Table of Contents
UNITED STATES
SECURITIES AND EXCHANGE COMMISSION
Washington, D.C. 20549
FORM N-CSR
CERTIFIED SHAREHOLDER REPORT OF REGISTERED
MANAGEMENT INVESTMENT COMPANIES
Investment Company Act file number: 811-00242
Natixis Funds Trust II
(Exact name of Registrant as specified in charter)
399 Boylston Street, Boston, Massachusetts 02116
(Address of principal executive offices) (Zip code)
Russell L. Kane, Esq.
NGAM Distribution, L.P.
399 Boylston Street
Boston, Massachusetts 02116
(Name and address of agent for service)
Registrant’s telephone number, including area code: (617) 449-2822
Date of fiscal year end: December 31
Date of reporting period: December 31, 2016
Table of Contents
Item 1. Reports to Stockholders.
The Registrant’s annual report transmitted to shareholders pursuant to Rule 30e-1 under the Investment Company Act of 1940 is as follows:
Table of Contents
ANNUAL REPORT
December 31, 2016

Mirova Global Sustainable Equity Fund
Natixis Oakmark Fund
Natixis Oakmark International Fund
Vaughan Nelson Small Cap Value Fund
Vaughan Nelson Value Opportunity Fund

Portfolio Review page 1
Portfolio of Investments page 29
Financial Statements page 51
Notes to Financial Statements page 77
Table of Contents
MIROVA GLOBAL SUSTAINABLE EQUITY FUND
| Managers | Symbols | |
| Jens Peers, CFA® | Class A ESGMX | |
| Suzanne Senellart | Class C ESGCX | |
| Hua Cheng, CFA®, PhD | Class Y ESGYX | |
| Natixis Asset Management U.S., LLC (“Natixis AM US”) |
Investment Goal
The Fund seeks long-term capital appreciation.
Market Conditions
2016 was another positive year for equity markets, especially as a sentiment driven year-end rally after the U.S. elections boosted returns significantly. On a relative basis, it turned out to be a rather negative year for ESG (Environmental, Social and Governance) investors though as traditional style biases, typical for ESG investing, were out of favor: Growth and Quality underperformed, while Value outperformed.
The year was clearly dominated by political news: Brexit and the U.S. elections. They turned out to be typical cases of buy on the rumor, sell on the news, as markets retracted before both events, but rebounded strongly (and more) after.
The macro-economic picture was generally positive with U.S. economic growth stronger than expected, leading to increased interest rates. There were also signs of a European economic recovery as construction activity picked up and unemployment numbers improved.
Performance Results
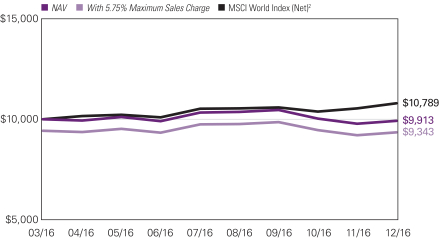
The Mirova Global Sustainable Equity Fund was launched on March 31, 2016. For the nine months ended December 31, 2016, Class A shares of Mirova Global Sustainable Equity Fund returned -0.85% at net asset value. The Fund underperformed its benchmark, the MSCI World Index (Net), which returned 7.89% over the same period. It is important to note that there are material differences between the Fund and this benchmark.
Explanation of Fund Performance
In terms of sector performance, we saw a reversal of 2015 trends. The best performing sector in the broader market was energy (oil and gas), followed by financials as interest rates increased. The fund does not invest in oil and gas companies, and invests less than its benchmark in financials, which explains a large part of its underperformance. The market experienced a strong sector rotation from IT to financials after the summer. Even though long-term growth prospects may be lower, the market clearly preferred the low valuation levels in both sectors, and the election of Donald Trump to become the next U.S. president helped the performance of these sectors even more. The same was true for the materials sector where mining companies such as Rio Tinto and BHP Billiton posted strong returns but the fund does not hold any mining companies. Meanwhile, health care was one of the
1 |
Table of Contents
worst performing sectors, due to profit taking, uncertainty about the potential U.S. health care reform and general pricing pressure on pharma products.
Relative to its benchmark, the Fund had a much larger position in health care, as we like the long-term fundamental growth drivers such as an aging population and the increased use of technology in finding solutions for insufficiently treated diseases.
The performance difference between the best performing and the worst performing stocks in the portfolio was larger than we would have anticipated. Danish companies Novo Nordisk (diabetes drugs) and Novozymes (biological enzymes) both issued profit warnings due to pressure on their profit margins. Ingenico, a French specialist in payment terminals, also reduced their growth expectations as the U.S. move to chipcards is slower than had been anticipated. Their poor performance could not be fully offset by the strong performance of stocks such as KBC (Belgian retail bank), A.O. Smith (energy-efficient water boilers) and Amazon.com (e-retail and cloud computing).
Outlook
We expect 2017 to be a relatively positive, but volatile year for equity market performance.
Valuations are relatively high on average but still attractive compared to bonds. Valuation support may be absent in the context of rising interest rates. Markets will therefore be relying more on earnings growth to generate returns. However, earnings growth expectations are flat in the United States before a potential tax reform impact. We therefore expect companies whose growth is supported by long-term demographic, environmental and technological megatrends to perform well in this low-growth environment. This should be more visible after first or second quarter results as it may become clear by then that some of the election promises may not be translated into corporate earnings growth. We like exposure to the U.S. market because of the tax reform and the strong dollar. This goes for U.S. companies with domestic exposure but also for non-U.S. companies selling into the United States. European equities should benefit from continued central bank support, lower valuations and improving economic numbers. Political uncertainty remains however and should lead to increased volatility (elections in France, the Netherlands and Germany).
| 2
Table of Contents
MIROVA GLOBAL SUSTAINABLE EQUITY FUND
Growth of $10,000 Investment in Class A Shares3
March 31, 2016 (inception) through December 31, 2016
Top Ten Holdings as of December 31, 2016
| Security name | % of net assets |
|||||
| 1 | Alphabet, Inc. | 4.94 | % | |||
| 2 | Thermo Fisher Scientific, Inc. | 4.71 | ||||
| 3 | Visa, Inc. | 4.58 | ||||
| 4 | Roper Technologies, Inc. | 4.16 | ||||
| 5 | Microsoft Corp. | 3.67 | ||||
| 6 | KBC Groep NV | 3.65 | ||||
| 7 | Danaher Corp. | 3.63 | ||||
| 8 | Essilor International S.A. | 3.45 | ||||
| 9 | Novo Nordisk AS | 2.99 | ||||
| 10 | Amazon.com, Inc. | 2.87 | ||||
The portfolio is actively managed and holdings are subject to change. There is no guarantee the Fund continues to invest in the securities referenced.
3 |
Table of Contents
Total Returns — December 31, 20163
| Expense Ratios4 | ||||||||||||
| Life of Fund | Gross | Net | ||||||||||
| Class A (Inception 3/31/16) | ||||||||||||
| NAV | -0.85 | % | 1.88 | % | 1.30 | % | ||||||
| With 5.75% Maximum Sales Charge | -6.55 | |||||||||||
| Class C (Inception 3/31/16) | ||||||||||||
| NAV | -1.39 | 2.63 | 2.05 | |||||||||
| With CDSC1 | -2.37 | |||||||||||
| Class Y (Inception 3/31/16) | ||||||||||||
| NAV | -0.70 | 1.63 | 1.05 | |||||||||
| Comparative Performance | ||||||||||||
| MSCI World Index (Net)2 | 7.89 | |||||||||||
Performance data shown represents past performance and is no guarantee of, and not necessarily indicative of, future results. Total return and value will vary, and you may have a gain or loss when shares are sold. Current performance may be lower or higher than quoted. For most recent month-end performance, visit ngam.natixis.com/performance. Performance for other share classes will be greater or less than shown based on differences in fees and sales charges. You may not invest directly in an index. Performance for periods less than one year is cumulative, not annualized. Returns reflect changes in share price and reinvestment of dividends and capital gains, if any. The table(s) do not reflect taxes shareholders might owe on any fund distributions or when they redeem their shares.
| 1 | Performance for Class C shares assumes a 1.00% contingent deferred sales charge (“CDSC”) applied when you sell shares within one year of purchase. |
| 2 | MSCI World Index (Net) is an unmanaged index that is designed to measure the equity market performance of developed markets. It is composed of common stocks of companies representative of the market structure of 22 developed market countries in North America, Europe, and the Asia/Pacific Region. The index is calculated without dividends, with net or with gross dividends reinvested, in both U.S. dollars and local currencies. You may not invest directly in an index. |
| 3 | Fund performance has been increased by fee waivers and/or expense reimbursements, if any, without which performance would have been lower. |
| 4 | As of the most recent prospectus, the investment advisor has contractually agreed to waive fees and/or reimburse expenses (with certain exceptions) once the expense cap of the Fund has been exceeded. This arrangement is set to expire on 4/30/17. When an expense cap has not been exceeded, the fund may have similar expense ratios. |
| 4
Table of Contents
NATIXIS OAKMARK FUND
| Managers | Symbols | |
| William C. Nygren, CFA® | Class A NEFOX | |
| Kevin G. Grant, CFA® | Class C NECOX | |
| M. Colin Hudson, CFA® | Class Y NEOYX | |
| Michael J. Mangan, CFA® | ||
| Harris Associates L.P. |
Investment Goal
The Fund seeks long-term capital appreciation.
Market Conditions
The year began on a sour note in 2016, as stock prices stumbled meaningfully in January across major global markets. As the year progressed, we saw instances of recovery offset by periodic events that prompted large declines (e.g. depressed commodity prices, the Brexit vote and ineffective central bank strategies to increase inflation in certain geographies).
At the conclusion of the year, major global market movements were largely influenced by the results of the U.S. presidential election in November. Although futures for the Dow Jones Industrial Average dropped nearly 900 points in the immediate aftermath of the election, investors surprisingly absorbed the implications of this political sea change. Subsequently, key indexes rebounded, and the Dow went on to close at a record high level on November 10, 2016 and finish up for the year. Financials led the advance, first benefiting from investors’ hopes that the new Republican administration would roll back industry regulations and second from the Federal Reserve’s decision to raise short-term interest rates for the first time in 2016. Citing signs that the economy has improved, the Fed also stated it intends to raise rates three times in 2017.
Elsewhere, the European Central Bank and the Bank of England both maintained key interest rates in December. The Bank of Japan (BOJ) opted to maintain its yield-curve and asset-purchasing programs. In addition, the BOJ pledged to further expand the monetary base in its continued efforts to lift inflation above 2%. In the weeks following the U.S. election, the Japanese yen sank over 10% against the dollar, which some investors expect will boost Japanese exports.
Meanwhile, members of the Organization of the Petroleum Exporting Countries (OPEC) reached an agreement with non-members to further reduce oil production. As a result of the deal, an additional 600,000 barrels per day will be removed from the market on top of the 1.2 million barrels per day cut agreed upon by OPEC in November. When all was said and done, Brent crude finished up approximately 52% for the year.
As value investors, we feel that our key task is to see through the haze generated by market pundits who are overly influenced by geopolitical events such as referendums and elections. Instead, we focus on the fundamental drivers of long-term cash flows. We seek to make investment decisions based on a company’s ability to generate and sustain a growing cash
5 |
Table of Contents
flow stream. While the market chased stable stocks in the face of uncertainty, we felt the attractive valuations in financials and cyclically-exposed areas of the market provided more safety. As is often the case, share price declines from the macro events of 2016 afforded us the opportunity to act on our convictions and reward our patient shareholders.
Performance Results
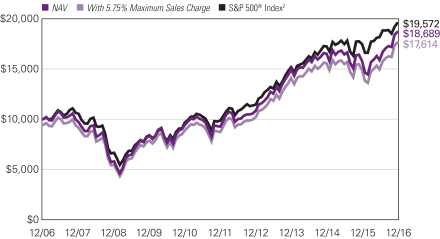
For the 12 months ended December 31, 2016, Class A shares of Natixis Oakmark Fund returned 18.37% at net asset value. The Fund outperformed its benchmark, the S&P 500® Index, which returned 11.96%.
Explanation of Fund Performance
As value investors with an emphasis on individual stock selection, our sector weights are a byproduct of our bottom-up process. On an absolute-return basis, shares in the energy sector gained the most value, while holdings in the consumer staples sector posted the largest negative return for calendar 2016.
The leading contributors to fund performance for the year were Apache and Cummins. Apache, a global oil and gas exploration company, was a beneficiary of the oil price rebound in 2016 after a volatile stretch. Apache has specifically benefitted from solid quarterly results that have demonstrated improved capital efficiency, including a 45% decline in North American well costs compared to 2014 levels. This year, the company also announced the discovery of a new resource play in the Permian Basin called “Alpine High.” Initial results indicate that Apache has discovered a high quality resource at a low cost. This increased our estimate of intrinsic value and also increased our confidence in management. In our view, Apache has the balance sheet and asset quality to survive continued volatility in oil and gas prices, and we like how the management team is preserving and growing per share value during the commodity price downturn. Cummins issued fiscal third-quarter results that indicated the company is on track to meet its full-year guidance. Although organic revenues declined, its decremental earnings margin (excluding the warranty charge) reached -23%, which is better than management’s full-year expectation of -25%. This positive outcome was a benefit of ongoing restructuring and cost reduction initiatives that helped buffer the impact from weak underlying end markets. From a segment perspective, Cummins’ components segment was a relative standout, as revenue growth of 7% internationally (+37% in China) partially offset the revenue decline in North America. Conversely, the power systems segment remains very weak globally, as the lack of infrastructure spending in developing markets and sluggish oil and gas/mining demand pressured results. Even so, the company repurchased about 7 million shares in 2016 through the third quarter, and Cummins’ management team reiterated its expectation for earnings per share of roughly $8 for the full year.
Liberty Interactive QVC and American Express were the largest detractors to Fund performance for the calendar year. After a long period of rather stable but low single-digit growth, Liberty Interactive QVC announced that sales fell by a mid-to-upper single digit amount in June, and these trends continued through July. The management team cited numerous company-specific reasons for the decline and noted they were taking action accordingly. In our estimation, the company’s underlying value was only modestly affected,
| 6
Table of Contents
NATIXIS OAKMARK FUND
relative to the decline in its share price. However, QVC CEO Mike George indicated at a conference in September that the trend from June and July had persisted through August. Despite this, investors were pleased with the results from the company’s third quarter, helping its share price to recoup some of the losses incurred earlier in 2016. Given that QVC also continues to buy back more stock, we remain confident that the company will reward shareholders over the long term. American Express was another large detractor to fund performance in the calendar year. News in January 2016 that Fidelity Investments had ended its 12-year partnership with American Express negatively affected the latter. This is in addition to the skepticism lingering from the 2015 announcement that Costco would not renew its co-brand partnership with American Express. We believe these factors will cause earnings growth to slow in the short term while American Express invests in marketing efforts to replace these customers, but we believe the company’s financial fundamentals remain very healthy. Despite what we believe is favorable secular growth and superior economics, American Express is trading at a large discount to the market. Our long-term view allows us to look past the short-term disappointment of the Costco and Fidelity announcements, and see the potential lucrative long-term value of American Express’ global payment network and growing customer base.
Outlook
Improving market conditions have prompted investors to realize the earnings potential of some otherwise overlooked companies. We appreciate when the market begins to recognize our perception of the intrinsic values of our holdings. Yet, our approach remains steadfast even when market sentiment turns pessimistic. We know that several policy-related issues are in flux over the coming year, and the outcomes of these could have large economic effects that move markets. Therefore, we remain prepared to capitalize on the opportunities that these events provide for the benefit of our investors.
7 |
Table of Contents
Growth of $10,000 Investment in Class A Shares3
December 31, 2006 through December 31, 2016
See notes to chart on page 9.
Top Ten Holdings as of December 31, 2016
| Security name | % of net assets |
|||||
| 1 | Citigroup, Inc. | 3.54 | % | |||
| 2 | Alphabet, Inc., Class A | 3.11 | ||||
| 3 | Bank of America Corp. | 2.91 | ||||
| 4 | American International Group, Inc. | 2.82 | ||||
| 5 | General Electric Co. | 2.75 | ||||
| 6 | Apache Corp. | 2.72 | ||||
| 7 | JPMorgan Chase & Co. | 2.69 | ||||
| 8 | Visa, Inc., Class A | 2.45 | ||||
| 9 | MasterCard, Inc., Class A | 2.41 | ||||
| 10 | Capital One Financial Corp. | 2.39 | ||||
The portfolio is actively managed and holdings are subject to change. There is no guarantee the Fund continues to invest in the securities referenced.
| 8
Table of Contents
NATIXIS OAKMARK FUND
Average Annual Total Returns — December 31, 20163
| Expense Ratios4 | ||||||||||||||||||||
| 1 Year | 5 Years | 10 Years | Gross | Net | ||||||||||||||||
| Class A (Inception 5/6/31) | ||||||||||||||||||||
| NAV | 18.37 | % | 15.05 | % | 6.45 | % | 1.14 | % | 1.14 | % | ||||||||||
| With 5.75% Maximum Sales Charge | 11.55 | 13.69 | 5.81 | |||||||||||||||||
| Class C (Inception 5/1/95) | ||||||||||||||||||||
| NAV | 17.45 | 14.19 | 5.65 | 1.89 | 1.89 | |||||||||||||||
| With CDSC1 | 16.45 | 14.19 | 5.65 | |||||||||||||||||
| Class Y (Inception 11/18/98) | ||||||||||||||||||||
| NAV | 18.69 | 15.34 | 6.75 | 0.89 | 0.89 | |||||||||||||||
| Comparative Performance | ||||||||||||||||||||
| S&P 500® Index2 | 11.96 | 14.66 | 6.95 | |||||||||||||||||
Performance data shown represents past performance and is no guarantee of, and not necessarily indicative of, future results. Total return and value will vary, and you may have a gain or loss when shares are sold. Current performance may be lower or higher than quoted. For most recent month-end performance, visit ngam.natixis.com/performance. Performance for other share classes will be greater or less than shown based on differences in fees and sales charges. You may not invest directly in an index. Performance for periods less than one year is cumulative, not annualized. Returns reflect changes in share price and reinvestment of dividends and capital gains, if any. The table(s) do not reflect taxes shareholders might owe on any fund distributions or when they redeem their shares.
| 1 | Performance for Class C shares assumes a 1.00% contingent deferred sales charge (“CDSC”) applied when you sell shares within one year of purchase. |
| 2 | S&P 500® Index is a widely recognized measure of U.S. stock market performance. It is an unmanaged index of 500 common stocks chosen for market size, liquidity, and industry group representation, among other factors. |
| 3 | Fund performance has been increased by fee waivers and/or expense reimbursements, if any, without which performance would have been lower. |
| 4 | As of the most recent prospectus, the investment advisor has contractually agreed to waive fees and/or reimburse expenses (with certain exceptions) once the expense cap of the Fund has been exceeded. This arrangement is set to expire on 4/30/17. When an expense cap has not been exceeded, the fund may have similar expense ratios. |
9 |
Table of Contents
NATIXIS OAKMARK INTERNATIONAL FUND
| Managers | Symbols | |
| David G. Herro, CFA® | Class A NOIAX | |
| Michael L. Manelli, CFA® | Class C NOICX | |
| Harris Associates L.P. |
Investment Goal
The Fund seeks long-term capital appreciation.
Market Conditions
Major global market movements in the fourth quarter of 2016 were largely influenced by the results of the U.S. presidential election in November. Although futures for the Dow Jones Industrial Average dropped nearly 900 points in the immediate aftermath of the election, investors surprisingly absorbed the implications of this political sea change. Subsequently, key indexes rebounded, and the Dow went on to close at a record high level on November 10, 2016 and finish up for the quarter. Financials led the advance, benefiting from investors’ hopes that the new Republican administration would roll back industry regulations and from the Federal Reserve’s decision to raise short-term interest rates for the first time in 2016. Citing signs that the economy has improved, the Fed also stated it intends to raise rates three times in 2017.
Elsewhere, the European Central Bank and the Bank of England both maintained key interest rates in December. The Bank of Japan (BOJ) opted to maintain its yield-curve and asset-purchasing programs. In addition, the BOJ pledged to further expand the monetary base in its continued efforts to lift inflation above 2%. In the weeks following the U.S. election, the Japanese yen sank over 10% against the dollar, which some investors expect will boost Japanese exports.
Meanwhile, non-members of the Organization of the Petroleum Exporting Countries (OPEC) reached an agreement with OPEC members to further reduce oil production. As a result of the deal, an additional 600,000 barrels per day will be removed from the market in addition to the 1.2 million barrels per day cut agreed upon by OPEC last month. When all was said and done, Brent crude finished up 52% for the year.
As value investors, we feel that our key task is to see through the haze generated by market pundits who are overly influenced by geopolitical events such as referendums and elections. Instead, we focus on the fundamental drivers of long-term cash flows. We seek to make investment decisions based on a company’s ability to generate and sustain a growing cash flow stream. While the market chased stable stocks in the face of uncertainty, we felt the attractive valuations in financials and cyclically exposed areas of the market provided more safety. As is often the case, share price declines from the macro events of 2016 afforded us the opportunity to act on our convictions and reward our patient shareholders.
| 10
Table of Contents
NATIXIS OAKMARK INTERNATIONAL FUND
Performance Results
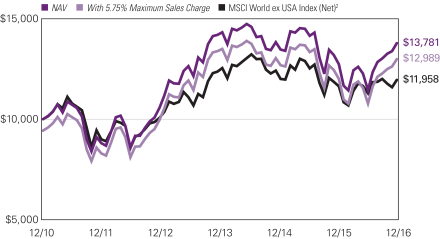
For the 12 months ended December 31, 2016, Class A shares of Natixis Oakmark International Fund returned 8.19% at net asset value. The Fund outperformed its benchmark, the MSCI World ex USA Index (Net), which returned 2.75%.
Explanation of Fund Performance
Geographically, we ended the quarter with 76% of our holdings in Europe, 9% in Japan and 4% in Australia. The remaining positions are in China, the United States, Indonesia, Mexico, Hong Kong, South Korea, India, Taiwan and Israel. As value investors with an emphasis on individual stock selection, our country and sector weights are a by-product of our bottom-up process.
On an absolute-return basis, shares in the materials sector produced the best collective return. Holdings in the financials sector declined the most during the year.
The top contributors to the yearly return were Glencore and CNH Industrial. In 2016, Glencore’s share price reacted positively to a rebound in commodity prices, the successful execution of its debt reduction plan and the election of Donald Trump as U.S. President. During the fourth quarter, Glencore completed its sale of non-core assets and raised a total of $6.3 billion in proceeds from all asset disposals, which puts the company on pace to meet its targeted net debt level of $16.5-$17.5 billion. Furthermore, management reinstated its dividend policy and plans to return at least $1 billion to shareholders starting in 2017. We believe management is working to enhance shareholder value, and our investment thesis remains intact. CNH Industrial received a boost early in 2016 following an analyst report that cited an increase in the price of corn and in the demand for agriculture equipment as potential drivers of CNH’s future share price recovery. We met with the company’s CEO Richard Tobin and CFO Max Chiara during the second quarter and discussed the performance status of each business segment. We were pleased to learn of progress in the agricultural business where inventory and manufacturing have been rightsized. The commercial vehicle and construction businesses also have targeted improvement plans in place. In the fourth quarter, CNH Industrial’s share price was boosted by the election of Donald Trump and the perceived benefits to the industrials sector. In addition, news that industry peer Deere delivered fiscal fourth-quarter earnings results that handily beat market expectations drove CNH’s share price higher, on hopes that the latter would follow suit. As previously mentioned, non-members of the Organization of the Petroleum Exporting Countries (OPEC) reached an agreement with OPEC members to further reduce oil production. As a result of the deal, an additional 600,000 barrels per day will be removed from the market in addition to the 1.2 million barrels per day cut agreed upon by OPEC earlier in the quarter. In conjunction with the recovery in oil prices during the fourth quarter, we find that the company continues to be undervalued relative to its normalized earnings power.
The largest detractors from return were Credit Suisse Group and BMW. Although Credit Suisse Group’s CEO Tidjane Thiam warned that fiscal fourth-quarter earnings would be weak, some one-off expenses related to litigation, pension true-up charges and write-downs on certain credit assets were negative surprises during the period. However, this caused the
11 |
Table of Contents
management team to accelerate the restructuring and reduction of non-core investment banking lines of businesses. The goal is to emphasize the wealth management business that has very good secular growth trends, is fee-based and requires little capital. Credit Suisse shares were also negatively impacted by the U.K.’s decision to leave the European Union. We believe it is important to remember that the bank derives minimal revenues (2%) from the U.K., while 13% of its costs are denominated in pound sterling currency, the net result of which may be somewhat positive for profitability. Later in the year, investor sentiment improved due to Credit Suisse Group’s Investor Day during the fourth quarter. The company indicated that it was lowering its target operating cost base from CHF 18 billion to CHF 17 billion and increasing its total net cost savings target from CHF 3.2 billion to greater than CHF 4.2 billion in 2018. In addition, Credit Suisse Group’s fiscal nine-month results benefited from effective cost controls that offset weaker revenues; lower operating expenses helped total net income to marginally exceed our projections. We were pleased that improvements in Global Markets drove core operating expenses to be roughly 5% better than we estimated. Credit Suisse’s capital ratios increased, and the bank finished the third quarter with a common equity Tier 1 ratio of 12%, which reflects a 180 basis point advance from a year ago. BMW’s share price experienced volatility in the first half of 2016, even though fiscal year 2015 fourth-quarter and fiscal year 2016 first-quarter earnings results were largely in line with our expectations. Despite this, we were disappointed in BMW’s capital allocation and significant cash position. We had hoped to discuss our concerns with management, but management refused to hear our thoughts on the topic. Given our concerns about capital allocation and management’s unwillingness to meet with us, we decided to sell our shares in June. However, we once again initiated a position in the company following a meeting with management in November. As a result of the meeting, we believe BMW’s motivations are in the right place and appreciate reaffirmation of management’s intention to increase the company’s payout ratio closer to 40%. Furthermore, the outlook for long-term auto demand is quite optimistic given emerging market growth, a revived U.S. market and potential for an auto sales rebound in Europe off of a 20-year low. In addition, we think that growth of premium auto brands will be faster than the overall market, as luxury goods sales have been robust even in a challenging economy. The company has expanded its product lines by introducing variations of several models, which has resulted in market share gains and constantly attractive product cycles. Overall, we believe BMW is a solid investment that will reward shareholders into the future.
Outlook
Again this year, macro and geopolitical events dominated the news. However, we believe it is a mistake to focus on these happenings when making investment decisions. We find that these events rarely impact long-term business value in a meaningful way. In fact, these events should be used to exploit short-term mispricing, as they enable investors to buy into businesses at low entry prices. We recognize that our job is to measure and determine intrinsic value, to buy when stock prices are low and to sell when stock prices are high. It is our belief that by focusing on this, rather than the exogenous events mentioned above, we will earn acceptable rates of return over time for those who entrust their funds with us.
| 12
Table of Contents
NATIXIS OAKMARK INTERNATIONAL FUND
Growth of $10,000 Investment in Class A Shares3
December 15, 2010 (inception) through December 31, 2016
Top Ten Holdings as of December 31, 2016
| Security name | % of net assets |
|||||
| 1 | Glencore PLC | 4.33 | % | |||
| 2 | Lloyds Banking Group PLC | 3.92 | ||||
| 3 | BNP Paribas S.A. | 3.59 | ||||
| 4 | Intesa Sanpaolo SpA | 3.53 | ||||
| 5 | Allianz SE, (Registered) | 3.46 | ||||
| 6 | Credit Suisse Group AG, (Registered) | 3.44 | ||||
| 7 | Daimler AG, (Registered) | 3.36 | ||||
| 8 | CNH Industrial NV | 3.30 | ||||
| 9 | Honda Motor Co. Ltd. | 2.48 | ||||
| 10 | EXOR | 2.42 | ||||
The portfolio is actively managed and holdings are subject to change. There is no guarantee the Fund continues to invest in the securities referenced.
13 |
Table of Contents
Average Annual Total Returns — December 31, 20163
| Expense Ratios4 | ||||||||||||||||||||
| 1 Year | 5 Years | Life of Fund | Gross | Net | ||||||||||||||||
| Class A (Inception 12/15/10) | ||||||||||||||||||||
| NAV | 8.19 | % | 9.68 | % | 5.45 | % | 1.31 | % | 1.31 | % | ||||||||||
| With 5.75% Maximum Sales Charge | 1.97 | 8.39 | 4.43 | |||||||||||||||||
| Class C (Inception 12/15/10) | ||||||||||||||||||||
| NAV | 7.36 | 8.89 | 4.68 | 2.06 | 2.06 | |||||||||||||||
| With CDSC1 | 6.36 | 8.89 | 4.68 | |||||||||||||||||
| Comparative Performance | ||||||||||||||||||||
| MSCI World ex USA Index (Net)2 | 2.75 | 6.07 | 3.00 | |||||||||||||||||
Performance data shown represents past performance and is no guarantee of, and not necessarily indicative of, future results. Total return and value will vary, and you may have a gain or loss when shares are sold. Current performance may be lower or higher than quoted. For most recent month-end performance, visit ngam.natixis.com/performance. Performance for other share classes will be greater or less than shown based on differences in fees and sales charges. You may not invest directly in an index. Performance for periods less than one year is cumulative, not annualized. Returns reflect changes in share price and reinvestment of dividends and capital gains, if any. The table(s) do not reflect taxes shareholders might owe on any fund distributions or when they redeem their shares.
| 1 | Performance for Class C shares assumes a 1.00% contingent deferred sales charge (“CDSC”) applied when you sell shares within one year of purchase. |
| 2 | MSCI World ex USA Index (Net) is an unmanaged index that is designed to measure the equity market performance of developed markets, excluding the United States. The index calculates reinvested dividends net of withholding taxes using Luxembourg tax rates. |
| 3 | Fund performance has been increased by fee waivers and/or expense reimbursements, if any, without which performance would have been lower. |
| 4 | As of the most recent prospectus, the investment advisor has contractually agreed to waive fees and/or reimburse expenses (with certain exceptions) once the expense cap of the Fund has been exceeded. This arrangement is set to expire on 4/30/17. When an expense cap has not been exceeded, the fund may have similar expense ratios. |
| 14
Table of Contents
VAUGHAN NELSON SMALL CAP VALUE FUND
| Managers | Symbols | |
| Dennis G. Alff, CFA® | Class A NEFJX | |
| Chad D. Fargason | Class C NEJCX | |
| Chris D. Wallis, CFA® | Class Y NEJYX | |
| Scott J. Weber, CFA® | ||
| Vaughan Nelson Investment Management, L.P. | ||
Effective July 31, 2009, the fund was closed to new investors.
Investment Goal
The Fund seeks capital appreciation.
Market Conditions
During the year, volatility remained elevated as the market digested the United Kingdom’s vote to leave the European Union (“Brexit”), Donald Trump’s successful campaign for President of the United States, and the Federal Reserve’s ability to raise interest rates. However, equity markets appreciated despite declining earnings expectations and deteriorating international economic conditions. We believe the incremental multiple expansion was driven by easy monetary conditions globally, by modest improvement in economic growth expectations throughout the year, and by foreign investors increasing portfolio allocations to U.S. equities post-Brexit.
Despite attractive gains in 2016, we believe equity markets might be in a state of unstable equilibrium given the significant structural changes that are occurring with central banks’ monetary policies and with U.S. government deficits in addition to the escalating number of earnings headwinds including: higher interest rates, a stronger U.S. dollar, rising health care costs, and wage inflation pressures. In fact, corporate earnings expectations declined for the fourth quarter of 2016 and for the full-year 2017, resulting in even richer valuation multiples as equity markets set new highs.
Performance Results
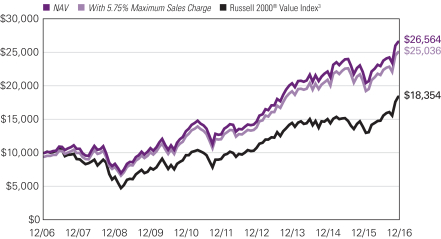
For the twelve months ended December 31, 2016, Class A shares of Vaughan Nelson Small Cap Value Fund returned 20.24% at net asset value. The Fund underperformed its benchmark, the Russell 2000® Value Index, which returned 31.74%.
Explanation of Fund Performance
While the Fund’s absolute performance was strong for the year, the Fund underperformed the benchmark primarily due to stock selection within materials, information technology, consumer discretionary, industrials, and financials. In addition, the Fund was also overweight health care during the year, which detracted from performance as the sector underperformed the market. The Fund was positioned more defensively during the year as valuations become more expensive, which hurt relative performance as more cyclical sectors such as materials outperformed. Financials, industrials, energy, utilities and information technology were the biggest contributors to absolute performance, while consumer discretionary, materials and real estate detracted from performance.
15 |
Table of Contents
Stock selection within the materials sector detracted the most from relative performance. This was primarily due to the Fund’s overweight in paper and packaging stocks, which as a group are more defensive and performed worse than the higher beta industries within the materials sector, such as metals and mining. Kapstone Paper and Packaging, Multi Packaging Solutions International, Silgan, and Graphic Packaging detracted the most from relative performance. Kapstone was hurt by concerns about product pricing and inventory levels in its end markets. Multi Packaging Solutions suffered from poor execution and weak end market volumes within its consumer products end markets. Silgan and Graphic Packaging underperformed primarily due to their defensive nature as noted above.
Stock selection within the information technology sector detracted from relative performance with RingCentral and Verint as the primary detractors. RingCentral performed poorly due to market concerns around its customer concentration, while Verint faced headwinds from its exposure to weak Emerging Market economies, as well as a strong U.S. dollar. In addition, the Fund was overweight IT services stocks, a more defensive industry, which did not perform as well as more cyclical industries such as semiconductors.
The industrials sector also detracted from performance on a relative basis as the portfolio was positioned in more defensive, less cyclical companies in industries such as commercial services and supplies. The Fund’s industrial holdings performed well on an absolute basis, but lagged in performance relative to the Fund’s benchmark.
The consumer discretionary sector detracted from performance on both an absolute and relative basis due to stock selection within auto component manufacturers, homebuilders, and retail. Vista Outdoor, CalAtlantic, Tenneco, and Tailored Brands detracted the most from performance. Vista Outdoor was negatively impacted by a customer bankruptcy that resulted in excess inventory in its sales channels. CalAtlantic saw order weakness in its Texas markets, driven by weak oil prices, and also faced a headwind from potentially higher mortgage rates going forward. Tenneco was negatively impacted by its exposure to China early in the year, as well as investor concerns that auto production levels may have peaked in the U.S. Tailored Brands continued to struggle with the integration of the Jos. A. Bank business with its Men’s Wearhouse business.
The Fund’s financial sector holdings performed well on an absolute basis, but underperformed on a relative basis driven by stock selection. The portfolio was overweight insurance due to its more defensive characteristics but insurance stocks did not perform as well as other interest rate sensitive names as the yield curve backed up following the election. Insurance holdings such as RenaissanceRe, First American Financial, and Aspen Insurance performed well on an absolute basis, while American Equity Life performed poorly due to regulatory headwinds and a continued low rate environment. American Equity Life was sold early in the year and did not benefit from the post-election rebound in interest rate sensitive stocks.
Sector selection drove the relative underperformance in health care. The Fund was overweight health care during the year due to the secular growth opportunities given the aging population and reasonable valuations. However, following Trump’s successful bid for the White House, health care stocks underperformed as the chances of repealing or replacing the Affordable Care Act increased. VWR, Civitas, Envision Healthcare, and
| 16
Table of Contents
VAUGHAN NELSON SMALL CAP VALUE FUND
Surgery Partners were the largest underperformers for the Fund. VWR performed poorly due to a headwind from a stronger U.S. dollar as well as concerns around National Institutes of Health funding levels. Civitas was negatively impacted by a reduction in funding levels at its largest customer, as well as a headwind from higher labor costs. Envision Healthcare was impacted by volatility around the Company’s merger with AmSurg. Surgery Partners saw weaker than expected surgery volumes late in the year.
The energy sector contributed the most to performance during the year due to strong stock selection. The Fund was also overweight energy and it was one of the best performing sectors for the year. Laredo Petroleum, Forum Energy, and Superior Energy Services contributed most to the sector’s results as all benefited from higher oil prices as the year progressed. Laredo, an E&P company, also performed very well on a company specific basis as it continued to increase the efficiency of its operations.
Other notable performers during the year included Prosperity Bancshares, CACI International, and First Financial Bancorp. Prosperity Bancshares and First Financial Bancorp are interest rate sensitive names that benefited from an increase in rate expectations and a steepening yield curve during the year, particularly after the election. CACI is a government IT services company that produced strong results through the year, and performed particularly well after the election on the prospect of higher fiscal spending by the U.S. Government.
Outlook
The U.S. presidential election has not caused us to change our view regarding portfolio positioning or the opportunity set. We still believe that there is little room for profit margins to improve and that interest rates cannot move materially higher without negative consequences. While we welcome a business friendly administration, corporate tax reform, and more fiscal spending, we think that these conditions are necessary to hit next year’s earnings estimates anyway. For example, earnings for the S&P 500® Index are estimated to grow approximately 20% in 2017, which seems unrealistic at this point in the business and corporate margin cycle. From here, the biggest fundamental impact to the economy and to asset prices is likely a renewal of animal spirits.
With corporate margins near all-time highs, labor markets tight, and benefit costs on the rise, we do not believe top line growth will be sufficient to prevent further margin pressure. With monetary stimulus nearly exhausted, we believe fiscal stimulus will be necessary not only in the United States but internationally so that the macro imbalances can continue to adjust without creating excessive volatility. Our outlook remains balanced, stock-specific, and not reflective of opportunities in specific industries, regions of the world, or broader market indices.
As it relates to the intermediate to long-term outlook, we believe we are entering the final stages of rebalancing the monetary bubble that has been building in our financial markets for several decades. While the financial crisis was effective at eliminating excesses within our regulated banking systems, it pushed imbalances into the unregulated financial system and accentuated the imbalances that exist in international markets.
We continue to seek investments in companies that have better pricing power, lower earnings variability, higher profitability, and stronger balance sheets than the broader
17 |
Table of Contents
investment universe. We still do not favor any single industry or sector, and continue to look for companies with the characteristics noted above that trade at attractive valuations.
Growth of $10,000 Investment in Class A Shares4
December 31, 2006 through December 31, 2016
See notes to chart on page 19.
Top Ten Holdings as of December 31, 2016
| Security name | % of net assets |
|||||
| 1 | iShares® Russell 2000 Value Index ETF | 5.13 | % | |||
| 2 | Prosperity Bancshares, Inc. | 3.25 | ||||
| 3 | Brown & Brown, Inc. | 2.32 | ||||
| 4 | Hillenbrand, Inc. | 2.23 | ||||
| 5 | RenaissanceRe Holdings Ltd. | 2.21 | ||||
| 6 | First Financial Bancorp | 2.12 | ||||
| 7 | First American Financial Corp. | 2.12 | ||||
| 8 | Envision Healthcare Corp. | 2.10 | ||||
| 9 | First Merchants Corp. | 2.06 | ||||
| 10 | Union Bankshares Corp. | 2.01 | ||||
The portfolio is actively managed and holdings are subject to change. There is no guarantee the Fund continues to invest in the securities referenced.
| 18
Table of Contents
VAUGHAN NELSON SMALL CAP VALUE FUND
Average Annual Total Returns — December 31, 20163
| Expense Ratios4 | ||||||||||||||||||||
| 1 Year | 5 Years | 10 Years | Gross | Net | ||||||||||||||||
| Class A (Inception 12/31/96) | ||||||||||||||||||||
| NAV | 20.24 | % | 15.82 | % | 10.27 | % | 1.45 | % | 1.45 | % | ||||||||||
| With 5.75% Maximum Sales Charge | 13.34 | 14.46 | 9.62 | |||||||||||||||||
| Class C (Inception 12/31/96) | ||||||||||||||||||||
| NAV | 19.32 | 14.95 | 9.44 | 2.20 | 2.20 | |||||||||||||||
| With CDSC1 | 18.32 | 14.95 | 9.44 | |||||||||||||||||
| Class Y (Inception 8/31/06) | ||||||||||||||||||||
| NAV | 20.53 | 16.10 | 10.55 | 1.20 | 1.20 | |||||||||||||||
| Comparative Performance | ||||||||||||||||||||
| Russell 2000® Value Index2 | 31.74 | 15.07 | 6.26 | |||||||||||||||||
Performance data shown represents past performance and is no guarantee of, and not necessarily indicative of, future results. Total return and value will vary, and you may have a gain or loss when shares are sold. Current performance may be lower or higher than quoted. For most recent month-end performance, visit ngam.natixis.com/performance. Performance for other share classes will be greater or less than shown based on differences in fees and sales charges. You may not invest directly in an index. Performance for periods less than one year is cumulative, not annualized. Returns reflect changes in share price and reinvestment of dividends and capital gains, if any. The table(s) do not reflect taxes shareholders might owe on any fund distributions or when they redeem their shares.
| 1 | Performance for Class C shares assumes a 1.00% contingent deferred sales charge (“CDSC”) applied when you sell shares within one year of purchase. |
| 2 | Russell 2000® Value Index is an unmanaged index that measures the performance of the small-cap value segment of the U.S. equity universe. It includes those Russell 2000® companies with lower price-to-book ratios and lower forecasted growth values. |
| 3 | Fund performance has been increased by fee waivers and/or expense reimbursements, if any, without which performance would have been lower. |
| 4 | As of the most recent prospectus, the investment advisor has contractually agreed to waive fees and/or reimburse expenses (with certain exceptions) once the expense cap of the Fund has been exceeded. This arrangement is set to expire on 4/30/17. When an expense cap has not been exceeded, the fund may have similar expense ratios. |
19 |
Table of Contents
VAUGHAN NELSON VALUE OPPORTUNITY FUND
| Managers | Symbols | |
| Dennis G. Alff, CFA® | Class A VNVAX | |
| Chad D. Fargason | Class C VNVCX | |
| Chris D. Wallis, CFA® | Class N VNVNX | |
| Scott J. Weber, CFA® | Class Y VNVYX | |
| Vaughan Nelson Investment Management, L.P. | ||
Investment Goal
The Fund seeks long-term capital appreciation.
Market Conditions
During the year, volatility remained elevated as the market digested the United Kingdom’s vote to leave the European Union (“Brexit”), Donald Trump’s successful campaign for President of the United States, and the Federal Reserve’s ability to raise interest rates. However, equity markets appreciated despite declining earnings expectations and deteriorating international economic conditions. We believe the incremental multiple expansion was driven by easy monetary conditions globally, by modest improvement in economic growth expectations throughout the year, and by foreign investors increasing portfolio allocations to U.S. equities post Brexit.
Despite attractive gains in 2016, we believe equity markets might be in a state of unstable equilibrium given the significant structural changes that are occurring with central banks’ monetary policies and with U.S. government deficits in addition to the escalating number of earnings headwinds including: higher interest rates, a stronger U.S. dollar, rising health care costs, and wage inflation pressures. In fact, corporate earnings expectations declined for the fourth quarter of 2016 and for the full-year 2017, resulting in even richer valuation multiples as equity markets set new highs.
Performance Results
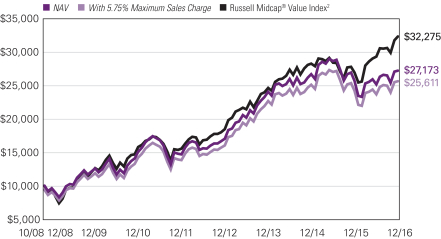
For the 12 months ended December 31, 2016, Class A shares of Vaughan Nelson Value Opportunity Fund returned 5.85% at net asset value. The fund underperformed its benchmark, the Russell Midcap® Value Index, which returned 20.00%.
Explanation of Fund Performance
While the Fund’s absolute performance was positive for the year, the Fund underperformed the benchmark primarily due to stock selection within information technology, materials, health care, consumer discretionary, and industrials. In addition, the Fund was overweight health care and consumer discretionary stocks during the year, which detracted from performance since both sectors underperformed the market. The Fund was positioned more defensively during the year as valuations become more expensive, which hurt relative performance as more cyclical sectors such as energy and industrials outperformed. Financials, technology, consumer discretionary, and energy were the biggest contributors to absolute performance, while health care detracted from performance.
| 20
Table of Contents
VAUGHAN NELSON VALUE OPPORTUNITY FUND
The information technology sector weighed on relative performance due to stock selection, with First Data and RingCentral detracting the most. First Data completed its initial public offering during the year and the stock performed poorly after management elected not to provide guidance. While the stock was only down modestly for the year, the technology sector was one of the best performing sectors, thus magnifying relative underperformance. RingCentral performed poorly due to market concerns related to its customer concentration. Last, the Fund was overweight IT services stocks, a more defensive industry with recurring revenues, which did not perform as well as cyclical industries such as semiconductors.
The materials sector also hampered relative performance due to stock selection. Constellium and Caesarstone detracted the most from performance. Constellium traded lower due to concerns about its acquisition of Wise Metals and fears of a slowdown in two of its primary end markets, aerospace and automotive. Caesarstone performed poorly during the year as its market share growth in the U.S. continued to suffer from increased competition while at the same time the company is expanding capacity. The Fund was also overweight paper and packaging stocks, which as a group are more defensive and performed worse than the higher beta industries within the materials sector, such as construction materials and metals and mining.
Sector selection and stock selection drove the relative underperformance in the health care sector. The Fund was overweight health care due to the secular growth opportunities given the aging population and due to reasonable valuations. However, following Trump’s successful bid for the White House, health care stocks underperformed as the chances of repealing or replacing the Affordable Care Act increased. Endo International, Community Health Systems, and Envision Healthcare detracted the most from performance. Endo International, a branded and generic pharmaceutical company, experienced pricing pressures in the generics business and litigation charges stemming from its mesh business. Community Health suffered from industry wide volume problems and from poor cost control. Envision Healthcare was impacted by volatility related to the Company’s merger with AmSurg, which is now complete.
The consumer discretionary sector detracted from relative performance due to stock and sector selection. The Fund was overweight consumer discretionary stocks relative to the benchmark, and the sector did not perform as well as the benchmark. H&R Block, Signet Jewelers, Delphi Automotive, and HSN, Inc. were the biggest detractors. H&R Block was negatively impacted by sluggish tax return volume growth. Delphi declined due to investor concerns that auto production levels may have peaked in the U.S. Signet and HSN continued to struggle with the challenging consumer retail environment.
The industrials sector also detracted from relative performance due to stock and sector selection. The Fund’s industrials holdings performed well on an absolute basis, but lagged relative to the benchmark. Also, the Fund was underweight industrials for the year and the industrials sector turned out to be one of the best performing sectors, partially driven by Donald Trump’s infrastructure spending plans. On a relative basis, the portfolio was positioned in more defensive, less cyclical companies rather than the more cyclical industries such as airlines, which performed the best. Hertz Global detracted the most
21 |
Table of Contents
from performance. Hertz was hurt by higher depreciation expenses on fleet vehicles as residual car values began to decline during the year.
The Fund’s underweight in energy detracted from relative performance. The energy sector was one of the best performers for the year benefitting from a recovery in oil prices. The Fund was concentrated in exploration and production companies, which performed better than energy equipment and services companies. WPX Energy and Continental Resources contributed the most to the Fund’s results as both companies benefited from higher oil prices as the year progressed.
Despite lagging the benchmark, the Fund had many notable outperformers during the year including Grand Canyon Education, New Residential Investment, Reinsurance Group of America, Chemical Financial, and NCR Corporation. As disappointing as 2016 was, the portfolio looks attractive relative to the benchmark going into 2017. Since inception we have tracked the PEG ratio of the strategy and as of December 31, 2016, the strategy is trading at about a 60% discount to the index. Further, the earnings growth for the portfolio is 12% versus 8% for the index and the Fund’s P/E ratio is 14x versus 16x for the index.
Outlook
The U.S. presidential election has not caused us to change our view regarding portfolio positioning or the opportunity set. We still believe that there is little room for profit margins to improve and that interest rates cannot move materially higher without negative consequences. While we welcome a business-friendly administration, corporate tax reform, and more fiscal spending, we think that these conditions are necessary to hit next year’s earnings estimates anyway. For example, earnings for the S&P 500® Index are estimated to grow approximately 20% in 2017, which seems unrealistic at this point in the business and corporate margin cycle. From here, the biggest fundamental impact to the economy and to asset prices is likely a renewal of animal spirits.
With corporate margins near all-time highs, labor markets tight, and benefit costs on the rise, we do not believe top line growth will be sufficient to prevent further margin pressure. With monetary stimulus nearly exhausted, we believe fiscal stimulus will be necessary not only in the United States but internationally so that the macro imbalances can continue to adjust without creating excessive volatility. Our outlook remains balanced, stock-specific, and not reflective of opportunities in specific industries, regions of the world, or broader market indices.
As it relates to the intermediate to long-term outlook, we believe we are entering the final stages of rebalancing the monetary bubble that has been building in our financial markets for several decades. While the financial crisis was effective at eliminating excesses within our regulated banking systems, it pushed imbalances into the unregulated financial system and accentuated the imbalances that exist in international markets.
We continue to seek investments in companies that have better pricing power, lower earnings variability, higher profitability, and stronger balance sheets than the broader investment universe. We still do not favor any single industry or sector, and continue to look for companies with the characteristics noted above that trade at attractive valuations.
| 22
Table of Contents
VAUGHAN NELSON VALUE OPPORTUNITY FUND
Growth of $10,000 Investment in Class A Shares3
October 31, 2008 (inception) through December 31, 2016
Top Ten Holdings as of December 31, 2016
| Security name | % of net assets |
|||||
| 1 | Ares Capital Corp. | 2.83 | % | |||
| 2 | Arthur J. Gallagher & Co. | 2.81 | ||||
| 3 | Fidelity National Information Services, Inc. | 2.77 | ||||
| 4 | New Residential Investment Corp. | 2.68 | ||||
| 5 | Synchrony Financial | 2.51 | ||||
| 6 | Envision Healthcare Corp. | 2.50 | ||||
| 7 | Newell Brands, Inc. | 2.42 | ||||
| 8 | Grand Canyon Education, Inc. | 2.28 | ||||
| 9 | Reinsurance Group of America, Inc., Class A | 2.27 | ||||
| 10 | Chemical Financial Corp. | 2.26 | ||||
The portfolio is actively managed and holdings are subject to change. There is no guarantee the Fund continues to invest in the securities referenced.
23 |
Table of Contents
Average Annual Total Returns — December 31, 20163
| Expense Ratios4 | ||||||||||||||||||||||||
| 1 Year | 5 Years | Life of Class | Gross | Net | ||||||||||||||||||||
| Class A (Inception 10/31/08) | Class A/C/Y | Class N | ||||||||||||||||||||||
| NAV | 5.85 | % | 13.12 | % | 13.02 | % | — | % | ||||||||||||||||
| With 5.75% Maximum Sales Charge | -0.22 | 11.79 | 12.20 | — | 1.45 | % | 1.45 | % | ||||||||||||||||
| Class C (Inception 10/31/08) | ||||||||||||||||||||||||
| NAV | 5.03 | 12.27 | 12.18 | — | 2.20 | 2.20 | ||||||||||||||||||
| With CDSC1 | 4.03 | 12.27 | 12.18 | — | ||||||||||||||||||||
| Class N (Inception 5/1/13) | ||||||||||||||||||||||||
| NAV | 6.21 | — | — | 10.11 | 1.11 | 1.11 | ||||||||||||||||||
| Class Y (Inception 10/31/08) | ||||||||||||||||||||||||
| NAV | 6.14 | 13.40 | 13.30 | — | 1.20 | 1.20 | ||||||||||||||||||
| Comparative Performance | ||||||||||||||||||||||||
| Russell Midcap® Value Index2 | 20.00 | 15.70 | 15.44 | 12.38 | ||||||||||||||||||||
Performance data shown represents past performance and is no guarantee of, and not necessarily indicative of, future results. Total return and value will vary, and you may have a gain or loss when shares are sold. Current performance may be lower or higher than quoted. For most recent month-end performance, visit ngam.natixis.com/performance. Performance for other share classes will be greater or less than shown based on differences in fees and sales charges. You may not invest directly in an index. Performance for periods less than one year is cumulative, not annualized. Returns reflect changes in share price and reinvestment of dividends and capital gains, if any. The table(s) do not reflect taxes shareholders might owe on any fund distributions or when they redeem their shares.
| 1 | Performance for Class C shares assumes a 1.00% contingent deferred sales charge (“CDSC”) applied when you sell shares within one year of purchase. |
| 2 | Russell Midcap® Value Index is an unmanaged index that measures the performance of the mid-cap value segment of the U.S. equity universe. It includes those Russell Midcap® Index companies with lower price-to-book ratios and lower forecasted growth values. |
| 3 | Fund performance has been increased by fee waivers and/or expense reimbursements, if any, without which performance would have been lower. |
| 4 | As of the most recent prospectus, the investment advisor has contractually agreed to waive fees and/or reimburse expenses (with certain exceptions) once the expense cap of the Fund has been exceeded. This arrangement is set to expire on 4/30/17. When an expense cap has not been exceeded, the fund may have similar expense ratios. |
| 24
Table of Contents
ADDITIONAL INFORMATION
The views expressed in this report reflect those of the portfolio managers as of the dates indicated. The managers’ views are subject to change at any time without notice based on changes in market or other conditions. References to specific securities or industries should not be regarded as investment advice. Because the Funds are actively managed, there is no assurance that they will continue to invest in the securities or industries mentioned.
All investing involves risk, including the risk of loss. There is no assurance that any investment will meet its performance objectives or that losses will be avoided.
ADDITIONAL INDEX INFORMATION
This document may contain references to third party copyrights, indexes, and trademarks, each of which is the property of its respective owner. Such owner is not affiliated with Natixis Global Asset Management or any of its related or affiliated companies (collectively “NGAM”) and does not sponsor, endorse or participate in the provision of any NGAM services, funds or other financial products.
The index information contained herein is derived from third parties and is provided on an “as is” basis. The user of this information assumes the entire risk of use of this information. Each of the third party entities involved in compiling, computing or creating index information disclaims all warranties (including, without limitation, any warranties of originality, accuracy, completeness, timeliness, non-infringement, merchantability and fitness for a particular purpose) with respect to such information.
PROXY VOTING INFORMATION
A description of the Natixis Funds’ proxy voting policies and procedures is available without charge, upon request, by calling Natixis Funds at 800-225-5478; on Natixis Funds’ website at ngam.natixis.com; and on the Securities and Exchange Commission’s (SEC) website at www.sec.gov. Information regarding how Natixis Funds voted proxies relating to portfolio securities during the most recent 12-month period ended June 30 is available from Natixis Funds’ website and the SEC’s website.
QUARTERLY PORTFOLIO SCHEDULES
Natixis Funds file a complete schedule of portfolio holdings with the SEC for the first and third quarters of each fiscal year on Form N-Q. The Funds’ Forms N-Q are available on the SEC’s website at www.sec.gov and may be reviewed and copied at the SEC’s Public Reference Room in Washington, DC. Information on the operation of the Public
Reference Room may be obtained by calling 800-SEC-0330.
25 |
Table of Contents
UNDERSTANDING FUND EXPENSES
As a mutual fund shareholder, you incur different costs: transaction costs, including sales charges (loads) on purchases and contingent deferred sales charges on redemptions, and ongoing costs, including management fees, distribution and/or service fees (12b-1 fees), and other fund expenses. Certain exemptions may apply. These costs are described in more detail in the Funds’ prospectus. The following examples are intended to help you understand the ongoing costs of investing in the Funds and help you compare these with the ongoing costs of investing in other mutual funds.
The first line in the table of each class of Fund shares shows the actual account values and actual Fund expenses you would have paid on a $1,000 investment in the Fund from July 1, 2016 through December 31, 2016. To estimate the expenses you paid over the period, simply divide your account value by $1,000 (for example $8,600 account value divided by $1,000 = 8.60) and multiply the result by the number in the Expenses Paid During Period column as shown for your class.
The second line in the table for each class of fund shares provides information about hypothetical account values and hypothetical expenses based on the Fund’s actual expense ratios and an assumed rate of return of 5% per year before expenses, which is not the Fund’s actual return. The hypothetical account values and expenses may not be used to estimate the actual ending account balance or expenses you paid on your investment for the period. You may use this information to compare the ongoing costs of investing in the Fund and other funds. To do so, compare this 5% hypothetical example with the 5% hypothetical examples that appear in the shareholder reports of the other funds.
Please note that the expenses shown reflect ongoing costs only, and do not include any transaction costs, such as sales charges. Therefore, the second line in the table of each fund is useful in comparing ongoing costs only, and will not help you determine the relative costs of owning different funds. If transaction costs were included, total costs would be higher.
| MIROVA GLOBAL SUSTAINABLE EQUITY FUND |
BEGINNING ACCOUNT VALUE 7/1/2016 |
ENDING ACCOUNT VALUE 12/31/2016 |
EXPENSES PAID DURING PERIOD* 7/1/2016 – 12/31/2016 |
|||||||||
| Class A | ||||||||||||
| Actual | $1,000.00 | $1,001.50 | $6.54 | |||||||||
| Hypothetical (5% return before expenses) | $1,000.00 | $1,018.60 | $6.60 | |||||||||
| Class C | ||||||||||||
| Actual | $1,000.00 | $998.10 | $10.30 | |||||||||
| Hypothetical (5% return before expenses) | $1,000.00 | $1,014.83 | $10.38 | |||||||||
| Class Y | ||||||||||||
| Actual | $1,000.00 | $1,002.00 | $5.28 | |||||||||
| Hypothetical (5% return before expenses) | $1,000.00 | $1,019.86 | $5.33 | |||||||||
| * | Expenses are equal to the Fund’s annualized expense ratio (after waiver/reimbursement): 1.30%, 2.05% and 1.05% for Class A, C and Y, respectively, multiplied by the average account value over the period, multiplied by the number of days in the most recent fiscal half-year (184), divided by 366 (to reflect the half-year period). |
| 26
Table of Contents
| NATIXIS OAKMARK FUND | BEGINNING ACCOUNT VALUE 7/1/2016 |
ENDING ACCOUNT VALUE 12/31/2016 |
EXPENSES PAID DURING PERIOD* 7/1/2016 – 12/31/2016 |
|||||||||
| Class A | ||||||||||||
| Actual | $1,000.00 | $1,178.00 | $6.41 | |||||||||
| Hypothetical (5% return before expenses) | $1,000.00 | $1,019.26 | $5.94 | |||||||||
| Class C | ||||||||||||
| Actual | $1,000.00 | $1,173.00 | $10.49 | |||||||||
| Hypothetical (5% return before expenses) | $1,000.00 | $1,015.48 | $9.73 | |||||||||
| Class Y | ||||||||||||
| Actual | $1,000.00 | $1,179.60 | $5.04 | |||||||||
| Hypothetical (5% return before expenses) | $1,000.00 | $1,020.51 | $4.67 | |||||||||
| * | Expenses are equal to the Fund’s annualized expense ratio: 1.17%, 1.92% and 0.92% for Class A, C and Y, respectively, multiplied by the average account value over the period, multiplied by the number of days in the most recent fiscal half-year (184), divided by 366 (to reflect the half-year period). |
| NATIXIS OAKMARK INTERNATIONAL FUND | BEGINNING ACCOUNT VALUE 7/1/2016 |
ENDING ACCOUNT VALUE 12/31/2016 |
EXPENSES PAID DURING PERIOD* 7/1/2016 – 12/31/2016 |
|||||||||
| Class A | ||||||||||||
| Actual | $1,000.00 | $1,204.40 | $7.43 | |||||||||
| Hypothetical (5% return before expenses) | $1,000.00 | $1,018.40 | $6.80 | |||||||||
| Class C | ||||||||||||
| Actual | $1,000.00 | $1,200.90 | $11.56 | |||||||||
| Hypothetical (5% return before expenses) | $1,000.00 | $1,014.63 | $10.58 | |||||||||
| * | Expenses are equal to the Fund’s annualized expense ratio: 1.34% and 2.09% for Class A and C, respectively, multiplied by the average account value over the period, multiplied by the number of days in the most recent fiscal half-year (184), divided by 366 (to reflect the half-year period). |
27 |
Table of Contents
| VAUGHAN NELSON SMALL CAP VALUE FUND | BEGINNING ACCOUNT VALUE 7/1/2016 |
ENDING ACCOUNT VALUE 12/31/2016 |
EXPENSES PAID DURING PERIOD* 7/1/2016 – 12/31/2016 |
|||||||||
| Class A | ||||||||||||
| Actual | $1,000.00 | $1,158.40 | $7.27 | |||||||||
| Hypothetical (5% return before expenses) | $1,000.00 | $1,018.40 | $6.80 | |||||||||
| Class C | ||||||||||||
| Actual | $1,000.00 | $1,153.80 | $11.32 | |||||||||
| Hypothetical (5% return before expenses) | $1,000.00 | $1,014.63 | $10.58 | |||||||||
| Class Y | ||||||||||||
| Actual | $1,000.00 | $1,159.20 | $5.92 | |||||||||
| Hypothetical (5% return before expenses) | $1,000.00 | $1,019.66 | $5.53 | |||||||||
| * | Expenses are equal to the Fund’s annualized expense ratio: 1.34%, 2.09% and 1.09% for Class A, C and Y, respectively, multiplied by the average account value over the period, multiplied by the number of days in the most recent fiscal half-year (184), divided by 366 (to reflect the half-year period). |
| VAUGHAN NELSON VALUE OPPORTUNITY FUND | BEGINNING ACCOUNT VALUE 7/1/2016 |
ENDING ACCOUNT VALUE 12/31/2016 |
EXPENSES PAID DURING PERIOD* 7/1/2016 – 12/31/2016 |
|||||||||
| Class A | ||||||||||||
| Actual | $1,000.00 | $1,081.70 | $6.38 | |||||||||
| Hypothetical (5% return before expenses) | $1,000.00 | $1,019.00 | $6.19 | |||||||||
| Class C | ||||||||||||
| Actual | $1,000.00 | $1,077.30 | $10.29 | |||||||||
| Hypothetical (5% return before expenses) | $1,000.00 | $1,015.23 | $9.98 | |||||||||
| Class N | ||||||||||||
| Actual | $1,000.00 | $1,082.90 | $4.61 | |||||||||
| Hypothetical (5% return before expenses) | $1,000.00 | $1,020.71 | $4.47 | |||||||||
| Class Y | ||||||||||||
| Actual | $1,000.00 | $1,082.70 | $5.08 | |||||||||
| Hypothetical (5% return before expenses) | $1,000.00 | $1,020.26 | $4.93 | |||||||||
| * | Expenses are equal to the Fund’s annualized expense ratio: 1.22%, 1.97%, 0.88% and 0.97% for Class A, C, N and Y, respectively, multiplied by the average account value over the period, multiplied by the number of days in the most recent fiscal half-year (184), divided by 366 (to reflect the half-year period). |
| 28
Table of Contents
Portfolio of Investments – as of December 31, 2016
Mirova Global Sustainable Equity Fund
| Shares | Description | Value (†) | ||||||
| Common Stocks — 94.1% of Net Assets | ||||||||
| Belgium — 3.7% | ||||||||
| 29,353 | KBC Groep NV | $ | 1,813,657 | |||||
|
|
|
|||||||
| Canada — 1.1% | ||||||||
| 21,332 | AltaGas Ltd. | 538,603 | ||||||
|
|
|
|||||||
| Denmark — 7.0% | ||||||||
| 8,800 | Chr. Hansen Holding AS | 486,687 | ||||||
| 5,826 | Coloplast AS, Series B | 392,431 | ||||||
| 41,389 | Novo Nordisk AS, Class B | 1,484,713 | ||||||
| 10,116 | Novozymes AS | 348,111 | ||||||
| 11,569 | Vestas Wind Systems AS | 749,261 | ||||||
|
|
|
|||||||
| 3,461,203 | ||||||||
|
|
|
|||||||
| France — 7.1% | ||||||||
| 15,221 | Essilor International S.A. | 1,717,358 | ||||||
| 2,371 | Ingenico Group S.A. | 189,172 | ||||||
| 4,658 | L’Oreal S.A. | 848,992 | ||||||
| 13,492 | Valeo S.A. | 774,546 | ||||||
|
|
|
|||||||
| 3,530,068 | ||||||||
|
|
|
|||||||
| Germany — 5.2% | ||||||||
| 3,720 | Allianz SE, (Registered) | 613,941 | ||||||
| 61,274 | Deutsche Telekom AG | 1,051,290 | ||||||
| 15,055 | Symrise AG | 914,708 | ||||||
|
|
|
|||||||
| 2,579,939 | ||||||||
|
|
|
|||||||
| Hong Kong — 1.9% | ||||||||
| 80,737 | AIA Group Ltd. | 452,276 | ||||||
| 21,000 | Tencent Holdings Ltd. | 509,189 | ||||||
|
|
|
|||||||
| 961,465 | ||||||||
|
|
|
|||||||
| Ireland — 3.5% | ||||||||
| 17,500 | Eaton Corp. PLC | 1,174,075 | ||||||
| 8,100 | Medtronic PLC | 576,963 | ||||||
|
|
|
|||||||
| 1,751,038 | ||||||||
|
|
|
|||||||
| Japan — 3.0% | ||||||||
| 4,100 | Rinnai Corp. | 329,901 | ||||||
| 19,700 | Toyota Motor Corp. | 1,154,979 | ||||||
|
|
|
|||||||
| 1,484,880 | ||||||||
|
|
|
|||||||
| Netherlands — 3.8% | ||||||||
| 7,332 | ASML Holding NV | 821,700 | ||||||
| 26,392 | Unilever NV | 1,084,152 | ||||||
|
|
|
|||||||
| 1,905,852 | ||||||||
|
|
|
|||||||
| Singapore — 1.5% | ||||||||
| 768,700 | Raffles Medical Group Ltd. | 758,429 | ||||||
|
|
|
|||||||
| Spain — 1.1% | ||||||||
| 21,397 | Enagas S.A. | 542,269 | ||||||
|
|
|
|||||||
See accompanying notes to financial statements.
29 |
Table of Contents
Portfolio of Investments – as of December 31, 2016
Mirova Global Sustainable Equity Fund – (continued)
| Shares | Description | Value (†) | ||||||
| Switzerland — 1.5% | ||||||||
| 11,471 | Cie Financiere Richemont S.A., (Registered) | $ | 758,124 | |||||
|
|
|
|||||||
| United Kingdom — 4.2% | ||||||||
| 303,943 | Legal & General Group PLC | 925,924 | ||||||
| 59,345 | Prudential PLC | 1,184,376 | ||||||
|
|
|
|||||||
| 2,110,300 | ||||||||
|
|
|
|||||||
| United States — 49.5% | ||||||||
| 16,200 | A.O. Smith Corp. | 767,070 | ||||||
| 2,100 | Alexion Pharmaceuticals, Inc.(b) | 256,935 | ||||||
| 3,101 | Alphabet, Inc., Class A(b) | 2,457,387 | ||||||
| 1,900 | Amazon.com, Inc.(b) | 1,424,753 | ||||||
| 10,174 | American Water Works Co., Inc. | 736,191 | ||||||
| 10,600 | Criteo S.A., Sponsored ADR(b) | 435,448 | ||||||
| 23,187 | Danaher Corp. | 1,804,876 | ||||||
| 16,500 | Delphi Automotive PLC | 1,111,275 | ||||||
| 9,000 | Ecolab, Inc. | 1,054,980 | ||||||
| 13,200 | Ellie Mae, Inc.(b) | 1,104,576 | ||||||
| 8,400 | Facebook, Inc., Class A(b) | 966,420 | ||||||
| 8,400 | Gilead Sciences, Inc. | 601,524 | ||||||
| 3,400 | Illumina, Inc.(b) | 435,336 | ||||||
| 4,100 | International Flavors & Fragrances, Inc. | 483,103 | ||||||
| 13,700 | MasterCard, Inc., Class A | 1,414,525 | ||||||
| 29,363 | Microsoft Corp. | 1,824,617 | ||||||
| 6,296 | NextEra Energy, Inc. | 752,120 | ||||||
| 11,300 | Roper Technologies, Inc. | 2,068,804 | ||||||
| 16,600 | Thermo Fisher Scientific, Inc. | 2,342,260 | ||||||
| 5,800 | United Natural Foods, Inc.(b) | 276,776 | ||||||
| 29,200 | Visa, Inc., Class A | 2,278,184 | ||||||
|
|
|
|||||||
| 24,597,160 | ||||||||
|
|
|
|||||||
| Total Common Stocks (Identified Cost $48,124,449) |
46,792,987 | |||||||
|
|
|
|||||||
| Principal Amount |
||||||||
| Short-Term Investments — 5.9% | ||||||||
| $ | 2,928,328 | Tri-Party Repurchase Agreement with Fixed Income Clearing Corporation, dated 12/30/2016 at 0.030% to be repurchased at $2,928,338 on 1/03/2017 collateralized by $3,060,000 U.S. Treasury Note, 2.000% due 2/15/2025 valued at $2,990,247 including accrued interest (Note 2 of Notes to Financial Statements) (Identified Cost $2,928,328) | 2,928,328 | |||||
|
|
|
|||||||
| Total Investments — 100.0% (Identified Cost $51,052,777)(a) |
49,721,315 | |||||||
| Other assets less liabilities — (0.0)% | (5,302 | ) | ||||||
|
|
|
|||||||
| Net Assets — 100.0% | $ | 49,716,013 | ||||||
|
|
|
|||||||
See accompanying notes to financial statements.
| 30
Table of Contents
Portfolio of Investments – as of December 31, 2016
Mirova Global Sustainable Equity Fund – (continued)
| (†) | See Note 2 of Notes to Financial Statements. | |||||||
| (a) | Federal Tax Information: | |||||||
| At December 31, 2016, the net unrealized depreciation on investments based on a cost of $51,045,564 for federal income tax purposes was as follows: | ||||||||
| Aggregate gross unrealized appreciation for all investments in which there is an excess of value over tax cost | $ | 1,668,771 | ||||||
| Aggregate gross unrealized depreciation for all investments in which there is an excess of tax cost over value | (2,993,020 | ) | ||||||
|
|
|
|||||||
| Net unrealized depreciation | $ | (1,324,249 | ) | |||||
|
|
|
|||||||
| (b) | Non-income producing security. | |||||||
| ADR | An American Depositary Receipt is a certificate issued by a custodian bank representing the right to receive securities of the foreign issuer described. The values of ADRs may be significantly influenced by trading on exchanges not located in the United States. | |||||||
Industry Summary at December 31, 2016
| Health Care Equipment & Supplies |
8.9 | % | ||
| Internet Software & Services |
8.7 | |||
| IT Services |
7.5 | |||
| Chemicals |
6.7 | |||
| Insurance |
6.3 | |||
| Software |
5.9 | |||
| Life Sciences Tools & Services |
5.6 | |||
| Industrial Conglomerates |
4.2 | |||
| Personal Products |
3.9 | |||
| Electrical Equipment |
3.9 | |||
| Auto Components |
3.8 | |||
| Banks |
3.7 | |||
| Pharmaceuticals |
3.0 | |||
| Internet & Direct Marketing Retail |
2.9 | |||
| Automobiles |
2.3 | |||
| Diversified Telecommunication Services |
2.1 | |||
| Other Investments, less than 2% each |
14.7 | |||
| Short-Term Investments |
5.9 | |||
|
|
|
|||
| Total Investments |
100.0 | |||
| Other assets less liabilities |
(0.0 | ) | ||
|
|
|
|||
| Net Assets |
100.0 | % | ||
|
|
|
See accompanying notes to financial statements.
31 |
Table of Contents
Portfolio of Investments – as of December 31, 2016
Mirova Global Sustainable Equity Fund – (continued)
Currency Exposure Summary at December 31, 2016
| United States Dollar |
58.9 | % | ||
| Euro |
20.9 | |||
| Danish Krone |
7.0 | |||
| British Pound |
4.2 | |||
| Japanese Yen |
3.0 | |||
| Other, less than 2% each |
6.0 | |||
|
|
|
|||
| Total Investments |
100.0 | |||
| Other assets less liabilities |
(0.0 | ) | ||
|
|
|
|||
| Net Assets |
100.0 | % | ||
|
|
|
See accompanying notes to financial statements.
| 32
Table of Contents
Portfolio of Investments – as of December 31, 2016
Natixis Oakmark Fund
| Shares | Description | Value (†) | ||||||
| Common Stocks — 93.0% of Net Assets | ||||||||
| Air Freight & Logistics — 2.2% | ||||||||
| 30,765 | FedEx Corp. | $ | 5,728,443 | |||||
|
|
|
|||||||
| Automobiles — 4.2% | ||||||||
| 364,300 | Fiat Chrysler Automobiles NV | 3,322,416 | ||||||
| 117,800 | General Motors Co. | 4,104,152 | ||||||
| 54,600 | Harley-Davidson, Inc. | 3,185,364 | ||||||
|
|
|
|||||||
| 10,611,932 | ||||||||
|
|
|
|||||||
| Banks — 10.9% | ||||||||
| 335,700 | Bank of America Corp. | 7,418,970 | ||||||
| 152,100 | Citigroup, Inc. | 9,039,303 | ||||||
| 79,700 | JPMorgan Chase & Co. | 6,877,313 | ||||||
| 79,500 | Wells Fargo & Co. | 4,381,245 | ||||||
|
|
|
|||||||
| 27,716,831 | ||||||||
|
|
|
|||||||
| Beverages — 2.0% | ||||||||
| 47,900 | Diageo PLC, Sponsored ADR | 4,978,726 | ||||||
|
|
|
|||||||
| Capital Markets — 5.7% | ||||||||
| 98,200 | Bank of New York Mellon Corp. (The) | 4,652,716 | ||||||
| 17,110 | Goldman Sachs Group, Inc. (The) | 4,096,990 | ||||||
| 74,000 | State Street Corp. | 5,751,280 | ||||||
|
|
|
|||||||
| 14,500,986 | ||||||||
|
|
|
|||||||
| Consumer Finance — 4.2% | ||||||||
| 247,600 | Ally Financial, Inc. | 4,709,352 | ||||||
| 70,000 | Capital One Financial Corp. | 6,106,800 | ||||||
|
|
|
|||||||
| 10,816,152 | ||||||||
|
|
|
|||||||
| Electronic Equipment, Instruments & Components — 2.1% | ||||||||
| 76,800 | TE Connectivity Ltd. | 5,320,704 | ||||||
|
|
|
|||||||
| Energy Equipment & Services — 2.0% | ||||||||
| 44,600 | Halliburton Co. | 2,412,414 | ||||||
| 69,200 | National Oilwell Varco, Inc. | 2,590,848 | ||||||
|
|
|
|||||||
| 5,003,262 | ||||||||
|
|
|
|||||||
| Food Products — 2.0% | ||||||||
| 70,490 | Nestle S.A., Sponsored ADR | 5,056,953 | ||||||
|
|
|
|||||||
| Health Care Equipment & Supplies — 1.9% | ||||||||
| 70,800 | Baxter International, Inc. | 3,139,272 | ||||||
| 25,280 | Medtronic PLC | 1,800,694 | ||||||
|
|
|
|||||||
| 4,939,966 | ||||||||
|
|
|
|||||||
| Health Care Providers & Services — 3.2% | ||||||||
| 34,800 | HCA Holdings, Inc.(b) | 2,575,896 | ||||||
| 34,250 | UnitedHealth Group, Inc. | 5,481,370 | ||||||
|
|
|
|||||||
| 8,057,266 | ||||||||
|
|
|
|||||||
See accompanying notes to financial statements.
33 |
Table of Contents
Portfolio of Investments – as of December 31, 2016
Natixis Oakmark Fund – (continued)
| Shares | Description | Value (†) | ||||||
| Hotels, Restaurants & Leisure — 1.2% | ||||||||
| 110,400 | MGM Resorts International(b) | $ | 3,182,832 | |||||
|
|
|
|||||||
| Household Durables — 1.9% | ||||||||
| 27,340 | Whirlpool Corp. | 4,969,592 | ||||||
|
|
|
|||||||
| Industrial Conglomerates — 2.7% | ||||||||
| 222,000 | General Electric Co. | 7,015,200 | ||||||
|
|
|
|||||||
| Insurance — 6.8% | ||||||||
| 76,300 | Aflac, Inc. | 5,310,480 | ||||||
| 110,200 | American International Group, Inc. | 7,197,162 | ||||||
| 43,350 | Aon PLC | 4,834,825 | ||||||
|
|
|
|||||||
| 17,342,467 | ||||||||
|
|
|
|||||||
| Internet & Direct Marketing Retail — 1.4% | ||||||||
| 181,300 | Liberty Interactive Corp./QVC Group, Class A(b) | 3,622,374 | ||||||
|
|
|
|||||||
| Internet Software & Services — 3.1% | ||||||||
| 10,000 | Alphabet, Inc., Class A(b) | 7,924,500 | ||||||
|
|
|
|||||||
| IT Services — 7.0% | ||||||||
| 53,300 | Automatic Data Processing, Inc. | 5,478,174 | ||||||
| 59,500 | MasterCard, Inc., Class A | 6,143,375 | ||||||
| 80,220 | Visa, Inc., Class A | 6,258,764 | ||||||
|
|
|
|||||||
| 17,880,313 | ||||||||
|
|
|
|||||||
| Machinery — 6.0% | ||||||||
| 55,400 | Caterpillar, Inc. | 5,137,796 | ||||||
| 35,800 | Cummins, Inc. | 4,892,786 | ||||||
| 38,000 | Parker Hannifin Corp. | 5,320,000 | ||||||
|
|
|
|||||||
| 15,350,582 | ||||||||
|
|
|
|||||||
| Media — 2.4% | ||||||||
| 46,600 | Comcast Corp., Class A | 3,217,730 | ||||||
| 262,800 | News Corp., Class A | 3,011,688 | ||||||
|
|
|
|||||||
| 6,229,418 | ||||||||
|
|
|
|||||||
| Oil, Gas & Consumable Fuels — 4.9% | ||||||||
| 79,200 | Anadarko Petroleum Corp. | 5,522,616 | ||||||
| 109,500 | Apache Corp. | 6,949,965 | ||||||
|
|
|
|||||||
| 12,472,581 | ||||||||
|
|
|
|||||||
| Personal Products — 1.9% | ||||||||
| 116,600 | Unilever PLC, Sponsored ADR | 4,745,620 | ||||||
|
|
|
|||||||
| Pharmaceuticals — 0.8% | ||||||||
| 49,100 | Sanofi, Sponsored ADR | 1,985,604 | ||||||
|
|
|
|||||||
| Semiconductors & Semiconductor Equipment — 6.4% | ||||||||
| 158,300 | Intel Corp. | 5,741,541 | ||||||
| 75,000 | QUALCOMM, Inc. | 4,890,000 | ||||||
| 79,600 | Texas Instruments, Inc. | 5,808,412 | ||||||
|
|
|
|||||||
| 16,439,953 | ||||||||
|
|
|
|||||||
See accompanying notes to financial statements.
| 34
Table of Contents
Portfolio of Investments – as of December 31, 2016
Natixis Oakmark Fund – (continued)
| Shares | Description | Value (†) | ||||||
| Software — 3.5% | ||||||||
| 60,300 | Microsoft Corp. | $ | 3,747,042 | |||||
| 136,500 | Oracle Corp. | 5,248,425 | ||||||
|
|
|
|||||||
| 8,995,467 | ||||||||
|
|
|
|||||||
| Specialty Retail — 0.3% | ||||||||
| 15,500 | AutoNation, Inc.(b) | 754,075 | ||||||
|
|
|
|||||||
| Technology Hardware, Storage & Peripherals — 2.3% | ||||||||
| 50,350 | Apple, Inc. | 5,831,537 | ||||||
|
|
|
|||||||
| Total Common Stocks (Identified Cost $196,226,686) |
237,473,336 | |||||||
|
|
|
|||||||
| Principal Amount |
||||||||
| Short-Term Investments — 7.9% | ||||||||
| $ | 20,125,275 | Tri-Party Repurchase Agreement with Fixed Income Clearing Corporation, dated 12/30/2016 at 0.030% to be repurchased at $20,125,341 on 1/03/2017 collateralized by $21,110,000 U.S. Treasury Note, 2.000% due 8/15/2025 valued at $20,528,187 including accrued interest (Note 2 of Notes to Financial Statements) (Identified Cost $20,125,275) | 20,125,275 | |||||
|
|
|
|||||||
| Total Investments — 100.9% (Identified Cost $216,351,961)(a) |
257,598,611 | |||||||
| Other assets less liabilities — (0.9)% | (2,400,336 | ) | ||||||
|
|
|
|||||||
| Net Assets — 100.0% | $ | 255,198,275 | ||||||
|
|
|
|||||||
| (†) | See Note 2 of Notes to Financial Statements. | |||||||
| (a) | Federal Tax Information: | |||||||
| At December 31, 2016, the net unrealized appreciation on investments based on a cost of $216,959,241 for federal income tax purposes was as follows: | ||||||||
| Aggregate gross unrealized appreciation for all investments in which there is an excess of value over tax cost | $ | 45,998,930 | ||||||
| Aggregate gross unrealized depreciation for all investments in which there is an excess of tax cost over value | (5,359,560 | ) | ||||||
|
|
|
|||||||
| Net unrealized appreciation | $ | 40,639,370 | ||||||
|
|
|
|||||||
| (b) | Non-income producing security. | |||||||
| ADR | An American Depositary Receipt is a certificate issued by a custodian bank representing the right to receive securities of the foreign issuer described. The values of ADRs may be significantly influenced by trading on exchanges not located in the United States. | |||||||
See accompanying notes to financial statements.
35 |
Table of Contents
Portfolio of Investments – as of December 31, 2016
Natixis Oakmark Fund – (continued)
Industry Summary at December 31, 2016
| Banks |
10.9 | % | ||
| IT Services |
7.0 | |||
| Insurance |
6.8 | |||
| Semiconductors & Semiconductor Equipment |
6.4 | |||
| Machinery |
6.0 | |||
| Capital Markets |
5.7 | |||
| Oil, Gas & Consumable Fuels |
4.9 | |||
| Consumer Finance |
4.2 | |||
| Automobiles |
4.2 | |||
| Software |
3.5 | |||
| Health Care Providers & Services |
3.2 | |||
| Internet Software & Services |
3.1 | |||
| Industrial Conglomerates |
2.7 | |||
| Media |
2.4 | |||
| Technology Hardware, Storage & Peripherals |
2.3 | |||
| Air Freight & Logistics |
2.2 | |||
| Electronic Equipment, Instruments & Components |
2.1 | |||
| Food Products |
2.0 | |||
| Energy Equipment & Services |
2.0 | |||
| Beverages |
2.0 | |||
| Other Investments, less than 2% each |
9.4 | |||
| Short-Term Investments |
7.9 | |||
|
|
|
|||
| Total Investments |
100.9 | |||
| Other assets less liabilities |
(0.9 | ) | ||
|
|
|
|||
| Net Assets |
100.0 | % | ||
|
|
|
See accompanying notes to financial statements.
| 36
Table of Contents
Portfolio of Investments – as of December 31, 2016
Natixis Oakmark International Fund
| Shares | Description | Value (†) | ||||||
| Common Stocks — 98.0% of Net Assets | ||||||||
| Australia — 3.9% | ||||||||
| 4,362,368 | AMP Ltd. | $ | 15,821,619 | |||||
| 1,165,216 | Orica Ltd. | 14,808,882 | ||||||
|
|
|
|||||||
| 30,630,501 | ||||||||
|
|
|
|||||||
| China — 2.0% | ||||||||
| 95,715 | Baidu, Inc., Sponsored ADR(b) | 15,736,503 | ||||||
|
|
|
|||||||
| France — 14.8% | ||||||||
| 444,400 | BNP Paribas S.A.(c) | 28,280,689 | ||||||
| 717,100 | Bureau Veritas S.A. | 13,878,965 | ||||||
| 224,023 | Danone | 14,175,852 | ||||||
| 55,815 | Kering | 12,519,503 | ||||||
| 67,650 | LVMH Moet Hennessy Louis Vuitton SE | 12,898,935 | ||||||
| 99,100 | Pernod-Ricard S.A. | 10,724,607 | ||||||
| 163,800 | Safran S.A. | 11,781,132 | ||||||
| 14,800 | Sanofi | 1,196,805 | ||||||
| 195,900 | Valeo S.A. | 11,246,189 | ||||||
|
|
|
|||||||
| 116,702,677 | ||||||||
|
|
|
|||||||
| Germany — 9.9% | ||||||||
| 165,300 | Allianz SE, (Registered) | 27,280,762 | ||||||
| 86,200 | Bayerische Motoren Werke AG | 8,028,324 | ||||||
| 83,450 | Continental AG | 16,077,209 | ||||||
| 356,400 | Daimler AG, (Registered) | 26,450,428 | ||||||
|
|
|
|||||||
| 77,836,723 | ||||||||
|
|
|
|||||||
| Hong Kong — 1.4% | ||||||||
| 719,995 | Melco Crown Entertainment Ltd., Sponsored ADR | 11,447,921 | ||||||
|
|
|
|||||||
| India — 0.6% | ||||||||
| 314,500 | Infosys Ltd., Sponsored ADR | 4,664,035 | ||||||
|
|
|
|||||||
| Indonesia — 1.8% | ||||||||
| 16,677,900 | Bank Mandiri Persero Tbk PT | 14,274,336 | ||||||
|
|
|
|||||||
| Ireland — 1.0% | ||||||||
| 434,531 | Experian PLC | 8,413,224 | ||||||
|
|
|
|||||||
| Israel — 0.1% | ||||||||
| 7,000 | Check Point Software Technologies Ltd.(b) | 591,220 | ||||||
|
|
|
|||||||
| Italy — 4.9% | ||||||||
| 10,995,000 | Intesa Sanpaolo SpA | 27,851,887 | ||||||
| 3,310,400 | Prada SpA | 11,190,107 | ||||||
|
|
|
|||||||
| 39,041,994 | ||||||||
|
|
|
|||||||
| Japan — 9.0% | ||||||||
| 2,509,000 | Daiwa Securities Group, Inc. | 15,449,733 | ||||||
| 668,900 | Honda Motor Co. Ltd.(c) | 19,528,731 | ||||||
| 285,700 | Komatsu Ltd. | 6,471,145 | ||||||
| 126,200 | Nomura Holdings, Inc. | 746,115 | ||||||
| 107,600 | Olympus Corp. | 3,707,331 | ||||||
See accompanying notes to financial statements.
37 |
Table of Contents
Portfolio of Investments – as of December 31, 2016
Natixis Oakmark International Fund – (continued)
| Shares | Description | Value (†) | ||||||
| Japan — continued | ||||||||
| 202,400 | Omron Corp. | $ | 7,734,708 | |||||
| 294,200 | Toyota Motor Corp. | 17,248,474 | ||||||
|
|
|
|||||||
| 70,886,237 | ||||||||
|
|
|
|||||||
| Korea — 1.1% | ||||||||
| 6,090 | Samsung Electronics Co. Ltd. | 9,063,820 | ||||||
|
|
|
|||||||
| Mexico — 1.8% | ||||||||
| 685,645 | Grupo Televisa SAB, Sponsored ADR | 14,323,124 | ||||||
|
|
|
|||||||
| Netherlands — 4.9% | ||||||||
| 70,731 | Akzo Nobel NV | 4,419,752 | ||||||
| 34,230 | ASML Holding NV | 3,836,170 | ||||||
| 443,400 | EXOR NV | 19,069,262 | ||||||
| 363,439 | Koninklijke Philips NV | 11,111,028 | ||||||
|
|
|
|||||||
| 38,436,212 | ||||||||
|
|
|
|||||||
| Sweden — 4.4% | ||||||||
| 127,200 | Atlas Copco AB, B Shares | 3,458,242 | ||||||
| 588,500 | Hennes & Mauritz AB, B Shares | 16,313,872 | ||||||
| 803,900 | SKF AB, B Shares | 14,740,442 | ||||||
|
|
|
|||||||
| 34,512,556 | ||||||||
|
|
|
|||||||
| Switzerland — 16.4% | ||||||||
| 255,800 | Cie Financiere Richemont S.A., (Registered) | 16,905,959 | ||||||
| 1,899,667 | Credit Suisse Group AG, (Registered)(c) | 27,148,193 | ||||||
| 10,097,100 | Glencore PLC(b) | 34,116,918 | ||||||
| 83,400 | Kuehne & Nagel International AG, (Registered) | 11,008,689 | ||||||
| 324,695 | LafargeHolcim Ltd., (Registered) | 17,043,913 | ||||||
| 103,400 | Nestle S.A., (Registered) | 7,407,324 | ||||||
| 49,705 | Swatch Group AG (The) | 15,426,572 | ||||||
|
|
|
|||||||
| 129,057,568 | ||||||||
|
|
|
|||||||
| Taiwan — 0.3% | ||||||||
| 392,000 | Taiwan Semiconductor Manufacturing Co. Ltd. | 2,195,691 | ||||||
|
|
|
|||||||
| United Kingdom — 17.8% | ||||||||
| 778,900 | Ashtead Group PLC | 15,142,106 | ||||||
| 3,000,300 | CNH Industrial NV | 26,033,589 | ||||||
| 608,100 | Diageo PLC | 15,780,094 | ||||||
| 3,098,400 | G4S PLC | 8,955,532 | ||||||
| 40,246,000 | Lloyds Banking Group PLC | 30,903,948 | ||||||
| 1,260,004 | Meggitt PLC | 7,115,482 | ||||||
| 4,441,400 | Royal Bank of Scotland Group PLC(b) | 12,272,265 | ||||||
| 382,289 | Schroders PLC | 14,040,678 | ||||||
| 100 | Schroders PLC, (Non Voting) | 2,752 | ||||||
| 362,800 | Smiths Group PLC | 6,315,296 | ||||||
| 47,000 | Wolseley PLC | 2,869,168 | ||||||
| 36,200 | WPP PLC | 805,574 | ||||||
|
|
|
|||||||
| 140,236,484 | ||||||||
|
|
|
|||||||
See accompanying notes to financial statements.
| 38
Table of Contents
Portfolio of Investments – as of December 31, 2016
Natixis Oakmark International Fund – (continued)
| Shares | Description | Value (†) | ||||||
| United States — 1.9% | ||||||||
| 120,892 | Willis Towers Watson PLC | $ | 14,782,674 | |||||
|
|
|
|||||||
| Total Common Stocks (Identified Cost $771,054,459) | 772,833,500 | |||||||
|
|
|
|||||||
| Principal Amount |
||||||||
| Short-Term Investments — 2.2% | ||||||||
| $ | 17,200,791 | Tri-Party Repurchase Agreement with Fixed Income Clearing Corporation, dated 12/30/2016 at 0.030% to be repurchased at $17,200,848 on 1/03/2017 collateralized by $18,045,000 U.S. Treasury Note, 2.000% due 8/15/2025 valued at $17,547,662 including accrued interest (Note 2 of Notes to Financial Statements) (Identified Cost $17,200,791) | 17,200,791 | |||||
|
|
|
|||||||
| Total Investments — 100.2% (Identified Cost $788,255,250)(a) |
790,034,291 | |||||||
| Other assets less liabilities — (0.2)% | (1,672,806 | ) | ||||||
|
|
|
|||||||
| Net Assets — 100.0% | $ | 788,361,485 | ||||||
|
|
|
|||||||
| (†) | See Note 2 of Notes to Financial Statements. | |||||||
| (a) | Federal Tax Information: | |||||||
| At December 31, 2016, the net unrealized depreciation on investments based on a cost of $816,453,492 for federal income tax purposes was as follows: | ||||||||
| Aggregate gross unrealized appreciation for all investments in which there is an excess of value over tax cost | $ | 25,526,340 | ||||||
| Aggregate gross unrealized depreciation for all investments in which there is an excess of tax cost over value | (51,945,541 | ) | ||||||
|
|
|
|||||||
| Net unrealized depreciation | $ | (26,419,201 | ) | |||||
|
|
|
|||||||
| (b) | Non-income producing security. | |||||||
| (c) | Security (or a portion thereof) has been designated to cover the Fund’s obligations under open derivative contracts. | |||||||
| ADR | An American Depositary Receipt is a certificate issued by a custodian bank representing the right to receive securities of the foreign issuer described. The values of ADRs may be significantly influenced by trading on exchanges not located in the United States. | |||||||
See accompanying notes to financial statements.
39 |
Table of Contents
Portfolio of Investments – as of December 31, 2016
Natixis Oakmark International Fund – (continued)
At December 31, 2016, the Fund had the following open forward foreign currency contracts:
| Contract to Buy/Sell |
Delivery Date |
Currency | Units of Currency |
Notional Value |
Unrealized Appreciation (Depreciation) |
|||||||||||||
| Sell1 | 6/21/2017 | Australian Dollar | 4,156,000 | $ | 2,987,225 | $ | 51,156 | |||||||||||
| Buy1 | 3/15/2017 | Swiss Franc | 4,193,000 | 4,135,716 | 40,498 | |||||||||||||
| Sell1 | 3/15/2017 | Swiss Franc | 27,035,000 | 26,665,653 | 1,385,063 | |||||||||||||
|
|
|
|||||||||||||||||
| Total | $ | 1,476,717 | ||||||||||||||||
|
|
|
|||||||||||||||||
1 Counterparty is State Street Bank and Trust Company
Industry Summary at December 31, 2016
| Banks |
14.4 | % | ||
| Automobiles |
9.1 | |||
| Textiles, Apparel & Luxury Goods |
8.8 | |||
| Capital Markets |
7.2 | |||
| Machinery |
6.4 | |||
| Insurance |
5.4 | |||
| Diversified Financial Services |
4.4 | |||
| Metals & Mining |
4.3 | |||
| Auto Components |
3.4 | |||
| Beverages |
3.4 | |||
| Professional Services |
2.8 | |||
| Food Products |
2.7 | |||
| Chemicals |
2.5 | |||
| Aerospace & Defense |
2.4 | |||
| Trading Companies & Distributors |
2.3 | |||
| Industrial Conglomerates |
2.2 | |||
| Construction Materials |
2.2 | |||
| Specialty Retail |
2.1 | |||
| Internet Software & Services |
2.0 | |||
| Other Investments, less than 2% each |
10.0 | |||
| Short-Term Investments |
2.2 | |||
|
|
|
|||
| Total Investments |
100.2 | |||
| Other assets less liabilities (including forward foreign currency contracts) |
(0.2 | ) | ||
|
|
|
|||
| Net Assets |
100.0 | % | ||
|
|
|
See accompanying notes to financial statements.
| 40
Table of Contents
Portfolio of Investments – as of December 31, 2016
Natixis Oakmark International Fund – (continued)
Currency Exposure Summary at December 31, 2016
| Euro |
36.4 | % | ||
| British Pound |
19.8 | |||
| Swiss Franc |
12.1 | |||
| United States Dollar |
10.0 | |||
| Japanese Yen |
9.0 | |||
| Swedish Krona |
4.4 | |||
| Australian Dollar |
3.9 | |||
| Other, less than 2% each |
4.6 | |||
|
|
|
|||
| Total Investments |
100.2 | |||
| Other assets less liabilities (including forward foreign currency contracts) |
(0.2 | ) | ||
|
|
|
|||
| Net Assets |
100.0 | % | ||
|
|
|
See accompanying notes to financial statements.
41 |
Table of Contents
Portfolio of Investments – as of December 31, 2016
Vaughan Nelson Small Cap Value Fund
| Shares | Description | Value (†) | ||||||
| Common Stocks — 88.2% of Net Assets | ||||||||
| Aerospace & Defense — 1.2% | ||||||||
| 107,375 | Engility Holdings, Inc.(b) | $ | 3,618,537 | |||||
|
|
|
|||||||
| Banks — 14.6% | ||||||||
| 24,250 | Community Trust Bancorp, Inc. | 1,202,800 | ||||||
| 231,250 | First Financial Bancorp | 6,579,062 | ||||||
| 169,200 | First Merchants Corp. | 6,370,380 | ||||||
| 168,925 | Hope Bancorp, Inc. | 3,697,768 | ||||||
| 61,225 | Lakeland Financial Corp. | 2,899,616 | ||||||
| 188,525 | Old National Bancorp | 3,421,729 | ||||||
| 106,850 | Pacific Premier Bancorp, Inc.(b) | 3,777,148 | ||||||
| 140,300 | Prosperity Bancshares, Inc. | 10,070,734 | ||||||
| 174,550 | Union Bankshares Corp. | 6,238,417 | ||||||
| 20,075 | Webster Financial Corp. | 1,089,671 | ||||||
|
|
|
|||||||
| 45,347,325 | ||||||||
|
|
|
|||||||
| Building Products — 1.9% | ||||||||
| 43,750 | American Woodmark Corp.(b) | 3,292,187 | ||||||
| 109,500 | Continental Building Products, Inc.(b) | 2,529,450 | ||||||
|
|
|
|||||||
| 5,821,637 | ||||||||
|
|
|
|||||||
| Chemicals — 0.4% | ||||||||
| 61,200 | AdvanSix, Inc.(b) | 1,354,968 | ||||||
|
|
|
|||||||
| Commercial Services & Supplies — 3.9% | ||||||||
| 144,650 | KAR Auction Services, Inc. | 6,164,983 | ||||||
| 51,650 | Multi-Color Corp. | 4,008,040 | ||||||
| 50,975 | Team, Inc.(b) | 2,000,769 | ||||||
|
|
|
|||||||
| 12,173,792 | ||||||||
|
|
|
|||||||
| Consumer Finance — 1.8% | ||||||||
| 118,775 | FirstCash, Inc. | 5,582,425 | ||||||
|
|
|
|||||||
| Containers & Packaging — 3.9% | ||||||||
| 448,925 | Graphic Packaging Holding Co. | 5,602,584 | ||||||
| 256,750 | Multi Packaging Solutions International Ltd.(b) | 3,661,255 | ||||||
| 56,825 | Silgan Holdings, Inc. | 2,908,303 | ||||||
|
|
|
|||||||
| 12,172,142 | ||||||||
|
|
|
|||||||
| Electric Utilities — 0.3% | ||||||||
| 16,475 | El Paso Electric Co. | 766,088 | ||||||
|
|
|
|||||||
| Electrical Equipment — 1.9% | ||||||||
| 185,025 | Atkore International Group, Inc.(b) | 4,423,948 | ||||||
| 70,300 | Thermon Group Holdings, Inc.(b) | 1,342,027 | ||||||
|
|
|
|||||||
| 5,765,975 | ||||||||
|
|
|
|||||||
| Electronic Equipment, Instruments & Components — 2.2% | ||||||||
| 16,775 | Littelfuse, Inc. | 2,545,942 | ||||||
| 49,650 | Zebra Technologies Corp., Class A(b) | 4,257,984 | ||||||
|
|
|
|||||||
| 6,803,926 | ||||||||
|
|
|
|||||||
See accompanying notes to financial statements.
| 42
Table of Contents
Portfolio of Investments – as of December 31, 2016
Vaughan Nelson Small Cap Value Fund – (continued)
| Shares | Description | Value (†) | ||||||
| Energy Equipment & Services — 1.0% | ||||||||
| 147,350 | Forum Energy Technologies, Inc.(b) | $ | 3,241,700 | |||||
|
|
|
|||||||
| Food Products — 0.8% | ||||||||
| 181,400 | Hostess Brands, Inc.(b) | 2,358,200 | ||||||
|
|
|
|||||||
| Gas Utilities — 0.8% | ||||||||
| 38,950 | Spire, Inc. | 2,514,223 | ||||||
|
|
|
|||||||
| Health Care Equipment & Supplies — 0.6% | ||||||||
| 22,925 | Integra LifeSciences Holdings Corp.(b) | 1,966,736 | ||||||
|
|
|
|||||||
| Health Care Providers & Services — 3.2% | ||||||||
| 64,700 | AMN Healthcare Services, Inc.(b) | 2,487,715 | ||||||
| 102,975 | Envision Healthcare Corp.(b) | 6,517,288 | ||||||
| 64,900 | Surgery Partners, Inc.(b) | 1,028,665 | ||||||
|
|
|
|||||||
| 10,033,668 | ||||||||
|
|
|
|||||||
| Health Care Technology — 0.9% | ||||||||
| 84,675 | Cotiviti Holdings, Inc.(b) | 2,912,820 | ||||||
|
|
|
|||||||
| Household Durables — 1.3% | ||||||||
| 129,825 | La-Z-Boy, Inc. | 4,031,066 | ||||||
|
|
|
|||||||
| Insurance — 8.6% | ||||||||
| 109,425 | Aspen Insurance Holdings Ltd. | 6,018,375 | ||||||
| 160,150 | Brown & Brown, Inc. | 7,184,329 | ||||||
| 179,050 | First American Financial Corp. | 6,558,601 | ||||||
| 50,216 | RenaissanceRe Holdings Ltd. | 6,840,424 | ||||||
|
|
|
|||||||
| 26,601,729 | ||||||||
|
|
|
|||||||
| Internet Software & Services — 0.4% | ||||||||
| 75,525 | CommerceHub, Inc., Series A(b) | 1,133,630 | ||||||
|
|
|
|||||||
| IT Services — 4.5% | ||||||||
| 161,825 | Booz Allen Hamilton Holding Corp. | 5,837,028 | ||||||
| 46,750 | CACI International, Inc., Class A(b) | 5,811,025 | ||||||
| 91,350 | Virtusa Corp.(b) | 2,294,712 | ||||||
|
|
|
|||||||
| 13,942,765 | ||||||||
|
|
|
|||||||
| Leisure Products — 1.3% | ||||||||
| 111,275 | Vista Outdoor, Inc.(b) | 4,106,047 | ||||||
|
|
|
|||||||
| Life Sciences Tools & Services — 4.4% | ||||||||
| 154,250 | Albany Molecular Research, Inc.(b) | 2,893,730 | ||||||
| 36,425 | INC Research Holdings, Inc., Class A(b) | 1,915,955 | ||||||
| 49,450 | PRA Health Sciences, Inc.(b) | 2,725,684 | ||||||
| 237,925 | VWR Corp.(b) | 5,955,263 | ||||||
|
|
|
|||||||
| 13,490,632 | ||||||||
|
|
|
|||||||
| Machinery — 4.2% | ||||||||
| 78,425 | Franklin Electric Co., Inc. | 3,050,732 | ||||||
| 25,650 | Global Brass & Copper Holdings, Inc. | 879,795 | ||||||
| 180,025 | Hillenbrand, Inc. | 6,903,959 | ||||||
| 29,300 | Lincoln Electric Holdings, Inc. | 2,246,431 | ||||||
|
|
|
|||||||
| 13,080,917 | ||||||||
|
|
|
|||||||
See accompanying notes to financial statements.
43 |
Table of Contents
Portfolio of Investments – as of December 31, 2016
Vaughan Nelson Small Cap Value Fund – (continued)
| Shares | Description | Value (†) | ||||||
| Marine — 0.7% | ||||||||
| 32,275 | Kirby Corp.(b) | $ | 2,146,288 | |||||
|
|
|
|||||||
| Metals & Mining — 1.8% | ||||||||
| 70,875 | Reliance Steel & Aluminum Co. | 5,637,397 | ||||||
|
|
|
|||||||
| Multi-Utilities — 2.9% | ||||||||
| 84,250 | NorthWestern Corp. | 4,791,298 | ||||||
| 83,175 | Vectren Corp. | 4,337,576 | ||||||
|
|
|
|||||||
| 9,128,874 | ||||||||
|
|
|
|||||||
| Oil, Gas & Consumable Fuels — 4.0% | ||||||||
| 202,850 | Callon Petroleum Co.(b) | 3,117,805 | ||||||
| 343,025 | Laredo Petroleum, Inc.(b) | 4,850,373 | ||||||
| 282,200 | Oasis Petroleum, Inc.(b) | 4,272,508 | ||||||
|
|
|
|||||||
| 12,240,686 | ||||||||
|
|
|
|||||||
| Professional Services — 3.4% | ||||||||
| 40,225 | Dun & Bradstreet Corp. (The) | 4,880,097 | ||||||
| 100,900 | ICF International, Inc.(b) | 5,569,680 | ||||||
|
|
|
|||||||
| 10,449,777 | ||||||||
|
|
|
|||||||
| REITs – Hotels — 1.0% | ||||||||
| 146,800 | Hersha Hospitality Trust | 3,156,200 | ||||||
|
|
|
|||||||
| REITs – Shopping Centers — 0.9% | ||||||||
| 161,275 | Ramco-Gershenson Properties Trust | 2,673,940 | ||||||
|
|
|
|||||||
| Road & Rail — 1.1% | ||||||||
| 50,875 | Genesee & Wyoming, Inc., Class A(b) | 3,531,234 | ||||||
|
|
|
|||||||
| Semiconductors & Semiconductor Equipment — 2.7% | ||||||||
| 95,325 | Integrated Device Technology, Inc.(b) | 2,245,857 | ||||||
| 93,400 | Silicon Laboratories, Inc.(b) | 6,071,000 | ||||||
|
|
|
|||||||
| 8,316,857 | ||||||||
|
|
|
|||||||
| Software — 1.7% | ||||||||
| 57,275 | BroadSoft, Inc.(b) | 2,362,594 | ||||||
| 81,400 | Verint Systems, Inc.(b) | 2,869,350 | ||||||
|
|
|
|||||||
| 5,231,944 | ||||||||
|
|
|
|||||||
| Specialty Retail — 1.3% | ||||||||
| 50,125 | Group 1 Automotive, Inc. | 3,906,742 | ||||||
|
|
|
|||||||
| Textiles, Apparel & Luxury Goods — 1.1% | ||||||||
| 92,200 | Steven Madden Ltd.(b) | 3,296,150 | ||||||
|
|
|
|||||||
| Trading Companies & Distributors — 1.5% | ||||||||
| 70,750 | WESCO International, Inc.(b) | 4,708,412 | ||||||
|
|
|
|||||||
| Total Common Stocks (Identified Cost $227,714,605) |
273,245,449 | |||||||
|
|
|
|||||||
| Exchange-Traded Funds — 5.1% | ||||||||
| 133,675 | iShares® Russell 2000 Value Index ETF (Identified Cost $13,904,406) |
15,899,304 | ||||||
|
|
|
|||||||
See accompanying notes to financial statements.
| 44
Table of Contents
Portfolio of Investments – as of December 31, 2016
Vaughan Nelson Small Cap Value Fund – (continued)
| Shares | Description | Value (†) | ||||||
| Closed-End Investment Companies — 2.6% | ||||||||
| 431,225 | FS Investment Corp. | $ | 4,441,618 | |||||
| 222,800 | TCP Capital Corp. | 3,765,320 | ||||||
|
|
|
|||||||
| Total Closed-End Investment Companies (Identified Cost $7,600,707) |
8,206,938 | |||||||
|
|
|
|||||||
| Principal Amount |
||||||||
| Short-Term Investments — 2.4% | ||||||||
| $ | 7,326,333 | Tri-Party Repurchase Agreement with Fixed Income Clearing Corporation, dated 12/30/2016 at 0.030% to be repurchased at $7,326,357 on 1/03/2017 collateralized by $7,685,000 U.S. Treasury Note, 2.000% due 8/15/2025 valued at $7,473,194 including accrued interest (Note 2 of Notes to Financial Statements) (Identified Cost $7,326,333) | 7,326,333 | |||||
|
|
|
|||||||
| Total Investments — 98.3% (Identified Cost $256,546,051)(a) |
304,678,024 | |||||||
| Other assets less liabilities — 1.7% | 5,293,769 | |||||||
|
|
|
|||||||
| Net Assets — 100.0% | $ | 309,971,793 | ||||||
|
|
|
|||||||
| (†) | See Note 2 of Notes to Financial Statements. | |||||||
| (a) | Federal Tax Information: | |||||||
| At December 31, 2016, the net unrealized appreciation on investments based on a cost of $257,333,498 for federal income tax purposes was as follows: | ||||||||
| Aggregate gross unrealized appreciation for all investments in which there is an excess of value over tax cost | $ | 51,228,374 | ||||||
| Aggregate gross unrealized depreciation for all investments in which there is an excess of tax cost over value | (3,883,848 | ) | ||||||
|
|
|
|||||||
| Net unrealized appreciation | $ | 47,344,526 | ||||||
|
|
|
|||||||
| (b) | Non-income producing security. | |||||||
| ETF | Exchange-Traded Fund | |||||||
| REITs | Real Estate Investment Trusts | |||||||
See accompanying notes to financial statements.
45 |
Table of Contents
Portfolio of Investments – as of December 31, 2016
Vaughan Nelson Small Cap Value Fund – (continued)
Industry Summary at December 31, 2016
| Banks |
14.6 | % | ||
| Insurance |
8.6 | |||
| Exchange-Traded Funds |
5.1 | |||
| IT Services |
4.5 | |||
| Life Sciences Tools & Services |
4.4 | |||
| Machinery |
4.2 | |||
| Oil, Gas & Consumable Fuels |
4.0 | |||
| Commercial Services & Supplies |
3.9 | |||
| Containers & Packaging |
3.9 | |||
| Professional Services |
3.4 | |||
| Health Care Providers & Services |
3.2 | |||
| Multi-Utilities |
2.9 | |||
| Semiconductors & Semiconductor Equipment |
2.7 | |||
| Closed-End Investment Companies |
2.6 | |||
| Electronic Equipment, Instruments & Components |
2.2 | |||
| Other Investments, less than 2% each |
25.7 | |||
| Short-Term Investments |
2.4 | |||
|
|
|
|||
| Total Investments |
98.3 | |||
| Other assets less liabilities |
1.7 | |||
|
|
|
|||
| Net Assets |
100.0 | % | ||
|
|
|
See accompanying notes to financial statements.
| 46
Table of Contents
Portfolio of Investments – as of December 31, 2016
Vaughan Nelson Value Opportunity Fund
| Shares | Description | Value (†) | ||||||
| Common Stocks — 97.6% of Net Assets | ||||||||
| Banks — 6.4% | ||||||||
| 503,175 | Chemical Financial Corp. | $ | 27,256,989 | |||||
| 1,810,125 | Investors Bancorp, Inc. | 25,251,244 | ||||||
| 448,275 | PacWest Bancorp | 24,404,091 | ||||||
|
|
|
|||||||
| 76,912,324 | ||||||||
|
|
|
|||||||
| Building Products — 1.6% | ||||||||
| 690,075 | Caesarstone Ltd.(b) | 19,770,649 | ||||||
|
|
|
|||||||
| Capital Markets — 2.9% | ||||||||
| 241,775 | Nasdaq, Inc. | 16,227,938 | ||||||
| 384,250 | SEI Investments Co. | 18,966,580 | ||||||
|
|
|
|||||||
| 35,194,518 | ||||||||
|
|
|
|||||||
| Commercial Services & Supplies — 1.3% | ||||||||
| 377,700 | KAR Auction Services, Inc. | 16,097,574 | ||||||
|
|
|
|||||||
| Communications Equipment — 1.0% | ||||||||
| 337,925 | CommScope Holding Co., Inc.(b) | 12,570,810 | ||||||
|
|
|
|||||||
| Consumer Finance — 2.5% | ||||||||
| 836,450 | Synchrony Financial | 30,338,041 | ||||||
|
|
|
|||||||
| Containers & Packaging — 6.2% | ||||||||
| 227,400 | Avery Dennison Corp. | 15,968,028 | ||||||
| 469,200 | Crown Holdings, Inc.(b) | 24,665,844 | ||||||
| 260,075 | Packaging Corp. of America | 22,059,561 | ||||||
| 236,550 | WestRock Co. | 12,009,644 | ||||||
|
|
|
|||||||
| 74,703,077 | ||||||||
|
|
|
|||||||
| Diversified Consumer Services — 3.8% | ||||||||
| 471,800 | Grand Canyon Education, Inc.(b) | 27,576,710 | ||||||
| 491,925 | ServiceMaster Global Holdings, Inc.(b) | 18,530,815 | ||||||
|
|
|
|||||||
| 46,107,525 | ||||||||
|
|
|
|||||||
| Energy Equipment & Services — 1.2% | ||||||||
| 219,450 | Baker Hughes, Inc. | 14,257,667 | ||||||
|
|
|
|||||||
| Health Care Providers & Services — 7.7% | ||||||||
| 254,850 | Centene Corp.(b) | 14,401,574 | ||||||
| 478,175 | Envision Healthcare Corp.(b) | 30,263,696 | ||||||
| 390,775 | MEDNAX, Inc.(b) | 26,049,061 | ||||||
| 724,050 | Premier, Inc., Class A(b) | 21,982,158 | ||||||
|
|
|
|||||||
| 92,696,489 | ||||||||
|
|
|
|||||||
| Hotels, Restaurants & Leisure — 2.1% | ||||||||
| 712,300 | Aramark | 25,443,356 | ||||||
|
|
|
|||||||
| Household Durables — 4.5% | ||||||||
| 128,075 | Mohawk Industries, Inc.(b) | 25,574,016 | ||||||
| 653,885 | Newell Brands, Inc. | 29,195,965 | ||||||
|
|
|
|||||||
| 54,769,981 | ||||||||
|
|
|
|||||||
| Insurance — 8.3% | ||||||||
| 653,475 | Arthur J. Gallagher & Co. | 33,954,561 | ||||||
| 575,050 | First American Financial Corp. | 21,064,082 | ||||||
See accompanying notes to financial statements.
47 |
Table of Contents
Portfolio of Investments – as of December 31, 2016
Vaughan Nelson Value Opportunity Fund – (continued)
| Shares | Description | Value (†) | ||||||
| Insurance — continued | ||||||||
| 377,700 | Hartford Financial Services Group, Inc. (The) | $ | 17,997,405 | |||||
| 218,250 | Reinsurance Group of America, Inc., Class A | 27,462,397 | ||||||
|
|
|
|||||||
| 100,478,445 | ||||||||
|
|
|
|||||||
| IT Services — 12.1% | ||||||||
| 96,725 | Alliance Data Systems Corp. | 22,101,662 | ||||||
| 177,750 | Broadridge Financial Solutions, Inc. | 11,784,825 | ||||||
| 168,600 | CACI International, Inc., Class A(b) | 20,956,980 | ||||||
| 441,750 | Fidelity National Information Services, Inc. | 33,413,970 | ||||||
| 1,288,650 | First Data Corp., Class A(b) | 18,285,944 | ||||||
| 128,075 | Fiserv, Inc.(b) | 13,611,811 | ||||||
| 369,875 | Global Payments, Inc. | 25,673,024 | ||||||
|
|
|
|||||||
| 145,828,216 | ||||||||
|
|
|
|||||||
| Life Sciences Tools & Services — 3.4% | ||||||||
| 210,737 | Quintiles IMS Holdings, Inc.(b) | 16,026,549 | ||||||
| 1,019,425 | VWR Corp.(b) | 25,516,208 | ||||||
|
|
|
|||||||
| 41,542,757 | ||||||||
|
|
|
|||||||
| Machinery — 5.4% | ||||||||
| 1,100,450 | Milacron Holdings Corp.(b) | 20,501,383 | ||||||
| 418,225 | Pentair PLC | 23,449,876 | ||||||
| 128,075 | Snap-on, Inc. | 21,935,405 | ||||||
|
|
|
|||||||
| 65,886,664 | ||||||||
|
|
|
|||||||
| Metals & Mining — 3.4% | ||||||||
| 2,902,725 | Constellium NV, Class A(b) | 17,126,077 | ||||||
| 300,600 | Reliance Steel & Aluminum Co. | 23,909,724 | ||||||
|
|
|
|||||||
| 41,035,801 | ||||||||
|
|
|
|||||||
| Oil, Gas & Consumable Fuels — 6.0% | ||||||||
| 505,800 | Continental Resources, Inc.(b) | 26,068,932 | ||||||
| 1,218,075 | QEP Resources, Inc.(b) | 22,424,761 | ||||||
| 1,619,300 | WPX Energy, Inc.(b) | 23,593,201 | ||||||
|
|
|
|||||||
| 72,086,894 | ||||||||
|
|
|
|||||||
| Pharmaceuticals — 2.9% | ||||||||
| 910,950 | Catalent, Inc.(b) | 24,559,212 | ||||||
| 660,000 | Endo International PLC(b) | 10,870,200 | ||||||
|
|
|
|||||||
| 35,429,412 | ||||||||
|
|
|
|||||||
| REITs – Diversified — 2.7% | ||||||||
| 2,058,450 | New Residential Investment Corp. | 32,358,834 | ||||||
|
|
|
|||||||
| Road & Rail — 0.4% | ||||||||
| 203,110 | Hertz Global Holdings, Inc.(b) | 4,379,052 | ||||||
|
|
|
|||||||
| Semiconductors & Semiconductor Equipment — 1.5% | ||||||||
| 803,775 | Micron Technology, Inc.(b) | 17,618,748 | ||||||
|
|
|
|||||||
| Software — 2.6% | ||||||||
| 231,325 | Check Point Software Technologies Ltd.(b) | 19,537,709 | ||||||
| 582,900 | RingCentral, Inc., Class A(b) | 12,007,740 | ||||||
|
|
|
|||||||
| 31,545,449 | ||||||||
|
|
|
|||||||
See accompanying notes to financial statements.
| 48
Table of Contents
Portfolio of Investments – as of December 31, 2016
Vaughan Nelson Value Opportunity Fund – (continued)
| Shares | Description | Value (†) | ||||||
| Specialty Retail — 2.0% | ||||||||
| 168,600 | Signet Jewelers Ltd. | $ | 15,892,236 | |||||
| 339,800 | Tailored Brands, Inc. | 8,681,890 | ||||||
|
|
|
|||||||
| 24,574,126 | ||||||||
|
|
|
|||||||
| Technology Hardware, Storage & Peripherals — 1.4% | ||||||||
| 403,850 | NCR Corp.(b) | 16,380,156 | ||||||
|
|
|
|||||||
| Textiles, Apparel & Luxury Goods — 1.1% | ||||||||
| 142,450 | PVH Corp. | 12,854,688 | ||||||
|
|
|
|||||||
| Trading Companies & Distributors — 3.2% | ||||||||
| 542,375 | HD Supply Holdings, Inc.(b) | 23,056,361 | ||||||
| 147,675 | United Rentals, Inc.(b) | 15,591,527 | ||||||
|
|
|
|||||||
| 38,647,888 | ||||||||
|
|
|
|||||||
| Total Common Stocks (Identified Cost $1,102,888,191) |
1,179,509,141 | |||||||
|
|
|
|||||||
| Closed-End Investment Companies — 2.8% | ||||||||
| 2,072,825 | Ares Capital Corp. (Identified Cost $32,367,362) |
34,180,884 | ||||||
|
|
|
|||||||
| Principal Amount |
||||||||
| Short-Term Investments — 1.4% | ||||||||
| $ | 16,710,268 | Tri-Party Repurchase Agreement with Fixed Income Clearing Corporation, dated 12/30/2016 at 0.030% to be repurchased at $16,710,324 on 1/03/2017 collateralized by $18,195,000 Federal Home Loan Bank, 2.640% due 2/22/2030 valued at $17,045,622 including accrued interest (Note 2 of Notes to Financial Statements) (Identified Cost $16,710,268) | 16,710,268 | |||||
|
|
|
|||||||
| Total Investments — 101.8% (Identified Cost $1,151,965,821)(a) |
1,230,400,293 | |||||||
| Other assets less liabilities — (1.8)% | (22,031,798 | ) | ||||||
|
|
|
|||||||
| Net Assets — 100.0% | $ | 1,208,368,495 | ||||||
|
|
|
|||||||
| (†) | See Note 2 of Notes to Financial Statements. | |||||||
| (a) | Federal Tax Information: | |||||||
| At December 31, 2016, the net unrealized appreciation on investments based on a cost of $1,167,114,677 for federal income tax purposes was as follows: | ||||||||
| Aggregate gross unrealized appreciation for all investments in which there is an excess of value over tax cost | $ | 111,150,025 | ||||||
| Aggregate gross unrealized depreciation for all investments in which there is an excess of tax cost over value | (47,864,409 | ) | ||||||
|
|
|
|||||||
| Net unrealized appreciation | $ | 63,285,616 | ||||||
|
|
|
|||||||
| (b) | Non-income producing security. | |||||||
| REITs | Real Estate Investment Trusts | |||||||
See accompanying notes to financial statements.
49 |
Table of Contents
Portfolio of Investments – as of December 31, 2016
Vaughan Nelson Value Opportunity Fund – (continued)
Industry Summary at December 31, 2016
| IT Services |
12.1 | % | ||
| Insurance |
8.3 | |||
| Health Care Providers & Services |
7.7 | |||
| Banks |
6.4 | |||
| Containers & Packaging |
6.2 | |||
| Oil, Gas & Consumable Fuels |
6.0 | |||
| Machinery |
5.4 | |||
| Household Durables |
4.5 | |||
| Diversified Consumer Services |
3.8 | |||
| Life Sciences Tools & Services |
3.4 | |||
| Metals & Mining |
3.4 | |||
| Trading Companies & Distributors |
3.2 | |||
| Pharmaceuticals |
2.9 | |||
| Capital Markets |
2.9 | |||
| Closed-End Investment Companies |
2.8 | |||
| REITs – Diversified |
2.7 | |||
| Software |
2.6 | |||
| Consumer Finance |
2.5 | |||
| Hotels, Restaurants & Leisure |
2.1 | |||
| Specialty Retail |
2.0 | |||
| Other Investments, less than 2% each |
9.5 | |||
| Short-Term Investments |
1.4 | |||
|
|
|
|||
| Total Investments |
101.8 | |||
| Other assets less liabilities |
(1.8 | ) | ||
|
|
|
|||
| Net Assets |
100.0 | % | ||
|
|
|
See accompanying notes to financial statements.
| 50
Table of Contents
Statements of Assets and Liabilities
December 31, 2016
| Mirova Global Sustainable Equity Fund |
Natixis Oakmark Fund |
Natixis Oakmark International Fund |
||||||||||
| ASSETS |
||||||||||||
| Investments at cost |
$ | 51,052,777 | $ | 216,351,961 | $ | 788,255,250 | ||||||
| Net unrealized appreciation (depreciation) |
(1,331,462 | ) | 41,246,650 | 1,779,041 | ||||||||
|
|
|
|
|
|
|
|||||||
| Investments at value |
49,721,315 | 257,598,611 | 790,034,291 | |||||||||
| Foreign currency at value (identified cost $70,710, $1 and $679, respectively) |
70,045 | 1 | 679 | |||||||||
| Receivable for Fund shares sold |
— | 1,868,804 | 4,777,882 | |||||||||
| Receivable for securities sold |
— | — | 567,642 | |||||||||
| Dividends and interest receivable |
17,194 | 142,099 | 221,173 | |||||||||
| Unrealized appreciation on forward foreign currency contracts (Note 2) |
— | — | 1,476,717 | |||||||||
| Tax reclaims receivable |
13,672 | 25,949 | 1,642,155 | |||||||||
| Prepaid expenses (Note 8) |
22 | 536 | 2,199 | |||||||||
|
|
|
|
|
|
|
|||||||
| TOTAL ASSETS |
49,822,248 | 259,636,000 | 798,722,738 | |||||||||
|
|
|
|
|
|
|
|||||||
| LIABILITIES |
||||||||||||
| Payable for securities purchased |
— | 3,268,296 | 1,204,339 | |||||||||
| Payable for Fund shares redeemed |
34,582 | 482,565 | 8,318,731 | |||||||||
| Management fees payable (Note 6) |
32,979 | 146,591 | 578,674 | |||||||||
| Deferred Trustees’ fees (Note 6) |
6,678 | 442,625 | 85,844 | |||||||||
| Administrative fees payable (Note 6) |
1,884 | 9,577 | 30,697 | |||||||||
| Payable to distributor (Note 6d) |
4 | 1,710 | 11,103 | |||||||||
| Other accounts payable and accrued expenses |
30,108 | 86,361 | 131,865 | |||||||||
|
|
|
|
|
|
|
|||||||
| TOTAL LIABILITIES |
106,235 | 4,437,725 | 10,361,253 | |||||||||
|
|
|
|
|
|
|
|||||||
| NET ASSETS |
$ | 49,716,013 | $ | 255,198,275 | $ | 788,361,485 | ||||||
|
|
|
|
|
|
|
|||||||
| NET ASSETS CONSIST OF: |
||||||||||||
| Paid-in capital |
$ | 51,150,319 | $ | 211,191,331 | $ | 926,778,851 | ||||||
| Distributions in excess of net investment income |
(9,340 | ) | (427,557 | ) | (531,405 | ) | ||||||
| Accumulated net realized gain (loss) on investments and foreign currency transactions |
(92,347 | ) | 3,187,851 | (140,998,650 | ) | |||||||
| Net unrealized appreciation (depreciation) on investments and foreign currency translations |
(1,332,619 | ) | 41,246,650 | 3,112,689 | ||||||||
|
|
|
|
|
|
|
|||||||
| NET ASSETS |
$ | 49,716,013 | $ | 255,198,275 | $ | 788,361,485 | ||||||
|
|
|
|
|
|
|
|||||||
See accompanying notes to financial statements.
51 |
Table of Contents
Statements of Assets and Liabilities (continued)
December 31, 2016
| Mirova Global Sustainable Equity Fund |
Natixis Oakmark Fund |
Natixis Oakmark International Fund |
||||||||||
| COMPUTATION OF NET ASSET VALUE AND OFFERING PRICE: |
||||||||||||
| Class A shares: |
||||||||||||
| Net assets |
$ | 70,680 | $ | 173,035,965 | $ | 533,112,441 | ||||||
|
|
|
|
|
|
|
|||||||
| Shares of beneficial interest |
7,138 | 8,097,889 | 43,878,912 | |||||||||
|
|
|
|
|
|
|
|||||||
| Net asset value and redemption price per share |
$ | 9.90 | $ | 21.37 | $ | 12.15 | ||||||
|
|
|
|
|
|
|
|||||||
| Offering price per share (100/94.25 of net asset value) (Note 1) |
$ | 10.50 | $ | 22.67 | $ | 12.89 | ||||||
|
|
|
|
|
|
|
|||||||
| Class C shares: (redemption price per share is equal to net asset value less any applicable contingent deferred sales charge) (Note 1) |
||||||||||||
| Net assets |
$ | 52,388 | $ | 55,909,843 | $ | 255,249,044 | ||||||
|
|
|
|
|
|
|
|||||||
| Shares of beneficial interest |
5,321 | 2,968,988 | 21,343,626 | |||||||||
|
|
|
|
|
|
|
|||||||
| Net asset value and offering price per share |
$ | 9.85 | $ | 18.83 | $ | 11.96 | ||||||
|
|
|
|
|
|
|
|||||||
| Class Y shares: |
||||||||||||
| Net assets |
$ | 49,592,945 | $ | 26,252,467 | $ | — | ||||||
|
|
|
|
|
|
|
|||||||
| Shares of beneficial interest |
5,003,393 | 1,175,168 | — | |||||||||
|
|
|
|
|
|
|
|||||||
| Net asset value, offering and redemption price per share |
$ | 9.91 | $ | 22.34 | $ | — | ||||||
|
|
|
|
|
|
|
|||||||
See accompanying notes to financial statements.
| 52
Table of Contents
Statements of Assets and Liabilities (continued)
December 31, 2016
| Vaughan Nelson Small Cap Value Fund |
Vaughan
Nelson Value Opportunity Fund |
|||||||
| ASSETS |
||||||||
| Investments at cost |
$ | 256,546,051 | $ | 1,151,965,821 | ||||
| Net unrealized appreciation |
48,131,973 | 78,434,472 | ||||||
|
|
|
|
|
|||||
| Investments at value |
304,678,024 | 1,230,400,293 | ||||||
| Cash |
— | 138,616 | ||||||
| Receivable for Fund shares sold |
871,029 | 1,580,932 | ||||||
| Receivable for securities sold |
5,790,947 | 3,549,770 | ||||||
| Dividends and interest receivable |
334,042 | 1,644,234 | ||||||
| Prepaid expenses (Note 8) |
661 | 3,215 | ||||||
|
|
|
|
|
|||||
| TOTAL ASSETS |
311,674,703 | 1,237,317,060 | ||||||
|
|
|
|
|
|||||
| LIABILITIES |
||||||||
| Payable for securities purchased |
130,454 | 5,173,789 | ||||||
| Payable for Fund shares redeemed |
1,020,430 | 22,659,617 | ||||||
| Management fees payable (Note 6) |
239,403 | 852,529 | ||||||
| Deferred Trustees’ fees (Note 6) |
237,136 | 101,257 | ||||||
| Administrative fees payable (Note 6) |
11,591 | 47,956 | ||||||
| Payable to distributor (Note 6d) |
2,216 | 13,029 | ||||||
| Other accounts payable and accrued expenses |
61,680 | 100,388 | ||||||
|
|
|
|
|
|||||
| TOTAL LIABILITIES |
1,702,910 | 28,948,565 | ||||||
|
|
|
|
|
|||||
| NET ASSETS |
$ | 309,971,793 | $ | 1,208,368,495 | ||||
|
|
|
|
|
|||||
| NET ASSETS CONSIST OF: |
||||||||
| Paid-in capital |
$ | 251,332,060 | $ | 1,175,611,557 | ||||
| Distributions in excess of net investment income |
(237,134 | ) | (101,257 | ) | ||||
| Accumulated net realized gain (loss) on investments |
10,744,894 | (45,576,277 | ) | |||||
| Net unrealized appreciation on investments |
48,131,973 | 78,434,472 | ||||||
|
|
|
|
|
|||||
| NET ASSETS |
$ | 309,971,793 | $ | 1,208,368,495 | ||||
|
|
|
|
|
|||||
See accompanying notes to financial statements.
53 |
Table of Contents
Statements of Assets and Liabilities (continued)
December 31, 2016
| Vaughan Nelson Small Cap Value Fund |
Vaughan
Nelson Value Opportunity Fund |
|||||||
| COMPUTATION OF NET ASSET VALUE AND OFFERING PRICE: |
||||||||
| Class A shares: |
||||||||
| Net assets |
$ | 106,447,339 | $ | 87,536,204 | ||||
|
|
|
|
|
|||||
| Shares of beneficial interest |
5,379,408 | 4,260,511 | ||||||
|
|
|
|
|
|||||
| Net asset value and redemption price per share |
$ | 19.79 | $ | 20.55 | ||||
|
|
|
|
|
|||||
| Offering price per share (100/94.25 of net asset value) (Note 1) |
$ | 21.00 | $ | 21.80 | ||||
|
|
|
|
|
|||||
| Class C shares: (redemption price per share is equal to net asset value less any applicable contingent deferred sales charge) (Note 1) |
||||||||
| Net assets |
$ | 20,379,121 | $ | 68,922,652 | ||||
|
|
|
|
|
|||||
| Shares of beneficial interest |
1,536,857 | 3,532,127 | ||||||
|
|
|
|
|
|||||
| Net asset value and offering price per share |
$ | 13.26 | $ | 19.51 | ||||
|
|
|
|
|
|||||
| Class N shares: |
||||||||
| Net assets |
$ | — | $ | 148,364,923 | ||||
|
|
|
|
|
|||||
| Shares of beneficial interest |
— | 7,149,889 | ||||||
|
|
|
|
|
|||||
| Net asset value, offering and redemption price per share |
$ | — | $ | 20.75 | ||||
|
|
|
|
|
|||||
| Class Y shares: |
||||||||
| Net assets |
$ | 183,145,333 | $ | 903,544,716 | ||||
|
|
|
|
|
|||||
| Shares of beneficial interest |
8,993,371 | 43,504,207 | ||||||
|
|
|
|
|
|||||
| Net asset value, offering and redemption price per share |
$ | 20.36 | $ | 20.77 | ||||
|
|
|
|
|
|||||
See accompanying notes to financial statements.
| 54
Table of Contents
Statements of Operations
For the Year Ended December 31, 2016
| Mirova Global Sustainable Equity Fund(a) |
Natixis Oakmark Fund |
Natixis Oakmark International Fund |
||||||||||
| INVESTMENT INCOME |
||||||||||||
| Dividends |
$ | 387,773 | $ | 4,724,247 | $ | 28,477,056 | ||||||
| Interest |
482 | 18,545 | 62,597 | |||||||||
| Less net foreign taxes withheld |
(26,705 | ) | (66,192 | ) | (2,861,994 | ) | ||||||
|
|
|
|
|
|
|
|||||||
| 361,550 | 4,676,600 | 25,677,659 | ||||||||||
|
|
|
|
|
|
|
|||||||
| Expenses |
||||||||||||
| Management fees (Note 6) |
204,341 | 1,621,055 | 7,627,201 | |||||||||
| Service and distribution fees (Note 6) |
262 | 971,398 | 4,374,771 | |||||||||
| Administrative fees (Note 6) |
11,358 | 103,858 | 398,119 | |||||||||
| Trustees’ fees and expenses (Note 6) |
14,298 | 38,787 | 42,131 | |||||||||
| Transfer agent fees and expenses (Note 6) |
2,802 | 266,850 | 1,055,671 | |||||||||
| Audit and tax services fees |
31,132 | 40,830 | 94,672 | |||||||||
| Custodian fees and expenses |
15,437 | 7,506 | 340,035 | |||||||||
| Legal fees |
360 | 3,245 | 12,915 | |||||||||
| Registration fees |
19,003 | 50,097 | 63,072 | |||||||||
| Shareholder reporting expenses |
613 | 16,509 | 81,848 | |||||||||
| Miscellaneous expenses (Note 8) |
8,493 | 16,497 | 53,344 | |||||||||
|
|
|
|
|
|
|
|||||||
| Total expenses |
308,099 | 3,136,632 | 14,143,779 | |||||||||
| Less waiver and/or expense reimbursement (Note 6) |
(39,340 | ) | — | — | ||||||||
|
|
|
|
|
|
|
|||||||
| Net expenses |
268,759 | 3,136,632 | 14,143,779 | |||||||||
|
|
|
|
|
|
|
|||||||
| Net investment income |
92,791 | 1,539,968 | 11,533,880 | |||||||||
|
|
|
|
|
|
|
|||||||
| NET REALIZED AND UNREALIZED GAIN (LOSS) ON INVESTMENTS AND FOREIGN CURRENCY TRANSACTIONS |
||||||||||||
| Net realized gain (loss) on: |
||||||||||||
| Investments |
(58,051 | ) | 6,222,168 | (133,707,517 | ) | |||||||
| Foreign currency transactions |
(52,634 | ) | — | 780,344 | ||||||||
| Net change in unrealized appreciation (depreciation) on: |
||||||||||||
| Investments |
(1,331,462 | ) | 29,078,941 | 171,246,452 | ||||||||
| Foreign currency translations |
(1,157 | ) | — | (8,262 | ) | |||||||
|
|
|
|
|
|
|
|||||||
| Net realized and unrealized gain (loss) on investments and foreign currency transactions |
(1,443,304 | ) | 35,301,109 | 38,311,017 | ||||||||
|
|
|
|
|
|
|
|||||||
| NET INCREASE (DECREASE) IN NET ASSETS RESULTING FROM OPERATIONS |
$ | (1,350,513 | ) | $ | 36,841,077 | $ | 49,844,897 | |||||
|
|
|
|
|
|
|
|||||||
| (a) | From commencement of operations on March 31, 2016 through December 31, 2016. |
See accompanying notes to financial statements.
55 |
Table of Contents
Statements of Operations (continued)
For the Year Ended December 31, 2016
| Vaughan Nelson Small Cap Value Fund |
Vaughan Nelson Value Opportunity Fund |
|||||||
| INVESTMENT INCOME |
||||||||
| Dividends |
$ | 4,351,344 | $ | 21,667,074 | ||||
| Interest |
16,149 | 20,777 | ||||||
| Less net foreign taxes withheld |
— | (23,241 | ) | |||||
|
|
|
|
|
|||||
| 4,367,493 | 21,664,610 | |||||||
|
|
|
|
|
|||||
| Expenses |
||||||||
| Management fees (Note 6) |
2,696,750 | 10,797,453 | ||||||
| Service and distribution fees (Note 6) |
447,582 | 1,141,301 | ||||||
| Administrative fees (Note 6) |
132,988 | 598,897 | ||||||
| Trustees’ fees and expenses (Note 6) |
37,149 | 51,416 | ||||||
| Transfer agent fees and expenses (Notes 6 and 7) |
267,639 | 1,259,054 | ||||||
| Audit and tax services fees |
40,848 | 41,978 | ||||||
| Custodian fees and expenses |
18,472 | 42,952 | ||||||
| Legal fees |
4,189 | 21,312 | ||||||
| Registration fees |
48,992 | 120,421 | ||||||
| Shareholder reporting expenses |
16,141 | 119,787 | ||||||
| Miscellaneous expenses (Note 8) |
18,673 | 50,744 | ||||||
|
|
|
|
|
|||||
| Total expenses |
3,729,423 | 14,245,315 | ||||||
| Less waiver and/or expense reimbursement (Note 6) |
— | (225 | ) | |||||
|
|
|
|
|
|||||
| Net expenses |
3,729,423 | 14,245,090 | ||||||
|
|
|
|
|
|||||
| Net investment income |
638,070 | 7,419,520 | ||||||
|
|
|
|
|
|||||
| NET REALIZED AND UNREALIZED GAIN (LOSS) ON INVESTMENTS |
||||||||
| Net realized gain (loss) on: |
||||||||
| Investments |
30,916,492 | (46,134,274 | ) | |||||
| Net change in unrealized appreciation (depreciation) on: |
||||||||
| Investments |
24,284,297 | 116,689,577 | ||||||
|
|
|
|
|
|||||
| Net realized and unrealized gain on investments |
55,200,789 | 70,555,303 | ||||||
|
|
|
|
|
|||||
| NET INCREASE IN NET ASSETS RESULTING FROM OPERATIONS |
$ | 55,838,859 | $ | 77,974,823 | ||||
|
|
|
|
|
|||||
See accompanying notes to financial statements.
| 56
Table of Contents
Statements of Changes in Net Assets
| Mirova Global Sustainable Equity Fund |
||||
| Period Ended December 31, 2016(a) |
||||
| FROM OPERATIONS: |
||||
| Net investment income |
$ | 92,791 | ||
| Net realized loss on investments and foreign currency transactions |
(110,685 | ) | ||
| Net change in unrealized appreciation (depreciation) on investments and foreign currency translations |
(1,332,619 | ) | ||
|
|
|
|||
| Net decrease in net assets resulting from operations |
(1,350,513 | ) | ||
|
|
|
|||
| FROM DISTRIBUTIONS TO SHAREHOLDERS: |
||||
| Net investment income |
||||
| Class A |
(24 | ) | ||
| Class Y |
(43,472 | ) | ||
| Net realized capital gains |
||||
| Class A |
(81 | ) | ||
| Class C |
(60 | ) | ||
| Class Y |
(56,464 | ) | ||
|
|
|
|||
| Total distributions |
(100,101 | ) | ||
|
|
|
|||
| NET INCREASE IN NET ASSETS FROM CAPITAL SHARE TRANSACTIONS (NOTE 11) |
51,166,627 | |||
|
|
|
|||
| Net increase in net assets |
49,716,013 | |||
| NET ASSETS |
||||
| Beginning of the period |
— | |||
|
|
|
|||
| End of the period |
$ | 49,716,013 | ||
|
|
|
|||
| DISTRIBUTIONS IN EXCESS OF NET INVESTMENT INCOME |
$ | (9,340 | ) | |
|
|
|
|||
| (a) | From commencement of operations on March 31, 2016 through December 31, 2016. |
See accompanying notes to financial statements.
57 |
Table of Contents
Statements of Changes in Net Assets (continued)
| Natixis Oakmark Fund | ||||||||
| Year Ended December 31, 2016 |
Year Ended December 31, 2015 |
|||||||
| FROM OPERATIONS: |
||||||||
| Net investment income |
$ | 1,539,968 | $ | 1,465,832 | ||||
| Net realized gain on investments |
6,222,168 | 13,620,468 | ||||||
| Net change in unrealized appreciation (depreciation) on investments |
29,078,941 | (28,311,926 | ) | |||||
|
|
|
|
|
|||||
| Net increase (decrease) in net assets resulting from operations |
36,841,077 | (13,225,626 | ) | |||||
|
|
|
|
|
|||||
| FROM DISTRIBUTIONS TO SHAREHOLDERS: |
||||||||
| Net investment income |
||||||||
| Class A |
(1,258,918 | ) | (1,174,474 | ) | ||||
| Class B(a) |
— | (41 | ) | |||||
| Class C |
(41,500 | ) | (17,288 | ) | ||||
| Class Y |
(236,527 | ) | (192,508 | ) | ||||
| Net realized capital gains |
||||||||
| Class A |
(5,328,126 | ) | (5,783,752 | ) | ||||
| Class B(a) |
— | (2,310 | ) | |||||
| Class C |
(2,180,741 | ) | (2,542,676 | ) | ||||
| Class Y |
(565,289 | ) | (658,314 | ) | ||||
|
|
|
|
|
|||||
| Total distributions |
(9,611,101 | ) | (10,371,363 | ) | ||||
|
|
|
|
|
|||||
| NET INCREASE (DECREASE) IN NET ASSETS FROM CAPITAL SHARE TRANSACTIONS (NOTE 11) |
(38,299,982 | ) | 4,501,009 | |||||
|
|
|
|
|
|||||
| Net decrease in net assets |
(11,070,006 | ) | (19,095,980 | ) | ||||
| NET ASSETS |
||||||||
| Beginning of the year |
266,268,281 | 285,364,261 | ||||||
|
|
|
|
|
|||||
| End of the year |
$ | 255,198,275 | $ | 266,268,281 | ||||
|
|
|
|
|
|||||
| DISTRIBUTIONS IN EXCESS OF NET INVESTMENT INCOME |
$ | (427,557 | ) | $ | (408,464 | ) | ||
|
|
|
|
|
|||||
| (a) | On January 11, 2016, Class B shares were converted into Class A shares. See Note 1 of Notes to Financial Statements. |
See accompanying notes to financial statements.
| 58
Table of Contents
Statements of Changes in Net Assets (continued)
| Natixis Oakmark International Fund |
||||||||
| Year Ended December 31, 2016 |
Year Ended December 31, 2015 |
|||||||
| FROM OPERATIONS: |
||||||||
| Net investment income |
$ | 11,533,880 | $ | 10,840,979 | ||||
| Net realized gain (loss) on investments and foreign currency transactions |
(132,927,173 | ) | 11,191,231 | |||||
| Net change in unrealized appreciation (depreciation) on investments and foreign currency translations |
171,238,190 | (111,848,122 | ) | |||||
|
|
|
|
|
|||||
| Net increase (decrease) in net assets resulting from operations |
49,844,897 | (89,815,912 | ) | |||||
|
|
|
|
|
|||||
| FROM DISTRIBUTIONS TO SHAREHOLDERS: |
||||||||
| Net investment income |
||||||||
| Class A |
(9,085,209 | ) | (12,403,954 | ) | ||||
| Class C |
(2,323,459 | ) | (3,234,507 | ) | ||||
| Net realized capital gains |
||||||||
| Class A |
(2,775,676 | ) | (7,266,683 | ) | ||||
| Class C |
(1,263,983 | ) | (3,475,721 | ) | ||||
|
|
|
|
|
|||||
| Total distributions |
(15,448,327 | ) | (26,380,865 | ) | ||||
|
|
|
|
|
|||||
| NET INCREASE (DECREASE) IN NET ASSETS FROM CAPITAL SHARE TRANSACTIONS (NOTE 11) |
(310,799,653 | ) | 236,259,606 | |||||
|
|
|
|
|
|||||
| Net increase (decrease) in net assets |
(276,403,083 | ) | 120,062,829 | |||||
| NET ASSETS |
||||||||
| Beginning of the year |
1,064,764,568 | 944,701,739 | ||||||
|
|
|
|
|
|||||
| End of the year |
$ | 788,361,485 | $ | 1,064,764,568 | ||||
|
|
|
|
|
|||||
| DISTRIBUTIONS IN EXCESS OF NET INVESTMENT INCOME |
$ | (531,405 | ) | $ | (1,505,467 | ) | ||
|
|
|
|
|
|||||
See accompanying notes to financial statements.
59 |
Table of Contents
Statements of Changes in Net Assets (continued)
| Vaughan Nelson Small Cap Value Fund |
||||||||
| Year Ended December 31, 2016 |
Year Ended December 31, 2015 |
|||||||
| FROM OPERATIONS: |
||||||||
| Net investment income |
$ | 638,070 | $ | 1,134,464 | ||||
| Net realized gain on investments |
30,916,492 | 43,233,709 | ||||||
| Net change in unrealized appreciation (depreciation) on investments |
24,284,297 | (45,477,353 | ) | |||||
|
|
|
|
|
|||||
| Net increase (decrease) in net assets resulting from operations |
55,838,859 | (1,109,180 | ) | |||||
|
|
|
|
|
|||||
| FROM DISTRIBUTIONS TO SHAREHOLDERS: |
||||||||
| Net investment income |
||||||||
| Class A |
(69,535 | ) | (188,563 | ) | ||||
| Class Y |
(533,444 | ) | (849,469 | ) | ||||
| Net realized capital gains |
||||||||
| Class A |
(7,594,180 | ) | (15,119,557 | ) | ||||
| Class B(a) |
— | (14,484 | ) | |||||
| Class C |
(2,160,752 | ) | (4,223,610 | ) | ||||
| Class Y |
(13,003,298 | ) | (25,335,936 | ) | ||||
|
|
|
|
|
|||||
| Total distributions |
(23,361,209 | ) | (45,731,619 | ) | ||||
|
|
|
|
|
|||||
| NET INCREASE (DECREASE) IN NET ASSETS FROM CAPITAL SHARE TRANSACTIONS (NOTE 11) |
(26,130,394 | ) | 20,099,488 | |||||
|
|
|
|
|
|||||
| Net increase (decrease) in net assets |
6,347,256 | (26,741,311 | ) | |||||
| NET ASSETS |
||||||||
| Beginning of the year |
303,624,537 | 330,365,848 | ||||||
|
|
|
|
|
|||||
| End of the year |
$ | 309,971,793 | $ | 303,624,537 | ||||
|
|
|
|
|
|||||
| DISTRIBUTIONS IN EXCESS OF NET INVESTMENT INCOME |
$ | (237,134 | ) | $ | (159,376 | ) | ||
|
|
|
|
|
|||||
| (a) | On January 11, 2016, Class B shares were converted into Class A shares. See Note 1 of Notes to Financial Statements. |
See accompanying notes to financial statements.
| 60
Table of Contents
Statements of Changes in Net Assets (continued)
| Vaughan Nelson Value Opportunity Fund |
||||||||
| Year Ended December 31, 2016 |
Year Ended December 31, 2015 |
|||||||
| FROM OPERATIONS: |
||||||||
| Net investment income |
$ | 7,419,520 | $ | 3,451,042 | ||||
| Net realized gain (loss) on investments |
(46,134,274 | ) | 65,059,104 | |||||
| Net change in unrealized appreciation (depreciation) on investments |
116,689,577 | (145,095,686 | ) | |||||
|
|
|
|
|
|||||
| Net increase (decrease) in net assets resulting from operations |
77,974,823 | (76,585,540 | ) | |||||
|
|
|
|
|
|||||
| FROM DISTRIBUTIONS TO SHAREHOLDERS: |
||||||||
| Net investment income |
||||||||
| Class A |
(208,980 | ) | (144,297 | ) | ||||
| Class C |
(4,215 | ) | — | |||||
| Class N |
(1,086,141 | ) | (217,534 | ) | ||||
| Class Y |
(5,786,437 | ) | (2,976,150 | ) | ||||
| Net realized capital gains |
||||||||
| Class A |
(4,375,048 | ) | (2,753,605 | ) | ||||
| Class C |
(2,641,165 | ) | (1,777,113 | ) | ||||
| Class N |
(1,943,672 | ) | (1,365,729 | ) | ||||
| Class Y |
(32,526,948 | ) | (22,568,470 | ) | ||||
|
|
|
|
|
|||||
| Total distributions |
(48,572,606 | ) | (31,802,898 | ) | ||||
|
|
|
|
|
|||||
| NET INCREASE (DECREASE) IN NET ASSETS FROM CAPITAL SHARE TRANSACTIONS (NOTE 11) |
(251,794,180 | ) | 761,923,276 | |||||
|
|
|
|
|
|||||
| Net increase (decrease) in net assets |
(222,391,963 | ) | 653,534,838 | |||||
| NET ASSETS |
||||||||
| Beginning of the year |
1,430,760,458 | 777,225,620 | ||||||
|
|
|
|
|
|||||
| End of the year |
$ | 1,208,368,495 | $ | 1,430,760,458 | ||||
|
|
|
|
|
|||||
| DISTRIBUTIONS IN EXCESS OF NET INVESTMENT INCOME |
$ | (101,257 | ) | $ | (51,161 | ) | ||
|
|
|
|
|
|||||
See accompanying notes to financial statements.
61 |
Table of Contents
Financial Highlights
For a share outstanding throughout each period.
| Mirova Global Sustainable Equity Fund—Class A |
||||
| Period Ended December 31, 2016* |
||||
| Net asset value, beginning of the period |
$ | 10.00 | ||
|
|
|
|||
| INCOME (LOSS) FROM INVESTMENT OPERATIONS: |
| |||
| Net investment income(a) |
0.02 | |||
| Net realized and unrealized gain (loss) |
(0.11 | ) | ||
|
|
|
|||
| Total from Investment Operations |
(0.09 | ) | ||
|
|
|
|||
| LESS DISTRIBUTIONS FROM: |
| |||
| Net investment income |
(0.00 | )(b) | ||
| Net realized capital gains |
(0.01 | ) | ||
|
|
|
|||
| Total Distributions |
(0.01 | ) | ||
|
|
|
|||
| Net asset value, end of the period |
$ | 9.90 | ||
|
|
|
|||
| Total return(c) |
(0.85 | )%(d) | ||
| RATIOS TO AVERAGE NET ASSETS: |
| |||
| Net assets, end of the period (000’s) |
$ | 71 | ||
| Net expenses |
1.30 | %(e)(f) | ||
| Gross expenses |
1.72 | %(f) | ||
| Net investment income |
0.23 | %(f) | ||
| Portfolio turnover rate |
20 | % | ||
| * | From commencement of operations on March 31, 2016 through December 31, 2016. |
| (a) | Per share net investment income has been calculated using the average shares outstanding during the period. |
| (b) | Amount rounds to less than $0.01 per share. |
| (c) | A sales charge for Class A shares is not reflected in total return calculations. |
| (d) | Had certain expenses not been waived/reimbursed during the period, total returns would have been lower. Periods less than one year are not annualized. |
| (e) | The investment adviser agreed to waive its fees and/or reimburse a portion of the Fund’s expenses during the period. Without this waiver/reimbursement, expenses would have been higher. |
| (f) | Computed on an annualized basis for periods less than one year. |
See accompanying notes to financial statements.
| 62
Table of Contents
Financial Highlights (continued)
For a share outstanding throughout each period.
| Mirova Global Sustainable Equity Fund—Class C |
||||
| Period Ended December 31, 2016* |
||||
| Net asset value, beginning of the period |
$ | 10.00 | ||
|
|
|
|||
| INCOME (LOSS) FROM INVESTMENT OPERATIONS: |
||||
| Net investment loss(a) |
(0.06 | ) | ||
| Net realized and unrealized gain (loss) |
(0.08 | ) | ||
|
|
|
|||
| Total from Investment Operations |
(0.14 | ) | ||
|
|
|
|||
| LESS DISTRIBUTIONS FROM: |
||||
| Net investment income |
— | |||
| Net realized capital gains |
(0.01 | ) | ||
|
|
|
|||
| Total Distributions |
(0.01 | ) | ||
|
|
|
|||
| Net asset value, end of the period |
$ | 9.85 | ||
|
|
|
|||
| Total return(b) |
(1.39 | )%(c) | ||
| RATIOS TO AVERAGE NET ASSETS: |
||||
| Net assets, end of the period (000’s) |
$ | 52 | ||
| Net expenses |
2.05 | %(d)(e) | ||
| Gross expenses |
2.20 | %(e) | ||
| Net investment loss |
(0.77 | )%(e) | ||
| Portfolio turnover rate |
20 | % | ||
| * | From commencement of operations on March 31, 2016 through December 31, 2016. |
| (a) | Per share net investment loss has been calculated using the average shares outstanding during the period. |
| (b) | A contingent deferred sales charge for Class C shares is not reflected in total return calculations. |
| (c) | Had certain expenses not been waived/reimbursed during the period, total returns would have been lower. Periods less than one year are not annualized. |
| (d) | The investment adviser agreed to waive its fees and/or reimburse a portion of the Fund’s expenses during the period. Without this waiver/reimbursement, expenses would have been higher. |
| (e) | Computed on an annualized basis for periods less than one year. |
See accompanying notes to financial statements.
63 |
Table of Contents
Financial Highlights (continued)
For a share outstanding throughout each period.
| Mirova Global Sustainable Equity Fund—Class Y |
||||
| Period Ended December 31, 2016* |
||||
| Net asset value, beginning of the period |
$ | 10.00 | ||
|
|
|
|||
| INCOME (LOSS) FROM INVESTMENT OPERATIONS: |
||||
| Net investment income(a) |
0.03 | |||
| Net realized and unrealized gain (loss) |
(0.10 | ) | ||
|
|
|
|||
| Total from Investment Operations |
(0.07 | ) | ||
|
|
|
|||
| LESS DISTRIBUTIONS FROM: |
||||
| Net investment income |
(0.01 | ) | ||
| Net realized capital gains |
(0.01 | ) | ||
|
|
|
|||
| Total Distributions |
(0.02 | ) | ||
|
|
|
|||
| Net asset value, end of the period |
$ | 9.91 | ||
|
|
|
|||
| Total return |
(0.70 | )%(b) | ||
| RATIOS TO AVERAGE NET ASSETS: |
||||
| Net assets, end of the period (000’s) |
$ | 49,593 | ||
| Net expenses |
1.05 | %(c)(d) | ||
| Gross expenses |
1.21 | %(d) | ||
| Net investment income |
0.35 | %(d) | ||
| Portfolio turnover rate |
20 | % | ||
| * | From commencement of operations on March 31, 2016 through December 31, 2016. |
| (a) | Per share net investment income has been calculated using the average shares outstanding during the period. |
| (b) | Had certain expenses not been waived/reimbursed during the period, total returns would have been lower. Periods less than one year are not annualized. |
| (c) | The investment adviser agreed to waive its fees and/or reimburse a portion of the Fund’s expenses during the period. Without this waiver/reimbursement, expenses would have been higher. |
| (d) | Computed on an annualized basis for periods less than one year. |
See accompanying notes to financial statements.
| 64
Table of Contents
Financial Highlights (continued)
For a share outstanding throughout each period.
| Natixis Oakmark Fund—Class A |
||||||||||||||||||||
| Year Ended December 31, 2016 |
Year Ended December 31, 2015 |
Year Ended December 31, 2014 |
Year Ended December 31, 2013 |
Year Ended December 31, 2012 |
||||||||||||||||
| Net asset value, beginning of the period |
$ | 18.79 | $ | 20.43 | $ | 21.40 | $ | 16.09 | $ | 13.86 | ||||||||||
|
|
|
|
|
|
|
|
|
|
|
|||||||||||
| INCOME (LOSS) FROM INVESTMENT OPERATIONS: |
||||||||||||||||||||
| Net investment income(a) |
0.16 | 0.14 | 0.10 | 0.06 | 0.12 | |||||||||||||||
| Net realized and unrealized gain (loss) |
3.20 | (1.02 | ) | 2.11 | 6.03 | 2.24 | ||||||||||||||
|
|
|
|
|
|
|
|
|
|
|
|||||||||||
| Total from Investment Operations |
3.36 | (0.88 | ) | 2.21 | 6.09 | 2.36 | ||||||||||||||
|
|
|
|
|
|
|
|
|
|
|
|||||||||||
| LESS DISTRIBUTIONS FROM: |
||||||||||||||||||||
| Net investment income |
(0.16 | ) | (0.13 | ) | (0.07 | ) | (0.07 | ) | (0.13 | ) | ||||||||||
| Net realized capital gains |
(0.62 | ) | (0.63 | ) | (3.11 | ) | (0.71 | ) | — | |||||||||||
|
|
|
|
|
|
|
|
|
|
|
|||||||||||
| Total Distributions |
(0.78 | ) | (0.76 | ) | (3.18 | ) | (0.78 | ) | (0.13 | ) | ||||||||||
|
|
|
|
|
|
|
|
|
|
|
|||||||||||
| Net asset value, end of the period |
$ | 21.37 | $ | 18.79 | $ | 20.43 | $ | 21.40 | $ | 16.09 | ||||||||||
|
|
|
|
|
|
|
|
|
|
|
|||||||||||
| Total return(b) |
18.37 | % | (4.41 | )% | 10.43 | % | 37.82 | % | 17.03 | %(c) | ||||||||||
| RATIOS TO AVERAGE NET ASSETS: |
||||||||||||||||||||
| Net assets, end of the period (000’s) |
$ | 173,036 | $ | 173,925 | $ | 195,061 | $ | 145,270 | $ | 113,870 | ||||||||||
| Net expenses |
1.18 | % | 1.14 | % | 1.22 | % | 1.30 | %(d) | 1.30 | %(e) | ||||||||||
| Gross expenses |
1.18 | % | 1.14 | % | 1.22 | % | 1.30 | %(d) | 1.33 | % | ||||||||||
| Net investment income |
0.82 | % | 0.68 | % | 0.44 | % | 0.33 | % | 0.77 | % | ||||||||||
| Portfolio turnover rate |
16 | % | 23 | % | 64 | %(f) | 29 | % | 25 | % | ||||||||||
| (a) | Per share net investment income has been calculated using the average shares outstanding during the period. |
| (b) | A sales charge for Class A shares is not reflected in total return calculations. |
| (c) | Had certain expenses not been waived/reimbursed during the period, total returns would have been lower. |
| (d) | Includes fee/expense recovery of less than 0.01%. |
| (e) | The investment adviser agreed to waive its fees and/or reimburse a portion of the Fund’s expenses during the period. Without this waiver/reimbursement, expenses would have been higher. |
| (f) | The variation in the Fund’s turnover rate from 2013 to 2014 was primarily due to a change in the portfolio management team. |
See accompanying notes to financial statements.
65 |
Table of Contents
Financial Highlights (continued)
For a share outstanding throughout each period.
| Natixis Oakmark Fund—Class C |
||||||||||||||||||||
| Year Ended December 31, 2016 |
Year Ended December 31, 2015 |
Year Ended December 31, 2014 |
Year Ended December 31, 2013 |
Year Ended December 31, 2012 |
||||||||||||||||
| Net asset value, beginning of the period |
$ | 16.65 | $ | 18.19 | $ | 19.48 | $ | 14.75 | $ | 12.72 | ||||||||||
|
|
|
|
|
|
|
|
|
|
|
|||||||||||
| INCOME (LOSS) FROM INVESTMENT OPERATIONS: |
||||||||||||||||||||
| Net investment income (loss)(a) |
0.01 | (0.01 | ) | (0.06 | ) | (0.07 | ) | 0.00 | (b) | |||||||||||
| Net realized and unrealized gain (loss) |
2.80 | (0.90 | ) | 1.90 | 5.51 | 2.05 | ||||||||||||||
|
|
|
|
|
|
|
|
|
|
|
|||||||||||
| Total from Investment Operations |
2.81 | (0.91 | ) | 1.84 | 5.44 | 2.05 | ||||||||||||||
|
|
|
|
|
|
|
|
|
|
|
|||||||||||
| LESS DISTRIBUTIONS FROM: |
||||||||||||||||||||
| Net investment income |
(0.01 | ) | (0.00 | )(b) | (0.02 | ) | — | (0.02 | ) | |||||||||||
| Net realized capital gains |
(0.62 | ) | (0.63 | ) | (3.11 | ) | (0.71 | ) | — | |||||||||||
|
|
|
|
|
|
|
|
|
|
|
|||||||||||
| Total Distributions |
(0.63 | ) | (0.63 | ) | (3.13 | ) | (0.71 | ) | (0.02 | ) | ||||||||||
|
|
|
|
|
|
|
|
|
|
|
|||||||||||
| Net asset value, end of the period |
$ | 18.83 | $ | 16.65 | $ | 18.19 | $ | 19.48 | $ | 14.75 | ||||||||||
|
|
|
|
|
|
|
|
|
|
|
|||||||||||
| Total return(c) |
17.45 | % | (5.07 | )% | 9.55 | % | 36.88 | % | 16.13 | %(d) | ||||||||||
| RATIOS TO AVERAGE NET ASSETS: |
||||||||||||||||||||
| Net assets, end of the period (000’s) |
$ | 55,910 | $ | 70,616 | $ | 62,941 | $ | 8,425 | $ | 6,016 | ||||||||||
| Net expenses |
1.93 | % | 1.89 | % | 1.97 | % | 2.05 | %(e) | 2.05 | %(f) | ||||||||||
| Gross expenses |
1.93 | % | 1.89 | % | 1.97 | % | 2.05 | %(e) | 2.08 | % | ||||||||||
| Net investment income (loss) |
0.09 | % | (0.07 | )% | (0.30 | )% | (0.42 | )% | 0.02 | % | ||||||||||
| Portfolio turnover rate |
16 | % | 23 | % | 64 | %(g) | 29 | % | 25 | % | ||||||||||
| (a) | Per share net investment income (loss) has been calculated using the average shares outstanding during the period. |
| (b) | Amount rounds to less than $0.01 per share. |
| (c) | A contingent deferred sales charge for Class C shares is not reflected in total return calculations. |
| (d) | Had certain expenses not been waived/reimbursed during the period, total returns would have been lower. |
| (e) | Includes fee/expense recovery of less than 0.01%. |
| (f) | The investment adviser agreed to waive its fees and/or reimburse a portion of the Fund’s expenses during the period. Without this waiver/reimbursement, expenses would have been higher. |
| (g) | The variation in the Fund’s turnover rate from 2013 to 2014 was primarily due to a change in the portfolio management team. |
See accompanying notes to financial statements.
| 66
Table of Contents
Financial Highlights (continued)
For a share outstanding throughout each period.
| Natixis Oakmark Fund—Class Y |
||||||||||||||||||||
| Year Ended December 31, 2016 |
Year Ended December 31, 2015 |
Year Ended December 31, 2014 |
Year Ended December 31, 2013 |
Year Ended December 31, 2012 |
||||||||||||||||
| Net asset value, beginning of the period |
$ | 19.60 | $ | 21.28 | $ | 22.16 | $ | 16.63 | $ | 14.32 | ||||||||||
|
|
|
|
|
|
|
|
|
|
|
|||||||||||
| INCOME (LOSS) FROM INVESTMENT OPERATIONS: |
||||||||||||||||||||
| Net investment income(a) |
0.21 | 0.19 | 0.15 | 0.11 | 0.17 | |||||||||||||||
| Net realized and unrealized gain (loss) |
3.36 | (1.06 | ) | 2.20 | 6.24 | 2.31 | ||||||||||||||
|
|
|
|
|
|
|
|
|
|
|
|||||||||||
| Total from Investment Operations |
3.57 | (0.87 | ) | 2.35 | 6.35 | 2.48 | ||||||||||||||
|
|
|
|
|
|
|
|
|
|
|
|||||||||||
| LESS DISTRIBUTIONS FROM: |
||||||||||||||||||||
| Net investment income |
(0.21 | ) | (0.18 | ) | (0.12 | ) | (0.11 | ) | (0.17 | ) | ||||||||||
| Net realized capital gains |
(0.62 | ) | (0.63 | ) | (3.11 | ) | (0.71 | ) | — | |||||||||||
|
|
|
|
|
|
|
|
|
|
|
|||||||||||
| Total Distributions |
(0.83 | ) | (0.81 | ) | (3.23 | ) | (0.82 | ) | (0.17 | ) | ||||||||||
|
|
|
|
|
|
|
|
|
|
|
|||||||||||
| Net asset value, end of the period |
$ | 22.34 | $ | 19.60 | $ | 21.28 | $ | 22.16 | $ | 16.63 | ||||||||||
|
|
|
|
|
|
|
|
|
|
|
|||||||||||
| Total return |
18.69 | % | (4.18 | )% | 10.70 | % | 38.21 | % | 17.33 | %(b) | ||||||||||
| RATIOS TO AVERAGE NET ASSETS: |
||||||||||||||||||||
| Net assets, end of the period (000’s) |
$ | 26,252 | $ | 21,696 | $ | 26,694 | $ | 14,176 | $ | 12,100 | ||||||||||
| Net expenses |
0.92 | % | 0.89 | % | 0.97 | % | 1.05 | %(c) | 1.05 | %(d) | ||||||||||
| Gross expenses |
0.92 | % | 0.89 | % | 0.97 | % | 1.05 | %(c) | 1.09 | % | ||||||||||
| Net investment income |
1.05 | % | 0.92 | % | 0.67 | % | 0.54 | % | 1.04 | % | ||||||||||
| Portfolio turnover rate |
16 | % | 23 | % | 64 | %(e) | 29 | % | 25 | % | ||||||||||
| (a) | Per share net investment income has been calculated using the average shares outstanding during the period. |
| (b) | Had certain expenses not been waived/reimbursed during the period, total returns would have been lower. |
| (c) | Includes fee/expense recovery of less than 0.01%. |
| (d) | The investment adviser agreed to waive its fees and/or reimburse a portion of the Fund’s expenses during the period. Without this waiver/reimbursement, expenses would have been higher. |
| (e) | The variation in the Fund’s turnover rate from 2013 to 2014 was primarily due to a change in the portfolio management team. |
See accompanying notes to financial statements.
67 |
Table of Contents
Financial Highlights (continued)
For a share outstanding throughout each period.
| Natixis Oakmark International Fund—Class A | ||||||||||||||||||||
| Year Ended December 31, 2016 |
Year Ended December 31, 2015 |
Year Ended December 31, 2014 |
Year Ended December 31, 2013 |
Year Ended December 31, 2012 |
||||||||||||||||
| Net asset value, beginning of the period |
$ | 11.47 | $ | 12.44 | $ | 13.74 | $ | 10.94 | $ | 8.68 | ||||||||||
|
|
|
|
|
|
|
|
|
|
|
|||||||||||
| INCOME (LOSS) FROM INVESTMENT OPERATIONS: |
||||||||||||||||||||
| Net investment income(a) |
0.17 | 0.15 | 0.18 | 0.07 | 0.14 | |||||||||||||||
| Net realized and unrealized gain (loss) |
0.76 | (0.80 | ) | (1.01 | ) | 2.99 | 2.35 | |||||||||||||
|
|
|
|
|
|
|
|
|
|
|
|||||||||||
| Total from Investment Operations |
0.93 | (0.65 | ) | (0.83 | ) | 3.06 | 2.49 | |||||||||||||
|
|
|
|
|
|
|
|
|
|
|
|||||||||||
| LESS DISTRIBUTIONS FROM: |
||||||||||||||||||||
| Net investment income |
(0.21 | ) | (0.20 | ) | (0.25 | ) | (0.08 | ) | (0.23 | ) | ||||||||||
| Net realized capital gains |
(0.04 | ) | (0.12 | ) | (0.22 | ) | (0.18 | ) | — | |||||||||||
|
|
|
|
|
|
|
|
|
|
|
|||||||||||
| Total Distributions |
(0.25 | ) | (0.32 | ) | (0.47 | ) | (0.26 | ) | (0.23 | ) | ||||||||||
|
|
|
|
|
|
|
|
|
|
|
|||||||||||
| Net asset value, end of the period |
$ | 12.15 | $ | 11.47 | $ | 12.44 | $ | 13.74 | $ | 10.94 | ||||||||||
|
|
|
|
|
|
|
|
|
|
|
|||||||||||
| Total return(b) |
8.19 | % | (5.35 | )% | (6.05 | )% | 28.13 | % | 28.78 | %(c) | ||||||||||
| RATIOS TO AVERAGE NET ASSETS: |
||||||||||||||||||||
| Net assets, end of the period (000’s) |
$ | 533,112 | $ | 722,805 | $ | 617,383 | $ | 314,579 | $ | 35,555 | ||||||||||
| Net expenses |
1.34 | % | 1.31 | % | 1.31 | % | 1.44 | %(d) | 1.45 | %(e) | ||||||||||
| Gross expenses |
1.34 | % | 1.31 | % | 1.31 | % | 1.44 | %(d) | 1.64 | % | ||||||||||
| Net investment income |
1.54 | % | 1.17 | % | 1.34 | % | 0.52 | % | 1.50 | % | ||||||||||
| Portfolio turnover rate |
41 | % | 51 | % | 31 | % | 20 | % | 53 | % | ||||||||||
| (a) | Per share net investment income has been calculated using the average shares outstanding during the period. |
| (b) | A sales charge for Class A shares is not reflected in total return calculations. |
| (c) | Had certain expenses not been waived/reimbursed during the period, total returns would have been lower. |
| (d) | Includes fee/expense recovery of 0.05%. |
| (e) | The investment adviser agreed to waive its fees and/or reimburse a portion of the Fund’s expenses during the period. Without this waiver/reimbursement, expenses would have been higher. |
See accompanying notes to financial statements.
| 68
Table of Contents
Financial Highlights (continued)
For a share outstanding throughout each period.
| Natixis Oakmark International Fund—Class C |
||||||||||||||||||||
| Year Ended December 31, 2016 |
Year Ended December 31, 2015 |
Year Ended December 31, 2014 |
Year Ended December 31, 2013 |
Year Ended December 31, 2012 |
||||||||||||||||
| Net asset value, beginning of the period |
$ | 11.29 | $ | 12.25 | $ | 13.53 | $ | 10.82 | $ | 8.61 | ||||||||||
|
|
|
|
|
|
|
|
|
|
|
|||||||||||
| INCOME (LOSS) FROM INVESTMENT OPERATIONS: |
||||||||||||||||||||
| Net investment income (loss)(a) |
0.08 | 0.05 | 0.08 | (0.02 | ) | 0.06 | ||||||||||||||
| Net realized and unrealized gain (loss) |
0.74 | (0.78 | ) | (0.98 | ) | 2.94 | 2.34 | |||||||||||||
|
|
|
|
|
|
|
|
|
|
|
|||||||||||
| Total from Investment Operations |
0.82 | (0.73 | ) | (0.90 | ) | 2.92 | 2.40 | |||||||||||||
|
|
|
|
|
|
|
|
|
|
|
|||||||||||
| LESS DISTRIBUTIONS FROM: |
||||||||||||||||||||
| Net investment income |
(0.11 | ) | (0.11 | ) | (0.16 | ) | (0.03 | ) | (0.19 | ) | ||||||||||
| Net realized capital gains |
(0.04 | ) | (0.12 | ) | (0.22 | ) | (0.18 | ) | — | |||||||||||
|
|
|
|
|
|
|
|
|
|
|
|||||||||||
| Total Distributions |
(0.15 | ) | (0.23 | ) | (0.38 | ) | (0.21 | ) | (0.19 | ) | ||||||||||
|
|
|
|
|
|
|
|
|
|
|
|||||||||||
| Net asset value, end of the period |
$ | 11.96 | $ | 11.29 | $ | 12.25 | $ | 13.53 | $ | 10.82 | ||||||||||
|
|
|
|
|
|
|
|
|
|
|
|||||||||||
| Total return(b) |
7.36 | % | (6.08 | )% | (6.67 | )% | 27.13 | % | 27.93 | %(c) | ||||||||||
| RATIOS TO AVERAGE NET ASSETS: |
||||||||||||||||||||
| Net assets, end of the period (000’s) |
$ | 255,249 | $ | 341,959 | $ | 327,319 | $ | 237,250 | $ | 34,142 | ||||||||||
| Net expenses |
2.09 | % | 2.06 | % | 2.05 | % | 2.19 | %(d) | 2.20 | %(e) | ||||||||||
| Gross expenses |
2.09 | % | 2.06 | % | 2.05 | % | 2.19 | %(d) | 2.39 | % | ||||||||||
| Net investment income (loss) |
0.73 | % | 0.39 | % | 0.61 | % | (0.14 | )% | 0.59 | % | ||||||||||
| Portfolio turnover rate |
41 | % | 51 | % | 31 | % | 20 | % | 53 | % | ||||||||||
| (a) | Per share net investment income (loss) has been calculated using the average shares outstanding during the period. |
| (b) | A contingent deferred sales charge for Class C shares is not reflected in total return calculations. |
| (c) | Had certain expenses not been waived/reimbursed during the period, total returns would have been lower. |
| (d) | Includes fee/expense recovery of 0.04%. |
| (e) | The investment adviser agreed to waive its fees and/or reimburse a portion of the Fund’s expenses during the period. Without this waiver/reimbursement, expenses would have been higher. |
See accompanying notes to financial statements.
69 |
Table of Contents
Financial Highlights (continued)
For a share outstanding throughout each period.
| Vaughan Nelson Small Cap Value Fund—Class A | ||||||||||||||||||||
| Year Ended December 31, 2016 |
Year Ended December 31, 2015 |
Year Ended December 31, 2014 |
Year Ended December 31, 2013 |
Year Ended December 31, 2012 |
||||||||||||||||
| Net asset value, beginning of the period |
$ | 17.74 | $ | 20.65 | $ | 22.34 | $ | 18.97 | $ | 17.74 | ||||||||||
|
|
|
|
|
|
|
|
|
|
|
|||||||||||
| INCOME (LOSS) FROM INVESTMENT OPERATIONS: |
||||||||||||||||||||
| Net investment income (loss)(a) |
0.02 | 0.06 | (b) | (0.06 | ) | 0.07 | (c) | 0.13 | (d) | |||||||||||
| Net realized and unrealized gain (loss) |
3.49 | (0.07 | ) | 1.95 | 7.14 | 2.50 | ||||||||||||||
|
|
|
|
|
|
|
|
|
|
|
|||||||||||
| Total from Investment Operations |
3.51 | (0.01 | ) | 1.89 | 7.21 | 2.63 | ||||||||||||||
|
|
|
|
|
|
|
|
|
|
|
|||||||||||
| LESS DISTRIBUTIONS FROM: |
||||||||||||||||||||
| Net investment income |
(0.01 | ) | (0.04 | ) | — | (0.06 | ) | (0.14 | ) | |||||||||||
| Net realized capital gains |
(1.45 | ) | (2.86 | ) | (3.58 | ) | (3.78 | ) | (1.26 | ) | ||||||||||
|
|
|
|
|
|
|
|
|
|
|
|||||||||||
| Total Distributions |
(1.46 | ) | (2.90 | ) | (3.58 | ) | (3.84 | ) | (1.40 | ) | ||||||||||
|
|
|
|
|
|
|
|
|
|
|
|||||||||||
| Net asset value, end of the period |
$ | 19.79 | $ | 17.74 | $ | 20.65 | $ | 22.34 | $ | 18.97 | ||||||||||
|
|
|
|
|
|
|
|
|
|
|
|||||||||||
| Total return(e) |
20.24 | % | (0.29 | )%(b) | 8.79 | % | 39.01 | %(c) | 14.93 | %(d) | ||||||||||
| RATIOS TO AVERAGE NET ASSETS: |
||||||||||||||||||||
| Net assets, end of the period (000’s) |
$ | 106,447 | $ | 103,092 | $ | 125,201 | $ | 152,792 | $ | 160,400 | ||||||||||
| Net expenses |
1.35 | % | 1.35 | % | 1.37 | % | 1.39 | %(f) | 1.39 | % | ||||||||||
| Gross expenses |
1.35 | % | 1.35 | % | 1.37 | % | 1.39 | %(f) | 1.39 | % | ||||||||||
| Net investment income (loss) |
0.11 | % | 0.26 | %(b) | (0.27 | )% | 0.33 | %(c) | 0.67 | %(d) | ||||||||||
| Portfolio turnover rate |
74 | % | 62 | % | 58 | % | 58 | % | 73 | % | ||||||||||
| (a) | Per share net investment income (loss) has been calculated using the average shares outstanding during the period. |
| (b) | Includes non-recurring dividends. Without these dividends, net investment loss per share would have been $(0.04), total return would have been (0.77)% and the ratio of net investment loss to average net assets would have been (0.20)%. |
| (c) | Includes a non-recurring dividend. Without this dividend, net investment income per share would have been $0.00, total return would have been 38.63% and the ratio of net investment income to average net assets would have been 0.02%. |
| (d) | Includes a non-recurring dividend. Without this dividend, net investment income per share would have been $0.04, total return would have been 14.42% and the ratio of net investment income to average net assets would have been 0.22%. |
| (e) | A sales charge for Class A shares is not reflected in total return calculations. |
| (f) | Includes interest expense of less than 0.01%. |
See accompanying notes to financial statements.
| 70
Table of Contents
Financial Highlights (continued)
For a share outstanding throughout each period.
| Vaughan Nelson Small Cap Value Fund—Class C | ||||||||||||||||||||
| Year Ended December 31, 2016 |
Year Ended December 31, 2015 |
Year Ended December 31, 2014 |
Year Ended December 31, 2013 |
Year Ended December 31, 2012 |
||||||||||||||||
| Net asset value, beginning of the period |
$ | 12.39 | $ | 15.36 | $ | 17.61 | $ | 15.64 | $ | 14.85 | ||||||||||
|
|
|
|
|
|
|
|
|
|
|
|||||||||||
| INCOME (LOSS) FROM INVESTMENT OPERATIONS: |
||||||||||||||||||||
| Net investment loss(a) |
(0.08 | ) | (0.08 | )(b) | (0.18 | ) | (0.07 | )(c) | (0.01 | )(d) | ||||||||||
| Net realized and unrealized gain (loss) |
2.40 | (0.03 | ) | 1.51 | 5.83 | 2.08 | ||||||||||||||
|
|
|
|
|
|
|
|
|
|
|
|||||||||||
| Total from Investment Operations |
2.32 | (0.11 | ) | 1.33 | 5.76 | 2.07 | ||||||||||||||
|
|
|
|
|
|
|
|
|
|
|
|||||||||||
| LESS DISTRIBUTIONS FROM: |
||||||||||||||||||||
| Net investment income |
— | — | — | (0.01 | ) | (0.02 | ) | |||||||||||||
| Net realized capital gains |
(1.45 | ) | (2.86 | ) | (3.58 | ) | (3.78 | ) | (1.26 | ) | ||||||||||
|
|
|
|
|
|
|
|
|
|
|
|||||||||||
| Total Distributions |
(1.45 | ) | (2.86 | ) | (3.58 | ) | (3.79 | ) | (1.28 | ) | ||||||||||
|
|
|
|
|
|
|
|
|
|
|
|||||||||||
| Net asset value, end of the period |
$ | 13.26 | $ | 12.39 | $ | 15.36 | $ | 17.61 | $ | 15.64 | ||||||||||
|
|
|
|
|
|
|
|
|
|
|
|||||||||||
| Total return(e) |
19.32 | % | (1.02 | )%(b) | 7.94 | % | 37.99 | %(c) | 14.08 | %(d) | ||||||||||
| RATIOS TO AVERAGE NET ASSETS: |
||||||||||||||||||||
| Net assets, end of the period (000’s) |
$ | 20,379 | $ | 21,188 | $ | 27,292 | $ | 31,476 | $ | 26,980 | ||||||||||
| Net expenses |
2.10 | % | 2.10 | % | 2.12 | % | 2.14 | %(f) | 2.14 | % | ||||||||||
| Gross expenses |
2.10 | % | 2.10 | % | 2.12 | % | 2.14 | %(f) | 2.14 | % | ||||||||||
| Net investment loss |
(0.64 | )% | (0.48 | )%(b) | (1.02 | )% | (0.40 | )%(c) | (0.07 | )%(d) | ||||||||||
| Portfolio turnover rate |
74 | % | 62 | % | 58 | % | 58 | % | 73 | % | ||||||||||
| (a) | Per share net investment loss has been calculated using the average shares outstanding during the period. |
| (b) | Includes non-recurring dividends. Without these dividends, net investment loss per share would have been $(0.15), total return would have been (1.48)% and the ratio of net investment loss to average net assets would have been (0.96)%. |
| (c) | Includes a non-recurring dividend. Without this dividend, net investment loss per share would have been $(0.13), total return would have been 37.59% and the ratio of net investment income loss to average net assets would have been (0.73)%. |
| (d) | Includes a non-recurring dividend. Without this dividend, net investment loss per share would have been $(0.08), total return would have been 13.52% and the ratio of net investment income loss to average net assets would have been (0.51)%. |
| (e) | A contingent deferred sales charge for Class C shares is not reflected in total return calculations. |
| (f) | Includes interest expense of less than 0.01%. |
See accompanying notes to financial statements.
71 |
Table of Contents
Financial Highlights (continued)
For a share outstanding throughout each period.
| Vaughan Nelson Small Cap Value Fund—Class Y | ||||||||||||||||||||
| Year Ended December 31, 2016 |
Year Ended December 31, 2015 |
Year Ended December 31, 2014 |
Year Ended December 31, 2013 |
Year Ended December 31, 2012 |
||||||||||||||||
| Net asset value, beginning of the period |
$ | 18.21 | $ | 21.13 | $ | 22.73 | $ | 19.24 | $ | 17.99 | ||||||||||
|
|
|
|
|
|
|
|
|
|
|
|||||||||||
| INCOME (LOSS) FROM INVESTMENT OPERATIONS: |
||||||||||||||||||||
| Net investment income (loss)(a) |
0.07 | 0.11 | (b) | (0.00 | )(c) | 0.13 | (d) | 0.18 | (e) | |||||||||||
| Net realized and unrealized gain (loss) |
3.59 | (0.07 | ) | 1.98 | 7.26 | 2.53 | ||||||||||||||
|
|
|
|
|
|
|
|
|
|
|
|||||||||||
| Total from Investment Operations |
3.66 | 0.04 | 1.98 | 7.39 | 2.71 | |||||||||||||||
|
|
|
|
|
|
|
|
|
|
|
|||||||||||
| LESS DISTRIBUTIONS FROM: |
||||||||||||||||||||
| Net investment income |
(0.06 | ) | (0.10 | ) | — | (0.12 | ) | (0.20 | ) | |||||||||||
| Net realized capital gains |
(1.45 | ) | (2.86 | ) | (3.58 | ) | (3.78 | ) | (1.26 | ) | ||||||||||
|
|
|
|
|
|
|
|
|
|
|
|||||||||||
| Total Distributions |
(1.51 | ) | (2.96 | ) | (3.58 | ) | (3.90 | ) | (1.46 | ) | ||||||||||
|
|
|
|
|
|
|
|
|
|
|
|||||||||||
| Net asset value, end of the period |
$ | 20.36 | $ | 18.21 | $ | 21.13 | $ | 22.73 | $ | 19.24 | ||||||||||
|
|
|
|
|
|
|
|
|
|
|
|||||||||||
| Total return |
20.53 | % | (0.05 | )%(b) | 9.04 | % | 39.43 | %(d) | 15.18 | %(e) | ||||||||||
| RATIOS TO AVERAGE NET ASSETS: |
||||||||||||||||||||
| Net assets, end of the period (000’s) |
$ | 183,145 | $ | 179,322 | $ | 176,905 | $ | 163,836 | $ | 132,970 | ||||||||||
| Net expenses |
1.10 | % | 1.10 | % | 1.12 | % | 1.14 | %(f) | 1.14 | % | ||||||||||
| Gross expenses |
1.10 | % | 1.10 | % | 1.12 | % | 1.14 | %(f) | 1.14 | % | ||||||||||
| Net investment income (loss) |
0.36 | % | 0.50 | %(b) | (0.01 | )% | 0.59 | %(d) | 0.95 | %(e) | ||||||||||
| Portfolio turnover rate |
74 | % | 62 | % | 58 | % | 58 | % | 73 | % | ||||||||||
| (a) | Per share net investment income (loss) has been calculated using the average shares outstanding during the period. |
| (b) | Includes non-recurring dividends. Without these dividends, net investment income per share would have been $0.02, total return would have been (0.53)% and the ratio of net investment income to average net assets would have been 0.07%. |
| (c) | Amount rounds to less than $0.01 per share. |
| (d) | Includes a non-recurring dividend. Without this dividend, net investment income per share would have been $0.06, total return would have been 39.06% and the ratio of net investment income to average net assets would have been 0.27%. |
| (e) | Includes a non-recurring dividend. Without this dividend, net investment income per share would have been $0.10, total return would have been 14.73% and the ratio of net investment income to average net assets would have been 0.50%. |
| (f) | Includes interest expense of less than 0.01%. |
See accompanying notes to financial statements.
| 72
Table of Contents
Financial Highlights (continued)
For a share outstanding throughout each period.
| Vaughan Nelson Value Opportunity Fund—Class A | ||||||||||||||||||||
| Year Ended December 31, 2016 |
Year Ended December 31, 2015 |
Year Ended December 31, 2014 |
Year Ended December 31, 2013 |
Year Ended December 31, 2012 |
||||||||||||||||
| Net asset value, beginning of the period |
$ | 20.04 | $ | 21.29 | $ | 20.63 | $ | 15.49 | $ | 13.83 | ||||||||||
|
|
|
|
|
|
|
|
|
|
|
|||||||||||
| INCOME (LOSS) FROM INVESTMENT OPERATIONS: |
||||||||||||||||||||
| Net investment income (loss)(a) |
0.07 | 0.03 | (b) | (0.08 | ) | (0.03 | ) | 0.15 | (c) | |||||||||||
| Net realized and unrealized gain (loss) |
1.05 | (0.79 | ) | 2.31 | 6.36 | 2.05 | ||||||||||||||
|
|
|
|
|
|
|
|
|
|
|
|||||||||||
| Total from Investment Operations |
1.12 | (0.76 | ) | 2.23 | 6.33 | 2.20 | ||||||||||||||
|
|
|
|
|
|
|
|
|
|
|
|||||||||||
| LESS DISTRIBUTIONS FROM: |
||||||||||||||||||||
| Net investment income |
(0.05 | ) | (0.02 | ) | — | — | (0.14 | ) | ||||||||||||
| Net realized capital gains |
(0.56 | ) | (0.47 | ) | (1.57 | ) | (1.19 | ) | (0.40 | ) | ||||||||||
|
|
|
|
|
|
|
|
|
|
|
|||||||||||
| Total Distributions |
(0.61 | ) | (0.49 | ) | (1.57 | ) | (1.19 | ) | (0.54 | ) | ||||||||||
|
|
|
|
|
|
|
|
|
|
|
|||||||||||
| Net asset value, end of the period |
$ | 20.55 | $ | 20.04 | $ | 21.29 | $ | 20.63 | $ | 15.49 | ||||||||||
|
|
|
|
|
|
|
|
|
|
|
|||||||||||
| Total return(d) |
5.85 | % | (3.66 | )%(b) | 10.92 | % | 41.22 | % | 15.93 | %(c) | ||||||||||
| RATIOS TO AVERAGE NET ASSETS: |
||||||||||||||||||||
| Net assets, end of the period (000’s) |
$ | 87,536 | $ | 142,833 | $ | 73,237 | $ | 67,716 | $ | 28,381 | ||||||||||
| Net expenses |
1.23 | % | 1.23 | % | 1.25 | % | 1.27 | % | 1.31 | % | ||||||||||
| Gross expenses |
1.23 | % | 1.23 | % | 1.25 | % | 1.27 | % | 1.31 | % | ||||||||||
| Net investment income (loss) |
0.35 | % | 0.16 | %(b) | (0.37 | )% | (0.13 | )% | 0.97 | %(c) | ||||||||||
| Portfolio turnover rate |
57 | % | 32 | % | 58 | % | 39 | % | 65 | % | ||||||||||
| (a) | Per share net investment income (loss) has been calculated using the average shares outstanding during the period. |
| (b) | Includes a non-recurring dividend. Without this dividend, net investment loss per share would have been $(0.01), total return would have been (3.94)% and the ratio of net investment loss to average net assets would have been (0.04)%. |
| (c) | Includes non-recurring dividends. Without these dividends, net investment income per share would have been $0.02, total return would have been 15.06% and the ratio of net investment income to average net assets would have been 0.16%. |
| (d) | A sales charge for Class A shares is not reflected in total return calculations. |
See accompanying notes to financial statements.
73 |
Table of Contents
Financial Highlights (continued)
For a share outstanding throughout each period.
| Vaughan Nelson Value Opportunity Fund—Class C | ||||||||||||||||||||
| Year Ended December 31, 2016 |
Year Ended December 31, 2015 |
Year Ended December 31, 2014 |
Year Ended December 31, 2013 |
Year Ended December 31, 2012 |
||||||||||||||||
| Net asset value, beginning of the period |
$ | 19.16 | $ | 20.51 | $ | 20.07 | $ | 15.21 | $ | 13.60 | ||||||||||
|
|
|
|
|
|
|
|
|
|
|
|||||||||||
| INCOME (LOSS) FROM INVESTMENT OPERATIONS: |
||||||||||||||||||||
| Net investment income (loss)(a) |
(0.07 | ) | (0.13 | )(b) | (0.23 | ) | (0.17 | ) | 0.04 | (c) | ||||||||||
| Net realized and unrealized gain (loss) |
0.98 | (0.75 | ) | 2.24 | 6.22 | 2.01 | ||||||||||||||
|
|
|
|
|
|
|
|
|
|
|
|||||||||||
| Total from Investment Operations |
0.91 | (0.88 | ) | 2.01 | 6.05 | 2.05 | ||||||||||||||
|
|
|
|
|
|
|
|
|
|
|
|||||||||||
| LESS DISTRIBUTIONS FROM: |
||||||||||||||||||||
| Net investment income |
(0.00 | )(d) | — | — | — | (0.04 | ) | |||||||||||||
| Net realized capital gains |
(0.56 | ) | (0.47 | ) | (1.57 | ) | (1.19 | ) | (0.40 | ) | ||||||||||
|
|
|
|
|
|
|
|
|
|
|
|||||||||||
| Total Distributions |
(0.56 | ) | (0.47 | ) | (1.57 | ) | (1.19 | ) | (0.44 | ) | ||||||||||
|
|
|
|
|
|
|
|
|
|
|
|||||||||||
| Net asset value, end of the period |
$ | 19.51 | $ | 19.16 | $ | 20.51 | $ | 20.07 | $ | 15.21 | ||||||||||
|
|
|
|
|
|
|
|
|
|
|
|||||||||||
| Total return(e) |
5.03 | % | (4.39 | )%(b) | 10.12 | % | 40.13 | % | 15.10 | %(c) | ||||||||||
| RATIOS TO AVERAGE NET ASSETS: |
||||||||||||||||||||
| Net assets, end of the period (000’s) |
$ | 68,923 | $ | 89,284 | $ | 35,894 | $ | 21,005 | $ | 3,090 | ||||||||||
| Net expenses |
1.98 | % | 1.98 | % | 2.00 | % | 2.02 | % | 2.06 | % | ||||||||||
| Gross expenses |
1.98 | % | 1.98 | % | 2.00 | % | 2.02 | % | 2.06 | % | ||||||||||
| Net investment income (loss) |
(0.38 | )% | (0.61 | )%(b) | (1.10 | )% | (0.89 | )% | 0.24 | %(c) | ||||||||||
| Portfolio turnover rate |
57 | % | 32 | % | 58 | % | 39 | % | 65 | % | ||||||||||
| (a) | Per share net investment income (loss) has been calculated using the average shares outstanding during the period. |
| (b) | Includes a non-recurring dividend. Without this dividend, net investment loss per share would have been $(0.16), total return would have been (4.68)% and the ratio of net investment loss to average net assets would have been (0.77)%. |
| (c) | Includes non-recurring dividends. Without these dividends, net investment loss per share would have been $(0.08), total return would have been 14.21% and the ratio of net investment loss to average net assets would have been (0.57)%. |
| (d) | Amount rounds to less than $0.01 per share. |
| (e) | A contingent deferred sales charge for Class C shares is not reflected in total return calculations. |
See accompanying notes to financial statements.
| 74
Table of Contents
Financial Highlights (continued)
For a share outstanding throughout each period.
| Vaughan Nelson Value Opportunity Fund—Class N | ||||||||||||||||
| Year Ended December 31, 2016 |
Year Ended December 31, 2015 |
Year Ended December 31, 2014 |
Period Ended December 31, 2013* |
|||||||||||||
| Net asset value, beginning of the period |
$ | 20.26 | $ | 21.50 | $ | 20.76 | $ | 17.53 | ||||||||
|
|
|
|
|
|
|
|
|
|||||||||
| INCOME (LOSS) FROM INVESTMENT OPERATIONS: |
||||||||||||||||
| Net investment income (loss)(a) |
0.16 | 0.11 | (b) | (0.00 | )(c) | (0.04 | ) | |||||||||
| Net realized and unrealized gain (loss) |
1.04 | (0.81 | ) | 2.31 | 4.35 | |||||||||||
|
|
|
|
|
|
|
|
|
|||||||||
| Total from Investment Operations |
1.20 | (0.70 | ) | 2.31 | 4.31 | |||||||||||
|
|
|
|
|
|
|
|
|
|||||||||
| LESS DISTRIBUTIONS FROM: |
||||||||||||||||
| Net investment income |
(0.15 | ) | (0.07 | ) | — | (0.02 | ) | |||||||||
| Net realized capital gains |
(0.56 | ) | (0.47 | ) | (1.57 | ) | (1.06 | ) | ||||||||
|
|
|
|
|
|
|
|
|
|||||||||
| Total Distributions |
(0.71 | ) | (0.54 | ) | (1.57 | ) | (1.08 | ) | ||||||||
|
|
|
|
|
|
|
|
|
|||||||||
| Net asset value, end of the period |
$ | 20.75 | $ | 20.26 | $ | 21.50 | $ | 20.76 | ||||||||
|
|
|
|
|
|
|
|
|
|||||||||
| Total return |
6.21 | % | (3.35 | )%(b) | 11.24 | % | 24.70 | %(d)(e) | ||||||||
| RATIOS TO AVERAGE NET ASSETS: |
||||||||||||||||
| Net assets, end of the period (000’s) |
$ | 148,365 | $ | 65,010 | $ | 12,024 | $ | 1 | ||||||||
| Net expenses |
0.88 | % | 0.89 | % | 0.91 | %(f) | 1.03 | %(g)(h) | ||||||||
| Gross expenses |
0.88 | % | 0.89 | % | 0.91 | %(f) | 2.07 | %(g) | ||||||||
| Net investment income (loss) |
0.78 | % | 0.50 | %(b) | (0.00 | )%(i) | (0.33 | )%(g) | ||||||||
| Portfolio turnover rate |
57 | % | 32 | % | 58 | % | 39 | % | ||||||||
| * | From commencement of operations on May 1, 2013 through December 31, 2013. |
| (a) | Per share net investment income (loss) has been calculated using the average shares outstanding during the period. |
| (b) | Includes a non-recurring dividend. Without this dividend, net investment income per share would have been $0.08, total return would have been (3.59)% and the ratio of net investment income to average net assets would have been 0.35%. |
| (c) | Amount rounds to less than $0.01 per share. |
| (d) | Had certain expenses not been waived/reimbursed during the period, total returns would have been lower. |
| (e) | Periods less than one year are not annualized. |
| (f) | Includes fee/expense recovery of less than 0.01%. |
| (g) | Computed on an annualized basis for periods less than one year. |
| (h) | The investment adviser agreed to waive its fees and/or reimburse a portion of the Fund’s expenses during the period. Without this waiver/reimbursement, expenses would have been higher. |
| (i) | Amount rounds to less than 0.01%. |
See accompanying notes to financial statements.
75 |
Table of Contents
Financial Highlights (continued)
For a share outstanding throughout each period.
| Vaughan Nelson Value Opportunity Fund—Class Y | ||||||||||||||||||||
| Year Ended December 31, 2016 |
Year Ended December 31, 2015 |
Year Ended December 31, 2014 |
Year Ended December 31, 2013 |
Year Ended December 31, 2012 |
||||||||||||||||
| Net asset value, beginning of the period |
$ | 20.27 | $ | 21.52 | $ | 20.78 | $ | 15.57 | $ | 13.89 | ||||||||||
|
|
|
|
|
|
|
|
|
|
|
|||||||||||
| INCOME (LOSS) FROM INVESTMENT OPERATIONS: |
||||||||||||||||||||
| Net investment income (loss)(a) |
0.12 | 0.09 | (b) | (0.02 | ) | 0.02 | 0.18 | (c) | ||||||||||||
| Net realized and unrealized gain (loss) |
1.07 | (0.82 | ) | 2.33 | 6.39 | 2.08 | ||||||||||||||
|
|
|
|
|
|
|
|
|
|
|
|||||||||||
| Total from Investment Operations |
1.19 | (0.73 | ) | 2.31 | 6.41 | 2.26 | ||||||||||||||
|
|
|
|
|
|
|
|
|
|
|
|||||||||||
| LESS DISTRIBUTIONS FROM: |
||||||||||||||||||||
| Net investment income |
(0.13 | ) | (0.05 | ) | — | (0.01 | ) | (0.18 | ) | |||||||||||
| Net realized capital gains |
(0.56 | ) | (0.47 | ) | (1.57 | ) | (1.19 | ) | (0.40 | ) | ||||||||||
|
|
|
|
|
|
|
|
|
|
|
|||||||||||
| Total Distributions |
(0.69 | ) | (0.52 | ) | (1.57 | ) | (1.20 | ) | (0.58 | ) | ||||||||||
|
|
|
|
|
|
|
|
|
|
|
|||||||||||
| Net asset value, end of the period |
$ | 20.77 | $ | 20.27 | $ | 21.52 | $ | 20.78 | $ | 15.57 | ||||||||||
|
|
|
|
|
|
|
|
|
|
|
|||||||||||
| Total return |
6.14 | % | (3.47 | )%(b) | 11.23 | % | 41.52 | % | 16.28 | %(c) | ||||||||||
| RATIOS TO AVERAGE NET ASSETS: |
||||||||||||||||||||
| Net assets, end of the period (000’s) |
$ | 903,545 | $ | 1,133,634 | $ | 656,071 | $ | 360,820 | $ | 163,589 | ||||||||||
| Net expenses |
0.98 | % | 0.98 | % | 1.00 | % | 1.02 | % | 1.06 | % | ||||||||||
| Gross expenses |
0.98 | % | 0.98 | % | 1.00 | % | 1.02 | % | 1.06 | % | ||||||||||
| Net investment income (loss) |
0.62 | % | 0.39 | %(b) | (0.10 | )% | 0.12 | % | 1.22 | %(c) | ||||||||||
| Portfolio turnover rate |
57 | % | 32 | % | 58 | % | 39 | % | 65 | % | ||||||||||
| (a) | Per share net investment income (loss) has been calculated using the average shares outstanding during the period. |
| (b) | Includes a non-recurring dividend. Without this dividend, net investment income per share would have been $0.05, total return would have been (3.70)% and the ratio of net investment income to average net assets would have been 0.20%. |
| (c) | Includes non-recurring dividends. Without these dividends, net investment income per share would have been $0.06, total return would have been 15.41% and the ratio of net investment income to average net assets would have been 0.42%. |
See accompanying notes to financial statements.
| 76
Table of Contents
Notes to Financial Statements
December 31, 2016
1. Organization. Natixis Funds Trust I and Natixis Funds Trust II (the “Trusts” and each a “Trust”) are each organized as a Massachusetts business trust. Each Trust is registered under the Investment Company Act of 1940, as amended (the “1940 Act”), as an open-end management investment company. Each Declaration of Trust permits the Board of Trustees to authorize the issuance of an unlimited number of shares of the Trust in multiple series. The financial statements for certain funds of the Trusts are presented in separate reports. The following funds (individually, a “Fund” and collectively, the “Funds”) are included in this report:
Natixis Funds Trust I:
Mirova Global Sustainable Equity Fund (the “Global Sustainable Equity Fund”)
Natixis Oakmark International Fund
Vaughan Nelson Small Cap Value Fund (the “Small Cap Value Fund”)
Natixis Funds Trust II:
Natixis Oakmark Fund
Vaughan Nelson Value Opportunity Fund (the “Value Opportunity Fund”)
Global Sustainable Equity Fund commenced operations on March 31, 2016 via contribution to the Fund by Natixis Global Asset Management L.P. (“Natixis US”) and affiliates of $10,002,000. An additional contribution of $40,000,000 was made during the period.
Each Fund is a diversified investment company.
Each Fund offers Class A and Class C shares. Global Sustainable Equity Fund, Small Cap Value Fund, Natixis Oakmark Fund and Value Opportunity Fund also offer Class Y shares. In addition, Value Opportunity Fund offers Class N shares. As of the close of business on January 11, 2016, Class B shares of Natixis Oakmark Fund and Small Cap Value Fund were converted into Class A shares and are no longer offered.
Effective July 31, 2009, the Small Cap Value Fund was closed to new investors. The Fund continues to offer Class A, Class C and Class Y shares to existing investors. The Fund, in its sole discretion, may permit an investor in another Vaughan Nelson-managed fund or product that follows the same investment strategy as the Fund to transfer assets from that fund or product into the Fund.
Class A shares are sold with a maximum front-end sales charge of 5.75%. Class C shares do not pay a front-end sales charge, pay higher Rule 12b-1 fees than Class A shares and may be subject to a contingent deferred sales charge (“CDSC”) of 1.00% if those shares are redeemed within one year of acquisition, except for reinvested distributions. Class N and Class Y shares do not pay a front-end sales charge, a CDSC or Rule 12b-1 fees. Class N shares are offered with no initial minimum investment to certain retirement plans held in an omnibus fashion and fund of funds that are distributed by NGAM Distribution, L.P. and with an initial minimum investment of
77 |
Table of Contents
Notes to Financial Statements (continued)
December 31, 2016
$1,000,000 to other categories of investors. Class Y shares are intended for institutional investors with a minimum initial investment of $100,000, though some categories of investors are exempted from the minimum investment amount as outlined in the Funds’ prospectus.
Most expenses can be directly attributed to a Fund. Expenses which cannot be directly attributed to a Fund are generally apportioned based on the relative net assets of each of the funds in Natixis Funds Trust I, Natixis Funds Trust II, Natixis Funds Trust IV, Gateway Trust and Natixis ETF Trust (“Natixis Funds Trusts”), Loomis Sayles Funds I and Loomis Sayles Funds II (“Loomis Sayles Funds Trusts”). Expenses of a Fund are borne pro rata by the holders of each class of shares, except that each class bears expenses unique to the class (such as the Rule 12b-1 fees applicable to Class A and Class C) and transfer agent fees for Value Opportunity Fund are borne collectively for Class A, Class C and Class Y and individually for Class N. In addition, each class votes as a class only with respect to its own Rule 12b-1 Plan. Shares of each class would receive their pro rata share of the net assets of a Fund if the Fund were liquidated. The Trustees approve separate distributions from net investment income on each class of shares.
2. Significant Accounting Policies. The following is a summary of significant accounting policies consistently followed by each Fund in the preparation of its financial statements. The Funds’ financial statements follow the accounting and reporting guidelines provided for investment companies and are prepared in accordance with accounting principles generally accepted in the United States of America which require the use of management estimates that affect the reported amounts and disclosures in the financial statements. Actual results could differ from those estimates. Management has evaluated the events and transactions subsequent to year-end through the date the financial statements were issued and has determined that there were no material events that would require disclosure in the Funds’ financial statements.
a. Valuation. Fund securities and other investments are valued at market value based on market quotations obtained or determined by independent pricing services recommended by the adviser and subadviser and approved by the Board of Trustees. Fund securities and other investments for which market quotations are not readily available are valued at fair value as determined in good faith by the adviser or subadviser pursuant to procedures approved by the Board of Trustees, as described below. Market value is determined as follows:
Listed equity securities (including shares of closed-end investment companies and exchange-traded funds) are valued at the last sale price quoted on the exchange where they are traded most extensively or, if there is no reported sale during the day, the closing bid quotation as reported by an independent pricing service. Securities traded on the NASDAQ Global Select Market, NASDAQ Global Market and NASDAQ
| 78
Table of Contents
Notes to Financial Statements (continued)
December 31, 2016
Capital Market are valued at the NASDAQ Official Closing Price (“NOCP”), or if lacking an NOCP, at the most recent bid quotations on the applicable NASDAQ Market. Unlisted equity securities (except unlisted preferred equity securities) are valued at the last sale price quoted in the market where they are traded most extensively or, if there is no reported sale during the day, the closing bid quotation as reported by an independent pricing service. If there is no last sale price or closing bid quotation available, unlisted equity securities will be valued using evaluated bids furnished by an independent pricing service, if available. In some foreign markets, an official close price and a last sale price may be available from the foreign exchange or market. In those cases, the official close price is used. Debt securities and unlisted preferred equity securities are valued based on evaluated bids furnished to the Funds by an independent pricing service or bid prices obtained from broker-dealers. Broker-dealer bid prices may be used to value debt and unlisted equity securities where an independent pricing service is unable to price a security or where an independent pricing service does not provide a reliable price for the security. Forward foreign currency contracts are valued utilizing interpolated rates determined based on information provided by an independent pricing service.
Fund securities and other investments for which market quotations are not readily available are valued at fair value as determined in good faith by the adviser or subadviser pursuant to procedures approved by the Board of Trustees. The Funds may also value securities and other investments at fair value in other circumstances such as when extraordinary events occur after the close of a foreign market but prior to the close of the New York Stock Exchange (“NYSE”). This may include situations relating to a single issuer (such as a declaration of bankruptcy or a delisting of the issuer’s security from the primary market on which it has traded) as well as events affecting the securities markets in general (such as market disruptions or closings and significant fluctuations in U.S. and/or foreign markets). When fair valuing its securities or other investments, the Funds may, among other things, use modeling tools or other processes that may take into account factors such as securities or other market activity and/or significant events that occur after the close of the foreign market and before the time the Fund’s net asset value (“NAV”) is calculated. Fair value pricing may require subjective determinations about the value of a security, and fair values used to determine a Fund’s NAV may differ from quoted or published prices, or from prices that are used by others, for the same securities. In addition, the use of fair value pricing may not always result in adjustments to the prices of securities held by a Fund.
79 |
Table of Contents
Notes to Financial Statements (continued)
December 31, 2016
As of December 31, 2016, securities held by the Funds’ were fair valued as follows:
| Fund |
Equity securities1 |
Percentage of Net Assets |
||||||
| Global Sustainable Equity Fund |
$ | 19,906,186 | 40.0 | % | ||||
| Natixis Oakmark International Fund |
$ | 711,288,023 | 90.2 | % | ||||
| 1 | Certain foreign equity securities were fair valued pursuant to procedures approved by the Board of Trustees as events occurring after the close of the foreign market were believed to materially affect the value of those securities. |
b. Investment Transactions and Related Investment Income. Investment transactions are accounted for on a trade date plus one day basis for daily NAV calculation. However, for financial reporting purposes, investment transactions are reported on trade date. Dividend income is recorded on ex-dividend date, or in the case of certain foreign securities, as soon as a Fund is notified, and interest income is recorded on an accrual basis. Interest income is increased by the accretion of discount and decreased by the amortization of premium, if applicable. Distributions received from investments in securities that represent a return of capital or capital gain are recorded as a reduction of cost of investments or as a realized gain, respectively. The calendar year-end amounts of ordinary income, capital gains, and return of capital included in distributions received from the Funds’ investments in real estate investment trusts (“REITs”) are reported to the Funds after the end of the fiscal year; accordingly, the Funds estimate these amounts for accounting purposes until the characterization of REIT distributions is reported to the Funds after the end of the fiscal year. Estimates are based on the most recent REIT distribution information available. In determining net gain or loss on securities sold, the cost of securities has been determined on an identified cost basis. Investment income, non-class specific expenses and realized and unrealized gains and losses are allocated on a pro rata basis to each class based on the relative net assets of each class to the total net assets of the Fund.
c. Foreign Currency Translation. The books and records of the Funds are maintained in U.S. dollars. The values of securities, currencies and other assets and liabilities denominated in currencies other than U.S. dollars are translated into U.S. dollars based upon foreign exchange rates prevailing at the end of the period. Purchases and sales of investment securities, income and expenses are translated into U.S. dollars on the respective dates of such transactions.
Net realized foreign exchange gains or losses arise from sales of foreign currency, changes in exchange rates between the trade and settlement dates on securities transactions and the difference between the amounts of dividends, interest and foreign withholding taxes recorded on the Fund’s books and the U.S. dollar equivalent of the amounts actually received or paid. Net unrealized foreign exchange gains or losses arise from changes in the value of assets and liabilities, other than investment securities, as of the end of the fiscal period, resulting from changes in exchange rates.
| 80
Table of Contents
Notes to Financial Statements (continued)
December 31, 2016
Net realized foreign exchange gains or losses and the net change in unrealized foreign exchange gains or losses are disclosed in the Statements of Operations. For federal income tax purposes, net realized foreign exchange gains or losses are characterized as ordinary income, and may, if the Funds have net losses, reduce the amount of income available to be distributed by the Funds.
The values of investment securities are presented at the foreign exchange rates prevailing at the end of the period for financial reporting purposes. Net realized and unrealized gains or losses on investments reported in the Statements of Operations reflect gains or losses resulting from changes in exchange rates and fluctuations which arise due to changes in market prices of investment securities.
The Funds may use foreign currency exchange contracts to facilitate transactions in foreign-denominated investments. Losses may arise from changes in the value of the foreign currency or if the counterparties do not perform under the contracts’ terms.
d. Forward Foreign Currency Contracts. Certain Funds may enter into forward foreign currency contracts, including forward foreign cross currency contracts, to acquire exposure to foreign currencies or to hedge the Fund’s investments against currency fluctuation. A contract can also be used to offset a previous contract. These contracts involve market risk in excess of the unrealized gain or loss reflected in the Funds’ Statements of Assets and Liabilities. The U.S. dollar value of the currencies a Fund has committed to buy or sell represents the aggregate exposure to each currency a Fund has acquired or hedged through currency contracts outstanding at period end. Gains or losses are recorded for financial statement purposes as unrealized until settlement date. Contracts are traded over-the-counter directly with a counterparty. Risks may arise upon entering into these contracts from the potential inability of counterparties to meet the terms of their contracts and from unanticipated movements in the value of a foreign currency relative to the U.S. dollar. Certain contracts may require the movement of cash and/or securities as collateral for the Fund’s or counterparty’s net obligations under the contracts.
e. Federal and Foreign Income Taxes. The Trusts treat each Fund as a separate entity for federal income tax purposes. Each Fund intends to meet the requirements of the Internal Revenue Code of 1986, as amended, applicable to regulated investment companies, and to distribute to its shareholders substantially all of its net investment income and any net realized capital gains at least annually. Management has performed an analysis of each Fund’s tax positions for the open tax years as of December 31, 2016, as applicable, and has concluded that no provisions for income tax are required. The Funds’ federal tax returns for the prior three fiscal years, where applicable, remain subject to examination by the Internal Revenue Service. Management is not aware of any events that are reasonably possible to occur in the next twelve months that would result in the amounts of any unrecognized tax benefits significantly increasing or decreasing for the Funds. However, management’s
81 |
Table of Contents
Notes to Financial Statements (continued)
December 31, 2016
conclusions regarding tax positions taken may be subject to review and adjustment at a later date based on factors including, but not limited to, new tax laws and accounting regulations and interpretations thereof.
A Fund may be subject to foreign withholding taxes on investment income and taxes on capital gains on investments that are accrued and paid based upon the Fund’s understanding of the tax rules and regulations that exist in the countries in which the Fund invests. Foreign withholding taxes on dividend and interest income are reflected on the Statements of Operations as a reduction of investment income, net of amounts eligible to be reclaimed. Dividends and interest receivable on the Statements of Assets and Liabilities are net of foreign withholding taxes. Foreign withholding taxes where reclaims have been or will be filed are reflected on the Statements of Assets and Liabilities as tax reclaims receivable. Capital gains taxes paid are included in net realized gain (loss) on investments in the Statements of Operations. Accrued but unpaid capital gains taxes are reflected as foreign taxes payable on the Statements of Assets and Liabilities, if applicable, and reduce unrealized gains on investments. In the event that realized gains on investments are subsequently offset by realized losses, taxes paid on realized gains may be returned to a Fund. Such amounts, if applicable, are reflected as foreign tax rebates receivable on the Statements of Assets and Liabilities and are recorded as a realized gain when received.
f. Dividends and Distributions to Shareholders. Dividends and distributions are recorded on ex-dividend date. The timing and characterization of certain income and capital gain distributions are determined in accordance with federal tax regulations, which may differ from accounting principles generally accepted in the United States of America. Permanent differences are primarily due to differing treatments for book and tax purposes of items such as distribution redesignations, non-deductible expenses, distributions in excess of income and/or capital gain, return of capital and capital gain distributions received, foreign currency gains and losses and deferred Trustees’ fees. Permanent book and tax basis differences relating to shareholder distributions, net investment income and net realized gains will result in reclassifications to capital accounts reported on the Statements of Assets and Liabilities. Temporary differences between book and tax distributable earnings are primarily due to deferred Trustees’ fees, wash sales, forward foreign currency contracts mark-to-market and return of capital distributions received. Amounts of income and capital gain available to be distributed on a tax basis are determined annually, and at other times during the Funds’ fiscal year as may be necessary to avoid knowingly declaring and paying a return of capital distribution. Distributions from net investment income and short-term capital gains are considered to be distributed from ordinary income for tax purposes.
| 82
Table of Contents
Notes to Financial Statements (continued)
December 31, 2016
The tax characterization of distributions is determined on an annual basis. The tax character of distributions paid to shareholders during the years ended December 31, 2016 and 2015 were as follows:
| 2016 Distributions Paid From: | 2015 Distributions Paid From: | |||||||||||||||||||||||
| Fund |
Ordinary |
Long-Term |
Total |
Ordinary |
Long-Term |
Total |
||||||||||||||||||
| Global Sustainable Equity Fund |
$ | 100,101 | $ | — | $ | 100,101 | $ | — | $ | — | $ | — | ||||||||||||
| Natixis Oakmark Fund |
1,798,205 | 7,812,896 | 9,611,101 | 2,201,492 | 8,169,871 | 10,371,363 | ||||||||||||||||||
| Natixis Oakmark International Fund |
15,448,327 | — | 15,448,327 | 19,403,163 | 6,977,702 | 26,380,865 | ||||||||||||||||||
| Small Cap Value Fund |
2,299,100 | 21,062,109 | 23,361,209 | 8,983,694 | 36,747,925 | 45,731,619 | ||||||||||||||||||
| Value Opportunity Fund |
7,189,189 | 41,383,417 | 48,572,606 | 8,555,915 | 23,246,983 | 31,802,898 | ||||||||||||||||||
Differences between these amounts and those reported in the Statements of Changes in Net Assets are primarily attributable to different book and tax treatment for short-term capital gains.
As of December 31, 2016, the components of distributable earnings on a tax basis were as follows:
| Global |
Natixis |
Natixis |
Small Cap |
Value |
||||||||||||||||
| Undistributed ordinary income |
$ | — | $ | 15,068 | $ | — | $ | 1,894,306 | $ | — | ||||||||||
| Undistributed long-term capital gains |
— | 3,795,131 | — | 9,638,035 | — | |||||||||||||||
|
|
|
|
|
|
|
|
|
|
|
|||||||||||
| Total undistributed earnings |
— | 3,810,199 | — | 11,532,341 | — | |||||||||||||||
|
|
|
|
|
|
|
|
|
|
|
|||||||||||
| Capital loss carryforward: |
— | — | — | — | — | |||||||||||||||
| Short-term: |
— | |||||||||||||||||||
| No expiration date |
— | — | (15,874,753 | ) | — | (30,427,421 | ) | |||||||||||||
| Long-term: |
||||||||||||||||||||
| No expiration date |
— | — | (96,925,655 | ) | — | — | ||||||||||||||
|
|
|
|
|
|
|
|
|
|
|
|||||||||||
| Total capital loss carryforward |
— | — | (112,800,408 | ) | — | (30,427,421 | ) | |||||||||||||
|
|
|
|
|
|
|
|
|
|
|
|||||||||||
| Late-year ordinary and post-October capital loss deferrals* |
(102,222 | ) | — | (447,104 | ) | — | — | |||||||||||||
|
|
|
|
|
|
|
|
|
|
|
|||||||||||
| Unrealized appreciation (depreciation) |
(1,325,406 | ) | 40,639,370 | (25,084,010 | ) | 47,344,526 | 63,285,616 | |||||||||||||
|
|
|
|
|
|
|
|
|
|
|
|||||||||||
| Total accumulated earnings (losses) |
$ | (1,427,628 | ) | $ | 44,449,569 | $ | (138,331,522 | ) | $ | 58,876,867 | $ | 32,858,195 | ||||||||
|
|
|
|
|
|
|
|
|
|
|
|||||||||||
| * | Under current tax law, capital losses, foreign currency losses, and losses on passive foreign investment companies and contingent payment debt instruments after October 31 or December 31, as applicable, may be deferred and treated as occurring on the first day of the following taxable year. Global Sustainable Equity Fund deferred foreign currency and capital losses, and Natixis Oakmark International Fund deferred foreign currency losses. |
83 |
Table of Contents
Notes to Financial Statements (continued)
December 31, 2016
g. Repurchase Agreements. Each Fund may enter into repurchase agreements, under the terms of a Master Repurchase Agreement, under which each Fund acquires securities as collateral and agrees to resell the securities at an agreed upon time and at an agreed upon price. It is each Fund’s policy that the market value of the collateral for repurchase agreements be at least equal to 102% of the repurchase price, including interest. Certain repurchase agreements are tri-party arrangements whereby the collateral is held in a segregated account for the benefit of the Fund and on behalf of the counterparty. Repurchase agreements could involve certain risks in the event of default or insolvency of the counterparty, including possible delays or restrictions upon a Fund’s ability to dispose of the underlying securities. As of December 31, 2016, each Fund, as applicable, had investments in repurchase agreements for which the value of the related collateral exceeded the value of the repurchase agreement. The gross value of repurchase agreements is included in the Statements of Assets and Liabilities for financial reporting purposes.
h. Securities Lending. Certain Funds have entered into an agreement with State Street Bank and Trust Company (“State Street Bank”), as agent of the Funds, to lend securities to certain designated borrowers. The loans are collateralized with cash or securities in an amount equal to at least 105% or 102% of the market value (including accrued interest) of the loaned international or domestic securities, respectively, when the loan is initiated. Thereafter, the value of the collateral must remain at least 102% of the market value (including accrued interest) of loaned securities for U.S. equities and U.S. corporate debt; at least 105% of the market value (including accrued interest) of loaned securities for non-U.S. equities; and at least 100% of the market value (including accrued interest) of loaned securities for U.S. Government securities, sovereign debt issued by non-U.S. Governments and non-U.S. corporate debt. In the event that the market value of the collateral falls below the required percentages described above, the borrower will deliver additional collateral on the next business day. As with other extensions of credit, the Funds may bear the risk of loss with respect to the investment of the collateral. The Funds invest cash collateral in short-term investments, a portion of the income from which is remitted to the borrowers and the remainder allocated between the Funds and State Street Bank as lending agent.
For the year ended December 31, 2016, none of the Funds had loaned securities under this agreement.
i. Indemnifications. Under the Trusts’ organizational documents, their officers and Trustees are indemnified against certain liabilities arising out of the performance of their duties to the Funds. Additionally, in the normal course of business, the Funds enter into contracts with service providers that contain general indemnification clauses. The Funds’ maximum exposure under these arrangements is unknown as this would involve future claims that may be made against the Funds that have not yet occurred. However, based on experience, the Funds expect the risk of loss to be remote.
| 84
Table of Contents
Notes to Financial Statements (continued)
December 31, 2016
j. New Accounting Pronouncement. In October 2016, the SEC adopted amendments to rules under the Investment Company Act of 1940 (“final rules”) intended to modernize the reporting and disclosure of information by registered investment companies. The final rules amend Regulation S-X and require funds to provide standardized, enhanced derivative disclosures in fund financial statements in a format designed for individual investors. The amendments to Regulation S-X also update the disclosures for other investments, including investments in and advances to affiliates, and amend the rules regarding the general form and content of fund financial statements. The compliance date for the amendments to Regulation S-X is August 1, 2017. Management is currently evaluating the amendments and the impact, if any, on the Funds’ financial statements.
3. Fair Value Measurements. In accordance with accounting standards related to fair value measurements and disclosures, the Funds have categorized the inputs utilized in determining the value of each Fund’s assets or liabilities. These inputs are summarized in the three broad levels listed below:
| • | Level 1 – quoted prices in active markets for identical assets or liabilities; |
| • | Level 2 – prices determined using other significant inputs that are observable either directly, or indirectly through corroboration with observable market data (which could include quoted prices for similar assets or liabilities, interest rates, credit risk, etc.); and |
| • | Level 3 – prices determined using significant unobservable inputs when quoted prices or observable inputs are unavailable such as when there is little or no market activity for an asset or liability (unobservable inputs reflect each Fund’s own assumptions in determining the fair value of assets or liabilities and would be based on the best information available). |
The inputs or methodology used for valuing securities are not necessarily an indication of the risk associated with investing in those securities.
85 |
Table of Contents
Notes to Financial Statements (continued)
December 31, 2016
The following is a summary of the inputs used to value the Funds’ investments as of December 31, 2016, at value:
Global Sustainable Equity Fund
Asset Valuation Inputs
| Description |
Level 1 |
Level 2 |
Level 3 |
Total |
||||||||||||
| Common Stocks |
||||||||||||||||
| Belgium |
$ | — | $ | 1,813,657 | $ | — | $ | 1,813,657 | ||||||||
| Denmark |
— | 3,461,203 | — | 3,461,203 | ||||||||||||
| France |
— | 3,530,068 | — | 3,530,068 | ||||||||||||
| Germany |
— | 2,579,939 | — | 2,579,939 | ||||||||||||
| Hong Kong |
— | 961,465 | — | 961,465 | ||||||||||||
| Japan |
— | 1,484,880 | — | 1,484,880 | ||||||||||||
| Netherlands |
— | 1,905,852 | — | 1,905,852 | ||||||||||||
| Singapore |
— | 758,429 | — | 758,429 | ||||||||||||
| Spain |
— | 542,269 | — | 542,269 | ||||||||||||
| Switzerland |
— | 758,124 | — | 758,124 | ||||||||||||
| United Kingdom |
— | 2,110,300 | — | 2,110,300 | ||||||||||||
| All Other Common Stocks(a) |
26,886,801 | — | — | 26,886,801 | ||||||||||||
|
|
|
|
|
|
|
|
|
|||||||||
| Total Common Stocks |
26,886,801 | 19,906,186 | — | 46,792,987 | ||||||||||||
|
|
|
|
|
|
|
|
|
|||||||||
| Short-Term Investments |
— | 2,928,328 | — | 2,928,328 | ||||||||||||
|
|
|
|
|
|
|
|
|
|||||||||
| Total |
$ | 26,886,801 | $ | 22,834,514 | $ | — | $ | 49,721,315 | ||||||||
|
|
|
|
|
|
|
|
|
|||||||||
| (a) | Details of the major categories of the Fund’s investments are reflected within the Portfolio of Investments. |
For the period ended December 31, 2016, there were no transfers among Levels 1, 2 and 3.
Natixis Oakmark Fund
Asset Valuation Inputs
| Description |
Level 1 |
Level 2 |
Level 3 |
Total |
||||||||||||
| Common Stocks(a) |
$ | 237,473,336 | $ | — | $ | — | $ | 237,473,336 | ||||||||
| Short-Term Investments |
— | 20,125,275 | — | 20,125,275 | ||||||||||||
|
|
|
|
|
|
|
|
|
|||||||||
| Total |
$ | 237,473,336 | $ | 20,125,275 | $ | — | $ | 257,598,611 | ||||||||
|
|
|
|
|
|
|
|
|
|||||||||
| (a) | Details of the major categories of the Fund’s investments are reflected within the Portfolio of Investments. |
For the year ended December 31, 2016, there were no transfers among Levels 1, 2 and 3.
| 86
Table of Contents
Notes to Financial Statements (continued)
December 31, 2016
Natixis Oakmark International Fund
Asset Valuation Inputs
| Description |
Level 1 |
Level 2 |
Level 3 |
Total |
||||||||||||
| Common Stocks |
||||||||||||||||
| Australia |
$ | — | $ | 30,630,501 | $ | — | $ | 30,630,501 | ||||||||
| France |
— | 116,702,677 | — | 116,702,677 | ||||||||||||
| Germany |
— | 77,836,723 | — | 77,836,723 | ||||||||||||
| Indonesia |
— | 14,274,336 | — | 14,274,336 | ||||||||||||
| Ireland |
— | 8,413,224 | — | 8,413,224 | ||||||||||||
| Italy |
— | 39,041,994 | — | 39,041,994 | ||||||||||||
| Japan |
— | 70,886,237 | — | 70,886,237 | ||||||||||||
| Korea |
— | 9,063,820 | — | 9,063,820 | ||||||||||||
| Netherlands |
— | 38,436,212 | — | 38,436,212 | ||||||||||||
| Sweden |
— | 34,512,556 | — | 34,512,556 | ||||||||||||
| Switzerland |
— | 129,057,568 | — | 129,057,568 | ||||||||||||
| Taiwan |
— | 2,195,691 | — | 2,195,691 | ||||||||||||
| United Kingdom |
— | 140,236,484 | — | 140,236,484 | ||||||||||||
| All Other Common Stocks(a) |
61,545,477 | — | — | 61,545,477 | ||||||||||||
|
|
|
|
|
|
|
|
|
|||||||||
| Total Common Stocks |
61,545,477 | 711,288,023 | — | 772,833,500 | ||||||||||||
|
|
|
|
|
|
|
|
|
|||||||||
| Short-Term Investments |
— | 17,200,791 | — | 17,200,791 | ||||||||||||
|
|
|
|
|
|
|
|
|
|||||||||
| Total Investments |
61,545,477 | 728,488,814 | — | 790,034,291 | ||||||||||||
|
|
|
|
|
|
|
|
|
|||||||||
| Forward Foreign Currency Contracts (unrealized appreciation) |
— | 1,476,717 | — | 1,476,717 | ||||||||||||
|
|
|
|
|
|
|
|
|
|||||||||
| Total |
$ | 61,545,477 | $ | 729,965,531 | $ | — | $ | 791,511,008 | ||||||||
|
|
|
|
|
|
|
|
|
|||||||||
| (a) | Details of the major categories of the Fund’s investments are reflected within the Portfolio of Investments. |
A common stock valued at $18,325,211 was transferred from Level 1 to Level 2 during the period ended December 31, 2016. At December 31, 2015, this security was valued at the market price in the foreign market in accordance with the Fund’s valuation policies. At December 31, 2016, this security was fair valued pursuant to procedures approved by the Board of Trustees as events occurring after the close of the foreign market were believed to materially affect the value of the security.
All transfers are recognized as of the beginning of the reporting period.
87 |
Table of Contents
Notes to Financial Statements (continued)
December 31, 2016
Small Cap Value Fund
Asset Valuation Inputs
| Description |
Level 1 |
Level 2 |
Level 3 |
Total |
||||||||||||
| Common Stocks(a) |
$ | 273,245,449 | $ | — | $ | — | $ | 273,245,449 | ||||||||
| Exchange-Traded Funds |
15,899,304 | — | — | 15,899,304 | ||||||||||||
| Closed-End Investment Companies |
8,206,938 | — | — | 8,206,938 | ||||||||||||
| Short-Term Investments |
— | 7,326,333 | — | 7,326,333 | ||||||||||||
|
|
|
|
|
|
|
|
|
|||||||||
| Total |
$ | 297,351,691 | $ | 7,326,333 | $ | — | $ | 304,678,024 | ||||||||
|
|
|
|
|
|
|
|
|
|||||||||
| (a) | Details of the major categories of the Fund’s investments are reflected within the Portfolio of Investments. |
For the year ended December 31, 2016, there were no transfers among Levels 1, 2 and 3.
Value Opportunity Fund
Asset Valuation Inputs
| Description |
Level 1 |
Level 2 |
Level 3 |
Total |
||||||||||||
| Common Stocks(a) |
$ | 1,179,509,141 | $ | — | $ | — | $ | 1,179,509,141 | ||||||||
| Closed-End Investment Companies |
34,180,884 | — | — | 34,180,884 | ||||||||||||
| Short-Term Investments |
— | 16,710,268 | — | 16,710,268 | ||||||||||||
|
|
|
|
|
|
|
|
|
|||||||||
| Total |
$ | 1,213,690,025 | $ | 16,710,268 | $ | — | $ | 1,230,400,293 | ||||||||
|
|
|
|
|
|
|
|
|
|||||||||
| (a) | Details of the major categories of the Fund’s investments are reflected within the Portfolio of Investments. |
For the year ended December 31, 2016, there were no transfers among Levels 1, 2 and 3.
4. Derivatives. Derivative instruments are defined as financial instruments whose value and performance are based on the value and performance of an underlying asset, reference rate or index. Derivative instruments that Natixis Oakmark International Fund used during the period include forward foreign currency contracts.
The Fund is subject to the risk that changes in foreign currency exchange rates will have an unfavorable effect on the value of Fund assets denominated in foreign currencies. The Fund may enter into forward foreign currency contracts for hedging purposes to protect the value of the Fund’s holdings of foreign securities. During the year ended December 31, 2016, the Fund engaged in forward foreign currency transactions for hedging purposes.
| 88
Table of Contents
Notes to Financial Statements (continued)
December 31, 2016
The following is a summary of derivative instruments for Natixis Oakmark International Fund as of December 31, 2016, as reflected within the Statements of Assets and Liabilities:
| Assets |
Unrealized appreciation |
|||
| Over-the-counter asset derivatives |
||||
| Foreign exchange contracts |
$ | 1,476,717 | ||
Transactions in derivative instruments for Natixis Oakmark International Fund during the year ended December 31, 2016, as reflected within the Statements of Operations were as follows:
| Net Realized Gain (Loss) on: |
Foreign currency |
|||
| Foreign exchange contracts |
$ | 706,504 | ||
| Net Change in Unrealized Appreciation |
Foreign currency |
|||
| Foreign exchange contracts |
$ | 25,558 | ||
| 1 | Represents realized gain and change in unrealized appreciation (depreciation), respectively, for forward foreign currency contracts during the period. Does not include other foreign currency gains or losses included in the Statements of Operations. |
As the Fund values its derivatives at fair value and recognizes changes in fair value through the Statement of Operations, it does not qualify for hedge accounting under authoritative guidance for derivative instruments. The Fund’s investments in derivatives may represent an economic hedge; however, they are considered to be non-hedge transactions for the purpose of these disclosures.
The volume of forward foreign currency contract activity, as a percentage of net assets, for Natixis Oakmark International Fund, based on gross month-end notional amounts outstanding during the period, including long and short positions at absolute value, was as follows for the year ended December 31, 2016:
| Natixis Oakmark International Fund |
Forwards |
|||
| Average Notional Amount Outstanding |
3.91 | % | ||
| Highest Notional Amount Outstanding |
4.29 | % | ||
| Lowest Notional Amount Outstanding |
3.51 | % | ||
| Notional Amount Outstanding as of December 31, 2016 |
4.29 | % | ||
Notional amounts outstanding at the end of the prior period are included in the average notional amount outstanding.
89 |
Table of Contents
Notes to Financial Statements (continued)
December 31, 2016
Unrealized gain and/or loss on open forwards is recorded in the Statements of Assets and Liabilities. The aggregate notional values of forward contracts are not recorded in the Statements of Assets and Liabilities, and therefore are not included in the Fund’s net assets.
The Fund enters into over-the-counter derivatives, including forward foreign currency contracts, pursuant to an International Swaps and Derivatives Association, Inc. (“ISDA”) agreement between the Fund and its counterparty. ISDA agreements typically contain master netting provisions in the event of a default or other termination event. Master netting provisions allow the Fund and the counterparty, in the event of a default or other termination event, to offset amounts owed by each related to derivative contracts to one net amount payable by either the Fund or the counterparty. For financial reporting purposes, the Fund does not offset derivative assets and liabilities on the Statements of Assets and Liabilities.
As of December 31, 2016, gross amounts of derivative assets and liabilities not offset in the Statement of Assets and Liabilities and the related net amounts after taking into account master netting arrangements, by counterparty, are as follows:
Natixis Oakmark International Fund
| Counterparty |
Gross Amounts |
Offset |
Net |
|||||||||
| State Street Bank and Trust Company |
$ | 1,476,717 | $ | — | $ | 1,476,717 | ||||||
Counterparty risk is managed based on policies and procedures established by each Fund’s adviser. Such policies and procedures may include, but are not limited to, minimum counterparty credit rating requirements and monitoring of counterparty credit default swap spreads. Based on balances reflected on the Fund’s Statement of Assets and Liabilities, the following table shows (i) the maximum amount of loss due to credit risk that, based on the gross fair value of the financial instrument, the Fund would incur if parties to the relevant financial instruments failed completely to perform according to the terms of the contracts and ii) the amount of loss that the Fund would incur after taking into account master netting provisions pursuant to ISDA agreements, as of December 31, 2016:
| Fund |
Maximum Amount |
Maximum Amount |
||||||
| Natixis Oakmark International Fund |
$ | 1,476,717 | $ | 1,476,717 | ||||
| 90
Table of Contents
Notes to Financial Statements (continued)
December 31, 2016
5. Purchases and Sales of Securities. For the year ended December 31, 2016, purchases and sales of securities (excluding short-term investments and U.S. Government/Agency securities and including paydowns) were as follows:
| Fund |
Purchases |
Sales |
||||||
| Global Sustainable Equity Fund |
$ | 54,708,592 | $ | 6,526,093 | ||||
| Natixis Oakmark Fund |
35,690,818 | 99,530,794 | ||||||
| Natixis Oakmark International Fund |
361,822,007 | 681,136,756 | ||||||
| Small Cap Value Fund |
214,174,030 | 261,516,383 | ||||||
| Value Opportunity Fund |
750,541,524 | 996,646,390 | ||||||
6. Management Fees and Other Transactions with Affiliates.
a. Management Fees. NGAM Advisors, L.P. (“NGAM Advisors”), serves as investment adviser to each Fund except the Global Sustainable Equity Fund. Natixis Asset Management U.S., LLC (“Natixis AM US”) is the investment adviser to the Global Sustainable Equity Fund. Under the terms of the management agreements, each Fund pays a management fee at the following annual rates, calculated daily and payable monthly, based on each Fund’s average daily net assets:
| Percentage of Average Daily Net Assets | ||||||||||||||||||||||||
| Fund |
First $200 million |
Next $300 million |
Next $500 million |
Next $500 million |
Next $500 million |
Over $2 billion |
||||||||||||||||||
| Global Sustainable Equity Fund |
0.80 | % | 0.80 | % | 0.80 | % | 0.80 | % | 0.80 | % | 0.80 | % | ||||||||||||
| Natixis Oakmark Fund |
0.70 | % | 0.65 | % | 0.60 | % | 0.60 | % | 0.60 | % | 0.60 | % | ||||||||||||
| Natixis Oakmark International Fund |
0.85 | % | 0.85 | % | 0.85 | % | 0.85 | % | 0.85 | % | 0.85 | % | ||||||||||||
| Small Cap Value Fund |
0.90 | % | 0.90 | % | 0.90 | % | 0.90 | % | 0.90 | % | 0.90 | % | ||||||||||||
| Value Opportunity Fund |
0.80 | % | 0.80 | % | 0.80 | % | 0.80 | % | 0.75 | % | 0.75 | % | ||||||||||||
NGAM Advisors has entered into subadvisory agreements for each Fund as listed below.
| Natixis Oakmark Fund |
Harris Associates L.P. (“Harris”) | |
| Natixis Oakmark International Fund |
Harris | |
| Small Cap Value Fund |
Vaughan Nelson Investment Management, L.P. (“Vaughan Nelson”) | |
| Value Opportunity Fund |
Vaughan Nelson |
91 |
Table of Contents
Notes to Financial Statements (continued)
December 31, 2016
Under the terms of the subadvisory agreements, each Fund has agreed to pay its respective subadviser a subadvisory fee at the following annual rates, calculated daily and payable monthly, based on each Fund’s average daily net assets:
| Percentage of Average Daily Net Assets |
||||||||||||||
| Fund |
Subadviser |
First $200 Million |
Next $1.3 Billion |
Over $1.5 Billion |
||||||||||
| Natixis Oakmark Fund |
Harris |
0.52 | % | 0.50 | % | 0.50 | % | |||||||
| Natixis Oakmark International Fund |
Harris |
0.60 | % | 0.60 | % | 0.60 | % | |||||||
| Small Cap Value Fund |
Vaughan Nelson |
0.55 | % | 0.55 | % | 0.55 | % | |||||||
| Value Opportunity Fund |
Vaughan Nelson |
0.50 | % | 0.50 | % | 0.47 | % | |||||||
NGAM Advisors and Natixis AM US have given binding undertakings to the Funds to waive management fees and/or reimburse certain expenses to limit the Funds’ operating expenses, exclusive of acquired fund fees and expenses, brokerage expenses, interest expense, taxes, organizational and extraordinary expenses, such as litigation and indemnification expenses. These undertakings are in effect until April 30, 2017, may be terminated before then only with the consent of the Funds’ Board of Trustees, and are reevaluated on an annual basis. Management fees payable, as reflected on the Statements of Assets and Liabilities, is net of waivers and/or expense reimbursements, if any, pursuant to these undertakings. Waivers/reimbursements that exceed management fees payable are reflected on the Statements of Assets and Liabilities as receivable from investment adviser.
For the year ended December 31, 2016 (period ending close of business January 11, 2016, for Class B) the expense limits as a percentage of average daily net assets under the expense limitation agreements were as follows:
| Expense Limit as a Percentage of Average Daily Net Assets |
||||||||||||||||||||
| Fund |
Class A |
Class B |
Class C |
Class N |
Class Y |
|||||||||||||||
| Global Sustainable Equity Fund |
1.30 | % | — | 2.05 | % | — | 1.05 | % | ||||||||||||
| Natixis Oakmark Fund |
1.30 | % | 2.05 | % | 2.05 | % | — | 1.05 | % | |||||||||||
| Natixis Oakmark International Fund |
1.45 | % | — | 2.20 | % | — | — | |||||||||||||
| Small Cap Value Fund |
1.45 | % | 2.20 | % | 2.20 | % | — | 1.20 | % | |||||||||||
| Value Opportunity Fund |
1.40 | % | — | 2.15 | % | 1.10 | % | 1.15 | % | |||||||||||
NGAM Advisors and Natixis AM US shall be permitted to recover expenses they have borne under the expense limitation agreements (whether through waiver of its management fees or otherwise) on a class by class basis in later periods to the extent the annual operating expenses of a class fall below a class’ expense limits, provided, however, that a class is not obligated to pay such waived/reimbursed fees or expenses
| 92
Table of Contents
Notes to Financial Statements (continued)
December 31, 2016
more than one year after the end of the fiscal year in which the fees or expenses were waived/reimbursed.
For the year ended December 31, 2016, the management fees and waivers of management fees for each Fund were as follows:
| Fund |
Gross |
Waivers
of |
Net |
Percentage of Average Daily Net Assets |
||||||||||||||||
| Gross |
Net |
|||||||||||||||||||
| Global Sustainable Equity Fund |
$ | 204,341 | $ | 39,340 | $ | 165,001 | 0.80% | 0.65% | ||||||||||||
| Natixis Oakmark Fund |
1,621,055 | — | 1,621,055 | 0.69% | 0.69% | |||||||||||||||
| Natixis Oakmark International Fund |
7,627,201 | — | 7,627,201 | 0.85% | 0.85% | |||||||||||||||
| Small Cap Value Fund |
2,696,750 | — | 2,696,750 | 0.90% | 0.90% | |||||||||||||||
| Value Opportunity Fund |
10,797,453 | — | 10,797,453 | 0.80% | 0.80% | |||||||||||||||
| 1 | Management fee waivers are subject to possible recovery until December 31, 2017. |
No expenses were recovered during the year ended December 31, 2016 under the terms of the expense limitation agreement.
Certain officers and directors of NGAM Advisors and its affiliates are also officers or Trustees of the Funds. NGAM Advisors, Harris and Vaughan Nelson are subsidiaries of Natixis US, which is part of Natixis Global Asset Management, an international asset management group based in Paris, France. Natixis AM US is a subsidiary of Natixis Asset Management (“NAM”), which is in turn a subsidiary of Natixis Global Asset Management.
b. Service and Distribution Fees. NGAM Distribution, L.P. (“NGAM Distribution”), which is a wholly-owned subsidiary of Natixis US, has entered into a distribution agreement with the Trusts. Pursuant to this agreement, NGAM Distribution serves as principal underwriter of the Funds of the Trusts.
Pursuant to Rule 12b-1 under the 1940 Act, the Trusts have adopted a Service Plan relating to each Fund’s Class A shares (the “Class A Plans”) and a Distribution and Service Plan relating to each Fund’s Class B (if applicable) and Class C shares (the “Class B and Class C Plans”).
Under the Class A Plans, each Fund pays NGAM Distribution a monthly service fee at an annual rate not to exceed 0.25% of the average daily net assets attributable to the Funds’ Class A shares, as reimbursement for expenses incurred by NGAM Distribution in providing personal services to investors in Class A shares and/or the maintenance of shareholder accounts.
93 |
Table of Contents
Notes to Financial Statements (continued)
December 31, 2016
Under the Class B (if applicable) and Class C Plans, each Fund pays (or paid) NGAM Distribution a monthly service fee at an annual rate not to exceed 0.25% of the average daily net assets attributable to the Funds’ Class B (if applicable) and Class C shares, as compensation for services provided by NGAM Distribution in providing personal services to investors in Class B (if applicable) and Class C shares and/or the maintenance of shareholder accounts.
Also under the Class B (if applicable) and Class C Plans, each Fund pays (or paid) NGAM Distribution a monthly distribution fee at an annual rate of 0.75% of the average daily net assets attributable to the Funds’ Class B (if applicable) and Class C shares, as compensation for services provided by NGAM Distribution in connection with the marketing or sale of Class B (if applicable) and Class C shares.
For the year ended December 31, 2016, the service and distribution fees for each Fund were as follows:
| Service Fees | Distribution Fees | |||||||||||||||||||
| Fund |
Class A |
Class B |
Class C |
Class B |
Class C |
|||||||||||||||
| Global Sustainable Equity Fund |
$ | 43 | $ | — | $ | 55 | $ | — | $ | 164 | ||||||||||
| Natixis Oakmark Fund |
400,057 | 2 | 142,833 | 7 | 428,499 | |||||||||||||||
| Natixis Oakmark International Fund |
1,532,803 | — | 710,492 | — | 2,131,476 | |||||||||||||||
| Small Cap Value Fund |
247,423 | 2 | 50,038 | 4 | 150,115 | |||||||||||||||
| Value Opportunity Fund |
322,652 | — | 204,662 | — | 613,987 | |||||||||||||||
c. Administrative Fees. NGAM Advisors provides certain administrative services for the Funds and contracts with State Street Bank to serve as sub-administrator. Pursuant to an agreement among Natixis Funds Trusts, Loomis Sayles Funds Trusts and NGAM Advisors, each Fund pays NGAM Advisors monthly its pro rata portion of fees equal to an annual rate of 0.0575% of the first $15 billion of the average daily net assets of the Natixis Funds Trusts and Loomis Sayles Funds Trusts, 0.0500% of the next $15 billion, 0.0400% of the next $30 billion, 0.0350% of the next $30 billion and 0.0325% of such assets in excess of $90 billion, subject to an annual aggregate minimum fee for the Natixis Funds Trusts and Loomis Sayles Funds Trusts of $10 million, which is reevaluated on an annual basis.
For the year ended December 31, 2016, the administrative fees for each Fund were as follows:
| Fund |
Administrative |
|||
| Global Sustainable Equity Fund |
$ | 11,358 | ||
| Natixis Oakmark Fund |
103,858 | |||
| Natixis Oakmark International Fund |
398,119 | |||
| Small Cap Value Fund |
132,988 | |||
| Value Opportunity Fund |
598,897 | |||
| 94
Table of Contents
Notes to Financial Statements (continued)
December 31, 2016
d. Sub-Transfer Agent Fees. NGAM Distribution has entered into agreements, which include servicing agreements, with financial intermediaries that provide recordkeeping, processing, shareholder communications and other services to customers of the intermediaries that hold positions in the Funds and has agreed to compensate the intermediaries for providing those services. Intermediaries transact with the Funds primarily through the use of omnibus accounts on behalf of their customers who hold positions in the Funds. These services would have been provided by the Funds’ transfer agent and other service providers if the shareholders’ accounts were maintained directly at the Funds’ transfer agent. Accordingly, the Funds have agreed to reimburse NGAM Distribution for all or a portion of the servicing fees paid to these intermediaries. The reimbursement amounts (sub-transfer agent fees) paid to NGAM Distribution are subject to a current per-account equivalent fee limit approved by the Funds’ Board of Trustees, which is based on fees for similar services paid to the Funds’ transfer agent and other service providers. Class N shares do not bear such expenses.
For the year ended December 31, 2016, the sub-transfer agent fees (which are reflected in transfer agent fees and expenses in the Statements of Operations) for each Fund were as follows:
| Fund |
Sub-Transfer |
|||
| Global Sustainable Equity Fund |
$ | 181 | ||
| Natixis Oakmark Fund |
126,543 | |||
| Natixis Oakmark International Fund |
995,693 | |||
| Small Cap Value Fund |
186,882 | |||
| Value Opportunity Fund |
1,155,838 | |||
As of December 31, 2016, the Funds owe NGAM Distribution the following reimbursements for sub-transfer agent fees (which are reflected in the Statements of Assets and Liabilities as payable to distributor):
| Fund |
Reimbursements |
|||
| Global Sustainable Equity Fund |
$ | 4 | ||
| Natixis Oakmark Fund |
1,710 | |||
| Natixis Oakmark International Fund |
11,103 | |||
| Small Cap Value Fund |
2,216 | |||
| Value Opportunity Fund |
13,029 | |||
Sub-transfer agent fees attributable to Class A, Class B, Class C and Class Y are allocated on a pro rata basis to each class based on the relative net assets of each class to the total net assets of those classes.
95 |
Table of Contents
Notes to Financial Statements (continued)
December 31, 2016
e. Commissions. Commissions (including CDSCs) on Fund shares retained by NGAM Distribution during the year ended December 31, 2016, were as follows:
| Fund |
Commissions |
|||
| Global Sustainable Equity Fund |
$ | 259 | ||
| Natixis Oakmark Fund |
38,063 | |||
| Natixis Oakmark International Fund |
128,223 | |||
| Small Cap Value Fund |
1,817 | |||
| Value Opportunity Fund |
56,785 | |||
f. Trustees Fees and Expenses. The Trusts do not pay any compensation directly to their officers or Trustees who are directors, officers or employees of NGAM Advisors, NGAM Distribution, Natixis US or their affiliates. The Chairperson of the Board of Trustees receives a retainer fee at the annual rate of $325,000. The Chairperson does not receive any meeting attendance fees for Board of Trustees meetings or committee meetings that she attends. Each Independent Trustee (other than the Chairperson) receives, in the aggregate, a retainer fee at the annual rate of $155,000. Each Independent Trustee also receives a meeting attendance fee of $10,000 for each meeting of the Board of Trustees that he or she attends in person and $5,000 for each meeting of the Board of Trustees that he or she attends telephonically. In addition, the chairperson of the Contract Review Committee and the chairperson of the Audit Committee each receive an additional retainer fee at the annual rate of $17,500. The chairperson of the Governance Committee receives an additional retainer fee at the annual rate of $10,000. Each Contract Review Committee member is compensated $6,000 for each Committee meeting that he or she attends in person and $3,000 for each meeting that he or she attends telephonically. Each Audit Committee member is compensated $6,000 for each Committee meeting that he or she attends in person and $3,000 for each meeting that he or she attends telephonically. These fees are allocated among the funds in the Natixis Funds Trusts and Loomis Sayles Funds Trusts based on a formula that takes into account, among other factors, the relative net assets of each fund. Trustees are reimbursed for travel expenses in connection with attendance at meetings.
A deferred compensation plan (the “Plan”) is available to the Trustees on a voluntary basis. Deferred amounts remain in the Funds until distributed in accordance with the provisions of the Plan. The value of a participating Trustee’s deferral account is based on theoretical investments of deferred amounts, on the normal payment dates, in certain funds of the Natixis Funds Trusts and Loomis Sayles Funds Trusts as designated by the participating Trustees. Changes in the value of participants’ deferral accounts are allocated pro rata among the funds in the Natixis Funds Trusts and Loomis Sayles Funds Trusts, and are normally reflected as Trustees’ fees and expenses in the Statements of Operations. The portions of the accrued obligations allocated to the Funds under the Plan are reflected as Deferred Trustees’ fees in the Statements of Assets and Liabilities.
| 96
Table of Contents
Notes to Financial Statements (continued)
December 31, 2016
g. Affiliated Ownership. As of December 31, 2016, Natixis US and affiliates held shares of Global Sustainable Equity Fund representing 97.84% of the Fund’s net assets. Investment activities of affiliated shareholders could have material impacts on the Fund.
h. Reimbursement of Transfer Agent Fees and Expenses. NGAM Advisors had given a binding contractual undertaking to the Value Opportunity Fund to reimburse any and all transfer agency expenses for the Fund’s Class N shares. This undertaking was in effect through April 30, 2016 and is not subject to recovery under the expense limitation agreement described above.
For the period January 1, 2016 through April 30, 2016, NGAM Advisors reimbursed the Fund $225 for transfer agency expenses related to Class N shares.
i. Payment by Affiliates. For the year ended December 31, 2016, Vaughan Nelson reimbursed Value Opportunity Fund $138,616 in connection with a trading error.
7. Class-Specific Transfer Agent Fees and Expenses. For the year ended December 31, 2016, Value Opportunity Fund incurred the following class-specific transfer agent fees and expenses (including sub-transfer agent fees, where applicable)
| Class A |
Class C |
Class N |
Class Y |
|||||||||||||
| Transfer Agent Fees and Expenses |
$ | 130,407 | $ | 82,496 | $ | 932 | $ | 1,045,219 | ||||||||
Transfer agent fees and expenses attributable to Class A, Class C, and Class Y are allocated on a pro rata basis to each class based on the relative net assets of each class to the total net assets of those classes. Transfer agent fees and expenses attributable to Class N are allocated to Class N.
All other Funds in this report allocate transfer agent fees and expenses on a pro rata basis based on the relative net assets of each class to the total net assets of those classes.
8. Line of Credit. Effective April 14, 2016, each Fund, together with certain other funds of Natixis Funds Trusts and Loomis Sayles Funds Trusts, entered into a 364-day, $400,000,000 syndicated, committed, unsecured line of credit with Citibank, N.A. to be used for temporary or emergency purposes only. Any one Fund may borrow up to the full $400,000,000 under the line of credit (as long as all borrowings by all Funds in the aggregate do not exceed the $400,000,000 limit at any time) subject to each Fund’s investment restrictions. Interest is charged to the Funds at a rate equal to the greater of the eurodollar or the federal funds rate plus 1.00%. In addition, a commitment fee of 0.10% per annum, payable on the last business day of each month, is accrued and apportioned among the participating funds based on their average daily unused portion of the line of credit. The Funds paid an arrangement fee, an upfront fee, and other fees in connection with the new line of credit agreement, which are being amortized over a period of 364 days and are reflected as miscellaneous expenses on the Statements of Operations. The unamortized balance is reflected as prepaid expenses on the Statements of Assets and Liabilities.
97 |
Table of Contents
Notes to Financial Statements (continued)
December 31, 2016
Prior to April 14, 2016 each Fund, together with certain other funds of Natixis Funds Trusts and Loomis Sayles Funds Trusts, participated in a $150,000,000 committed unsecured line of credit provided by State Street Bank. Any one Fund was able to borrow up to the full $150,000,000 under the line of credit (as long as all borrowings by all Funds in the aggregate do not exceed the $150,000,000 limit at any time). Interest was charged to each participating Fund based on its borrowings at a rate per annum equal to the greater of the Federal Funds rate or overnight LIBOR, plus 1.25%. In addition, a commitment fee of 0.15% per annum, payable at the end of each calendar quarter, was accrued and apportioned among the participating funds based on their average daily unused portion of the line of credit.
For the year ended December 31, 2016, none of the Funds had borrowings under these agreements.
9. Concentration of Risk. The Global Sustainable Equity Fund and Natixis Oakmark International Fund’s investments in foreign securities are subject to foreign currency fluctuations, higher volatility than U.S. securities, varying degrees of regulation and limited liquidity. Greater political, economic, credit and information risks are also associated with foreign securities.
10. Concentration of Ownership. From time to time, a Fund may have a concentration of one or more accounts constituting a significant percentage of shares outstanding. Investment activities by holders of such accounts could have material impacts on the Funds. As of December 31, 2016, based on management’s evaluation of the shareholder account base, the Funds had accounts representing controlling ownership of more than 5% of the Fund’s total outstanding shares. The number of such accounts, based on accounts that represent more than 5% of an individual class of shares, and the aggregate percentage of net assets represented by such holdings were as follows:
| Fund |
Number of 5% Non-Affiliated Account Holders |
Percentage of Non-Affiliated Ownership |
Percentage of Affiliated (Note 6g) |
Total Percentage |
||||||||||||
| Global Sustainable Equity Fund |
— | — | 97.84 | % | 97.84 | % | ||||||||||
| Natixis Oakmark International Fund |
1 | 10.95 | % | — | 10.95 | % | ||||||||||
| Small Cap Value Fund |
2 | 16.59 | % | — | 16.59 | % | ||||||||||
| Value Opportunity Fund |
2 | 22.69 | %(a) | — | 22.69 | % | ||||||||||
Omnibus shareholder accounts for which NGAM Advisors understands that the intermediary has discretion over the underlying shareholder accounts or investment models where a shareholder account may be invested for a non-discretionary customer are included in the table above. For other omnibus accounts, the Funds do
| 98
Table of Contents
Notes to Financial Statements (continued)
December 31, 2016
not have information on the individual shareholder accounts underlying the omnibus accounts; therefore, there could be other 5% shareholders in addition to those disclosed in the table above.
| (a) | Certain Fund shareholders are invested in the Fund as a result of the Fund’s inclusion in an investment portfolio model, utilized by certain third party intermediaries, developed by an affiliate of the Fund (AlphaSimplex Group, LLC, which is a subsidiary of Natixis US)(“ASG”). Without this model or as a result of changes in this model, these shareholder positions in the Fund may not exist or could change in a material amount. ASG has no involvement in the decisions to invest in the models provided. |
11. Capital Shares. Each Fund may issue an unlimited number of shares of beneficial interest, without par value. Transactions in capital shares were as follows:
| |
Period Ended December 31, 2016(a) |
| ||||||
| Global Sustainable Equity Fund |
Shares | Amount | ||||||
| Class A | ||||||||
| Issued from the sale of shares |
7,436 | $ | 74,105 | |||||
| Issued in connection with the reinvestment of distributions |
3 | 30 | ||||||
| Redeemed |
(301 | ) | (3,007 | ) | ||||
|
|
|
|
|
|||||
| Net change |
7,138 | $ | 71,128 | |||||
|
|
|
|
|
|||||
| Class C | ||||||||
| Issued from the sale of shares |
5,318 | $ | 52,970 | |||||
| Issued in connection with the reinvestment of distributions |
6 | 60 | ||||||
| Redeemed |
(3 | ) | (33 | ) | ||||
|
|
|
|
|
|||||
| Net change |
5,321 | $ | 52,997 | |||||
|
|
|
|
|
|||||
| Class Y | ||||||||
| Issued from the sale of shares |
4,997,044 | $ | 50,979,075 | |||||
| Issued in connection with the reinvestment of distributions |
9,961 | 99,208 | ||||||
| Redeemed |
(3,612 | ) | (35,781 | ) | ||||
|
|
|
|
|
|||||
| Net change |
5,003,393 | $ | 51,042,502 | |||||
|
|
|
|
|
|||||
| Increase (decrease) from capital share transactions |
5,015,852 | $ | 51,166,627 | |||||
|
|
|
|
|
|||||
| (a) | From commencement of operations on March 31, 2016 through December 31, 2016. |
99 |
Table of Contents
Notes to Financial Statements (continued)
December 31, 2016
11. Capital Shares (continued).
| |
Year Ended December 31, 2016 |
|
|
Year Ended December 31, 2015 |
| |||||||||||
| Natixis Oakmark Fund |
Shares | Amount | Shares | Amount | ||||||||||||
| Class A | ||||||||||||||||
| Issued from the sale of shares |
1,253,674 | $ | 23,788,547 | 1,517,556 | $ | 30,354,006 | ||||||||||
| Issued in connection with the reinvestment of distributions |
310,173 | 5,971,567 | 313,620 | 6,034,951 | ||||||||||||
| Redeemed |
(2,722,428 | ) | (50,444,998 | ) | (2,123,661 | ) | (41,948,388 | ) | ||||||||
|
|
|
|
|
|
|
|
|
|||||||||
| Net change |
(1,158,581 | ) | $ | (20,684,884 | ) | (292,485 | ) | $ | (5,559,431 | ) | ||||||
|
|
|
|
|
|
|
|
|
|||||||||
| Class B(a) | ||||||||||||||||
| Issued from the sale of shares |
— | $ | – | 94 | $ | 1,650 | ||||||||||
| Issued in connection with the reinvestment of distributions |
– | – | 123 | 2,182 | ||||||||||||
| Redeemed |
(1,891 | ) | (29,216 | ) | (34,844 | ) | (631,808 | ) | ||||||||
|
|
|
|
|
|
|
|
|
|||||||||
| Net change |
(1,891 | ) | $ | (29,216 | ) | (34,627 | ) | $ | (627,976 | ) | ||||||
|
|
|
|
|
|
|
|
|
|||||||||
| Class C | ||||||||||||||||
| Issued from the sale of shares |
806,782 | $ | 13,902,509 | 1,967,705 | $ | 34,953,476 | ||||||||||
| Issued in connection with the reinvestment of distributions |
89,633 | 1,486,762 | 88,208 | 1,504,613 | ||||||||||||
| Redeemed |
(2,169,451 | ) | (36,029,587 | ) | (1,273,258 | ) | (22,539,155 | ) | ||||||||
|
|
|
|
|
|
|
|
|
|||||||||
| Net change |
(1,273,036 | ) | $ | (20,640,316 | ) | 782,655 | $ | 13,918,934 | ||||||||
|
|
|
|
|
|
|
|
|
|||||||||
| Class Y | ||||||||||||||||
| Issued from the sale of shares |
920,373 | $ | 19,279,606 | 551,387 | $ | 11,590,333 | ||||||||||
| Issued in connection with the reinvestment of distributions |
31,858 | 655,095 | 37,938 | 760,796 | ||||||||||||
| Redeemed |
(883,863 | ) | (16,880,267 | ) | (737,029 | ) | (15,581,647 | ) | ||||||||
|
|
|
|
|
|
|
|
|
|||||||||
| Net change |
68,368 | $ | 3,054,434 | (147,704 | ) | $ | (3,230,518 | ) | ||||||||
|
|
|
|
|
|
|
|
|
|||||||||
| Increase (decrease) from capital share transactions |
(2,365,140 | ) | $ | (38,299,982 | ) | 307,839 | $ | 4,501,009 | ||||||||
|
|
|
|
|
|
|
|
|
|||||||||
| (a) | On January 11, 2016, Class B shares were converted into Class A shares. See Note 1 of Notes to Financial Statements. |
| 100
Table of Contents
Notes to Financial Statements (continued)
December 31, 2016
11. Capital Shares (continued).
| |
Year Ended December 31, 2016 |
|
|
Year Ended December 31, 2015 |
| |||||||||||
| Natixis Oakmark International Fund |
Shares | Amount | Shares | Amount | ||||||||||||
| Class A | ||||||||||||||||
| Issued from the sale of shares |
17,316,910 | $ | 189,288,241 | 40,727,220 | $ | 524,245,138 | ||||||||||
| Issued in connection with the reinvestment of distributions |
958,477 | 11,230,103 | 1,547,094 | 18,551,475 | ||||||||||||
| Redeemed |
(37,402,741 | ) | (413,700,664 | ) | (28,890,059 | ) | (355,356,386 | ) | ||||||||
|
|
|
|
|
|
|
|
|
|||||||||
| Net change |
(19,127,354 | ) | $ | (213,182,320 | ) | 13,384,255 | $ | 187,440,227 | ||||||||
|
|
|
|
|
|
|
|
|
|||||||||
| Class C | ||||||||||||||||
| Issued from the sale of shares |
2,591,697 | $ | 28,122,303 | 10,955,520 | $ | 138,511,592 | ||||||||||
| Issued in connection with the reinvestment of distributions |
233,485 | 2,645,525 | 408,992 | 4,881,076 | ||||||||||||
| Redeemed |
(11,772,884 | ) | (128,385,161 | ) | (7,803,461 | ) | (94,573,289 | ) | ||||||||
|
|
|
|
|
|
|
|
|
|||||||||
| Net change |
(8,947,702 | ) | $ | (97,617,333 | ) | 3,561,051 | $ | 48,819,379 | ||||||||
|
|
|
|
|
|
|
|
|
|||||||||
| Increase (decrease) from capital share transactions |
(28,075,056 | ) | $ | (310,799,653 | ) | 16,945,306 | $ | 236,259,606 | ||||||||
|
|
|
|
|
|
|
|
|
|||||||||
101 |
Table of Contents
Notes to Financial Statements (continued)
December 31, 2016
11. Capital Shares (continued).
| |
Year Ended December 31, 2016 |
|
|
Year Ended December 31, 2015 |
| |||||||||||
| Small Cap Value Fund |
Shares | Amount | Shares | Amount | ||||||||||||
| Class A | ||||||||||||||||
| Issued from the sale of shares |
636,491 | $ | 11,812,924 | 586,565 | $ | 12,199,067 | ||||||||||
| Issued in connection with the reinvestment of distributions |
353,938 | 6,758,819 | 718,326 | 13,152,899 | ||||||||||||
| Redeemed |
(1,423,762 | ) | (25,938,444 | ) | (1,556,600 | ) | (32,314,146 | ) | ||||||||
|
|
|
|
|
|
|
|
|
|||||||||
| Net change |
(433,333 | ) | $ | (7,366,701 | ) | (251,709 | ) | $ | (6,962,180 | ) | ||||||
|
|
|
|
|
|
|
|
|
|||||||||
| Class B(a) | ||||||||||||||||
| Issued from the sale of shares |
— | $ | — | 1,259 | $ | 20,238 | ||||||||||
| Issued in connection with the reinvestment of distributions |
— | — | 567 | 8,015 | ||||||||||||
| Redeemed |
(1,791 | ) | (20,887 | ) | (62,964 | ) | (986,740 | ) | ||||||||
|
|
|
|
|
|
|
|
|
|||||||||
| Net change |
(1,791 | ) | $ | (20,887 | ) | (61,138 | ) | $ | (958,487 | ) | ||||||
|
|
|
|
|
|
|
|
|
|||||||||
| Class C | ||||||||||||||||
| Issued from the sale of shares |
53,331 | $ | 672,153 | 130,432 | $ | 1,823,149 | ||||||||||
| Issued in connection with the reinvestment of distributions |
137,010 | 1,766,472 | 255,701 | 3,290,720 | ||||||||||||
| Redeemed |
(364,140 | ) | (4,604,493 | ) | (452,639 | ) | (6,920,026 | ) | ||||||||
|
|
|
|
|
|
|
|
|
|||||||||
| Net change |
(173,799 | ) | $ | (2,165,868 | ) | (66,506 | ) | $ | (1,806,157 | ) | ||||||
|
|
|
|
|
|
|
|
|
|||||||||
| Class Y | ||||||||||||||||
| Issued from the sale of shares |
1,398,050 | $ | 25,550,473 | 2,141,789 | $ | 46,690,758 | ||||||||||
| Issued in connection with the reinvestment of distributions |
591,961 | 11,610,546 | 1,198,310 | 22,443,814 | ||||||||||||
| Redeemed |
(2,844,796 | ) | (53,737,957 | ) | (1,865,835 | ) | (39,308,260 | ) | ||||||||
|
|
|
|
|
|
|
|
|
|||||||||
| Net change |
(854,785 | ) | $ | (16,576,938 | ) | 1,474,264 | $ | 29,826,312 | ||||||||
|
|
|
|
|
|
|
|
|
|||||||||
| Increase (decrease) from capital share transactions |
(1,463,708 | ) | $ | (26,130,394 | ) | 1,094,911 | $ | 20,099,488 | ||||||||
|
|
|
|
|
|
|
|
|
|||||||||
| (a) | On January 11, 2016, Class B shares were converted into Class A shares. See Note 1 of Notes to Financial Statements. |
| 102
Table of Contents
Notes to Financial Statements (continued)
December 31, 2016
11. Capital Shares (continued).
| |
Year Ended December 31, 2016 |
|
|
Year Ended December 31, 2015 |
| |||||||||||
| Value Opportunity Fund |
Shares | Amount | Shares | Amount | ||||||||||||
| Class A | ||||||||||||||||
| Issued from the sale of shares |
2,179,717 | $ | 40,891,195 | 6,072,313 | $ | 131,319,540 | ||||||||||
| Issued in connection with the reinvestment of distributions |
212,252 | 4,019,870 | 125,012 | 2,584,853 | ||||||||||||
| Redeemed |
(5,260,596 | ) | (102,702,359 | ) | (2,508,032 | ) | (53,811,968 | ) | ||||||||
|
|
|
|
|
|
|
|
|
|||||||||
| Net change |
(2,868,627 | ) | $ | (57,791,294 | ) | 3,689,293 | $ | 80,092,425 | ||||||||
|
|
|
|
|
|
|
|
|
|||||||||
| Class C | ||||||||||||||||
| Issued from the sale of shares |
585,856 | $ | 10,632,845 | 3,368,669 | $ | 70,554,606 | ||||||||||
| Issued in connection with the reinvestment of distributions |
116,224 | 2,089,713 | 71,042 | 1,402,692 | ||||||||||||
| Redeemed |
(1,830,738 | ) | (34,208,799 | ) | (529,265 | ) | (10,823,300 | ) | ||||||||
|
|
|
|
|
|
|
|
|
|||||||||
| Net change |
(1,128,658 | ) | $ | (21,486,241 | ) | 2,910,446 | $ | 61,133,998 | ||||||||
|
|
|
|
|
|
|
|
|
|||||||||
| Class N | ||||||||||||||||
| Issued from the sale of shares |
5,270,883 | $ | 105,086,789 | 2,972,431 | $ | 65,031,583 | ||||||||||
| Issued in connection with the reinvestment of distributions |
153,597 | 3,029,813 | 75,531 | 1,583,262 | ||||||||||||
| Redeemed |
(1,483,482 | ) | (29,622,654 | ) | (398,415 | ) | (8,784,271 | ) | ||||||||
|
|
|
|
|
|
|
|
|
|||||||||
| Net change |
3,940,998 | $ | 78,493,948 | 2,649,547 | $ | 57,830,574 | ||||||||||
|
|
|
|
|
|
|
|
|
|||||||||
| Class Y | ||||||||||||||||
| Issued from the sale of shares |
16,682,481 | $ | 321,963,213 | 35,161,537 | $ | 775,069,318 | ||||||||||
| Issued in connection with the reinvestment of distributions |
1,675,760 | 32,458,565 | 1,024,181 | 21,435,705 | ||||||||||||
| Redeemed |
(30,771,971 | ) | (605,432,371 | ) | (10,758,464 | ) | (233,638,744 | ) | ||||||||
|
|
|
|
|
|
|
|
|
|||||||||
| Net change |
(12,413,730 | ) | $ | (251,010,593 | ) | 25,427,254 | $ | 562,866,279 | ||||||||
|
|
|
|
|
|
|
|
|
|||||||||
| Increase (decrease) from capital share transactions |
(12,470,017 | ) | $ | (251,794,180 | ) | 34,676,540 | $ | 761,923,276 | ||||||||
|
|
|
|
|
|
|
|
|
|||||||||
103 |
Table of Contents
Report of Independent Registered Public Accounting Firm
To the Trustees of Natixis Funds Trust I and Natixis Funds Trust II and Shareholders of Mirova Global Sustainable Equity Fund, Natixis Oakmark Fund, Natixis Oakmark International Fund, Vaughan Nelson Small Cap Value Fund, and Vaughan Nelson Value Opportunity Fund:
In our opinion, the accompanying statements of assets and liabilities, including the portfolios of investments, and the related statements of operations and of changes in net assets and the financial highlights present fairly, in all material respects, the financial position of the Mirova Global Sustainable Equity Fund, Natixis Oakmark International Fund and Vaughan Nelson Small Cap Value Fund, each a series of Natixis Funds Trust I; and the Natixis Oakmark Fund and Vaughan Nelson Value Opportunity Fund, each a series of Natixis Funds Trust II (collectively, the “Funds”) as of December 31, 2016, and the results of each of their operations, the changes in each of their net assets and the financial highlights for each of the periods indicated, in conformity with accounting principles generally accepted in the United States of America. These financial statements and financial highlights (hereafter referred to as “financial statements”) are the responsibility of the Funds’ management. Our responsibility is to express an opinion on these financial statements based on our audits. We conducted our audits of these financial statements in accordance with the standards of the Public Company Accounting Oversight Board (United States). Those standards require that we plan and perform the audit to obtain reasonable assurance about whether the financial statements are free of material misstatement. An audit includes examining, on a test basis, evidence supporting the amounts and disclosures in the financial statements, assessing the accounting principles used and significant estimates made by management, and evaluating the overall financial statement presentation. We believe that our audits, which included confirmation of securities as of December 31, 2016 by correspondence with the custodian and brokers, provide a reasonable basis for our opinion.
PricewaterhouseCoopers LLP
Boston, Massachusetts
February 22, 2017
| 104
Table of Contents
2016 U.S. Tax Distribution Information to Shareholders (Unaudited)
Corporate Dividends Received Deduction. For the fiscal year ended December 31, 2016, a percentage of dividends distributed by the Funds listed below qualify for the dividends received deduction for corporate shareholders. These percentages are as follows:
| Fund |
Qualifying |
|||
| Global Sustainable Equity |
100.00 | % | ||
| Natixis Oakmark |
100.00 | % | ||
| Small Cap Value |
76.03 | % | ||
| Value Opportunity |
100.00 | % | ||
Capital Gains Distributions. Pursuant to Internal Revenue Section 852(b), the following Funds paid distributions, which have been designated as capital gains distributions for the fiscal year ended December 31, 2016.
| Fund |
Amount |
|||
| Natixis Oakmark |
$ | 7,812,896 | ||
| Small Cap Value |
21,062,109 | |||
| Value Opportunity |
41,383,417 | |||
Qualified Dividend Income. For the fiscal year ended December 31, 2016, a percentage of the ordinary income dividends paid by the Funds are considered qualified dividend income eligible for reduced tax rates. These lower rates range from 0% to 20% depending on an individual’s tax bracket. If the Funds paid a distribution during calendar year 2016, complete information will be reported in conjunction with Form 1099-DIV. These percentages are noted below:
| Fund |
Qualifying |
|||
| Global Sustainable Equity |
100.00 | % | ||
| Natixis Oakmark |
100.00 | % | ||
| Natixis Oakmark International |
100.00 | % | ||
| Small Cap Value |
100.00 | % | ||
| Value Opportunity |
100.00 | % | ||
Foreign Tax Credit. For the year ended December 31, 2016, the Fund intends to pass through foreign tax credits and have derived gross income from sources within foreign countries amounting to:
| Fund |
Foreign Tax |
Foreign Source |
||||||
| Natixis Oakmark International |
$ | 2,667,206 | $ | 28,477,056 | ||||
105 |
Table of Contents
Trustee and Officer Information
The tables below provide certain information regarding the trustees and officers of Natixis Funds Trust I and Natixis Funds Trust II (the “Trusts”). Unless otherwise indicated, the address of all persons below is 399 Boylston Street, Boston, MA 02116. The Funds’ Statement(s) of Additional Information include additional information about the trustees of the Trust(s) and are available by calling Natixis Funds at 800-225-5478.
| Name and Year of Birth |
Position(s) Held with the Trusts, Length of Time Served and Term of Office1 |
Principal Occupation(s) During Past 5 Years |
Number of Portfolios in Fund Complex Overseen2 and Other Directorships Held During Past 5 Years |
Experience, Qualifications, Attributes, Skills for Board Membership | ||||
| INDEPENDENT TRUSTEES | ||||||||
| Kenneth A. Drucker (1945) |
Chairperson of the Board of Trustees since January 2017 Trustee since 2008 Ex Officio member of the Audit Committee, the Contract Review Committee and the Governance Committee |
Retired | 53 None |
Significant experience on the Board and on the boards of other business organizations (including at investment companies); executive experience (including as treasurer of an aerospace, automotive, and metal manufacturing corporation) | ||||
| Edmond J. English (1953) |
Trustee since 2013 Audit Committee Member |
Chief Executive Officer of Bob’s Discount Furniture (retail) | 53 Director, Burlington Stores, Inc. (retail) |
Experience on the Board and significant experience on the boards of other business organizations (including retail companies and a bank); executive experience (including at a retail company) | ||||
| 106
Table of Contents
Trustee and Officer Information
| Name and Year of Birth |
Position(s) Held with the Trusts, Length of Time Served and Term of Office1 |
Principal Occupation(s) During Past 5 Years |
Number of Portfolios in Fund Complex Overseen2 and Other Directorships Held During Past 5 Years |
Experience, Qualifications, Attributes, Skills for Board Membership | ||||
| INDEPENDENT TRUSTEES continued |
||||||||
| Richard A. Goglia (1951) |
Trustee since 2015 Audit Committee Member |
Retired; formerly Vice President and Treasurer of Raytheon Company (defense) | 53 None |
Experience on the Board and executive experience (including his role as vice president and treasurer of a defense company and experience at a financial services company) | ||||
| Wendell J. Knox (1948) |
Trustee since 2009 Contract Review Committee Member and Governance Committee Member |
Director of Abt Associates Inc. (research and consulting) | 53 Director, Eastern Bank (bank); Director, The Hanover Insurance Group (property and casualty insurance) |
Significant experience on the Board and on the boards of other business organizations (including at a bank and at a property and casualty insurance firm); executive experience (including roles as president and chief executive officer of a research and consulting company) | ||||
107 |
Table of Contents
Trustee and Officer Information
| Name and Year of Birth |
Position(s) Held with the Trusts, Length of Time Served and Term of Office1 |
Principal Occupation(s) During Past 5 Years |
Number of Portfolios in Fund Complex Overseen2 and Other Directorships Held During Past 5 Years |
Experience, Qualifications, Attributes, Skills for Board Membership | ||||
| INDEPENDENT TRUSTEES continued |
||||||||
| Martin T. Meehan (1956) |
Trustee since 2012 Contract Review Committee Member |
President, University of Massachusetts; formerly, Chancellor and faculty member, University of Massachusetts Lowell | 53 None |
Experience on the Board and on the boards of other business organizations; experience as President of the University of Massachusetts; government experience (including as a member of the U.S. House of Representatives); academic experience | ||||
| Sandra O. Moose (1942) |
Trustee since 1982 for Natixis Funds Trust I (including its predecessors); since 1993 for Natixis Funds Trust II Audit Committee Member and Governance Committee Member |
President, Strategic Advisory Services (management consulting) | 53 Formerly, Director, AES Corporation (international power company); formerly, Director, Verizon Communications (telecommunications company) |
Significant experience on the Board and on the boards of other business organizations (including at a telecommunications company, an international power company and a specialty chemicals corporation); executive experience (including at a management consulting company) | ||||
| 108
Table of Contents
Trustee and Officer Information
| Name and Year of Birth |
Position(s) Held with the Trusts, Length of Time Served and Term of Office1 |
Principal Occupation(s) During Past 5 Years |
Number of Portfolios in Fund Complex Overseen2 and Other Directorships Held During Past 5 Years |
Experience, Qualifications, Attributes, Skills for Board Membership | ||||
| INDEPENDENT TRUSTEES continued |
||||||||
| James P. Palermo (1955) |
Trustee since 2016 Contract Review Committee Member |
Founding Partner, Breton Capital Management, LLC (private equity); Partner, STEP Partners, LLC (private equity); formerly, Chief Executive Officer of Global Client Management of The Bank of New York Mellon Corporation | 53 None |
Experience on the Board; financial services industry and executive experience (including roles as chief executive officer of client management and asset servicing for a banking and financial services company) | ||||
| Erik R. Sirri (1958) |
Trustee since 2009 Chairperson of the Audit Committee |
Professor of Finance at Babson College | 53 None |
Significant experience on the Board; experience as Director of the Division of Trading and Markets at the Securities and Exchange Commission; academic experience; training as an economist | ||||
| Peter J. Smail (1952) |
Trustee since 2009 Chairperson of the Contract Review Committee and Governance Committee Member |
Retired | 53 None |
Significant experience on the Board; mutual fund industry and executive experience (including roles as president and chief executive officer for an investment adviser) | ||||
109 |
Table of Contents
Trustee and Officer Information
| Name and Year of Birth |
Position(s) Held with the Trusts, Length of Time Served and Term of Office1 |
Principal Occupation(s) During Past 5 Years |
Number of Portfolios in Fund Complex Overseen2 and Other Directorships Held During Past 5 Years |
Experience, Qualifications, Attributes, Skills for Board Membership | ||||
| INDEPENDENT TRUSTEES continued |
||||||||
| Cynthia L. Walker (1956) |
Trustee since 2005 Chairperson of the Governance Committee and Audit Committee Member |
Deputy Dean for Finance and Administration, Yale University School of Medicine | 53 None |
Significant experience on the Board; executive experience in a variety of academic organizations (including roles as dean for finance and administration) | ||||
| INTERESTED TRUSTEES | ||||||||
| Kevin P. Charleston3 (1965) One Financial Center Boston, MA 02111 |
Trustee since 2015 | President, Chief Executive Officer and Director; formerly, Chief Financial Officer, Loomis, Sayles & Company, L.P. | 53 None |
Experience on the Board; continuing service as President, Chief Executive Officer and Director of Loomis, Sayles & Company, L.P. | ||||
| David L. Giunta4 (1965) |
Trustee since 2011 President and Chief Executive Officer since 2008 |
President and Chief Executive Officer, NGAM Distribution Corporation, NGAM Advisors, L.P. and NGAM Distribution, L.P. | 53 None |
Significant experience on the Board; continuing experience as President and Chief Executive Officer of NGAM Advisors, L.P. | ||||
| 1 | Each trustee serves until retirement, resignation or removal from the Board. The current retirement age is 75. The position of Chairperson of the Board is appointed for a three-year term. |
| 2 | The trustees of the Trusts serve as trustees of a fund complex that includes all series of the Natixis Funds Trust I, Natixis Funds Trust II, Natixis Funds Trust IV and Gateway Trust (collectively, the “Natixis Funds Trusts”), Loomis Sayles Funds I and Loomis Sayles Funds II (collectively, the “Loomis Sayles Funds Trusts”) and Natixis ETF Trust (collectively, the “Fund Complex”). |
| 3 | Mr. Charleston is deemed an “interested person” of the Trusts because he holds the following positions with an affiliated person of the Trusts: President and Chief Executive Officer of Loomis, Sayles & Company, L.P. |
| 4 | Mr. Giunta is deemed an “interested person” of the Trusts because he holds the following positions with an affiliated person of the Trusts: President and Chief Executive Officer of NGAM Distribution Corporation, NGAM Advisors, L.P. and NGAM Distribution, L.P. |
| 110
Table of Contents
Trustee and Officer Information
| Name and Year of Birth |
Position(s) Held with the Trusts |
Term of Office1 and Length of Time Served |
Principal Occupation(s) During Past 5 Years2 | |||
| OFFICERS OF THE TRUST | ||||||
| Russell L. Kane (1969) |
Secretary, Clerk and Chief Legal Officer | Since July 2016 | Executive Vice President, General Counsel, Secretary and Clerk, NGAM Distribution Corporation, NGAM Advisors, L.P. and NGAM Distribution, L.P.; formerly, Chief Compliance Officer for Mutual Funds, Senior Vice President, Deputy General Counsel, Assistant Secretary and Assistant Clerk, NGAM Distribution Corporation, NGAM Advisors, L.P. and NGAM Distribution, L.P. | |||
| Michael C. Kardok (1959) |
Treasurer, Principal Financial and Accounting Officer | Since October 2004 | Senior Vice President, NGAM Advisors, L.P. and NGAM Distribution, L.P. | |||
| Rosa Licea-Mailloux (1976) |
Chief Compliance Officer, Assistant Secretary and Anti-Money Laundering Officer | Since July 2016 | Senior Vice President, Deputy General Counsel, Assistant Secretary and Assistant Clerk, NGAM Distribution Corporation, NGAM Advisors, L.P. and NGAM Distribution, L.P.; formerly, Associate General Counsel, NGAM Distribution, L.P. | |||
| 1 | Each officer of the Trusts serves for an indefinite term in accordance with the Trusts’ current by-laws until the date his or her successor is elected and qualified, or until he or she sooner dies, retires, is removed or becomes disqualified. |
| 2 | Each person listed above, except as noted, holds the same position(s) with the Fund Complex. Previous positions during the past five years with NGAM Distribution, L.P., NGAM Advisors, L.P. or Loomis, Sayles & Company, L.P. are omitted, if not materially different from a trustee’s or officer’s current position with such entity. |
111 |
Table of Contents
ANNUAL REPORT
December 31, 2016

Loomis Sayles Multi-Asset Income Fund
McDonnell Intermediate Municipal Bond Fund
Natixis U.S. Equity Opportunities Fund

Portfolio Review page 1
Portfolio of Investments page 21
Financial Statements page 41
Notes to Financial Statements page 57
Table of Contents
LOOMIS SAYLES MULTI-ASSET INCOME FUND
| Managers | Symbols | |||
| Thomas Fahey | Class A | IIDPX | ||
| Kevin P. Kearns | Class C | CIDPX | ||
| Maura T. Murphy, CFA® | Class N | LMINX | ||
| Loomis, Sayles & Company, L.P. | Class Y | YIDPX | ||
Investment Goal
The Fund seeks current income with a secondary objective of capital appreciation.
Market Conditions
Investor preferences for riskier assets held up well during the period. U.S. high-yield bonds experienced a sustained rally, and equity markets hit all-time highs following Donald Trump’s presidential win and the surprise Republican sweep of Congress. The Federal Reserve (the Fed) raised interest rates for the second time in a decade, and Brent crude oil surged more than 23% in the face of a strong U.S. dollar rally during the fourth quarter. After experiencing short-term spikes during the bond market sell-off in February and again following the late-June Brexit vote, market volatility decreased to close out the year.
U.S. high-yield bonds represented a bright spot among global fixed-income sectors throughout the year and finished the period with solid returns. The sector benefited from the jump in oil prices, which helped strengthen credit profiles in energy and related industries. Energy-related names tended to lead the broad market in results. Meanwhile, the U.S. dollar hit a 14-year high during the fourth quarter, strengthening relative to most foreign currencies due to a combination of diverging monetary policies and concern about global trade policy following the U.S. election.
Overall, global equity markets posted solid returns for the year, primarily driven by a post-Brexit-referendum equity rally in July and another rally following the U.S. election.
Performance Results
For the 12 months ended December 31, 2016, Class A shares of the Loomis Sayles Multi-Asset Income Fund returned 10.14% at net asset value. The portfolio outperformed its primary benchmark, the Bloomberg Barclays U.S. Aggregate Bond Index, which returned 2.65%.
Explanation of Fund Performance
Exposure to U.S. and global dividend-paying equities and high-yield and investment-grade corporate bonds drove the fund’s positive performance. In addition, our exposure to bank loans, master limited partnerships (MLPs) and preferred securities aided absolute return. These gains more than offset losses from our strategies related to real estate investment trusts (REITs).
U.S. equity markets sold off through mid-February and experienced additional sharp declines after the Brexit vote and prior to the U.S. election; however, U.S. stocks rallied
1 |
Table of Contents
and finished the year strong, lifting global equities along the way. U.S. energy, telecommunications and consumer non-cyclical dividend names were top contributors in the fund. In addition, European preferred securities in the banking sector, which had suffered the most after Brexit, added to return as investors reallocated into this space.
High-yield corporate bonds boosted performance, as spreads (the difference in yield between Treasury and high-yield bonds of similar maturity) generally tightened following February’s bond market sell-off. Spreads finished the period near their tightest levels of the year. Aided by a relatively dovish Fed, positive flows into the asset class, stable oil and metals prices and a general dearth of yield, investors continued to allocate into riskier assets, pushing valuations higher. Individual telecommunications, energy and basic materials names aided fund performance the most.
The Fed’s decision to hike rates during the fourth quarter weighed on longer duration (greater price sensitivity to interest rate changes) issues, including investment-grade corporate bonds. Nevertheless, investment-grade corporates aided overall return as spreads tightened in similar fashion to high-yield bonds. Flows into corporates from outside the United States continued as the search for yield intensified on depressed government rates. Major central banks across the world maintained and even increased their accommodative stance, including the Bank of England, which began buying corporate bonds following the Brexit vote. Most of the positive contribution from investment-grade corporates came from technology, telecommunication and banking names.
The fund’s highly diversified group of bank loans also lifted return. The floating rate nature of bank loans remained attractive relative to other sectors, as investors favored the relative safety of these securities due to their senior position in the capital structure. Contributions from the transportation, telecommunication and energy sectors drove across-the-board gains in this bank loan asset class.
Foreign currency-denominated positions weighed on performance. Specifically, British pound- and euro-denominated names detracted from return. The pound and euro declined sharply versus the U.S. dollar after Brexit, and the currencies remained weak amid the diverging monetary policies between the Fed and the European Central Bank. Additionally, the U.S. presidential election had a negative impact on the Mexican peso in December, diminishing our positions denominated in the currency. Meanwhile, higher interest rates and stretched valuations weakened REIT performance. We reduced the fund’s REIT position and await a more opportunistic point of re-entry.
The fund’s portfolio turnover for the 12 months ended December 31, 2016, was significantly higher than the turnover level experienced during the prior fiscal year. The increase in turnover was primarily related to the sale of a large number of securities in January 2016. As previously reported, the fund’s investment strategy changed in August 2015; in January 2016, based on the fund’s investment strategy and our economic outlook, certain holdings were sold because we did not believe they were optimal sources of income. January was a very volatile month in the capital markets, and global growth expectations were reduced; as a result, we wanted to position the fund much more defensively. Turnover will likely remain higher going forward than it was prior to the change in the fund’s investment strategy.
| 2
Table of Contents
LOOMIS SAYLES MULTI-ASSET INCOME FUND
Outlook
Growth in the United States continued at a moderate rate, while Europe’s pace remained a bit slower. As the Fed works to normalize U.S. interest rates, we expect two rate hikes in 2017 and four additional hikes in 2018. We believe a fiscal stimulus package from the Trump administration could boost GDP growth and inflation, but not until 2018. We expect higher inflation will be primarily responsible for the accelerated pace of tightening in 2018.
We believe expectations for tax reform and pro-business policies could prolong the expansion phase of the U.S. credit cycle. Key assumptions include a measured path of rate hikes that do not create significant volatility in risk markets and continued strong foreign demand for corporate bonds. Deteriorating fundamentals remain a concern at this stage of the cycle, as companies reward equity holders at the expense of balance sheets.
Although deteriorating debt fundamentals in the emerging markets have been bottoming out, growth remains weak, and the fiscal picture has not yet improved. External balances remain mixed across countries, as winners and losers are determined by each country’s status as a commodity importer or exporter. Meanwhile, European corporate fundamentals currently remain solid and notably better than in the United States, with stable balance sheets and prudent outlooks. Mergers and acquisitions, capital spending and share repurchases remain subdued, with capital spending forecasted to be down again in 2017.
Growth of $10,000 Investment in Class A Shares4
December 31, 2006 through December 31, 2016

See notes to chart on page 5.
3 |
Table of Contents
Top Ten Holdings as of December 31, 2016
| Security Name | % of Net Assets |
|||||
| 1 | JPMorgan Alerian MLP Index ETN | 4.47 | % | |||
| 2 | ETRACS Alerian MLP Infrastructure Index ETN | 3.83 | ||||
| 3 | Consumer Discretionary Select Sector SPDR® Fund | 3.78 | ||||
| 4 | iShares® Russell 2000 ETF | 3.49 | ||||
| 5 | BNP Paribas S.A., 6.750% | 2.87 | ||||
| 6 | Gol LuxCo S.A., 1st Lien Term Loan, 6.500%, 8/31/2020 | 2.53 | ||||
| 7 | Citigroup, Inc. | 2.04 | ||||
| 8 | SPDR® S&P® Regional Banking ETF | 2.02 | ||||
| 9 | Bank of America Corp. | 2.01 | ||||
| 10 | Barclays PLC, (fixed rate to 9/15/2019, variable rate thereafter), 6.625% | 1.70 | ||||
The portfolio is actively managed and holdings are subject to change. There is no guarantee the Fund continues to invest in the securities referenced
| 4
Table of Contents
LOOMIS SAYLES MULTI-ASSET INCOME FUND
Average Annual Total Returns — December 31, 20164,5
| Life of | Expense Ratios6 | |||||||||||||||||||||||
| 1 Year | 5 Years | 10 Years | Class N | Gross | Net | |||||||||||||||||||
| Class A (Inception 11/17/05) | ||||||||||||||||||||||||
| NAV | 10.14 | % | 7.91 | % | 5.90 | % | — | % | 1.11 | % | 0.95 | % | ||||||||||||
| With 4.25% Maximum Sales Charge | 5.46 | 6.97 | 5.44 | — | ||||||||||||||||||||
| Class C (Inception 11/17/05) | ||||||||||||||||||||||||
| NAV | 9.27 | 7.09 | 5.09 | — | 1.87 | 1.70 | ||||||||||||||||||
| With CDSC2 | 8.27 | 7.09 | 5.09 | — | ||||||||||||||||||||
| Class N (Inception 8/31/15) | ||||||||||||||||||||||||
| NAV | 10.53 | — | — | 9.33 | 13.66 | 0.65 | ||||||||||||||||||
| Class Y (Inception 12/3/12)1 | ||||||||||||||||||||||||
| NAV | 10.38 | 8.03 | 5.96 | — | 0.86 | 0.70 | ||||||||||||||||||
| Comparative Performance | ||||||||||||||||||||||||
| Bloomberg Barclays U.S. Aggregate Bond Index3 | 2.65 | 2.23 | 4.34 | 2.05 | ||||||||||||||||||||
Performance data shown represents past performance and is no guarantee of, and not necessarily indicative of, future results. Total return and value will vary, and you may have a gain or loss when shares are sold. Current performance may be lower or higher than quoted. For most recent month-end performance, visit ngam.natixis.com/performance. Performance for other share classes will be greater or less than shown based on differences in fees and sales charges. You may not invest directly in an index. Performance for periods less than one year is cumulative, not annualized. Returns reflect changes in share price and reinvestment of dividends and capital gains, if any. The table(s) do not reflect taxes shareholders might owe on any fund distributions or when they redeem their shares.
| 1 | Prior to the inception of Class Y shares (12/3/2012), performance is that of Class A shares and reflects the higher net expenses of that share class. |
| 2 | Class C share performance assumes a 1.00% contingent deferred sales charge (“CDSC”) applied when you sell shares within one year of purchase. |
| 3 | The Bloomberg Barclays U.S. Aggregate Bond Index is an unmanaged index that covers the U.S.-dollar denominated, investment grade, fixed-rate, taxable bond market of SEC-registered securities. The index includes bonds from the Treasury, government-related, corporate, mortgage-backed securities, asset-backed securities, and collateralized mortgage-backed securities sectors. |
| 4 | Fund performance has been increased by fee waivers and/or expense reimbursements, if any, without which performance would have been lower. |
| 5 | Prior to the stock market close August 31, 2015, the Fund had multiple subadvisers. The performance results shown above for the periods prior to the stock market close August 31, 2015 reflect results achieved by those subadvisers using different investment strategies. |
| 6 | As of the most recent prospectus, the investment advisor has contractually agreed to waive fees and/or reimburse expenses (with certain exceptions) once the expense cap of the Fund has been exceeded. This arrangement is set to expire on 4/30/2017. When an expense cap has not been exceeded, the fund may have similar expense ratios. |
5 |
Table of Contents
MCDONNELL INTERMEDIATE MUNICIPAL BOND FUND
| Managers | Symbols | |
| Dawn Mangerson | Class A MIMAX | |
| James Grabovac, CFA® | Class C MIMCX | |
| Lawrence Jones | Class Y MIMYX | |
| Steve Wlodarski, CFA® | ||
| McDonnell Investment Management, LLC |
Investment Goal
The Fund seeks a high level of federal tax-exempt current income, consistent with the preservation of capital.
Market Conditions
Yields rose sharply during the fourth quarter of 2016, erasing the gains generated during the first half of the year and tacking an additional 17 basis points to 10-year Treasury yields for the year in total. While much of the period was characterized by calm conditions, the year was punctuated by three distinct market-jarring events. The first catalyst was the double-bottom in crude oil prices in February, which served as a bellwether for a broad recovery in risk market assets and helped reverse widening corporate spreads. Markets stabilized only to be upended with the shocking results of the Brexit referendum in June, which caused yields to plummet not only in the U.K. but across the developed market landscape. The episode seemed to indicate, at the time, the fragileness of the prevailing global interest rate structure and heightened awareness of the possibility of a further leg down in U.S. rates should the recovery falter. The effects of the Brexit vote, however, proved to be relatively short-lived in rate markets, and the adjustment was principally factored into a sharp depreciation of sterling but unexpectedly steady economic and equity market performance in the U.K. Going into November, U.S. rates were 20 to 50 basis points lower and the yield curve was flattening. But yields rose sharply and surprisingly following the election as investors quickly shifted from a scenario of flight-to-quality to flight-from-quality as the prospect of single-party government becoming re-engaged in fiscal policy after a six-year disengagement stoked expectations of potentially significant fiscal stimulus and reflation on the horizon.
| · | Treasury yields rose sharply during the quarter and ended the year modestly higher across the yield curve. |
| · | Municipals underperformed Treasuries for the year, resulting in more attractive valuations across the yield curve. |
| · | Equities rallied in the final quarter, generating gains of more than 10% for the S&P 500® overall and with gains more broadly based than the narrow market focus that characterized last year. |
| 6
Table of Contents
MCDONNELL INTERMEDIATE MUNICIPAL BOND FUND
| · | Energy markets staged a strong recovery after plunging at the start of the year. Stabilization was ultimately bolstered by an OPEC production cut agreement scheduled to take effect in January 2017. |
| · | Commodity markets recovered broadly with energy and metals leading the way with strong gains while agricultural commodities were mixed to mostly higher. |
| · | The U.S. dollar powered to new 14-year highs against the euro and more than 30-year highs against a Brexit-battered pound sterling. |
Market reactions to major political developments to date are based primarily upon expectations and will soon be tested with policy proposals and policy outcome realities. Investors will be challenged to divine how asset class valuations will fare while balancing the policy objectives of across the board tax cuts, increased infrastructure investment and maintenance of a strong social safety net in the United States that can be crafted within the framework of responsible budgeting. In the U.K., the preference to control borders must be weighed against forgoing some or all of the benefits of access to the EU single market. In addition, the policy preference favored by a narrow majority of referendum voters is faced with strong regional and generational preference for the benefits derived from the existing EU membership. Electorates across major euro-zone countries will similarly weigh in with national elections in the Netherlands, France, Germany and possibly Italy before the year is out. Populist anti-globalization movements are a factor in all of these core euro-zone countries, and many of these factions favor exiting the euro zone at a minimum or the EU entirely. Whether the EU will emerge weakened or with renewed commitment to the European project will be both interesting and potentially disquieting to observe as the year unfolds. Asia also faces geopolitical challenges as an emboldened China increasingly flexes its economic and military power across the region as it seeks to expand control of the important South China Sea shipping lanes. To date, the United States has been measured but firm in its commitment to freedom of the seas along international boundaries and not in accordance with China’s more wishful interpretation. Nevertheless, potential market flashpoints abound and, as this past year proved, investors should be prepared to expect the unexpected.
Performance Results
For the 12 months ended December 31, 2016, Class A shares of the McDonnell Intermediate Municipal Bond Fund returned -0.79% at net asset value. The Fund underperformed its benchmark, the Bloomberg Barclays 3-15 Year Blend Municipal Bond Index, which returned -0.05%.
Explanation of Fund Performance
The municipal market experienced record new issue supply of $445.8 billion, representing a near 19% increase from last year’s pace. Refunding issuance represented more than 60% of total volume while the pace of new money issuance accelerated by more than 25% versus 2015. Municipals also experienced strong investor demand for most of the year represented by more than 50 weeks of positive mutual fund flows. Furthermore, commercial bank and insurance company portfolios increased municipal exposure during the year. With respect
7 |
Table of Contents
to performance, the greatest negative impacts on Fund performance were an overweight to the 6-8 year portion of the yield curve, overweight to the higher education sector and security selection within the lease sector. Positive contributors to performance included continued spread compression in lower-quality securities within higher-yielding sectors, particularly in the intermediate portion of the yield curve. The Fund’s underweight to the AA-rated category and overweight to single A-rated securities across various sectors of the market positively influenced performance. Security selection within the hospital and special tax sectors also benefited performance, as did an overweight to the pre-refunded sector.
Outlook
Thematically, we view the economic expansion as likely to continue apace as we enter 2017. Growth appears solid, labor market gains have been steady and should provide the wherewithal to continue to fuel consumption. Capital investment has been somewhat disappointing, but global growth prospects recently appear somewhat brighter and may offer a spark for a modest uptick in business fixed investment alongside the prospect of an inventory rebuild after several quarters of decline. The potential for a positive GDP contribution from the federal government has bolstered investor confidence in recent weeks but will take shape over time and will not likely impact growth prospects over the medium term. The state and local contribution has been a more positive factor of late and has the potential to have an increasingly additive impact going forward, dependent upon the size and scope of any potential infrastructure initiative. Inflation has been drifting higher and we expect it may be less problematic for the Fed after several years of below target readings that have influenced policy. Political risk, however, appears heightened both from a geopolitical standpoint and on the domestic front. Potential global flashpoints include a series of critical national elections in the EU, increasing Russian efforts to destabilize the West, rumblings from North Korea and the unaddressed economic imbalances in China. On the domestic front, while the prospect of unified government offers the potential for newly effective economic policymaking, it also presents an opportunity for overreach and unintended consequences. While we remain optimistic on the economy, we maintain a healthy wariness of the possibility of either domestic or geopolitical missteps as we enter uncharted waters.
| 8
Table of Contents
MCDONNELL INTERMEDIATE MUNICIPAL BOND FUND
Growth of $10,000 Investment in Class A Shares4
December 31, 2012 (inception) through December 31, 2016
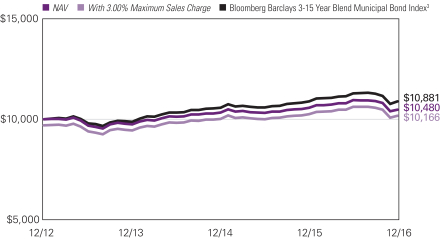
9 |
Table of Contents
Average Annual Total Returns — December 31, 20164
| Expense Ratios5 | ||||||||||||||||
| 1 Year | Life of Fund | Gross | Net | |||||||||||||
| Class A (Inception 12/31/12)1 | ||||||||||||||||
| NAV | -0.79 | % | 1.17 | % | 1.12 | % | 0.70 | % | ||||||||
| With 3.00% Maximum Sales Charge | -3.75 | 0.40 | ||||||||||||||
| Class C (Inception 12/31/12)1 | ||||||||||||||||
| NAV | -1.44 | 0.45 | 1.88 | 1.45 | ||||||||||||
| With CDSC2 | -2.42 | 0.45 | ||||||||||||||
| Class Y (Inception 12/31/12)1 | ||||||||||||||||
| NAV | -0.55 | 1.48 | 0.85 | 0.45 | ||||||||||||
| Comparative Performance | ||||||||||||||||
| Bloomberg Barclays 3-15 Year Blend Municipal Bond Index3 | -0.05 | 2.14 | ||||||||||||||
Performance data shown represents past performance and is no guarantee of, and not necessarily indicative of, future results. Total return and value will vary, and you may have a gain or loss when shares are sold. Current performance may be lower or higher than quoted. For most recent month-end performance, visit ngam.natixis.com/performance. Performance for other share classes will be greater or less than shown based on differences in fees and sales charges. You may not invest directly in an index. Performance for periods less than one year is cumulative, not annualized. Returns reflect changes in share price and reinvestment of dividends and capital gains, if any. The table(s) do not reflect taxes shareholders might owe on any fund distributions or when they redeem their shares.
| 1 | December 31, 2012 represents the date shares were first registered for public sale under the Securities Act of 1933. November 16, 2012 represents commencement of operations for accounting and financial reporting purposes only. |
| 2 | Performance for Class C shares assumes a 1.00% contingent deferred sales charge (“CDSC”) applied when you sell shares within one year of purchase. |
| 3 | Bloomberg Barclays 3-15 Year Blend Municipal Bond Index tracks the performance of municipal bonds issued after December 31, 1990 with remaining maturities between 2 and 17 years and at least $5 million in principal amount outstanding. |
| 4 | Fund performance has been increased by fee waivers and/or expense reimbursements, if any, without which performance would have been lower. |
| 5 | As of the most recent prospectus, the investment advisor has contractually agreed to waive fees and/or reimburse expenses (with certain exceptions) once the expense cap of the Fund has been exceeded. This arrangement is set to expire on 4/30/2017. When an expense cap has not been exceeded, the fund may have similar expense ratios. |
| 10
Table of Contents
NATIXIS U.S. EQUITY OPPORTUNITIES FUND
| Managers | Symbols | |
| Large Cap Value Segment | Class A NEFSX | |
| Harris Associates L.P. | Class C NECCX | |
| All Cap Growth Segment | Class Y NESYX | |
| Loomis, Sayles & Company, L.P. |
Investment Goal
The Fund seeks long-term growth of capital.
Market Conditions
Three unexpected, distinct events shaped markets in 2016. January began with a plunge related to fears regarding a growth slowdown in China, crashing oil prices and disappointing U.S. corporate earnings. In fact, U.S. markets experienced the worst 10-day start to the year in history. In June, contrary to expectations, U.K. voters opted for Brexit, the decision to leave the European Union. Prolonged uncertainty regarding the implementation of the vote and its impact on European political structures roiled the British pound. Finally, the election of Donald Trump in November, fueled a rally in U.S. stocks amid hopes that he would pare back regulation, stimulate the economy and reform the U.S. tax code. While each event had the potential to derail markets and economies, the U.S. markets ended the year on a strong note.
The U.S. Federal Reserve (the Fed) decided to increase the federal funds rate in December due to strong growth in employment, firming inflation and higher wage growth. Rate policy divergence continued as Europe, Britain and Japan pursued looser monetary policy. Oil prices stabilized as OPEC agreed to the first oil output cut in eight years. The dollar continued to strengthen versus other currencies. While the U.S. economy maintained a steady growth rate in line with averages experienced since the financial crisis, overall global growth experienced a post-crisis low.
Performance Results
For the 12 months ended December 31, 2016, Class A shares of Natixis U.S. Equity Opportunities Fund returned 11.86% at net asset value. The Fund was in line with its primary benchmark, the S&P 500® Index, which returned 11.96%. The Fund slightly underperformed its secondary benchmark, the Russell 1000® Index, which returned 12.05%.
Explanation of Fund Performance
Each of the portfolio’s segments uses a distinct investment style, providing shareholders with exposure to a variety of different stocks:
| · | The Harris Associates Large Cap Value segment invests primarily in the common stocks of larger-capitalization companies that Harris Associates believes are trading at a substantial discount to the company’s “true business value.” |
11 |
Table of Contents
| · | The Loomis, Sayles & Company All Cap Growth segment invests in equity securities, including common stocks, preferred stocks, convertible securities and warrants. This segment may invest in companies of any size. |
Both segments contributed positively to the overall return of the Fund during the year.
Harris Associates Large Cap Value Segment
As value investors with an emphasis on individual stock selection, our sector weights are a byproduct of our bottom-up process. On an absolute-return basis, shares in the energy sector gained the most value, while holdings in the consumer staples sector posted the lowest return for calendar 2016.
The leading contributor to fund performance for the year was Apache, a global oil and gas exploration company. Oil prices rebounded in 2016 after a volatile stretch. Apache has specifically benefited from solid quarterly results that have demonstrated improved capital efficiency, including a 45% decline in North American well costs compared to 2014 levels. This year, the company also announced the discovery of a new resource play in the Permian Basin called “Alpine High.” Initial results indicate that Apache has discovered a high-quality resource at a low cost. This increased our estimate of intrinsic value and also increased our confidence in management. In our view, Apache has the balance sheet and asset quality to survive continued volatility in oil and gas prices, and we like how the management team is preserving and growing per-share value during the commodity price downturn.
American Express was the largest detractor from fund performance in the calendar year. News in January 2016 that Fidelity Investments had ended its 12-year partnership with American Express negatively affected the latter. This is in addition to the skepticism lingering from the 2015 announcement that Costco would not renew its co-brand partnership with American Express. We believe these factors will cause earnings growth to slow in the short term while the company invests in marketing efforts to replace these customers, but we believe American Express’ financial fundamentals remain very healthy. Despite what we believe is favorable secular growth and superior economics, American Express is trading at a large discount to the market. Our long-term view allows us to look past the short-term disappointment of the Costco and Fidelity announcements, and see the potential lucrative long-term value of American Express’ global payment network and growing customer base.
Loomis Sayles All Cap Growth Segment
For the period, the All Cap Growth segment posted a positive absolute return. We are an active manager with a long-term, private equity approach to investing. Through our proprietary bottom-up research framework, we look to invest in those few high-quality businesses with sustainable competitive advantages and profitable growth when they trade at a significant discount to intrinsic value (our estimate of the true worth of a business, which we define as the present value of all expected future net cash flows to the company). Our holdings in the information technology, consumer discretionary, energy and
| 12
Table of Contents
NATIXIS U.S. EQUITY OPPORTUNITIES FUND
industrials sectors contributed positively to results, while holdings in the consumer staples, financials and healthcare sectors detracted from performance.
Adidas, Qualcomm and ARM Holdings were among the largest contributors during the period. A leader in global sportswear, Adidas reported strong performance. Realignment of channel and brand management globally, along with new consumer-centric innovation and marketing, spurred strong demand across categories. Adidas reported its best first and second fiscal quarters in more than a decade during the period. Sales of Adidas brand products, which represented more than 80% of sales, showed strength in the strategic markets of North America, Western Europe, Greater China, and Latin America. The company recently decided to sell its golf hardware brands, including TaylorMade, using the proceeds to strengthen its core business of sports footwear and apparel. We believe this is the right long-term strategy. Operating profit margins expanded, reflecting strong operating leverage. On October 1, 2016, new CEO Kasper Rorsted succeeded long-time CEO Herbert Hainer. One of two truly global sports footwear and apparel brands, we believe Adidas has sustainable competitive advantages, including brand, scale and distribution.
Qualcomm, a designer and manufacturer of digital telecommunication chips and services, reported better-than-expected results in its technology licensing (QTL) and chip manufacturing (QCT) businesses. Following the company’s positive settlement with China’s antitrust regulators in 2015, Qualcomm signed deals with all top smartphone manufacturers in China. Payments from newly compliant device makers in China and the resolution of a royalty dispute with South Korean device manufacturer LG contributed to QTL results. We believe these actions validate Qualcomm’s leading intellectual property and patents as well as the sustainability of the royalty business model. QTL margins were in the mid-80% range and generated approximately 80% of profits. The QCT segment had a mixed year, including losing market share at Apple. But strong customer traction for its latest chipsets allowed for improved margins throughout the year. Delivering on a priority for the year, QCT margins rose to 17% from more recent single-digit levels. In late October, the company announced a definitive agreement to acquire NXP Semiconductors, a Netherlands-based chip manufacturer focused primarily on automotive markets. The deal is expected to be completed by the end of 2017. We believe Qualcomm is well positioned to benefit from long-term secular growth in mobile devices and that market expectations embed future growth well below our estimate. We believe Qualcomm continues to sell at a meaningful discount to our estimate of intrinsic value and offers a compelling reward-to-risk opportunity.
Shares of ARM Holdings, the world’s leading semiconductor intellectual property (IP) supplier, were up nearly 40% in July on news of the all-cash acquisition by Softbank Group Corporation. Similar to our long-term thesis, Softbank recognized the fundamental drivers for ARM remain robust, as it benefits from increased chip connectivity, complexity and chip architecture outsourcing. Softbank also highlighted ARM’s rich ecosystem and innovative culture, which have allowed ARM to take market share and become dominant in the markets it enters. Softbank’s willingness to pay a greater than 40% premium on a share price already near an all-time high supports our assessment that there remained
13 |
Table of Contents
significant upside potential for the business. ARM Holdings became a privately held company when Softbank’s purchase of ARM became final on September 1, 2016. Therefore, the shares were effectively sold from the portfolio.
Conversely, Novo Nordisk, Monster Beverage and Cerner Corporation were among the largest detractors during the period. Novo Nordisk, a diabetes-focused pharmaceutical company, reported fundamentally solid growth during the period, largely due to new-generation insulin therapy Tresiba and non-insulin anti-diabetic therapy Victoza. However, shares were pressured as management issued lower-than-expected near-term guidance and meaningfully lowered its longer-term operating profit growth guidance to 5% from 10%, citing pricing pressure in the U.S., which accounts for approximately 50% of the company’s sales. We continue to believe Novo’s competitive advantages of deep experience in diabetes care and therapeutic proteins, a robust infrastructure that took decades to build, efficient manufacturing techniques, a robust pipeline and economies of scale would be very difficult to replicate. Accordingly, we believe Novo Nordisk has an unmatched ability to engineer, formulate, develop and deliver value-added treatments for unmet patient needs. We increased our position in Novo Nordisk during the fourth quarter on price weakness.
Monster Beverage, a leading marketer and distributor of energy drinks, reported solid fundamental results during the period, taking market share in its North American and international markets and consistently expanding gross margins. However, weakness in the non-alcoholic ready-to-drink market in the U.S. and short-term distribution disruptions in some international markets arising from the transition to Coca-Cola’s network had a greater-than-expected negative impact. These factors made Monster one of the largest detractors from performance. We believe the partnership with Coca-Cola’s global distribution network will create significant benefits for Monster Beverage in the longer term, creating faster market share gains and better profitability. International sales growth outpaced growth in the U.S., in line with our long-term investment thesis, and showed particular strength in the Asia Pacific, Europe, Middle East and Africa markets. Operationally, the company made substantial progress in reaching agreements with Coca-Cola distributors in Europe, Latin America, Australia, Africa and Asia, and it made its inaugural launch in China in September. During the period, Monster completed the acquisition of American Fruit and Flavors, which we believe will be accretive to gross margins and give the company control over its flavor intellectual property. We believe Monster continues to execute well on its business strategy and remains well positioned to benefit from growth in the energy drink category around the world.
Cerner, a provider of healthcare information technology solutions, reported inconsistent quarters relative to management and consensus expectations during 2016. Near-term weakness in hospital spending delayed purchase decisions as well as lower demand for its technology resale business contributed to performance. A growing portion of new bookings throughout the year (consistently more than one-third) came from outside the company’s installed client base, demonstrating net new client acquisition and competitor displacement. The company also saw traction for its population health and revenue cycle products, which were adopted by a majority of its new electronic health records clients. We believe Cerner is a high-quality company with sustainable competitive advantages. We
| 14
Table of Contents
NATIXIS U.S. EQUITY OPPORTUNITIES FUND
believe the market expectations embed long-term future growth for Cerner well below our estimate. We believe Cerner, Monster and Novo are all selling at meaningful discounts to our estimate of their intrinsic value and offer compelling reward-to-risk opportunities.
Growth of $10,000 Investment in Class A Shares4
December 31, 2006 through December 31, 2016
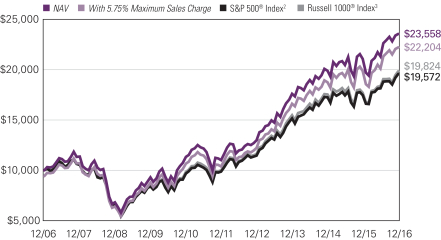
Top Ten Holdings as of December 31, 2016
| Security Name | % of Net Assets |
|||||
| 1 | Visa, Inc., Class A | 3.68 | % | |||
| 2 | Oracle Corp. | 3.50 | ||||
| 3 | Alphabet, Inc., Class A | 3.47 | ||||
| 4 | QUALCOMM, Inc. | 3.41 | ||||
| 5 | Amazon.com, Inc. | 3.32 | ||||
| 6 | Facebook, Inc., Class A | 2.78 | ||||
| 7 | Monster Beverage Corp. | 2.50 | ||||
| 8 | Citigroup, Inc. | 2.48 | ||||
| 9 | Cisco Systems, Inc. | 2.43 | ||||
| 10 | Alibaba Group Holding Ltd., Sponsored ADR | 2.25 | ||||
The portfolio is actively managed and holdings are subject to change. There is no guarantee the Fund continues to invest in the securities referenced.
15 |
Table of Contents
Average Annual Total Returns — December 31, 20164
| Expense Ratios5 | ||||||||||||||||||||
| 1 Year | 5 Years | 10 Years | Gross | Net | ||||||||||||||||
| Class A (Inception 7/7/94) | ||||||||||||||||||||
| NAV | 11.86 | % | 16.42 | % | 8.95 | % | 1.25 | % | 1.25 | % | ||||||||||
| With 5.75% Maximum Sales Charge | 5.44 | 15.04 | 8.30 | |||||||||||||||||
| Class C (Inception 7/7/94) | ||||||||||||||||||||
| NAV | 11.02 | 15.55 | 8.13 | 2.00 | 2.00 | |||||||||||||||
| With CDSC1 | 10.02 | 15.55 | 8.13 | |||||||||||||||||
| Class Y (Inception 11/15/94) | ||||||||||||||||||||
| NAV | 12.13 | 16.72 | 9.23 | 1.00 | 1.00 | |||||||||||||||
| Comparative Performance | ||||||||||||||||||||
| S&P 500® Index2 | 11.96 | 14.66 | 6.95 | |||||||||||||||||
| Russell 1000® Index3 | 12.05 | 14.69 | 7.08 | |||||||||||||||||
Performance data shown represents past performance and is no guarantee of, and not necessarily indicative of, future results. Total return and value will vary, and you may have a gain or loss when shares are sold. Current performance may be lower or higher than quoted. For most recent month-end performance, visit ngam.natixis.com/performance. Performance for other share classes will be greater or less than shown based on differences in fees and sales charges. You may not invest directly in an index. Performance for periods less than one year is cumulative, not annualized. Returns reflect changes in share price and reinvestment of dividends and capital gains, if any. The table(s) do not reflect taxes shareholders might owe on any fund distributions or when they redeem their shares.
| 1 | Performance for Class C shares assumes a 1.00% contingent deferred sales charge (“CDSC”) applied when you sell shares within one year of purchase. |
| 2 | S&P 500® Index is a widely recognized measure of U.S. stock market performance. It is an unmanaged index of 500 common stocks chosen for market size, liquidity, and industry group representation, among other factors. |
| 3 | Russell 1000® Index measures the performance of the large-cap segment of the U.S. equity universe. It is a subset of the Russell 3000® Index and includes approximately 1000 of the largest securities based on a combination of their market cap and current index membership. The Russell 1000® Index represents approximately 92% of the U.S. market and is constructed to provide a comprehensive and unbiased barometer for the large-cap segment and is completely reconstituted annually to ensure new and growing equities are reflected. |
| 4 | Fund performance has been increased by fee waivers and/or expense reimbursements, if any, without which performance would have been lower. |
| 5 | As of the most recent prospectus, the investment advisor has contractually agreed to waive fees and/or reimburse expenses (with certain exceptions) once the expense cap of the Fund has been exceeded. This arrangement is set to expire on 4/30/2017. When an expense cap has not been exceeded, the fund may have similar expense ratios. |
| 16
Table of Contents
ADDITIONAL INFORMATION
The views expressed in this report reflect those of the portfolio managers as of the dates indicated. The managers’ views are subject to change at any time without notice based on changes in market or other conditions. References to specific securities or industries should not be regarded as investment advice. Because the Funds are actively managed, there is no assurance that they will continue to invest in the securities or industries mentioned.
All investing involves risk, including the risk of loss. There is no assurance that any investment will meet its performance objectives or that losses will be avoided.
ADDITIONAL INDEX INFORMATION
This document may contain references to third party copyrights, indexes, and trademarks, each of which is the property of its respective owner. Such owner is not affiliated with Natixis Global Asset Management or any of its related or affiliated companies (collectively “NGAM”) and does not sponsor, endorse or participate in the provision of any NGAM services, funds or other financial products.
The index information contained herein is derived from third parties and is provided on an “as is” basis. The user of this information assumes the entire risk of use of this information. Each of the third party entities involved in compiling, computing or creating index information, disclaims all warranties (including, without limitation, any warranties of originality, accuracy, completeness, timeliness, non-infringement, merchantability and fitness for a particular purpose) with respect to such information.
PROXY VOTING INFORMATION
A description of the Natixis Funds’ proxy voting policies and procedures is available without charge, upon request, by calling Natixis Funds at 800-225-5478; on Natixis Funds’ website at ngam.natixis.com; and on the Securities and Exchange Commission’s (SEC) website at www.sec.gov. Information regarding how Natixis Funds voted proxies relating to portfolio securities during the most recent 12-month period ended June 30 is available from Natixis Funds’ website and the SEC’s website.
QUARTERLY PORTFOLIO SCHEDULES
Natixis Funds file a complete schedule of portfolio holdings with the SEC for the first and third quarters of each fiscal year on Form N-Q. The Funds’ Forms N-Q are available on the SEC’s website at www.sec.gov and may be reviewed and copied at the SEC’s Public Reference Room in Washington, DC. Information on the operation of the Public Reference Room may be obtained by calling 800-SEC-0330.
17 |
Table of Contents
UNDERSTANDING FUND EXPENSES
As a mutual fund shareholder, you incur different costs: transaction costs, including sales charges (loads) on purchases and contingent deferred sales charges on redemptions, and ongoing costs, including management fees, distribution and/or service fees (12b-1 fees), and other fund expenses. Certain exemptions may apply. These costs are described in more detail in the Funds’ prospectus. The following examples are intended to help you understand the ongoing costs of investing in the Funds and help you compare these with the ongoing costs of investing in other mutual funds.
The first line in the table of each class of Fund shares shows the actual account values and actual Fund expenses you would have paid on a $1,000 investment in the Fund from July 1, 2016 through December 31, 2016. To estimate the expenses you paid over the period, simply divide your account value by $1,000 (for example $8,600 account value divided by $1,000 = 8.60) and multiply the result by the number in the Expenses Paid During Period column as shown for your class.
The second line in the table for each class of Fund shares provides information about hypothetical account values and hypothetical expenses based on the Fund’s actual expense ratios and an assumed rate of return of 5% per year before expenses, which is not the Fund’s actual return. The hypothetical account values and expenses may not be used to estimate the actual ending account balance or expenses you paid on your investment for the period. You may use this information to compare the ongoing costs of investing in the Fund and other funds. To do so, compare this 5% hypothetical example with the 5% hypothetical examples that appear in the shareholder reports of the other funds.
Please note that the expenses shown reflect ongoing costs only, and do not include any transaction costs, such as sales charges. Therefore, the second line in the table of each Fund is useful in comparing ongoing costs only, and will not help you determine the relative costs of owning different funds. If transaction costs were included, total costs would be higher.
| 18
Table of Contents
| LOOMIS SAYLES MULTI-ASSET INCOME FUND |
BEGINNING ACCOUNT VALUE 7/1/2016 |
ENDING ACCOUNT VALUE 12/31/2016 |
EXPENSES PAID DURING PERIOD* 7/1/2016 – 12/31/2016 |
|||||||||
| Class A | ||||||||||||
| Actual | $1,000.00 | $1,036.40 | $4.86 | |||||||||
| Hypothetical (5% return before expenses) | $1,000.00 | $1,020.36 | $4.82 | |||||||||
| Class C | ||||||||||||
| Actual | $1,000.00 | $1,031.80 | $8.68 | |||||||||
| Hypothetical (5% return before expenses) | $1,000.00 | $1,016.59 | $8.62 | |||||||||
| Class N | ||||||||||||
| Actual | $1,000.00 | $1,038.20 | $3.33 | |||||||||
| Hypothetical (5% return before expenses) | $1,000.00 | $1,021.87 | $3.30 | |||||||||
| Class Y | ||||||||||||
| Actual | $1,000.00 | $1,037.90 | $3.59 | |||||||||
| Hypothetical (5% return before expenses) | $1,000.00 | $1,021.62 | $3.56 | |||||||||
| * | Expenses are equal to the Fund’s annualized expense ratio (after waiver/reimbursement): 0.95%, 1.70%, 0.65% and 0.70% for Class A, C, N and Y, respectively, multiplied by the average account value over the period, multiplied by the number of days in the most recent fiscal half-year (184), divided by 366 (to reflect the half-year period). |
| MCDONNELL INTERMEDIATE MUNICIPAL BOND FUND |
BEGINNING ACCOUNT VALUE 7/1/2016 |
ENDING ACCOUNT VALUE 12/31/2016 |
EXPENSES PAID DURING PERIOD* 7/1/2016 – 12/31/2016 |
|||||||||
| Class A | ||||||||||||
| Actual | $1,000.00 | $957.10 | $3.44 | |||||||||
| Hypothetical (5% return before expenses) | $1,000.00 | $1,021.62 | $3.56 | |||||||||
| Class C | ||||||||||||
| Actual | $1,000.00 | $954.50 | $7.12 | |||||||||
| Hypothetical (5% return before expenses) | $1,000.00 | $1,017.85 | $7.35 | |||||||||
| Class Y | ||||||||||||
| Actual | $1,000.00 | $958.40 | $2.22 | |||||||||
| Hypothetical (5% return before expenses) | $1,000.00 | $1,022.87 | $2.29 | |||||||||
| * | Expenses are equal to the Fund’s annualized expense ratio (after waiver/reimbursement): 0.70%, 1.45% and 0.45% for Class A, C and Y, respectively, multiplied by the average account value over the period, multiplied by the number of days in the most recent fiscal half-year (184), divided by 366 (to reflect the half-year period). |
19 |
Table of Contents
| NATIXIS U.S. EQUITY OPPORTUNITIES FUND | BEGINNING ACCOUNT VALUE 7/1/2016 |
ENDING ACCOUNT VALUE 12/31/2016 |
EXPENSES PAID DURING PERIOD* 7/1/2016 – 12/31/2016 |
|||||||||
| Class A | ||||||||||||
| Actual | $1,000.00 | $1,104.30 | $6.45 | |||||||||
| Hypothetical (5% return before expenses) | $1,000.00 | $1,019.00 | $6.19 | |||||||||
| Class C | ||||||||||||
| Actual | $1,000.00 | $1,100.50 | $10.40 | |||||||||
| Hypothetical (5% return before expenses) | $1,000.00 | $1,015.23 | $9.98 | |||||||||
| Class Y | ||||||||||||
| Actual | $1,000.00 | $1,105.70 | $5.13 | |||||||||
| Hypothetical (5% return before expenses) | $1,000.00 | $1,020.26 | $4.93 | |||||||||
| * | Expenses are equal to the Fund’s annualized expense ratio: 1.22%, 1.97% and 0.97% for Class A, C and Y, respectively, multiplied by the average account value over the period, multiplied by the number of days in the most recent fiscal half-year (184), divided by 366 (to reflect the half-year period). |
| 20
Table of Contents
Portfolio of Investments – as of December 31, 2016
Loomis Sayles Multi-Asset Income Fund
| Shares |
Description | Value (†) | ||||||
| Common Stocks — 39.1% of Net Assets | ||||||||
| Aerospace & Defense — 1.2% | ||||||||
| 1,188 | Boeing Co. (The) | $ | 184,948 | |||||
| 11,765 | United Technologies Corp. | 1,289,679 | ||||||
|
|
|
|||||||
| 1,474,627 | ||||||||
|
|
|
|||||||
| Air Freight & Logistics — 0.1% | ||||||||
| 7,124 | bpost S.A. | 168,416 | ||||||
|
|
|
|||||||
| Airlines — 0.3% | ||||||||
| 8,064 | Southwest Airlines Co. | 401,910 | ||||||
|
|
|
|||||||
| Auto Components — 0.1% | ||||||||
| 2,052 | Delphi Automotive PLC | 138,202 | ||||||
|
|
|
|||||||
| Automobiles — 0.2% | ||||||||
| 7,219 | General Motors Co. | 251,510 | ||||||
|
|
|
|||||||
| Banks — 7.2% | ||||||||
| 112,800 | Bank of America Corp. | 2,492,880 | ||||||
| 1,700 | Bank of Montreal | 122,272 | ||||||
| 1,200 | Bank of Nova Scotia | 66,817 | ||||||
| 6,863 | BB&T Corp. | 322,698 | ||||||
| 16,500 | BOC Hong Kong Holdings Ltd. | 58,766 | ||||||
| 2,200 | Canadian Imperial Bank of Commerce | 179,520 | ||||||
| 42,500 | Citigroup, Inc. | 2,525,775 | ||||||
| 13,704 | JPMorgan Chase & Co. | 1,182,518 | ||||||
| 4,500 | National Bank of Canada | 182,762 | ||||||
| 3,568 | PNC Financial Services Group, Inc. (The) | 417,313 | ||||||
| 6,803 | U.S. Bancorp | 349,470 | ||||||
| 17,764 | Wells Fargo & Co. | 978,974 | ||||||
|
|
|
|||||||
| 8,879,765 | ||||||||
|
|
|
|||||||
| Beverages — 1.4% | ||||||||
| 17,284 | Coca-Cola Co. (The) | 716,595 | ||||||
| 1,743 | Constellation Brands, Inc., Class A | 267,219 | ||||||
| 6,571 | PepsiCo, Inc. | 687,524 | ||||||
| 739 | Royal Unibrew AS | 28,494 | ||||||
|
|
|
|||||||
| 1,699,832 | ||||||||
|
|
|
|||||||
| Biotechnology — 0.2% | ||||||||
| 1,015 | AbbVie, Inc. | 63,560 | ||||||
| 1,082 | Amgen, Inc. | 158,199 | ||||||
|
|
|
|||||||
| 221,759 | ||||||||
|
|
|
|||||||
| Building Products — 0.3% | ||||||||
| 10,375 | Johnson Controls International PLC | 427,346 | ||||||
|
|
|
|||||||
| Capital Markets — 1.7% | ||||||||
| 18,247 | BGC Partners, Inc., Class A | 186,667 | ||||||
| 44,100 | Morgan Stanley | 1,863,225 | ||||||
|
|
|
|||||||
| 2,049,892 | ||||||||
|
|
|
|||||||
See accompanying notes to financial statements.
21 |
Table of Contents
Portfolio of Investments – as of December 31, 2016
Loomis Sayles Multi-Asset Income Fund – (continued)
| Shares |
Description | Value (†) | ||||||
| Chemicals — 0.8% | ||||||||
| 4,619 | E.I. du Pont de Nemours & Co. | $ | 339,035 | |||||
| 1,841 | Eastman Chemical Co. | 138,462 | ||||||
| 4,600 | Hitachi Chemical Co. Ltd. | 114,753 | ||||||
| 2,048 | LyondellBasell Industries NV, Class A | 175,677 | ||||||
| 1,527 | PPG Industries, Inc. | 144,698 | ||||||
| 2,239 | Trinseo S.A. | 132,773 | ||||||
|
|
|
|||||||
| 1,045,398 | ||||||||
|
|
|
|||||||
| Commercial Services & Supplies — 0.3% | ||||||||
| 5,764 | Intrum Justitia AB | 194,328 | ||||||
| 2,627 | Waste Management, Inc. | 186,281 | ||||||
|
|
|
|||||||
| 380,609 | ||||||||
|
|
|
|||||||
| Construction & Engineering — 0.4% | ||||||||
| 21,449 | Peab AB | 169,762 | ||||||
| 7,716 | Skanska AB | 181,668 | ||||||
| 14,000 | Taisei Corp. | 97,762 | ||||||
|
|
|
|||||||
| 449,192 | ||||||||
|
|
|
|||||||
| Construction Materials — 0.2% | ||||||||
| 24,878 | Fletcher Building Ltd. | 182,797 | ||||||
|
|
|
|||||||
| Containers & Packaging — 0.6% | ||||||||
| 8,342 | International Paper Co. | 442,626 | ||||||
| 2,111 | Packaging Corp. of America | 179,055 | ||||||
| 2,635 | WestRock Co. | 133,779 | ||||||
|
|
|
|||||||
| 755,460 | ||||||||
|
|
|
|||||||
| Distributors — 0.0% | ||||||||
| 2,800 | Canon Marketing Japan, Inc. | 47,015 | ||||||
|
|
|
|||||||
| Diversified Consumer Services — 0.2% | ||||||||
| 6,700 | Benesse Holdings, Inc. | 184,082 | ||||||
|
|
|
|||||||
| Diversified Financial Services — 0.1% | ||||||||
| 1,939 | Pargesa Holding S.A. | 126,033 | ||||||
|
|
|
|||||||
| Diversified Telecommunication Services — 1.2% | ||||||||
| 8,987 | AT&T, Inc. | 382,217 | ||||||
| 10,140 | CenturyLink, Inc. | 241,129 | ||||||
| 127,000 | HKT Trust & HKT Ltd. | 155,556 | ||||||
| 13,920 | Verizon Communications, Inc. | 743,050 | ||||||
|
|
|
|||||||
| 1,521,952 | ||||||||
|
|
|
|||||||
| Electric Utilities — 1.7% | ||||||||
| 17,500 | CLP Holdings Ltd. | 160,490 | ||||||
| 7,411 | EDP - Energias de Portugal S.A. | 22,556 | ||||||
| 8,026 | Exelon Corp. | 284,843 | ||||||
| 6,052 | FirstEnergy Corp. | 187,430 | ||||||
| 3,726 | Great Plains Energy, Inc. | 101,906 | ||||||
| 171,000 | HK Electric Investments & HK Electric Investments Ltd., 144A | 140,974 | ||||||
See accompanying notes to financial statements.
| 22
Table of Contents
Portfolio of Investments – as of December 31, 2016
Loomis Sayles Multi-Asset Income Fund – (continued)
| Shares |
Description | Value (†) | ||||||
| Electric Utilities — continued | ||||||||
| 4,883 | NextEra Energy, Inc. | $ | 583,323 | |||||
| 10,945 | PG&E Corp. | 665,128 | ||||||
|
|
|
|||||||
| 2,146,650 | ||||||||
|
|
|
|||||||
| Energy Equipment & Services — 0.2% | ||||||||
| 4,368 | Halliburton Co. | 236,265 | ||||||
|
|
|
|||||||
| Food & Staples Retailing — 0.4% | ||||||||
| 3,454 | CVS Health Corp. | 272,555 | ||||||
| 8,098 | Kroger Co. (The) | 279,462 | ||||||
|
|
|
|||||||
| 552,017 | ||||||||
|
|
|
|||||||
| Food Products — 0.8% | ||||||||
| 3,656 | B&G Foods, Inc. | 160,133 | ||||||
| 3,163 | Campbell Soup Co. | 191,267 | ||||||
| 1,277 | J.M. Smucker Co. (The) | 163,533 | ||||||
| 690 | Lamb Weston Holdings, Inc.(b) | 26,116 | ||||||
| 2,983 | Mead Johnson Nutrition Co. | 211,077 | ||||||
| 5,945 | Salmar ASA | 177,523 | ||||||
|
|
|
|||||||
| 929,649 | ||||||||
|
|
|
|||||||
| Health Care Equipment & Supplies — 0.1% | ||||||||
| 2,459 | Medtronic PLC | 175,155 | ||||||
|
|
|
|||||||
| Health Care Providers & Services — 0.2% | ||||||||
| 2,105 | Quest Diagnostics, Inc. | 193,449 | ||||||
|
|
|
|||||||
| Hotels, Restaurants & Leisure — 0.9% | ||||||||
| 1,089 | Cracker Barrel Old Country Store, Inc. | 181,841 | ||||||
| 2,331 | Darden Restaurants, Inc. | 169,510 | ||||||
| 12,873 | Hilton Worldwide Holdings, Inc. | 350,146 | ||||||
| 3,437 | McDonald’s Corp. | 418,352 | ||||||
| 269 | Vail Resorts, Inc. | 43,392 | ||||||
|
|
|
|||||||
| 1,163,241 | ||||||||
|
|
|
|||||||
| Household Durables — 0.2% | ||||||||
| 1,071 | Whirlpool Corp. | 194,676 | ||||||
|
|
|
|||||||
| Industrial Conglomerates — 2.0% | ||||||||
| 51,882 | General Electric Co. | 1,639,471 | ||||||
| 3,210 | Honeywell International, Inc. | 371,879 | ||||||
| 2,473 | Roper Technologies, Inc. | 452,757 | ||||||
|
|
|
|||||||
| 2,464,107 | ||||||||
|
|
|
|||||||
| Insurance — 1.2% | ||||||||
| 4,860 | Assured Guaranty Ltd. | 183,562 | ||||||
| 2,410 | Chubb Ltd. | 318,409 | ||||||
| 19,063 | MetLife, Inc. | 1,027,305 | ||||||
|
|
|
|||||||
| 1,529,276 | ||||||||
|
|
|
|||||||
| Internet Software & Services — 0.2% | ||||||||
| 2,293 | j2 Global, Inc. | 187,567 | ||||||
|
|
|
|||||||
See accompanying notes to financial statements.
23 |
Table of Contents
Portfolio of Investments – as of December 31, 2016
Loomis Sayles Multi-Asset Income Fund – (continued)
| Shares |
Description | Value (†) | ||||||
| IT Services — 0.9% | ||||||||
| 1,469 | Accenture PLC, Class A | $ | 172,064 | |||||
| 5,900 | ITOCHU Techno-Solutions Corp. | 153,132 | ||||||
| 3,285 | Leidos Holdings, Inc. | 167,995 | ||||||
| 964 | Paychex, Inc. | 58,688 | ||||||
| 2,111 | Science Applications International Corp. | 179,013 | ||||||
| 2,156 | Visa, Inc., Class A | 168,211 | ||||||
| 8,318 | Western Union Co. (The) | 180,667 | ||||||
|
|
|
|||||||
| 1,079,770 | ||||||||
|
|
|
|||||||
| Leisure Products — 0.1% | ||||||||
| 5,700 | Sega Sammy Holdings, Inc. | 84,702 | ||||||
|
|
|
|||||||
| Machinery — 0.4% | ||||||||
| 1,280 | Cummins, Inc. | 174,938 | ||||||
| 3,711 | Dover Corp. | 278,065 | ||||||
|
|
|
|||||||
| 453,003 | ||||||||
|
|
|
|||||||
| Media — 0.2% | ||||||||
| 4,393 | Comcast Corp., Class A | 303,337 | ||||||
|
|
|
|||||||
| Metals & Mining — 0.1% | ||||||||
| 54,952 | Centamin PLC | 93,015 | ||||||
|
|
|
|||||||
| Multi-Utilities — 0.8% | ||||||||
| 7,847 | CenterPoint Energy, Inc. | 193,350 | ||||||
| 2,619 | Consolidated Edison, Inc. | 192,968 | ||||||
| 5,818 | Sempra Energy | 585,524 | ||||||
|
|
|
|||||||
| 971,842 | ||||||||
|
|
|
|||||||
| Multiline Retail — 0.0% | ||||||||
| 387 | Target Corp. | 27,953 | ||||||
|
|
|
|||||||
| Oil, Gas & Consumable Fuels — 3.2% | ||||||||
| 4,533 | Chevron Corp. | 533,534 | ||||||
| 2,900 | Enbridge Income Fund Holdings, Inc. | 75,100 | ||||||
| 19,436 | Encana Corp. | 228,179 | ||||||
| 2,071 | EQT Corp. | 135,443 | ||||||
| 12,449 | Exxon Mobil Corp. | 1,123,647 | ||||||
| 8,545 | Golar LNG Ltd. | 196,022 | ||||||
| 2,600 | Inter Pipeline Ltd. | 57,397 | ||||||
| 13,822 | Kinder Morgan, Inc. | 286,254 | ||||||
| 51,000 | MEG Energy Corp.(b) | 350,598 | ||||||
| 2,759 | Neste OYJ | 105,580 | ||||||
| 600 | ONEOK, Inc. | 34,446 | ||||||
| 1,881 | PDC Energy, Inc.(b) | 136,523 | ||||||
| 11,200 | Range Resources Corp. | 384,832 | ||||||
| 4,501 | Valero Energy Corp. | 307,508 | ||||||
|
|
|
|||||||
| 3,955,063 | ||||||||
|
|
|
|||||||
| Pharmaceuticals — 2.7% | ||||||||
| 11,900 | Astellas Pharma, Inc. | 165,093 | ||||||
| 7,726 | Bristol-Myers Squibb Co. | 451,507 | ||||||
See accompanying notes to financial statements.
| 24
Table of Contents
Portfolio of Investments – as of December 31, 2016
Loomis Sayles Multi-Asset Income Fund – (continued)
| Shares |
Description | Value (†) | ||||||
| Pharmaceuticals — continued | ||||||||
| 8,100 | Daiichi Sankyo Co. Ltd. | $ | 165,396 | |||||
| 4,661 | Eli Lilly & Co. | 342,817 | ||||||
| 9,325 | GlaxoSmithKline PLC | 179,119 | ||||||
| 11,873 | Johnson & Johnson | 1,367,888 | ||||||
| 22,338 | Pfizer, Inc. | 725,538 | ||||||
|
|
|
|||||||
| 3,397,358 | ||||||||
|
|
|
|||||||
| REITs – Mortgage — 0.1% | ||||||||
| 10,471 | Chimera Investment Corp. | 178,216 | ||||||
|
|
|
|||||||
| Road & Rail — 0.2% | ||||||||
| 6,682 | CSX Corp. | 240,084 | ||||||
|
|
|
|||||||
| Semiconductors & Semiconductor Equipment — 1.4% | ||||||||
| 28,129 | Cypress Semiconductor Corp. | 321,796 | ||||||
| 6,869 | Intel Corp. | 249,139 | ||||||
| 4,641 | Maxim Integrated Products, Inc. | 179,003 | ||||||
| 14,189 | QUALCOMM, Inc. | 925,123 | ||||||
| 1,200 | Texas Instruments, Inc. | 87,564 | ||||||
|
|
|
|||||||
| 1,762,625 | ||||||||
|
|
|
|||||||
| Software — 1.8% | ||||||||
| 28,339 | Microsoft Corp. | 1,760,985 | ||||||
| 12,140 | Oracle Corp. | 466,783 | ||||||
|
|
|
|||||||
| 2,227,768 | ||||||||
|
|
|
|||||||
| Specialty Retail — 0.1% | ||||||||
| 3,865 | Best Buy Co., Inc. | 164,920 | ||||||
|
|
|
|||||||
| Technology Hardware, Storage & Peripherals — 0.4% | ||||||||
| 3,591 | Apple, Inc. | 415,910 | ||||||
| 1,868 | Seagate Technology PLC | 71,301 | ||||||
|
|
|
|||||||
| 487,211 | ||||||||
|
|
|
|||||||
| Thrifts & Mortgage Finance — 0.1% | ||||||||
| 7,200 | Genworth MI Canada, Inc. | 180,503 | ||||||
|
|
|
|||||||
| Tobacco — 1.4% | ||||||||
| 3,716 | Altria Group, Inc. | 251,276 | ||||||
| 3,178 | British American Tobacco PLC | 180,114 | ||||||
| 4,306 | Imperial Brands PLC | 187,658 | ||||||
| 5,401 | Philip Morris International, Inc. | 494,138 | ||||||
| 7,481 | Reynolds American, Inc. | 419,235 | ||||||
| 8,558 | Vector Group Ltd. | 194,609 | ||||||
|
|
|
|||||||
| 1,727,030 | ||||||||
|
|
|
|||||||
| Trading Companies & Distributors — 0.6% | ||||||||
| 12,800 | ITOCHU Corp. | 169,482 | ||||||
| 8,200 | Mitsubishi Corp. | 174,157 | ||||||
| 12,500 | Mitsui & Co. Ltd. | 171,279 | ||||||
| 70,000 | Sojitz Corp. | 169,481 | ||||||
|
|
|
|||||||
| 684,399 | ||||||||
|
|
|
|||||||
See accompanying notes to financial statements.
25 |
Table of Contents
Portfolio of Investments – as of December 31, 2016
Loomis Sayles Multi-Asset Income Fund – (continued)
| Shares |
Description | Value (†) | ||||||
| Transportation Infrastructure — 0.2% | ||||||||
| 2,234 | Macquarie Infrastructure Corp. | $ | 182,518 | |||||
|
|
|
|||||||
| Total Common Stocks (Identified Cost $45,566,383) |
48,379,166 | |||||||
|
|
|
|||||||
| Principal Amount (‡) |
||||||||
| Bonds and Notes — 30.9% | ||||||||
| Non-Convertible Bonds — 30.3% | ||||||||
| Banking — 12.9% | ||||||||
| $ | 610,000 | Australia & New Zealand Banking Group Ltd., (fixed rate to 6/15/2026, variable rate thereafter), 6.750%, 144A(c) | 644,542 | |||||
| 1,800,000 | Banco Bilbao Vizcaya Argentaria S.A., (fixed rate to 5/09/2018, variable rate thereafter), 9.000%(c) | 1,873,793 | ||||||
| 1,000,000 | Banco Santander S.A., (fixed rate to 5/19/2019, variable rate thereafter), 6.375%(c) | 928,960 | ||||||
| 2,250,000 | Barclays PLC, (fixed rate to 9/15/2019, variable rate thereafter), 6.625%(c) | 2,106,837 | ||||||
| 3,600,000 | BNP Paribas S.A., (fixed rate to 3/14/2022, variable rate thereafter), 6.750%, 144A(c) | 3,550,500 | ||||||
| 1,150,000 | BNP Paribas S.A., (fixed rate to 3/30/2021, variable rate thereafter), 7.625%, 144A(c) | 1,213,365 | ||||||
| 1,550,000 | Lloyds Banking Group PLC, (fixed rate to 6/27/2024, variable rate thereafter), 7.500%(c) | 1,596,500 | ||||||
| 1,200,000 | Royal Bank of Scotland Group PLC, (fixed rate to 8/15/2021, variable rate thereafter), 8.625%(c) | 1,224,000 | ||||||
| 610,000 | Societe Generale S.A., 4.250%, 8/19/2026, 144A | 589,183 | ||||||
| 1,200,000 | Standard Chartered PLC, (fixed rate to 4/02/2020, variable rate thereafter), 6.500%, 144A(c) | 1,095,540 | ||||||
| 1,140,000 | UBS Group AG, (fixed rate to 8/07/2025, variable rate thereafter), 6.875%(c) | 1,126,557 | ||||||
|
|
|
|||||||
| 15,949,777 | ||||||||
|
|
|
|||||||
| Cable Satellite — 0.6% | ||||||||
| 600,000 | DISH DBS Corp., 7.750%, 7/01/2026 | 676,500 | ||||||
|
|
|
|||||||
| Chemicals — 1.6% | ||||||||
| 650,000 | Hercules LLC, 6.500%, 6/30/2029 | 631,312 | ||||||
| 350,000 | Hexion, Inc., 8.875%, 2/01/2018 | 348,250 | ||||||
| 1,000,000 | Koppers, Inc., 7.875%, 12/01/2019 | 1,013,750 | ||||||
|
|
|
|||||||
| 1,993,312 | ||||||||
|
|
|
|||||||
| Electric — 1.3% | ||||||||
| 600,000 | Dynegy, Inc., 5.875%, 6/01/2023 | 520,500 | ||||||
| 670,000 | Dynegy, Inc., 8.000%, 1/15/2025, 144A | 628,125 | ||||||
| 435,000 | NRG Energy, Inc., 7.250%, 5/15/2026, 144A | 432,825 | ||||||
|
|
|
|||||||
| 1,581,450 | ||||||||
|
|
|
|||||||
| Finance Companies — 0.5% | ||||||||
| 295,000 | Cia Latinoamericana de Infraestructura & Servicios S.A., 9.500%, 7/20/2023, 144A | 286,150 | ||||||
See accompanying notes to financial statements.
| 26
Table of Contents
Portfolio of Investments – as of December 31, 2016
Loomis Sayles Multi-Asset Income Fund – (continued)
| Principal Amount (‡) |
Description | Value (†) | ||||||
| Finance Companies — continued | ||||||||
| $ | 395,000 | Mexico City Airport Trust, 4.250%, 10/31/2026, 144A | $ | 387,100 | ||||
|
|
|
|||||||
| 673,250 | ||||||||
|
|
|
|||||||
| Food & Beverage — 0.5% | ||||||||
| 635,000 | Marfrig Holdings Europe BV, 8.000%, 6/08/2023, 144A | 656,431 | ||||||
|
|
|
|||||||
| Government Owned – No Guarantee — 1.0% | ||||||||
| 1,150,000 | Petrobras Global Finance BV, 8.750%, 5/23/2026 | 1,240,563 | ||||||
|
|
|
|||||||
| Independent Energy — 0.7% | ||||||||
| 300,000 | MEG Energy Corp., 6.375%, 1/30/2023, 144A | 267,000 | ||||||
| 710,000 | MEG Energy Corp., 7.000%, 3/31/2024, 144A | 642,550 | ||||||
|
|
|
|||||||
| 909,550 | ||||||||
|
|
|
|||||||
| Metals & Mining — 0.9% | ||||||||
| 1,020,000 | Freeport-McMoRan, Inc., 6.750%, 2/01/2022, 144A | 1,048,050 | ||||||
|
|
|
|||||||
| Midstream — 0.8% | ||||||||
| 465,000 | Plains All American Pipeline LP/PAA Finance Corp., 6.650%, 1/15/2037 | 507,536 | ||||||
| 485,000 | Western Refining Logistics LP/WNRL Finance Corp., 7.500%, 2/15/2023 | 523,800 | ||||||
|
|
|
|||||||
| 1,031,336 | ||||||||
|
|
|
|||||||
| Non-Agency Commercial Mortgage-Backed Securities — 0.3% | ||||||||
| 370,000 | Commercial Mortgage Trust, Series 2016-SAVA, Class C, 3.704%, 10/15/2034, 144A(d) |
370,873 | ||||||
|
|
|
|||||||
| Oil Field Services — 1.6% | ||||||||
| 530,000 | Noble Holding International Ltd., 6.050%, 3/01/2041 | 365,700 | ||||||
| 385,000 | Noble Holding International Ltd., 7.200%, 4/01/2025 | 360,938 | ||||||
| 900,000 | Transocean, Inc., 6.000%, 3/15/2018 | 911,250 | ||||||
| 455,000 | Transocean, Inc., 6.800%, 3/15/2038 | 352,625 | ||||||
|
|
|
|||||||
| 1,990,513 | ||||||||
|
|
|
|||||||
| Packaging — 0.4% | ||||||||
| 540,000 | ARD Finance S.A., PIK, 7.125%, 9/15/2023, 144A(e) | 533,250 | ||||||
|
|
|
|||||||
| Property & Casualty Insurance — 0.4% | ||||||||
| 565,000 | Old Republic International Corp., 3.875%, 8/26/2026 | 537,436 | ||||||
|
|
|
|||||||
| Sovereigns — 0.4% | ||||||||
| 485,000 | Republic of Argentina, 7.500%, 4/22/2026, 144A | 509,061 | ||||||
|
|
|
|||||||
| Technology — 1.4% | ||||||||
| 75,000 | Diamond 1 Finance Corp./Diamond 2 Finance Corp., 7.125%, 6/15/2024, 144A | 83,263 | ||||||
| 410,000 | Diamond 1 Finance Corp./Diamond 2 Finance Corp., 8.100%, 7/15/2036, 144A | 487,729 | ||||||
| 290,000 | Diamond 1 Finance Corp./Diamond 2 Finance Corp., 8.350%, 7/15/2046, 144A | 357,074 | ||||||
| 675,000 | Western Digital Corp., 10.500%, 4/01/2024, 144A | 798,187 | ||||||
|
|
|
|||||||
| 1,726,253 | ||||||||
|
|
|
|||||||
| Treasuries — 0.9% | ||||||||
| 4,300(††) | Brazil Notas do Tesouro Nacional, Series F, 10.000%, 1/01/2027, (BRL) | 1,154,265 | ||||||
|
|
|
|||||||
| Wireless — 0.8% | ||||||||
| 900,000 | Sprint Corp., 7.250%, 9/15/2021 | 956,250 | ||||||
|
|
|
|||||||
See accompanying notes to financial statements.
27 |
Table of Contents
Portfolio of Investments – as of December 31, 2016
Loomis Sayles Multi-Asset Income Fund – (continued)
| Principal Amount (‡) |
Description | Value (†) | ||||||
| Wirelines — 3.3% | ||||||||
| $ | 380,000 | CenturyLink, Inc., Series P, 7.600%, 9/15/2039 | $ | 331,550 | ||||
| 385,000 | Cincinnati Bell, Inc., 7.000%, 7/15/2024, 144A | 407,138 | ||||||
| 1,355,000 | Frontier Communications Corp., 8.875%, 9/15/2020 | 1,443,075 | ||||||
| 920,000 | Frontier Communications Corp., 10.500%, 9/15/2022 | 967,196 | ||||||
| 910,000 | Qwest Corp., 6.875%, 9/15/2033 | 868,878 | ||||||
|
|
|
|||||||
| 4,017,837 | ||||||||
|
|
|
|||||||
| Total Non-Convertible Bonds (Identified Cost $36,446,020) |
37,555,957 | |||||||
|
|
|
|||||||
| Convertible Bonds — 0.6% | ||||||||
| Cable Satellite — 0.6% | ||||||||
| 610,000 | Dish Network Corp., 3.375%, 8/15/2026, 144A (Identified Cost $642,766) |
694,256 | ||||||
|
|
|
|||||||
| Total Bonds and Notes (Identified Cost $37,088,786) |
38,250,213 | |||||||
|
|
|
|||||||
| Shares | ||||||||
| Exchange-Traded Funds and Notes — 17.6% | ||||||||
| 57,500 | Consumer Discretionary Select Sector SPDR® Fund | 4,680,500 | ||||||
| 167,000 | ETRACS Alerian MLP Infrastructure Index ETN | 4,744,470 | ||||||
| 32,000 | iShares® Russell 2000 ETF | 4,315,200 | ||||||
| 175,000 | JPMorgan Alerian MLP Index ETN | 5,531,750 | ||||||
| 45,000 | SPDR® S&P® Regional Banking ETF | 2,500,650 | ||||||
|
|
|
|||||||
| Total Exchange-Traded Funds (Identified Cost $21,028,295) |
21,772,570 | |||||||
|
|
|
|||||||
| Principal Amount (‡) |
||||||||
| Senior Loans — 7.2% | ||||||||
| Airlines — 2.5% | ||||||||
| $ | 3,063,636 | Gol LuxCo S.A., 1st Lien Term Loan, 6.500%, 8/31/2020(d) | 3,128,738 | |||||
|
|
|
|||||||
| Building Materials — 0.1% | ||||||||
| 90,000 | Quikrete Holdings, Inc., 2016 1st Lien Term Loan, 11/15/2023(f) | 90,825 | ||||||
|
|
|
|||||||
| Chemicals — 1.0% | ||||||||
| 260,833 | Chromaflo Technologies Corp., Term Loan B1, 5.000%, 11/18/2023(d) | 262,628 | ||||||
| 339,167 | Chromaflo Technologies Corp., Term Loan B2, 5.000%, 11/18/2023(d) | 341,500 | ||||||
| 600,000 | Kraton Polymers LLC, Term Loan B, 1/06/2022(f) | 606,324 | ||||||
|
|
|
|||||||
| 1,210,452 | ||||||||
|
|
|
|||||||
| Electric — 0.9% | ||||||||
| 1,060,000 | Dynegy, Inc., Escrow, 5.000%, 6/27/2023(d) | 1,072,805 | ||||||
|
|
|
|||||||
| Independent Energy — 0.3% | ||||||||
| 392,811 | Chesapeake Energy Corp., Term Loan, 8.500%, 8/23/2021(d) | 427,017 | ||||||
|
|
|
|||||||
| Media Entertainment — 0.5% | ||||||||
| 598,500 | Camelot UK Holdco Ltd., Term Loan B, 10/03/2023(f) | 605,108 | ||||||
|
|
|
|||||||
See accompanying notes to financial statements.
| 28
Table of Contents
Portfolio of Investments – as of December 31, 2016
Loomis Sayles Multi-Asset Income Fund – (continued)
| Principal Amount (‡) |
Description | Value (†) | ||||||
| Retailers — 0.5% | ||||||||
| $ | 600,000 | PetSmart, Inc., Term Loan B2, 3/11/2022(f) | $ | 601,500 | ||||
|
|
|
|||||||
| Technology — 1.4% | ||||||||
| 1,715,000 | Dell, Inc., 2016 Term Loan B, 4.020%, 9/07/2023(d) | 1,743,246 | ||||||
|
|
|
|||||||
| Total Senior Loans (Identified Cost $8,675,370) |
8,879,691 | |||||||
|
|
|
|||||||
| Shares | ||||||||
| Preferred Stocks — 1.7% | ||||||||
| Banking — 1.3% | ||||||||
| 64,000 | Bank of America Corp., Series CC, 6.200% | 1,616,640 | ||||||
|
|
|
|||||||
| Consumer Cyclical Services — 0.4% | ||||||||
| 22,000 | eBay, Inc., 6.000% | 570,680 | ||||||
|
|
|
|||||||
| Total Preferred Stocks (Identified Cost $2,150,000) |
2,187,320 | |||||||
|
|
|
|||||||
| Principal Amount (‡) |
||||||||
| Short-Term Investments — 4.8% | ||||||||
| $ | 5,916,420 | Tri-Party Repurchase Agreement with Fixed Income Clearing Corporation, dated 12/30/2016 at 0.030% to be repurchased at $5,916,440 on 1/03/2017 collateralized by $6,210,000 U.S. Treasury Note, 2.000% due 8/15/2025 valued at $6,038,846 including accrued interest (Note 2 of Notes to Financial Statements) (Identified Cost $5,916,420) | 5,916,420 | |||||
|
|
|
|||||||
| Total Investments — 101.3% (Identified Cost $120,425,254)(a) |
125,385,380 | |||||||
| Other assets less liabilities — (1.3)% | (1,612,070 | ) | ||||||
|
|
|
|||||||
| Net Assets — 100.0% | $ | 123,773,310 | ||||||
|
|
|
|||||||
| (‡) | Principal Amount stated in U.S. dollars unless otherwise noted. | |||||||
| (†) | See Note 2 of Notes to Financial Statements. | |||||||
| (††) | Amount shown represents units. One unit represents a principal amount of 1,000. | |||||||
| (a) | Federal Tax Information: | |||||||
| At December 31, 2016, the net unrealized appreciation on investments based on a cost of $121,213,741 for federal income tax purposes was as follows: | ||||||||
| Aggregate gross unrealized appreciation for all investments in which there is an excess of value over tax cost | $ | 5,223,132 | ||||||
| Aggregate gross unrealized depreciation for all investments in which there is an excess of tax cost over value | (1,051,493 | ) | ||||||
|
|
|
|||||||
| Net unrealized appreciation | $ | 4,171,639 | ||||||
|
|
|
|||||||
| (b) | Non-income producing security. | |||||||
| (c) | Perpetual bond with no specified maturity date. | |||||||
See accompanying notes to financial statements.
29 |
Table of Contents
Portfolio of Investments – as of December 31, 2016
Loomis Sayles Multi-Asset Income Fund – (continued)
| (d) | Variable rate security. Rate as of December 31, 2016 is disclosed. | |||||||
| (e) | Payment-in-kind security for which the issuer has the option at each interest payment date of making interest payments in cash or additional debt securities. For the period ended December 31, 2016, interest payments were made in cash. | |||||||
| (f) | Position is unsettled. Contract rate was not determined at December 31, 2016 and does not take effect until settlement date. Maturity date is not finalized until settlement date. | |||||||
| 144A | All or a portion of these securities are exempt from registration under Rule 144A of the Securities Act of 1933. These securities may be resold in transactions exempt from registration, normally to qualified institutional buyers. At December 31, 2016, the value of Rule 144A holdings amounted to $15,823,166 or 12.8% of net assets. | |||||||
| ETF | Exchange-Traded Fund | |||||||
| ETN | Exchange-Traded Note | |||||||
| PIK | Payment-in-Kind | |||||||
| REITs | Real Estate Investment Trusts | |||||||
| BRL | Brazilian Real | |||||||
Industry Summary at December 31, 2016
| Exchange-Traded Funds |
17.6 | % | ||
| Banking |
14.2 | |||
| Banks |
7.2 | |||
| Chemicals |
3.4 | |||
| Wirelines |
3.3 | |||
| Oil, Gas & Consumable Fuels |
3.2 | |||
| Airlines |
2.8 | |||
| Technology |
2.8 | |||
| Pharmaceuticals |
2.7 | |||
| Electric |
2.2 | |||
| Industrial Conglomerates |
2.0 | |||
| Other Investments, less than 2% each |
35.1 | |||
| Short-Term Investments |
4.8 | |||
|
|
|
|||
| Total Investments |
101.3 | |||
| Other assets less liabilities |
(1.3 | ) | ||
|
|
|
|||
| Net Assets |
100.0 | % | ||
|
|
|
See accompanying notes to financial statements.
| 30
Table of Contents
Portfolio of Investments – as of December 31, 2016
McDonnell Intermediate Municipal Bond Fund
| Principal Amount |
Description | Value (†) | ||||||
| Bonds and Notes — 100.8% of Net Assets | ||||||||
| Municipals — 100.8% | ||||||||
| Arkansas — 2.3% | ||||||||
| $ | 750,000 | Arizona Board of Regents, State University System Revenue, Refunding, Series A, 5.000%, 7/01/2024 | $ | 888,578 | ||||
| 400,000 | Pulaski County Hospital Revenue, Arkansas Children’s Hospital, Refunding, 5.000%, 3/01/2024 | 466,560 | ||||||
|
|
|
|||||||
| 1,355,138 | ||||||||
|
|
|
|||||||
| California — 5.7% | ||||||||
| 250,000 | Alameda Corridor Transportation Authority Revenue, Senior Lien, Refunding, Series A, 5.000%, 10/01/2024 | 288,868 | ||||||
| 380,000 | Bay Area Water Supply & Conservation Agency Revenue, Series A, 5.000%, 10/01/2024 | 441,940 | ||||||
| 485,000 | California School Finance Authority Revenue, Aspire Public Schools Obligated Group, Refunding, 5.000%, 8/01/2027 | 526,870 | ||||||
| 700,000 | Garden Grove Unified School District, 2010 Election, GO, Series C, 5.000%, 8/01/2035 | 782,488 | ||||||
| 400,000 | Los Angeles Harbor Department Revenue, Refunding, Series A, AMT, 5.000%, 8/01/2036 | 440,436 | ||||||
| 760,000 | San Gorgonio Memorial Health Care District, GO, Refunding, 5.000%, 8/01/2024 | 888,037 | ||||||
|
|
|
|||||||
| 3,368,639 | ||||||||
|
|
|
|||||||
| Colorado — 6.0% | ||||||||
| 1,000,000 | Adams & Weld Counties School District No. 27J Brighton, GO, (State Aid Withholding), 5.000%, 12/01/2028 | 1,187,930 | ||||||
| 260,000 | Colorado Springs Utilities System Revenue, Series B-2, 5.000%, 11/15/2033 | 298,797 | ||||||
| 400,000 | Colorado State Health Facilities Authority Revenue, Craig Hospital Project, 5.000%, 12/01/2028 | 443,220 | ||||||
| 400,000 | Denver City & County School District No. 1, GO, Series B, (State Aid Withholding), 5.000%, 12/01/2026 | 466,036 | ||||||
| 500,000 | Regional Transportation District Sales Tax Revenue, Fastracks Project, Refunding, Series A, 5.000%, 11/01/2028 | 609,480 | ||||||
| 450,000 | University of Colorado Revenue, Refunding, Series B, 5.000%, 6/01/2019 | 487,625 | ||||||
|
|
|
|||||||
| 3,493,088 | ||||||||
|
|
|
|||||||
| District of Columbia — 1.5% | ||||||||
| 800,000 | District of Columbia Water & Sewer Authority Public Utility Revenue, Prerefunded 10/01/2018@100, Series A, 5.000%, 10/01/2024 | 852,144 | ||||||
|
|
|
|||||||
| Florida — 16.3% | ||||||||
| 500,000 | Fernandina Beach Utility System Revenue, Refunding, Series A, 5.000%, 9/01/2027 | 567,330 | ||||||
| 1,000,000 | Florida Municipal Power Agency, Refunding, Series A, 5.000%, 10/01/2028 | 1,188,230 | ||||||
| 400,000 | Florida State Board of Governors, University System Improvement Revenue, Refunding, Series A, 5.000%, 7/01/2018 | 422,120 | ||||||
| 1,000,000 | Lee County Transportation Facilities Revenue, Refunding, (AGM insured), 5.000%, 10/01/2022 | 1,153,650 | ||||||
| 750,000 | Miami-Dade County Aviation Revenue, Refunding, Series A, AMT, 5.000%, 10/01/2017 | 771,000 | ||||||
See accompanying notes to financial statements.
31 |
Table of Contents
Portfolio of Investments – as of December 31, 2016
McDonnell Intermediate Municipal Bond Fund – (continued)
| Principal Amount |
Description | Value (†) | ||||||
| Florida — continued | ||||||||
| $ | 1,000,000 | Miami-Dade County Water & Sewer System Revenue, Refunding, 5.000%, 10/01/2023 | $ | 1,161,530 | ||||
| 400,000 | Orlando & Orange County Expressway Authority Revenue, Refunding, 5.000%, 7/01/2023 | 451,212 | ||||||
| 1,000,000 | Orlando & Orange County Expressway Authority, Refunding, (AGM insured), 5.000%, 7/01/2024 | 1,126,390 | ||||||
| 1,000,000 | Osceola County Sales Tax Revenue, Refunding, Series A, 5.000%, 10/01/2033 | 1,128,910 | ||||||
| 600,000 | Sarasota County Infrastructure Sales Surtax Revenue, Refunding, 5.000%, 10/01/2022 | 687,654 | ||||||
| 400,000 | Sarasota County Utility System Revenue, 5.000%, 10/01/2023 | 468,140 | ||||||
| 400,000 | Volusia County Educational Facility Authority Revenue, Embry-Riddle Aeronautical University, Inc., Series B, 5.000%, 10/15/2025 | 463,320 | ||||||
|
|
|
|||||||
| 9,589,486 | ||||||||
|
|
|
|||||||
| Georgia — 4.3% | ||||||||
| 500,000 | Municipal Electric Authority of Georgia Revenue, Series B, 5.000%, 1/01/2021 | 557,435 | ||||||
| 1,500,000 | Municipal Electric Authority of Georgia Revenue, Project One Subordinated Bonds, Refunding, Series A, 5.000%, 1/01/2032 | 1,700,310 | ||||||
| 250,000 | Savannah Hospital Authority Revenue, St. Joseph’s/Candler Health System Obligated Group, Series A, 5.500%, 7/01/2027 | 293,032 | ||||||
|
|
|
|||||||
| 2,550,777 | ||||||||
|
|
|
|||||||
| Illinois — 6.1% | ||||||||
| 210,000 | Chicago O’Hare International Airport, General Revenue, Refunding, Series C, AMT, 5.000%, 1/01/2022 | 231,166 | ||||||
| 1,000,000 | Chicago O’Hare International Airport, Revenue, Series D, 5.000%, 1/01/2026 | 1,149,560 | ||||||
| 100,000 | Illinois Finance Authority Revenue, Art Institute of Chicago (The), Refunding, 5.000%, 3/01/2025 | 116,176 | ||||||
| 210,000 | Illinois Finance Authority Revenue, Art Institute of Chicago (The), Refunding, 5.000%, 3/01/2024 | 242,411 | ||||||
| 370,000 | Illinois Finance Authority Revenue, Children’s Memorial Hospital, Series B, 5.500%, 8/15/2028 | 391,634 | ||||||
| 500,000 | Illinois Finance Authority Revenue, Loyola University Chicago, Series B, 5.000%, 7/01/2020 | 551,730 | ||||||
| 100,000 | Illinois Finance Authority Revenue, Loyola University Chicago, Series B, 5.000%, 7/01/2021 | 112,088 | ||||||
| 700,000 | Will County Forest Preservation District, GO, Refunding, Series A, 5.000%, 12/15/2020 | 780,668 | ||||||
|
|
|
|||||||
| 3,575,433 | ||||||||
|
|
|
|||||||
| Indiana — 1.7% | ||||||||
| 405,000 | Greenfield Middle School Building Corp. Revenue, 1st Mortgage, Refunding, 5.000%, 1/15/2020 | 445,160 | ||||||
| 500,000 | Indianapolis Local Public Improvement Bond Bank Revenue, Indianapolis Airport Authority, Refunding, Series A1, AMT, 5.000%, 1/01/2023 | 570,620 | ||||||
|
|
|
|||||||
| 1,015,780 | ||||||||
|
|
|
|||||||
See accompanying notes to financial statements.
| 32
Table of Contents
Portfolio of Investments – as of December 31, 2016
McDonnell Intermediate Municipal Bond Fund – (continued)
| Principal Amount |
Description | Value (†) | ||||||
| Iowa — 1.5% | ||||||||
| $ | 335,000 | Xenia Rural Water District Revenue, Capital Loan Notes, Refunding, 5.000%, 12/01/2022 | $ | 373,498 | ||||
| 450,000 | Xenia Rural Water District Revenue, Capital Loan Notes, Refunding, 5.000%, 12/01/2023 | 504,851 | ||||||
|
|
|
|||||||
| 878,349 | ||||||||
|
|
|
|||||||
| Kansas — 1.4% | ||||||||
| 720,000 | Sedgwick County Unified School District No. 265 Goddard, GO, Refunding, Series B, 4.000%, 10/01/2022 | 791,942 | ||||||
|
|
|
|||||||
| Kentucky — 0.6% | ||||||||
| 325,000 | Louisville & Jefferson County Metropolitan Government Health System Revenue, Norton Healthcare, Inc. Obligated Group, Refunding, Series A, 5.000%, 10/01/2020 | 354,062 | ||||||
|
|
|
|||||||
| Massachusetts — 1.0% | ||||||||
| 400,000 | Massachusetts State Development Finance Agency Revenue, Emerson College, Series A, 5.000%, 1/01/2023 | 441,480 | ||||||
| 150,000 | Massachusetts State Development Finance Agency Revenue, Massachusetts College of Pharmacy Allied Health Science, Series F, 4.000%, 7/01/2018 | 155,840 | ||||||
|
|
|
|||||||
| 597,320 | ||||||||
|
|
|
|||||||
| Minnesota — 0.4% | ||||||||
| 250,000 | Minneapolis-St. Paul Metropolitan Airports Commission Revenue, Refunding, 5.000%, 1/01/2017 | 250,000 | ||||||
|
|
|
|||||||
| Missouri — 3.8% | ||||||||
| 700,000 | Missouri Joint Municipal Electric Utility Commission Power Project Revenue, Refunding, 5.000%, 1/01/2024 | 805,763 | ||||||
| 1,250,000 | Missouri Joint Municipal Electric Utility Commission Power Project Revenue, Refunding, Series A, 5.000%, 12/01/2034 | 1,397,000 | ||||||
|
|
|
|||||||
| 2,202,763 | ||||||||
|
|
|
|||||||
| Nebraska — 2.9% | ||||||||
| 1,000,000 | Metropolitan Utilities District of Omaha Revenue, System Improvements, Refunding, 5.000%, 12/01/2022 | 1,153,650 | ||||||
| 500,000 | Nebraska Public Power District, General Revenue, Refunding, Series A, 5.000%, 1/01/2028 | 556,300 | ||||||
|
|
|
|||||||
| 1,709,950 | ||||||||
|
|
|
|||||||
| Nevada — 1.0% | ||||||||
| 500,000 | City of Henderson, GO, Various Purpose, Refunding, 5.000%, 6/01/2026 | 587,710 | ||||||
|
|
|
|||||||
| New Jersey — 5.3% | ||||||||
| 265,000 | New Jersey Health Care Facilities Financing Authority Revenue, Refunding, Virtual Health, Inc., 5.000%, 7/01/2023 | 304,114 | ||||||
| 500,000 | New Jersey State Turnpike Authority Revenue, Series A, 5.000%, 1/01/2032 | 563,055 | ||||||
| 1,500,000 | New Jersey State Turnpike Authority Revenue, Series E, 5.000%, 1/01/2032 | 1,689,000 | ||||||
| 500,000 | Rutgers The State University of New Jersey, Refunding, Series J, 5.000%, 5/01/2024 | 578,360 | ||||||
|
|
|
|||||||
| 3,134,529 | ||||||||
|
|
|
|||||||
See accompanying notes to financial statements.
33 |
Table of Contents
Portfolio of Investments – as of December 31, 2016
McDonnell Intermediate Municipal Bond Fund – (continued)
| Principal Amount |
Description | Value (†) | ||||||
| New Mexico — 1.0% | ||||||||
| $ | 500,000 | New Mexico Hospital Equipment Loan Council Revenue, Presbyterian Healthcare Services Obligated Group, Refunding, 5.000%, 8/01/2031 | $ | 571,425 | ||||
|
|
|
|||||||
| New York — 1.8% | ||||||||
| 1,000,000 | Port Authority of New York & New Jersey Revenue, 195th Series, Refunding, AMT, 5.000%, 10/01/2019 | 1,084,560 | ||||||
|
|
|
|||||||
| Ohio — 5.6% | ||||||||
| 400,000 | American Municipal Power Revenue, Hydroelectric Projects, Refunding, Series CA, (AGM insured), 5.000%, 2/15/2021 | 441,236 | ||||||
| 250,000 | American Municipal Power, Inc. Revenue, Greenup Hydroelectric Project, Series A, 5.000%, 2/15/2028 | 288,517 | ||||||
| 250,000 | American Municipal Power, Inc. Revenue, Meldahl Hydroelectric Project, Green Bond, Series A, 5.000%, 2/15/2022 | 282,240 | ||||||
| 500,000 | Columbus, GO, Various Purpose, Series A, 5.000%, 8/15/2023 | 592,110 | ||||||
| 500,000 | Hamilton County Hospital Facilities Revenue, UC Health Obligated Group, 5.000%, 2/01/2024 |
574,270 | ||||||
| 500,000 | Ohio State Higher Educational Facility Commission Revenue, University of Dayton, 5.000%, 12/01/2030 | 562,665 | ||||||
| 500,000 | Scioto County Hospital Revenue, Southern Ohio Medical Center Obligated Group, Refunding, 5.000%, 2/15/2030 | 568,085 | ||||||
|
|
|
|||||||
| 3,309,123 | ||||||||
|
|
|
|||||||
| Pennsylvania — 1.1% | ||||||||
| 335,000 | Delaware County Authority Revenue, Villanova University, 5.000%, 8/01/2019 | 362,262 | ||||||
| 285,000 | Delaware River Joint Toll Bridge Commission Revenue, Refunding, Series A, 4.000%, 7/01/2027 | 303,183 | ||||||
|
|
|
|||||||
| 665,445 | ||||||||
|
|
|
|||||||
| Rhode Island — 3.0% | ||||||||
| 500,000 | Rhode Island Clean Water Finance Agency Pollution Control Agency Revolving Fund-Pooled Loan, Series A, 5.000%, 10/01/2024 | 593,075 | ||||||
| 1,000,000 | Rhode Island Turnpike & Bridge Authority Motor Fuel Tax Revenue, Refunding, Series A, 5.000%, 10/01/2033 | 1,137,800 | ||||||
|
|
|
|||||||
| 1,730,875 | ||||||||
|
|
|
|||||||
| South Dakota — 0.8% | ||||||||
| 465,000 | Sioux Falls Sales Tax Revenue, Series A-1, 4.750%, 11/15/2036 | 477,792 | ||||||
|
|
|
|||||||
| Tennessee — 2.2% | ||||||||
| 500,000 | Metropolitan Government Nashville & Davidson County Health & Educational Facilities Board Revenue, Vanderbilt University Medical Center Obligated Group, Series A, 5.000%, 7/01/2030 | 560,970 | ||||||
| 615,000 | Metropolitan Nashville Airport Authority (The) Revenue, Series B, AMT, 5.000%, 7/01/2023 | 700,245 | ||||||
|
|
|
|||||||
| 1,261,215 | ||||||||
|
|
|
|||||||
| Texas — 10.9% | ||||||||
| 700,000 | City of Denton, GO, Refunding, 5.000%, 2/15/2024 | 821,814 | ||||||
| 500,000 | Harris County Health Facilities Development Authority Revenue, Memorial Hermann Healthcare System, Prerefunded 12/01/2018@100, Series B, 7.125%, 12/01/2031 | 553,730 | ||||||
See accompanying notes to financial statements.
| 34
Table of Contents
Portfolio of Investments – as of December 31, 2016
McDonnell Intermediate Municipal Bond Fund – (continued)
| Principal Amount |
Description | Value (†) | ||||||
| Texas — continued | ||||||||
| $ | 1,000,000 | Houston Higher Education Finance Corp. Revenue, Harmony Public School, Refunding, Series A, (PSF-GTD), 5.000%, 2/15/2024 | $ | 1,160,510 | ||||
| 1,000,000 | Lancaster Independent School District, GO, Refunding, (BAM insured), 5.000%, 2/15/2026 | 1,181,680 | ||||||
| 940,000 | New Caney Independent School District, Refunding, Series A, (PSF-GTD), 5.000%, 2/15/2023 | 1,093,803 | ||||||
| 350,000 | State of Texas Water Financial Assistance, GO, Series B, 5.000%, 8/01/2022 | 396,312 | ||||||
| 400,000 | Tarrant County Cultural Education Facilities Finance Corp. Revenue, Methodist Hospitals of Dallas, 5.000%, 10/01/2024 | 462,456 | ||||||
| 670,000 | Texas State Technical College System Revenue, Refunding, (AGM Insured), 4.000%, 10/15/2033 | 696,947 | ||||||
|
|
|
|||||||
| 6,367,252 | ||||||||
|
|
|
|||||||
| Utah — 0.5% | ||||||||
| 250,000 | Utah State Transit Authority Sales Tax Revenue, Refunding, 5.000%, 6/15/2024 | 285,040 | ||||||
|
|
|
|||||||
| Washington — 8.9% | ||||||||
| 1,140,000 | Grant County Public Utility District No. 2, Refunding, Priest Rapids Hydroelectric Project, Series B, AMT, 5.000%, 1/01/2025 | 1,328,168 | ||||||
| 500,000 | King County Public Hospital District No. 2, GO, Evergreen Healthcare, Series B, 5.000%, 12/01/2032 | 558,710 | ||||||
| 1,500,000 | Pierce County School District No. 10 Tacoma, Refunding, 5.000%, 12/01/2026 | 1,784,520 | ||||||
| 500,000 | Port of Seattle Revenue, AMT, 5.000%, 7/01/2029 | 551,125 | ||||||
| 400,000 | Port of Seattle Special Facility Revenue, Refunding, AMT, SEATAC Fuel Facility LLC, 5.000%, 6/01/2020 | 434,488 | ||||||
| 500,000 | Snohomish County School District No. 15 Edmonds, GO, 5.000%, 12/01/2031 | 573,455 | ||||||
|
|
|
|||||||
| 5,230,466 | ||||||||
|
|
|
|||||||
| Wisconsin — 3.2% | ||||||||
| 450,000 | Public Finance Authority Hospital Revenue, Renown Regional Medical Center Project Obligated Group, Refunding, Series A, 4.000%, 6/01/2020 | 479,632 | ||||||
| 1,000,000 | Public Finance Authority Lease Development Revenue, Kansas University Development Corp., 5.000%, 3/01/2030 | 1,141,840 | ||||||
| 225,000 | Wisconsin Health & Educational Facilities Authority Revenue, Aspirus, Inc. Obligated Group, Refunding, Series A, 5.000%, 8/15/2031 | 245,327 | ||||||
|
|
|
|||||||
| 1,866,799 | ||||||||
|
|
|
|||||||
| Total Bonds and Notes (Identified Cost $59,347,343) |
59,157,102 | |||||||
|
|
|
|||||||
See accompanying notes to financial statements.
35 |
Table of Contents
Portfolio of Investments – as of December 31, 2016
McDonnell Intermediate Municipal Bond Fund – (continued)
| Principal Amount |
Description | Value (†) | ||||||
| Short-Term Investments — 1.4% | ||||||||
| $ | 825,519 | Tri-Party Repurchase Agreement with Fixed Income Clearing Corporation, dated 12/30/2016 at 0.030% to be repurchased at $825,522 on 1/03/2017 collateralized by $870,000 U.S. Treasury Note, 2.000% due 8/15/2025 valued at $846,022 including accrued interest (Note 2 of Notes to Financial Statements) (Identified Cost $825,519) | $ | 825,519 | ||||
|
|
|
|||||||
| Total Investments — 102.2% (Identified Cost $60,172,862)(a) |
59,982,621 | |||||||
| Other assets less liabilities — (2.2)% | (1,314,541 | ) | ||||||
|
|
|
|||||||
| Net Assets — 100.0% | $ | 58,668,080 | ||||||
|
|
|
|||||||
| (†) | See Note 2 of Notes to Financial Statements. | |||||||
| (a) | Federal Tax Information: | |||||||
| At December 31, 2016, the net unrealized depreciation on investments based on a cost of $60,172,862 for federal income tax purposes was as follows: | ||||||||
| Aggregate gross unrealized appreciation for all investments in which there is an excess of value over tax cost | $ | 601,427 | ||||||
| Aggregate gross unrealized depreciation for all investments in which there is an excess of tax cost over value | (791,668 | ) | ||||||
|
|
|
|||||||
| Net unrealized depreciation | $ | (190,241 | ) | |||||
|
|
|
|||||||
| AGM | Assured Guaranty Municipal Corporation | |||||||
| AMT | Alternative Minimum Tax | |||||||
| BAM | Build America Mutual | |||||||
| GO | General Obligation | |||||||
| PSF-GTD | Permanent School Fund Guarantee Program | |||||||
Holdings Summary at December 31, 2016
| Transportation |
14.6 | % | ||
| Higher Education |
13.6 | |||
| School District |
13.4 | |||
| Power |
12.2 | |||
| Medical |
10.8 | |||
| Water |
10.6 | |||
| General Obligation |
7.9 | |||
| General |
7.0 | |||
| Airport |
5.3 | |||
| Utilities |
2.8 | |||
| Education |
1.6 | |||
| Bond Bank |
1.0 | |||
| Short-Term Investments |
1.4 | |||
|
|
|
|||
| Total Investments |
102.2 | |||
| Other assets less liabilities |
(2.2 | ) | ||
|
|
|
|||
| Net Assets |
100.0 | % | ||
|
|
|
See accompanying notes to financial statements.
| 36
Table of Contents
Portfolio of Investments – as of December 31, 2016
Natixis U.S. Equity Opportunities Fund
| Shares | Description | Value (†) | ||||||
| Common Stocks — 95.7% of Net Assets | ||||||||
| Air Freight & Logistics — 4.6% | ||||||||
| 277,260 | Expeditors International of Washington, Inc. | $ | 14,683,690 | |||||
| 60,100 | FedEx Corp. | 11,190,620 | ||||||
| 48,279 | United Parcel Service, Inc., Class B | 5,534,704 | ||||||
|
|
|
|||||||
| 31,409,014 | ||||||||
|
|
|
|||||||
| Automobiles — 1.2% | ||||||||
| 231,700 | General Motors Co. | 8,072,428 | ||||||
|
|
|
|||||||
| Banks — 6.5% | ||||||||
| 651,500 | Bank of America Corp. | 14,398,150 | ||||||
| 287,600 | Citigroup, Inc. | 17,092,068 | ||||||
| 155,100 | JPMorgan Chase & Co. | 13,383,579 | ||||||
|
|
|
|||||||
| 44,873,797 | ||||||||
|
|
|
|||||||
| Beverages — 5.0% | ||||||||
| 179,928 | Coca-Cola Co. (The) | 7,459,815 | ||||||
| 95,000 | Diageo PLC, Sponsored ADR | 9,874,300 | ||||||
| 388,441 | Monster Beverage Corp.(b) | 17,223,474 | ||||||
|
|
|
|||||||
| 34,557,589 | ||||||||
|
|
|
|||||||
| Biotechnology — 2.0% | ||||||||
| 30,964 | Amgen, Inc. | 4,527,247 | ||||||
| 25,501 | Regeneron Pharmaceuticals, Inc.(b) | 9,361,162 | ||||||
|
|
|
|||||||
| 13,888,409 | ||||||||
|
|
|
|||||||
| Capital Markets — 4.8% | ||||||||
| 43,655 | FactSet Research Systems, Inc. | 7,134,537 | ||||||
| 33,400 | Goldman Sachs Group, Inc. (The) | 7,997,630 | ||||||
| 76,327 | MSCI, Inc. | 6,013,041 | ||||||
| 244,468 | SEI Investments Co. | 12,066,940 | ||||||
|
|
|
|||||||
| 33,212,148 | ||||||||
|
|
|
|||||||
| Communications Equipment — 2.4% | ||||||||
| 554,240 | Cisco Systems, Inc. | 16,749,133 | ||||||
|
|
|
|||||||
| Consumer Finance — 2.4% | ||||||||
| 60,049 | American Express Co. | 4,448,430 | ||||||
| 136,800 | Capital One Financial Corp. | 11,934,432 | ||||||
|
|
|
|||||||
| 16,382,862 | ||||||||
|
|
|
|||||||
| Energy Equipment & Services — 1.4% | ||||||||
| 112,565 | Schlumberger Ltd. | 9,449,832 | ||||||
|
|
|
|||||||
| Food Products — 2.6% | ||||||||
| 617,829 | Danone S.A., Sponsored ADR | 7,772,289 | ||||||
| 138,600 | Nestle S.A., Sponsored ADR | 9,943,164 | ||||||
|
|
|
|||||||
| 17,715,453 | ||||||||
|
|
|
|||||||
| Health Care Equipment & Supplies — 1.6% | ||||||||
| 123,625 | Varian Medical Systems, Inc.(b) | 11,099,053 | ||||||
|
|
|
|||||||
See accompanying notes to financial statements.
37 |
Table of Contents
Portfolio of Investments – as of December 31, 2016
Natixis U.S. Equity Opportunities Fund – (continued)
| Shares | Description | Value (†) | ||||||
| Health Care Providers & Services — 1.3% | ||||||||
| 57,700 | UnitedHealth Group, Inc. | $ | 9,234,308 | |||||
|
|
|
|||||||
| Health Care Technology — 0.8% | ||||||||
| 118,166 | Cerner Corp.(b) | 5,597,523 | ||||||
|
|
|
|||||||
| Hotels, Restaurants & Leisure — 2.2% | ||||||||
| 352,645 | Yum China Holdings, Inc.(b) | 9,211,087 | ||||||
| 87,979 | Yum! Brands, Inc. | 5,571,710 | ||||||
|
|
|
|||||||
| 14,782,797 | ||||||||
|
|
|
|||||||
| Household Durables — 1.4% | ||||||||
| 52,450 | Whirlpool Corp. | 9,533,837 | ||||||
|
|
|
|||||||
| Household Products — 1.1% | ||||||||
| 88,392 | Procter & Gamble Co. (The) | 7,431,999 | ||||||
|
|
|
|||||||
| Industrial Conglomerates — 2.0% | ||||||||
| 432,400 | General Electric Co. | 13,663,840 | ||||||
|
|
|
|||||||
| Insurance — 4.9% | ||||||||
| 148,800 | Aflac, Inc. | 10,356,480 | ||||||
| 211,400 | American International Group, Inc. | 13,806,534 | ||||||
| 84,500 | Aon PLC | 9,424,285 | ||||||
|
|
|
|||||||
| 33,587,299 | ||||||||
|
|
|
|||||||
| Internet & Direct Marketing Retail — 4.3% | ||||||||
| 30,473 | Amazon.com, Inc.(b) | 22,850,789 | ||||||
| 348,600 | Liberty Interactive Corp./QVC Group, Class A(b) | 6,965,028 | ||||||
|
|
|
|||||||
| 29,815,817 | ||||||||
|
|
|
|||||||
| Internet Software & Services — 9.7% | ||||||||
| 176,083 | Alibaba Group Holding Ltd., Sponsored ADR(b) | 15,461,848 | ||||||
| 30,154 | Alphabet, Inc., Class A(b) | 23,895,537 | ||||||
| 10,785 | Alphabet, Inc., Class C(b) | 8,324,079 | ||||||
| 166,439 | Facebook, Inc., Class A(b) | 19,148,807 | ||||||
|
|
|
|||||||
| 66,830,271 | ||||||||
|
|
|
|||||||
| IT Services — 5.9% | ||||||||
| 36,358 | Automatic Data Processing, Inc. | 3,736,875 | ||||||
| 114,500 | MasterCard, Inc., Class A | 11,822,125 | ||||||
| 324,494 | Visa, Inc., Class A | 25,317,022 | ||||||
|
|
|
|||||||
| 40,876,022 | ||||||||
|
|
|
|||||||
| Machinery — 4.1% | ||||||||
| 105,200 | Caterpillar, Inc. | 9,756,248 | ||||||
| 69,800 | Cummins, Inc. | 9,539,566 | ||||||
| 85,757 | Deere & Co. | 8,836,401 | ||||||
|
|
|
|||||||
| 28,132,215 | ||||||||
|
|
|
|||||||
| Metals & Mining — 0.4% | ||||||||
| 35,782 | Compass Minerals International, Inc. | 2,803,520 | ||||||
|
|
|
|||||||
| Oil, Gas & Consumable Fuels — 3.5% | ||||||||
| 154,700 | Anadarko Petroleum Corp. | 10,787,231 | ||||||
See accompanying notes to financial statements.
| 38
Table of Contents
Portfolio of Investments – as of December 31, 2016
Natixis U.S. Equity Opportunities Fund – (continued)
| Shares | Description | Value (†) | ||||||
| Oil, Gas & Consumable Fuels — continued | ||||||||
| 210,300 | Apache Corp. | $ | 13,347,741 | |||||
|
|
|
|||||||
| 24,134,972 | ||||||||
|
|
|
|||||||
| Personal Products — 1.4% | ||||||||
| 231,800 | Unilever PLC, Sponsored ADR | 9,434,260 | ||||||
|
|
|
|||||||
| Pharmaceuticals — 2.6% | ||||||||
| 49,547 | Merck & Co., Inc. | 2,916,832 | ||||||
| 72,581 | Novartis AG, Sponsored ADR | 5,286,800 | ||||||
| 266,700 | Novo Nordisk AS, Sponsored ADR | 9,563,862 | ||||||
|
|
|
|||||||
| 17,767,494 | ||||||||
|
|
|
|||||||
| Semiconductors & Semiconductor Equipment — 7.1% | ||||||||
| 17,788 | Analog Devices, Inc. | 1,291,765 | ||||||
| 308,100 | Intel Corp. | 11,174,787 | ||||||
| 26,274 | Linear Technology Corp. | 1,638,184 | ||||||
| 359,657 | QUALCOMM, Inc. | 23,449,636 | ||||||
| 155,300 | Texas Instruments, Inc. | 11,332,241 | ||||||
|
|
|
|||||||
| 48,886,613 | ||||||||
|
|
|
|||||||
| Software — 6.1% | ||||||||
| 155,557 | Autodesk, Inc.(b) | 11,512,774 | ||||||
| 104,858 | Microsoft Corp. | 6,515,876 | ||||||
| 626,610 | Oracle Corp. | 24,093,154 | ||||||
|
|
|
|||||||
| 42,121,804 | ||||||||
|
|
|
|||||||
| Technology Hardware, Storage & Peripherals — 1.6% | ||||||||
| 96,600 | Apple, Inc. | 11,188,212 | ||||||
|
|
|
|||||||
| Textiles, Apparel & Luxury Goods — 0.8% | ||||||||
| 73,406 | adidas AG, Sponsored ADR | 5,766,041 | ||||||
|
|
|
|||||||
| Total Common Stocks (Identified Cost $529,508,285) |
658,998,562 | |||||||
|
|
|
|||||||
| Principal Amount |
||||||||
| Short-Term Investments — 4.3% | ||||||||
| $ | 29,406,475 | Tri-Party Repurchase Agreement with Fixed Income Clearing Corporation, dated 12/30/2016 at 0.030% to be repurchased at $29,406,573 on 1/03/2017 collateralized by $30,850,000 U.S. Treasury Note, 2.000% due 8/15/2025 valued at $29,999,743 (Note 2 of Notes to Financial Statements) (Identified Cost $29,406,475) | 29,406,475 | |||||
|
|
|
|||||||
| Total Investments — 100.0% (Identified Cost $558,914,760)(a) |
688,405,037 | |||||||
| Other assets less liabilities — 0.0% | 30,775 | |||||||
|
|
|
|||||||
| Net Assets — 100.0% | $ | 688,435,812 | ||||||
|
|
|
|||||||
See accompanying notes to financial statements.
39 |
Table of Contents
Portfolio of Investments – as of December 31, 2016
Natixis U.S. Equity Opportunities Fund – (continued)
| (†) | See Note 2 of Notes to Financial Statements. | |||||||
| (a) | Federal Tax Information: | |||||||
| At December 31, 2016, the net unrealized appreciation on investments based on a cost of $559,526,710 for federal income tax purposes was as follows: | ||||||||
| Aggregate gross unrealized appreciation for all investments in which there is an excess of value over tax cost | $ | 138,546,459 | ||||||
| Aggregate gross unrealized depreciation for all investments in which there is an excess of tax cost over value | (9,668,132 | ) | ||||||
|
|
|
|||||||
| Net unrealized appreciation | $ | 128,878,327 | ||||||
|
|
|
|||||||
| (b) | Non-income producing security. | |||||||
| ADR | An American Depositary Receipt is a certificate issued by a custodian bank representing the right to receive securities of the foreign issuer described. The values of ADRs may be significantly influenced by trading on exchanges not located in the United States. | |||||||
Industry Summary at December 31, 2016
| Internet Software & Services |
9.7 | % | ||
| Semiconductors & Semiconductor Equipment |
7.1 | |||
| Banks |
6.5 | |||
| Software |
6.1 | |||
| IT Services |
5.9 | |||
| Beverages |
5.0 | |||
| Insurance |
4.9 | |||
| Capital Markets |
4.8 | |||
| Air Freight & Logistics |
4.6 | |||
| Internet & Direct Marketing Retail |
4.3 | |||
| Machinery |
4.1 | |||
| Oil, Gas & Consumable Fuels |
3.5 | |||
| Pharmaceuticals |
2.6 | |||
| Food Products |
2.6 | |||
| Communications Equipment |
2.4 | |||
| Consumer Finance |
2.4 | |||
| Hotels, Restaurants & Leisure |
2.2 | |||
| Biotechnology |
2.0 | |||
| Industrial Conglomerates |
2.0 | |||
| Other Investments, less than 2% each |
13.0 | |||
| Short-Term Investments |
4.3 | |||
|
|
|
|||
| Total Investments |
100.0 | |||
| Other assets less liabilities |
0.0 | |||
|
|
|
|||
| Net Assets |
100.0 | % | ||
|
|
|
See accompanying notes to financial statements.
| 40
Table of Contents
Statements of Assets and Liabilities
December 31, 2016
| Loomis Sayles Multi-Asset Income Fund |
McDonnell Intermediate Municipal Bond Fund |
Natixis U.S. Equity Opportunities Fund |
||||||||||
| ASSETS |
| |||||||||||
| Investments at cost |
$ | 120,425,254 | $ | 60,172,862 | $ | 558,914,760 | ||||||
| Net unrealized appreciation (depreciation) |
4,960,126 | (190,241 | ) | 129,490,277 | ||||||||
|
|
|
|
|
|
|
|||||||
| Investments at value |
125,385,380 | 59,982,621 | 688,405,037 | |||||||||
| Cash |
5,598 | — | 68,395 | |||||||||
| Foreign currency at value (identified cost $2,446, $0 and $0, respectively) |
2,458 | — | — | |||||||||
| Receivable for Fund shares sold |
628,772 | 87,821 | 4,662,247 | |||||||||
| Dividends and interest receivable |
813,168 | 813,387 | 335,122 | |||||||||
| Tax reclaims receivable |
1,670 | — | 77,892 | |||||||||
| Prepaid expenses (Note 8) |
254 | 203 | 1,217 | |||||||||
|
|
|
|
|
|
|
|||||||
| TOTAL ASSETS |
126,837,300 | 60,884,032 | 693,549,910 | |||||||||
|
|
|
|
|
|
|
|||||||
| LIABILITIES |
| |||||||||||
| Payable for securities purchased |
2,183,841 | — | 3,087,600 | |||||||||
| Payable for Fund shares redeemed |
642,101 | 2,027,149 | 848,974 | |||||||||
| Distributions payable |
— | 77,159 | — | |||||||||
| Management fees payable (Note 6) |
62,077 | 22,188 | 495,261 | |||||||||
| Deferred Trustees’ fees (Note 6) |
116,180 | 35,990 | 533,778 | |||||||||
| Administrative fees payable (Note 6) |
4,533 | 2,682 | 25,828 | |||||||||
| Payable to distributor (Note 6d) |
921 | 138 | 3,014 | |||||||||
| Other accounts payable and accrued expenses |
54,337 | 50,646 | 119,643 | |||||||||
|
|
|
|
|
|
|
|||||||
| TOTAL LIABILITIES |
3,063,990 | 2,215,952 | 5,114,098 | |||||||||
|
|
|
|
|
|
|
|||||||
| NET ASSETS |
$ | 123,773,310 | $ | 58,668,080 | $ | 688,435,812 | ||||||
|
|
|
|
|
|
|
|||||||
| NET ASSETS CONSIST OF: |
| |||||||||||
| Paid-in capital |
$ | 120,143,136 | $ | 59,640,783 | $ | 557,347,539 | ||||||
| Distributions in excess of net investment income |
(459,511 | ) | (23,502 | ) | (484,437 | ) | ||||||
| Accumulated net realized gain (loss) on investments, futures contracts and foreign currency transactions |
(871,130 | ) | (758,960 | ) | 2,082,433 | |||||||
| Net unrealized appreciation (depreciation) on investments and foreign currency translations |
4,960,815 | (190,241 | ) | 129,490,277 | ||||||||
|
|
|
|
|
|
|
|||||||
| NET ASSETS |
$ | 123,773,310 | $ | 58,668,080 | $ | 688,435,812 | ||||||
|
|
|
|
|
|
|
|||||||
See accompanying notes to financial statements.
41 |
Table of Contents
Statements of Assets and Liabilities (continued)
December 31, 2016
| Loomis Sayles Multi-Asset Income Fund |
McDonnell Intermediate Municipal Bond Fund |
Natixis U.S. Equity Opportunities Fund |
||||||||||
| COMPUTATION OF NET ASSET VALUE AND OFFERING PRICE: |
||||||||||||
| Class A shares: |
| |||||||||||
| Net assets |
$ | 57,320,087 | $ | 5,474,449 | $ | 472,435,940 | ||||||
|
|
|
|
|
|
|
|||||||
| Shares of beneficial interest |
4,330,400 | 553,301 | 15,608,971 | |||||||||
|
|
|
|
|
|
|
|||||||
| Net asset value and redemption price per share |
$ | 13.24 | $ | 9.89 | $ | 30.27 | ||||||
|
|
|
|
|
|
|
|||||||
| Offering price per share (100/[100-maximum sales charge] of net asset value) (Note 1) |
$ | 13.83 | $ | 10.20 | $ | 32.12 | ||||||
|
|
|
|
|
|
|
|||||||
| Class C shares: (redemption price per share is equal to net asset value less any applicable contingent deferred sales charge) (Note 1) |
||||||||||||
| Net assets |
$ | 46,350,629 | $ | 4,014,843 | $ | 72,768,437 | ||||||
|
|
|
|
|
|
|
|||||||
| Shares of beneficial interest |
3,515,997 | 405,686 | 3,378,572 | |||||||||
|
|
|
|
|
|
|
|||||||
| Net asset value and offering price per share |
$ | 13.18 | $ | 9.90 | $ | 21.54 | ||||||
|
|
|
|
|
|
|
|||||||
| Class N shares: |
| |||||||||||
| Net assets |
$ | 1,127 | $ | — | $ | — | ||||||
|
|
|
|
|
|
|
|||||||
| Shares of beneficial interest |
86 | — | — | |||||||||
|
|
|
|
|
|
|
|||||||
| Net asset value, offering and redemption price per share |
$ | 13.16 | * | $ | — | $ | — | |||||
|
|
|
|
|
|
|
|||||||
| Class Y shares: |
| |||||||||||
| Net assets |
$ | 20,101,467 | $ | 49,178,788 | $ | 143,231,435 | ||||||
|
|
|
|
|
|
|
|||||||
| Shares of beneficial interest |
1,526,706 | 4,965,252 | 4,119,612 | |||||||||
|
|
|
|
|
|
|
|||||||
| Net asset value, offering and redemption price per share |
$ | 13.17 | $ | 9.90 | $ | 34.77 | ||||||
|
|
|
|
|
|
|
|||||||
| * | Net asset value calculations reflect fractional share and dollar amounts. |
See accompanying notes to financial statements.
| 42
Table of Contents
Statements of Operations
For the Year Ended December 31, 2016
| Loomis Sayles Multi-Asset Income Fund |
McDonnell Intermediate Municipal Bond Fund |
Natixis U.S. Equity Opportunities Fund |
||||||||||
| INVESTMENT INCOME |
| |||||||||||
| Dividends |
$ | 2,138,704 | $ | — | $ | 9,660,441 | ||||||
| Interest |
3,383,504 | 1,761,351 | 14,799 | |||||||||
| Less net foreign taxes withheld |
(14,642 | ) | — | (97,226 | ) | |||||||
|
|
|
|
|
|
|
|||||||
| 5,507,566 | 1,761,351 | 9,578,014 | ||||||||||
|
|
|
|
|
|
|
|||||||
| Expenses |
| |||||||||||
| Management fees (Note 6) |
650,601 | 373,029 | 4,649,135 | |||||||||
| Service and distribution fees (Note 6) |
616,234 | 86,175 | 1,721,516 | |||||||||
| Administrative fees (Note 6) |
52,502 | 41,380 | 257,981 | |||||||||
| Trustees’ fees and expenses (Note 6) |
26,814 | 21,705 | 59,150 | |||||||||
| Transfer agent fees and expenses (Notes 6 and 7) |
82,168 | 20,910 | 537,234 | |||||||||
| Audit and tax services fees |
48,073 | 52,288 | 48,526 | |||||||||
| Custodian fees and expenses |
45,182 | 6,991 | 22,499 | |||||||||
| Legal fees |
1,497 | 1,546 | 8,116 | |||||||||
| Registration fees |
63,270 | 54,568 | 47,105 | |||||||||
| Shareholder reporting expenses |
5,157 | 3,520 | 37,574 | |||||||||
| Miscellaneous expenses (Note 8) |
15,715 | 10,904 | 26,040 | |||||||||
|
|
|
|
|
|
|
|||||||
| Total expenses |
1,607,213 | 673,016 | 7,414,876 | |||||||||
| Fee/expense recovery (Note 6) |
— | — | 2,238 | |||||||||
| Less waiver and/or expense reimbursement (Note 6) |
(162,281 | ) | (167,183 | ) | — | |||||||
|
|
|
|
|
|
|
|||||||
| Net expenses |
1,444,932 | 505,833 | 7,417,114 | |||||||||
|
|
|
|
|
|
|
|||||||
| Net investment income |
4,062,634 | 1,255,518 | 2,160,900 | |||||||||
|
|
|
|
|
|
|
|||||||
| NET REALIZED AND UNREALIZED GAIN (LOSS) ON INVESTMENTS, FUTURES CONTRACTS AND FOREIGN CURRENCY TRANSACTIONS |
||||||||||||
| Net realized gain (loss) on: |
| |||||||||||
| Investments |
3,927,525 | (382,050 | ) | 7,563,829 | ||||||||
| Futures contracts |
(289,466 | ) | — | — | ||||||||
| Foreign currency transactions |
23,431 | — | — | |||||||||
| Net change in unrealized appreciation (depreciation) on: |
||||||||||||
| Investments |
2,912,037 | (1,492,330 | ) | 56,605,558 | ||||||||
| Foreign currency translations |
4,595 | — | — | |||||||||
|
|
|
|
|
|
|
|||||||
| Net realized and unrealized gain (loss) on investments, futures contracts and foreign currency transactions |
6,578,122 | (1,874,380 | ) | 64,169,387 | ||||||||
|
|
|
|
|
|
|
|||||||
| NET INCREASE (DECREASE) IN NET ASSETS RESULTING FROM OPERATIONS |
$ | 10,640,756 | $ | (618,862 | ) | $ | 66,330,287 | |||||
|
|
|
|
|
|
|
|||||||
See accompanying notes to financial statements.
43 |
Table of Contents
Statements of Changes in Net Assets
| Loomis Sayles Multi-Asset Income Fund |
||||||||
| Year Ended December 31, 2016 |
Year Ended December 31, 2015 |
|||||||
| FROM OPERATIONS: |
||||||||
| Net investment income |
$ | 4,062,634 | $ | 3,626,869 | ||||
| Net realized gain on investments, futures contracts and foreign currency transactions |
3,661,490 | 7,718,703 | ||||||
| Net change in unrealized appreciation (depreciation) on investments and foreign currency translations |
2,916,632 | (15,091,886 | ) | |||||
|
|
|
|
|
|||||
| Net increase (decrease) in net assets resulting from operations |
10,640,756 | (3,746,314 | ) | |||||
|
|
|
|
|
|||||
| FROM DISTRIBUTIONS TO SHAREHOLDERS: |
||||||||
| Net investment income |
||||||||
| Class A |
(1,712,251 | ) | (2,173,545 | ) | ||||
| Class C |
(1,054,549 | ) | (937,937 | ) | ||||
| Class N |
(36 | ) | (14 | ) | ||||
| Class Y |
(466,918 | ) | (430,540 | ) | ||||
| Net realized capital gains |
||||||||
| Class A |
(2,049,190 | ) | — | |||||
| Class C |
(1,689,864 | ) | — | |||||
| Class N |
(41 | ) | — | |||||
| Class Y |
(730,396 | ) | — | |||||
|
|
|
|
|
|||||
| Total distributions |
(7,703,245 | ) | (3,542,036 | ) | ||||
|
|
|
|
|
|||||
| NET DECREASE IN NET ASSETS FROM CAPITAL SHARE TRANSACTIONS (NOTE 11) |
(1,482,318 | ) | (48,770,339 | ) | ||||
|
|
|
|
|
|||||
| Net increase (decrease) in net assets |
1,455,193 | (56,058,689 | ) | |||||
| NET ASSETS |
| |||||||
| Beginning of the year |
122,318,117 | 178,376,806 | ||||||
|
|
|
|
|
|||||
| End of the year |
$ | 123,773,310 | $ | 122,318,117 | ||||
|
|
|
|
|
|||||
| UNDISTRIBUTED (DISTRIBUTIONS IN EXCESS OF) NET INVESTMENT INCOME |
$ | (459,511 | ) | $ | 15,241 | |||
|
|
|
|
|
|||||
See accompanying notes to financial statements.
| 44
Table of Contents
Statements of Changes in Net Assets (continued)
| McDonnell Intermediate Municipal Bond Fund |
||||||||
| Year Ended December 31, 2016 |
Year Ended December 31, 2015 |
|||||||
| FROM OPERATIONS: |
||||||||
| Net investment income |
$ | 1,255,518 | $ | 544,038 | ||||
| Net realized gain (loss) on investments |
(382,050 | ) | 24,506 | |||||
| Net change in unrealized appreciation (depreciation) on investments |
(1,492,330 | ) | 538,992 | |||||
|
|
|
|
|
|||||
| Net increase (decrease) in net assets resulting from operations |
(618,862 | ) | 1,107,536 | |||||
|
|
|
|
|
|||||
| FROM DISTRIBUTIONS TO SHAREHOLDERS: |
| |||||||
| Net investment income |
||||||||
| Class A |
(136,816 | ) | (46,261 | ) | ||||
| Class C |
(25,208 | ) | (15,022 | ) | ||||
| Class Y |
(1,093,491 | ) | (504,191 | ) | ||||
|
|
|
|
|
|||||
| Total distributions |
(1,255,515 | ) | (565,474 | ) | ||||
|
|
|
|
|
|||||
| NET INCREASE (DECREASE) IN NET ASSETS FROM CAPITAL SHARE TRANSACTIONS (NOTE 11) |
(18,953,089 | ) | 46,018,276 | |||||
|
|
|
|
|
|||||
| Net increase (decrease) in net assets |
(20,827,466 | ) | 46,560,338 | |||||
| NET ASSETS |
| |||||||
| Beginning of the year |
79,495,546 | 32,935,208 | ||||||
|
|
|
|
|
|||||
| End of the year |
$ | 58,668,080 | $ | 79,495,546 | ||||
|
|
|
|
|
|||||
| DISTRIBUTIONS IN EXCESS OF NET INVESTMENT INCOME |
$ | (23,502 | ) | $ | (22,790 | ) | ||
|
|
|
|
|
|||||
See accompanying notes to financial statements.
45 |
Table of Contents
Statements of Changes in Net Assets (continued)
| Natixis U.S. Equity Opportunities Fund |
||||||||
| Year Ended December 31, 2016 |
Year Ended December 31, 2015 |
|||||||
| FROM OPERATIONS: |
||||||||
| Net investment income |
$ | 2,160,900 | $ | 837,665 | ||||
| Net realized gain on investments |
7,563,829 | 26,118,486 | ||||||
| Net change in unrealized appreciation (depreciation) on investments |
56,605,558 | 3,596,453 | ||||||
|
|
|
|
|
|||||
| Net increase in net assets resulting from operations |
66,330,287 | 30,552,604 | ||||||
|
|
|
|
|
|||||
| FROM DISTRIBUTIONS TO SHAREHOLDERS: |
| |||||||
| Net investment income |
||||||||
| Class A |
(1,829,987 | ) | — | |||||
| Class C |
(75,717 | ) | — | |||||
| Class Y |
(689,276 | ) | (147,433 | ) | ||||
| Net realized capital gains |
||||||||
| Class A |
(6,990,778 | ) | (20,882,818 | ) | ||||
| Class B(a) |
— | (45,584 | ) | |||||
| Class C |
(1,442,071 | ) | (4,110,090 | ) | ||||
| Class Y |
(1,298,700 | ) | (2,904,325 | ) | ||||
|
|
|
|
|
|||||
| Total distributions |
(12,326,529 | ) | (28,090,250 | ) | ||||
|
|
|
|
|
|||||
| NET INCREASE IN NET ASSETS FROM CAPITAL SHARE TRANSACTIONS (NOTE 11) |
79,688,302 | 56,719,631 | ||||||
|
|
|
|
|
|||||
| Net increase in net assets |
133,692,060 | 59,181,985 | ||||||
| NET ASSETS |
| |||||||
| Beginning of the year |
554,743,752 | 495,561,767 | ||||||
|
|
|
|
|
|||||
| End of the year |
$ | 688,435,812 | $ | 554,743,752 | ||||
|
|
|
|
|
|||||
| UNDISTRIBUTED (DISTRIBUTIONS IN EXCESS OF) NET INVESTMENT INCOME |
$ | (484,437 | ) | $ | 131,902 | |||
|
|
|
|
|
|||||
| (a) | On January 11, 2016, Class B shares were converted into Class A shares. See Note 1 of Notes to Financial Statements. |
See accompanying notes to financial statements.
| 46
Table of Contents
Financial Highlights
For a share outstanding throughout each period.
| Loomis Sayles Multi-Asset Income Fund—Class A | ||||||||||||||||||||
| Year Ended December 31, 2016 |
Year Ended December 31, 2015 |
Year Ended December 31, 2014 |
Year Ended December 31, 2013 |
Year Ended December 31, 2012 |
||||||||||||||||
| Net asset value, beginning of the period |
$ | 12.85 | $ | 13.45 | $ | 12.21 | $ | 11.83 | $ | 10.74 | ||||||||||
|
|
|
|
|
|
|
|
|
|
|
|||||||||||
| INCOME (LOSS) FROM INVESTMENT OPERATIONS: |
||||||||||||||||||||
| Net investment income(a) |
0.49 | 0.32 | 0.32 | 0.29 | 0.29 | |||||||||||||||
| Net realized and unrealized gain (loss) |
0.80 | (0.58 | ) | 1.26 | 0.40 | 1.12 | ||||||||||||||
|
|
|
|
|
|
|
|
|
|
|
|||||||||||
| Total from Investment Operations |
1.29 | (0.26 | ) | 1.58 | 0.69 | 1.41 | ||||||||||||||
|
|
|
|
|
|
|
|
|
|
|
|||||||||||
| LESS DISTRIBUTIONS FROM: |
||||||||||||||||||||
| Net investment income |
(0.40 | ) | (0.34 | ) | (0.34 | ) | (0.31 | ) | (0.32 | ) | ||||||||||
| Net realized capital gains |
(0.50 | ) | — | — | — | — | ||||||||||||||
|
|
|
|
|
|
|
|
|
|
|
|||||||||||
| Total Distributions |
(0.90 | ) | (0.34 | ) | (0.34 | ) | (0.31 | ) | (0.32 | ) | ||||||||||
|
|
|
|
|
|
|
|
|
|
|
|||||||||||
| Net asset value, end of the period |
$ | 13.24 | $ | 12.85 | $ | 13.45 | $ | 12.21 | $ | 11.83 | ||||||||||
|
|
|
|
|
|
|
|
|
|
|
|||||||||||
| Total return(b) |
10.14 | %(c) | (1.96 | )%(c) | 13.08 | % | 5.84 | % | 13.22 | % | ||||||||||
| RATIOS TO AVERAGE NET ASSETS: |
||||||||||||||||||||
| Net assets, end of the period (000’s) |
$ | 57,320 | $ | 63,254 | $ | 110,874 | $ | 79,039 | $ | 78,216 | ||||||||||
| Net expenses |
0.95 | %(d) | 1.04 | %(d)(e) | 1.06 | % | 1.09 | % | 1.11 | % | ||||||||||
| Gross expenses |
1.09 | % | 1.11 | % | 1.06 | % | 1.09 | % | 1.11 | % | ||||||||||
| Net investment income |
3.70 | % | 2.40 | % | 2.46 | % | 2.34 | % | 2.53 | % | ||||||||||
| Portfolio turnover rate |
341 | %(f) | 93 | %(g) | 41 | % | 41 | % | 29 | % | ||||||||||
| (a) | Per share net investment income has been calculated using the average shares outstanding during the period. |
| (b) | A sales charge for Class A shares is not reflected in total return calculations. |
| (c) | Had certain expenses not been waived/reimbursed during the period, total returns would have been lower. |
| (d) | The investment adviser agreed to waive its fees and/or reimburse a portion of the Fund’s expenses during the period. Without this waiver/reimbursement, expenses would have been higher. |
| (e) | Effective September 1, 2015, the expense limit decreased from 1.25% to 0.95%. |
| (f) | The variation in the Fund’s turnover rate from 2015 to 2016 was primarily due to a repositioning of the portfolio as well as sales of additional securities as a result of a change in investment strategy in 2015. |
| (g) | The variation in the Fund’s turnover rate from 2014 to 2015 was primarily due to a change in the investment strategy and management structure of the Fund. |
See accompanying notes to financial statements.
47 |
Table of Contents
Financial Highlights (continued)
For a share outstanding throughout each period.
| Loomis Sayles Multi-Asset Income Fund—Class C | ||||||||||||||||||||
| Year Ended December 31, 2016 |
Year Ended December 31, 2015 |
Year Ended December 31, 2014 |
Year Ended December 31, 2013 |
Year Ended December 31, 2012 |
||||||||||||||||
| Net asset value, beginning of the period |
$ | 12.80 | $ | 13.41 | $ | 12.17 | $ | 11.80 | $ | 10.71 | ||||||||||
|
|
|
|
|
|
|
|
|
|
|
|||||||||||
| INCOME (LOSS) FROM INVESTMENT OPERATIONS: |
||||||||||||||||||||
| Net investment income(a) |
0.39 | 0.24 | 0.22 | 0.19 | 0.20 | |||||||||||||||
| Net realized and unrealized gain (loss) |
0.79 | (0.60 | ) | 1.27 | 0.39 | 1.12 | ||||||||||||||
|
|
|
|
|
|
|
|
|
|
|
|||||||||||
| Total from Investment Operations |
1.18 | (0.36 | ) | 1.49 | 0.58 | 1.32 | ||||||||||||||
|
|
|
|
|
|
|
|
|
|
|
|||||||||||
| LESS DISTRIBUTIONS FROM: |
||||||||||||||||||||
| Net investment income |
(0.30 | ) | (0.25 | ) | (0.25 | ) | (0.21 | ) | (0.23 | ) | ||||||||||
| Net realized capital gains |
(0.50 | ) | — | — | — | — | ||||||||||||||
|
|
|
|
|
|
|
|
|
|
|
|||||||||||
| Total Distributions |
(0.80 | ) | (0.25 | ) | (0.25 | ) | (0.21 | ) | (0.23 | ) | ||||||||||
|
|
|
|
|
|
|
|
|
|
|
|||||||||||
| Net asset value, end of the period |
$ | 13.18 | $ | 12.80 | $ | 13.41 | $ | 12.17 | $ | 11.80 | ||||||||||
|
|
|
|
|
|
|
|
|
|
|
|||||||||||
| Total return(b) |
9.27 | %(c) | (2.73 | )%(c) | 12.28 | % | 4.98 | % | 12.43 | % | ||||||||||
| RATIOS TO AVERAGE NET ASSETS: |
||||||||||||||||||||
| Net assets, end of the period (000’s) |
$ | 46,351 | $ | 47,791 | $ | 53,074 | $ | 48,512 | $ | 49,697 | ||||||||||
| Net expenses |
1.70 | %(d) | 1.80 | %(d)(e) | 1.81 | % | 1.84 | % | 1.86 | % | ||||||||||
| Gross expenses |
1.84 | % | 1.87 | % | 1.81 | % | 1.84 | % | 1.86 | % | ||||||||||
| Net investment income |
2.96 | % | 1.78 | % | 1.70 | % | 1.59 | % | 1.79 | % | ||||||||||
| Portfolio turnover rate |
341 | %(f) | 93 | %(g) | 41 | % | 41 | % | 29 | % | ||||||||||
| (a) | Per share net investment income has been calculated using the average shares outstanding during the period. |
| (b) | A contingent deferred sales charge for Class C shares is not reflected in total return calculations. |
| (c) | Had certain expenses not been waived/reimbursed during the period, total returns would have been lower. |
| (d) | The investment adviser agreed to waive its fees and/or reimburse a portion of the Fund’s expenses during the period. Without this waiver/reimbursement, expenses would have been higher. |
| (e) | Effective September 1, 2015, the expense limit decreased from 2.00% to 1.70%. |
| (f) | The variation in the Fund’s turnover rate from 2015 to 2016 was primarily due to a repositioning of the portfolio as well as sales of additional securities as a result of a change in investment strategy in 2015. |
| (g) | The variation in the Fund’s turnover rate from 2014 to 2015 was primarily due to a change in the investment strategy and management structure of the Fund. |
See accompanying notes to financial statements.
| 48
Table of Contents
Financial Highlights (continued)
For a share outstanding throughout each period.
| Loomis Sayles Multi-Asset Income Fund—Class N |
||||||||
| Year Ended December 31, 2016 |
Period Ended December 31, 2015* |
|||||||
| Net asset value, beginning of the period |
$ | 12.77 | $ | 12.70 | ||||
|
|
|
|
|
|||||
| INCOME (LOSS) FROM INVESTMENT OPERATIONS: |
||||||||
| Net investment income(a) |
0.53 | 0.14 | ||||||
| Net realized and unrealized gain (loss) |
0.80 | 0.10 | ||||||
|
|
|
|
|
|||||
| Total from Investment Operations |
1.33 | 0.24 | ||||||
|
|
|
|
|
|||||
| LESS DISTRIBUTIONS FROM: |
||||||||
| Net investment income |
(0.44 | ) | (0.17 | ) | ||||
| Net realized capital gains |
(0.50 | ) | — | |||||
|
|
|
|
|
|||||
| Total Distributions |
(0.94 | ) | (0.17 | ) | ||||
|
|
|
|
|
|||||
| Net asset value, end of the period |
$ | 13.16 | $ | 12.77 | ||||
|
|
|
|
|
|||||
| Total return(b) |
10.53 | % | 1.91 | %(c) | ||||
| RATIOS TO AVERAGE NET ASSETS: |
||||||||
| Net assets, end of the period (000’s) |
$ | 1 | $ | 1 | ||||
| Net expenses(d) |
0.65 | % | 0.65 | %(e) | ||||
| Gross expenses |
13.53 | % | 13.66 | %(e) | ||||
| Net investment income |
4.02 | % | 3.22 | %(e) | ||||
| Portfolio turnover rate |
341 | %(f) | 93 | % | ||||
| * | From commencement of Class operations on August 31, 2015 through December 31, 2015 for Class N shares. |
| (a) | Per share net investment income has been calculated using the average shares outstanding during the period. |
| (b) | Had certain expenses not been waived/reimbursed during the period, total returns would have been lower. |
| (c) | Periods less than one year are not annualized. |
| (d) | The investment adviser agreed to waive its fees and/or reimburse a portion of the Fund’s expenses during the period. Without this waiver/reimbursement, expenses would have been higher. |
| (e) | Computed on an annualized basis for periods less than one year. |
| (f) | The variation in the Fund’s turnover rate from 2015 to 2016 was primarily due to a repositioning of the portfolio as well as sales of additional securities as a result of a change in investment strategy in 2015. |
See accompanying notes to financial statements.
49 |
Table of Contents
Financial Highlights (continued)
For a share outstanding throughout each period.
| Loomis Sayles Multi-Asset Income Fund—Class Y | ||||||||||||||||||||
| Year Ended December 31, 2016 |
Year Ended December 31, 2015 |
Year Ended December 31, 2014 |
Year Ended December 31, 2013 |
Period Ended December 31, 2012* |
||||||||||||||||
| Net asset value, beginning of the period |
$ | 12.79 | $ | 13.39 | $ | 12.19 | $ | 11.83 | $ | 11.72 | ||||||||||
|
|
|
|
|
|
|
|
|
|
|
|||||||||||
| INCOME (LOSS) FROM INVESTMENT OPERATIONS: |
||||||||||||||||||||
| Net investment income (loss)(a) |
0.53 | 0.36 | 0.38 | 0.33 | (0.02 | ) | ||||||||||||||
| Net realized and unrealized gain (loss) |
0.78 | (0.59 | ) | 1.19 | 0.37 | 0.18 | ||||||||||||||
|
|
|
|
|
|
|
|
|
|
|
|||||||||||
| Total from Investment Operations |
1.31 | (0.23 | ) | 1.57 | 0.70 | 0.16 | ||||||||||||||
|
|
|
|
|
|
|
|
|
|
|
|||||||||||
| LESS DISTRIBUTIONS FROM: |
||||||||||||||||||||
| Net investment income |
(0.43 | ) | (0.37 | ) | (0.37 | ) | (0.34 | ) | (0.05 | ) | ||||||||||
| Net realized capital gains |
(0.50 | ) | — | — | — | — | ||||||||||||||
|
|
|
|
|
|
|
|
|
|
|
|||||||||||
| Total Distributions |
(0.93 | ) | (0.37 | ) | (0.37 | ) | (0.34 | ) | (0.05 | ) | ||||||||||
|
|
|
|
|
|
|
|
|
|
|
|||||||||||
| Net asset value, end of the period |
$ | 13.17 | $ | 12.79 | $ | 13.39 | $ | 12.19 | $ | 11.83 | ||||||||||
|
|
|
|
|
|
|
|
|
|
|
|||||||||||
| Total return |
10.38 | %(b) | (1.72 | )%(b) | 13.05 | % | 5.93 | % | 1.35 | %(c) | ||||||||||
| RATIOS TO AVERAGE NET ASSETS: |
||||||||||||||||||||
| Net assets, end of the period (000’s) |
$ | 20,101 | $ | 11,272 | $ | 14,428 | $ | 628 | $ | 1 | ||||||||||
| Net expenses |
0.70 | %(d) | 0.80 | %(d)(e) | 0.82 | % | 0.83 | % | 1.00 | %(f) | ||||||||||
| Gross expenses |
0.84 | % | 0.86 | % | 0.82 | % | 0.83 | % | 1.00 | %(f) | ||||||||||
| Net investment income (loss) |
4.00 | % | 2.73 | % | 2.92 | % | 2.71 | % | (2.37 | )%(f) | ||||||||||
| Portfolio turnover rate |
341 | %(g) | 93 | %(h) | 41 | % | 41 | % | 29 | % | ||||||||||
| * | From commencement of operations on December 3, 2012, through December 31, 2012. |
| (a) | Per share net investment income (loss) has been calculated using the average shares outstanding during the period. |
| (b) | Had certain expenses not been waived/reimbursed during the period, total returns would have been lower. |
| (c) | Periods less than one year are not annualized. |
| (d) | The investment adviser agreed to waive its fees and/or reimburse a portion of the Fund’s expenses during the period. Without this waiver/reimbursement, expenses would have been higher. |
| (e) | Effective September 1, 2015, the expense limit decreased from 1.00% to 0.70%. |
| (f) | Computed on an annualized basis for periods less than one year. |
| (g) | The variation in the Fund’s turnover rate from 2015 to 2016 was primarily due to a repositioning of the portfolio as well as sales of additional securities as a result of a change in investment strategy in 2015. |
| (h) | The variation in the Fund’s turnover rate from 2014 to 2015 was primarily due to a change in the investment strategy and management structure of the Fund. |
See accompanying notes to financial statements.
| 50
Table of Contents
Financial Highlights (continued)
For a share outstanding throughout each period.
| McDonnell Intermediate Municipal Bond Fund—Class A | ||||||||||||||||||||
| Year Ended December 31, 2016 |
Year Ended December 31, 2015 |
Year Ended December 31, 2014 |
Year Ended December 31, 2013 |
Period Ended December 31, 2012* |
||||||||||||||||
| Net asset value, beginning of the period |
$ | 10.09 | $ | 10.00 | $ | 9.54 | $ | 9.89 | $ | 10.00 | ||||||||||
|
|
|
|
|
|
|
|
|
|
|
|||||||||||
| INCOME (LOSS) FROM INVESTMENT OPERATIONS: |
||||||||||||||||||||
| Net investment income (loss)(a) |
0.12 | 0.13 | 0.11 | 0.09 | (0.01 | ) | ||||||||||||||
| Net realized and unrealized gain (loss) |
(0.20 | ) | 0.10 | 0.47 | (0.35 | ) | (0.10 | ) | ||||||||||||
|
|
|
|
|
|
|
|
|
|
|
|||||||||||
| Total from Investment Operations |
(0.08 | ) | 0.23 | 0.58 | (0.26 | ) | (0.11 | ) | ||||||||||||
|
|
|
|
|
|
|
|
|
|
|
|||||||||||
| LESS DISTRIBUTIONS FROM: |
||||||||||||||||||||
| Net investment income |
(0.12 | ) | (0.14 | ) | (0.12 | ) | (0.09 | ) | — | |||||||||||
|
|
|
|
|
|
|
|
|
|
|
|||||||||||
| Net asset value, end of the period |
$ | 9.89 | $ | 10.09 | $ | 10.00 | $ | 9.54 | $ | 9.89 | ||||||||||
|
|
|
|
|
|
|
|
|
|
|
|||||||||||
| Total return(b)(c) |
(0.79 | )% | 2.28 | % | 6.08 | % | (2.66 | )% | (1.10 | )%(d) | ||||||||||
| RATIOS TO AVERAGE NET ASSETS: |
||||||||||||||||||||
| Net assets, end of the period (000’s) |
$ | 5,474 | $ | 6,427 | $ | 2,399 | $ | 1,047 | $ | 1 | ||||||||||
| Net expenses(e) |
0.70 | % | 0.74 | %(f) | 0.80 | % | 0.80 | % | 2.19 | %(g)(h) | ||||||||||
| Gross expenses |
0.88 | % | 1.12 | % | 1.26 | % | 1.37 | % | 2.23 | %(g) | ||||||||||
| Net investment income (loss) |
1.19 | % | 1.27 | % | 1.15 | % | 0.90 | % | (0.71 | )%(g) | ||||||||||
| Portfolio turnover rate |
48 | % | 20 | % | 10 | % | 37 | % | 0 | % | ||||||||||
| * | From commencement of operations on November 16, 2012 through December 31, 2012. |
| (a) | Per share net investment income (loss) has been calculated using the average shares outstanding during the period. |
| (b) | Had certain expenses not been waived/reimbursed during the period, total returns would have been lower. |
| (c) | A sales charge for Class A shares is not reflected in total return calculations. |
| (d) | Periods less than one year are not annualized. |
| (e) | The investment adviser agreed to waive its fees and/or reimburse a portion of the Fund’s expenses during the period. Without this waiver/reimbursement, expenses would have been higher. |
| (f) | Effective July 1, 2015, the expense limit decreased from 0.80% to 0.70%. |
| (g) | Computed on an annualized basis for periods less than one year. |
| (h) | Prior to December 31, 2012, there was no expense limitation agreement in place for the Fund. |
See accompanying notes to financial statements.
51 |
Table of Contents
Financial Highlights (continued)
For a share outstanding throughout each period.
| McDonnell Intermediate Municipal Bond Fund—Class C | ||||||||||||||||||||
| Year Ended December 31, 2016 |
Year Ended December 31, 2015 |
Year Ended December 31, 2014 |
Year Ended December 31, 2013 |
Period Ended December 31, 2012* |
||||||||||||||||
| Net asset value, beginning of the period |
$ | 10.09 | $ | 9.99 | $ | 9.54 | $ | 9.89 | $ | 10.00 | ||||||||||
|
|
|
|
|
|
|
|
|
|
|
|||||||||||
| INCOME (LOSS) FROM INVESTMENT OPERATIONS: |
||||||||||||||||||||
| Net investment income (loss)(a) |
0.04 | 0.05 | 0.04 | 0.01 | (0.01 | ) | ||||||||||||||
| Net realized and unrealized gain (loss) |
(0.18 | ) | 0.11 | 0.45 | (0.34 | ) | (0.10 | ) | ||||||||||||
|
|
|
|
|
|
|
|
|
|
|
|||||||||||
| Total from Investment Operations |
(0.14 | ) | 0.16 | 0.49 | (0.33 | ) | (0.11 | ) | ||||||||||||
|
|
|
|
|
|
|
|
|
|
|
|||||||||||
| LESS DISTRIBUTIONS FROM: |
||||||||||||||||||||
| Net investment income |
(0.05 | ) | (0.06 | ) | (0.04 | ) | (0.02 | ) | — | |||||||||||
|
|
|
|
|
|
|
|
|
|
|
|||||||||||
| Net asset value, end of the period |
$ | 9.90 | $ | 10.09 | $ | 9.99 | $ | 9.54 | $ | 9.89 | ||||||||||
|
|
|
|
|
|
|
|
|
|
|
|||||||||||
| Total return(b)(c) |
(1.44 | )% | 1.63 | % | 5.18 | % | (3.35 | )% | (1.10 | )%(d) | ||||||||||
| RATIOS TO AVERAGE NET ASSETS: |
||||||||||||||||||||
| Net assets, end of the period (000’s) |
$ | 4,015 | $ | 6,355 | $ | 2,223 | $ | 55 | $ | 1 | ||||||||||
| Net expenses(e) |
1.45 | % | 1.49 | %(f) | 1.55 | % | 1.55 | % | 2.20 | %(g)(h) | ||||||||||
| Gross expenses |
1.63 | % | 1.88 | % | 2.04 | % | 2.08 | % | 2.24 | %(g) | ||||||||||
| Net investment income (loss) |
0.44 | % | 0.52 | % | 0.41 | % | 0.14 | % | (0.73 | )%(g) | ||||||||||
| Portfolio turnover rate |
48 | % | 20 | % | 10 | % | 37 | % | 0 | % | ||||||||||
| * | From commencement of operations on November 16, 2012 through December 31, 2012. |
| (a) | Per share net investment income (loss) has been calculated using the average shares outstanding during the period. |
| (b) | Had certain expenses not been waived/reimbursed during the period, total returns would have been lower. |
| (c) | A contingent deferred sales charge for Class C shares is not reflected in total return calculations. |
| (d) | Periods less than one year are not annualized. |
| (e) | The investment adviser agreed to waive its fees and/or reimburse a portion of the Fund’s expenses during the period. Without this waiver/reimbursement, expenses would have been higher. |
| (f) | Effective July 1, 2015, the expense limit decreased from 1.55% to 1.45%. |
| (g) | Computed on an annualized basis for periods less than one year. |
| (h) | Prior to December 31, 2012, there was no expense limitation agreement in place for the Fund. |
See accompanying notes to financial statements.
| 52
Table of Contents
Financial Highlights (continued)
For a share outstanding throughout each period.
| McDonnell Intermediate Municipal Bond Fund—Class Y | ||||||||||||||||||||
| Year Ended December 31, 2016 |
Year Ended December 31, 2015 |
Year Ended December 31, 2014 |
Year Ended December 31, 2013 |
Period Ended December 31, 2012* |
||||||||||||||||
| Net asset value, beginning of the period |
$ | 10.10 | $ | 10.00 | $ | 9.54 | $ | 9.88 | $ | 10.00 | ||||||||||
|
|
|
|
|
|
|
|
|
|
|
|||||||||||
| INCOME (LOSS) FROM INVESTMENT OPERATIONS: |
||||||||||||||||||||
| Net investment income |
0.15 | 0.15 | 0.14 | 0.11 | (0.01 | ) | ||||||||||||||
| Net realized and unrealized gain (loss) |
(0.20 | ) | 0.11 | 0.46 | (0.34 | ) | (0.11 | ) | ||||||||||||
|
|
|
|
|
|
|
|
|
|
|
|||||||||||
| Total from Investment Operations |
(0.05 | ) | 0.26 | 0.60 | (0.23 | ) | (0.12 | ) | ||||||||||||
|
|
|
|
|
|
|
|
|
|
|
|||||||||||
| LESS DISTRIBUTIONS FROM: |
||||||||||||||||||||
| Net investment income |
(0.15 | ) | (0.16 | ) | (0.14 | ) | (0.11 | ) | — | |||||||||||
|
|
|
|
|
|
|
|
|
|
|
|||||||||||
| Net asset value, end of the period |
$ | 9.90 | $ | 10.10 | $ | 10.00 | $ | 9.54 | $ | 9.88 | ||||||||||
|
|
|
|
|
|
|
|
|
|
|
|||||||||||
| Total return(b) |
(0.55 | )% | 2.63 | % | 6.36 | % | (2.31 | )% | (1.20 | )%(c) | ||||||||||
| RATIOS TO AVERAGE NET ASSETS: |
||||||||||||||||||||
| Net assets, end of the period (000’s) |
$ | 49,179 | $ | 66,713 | $ | 28,314 | $ | 21,704 | $ | 14,827 | ||||||||||
| Net expenses(d) |
0.45 | % | 0.49 | %(e) | 0.55 | % | 0.55 | % | 2.33 | %(f)(g) | ||||||||||
| Gross expenses |
0.63 | % | 0.85 | % | 1.02 | % | 1.04 | % | 2.37 | %(f) | ||||||||||
| Net investment income (loss) |
1.44 | % | 1.48 | % | 1.46 | % | 1.13 | % | (0.84 | )%(f) | ||||||||||
| Portfolio turnover rate |
48 | % | 20 | % | 10 | % | 37 | % | 0 | % | ||||||||||
| * | From commencement of operations on November 16, 2012 through December 31, 2012. |
| (a) | Per share net investment income (loss) has been calculated using the average shares outstanding during the period. |
| (b) | Had certain expenses not been waived/reimbursed during the period, total returns would have been lower. |
| (c) | Periods less than one year are not annualized. |
| (d) | The investment adviser agreed to waive its fees and/or reimburse a portion of the Fund’s expenses during the period. Without this waiver/reimbursement, expenses would have been higher. |
| (e) | Effective July 1, 2015, the expense limit decreased from 0.55% to 0.45%. |
| (f) | Computed on an annualized basis for periods less than one year. |
| (g) | Prior to December 31, 2012, there was no expense limitation agreement in place for the Fund. |
See accompanying notes to financial statements.
53 |
Table of Contents
Financial Highlights (continued)
For a share outstanding throughout each period.
| Natixis U.S. Equity Opportunities Fund—Class A | ||||||||||||||||||||
| Year Ended December 31, 2016 |
Year Ended December 31, 2015 |
Year Ended December 31, 2014 |
Year Ended December 31, 2013 |
Year Ended December 31, 2012 |
||||||||||||||||
| Net asset value, beginning of the period |
$ | 27.60 | $ | 27.40 | $ | 33.07 | $ | 26.35 | $ | 23.56 | ||||||||||
|
|
|
|
|
|
|
|
|
|
|
|||||||||||
| INCOME (LOSS) FROM INVESTMENT OPERATIONS: |
||||||||||||||||||||
| Net investment income (loss)(a) |
0.12 | 0.06 | 0.02 | (0.04 | ) | 0.07 | ||||||||||||||
| Net realized and unrealized gain (loss) |
3.12 | 1.55 | 4.31 | 9.34 | 4.12 | |||||||||||||||
|
|
|
|
|
|
|
|
|
|
|
|||||||||||
| Total from Investment Operations |
3.24 | 1.61 | 4.33 | 9.30 | 4.19 | |||||||||||||||
|
|
|
|
|
|
|
|
|
|
|
|||||||||||
| LESS DISTRIBUTIONS FROM: |
||||||||||||||||||||
| Net investment income |
(0.12 | ) | — | — | — | (0.07 | ) | |||||||||||||
| Net realized capital gains |
(0.45 | ) | (1.41 | ) | (10.00 | ) | (2.58 | ) | (1.33 | ) | ||||||||||
|
|
|
|
|
|
|
|
|
|
|
|||||||||||
| Total Distributions |
(0.57 | ) | (1.41 | ) | (10.00 | ) | (2.58 | ) | (1.40 | ) | ||||||||||
|
|
|
|
|
|
|
|
|
|
|
|||||||||||
| Net asset value, end of the period |
$ | 30.27 | $ | 27.60 | $ | 27.40 | $ | 33.07 | $ | 26.35 | ||||||||||
|
|
|
|
|
|
|
|
|
|
|
|||||||||||
| Total return(b) |
11.86 | % | 5.86 | % | 12.94 | % | 35.75 | %(c) | 17.79 | %(c) | ||||||||||
| RATIOS TO AVERAGE NET ASSETS: |
||||||||||||||||||||
| Net assets, end of the period (000’s) |
$ | 472,436 | $ | 422,069 | $ | 400,678 | $ | 371,102 | $ | 289,898 | ||||||||||
| Net expenses |
1.23 | %(d) | 1.25 | %(e) | 1.29 | %(f) | 1.30 | %(g) | 1.30 | %(g) | ||||||||||
| Gross expenses |
1.23 | %(d) | 1.25 | % | 1.29 | %(f) | 1.32 | % | 1.35 | % | ||||||||||
| Net investment income (loss) |
0.42 | % | 0.21 | % | 0.07 | % | (0.12 | )% | 0.25 | % | ||||||||||
| Portfolio turnover rate |
17 | % | 20 | % | 93 | %(h) | 50 | % | 52 | % | ||||||||||
| (a) | Per share net investment income (loss) has been calculated using the average shares outstanding during the period. |
| (b) | A sales charge for Class A shares is not reflected in total return calculations. |
| (c) | Had certain expenses not been waived/reimbursed during the period, total returns would have been lower. |
| (d) | Includes fee/expense recovery of less than 0.01%. |
| (e) | Effective July 1, 2015, the expense limit decreased from 1.30% to 1.25%. |
| (f) | Includes fee/expense recovery of 0.02%. |
| (g) | The investment adviser agreed to waive its fees and/or reimburse a portion of the Fund’s expenses during the period. Without this waiver/reimbursement, expenses would have been higher. |
| (h) | The variation in the Fund’s turnover rate from 2013 to 2014 was primarily due to the change in the structure of the Fund from four segments to two segments. |
See accompanying notes to financial statements.
| 54
Table of Contents
Financial Highlights (continued)
For a share outstanding throughout each period.
| Natixis U.S. Equity Opportunities Fund—Class C | ||||||||||||||||||||
| Year Ended December 31, 2016 |
Year Ended December 31, 2015 |
Year Ended December 31, 2014 |
Year Ended December 31, 2013 |
Year Ended December 31, 2012 |
||||||||||||||||
| Net asset value, beginning of the period |
$ | 19.86 | $ | 20.24 | $ | 26.92 | $ | 21.99 | $ | 19.94 | ||||||||||
|
|
|
|
|
|
|
|
|
|
|
|||||||||||
| INCOME (LOSS) FROM INVESTMENT OPERATIONS: |
||||||||||||||||||||
| Net investment loss(a) |
(0.07 | ) | (0.11 | ) | (0.19 | ) | (0.22 | ) | (0.11 | ) | ||||||||||
| Net realized and unrealized gain (loss) |
2.22 | 1.14 | 3.51 | 7.73 | 3.49 | |||||||||||||||
|
|
|
|
|
|
|
|
|
|
|
|||||||||||
| Total from Investment Operations |
2.15 | 1.03 | 3.32 | 7.51 | 3.38 | |||||||||||||||
|
|
|
|
|
|
|
|
|
|
|
|||||||||||
| LESS DISTRIBUTIONS FROM: |
||||||||||||||||||||
| Net investment income |
(0.02 | ) | — | — | — | — | ||||||||||||||
| Net realized capital gains |
(0.45 | ) | (1.41 | ) | (10.00 | ) | (2.58 | ) | (1.33 | ) | ||||||||||
|
|
|
|
|
|
|
|
|
|
|
|||||||||||
| Total Distributions |
(0.47 | ) | (1.41 | ) | (10.00 | ) | (2.58 | ) | (1.33 | ) | ||||||||||
|
|
|
|
|
|
|
|
|
|
|
|||||||||||
| Net asset value, end of the period |
$ | 21.54 | $ | 19.86 | $ | 20.24 | $ | 26.92 | $ | 21.99 | ||||||||||
|
|
|
|
|
|
|
|
|
|
|
|||||||||||
| Total return(b) |
11.02 | % | 5.06 | % | 12.12 | % | 34.69 | %(c) | 16.96 | %(c) | ||||||||||
| RATIOS TO AVERAGE NET ASSETS: |
||||||||||||||||||||
| Net assets, end of the period (000’s) |
$ | 72,768 | $ | 61,864 | $ | 53,925 | $ | 44,150 | $ | 30,525 | ||||||||||
| Net expenses |
1.98 | %(d) | 2.00 | %(e) | 2.04 | %(f) | 2.05 | %(g) | 2.05 | %(g) | ||||||||||
| Gross expenses |
1.98 | %(d) | 2.00 | % | 2.04 | %(f) | 2.07 | % | 2.10 | % | ||||||||||
| Net investment loss |
(0.33 | )% | (0.54 | )% | (0.68 | )% | (0.86 | )% | (0.49 | )% | ||||||||||
| Portfolio turnover rate |
17 | % | 20 | % | 93 | %(h) | 50 | % | 52 | % | ||||||||||
| (a) | Per share net investment loss has been calculated using the average shares outstanding during the period. |
| (b) | A contingent deferred sales charge for Class C shares is not reflected in total return calculations. |
| (c) | Had certain expenses not been waived/reimbursed during the period, total returns would have been lower. |
| (d) | Includes fee/expense recovery of less than 0.01%. |
| (e) | Effective July 1, 2015, the expense limit decreased from 2.05% to 2.00%. |
| (f) | Includes fee/expense recovery of 0.01%. |
| (g) | The investment adviser agreed to waive its fees and/or reimburse a portion of the Fund’s expenses during the period. Without this waiver/reimbursement, expenses would have been higher. |
| (h) | The variation in the Fund’s turnover rate from 2013 to 2014 was primarily due to the change in the structure of the Fund from four segments to two segments. |
See accompanying notes to financial statements.
55 |
Table of Contents
Financial Highlights (continued)
For a share outstanding throughout each period.
| Natixis U.S. Equity Opportunities Fund—Class Y | ||||||||||||||||||||
| Year Ended December 31, 2016 |
Year Ended December 31, 2015 |
Year Ended December 31, 2014 |
Year Ended December 31, 2013 |
Year Ended December 31, 2012 |
||||||||||||||||
| Net asset value, beginning of the period |
$ | 31.61 | $ | 31.18 | $ | 36.32 | $ | 28.68 | $ | 25.52 | ||||||||||
|
|
|
|
|
|
|
|
|
|
|
|||||||||||
| INCOME (LOSS) FROM INVESTMENT OPERATIONS: |
||||||||||||||||||||
| Net investment income(a) |
0.21 | 0.15 | 0.12 | 0.05 | 0.17 | |||||||||||||||
| Net realized and unrealized gain (loss) |
3.59 | 1.76 | 4.74 | 10.17 | 4.46 | |||||||||||||||
|
|
|
|
|
|
|
|
|
|
|
|||||||||||
| Total from Investment Operations |
3.80 | 1.91 | 4.86 | 10.22 | 4.63 | |||||||||||||||
|
|
|
|
|
|
|
|
|
|
|
|||||||||||
| LESS DISTRIBUTIONS FROM: |
||||||||||||||||||||
| Net investment income |
(0.19 | ) | (0.07 | ) | — | — | (0.14 | ) | ||||||||||||
| Net realized capital gains |
(0.45 | ) | (1.41 | ) | (10.00 | ) | (2.58 | ) | (1.33 | ) | ||||||||||
|
|
|
|
|
|
|
|
|
|
|
|||||||||||
| Total Distributions |
(0.64 | ) | (1.48 | ) | (10.00 | ) | (2.58 | ) | (1.47 | ) | ||||||||||
|
|
|
|
|
|
|
|
|
|
|
|||||||||||
| Net asset value, end of the period |
$ | 34.77 | $ | 31.61 | $ | 31.18 | $ | 36.32 | $ | 28.68 | ||||||||||
|
|
|
|
|
|
|
|
|
|
|
|||||||||||
| Total return |
12.13 | % | 6.11 | % | 13.25 | % | 36.06 | %(b) | 18.15 | %(b) | ||||||||||
| RATIOS TO AVERAGE NET ASSETS: |
||||||||||||||||||||
| Net assets, end of the period (000’s) |
$ | 143,231 | $ | 70,643 | $ | 37,636 | $ | 24,661 | $ | 11,035 | ||||||||||
| Net expenses |
0.98 | %(c) | 1.00 | %(d) | 1.05 | %(e) | 1.05 | %(f) | 1.05 | %(f) | ||||||||||
| Gross expenses |
0.98 | %(c) | 1.00 | % | 1.05 | %(e) | 1.07 | % | 1.10 | % | ||||||||||
| Net investment income |
0.63 | % | 0.46 | % | 0.32 | % | 0.13 | % | 0.61 | % | ||||||||||
| Portfolio turnover rate |
17 | % | 20 | % | 93 | %(g) | 50 | % | 52 | % | ||||||||||
| (a) | Per share net investment income has been calculated using the average shares outstanding during the period. |
| (b) | Had certain expenses not been waived/reimbursed during the period, total returns would have been lower. |
| (c) | Includes fee/expense recovery of less than 0.01%. |
| (d) | Effective July 1, 2015, the expense limit decreased from 1.05% to 1.00%. |
| (e) | Includes fee/expense recovery of 0.01%. |
| (f) | The investment adviser agreed to waive its fees and/or reimburse a portion of the Fund’s expenses during the period. Without this waiver/reimbursement, expenses would have been higher. |
| (g) | The variation in the Fund’s turnover rate from 2013 to 2014 was primarily due to the change in the structure of the Fund from four segments to two segments. |
See accompanying notes to financial statements.
| 56
Table of Contents
December 31, 2016
1. Organization. Natixis Funds Trust I and Natixis Funds Trust II (the “Trusts” and each a “Trust”) are each organized as a Massachusetts business trust. Each Trust is registered under the Investment Company Act of 1940, as amended (the “1940 Act”), as an open-end management investment company. Each Declaration of Trust permits the Board of Trustees to authorize the issuance of an unlimited number of shares of the Trust in multiple series. The financial statements for certain funds of the Trusts are presented in separate reports. The following funds (individually, a “Fund” and collectively, the “Funds”) are included in this report:
Natixis Funds Trust I:
Loomis Sayles Multi-Asset Income Fund
Natixis U.S. Equity Opportunities Fund (the “U.S. Equity Opportunities Fund”)
Natixis Funds Trust II:
McDonnell Intermediate Municipal Bond Fund (the “Intermediate Municipal Bond Fund”)
Each Fund is a diversified investment company.
Each Fund offers Class A, Class C and Class Y shares. Multi-Asset Income Fund also offers Class N shares. As of the close of business on January 11, 2016, Class B shares of U.S. Equity Opportunities Fund were converted into Class A shares and are no longer offered.
Class A shares are sold with a maximum front-end sales charge of 3.00% and 4.25% for Intermediate Municipal Bond Fund and Multi-Asset Income Fund, respectively, and 5.75% for U.S. Equity Opportunities Fund. Class C shares do not pay a front-end sales charge, pay higher ongoing Rule 12b-1 fees than Class A shares and may be subject to a CDSC of 1.00% if those shares are redeemed within one year of acquisition, except for reinvested distributions. Class N and Class Y shares do not pay a front-end sales charge, a CDSC or Rule 12b-1 fees. Class N shares are offered with no initial minimum investment to certain retirement plans held in an omnibus fashion and fund of funds that are distributed by NGAM Distribution, L.P. and with an initial minimum investment of $1,000,000 to other categories of investors. Class Y shares are intended for institutional investors with a minimum initial investment of $100,000. Some categories of investors are exempted from the minimum investment amount as outlined in the Funds’ prospectus.
Most expenses can be directly attributed to a Fund. Expenses which cannot be directly attributed to a Fund are generally apportioned based on the relative net assets of each of the funds in Natixis Funds Trust I, Natixis Funds Trust II, Natixis Funds Trust IV, Gateway Trust, Natixis ETF Trust (“Natixis Funds Trusts”), Loomis Sayles Funds I and Loomis Sayles Funds II (“Loomis Sayles Funds Trusts”). Expenses of a Fund are borne pro rata by the holders of each class of shares, except that each class bears expenses unique to that class (such as the Rule 12b-1 fees applicable to Class A and Class C and,
57 |
Table of Contents
Notes to Financial Statements (continued)
December 31, 2016
for Multi-Asset Income Fund, transfer agent fees). In addition, each class votes as a class only with respect to its own Rule 12b-1 Plan. Shares of each class would receive their pro rata share of the net assets of a Fund if the Fund were liquidated. The Trustees approve separate distributions from net investment income on each class of shares.
2. Significant Accounting Policies. The following is a summary of significant accounting policies consistently followed by each Fund in the preparation of its financial statements. The Funds’ financial statements follow the accounting and reporting guidelines provided for investment companies and are prepared in accordance with accounting principles generally accepted in the United States of America which require the use of management estimates that affect the reported amounts and disclosures in the financial statements. Actual results could differ from those estimates. Management has evaluated the events and transactions subsequent to year-end through the date the financial statements were issued and has determined that there were no material events that would require disclosure in the Funds’ financial statements.
a. Valuation. Fund securities and other investments are valued at market value based on market quotations obtained or determined by independent pricing services recommended by the adviser and subadvisers and approved by the Board of Trustees. Fund securities and other investments for which market quotations are not readily available are valued at fair value as determined in good faith by the adviser or subadviser pursuant to procedures approved by the Board of Trustees, as described below. Market value is determined as follows:
Listed equity securities (including shares of closed-end investment companies and exchange-traded funds) are valued at the last sale price quoted on the exchange where they are traded most extensively or, if there is no reported sale during the day, the closing bid quotation as reported by an independent pricing service. Securities traded on the NASDAQ Global Select Market, NASDAQ Global Market and NASDAQ Capital Market are valued at the NASDAQ Official Closing Price (“NOCP”), or if lacking an NOCP, at the most recent bid quotations on the applicable NASDAQ Market. Unlisted equity securities (except unlisted preferred equity securities) are valued at the last sale price quoted in the market where they are traded most extensively or, if there is no reported sale during the day, the closing bid quotation as reported by an independent pricing service. If there is no last sale price or closing bid quotation available, unlisted equity securities will be valued using evaluated bids furnished by an independent pricing service, if available. In some foreign markets, an official close price and a last sale price may be available from the foreign exchange or market. In those cases, the official close price is used. Debt securities and unlisted preferred equity securities are valued based on evaluated bids furnished to the Fund by an independent pricing service or bid prices obtained from broker-dealers. Senior loans are valued at bid prices supplied by an independent pricing service, if available.
| 58
Table of Contents
Notes to Financial Statements (continued)
December 31, 2016
Broker-dealer bid prices may be used to value debt and unlisted equity securities and senior loans where an independent pricing service is unable to price a security or where an independent pricing service does not provide a reliable price for the security. Futures contracts are valued at the most recent settlement price on the exchange on which the adviser or subadviser believes that, over time, they are traded most extensively.
Fund securities and other investments for which market quotations are not readily available are valued at fair value as determined in good faith by the adviser or subadviser pursuant to procedures approved by the Board of Trustees. The Funds may also value securities and other investments at fair value in other circumstances such as when extraordinary events occur after the close of a foreign market but prior to the close of the New York Stock Exchange (“NYSE”). This may include situations relating to a single issuer (such as a declaration of bankruptcy or a delisting of the issuer’s security from the primary market on which it has traded) as well as events affecting the securities markets in general (such as market disruptions or closings and significant fluctuations in U.S. and/or foreign markets). When fair valuing its securities or other investments, the Funds may, among other things, use modeling tools or other processes that may take into account factors such as securities or other market activity and/or significant events that occur after the close of the foreign market and before the time the Fund’s net asset value (“NAV”) is calculated. Fair value pricing may require subjective determinations about the value of a security, and fair values used to determine a Fund’s NAV may differ from quoted or published prices, or from prices that are used by others, for the same securities. In addition, the use of fair value pricing may not always result in adjustments to the prices of securities held by a Fund.
As of December 31, 2016, securities and other investments of the funds included in net assets were fair valued as follows:
| Fund |
Equity |
Percentage of |
||||||
| Multi-Asset Income Fund |
$ | 4,209,183 | 3.40 | % | ||||
| 1 | Certain foreign equity securities were fair valued pursuant to procedures approved by the Board of Trustees as events occurring after the close of the foreign market were believed to materially affect the value of those securities. |
b. Investment Transactions and Related Investment Income. Investment transactions are accounted for on a trade date plus one day basis for daily NAV calculation. However, for financial reporting purposes, investment transactions are reported on trade date. Dividend income is recorded on ex-dividend date, or in the case of certain foreign securities, as soon as a Fund is notified, and interest income is recorded on an accrual basis. Interest income is increased by the accretion of discount and decreased by the amortization of premium, if applicable. Periodic principal adjustments for
59 |
Table of Contents
Notes to Financial Statements (continued)
December 31, 2016
inflation-protected securities are recorded to interest income. Negative principal adjustments (in the event of deflation) are recorded as reductions of interest income to the extent of interest income earned, not to exceed the amount of positive principal adjustments on a cumulative basis. Distributions received from investments in securities that represent a return of capital or capital gain are recorded as a reduction of cost of the investments or as a realized gain, respectively. The calendar year-end amounts of ordinary income, capital gains, and return of capital included in distributions received from the Funds’ investments in real estate investment trusts (“REITs”) are reported to the Funds after the end of the fiscal year; accordingly, the Funds estimate these amounts for accounting purposes until the characterization of REIT distributions is reported to the Funds after the end of the fiscal year. Estimates are based on the most recent REIT distribution information available. In determining net gain or loss on securities sold, the cost of securities has been determined on an identified cost basis. Investment income, non-class specific expenses and realized and unrealized gains and losses are allocated on a pro rata basis to each class based on the relative net assets of each class to the total net assets of the Fund.
c. Foreign Currency Translation. The books and records of the Funds are maintained in U.S. dollars. The values of securities, currencies and other assets and liabilities denominated in currencies other than U.S. dollars are translated into U.S. dollars based upon foreign exchange rates prevailing at the end of the period. Purchases and sales of investment securities, income and expenses are translated into U.S. dollars on the respective dates of such transactions.
Net realized foreign exchange gains or losses arise from sales of foreign currency, changes in exchange rates between the trade and settlement dates on securities transactions and the difference between the amounts of dividends, interest and foreign withholding taxes recorded on the Fund’s books and the U.S. dollar equivalent of the amounts actually received or paid. Net unrealized foreign exchange gains or losses arise from changes in the value of assets and liabilities, other than investment securities, as of the end of the fiscal period, resulting from changes in exchange rates. Net realized foreign exchange gains or losses and the net change in unrealized foreign exchange gains or losses are disclosed in the Statements of Operations. For federal income tax purposes, net realized foreign exchange gains or losses are characterized as ordinary income, and may, if the Funds have net losses, reduce or eliminate the amount of income available to be distributed by the Funds.
The values of investment securities are presented at the foreign exchange rates prevailing at the end of the period for financial reporting purposes. Net realized and unrealized gains or losses on investments reported in the Statements of Operations reflect gains or losses resulting from changes in exchange rates and fluctuations which arise due to changes in market prices of investment securities. For federal income tax purposes, a portion of the net realized gain or loss on investments arising
| 60
Table of Contents
Notes to Financial Statements (continued)
December 31, 2016
from changes in exchange rates, which is reflected in the Statements of Operations, may be characterized as ordinary income and may, if the Funds have net losses, reduce the amount of income available to be distributed by the Funds.
For the year ended December 31, 2016, the amount of income available to be distributed by Multi-Asset Income Fund has been reduced by $1,458,133 as a result of losses arising from changes in exchange rates.
The Funds may use foreign currency exchange contracts to facilitate transactions in foreign-denominated investments. Losses may arise from changes in the value of the foreign currency or if the counterparties do not perform under the contracts’ terms.
d. Futures Contracts. The Funds may enter into futures contracts. Futures contracts are agreements between two parties to buy and sell a particular instrument or index for a specified price on a specified future date.
When a Fund enters into a futures contract, it is required to deposit with (or for the benefit of) its broker an amount of cash or short-term high-quality securities as “initial margin.” As the value of the contract changes, the value of the futures contract position increases or declines. Subsequent payments, known as “variation margin,” are made or received by a Fund, depending on the price fluctuations in the fair value of the contract and the value of cash or securities on deposit with the broker. The aggregate principal amounts of the contracts are not recorded in the financial statements. Fluctuations in the value of the contracts are recorded in the Statements of Assets and Liabilities as an asset (liability) and in the Statements of Operations as unrealized appreciation (depreciation) until the contracts are closed, when they are recorded as realized gains (losses). Realized gain or loss on a futures position is equal to the difference between the value of the contract at the time it was opened and the value at the time it was closed, minus brokerage commissions. When a Fund enters into a futures contract certain risks may arise, such as illiquidity in the futures market, which may limit a Fund’s ability to close out a futures contract prior to settlement date, and unanticipated movements in the value of securities or interest rates.
Futures contracts are exchange-traded. Exchange-traded futures contracts are standardized and are settled through a clearing house with fulfillment supported by the credit of the exchange. Therefore, counterparty credit risks to the Funds are reduced; however, in the event that a counterparty enters into bankruptcy, a Fund’s claim against initial/variation margin on deposit with the counterparty may be subject to terms of a final settlement in bankruptcy court.
e. Federal and Foreign Income Taxes. The Trusts treat each Fund as a separate entity for federal income tax purposes. Each Fund intends to meet the requirements of the Internal Revenue Code of 1986, as amended, applicable to regulated investment companies, and to distribute to its shareholders substantially all of its net investment income and any net realized capital gains at least annually. Management has
61 |
Table of Contents
Notes to Financial Statements (continued)
December 31, 2016
performed an analysis of each Fund’s tax positions for the open tax years as of December 31, 2016 and has concluded that no provisions for income tax are required. The Funds’ federal tax returns for the prior three fiscal years remain subject to examination by the Internal Revenue Service. Management is not aware of any events that are reasonably possible to occur in the next twelve months that would result in the amounts of any unrecognized tax benefits significantly increasing or decreasing for the Funds. However, management’s conclusions regarding tax positions taken may be subject to review and adjustment at a later date based on factors including, but not limited to, new tax laws and accounting regulations and interpretations thereof.
A Fund may be subject to foreign withholding taxes on investment income and taxes on capital gains on investments that are accrued and paid based upon the Fund’s understanding of the tax rules and regulations that exist in the countries in which the Fund invests. Foreign withholding taxes on dividend and interest income are reflected on the Statements of Operations as a reduction of investment income, net of amounts eligible to be reclaimed. Dividends and interest receivable on the Statements of Assets and Liabilities are net of foreign withholding taxes. Foreign withholding taxes where reclaims have been or will be filed are reflected on the Statements of Assets and Liabilities as tax reclaims receivable. Capital gains taxes paid are included in net realized gain (loss) on investments in the Statements of Operations. Accrued but unpaid capital gains taxes are reflected as foreign taxes payable on the Statements of Assets and Liabilities, if applicable, and reduce unrealized gains on investments. In the event that realized gains on investments are subsequently offset by realized losses, taxes paid on realized gains may be returned to a Fund. Such amounts, if applicable, are reflected as foreign tax rebates receivable on the Statements of Assets and Liabilities and are recorded as a realized gain when received.
f. Dividends and Distributions to Shareholders. Dividends and distributions are recorded on ex-dividend date. The timing and characterization of certain income and capital gain distributions are determined in accordance with federal tax regulations, which may differ from accounting principles generally accepted in the United States of America. Permanent differences are primarily due to differing treatments for book and tax purposes of items such as deferred Trustees’ fees, defaulted and/or non-income producing securities, premium amortization, trust preferred securities, distribution redesignations, passive foreign investment company adjustments and foreign currency gains and losses. Permanent book and tax basis differences relating to shareholder distributions, net investment income and net realized gains will result in reclassifications to capital accounts reported on the Statements of Assets and Liabilities. Temporary differences between book and tax distributable earnings are primarily due to deferred Trustees’ fees, premium amortization and wash sales. Amounts of income and capital gain available to be distributed on a tax basis are determined annually, and at other times during the Funds’ fiscal year as may be necessary to avoid knowingly declaring and paying a return of capital distribution.
| 62
Table of Contents
Notes to Financial Statements (continued)
December 31, 2016
Distributions from net investment income and short-term capital gains are considered to be distributed from ordinary income for tax purposes.
The tax characterization of distributions is determined on an annual basis. The tax character of distributions paid to shareholders during the years ended December 31, 2016 and 2015 was as follows:
| 2016 Distributions Paid From: | ||||||||||||||||
| Fund |
Ordinary |
Tax Exempt |
Long-Term |
Total |
||||||||||||
| Multi-Asset Income Fund |
$ | 3,154,985 | $ | — | $ | 4,548,260 | $ | 7,703,245 | ||||||||
| Intermediate Municipal Bond Fund |
— | 1,255,515 | — | 1,255,515 | ||||||||||||
| U.S. Equity Opportunities Fund |
2,594,980 | — | 9,731,549 | 12,326,529 | ||||||||||||
| 2015 Distributions Paid From: | ||||||||||||||||
| Fund |
Ordinary |
Tax Exempt |
Long-Term |
Total |
||||||||||||
| Multi-Asset Income Fund |
$ | 3,542,036 | $ | — | $ | — | $ | 3,542,036 | ||||||||
| Intermediate Municipal Bond Fund |
— | 565,474 | — | 565,474 | ||||||||||||
| U.S. Equity Opportunities Fund |
7,472,234 | — | 20,618,016 | 28,090,250 | ||||||||||||
Differences between these amounts and those reported in the Statements of Changes in Net Assets are primarily attributable to different book and tax treatment for short-term capital gains.
As of December 31, 2016, the components of distributable earnings on a tax basis were as follows:
|
Multi-Asset |
Intermediate |
U.S. Equity |
||||||||||
| Undistributed ordinary income |
$ | — | $ | — | $ | 49,341 | ||||||
| Undistributed tax exempt income |
— | 12,487 | — | |||||||||
| Undistributed long-term capital gains |
10,994 | — | 2,694,383 | |||||||||
|
|
|
|
|
|
|
|||||||
| Total undistributed earnings |
10,994 | 12,487 | 2,743,724 | |||||||||
|
|
|
|
|
|
|
|||||||
63 |
Table of Contents
Notes to Financial Statements (continued)
December 31, 2016
|
Multi-Asset |
Intermediate |
U.S. Equity |
||||||||||
| Capital loss carryforward: |
||||||||||||
| Short-term: |
| |||||||||||
| No expiration date |
$ | — | $ | (758,960 | ) | $ | — | |||||
|
|
|
|
|
|
|
|||||||
| Total capital loss carryforward |
— | (758,960 | ) | — | ||||||||
|
|
|
|
|
|
|
|||||||
| Late-year ordinary and post-October capital loss deferrals* |
(436,967 | ) | — | — | ||||||||
|
|
|
|
|
|
|
|||||||
| Unrealized appreciation (depreciation) |
4,172,327 | (190,241 | ) | 128,878,327 | ||||||||
|
|
|
|
|
|
|
|||||||
| Total accumulated earnings (losses) |
$ | 3,746,354 | $ | (936,714 | ) | $ | 131,622,051 | |||||
|
|
|
|
|
|
|
|||||||
| Capital loss carryforward utilized in the current year |
$ | 1,247,430 | $ | — | $ | — | ||||||
|
|
|
|
|
|
|
|||||||
| * | Under current tax law, capital losses, foreign currency losses, and losses on passive foreign investment companies and contingent payment debt instruments after October 31 or December 31, as applicable, may be deferred and treated as occurring on the first day of the following taxable year. Multi-Asset Income Fund is deferring capital and foreign currency losses that occurred after October 31, 2016. |
As of December 31, 2016, unrealized appreciation (depreciation) on a tax basis was approximately as follows:
|
Multi-Asset |
Intermediate |
U.S. Equity |
||||||||||
| Unrealized appreciation (depreciation) |
||||||||||||
| Investments |
$ | 4,148,919 | $ | (190,241 | ) | $ | 128,878,327 | |||||
| Foreign currency translations |
23,408 | — | — | |||||||||
|
|
|
|
|
|
|
|||||||
| Total unrealized appreciation (depreciation) |
$ | 4,172,327 | $ | (190,241 | ) | $ | 128,878,327 | |||||
|
|
|
|
|
|
|
|||||||
g. Repurchase Agreements. Each Fund may enter into repurchase agreements, under the terms of a Master Repurchase Agreement, under which each Fund acquires securities as collateral and agrees to resell the securities at an agreed upon time and at an agreed upon price. It is each Fund’s policy that the market value of the collateral for repurchase agreements be at least equal to 102% of the repurchase price, including interest. Certain repurchase agreements are tri-party arrangements whereby the collateral is held in a segregated account for the benefit of the Fund and on behalf of the counterparty. Repurchase agreements could involve certain risks in the event of default or insolvency of the counterparty, including possible delays or restrictions upon a Fund’s ability to dispose of the underlying securities. As of December 31, 2016, each Fund, as applicable, had investments in repurchase agreements for which the value of
| 64
Table of Contents
Notes to Financial Statements (continued)
December 31, 2016
the related collateral exceeded the value of the repurchase agreement. The gross value of repurchase agreements is included in the Statements of Assets and Liabilities for financial reporting purposes.
h. When-Issued and Delayed Delivery Transactions. The Funds may enter into when-issued or delayed delivery transactions. When-issued refers to transactions made conditionally because a security, although authorized, has not been issued. Delayed delivery refers to transactions for which delivery or payment will occur at a later date, beyond the normal settlement period. The price of when-issued and delayed delivery securities and the date when the securities will be delivered and paid for are fixed at the time the transaction is negotiated. The security and the obligation to pay for it are recorded by the Funds at the time the commitment is entered into. The value of the security may vary with market fluctuations during the time before the Funds take delivery of the security. No interest accrues to the Funds until the transaction settles.
Delayed delivery transactions include those designated as To Be Announced (“TBAs”) in the Portfolios of Investments. For TBAs, the actual security that will be delivered to fulfill the transaction is not designated at the time of the trade. The security is “to be announced” 48 hours prior to the established trade settlement date. Certain transactions require the Funds or counterparty to post cash and/or securities as collateral for the net mark-to-market exposure to the other party. The Funds cover their net obligations under outstanding delayed delivery commitments by segregating or earmarking cash or securities at the custodian.
Purchases of when-issued or delayed delivery securities may have a similar effect on the Funds’ NAV as if the Funds’ had created a degree of leverage in the portfolio. Risks may arise upon entering into such transactions from the potential inability of counterparties to meet their obligations under the transactions. Additionally, losses may arise due to changes in the value of the underlying securities.
There were no when-issued or delayed delivery securities held by the Funds as of December 31, 2016.
i. Securities Lending. The Funds have entered into an agreement with State Street Bank and Trust Company (“State Street Bank”), as agent of the Funds, to lend securities to certain designated borrowers. The loans are collateralized with cash or securities in an amount equal to at least 105% or 102% of the market value (including accrued interest) of the loaned international or domestic securities, respectively, when the loan is initiated. Thereafter, the value of the collateral must remain at least 102% of the market value (including accrued interest) of loaned securities for U.S. equities and U.S. corporate debt; at least 105% of the market value (including accrued interest) of loaned securities for non-U.S. equities; and at least 100% of the market value (including accrued interest) of loaned securities for U.S. Government securities, sovereign debt issued by non-U.S. Governments and non-U.S. corporate debt. In the event that the
65 |
Table of Contents
Notes to Financial Statements (continued)
December 31, 2016
market value of the collateral falls below the required percentages described above, the borrower will deliver additional collateral on the next business day. As with other extensions of credit, the Funds may bear the risk of loss with respect to the investment of the collateral. The Funds invest cash collateral in short-term investments, a portion of the income from which is remitted to the borrowers and the remainder allocated between the Funds and State Street Bank as lending agent.
For the year ended December 31, 2016, none of the Funds had loaned securities under this agreement.
j. Indemnifications. Under the Trusts’ organizational documents, their officers and Trustees are indemnified against certain liabilities arising out of the performance of their duties to the Funds. Additionally, in the normal course of business, the Funds enter into contracts with service providers that contain general indemnification clauses. The Funds’ maximum exposure under these arrangements is unknown as this would involve future claims that may be made against the Funds that have not yet occurred. However, based on experience, the Funds expect the risk of loss to be remote.
k. New Accounting Pronouncement. In October 2016, the SEC adopted amendments to rules under the Investment Company Act of 1940 (“final rules”) intended to modernize the reporting and disclosure of information by registered investment companies. The final rules amend Regulation S-X and require funds to provide standardized, enhanced derivative disclosures in fund financial statements in a format designed for individual investors. The amendments to Regulation S-X also update the disclosures for other investments, including investments in and advances to affiliates, and amend the rules regarding the general form and content of fund financial statements. The compliance date for the amendments to Regulation S-X is August 1, 2017. Management is currently evaluating the amendments and the impact, if any, on the Fund’s financial statements.
3. Fair Value Measurements. In accordance with accounting standards related to fair value measurements and disclosures, the Funds have categorized the inputs utilized in determining the value of each Fund’s assets or liabilities. These inputs are summarized in the three broad levels listed below:
| • | Level 1 – quoted prices in active markets for identical assets or liabilities; |
| • | Level 2 – prices determined using other significant inputs that are observable either directly, or indirectly through corroboration with observable market data (which could include quoted prices for similar assets or liabilities, interest rates, credit risk, etc.); and |
| • | Level 3 – prices determined using significant unobservable inputs when quoted prices or observable inputs are unavailable such as when there is little or no market activity for an asset or liability (unobservable inputs reflect each Fund’s |
| 66
Table of Contents
Notes to Financial Statements (continued)
December 31, 2016
| own assumptions in determining the fair value of assets or liabilities and would be based on the best information available). |
The inputs or methodology used for valuing securities are not necessarily an indication of the risk associated with investing in those securities.
The following is a summary of the inputs used to value the Funds’ investments as of December 31, 2016, at value:
Multi-Asset Income Fund
Asset Valuation Inputs
| Description |
Level 1 |
Level 2 |
Level 3 |
Total |
||||||||||||
| Common Stocks |
||||||||||||||||
| Air Freight & Logistics |
$ | — | $ | 168,416 | $ | — | $ | 168,416 | ||||||||
| Banks |
8,820,999 | 58,766 | — | 8,879,765 | ||||||||||||
| Beverages |
1,671,338 | 28,494 | — | 1,699,832 | ||||||||||||
| Chemicals |
930,645 | 114,753 | — | 1,045,398 | ||||||||||||
| Commercial Services & Supplies |
186,281 | 194,328 | — | 380,609 | ||||||||||||
| Construction & Engineering |
— | 449,192 | — | 449,192 | ||||||||||||
| Construction Materials |
— | 182,797 | — | 182,797 | ||||||||||||
| Distributors |
— | 47,015 | — | 47,015 | ||||||||||||
| Diversified Consumer Services |
— | 184,082 | — | 184,082 | ||||||||||||
| Diversified Financial Services |
— | 126,033 | — | 126,033 | ||||||||||||
| Diversified Telecommunication Services |
1,366,396 | 155,556 | — | 1,521,952 | ||||||||||||
| Electric Utilities |
1,822,630 | 324,020 | — | 2,146,650 | ||||||||||||
| Food Products |
752,126 | 177,523 | — | 929,649 | ||||||||||||
| IT Services |
926,638 | 153,132 | — | 1,079,770 | ||||||||||||
| Leisure Products |
— | 84,702 | — | 84,702 | ||||||||||||
| Metals & Mining |
— | 93,015 | — | 93,015 | ||||||||||||
| Oil, Gas & Consumable Fuels |
3,849,483 | 105,580 | — | 3,955,063 | ||||||||||||
| Pharmaceuticals |
2,887,750 | 509,608 | — | 3,397,358 | ||||||||||||
| Tobacco |
1,359,258 | 367,772 | — | 1,727,030 | ||||||||||||
| Trading Companies & Distributors |
— | 684,399 | — | 684,399 | ||||||||||||
| All Other Common Stocks(a) |
19,596,439 | — | — | 19,596,439 | ||||||||||||
|
|
|
|
|
|
|
|
|
|||||||||
| Total Common Stocks |
44,169,983 | 4,209,183 | — | 48,379,166 | ||||||||||||
|
|
|
|
|
|
|
|
|
|||||||||
67 |
Table of Contents
Notes to Financial Statements (continued)
December 31, 2016
Multi-Asset Income Fund (continued)
Asset Valuation Inputs (continued)
| Description |
Level 1 |
Level 2 |
Level 3 |
Total |
||||||||||||
| Bonds and Notes(a) |
$ | — | $ | 38,350,213 | $ | — | $ | 38,350,213 | ||||||||
| Exchange-Traded Funds & Notes |
21,772,570 | — | — | 21,772,570 | ||||||||||||
| Senior Loans(a) |
— | 8,879,691 | — | 8,879,691 | ||||||||||||
| Preferred Stocks |
||||||||||||||||
| Banking |
— | 1,616,640 | — | 1,616,640 | ||||||||||||
| Consumer Cyclical Services |
570,680 | — | — | 570,680 | ||||||||||||
|
|
|
|
|
|
|
|
|
|||||||||
| Total Preferred Stocks |
570,680 | 1,616,640 | — | 2,187,320 | ||||||||||||
|
|
|
|
|
|
|
|
|
|||||||||
| Short-Term Investments |
— | 5,916,420 | — | 5,916,420 | ||||||||||||
|
|
|
|
|
|
|
|
|
|||||||||
| Total |
$ | 66,513,233 | $ | 58,872,147 | $ | — | $ | 125,385,380 | ||||||||
|
|
|
|
|
|
|
|
|
|||||||||
| (a) | Details of the major categories of the Fund’s investments are reflected within the Portfolio of Investments. |
A common stock valued at $12,774 was transferred from Level 1 to Level 2 during the period ended December 31, 2016. At December 31, 2015, this security was valued at the market price in the foreign market in accordance with the Fund’s valuation policies. At December 31, 2016, this security was fair valued pursuant to procedures approved by the Board of Trustees as events occurring after the close of the foreign market were believed to materially affect the value of the security.
All transfers are recognized as of the beginning of the reporting period.
Intermediate Municipal Bond Fund
Asset Valuation Inputs
| Description |
Level 1 |
Level 2 |
Level 3 |
Total |
||||||||||||
| Bonds and Notes(a) |
$ | — | $ | 59,157,102 | $ | — | $ | 59,157,102 | ||||||||
| Short-Term Investments |
— | 825,519 | — | 825,519 | ||||||||||||
|
|
|
|
|
|
|
|
|
|||||||||
| Total |
$ | — | $ | 59,982,621 | $ | — | $ | 59,982,621 | ||||||||
|
|
|
|
|
|
|
|
|
|||||||||
| (a) | Details of the major categories of the Fund’s investments are reflected within the Portfolio of Investments. |
For the year ended December 31, 2016, there were no transfers among Levels 1, 2 and 3.
| 68
Table of Contents
Notes to Financial Statements (continued)
December 31, 2016
U.S. Equity Opportunities Fund
Asset Valuation Inputs
| Description |
Level 1 |
Level 2 |
Level 3 |
Total |
||||||||||||
| Common Stocks(a) |
$ | 658,998,562 | $ | — | $ | — | $ | 658,998,562 | ||||||||
| Short-Term Investments |
— | 29,406,475 | — | 29,406,475 | ||||||||||||
|
|
|
|
|
|
|
|
|
|||||||||
| Total |
$ | 658,998,562 | $ | 29,406,475 | $ | — | $ | 688,405,037 | ||||||||
|
|
|
|
|
|
|
|
|
|||||||||
| (a) | Details of the major categories of the Fund’s investments are reflected within the Portfolio of Investments. |
For the year ended December 31, 2016, there were no transfers among Levels 1, 2 and 3.
The following is a reconciliation of Level 3 investments for which significant unobservable inputs were used to determine fair value as of December 31, 2015 and/or December 31, 2016:
Multi-Asset Income Fund
Asset Valuation Inputs
| Investments in Securities |
Balance as of |
Accrued |
Realized |
Change in |
Purchases |
|||||||||||||||
| Bonds and Notes |
||||||||||||||||||||
| Non-Convertible Bonds |
||||||||||||||||||||
| Building Materials |
$ | 40,758 | $ | 2 | $ | (110,921 | ) | $ | 108,665 | $ | — | |||||||||
|
|
|
|
|
|
|
|
|
|
|
|||||||||||
| Investments in Securities |
Sales |
Transfers |
Transfers |
Balance as of |
Change
in |
|||||||||||||||
| Bonds and Notes |
||||||||||||||||||||
| Non-Convertible Bonds |
||||||||||||||||||||
| Building Materials |
$ | (38,504 | ) | $ | — | $ | — | $ | — | $ | — | |||||||||
|
|
|
|
|
|
|
|
|
|
|
|||||||||||
69 |
Table of Contents
Notes to Financial Statements (continued)
December 31, 2016
4. Derivatives. Derivative instruments are defined as financial instruments whose value and performance are based on the value and performance of an underlying asset, reference rate or index. The derivative instrument that Multi-Asset Income Fund used during the period includes futures contracts.
Multi-Asset Income Fund is subject to the risk of unpredictable declines in the value of individual equity securities and periods of below-average performance in individual securities or in the equity market as a whole. The Fund may use futures contracts to hedge against a decline in value of an equity security that it owns. The Fund may also use futures contracts for investment purposes. During the year ended December 31, 2016, the Fund used futures contracts to gain investment exposure.
Transactions in derivative instruments for Multi-Asset Income Fund during the year ended December 31, 2016 as reflected within the Statements of Operations were as follows:
| Net Realized Gain (Loss) on: |
Futures |
|||
| Equity Contracts |
$ | (289,466 | ) | |
As the Funds value their derivatives at fair value and recognize changes in fair value through the Statements of Operations, they do not qualify for hedge accounting under authoritative guidance for derivative instruments. The Funds’ investments in derivatives may represent an economic hedge; however, they are considered to be non-hedge transactions for the purpose of these disclosures.
The volume of futures contract activity, as a percentage of net assets, for Multi-Asset Income Fund is based on gross month-end or daily (as applicable) notional amounts outstanding during the period, including long and short positions at absolute value, was as follows for the year ended December 31, 2016:
| Multi-Asset Income Fund |
Futures |
|||
| Average Notional Amount Outstanding |
0.20 | % | ||
| Highest Notional Amount Outstanding |
3.01 | % | ||
| Lowest Notional Amount Outstanding |
0.00 | % | ||
| Notional Amount Outstanding as of |
0.00 | % | ||
Notional amounts outstanding at the end of the prior period are included in the average notional amount outstanding.
Unrealized gain and/or loss on open futures is recorded in the Statements of Assets and Liabilities. The aggregate notional values of futures are not recorded in the Statements of Assets and Liabilities, and therefore are not included in the Fund’s net assets.
| 70
Table of Contents
Notes to Financial Statements (continued)
December 31, 2016
5. Purchases and Sales of Securities. For the year ended December 31, 2016, purchases and sales of securities (excluding short-term investments and U.S. Government/Agency securities and option contracts and including paydowns) were as follows:
| Fund |
Purchases |
Sales |
||||||
| Multi-Asset Income Fund |
$ | 346,429,247 | $ | 350,238,620 | ||||
| Intermediate Municipal Bond Fund |
40,242,026 | 49,755,045 | ||||||
| U.S. Equity Opportunities Fund |
150,329,163 | 97,245,084 | ||||||
For the year ended December 31, 2016, purchases and sales of U.S. Government/Agency securities by Multi-Asset Income Fund were $44,145,317 and $44,549,050, respectively.
6. Management Fees and Other Transactions with Affiliates.
a. Management Fees. NGAM Advisors, L.P. (“NGAM Advisors”) serves as investment adviser to each Fund. Under the terms of the management agreements, each Fund pays a management fee at the following annual rates, calculated daily and payable monthly, based on each Fund’s average daily net assets:
| Percentage of Average Daily Net Assets | ||||||||
| Fund |
First $1 billion |
Over $1 billion |
||||||
| Multi-Asset Income Fund |
0.55 | % | 0.50 | % | ||||
| Intermediate Municipal Bond Fund |
0.40 | % | 0.40 | % | ||||
| U.S. Equity Opportunities Fund |
0.80 | % | 0.80 | % | ||||
NGAM Advisors has entered into subadvisory agreements for each Fund as listed below.
| Multi-Asset Income Fund |
Loomis, Sayles & Company, L.P. (“Loomis Sayles”) | |
| Intermediate Municipal Bond Fund |
McDonnell Investment Management, LLC (“McDonnell”) | |
| U.S. Equity Opportunities Fund |
Harris Associates L.P. (“Harris”) | |
| Loomis Sayles |
71 |
Table of Contents
Notes to Financial Statements (continued)
December 31, 2016
Under the terms of the subadvisory agreements, each Fund has agreed to pay its respective subadviser(s) a subadvisory fee at the following annual rates, calculated daily and payable monthly, based on each Fund’s/Segment’s average daily net assets:
| Percentage of Average Daily Net Assets |
||||||||||
| Fund |
Subadviser |
First $1 billion |
Over $1 billion |
|||||||
| Multi-Asset Income Fund |
Loomis Sayles | 0.325 | % | 0.30 | % | |||||
| Intermediate Municipal Bond Fund |
McDonnell | 0.20 | % | 0.20 | % | |||||
| U.S. Equity Opportunities Fund |
||||||||||
| Large Cap Growth Segment |
Harris | 0.52 | % | 0.52 | % | |||||
| All Cap Growth Segment |
Loomis Sayles | 0.35 | % | 0.35 | % | |||||
Payments to NGAM Advisors are reduced by the amounts of payments to the subadvisers, as calculated based on the table above.
NGAM Advisors and Natixis AM US have given binding undertakings to the Funds to waive management fees and/or reimburse certain expenses to limit the Funds’ operating expenses, exclusive of acquired fund fees and expenses, brokerage expenses, interest expense, taxes, organizational and extraordinary expenses such as litigation and indemnification expenses. These undertakings are in effect until April 30, 2017, may be terminated before then only with the consent of the Funds’ Board of Trustees, and are reevaluated on an annual basis. Management fees payable, as reflected on the Statements of Assets and Liabilities, is net of waivers and/or expense reimbursements, if any, pursuant to these undertakings. Waivers/reimbursements that exceed management fees payable are reflected on the Statements of Assets and Liabilities as receivable from investment adviser.
For the year ended December 31, 2016 (period ending close of business January 11, 2016, for Class B) the expense limits as a percentage of average daily net assets under the expense limitation agreements were as follows:
| Expense Limit as a Percentage of Average Daily Net Assets |
||||||||||||||||||||
| Fund |
Class A |
Class B |
Class C |
Class N |
Class Y |
|||||||||||||||
| Multi-Asset Income Fund |
0.95 | % | — | 1.70 | % | 0.65 | % | 0.70 | % | |||||||||||
| Intermediate Municipal Bond Fund |
0.70 | % | — | 1.45 | % | — | 0.45 | % | ||||||||||||
| U.S. Equity Opportunities Fund |
1.25 | % | 2.00 | % | 2.00 | % | — | 1.00 | % | |||||||||||
NGAM Advisors and Natixis AM US shall be permitted to recover expenses they have borne under the expense limitation agreements (whether through waiver of its management fees or otherwise) on a class by class basis in later periods to the extent the annual operating expenses of a class fall below a class’ expense limits, provided,
| 72
Table of Contents
Notes to Financial Statements (continued)
December 31, 2016
however, that a class is not obligated to pay such waived/reimbursed fees or expenses more than one year after the end of the fiscal year in which the fees or expenses were waived/reimbursed.
For the year ended December 31, 2016, the management fees and waivers of management fees for each Fund were as follows:
| Fund |
Gross |
Waivers of |
Net |
Percentage of |
||||||||||||||||
| Gross |
Net |
|||||||||||||||||||
| Multi-Asset Income Fund |
$ | 650,601 | $ | 139,165 | $ | 511,436 | 0.55 | % | 0.43 | % | ||||||||||
| Intermediate Municipal Bond Fund |
373,029 | 167,183 | 205,846 | 0.40 | % | 0.22 | % | |||||||||||||
| U.S. Equity Opportunities Fund |
4,649,135 | — | 4,649,135 | 0.80 | % | 0.80 | % | |||||||||||||
| 1 | Management fee waivers are subject to possible recovery until December 31, 2017. |
For the year ended December 31, 2016, class-specific expenses have been reimbursed as follows:
| Reimbursement2 | ||||||||||||||||
| Fund |
Class A |
Class C |
Class N |
Class Y |
||||||||||||
| Multi-Asset Income Fund |
$ | 11,225 | $ | 9,172 | $ | — | $ | 2,582 | ||||||||
| 2 | Expense reimbursements are subject to possible recovery until December 31, 2017, except as noted in Note 6g. |
For the year ended December 31, 2016, expense reimbursements related to the prior fiscal year were recovered as follows:
| Fund |
Recovered Expenses |
|||
| U.S. Equity Opportunities Fund |
$ | 2,238 | ||
Certain officers and directors of NGAM Advisors and its affiliates are also officers or Trustees of the Funds. NGAM Advisors, McDonnell, Loomis Sayles and Harris are subsidiaries of Natixis Global Asset Management, L.P. (“Natixis US”), which is part of Natixis Global Asset Management, an international asset management group based in Paris, France.
b. Service and Distribution Fees. NGAM Distribution, L.P. (“NGAM Distribution”), which is a wholly-owned subsidiary of Natixis US, has entered into a distribution agreement with the Trusts. Pursuant to this agreement, NGAM Distribution serves as principal underwriter of the Funds of the Trusts.
Pursuant to Rule 12b-1 under the 1940 Act, the Trusts have adopted a Service Plan relating to each Fund’s Class A shares (the “Class A Plans”) and a Distribution and
73 |
Table of Contents
Notes to Financial Statements (continued)
December 31, 2016
Service Plan relating to each Fund’s Class B (if applicable) and Class C shares (the “Class B and Class C Plans”).
Under the Class A Plans, each Fund pays NGAM Distribution a monthly service fee at an annual rate not to exceed 0.25% of the average daily net assets attributable to the Funds’ Class A shares, as reimbursement for expenses incurred by NGAM Distribution in providing personal services to investors in Class A shares and/or the maintenance of shareholder accounts.
Under the Class B (if applicable) and Class C Plans, each Fund pays (or paid) NGAM Distribution a monthly service fee at an annual rate not to exceed 0.25% of the average daily net assets attributable to the Funds’ Class B (if applicable) and Class C shares, as compensation for services provided by NGAM Distribution in providing personal services to investors in Class B (if applicable) and Class C shares and/or the maintenance of shareholder accounts.
Also under the Class B (if applicable) and Class C Plans, each Fund pays (or paid) NGAM Distribution a monthly distribution fee at an annual rate of 0.75% of the average daily net assets attributable to the Funds’ Class B (if applicable) and Class C shares, as compensation for services provided by NGAM Distribution in connection with the marketing or sale of Class B (if applicable) and Class C shares.
For the year ended December 31, 2016, the service and distribution fees for each Fund were as follows:
| Service Fees | Distribution Fees | |||||||||||||||||||
| Fund |
Class A |
Class B |
Class C |
Class B |
Class C |
|||||||||||||||
| Multi-Asset Income Fund |
$ | 144,660 | $ | — | $ | 117,893 | $ | — | $ | 353,681 | ||||||||||
| Intermediate Municipal Bond Fund |
28,776 | — | 14,350 | — | 43,049 | |||||||||||||||
| U.S. Equity Opportunities Fund |
1,089,500 | 12 | 157,992 | 37 | 473,975 | |||||||||||||||
c. Administrative Fees. NGAM Advisors provides certain administrative services for the Funds and contracts with State Street Bank to serve as sub-administrator. Pursuant to an agreement among Natixis Funds Trusts, Loomis Sayles Funds Trusts and NGAM Advisors, each Fund pays NGAM Advisors monthly its pro rata portion of fees equal to an annual rate of 0.0575% of the first $15 billion of the average daily net assets of the Natixis Funds Trusts and Loomis Sayles Funds Trusts, 0.0500% of the next $15 billion, 0.0400% of the next $30 billion, 0.0350% of the next $30 billion and 0.0325% of such assets in excess of $90 billion, subject to an annual aggregate minimum fee for the Natixis Funds Trusts and Loomis Sayles Funds Trusts of $10 million, which is reevaluated on an annual basis.
| 74
Table of Contents
Notes to Financial Statements (continued)
December 31, 2016
For the year ended December 31, 2016, the administrative fees for each Fund were as follows:
| Fund |
Administrative |
|||
| Multi-Asset Income Fund |
$ | 52,502 | ||
| Intermediate Municipal Bond Fund |
41,380 | |||
| U.S. Equity Opportunities Fund |
257,981 | |||
d. Sub-Transfer Agent Fees. NGAM Distribution has entered into agreements, which include servicing agreements, with financial intermediaries that provide recordkeeping, processing, shareholder communications and other services to customers of the intermediaries that hold positions in the Funds and has agreed to compensate the intermediaries for providing those services. Intermediaries transact with the Funds primarily through the use of omnibus accounts on behalf of their customers who hold positions in the Funds. These services would have been provided by the Funds’ transfer agent and other service providers if the shareholders’ accounts were maintained directly at the Funds’ transfer agent. Accordingly, the Funds have agreed to reimburse NGAM Distribution for all or a portion of the servicing fees paid to these intermediaries. The reimbursement amounts (sub-transfer agent fees) paid to NGAM Distribution are subject to a current per-account equivalent fee limit approved by the Funds’ Board of Trustees, which is based on fees for similar services paid to the Funds’ transfer agent and other service providers. Class N shares do not bear such expenses.
For the year ended December 31, 2016, the sub-transfer agent fees (which are reflected in transfer agent fees and expenses in the Statements of Operations) for each Fund were as follows:
| Fund |
Sub-Transfer |
|||
| Multi-Asset Income Fund |
$ | 67,385 | ||
| Intermediate Municipal Bond Fund |
14,192 | |||
| U.S. Equity Opportunities Fund |
200,051 | |||
As of December 31, 2016, the Funds owe NGAM Distribution the following reimbursements for sub-transfer agent fees (which are reflected in the Statements of Assets and Liabilities as payable to distributor):
| Fund |
Reimbursements |
|||
| Multi-Asset Income Fund |
$ | 921 | ||
| Intermediate Municipal Bond Fund |
138 | |||
| U.S. Equity Opportunities Fund |
3,014 | |||
75 |
Table of Contents
Notes to Financial Statements (continued)
December 31, 2016
Sub-transfer agent fees attributable to Class A, Class B, Class C and Class Y are allocated on a pro rata basis to each class based on the relative net assets of each class to the total net assets of those classes.
e. Commissions. Commissions (including CDSCs) on Fund shares retained by NGAM Distribution during the year ended December 31, 2016 were as follows:
| Fund |
Commissions |
|||
| Multi-Asset Income Fund |
$ | 10,471 | ||
| Intermediate Municipal Bond Fund |
2,313 | |||
| U.S. Equity Opportunities Fund |
54,911 | |||
f. Trustees Fees and Expenses. The Trusts do not pay any compensation directly to their officers or Trustees who are directors, officers or employees of NGAM Advisors, NGAM Distribution, Natixis US or their affiliates. The Chairperson of the Board of Trustees receives a retainer fee at the annual rate of $325,000. The Chairperson does not receive any meeting attendance fees for Board of Trustees meetings or committee meetings that she attends. Each Independent Trustee (other than the Chairperson) receives, in the aggregate, a retainer fee at the annual rate of $155,000. Each Independent Trustee also receives a meeting attendance fee of $10,000 for each meeting of the Board of Trustees that he or she attends in person and $5,000 for each meeting of the Board of Trustees that he or she attends telephonically. In addition, the chairperson of the Contract Review Committee and the chairperson of the Audit Committee each receive an additional retainer fee at the annual rate of $17,500. The chairperson of the Governance Committee receives an additional retainer fee at the annual rate of $10,000. Each Contract Review Committee member is compensated $6,000 for each Committee meeting that he or she attends in person and $3,000 for each meeting that he or she attends telephonically. Each Audit Committee member is compensated $6,000 for each Committee meeting that he or she attends in person and $3,000 for each meeting that he or she attends telephonically. These fees are allocated among the funds in the Natixis Funds Trusts and Loomis Sayles Funds Trusts based on a formula that takes into account, among other factors, the relative net assets of each fund. Trustees are reimbursed for travel expenses in connection with attendance at meetings.
A deferred compensation plan (the “Plan”) is available to the Trustees on a voluntary basis. Deferred amounts remain in the Funds until distributed in accordance with the provisions of the Plan. The value of a participating Trustee’s deferral account is based on theoretical investments of deferred amounts, on the normal payment dates, in certain funds of the Natixis Funds Trusts and Loomis Sayles Funds Trusts as designated by the participating Trustees. Changes in the value of participants’ deferral accounts are allocated pro rata among the funds in the Natixis Funds Trusts and Loomis Sayles Funds Trusts and are normally reflected as Trustees’ fees and expenses in the Statements of Operations. The portions of the accrued obligations allocated to
| 76
Table of Contents
Notes to Financial Statements (continued)
December 31, 2016
the Funds under the Plan are reflected as Deferred Trustees’ fees in the Statements of Assets and Liabilities.
g. Reimbursement of Transfer Agent Fees and Expenses. Effective September 1, 2015, NGAM Advisors has given a binding contractual undertaking to the Multi-Asset Income Fund to reimburse any and all transfer agency expenses for the Fund’s Class N shares. This undertaking is in effect through April 30, 2017 and is not subject to recovery under the expense limitation agreement described above.
For the year ended December 31, 2016, NGAM Advisors reimbursed the Fund $137 for transfer agency expenses related to Class N shares.
h. Affiliated Ownership. As of December 31, 2016, Natixis US and affiliates held shares of Multi-Asset Income Fund representing less than .01% of the Fund’s net assets.
i. Payment by Affiliates. During the year ended December 31, 2016, Loomis Sayles reimbursed Multi-Asset Income Fund $6,754 for losses incurred in connection with a trading error.
7. Class-Specific Transfer Agent Fees and Expenses. For the year ended December 31, 2016, Multi-Asset Income Fund incurred the following class-specific transfer agent fees and expenses (including sub-transfer agent fees, where applicable)
| Class A |
Class C |
Class N |
Class Y |
|||||||||||||
| Transfer Agent Fees and Expenses |
$ | 40,112 | $ | 32,713 | $ | 137 | $ | 9,206 | ||||||||
Transfer agent fees and expenses attributable to Class A, Class C, and Class Y are allocated on a pro rata basis to each class based on the relative net assets of each class to the total net assets of those classes. Transfer agent fees and expenses attributable to Class N are allocated to Class N.
All other Funds in this report allocate transfer agent fees and expenses on a pro rata basis based on the relative net assets of each class to the total net assets of those classes.
8. Line of Credit. Effective April 14, 2016, each Fund, together with certain other funds of Natixis Funds Trusts and Loomis Sayles Funds Trusts, entered into a 364-day, $400,000,000 syndicated, committed, unsecured line of credit with Citibank, N.A. to be used for temporary or emergency purposes only. Any one Fund may borrow up to the full $400,000,000 under the line of credit (as long as all borrowings by all Funds in the aggregate do not exceed the $400,000,000 limit at any time), subject to each Fund’s investment restrictions. Interest is charged to the Funds at a rate equal to the greater of the eurodollar or the federal funds rate plus 1.00%. In addition, a commitment fee of 0.10% per annum, payable on the last business day of each month, is accrued and apportioned among the participating funds based on their average daily unused portion
77 |
Table of Contents
Notes to Financial Statements (continued)
December 31, 2016
of the line of credit. The Funds paid an arrangement fee, an upfront fee, and other fees in connection with the new line of credit agreement, which are being amortized over a period of 364 days and are reflected as miscellaneous expenses on the Statements of Operations. The unamortized balance is reflected as prepaid expenses on the Statements of Assets and Liabilities.
Prior to April 14, 2016 each Fund, together with certain other funds of Natixis Funds Trusts and Loomis Sayles Funds Trusts, participated in a $150,000,000 committed unsecured line of credit provided by State Street Bank. Any one Fund was able to borrow up to the full $150,000,000 under the line of credit (as long as all borrowings by all Funds in the aggregate do not exceed the $150,000,000 limit at any time). Interest was charged to each participating Fund based on its borrowings at a rate per annum equal to the greater of the Federal Funds rate or overnight LIBOR, plus 1.25%. In addition, a commitment fee of 0.15% per annum, payable at the end of each calendar quarter, was accrued and apportioned among the participating funds based on their average daily unused portion of the line of credit.
For the year ended December 31, 2016, none of the Funds had borrowings under these agreements.
9. Brokerage Commission Recapture. Certain Funds have entered into agreements with certain brokers whereby the brokers will rebate a portion of brokerage commissions. All amounts rebated by the brokers are returned to the Funds under such agreements and are included in realized gains on investments in the Statements of Operations. For the year ended December 31, 2016, amounts rebated under these agreements were as follows:
| Fund |
Rebates |
|||
| Multi-Asset Income Fund |
$ | 8,635 | ||
| U.S. Equity Opportunities Fund |
5,723 | |||
10. Concentration of Risk. Each Fund’s investments in foreign securities are subject to foreign currency fluctuations, higher volatility than U.S. securities, varying degrees of regulation and limited liquidity. Greater political, economic, credit and information risks are also associated with foreign securities.
| 78
Table of Contents
Notes to Financial Statements (continued)
December 31, 2016
11. Capital Shares. Each Fund may issue an unlimited number of shares of beneficial interest, without par value. Transactions in capital shares were as follows:
| |
Year Ended December 31, 2016 |
|
Year Ended December 31, 2015* |
|||||||||||||
| Multi-Asset Income Fund |
Shares | Amount | Shares | Amount | ||||||||||||
| Class A | ||||||||||||||||
| Issued from the sale of shares |
964,767 | $ | 12,838,875 | 1,847,041 | $ | 25,047,639 | ||||||||||
| Issued in connection with the reinvestment of distributions |
229,840 | 3,055,639 | 135,940 | 1,788,328 | ||||||||||||
| Redeemed |
(1,787,134 | ) | (23,410,657 | ) | (5,302,356 | ) | (70,529,840 | ) | ||||||||
|
|
|
|
|
|
|
|
|
|||||||||
| Net change |
(592,527 | ) | $ | (7,516,143 | ) | (3,319,375 | ) | $ | (43,693,873 | ) | ||||||
|
|
|
|
|
|
|
|
|
|||||||||
| Class C | ||||||||||||||||
| Issued from the sale of shares |
507,201 | $ | 6,771,235 | 809,470 | $ | 10,798,585 | ||||||||||
| Issued in connection with the reinvestment of distributions |
125,023 | 1,656,083 | 42,974 | 560,787 | ||||||||||||
| Redeemed |
(849,899 | ) | (11,247,092 | ) | (1,076,310 | ) | (14,183,914 | ) | ||||||||
|
|
|
|
|
|
|
|
|
|||||||||
| Net change |
(217,675 | ) | $ | (2,819,774 | ) | (223,866 | ) | $ | (2,824,542 | ) | ||||||
|
|
|
|
|
|
|
|
|
|||||||||
| Class N | ||||||||||||||||
| Issued from the sale of shares |
— | $ | — | 79 | $ | 1,001 | ||||||||||
| Issued in connection with the reinvestment of distributions |
6 | 75 | 1 | 14 | ||||||||||||
|
|
|
|
|
|
|
|
|
|||||||||
| Net change |
6 | $ | 75 | 80 | $ | 1,015 | ||||||||||
|
|
|
|
|
|
|
|
|
|||||||||
| Class Y | ||||||||||||||||
| Issued from the sale of shares |
1,218,325 | $ | 16,358,206 | 1,039,119 | $ | 14,008,487 | ||||||||||
| Issued in connection with the reinvestment of distributions |
88,064 | 1,165,946 | 31,764 | 417,023 | ||||||||||||
| Redeemed |
(661,295 | ) | (8,670,628 | ) | (1,266,925 | ) | (16,678,449 | ) | ||||||||
|
|
|
|
|
|
|
|
|
|||||||||
| Net change |
645,094 | $ | 8,853,524 | (196,042 | ) | $ | (2,252,939 | ) | ||||||||
|
|
|
|
|
|
|
|
|
|||||||||
| Increase (decrease) from capital share transactions |
(165,102 | ) | $ | (1,482,318 | ) | (3,739,203 | ) | $ | (48,770,339 | ) | ||||||
|
|
|
|
|
|
|
|
|
|||||||||
| * | From commencement of class operations on August 31, 2015 through December 31, 2015 for Class N shares. |
79 |
Table of Contents
Notes to Financial Statements (continued)
December 31, 2016
11. Capital Shares (continued).
| |
Year Ended December 31, 2016 |
|
Year Ended December 31, 2015 |
|||||||||||||
| Intermediate Municipal Bond Fund |
Shares | Amount | Shares | Amount | ||||||||||||
| Class A | ||||||||||||||||
| Issued from the sale of shares |
909,992 | $ | 9,258,255 | 592,244 | $ | 5,929,603 | ||||||||||
| Issued in connection with the reinvestment of distributions |
9,036 | 92,223 | 4,131 | 41,346 | ||||||||||||
| Redeemed |
(1,002,724 | ) | (10,157,813 | ) | (199,347 | ) | (1,988,883 | ) | ||||||||
|
|
|
|
|
|
|
|
|
|||||||||
| Net change |
(83,696 | ) | $ | (807,335 | ) | 397,028 | $ | 3,982,066 | ||||||||
|
|
|
|
|
|
|
|
|
|||||||||
| Class C | ||||||||||||||||
| Issued from the sale of shares |
254,574 | $ | 2,604,454 | 516,208 | $ | 5,183,929 | ||||||||||
| Issued in connection with the reinvestment of distributions |
877 | 8,930 | 478 | 4,779 | ||||||||||||
| Redeemed |
(479,533 | ) | (4,860,648 | ) | (109,322 | ) | (1,092,827 | ) | ||||||||
|
|
|
|
|
|
|
|
|
|||||||||
| Net change |
(224,082 | ) | $ | (2,247,264 | ) | 407,364 | $ | 4,095,881 | ||||||||
|
|
|
|
|
|
|
|
|
|||||||||
| Class Y | ||||||||||||||||
| Issued from the sale of shares |
4,274,591 | $ | 43,902,428 | 6,857,887 | $ | 68,754,803 | ||||||||||
| Issued in connection with the reinvestment of distributions |
14,948 | 152,317 | 19,332 | 193,727 | ||||||||||||
| Redeemed |
(5,930,187 | ) | (59,953,235 | ) | (3,102,593 | ) | (31,008,201 | ) | ||||||||
|
|
|
|
|
|
|
|
|
|||||||||
| Net change |
(1,640,648 | ) | $ | (15,898,490 | ) | 3,774,626 | $ | 37,940,329 | ||||||||
|
|
|
|
|
|
|
|
|
|||||||||
| Increase (decrease) from capital share transactions |
(1,948,426 | ) | $ | (18,953,089 | ) | 4,579,018 | $ | 46,018,276 | ||||||||
|
|
|
|
|
|
|
|
|
|||||||||
| 80
Table of Contents
Notes to Financial Statements (continued)
December 31, 2016
11. Capital Shares (continued).
| |
Year Ended December 31, 2016 |
|
Year Ended December 31, 2015 |
|||||||||||||
| U.S. Equity Opportunities Fund |
Shares | Amount | Shares | Amount | ||||||||||||
| Class A | ||||||||||||||||
| Issued from the sale of shares |
2,226,069 | $ | 61,833,280 | 1,905,649 | $ | 53,185,247 | ||||||||||
| Issued in connection with the reinvestment of distributions |
292,665 | 8,405,917 | 717,539 | 19,984,422 | ||||||||||||
| Redeemed |
(2,200,041 | ) | (61,873,204 | ) | (1,954,194 | ) | (54,802,400 | ) | ||||||||
|
|
|
|
|
|
|
|
|
|||||||||
| Net change |
318,693 | $ | 8,365,993 | 668,994 | $ | 18,367,269 | ||||||||||
|
|
|
|
|
|
|
|
|
|||||||||
| Class B(a) | ||||||||||||||||
| Issued from the sale of shares |
— | $ | — | 451 | $ | 9,116 | ||||||||||
| Issued in connection with the reinvestment of distributions |
— | — | 2,049 | 41,836 | ||||||||||||
| Redeemed |
(8,466 | ) | (156,331 | ) | (158,367 | ) | (3,248,117 | ) | ||||||||
|
|
|
|
|
|
|
|
|
|||||||||
| Net change |
(8,466 | ) | $ | (156,331 | ) | (155,867 | ) | $ | (3,197,165 | ) | ||||||
|
|
|
|
|
|
|
|
|
|||||||||
| Class C | ||||||||||||||||
| Issued from the sale of shares |
737,164 | $ | 15,374,320 | 731,050 | $ | 14,968,474 | ||||||||||
| Issued in connection with the reinvestment of distributions |
61,245 | 1,243,880 | 166,686 | 3,355,438 | ||||||||||||
| Redeemed |
(534,495 | ) | (10,851,615 | ) | (447,307 | ) | (9,204,165 | ) | ||||||||
|
|
|
|
|
|
|
|
|
|||||||||
| Net change |
263,914 | $ | 5,766,585 | 450,429 | $ | 9,119,747 | ||||||||||
|
|
|
|
|
|
|
|
|
|||||||||
| Class Y | ||||||||||||||||
| Issued from the sale of shares |
2,820,038 | $ | 95,090,135 | 1,585,958 | $ | 50,501,292 | ||||||||||
| Issued in connection with the reinvestment of distributions |
48,742 | 1,650,830 | 79,841 | 2,543,672 | ||||||||||||
| Redeemed |
(983,768 | ) | (31,028,910 | ) | (638,372 | ) | (20,615,184 | ) | ||||||||
|
|
|
|
|
|
|
|
|
|||||||||
| Net change |
1,885,012 | $ | 65,712,055 | 1,027,427 | $ | 32,429,780 | ||||||||||
|
|
|
|
|
|
|
|
|
|||||||||
| Increase (decrease) from capital share transactions |
2,459,153 | $ | 79,688,302 | 1,990,983 | $ | 56,719,631 | ||||||||||
|
|
|
|
|
|
|
|
|
|||||||||
| (a) | On January 11, 2016, Class B shares were converted into Class A shares. See Note 1 of Notes to Financial Statements. |
81 |
Table of Contents
Report of Independent Registered Public
Accounting Firm
To the Trustees of Natixis Funds Trust I and Natixis Funds Trust II and Shareholders of Loomis Sayles Multi-Asset Income Fund, McDonnell Intermediate Municipal Bond Fund, and Natixis U.S. Equity Opportunities Fund:
In our opinion, the accompanying statements of assets and liabilities, including the portfolios of investments, and the related statements of operations and of changes in net assets and the financial highlights present fairly, in all material respects, the financial position of the Loomis Sayles Multi-Asset Income Fund and Natixis U.S. Equity Opportunities Fund, each a series of Natixis Funds Trust I; and McDonnell Intermediate Municipal Bond Fund, a series of Natixis Funds Trust II (collectively, the “Funds”) as of December 31, 2016, and the results of each of their operations, the changes in each of their net assets and the financial highlights for each of the periods indicated, in conformity with accounting principles generally accepted in the United States of America. These financial statements and financial highlights (hereafter referred to as “financial statements”) are the responsibility of the Funds’ management. Our responsibility is to express an opinion on these financial statements based on our audits. We conducted our audits of these financial statements in accordance with the standards of the Public Company Accounting Oversight Board (United States). Those standards require that we plan and perform the audit to obtain reasonable assurance about whether the financial statements are free of material misstatement. An audit includes examining, on a test basis, evidence supporting the amounts and disclosures in the financial statements, assessing the accounting principles used and significant estimates made by management, and evaluating the overall financial statement presentation. We believe that our audits, which included confirmation of securities as of December 31, 2016 by correspondence with the custodian, agent banks and brokers, provide a reasonable basis for our opinion.
PricewaterhouseCoopers LLP
Boston, Massachusetts
February 22, 2017
| 82
Table of Contents
2016 U.S. Tax Distribution Information to Shareholders (Unaudited)
Corporate Dividends Received Deduction. For the fiscal year ended December 31, 2016, a percentage of dividends distributed by the Funds listed below qualify for the dividends received deduction for corporate shareholders. These percentages are as follows:
| Fund |
Qualifying |
|||
| Multi-Asset Income |
45.52 | % | ||
| U.S. Equity Opportunities |
100.00 | % | ||
Capital Gains Distributions. Pursuant to Internal Revenue Section 852(b), the following Funds paid distributions, which have been designated as capital gains distributions for the fiscal year ended December 31, 2016.
| Fund |
Amount |
|||
| Multi-Asset Income |
$ | 4,548,260 | ||
| U.S. Equity Opportunities |
9,731,549 | |||
Qualified Dividend Income. For the fiscal year ended December 31, 2016 a percentage of the ordinary income dividends paid by the Funds are considered qualified dividend income eligible for reduced tax rates. These lower rates range from 0% to 20% depending on an individual’s tax bracket. If the Funds paid a distribution during calendar year 2016, complete information will be reported in conjunction with Form 1099-DIV. These percentages are noted below:
| Fund |
Qualifying |
|||
| Multi-Asset Income |
56.24 | % | ||
| U.S. Equity Opportunities |
100.00 | % | ||
Exempt Interest Dividends
During the year ended December 31, 2016, Intermediate Municipal Bond paid dividends to shareholders from net investment income, of which 100.00% are designated as exempt interest dividends for federal tax purposes. However, state and local taxes differ from state to state and a portion of the dividends may be subject to the individual Alternative Minimum Tax, so it is suggested that you consult your own tax adviser.
83 |
Table of Contents
Trustee and Officer Information
The tables below provide certain information regarding the trustees and officers of Natixis Funds Trust I and Natixis Funds Trust II (the “Trusts”). Unless otherwise indicated, the address of all persons below is 399 Boylston Street, Boston, MA 02116. The Funds’ Statement(s) of Additional Information include additional information about the trustees of the Trust(s) and are available by calling Natixis Funds at 800-225-5478.
| Name and Year of Birth |
Position(s) Held with the Trusts, Length of Time Served and Term of Office1 |
Principal Occupation(s) During Past 5 Years |
Number of Portfolios in Fund Complex Overseen2 and Other Directorships Held During Past 5 Years |
Experience, Qualifications, Attributes, Skills for Board Membership | ||||
| INDEPENDENT TRUSTEES | ||||||||
| Kenneth A. Drucker (1945) |
Chairperson of the Board of Trustees since January 2017 Trustee since 2008 Ex Officio member of the Audit Committee, the Contract Review Committee and the Governance Committee |
Retired | 53 None |
Significant experience on the Board and on the boards of other business organizations (including at investment companies); executive experience (including as treasurer of an aerospace, automotive, and metal manufacturing corporation) | ||||
| Edmond J. English (1953) | Trustee since 2013 Audit Committee Member |
Chief Executive Officer of Bob’s Discount Furniture (retail) | 53 Director, Burlington Stores, Inc. (retail) |
Experience on the Board and significant experience on the boards of other business organizations (including retail companies and a bank); executive experience (including at a retail company) | ||||
| 84
Table of Contents
Trustee and Officer Information
| Name and Year of Birth |
Position(s) Held with the Trusts, Length of Time Served and Term of Office1 |
Principal Occupation(s) During Past 5 Years |
Number of Portfolios in Fund Complex Overseen2 and Other Directorships Held During Past 5 Years |
Experience, Qualifications, Attributes, Skills for Board Membership | ||||
| INDEPENDENT TRUSTEES continued | ||||||||
| Richard A. Goglia (1951) |
Trustee since 2015 Audit Committee Member |
Retired; formerly Vice President and Treasurer of Raytheon Company (defense) | 53 None |
Experience on the Board and executive experience (including his role as vice president and treasurer of a defense company and experience at a financial services company) | ||||
| Wendell J. Knox (1948) |
Trustee since 2009 Contract Review Committee Member and Governance Committee Member |
Director of Abt Associates Inc. (research and consulting) | 53 Director, Eastern Bank (bank); Director, The Hanover Insurance Group (property and casualty insurance) |
Significant experience on the Board and on the boards of other business organizations (including at a bank and at a property and casualty insurance firm); executive experience (including roles as president and chief executive officer of a research and consulting company) | ||||
85 |
Table of Contents
Trustee and Officer Information
| Name and Year of Birth |
Name and Year of Birth |
Position(s) Held with the Trusts, Length of Time Served and Term of Office1 |
Principal Occupation(s) During Past 5 Years |
Number of Portfolios in Fund Complex Overseen2 and Other Directorships Held During Past 5 Years | ||||
| INDEPENDENT TRUSTEES continued | ||||||||
| Martin T. Meehan (1956) | Trustee since 2012 Contract Review Committee Member |
President, University of Massachusetts; formerly, Chancellor and faculty member, University of Massachusetts Lowell | 53 None |
Experience on the Board and on the boards of other business organizations; experience as President of the University of Massachusetts; government experience (including as a member of the U.S. House of Representatives); academic experience | ||||
| Sandra O. Moose (1942) |
Trustee since 1982 for Natixis Funds Trust I (including its predecessors); since 1993 for Natixis Funds Trust II Audit Committee Member and Governance Committee Member |
President, Strategic Advisory Services (management consulting) | 53 Formerly, Director, AES Corporation (international power company); formerly, Director, Verizon Communications (telecommunications company) |
Significant experience on the Board and on the boards of other business organizations (including at a telecommunications company, an international power company and a specialty chemicals corporation); executive experience (including at a management consulting company) | ||||
| 86
Table of Contents
Trustee and Officer Information
| Name and Year of Birth |
Position(s) Held with the Trusts, Length of Time Served and Term of Office1 |
Principal Occupation(s) During Past 5 Years |
Number of Portfolios in Fund Complex Overseen2 and Other Directorships Held During Past 5 Years |
Experience, Qualifications, Attributes, Skills for Board Membership | ||||
| INDEPENDENT TRUSTEES continued | ||||||||
| James P. Palermo (1955) |
Trustee since 2016 Contract Review Committee Member |
Founding Partner, Breton Capital Management, LLC (private equity); Partner, STEP Partners, LLC (private equity); formerly, Chief Executive Officer of Global Client Management of The Bank of New York Mellon Corporation | 53 None |
Experience on the Board; financial services industry and executive experience (including roles as chief executive officer of client management and asset servicing for a banking and financial services company) | ||||
| Erik R. Sirri (1958) |
Trustee since 2009 Chairperson of the Audit Committee |
Professor of Finance at Babson College | 53 None |
Significant experience on the Board; experience as Director of the Division of Trading and Markets at the Securities and Exchange Commission; academic experience; training as an economist | ||||
| Peter J. Smail (1952) |
Trustee since 2009 Chairperson of the Contract Review Committee and Governance Committee Member |
Retired | 53 None |
Significant experience on the Board; mutual fund industry and executive experience (including roles as president and chief executive officer for an investment adviser) | ||||
87 |
Table of Contents
Trustee and Officer Information
| Name and Year of Birth |
Position(s) Held with the Trusts, Length of Time Served and Term of Office1 |
Principal Occupation(s) During Past 5 Years |
Number of Portfolios in Fund Complex Overseen2 and Other Directorships Held During Past 5 Years |
Experience, Qualifications, Attributes, Skills for Board Membership | ||||
| INDEPENDENT TRUSTEES continued | ||||||||
| Cynthia L. Walker (1956) |
Trustee since 2005 Chairperson of the Governance Committee and Audit Committee Member |
Deputy Dean for Finance and Administration, Yale University School of Medicine | 53 None |
Significant experience on the Board; executive experience in a variety of academic organizations (including roles as dean for finance and administration) | ||||
| INTERESTED TRUSTEES | ||||||||
| Kevin P. Charleston3 (1965) One Financial Center Boston, MA 02111 |
Trustee since 2015 | President, Chief Executive Officer and Director; formerly, Chief Financial Officer, Loomis, Sayles & Company, L.P. | 53 None |
Experience on the Board; continuing service as President, Chief Executive Officer and Director of Loomis, Sayles & Company, L.P. | ||||
| David L. Giunta4 (1965) |
Trustee since 2011 President and Chief Executive Officer since 2008 |
President and Chief Executive Officer, NGAM Distribution Corporation, NGAM Advisors, L.P. and NGAM Distribution, L.P. | 53 None |
Significant experience on the Board; continuing experience as President and Chief Executive Officer of NGAM Advisors, L.P. | ||||
| 1 | Each trustee serves until retirement, resignation or removal from the Board. The current retirement age is 75. The position of Chairperson of the Board is appointed for a three-year term. |
| 2 | The trustees of the Trusts serve as trustees of a fund complex that includes all series of the Natixis Funds Trust I, Natixis Funds Trust II, Natixis Funds Trust IV and Gateway Trust (collectively, the “Natixis Funds Trusts”), Loomis Sayles Funds I and Loomis Sayles Funds II (collectively, the “Loomis Sayles Funds Trusts”) and Natixis ETF Trust (collectively, the “Fund Complex”). |
| 3 | Mr. Charleston is deemed an “interested person” of the Trusts because he holds the following positions with an affiliated person of the Trusts: President and Chief Executive Officer of Loomis, Sayles & Company, L.P. |
| 4 | Mr. Giunta is deemed an “interested person” of the Trusts because he holds the following positions with an affiliated person of the Trusts: President and Chief Executive Officer of NGAM Distribution Corporation, NGAM Advisors, L.P. and NGAM Distribution, L.P. |
| 88
Table of Contents
Trustee and Officer Information
| Name and Year of Birth |
Position(s) Held |
Term of
Office1 and |
Principal Occupation(s) | |||
| OFFICERS OF THE TRUST | ||||||
| Russell L. Kane (1969) |
Secretary, Clerk and Chief Legal Officer | Since July 2016 | Executive Vice President, General Counsel, Secretary and Clerk, NGAM Distribution Corporation, NGAM Advisors, L.P. and NGAM Distribution, L.P.; formerly, Chief Compliance Officer for Mutual Funds, Senior Vice President, Deputy General Counsel, Assistant Secretary and Assistant Clerk, NGAM Distribution Corporation, NGAM Advisors, L.P. and NGAM Distribution, L.P. | |||
| Michael C. Kardok (1959) |
Treasurer, Principal Financial and Accounting Officer | Since October 2004 | Senior Vice President, NGAM Advisors, L.P. and NGAM Distribution, L.P. | |||
| Rosa Licea-Mailloux (1976) |
Chief Compliance Officer, Assistant Secretary and Anti-Money Laundering Officer | Since July 2016 | Senior Vice President, Deputy General Counsel, Assistant Secretary and Assistant Clerk, NGAM Distribution Corporation, NGAM Advisors, L.P. and NGAM Distribution, L.P.; formerly, Associate General Counsel, NGAM Distribution, L.P. | |||
| 1 | Each officer of the Trusts serves for an indefinite term in accordance with the Trusts’ current by-laws until the date his or her successor is elected and qualified, or until he or she sooner dies, retires, is removed or becomes disqualified. |
| 2 | Each person listed above, except as noted, holds the same position(s) with the Fund Complex. Previous positions during the past five years with NGAM Distribution, L.P., NGAM Advisors, L.P. or Loomis, Sayles & Company, L.P. are omitted, if not materially different from a trustee’s or officer’s current position with such entity. |
89 |
Table of Contents
ANNUAL REPORT
December 31, 2016

Gateway Equity Call Premium Fund
Loomis Sayles Strategic Alpha Fund

Portfolio Review page 1
Portfolio of Investments page 13
Financial Statements page 49
Notes to Financial Statements page 59
Table of Contents
GATEWAY EQUITY CALL PREMIUM FUND
| Managers | Symbols | |
| Daniel M. Ashcraft, CFA® | Class A GCPAX | |
| Michael T. Buckius, CFA® | Class C GCPCX | |
| Kenneth H. Toft, CFA® | Class Y GCPYX | |
| Gateway Investment Advisers, LLC | ||
Investment Goal
The Fund seeks total return with less risk than U.S. equity markets.
Market Conditions
Surprises were a hallmark of 2016. Surprises in the first half of the year included the S&P 500® Index’s 10.27% loss through February 11 and a steady decline in the yield on the 10-year U.S. Treasury Note, despite the Federal Reserve preparing investors for multiple rate hikes in 2016. Though equities had recovered to positive territory by the end of the first quarter, falling interest rates contributed to the bond market’s surprising outperformance of the stock market over the first half of the year. Equity market conditions were calm in the second half of the year despite the United Kingdom (U.K.) voting to leave the European Union and Donald Trump winning the U.S. presidential election. Neither outcome was expected and both were forecast to have a negative impact on capital markets in the unlikely event they came to pass. The S&P 500® Index did decline 5.34% in the two days after the U.K. vote, but quickly recovered and advanced until mid-August. The S&P 500® Index declined 4.38% from August 15, 2016 through November 4, 2016 as both the Trump and Clinton campaigns struggled with negative developments. However, the equity market advanced steadily after the election, propelled by anticipation of pro-growth economic policies from the incoming Trump administration and mostly positive quarterly earnings and economic reports. Interest rates rose in the second half of the year, accelerating after the election, and driving the Bloomberg Barclays U.S. Aggregate Bond Index to a loss of 2.53% over the last six months. Fundamentally, seven consecutive quarters of aggregate S&P 500® Index earnings declines came to an end in the third quarter and third quarter GDP growth of 3.5% was the highest rate in two years.
Implied volatility, as measured by the Chicago Board Options Exchange (CBOE) Volatility Index (the VIX), averaged 15.83 for the year, based on the daily closing values. This is well below its long-term average of 19.71 and a somewhat counter-intuitive outcome for an election year that included a great deal of uncertainty and multiple unexpected events. However, below-average volatility is not uncommon in election years and the pattern of volatility in 2016 was similar to typical election years in that the highest volatility readings came early in the year, troughed in the third quarter and rose in October and November.
Performance Results
For the 12 months ended December 31, 2016, Class A shares of Gateway Equity Call Premium Fund returned 7.58% at net asset value. The Fund outperformed its benchmark, the CBOE S&P 500 BuyWriteSM Index (the BXMSM), which returned 7.07% for the same period.
1 |
Table of Contents
Explanation of Fund Performance
The Fund invests in a diversified stock portfolio designed to support its index option-based risk management strategy as efficiently as possible while seeking to enhance the Fund’s total return. The Fund seeks to generate returns by writing at- and near-the-money index call options against the full value of its underlying equity portfolio. The steady cash flow from call option writing is intended to be an important source of the Fund’s return, although it reduces the Fund’s ability to profit from potential increases in the value of its equity portfolio. The index call options written by the Fund often have similar characteristics to the index call option present in the BXMSM at any given time. However, unlike the BXMSM, the Fund employs an active strategy that gives its management team discretion to diversify expiration dates and strike prices across a portfolio of index call options, and to opportunistically pursue attractive call premiums while maintaining a relatively consistent risk profile.
Though collecting premiums from writing index call options generally allows the Fund to generate a positive return when the S&P 500® Index advances, call option positions that expire or are closed out when the Index is well above the option’s strike price may generate realized losses. Thus, call option positions detracted from the Fund’s return in three out of four quarters for the year. Specifically, in the first quarter, index call option positions generated gains as the market declined in January and February but those gains were erased by the strong market rally in March. The steady and modest monthly advances for the market in the second quarter resulted in a slight net gain from call options positions for the quarter. In the second half of the year, as the market trended sideways to down, gains from call options in August, September and October were not large enough to cover the losses from call options during the strong market advances in July, November and December.
Despite slight underperformance relative to the BXMSM in three out of four quarters for the year, the Fund generated a higher total return in 2016 due to 1.10 percentage points of outperformance in the third quarter. The investment management team’s key moves leading to outperformance included increasing the index call option portfolio’s weighted average strike price as the market advanced in July and placing opportunistic trades that took advantage of relatively elevated implied volatility in early September.
The Fund’s equity portfolio returned 13.14% for the year, a performance differential of positive 118 basis points versus the S&P 500® Index, which contributed to the Fund’s return. Index call options detracted approximately 3.90% from overall return for the year. Consistent with its investment objective, the measured risk of the Fund was lower than that of the U.S. equity market and its benchmark, as its standard deviation for 2016 was 8.03% versus 13.30% and 8.65% for the S&P 500® Index and the BXMSM, respectively.
Outlook
As we transition from the old year to the new one, we close the books on a year of unexpected events. But with key market elements including interest rates, monetary policy, market volatility and corporate earnings at possible inflection points, 2017 may deliver some significant turning points of its own. As the trends play out, they could contribute significantly either on the positive or negative side for stocks and bonds.
| 2
Table of Contents
GATEWAY EQUITY CALL PREMIUM FUND
Gateway’s investment philosophy maintains that the U.S. equity market is the most reliable source of attractive long-term returns, despite its high volatility and tendency to periodically deliver significant losses over shorter periods of time. Gateway’s investment philosophy also holds that consistency is the key to long-term investment success and that generating cash flow, rather than seeking to forecast the rise and fall of the market, can be a lower-risk means to participate in equity markets. By staying true to its philosophy and managing the Gateway Equity Call Premium Fund consistently with the firm’s historical approach, Gateway will continue to help investors manage risk while pursuing long-term return in this challenging and uncertain environment.
Hypothetical Growth of $10,000 Investment in Class A Shares4
September 30, 2014 (inception) through December 31, 2016
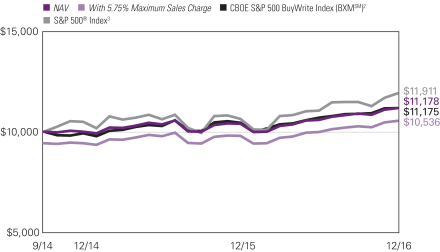
See notes to chart on page 5.
3 |
Table of Contents
Top Ten Holdings as of December 31, 2016
| Security name | % of net assets |
|||||
| 1 | Apple, Inc. | 3.32 | % | |||
| 2 | Microsoft Corp. | 2.53 | ||||
| 3 | Exxon Mobil Corp. | 2.08 | ||||
| 4 | JPMorgan Chase & Co. | 1.75 | ||||
| 5 | Johnson & Johnson | 1.67 | ||||
| 6 | General Electric Co. | 1.59 | ||||
| 7 | Berkshire Hathaway, Inc., Class B | 1.53 | ||||
| 8 | Amazon.com, Inc. | 1.52 | ||||
| 9 | Alphabet, Inc., Class A | 1.52 | ||||
| 10 | Facebook, Inc., Class A | 1.43 | ||||
The portfolio is actively managed and holdings are subject to change. There is no guarantee the Fund continues to invest in the securities referenced.
| 4
Table of Contents
GATEWAY EQUITY CALL PREMIUM FUND
Average Annual Total Returns — December 31, 20164
| Expense Ratios5 | ||||||||||||||||
| 1 Year | Life of Fund | Gross | Net | |||||||||||||
| Class A (Inception 9/30/14) | ||||||||||||||||
| NAV | 7.58 | % | 5.07 | % | 1.70 | % | 1.20 | % | ||||||||
| With 5.75% Maximum Sales Charge | 1.43 | 2.34 | ||||||||||||||
| Class C (Inception 9/30/14) | ||||||||||||||||
| NAV | 6.85 | 4.32 | 2.40 | 1.95 | ||||||||||||
| With CDSC1 | 5.85 | 4.32 | ||||||||||||||
| Class Y (Inception 9/30/14) | ||||||||||||||||
| NAV | 7.83 | 5.30 | 1.45 | 0.95 | ||||||||||||
| Comparative Performance | ||||||||||||||||
| CBOE S&P 500 BuyWrite Index (BXMSM)2 | 7.07 | 5.05 | ||||||||||||||
| S&P 500® Index3 | 11.96 | 8.07 | ||||||||||||||
Performance data shown represents past performance and is no guarantee of, and not necessarily indicative of, future results. Total return and value will vary, and you may have a gain or loss when shares are sold. Current performance may be lower or higher than quoted. For most recent month-end performance, visit ngam.natixis.com/performance. Performance for other share classes will be greater or less than shown based on differences in fees and sales charges. You may not invest directly in an index. Performance for periods less than one year is cumulative, not annualized. Returns reflect changes in share price and reinvestment of dividends and capital gains, if any. The table(s) do not reflect taxes shareholders might owe on any fund distributions or when they redeem their shares.
| 1 | Performance for Class C shares assumes a 1% contingent deferred sales charge (“CDSC”) applied when you sell shares within one year of purchase. |
| 2 | The CBOE S&P 500 BuyWrite Index (BXMSM) is a benchmark index designed to track the performance of a hypothetical buy-write strategy on the S&P 500® Index. The BXM is a passive total return index based on (1) buying an S&P 500 stock index portfolio, and (2) “writing” (or selling) the near-term S&P 500® Index (SPXSM) “covered” call option, generally on the third Friday of each month. The SPX call written will have about one month remaining to expiration, with an exercise price just above the prevailing index level (i.e., slightly out of the money). The SPX call is held until expiration and cash settled, at which time a new one-month, near-the-money call is written. |
| 3 | S&P 500® Index is a widely recognized measure of U.S. stock market performance. It is an unmanaged index of 500 common stocks chosen for market size, liquidity, and industry group representation, among other factors. |
| 4 | Fund performance has been increased by fee waivers and/or expense reimbursements, if any, without which performance would have been lower. |
| 5 | As of the most recent prospectus, the investment advisor has contractually agreed to waive fees and/or reimburse expenses (with certain exceptions) once the expense cap of the Fund has been exceeded. This arrangement is set to expire on 4/30/2017. When an expense cap has not been exceeded, the fund may have similar expense ratios. |
5 |
Table of Contents
LOOMIS SAYLES STRATEGIC ALPHA FUND
| Managers | Symbols | |
| Matthew J. Eagan, CFA® | Class A LABAX | |
| Kevin P. Kearns | Class C LABCX | |
| Todd P. Vandam, CFA® | Class Y LASYX | |
| Loomis, Sayles & Company, L.P. | ||
Investment Goal
The Fund seeks to provide an attractive absolute total return, complemented by prudent investment management designed to manage risks and protect investor capital. The secondary goal of the Fund is to achieve these returns with relatively low volatility.
Market Conditions
Investor preferences for riskier assets held up well during the period. U.S. high-yield bonds experienced a sustained rally, and equity markets hit all-time highs following Donald Trump’s presidential win and the surprise Republican sweep of Congress. The Federal Reserve (the Fed) raised interest rates for the second time in a decade, and Brent crude oil surged more than 23% in the face of a strong U.S. dollar rally during the fourth quarter. After experiencing short-term spikes during the bond market sell-off in February and again following the late-June Brexit vote, market volatility decreased to close out the year.
U.S. high-yield bonds represented a bright spot among global fixed-income sectors throughout the year and finished the period with solid returns. The sector benefited from the jump in oil prices, which helped strengthen credit profiles in energy and related industries. Energy-related names tended to lead the broad market in results. Meanwhile, the U.S. dollar hit a 14-year high during the fourth quarter, strengthening relative to most foreign currencies due to a combination of diverging monetary policies and concern about global trade policy following the U.S. election.
Performance Results
For the 12 months ended December 31, 2016, Class A Shares of the Loomis Sayles Strategic Alpha Fund returned 6.57% at net asset value. The Fund outperformed its benchmark, the 3-month London Interbank Offered Rate (LIBOR), which returned 0.66%. The Fund follows an absolute return strategy and is not managed to an index.
Explanation of Fund Performance
Exposure to high-yield and investment-grade corporate bonds primarily generated the Fund’s positive performance. Beyond that, securitized, emerging market and convertible securities contributed to absolute return. Gains from these positions more than offset losses from our currency, global rates and global credit exposures.
High-yield corporate bond spreads (the difference in yield between Treasury and high-yield bonds of similar maturity) consistently tightened following February’s bond market sell-off and finished the period near their tightest levels for the year. Aided by a relatively dovish
| 6
Table of Contents
LOOMIS SAYLES STRATEGIC ALPHA FUND
Fed, positive flows into the asset class, stable oil and metals prices and a general dearth of yield, investors continued to allocate into riskier assets, pushing valuations higher. Individual energy, telecommunication and technology names aided performance the most.
The Fed’s decision to hike rates during the fourth quarter weighed on longer-duration (greater price sensitivity to interest rate changes) issues, including investment-grade corporate bonds. Nevertheless, investment-grade corporates aided overall return as spreads tightened similar to high-yield bonds. Fund flows into corporates from outside the U.S. continued as the search for yield intensified on depressed government rates. Major central banks across the world maintained and even increased their accommodative stance, including the Bank of England, which began buying corporate bonds after the Brexit vote. Most of the positive contribution from investment-grade corporates came from energy, technology and banking names.
Securitized assets, particularly our residential mortgage-backed securities (RMBS), boosted performance during the period, as fundamentals remained stable across all sectors. The weaker spread tightening among asset-backed securities (ABS), commercial mortgage-backed securities (CMBS) and RMBS relative to corporates continued to play out, translating into higher valuations.
Emerging market exposure also lifted the Fund’s return, as credits benefited from spread compression amid the low interest rate environment. Market technical factors also stayed supportive for hard currency assets, as inflows into the asset class remained solid and limited new supply spurred demand. The Fund’s holdings in the energy, capital goods and consumer non-cyclical sectors were leading contributors.
Currency positioning weighed on Fund performance. In particular, currencies of beaten-down commodity exporters rebounded during the period due to the rally in the commodities market. Many of our positions were offset against long pairs, which mitigated the impact. Short positions in the Brazilian real and New Zealand dollar and long positions in the Norwegian krone also weighed on performance. Additionally, the U.S. presidential election had a negative impact on the Mexican peso in December, weakening the Fund’s long position in the currency.
The Fund’s global rates tools, primarily the use of swaps, swaptions (options on interest rate swaps) and interest rate futures, weighed on performance. A short position in a eurodollar future was the primary laggard, as the post-Brexit flight-to-quality rally pushed down Treasury yields. Additionally, short exposure to a euro-bund future diminished performance, as the continuation of accommodative European Central Bank policy caused long maturity German yields to decline during the first half of the period.
Outlook
Growth in the U.S. continues at a moderate rate, while Europe’s pace remains a bit slower. As the Fed works to normalize U.S. interest rates, we expect two rate hikes in 2017 and four additional hikes in 2018. We believe a fiscal stimulus package from the Trump administration could boost GDP growth and inflation, but not until 2018. We expect higher inflation will be primarily responsible for the accelerated pace of tightening in 2018.
7 |
Table of Contents
We believe expectations for tax reform and pro-business policies could prolong the expansion phase of the U.S. credit cycle. Key assumptions include a measured path of rate hikes that do not create significant volatility in risk markets and continued strong foreign demand for corporate bonds. Deteriorating fundamentals remain a concern at this stage of the cycle, as companies reward equity holders at the expense of balance sheets.
Although deteriorating debt fundamentals in the emerging markets have been bottoming out, growth remains weak, and the fiscal picture has not yet improved. External balances remain mixed across countries, as winners and losers are determined by each country’s status as a commodity importer or exporter. Meanwhile, European corporate fundamentals remain solid and notably better than in the U.S., with stable balance sheets and prudent outlooks. Mergers and acquisitions, capital spending and share repurchases remain subdued, with capital spending forecasted to be down again in 2017.
Hypothetical Growth of $10,000 Investment in Class A Shares4
December 15, 2010 (inception) through December 31, 2016
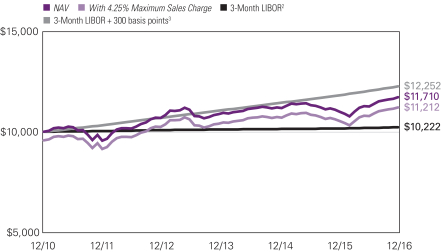
See notes to chart on page 9.
| 8
Table of Contents
LOOMIS SAYLES STRATEGIC ALPHA FUND
Average Annual Total Returns — December 31, 20164
| Expense Ratios5 | ||||||||||||||||||||
| 1 Year | 5 Years | Life of Fund | Gross | Net | ||||||||||||||||
| Class A (Inception 12/15/10) | ||||||||||||||||||||
| NAV | 6.57 | % | 3.95 | % | 2.65 | % | 1.10 | % | 1.10 | % | ||||||||||
| With 4.25% Maximum Sales Charge | 2.03 | 3.06 | 1.92 | |||||||||||||||||
| Class C (Inception 12/15/10) | ||||||||||||||||||||
| NAV | 5.70 | 3.17 | 1.85 | 1.85 | 1.85 | |||||||||||||||
| With CDSC1 | 4.70 | 3.17 | 1.85 | |||||||||||||||||
| Class Y (Inception 12/15/10) | ||||||||||||||||||||
| NAV | 6.86 | 4.23 | 2.90 | 0.85 | 0.85 | |||||||||||||||
| Comparative Performance | ||||||||||||||||||||
| 3-Month LIBOR2 | 0.66 | 0.38 | 0.36 | |||||||||||||||||
| 3-Month LIBOR + 300 basis points3 | 3.73 | 3.44 | 3.42 | |||||||||||||||||
Performance data shown represents past performance and is no guarantee of, and not necessarily indicative of, future results. Total return and value will vary, and you may have a gain or loss when shares are sold. Current performance may be lower or higher than quoted. For most recent month-end performance, visit ngam.natixis.com/performance. Performance for other share classes will be greater or less than shown based on differences in fees and sales charges. You may not invest directly in an index. Performance for periods less than one year is cumulative, not annualized. Returns reflect changes in share price and reinvestment of dividends and capital gains, if any. The table(s) do not reflect taxes shareholders might owe on any fund distributions or when they redeem their shares.
| 1 | Performance for Class C shares assumes a 1% contingent deferred sales charge (“CDSC”) applied when you sell shares within one year of purchase. |
| 2 | 3-Month LIBOR, or the London Interbank Offered Rate, represents the average rate at which a leading bank, for a given currency (in this case U.S. dollars), can obtain unsecured funding, and is representative of short-term interest rates. |
| 3 | 3-Month LIBOR +300 basis points is created by adding 3.00% to the annual return of 3-Month LIBOR. The calculation is performed on a monthly basis and is subject to the effects of compounding. |
| 4 | Fund performance has been increased by fee waivers and/or expense reimbursements, if any, without which performance would have been lower. |
| 5 | As of the most recent prospectus, the investment advisor has contractually agreed to waive fees and/or reimburse expenses (with certain exceptions) once the expense cap of the Fund has been exceeded. This arrangement is set to expire on 4/30/2017. When an expense cap has not been exceeded, the fund may have similar expense ratios. |
9 |
Table of Contents
ADDITIONAL INFORMATION
The views expressed in this report reflect those of the portfolio managers as of the dates indicated. The managers’ views are subject to change at any time without notice based on changes in market or other conditions. References to specific securities or industries should not be regarded as investment advice. Because the Funds are actively managed, there is no assurance that they will continue to invest in the securities or industries mentioned.
All investing involves risk, including the risk of loss. There is no assurance that any investment will meet its performance objectives or that losses will be avoided.
ADDITIONAL INDEX INFORMATION
This document may contain references to third party copyrights, indexes, and trademarks, each of which is the property of its respective owner. Such owner is not affiliated with Natixis Global Asset Management or any of its related or affiliated companies (collectively “NGAM”) and does not sponsor, endorse or participate in the provision of any NGAM services, funds or other financial products.
The index information contained herein is derived form third parties and is provided on an “as is” basis. The user of this information assumes the entire risk of use of this information. Each of the third party entities involved in compiling, computing or creating index information, disclaims all warranties (including, without limitation, any warranties of originality, accuracy, completeness, timeliness, non-infringement, merchantability and fitness for a particular purpose) with respect to such information.
PROXY VOTING INFORMATION
A description of Natixis Funds’ proxy voting policies and procedures is available without charge, upon request, by calling Natixis Funds at 800-225-5478; on Natixis Funds’ website at ngam.natixis.com; and on the Securities and Exchange Commission’s (SEC) website at www.sec.gov. Information regarding how Natixis Funds voted proxies relating to portfolio securities during the most recent 12-month period ended June 30 is available on Natixis Funds’ website and the SEC’s website.
QUARTERLY PORTFOLIO SCHEDULES
Natixis Funds file a complete schedule of portfolio holdings with the SEC for the first and third quarters of each fiscal year on Form N-Q. The Funds’ Forms N-Q are available on the SEC’s website at www.sec.gov and may be reviewed and copied at the SEC’s Public Reference Room in Washington, DC. Information on the operation of the Public Reference Room may be obtained by calling 800-SEC-0330.
| 10
Table of Contents
UNDERSTANDING FUND EXPENSES
As a mutual fund shareholder, you incur different types of costs: transaction costs, including sales charges (loads) on purchases, contingent deferred sales charges on redemptions, and ongoing costs, including management fees, distribution and/or service fees (12b-1 fees), and other fund expenses. Certain exemptions may apply. These costs are described in more detail in the Fund’s prospectus. The following examples are intended to help you understand the ongoing costs of investing in the Fund and help you compare these with the ongoing costs of investing in other mutual funds.
The first line in the table for each class shows the actual account values and actual Fund expenses you would have paid on a $1,000 investment in the Fund from July 1, 2016 through December 31, 2016. To estimate the expenses you paid over the period, simply divide your account value by $1,000 (for example, $8,600 account value divided by $1,000 = 8.60) and multiply the result by the number in the Expenses Paid During Period column as shown for your Class.
The second line for the table of each class provides information about hypothetical account values and hypothetical expenses based on the Fund’s actual expense ratios and an assumed rate of return of 5% per year before expenses, which is not the Fund’s actual return. The hypothetical account values and expenses may not be used to estimate the actual ending account balance or expenses you paid on your investment for the period. You may use this information to compare the ongoing costs of investing in the Fund and other funds. To do so, compare this 5% hypothetical example with the 5% hypothetical examples that appear in the shareholder reports of the other funds.
Please note that the expenses shown reflect ongoing costs only, and do not include any transaction costs, such as sales charges. Therefore, the second line in the table of each Fund is useful in comparing ongoing costs only, and will not help you determine the relative costs of owning different funds. If transaction costs were included, total costs would be higher.
| GATEWAY EQUITY CALL PREMIUM FUND | BEGINNING ACCOUNT VALUE 7/1/2016 |
ENDING ACCOUNT VALUE 12/31/2016 |
EXPENSES PAID DURING PERIOD* 7/1/2016 – 12/31/2016 |
|||||||||
| Class A | ||||||||||||
| Actual | $1,000.00 | $1,055.90 | $6.20 | |||||||||
| Hypothetical (5% return before expenses) | $1,000.00 | $1,019.10 | $6.09 | |||||||||
| Class C | ||||||||||||
| Actual | $1,000.00 | $1,051.50 | $10.06 | |||||||||
| Hypothetical (5% return before expenses) | $1,000.00 | $1,015.33 | $9.88 | |||||||||
| Class Y | ||||||||||||
| Actual | $1,000.00 | $1,056.20 | $4.91 | |||||||||
| Hypothetical (5% return before expenses) | $1,000.00 | $1,020.36 | $4.82 | |||||||||
| * | Expenses are equal to the Fund’s annualized expense ratio (after waiver/reimbursement): 1.20%, 1.95% and 0.95% for Class A, C and Y, respectively, multiplied by the average account value over the period, multiplied by the number of days in the most recent fiscal half-year (184), divided by 366 (to reflect the half-year period). |
11 |
Table of Contents
| LOOMIS SAYLES STRATEGIC ALPHA FUND | BEGINNING ACCOUNT VALUE 7/1/2016 |
ENDING ACCOUNT VALUE 12/31/2016 |
EXPENSES PAID DURING PERIOD* 7/1/2016 – 12/31/2016 |
|||||||||
| Class A | ||||||||||||
| Actual | $1,000.00 | $1,040.20 | $5.64 | |||||||||
| Hypothetical (5% return before expenses) | $1,000.00 | $1,019.61 | $5.58 | |||||||||
| Class C | ||||||||||||
| Actual | $1,000.00 | $1,035.50 | $9.47 | |||||||||
| Hypothetical (5% return before expenses) | $1,000.00 | $1,015.84 | $9.37 | |||||||||
| Class Y | ||||||||||||
| Actual | $1,000.00 | $1,041.60 | $4.36 | |||||||||
| Hypothetical (5% return before expenses) | $1,000.00 | $1,020.86 | $4.32 | |||||||||
| * | Expenses are equal to the Fund’s annualized expense ratio: 1.10%, 1.85% and 0.85% for Class A, C and Y, respectively, multiplied by the average account value over the period, multiplied by the number of days in the most recent fiscal half-year (184), divided by 366 (to reflect the half-year period). |
| 12
Table of Contents
Portfolio of Investments – as of December 31, 2016
Gateway Equity Call Premium Fund
| Shares | Description | Value (†) | ||||||
| Common Stocks — 98.0% of Net Assets | ||||||||
| Aerospace & Defense — 2.2% | ||||||||
| 1,325 | B/E Aerospace, Inc.(b) | $ | 79,752 | |||||
| 2,576 | Boeing Co. (The)(b) | 401,032 | ||||||
| 1,431 | General Dynamics Corp.(b) | 247,076 | ||||||
| 468 | Huntington Ingalls Industries, Inc.(b) | 86,201 | ||||||
| 991 | KLX, Inc.(b)(c) | 44,704 | ||||||
| 1,207 | Lockheed Martin Corp.(b) | 301,678 | ||||||
| 3,296 | United Technologies Corp.(b) | 361,307 | ||||||
|
|
|
|||||||
| 1,521,750 | ||||||||
|
|
|
|||||||
| Air Freight & Logistics — 0.8% | ||||||||
| 1,248 | FedEx Corp.(b) | 232,378 | ||||||
| 3,068 | United Parcel Service, Inc., Class B(b) | 351,715 | ||||||
|
|
|
|||||||
| 584,093 | ||||||||
|
|
|
|||||||
| Airlines — 0.6% | ||||||||
| 821 | Alaska Air Group, Inc.(b) | 72,847 | ||||||
| 3,807 | Delta Air Lines, Inc.(b) | 187,267 | ||||||
| 1,762 | JetBlue Airways Corp.(b)(c) | 39,504 | ||||||
| 1,958 | United Continental Holdings, Inc.(b)(c) | 142,699 | ||||||
|
|
|
|||||||
| 442,317 | ||||||||
|
|
|
|||||||
| Auto Components — 0.2% | ||||||||
| 437 | Adient PLC(b)(c) | 25,608 | ||||||
| 847 | Lear Corp.(b) | 112,118 | ||||||
|
|
|
|||||||
| 137,726 | ||||||||
|
|
|
|||||||
| Automobiles — 0.5% | ||||||||
| 8,226 | General Motors Co.(b) | 286,594 | ||||||
| 208 | Tesla Motors, Inc.(c) | 44,447 | ||||||
|
|
|
|||||||
| 331,041 | ||||||||
|
|
|
|||||||
| Banks — 6.7% | ||||||||
| 38,572 | Bank of America Corp.(b) | 852,441 | ||||||
| 12,292 | Citigroup, Inc.(b) | 730,514 | ||||||
| 2,148 | Comerica, Inc.(b) | 146,300 | ||||||
| 757 | East West Bancorp, Inc.(b) | 38,478 | ||||||
| 7,783 | Fifth Third Bancorp(b) | 209,908 | ||||||
| 888 | First Republic Bank(b) | 81,820 | ||||||
| 16,839 | Huntington Bancshares, Inc.(b) | 222,612 | ||||||
| 14,279 | JPMorgan Chase & Co.(b) | 1,232,135 | ||||||
| 173 | Signature Bank(c) | 25,985 | ||||||
| 3,872 | SunTrust Banks, Inc.(b) | 212,379 | ||||||
| 17,219 | Wells Fargo & Co.(b) | 948,939 | ||||||
|
|
|
|||||||
| 4,701,511 | ||||||||
|
|
|
|||||||
| Beverages — 2.0% | ||||||||
| 16,998 | Coca-Cola Co. (The)(b) | 704,737 | ||||||
| 6,946 | PepsiCo, Inc.(b) | 726,760 | ||||||
|
|
|
|||||||
| 1,431,497 | ||||||||
|
|
|
|||||||
See accompanying notes to financial statements.
13 |
Table of Contents
Portfolio of Investments – as of December 31, 2016
Gateway Equity Call Premium Fund – (continued)
| Shares | Description | Value (†) | ||||||
| Biotechnology — 2.9% | ||||||||
| 6,050 | AbbVie, Inc.(b) | $ | 378,851 | |||||
| 762 | Alexion Pharmaceuticals, Inc.(b)(c) | 93,231 | ||||||
| 984 | Alkermes PLC(b)(c) | 54,691 | ||||||
| 1,001 | Alnylam Pharmaceuticals, Inc.(b)(c) | 37,477 | ||||||
| 2,803 | Amgen, Inc.(b) | 409,827 | ||||||
| 911 | Biogen, Inc.(b)(c) | 258,341 | ||||||
| 611 | BioMarin Pharmaceutical, Inc.(b)(c) | 50,615 | ||||||
| 3,079 | Celgene Corp.(b)(c) | 356,394 | ||||||
| 4,921 | Gilead Sciences, Inc.(b) | 352,393 | ||||||
| 343 | Incyte Corp.(b)(c) | 34,393 | ||||||
|
|
|
|||||||
| 2,026,213 | ||||||||
|
|
|
|||||||
| Building Products — 0.6% | ||||||||
| 1,664 | A.O. Smith Corp.(b) | 78,791 | ||||||
| 2,274 | Fortune Brands Home & Security, Inc.(b) | 121,568 | ||||||
| 4,370 | Johnson Controls International PLC(b) | 180,000 | ||||||
| 258 | Lennox International, Inc. | 39,518 | ||||||
|
|
|
|||||||
| 419,877 | ||||||||
|
|
|
|||||||
| Capital Markets — 2.2% | ||||||||
| 5,475 | Bank of New York Mellon Corp. (The)(b) | 259,405 | ||||||
| 588 | BlackRock, Inc.(b) | 223,758 | ||||||
| 1,883 | Goldman Sachs Group, Inc. (The)(b) | 450,884 | ||||||
| 8,565 | Morgan Stanley(b) | 361,871 | ||||||
| 661 | MSCI, Inc.(b) | 52,074 | ||||||
| 1,178 | Raymond James Financial, Inc.(b) | 81,600 | ||||||
| 930 | SEI Investments Co.(b) | 45,905 | ||||||
| 2,107 | TD Ameritrade Holding Corp.(b) | 91,865 | ||||||
|
|
|
|||||||
| 1,567,362 | ||||||||
|
|
|
|||||||
| Chemicals — 2.1% | ||||||||
| 521 | AdvanSix, Inc.(b)(c) | 11,535 | ||||||
| 651 | Agrium, Inc.(b) | 65,458 | ||||||
| 1,336 | Air Products & Chemicals, Inc.(b) | 192,144 | ||||||
| 1,303 | Albemarle Corp.(b) | 112,162 | ||||||
| 898 | Ashland Global Holdings, Inc.(b) | 98,142 | ||||||
| 1,035 | Celanese Corp., Series A(b) | 81,496 | ||||||
| 4,632 | Huntsman Corp.(b) | 88,379 | ||||||
| 759 | International Flavors & Fragrances, Inc.(b) | 89,433 | ||||||
| 2,095 | Monsanto Co.(b) | 220,415 | ||||||
| 1,665 | PPG Industries, Inc.(b) | 157,775 | ||||||
| 2,271 | Praxair, Inc.(b) | 266,138 | ||||||
| 1,175 | Valspar Corp. (The)(b) | 121,742 | ||||||
|
|
|
|||||||
| 1,504,819 | ||||||||
|
|
|
|||||||
| Commercial Services & Supplies — 0.3% | ||||||||
| 446 | Waste Connections, Inc. | 35,051 | ||||||
| 2,825 | Waste Management, Inc.(b) | 200,321 | ||||||
|
|
|
|||||||
| 235,372 | ||||||||
|
|
|
|||||||
See accompanying notes to financial statements.
| 14
Table of Contents
Portfolio of Investments – as of December 31, 2016
Gateway Equity Call Premium Fund – (continued)
| Shares | Description | Value (†) | ||||||
| Communications Equipment — 1.0% | ||||||||
| 1,668 | ARRIS International PLC(b)(c) | $ | 50,257 | |||||
| 21,120 | Cisco Systems, Inc.(b) | 638,246 | ||||||
| 334 | Palo Alto Networks, Inc.(b)(c) | 41,767 | ||||||
|
|
|
|||||||
| 730,270 | ||||||||
|
|
|
|||||||
| Construction & Engineering — 0.1% | ||||||||
| 1,327 | Chicago Bridge & Iron Co.(b) | 42,132 | ||||||
|
|
|
|||||||
| Consumer Finance — 1.6% | ||||||||
| 3,522 | Ally Financial, Inc.(b) | 66,989 | ||||||
| 4,415 | American Express Co.(b) | 327,063 | ||||||
| 3,429 | Capital One Financial Corp.(b) | 299,146 | ||||||
| 3,486 | Discover Financial Services(b) | 251,306 | ||||||
| 4,319 | Synchrony Financial(b) | 156,650 | ||||||
|
|
|
|||||||
| 1,101,154 | ||||||||
|
|
|
|||||||
| Containers & Packaging — 0.4% | ||||||||
| 1,167 | Crown Holdings, Inc.(b)(c) | 61,349 | ||||||
| 3,932 | International Paper Co.(b) | 208,632 | ||||||
| 532 | Packaging Corp. of America(b) | 45,124 | ||||||
|
|
|
|||||||
| 315,105 | ||||||||
|
|
|
|||||||
| Diversified Financial Services — 1.5% | ||||||||
| 6,612 | Berkshire Hathaway, Inc., Class B(b)(c) | 1,077,624 | ||||||
|
|
|
|||||||
| Diversified Telecommunication Services — 2.6% | ||||||||
| 23,005 | AT&T, Inc.(b) | 978,403 | ||||||
| 552 | SBA Communications Corp., Class A(b)(c) | 56,999 | ||||||
| 15,034 | Verizon Communications, Inc.(b) | 802,515 | ||||||
|
|
|
|||||||
| 1,837,917 | ||||||||
|
|
|
|||||||
| Electric Utilities — 2.1% | ||||||||
| 4,570 | Alliant Energy Corp.(b) | 173,158 | ||||||
| 6,396 | American Electric Power Co., Inc.(b) | 402,692 | ||||||
| 3,656 | PG&E Corp.(b) | 222,175 | ||||||
| 6,885 | PPL Corp.(b) | 234,434 | ||||||
| 5,391 | Southern Co. (The)(b) | 265,183 | ||||||
| 3,073 | Westar Energy, Inc.(b) | 173,164 | ||||||
|
|
|
|||||||
| 1,470,806 | ||||||||
|
|
|
|||||||
| Electrical Equipment — 0.5% | ||||||||
| 299 | Acuity Brands, Inc.(b) | 69,027 | ||||||
| 4,467 | Emerson Electric Co.(b) | 249,035 | ||||||
|
|
|
|||||||
| 318,062 | ||||||||
|
|
|
|||||||
| Electronic Equipment, Instruments & Components — 0.4% | ||||||||
| 1,407 | Arrow Electronics, Inc.(b)(c) | 100,319 | ||||||
| 1,980 | Avnet, Inc.(b) | 94,268 | ||||||
| 6,496 | Flex Ltd.(b)(c) | 93,347 | ||||||
|
|
|
|||||||
| 287,934 | ||||||||
|
|
|
|||||||
See accompanying notes to financial statements.
15 |
Table of Contents
Portfolio of Investments – as of December 31, 2016
Gateway Equity Call Premium Fund – (continued)
| Shares | Description | Value (†) | ||||||
| Energy Equipment & Services — 1.3% | ||||||||
| 4,362 | National Oilwell Varco, Inc.(b) | $ | 163,313 | |||||
| 3,461 | Oceaneering International, Inc.(b) | 97,635 | ||||||
| 7,976 | Schlumberger Ltd.(b) | 669,585 | ||||||
|
|
|
|||||||
| 930,533 | ||||||||
|
|
|
|||||||
| Food & Staples Retailing — 2.0% | ||||||||
| 1,846 | Costco Wholesale Corp.(b) | 295,563 | ||||||
| 3,443 | CVS Health Corp.(b) | 271,687 | ||||||
| 2,488 | Sysco Corp.(b) | 137,761 | ||||||
| 5,468 | Wal-Mart Stores, Inc.(b) | 377,948 | ||||||
| 3,584 | Walgreens Boots Alliance, Inc.(b) | 296,612 | ||||||
|
|
|
|||||||
| 1,379,571 | ||||||||
|
|
|
|||||||
| Food Products — 1.6% | ||||||||
| 3,547 | General Mills, Inc.(b) | 219,098 | ||||||
| 1,632 | Hain Celestial Group, Inc. (The)(b)(c) | 63,697 | ||||||
| 557 | Ingredion, Inc.(b) | 69,603 | ||||||
| 2,622 | Kellogg Co.(b) | 193,268 | ||||||
| 2,225 | Kraft Heinz Co. (The)(b) | 194,287 | ||||||
| 7,367 | Mondelez International, Inc., Class A(b) | 326,579 | ||||||
| 188 | Post Holdings, Inc.(b)(c) | 15,113 | ||||||
| 317 | TreeHouse Foods, Inc.(b)(c) | 22,884 | ||||||
|
|
|
|||||||
| 1,104,529 | ||||||||
|
|
|
|||||||
| Gas Utilities — 0.3% | ||||||||
| 1,722 | Atmos Energy Corp.(b) | 127,686 | ||||||
| 1,999 | UGI Corp.(b) | 92,114 | ||||||
|
|
|
|||||||
| 219,800 | ||||||||
|
|
|
|||||||
| Health Care Equipment & Supplies — 2.1% | ||||||||
| 7,508 | Abbott Laboratories(b) | 288,382 | ||||||
| 624 | Align Technology, Inc.(b)(c) | 59,985 | ||||||
| 389 | Cooper Cos., Inc. (The)(b) | 68,048 | ||||||
| 2,266 | DENTSPLY SIRONA, Inc.(b) | 130,816 | ||||||
| 4,178 | Hologic, Inc.(b)(c) | 167,621 | ||||||
| 825 | IDEXX Laboratories, Inc.(b)(c) | 96,748 | ||||||
| 6,217 | Medtronic PLC(b) | 442,837 | ||||||
| 826 | ResMed, Inc.(b) | 51,253 | ||||||
| 909 | STERIS PLC(b) | 61,258 | ||||||
| 770 | Teleflex, Inc.(b) | 124,086 | ||||||
|
|
|
|||||||
| 1,491,034 | ||||||||
|
|
|
|||||||
| Health Care Providers & Services — 2.6% | ||||||||
| 2,358 | Anthem, Inc.(b) | 339,010 | ||||||
| 2,192 | Centene Corp.(b)(c) | 123,870 | ||||||
| 3,711 | Express Scripts Holding Co.(b)(c) | 255,280 | ||||||
| 1,689 | McKesson Corp.(b) | 237,220 | ||||||
| 1,275 | MEDNAX, Inc.(b)(c) | 84,991 | ||||||
| 4,565 | UnitedHealth Group, Inc.(b) | 730,582 | ||||||
| 508 | WellCare Health Plans, Inc.(b)(c) | 69,637 | ||||||
|
|
|
|||||||
| 1,840,590 | ||||||||
|
|
|
|||||||
See accompanying notes to financial statements.
| 16
Table of Contents
Portfolio of Investments – as of December 31, 2016
Gateway Equity Call Premium Fund – (continued)
| Shares | Description | Value (†) | ||||||
| Hotels, Restaurants & Leisure — 1.6% | ||||||||
| 364 | Domino’s Pizza, Inc.(b) | $ | 57,963 | |||||
| 3,043 | Hilton Worldwide Holdings, Inc.(b) | 82,769 | ||||||
| 1,127 | Las Vegas Sands Corp.(b) | 60,193 | ||||||
| 3,107 | McDonald’s Corp.(b) | 378,184 | ||||||
| 2,601 | MGM Resorts International(b)(c) | 74,987 | ||||||
| 4,988 | Starbucks Corp.(b) | 276,934 | ||||||
| 2,190 | Yum China Holdings, Inc.(b)(c) | 57,203 | ||||||
| 2,190 | Yum! Brands, Inc.(b) | 138,693 | ||||||
|
|
|
|||||||
| 1,126,926 | ||||||||
|
|
|
|||||||
| Household Durables — 0.5% | ||||||||
| 1,633 | Leggett & Platt, Inc.(b) | 79,821 | ||||||
| 3,257 | Newell Brands, Inc.(b) | 145,425 | ||||||
| 3,216 | Toll Brothers, Inc.(b)(c) | 99,696 | ||||||
|
|
|
|||||||
| 324,942 | ||||||||
|
|
|
|||||||
| Household Products — 1.9% | ||||||||
| 1,966 | Church & Dwight Co., Inc.(b) | 86,878 | ||||||
| 1,573 | Clorox Co. (The)(b) | 188,791 | ||||||
| 1,870 | Kimberly-Clark Corp.(b) | 213,404 | ||||||
| 9,945 | Procter & Gamble Co. (The)(b) | 836,176 | ||||||
|
|
|
|||||||
| 1,325,249 | ||||||||
|
|
|
|||||||
| Industrial Conglomerates — 2.9% | ||||||||
| 3,051 | 3M Co.(b) | 544,817 | ||||||
| 35,497 | General Electric Co.(b) | 1,121,705 | ||||||
| 3,488 | Honeywell International, Inc.(b) | 404,085 | ||||||
|
|
|
|||||||
| 2,070,607 | ||||||||
|
|
|
|||||||
| Insurance — 2.2% | ||||||||
| 1,318 | Arch Capital Group Ltd.(b)(c) | 113,730 | ||||||
| 2,827 | Chubb Ltd.(b) | 373,503 | ||||||
| 2,022 | Cincinnati Financial Corp.(b) | 153,167 | ||||||
| 3,703 | Lincoln National Corp.(b) | 245,398 | ||||||
| 4,897 | Prudential Financial, Inc.(b) | 509,582 | ||||||
| 998 | Willis Towers Watson PLC(b) | 122,035 | ||||||
|
|
|
|||||||
| 1,517,415 | ||||||||
|
|
|
|||||||
| Internet & Direct Marketing Retail — 2.4% | ||||||||
| 1,434 | Amazon.com, Inc.(b)(c) | 1,075,314 | ||||||
| 236 | Liberty Expedia Holdings, Inc., Series A(b)(c) | 9,362 | ||||||
| 4,574 | Liberty Interactive Corp./QVC Group, Class A(b)(c) | 91,388 | ||||||
| 486 | Liberty Ventures, Series A(b)(c) | 17,919 | ||||||
| 1,729 | Netflix, Inc.(b)(c) | 214,050 | ||||||
| 201 | Priceline Group, Inc. (The)(b)(c) | 294,678 | ||||||
|
|
|
|||||||
| 1,702,711 | ||||||||
|
|
|
|||||||
| Internet Software & Services — 4.1% | ||||||||
| 307 | Alibaba Group Holding Ltd., Sponsored ADR(b)(c) | 26,958 | ||||||
| 1,352 | Alphabet, Inc., Class A(b)(c) | 1,071,392 | ||||||
| 816 | Alphabet, Inc., Class C(b)(c) | 629,805 | ||||||
See accompanying notes to financial statements.
17 |
Table of Contents
Portfolio of Investments – as of December 31, 2016
Gateway Equity Call Premium Fund – (continued)
| Shares | Description | Value (†) | ||||||
| Internet Software & Services — continued | ||||||||
| 81 | CommerceHub, Inc., Series A(b)(c) | $ | 1,216 | |||||
| 162 | CommerceHub, Inc., Series C(b)(c) | 2,435 | ||||||
| 8,766 | Facebook, Inc., Class A(b)(c) | 1,008,528 | ||||||
| 4,543 | Yahoo!, Inc.(b)(c) | 175,678 | ||||||
|
|
|
|||||||
| 2,916,012 | ||||||||
|
|
|
|||||||
| IT Services — 3.4% | ||||||||
| 2,925 | Accenture PLC, Class A(b) | 342,605 | ||||||
| 655 | Amdocs Ltd.(b) | 38,154 | ||||||
| 1,720 | Computer Sciences Corp.(b) | 102,203 | ||||||
| 360 | FleetCor Technologies, Inc.(b)(c) | 50,947 | ||||||
| 1,181 | Global Payments, Inc.(b) | 81,973 | ||||||
| 3,501 | International Business Machines Corp.(b) | 581,131 | ||||||
| 4,205 | MasterCard, Inc., Class A(b) | 434,166 | ||||||
| 2,951 | Paychex, Inc.(b) | 179,657 | ||||||
| 7,829 | Visa, Inc., Class A(b) | 610,819 | ||||||
|
|
|
|||||||
| 2,421,655 | ||||||||
|
|
|
|||||||
| Leisure Products — 0.2% | ||||||||
| 1,129 | Brunswick Corp.(b) | 61,576 | ||||||
| 586 | Polaris Industries, Inc.(b) | 48,280 | ||||||
|
|
|
|||||||
| 109,856 | ||||||||
|
|
|
|||||||
| Life Sciences Tools & Services — 0.4% | ||||||||
| 708 | Illumina, Inc.(b)(c) | 90,652 | ||||||
| 1,534 | Thermo Fisher Scientific, Inc.(b) | 216,448 | ||||||
|
|
|
|||||||
| 307,100 | ||||||||
|
|
|
|||||||
| Machinery — 1.3% | ||||||||
| 652 | AGCO Corp.(b) | 37,725 | ||||||
| 3,887 | Caterpillar, Inc.(b) | 360,480 | ||||||
| 1,359 | Cummins, Inc.(b) | 185,735 | ||||||
| 2,426 | IDEX Corp.(b) | 218,486 | ||||||
| 581 | WABCO Holdings, Inc.(b)(c) | 61,673 | ||||||
| 964 | Wabtec Corp.(b) | 80,031 | ||||||
|
|
|
|||||||
| 944,130 | ||||||||
|
|
|
|||||||
| Media — 2.9% | ||||||||
| 939 | AMC Networks, Inc., Class A(b)(c) | 49,147 | ||||||
| 9,388 | Comcast Corp., Class A(b) | 648,242 | ||||||
| 36,426 | Sirius XM Holdings, Inc.(b) | 162,096 | ||||||
| 3,313 | Time Warner, Inc.(b) | 319,804 | ||||||
| 9,359 | Twenty-First Century Fox, Inc., Class A(b) | 262,426 | ||||||
| 956 | Twenty-First Century Fox, Inc., Class B(b) | 26,051 | ||||||
| 5,679 | Walt Disney Co. (The)(b) | 591,865 | ||||||
|
|
|
|||||||
| 2,059,631 | ||||||||
|
|
|
|||||||
| Metals & Mining — 0.2% | ||||||||
| 4,474 | Steel Dynamics, Inc.(b) | 159,185 | ||||||
|
|
|
|||||||
See accompanying notes to financial statements.
| 18
Table of Contents
Portfolio of Investments – as of December 31, 2016
Gateway Equity Call Premium Fund – (continued)
| Shares | Description | Value (†) | ||||||
| Multi – Utilities — 0.3% | ||||||||
| 4,966 | Public Service Enterprise Group, Inc.(b) | $ | 217,908 | |||||
|
|
|
|||||||
| Multiline Retail — 0.5% | ||||||||
| 2,844 | Nordstrom, Inc.(b) | 136,313 | ||||||
| 3,466 | Target Corp.(b) | 250,349 | ||||||
|
|
|
|||||||
| 386,662 | ||||||||
|
|
|
|||||||
| Oil, Gas & Consumable Fuels — 6.2% | ||||||||
| 1,770 | Cheniere Energy, Inc.(b)(c) | 73,331 | ||||||
| 7,795 | Chevron Corp.(b) | 917,471 | ||||||
| 2,413 | Concho Resources, Inc.(b)(c) | 319,964 | ||||||
| 16,270 | Exxon Mobil Corp.(b) | 1,468,530 | ||||||
| 3,480 | HollyFrontier Corp.(b) | 114,005 | ||||||
| 6,753 | Noble Energy, Inc.(b) | 257,019 | ||||||
| 5,635 | Occidental Petroleum Corp.(b) | 401,381 | ||||||
| 3,064 | Phillips 66(b) | 264,760 | ||||||
| 1,780 | Pioneer Natural Resources Co.(b) | 320,525 | ||||||
| 4,839 | Spectra Energy Corp.(b) | 198,835 | ||||||
| 6,271 | Whiting Petroleum Corp.(b)(c) | 75,377 | ||||||
|
|
|
|||||||
| 4,411,198 | ||||||||
|
|
|
|||||||
| Pharmaceuticals — 5.1% | ||||||||
| 1,191 | Allergan PLC(b)(c) | 250,122 | ||||||
| 7,282 | Bristol-Myers Squibb Co.(b) | 425,560 | ||||||
| 4,170 | Eli Lilly & Co.(b) | 306,704 | ||||||
| 844 | Jazz Pharmaceuticals PLC(b)(c) | 92,021 | ||||||
| 10,242 | Johnson & Johnson(b) | 1,179,981 | ||||||
| 10,712 | Merck & Co., Inc.(b) | 630,615 | ||||||
| 23,104 | Pfizer, Inc.(b) | 750,418 | ||||||
|
|
|
|||||||
| 3,635,421 | ||||||||
|
|
|
|||||||
| Professional Services — 0.2% | ||||||||
| 578 | Manpowergroup, Inc.(b) | 51,367 | ||||||
| 1,312 | Verisk Analytics, Inc.(b)(c) | 106,495 | ||||||
|
|
|
|||||||
| 157,862 | ||||||||
|
|
|
|||||||
| Real Estate Management & Development — 0.1% | ||||||||
| 559 | Jones Lang LaSalle, Inc.(b) | 56,481 | ||||||
|
|
|
|||||||
| REITs – Apartments — 0.6% | ||||||||
| 823 | American Campus Communities, Inc.(b) | 40,961 | ||||||
| 561 | Essex Property Trust, Inc.(b) | 130,432 | ||||||
| 745 | Mid-America Apartment Communities, Inc.(b) | 72,950 | ||||||
| 4,045 | UDR, Inc.(b) | 147,562 | ||||||
|
|
|
|||||||
| 391,905 | ||||||||
|
|
|
|||||||
| REITs – Diversified — 0.7% | ||||||||
| 1,972 | Crown Castle International Corp.(b) | 171,111 | ||||||
| 1,316 | Digital Realty Trust, Inc.(b) | 129,310 | ||||||
| 7,240 | Duke Realty Corp.(b) | 192,294 | ||||||
|
|
|
|||||||
| 492,715 | ||||||||
|
|
|
|||||||
See accompanying notes to financial statements.
19 |
Table of Contents
Portfolio of Investments – as of December 31, 2016
Gateway Equity Call Premium Fund – (continued)
| Shares | Description | Value (†) | ||||||
| REITs – Mortgage — 0.2% | ||||||||
| 4,847 | AGNC Investment Corp.(b) | $ | 87,876 | |||||
| 8,270 | Annaly Capital Management, Inc.(b) | 82,452 | ||||||
|
|
|
|||||||
| 170,328 | ||||||||
|
|
|
|||||||
| REITs – Office Property — 0.4% | ||||||||
| 1,607 | Kilroy Realty Corp.(b) | 117,665 | ||||||
| 1,517 | SL Green Realty Corp.(b) | 163,153 | ||||||
|
|
|
|||||||
| 280,818 | ||||||||
|
|
|
|||||||
| REITs – Shopping Centers — 0.4% | ||||||||
| 13,092 | DDR Corp.(b) | 199,915 | ||||||
| 1,155 | Regency Centers Corp.(b) | 79,637 | ||||||
|
|
|
|||||||
| 279,552 | ||||||||
|
|
|
|||||||
| REITs – Single Tenant — 0.3% | ||||||||
| 1,430 | National Retail Properties, Inc.(b) | 63,206 | ||||||
| 2,059 | Realty Income Corp.(b) | 118,351 | ||||||
|
|
|
|||||||
| 181,557 | ||||||||
|
|
|
|||||||
| REITs – Storage — 0.2% | ||||||||
| 1,525 | Extra Space Storage, Inc.(b) | 117,791 | ||||||
|
|
|
|||||||
| Road & Rail — 0.9% | ||||||||
| 1,717 | Norfolk Southern Corp.(b) | 185,556 | ||||||
| 915 | Old Dominion Freight Line, Inc.(b)(c) | 78,498 | ||||||
| 3,737 | Union Pacific Corp.(b) | 387,452 | ||||||
|
|
|
|||||||
| 651,506 | ||||||||
|
|
|
|||||||
| Semiconductors & Semiconductor Equipment — 3.0% | ||||||||
| 9,410 | Applied Materials, Inc.(b) | 303,661 | ||||||
| 21,405 | Intel Corp.(b) | 776,359 | ||||||
| 2,220 | Maxim Integrated Products, Inc.(b) | 85,625 | ||||||
| 830 | NXP Semiconductors NV(b)(c) | 81,348 | ||||||
| 6,293 | QUALCOMM, Inc.(b) | 410,304 | ||||||
| 6,106 | Texas Instruments, Inc.(b) | 445,555 | ||||||
| 993 | Versum Materials, Inc.(b)(c) | 27,874 | ||||||
|
|
|
|||||||
| 2,130,726 | ||||||||
|
|
|
|||||||
| Software — 4.6% | ||||||||
| 3,182 | Activision Blizzard, Inc.(b) | 114,902 | ||||||
| 2,439 | Adobe Systems, Inc.(b)(c) | 251,095 | ||||||
| 412 | ANSYS, Inc.(b)(c) | 38,106 | ||||||
| 2,200 | Cadence Design Systems, Inc.(b)(c) | 55,484 | ||||||
| 379 | CDK Global, Inc.(b) | 22,622 | ||||||
| 429 | Check Point Software Technologies Ltd.(c) | 36,233 | ||||||
| 971 | Dell Technologies, Inc., Class V(b)(c) | 53,376 | ||||||
| 1,834 | Fortinet, Inc.(b)(c) | 55,240 | ||||||
| 28,775 | Microsoft Corp.(b) | 1,788,078 | ||||||
| 12,935 | Oracle Corp.(b) | 497,351 | ||||||
| 2,954 | Salesforce.com, Inc.(b)(c) | 202,231 | ||||||
| 652 | ServiceNow, Inc.(b)(c) | 48,470 | ||||||
See accompanying notes to financial statements.
| 20
Table of Contents
Portfolio of Investments – as of December 31, 2016
Gateway Equity Call Premium Fund – (continued)
| Shares | Description | Value (†) | ||||||
| Software — continued | ||||||||
| 406 | Synopsys, Inc.(b)(c) | $ | 23,897 | |||||
| 142 | Ultimate Software Group, Inc. (The)(b)(c) | 25,894 | ||||||
|
|
|
|||||||
| 3,212,979 | ||||||||
|
|
|
|||||||
| Specialty Retail — 2.5% | ||||||||
| 497 | Advance Auto Parts, Inc.(b) | 84,053 | ||||||
| 1,237 | Dick’s Sporting Goods, Inc.(b) | 65,685 | ||||||
| 1,582 | Foot Locker, Inc.(b) | 112,148 | ||||||
| 5,393 | Home Depot, Inc. (The)(b) | 723,093 | ||||||
| 4,459 | Lowe’s Cos., Inc.(b) | 317,124 | ||||||
| 575 | Signet Jewelers Ltd.(b) | 54,199 | ||||||
| 3,067 | TJX Cos., Inc. (The)(b) | 230,424 | ||||||
| 392 | Ulta Salon, Cosmetics & Fragrance, Inc.(b)(c) | 99,936 | ||||||
| 1,007 | Williams-Sonoma, Inc.(b) | 48,729 | ||||||
|
|
|
|||||||
| 1,735,391 | ||||||||
|
|
|
|||||||
| Technology Hardware, Storage & Peripherals — 3.8% | ||||||||
| 20,248 | Apple, Inc.(b) | 2,345,124 | ||||||
| 7,272 | Hewlett Packard Enterprise Co.(b) | 168,274 | ||||||
| 12,056 | HP, Inc.(b) | 178,911 | ||||||
|
|
|
|||||||
| 2,692,309 | ||||||||
|
|
|
|||||||
| Textiles, Apparel & Luxury Goods — 0.7% | ||||||||
| 412 | Carter’s, Inc.(b) | 35,593 | ||||||
| 2,897 | Hanesbrands, Inc.(b) | 62,488 | ||||||
| 743 | Lululemon Athletica, Inc.(b)(c) | 48,287 | ||||||
| 5,923 | NIKE, Inc., Class B(b) | 301,066 | ||||||
| 1,029 | Skechers U.S.A., Inc., Class A(b)(c) | 25,293 | ||||||
|
|
|
|||||||
| 472,727 | ||||||||
|
|
|
|||||||
| Thrifts & Mortgage Finance — 0.0% | ||||||||
| 2,133 | New York Community Bancorp, Inc.(b) | 33,936 | ||||||
|
|
|
|||||||
| Tobacco — 1.7% | ||||||||
| 8,904 | Altria Group, Inc.(b) | 602,089 | ||||||
| 6,535 | Philip Morris International, Inc.(b) | 597,887 | ||||||
|
|
|
|||||||
| 1,199,976 | ||||||||
|
|
|
|||||||
| Water Utilities — 0.3% | ||||||||
| 2,843 | American Water Works Co., Inc.(b) | 205,720 | ||||||
|
|
|
|||||||
| Wireless Telecommunication Services — 0.1% | ||||||||
| 7,863 | Sprint Corp.(b)(c) | 66,206 | ||||||
|
|
|
|||||||
| Total Common Stocks (Identified Cost $58,723,760) |
69,217,732 | |||||||
|
|
|
|||||||
See accompanying notes to financial statements.
21 |
Table of Contents
Portfolio of Investments – as of December 31, 2016
Gateway Equity Call Premium Fund – (continued)
| Principal Amount |
Value (†) | |||||||
| Short-Term Investments — 4.0% | ||||||||
| $ | 2,790,351 | Tri-Party Repurchase Agreement with Fixed Income Clearing Corporation, dated 12/30/2016 at 0.030% to be repurchased at $2,790,360 on 1/03/2017
collateralized by $2,930,000 U.S. Treasury Note, 2.000% due 8/15/2025 valued at $2,849,246 including accrued interest (Note 2 of Notes to Financial Statements) (Identified Cost $2,790,351) |
$ | 2,790,351 | ||||
|
|
|
|||||||
| Total Investments — 102.0% (Identified Cost $61,514,111)(a) |
72,008,083 | |||||||
| Other assets less liabilities — (2.0)% | (1,398,395 | ) | ||||||
|
|
|
|||||||
| Net Assets — 100.0% | $ | 70,609,688 | ||||||
|
|
|
|||||||
| Contracts | ||||||||
| Written Options — (1.9%) | ||||||||
| Index Options — (1.9%) | ||||||||
| 35 | On S&P 500® Index, Call expiring January 06, 2017 at 2200 | $ | (152,950 | ) | ||||
| 32 | On S&P 500® Index, Call expiring January 13, 2017 at 2260 | (31,200 | ) | |||||
| 38 | On S&P 500® Index, Call expiring January 20, 2017 at 2175 | (281,390 | ) | |||||
| 31 | On S&P 500® Index, Call expiring January 20, 2017 at 2200 | (164,610 | ) | |||||
| 31 | On S&P 500® Index, Call expiring January 20, 2017 at 2250 | (57,970 | ) | |||||
| 36 | On S&P 500® Index, Call expiring February 17, 2017 at 2200 | (236,700 | ) | |||||
| 37 | On S&P 500® Index, Call expiring February 17, 2017 at 2225 | (177,970 | ) | |||||
| 32 | On S&P 500® Index, Call expiring March 17, 2017 at 2250 | (145,760 | ) | |||||
| 34 | On S&P 500® Index, Call expiring March 17, 2017 at 2275 | (109,650 | ) | |||||
|
|
|
|||||||
| Total Written Options (Premiums Received $1,217,286) |
$ | (1,358,200 | ) | |||||
|
|
|
|||||||
| (†) | See Note 2 of Notes to Financial Statements. | |||||||
| (a) | Federal Tax Information: | |||||||
| At December 31, 2016, the net unrealized appreciation on investments based on a cost of $61,538,841 for federal income tax purposes was as follows: | ||||||||
| Aggregate gross unrealized appreciation for all investments in which there is an excess of value over tax cost | $ | 11,043,742 | ||||||
| Aggregate gross unrealized depreciation for all investments in which there is an excess of tax cost over value | (574,500 | ) | ||||||
|
|
|
|||||||
| Net unrealized appreciation | $ | 10,469,242 | ||||||
|
|
|
|||||||
| (b) | Security (or a portion thereof) has been pledged as collateral for open derivative contracts. | |||||||
| (c) | Non-income producing security. | |||||||
| ADR | An American Depositary Receipt is a certificate issued by a custodian bank representing the right to receive securities of the foreign issuer described. The values of ADRs may be significantly influenced by trading on exchanges not located in the United States. | |||||||
| REITs | Real Estate Investment Trusts | |||||||
See accompanying notes to financial statements.
| 22
Table of Contents
Portfolio of Investments – as of December 31, 2016
Gateway Equity Call Premium Fund – (continued)
Industry Summary at December 31, 2016
| Banks |
6.7 | % | ||
| Oil, Gas & Consumable Fuels |
6.2 | |||
| Pharmaceuticals |
5.1 | |||
| Software |
4.6 | |||
| Internet Software & Services |
4.1 | |||
| Technology Hardware, Storage & Peripherals |
3.8 | |||
| IT Services |
3.4 | |||
| Semiconductors & Semiconductor Equipment |
3.0 | |||
| Industrial Conglomerates |
2.9 | |||
| Media |
2.9 | |||
| Biotechnology |
2.9 | |||
| Health Care Providers & Services |
2.6 | |||
| Diversified Telecommunication Services |
2.6 | |||
| Specialty Retail |
2.5 | |||
| Internet & Direct Marketing Retail |
2.4 | |||
| Capital Markets |
2.2 | |||
| Aerospace & Defense |
2.2 | |||
| Insurance |
2.2 | |||
| Chemicals |
2.1 | |||
| Health Care Equipment & Supplies |
2.1 | |||
| Electric Utilities |
2.1 | |||
| Beverages |
2.0 | |||
| Food & Staples Retailing |
2.0 | |||
| Other Investments, less than 2% each |
25.4 | |||
| Short-Term Investments |
4.0 | |||
|
|
|
|||
| Total Investments |
102.0 | |||
| Other assets less liabilities (including open written options) |
(2.0 | ) | ||
|
|
|
|||
| Net Assets |
100.0 | % | ||
|
|
|
See accompanying notes to financial statements.
23 |
Table of Contents
Portfolio of Investments – as of December 31, 2016
Loomis Sayles Strategic Alpha Fund
| Principal Amount (‡) |
Description | Value (†) | ||||||
| Bonds and Notes — 73.9% of Net Assets | ||||||||
| Non-Convertible Bonds — 72.7% | ||||||||
| ABS Car Loan — 6.0% | ||||||||
| $ | 2,135,000 | Ally Auto Receivables Trust, Series 2016-3, Class A3, 1.440%, 8/17/2020(b) |
$ | 2,134,852 | ||||
| 1,455,000 | AmeriCredit Automobile Receivables Trust, Series 2015-4, Class D, 3.720%, 12/08/2021(b) |
1,486,663 | ||||||
| 295,000 | AmeriCredit Automobile Receivables Trust, Series 2016-2, Class D, 3.650%, 5/09/2022(b) |
300,645 | ||||||
| 600,000 | CPS Auto Receivables Trust, Series 2014-D, Class C, 4.350%, 11/16/2020, 144A(b) |
603,403 | ||||||
| 3,065,000 | CPS Auto Receivables Trust, Series 2016-B, Class E, 8.140%, 5/15/2023, 144A |
3,183,156 | ||||||
| 2,175,000 | Drive Auto Receivables Trust, Series 2016-CA, Class C, 3.020%, 11/15/2021, 144A(b) |
2,176,336 | ||||||
| 655,000 | DT Auto Owner Trust, Series 2014-3A, Class D, 4.470%, 11/15/2021, 144A(b) |
667,950 | ||||||
| 4,075,000 | DT Auto Owner Trust, Series 2016-1A, Class D, 4.660%, 12/15/2022, 144A(b) |
4,135,716 | ||||||
| 3,045,000 | DT Auto Owner Trust, Series 2016-2A, Class D, 5.430%, 11/15/2022, 144A(b) |
3,144,138 | ||||||
| 270,000 | First Investors Auto Owner Trust, Series 2014-1A, Class D, 3.280%, 4/15/2021, 144A(b) |
270,678 | ||||||
| 440,000 | First Investors Auto Owner Trust, Series 2014-2A, Class D, 3.470%, 2/15/2021, 144A(b) |
442,801 | ||||||
| 345,000 | First Investors Auto Owner Trust, Series 2015-1A, Class D, 3.590%, 1/18/2022, 144A(b) |
345,496 | ||||||
| 1,710,000 | First Investors Auto Owner Trust, Series 2015-2A, Class D, 4.220%, 12/15/2021, 144A(b) |
1,734,493 | ||||||
| 220,000 | First Investors Auto Owner Trust, Series 2016-2A, Class D, 3.350%, 11/15/2022, 144A(b) |
215,460 | ||||||
| 605,000 | Flagship Credit Auto Trust, Series 2015-1, Class C, 3.760%, 6/15/2021, 144A(b) |
603,155 | ||||||
| 2,450,000 | Flagship Credit Auto Trust, Series 2015-2, Class D, 5.980%, 8/15/2022, 144A |
2,437,395 | ||||||
| 2,610,000 | Flagship Credit Auto Trust, Series 2015-3, Class D, 7.120%, 11/15/2022, 144A |
2,658,689 | ||||||
| 650,000 | Flagship Credit Auto Trust, Series 2016-3, Class D, 3.890%, 11/15/2022, 144A(b) |
637,270 | ||||||
| 1,135,000 | Flagship Credit Auto Trust, Series 2016-3, Class E, 6.250%, 10/15/2023, 144A |
1,117,877 | ||||||
| 1,403,699 | Ford Credit Auto Owner Trust, Series 2014-C, Class A3, 1.060%, 5/15/2019(b) |
1,402,873 | ||||||
| 2,446,114 | Ford Credit Auto Owner Trust, Series 2015-A, Class A3, 1.280%, 9/15/2019(b) |
2,447,083 | ||||||
| 1,981,279 | Ford Credit Auto Owner Trust, Series 2015-B, Class A3, 1.160%, 11/15/2019(b) |
1,979,470 | ||||||
| 3,350,000 | Ford Credit Auto Owner Trust, Series 2015-C, Class A3, 1.410%, 2/15/2020(b) |
3,351,148 | ||||||
See accompanying notes to financial statements.
| 24
Table of Contents
Portfolio of Investments – as of December 31, 2016
Loomis Sayles Strategic Alpha Fund – (continued)
| Principal Amount (‡) |
Description | Value (†) | ||||||
| ABS Car Loan — continued | ||||||||
| $ | 891,746 | Ford Credit Auto Owner Trust, Series 2016-B, Class A2B, 1.014%, 3/15/2019(b)(c) |
$ | 892,233 | ||||
| 10,395,000 | Ford Credit Auto Owner Trust, Series 2016-C, Class A2B, 0.844%, 9/15/2019(b)(c) |
10,395,272 | ||||||
| 1,270,504 | Honda Auto Receivables Owner Trust, Series 2014-4, Class A3, 0.990%, 9/17/2018(b) |
1,269,522 | ||||||
| 3,385,000 | Honda Auto Receivables Owner Trust, Series 2015-3, Class A3, 1.270%, 4/18/2019(b) |
3,383,906 | ||||||
| 2,135,000 | Honda Auto Receivables Owner Trust, Series 2016-2, Class A3, 1.390%, 4/15/2020(b) |
2,131,690 | ||||||
| 5,570,000 | Honda Auto Receivables Owner Trust, Series 2016-4, Class A3, 1.210%, 12/18/2020(b) |
5,525,560 | ||||||
| 970,000 | Nissan Auto Receivables Owner Trust, Series 2016-C, Class A3, 1.180%, 1/15/2021(b) |
960,903 | ||||||
| 3,045,000 | Prestige Auto Receivables Trust, Series 2016-1A, Class D, 5.150%, 11/15/2021, 144A(b) |
3,120,837 | ||||||
| 3,215,000 | Toyota Auto Receivables Owner Trust, Series 2015-C, Class A3, 1.340%, 6/17/2019(b) |
3,215,165 | ||||||
| 795,000 | Toyota Auto Receivables Owner Trust, Series 2016-C, Class A3, 1.140%, 8/17/2020(b) |
789,778 | ||||||
| 1,975,000 | Toyota Auto Receivables Owner Trust, Series 2016-D, Class A2B, 0.834%, 5/15/2019(b)(c) |
1,975,147 | ||||||
| 1,345,000 | USAA Auto Owner Trust, Series 2016-1, Class A3, 1.200%, 6/15/2020(b) | 1,339,577 | ||||||
|
|
|
|||||||
| 72,476,337 | ||||||||
|
|
|
|||||||
| ABS Credit Card — 7.3% | ||||||||
| 3,145,000 | American Express Credit Account Master Trust, Series 2013-1, Class A, 1.124%, 2/16/2021(b)(c) |
3,154,786 | ||||||
| 2,695,000 | American Express Credit Account Master Trust, Series 2014-4, Class A, 1.430%, 6/15/2020(b) |
2,699,465 | ||||||
| 2,295,000 | American Express Credit Account Master Trust, Series 2014-5, Class A, 0.994%, 5/15/2020(b)(c) |
2,297,286 | ||||||
| 4,050,000 | American Express Credit Account Secured Note Trust, Series 2012-4, Class A, 0.944%, 5/15/2020(b)(c) | 4,050,025 | ||||||
| 2,765,000 | American Express Issuance Trust II, Series 2013-2, Class A, 1.134%, 8/15/2019(b)(c) |
2,775,545 | ||||||
| 2,050,000 | BA Credit Card Trust, Series 2014-A1, Class A, 1.084%, 6/15/2021(b)(c) | 2,055,155 | ||||||
| 5,865,000 | Bank of America Credit Card Trust, Series 2015-A1, Class A, 1.034%, 6/15/2020(b)(c) |
5,872,877 | ||||||
| 995,000 | Bank of America Credit Card Trust, Series 2016-A1, Class A, 1.094%, 10/15/2021(b)(c) |
997,904 | ||||||
| 3,600,000 | Capital One Multi-Asset Execution Trust, Series 2004-A7, Class A7, 1.450%, 8/16/2021(b) |
3,592,476 | ||||||
| 5,865,000 | Capital One Multi-Asset Execution Trust, Series 2007-A2, Class A2, 0.784%, 12/16/2019(b)(c) |
5,865,000 | ||||||
| 3,370,000 | Chase Issuance Trust, Series 2007-A12, Class A12, 0.754%, 8/15/2019(b)(c) |
3,368,049 | ||||||
| 6,640,000 | Chase Issuance Trust, Series 2014-A7, Class A, 1.380%, 11/15/2019(b) | 6,645,769 | ||||||
| 3,560,000 | Chase Issuance Trust, Series 2015-A1, Class A, 1.024%, 2/18/2020(b)(c) | 3,564,414 | ||||||
See accompanying notes to financial statements.
25 |
Table of Contents
Portfolio of Investments – as of December 31, 2016
Loomis Sayles Strategic Alpha Fund – (continued)
| Principal Amount (‡) |
Description | Value (†) | ||||||
| ABS Credit Card — continued | ||||||||
| $ | 3,500,000 | Chase Issuance Trust, Series 2015-A4, Class A, 1.840%, 4/15/2022(b) | $ | 3,482,971 | ||||
| 6,090,000 | Chase Issuance Trust, Series 2016-A1, Class A, 1.114%, 5/17/2021(b)(c) | 6,109,029 | ||||||
| 3,120,000 | Chase Issuance Trust, Series 2016-A2, Class A, 1.370%, 6/15/2021(b) | 3,089,912 | ||||||
| 2,900,000 | Chase Issuance Trust, Series 2016-A5, Class A5, 1.270%, 7/15/2021(b) | 2,861,328 | ||||||
| 5,825,000 | Citibank Credit Card Issuance Trust, Series 2013-A7, Class A7, 1.094%, 9/10/2020(b)(c) |
5,845,926 | ||||||
| 3,000,000 | Citibank Credit Card Issuance Trust, Series 2014-A4, Class A4, 1.230%, 4/24/2019(b) |
3,001,200 | ||||||
| 3,045,000 | Citibank Credit Card Issuance Trust, Series 2014-A8, Class A8, 1.730%, 4/09/2020(b) |
3,056,668 | ||||||
| 5,800,000 | Citibank Credit Card Issuance Trust, Series 2016-A1, Class A1, 1.750%, 11/19/2021(b) |
5,774,451 | ||||||
| 2,405,000 | Discover Card Execution Note Trust, Series 2013-A1, Class A1, 1.004%, 8/17/2020(b)(c) |
2,406,969 | ||||||
| 990,000 | Discover Card Execution Note Trust, Series 2015-A1, Class A1, 1.054%, 8/17/2020(b)(c) |
991,491 | ||||||
| 3,600,000 | World Financial Network Credit Card Master Trust, Series 2015-C, Class A, 1.260%, 3/15/2021(b) | 3,602,181 | ||||||
|
|
|
|||||||
| 87,160,877 | ||||||||
|
|
|
|||||||
| ABS Home Equity — 12.6% | ||||||||
| 764,379 | Adjustable Rate Mortgage Trust, Series 2004-4, Class 3A1, 3.278%, 3/25/2035(b)(c) |
735,494 | ||||||
| 1,963,530 | Ajax Mortgage Loan Trust, Series 2016-B, Class A, 4.000%, 9/25/2065, 144A(b)(c) |
1,959,574 | ||||||
| 1,519,472 | Ajax Mortgage Loan Trust, Series 2016-C, Class A, 4.000%, 10/25/2057, 144A(b)(c) |
1,522,695 | ||||||
| 4,170,870 | Alliance Bancorp Trust, Series 2007-OA1, Class A1, 0.996%, 7/25/2037(c) | 3,011,615 | ||||||
| 708,655 | Alternative Loan Trust, Series 2003-20CB, Class 2A1, 5.750%, 10/25/2033 | 729,627 | ||||||
| 610,207 | Alternative Loan Trust, Series 2003-9T1, Class A7, 5.500%, 7/25/2033 | 604,142 | ||||||
| 450,120 | Alternative Loan Trust, Series 2004-28CB, Class 5A1, 5.750%, 1/25/2035 | 453,092 | ||||||
| 1,354,215 | Alternative Loan Trust, Series 2005-J1, Class 2A1, 5.500%, 2/25/2025 | 1,379,699 | ||||||
| 1,070,764 | American Home Mortgage Investment Trust, Series 2005-2, Class 1A1, 0.884%, 9/25/2045(c) |
882,632 | ||||||
| 1,500,000 | American Homes 4 Rent, Series 2014-SFR1, Class E, 3.236%, 6/17/2031, 144A(c) |
1,491,339 | ||||||
| 300,000 | American Homes 4 Rent, Series 2014-SFR2, Class D, 5.149%, 10/17/2036, 144A(b) |
314,332 | ||||||
| 1,980,000 | American Homes 4 Rent, Series 2014-SFR2, Class E, 6.231%, 10/17/2036, 144A |
2,067,808 | ||||||
| 1,200,000 | American Homes 4 Rent, Series 2014-SFR3, Class E, 6.418%, 12/17/2036, 144A |
1,267,639 | ||||||
| 863,560 | Banc of America Alternative Loan Trust, Series 2003-8, Class 1CB1, 5.500%, 10/25/2033 |
880,293 | ||||||
| 3,009,423 | Banc of America Alternative Loan Trust, Series 2004-6, Class 2A1, 6.000%, 7/25/2034 |
3,152,115 | ||||||
| 1,098,966 | Banc of America Alternative Loan Trust, Series 2005-6, Class CB7, 5.250%, 7/25/2035 | 1,001,702 | ||||||
See accompanying notes to financial statements.
| 26
Table of Contents
Portfolio of Investments – as of December 31, 2016
Loomis Sayles Strategic Alpha Fund – (continued)
| Principal Amount (‡) |
Description | Value (†) | ||||||
| ABS Home Equity — continued | ||||||||
| $ | 810,127 | Banc of America Funding Corp., Series 2007-4, Class 5A1, 5.500%, 11/25/2034 |
$ | 803,019 | ||||
| 1,593,970 | Banc of America Funding Trust, Series 2004-B, Class 4A2, 3.231%, 11/20/2034(c) |
1,486,210 | ||||||
| 467,191 | Banc of America Funding Trust, Series 2005-5, Class A1, 5.500%, 9/25/2035(b) |
483,125 | ||||||
| 1,132,807 | Banc of America Funding Trust, Series 2005-7, Class 3A1, 5.750%, 11/25/2035 |
1,160,661 | ||||||
| 648,953 | Bayview Opportunity Master Fund Trust, Series 16-RPL3, Class A1, 3.475%, 7/28/2031, 144A(b)(c) |
645,154 | ||||||
| 1,958,151 | Bayview Opportunity Master Fund Trust, Series 2016-LT1, Class A1, 3.475%, 10/28/2031, 144A(b)(c) |
1,950,416 | ||||||
| 1,002,713 | Bayview Opportunity Master Fund Trust, Series 2016-RN3, Class A1, 3.598%, 9/29/2031, 144A(b)(c) |
998,969 | ||||||
| 1,126,592 | BCAP LLC Trust, Series 2007-AA2, Class 22A1, 6.000%, 3/25/2022 | 1,113,797 | ||||||
| 2,302,178 | Bear Stearns Adjustable Rate Mortgage Trust, Series 2004-6, Class 2A1, 3.322%, 9/25/2034(c) |
2,110,923 | ||||||
| 1,183,677 | Bear Stearns Adjustable Rate Mortgage Trust, Series 2005-12, Class 11A1, 3.177%, 2/25/2036(c) | 999,373 | ||||||
| 612,855 | CAM Mortgage Trust, Series 2016-1, Class A, 4.000%, 1/15/2056, 144A(b)(c) |
609,931 | ||||||
| 2,055,000 | CAM Mortgage Trust, Series 2016-1, Class M, 5.000%, 1/15/2056, 144A(c) | 1,970,435 | ||||||
| 632,204 | Citigroup Mortgage Loan Trust, Inc., Series 2005-2, Class 1A4, 2.967%, 5/25/2035(c) |
587,849 | ||||||
| 2,545,327 | Citigroup Mortgage Loan Trust, Inc., Series 2005-3, Class 2A3, 3.005%, 8/25/2035(c) |
2,190,801 | ||||||
| 2,967,154 | Citigroup Mortgage Loan Trust, Inc., Series 2014-11, Class 2A1, 0.990%, 8/25/2036, 144A(b)(c) |
2,679,422 | ||||||
| 2,665,192 | Citigroup Mortgage Loan Trust, Inc., Series 2015-2, Class 1A1, 0.784%, 6/25/2047, 144A(b)(c) |
2,311,849 | ||||||
| 2,007,498 | CitiMortgage Alternative Loan Trust, Series 2006-A4, Class 1A1, 6.000%, 9/25/2036 |
1,788,886 | ||||||
| 2,200,000 | Colony American Finance Ltd., Series 2015-1, Class D, 5.649%, 10/15/2047, 144A(b) |
2,158,561 | ||||||
| 1,065,000 | Colony American Finance Ltd., Series 2016-1, Class C, 4.638%, 6/15/2048, 144A(b)(c) |
1,065,765 | ||||||
| 400,000 | Colony American Homes, Series 2014-2A, Class E, 3.960%, 7/17/2031, 144A(c) |
401,892 | ||||||
| 812,498 | Countrywide Alternative Loan Trust, Series 2003-22CB, Class 1A1, 5.750%, 12/25/2033(b) |
831,425 | ||||||
| 763,569 | Countrywide Alternative Loan Trust, Series 2004-14T2, Class A11, 5.500%, 8/25/2034 |
795,161 | ||||||
| 1,353,174 | Countrywide Alternative Loan Trust, Series 2004-J10, Class 2CB1, 6.000%, 9/25/2034 |
1,392,993 | ||||||
| 767,580 | Countrywide Alternative Loan Trust, Series 2004-J3, Class 1A1, 5.500%, 4/25/2034(b) |
779,513 | ||||||
| 6,304 | Countrywide Alternative Loan Trust, Series 2004-J7, Class 1A5, 5.188%, 8/25/2034(b)(c)(d) |
6,142 | ||||||
See accompanying notes to financial statements.
27 |
Table of Contents
Portfolio of Investments – as of December 31, 2016
Loomis Sayles Strategic Alpha Fund – (continued)
| Principal Amount (‡) |
Description | Value (†) | ||||||
| ABS Home Equity — continued | ||||||||
| $ | 866,469 | Countrywide Alternative Loan Trust, Series 2005-14, Class 2A1, 0.966%, 5/25/2035(c) |
$ | 717,884 | ||||
| 827,406 | Countrywide Home Loan Mortgage Pass Through Trust, Series 2004-12, Class 8A1, 3.223%, 8/25/2034(c) | 710,829 | ||||||
| 122,258 | Countrywide Home Loan Mortgage Pass Through Trust, Series 2004-HYB4, Class 2A1, 3.055%, 9/20/2034(b)(c)(d) | 115,254 | ||||||
| 309,580 | Countrywide Home Loan Mortgage Pass Through Trust, Series 2005-11, Class 4A1, 1.026%, 4/25/2035(c) | 241,971 | ||||||
| 946,427 | Countrywide Home Loan Mortgage Pass Through Trust, Series 2005-21, Class A17, 5.500%, 10/25/2035 | 844,467 | ||||||
| 1,849,178 | Credit Suisse First Boston Mortgage Pass Through Certificates, Series 2004-AR3, Class 3A1, 3.085%, 5/25/2034(b)(c) | 1,734,339 | ||||||
| 276,109 | Credit Suisse First Boston Mortgage Securities Corp., Series 2003-27, Class 4A4, 5.750%, 11/25/2033(b) | 288,430 | ||||||
| 698,278 | Credit Suisse First Boston Mortgage Securities Corp., Series 2003-AR26, Class 7A1, 3.145%, 11/25/2033(b)(c) | 672,831 | ||||||
| 521,220 | Credit Suisse First Boston Mortgage Securities Corp., Series 2003-AR28, Class 4A1, 3.253%, 12/25/2033(b)(c)(d) | 505,766 | ||||||
| 871,568 | Credit Suisse First Boston Mortgage Securities Corp., Series 2005-10, Class 5A4, 5.500%, 11/25/2035 | 803,561 | ||||||
| 745,409 | Deutsche Alternative Mortgage Loan Trust Securities, Inc., Series 2005-5, Class 1A4, 5.500%, 11/25/2035(c) | 708,138 | ||||||
| 1,164,090 | Deutsche Mortgage Securities, Inc., Series 2004-4, Class 7AR1, 1.106%, 6/25/2034(c) |
1,057,975 | ||||||
| 789,256 | DSLA Mortgage Loan Trust, Series 2005-AR5, Class 2A1A, 1.066%, 9/19/2045(c) |
586,446 | ||||||
| 2,100,989 | Dukinfield 2 PLC, Series 2, Class A, 1.615%, 12/20/2052, (GBP)(b)(c) | 2,593,386 | ||||||
| 783,543 | Eurosail PLC, Series 2007-2X, Class A3C, 0.527%, 3/13/2045, (GBP)(b)(c) | 933,195 | ||||||
| 500,000 | Freddie Mac Structured Agency Credit Risk Debt Notes, Series 2013-DN2, Class M2, 5.006%, 11/25/2023(c) | 528,083 | ||||||
| 2,015,000 | Freddie Mac Structured Agency Credit Risk Debt Notes, Series 2014-DN1, Class M2, 2.956%, 2/25/2024(b)(c) | 2,061,397 | ||||||
| 1,580,264 | Freddie Mac Structured Agency Credit Risk Debt Notes, Series 2014-DN2, Class M2, 2.406%, 4/25/2024(b)(c) | 1,593,227 | ||||||
| 2,585,000 | Freddie Mac Structured Agency Credit Risk Debt Notes, Series 2015-DNA1, Class M2, 2.606%, 10/25/2027(b)(c) | 2,622,014 | ||||||
| 511,570 | GMAC Mortgage Corp. Loan Trust, Series 2005-AR4, Class 3A1, 3.578%, 7/19/2035(c) |
460,803 | ||||||
| 1,027,503 | GSR Mortgage Loan Trust, Series 2004-14, Class 5A1, 3.202%, 12/25/2034(b)(c) |
1,018,327 | ||||||
| 469,830 | GSR Mortgage Loan Trust, Series 2005-AR4, Class 4A1, 3.118%, 7/25/2035(c) |
415,960 | ||||||
| 1,385,646 | HarborView Mortgage Loan Trust, Series 2006-10, Class 2A1A, 0.916%, 11/19/2036(c) |
1,139,882 | ||||||
| 1,864,227 | IndyMac Index Mortgage Loan Trust, Series 2004-AR12, Class A1, 1.536%, 12/25/2034(c) |
1,529,436 | ||||||
| 1,930,958 | IndyMac Index Mortgage Loan Trust, Series 2005-16IP, Class A1, 1.396%, 7/25/2045(c) |
1,615,274 | ||||||
See accompanying notes to financial statements.
| 28
Table of Contents
Portfolio of Investments – as of December 31, 2016
Loomis Sayles Strategic Alpha Fund – (continued)
| Principal Amount (‡) |
Description | Value (†) | ||||||
| ABS Home Equity — continued | ||||||||
| $ | 4,074,600 | IndyMac Index Mortgage Loan Trust, Series 2006-AR2, Class 2A1, 0.966%, 2/25/2046(c) |
$ | 3,208,004 | ||||
| 860,000 | Invitation Homes Trust, Series 2015-SFR1, Class E, 4.936%, 3/17/2032, 144A(c) |
862,581 | ||||||
| 2,333,456 | JPMorgan Alternative Loan Trust, Series 2006-A1, Class 3A1, 2.901%, 3/25/2036(c) |
1,910,904 | ||||||
| 663,417 | JPMorgan Mortgage Trust, Series 2003-A2, Class 3A1, 2.770%, 11/25/2033(b)(c) |
629,053 | ||||||
| 2,153,011 | JPMorgan Mortgage Trust, Series 2004-S1, Class 2A1, 6.000%, 9/25/2034 | 2,176,387 | ||||||
| 1,647,076 | JPMorgan Mortgage Trust, Series 2005-A2, Class 3A2, 2.930%, 4/25/2035(b)(c) |
1,635,638 | ||||||
| 577,947 | JPMorgan Mortgage Trust, Series 2005-A3, Class 4A1, 3.077%, 6/25/2035(b)(c) |
580,081 | ||||||
| 2,174,435 | JPMorgan Mortgage Trust, Series 2005-S3, Class 1A9, 6.000%, 1/25/2036 | 1,817,490 | ||||||
| 1,264,471 | JPMorgan Mortgage Trust, Series 2006-A1, Class 1A2, 3.184%, 2/25/2036(c) | 1,116,695 | ||||||
| 2,424,068 | JPMorgan Mortgage Trust, Series 2006-A7, Class 2A4, 3.186%, 1/25/2037(c) |
2,163,641 | ||||||
| 719,402 | Lehman XS Trust, Series 2005-7N, Class 3A1, 1.036%, 12/25/2035(c) | 540,127 | ||||||
| 24 | Lehman XS Trust, Series 2006-12N, Class A2A1, 0.906%, 8/25/2046(c)(d) | 23 | ||||||
| 808,470 | Lehman XS Trust, Series 2006-2N, Class 1A1, 1.016%, 2/25/2046(c) | 596,605 | ||||||
| 577,369 | Ludgate Funding PLC, Series 2007-1, Class A2B, Zero Coupon, 1/01/2061, (EUR)(b)(c) |
568,604 | ||||||
| 2,273,326 | Ludgate Funding PLC, Series 2008-W1X, Class A1, 0.983%, 1/01/2061, (GBP)(b)(c) |
2,663,010 | ||||||
| 360,755 | MASTR Adjustable Rate Mortgages Trust, Series 2004-4, Class 5A1, 3.148%, 5/25/2034(b)(c)(d) |
345,080 | ||||||
| 1,680,359 | MASTR Adjustable Rate Mortgages Trust, Series 2004-7, Class 3A1, 2.854%, 7/25/2034(c) |
1,622,330 | ||||||
| 419,598 | MASTR Adjustable Rate Mortgages Trust, Series 2006-2, Class 1A1, 3.188%, 4/25/2036(c) |
384,948 | ||||||
| 609,292 | MASTR Alternative Loan Trust, Series 2003-9, Class 4A1, 5.250%, 11/25/2033(b) |
629,090 | ||||||
| 658,888 | MASTR Alternative Loan Trust, Series 2004-5, Class 1A1, 5.500%, 6/25/2034(b) |
675,226 | ||||||
| 756,051 | MASTR Alternative Loan Trust, Series 2004-5, Class 2A1, 6.000%, 6/25/2034(b) |
771,179 | ||||||
| 1,964,986 | MASTR Alternative Loan Trust, Series 2004-8, Class 2A1, 6.000%, 9/25/2034 |
2,082,826 | ||||||
| 243,388 | MLCC Mortgage Investors, Inc., Series 2006-2, Class 2A, 2.706%, 5/25/2036(b)(c) |
234,698 | ||||||
| 715,401 | Morgan Stanley Mortgage Loan Trust, Series 2005-7, Class 4A2, 5.500%, 11/25/2035(d) |
681,901 | ||||||
| 1,475,655 | Morgan Stanley Mortgage Loan Trust, Series 2005-7, Class 7A5, 5.500%, 11/25/2035 |
1,517,260 | ||||||
| 1,837,897 | National City Mortgage Capital Trust, Series 2008-1, Class 2A1, 6.000%, 3/25/2038 |
1,907,056 | ||||||
See accompanying notes to financial statements.
29 |
Table of Contents
Portfolio of Investments – as of December 31, 2016
Loomis Sayles Strategic Alpha Fund – (continued)
| Principal Amount (‡) |
Description | Value (†) | ||||||
| ABS Home Equity — continued | ||||||||
| 850,123 | Newgate Funding, Series 2007-3X, Class A2B, 0.284%, 12/15/2050, (EUR)(b)(c) |
$ | 857,136 | |||||
| 784,810 | NYMT Residential LLC, Series 2016-RP1A, Class A, 4.000%, 3/25/2021, 144A(b)(c) |
778,941 | ||||||
| 1,683,290 | RCO Depositor II LLC, Series 2015-2A, Class A, 4.500%, 11/25/2045, 144A(b)(c) |
1,681,397 | ||||||
| 2,700,000 | RCO Depositor II LLC, Series 2015-2A, Class M, 5.000%, 11/25/2045, 144A(c) |
2,575,456 | ||||||
| 1,135,803 | Residential Accredit Loans, Inc. Trust, Series 2006-QO4, Class 2A1, 0.946%, 4/25/2046(c) |
913,497 | ||||||
| 538,950 | Residential Accredit Loans, Inc. Trust, Series 2006-QO7, Class 3A2, 0.961%, 9/25/2046(c) |
398,121 | ||||||
| 869,934 | Residential Accredit Loans, Inc. Trust, Series 2007-QO4, Class A1A, 0.946%, 5/25/2047(c) |
724,190 | ||||||
| 1,747,514 | Residential Asset Securitization Trust, Series 2005-A8CB, Class A9, 5.375%, 7/25/2035 | 1,532,636 | ||||||
| 594,793 | Residential Funding Mortgage Securities, Series 2006-S1, Class 1A3, 5.750%, 1/25/2036(d) |
577,100 | ||||||
| 267,524 | RMAC PLC, Series 2005-NS3X, Class A2C, 0.042%, 6/12/2043, (EUR)(b)(c) | 265,305 | ||||||
| 475,503 | RMAC Securities No. 1 PLC, Series 2006-NS1X, Class A2C, Zero Coupon, 6/12/2044, (EUR)(b)(c) | 469,050 | ||||||
| 365,968 | RMAC Securities No. 1 PLC, Series 2007-NS1X, Class A2A, 0.526%, 6/12/2044, (GBP)(b)(c) |
419,320 | ||||||
| 671,403 | Structured Adjustable Rate Mortgage Loan Trust, Series 2004-12, Class 6A, 3.039%, 9/25/2034(b)(c) | 660,848 | ||||||
| 891,227 | Structured Adjustable Rate Mortgage Loan Trust, Series 2004-6, Class 1A, 3.096%, 6/25/2034(b)(c) | 880,419 | ||||||
| 4,007,361 | Structured Adjustable Rate Mortgage Loan Trust, Series 2005-14, Class A1, 1.066%, 7/25/2035(c) | 2,930,656 | ||||||
| 814,429 | Structured Asset Securities Corp. Mortgage Pass Through Certificates, Series 2004-20, Class 8A7, 5.750%, 11/25/2034(b) | 823,425 | ||||||
| 451,577 | Structured Asset Securities Corp. Trust, Series 2005-1, Class 7A7, 5.500%, 2/25/2035 |
457,934 | ||||||
| 1,200,000 | Towd Point Mortgage Funding PLC, Series 16-GR1X, Class B, 1.802%, 7/20/2046, (GBP)(b)(c) |
1,478,926 | ||||||
| 902,617 | U.S. Residential Opportunity Fund III Trust, Series 2016-1III, Class A, 3.475%, 7/27/2036, 144A(b)(c) |
898,877 | ||||||
| 2,927,312 | Vericrest Opportunity Loan Transferee, Series 16-NPL8, Class A1, 3.500%, 7/25/2046, 144A(b)(c) |
2,917,314 | ||||||
| 407,415 | Vericrest Opportunity Loan Transferee, Series 2015-NPL7, Class A1, 3.250%, 2/25/2055, 144A(b)(c) |
406,345 | ||||||
| 1,565,000 | VOLT XL LLC, Series 2015-NP14, Class A2, 4.875%, 11/27/2045, 144A(c) | 1,491,433 | ||||||
| 2,472,098 | VOLT XXVI LLC, Series 2014-NPL6, Class A1, 3.125%, 9/25/2043, 144A(b)(c) | 2,468,605 | ||||||
| 452,705 | VOLT XXX LLC, Series 2015-NPL1, Class A1, 3.625%, 10/25/2057, 144A(b)(c) | 452,746 | ||||||
See accompanying notes to financial statements.
| 30
Table of Contents
Portfolio of Investments – as of December 31, 2016
Loomis Sayles Strategic Alpha Fund – (continued)
| Principal Amount (‡) |
Description | Value (†) | ||||||
| ABS Home Equity — continued | ||||||||
| $ | 1,401,293 | VOLT XXXI LLC, Series 2015-NPL2, Class A1, 3.375%, 2/25/2055, 144A(b)(c) | $ | 1,404,672 | ||||
| 1,149,527 | VOLT XXXIII LLC, Series 2015-NPL5, Class A1, 3.500%, 3/25/2055, 144A(b)(c) |
1,152,832 | ||||||
| 1,569,097 | VOLT XXXIX LLC, Series 2015-NP13, Class A1, 4.125%, 10/25/2045, 144A(b)(c) |
1,578,544 | ||||||
| 1,320,794 | VOLT XXXV, Series 2016-NPL9, Class A1, 3.500%, 9/25/2046, 144A(b)(c) | 1,317,714 | ||||||
| 440,741 | WaMu Mortgage Pass Through Certificates, Series 2004-CB2, Class 2A, 5.500%, 7/25/2034(b) |
463,044 | ||||||
| 1,160,668 | WaMu Mortgage Pass Through Certificates, Series 2006-AR11, Class 2A, 2.098%, 9/25/2046(c) |
1,107,025 | ||||||
| 2,925,965 | WaMu Mortgage Pass Through Certificates, Series 2006-AR19, Class 2A, 1.848%, 1/25/2047(c) |
2,723,850 | ||||||
| 1,925,629 | WaMu Mortgage Pass Through Certificates, Series 2007-HY5, Class 2A3, 2.400%, 5/25/2037(c) |
1,597,625 | ||||||
| 855,000 | Wedgewood Real Estate Trust, Series 2016-1, Class A2, 5.000%, 7/15/2046, 144A(c) |
852,438 | ||||||
| 385,317 | Wells Fargo Mortgage Backed Securities Trust, Series 2004-O, Class A1, 2.995%, 8/25/2034(b)(c) |
390,570 | ||||||
| 243,764 | Wells Fargo Mortgage Backed Securities Trust, Series 2005-11, Class 2A3, 5.500%, 11/25/2035(d) | 247,995 | ||||||
| 1,070,508 | Wells Fargo Mortgage Backed Securities Trust, Series 2005-16, Class A18, 6.000%, 1/25/2036 | 1,059,043 | ||||||
| 575,067 | Wells Fargo Mortgage Backed Securities Trust, Series 2005-AR10, Class 2A4, 3.010%, 5/01/2035(b)(c) | 591,406 | ||||||
|
|
|
|||||||
| 151,141,817 | ||||||||
|
|
|
|||||||
| ABS Other — 3.8% | ||||||||
| 4,236,607 | AIM Aviation Finance Ltd., Series 2015-1A, Class B1, 5.072%, 2/15/2040, 144A(b)(c) |
4,077,734 | ||||||
| 738,095 | AIM Aviation Finance Ltd., Series 2015-1A, Class C1, 4.750%, 2/15/2040, 144A |
675,357 | ||||||
| 1,240,000 | Blackbird Capital Aircraft Lease Securitization Ltd., Series 2016-1A, Class A, 4.213%, 12/16/2041, 144A(b)(c) | 1,230,700 | ||||||
| 2,805,093 | Cronos Containers Program I Ltd., 3.270%, 11/18/2029, 144A(b) | 2,713,374 | ||||||
| 549,159 | Diamond Resorts Owner Trust, Series 2011-1, Class A, 4.000%, 3/20/2023, 144A(b) |
549,491 | ||||||
| 1,949,544 | GCA2014 Holdings Ltd., Series 2014-1, Class C, 6.000%, 1/05/2030, 144A(d)(e) |
1,239,910 | ||||||
| 761,855 | GCA2014 Holdings Ltd., Series 2014-1, Class D, 7.500%, 1/05/2030, 144A(d)(e) |
219,566 | ||||||
| 3,410,000 | GCA2014 Holdings Ltd., Series 2014-1, Class E, Zero Coupon, 1/05/2030, 144A(d)(e)(f) |
49,445 | ||||||
| 1,317,885 | Global Container Assets Ltd., Series 2015-1A, Class B, 4.500%, 2/05/2030, 144A(e)(g) |
1,266,509 | ||||||
| 3,120,000 | OneMain Financial Issuance Trust, 4.160%, 11/20/2028, 144A(b) | 3,000,087 | ||||||
| 601,471 | OneMain Financial Issuance Trust, Series 2014-1A, Class A, 2.430%, 6/18/2024, 144A(b) |
601,501 | ||||||
See accompanying notes to financial statements.
31 |
Table of Contents
Portfolio of Investments – as of December 31, 2016
Loomis Sayles Strategic Alpha Fund – (continued)
| Principal Amount (‡) |
Description | Value (†) | ||||||
| ABS Other — continued | ||||||||
| $ | 443,349 | OneMain Financial Issuance Trust, Series 2014-2A, Class A, 2.470%, 9/18/2024, 144A(b) |
$ | 443,531 | ||||
| 745,000 | OneMain Financial Issuance Trust, Series 2014-2A, Class B, 3.020%, 9/18/2024, 144A(b) |
744,699 | ||||||
| 6,475,000 | OneMain Financial Issuance Trust, Series 2014-2A, Class D, 5.310%, 9/18/2024, 144A |
6,502,683 | ||||||
| 1,265,000 | OneMain Financial Issuance Trust, Series 2015-1A, Class A, 3.190%, 3/18/2026, 144A(b) |
1,273,978 | ||||||
| 3,100,000 | OneMain Financial Issuance Trust, Series 2016-1A, Class C, 6.000%, 2/20/2029, 144A |
3,180,594 | ||||||
| 2,685,000 | OneMain Financial Issuance Trust, Series 2016-2A, Class B, 5.940%, 3/20/2028, 144A(b) |
2,827,189 | ||||||
| 4,196,452 | Shenton Aircraft Investment I Ltd., Series 2015-1A, Class A, 4.750%, 10/15/2042, 144A(b) |
4,216,181 | ||||||
| 147,284 | Sierra Timeshare Receivables Funding LLC, Series 2012-1A, Class A, 2.840%, 11/20/2028, 144A(b) |
147,354 | ||||||
| 599,051 | Sierra Timeshare Receivables Funding LLC, Series 2013-1A, Class A, 1.590%, 11/20/2029, 144A(b) |
596,105 | ||||||
| 1,189,602 | Sierra Timeshare Receivables Funding LLC, Series 2013-3A, Class A, 2.200%, 10/20/2030, 144A(b) |
1,189,216 | ||||||
| 598,483 | Springleaf Funding Trust, Series 2014-AA, Class A, 2.410%, 12/15/2022, 144A(b) |
598,703 | ||||||
| 2,566,083 | TAL Advantage V LLC, Series 2013-2A, Class A, 3.550%, 11/20/2038, 144A(b) |
2,490,611 | ||||||
| 5,700,000 | Working Capital Solutions Funding LLC, 7.711%, 8/27/2017, 144A(c)(d)(e) | 5,700,000 | ||||||
|
|
|
|||||||
| 45,534,518 | ||||||||
|
|
|
|||||||
| ABS Student Loan — 0.4% | ||||||||
| 310,338 | SoFi Professional Loan Program LLC, Series 2014-B, Class A1, 2.006%, 8/25/2032, 144A(b)(c) |
312,267 | ||||||
| 1,573,087 | SoFi Professional Loan Program LLC, Series 2015-A, Class A1, 1.792%, 3/25/2033, 144A(b)(c) |
1,580,919 | ||||||
| 3,110,000 | SoFi Professional Loan Program LLC, Series 2016-A, Class B, 3.570%, 1/26/2038, 144A(b) |
3,113,592 | ||||||
|
|
|
|||||||
| 5,006,778 | ||||||||
|
|
|
|||||||
| Aerospace & Defense — 0.7% | ||||||||
| 1,135,000 | Embraer Netherlands Finance BV, 5.050%, 6/15/2025(b) | 1,128,190 | ||||||
| 1,195,000 | Embraer Overseas Ltd., 5.696%, 9/16/2023, 144A(b) | 1,248,775 | ||||||
| 6,003,000 | Meccanica Holdings USA, Inc., 6.250%, 1/15/2040, 144A | 6,078,038 | ||||||
|
|
|
|||||||
| 8,455,003 | ||||||||
|
|
|
|||||||
| Airlines — 1.1% | ||||||||
| 8,093,778 | Air Canada Pass Through Trust, Series 2015-2, Class B, 5.000%, 6/15/2025, 144A(b) |
8,116,116 | ||||||
| 5,641,485 | Latam Airlines Pass Through Trust, Series 2015-1, Class B, 4.500%, 8/15/2025 |
5,444,033 | ||||||
|
|
|
|||||||
| 13,560,149 | ||||||||
|
|
|
|||||||
See accompanying notes to financial statements.
| 32
Table of Contents
Portfolio of Investments – as of December 31, 2016
Loomis Sayles Strategic Alpha Fund – (continued)
| Principal Amount (‡) |
Description | Value (†) | ||||||
| Automotive — 2.5% | ||||||||
| $ | 5,875,000 | American Honda Finance Corp., MTN, 1.191%, 11/19/2018(b)(c) | $ | 5,876,586 | ||||
| 3,700,000 | American Honda Finance Corp., Series MTN, 1.447%, 9/20/2017(b)(c) | 3,708,799 | ||||||
| 5,785,000 | BMW U.S. Capital LLC, 1.373%, 9/13/2019, 144A(b)(c) | 5,783,583 | ||||||
| 6,100,000 | Hyundai Capital Services, Inc., 1.793%, 3/18/2017, 144A(b)(c) | 6,101,720 | ||||||
| 5,960,000 | Nissan Motor Acceptance Corp., 1.492%, 3/03/2017, 144A(b)(c) | 5,965,280 | ||||||
| 2,955,000 | Toyota Motor Credit Corp., MTN, 1.322%, 10/18/2019(b)(c) | 2,969,539 | ||||||
|
|
|
|||||||
| 30,405,507 | ||||||||
|
|
|
|||||||
| Banking — 3.4% | ||||||||
| 2,625,000 | Ally Financial, Inc., 4.250%, 4/15/2021 | 2,649,609 | ||||||
| 3,200,000 | Ally Financial, Inc., 5.750%, 11/20/2025 | 3,192,000 | ||||||
| 44,895,000 | Banco Hipotecario S.A., 24.729%, 1/12/2020, 144A, (ARS)(c) | 2,704,314 | ||||||
| 1,334,000 | Bank of America NA, Series BKNT, 1.263%, 6/15/2017(b)(c) | 1,333,272 | ||||||
| 4,603,000 | Citigroup, Inc., 1.630%, 11/24/2017(b)(c) | 4,612,629 | ||||||
| 5,840,000 | Goldman Sachs Group, Inc. (The), MTN, 1.567%, 6/04/2017(b)(c) | 5,849,309 | ||||||
| 5,800,000 | JPMorgan Chase Bank NA, 1.588%, 9/23/2019(b)(c) | 5,804,362 | ||||||
| 12,840,000 | Santander Holdings USA, Inc., 4.500%, 7/17/2025(b) | 12,759,699 | ||||||
| 1,330,000 | Wells Fargo & Co., MTN, 1.234%, 6/02/2017(b)(c) | 1,330,521 | ||||||
|
|
|
|||||||
| 40,235,715 | ||||||||
|
|
|
|||||||
| Building Materials — 0.5% | ||||||||
| 5,500,000 | Cemex SAB de CV, 6.125%, 5/05/2025, 144A | 5,623,750 | ||||||
|
|
|
|||||||
| Cable Satellite — 1.1% | ||||||||
| 1,325,000 | Cablevision S.A., 6.500%, 6/15/2021, 144A | 1,346,531 | ||||||
| 2,865,000 | Cox Communications, Inc., 4.500%, 6/30/2043, 144A(b) | 2,426,048 | ||||||
| 1,575,000 | Cox Communications, Inc., 4.700%, 12/15/2042, 144A(b) | 1,369,535 | ||||||
| 1,740,000 | DISH DBS Corp., 5.875%, 11/15/2024 | 1,790,460 | ||||||
| 1,475,000 | DISH DBS Corp., 7.750%, 7/01/2026 | 1,663,062 | ||||||
| 2,065,000 | Time Warner Cable LLC, 4.500%, 9/15/2042(b) | 1,870,180 | ||||||
| 2,900,000 | Ziggo Secured Finance BV, 5.500%, 1/15/2027, 144A | 2,826,920 | ||||||
|
|
|
|||||||
| 13,292,736 | ||||||||
|
|
|
|||||||
| Collateralized Mortgage Obligations — 0.6% | ||||||||
| 56,697,988 | Government National Mortgage Association, Series 2012-135, Class IO, 0.611%, 1/16/2053(b)(c)(h) |
2,336,025 | ||||||
| 1,316,231 | GSR Mortgage Loan Trust, Series 2005-AR5, Class 4A1, 3.233%, 10/25/2035(c) |
1,235,095 | ||||||
| 541,897 | HarborView Mortgage Loan Trust, Series 2006-7, Class 2A1A, 0.936%, 9/19/2046(c) |
389,241 | ||||||
| 3,062,568 | Merrill Lynch Mortgage Investors Trust, Series 2006-1, Class 1A, 3.014%, 2/25/2036(c) |
2,819,069 | ||||||
|
|
|
|||||||
| 6,779,430 | ||||||||
|
|
|
|||||||
| Construction Machinery — 0.5% | ||||||||
| 5,810,000 | Caterpillar Financial Services Corp., GMTN, 1.620%, 2/23/2018(b)(c) | 5,839,004 | ||||||
|
|
|
|||||||
| Diversified Manufacturing — 0.5% | ||||||||
| 5,915,000 | United Technologies Corp., 1.236%, 11/01/2019(b)(c) | 5,928,427 | ||||||
|
|
|
|||||||
| Electric — 1.6% | ||||||||
| 12,170,000 | Enel SpA, (fixed rate to 9/24/2023, variable rate thereafter), 8.750%, 9/24/2073, 144A(b) |
13,843,375 | ||||||
| 4,800,000 | Pacific Gas & Electric Co., 1.131%, 11/30/2017(b)(c) | 4,801,522 | ||||||
|
|
|
|||||||
| 18,644,897 | ||||||||
|
|
|
|||||||
See accompanying notes to financial statements.
33 |
Table of Contents
Portfolio of Investments – as of December 31, 2016
Loomis Sayles Strategic Alpha Fund – (continued)
| Principal Amount (‡) |
Description | Value (†) | ||||||
| Finance Companies — 0.7% | ||||||||
| $ | 3,225,000 | Ladder Capital Finance Holdings LLLP/Ladder Capital Finance Corp., 5.875%, 8/01/2021, 144A |
$ | 3,063,750 | ||||
| 5,813,000 | Quicken Loans, Inc., 5.750%, 5/01/2025, 144A | 5,653,143 | ||||||
|
|
|
|||||||
| 8,716,893 | ||||||||
|
|
|
|||||||
| Financial Other — 0.6% | ||||||||
| 6,780,000 | Rialto Holdings LLC/Rialto Corp., 7.000%, 12/01/2018, 144A | 6,864,750 | ||||||
|
|
|
|||||||
| Food & Beverage — 1.5% | ||||||||
| 5,940,000 | BRF GmbH, 4.350%, 9/29/2026, 144A(b) | 5,507,568 | ||||||
| 10,800,000 | BRF S.A., 7.750%, 5/22/2018, 144A, (BRL)(b) | 3,102,590 | ||||||
| 3,225,000 | Cosan Luxembourg S.A., 7.000%, 1/20/2027, 144A | 3,233,063 | ||||||
| 2,300,000 | Cosan Luxembourg S.A., 9.500%, 3/14/2018, 144A, (BRL) | 670,454 | ||||||
| 460,000 | JBS Investments GmbH, 7.250%, 4/03/2024, 144A | 480,700 | ||||||
| 2,090,000 | JBS USA LUX S.A./JBS USA Finance, Inc., 5.750%, 6/15/2025, 144A | 2,116,125 | ||||||
| 145,000 | JBS USA LUX S.A./JBS USA Finance, Inc., 7.250%, 6/01/2021, 144A | 150,076 | ||||||
| 2,900,000 | PepsiCo, Inc., 1.268%, 10/04/2019(b)(c) | 2,903,190 | ||||||
|
|
|
|||||||
| 18,163,766 | ||||||||
|
|
|
|||||||
| Government Owned – No Guarantee — 1.9% | ||||||||
| 18,670,000,000 | Financiera de Desarrollo Territorial S.A. Findeter, 7.875%, 8/12/2024, 144A, (COP)(b) |
5,761,169 | ||||||
| 9,960,000 | Petrobras Global Finance BV, 5.375%, 1/27/2021 | 9,740,880 | ||||||
| 905,000 | Petrobras Global Finance BV, 5.625%, 5/20/2043 | 668,976 | ||||||
| 940,000 | Petrobras Global Finance BV, 8.750%, 5/23/2026 | 1,014,025 | ||||||
| 700,000(††) | Petroleos Mexicanos, 7.650%, 11/24/2021, 144A, (MXN)(b) | 3,100,093 | ||||||
| 1,930,000 | YPF S.A., 26.333%, 7/07/2020, 144A(c) | 2,180,900 | ||||||
|
|
|
|||||||
| 22,466,043 | ||||||||
|
|
|
|||||||
| Health Insurance — 0.5% | ||||||||
| 5,665,000 | Aetna, Inc., 1.601%, 12/08/2017(b)(c) | 5,684,533 | ||||||
|
|
|
|||||||
| Home Construction — 0.2% | ||||||||
| 2,920,000 | PulteGroup, Inc., 5.000%, 1/15/2027 | 2,774,000 | ||||||
|
|
|
|||||||
| Independent Energy — 4.9% | ||||||||
| 150,000 | Baytex Energy Corp., 5.125%, 6/01/2021, 144A | 135,375 | ||||||
| 665,000 | Baytex Energy Corp., 5.625%, 6/01/2024, 144A | 586,863 | ||||||
| 905,000 | Bonanza Creek Energy, Inc., 5.750%, 2/01/2023(f) | 660,650 | ||||||
| 240,000 | Bonanza Creek Energy, Inc., 6.750%, 4/15/2021(f) | 178,800 | ||||||
| 74,000 | California Resources Corp., 5.500%, 9/15/2021 | 58,090 | ||||||
| 448,000 | California Resources Corp., 6.000%, 11/15/2024 | 328,720 | ||||||
| 1,095,000 | California Resources Corp., 8.000%, 12/15/2022, 144A | 974,550 | ||||||
| 3,180,000 | Callon Petroleum Co., 6.125%, 10/01/2024, 144A | 3,275,400 | ||||||
| 245,000 | Canadian Natural Resources Ltd., 3.900%, 2/01/2025(b) | 245,724 | ||||||
| 326,000 | Chesapeake Energy Corp., 4.875%, 4/15/2022 | 297,475 | ||||||
| 13,000 | Chesapeake Energy Corp., 6.125%, 2/15/2021 | 12,675 | ||||||
| 16,000 | Chesapeake Energy Corp., 6.625%, 8/15/2020 | 16,160 | ||||||
| 1,190,000 | Chesapeake Energy Corp., 8.000%, 1/15/2025, 144A | 1,213,800 | ||||||
| 800,000 | Concho Resources, Inc., 5.500%, 10/01/2022 | 829,000 | ||||||
| 3,105,000 | Concho Resources, Inc., 5.500%, 4/01/2023 | 3,217,711 | ||||||
See accompanying notes to financial statements.
| 34
Table of Contents
Portfolio of Investments – as of December 31, 2016
Loomis Sayles Strategic Alpha Fund – (continued)
| Principal Amount (‡) |
Description | Value (†) | ||||||
| Independent Energy — continued | ||||||||
| $ | 3,635,000 | Continental Resources, Inc., 3.800%, 6/01/2024 | $ | 3,353,287 | ||||
| 560,000 | Continental Resources, Inc., 4.500%, 4/15/2023 | 548,800 | ||||||
| 11,465,000 | Continental Resources, Inc., 5.000%, 9/15/2022(b) | 11,572,656 | ||||||
| 1,342,000 | Devon Energy Corp., 5.000%, 6/15/2045(b) | 1,318,294 | ||||||
| 1,195,000 | Halcon Resources Corp., 8.625%, 2/01/2020, 144A | 1,242,800 | ||||||
| 4,519,000 | Matador Resources Co., 6.875%, 4/15/2023 | 4,744,950 | ||||||
| 1,265,000 | MEG Energy Corp., 6.375%, 1/30/2023, 144A | 1,125,850 | ||||||
| 180,000 | MEG Energy Corp., 6.500%, 3/15/2021, 144A | 166,500 | ||||||
| 2,055,000 | MEG Energy Corp., 7.000%, 3/31/2024, 144A | 1,859,775 | ||||||
| 2,390,000 | Oasis Petroleum, Inc., 6.875%, 3/15/2022 | 2,449,750 | ||||||
| 7,460,000 | OGX Austria GmbH, 8.375%, 4/01/2022, 144A(d)(e)(i) | — | ||||||
| 4,420,000 | OGX Austria GmbH, 8.500%, 6/01/2018, 144A(d)(e)(i) | — | ||||||
| 2,015,000 | Parsley Energy LLC/Parsley Finance Corp., 6.250%, 6/01/2024, 144A | 2,120,385 | ||||||
| 725,000 | PDC Energy, Inc., 6.125%, 9/15/2024, 144A | 741,313 | ||||||
| 7,565,000 | RSP Permian, Inc., 6.625%, 10/01/2022 | 7,999,987 | ||||||
| 1,055,000 | SM Energy Co., 5.000%, 1/15/2024 | 994,338 | ||||||
| 1,750,000 | SM Energy Co., 6.125%, 11/15/2022 | 1,771,875 | ||||||
| 165,000 | SM Energy Co., 6.500%, 1/01/2023 | 167,681 | ||||||
| 535,000 | SM Energy Co., 6.750%, 9/15/2026 | 551,050 | ||||||
| 400,000 | Whiting Petroleum Corp., 5.000%, 3/15/2019 | 401,564 | ||||||
| 3,255,000 | Whiting Petroleum Corp., 6.500%, 10/01/2018 | 3,238,725 | ||||||
|
|
|
|||||||
| 58,400,573 | ||||||||
|
|
|
|||||||
| Industrial Other — 0.2% | ||||||||
| 2,200,000 | Alfa SAB de CV, 6.875%, 3/25/2044, 144A(b) | 2,139,500 | ||||||
|
|
|
|||||||
| Integrated Energy — 1.1% | ||||||||
| 1,225,000 | BP Capital Markets PLC, 1.327%, 2/13/2018(b)(c) | 1,226,210 | ||||||
| 6,595,000 | Chevron Corp., 1.076%, 11/15/2017(b)(c) | 6,595,923 | ||||||
| 5,795,000 | Shell International Finance BV, 1.303%, 9/12/2019(b)(c) | 5,796,704 | ||||||
|
|
|
|||||||
| 13,618,837 | ||||||||
|
|
|
|||||||
| Life Insurance — 0.5% | ||||||||
| 5,785,000 | Metropolitan Life Global Funding I, 1.299%, 9/14/2018, 144A(b)(c) | 5,790,438 | ||||||
|
|
|
|||||||
| Local Authorities — 0.2% | ||||||||
| 2,900,000 | Provincia de Buenos Aires, 5.750%, 6/15/2019, 144A | 3,023,830 | ||||||
|
|
|
|||||||
| Lodging — 0.1% | ||||||||
| 715,000 | Hilton Grand Vacations Borrower LLC/Hilton Grand Vacations Borrower, Inc., 6.125%, 12/01/2024, 144A | 742,706 | ||||||
|
|
|
|||||||
| Media Entertainment — 0.4% | ||||||||
| 4,150,000 | Clear Channel Worldwide Holdings, Inc., 7.625%, 3/15/2020 | 4,147,385 | ||||||
| 27,290,000 | Grupo Televisa SAB, EMTN, 7.250%, 5/14/2043, (MXN)(b) | 977,545 | ||||||
|
|
|
|||||||
| 5,124,930 | ||||||||
|
|
|
|||||||
| Midstream — 4.5% | ||||||||
| 2,695,000 | AmeriGas Partners LP/AmeriGas Finance Corp., 5.500%, 5/20/2025 | 2,721,950 | ||||||
| 2,340,000 | Crestwood Midstream Partners LP/Crestwood Midstream Finance Corp., 6.125%, 3/01/2022 |
2,398,500 | ||||||
See accompanying notes to financial statements.
35 |
Table of Contents
Portfolio of Investments – as of December 31, 2016
Loomis Sayles Strategic Alpha Fund – (continued)
| Principal Amount (‡) |
Description | Value (†) | ||||||
| Midstream — continued | ||||||||
| $ | 410,000 | Energy Transfer Partners LP, 5.150%, 3/15/2045(b) | $ | 393,223 | ||||
| 5,595,000 | Energy Transfer Partners LP, 6.125%, 12/15/2045(b) | 5,952,739 | ||||||
| 1,290,000 | EnLink Midstream Partners LP, 5.050%, 4/01/2045(b) | 1,169,452 | ||||||
| 765,000 | EnLink Midstream Partners LP, 5.600%, 4/01/2044(b) | 736,778 | ||||||
| 1,195,000 | Kinder Morgan Energy Partners LP, 4.700%, 11/01/2042(b) | 1,113,372 | ||||||
| 2,155,000 | Kinder Morgan Energy Partners LP, 5.000%, 8/15/2042(b) | 2,059,574 | ||||||
| 255,000 | Kinder Morgan Energy Partners LP, 5.000%, 3/01/2043(b) | 245,888 | ||||||
| 1,750,000 | Kinder Morgan Energy Partners LP, 5.625%, 9/01/2041(b) | 1,757,667 | ||||||
| 450,000 | MPLX LP, 4.000%, 2/15/2025(b) | 437,402 | ||||||
| 765,000 | MPLX LP, 4.500%, 7/15/2023(b) | 776,946 | ||||||
| 5,395,000 | MPLX LP, 4.875%, 12/01/2024(b) | 5,555,199 | ||||||
| 475,000 | MPLX LP, 4.875%, 6/01/2025(b) | 488,370 | ||||||
| 2,690,000 | NGL Energy Partners LP/NGL Energy Finance Corp., 5.125%, 7/15/2019 | 2,666,462 | ||||||
| 415,000 | NGL Energy Partners LP/NGL Energy Finance Corp., 6.875%, 10/15/2021 | 424,338 | ||||||
| 3,050,000 | NGL Energy Partners LP/NGL Energy Finance Corp., 7.500%, 11/01/2023, 144A |
3,149,125 | ||||||
| 5,055,000 | Sabine Pass Liquefaction LLC, 5.625%, 3/01/2025(b) | 5,408,850 | ||||||
| 180,000 | Targa Resources Partners LP/Targa Resources Partners Finance Corp., 4.250%, 11/15/2023 |
172,125 | ||||||
| 690,000 | Targa Resources Partners LP/Targa Resources Partners Finance Corp., 5.250%, 5/01/2023 |
696,900 | ||||||
| 1,120,000 | Targa Resources Partners LP/Targa Resources Partners Finance Corp., 6.375%, 8/01/2022 |
1,159,200 | ||||||
| 6,015,000 | Targa Resources Partners LP/Targa Resources Partners Finance Corp., 6.750%, 3/15/2024 |
6,451,087 | ||||||
| 1,310,000 | Western Refining Logistics LP/WNRL Finance Corp., 7.500%, 2/15/2023 | 1,414,800 | ||||||
| 3,995,000 | Williams Partners LP, 4.000%, 9/15/2025(b) | 3,950,172 | ||||||
| 965,000 | Williams Partners LP, 5.100%, 9/15/2045(b) | 917,183 | ||||||
| 1,825,000 | Williams Partners LP, 6.300%, 4/15/2040(b) | 1,947,989 | ||||||
|
|
|
|||||||
| 54,165,291 | ||||||||
|
|
|
|||||||
| Non-Agency Commercial Mortgage-Backed Securities — 4.8% | ||||||||
| 1,600,000 | BLCP Hotel Trust, Series 2014-CLRN, Class D, 3.204%, 8/15/2029, 144A(b)(c) |
1,580,900 | ||||||
| 1,600,000 | BLCP Hotel Trust, Series 2014-CLRN, Class E, 4.374%, 8/15/2029, 144A(c) | 1,587,946 | ||||||
| 3,442,048 | BXHTL Mortgage Trust, Series 2015-DRMZ, Class M, 8.849%, 5/15/2020, 144A(c)(e)(g) |
3,349,021 | ||||||
| 4,565,000 | CFCRE Commercial Mortgage Trust, Series 2011-C1, Class D, 6.180%, 4/15/2044, 144A(b)(c) |
4,658,535 | ||||||
| 1,900,000 | Commercial Mortgage Trust, Series 2016-SAVA, Class C, 3.704%, 10/15/2034, 144A(b)(c) |
1,904,485 | ||||||
| 3,700,000 | Credit Suisse Mortgage Capital Certificates, Series 2015-TOWN, Class A, 1.954%, 3/15/2017, 144A(b)(c) |
3,702,255 | ||||||
| 2,552,340 | DBUBS Mortgage Trust, Series 2011-LC1A, Class E, 5.685%, 11/10/2046, 144A(b)(c) |
2,669,814 | ||||||
| 6,505,000 | GS Mortgage Securities Trust, Series 2007-GG10, Class AM, 5.793%, 8/10/2045(c) |
6,425,764 | ||||||
| 4,429 | Hilton USA Trust, Series 2013-HLT, Class DFX, 4.407%, 11/05/2030, 144A | 4,411 | ||||||
See accompanying notes to financial statements.
| 36
Table of Contents
Portfolio of Investments – as of December 31, 2016
Loomis Sayles Strategic Alpha Fund – (continued)
| Principal Amount (‡) |
Description | Value (†) | ||||||
| Non-Agency Commercial Mortgage-Backed Securities — continued | ||||||||
| $ | 1,580,000 | Hilton USA Trust, Series 2013-HLT, Class EFX, 4.453%, 11/05/2030, 144A(b)(c) |
$ | 1,582,358 | ||||
| 1,520,000 | JPMorgan Chase Commercial Mortgage Securities Trust, Series 2007-LDPX, Class AM, 5.464%, 1/15/2049(b)(c) | 1,506,868 | ||||||
| 3,090,000 | JPMorgan Chase Commercial Mortgage Securities Trust, Series 2015-SGP, Class D, 5.204%, 7/15/2036, 144A(b)(c) | 3,109,298 | ||||||
| 1,225,881 | Morgan Stanley Capital I Trust, Series 2007-HQ12, Class AM, 5.775%, 4/12/2049(b)(c) |
1,225,664 | ||||||
| 1,570,000 | Morgan Stanley Capital I Trust, Series 2011-C2, Class D, 5.473%, 6/15/2044, 144A(b)(c) |
1,617,485 | ||||||
| 2,125,000 | Morgan Stanley Capital I Trust, Series 2011-C2, Class E, 5.473%, 6/15/2044, 144A(b)(c) |
2,173,355 | ||||||
| 9,814,029 | Motel 6 Trust, Series 2015-M6MZ, Class M, 8.230%, 2/05/2020, 144A(e)(g) | 9,906,035 | ||||||
| 2,280,000 | SCG Trust, Series 2013-SRP1, Class B, 3.204%, 11/15/2026, 144A(b)(c) | 2,178,052 | ||||||
| 2,200,000 | SCG Trust, Series 2013-SRP1, Class C, 3.954%, 11/15/2026, 144A(b)(c) | 2,140,529 | ||||||
| 3,165,000 | SCG Trust, Series 2013-SRP1, Class D, 4.048%, 11/15/2026, 144A(b)(c) | 3,034,671 | ||||||
| 2,587,500 | WFRBS Commercial Mortgage Trust, Series 2011-C2, Class D, 5.602%, 2/15/2044, 144A(b)(c) |
2,648,840 | ||||||
|
|
|
|||||||
| 57,006,286 | ||||||||
|
|
|
|||||||
| Oil Field Services — 0.6% | ||||||||
| 3,490,000 | Noble Holding International Ltd., 5.250%, 3/15/2042 | 2,303,400 | ||||||
| 3,015,000 | Noble Holding International Ltd., 7.750%, 1/15/2024 | 2,835,909 | ||||||
| 2,040,000 | Transocean Proteus Ltd., 6.250%, 12/01/2024, 144A | 2,059,135 | ||||||
|
|
|
|||||||
| 7,198,444 | ||||||||
|
|
|
|||||||
| Pharmaceuticals — 1.0% | ||||||||
| 5,570,000 | Merck & Co., Inc., 1.007%, 2/10/2017(b)(c) | 5,571,242 | ||||||
| 3,175,000 | Valeant Pharmaceuticals International, Inc., 5.500%, 3/01/2023, 144A | 2,381,250 | ||||||
| 5,356,000 | Valeant Pharmaceuticals International, Inc., 5.875%, 5/15/2023, 144A | 4,043,780 | ||||||
|
|
|
|||||||
| 11,996,272 | ||||||||
|
|
|
|||||||
| Refining — 0.2% | ||||||||
| 2,090,000 | Ultrapar International S.A., 5.250%, 10/06/2026, 144A | 2,047,991 | ||||||
|
|
|
|||||||
| REITs – Mortgage — 0.1% | ||||||||
| 775,000 | Starwood Property Trust, Inc., 5.000%, 12/15/2021, 144A | 785,385 | ||||||
|
|
|
|||||||
| Retailers — 0.1% | ||||||||
| 1,080,000 | PVH Corp., 7.750%, 11/15/2023(b) | 1,255,500 | ||||||
|
|
|
|||||||
| Technology — 3.0% | ||||||||
| 4,770,000 | Alcatel-Lucent USA, Inc., 6.450%, 3/15/2029 | 4,972,725 | ||||||
| 1,542,000 | Alcatel-Lucent USA, Inc., 6.500%, 1/15/2028 | 1,592,115 | ||||||
| 6,955,000 | Cisco Systems, Inc., 1.337%, 9/20/2019(b)(c) | 6,972,165 | ||||||
| 11,255,000 | Diamond 1 Finance Corp./Diamond 2 Finance Corp., 6.020%, 6/15/2026, 144A(b) |
12,192,496 | ||||||
| 3,310,000 | Donnelley Financial Solutions, Inc., 8.250%, 10/15/2024, 144A | 3,367,925 | ||||||
| 6,695,000 | Open Text Corp., 5.875%, 6/01/2026, 144A | 7,063,225 | ||||||
|
|
|
|||||||
| 36,160,651 | ||||||||
|
|
|
|||||||
See accompanying notes to financial statements.
37 |
Table of Contents
Portfolio of Investments – as of December 31, 2016
Loomis Sayles Strategic Alpha Fund – (continued)
| Principal Amount (‡) |
Description | Value (†) | ||||||
| Treasuries — 2.3% | ||||||||
| 42,200(†††) | Brazil Letras do Tesouro Nacional, Zero Coupon, 7/01/2017, (BRL) | $ | 12,240,904 | |||||
| 1,115,000(††) | Mexican Fixed Rate Bonds, Series M, 5.750%, 3/05/2026, (MXN)(b) | 4,772,517 | ||||||
| 43,850,000 | Poland Government International Bond, 4.750%, 4/25/2017, (PLN)(b) | 10,579,370 | ||||||
|
|
|
|||||||
| 27,592,791 | ||||||||
|
|
|
|||||||
| Wirelines — 0.7% | ||||||||
| 1,880,000 | Communications Sales & Leasing, Inc./CSL Capital LLC, 7.125%, 12/15/2024, 144A |
1,898,800 | ||||||
| 10,085,000 | Oi S.A., 9.750%, 9/15/2016, 144A, (BRL)(i) | 654,578 | ||||||
| 5,685,000 | Verizon Communications, Inc., 2.709%, 9/14/2018(b)(c) | 5,811,901 | ||||||
|
|
|
|||||||
| 8,365,279 | ||||||||
|
|
|
|||||||
| Total Non-Convertible Bonds (Identified Cost $888,183,803) |
870,169,634 | |||||||
|
|
|
|||||||
| Convertible Bonds — 1.2% | ||||||||
| Building Materials — 0.0% | ||||||||
| 335,000 | CalAtlantic Group, Inc., 0.250%, 6/01/2019 | 311,969 | ||||||
|
|
|
|||||||
| Diversified Operations — 0.1% | ||||||||
| 775,000 | RWT Holdings, Inc., 5.625%, 11/15/2019 | 780,812 | ||||||
|
|
|
|||||||
| Healthcare — 0.2% | ||||||||
| 1,180,000 | Brookdale Senior Living, Inc., 2.750%, 6/15/2018 | 1,148,287 | ||||||
| 615,000 | Evolent Health, Inc., 2.000%, 12/01/2021, 144A | 590,016 | ||||||
|
|
|
|||||||
| 1,738,303 | ||||||||
|
|
|
|||||||
| Media Entertainment — 0.1% | ||||||||
| 885,000 | Liberty Media Corp., 2.250%, 9/30/2046, 144A | 932,569 | ||||||
|
|
|
|||||||
| Pharmaceuticals — 0.6% | ||||||||
| 1,250,000 | Horizon Pharma Investment Ltd., 2.500%, 3/15/2022 | 1,189,063 | ||||||
| 4,110,000 | Impax Laboratories, Inc., 2.000%, 6/15/2022 | 3,244,331 | ||||||
| 2,770,000 | Ionis Pharmaceuticals, Inc., 1.000%, 11/15/2021 | 2,792,506 | ||||||
|
|
|
|||||||
| 7,225,900 | ||||||||
|
|
|
|||||||
| Technology — 0.2% | ||||||||
| 420,000 | CalAmp Corp., 1.625%, 5/15/2020 | 404,775 | ||||||
| 740,000 | Cypress Semiconductor Corp., 4.500%, 1/15/2022, 144A | 832,038 | ||||||
| 1,578,000 | Viavi Solutions, Inc., 0.625%, 8/15/2033 | 1,631,257 | ||||||
|
|
|
|||||||
| 2,868,070 | ||||||||
|
|
|
|||||||
| Total Convertible Bonds (Identified Cost $13,411,536) |
13,857,623 | |||||||
|
|
|
|||||||
| Total Bonds and Notes (Identified Cost $901,595,339) |
884,027,257 | |||||||
|
|
|
|||||||
| Senior Loans — 7.5% | ||||||||
| Aerospace & Defense — 0.3% | ||||||||
| 1,184,548 | Engility Corp., Term Loan B2, 5.807%, 8/12/2023(j) | 1,201,428 | ||||||
| 335,444 | TransDigm, Inc., 2015 Term Loan E, 3.845%, 5/14/2022(j) | 338,111 | ||||||
See accompanying notes to financial statements.
| 38
Table of Contents
Portfolio of Investments – as of December 31, 2016
Loomis Sayles Strategic Alpha Fund – (continued)
| Principal Amount (‡) |
Description | Value (†) | ||||||
| Aerospace & Defense — continued | ||||||||
| $ | 2,398,221 | TransDigm, Inc., 2016 Extended Term Loan F, 3.770%, 6/09/2023(c) | $ | 2,421,004 | ||||
|
|
|
|||||||
| 3,960,543 | ||||||||
|
|
|
|||||||
| Automotive — 0.1% | ||||||||
| 1,587,537 | Gates Global, Inc., Term Loan B, 4.250%, 7/06/2021(c) | 1,587,537 | ||||||
|
|
|
|||||||
| Building Materials — 0.6% | ||||||||
| 1,596,000 | HD Supply, Inc., Incremental Term Loan B2, 3.748%, 10/17/2023(c) | 1,606,645 | ||||||
| 2,112,508 | Headwaters, Inc., 2016 Term Loan B, 4.000%, 3/24/2022(c) | 2,122,416 | ||||||
| 865,996 | Ply Gem Industries, Inc., Term Loan, 4.000%, 2/01/2021(c) | 872,855 | ||||||
| 335,000 | Quikrete Holdings, Inc., 2016 1st Lien Term Loan, 11/15/2023(k) | 338,072 | ||||||
| 2,035,000 | Quikrete Holdings, Inc., 2016 1st Lien Term Loan, 4.000%, 11/15/2023(c) | 2,053,661 | ||||||
|
|
|
|||||||
| 6,993,649 | ||||||||
|
|
|
|||||||
| Cable Satellite — 0.4% | ||||||||
| 282,710 | Altice U.S. Finance I Corp., 2016 Term Loan B, 3.882%, 1/15/2025(c) | 285,537 | ||||||
| 205,000 | CSC Holdings LLC, 2016 Term Loan, 3.876%, 10/11/2024(c) | 207,007 | ||||||
| 2,575,000 | Virgin Media Investment Holdings Ltd., USD Term Loan I, 3.486%, 1/31/2025(c) |
2,584,991 | ||||||
| 1,684,803 | Ziggo Financing Partnership, USD Term Loan B1, 3.500%, 1/15/2022(c) | 1,691,829 | ||||||
| 309,719 | Ziggo Financing Partnership, USD Term Loan B2A, 3.500%, 1/15/2022(c) | 311,011 | ||||||
| 96,238 | Ziggo Financing Partnership, USD Term Loan B3, 3.701%, 1/15/2022(c) | 96,639 | ||||||
|
|
|
|||||||
| 5,177,014 | ||||||||
|
|
|
|||||||
| Consumer Cyclical Services — 0.4% | ||||||||
| 1,175,000 | Conduent, Inc., USD Term Loan B, 12/07/2023(k) | 1,188,219 | ||||||
| 3,885,000 | Conduent, Inc., USD Term Loan B, 6.250%, 12/07/2023(c) | 3,928,706 | ||||||
|
|
|
|||||||
| 5,116,925 | ||||||||
|
|
|
|||||||
| Consumer Products — 0.3% | ||||||||
| 3,119,292 | Serta Simmons Bedding LLC, 1st Lien Term Loan, 4.500%, 11/08/2023(c) | 3,151,452 | ||||||
|
|
|
|||||||
| Environmental — 0.1% | ||||||||
| 753,113 | GFL Environmental, Inc., USD Term Loan B, 3.750%, 9/29/2023(c) | 754,679 | ||||||
|
|
|
|||||||
| Gaming — 0.1% | ||||||||
| 741,258 | Boyd Gaming Corp., Term Loan B2, 3.756%, 9/15/2023(c) | 749,331 | ||||||
|
|
|
|||||||
| Healthcare — 0.1% | ||||||||
| 905,000 | Envision Healthcare Corp., 2016 Term Loan B, 4.000%, 12/01/2023(c) | 913,489 | ||||||
|
|
|
|||||||
| Independent Energy — 0.5% | ||||||||
| 3,385,000 | California Resources Corp., Second Out Term Loan, 11.375%, 12/31/2021(c) |
3,751,697 | ||||||
| 2,649,896 | Chesapeake Energy Corp., Term Loan, 8.500%, 8/23/2021(c) | 2,880,649 | ||||||
|
|
|
|||||||
| 6,632,346 | ||||||||
|
|
|
|||||||
| Industrial Other — 0.4% | ||||||||
| 1,891,188 | Pinnacle Operating Corp., Term Loan, 4.750%, 11/15/2018(c) | 1,555,502 | ||||||
| 2,940,300 | USAGM HoldCo LLC, 2015 Term Loan, 4.750%, 7/28/2022(c) | 2,950,415 | ||||||
|
|
|
|||||||
| 4,505,917 | ||||||||
|
|
|
|||||||
| Leisure — 0.0% | ||||||||
| 310,000 | AMC Entertainment, Inc., New Term Loan B, 3.511%, 12/15/2023(c) | 312,867 | ||||||
|
|
|
|||||||
See accompanying notes to financial statements.
39 |
Table of Contents
Portfolio of Investments – as of December 31, 2016
Loomis Sayles Strategic Alpha Fund – (continued)
| Principal Amount (‡) |
Description | Value (†) | ||||||
| Media Entertainment — 0.3% | ||||||||
| $ | 1,511,213 | Camelot UK Holdco Ltd., Term Loan B, 4.750%, 10/03/2023(c) | $ | 1,527,896 | ||||
| 1,050,566 | CBS Radio, Inc., Term Loan B, 4.500%, 10/17/2023(c) | 1,059,758 | ||||||
| 1,092,857 | Donnelley Financial Solutions, Inc., Term Loan B, 5.000%, 9/30/2023(c) | 1,102,879 | ||||||
|
|
|
|||||||
| 3,690,533 | ||||||||
|
|
|
|||||||
| Midstream — 0.2% | ||||||||
| 1,002,817 | Energy Transfer Equity LP, 2015 Term Loan, 4.137%, 12/02/2019(c) | 1,007,209 | ||||||
| 1,598,385 | Energy Transfer Equity LP, New Term Loan, 3.387%, 12/02/2019(c) | 1,598,385 | ||||||
|
|
|
|||||||
| 2,605,594 | ||||||||
|
|
|
|||||||
| Natural Gas — 0.1% | ||||||||
| 955,402 | Southcross Energy Partners LP, 1st Lien Term Loan, 5.250%, 8/04/2021(c) | 749,991 | ||||||
|
|
|
|||||||
| Other Utility — 0.3% | ||||||||
| 3,129,569 | PowerTeam Services LLC, 1st Lien Term Loan, 4.250%, 5/06/2020(c) | 3,125,657 | ||||||
|
|
|
|||||||
| Packaging — 0.3% | ||||||||
| 3,075,000 | Flex Acquisition Company, Inc., Unsecured Bridge Loan, 8.000%, 12/06/2017(c) |
3,067,312 | ||||||
| 282,625 | Signode Industrial Group U.S., Inc., USD Term Loan B, 4.000%, 5/01/2021(c) |
284,745 | ||||||
|
|
|
|||||||
| 3,352,057 | ||||||||
|
|
|
|||||||
| Pharmaceuticals — 0.5% | ||||||||
| 5,430,000 | inVentiv Health, Inc., 2016 Term Loan B, 4.750%, 11/09/2023(c) | 5,474,580 | ||||||
|
|
|
|||||||
| Property & Casualty Insurance — 0.1% | ||||||||
| 1,467,650 | Hyperion Insurance Group Ltd., 2015 Term Loan B, 5.500%, 4/29/2022(c) | 1,469,485 | ||||||
|
|
|
|||||||
| Retailers — 0.8% | ||||||||
| 2,400,000 | Bass Pro Group LLC, Term Loan B, 5.970%, 12/16/2023(c) | 2,376,000 | ||||||
| 1,353,634 | Harbor Freight Tools USA, Inc., 2016 Term Loan B, 3.887%, 8/19/2023(c) | 1,371,678 | ||||||
| 1,173,660 | Men’s Wearhouse, Inc. (The), Term Loan B, 4.500%, 6/18/2021(c) | 1,172,193 | ||||||
| 2,827,822 | PetSmart, Inc., Term Loan B2, 4.000%, 3/11/2022(c) | 2,834,892 | ||||||
| 1,867,273 | Talbots, Inc. (The), 1st Lien Term Loan, 5.500%, 3/19/2020(c) | 1,812,189 | ||||||
|
|
|
|||||||
| 9,566,952 | ||||||||
|
|
|
|||||||
| Supermarkets — 0.3% | ||||||||
| 3,560,000 | Albertsons LLC, USD 2016 Term Loan B4, 8/22/2021(k) | 3,599,302 | ||||||
|
|
|
|||||||
| Technology — 0.4% | ||||||||
| 857,850 | Cavium, Inc., Term Loan B, 3.750%, 8/16/2022(c) | 865,356 | ||||||
| 284,288 | NXP BV, Term Loan F, 3.270%, 12/07/2020(c) | 285,567 | ||||||
| 990,000 | Rackspace Hosting, Inc., 1st Lien Term Loan, 11/03/2023(k) | 1,001,959 | ||||||
| 2,130,531 | Western Digital Corp., USD 2016 Term Loan B1, 4.520%, 4/29/2023(c) | 2,163,149 | ||||||
|
|
|
|||||||
| 4,316,031 | ||||||||
|
|
|
|||||||
| Transportation Services — 0.2% | ||||||||
| 2,992,500 | Uber Technologies, Term Loan B, 5.000%, 7/13/2023(c) | 2,996,241 | ||||||
|
|
|
|||||||
| Wireless — 0.3% | ||||||||
| 632,000 | GTT Communications, Inc., USD 2016 Term Loan B, 9/12/2023(k) | 640,690 | ||||||
| 2,965,000 | Lonestar Intermediate Super Holdings LLC, PIK Term Loan B, 10.000%, 8/31/2021(c) |
3,046,537 | ||||||
|
|
|
|||||||
| 3,687,227 | ||||||||
|
|
|
|||||||
See accompanying notes to financial statements.
| 40
Table of Contents
Portfolio of Investments – as of December 31, 2016
Loomis Sayles Strategic Alpha Fund – (continued)
| Principal Amount (‡) |
Description | Value (†) | ||||||
| Wirelines — 0.4% | ||||||||
| $ | 1,160,000 | Consolidated Communications, Inc., Term Loan B2, 10/05/2023(k) | $ | 1,165,800 | ||||
| 3,478,050 | Integra Telecom, Inc., 2015 1st Lien Term Loan, 5.250%, 8/14/2020(c) | 3,484,137 | ||||||
|
|
|
|||||||
| 4,649,937 | ||||||||
|
|
|
|||||||
| Total Senior Loans (Identified Cost $88,183,118) |
89,139,336 | |||||||
|
|
|
|||||||
| Loan Participations — 0.2% | ||||||||
| ABS Other — 0.2% | ||||||||
| 2,302,766 | Rise Ltd., Series 2014-1, Class A, 4.750%, 2/15/2039(c)(e)(g) (Identified Cost $2,320,036) |
2,256,710 | ||||||
|
|
|
|||||||
| Shares | ||||||||
| Preferred Stocks — 0.9% | ||||||||
| Convertible Preferred Stocks — 0.6% | ||||||||
| Food & Beverage — 0.2% | ||||||||
| 25,620 | Bunge Ltd., 4.875% | 2,616,058 | ||||||
|
|
|
|||||||
| Pharmaceuticals — 0.2% | ||||||||
| 521 | Allergan PLC, Series A, 5.500% | 397,242 | ||||||
| 2,057 | Teva Pharmaceutical Industries Ltd., 7.000% | 1,331,496 | ||||||
|
|
|
|||||||
| 1,728,738 | ||||||||
|
|
|
|||||||
| Technology — 0.2% | ||||||||
| 24,910 | Belden, Inc., 6.750% | 2,632,240 | ||||||
|
|
|
|||||||
| Total Convertible Preferred Stocks (Identified Cost $7,080,603) |
6,977,036 | |||||||
|
|
|
|||||||
| Non-Convertible Preferred Stock — 0.3% | ||||||||
| Cable Satellite — 0.3% | ||||||||
| 4,040,000 | NBCUniversal Enterprise, Inc., 5.250%, 144A(b) (Identified Cost $4,040,000) |
4,242,000 | ||||||
|
|
|
|||||||
| Total Preferred Stocks (Identified Cost $11,120,603) |
11,219,036 | |||||||
|
|
|
|||||||
| Common Stocks — 1.7% | ||||||||
| Energy Equipment & Services — 0.1% | ||||||||
| 35,206 | Halliburton Co. | 1,904,292 | ||||||
|
|
|
|||||||
| Oil, Gas & Consumable Fuels — 1.4% | ||||||||
| 188,463 | OGX Petroleo e Gas S.A., Sponsored ADR | 116,847 | ||||||
| 50,446 | Pacific Exploration and Production Corp.(f) | 2,206,602 | ||||||
| 1,172,928 | Whiting Petroleum Corp.(f) | 14,098,589 | ||||||
|
|
|
|||||||
| 16,422,038 | ||||||||
|
|
|
|||||||
| Pharmaceuticals — 0.2% | ||||||||
| 38,880 | Bristol-Myers Squibb Co. | 2,272,147 | ||||||
|
|
|
|||||||
| Total Common Stocks (Identified Cost $22,973,310) |
20,598,477 | |||||||
|
|
|
|||||||
See accompanying notes to financial statements.
41 |
Table of Contents
Portfolio of Investments – as of December 31, 2016
Loomis Sayles Strategic Alpha Fund – (continued)
| Shares | Description | Value (†) | ||||||
| Other Investments — 0.7% | ||||||||
| Aircraft ABS — 0.7% | ||||||||
| 900 | ECAF I Blocker Ltd.(d)(e) (Identified Cost $9,000,000) | $ | 8,840,043 | |||||
|
|
|
|||||||
| Units of Currency(††††) |
||||||||
| Purchased Options — 0.1% | ||||||||
| Over-the-Counter Options on Currency — 0.1% | ||||||||
| 41,652,000 | TRY Call, expiring January 20, 2017 at 3.4000(f)(l) | 2,499 | ||||||
| 39,990,000 | TWD Put, expiring January 17, 2017 at 31.7800(f)(m) | 870,942 | ||||||
|
|
|
|||||||
| 873,441 | ||||||||
|
|
|
|||||||
| Total Purchased Options (Identified Cost $1,622,400) |
873,441 | |||||||
|
|
|
|||||||
| Principal Amount (‡) |
||||||||
| Short-Term Investments — 13.3% | ||||||||
| $ | 22,195,000(††) | Mexican Federal Treasury Certificates, 4.480%, 1/05/2017, (MXN)(b)(n) | 10,702,603 | |||||
| 189,022 | Repurchase Agreement with State Street Bank and Trust Company, dated 12/30/2016 at 0.000% to be repurchased at $189,022 on 1/03/2017 collateralized by $190,700 U.S. Treasury Note, 1.500% due 8/31/2018 valued at $192,848 including accrued interest (Note 2 of Notes to Financial Statements) | 189,022 | ||||||
| 53,915,596 | Tri-Party Repurchase Agreement with Fixed Income Clearing Corporation, dated 12/30/2016 at 0.030% to be repurchased at $53,915,776 on 1/03/2017 collateralized by $2,810,000 U.S. Treasury Note, 3.625% due 2/15/2020 valued at $ 3,027,025; $53,445,000 U.S. Treasury Note, 2.000% due 8/15/2025 valued at $51,972,002 including accrued interest (Note 2 of Notes to Financial Statements) | 53,915,596 | ||||||
| 35,700,000 | U.S. Treasury Bills, 0.318%, 1/05/2017(b)(n) | 35,699,286 | ||||||
| 5,400,000 | U.S. Treasury Bills, 0.381%, 1/12/2017(b)(n)(o) | 5,399,460 | ||||||
| 35,700,000 | U.S. Treasury Bills, 0.466%, 4/06/2017(b)(n) | 35,651,412 | ||||||
| 17,610,000 | U.S. Treasury Bills, 0.583%, 5/25/2017(b)(n) | 17,567,807 | ||||||
|
|
|
|||||||
| Total Short-Term Investments (Identified Cost $160,047,307) |
159,125,186 | |||||||
|
|
|
|||||||
| Total Investments — 98.3% (Identified Cost $1,196,862,113)(a) |
1,176,079,486 | |||||||
| Other assets less liabilities — 1.7% | 20,867,537 | |||||||
|
|
|
|||||||
| Net Assets — 100.0% | $ | 1,196,947,023 | ||||||
|
|
|
|||||||
| (‡) | Principal Amount stated in U.S. dollars unless otherwise noted. | |||||||
| (†) | See Note 2 of Notes to Financial Statements. | |||||||
| (††) | Amount shown represents units. One unit represents a principal amount of 100. | |||||||
| (†††) | Amount shown represents units. One unit represents a principal amount of 1,000. | |||||||
| (††††) | Options on currency are expressed as units of currency. | |||||||
See accompanying notes to financial statements.
| 42
Table of Contents
Portfolio of Investments – as of December 31, 2016
Loomis Sayles Strategic Alpha Fund – (continued)
| (a) | Federal Tax Information: | |||||||
| At December 31, 2016, the net unrealized depreciation on investments based on a cost of $1,197,195,311 for federal income tax purposes was as follows: | ||||||||
| Aggregate gross unrealized appreciation for all investments in which there is an excess of value over tax cost | $ | 26,072,731 | ||||||
| Aggregate gross unrealized depreciation for all investments in which there is an excess of tax cost over value | (47,188,556 | ) | ||||||
|
|
|
|||||||
| Net unrealized depreciation | $ | (21,115,825) | ||||||
|
|
|
|||||||
| (b) | Security (or a portion thereof) has been designated to cover the Fund’s obligations under open derivative contracts. | |||||||
| (c) | Variable rate security. Rate as of December 31, 2016 is disclosed. | |||||||
| (d) | Fair valued by the Fund’s adviser. At December 31, 2016, the value of these securities amounted to $18,528,225 or 1.5% of net assets. See Note 2 of Notes to Financial Statements. | |||||||
| (e) | Illiquid security. (Unaudited) | |||||||
| (f) | Non-income producing security. | |||||||
| (g) | Securities classified as fair valued pursuant to the Fund’s pricing policies and procedures. At December 31, 2016, the value of these securities amounted to $16,778,275 or 1.4% of net assets. See Note 2 of Notes to Financial Statements. | |||||||
| (h) | Security represents right to receive monthly interest payments on an underlying pool of mortgages. Principal shown is the outstanding par amount of the pool held as of the end of the period. | |||||||
| (i) | The issuer is in default with respect to interest and/or principal payments. Income is not being accrued. | |||||||
| (j) | Variable rate security. Rate shown represents the weighted average rate of underlying contracts at December 31, 2016. | |||||||
| (k) | Position is unsettled. Contract rate was not determined at December 31, 2016 and does not take effect until settlement date. Maturity date is not finalized until settlement date. | |||||||
| (l) | Counterparty is Deutsche Bank AG. | |||||||
| (m) | Counterparty is Bank of America, N.A. | |||||||
| (n) | Interest rate represents discount rate at time of purchase; not a coupon rate. | |||||||
| (o) | Security (or a portion thereof) has been pledged as collateral for open derivative contracts. | |||||||
| 144A | All or a portion of these securities are exempt from registration under Rule 144A of the Securities Act of 1933. These securities may be resold in transactions exempt from registration, normally to qualified institutional buyers. At December 31, 2016, the value of Rule 144A holdings amounted to $346,837,576 or 29.0% of net assets. | |||||||
| ABS | Asset-Backed Securities | |||||||
| ADR | An American Depositary Receipt is a certificate issued by a custodian bank representing the right to receive securities of the foreign issuer described. The values of ADRs may be significantly influenced by trading on exchanges not located in the United States. | |||||||
| EMTN | Euro Medium Term Note | |||||||
| GMTN | Global Medium Term Note | |||||||
| JIBAR | Johannesburg Interbank Agreed Rate | |||||||
| LIBOR | London Interbank Offered Rate | |||||||
| MTN | Medium Term Note | |||||||
| PIK | Payment-in-Kind | |||||||
| REITs | Real Estate Investment Trusts | |||||||
See accompanying notes to financial statements.
43 |
Table of Contents
Portfolio of Investments – as of December 31, 2016
Loomis Sayles Strategic Alpha Fund – (continued)
| PRIBOR | Prague Interbank Offered Rate | |||||||
| SAFEX | South African Futures Exchange | |||||||
| TIIE | Equilibrium Interbank Interest Rate (Tasa de Interes de Equilibrio) | |||||||
| ARS | Argentine Peso | |||||||
| BRL | Brazilian Real | |||||||
| COP | Colombian Peso | |||||||
| CZK | Czech Koruna | |||||||
| EUR | Euro | |||||||
| GBP | British Pound | |||||||
| MXN | Mexican Peso | |||||||
| PLN | Polish Zloty | |||||||
| TRY | Turkish Lira | |||||||
| TWD | New Taiwan Dollar | |||||||
| USD | U.S. Dollar | |||||||
| ZAR | South African Rand |
At December 31, 2016, the Fund had the following open bilateral credit default swap agreements:
| Buy Protection | ||||||||||||||||||||||||
| Counterparty | Reference Obligation |
(Pay)/ Receive Fixed Rate |
Expiration Date |
Notional Value(‡) |
Unamortized Up Front Premium Paid/ (Received) |
Market Value |
Unrealized Appreciation (Depreciation) |
|||||||||||||||||
| Bank of America, N.A. | Republic of Turkey | (1.00%) | 12/20/2021 | 12,000,000 | $ | 921,372 | $ | 939,786 | $ | 18,414 | ||||||||||||||
| Barclays Bank PLC | Enel SpA | (1.00%) | 12/20/2021 | 5,500,000 | EUR | 30,951 | (20,481 | ) | (51,432 | ) | ||||||||||||||
| Barclays Bank PLC | Markit iTraxx Asia ex-Japan Index Series 25, 5-Year |
(1.00%) | 6/20/2021 | 4,370,000 | 76,230 | 6,968 | (69,262 | ) | ||||||||||||||||
| Deutsche Bank AG | Republic of China | (1.00%) | 6/20/2021 | 5,900,000 | 27,412 | 20,049 | (7,363 | ) | ||||||||||||||||
| JPMorgan Chase Bank, N.A. | Enel SpA | (1.00%) | 12/20/2021 | 5,500,000 | EUR | 33,733 | (20,481 | ) | (54,214 | ) | ||||||||||||||
| JPMorgan Chase Bank, N.A. | Intesa Sanpaolo SpA | (1.00%) | 12/20/2021 | 5,500,000 | EUR | 189,491 | 110,362 | (79,129 | ) | |||||||||||||||
| JPMorgan Chase Bank, N.A. | Intesa Sanpaolo SpA | (1.00%) | 12/20/2021 | 5,500,000 | EUR | 205,345 | 110,362 | (94,983 | ) | |||||||||||||||
| Morgan Stanley Capital Services, Inc. | Markit iTraxx Asia ex-Japan Index Series 25, 5-Year |
(1.00%) | 6/20/2021 | 8,910,000 | 160,874 | 14,207 | (146,667 | ) | ||||||||||||||||
|
|
|
|
|
|||||||||||||||||||||
| Total | $ | 1,160,772 | $ | (484,636 | ) | |||||||||||||||||||
|
|
|
|
|
|||||||||||||||||||||
See accompanying notes to financial statements.
| 44
Table of Contents
Portfolio of Investments – as of December 31, 2016
Loomis Sayles Strategic Alpha Fund – (continued)
At December 31, 2016, the Fund had the following open centrally cleared credit default swap agreements:
| Buy Protection | ||||||||||||||||
| Reference Obligation |
(Pay)/ Receive Fixed Rate |
Expiration Date |
Notional Value(‡) |
Market Value |
Unrealized Appreciation (Depreciation) |
|||||||||||
| CDX.HY Series 27, 5-Year | (5.00%) | 12/20/2021 | 35,600,000 | $ | (2,203,925 | ) | $ | (850,080 | ) | |||||||
| CDX.HY Series 27, 5-Year | (5.00%) | 12/20/2021 | 12,000,000 | (742,896 | ) | (286,544 | ) | |||||||||
| CDX.HY Series 27, 5-Year | (5.00%) | 12/20/2021 | 11,750,000 | (727,419 | ) | (280,574 | ) | |||||||||
|
|
|
|
|
|||||||||||||
| Total | $ | (3,674,240 | ) | $ | (1,417,198 | ) | ||||||||||
|
|
|
|
|
|||||||||||||
At December 31, 2016, the Fund had the following open centrally cleared interest rate swap agreements:
| Notional Value | Currency | Expiration Date |
Fund Pays | Fund Receives | Market Value1 |
|||||||||||||||||
| 76,950,000 | GBP | 7/21/2018 | 6-month LIBOR | 0.526% | $ | (82,251 | ) | |||||||||||||||
| 76,950,000 | GBP | 7/22/2018 | 6-month LIBOR | 0.499% | (121,655 | ) | ||||||||||||||||
| 19,195,200 | USD | 7/18/2026 | 1.410% | 3-month LIBOR | 1,548,618 | |||||||||||||||||
| 25,650,000 | GBP | 7/21/2021 | 0.621% | 6-month LIBOR | 293,889 | |||||||||||||||||
| 25,650,000 | GBP | 7/22/2021 | 0.594% | 6-month LIBOR | 332,029 | |||||||||||||||||
|
|
|
|||||||||||||||||||||
| Total | $ | 1,970,630 | ||||||||||||||||||||
|
|
|
|||||||||||||||||||||
| At December 31, 2016, the Fund had the following open bilateral interest rate swap agreements: | ||||||||||||||||||||||
| Counterparty | Notional Value | Currency | Expiration Date |
Fund Pays | Fund Receives | Market Value1 |
||||||||||||||||
| Bank of America, N.A. |
36,000,000 | ZAR | 5/8/2025 | 7.950% | 3-month SAFEX-JIBAR | $ | 40,717 | |||||||||||||||
| Bank of America, N.A. |
330,558,000 | MXN | 7/3/2026 | 28-day TIIE | 6.130% | (1,925,781 | ) | |||||||||||||||
| Bank of America, N.A. |
2,874,300,000 | CZK | 8/3/2018 | 6-month PRIBOR | 0.300% | 102,541 | ||||||||||||||||
| Bank of America, N.A. |
862,000,000 | CZK | 8/3/2021 | 0.350% | 6-month PRIBOR | 178,643 | ||||||||||||||||
| Bank of America, N.A. |
344,900,000 | CZK | 8/4/2018 | 6-month PRIBOR | 0.305% | 13,327 | ||||||||||||||||
| Bank of America, N.A. |
143,600,000 | CZK | 8/4/2021 | 0.355% | 6-month PRIBOR | 28,597 | ||||||||||||||||
| Bank of America, N.A. |
1,741,000,000 | CZK | 7/29/2018 | 6-month PRIBOR | 0.320% | 83,705 | ||||||||||||||||
| Bank of America, N.A. |
698,000,000 | CZK | 7/29/2021 | 0.370% | 6-month PRIBOR | 117,013 | ||||||||||||||||
| Barclays Bank PLC |
291,000,000 | ZAR | 5/5/2025 | 7.950% | 3-month SAFEX-JIBAR | 327,908 | ||||||||||||||||
| Deutsche Bank AG |
670,000,000 | CZK | 7/29/2021 | 0.375% | 6-month PRIBOR | 106,298 | ||||||||||||||||
| Deutsche Bank AG |
104,000,000 | MXN | 7/3/2026 | 28-day TIIE | 6.135% | (604,184 | ) | |||||||||||||||
| Deutsche Bank AG |
1,710,000,000 | CZK | 7/29/2018 | 6-month PRIBOR | 0.325% | 87,537 | ||||||||||||||||
| JPMorgan Chase Bank, N.A. |
57,120,000 | ZAR | 4/17/2025 | 7.720% | 3-month SAFEX-JIBAR | 120,759 | ||||||||||||||||
|
|
|
|||||||||||||||||||||
| Total |
$ | (1,322,920 | ) | |||||||||||||||||||
|
|
|
|||||||||||||||||||||
| (‡) | Notional value stated in U.S. dollars unless otherwise noted. |
| 1 | There are no up front payments on interest rate swap agreements; therefore unrealized appreciation (depreciation) is equal to market value. |
See accompanying notes to financial statements.
45 |
Table of Contents
Portfolio of Investments – as of December 31, 2016
Loomis Sayles Strategic Alpha Fund – (continued)
At December 31, 2016, the Fund had the following open forward foreign currency contracts:
| Contract to Buy/Sell |
Delivery Date |
Currency | Units of Currency |
Notional Value |
Unrealized Appreciation (Depreciation) |
|||||||||||||
| Buy1 | 1/05/2017 | Brazilian Real | 37,900,000 | $ | 11,641,224 | $ | 180,686 | |||||||||||
| Sell1 | 1/05/2017 | Brazilian Real | 37,900,000 | 11,641,224 | (378,222 | ) | ||||||||||||
| Sell2 | 1/17/2017 | Brazilian Real | 23,300,000 | 7,131,992 | (263,901 | ) | ||||||||||||
| Sell1 | 7/06/2017 | Brazilian Real | 37,900,000 | 11,101,026 | (164,653 | ) | ||||||||||||
| Sell3 | 1/12/2017 | British Pound | 5,095,000 | 6,280,905 | 138,795 | |||||||||||||
| Sell1 | 2/09/2017 | British Pound | 1,225,000 | 1,511,108 | 9,191 | |||||||||||||
| Sell1 | 1/27/2017 | Canadian Dollar | 39,200,000 | 29,204,830 | (274,001 | ) | ||||||||||||
| Sell1 | 1/30/2017 | Canadian Dollar | 31,300,000 | 23,320,009 | (122,624 | ) | ||||||||||||
| Sell4 | 1/27/2017 | Colombian Peso | 18,400,000,000 | 6,102,411 | (351,063 | ) | ||||||||||||
| Sell2 | 1/10/2017 | Euro | 15,950,000 | 16,797,293 | 306,530 | |||||||||||||
| Sell3 | 1/17/2017 | Euro | 2,000,000 | 2,106,950 | 28,670 | |||||||||||||
| Sell2 | 1/30/2017 | Euro | 32,550,000 | 34,309,971 | (190,735 | ) | ||||||||||||
| Buy2 | 1/10/2017 | Hungarian Forint | 4,962,600,000 | 16,896,504 | (16,741 | ) | ||||||||||||
| Sell4 | 2/23/2017 | Indonesian Rupiah | 196,800,000,000 | 14,499,431 | (243,727 | ) | ||||||||||||
| Buy1 | 1/30/2017 | Mexican Peso | 445,000,000 | 21,388,261 | 74,163 | |||||||||||||
| Sell1 | 1/09/2017 | Mexican Peso | 219,200,000 | 10,566,252 | 776,665 | |||||||||||||
| Sell2 | 1/17/2017 | Mexican Peso | 92,400,000 | 4,449,006 | 80,406 | |||||||||||||
| Sell1 | 1/27/2017 | Mexican Peso | 11,230,986 | 540,023 | (552 | ) | ||||||||||||
| Sell5 | 1/17/2017 | New Zealand Dollar | 28,200,000 | 19,582,266 | 591,027 | |||||||||||||
| Buy1 | 1/27/2017 | Norwegian Krone | 147,430,000 | 17,076,862 | 195,804 | |||||||||||||
| Buy1 | 1/30/2017 | Norwegian Krone | 253,000,000 | 29,305,596 | 233,156 | |||||||||||||
| Sell3 | 4/28/2017 | Polish Zloty | 45,000,000 | 10,733,819 | 947,666 | |||||||||||||
| Sell2 | 1/17/2017 | South Korean Won | 25,000,000,000 | 20,698,791 | 645,015 | |||||||||||||
| Buy1 | 1/17/2017 | Swedish Krona | 161,100,000 | 17,699,818 | 139,115 | |||||||||||||
| Buy2 | 9/19/2017 | Yuan Renminbi | 235,000,000 | 33,575,400 | 245,848 | |||||||||||||
| Sell2 | 9/19/2017 | Yuan Renminbi | 235,000,000 | 33,575,400 | 653,717 | |||||||||||||
|
|
|
|||||||||||||||||
| Total | $ | 3,240,235 | ||||||||||||||||
|
|
|
|||||||||||||||||
1 Counterparty is Morgan Stanley Capital Services, Inc.
2 Counterparty is Bank of America, N.A.
3 Counterparty is Deutsche Bank AG
4 Counterparty is Credit Suisse International
5 Counterparty is Commonwealth Bank of Australia Sydney
At December 31, 2016, open long futures contracts were as follows:
| Financial Futures | Expiration Date |
Contracts | Notional Value |
Unrealized Appreciation (Depreciation) |
||||||||||||
| CBOE SPX Volatility Index |
2/15/2017 | 166 | $ | 2,751,450 | $ | (168,848 | ) | |||||||||
|
|
|
|||||||||||||||
See accompanying notes to financial statements.
| 46
Table of Contents
Portfolio of Investments – as of December 31, 2016
Loomis Sayles Strategic Alpha Fund – (continued)
At December 31, 2016, open short futures contracts were as follows:
| Financial Futures | Expiration Date |
Contracts | Notional Value |
Unrealized Appreciation (Depreciation) |
||||||||||||
| Ultra Long U.S. Treasury Bond |
3/22/2017 | 76 | $ | 12,179,000 | $ | 168,932 | ||||||||||
| Ultra 10 Year U.S. Treasury Note |
3/22/2017 | 236 | 31,638,750 | 226,727 | ||||||||||||
| 5 Year U.S. Treasury Note |
3/31/2017 | 578 | 68,009,828 | (561,024 | ) | |||||||||||
| 10 Year U.S. Treasury Note |
3/22/2017 | 720 | 89,482,500 | 494,171 | ||||||||||||
|
|
|
|||||||||||||||
| Total |
|
$ | 328,806 | |||||||||||||
|
|
|
|||||||||||||||
Industry Summary at December 31, 2016
| ABS Home Equity |
12.6 | % | ||
| ABS Credit Card |
7.3 | |||
| ABS Car Loan |
6.0 | |||
| Independent Energy |
5.4 | |||
| Non-Agency Commercial Mortgage-Backed Securities |
4.8 | |||
| Midstream |
4.7 | |||
| ABS Other |
4.0 | |||
| Technology |
3.8 | |||
| Banking |
3.4 | |||
| Automotive |
2.6 | |||
| Pharmaceuticals |
2.5 | |||
| Treasuries |
2.3 | |||
| Other Investments, less than 2% each |
25.6 | |||
| Short-Term Investments |
13.3 | |||
|
|
|
|||
| Total Investments |
98.3 | |||
| Other assets less liabilities (including swap agreements, forward foreign currency and futures contracts) |
1.7 | |||
|
|
|
|||
| Net Assets |
100.0 | % | ||
|
|
|
See accompanying notes to financial statements.
47 |
Table of Contents
This Page Intentionally Left Blank
| 48
Table of Contents
Statements of Assets and Liabilities
December 31, 2016
| Gateway Equity Call Premium Fund |
Loomis Sayles Strategic Alpha Fund |
|||||||
| ASSETS |
| |||||||
| Investments at cost |
$ | 61,514,111 | $ | 1,196,862,113 | ||||
| Net unrealized appreciation (depreciation) |
10,493,972 | (20,782,627 | ) | |||||
|
|
|
|
|
|||||
| Investments at value |
72,008,083 | 1,176,079,486 | ||||||
| Cash |
— | 1,078,123 | ||||||
| Due from brokers (Note 2) |
— | 11,725,674 | ||||||
| Foreign currency at value (identified cost $0 and $4,059,048, respectively) |
— | 3,728,098 | ||||||
| Receivable for Fund shares sold |
230,017 | 5,072,114 | ||||||
| Receivable for securities sold |
— | 83,502 | ||||||
| Collateral received for open forward foreign currency contracts, options or swap agreements (Notes 2 and 4) |
— | 4,099,630 | ||||||
| Dividends and interest receivable |
92,056 | 6,262,980 | ||||||
| Unrealized appreciation on bilateral swap agreements (Note 2) |
— | 1,225,459 | ||||||
| Unrealized appreciation on forward foreign currency contracts (Note 2) |
— | 5,246,454 | ||||||
| Tax reclaims receivable |
— | 9,277 | ||||||
| Unamortized upfront premiums paid on bilateral swap agreements (Note 2) |
— | 1,645,408 | ||||||
| Fees receivable on swap agreements (Note 2) |
— | 822,207 | ||||||
| Prepaid expenses (Note 7) |
138 | 2,778 | ||||||
|
|
|
|
|
|||||
| TOTAL ASSETS |
72,330,294 | 1,217,081,190 | ||||||
|
|
|
|
|
|||||
| LIABILITIES |
| |||||||
| Options written, at value (premiums received $1,217,286 and $0, respectively) (Note 2) |
1,358,200 | — | ||||||
| Payable for securities purchased |
— | 7,842,203 | ||||||
| Unrealized depreciation on bilateral swap agreements (Note 2) |
— | 3,033,015 | ||||||
| Payable for Fund shares redeemed |
234,201 | 606,086 | ||||||
| Unrealized depreciation on forward foreign currency contracts (Note 2) |
— | 2,006,219 | ||||||
| Payable for variation margin on centrally cleared swap agreements (Note 2) |
— | 131,251 | ||||||
| Due to brokers (Note 2) |
— | 4,099,630 | ||||||
| Payable for variation margin on futures contracts (Note 2) |
— | 520,090 | ||||||
| Fees payable on swap agreements (Note 2) |
— | 919,264 | ||||||
| Management fees payable (Note 6) |
48,504 | 701,369 | ||||||
| Deferred Trustees’ fees (Note 6) |
22,450 | 92,209 | ||||||
| Administrative fees payable (Note 6) |
2,676 | 45,163 | ||||||
| Payable to distributor (Note 6d) |
393 | 9,984 | ||||||
| Other accounts payable and accrued expenses |
54,182 | 127,684 | ||||||
|
|
|
|
|
|||||
| TOTAL LIABILITIES |
1,720,606 | 20,134,167 | ||||||
|
|
|
|
|
|||||
| NET ASSETS |
$ | 70,609,688 | $ | 1,196,947,023 | ||||
|
|
|
|
|
|||||
| NET ASSETS CONSIST OF: |
| |||||||
| Paid-in capital |
$ | 65,426,731 | $ | 1,273,001,223 | ||||
| Distributions in excess of net investment income |
(21,052 | ) | (1,669,570 | ) | ||||
| Accumulated net realized loss on investments, futures contracts, options/swaptions written, swap agreements and foreign currency transactions |
(5,149,049 | ) | (55,020,455 | ) | ||||
| Net unrealized appreciation (depreciation) on investments, futures contracts, options/swaptions written, swap agreements and foreign currency translations |
10,353,058 | (19,364,175 | ) | |||||
|
|
|
|
|
|||||
| NET ASSETS |
$ | 70,609,688 | $ | 1,196,947,023 | ||||
|
|
|
|
|
|||||
See accompanying notes to financial statements.
49 |
Table of Contents
Statements of Assets and Liabilities (continued)
December 31, 2016
| Gateway Equity Call Premium Fund |
Loomis Sayles Strategic Alpha Fund |
|||||||
| COMPUTATION OF NET ASSET VALUE AND OFFERING PRICE: |
||||||||
| Class A shares: |
| |||||||
| Net assets |
$ | 6,507,245 | $ | 67,746,118 | ||||
|
|
|
|
|
|||||
| Shares of beneficial interest |
597,648 | 6,871,861 | ||||||
|
|
|
|
|
|||||
| Net asset value and redemption price per share |
$ | 10.89 | $ | 9.86 | ||||
|
|
|
|
|
|||||
| Offering price per share (100/[100-maximum sales charge] of net asset value) (Note 1) |
$ | 11.55 | $ | 10.30 | ||||
|
|
|
|
|
|||||
| Class C shares: (redemption price per share is equal to net asset value less any applicable contingent deferred sales charge) (Note 1) |
||||||||
| Net assets |
$ | 524,292 | $ | 45,674,260 | ||||
|
|
|
|
|
|||||
| Shares of beneficial interest |
48,250 | 4,649,398 | ||||||
|
|
|
|
|
|||||
| Net asset value and offering price per share |
$ | 10.87 | $ | 9.82 | ||||
|
|
|
|
|
|||||
| Class Y shares: |
| |||||||
| Net assets |
$ | 63,578,151 | $ | 1,083,526,645 | ||||
|
|
|
|
|
|||||
| Shares of beneficial interest |
5,836,633 | 110,039,832 | ||||||
|
|
|
|
|
|||||
| Net asset value, offering and redemption price per share |
$ | 10.89 | $ | 9.85 | ||||
|
|
|
|
|
|||||
See accompanying notes to financial statements.
| 50
Table of Contents
Statements of Operations
For the Year Ended December 31, 2016
| Gateway Equity Call Premium Fund |
Loomis Sayles Strategic Alpha Fund |
|||||||
| INVESTMENT INCOME |
| |||||||
| Interest |
$ | 640 | $ | 49,631,562 | ||||
| Dividends |
1,434,866 | 1,869,517 | ||||||
| Less net foreign taxes withheld |
(388 | ) | (15,281 | ) | ||||
|
|
|
|
|
|||||
| 1,435,118 | 51,485,798 | |||||||
|
|
|
|
|
|||||
| Expenses |
| |||||||
| Management fees (Note 6) |
420,410 | 8,505,759 | ||||||
| Service and distribution fees (Note 6) |
15,770 | 713,430 | ||||||
| Administrative fees (Note 6) |
28,710 | 539,257 | ||||||
| Trustees’ fees and expenses (Note 6) |
20,524 | 48,169 | ||||||
| Transfer agent fees and expenses (Note 6) |
35,691 | 839,782 | ||||||
| Audit and tax services fees |
50,094 | 82,509 | ||||||
| Custodian fees and expenses |
54,542 | 145,457 | ||||||
| Legal fees |
1,081 | 17,358 | ||||||
| Registration fees |
59,523 | 70,668 | ||||||
| Shareholder reporting expenses |
3,048 | 33,650 | ||||||
| Miscellaneous expenses (Note 7) |
10,792 | 57,242 | ||||||
|
|
|
|
|
|||||
| Total expenses |
700,185 | 11,053,281 | ||||||
| Less waiver and/or expense reimbursement (Note 6) |
(69,968 | ) | — | |||||
|
|
|
|
|
|||||
| Net expenses |
630,217 | 11,053,281 | ||||||
|
|
|
|
|
|||||
| Net investment income |
804,901 | 40,432,517 | ||||||
|
|
|
|
|
|||||
| NET REALIZED AND UNREALIZED GAIN (LOSS) ON INVESTMENTS, FUTURES CONTRACTS, OPTIONS/SWAPTIONS WRITTEN, SWAP AGREEMENTS AND FOREIGN CURRENCY TRANSACTIONS |
||||||||
| Net realized gain (loss) on: |
| |||||||
| Investments |
(1,708,951 | ) | 188,180 | |||||
| Futures contracts |
— | (4,680,774 | ) | |||||
| Options/swaptions written |
(1,679,523 | ) | (78,106 | ) | ||||
| Swap agreements |
— | (1,940,585 | ) | |||||
| Foreign currency transactions |
— | (14,117,611 | ) | |||||
| Net change in unrealized appreciation (depreciation) on: |
| |||||||
| Investments |
8,823,220 | 55,962,458 | ||||||
| Futures contracts |
— | 1,359,156 | ||||||
| Options/swaptions written |
(775,949 | ) | (1,204,936 | ) | ||||
| Swap agreements |
— | (3,624,488 | ) | |||||
| Foreign currency translations |
— | 4,331,047 | ||||||
|
|
|
|
|
|||||
| Net realized and unrealized gain on investments, futures contracts, options/swaptions written, swap agreements and foreign currency transactions |
4,658,797 | 36,194,341 | ||||||
|
|
|
|
|
|||||
| NET INCREASE IN NET ASSETS RESULTING FROM OPERATIONS |
$ | 5,463,698 | $ | 76,626,858 | ||||
|
|
|
|
|
|||||
See accompanying notes to financial statements.
51 |
Table of Contents
Statements of Changes in Net Assets
| Gateway Equity Call Premium Fund |
Loomis Sayles Strategic Alpha Fund |
|||||||||||||||
| Year Ended December 31, 2016 |
Year Ended December 31, 2015 |
Year Ended December 31, 2016 |
Year Ended December 31, 2015 |
|||||||||||||
| FROM OPERATIONS: |
||||||||||||||||
| Net investment income |
$ | 804,901 | $ | 565,577 | $ | 40,432,517 | $ | 40,768,224 | ||||||||
| Net realized gain (loss) on investments, futures contracts, options/swaptions written, swap agreements and foreign currency transactions |
(3,388,474 | ) | (1,305,010 | ) | (20,628,896 | ) | 9,367,111 | |||||||||
| Net change in unrealized appreciation (depreciation) on investments, futures contracts, options/swaptions written, swap agreements and foreign currency translations |
8,047,271 | 1,812,287 | 56,823,237 | (73,340,507 | ) | |||||||||||
|
|
|
|
|
|
|
|
|
|||||||||
| Net increase (decrease) in net assets resulting from operations |
5,463,698 | 1,072,854 | 76,626,858 | (23,205,172 | ) | |||||||||||
|
|
|
|
|
|
|
|
|
|||||||||
| FROM DISTRIBUTIONS TO SHAREHOLDERS: |
||||||||||||||||
| Net investment income |
||||||||||||||||
| Class A |
(57,801 | ) | (39,013 | ) | (1,492,404 | ) | (4,059,682 | ) | ||||||||
| Class C |
(1,192 | ) | (187 | ) | (703,920 | ) | (1,842,482 | ) | ||||||||
| Class Y |
(719,110 | ) | (520,001 | ) | (25,810,102 | ) | (47,419,979 | ) | ||||||||
|
|
|
|
|
|
|
|
|
|||||||||
| Total distributions |
(778,103 | ) | (559,201 | ) | (28,006,426 | ) | (53,322,143 | ) | ||||||||
|
|
|
|
|
|
|
|
|
|||||||||
| NET INCREASE (DECREASE) IN NET ASSETS FROM CAPITAL SHARE TRANSACTIONS (NOTE 10) |
11,698,686 | 32,799,930 | (213,904,671 | ) | 74,883,671 | |||||||||||
|
|
|
|
|
|
|
|
|
|||||||||
| Net increase (decrease) in net assets |
16,384,281 | 33,313,583 | (165,284,239 | ) | (1,643,644 | ) | ||||||||||
| NET ASSETS |
||||||||||||||||
| Beginning of the year |
54,225,407 | 20,911,824 | 1,362,231,262 | 1,363,874,906 | ||||||||||||
|
|
|
|
|
|
|
|
|
|||||||||
| End of the year |
$ | 70,609,688 | $ | 54,225,407 | $ | 1,196,947,023 | $ | 1,362,231,262 | ||||||||
|
|
|
|
|
|
|
|
|
|||||||||
| UNDISTRIBUTED (DISTRIBUTIONS IN EXCESS OF) NET INVESTMENT INCOME |
$ | (21,052 | ) | $ | (7,362 | ) | $ | (1,669,570 | ) | $ | 517,945 | |||||
|
|
|
|
|
|
|
|
|
|||||||||
See accompanying notes to financial statements.
| 52
Table of Contents
Financial Highlights
For a share outstanding throughout each period.
| Gateway Equity Call Premium Fund—Class A | ||||||||||||
| Year Ended December 31, 2016 |
Year Ended December 31, 2015 |
Period Ended December 31, 2014* |
||||||||||
| Net asset value, beginning of the period |
$ | 10.22 | $ | 9.96 | $ | 10.00 | ||||||
|
|
|
|
|
|
|
|||||||
| INCOME (LOSS) FROM INVESTMENT OPERATIONS: |
| |||||||||||
| Net investment income(a) |
0.11 | 0.15 | (b) | 0.02 | ||||||||
| Net realized and unrealized gain (loss) |
0.66 | 0.24 | (0.02 | ) | ||||||||
|
|
|
|
|
|
|
|||||||
| Total from Investment Operations |
0.77 | 0.39 | 0.00 | (c) | ||||||||
|
|
|
|
|
|
|
|||||||
| LESS DISTRIBUTIONS FROM: |
| |||||||||||
| Net investment income |
(0.10 | ) | (0.13 | ) | (0.04 | ) | ||||||
|
|
|
|
|
|
|
|||||||
| Net asset value, end of the period |
$ | 10.89 | $ | 10.22 | $ | 9.96 | ||||||
|
|
|
|
|
|
|
|||||||
| Total return(d)(e) |
7.58 | % | 3.90 | % | 0.00 | %(f) | ||||||
| RATIOS TO AVERAGE NET ASSETS: |
| |||||||||||
| Net assets, end of the period (000’s) |
$ | 6,507 | $ | 3,855 | $ | 96 | ||||||
| Net expenses(g) |
1.20 | % | 1.20 | % | 1.20 | %(h) | ||||||
| Gross expenses |
1.31 | % | 1.70 | % | 3.69 | %(h) | ||||||
| Net investment income |
1.02 | % | 1.47 | %(b) | 0.84 | %(h) | ||||||
| Portfolio turnover rate |
24 | % | 38 | % | 7 | % | ||||||
| * | From commencement of operations on September 30, 2014 through December 31, 2014. |
| (a) | Per share net investment income has been calculated using the average shares outstanding during the period. |
| (b) | Includes a non-recurring dividend. Without this dividend, net investment income per share would have been $0.10 and the ratio of net investment income to average net assets would have been 0.98%. |
| (c) | Amount rounds to less than $0.01 per share. |
| (d) | A sales charge for Class A shares is not reflected in total return calculations. |
| (e) | Had certain expenses not been waived/reimbursed during the period, total returns would have been lower. |
| (f) | Periods less than one year are not annualized. |
| (g) | The investment adviser agreed to waive its fees and/or reimburse a portion of the Fund’s expenses during the period. Without this waiver/reimbursement, expenses would have been higher. |
| (h) | Computed on an annualized basis for periods less than one year. |
See accompanying notes to financial statements.
53 |
Table of Contents
Financial Highlights (continued)
For a share outstanding throughout each period.
| Gateway Equity Call Premium Fund—Class C | ||||||||||||
| Year Ended December 31, 2016 |
Year Ended December 31, 2015 |
Period Ended December 31, 2014* |
||||||||||
| Net asset value, beginning of the period |
$ | 10.22 | $ | 9.97 | $ | 10.00 | ||||||
|
|
|
|
|
|
|
|||||||
| INCOME (LOSS) FROM INVESTMENT OPERATIONS: |
| |||||||||||
| Net investment income(a) |
0.02 | 0.09 | (b) | 0.00 | (c) | |||||||
| Net realized and unrealized gain (loss) |
0.68 | 0.22 | (0.01 | ) | ||||||||
|
|
|
|
|
|
|
|||||||
| Total from Investment Operations |
0.70 | 0.31 | (0.01 | ) | ||||||||
|
|
|
|
|
|
|
|||||||
| LESS DISTRIBUTIONS FROM: |
| |||||||||||
| Net investment income |
(0.05 | ) | (0.06 | ) | (0.02 | ) | ||||||
|
|
|
|
|
|
|
|||||||
| Net asset value, end of the period |
$ | 10.87 | $ | 10.22 | $ | 9.97 | ||||||
|
|
|
|
|
|
|
|||||||
| Total return(d)(e) |
6.85 | % | 3.07 | % | (0.12 | )%(f) | ||||||
| RATIOS TO AVERAGE NET ASSETS: |
| |||||||||||
| Net assets, end of the period (000’s) |
$ | 524 | $ | 37 | $ | 1 | ||||||
| Net expenses(g) |
1.95 | % | 1.95 | % | 1.95 | %(h) | ||||||
| Gross expenses |
1.98 | % | 2.40 | % | 4.37 | %(h) | ||||||
| Net investment income |
0.23 | % | 0.85 | %(b) | 0.01 | %(h) | ||||||
| Portfolio turnover rate |
24 | % | 38 | % | 7 | % | ||||||
| * | From commencement of operations on September 30, 2014 through December 31, 2014. |
| (a) | Per share net investment income has been calculated using the average shares outstanding during the period. |
| (b) | Includes a non-recurring dividend. Without this dividend, net investment income per share would have been $0.07 and the ratio of net investment income to average net assets would have been 0.72%. |
| (c) | Amount rounds to less than $0.01 per share. |
| (d) | A contingent deferred sales charge for Class C shares is not reflected in total return calculations. |
| (e) | Had certain expenses not been waived/reimbursed during the period, total returns would have been lower. |
| (f) | Periods less than one year are not annualized. |
| (g) | The investment adviser agreed to waive its fees and/or reimburse a portion of the Fund’s expenses during the period. Without this waiver/reimbursement, expenses would have been higher. |
| (h) | Computed on an annualized basis for periods less than one year. |
See accompanying notes to financial statements.
| 54
Table of Contents
Financial Highlights (continued)
For a share outstanding throughout each period.
| Gateway Equity Call Premium Fund—Class Y | ||||||||||||
| Year Ended December 31, 2016 |
Year Ended December 31, 2015 |
Period Ended December 31, 2014* |
||||||||||
| Net asset value, beginning of the period |
$ | 10.22 | $ | 9.97 | $ | 10.00 | ||||||
|
|
|
|
|
|
|
|||||||
| INCOME (LOSS) FROM INVESTMENT OPERATIONS: |
| |||||||||||
| Net investment income(a) |
0.13 | 0.16 | (b) | 0.02 | ||||||||
| Net realized and unrealized gain (loss) |
0.67 | 0.24 | (0.01 | ) | ||||||||
|
|
|
|
|
|
|
|||||||
| Total from Investment Operations |
0.80 | 0.40 | 0.01 | |||||||||
|
|
|
|
|
|
|
|||||||
| LESS DISTRIBUTIONS FROM: |
| |||||||||||
| Net investment income |
(0.13 | ) | (0.15 | ) | (0.04 | ) | ||||||
|
|
|
|
|
|
|
|||||||
| Net asset value, end of the period |
$ | 10.89 | $ | 10.22 | $ | 9.97 | ||||||
|
|
|
|
|
|
|
|||||||
| Total return(c) |
7.83 | % | 4.03 | % | 0.13 | %(d) | ||||||
| RATIOS TO AVERAGE NET ASSETS: |
| |||||||||||
| Net assets, end of the period (000’s) |
$ | 63,578 | $ | 50,334 | $ | 20,815 | ||||||
| Net expenses(e) |
0.95 | % | 0.95 | % | 0.95 | %(f) | ||||||
| Gross expenses |
1.06 | % | 1.45 | % | 3.54 | %(f) | ||||||
| Net investment income |
1.27 | % | 1.59 | %(b) | 0.99 | %(f) | ||||||
| Portfolio turnover rate |
24 | % | 38 | % | 7 | % | ||||||
| * | From commencement of operations on September 30, 2014 through December 31, 2014. |
| (a) | Per share net investment income has been calculated using the average shares outstanding during the period. |
| (b) | Includes a non-recurring dividend. Without this dividend, net investment income per share would have been $0.12 and the ratio of net investment income to average net assets would have been 1.20%. |
| (c) | Had certain expenses not been waived/reimbursed during the period, total returns would have been lower. |
| (d) | Periods less than one year are not annualized. |
| (e) | The investment adviser agreed to waive its fees and/or reimburse a portion of the Fund’s expenses during the period. Without this waiver/reimbursement, expenses would have been higher. |
| (f) | Computed on an annualized basis for periods less than one year. |
See accompanying notes to financial statements.
55 |
Table of Contents
Financial Highlights (continued)
For a share outstanding throughout each period.
| Loomis Sayles Strategic Alpha Fund—Class A | ||||||||||||||||||||
| Year Ended December 31, 2016 |
Year Ended December 31, 2015 |
Year Ended December 31, 2014 |
Year Ended December 31, 2013 |
Year Ended December 31, 2012 |
||||||||||||||||
| Net asset value, beginning of the period |
$ | 9.45 | $ | 9.96 | $ | 10.06 | $ | 10.20 | $ | 9.34 | ||||||||||
|
|
|
|
|
|
|
|
|
|
|
|||||||||||
| INCOME (LOSS) FROM INVESTMENT OPERATIONS: |
||||||||||||||||||||
| Net investment income(a) |
0.30 | 0.26 | 0.29 | (b) | 0.37 | 0.37 | ||||||||||||||
| Net realized and unrealized gain (loss) |
0.31 | (0.42 | ) | (0.07 | ) | (0.28 | ) | 0.77 | ||||||||||||
|
|
|
|
|
|
|
|
|
|
|
|||||||||||
| Total from Investment Operations |
0.61 | (0.16 | ) | 0.22 | 0.09 | 1.14 | ||||||||||||||
|
|
|
|
|
|
|
|
|
|
|
|||||||||||
| LESS DISTRIBUTIONS FROM: |
||||||||||||||||||||
| Net investment income |
(0.20 | ) | (0.35 | ) | (0.32 | ) | (0.23 | ) | (0.28 | ) | ||||||||||
|
|
|
|
|
|
|
|
|
|
|
|||||||||||
| Net asset value, end of the period |
$ | 9.86 | $ | 9.45 | $ | 9.96 | $ | 10.06 | $ | 10.20 | ||||||||||
|
|
|
|
|
|
|
|
|
|
|
|||||||||||
| Total return(c) |
6.57 | % | (1.68 | )% | 2.24 | %(b) | 0.96 | % | 12.24 | % | ||||||||||
| RATIOS TO AVERAGE NET ASSETS: |
||||||||||||||||||||
| Net assets, end of the period (000’s) |
$ | 67,746 | $ | 116,055 | $ | 104,056 | $ | 177,339 | $ | 80,704 | ||||||||||
| Net expenses |
1.10 | % | 1.10 | % | 1.10 | % | 1.11 | % | 1.12 | % | ||||||||||
| Gross expenses |
1.10 | % | 1.10 | % | 1.10 | % | 1.11 | % | 1.12 | % | ||||||||||
| Net investment income |
3.14 | % | 2.66 | % | 2.90 | %(b) | 3.68 | % | 3.77 | % | ||||||||||
| Portfolio turnover rate |
72 | % | 72 | % | 87 | % | 115 | % | 116 | % | ||||||||||
| (a) | Per share net investment income has been calculated using the average shares outstanding during the period. |
| (b) | Includes a non-recurring dividend. Without this dividend, net investment income per share would have been $0.28, total return would have been 2.14% and the ratio of net investment income to average net assets would have been 2.81%. |
| (c) | A sales charge for Class A shares is not reflected in total return calculations. |
See accompanying notes to financial statements.
| 56
Table of Contents
Financial Highlights (continued)
For a share outstanding throughout each period.
| Loomis Sayles Strategic Alpha Fund—Class C | ||||||||||||||||||||
| Year Ended December 31, 2016 |
Year Ended December 31, 2015 |
Year Ended December 31, 2014 |
Year Ended December 31, 2013 |
Year Ended December 31, 2012 |
||||||||||||||||
| Net asset value, beginning of the period |
$ | 9.42 | $ | 9.93 | $ | 10.03 | $ | 10.16 | $ | 9.31 | ||||||||||
|
|
|
|
|
|
|
|
|
|
|
|||||||||||
| INCOME (LOSS) FROM INVESTMENT OPERATIONS: |
||||||||||||||||||||
| Net investment income(a) |
0.23 | 0.19 | 0.21 | (b) | 0.30 | 0.30 | ||||||||||||||
| Net realized and unrealized gain (loss) |
0.30 | (0.43 | ) | (0.06 | ) | (0.28 | ) | 0.76 | ||||||||||||
|
|
|
|
|
|
|
|
|
|
|
|||||||||||
| Total from Investment Operations |
0.53 | (0.24 | ) | 0.15 | 0.02 | 1.06 | ||||||||||||||
|
|
|
|
|
|
|
|
|
|
|
|||||||||||
| LESS DISTRIBUTIONS FROM: |
||||||||||||||||||||
| Net investment income |
(0.13 | ) | (0.27 | ) | (0.25 | ) | (0.15 | ) | (0.21 | ) | ||||||||||
|
|
|
|
|
|
|
|
|
|
|
|||||||||||
| Net asset value, end of the period |
$ | 9.82 | $ | 9.42 | $ | 9.93 | $ | 10.03 | $ | 10.16 | ||||||||||
|
|
|
|
|
|
|
|
|
|
|
|||||||||||
| Total return(c) |
5.70 | % | (2.44 | )% | 1.47 | %(b) | 0.22 | % | 11.44 | % | ||||||||||
| RATIOS TO AVERAGE NET ASSETS: |
||||||||||||||||||||
| Net assets, end of the period (000’s) |
$ | 45,674 | $ | 62,453 | $ | 71,215 | $ | 91,694 | $ | 67,748 | ||||||||||
| Net expenses |
1.85 | % | 1.85 | % | 1.85 | % | 1.86 | % | 1.87 | % | ||||||||||
| Gross expenses |
1.85 | % | 1.85 | % | 1.85 | % | 1.86 | % | 1.87 | % | ||||||||||
| Net investment income |
2.40 | % | 1.91 | % | 2.13 | %(b) | 2.96 | % | 3.05 | % | ||||||||||
| Portfolio turnover rate |
72 | % | 72 | % | 87 | % | 115 | % | 116 | % | ||||||||||
| (a) | Per share net investment income has been calculated using the average shares outstanding during the period. |
| (b) | Includes a non-recurring dividend. Without this dividend, net investment income per share would have been $0.21, total return would have been 1.37% and the ratio of net investment income to average net assets would have been 2.05%. |
| (c) | A contingent deferred sales charge for Class C shares is not reflected in total return calculations. |
See accompanying notes to financial statements.
57 |
Table of Contents
Financial Highlights (continued)
For a share outstanding throughout each period.
| Loomis Sayles Strategic Alpha Fund—Class Y | ||||||||||||||||||||
| Year Ended December 31, 2016 |
Year Ended December 31, 2015 |
Year Ended December 31, 2014 |
Year Ended December 31, 2013 |
Year Ended December 31, 2012 |
||||||||||||||||
| Net asset value, beginning of the period |
$ | 9.44 | $ | 9.95 | $ | 10.05 | $ | 10.19 | $ | 9.33 | ||||||||||
|
|
|
|
|
|
|
|
|
|
|
|||||||||||
| INCOME (LOSS) FROM INVESTMENT OPERATIONS: |
||||||||||||||||||||
| Net investment income(a) |
0.32 | 0.29 | 0.31 | (b) | 0.40 | 0.41 | ||||||||||||||
| Net realized and unrealized gain (loss) |
0.32 | (0.43 | ) | (0.06 | ) | (0.29 | ) | 0.76 | ||||||||||||
|
|
|
|
|
|
|
|
|
|
|
|||||||||||
| Total from Investment Operations |
0.64 | (0.14 | ) | 0.25 | 0.11 | 1.17 | ||||||||||||||
|
|
|
|
|
|
|
|
|
|
|
|||||||||||
| LESS DISTRIBUTIONS FROM: |
||||||||||||||||||||
| Net investment income |
(0.23 | ) | (0.37 | ) | (0.35 | ) | (0.25 | ) | (0.31 | ) | ||||||||||
|
|
|
|
|
|
|
|
|
|
|
|||||||||||
| Net asset value, end of the period |
$ | 9.85 | $ | 9.44 | $ | 9.95 | $ | 10.05 | $ | 10.19 | ||||||||||
|
|
|
|
|
|
|
|
|
|
|
|||||||||||
| Total return |
6.86 | % | (1.43 | )% | 2.52 | %(b) | 1.19 | % | 12.57 | % | ||||||||||
| RATIOS TO AVERAGE NET ASSETS: |
||||||||||||||||||||
| Net assets, end of the period (000’s) |
$ | 1,083,527 | $ | 1,183,723 | $ | 1,188,605 | $ | 970,539 | $ | 497,648 | ||||||||||
| Net expenses |
0.85 | % | 0.85 | % | 0.85 | % | 0.86 | % | 0.87 | % | ||||||||||
| Gross expenses |
0.85 | % | 0.85 | % | 0.85 | % | 0.86 | % | 0.87 | % | ||||||||||
| Net investment income |
3.39 | % | 2.91 | % | 3.10 | %(b) | 3.92 | % | 4.09 | % | ||||||||||
| Portfolio turnover rate |
72 | % | 72 | % | 87 | % | 115 | % | 116 | % | ||||||||||
| (a) | Per share net investment income has been calculated using the average shares outstanding during the period. |
| (b) | Includes a non-recurring dividend. Without this dividend, net investment income per share would have been $0.31, total return would have been 2.42% and the ratio of net investment income to average net assets would have been 3.03%. |
See accompanying notes to financial statements.
| 58
Table of Contents
December 31, 2016
1. Organization. Gateway Trust and Natixis Funds Trust II (the “Trusts” and each a “Trust”) are each organized as a Massachusetts business trust. Each Trust is registered under the Investment Company Act of 1940, as amended (the “1940 Act”), as an open-end management investment company. Each Declaration of Trust permits the Board of Trustees to authorize the issuance of an unlimited number of shares of the Trust in multiple series. The financial statements for certain funds of the Trusts are presented in separate reports. The following funds (individually, a “Fund” and collectively, the “Funds”) are included in this report:
Gateway Trust:
Gateway Equity Call Premium Fund
Natixis Funds Trust II:
Loomis Sayles Strategic Alpha Fund (the “Strategic Alpha Fund”)
The Gateway Equity Call Premium Fund is a diversified investment company. The Strategic Alpha Fund is a non-diversified investment company.
Each Fund offers Class A, Class C and Class Y shares. Class A shares are sold with a maximum front-end sales charge of 5.75% for Gateway Equity Call Premium Fund and 4.25% for Strategic Alpha Fund. Class C shares do not pay a front-end sales charge, do not convert to any other class of shares, pay higher Rule 12b-1 fees than Class A shares and may be subject to a contingent deferred sales charge (“CDSC”) of 1.00% if those shares are redeemed within one year of acquisition, except for reinvested distributions. Class Y shares do not pay a front-end sales charge, a CDSC or Rule 12b-1 fees. Class Y shares are intended for institutional investors with a minimum initial investment of $100,000, though some categories of investors are exempted from the minimum investment amount as outlined in the Funds’ prospectus.
Most expenses can be directly attributed to a Fund. Expenses which cannot be directly attributed to a Fund are generally apportioned based on the relative net assets of each of the funds in Natixis Funds Trust I, Natixis Funds Trust II, Natixis Funds Trust IV, Gateway Trust and Natixis ETF Trust (“Natixis Funds Trusts”), Loomis Sayles Funds I and Loomis Sayles Funds II (“Loomis Sayles Funds Trusts”). Expenses of a Fund are borne pro rata by the holders of each class of shares, except that each class bears expenses unique to that class (including the Rule 12b-1 fees applicable to class A and Class C). In addition, each class votes as a class only with respect to its own Rule 12b-1 Plan. Shares of each class would receive their pro rata share of the net assets of a Fund if the Fund were liquidated. The Trustees approve separate distributions from net investment income on each class of shares.
2. Significant Accounting Policies. The following is a summary of significant accounting policies consistently followed by each Fund in the preparation of its financial statements. The Funds’ financial statements follow the accounting and reporting guidelines provided for investment companies and are prepared in accordance with
59 |
Table of Contents
Notes to Financial Statements (continued)
December 31, 2016
accounting principles generally accepted in the United States of America which require the use of management estimates that affect the reported amounts and disclosures in the financial statements. Actual results could differ from those estimates. Management has evaluated the events and transactions subsequent to year-end through the date the financial statements were issued and has determined that there were no material events that would require disclosure in the Funds’ financial statements.
a. Valuation. Fund securities and other investments are valued at market value based on market quotations obtained or determined by independent pricing services recommended by the adviser and approved by the Board of Trustees. Fund securities and other investments for which market quotations are not readily available are valued at fair value as determined in good faith by the adviser pursuant to procedures approved by the Board of Trustees, as described below. Market value is determined as follows:
Listed equity securities (including shares of closed-end investment companies and exchange-traded funds) are valued at the last sale price quoted on the exchange where they are traded most extensively or, if there is no reported sale during the day, the closing bid quotation as reported by an independent pricing service. Securities traded on the NASDAQ Global Select Market, NASDAQ Global Market and NASDAQ Capital Market are valued at the NASDAQ Official Closing Price (“NOCP”), or if lacking an NOCP, at the most recent bid quotations on the applicable NASDAQ Market. Unlisted equity securities (except unlisted preferred equity securities) are valued at the last sale price quoted in the market where they are traded most extensively or, if there is no reported sale during the day, the closing bid quotation as reported by an independent pricing service. If there is no last sale price or closing bid quotation available, unlisted equity securities will be valued using evaluated bids furnished by an independent pricing service, if available. In some foreign markets, an official close price and a last sale price may be available from the foreign exchange or market. In those cases, the official close price is used. Debt securities and unlisted preferred equity securities are valued based on evaluated bids furnished to the Fund by an independent pricing service or bid prices obtained from broker-dealers. Senior loans are valued at bid prices supplied by an independent pricing service, if available. Broker-dealer bid prices may be used to value debt and unlisted equity securities and senior loans where an independent pricing service is unable to price a security or where an independent pricing service does not provide a reliable price for the security. Forward foreign currency contracts are valued utilizing interpolated rates determined based on information provided by an independent pricing service. Futures contracts are valued at the most recent settlement price on the exchange on which the adviser believes that, over time, they are traded most extensively. Centrally cleared swap agreements are valued at settlement prices of the clearinghouse on which the contracts were traded or prices obtained from broker-dealers. Bilateral credit default swaps are valued based on mid prices (between the bid price and the ask price)
| 60
Table of Contents
Notes to Financial Statements (continued)
December 31, 2016
supplied by an independent pricing service. Bilateral interest rate swaps are valued based on prices supplied by an independent pricing source. Domestic exchange-traded single name equity option contracts are valued at the mean of the National Best Bid and Offer quotations. Options on futures contracts are valued using the current settlement price on the exchange on which, over time, they are traded most extensively. Option contracts on domestic indices are valued at the average of the closing bid and ask quotations as of the close of trading on the Chicago Board Options Exchange (“CBOE”). Option contracts on foreign indices are priced at the most recent settlement price. Other exchange-traded options are valued at the average of the closing bid and ask quotations on the exchange on which, over time, they are traded most extensively. Over-the-counter (“OTC”) currency options and swaptions are valued at mid prices (between the bid and the ask price) supplied by an independent pricing service, if available. Other OTC option contracts (including currency options and swaptions not priced through an independent pricing service) are valued based on quotations obtained from broker-dealers.
Fund securities and other investments for which market quotations are not readily available are valued at fair value as determined in good faith by the adviser pursuant to procedures approved by the Board of Trustees. Option contracts for which the average of the closing bid and ask quotations are not considered to reflect option contract values as of the close of the New York Stock Exchange (“NYSE”) are valued at fair value as determined in good faith by the adviser pursuant to procedures approved by the Board of Trustees. On the last business day of the month, the Fund will fair value S&P 500® Index options using the closing rotation values published by the CBOE. The Fund may also value securities and other investments at fair value in other circumstances such as when extraordinary events occur after the close of a foreign market but prior to the close of the NYSE. This may include situations relating to a single issuer (such as a declaration of bankruptcy or a delisting of the issuer’s security from the primary market on which it has traded) as well as events affecting the securities markets in general (such as market disruptions or closings and significant fluctuations in U.S. and/or foreign markets). When fair valuing its securities or other investments, the Fund may, among other things, use modeling tools or other processes that may take into account factors such as securities or other market activity and/or significant events that occur after the close of the foreign market and before the time the Fund’s net asset value (“NAV”) is calculated. Fair value pricing may require subjective determinations about the value of a security, and fair values used to determine the Fund’s NAV may differ from quoted or published prices, or from prices that are used by others, for the same securities. In addition, the use of fair value pricing may not always result in adjustments to the prices of securities held by the Fund.
Illiquid securities for which market quotations are readily available and have been evaluated by the adviser are considered and classified as fair valued securities.
61 |
Table of Contents
Notes to Financial Statements (continued)
December 31, 2016
As of December 31, 2016, written options held by Gateway Equity Call Premium Fund were fair valued at $(1,358,200), representing (1.9)% of net assets, using the closing rotation values published by the CBOE.
As of December 31, 2016, securities held by Strategic Alpha Fund were fair valued as follows:
| Securities classified |
Percentage of Net Assets |
Securities fair valued |
Percentage of Net Assets | |||
| $16,778,275 |
1.4% | $18,528,225 | 1.5% |
b. Investment Transactions and Related Investment Income. Investment transactions are accounted for on a trade date plus one day basis for daily NAV calculation. However, for financial reporting purposes, investment transactions are reported on trade date. Dividend income is recorded on ex-dividend date, or in the case of certain foreign securities, as soon as a Fund is notified, and interest income is recorded on an accrual basis. Interest income is increased by the accretion of discount and decreased by the amortization of premium, if applicable. Periodic principal adjustments for inflation-protected securities are recorded to interest income. The calendar year-end amounts of ordinary income, capital gains, and return of capital included in distributions received from the Funds’ investments in real estate investment trusts (“REITs”) are reported to the Funds after the end of the fiscal year; accordingly, the Funds estimate these amounts for accounting purposes until the characterization of REIT distributions is reported to the Funds after the end of the fiscal year. Estimates are based on the most recent REIT distribution information available. In determining net gain or loss on securities sold, the cost of securities has been determined on an identified cost basis. Investment income, non-class specific expenses and realized and unrealized gains and losses are allocated on a pro rata basis to each class based on the relative net assets of each class to the total net assets of the Fund.
c. Foreign Currency Translation. The books and records of the Funds are maintained in U.S. dollars. The values of securities, currencies and other assets and liabilities denominated in currencies other than U.S. dollars are translated into U.S. dollars based upon foreign exchange rates prevailing at the end of the period. Purchases and sales of investment securities, income and expenses are translated into U.S. dollars on the respective dates of such transactions.
Net realized foreign exchange gains or losses arise from sales of foreign currency, changes in exchange rates between the trade and settlement dates on securities transactions and the difference between the amounts of dividends, interest and foreign withholding taxes recorded on the Fund’s books and the U.S. dollar equivalent of the amounts actually received or paid. Net unrealized foreign exchange gains or losses arise from changes in the value of assets and liabilities, other than investment securities, as of the end of the fiscal period, resulting from changes in exchange rates.
| 62
Table of Contents
Notes to Financial Statements (continued)
December 31, 2016
Net realized foreign exchange gains or losses and the net change in unrealized foreign exchange gains or losses are disclosed in the Statements of Operations. For federal income tax purposes, net realized foreign exchange gains or losses are characterized as ordinary income, and may, if the Funds have net losses, reduce the amount of income available to be distributed by the Funds.
The values of investment securities are presented at the foreign exchange rates prevailing at the end of the period for financial reporting purposes. Net realized and unrealized gains or losses on investments reported in the Statements of Operations reflect gains or losses resulting from changes in exchange rates and fluctuations which arise due to changes in market prices of investment securities. For federal income tax purposes, a portion of Strategic Alpha Fund’s net realized gain or loss on investments arising from changes in exchange rates, which is reflected in the Statements of Operations, may be characterized as ordinary income and may, if the Fund has net losses, reduce the amount of income available to be distributed by the Fund.
For the year ended December 31, 2016, the amount of income available to be distributed by Strategic Alpha Fund has been reduced by $11,833,779 as a result of losses arising from changes in exchange rates.
The Funds may use foreign currency exchange contracts to facilitate transactions in foreign-denominated investments. Losses may arise from changes in the value of the foreign currency or if the counterparties do not perform under the contracts’ terms.
d. Forward Foreign Currency Contracts. The Funds may enter into forward foreign currency contracts, including forward foreign cross currency contracts, to acquire exposure to foreign currencies or to hedge the Fund’s investments against currency fluctuation. A contract can also be used to offset a previous contract. These contracts involve market risk in excess of the unrealized gain or loss reflected in the Funds’ Statements of Assets and Liabilities. The U.S. dollar value of the currencies a Fund has committed to buy or sell represents the aggregate exposure to each currency a Fund has acquired or hedged through currency contracts outstanding at period end. Gains or losses are recorded for financial statement purposes as unrealized until settlement date. Contracts are traded over-the-counter directly with a counterparty. Risks may arise upon entering into these contracts from the potential inability of counterparties to meet the terms of their contracts and from unanticipated movements in the value of a foreign currency relative to the U.S. dollar. Certain contracts may require the movement of cash and/or securities as collateral for the Fund’s or counterparty’s net obligations under the contracts.
e. Futures Contracts. The Funds may enter into futures contracts. Futures contracts are agreements between two parties to buy and sell a particular instrument or index for a specified price on a specified future date.
63 |
Table of Contents
Notes to Financial Statements (continued)
December 31, 2016
When a Fund enters into a futures contract, it is required to deposit with (or for the benefit of) its broker an amount of cash or short-term high-quality securities as “initial margin.” As the value of the contract changes, the value of the futures contract position increases or declines. Subsequent payments, known as “variation margin,” are made or received by a Fund, depending on the price fluctuations in the fair value of the contract and the value of cash or securities on deposit with the broker. The aggregate principal amounts of the contracts are not recorded in the financial statements. Fluctuations in the value of the contracts are recorded in the Statements of Assets and Liabilities as an asset (liability) and in the Statements of Operations as unrealized appreciation (depreciation) until the contracts are closed, when they are recorded as realized gains (losses). Realized gain or loss on a futures position is equal to the difference between the value of the contract at the time it was opened and the value at the time it was closed, minus brokerage commissions. When a Fund enters into a futures contract certain risks may arise, such as illiquidity in the futures market, which may limit a Fund’s ability to close out a futures contract prior to settlement date, and unanticipated movements in the value of securities or interest rates.
Futures contracts are exchange-traded. Exchange-traded futures contracts are standardized and are settled through a clearing house with fulfillment supported by the credit of the exchange. Therefore, counterparty credit risks to the Funds are reduced; however, in the event that a counterparty enters into bankruptcy, a Fund’s claim against initial/variation margin on deposit with the counterparty may be subject to terms of a final settlement in bankruptcy court.
f. Option Contracts. The Funds may enter into option contracts. When a Fund purchases an option, it pays a premium and the option is subsequently marked-to-market to reflect current value. Premiums paid for purchasing options which expire are treated as realized losses. Premiums paid for purchasing options which are exercised are added to the cost or deducted from the proceeds on the underlying instrument to determine the realized gain or loss. If the Fund enters into a closing sale transaction, the difference between the premium paid and the proceeds of the closing sale transaction is treated as a realized gain or loss. The risk associated with purchasing options is limited to the premium paid.
When a Fund writes an option, an amount equal to the net premium received (the premium less commission) is recorded as a liability and is subsequently adjusted to the current value. Net premiums received for written options which expire are treated as realized gains. Net premiums received for written options which are exercised are deducted from the cost or added to the proceeds on the underlying instrument to determine the realized gain or loss. If the Fund enters into a closing purchase transaction, the difference between the net premium received and any amount paid on effecting a closing purchase transaction, including commissions, is treated as a realized gain or, if the net premium received is less than the amount paid, as a realized
| 64
Table of Contents
Notes to Financial Statements (continued)
December 31, 2016
loss. The Fund, as writer of a written option, bears the risk of an unfavorable change in the market value of the instrument or index underlying the written option.
Exchange-traded options contracts are standardized and are settled through a clearing house with fulfillment supported by the credit of the exchange. Therefore, counterparty credit risks to the Funds are reduced. OTC options are subject to the risk that the counterparty is unable or unwilling to meet its obligations under the option.
g. Swaptions. The Funds may enter into interest rate swaptions. An interest rate swaption gives the holder the right, but not the obligation, to enter into or cancel an interest rate swap agreement at a future date. Interest rate swaptions may be either purchased or written. The buyer of an interest rate swaption may purchase either the right to receive a fixed rate in the underlying swap (known as a “receiver swaption”) or to pay a fixed rate (known as a “payer swaption”), based on the notional amount of the swap agreement, in exchange for a floating rate. The notional amounts of swaptions are not recorded in the financial statements.
When a Fund purchases an interest rate swaption, it pays a premium and the swaption is subsequently marked-to-market to reflect current value. Premiums paid for purchasing interest rate swaptions which expire are treated as realized losses. Premiums paid for purchasing interest rate swaptions which are exercised are added to the cost or deducted from the proceeds on the underlying swap to determine the realized gain or loss. If a Fund enters into a closing sale transaction, the difference between the premium paid and the proceeds of the closing sale transaction is treated as a realized gain or loss. The risk associated with purchasing interest rate swaptions is limited to the premium paid.
When a Fund writes an interest rate swaption, an amount equal to the premium received is recorded as a liability and is subsequently adjusted to the current value. Premiums received for written interest rate swaptions which expire are treated as realized gains. Premiums received for written interest rate swaptions which are exercised are deducted from the cost or added to the proceeds on the underlying swap to determine the realized gain or loss. If a Fund enters into a closing purchase transaction, the difference between the premium received and any amount paid on effecting a closing purchase transaction, including commission, is treated as a realized gain or, if the premium received is less than the amount paid, as a realized loss. A Fund, as writer of a written interest rate swaption, bears the risk of an unfavorable change in the market value of the swap underlying the written interest rate swaption.
OTC interest rate swaptions are subject to the risk that the counterparty is unable or unwilling to meet its obligations under the swaption.
h. Swap Agreements. The Funds may enter into credit default and interest rate swaps. A credit default swap is an agreement between two parties (the “protection buyer” and “protection seller”) to exchange the credit risk of an issuer (“reference obligation”) for a
65 |
Table of Contents
Notes to Financial Statements (continued)
December 31, 2016
specified time period. The reference obligation may be one or more debt securities or an index of such securities. The Funds may be either the protection buyer or the protection seller. As a protection buyer, the Funds have the ability to hedge the downside risk of an issuer or group of issuers. As a protection seller, the Funds have the ability to gain exposure to an issuer or group of issuers whose bonds are unavailable or in short supply in the cash bond market, as well as realize additional income in the form of fees paid by the protection buyer. The protection buyer is obligated to pay the protection seller a stream of payments (“fees”) over the term of the contract, provided that no credit event, such as a default or a downgrade in credit rating, occurs on the reference obligation. The Funds may also pay or receive upfront premiums. If a credit event occurs, the protection seller must pay the protection buyer the difference between the agreed upon notional value and market value of the reference obligation. Market value in this case is determined by a facilitated auction whereby a minimum number of allowable broker bids, together with a specified valuation method, are used to calculate the value. The maximum potential amount of undiscounted future payments that a Fund as the protection seller could be required to make under a credit default swap agreement would be an amount equal to the notional amount of the agreement.
Implied credit spreads, represented in absolute terms, are disclosed in the Portfolio of Investments for those agreements for which the Fund is the protection seller. Implied credit spreads serve as an indicator of the current status of the payment/performance risk and represent the likelihood or risk of default for the credit derivative. The implied credit spread of a particular reference entity reflects the cost of buying/selling protection and may include upfront payments required to be made to enter into the agreement. Wider credit spreads represent a deterioration of the reference entity’s credit soundness and a greater likelihood or risk of default or other credit event occurring as defined under the terms of the agreement.
An interest rate swap is an agreement with another party to receive or pay interest (e.g., an exchange of fixed rate payments for floating rate payments) to protect themselves from interest rate fluctuations. This type of swap is an agreement that obligates two parties to exchange a series of cash flows at specified intervals based upon or calculated by reference to a specified interest rate(s) for a specified notional amount. The payment flows are usually netted against each other, with the difference being paid by one party to the other.
The notional amounts of swap agreements are not recorded in the financial statements. Swap agreements are valued daily, and fluctuations in value are recorded in the Statements of Operations as change in unrealized appreciation (depreciation) on swap agreements. Fees are accrued in accordance with the terms of the agreement and are recorded in the Statements of Assets and Liabilities as fees receivable or payable. When received or paid, fees are recorded in the Statements of Operations as realized gain or loss. Upfront premiums paid or received by the Funds are recorded on the Statements of Assets and Liabilities as an asset or liability, respectively, and are
| 66
Table of Contents
Notes to Financial Statements (continued)
December 31, 2016
amortized or accreted over the term of the agreement and recorded as realized gain or loss. Payments made or received by the Funds as a result of a credit event or termination of the agreement are recorded as realized gain or loss.
Swap agreements are privately negotiated in the OTC market and may be entered into as a bilateral contract or centrally cleared (“centrally cleared swaps”). Bilateral swap agreements are traded between counterparties and, as such, are subject to the risk that a party to the agreement will not be able to meet its obligations. In a centrally cleared swap, immediately following execution of the swap agreement, the swap agreement is novated to a central counterparty (the “CCP”) and the Funds face the CCP through a broker. Upon entering into a centrally cleared swap, the Funds are required to deposit initial margin with the broker in the form of cash or securities in an amount that varies depending on the size and risk profile of the particular swap. Subsequent payments, known as “variation margin,” are made or received by the Funds based on the daily change in the value of the centrally cleared swap agreement. For centrally cleared swaps, the Funds’ counterparty credit risk is reduced as the CCP stands between the Funds and the counterparty. The Funds cover their net obligations under outstanding swap agreements by segregating or earmarking cash or securities.
i. Due to/from Brokers. Transactions and positions in certain options, swaptions, futures, forward foreign currency contracts and swap agreements are maintained and cleared by registered U.S. broker/dealers pursuant to customer agreements between the Funds and the various broker/dealers. The due from brokers balance in the Statements of Assets and Liabilities for Strategic Alpha Fund represents cash pledged as collateral for forward foreign currency contracts, options and bilateral swap agreements and as initial margin for futures contracts and centrally cleared swap agreements. The due to brokers balance in the Statements of Assets and Liabilities for Strategic Alpha Fund represents cash and securities received as collateral for forward foreign currency contracts, options and bilateral swap agreements. In certain circumstances the Funds’ use of cash, securities and/or foreign currency held at brokers is restricted by regulation or broker mandated limits.
j. Federal and Foreign Income Taxes. The Trusts treat each Fund as a separate entity for federal income tax purposes. Each Fund intends to meet the requirements of the Internal Revenue Code of 1986, as amended, applicable to regulated investment companies, and to distribute to its shareholders substantially all of its net investment income and any net realized capital gains at least annually. Management has performed an analysis of each Fund’s tax positions for the open tax years as of December 31, 2016 and has concluded that no provisions for income tax are required. The Funds’ federal tax returns for the prior three fiscal years, where applicable, remain subject to examination by the Internal Revenue Service. Management is not aware of any events that are reasonably possible to occur in the next twelve months that would result in the amounts of any unrecognized tax benefits significantly increasing or decreasing for the Funds. However, management’s conclusions regarding tax positions
67 |
Table of Contents
Notes to Financial Statements (continued)
December 31, 2016
taken may be subject to review and adjustment at a later date based on factors including, but not limited to, new tax laws and accounting regulations and interpretations thereof.
A Fund may be subject to foreign withholding taxes on investment income and taxes on capital gains on investments that are accrued and paid based upon the Fund’s understanding of the tax rules and regulations that exist in the countries in which the Fund invests. Foreign withholding taxes on dividend and interest income are reflected on the Statements of Operations as a reduction of investment income, net of amounts eligible to be reclaimed. Dividends and interest receivable on the Statements of Assets and Liabilities are net of foreign withholding taxes. Foreign withholding taxes where reclaims have been or will be filed are reflected on the Statements of Assets and Liabilities as tax reclaims receivable. Capital gains taxes paid are included in net realized gain (loss) on investments in the Statements of Operations. Accrued but unpaid capital gains taxes are reflected as foreign taxes payable on the Statements of Assets and Liabilities, if applicable, and reduce unrealized gains on investments. In the event that realized gains on investments are subsequently offset by realized losses, taxes paid on realized gains may be returned to a Fund. Such amounts, if applicable, are reflected as foreign tax rebates receivable on the Statements of Assets and Liabilities and are recorded as a realized gain when received.
k. Dividends and Distributions to Shareholders. Dividends and distributions are recorded on ex-dividend date. The timing and characterization of certain income and capital gain distributions are determined in accordance with federal tax regulations, which may differ from accounting principles generally accepted in the United States of America. Permanent differences are primarily due to differing treatments for book and tax purposes of items such as paydown gains and losses, return of capital and capital gain distributions received, swap adjustments, treasury inflation-protected bonds, foreign currency gains and losses, convertible bonds, deferred Trustees’ fees, defaulted and/or non-income producing securities, contingent payment debt instruments and premium amortization. Permanent book and tax basis differences relating to shareholder distributions, net investment income and net realized gains will result in reclassifications to capital accounts reported on the Statements of Assets and Liabilities. Temporary differences between book and tax distributable earnings are primarily due to deferred Trustees’ fees, premium amortization, defaulted and/or non-income producing securities, swap adjustments, wash sales, return of capital distributions received, convertible bonds, forward foreign currency, options and futures contracts mark-to-market and straddle deferrals. Amounts of income and capital gain available to be distributed on a tax basis are determined annually, and at other times during the Funds’ fiscal year as may be necessary to avoid knowingly declaring and paying a return of capital distribution. Distributions from net investment income and short-term capital gains are considered to be distributed from ordinary income for tax purposes.
| 68
Table of Contents
Notes to Financial Statements (continued)
December 31, 2016
The tax characterization of distributions is determined on an annual basis. The tax character of distributions paid to shareholders during the years ended December 31, 2016 and 2015 were as follows:
| 2016 Distributions Paid From: | 2015 Distributions Paid From: | |||||||||||||||||||||||
| Fund |
Ordinary |
Long-Term |
Total |
Ordinary |
Long-Term |
Total |
||||||||||||||||||
| Gateway Equity Call Premium Fund |
$ | 778,103 | $ | — | $ | 778,103 | $ | 559,201 | $ | — | $ | 559,201 | ||||||||||||
| Strategic Alpha Fund |
28,006,426 | — | 28,006,426 | 53,322,143 | — | 53,322,143 | ||||||||||||||||||
As of December 31, 2016, the components of distributable earnings on a tax basis were as follows:
| Gateway |
Strategic |
|||||||
| Undistributed ordinary income |
$ | 1,399 | $ | 2,538,801 | ||||
|
|
|
|
|
|||||
| Total undistributed earnings |
1,399 | 2,538,801 | ||||||
|
|
|
|
|
|||||
| Capital loss carryforward: |
||||||||
| Short-term: |
||||||||
| No expiration date |
(3,203,687 | ) | (37,730,155 | ) | ||||
| Long-term: |
||||||||
| No expiration date |
(2,061,547 | ) | (17,520,479 | ) | ||||
|
|
|
|
|
|||||
| Total capital loss carryforward |
(5,265,234 | ) | (55,250,634 | ) | ||||
|
|
|
|
|
|||||
| Unrealized appreciation (depreciation) |
10,469,243 | (22,660,525 | ) | |||||
|
|
|
|
|
|||||
| Total accumulated earnings (losses) |
$ | 5,205,408 | $ | (75,372,358 | ) | |||
|
|
|
|
|
|||||
As of December 31, 2016, unrealized appreciation (depreciation) on a tax basis was as follows:
| Gateway |
Strategic |
|||||||
| Unrealized appreciation (depreciation) |
||||||||
| Investments |
$ | 10,469,243 | $ | (8,431,064 | ) | |||
| Foreign currency translations |
— | (14,229,461 | ) | |||||
|
|
|
|
|
|||||
| Total unrealized appreciation (depreciation) |
$ | 10,469,243 | $ | (22,660,525 | ) | |||
|
|
|
|
|
|||||
69 |
Table of Contents
Notes to Financial Statements (continued)
December 31, 2016
l. Loan Participations. Strategic Alpha Fund may invest in loans to corporate, governmental or other borrowers. The Fund’s investments in loans may be in the form of participations in loans or assignments of all or a portion of loans. A loan is often administered by a bank or other financial institution that acts as agent for all holders. The agent administers the terms of the loan, as specified in the loan agreement. When investing in a loan participation, (i) a Fund has the right to receive payments of principal, interest and any fees to which it is entitled only from the party from whom the Fund has purchased the participation and only upon receipt by that party of payments from the borrower and (ii) a Fund generally has no right to enforce compliance by the borrower with the terms of the loan agreement or to vote on matters arising under the loan agreement. Thus, a Fund may be subject to credit risk both of the party from whom it purchased the loan participation and the borrower and the Fund may have minimal control over the terms of any loan modification. When a Fund purchases assignments from lenders, it acquires direct rights against the borrower on the loan. Loan agreements and participations outstanding at the end of the period, if any, are listed in each applicable Fund’s Schedule of Investments.
m. Repurchase Agreements. Each Fund may enter into repurchase agreements, under the terms of a Master Repurchase Agreement, under which each Fund acquires securities as collateral and agrees to resell the securities at an agreed upon time and at an agreed upon price. It is each Fund’s policy that the market value of the collateral for repurchase agreements be at least equal to 102% of the repurchase price, including interest. Certain repurchase agreements are tri-party arrangements whereby the collateral is held in a segregated account for the benefit of the Fund and on behalf of the counterparty. Repurchase agreements could involve certain risks in the event of default or insolvency of the counterparty, including possible delays or restrictions upon a Fund’s ability to dispose of the underlying securities. As of December 31, 2016, each Fund, as applicable, had investments in repurchase agreements for which the value of the related collateral exceeded the value of the repurchase agreement. The gross value of repurchase agreements is included in the Statements of Assets and Liabilities for financial reporting purposes.
n. When-Issued and Delayed Delivery Transactions. The Funds may enter into when-issued or delayed delivery transactions. When-issued refers to transactions made conditionally because a security, although authorized, has not been issued. Delayed delivery refers to transactions for which delivery or payment will occur at a later date, beyond the normal settlement period. The price of when-issued and delayed delivery securities and the date when the securities will be delivered and paid for are fixed at the time the transaction is negotiated. The security and the obligation to pay for it are recorded by the Funds at the time the commitment is entered into. The value of the security may vary with market fluctuations during the time before the Funds take delivery of the security. No interest accrues to the Funds until the transaction settles.
| 70
Table of Contents
Notes to Financial Statements (continued)
December 31, 2016
Delayed delivery transactions include those designated as To Be Announced (“TBAs”) in the Portfolios of Investments. For TBAs, the actual security that will be delivered to fulfill the transaction is not designated at the time of the trade. The security is “to be announced” 48 hours prior to the established trade settlement date. Certain transactions require the Funds or counterparty to post cash and/or securities as collateral for the net mark-to-market exposure to the other party. The Funds cover their net obligations under outstanding delayed delivery commitments by segregating or earmarking cash or securities at the custodian.
Purchases of when-issued or delayed delivery securities may have a similar effect on the Funds’ NAV as if the Funds’ had created a degree of leverage in the portfolio. Risks may arise upon entering into such transactions from the potential inability of counterparties to meet their obligations under the transactions. Additionally, losses may arise due to changes in the value of the underlying securities.
There were no when-issued or delayed delivery securities held by the Funds as of December 31, 2016.
o. Securities Lending. The Strategic Alpha Fund has entered into an agreement with State Street Bank and Trust Company (“State Street Bank”), as agent of the Fund, to lend securities to certain designated borrowers. The loans are collateralized with cash or securities in an amount equal to at least 105% or 102% of the market value (including accrued interest) of the loaned international or domestic securities, respectively, when the loan is initiated. Thereafter, the value of the collateral must remain at least 102% of the market value (including accrued interest) of loaned securities for U.S. equities and U.S. corporate debt; at least 105% of the market value (including accrued interest) of loaned securities for non-U.S. equities; and at least 100% of the market value (including accrued interest) of loaned securities for U.S. Government securities, sovereign debt issued by non-U.S. Governments and non-U.S. corporate debt. In the event that the market value of the collateral falls below the required percentages described above, the borrower will deliver additional collateral on the next business day. As with other extensions of credit, the Fund may bear the risk of loss with respect to the investment of the collateral. The Fund invests cash collateral in short-term investments, a portion of the income from which is remitted to the borrowers and the remainder allocated between the Fund and State Street Bank as lending agent.
For the year ended December 31, 2016, the Fund did not loan securities under this agreement.
p. Indemnifications. Under the Trusts’ organizational documents, its officers and Trustees are indemnified against certain liabilities arising out of the performance of their duties to the Funds. Additionally, in the normal course of business, the Funds enter into contracts with service providers that contain general indemnification clauses. The Funds’ maximum exposure under these arrangements is unknown as this would involve
71 |
Table of Contents
Notes to Financial Statements (continued)
December 31, 2016
future claims that may be made against the Funds that have not yet occurred. However, based on experience, the Funds expect the risk of loss to be remote.
q. New Accounting Pronouncement. In October 2016, the SEC adopted amendments to rules under the Investment Company Act of 1940 (“final rules”) intended to modernize the reporting and disclosure of information by registered investment companies. The final rules amend Regulation S-X and require funds to provide standardized, enhanced derivative disclosures in fund financial statements in a format designed for individual investors. The amendments to Regulation S-X also update the disclosures for other investments, including investments in and advances to affiliates, and amend the rules regarding the general form and content of fund financial statements. The compliance date for the amendments to Regulation S-X is August 1, 2017. Management is currently evaluating the amendments and the impact, if any, on the Fund’s financial statements.
3. Fair Value Measurements. In accordance with accounting standards related to fair value measurements and disclosures, the Funds have categorized the inputs utilized in determining the value of each Fund’s assets or liabilities. These inputs are summarized in the three broad levels listed below:
| • | Level 1 – quoted prices in active markets for identical assets or liabilities; |
| • | Level 2 – prices determined using other significant inputs that are observable either directly, or indirectly through corroboration with observable market data (which could include quoted prices for similar assets or liabilities, interest rates, credit risk, etc.); and |
| • | Level 3 – prices determined using significant unobservable inputs when quoted prices or observable inputs are unavailable such as when there is little or no market activity for an asset or liability (unobservable inputs reflect each Fund’s own assumptions in determining the fair value of assets or liabilities and would be based on the best information available). |
The inputs or methodology used for valuing securities are not necessarily an indication of the risk associated with investing in those securities.
The Fund’s pricing policies and procedures are recommended by the adviser and approved by the Board of Trustees. Debt securities are valued based on evaluated bids furnished to the Fund by an independent pricing service. Broker-dealer bid prices may be used if an independent pricing service either is unable to price a security or does not provide a reliable price for a security. Broker-dealer bid prices for which the Fund does not have knowledge of the inputs used by the broker-dealer are categorized in Level 3. All security prices, including those obtained from an independent pricing service and broker-dealer bid prices, are reviewed on a daily basis by the adviser, subject to oversight by Fund management and the Board of Trustees. If the adviser, in good faith, believes that the price provided by an independent pricing service is unreliable, broker-dealer bid
| 72
Table of Contents
Notes to Financial Statements (continued)
December 31, 2016
prices may be used until the price provided by the independent pricing service is considered to be reliable. Reliability of all security prices, including those obtained from an independent pricing service and broker-dealer bid prices, is tested in a variety of ways, including comparison to recent transaction prices and daily fluctuations, amongst other validation procedures in place. Securities for which market quotations are not readily available are valued at fair value as determined in good faith by the Fund’s adviser pursuant to procedures approved by the Board of Trustees. Fair valued securities may be categorized in Level 3.
The following is a summary of the inputs used to value the Funds’ investments as of December 31, 2016, at value:
Gateway Equity Call Premium Fund
Asset Valuation Inputs
| Description |
Level 1 |
Level 2 |
Level 3 |
Total |
||||||||||||
| Common Stocks(a) |
$ | 69,217,732 | $ | — | $ | — | $ | 69,217,732 | ||||||||
| Short-Term Investments |
— | 2,790,351 | — | 2,790,351 | ||||||||||||
|
|
|
|
|
|
|
|
|
|||||||||
| Total |
$ | 69,217,732 | $ | 2,790,351 | $ | — | $ | 72,008,083 | ||||||||
|
|
|
|
|
|
|
|
|
|||||||||
| Liability Valuation Inputs | ||||||||||||||||
| Description |
Level 1 |
Level 2 |
Level 3 |
Total |
||||||||||||
| Written Options |
$ | — | $ | (1,358,200 | ) | $ | — | $ | (1,358,200 | ) | ||||||
|
|
|
|
|
|
|
|
|
|||||||||
| (a) | Details of the major categories of the Fund’s investments are reflected within the Portfolio of Investments. |
For the year ended December 31, 2016, there were no transfers among Levels 1, 2 and 3.
73 |
Table of Contents
Notes to Financial Statements (continued)
December 31, 2016
Strategic Alpha Fund
Asset Valuation Inputs
| Description |
Level 1 |
Level 2 |
Level 3 |
Total |
||||||||||||
| Bonds and Notes |
||||||||||||||||
| Non-Convertible Bonds |
||||||||||||||||
| ABS Home Equity |
$ | — | $ | 147,954,418 | $ | 3,187,399 | (b) | $ | 151,141,817 | |||||||
| ABS Other |
— | 33,698,372 | 11,836,146 | (c) | 45,534,518 | |||||||||||
| Banking |
— | 37,531,401 | 2,704,314 | (d) | 40,235,715 | |||||||||||
| Government Owned - No Guarantee |
— | 20,285,143 | 2,180,900 | (d) | 22,466,043 | |||||||||||
| Independent Energy |
— | 58,400,573 | — | (e) | 58,400,573 | |||||||||||
| Non-Agency Commercial Mortgage-Backed Securities |
— | 53,657,265 | 3,349,021 | (d) | 57,006,286 | |||||||||||
| All Other Non-Convertible Bonds(a) |
— | 495,384,682 | — | 495,384,682 | ||||||||||||
|
|
|
|
|
|
|
|
|
|||||||||
| Total Non-Convertible Bonds |
— | 846,911,854 | 23,257,780 | 870,169,634 | ||||||||||||
|
|
|
|
|
|
|
|
|
|||||||||
| Convertible Bonds(a) |
— | 13,857,623 | — | 13,857,623 | ||||||||||||
|
|
|
|
|
|
|
|
|
|||||||||
| Total Bonds and Notes |
— | 860,769,477 | 23,257,780 | 884,027,257 | ||||||||||||
|
|
|
|
|
|
|
|
|
|||||||||
| Senior Loans |
||||||||||||||||
| Wirelines |
— | 3,484,137 | 1,165,800 | (d) | 4,649,937 | |||||||||||
| All Other Senior Loans(a) |
— | 84,489,399 | — | 84,489,399 | ||||||||||||
|
|
|
|
|
|
|
|
|
|||||||||
| Total Senior Loans |
— | 87,973,536 | 1,165,800 | 89,139,336 | ||||||||||||
|
|
|
|
|
|
|
|
|
|||||||||
| Loan Participations(a) |
— | — | 2,256,710 | (d) | 2,256,710 | |||||||||||
| Preferred Stocks |
||||||||||||||||
| Convertible Preferred Stocks |
||||||||||||||||
| Pharmaceuticals |
397,242 | 1,331,496 | — | 1,728,738 | ||||||||||||
| All Other Convertible Preferred Stocks(a) |
5,248,298 | — | — | 5,248,298 | ||||||||||||
|
|
|
|
|
|
|
|
|
|||||||||
| Total Convertible Preferred Stocks |
5,645,540 | 1,331,496 | — | 6,977,036 | ||||||||||||
|
|
|
|
|
|
|
|
|
|||||||||
| Non-Convertible Preferred Stock(a) |
— | 4,242,000 | — | 4,242,000 | ||||||||||||
|
|
|
|
|
|
|
|
|
|||||||||
| Total Preferred Stocks |
5,645,540 | 5,573,496 | — | 11,219,036 | ||||||||||||
|
|
|
|
|
|
|
|
|
|||||||||
| 74
Table of Contents
Notes to Financial Statements (continued)
December 31, 2016
Strategic Alpha Fund (continued)
Asset Valuation Inputs (continued)
| Description |
Level 1 |
Level 2 |
Level 3 |
Total |
||||||||||||
| Common Stocks(a) |
$ | 20,598,477 | $ | — | $ | — | $ | 20,598,477 | ||||||||
| Other Investments(a) |
— | — | 8,840,043 | (f) | 8,840,043 | |||||||||||
| Purchased Options(a) |
— | 873,441 | — | 873,441 | ||||||||||||
| Short-Term Investments |
— | 159,125,186 | — | 159,125,186 | ||||||||||||
|
|
|
|
|
|
|
|
|
|||||||||
| Total Investments |
26,244,017 | 1,114,315,136 | 35,520,333 | 1,176,079,486 | ||||||||||||
|
|
|
|
|
|
|
|
|
|||||||||
| Bilateral Credit Default Swap Agreements (unrealized appreciation) |
— | 18,414 | — | 18,414 | ||||||||||||
| Centrally Cleared Interest Rate Swap Agreements (unrealized appreciation) |
— | 2,174,536 | — | 2,174,536 | ||||||||||||
| Bilateral Interest Rate Swap Agreements (unrealized appreciation) |
— | 1,207,045 | — | 1,207,045 | ||||||||||||
| Forward Foreign Currency Contracts (unrealized appreciation) |
— | 5,246,454 | — | 5,246,454 | ||||||||||||
| Futures Contracts (unrealized appreciation) |
889,830 | — | — | 889,830 | ||||||||||||
|
|
|
|
|
|
|
|
|
|||||||||
| Total |
$ | 27,133,847 | $ | 1,122,961,585 | $ | 35,520,333 | $ | 1,185,615,765 | ||||||||
|
|
|
|
|
|
|
|
|
|||||||||
| Liability Valuation Inputs | ||||||||||||||||
| Description |
Level 1 |
Level 2 |
Level 3 |
Total |
||||||||||||
| Bilateral Credit Default Swap Agreements (unrealized depreciation) |
$ | — | $ | (503,050 | ) | $ | — | $ | (503,050 | ) | ||||||
| Centrally Cleared Credit Default Swap Agreements (unrealized depreciation) |
— | (1,417,198 | ) | — | (1,417,198 | ) | ||||||||||
| Centrally Cleared Interest Rate Swap Agreements (unrealized depreciation) |
— | (203,906 | ) | — | (203,906 | ) | ||||||||||
| Bilateral Interest Rate Swap Agreements (unrealized depreciation) |
— | (2,529,965 | ) | — | (2,529,965 | ) | ||||||||||
| Forward Foreign Currency Contracts (unrealized depreciation) |
— | (2,006,219 | ) | — | (2,006,219 | ) | ||||||||||
| Futures Contracts (unrealized depreciation) |
(729,872 | ) | — | — | (729,872 | ) | ||||||||||
|
|
|
|
|
|
|
|
|
|||||||||
| Total |
$ | (729,872 | ) | $ | (6,660,338 | ) | $ | — | $ | (7,390,210 | ) | |||||
|
|
|
|
|
|
|
|
|
|||||||||
75 |
Table of Contents
Notes to Financial Statements (continued)
December 31, 2016
| (a) | Details of the major categories of the Fund’s investments are reflected within the Portfolio of Investments. |
| (b) | Valued using broker-dealer bid prices ($708,138) or fair valued by the Fund’s adviser ($2,479,261). |
| (c) | Valued using broker-dealer bid prices ($4,627,225) or fair valued by the Fund’s adviser using broker-dealer bid prices for which the inputs are unobservable to the Fund ($7,208,921). |
| (d) | Valued using broker-dealer bid prices. |
| (e) | Fair valued at zero using level 3 inputs. |
| (f) | Fair valued by the Fund’s adviser using broker-dealer bid prices for which the inputs are unobservable to the Fund. |
The following is a reconciliation of Level 3 investments for which significant unobservable inputs were used to determine fair value as of December 31, 2015 and/or December 31, 2016:
Strategic Alpha Fund
Asset Valuation Inputs
| Investments in Securities |
Balance as of |
Accrued |
Realized |
Change in |
Purchases |
|||||||||||||||
| Bonds and Notes |
||||||||||||||||||||
| Non-Convertible Bonds |
||||||||||||||||||||
| ABS Home Equity |
$ | 1,961,377 | $ | — | $ | 33,522 | $ | (31,816 | ) | $ | — | |||||||||
| ABS Other |
13,438,737 | — | 1,779 | (3,032,386 | ) | 5,792,930 | ||||||||||||||
| Banking |
— | (153,258 | ) | — | (96,863 | ) | 2,954,435 | |||||||||||||
| Government Owned - No Guarantee |
— | — | — | 250,900 | 1,930,000 | |||||||||||||||
| Independent Energy |
— | (a) | 310,422 | (310,422 | ) | — | ||||||||||||||
| Non-Agency Commercial Mortgage-Backed Securities |
16,593,700 | — | (9,066 | ) | (77,676 | ) | — | |||||||||||||
| Senior Loans |
||||||||||||||||||||
| Wirelines |
— | 5 | — | 11,595 | 1,154,200 | |||||||||||||||
| Loan Participations |
2,445,609 | — | (1,257 | ) | (20,095 | ) | — | |||||||||||||
| Common Stocks |
||||||||||||||||||||
| Oil, Gas & Consumable Fuels |
— | (a) | — | — | — | — | ||||||||||||||
| Other Investments |
||||||||||||||||||||
| Aircraft ABS |
8,820,000 | — | — | 20,043 | — | |||||||||||||||
|
|
|
|
|
|
|
|
|
|
|
|||||||||||
| Total |
$ | 43,259,423 | $ | 157,169 | $ | 24,978 | $ | (3,286,720 | ) | $ | 11,831,565 | |||||||||
|
|
|
|
|
|
|
|
|
|
|
|||||||||||
| 76
Table of Contents
Notes to Financial Statements (continued)
December 31, 2016
Strategic Alpha Fund (continued)
Asset Valuation Inputs (continued)
| Investments in Securities |
Sales |
Transfers |
Transfers |
Balance as of |
Change
in |
|||||||||||||||
| Bonds and Notes |
||||||||||||||||||||
| Non-Convertible Bonds |
||||||||||||||||||||
| ABS Home Equity |
$ | (951,246 | ) | $ | 2,175,562 | $ | — | $ | 3,187,399 | $ | (31,692 | ) | ||||||||
| ABS Other |
(6,519,178 | ) | 5,267,400 | (3,113,136 | ) | 11,836,146 | (3,091,389 | ) | ||||||||||||
| Banking |
— | — | — | 2,704,314 | (96,863 | ) | ||||||||||||||
| Government Owned - No Guarantee |
— | — | — | 2,180,900 | 250,900 | |||||||||||||||
| Independent Energy |
— | — | — | — | (a) | (310,422 | ) | |||||||||||||
| Non-Agency Commercial Mortgage-Backed Securities |
(3,435,000 | ) | — | (9,722,937 | ) | 3,349,021 | (93,027 | ) | ||||||||||||
| Senior Loans |
||||||||||||||||||||
| Wirelines |
— | — | — | 1,165,800 | 11,595 | |||||||||||||||
| Loan Participations |
(167,547 | ) | — | — | 2,256,710 | (23,028 | ) | |||||||||||||
| Common Stocks |
||||||||||||||||||||
| Oil, Gas & Consumable Fuels |
— | — | — | — | — | |||||||||||||||
| Other Investments |
||||||||||||||||||||
| Aircraft ABS |
— | — | — | 8,840,043 | 20,043 | |||||||||||||||
|
|
|
|
|
|
|
|
|
|
|
|||||||||||
| Total |
$ | (11,072,971 | ) | $ | 7,442,962 | $ | (12,836,073 | ) | $ | 35,520,333 | $ | (3,363,883 | ) | |||||||
|
|
|
|
|
|
|
|
|
|
|
|||||||||||
| (a) | Fair valued at zero. |
Debt securities valued at $1,308,689 were transferred from Level 2 to Level 3 during the period ended December 31, 2016. At December 31, 2015, these securities were valued on the basis of evaluated bids furnished to the Fund by an independent pricing service in accordance with the Fund’s valuation policies. At December 31, 2016, these securities were valued at fair value as determined in good faith by the Fund’s adviser as an independent pricing service did not provide a reliable price for the securities.
Debt securities valued at $6,134,273 were transferred from Level 2 to Level 3 during the period ended December 31, 2016. At December 31, 2015, these securities were valued
77 |
Table of Contents
Notes to Financial Statements (continued)
December 31, 2016
on the basis of evaluated bids furnished to the Fund by an independent pricing service in accordance with the Fund’s valuation policies. At December 31, 2016, these securities were valued using broker-dealer bid prices based on inputs unobservable to the Fund as an independent pricing service was unable to price the securities.
Debt securities valued at $12,836,073 were transferred from Level 3 to Level 2 during the period ended December 31, 2016. At December 31, 2015, these securities were valued using broker-dealer bid prices based on inputs unobservable to the Fund as an independent pricing service was unable to price the securities. At December 31, 2016, these securities were valued on the basis of evaluated bids furnished to the Fund by an independent pricing service in accordance with the Fund’s valuation policies.
All transfers are recognized as of the beginning of the reporting period.
4. Derivatives. Derivative instruments are defined as financial instruments whose value and performance are based on the value and performance of an underlying asset, reference rate or index. Derivative instruments that the Funds used during the period include forward foreign currency contracts, futures contracts, option contracts, swaptions and swap agreements.
Gateway Equity Call Premium Fund seeks to capture the majority of the returns associated with equity market investments, while exposing investors to less risk than other equity investments. To meet this investment goal, the Fund invests in a broadly diversified portfolio of common stocks, while also writing index call options. Writing index call options can reduce the Fund’s volatility, provide a steady cash flow and be an important source of the Fund’s return, although it also may reduce the Fund’s ability to profit from increases in the value of its equity portfolio. The combination of the diversified stock portfolio and the steady cash flow from writing of index call options is intended to moderate the volatility of returns relative to an all-equity portfolio. During the year ended December 31, 2016, written index call options were used in accordance with this objective.
Strategic Alpha Fund seeks to achieve positive total returns over a full market cycle. The Fund pursues its objective by utilizing a flexible investment approach that allocates investments across a global range of investment opportunities related to credit, currencies and interest rates, while employing risk management techniques to mitigate downside risk. At times, the Fund expects to gain its investment exposure substantially through the use of derivatives, including forward foreign currency contracts, futures and option contracts, interest rate swaptions and swap agreements. During the year ended December 31, 2016, the Fund used futures, forward foreign currency and option contracts, swaptions, interest rate swap agreements and credit default swap agreements (as a protection seller) to gain investment exposures in accordance with its objective.
Strategic Alpha Fund is subject to the risk that changes in foreign currency exchange rates will have an unfavorable effect on the value of Fund assets denominated in
| 78
Table of Contents
Notes to Financial Statements (continued)
December 31, 2016
foreign currencies. The Fund may enter into forward foreign currency exchange contracts and option contracts for hedging purposes to protect the value of the Fund’s holdings of foreign securities. During the year ended December 31, 2016, the Fund engaged in forward foreign currency and option contracts for hedging purposes.
Strategic Alpha Fund is subject to the risk that companies in which the Fund invests will fail financially or otherwise be unwilling or unable to meet their obligations to the Fund. The Fund may use credit default swaps, as a protection buyer, to hedge its credit exposure to issuers of bonds it holds without having to sell the bonds. During the year ended December 31, 2016, the Fund engaged in credit default swap transactions (as a protection buyer) to hedge its credit exposure.
Strategic Alpha Fund is subject to the risk of unpredictable declines in the value of individual equity securities and periods of below-average performance in individual securities or in the equity market as a whole. The Fund may use futures contracts, purchased put options and written call options to hedge against a decline in value of an equity security that it owns. The Fund may also write put options to offset the cost of options used for hedging purposes. During the year ended December 31, 2016, the Fund engaged in futures and option contracts for hedging purposes.
The following is a summary of derivative instruments for Gateway Equity Call Premium Fund as of December 31, 2016, as reflected within the Statements of Assets and Liabilities:
| Liabilities |
Options written | |
| Exchange-traded/cleared liability derivatives |
||
| Equity contracts |
$(1,358,200) |
Transactions in derivative instruments for Gateway Equity Call Premium Fund during the year ended December 31, 2016, as reflected within the Statements of Operations, were as follows:
| Net Realized Gain (Loss) on: |
Options written | |
| Equity contracts |
$(1,679,523) |
| Net Change in Unrealized Appreciation |
Options written | |
| Equity contracts |
$(775,949) |
79 |
Table of Contents
Notes to Financial Statements (continued)
December 31, 2016
The following is a summary of derivative instruments for Strategic Alpha Fund as of December 31, 2016, as reflected within the Statements of Assets and Liabilities:
| Assets |
Investments |
Unrealized |
Swap |
Unrealized |
Total |
|||||||||||||||
| Over-the-counter asset derivatives |
||||||||||||||||||||
| Interest rate contracts |
$ | — | $ | — | $ | 1,207,045 | $ | — | $ | 1,207,045 | ||||||||||
| Foreign exchange contracts |
873,441 | 5,246,454 | — | — | 6,119,895 | |||||||||||||||
| Credit contracts |
— | — | 1,201,734 | — | 1,201,734 | |||||||||||||||
|
|
|
|
|
|
|
|
|
|
|
|||||||||||
| Total over-the-counter asset derivatives |
$ | 873,441 | $ | 5,246,454 | $ | 2,408,779 | $ | — | $ | 8,528,674 | ||||||||||
|
|
|
|
|
|
|
|
|
|
|
|||||||||||
| Exchange-traded/ cleared asset derivatives |
||||||||||||||||||||
| Interest rate contracts |
$ | — | $ | — | $ | 2,174,536 | $ | 889,830 | $ | 3,064,366 | ||||||||||
|
|
|
|
|
|
|
|
|
|
|
|||||||||||
| Total exchange-traded/cleared asset derivatives |
$ | — | $ | — | $ | 2,174,536 | $ | 889,830 | $ | 3,064,366 | ||||||||||
|
|
|
|
|
|
|
|
|
|
|
|||||||||||
| Total asset derivatives |
$ | 873,441 | $ | 5,246,454 | $ | 4,583,315 | $ | 889,830 | $ | 11,593,040 | ||||||||||
|
|
|
|
|
|
|
|
|
|
|
|||||||||||
| Liabilities |
Unrealized |
Swap |
Unrealized |
Total |
||||||||||||
| Over-the-counter liability derivatives |
||||||||||||||||
| Interest rate contracts |
$ | — | $ | (2,529,965 | ) | $ | — | $ | (2,529,965 | ) | ||||||
| Foreign exchange contracts |
(2,006,219 | ) | — | — | (2,006,219 | ) | ||||||||||
| Credit contracts |
— | (40,962 | ) | — | (40,962 | ) | ||||||||||
|
|
|
|
|
|
|
|
|
|||||||||
| Total over-the-counter liability derivatives |
$ | (2,006,219 | ) | $ | (2,570,927 | ) | $ | — | $ | (4,577,146 | ) | |||||
|
|
|
|
|
|
|
|
|
|||||||||
| Exchange-traded/cleared liability derivatives |
||||||||||||||||
| Interest rate contracts |
$ | — | $ | (203,906 | ) | $ | (561,024 | ) | $ | (764,930 | ) | |||||
| Credit contracts |
— | (3,674,240 | ) | — | (3,674,240 | ) | ||||||||||
| Equity contracts |
— | — | (168,848 | ) | (168,848 | ) | ||||||||||
|
|
|
|
|
|
|
|
|
|||||||||
| Total exchange-traded/cleared liability derivatives |
$ | — | $ | (3,878,146 | ) | $ | (729,872 | ) | $ | (4,608,018 | ) | |||||
|
|
|
|
|
|
|
|
|
|||||||||
| Total liability derivatives |
$ | (2,006,219 | ) | $ | (6,449,073 | ) | $ | (729,872 | ) | $ | (9,185,164 | ) | ||||
|
|
|
|
|
|
|
|
|
|||||||||
| 1 | Represents purchased options, at value. |
| 80
Table of Contents
Notes to Financial Statements (continued)
December 31, 2016
| 2 | Represents swap agreements, at value. Market value of swap agreements is reported in the Portfolio of Investments along with the unamortized upfront premium paid (received), if any, and unrealized appreciation (depreciation) on each individual contract. Unrealized appreciation (depreciation) and upfront premiums paid (received) are reported within the Statements of Assets and Liabilities. |
| 3 | Represents cumulative unrealized appreciation (depreciation) on futures contracts. Only the current day’s variation margin on futures contracts is reported within the Statements of Assets and Liabilities as receivable or payable for variation margin, as applicable. |
Transactions in derivative instruments for Strategic Alpha Fund during the year ended December 31, 2016, as reflected in the Statements of Operations were as follows:
| Net Realized Gain |
Investments4 |
Futures |
Options/ |
Swap |
Foreign |
|||||||||||||||
| Interest rate contracts |
$ | (4,113,923 | ) | $ | (5,136,751 | ) | $ | 1,783,740 | $ | 2,199,856 | $ | — | ||||||||
| Foreign exchange contracts |
293,631 | — | — | — | (14,451,328 | ) | ||||||||||||||
| Credit contracts |
— | — | — | (4,140,441 | ) | — | ||||||||||||||
| Equity contracts |
(86,169 | ) | 455,977 | (1,861,846 | ) | — | — | |||||||||||||
|
|
|
|
|
|
|
|
|
|
|
|||||||||||
| Total |
$ | (3,906,461 | ) | $ | (4,680,774 | ) | $ | (78,106 | ) | $ | (1,940,585 | ) | $ | (14,451,328 | ) | |||||
|
|
|
|
|
|
|
|
|
|
|
|||||||||||
| Net Change in |
Investments4 |
Futures |
Options/ |
Swap |
Foreign |
|||||||||||||||
| Interest rate contracts |
$ | 2,067,739 | $ | 1,052,822 | $ | (1,204,936 | ) | $ | (2,310,678 | ) | $ | — | ||||||||
| Foreign exchange contracts |
(585,760 | ) | — | — | — | 4,378,363 | ||||||||||||||
| Credit contracts |
— | — | — | (1,313,810 | ) | — | ||||||||||||||
| Equity contracts |
26,553 | 306,334 | — | — | — | |||||||||||||||
|
|
|
|
|
|
|
|
|
|
|
|||||||||||
| Total |
$ | 1,508,532 | $ | 1,359,156 | $ | (1,204,936 | ) | $ | (3,624,488 | ) | $ | 4,378,363 | ||||||||
|
|
|
|
|
|
|
|
|
|
|
|||||||||||
| 4 | Represents realized gain (loss) and change in unrealized appreciation (depreciation), respectively, for purchased options/swaptions during the period. |
| 5 | Represents realized loss and change in unrealized appreciation (depreciation), respectively, for forward foreign currency contracts during the period. Does not include other foreign currency gains or losses included in the Statement of Operations. |
As the Funds value their derivatives at fair value and recognize changes in fair value through the Statements of Operations, they do not qualify for hedge accounting under authoritative guidance for derivative instruments. The Funds’ investments in derivatives may represent an economic hedge; however, they are considered to be non-hedge transactions for the purpose of these disclosures.
81 |
Table of Contents
Notes to Financial Statements (continued)
December 31, 2016
The volume of option contract activity, as a percentage of investments in common stocks, for Gateway Equity Call Premium Fund, based on month-end notional amounts outstanding during the period, at absolute value, was as follows for the year ended December 31, 2016:
| Gateway Equity Call Premium Fund |
Call Options |
|||
| Average Notional Amount Outstanding |
98.95 | % | ||
| Highest Notional Amount Outstanding |
99.15 | % | ||
| Lowest Notional Amount Outstanding |
98.70 | % | ||
| Notional Amount Outstanding as of December 31, 2016 |
98.97 | % | ||
| * | Notional amounts outstanding are determined by multiplying option contracts by the contract multiplier by the price of the option’s underlying index, the S&P 500® Index. |
The volume of forward foreign currency contract, futures contract and swap agreement activity, as a percentage of net assets for Strategic Alpha Fund, based on gross month-end notional amounts outstanding during the period, including long and short positions at absolute value, was as follows for the year ended December 31, 2016:
| Strategic Alpha Fund |
Forwards |
Futures |
Credit |
Interest |
||||||||||||
| Average Notional Amount Outstanding |
37.88 | % | 61.42 | % | 6.59 | % | 41.37 | % | ||||||||
| Highest Notional Amount Outstanding |
59.34 | % | 99.15 | % | 11.73 | % | 101.50 | % | ||||||||
| Lowest Notional Amount Outstanding |
27.73 | % | 11.63 | % | 1.66 | % | 1.85 | % | ||||||||
| Notional Amount Outstanding as of December 31, 2016 |
34.40 | % | 17.05 | % | 9.50 | % | 56.25 | % | ||||||||
Notional amounts outstanding at the end of the prior period, if applicable, are included in the averages above.
Unrealized gain and/or loss on open forwards, futures and swaps is recorded in the Statements of Assets and Liabilities. The aggregate notional values of forward, futures and swap contracts are not recorded in the Statements of Assets and Liabilities, and therefore are not included in the Fund’s net assets.
| 82
Table of Contents
Notes to Financial Statements (continued)
December 31, 2016
The volume of option contract activity, as a percentage of net assets for Strategic Alpha Fund, based on the month-end market values of instruments underlying purchased and written options, at absolute value, was as follows for the year ended December 31, 2016:
| Strategic Alpha Fund |
Call |
Put |
Call |
Put |
||||||||||||
| Average Market Value of Underlying Instruments |
4.78 | % | 3.27 | % | 2.08 | % | 0.38 | % | ||||||||
| Highest Market Value of Underlying Instruments |
12.05 | % | 7.24 | % | 11.06 | % | 4.84 | % | ||||||||
| Lowest Market Value of Underlying Instruments |
0.00 | % | 2.11 | % | 0.00 | % | 0.00 | % | ||||||||
| Market Value of Underlying Instruments as of December 31, 2016 |
3.35 | % | 3.29 | % | 0.00 | % | 0.00 | % | ||||||||
| * | Market value of underlying instruments is determined as follows: for securities by multiplying option shares by the price of the option’s underlying security, for currencies by multiplying par value by the strike price and dividing by the foreign currency exchange rate and for foreign indices by multiplying the number of contracts by the contract multiplier by the price of the underlying index and dividing by the foreign currency exchange rate. |
The volume of interest rate swaption activity, as a percentage of net assets for Strategic Alpha Fund, based on average premiums paid or received during the period, including long and short positions at absolute value, was as follows for the year ended December 31, 2016:
| Strategic Alpha Fund |
Interest |
Interest |
Interest |
|||||||||
| Average Premium Paid/Received |
0.07 | % | 0.23 | % | 0.10 | % | ||||||
| Highest Premium Paid/Received |
0.14 | % | 0.34 | % | 0.15 | % | ||||||
| Lowest Premium Paid/Received |
0.00 | % | 0.00 | % | 0.00 | % | ||||||
| Premium Paid/Received as of December 31, 2016 |
0.00 | % | 0.00 | % | 0.00 | % | ||||||
83 |
Table of Contents
Notes to Financial Statements (continued)
December 31, 2016
The following is a summary of Gateway Equity Call Premium Fund’s written option activity:
| Gateway Equity Call Premium Fund |
Number of |
Premiums |
||||||
| Outstanding at December 31, 2015 |
252 | $ | 1,260,695 | |||||
| Options written |
3,252 | 11,725,016 | ||||||
| Options terminated in closing purchase transactions |
(3,151 | ) | (11,702,746 | ) | ||||
| Options expired |
(47 | ) | (65,679 | ) | ||||
|
|
|
|
|
|||||
| Outstanding at December 31, 2016 |
306 | $ | 1,217,286 | |||||
|
|
|
|
|
|||||
The following is a summary of Strategic Alpha Fund’s written option activity:
| Strategic Alpha Fund |
Number of |
Premiums |
||||||
| Outstanding at December 31, 2015 |
— | $ | — | |||||
| Options written |
18,167 | 3,041,285 | ||||||
| Options terminated in closing purchase transactions |
(8,928 | ) | (2,713,469 | ) | ||||
| Options expired |
(9,239 | ) | (327,816 | ) | ||||
| Options assigned |
— | — | ||||||
|
|
|
|
|
|||||
| Outstanding at December 31, 2016 |
— | $ | — | |||||
|
|
|
|
|
|||||
The following is a summary of Strategic Alpha Fund’s written interest rate swaption activity:
| Strategic Alpha Fund |
Notional |
Premiums |
||||||
| Outstanding at December 31, 2015 |
$ | 130,200,000 | $ | 1,783,740 | ||||
| Swaptions expired |
(130,200,000 | ) | (1,783,740 | ) | ||||
| Swaptions terminated in closing purchase transactions |
— | — | ||||||
|
|
|
|
|
|||||
| Outstanding at December 31, 2016 |
$ | — | $ | — | ||||
|
|
|
|
|
|||||
OTC derivatives, including forward foreign currency contracts, options, interest rate swaptions and swap agreements, are entered into pursuant to International Swaps and Derivatives Association, Inc. (“ISDA”) agreements negotiated between the Funds and their counterparties. ISDA agreements typically contain, among other things, terms for the posting of collateral and master netting provisions in the event of a default or other termination event. Collateral is posted by a Fund or the counterparty to the extent of the net mark-to-market exposure to the other party of all open contracts under the agreement, subject to minimum transfer requirements. Master netting provisions allow
| 84
Table of Contents
Notes to Financial Statements (continued)
December 31, 2016
the Funds and the counterparty, in the event of a default or other termination event, to offset amounts owed by each related to derivative contracts, including any posted collateral, to one net amount payable by either the Funds or the counterparty. The Funds’ ISDA agreements typically contain provisions that allow a counterparty to terminate open contracts early if the NAV of a Fund declines beyond a certain threshold. For financial reporting purposes, the Funds do not offset derivative assets and liabilities, and any related collateral received or pledged, on the Statements of Assets and Liabilities.
As of December 31, 2016, gross amounts of OTC derivative assets and liabilities not offset in the Statements of Assets and Liabilities and the related net amounts after taking into account master netting arrangements, by counterparty, are as follows:
Strategic Alpha Fund
| Counterparty |
Gross Amounts |
Offset |
Net |
Collateral |
Net |
|||||||||||||||
| Bank of America, N.A. |
$ | 4,306,787 | $ | (2,397,158 | ) | $ | 1,909,629 | $ | (1,909,629 | ) | $ | — | ||||||||
| Barclays Bank PLC |
334,876 | (20,481 | ) | 314,395 | (289,630 | ) | 24,765 | |||||||||||||
| Commonwealth Bank of Australia Sydney |
591,027 | — | 591,027 | — | 591,027 | |||||||||||||||
| Deutsche Bank AG |
1,331,514 | (604,184 | ) | 727,330 | (727,330 | ) | — | |||||||||||||
| JPMorgan Chase Bank, N.A. |
341,483 | (20,481 | ) | 321,002 | (321,002 | ) | — | |||||||||||||
| Morgan Stanley Capital Services, Inc. |
1,622,987 | (940,052 | ) | 682,935 | — | 682,935 | ||||||||||||||
|
|
|
|
|
|
|
|
|
|
|
|||||||||||
| $ | 8,528,674 | $ | (3,982,356 | ) | $ | 4,546,318 | $ | (3,247,591 | ) | $ | 1,298,727 | |||||||||
|
|
|
|
|
|
|
|
|
|
|
|||||||||||
| Counterparty |
Gross Amounts |
Offset |
Net |
Collateral |
Net |
|||||||||||||||
| Bank of America, N.A. |
$ | (2,397,158 | ) | $ | 2,397,158 | $ | — | $ | — | $ | — | |||||||||
| Barclays Bank PLC |
(20,481 | ) | 20,481 | — | — | — | ||||||||||||||
| Credit Suisse International |
(594,790 | ) | — | (594,790 | ) | 594,790 | — | |||||||||||||
| Deutsche Bank AG |
(604,184 | ) | 604,184 | — | — | — | ||||||||||||||
| JPMorgan Chase Bank, N.A. |
(20,481 | ) | 20,481 | — | — | — | ||||||||||||||
| Morgan Stanley Capital Services, Inc. |
(940,052 | ) | 940,052 | — | — | — | ||||||||||||||
|
|
|
|
|
|
|
|
|
|
|
|||||||||||
| $ | (4,577,146 | ) | $ | 3,982,356 | $ | (594,790 | ) | $ | 594,790 | $ | — | |||||||||
|
|
|
|
|
|
|
|
|
|
|
|||||||||||
85 |
Table of Contents
Notes to Financial Statements (continued)
December 31, 2016
The actual collateral received or pledged, if any, may exceed the amounts shown in the table due to overcollateralization. Timing differences may exist between when contracts under the ISDA agreements are marked-to-market and when collateral moves. The ISDA agreements include tri-party control agreements under which collateral is held for the benefit of the secured party at a third party custodian, State Street Bank.
Counterparty risk is managed based on policies and procedures established by each Fund’s adviser. Such policies and procedures may include, but are not limited to, minimum counterparty credit rating requirements, monitoring of counterparty credit default swap spreads and posting of collateral. A Fund’s risk of loss from counterparty credit risk on OTC derivatives is generally limited to the Fund’s aggregated unrealized gains and the amount of any collateral pledged to the counterparty, which may be offset by any collateral posted to the Fund by the counterparty. ISDA master agreements can help to manage counterparty risk by specifying collateral posting arrangements at pre-arranged exposure levels. Under these ISDA agreements, collateral is routinely transferred if the total net exposure in respect of certain transactions, net of existing collateral already in place, exceeds a specified amount (typically $250,000, depending on the counterparty). With exchange-traded derivatives, there is minimal counterparty credit risk to the Fund because the exchange’s clearinghouse, as counterparty to these instruments, stands between the buyer and the seller of the contract. Credit risk still exists in exchange-traded derivatives with respect to initial and variation margin that is held in a broker’s customer accounts. While brokers are required to segregate customer margin from their own assets, in the event that a broker becomes insolvent or goes into bankruptcy and at that time there is a shortfall in the aggregate amount of margin held by the broker for all its clients, U.S. bankruptcy laws will typically allocate that shortfall on a pro rata basis across all of the broker’s customers, potentially resulting in losses to the Fund. Based on balances reflected on each Fund’s Statement of Assets and Liabilities, the following table shows (i) the maximum amount of loss due to credit risk that, based on the gross fair value of the financial instrument, the applicable Fund would incur if parties (including OTC derivative counterparties and brokers holding margin for exchange-traded derivatives) to the relevant financial instruments failed completely to perform according to the terms of the contracts and the collateral or other security, if any, for the amount due proved to be of no value to the Fund, and (ii) the amount of loss that the applicable Fund would incur after taking into account master netting provisions pursuant to ISDA agreements, as of December 31, 2016:
| Fund |
Maximum Amount of Loss - Gross |
Maximum Amount of Loss - Net |
||||||
| Strategic Alpha Fund |
$ | 24,052,794 | $ | 16,228,057 | ||||
| 86
Table of Contents
Notes to Financial Statements (continued)
December 31, 2016
These amounts include cash and U.S. government and agency securities received as collateral of $4,099,630. U.S. government and agency securities received as collateral are valued in accordance with the Fund’s valuation policies and are recorded on the Statements of Assets and Liabilities.
5. Purchases and Sales of Securities. For the year ended December 31, 2016, purchases and sales of securities (excluding short-term investments and option/swaption contracts and including paydowns) were as follows:
| U.S. Government/ Agency Securities |
Other Securities | |||||||||||||||
| Fund |
Purchases |
Sales |
Purchases |
Sales |
||||||||||||
| Gateway Equity Call Premium Fund |
$ | — | $ | — | $ | 25,694,211 | $ | 15,577,838 | ||||||||
| Strategic Alpha Fund |
— | 82,315,731 | 769,661,876 | 1,100,921,610 | ||||||||||||
6. Management Fees and Other Transactions with Affiliates.
a. Management Fees. Gateway Investment Advisers, LLC (“Gateway Advisers”) serves as investment adviser to Gateway Equity Call Premium Fund. Gateway Advisers is a subsidiary of Natixis Global Asset Management, L.P. (“Natixis US”), which is part of Natixis Global Asset Management, an international asset management group based in Paris, France. Under the terms of the management agreement, the Fund pays a management fee at the annual rate of 0.65%, calculated daily and payable monthly, based on the Fund’s average daily net assets.
Loomis, Sayles & Company, L.P. (“Loomis Sayles”) is the investment adviser to Strategic Alpha Fund. Loomis Sayles’ general partner is indirectly owned by Natixis US. Under the terms of the management agreement, the Fund pays a management fee at the annual rate of 0.70% of the Fund’s average daily net assets, calculated daily and payable monthly.
Gateway Advisers and Loomis Sayles have given binding undertakings to the Funds to waive management fees and/or reimburse certain expenses to limit the Funds’ operating expenses, exclusive of acquired fund fees and expenses, brokerage expenses, interest expense, taxes, organizational and extraordinary expenses such as litigation and indemnification expenses. These undertakings are in effect until April 30, 2017, may be terminated before then only with the consent of the Funds’ Board of Trustees, and are reevaluated on an annual basis. Management fees payable, as reflected on the Statements of Assets and Liabilities, is net of waivers and/or expense reimbursements, if any, pursuant to these undertakings. Waivers/reimbursements that exceed management fees payable are reflected on the Statements of Assets and Liabilities as receivable from investment adviser.
87 |
Table of Contents
Notes to Financial Statements (continued)
December 31, 2016
For the year ended December 31, 2016, the expense limits as a percentage of average daily net assets under the expense limitation agreements were as follows:
| Expense Limit as a Percentage of Average Daily Net Assets |
||||||||||||
| Fund |
Class A |
Class C |
Class Y |
|||||||||
| Gateway Equity Call Premium Fund |
1.20 | % | 1.95 | % | 0.95 | % | ||||||
| Strategic Alpha Fund |
1.30 | % | 2.05 | % | 1.05 | % | ||||||
Gateway Advisers and Loomis Sayles shall be permitted to recover expenses they have borne under the expense limitation agreements (whether through waiver of its management fees or otherwise) on a class by class basis in later periods to the extent the annual operating expenses of a class fall below a class’ expense limits, provided, however, that a class is not obligated to pay such waived/reimbursed fees or expenses more than one year after the end of the fiscal year in which the fees or expenses were waived/reimbursed.
For the year ended December 31, 2016, the management fees and waivers of management fees for each Fund were as follows:
| Gross |
Waivers
of |
Net |
Percentage of Average Daily Net Assets |
|||||||||||||||||
| Fund |
Gross |
Net |
||||||||||||||||||
| Gateway Equity Call Premium Fund |
$ | 420,410 | $ | 69,968 | $ | 350,442 | 0.65 | % | 0.54 | % | ||||||||||
| Strategic Alpha Fund |
8,505,759 | — | 8,505,759 | 0.70 | % | 0.70 | % | |||||||||||||
| 1 | Management fee waivers are subject to possible recovery until December 31, 2017. |
No expenses were recovered for either Fund during the year ended December 31, 2016 under the terms of the expense limitation agreements.
b. Service and Distribution Fees. NGAM Distribution, L.P. (“NGAM Distribution”), which is a wholly-owned subsidiary of Natixis US, has entered into a distribution agreement with the Trusts. Pursuant to this agreement, NGAM Distribution serves as principal underwriter of the Funds of the Trusts.
Pursuant to Rule 12b-1 under the 1940 Act, the Trusts have adopted a Service Plan relating to each Fund’s Class A shares (the “Class A Plans”) and a Distribution and Service Plan relating to each Fund’s Class C shares (the “Class C Plans”).
Under the Class A Plans, each Fund pays NGAM Distribution a monthly service fee at an annual rate not to exceed 0.25% of the average daily net assets attributable to the
| 88
Table of Contents
Notes to Financial Statements (continued)
December 31, 2016
Fund’s Class A shares, as reimbursement for expenses incurred by NGAM Distribution in providing personal services to investors in Class A shares and/or the maintenance of shareholder accounts.
Under the Class C Plans, each Fund pays NGAM Distribution a monthly service fee at an annual rate not to exceed 0.25% of the average daily net assets attributable to the Fund’s Class C shares, as compensation for services provided by NGAM Distribution in providing personal services to investors in Class C shares and/or the maintenance of shareholder accounts.
Also under the Class C Plans, each Fund pays NGAM Distribution a monthly distribution fee at the annual rate of 0.75% of the average daily net assets attributable to the Fund’s Class C shares, as compensation for services provided by NGAM Distribution in connection with the marketing or sale of Class C shares.
For the year ended December 31, 2016, the service and distribution fees for each Fund were as follows:
| Service Fees | Distribution Fees | |||||||||||
| Fund |
Class A |
Class C |
Class C |
|||||||||
| Gateway Equity Call Premium Fund |
$ | 14,469 | $ | 325 | $ | 976 | ||||||
| Strategic Alpha Fund |
189,156 | 131,069 | 393,205 | |||||||||
c. Administrative Fees. NGAM Advisors provides certain administrative services for the Funds and contracts with State Street Bank to serve as sub-administrator. Pursuant to an agreement among Natixis Funds Trusts, Loomis Sayles Funds Trusts and NGAM Advisors, each Fund pays NGAM Advisors monthly its pro rata portion of fees equal to an annual rate of 0.0575% of the first $15 billion of the average daily net assets of the Natixis Funds Trusts and Loomis Sayles Funds Trusts, 0.0500% of the next $15 billion, 0.0400% of the next $30 billion, 0.0350% of the next $30 billion and 0.0325% of such assets in excess of $90 billion, subject to an annual aggregate minimum fee for the Natixis Funds Trusts and Loomis Sayles Funds Trusts of $10 million, which is reevaluated on an annual basis.
For the year ended December 31, 2016, the administrative fees for each Fund were as follows:
| Fund |
Administrative |
|||
| Gateway Equity Call Premium Fund |
$ | 28,710 | ||
| Strategic Alpha Fund |
539,257 | |||
d. Sub-Transfer Agent Fees. NGAM Distribution has entered into agreements, which include servicing agreements, with financial intermediaries that provide recordkeeping, processing, shareholder communications and other services to customers of the intermediaries that hold positions in the Funds and has agreed to
89 |
Table of Contents
Notes to Financial Statements (continued)
December 31, 2016
compensate the intermediaries for providing those services. Intermediaries transact with the Funds primarily through the use of omnibus accounts on behalf of their customers who hold positions in the Funds. These services would have been provided by the Funds’ transfer agent and other service providers if the shareholders’ accounts were maintained directly at the Funds’ transfer agent. Accordingly, the Funds have agreed to reimburse NGAM Distribution for all or a portion of the servicing fees paid to these intermediaries. The reimbursement amounts (sub-transfer agent fees) paid to NGAM Distribution are subject to a current per-account equivalent fee limit approved by the Funds’ Board of Trustees, which is based on fees for similar services paid to the Funds’ transfer agent and other service providers.
For the year ended December 31, 2016, the sub-transfer agent fees (which are reflected in transfer agent fees and expenses in the Statements of Operations) for each Fund were as follows:
| Fund |
Sub-Transfer |
|||
| Gateway Equity Call Premium Fund |
$ | 28,321 | ||
| Strategic Alpha Fund |
810,293 | |||
As of December 31, 2016, the Funds owe NGAM Distribution the following reimbursements for sub-transfer agent fees (which are reflected in the Statements of Assets and Liabilities as payable to distributor):
| Fund |
Reimbursements |
|||
| Gateway Equity Call Premium Fund |
$ | 393 | ||
| Strategic Alpha Fund |
9,984 | |||
e. Commissions. Commissions (including CDSCs) on Fund shares retained by NGAM Distribution during the year ended December 31, 2016 were as follows:
| Fund |
Commissions |
|||
| Strategic Alpha Fund |
$ | 5,542 | ||
f. Trustees Fees and Expenses. The Trusts do not pay any compensation directly to their officers or Trustees who are directors, officers or employees of NGAM Advisors, NGAM Distribution, Natixis US or their affiliates. The Chairperson of the Board of Trustees receives a retainer fee at the annual rate of $325,000. The Chairperson does not receive any meeting attendance fees for Board of Trustees meetings or committee meetings that she attends. Each Independent Trustee (other than the Chairperson) receives, in the aggregate, a retainer fee at the annual rate of $155,000. Each Independent Trustee also receives a meeting attendance fee of $10,000 for each meeting of the Board of Trustees
| 90
Table of Contents
Notes to Financial Statements (continued)
December 31, 2016
that he or she attends in person and $5,000 for each meeting of the Board of Trustees that he or she attends telephonically. In addition, the chairperson of the Contract Review Committee and the chairperson of the Audit Committee each receive an additional retainer fee at the annual rate of $17,500. The chairperson of the Governance Committee receives an additional retainer fee at the annual rate of $10,000. Each Contract Review Committee member is compensated $6,000 for each Committee meeting that he or she attends in person and $3,000 for each meeting that he or she attends telephonically. Each Audit Committee member is compensated $6,000 for each Committee meeting that he or she attends in person and $3,000 for each meeting that he or she attends telephonically. These fees are allocated among the funds in the Natixis Funds Trusts and Loomis Sayles Funds Trusts based on a formula that takes into account, among other factors, the relative net assets of each fund. Trustees are reimbursed for travel expenses in connection with attendance at meetings.
A deferred compensation plan (the “Plan”) is available to the Trustees on a voluntary basis. Deferred amounts remain in the Funds until distributed in accordance with the provisions of the Plan. The value of a participating Trustee’s deferral account is based on theoretical investments of deferred amounts, on the normal payment dates, in certain funds of the Natixis Funds Trusts and Loomis Sayles Funds Trusts as designated by the participating Trustees. Changes in the value of participants’ deferral accounts are allocated pro rata among the funds in the Natixis Funds Trusts and Loomis Sayles Funds Trusts, and are normally reflected as Trustees’ fees and expenses in the Statements of Operations. The portions of the accrued obligations allocated to the Funds under the Plan are reflected as Deferred Trustees’ fees in the Statements of Assets and Liabilities.
g. Affiliated Ownership. As of December 31, 2016, Loomis Sayles Employees’ Profit Sharing Retirement Plan held shares of Strategic Alpha Fund representing 0.10% of the Fund’s net assets.
7. Line of Credit. Effective April 14, 2016, each Fund, together with certain other funds of Natixis Funds Trusts and Loomis Sayles Funds Trusts, entered into a 364-day, $400,000,000 syndicated, committed, unsecured line of credit with Citibank, N.A. to be used for temporary or emergency purposes only. Any one Fund may borrow up to the full $400,000,000 under the line of credit (as long as all borrowings by all Funds in the aggregate do not exceed the $400,000,000 limit at any time), subject to each Fund’s investment restrictions. Interest is charged to the Funds at a rate equal to the greater of the eurodollar or the federal funds rate plus 1.00%. In addition, a commitment fee of 0.10% per annum, payable on the last business day of each month, is accrued and apportioned among the participating funds based on their average daily unused portion of the line of credit. The Funds paid an arrangement fee, an upfront fee, and other fees in connection with the new line of credit agreement, which are being amortized over a period of 364 days and are reflected as miscellaneous expenses on the Statements of Operations. The unamortized balance is reflected as prepaid expenses on the Statements of Assets and Liabilities.
91 |
Table of Contents
Notes to Financial Statements (continued)
December 31, 2016
Prior to April 14, 2016 each Fund, together with certain other funds of Natixis Funds Trusts and Loomis Sayles Funds Trusts, participated in a $150,000,000 committed unsecured line of credit provided by State Street Bank. Any one Fund was able to borrow up to the full $150,000,000 under the line of credit (as long as all borrowings by all Funds in the aggregate do not exceed the $150,000,000 limit at any time). Interest was charged to each participating Fund based on its borrowings at a rate per annum equal to the greater of the Federal Funds rate or overnight LIBOR, plus 1.25%. In addition, a commitment fee of 0.15% per annum, payable at the end of each calendar quarter, was accrued and apportioned among the participating funds based on their average daily unused portion of the line of credit.
For the year ended December 31, 2016, none of the Funds had borrowings under these agreements.
8. Concentration of Risk. The Funds’ investments in foreign securities are subject to foreign currency fluctuations, higher volatility than U.S. securities, varying degrees of regulation and limited liquidity. Greater political, economic, credit and information risks are also associated with foreign securities.
Strategic Alpha Fund is non-diversified, which means it is not limited under the 1940 Act to a percentage of assets that it may invest in any one issuer. Because the Fund may invest in the securities of a limited number of issuers, an investment in the Fund may involve a higher degree of risk than would be present in a diversified portfolio.
9. Concentration of Ownership. From time to time, a Fund may have a concentration of one or more accounts constituting a significant percentage of shares outstanding. Investment activities by holders of such accounts could have material impacts on the Funds. As of December 31, 2016, based on management’s evaluation of the shareholder account base, the Funds had accounts representing controlling ownership of more than 5% of the Fund’s total outstanding shares. The number of such accounts, based on accounts that represent more than 5% of an individual class of shares, and the aggregate percentage of net assets represented by such holdings were as follows:
| Fund |
Number of 5% Non-Affiliated Account Holders |
Percentage of |
||||||
| Gateway Equity Call Premium Fund |
3 | 79.61 | % | |||||
| Strategic Alpha Fund |
3 | 41.49 | % | |||||
Omnibus shareholder accounts for which NGAM Advisors understands that the intermediary has discretion over the underlying shareholder accounts or investment models where a shareholder account may be invested for a non-discretionary customer are included in the table above. For other omnibus accounts, the Funds do not have information on the individual shareholder
| 92
Table of Contents
Notes to Financial Statements (continued)
December 31, 2016
10. Capital Shares. The Fund may issue an unlimited number of shares of beneficial interest, without par value. Transactions in capital shares were as follows:
| |
Year Ended December 31, 2016 |
|
|
Year Ended December 31, 2015 |
| |||||||||||
| Gateway Equity Call Premium Fund |
Shares | Amount | Shares | Amount | ||||||||||||
| Class A | ||||||||||||||||
| Issued from the sale of shares |
592,010 | $ | 6,121,622 | 449,589 | $ | 4,570,382 | ||||||||||
| Issued in connection with the reinvestment of distributions |
5,121 | 53,868 | 3,514 | 35,722 | ||||||||||||
| Redeemed |
(376,732 | ) | (3,971,403 | ) | (85,447 | ) | (858,858 | ) | ||||||||
|
|
|
|
|
|
|
|
|
|||||||||
| Net change |
220,399 | $ | 2,204,087 | 367,656 | $ | 3,747,246 | ||||||||||
|
|
|
|
|
|
|
|
|
|||||||||
| Class C | ||||||||||||||||
| Issued from the sale of shares |
45,956 | $ | 492,236 | 3,581 | $ | 36,310 | ||||||||||
| Issued in connection with the reinvestment of distributions |
111 | 1,192 | 18 | 187 | ||||||||||||
| Redeemed |
(1,416 | ) | (14,955 | ) | (100 | ) | (1,028 | ) | ||||||||
|
|
|
|
|
|
|
|
|
|||||||||
| Net change |
44,651 | $ | 478,473 | 3,499 | $ | 35,469 | ||||||||||
|
|
|
|
|
|
|
|
|
|||||||||
| Class Y | ||||||||||||||||
| Issued from the sale of shares |
1,581,610 | $ | 15,844,856 | 4,210,869 | $ | 43,166,037 | ||||||||||
| Issued in connection with the reinvestment of distributions |
39,283 | 412,824 | 27,812 | 281,744 | ||||||||||||
| Redeemed |
(708,332 | ) | (7,241,554 | ) | (1,402,243 | ) | (14,430,566 | ) | ||||||||
|
|
|
|
|
|
|
|
|
|||||||||
| Net change |
912,561 | $ | 9,016,126 | 2,836,438 | $ | 29,017,215 | ||||||||||
|
|
|
|
|
|
|
|
|
|||||||||
| Increase (decrease) from capital share transactions |
1,177,611 | $ | 11,698,686 | 3,207,593 | $ | 32,799,930 | ||||||||||
|
|
|
|
|
|
|
|
|
|||||||||
93 |
Table of Contents
Notes to Financial Statements (continued)
December 31, 2016
10. Capital Shares (continued).
| |
Year Ended December 31, 2016 |
|
Year Ended December 31, 2015 |
|||||||||||||
| Loomis Sayles Strategic Alpha Fund |
Shares | Amount | Shares | Amount | ||||||||||||
| Class A | ||||||||||||||||
| Issued from the sale of shares |
2,073,679 | $ | 19,966,508 | 6,366,120 | $ | 62,543,457 | ||||||||||
| Issued in connection with the reinvestment of distributions |
102,020 | 979,713 | 318,954 | 3,111,420 | ||||||||||||
| Redeemed |
(7,583,445 | ) | (71,672,383 | ) | (4,852,855 | ) | (47,380,866 | ) | ||||||||
|
|
|
|
|
|
|
|
|
|||||||||
| Net change |
(5,407,746 | ) | $ | (50,726,162 | ) | 1,832,219 | $ | 18,274,011 | ||||||||
|
|
|
|
|
|
|
|
|
|||||||||
| Class C | ||||||||||||||||
| Issued from the sale of shares |
285,547 | $ | 2,782,194 | 1,290,714 | $ | 12,573,109 | ||||||||||
| Issued in connection with the reinvestment of distributions |
45,145 | 430,682 | 122,269 | 1,191,265 | ||||||||||||
| Redeemed |
(2,312,367 | ) | (22,078,378 | ) | (1,956,904 | ) | (19,229,282 | ) | ||||||||
|
|
|
|
|
|
|
|
|
|||||||||
| Net change |
(1,981,675 | ) | $ | (18,865,502 | ) | (543,921 | ) | $ | (5,464,908 | ) | ||||||
|
|
|
|
|
|
|
|
|
|||||||||
| Class Y | ||||||||||||||||
| Issued from the sale of shares |
28,064,358 | $ | 270,266,593 | 44,468,853 | $ | 439,028,093 | ||||||||||
| Issued in connection with the reinvestment of distributions |
1,876,898 | 18,017,506 | 3,252,297 | 31,686,738 | ||||||||||||
| Redeemed |
(45,303,829 | ) | (432,597,106 | ) | (41,791,361 | ) | (408,640,263 | ) | ||||||||
|
|
|
|
|
|
|
|
|
|||||||||
| Net change |
(15,362,573 | ) | $ | (144,313,007 | ) | 5,929,789 | $ | 62,074,568 | ||||||||
|
|
|
|
|
|
|
|
|
|||||||||
| Increase (decrease) from capital share transactions |
(22,751,994 | ) | $ | (213,904,671 | ) | 7,218,087 | $ | 74,883,671 | ||||||||
|
|
|
|
|
|
|
|
|
|||||||||
| 94
Table of Contents
Report of Independent Registered Public Accounting Firm
To the Trustees of Gateway Trust and Natixis Funds Trust II and Shareholders of Gateway Equity Call Premium Fund and Loomis Sayles Strategic Alpha Fund:
In our opinion, the accompanying statements of assets and liabilities, including the portfolios of investments, and the related statements of operations and of changes in net assets and the financial highlights present fairly, in all material respects, the financial position of the Gateway Equity Call Premium Fund, a series of Gateway Trust, and Loomis Sayles Strategic Alpha Fund, a series of Natixis Funds Trust II (collectively, the “Funds”) as of December 31, 2016, and the results of each of their operations, the changes in each of their net assets and the financial highlights for each of the periods indicated, in conformity with accounting principles generally accepted in the United States of America. These financial statements and financial highlights (hereafter referred to as “financial statements”) are the responsibility of the Funds’ management. Our responsibility is to express an opinion on these financial statements based on our audits. We conducted our audits of these financial statements in accordance with the standards of the Public Company Accounting Oversight Board (United States). Those standards require that we plan and perform the audit to obtain reasonable assurance about whether the financial statements are free of material misstatement. An audit includes examining, on a test basis, evidence supporting the amounts and disclosures in the financial statements, assessing the accounting principles used and significant estimates made by management, and evaluating the overall financial statement presentation. We believe that our audits, which included confirmation of securities at December 31, 2016 by correspondence with the custodian, agent banks and brokers, provide a reasonable basis for our opinion.
PricewaterhouseCoopers LLP
Boston, Massachusetts
February 22, 2017
95 |
Table of Contents
2016 U.S. Tax Distribution Information to Shareholders (Unaudited)
Corporate Dividends Received Deduction. For the fiscal year ended December 31, 2016, a percentage of dividends distributed by the Funds listed below qualify for the dividends received deduction for corporate shareholders. These percentages are as follows:
| Fund |
Qualifying |
|||
| Gateway Equity Call Premium |
100.00 | % | ||
| Strategic Alpha |
0.61 | % | ||
Qualified Dividend Income. A percentage of dividends distributed by the Funds during the fiscal year ended December 31, 2016 are considered qualified dividend income, and are eligible for reduced tax rates. These lower rates range from 0% to 20% depending on an individual’s tax bracket. These percentages are noted below:
| Fund |
Qualifying |
|||
| Gateway Equity Call Premium |
100.00 | % | ||
| Strategic Alpha |
0.78 | % | ||
| 96
Table of Contents
Trustee and Officer Information
The tables below provide certain information regarding the trustees and officers of Natixis Funds Trust II and Gateway Trust (the “Trusts”). Unless otherwise indicated, the address of all persons below is 399 Boylston Street, Boston, MA 02116. The Funds’ Statement of Additional Information includes additional information about the trustees of the Trust and is available by calling Natixis Funds at 800-225-5478.
| Name and Year of Birth |
Position(s) Held of Office1 |
Principal 5 Years |
Number of and Other 5 Years |
Experience, Membership | ||||
| INDEPENDENT TRUSTEES | ||||||||
| Kenneth A. Drucker (1945) |
Chairperson of the Board of Trustees since January 2017 Trustee since 2008 Ex Officio member of the Audit Committee, the Contract Review Committee and the Governance Committee |
Retired | 53 None |
Significant experience on the Board and on the boards of other business organizations (including at investment companies); executive experience (including as treasurer of an aerospace, automotive, and metal manufacturing corporation) | ||||
| Edmond J. English (1953) | Trustee since 2013 Audit Committee Member |
Chief Executive Officer of Bob’s Discount Furniture (retail) | 53 Director, Burlington Stores, Inc. (retail) |
Experience on the Board and significant experience on the boards of other business organizations (including retail companies and a bank); executive experience (including at a retail company) | ||||
97 |
Table of Contents
Trustee and Officer Information
| Name and Year of Birth |
Position(s) Held of Office1 |
Principal 5 Years |
Number of and Other 5 Years |
Experience, Membership | ||||
| INDEPENDENT TRUSTEES continued | ||||||||
| Richard A. Goglia (1951) |
Trustee since 2015 Audit Committee Member |
Retired; formerly Vice President and Treasurer of Raytheon Company (defense) | 53 None |
Experience on the Board and executive experience (including his role as vice president and treasurer of a defense company and experience at a financial services company) | ||||
| Wendell J. Knox (1948) |
Trustee since 2009 Contract Review Committee Member and Governance Committee Member |
Director of Abt Associates Inc. (research and consulting) | 53 Director, Eastern Bank (bank); Director, The Hanover Insurance Group (property and casualty insurance) |
Significant experience on the Board and on the boards of other business organizations (including at a bank and at a property and casualty insurance firm); executive experience (including roles as president and chief executive officer of a research and consulting company) | ||||
| 98
Table of Contents
Trustee and Officer Information
| Name and Year of Birth |
Position(s) Held of Office1 |
Principal 5 Years |
Number of and Other 5 Years |
Experience, Membership | ||||
| INDEPENDENT TRUSTEES continued | ||||||||
| Martin T. Meehan (1956) |
Trustee since 2012 Contract Review Committee Member |
President, University of Massachusetts; formerly, Chancellor and faculty member, University of Massachusetts Lowell | 53 None |
Experience on the Board and on the boards of other business organizations; experience as President of the University of Massachusetts; government experience (including as a member of the U.S. House of Representatives); academic experience | ||||
| Sandra O. Moose (1942) |
Trustee since 1993 for Natixis Funds Trust II and since 2007 for Gateway Trust Audit Committee Member and Governance Committee Member |
President, Strategic Advisory Services (management consulting) | 53 Formerly, Director, AES Corporation (international power company); formerly, Director, Verizon Communications (telecommunications company) |
Significant experience on the Board and on the boards of other business organizations (including at a telecommunications company, an international power company and a specialty chemicals corporation); executive experience (including at a management consulting company) | ||||
99 |
Table of Contents
Trustee and Officer Information
| Name and Year of Birth |
Position(s) Held of Office1 |
Principal 5 Years |
Number of and Other 5 Years |
Experience, Membership | ||||
| INDEPENDENT TRUSTEES continued | ||||||||
| James P. Palermo (1955) |
Trustee since 2016 Contract Review Committee Member |
Founding Partner, Breton Capital Management, LLC (private equity); Partner, STEP Partners, LLC (private equity); formerly, Chief Executive Officer of Global Client Management of The Bank of New York Mellon Corporation | 53 None |
Experience on the Board; financial services industry and executive experience (including roles as chief executive officer of client management and asset servicing for a banking and financial services company) | ||||
| Erik R. Sirri (1958) |
Trustee since 2009 Chairperson of the Audit Committee |
Professor of Finance at Babson College | 53 None |
Significant experience on the Board; experience as Director of the Division of Trading and Markets at the Securities and Exchange Commission; academic experience; training as an economist | ||||
| Peter J. Smail (1952) |
Trustee since 2009 Chairperson of the Contract Review Committee and Governance Committee Member |
Retired | 53 None |
Significant experience on the Board; mutual fund industry and executive experience (including roles as president and chief executive officer for an investment adviser) | ||||
| 100
Table of Contents
Trustee and Officer Information
| Name and Year of Birth |
Position(s) Held of Office1 |
Principal 5 Years |
Number of and Other 5 Years |
Experience, Membership | ||||
| INDEPENDENT TRUSTEES continued | ||||||||
| Cynthia L. Walker (1956) |
Trustee since 2005 for Natixis Funds Trust II and since 2007 for Gateway Trust Chairperson of the Governance Committee and Audit Committee Member |
Deputy Dean for Finance and Administration, Yale University School of Medicine | 53 None |
Significant experience on the Board; executive experience in a variety of academic organizations (including roles as dean for finance and administration) | ||||
| INTERESTED TRUSTEES | ||||||||
| Kevin P. Charleston3 (1965) One Financial Center Boston, MA 02111 |
Trustee since 2015 | President, Chief Executive Officer and Director; formerly, Chief Financial Officer, Loomis, Sayles & Company, L.P. | 53 None |
Experience on the Board; continuing service as President, Chief Executive Officer and Director of Loomis, Sayles & Company, L.P. | ||||
| David L. Giunta4 (1965) |
Trustee since 2011 President and Chief Executive Officer since 2008 |
President and Chief Executive Officer, NGAM Distribution Corporation, NGAM Advisors, L.P. and NGAM Distribution, L.P. | 53 None |
Significant experience on the Board; continuing experience as President and Chief Executive Officer of NGAM Advisors, L.P. | ||||
| 1 | Each trustee serves until retirement, resignation or removal from the Board. The current retirement age is 75. The position of Chairperson of the Board is appointed for a three-year term. |
| 2 | The trustees of the Trusts serve as trustees of a fund complex that includes all series of the Natixis Funds Trust I, Natixis Funds Trust II, Natixis Funds Trust IV and Gateway Trust (collectively, the “Natixis Funds Trusts”), Loomis Sayles Funds I and Loomis Sayles Funds II (collectively, the “Loomis Sayles Funds Trusts”) and Natixis ETF Trust (collectively, the “Fund Complex”). |
| 3 | Mr. Charleston is deemed an “interested person” of the Trusts because he holds the following positions with an affiliated person of the Trusts: President and Chief Executive Officer of Loomis, Sayles & Company, L.P. |
| 4 | Mr. Giunta is deemed an “interested person” of the Trusts because he holds the following positions with an affiliated person of the Trusts: President and Chief Executive Officer of NGAM Distribution Corporation, NGAM Advisors, L.P. and NGAM Distribution, L.P. |
101 |
Table of Contents
Trustee and Officer Information
| Name and Year of Birth |
Position(s) Held with the Trust |
Term of Office1 and Length of Time Served |
Principal Occupation(s) During Past 5 Years2 | |||
| OFFICERS OF THE TRUST | ||||||
| Russell L. Kane (1969) |
Secretary, Clerk and Chief Legal Officer | Since July 2016 | Executive Vice President, General Counsel, Secretary and Clerk, NGAM Distribution Corporation, NGAM Advisors, L.P. and NGAM Distribution, L.P.; formerly, Chief Compliance Officer for Mutual Funds, Senior Vice President, Deputy General Counsel, Assistant Secretary and Assistant Clerk, NGAM Distribution Corporation, NGAM Advisors, L.P. and NGAM Distribution, L.P. | |||
| Michael C. Kardok (1959) |
Treasurer, Principal Financial and Accounting Officer | Since October 2004 for Natixis Funds Trust II and since May 2007 for Gateway Trust | Senior Vice President, NGAM Advisors, L.P. and NGAM Distribution, L.P. | |||
| Rosa Licea-Mailloux (1976) |
Chief Compliance Officer, Assistant Secretary and Anti-Money Laundering Officer |
Since July 2016 | Senior Vice President, Deputy General Counsel, Assistant Secretary and Assistant Clerk, NGAM Distribution Corporation, NGAM Advisors, L.P. and NGAM Distribution, L.P.; formerly, Associate General Counsel, NGAM Distribution, L.P. | |||
| 1 | Each officer of the Trusts serves for an indefinite term in accordance with the Trusts’ current by-laws until the date his or her successor is elected and qualified, or until he or she sooner dies, retires, is removed or becomes disqualified. |
| 2 | Each person listed above, except as noted, holds the same position(s) with the Fund Complex. Previous positions during the past five years with NGAM Distribution, L.P., NGAM Advisors, L.P. or Loomis, Sayles & Company, L.P. are omitted, if not materially different from a trustee’s or officer’s current position with such entity. |
| 102
Table of Contents
ANNUAL REPORT
December 31, 2016

ASG Dynamic Allocation Fund
ASG Global Alternatives Fund
ASG Managed Futures Strategy Fund
ASG Tactical U.S. Market Fund

Portfolio Review page 1
Portfolio of Investments page 25
Financial Statements page 45
Notes to Financial Statements page 67
Table of Contents
| Managers | Symbols | |
| Alexander D. Healy, PhD | Class A DAAFX | |
| Robert S. Rickard | Class C DACFX | |
| Derek M. Schug, CFA® | Class Y DAYFX | |
| AlphaSimplex Group, LLC (Adviser) | ||
Investment Goal
The Fund seeks long-term capital appreciation. The secondary goal of the Fund is the protection of capital during unfavorable market conditions.
Market Conditions
Economic policy divergences and political shocks took center stage for investors and financial markets in 2016.
Equity markets began the year in risk-off fashion. Deflationary fears following the U.S. Federal Reserve’s (Fed) rate hike in December were the main catalyst. Concerns that higher rates in the United States would pull capital from emerging markets drove a sharp, widespread sell-off, led by China. As equities retreated, global bond yields plummeted in response and energy markets fell. Responding to the weakening global outlook and elevated risks of deflation, several major central banks eased policies further, compounding the divergence between the Fed’s positioning and the rest of the world’s. The Bank of Japan (BoJ) eased policy rates into negative territory while the European Central Bank (ECB) cut rates and expanded its Quantitative Easing (QE) program. Equity, fixed-income, credit and commodity markets recovered through the first quarter and stabilized throughout much of the second quarter as a result.
The macro event shocker in June was Brexit, the vote by the United Kingdom to leave the European Union (EU). Initially, polls indicated that the “remain” vote would win and investors were in risk-on mode. However, as the results became clear, the British pound staged a massive sell-off as panic set in. The initial panic was brief, however, and equity and bond markets recovered as investors assessed the benefits of a weaker pound and the prospect for easing from the Bank of England (BoE). The BoE did follow through, reducing interest rates and expanding its QE program.
The second half of the year was met with some caution ahead of the U.S. presidential election. Equity markets remained in narrow ranges as the campaign became more contentious. Other global macro events during this period included the BoJ targeting bond yields and the ECB announcing an extension of its QE program. Despite this further easing, bond yields inched higher prior to the U.S. election, as investors focused on the potential for an interest rate hike by the Fed in December. The move from the ECB and the BoJ had investors wondering if yields had already reached their lows, as the moves were perceived by investors as tapering rather than easing. Meanwhile, the British pound suffered what many referred to as a “flash crash” in October, as investors remained concerned about the Brexit fallout.
1 |
Table of Contents
The win by Donald Trump stunned markets and investors alike. After the initial shock and very brief risk-off sentiment, investors began to anticipate that policies in a Trump administration with a Republican House and Senate would be geared towards generating stronger GDP growth. As such, equity markets recovered strongly while the U.S. dollar surged. Bond yields responded to both the Trump victory and the Fed’s interest rate hike in December. Emerging markets reacted negatively towards the Trump victory, as the prospect of trade adjustments could impact local economies. Additional pressure on emerging markets came from falling local currencies, resulting from the U.S. dollar surge and rising interest rates. China reacted to ongoing weakness in FX reserves, bad loans and money market data with tighter capital controls and liquidity provisions. Energy markets helped support commodity indexes for the year as the Organization of the Petroleum Exporting Countries (OPEC) announced the first cuts in nearly a decade.
Performance Results
For the 12 months ended December 31, 2016, Class A Shares of the ASG Dynamic Allocation Fund returned 2.41% at net asset value. The Fund’s benchmark, the Morningstar® Global AllocationSM, returned 7.00% for the same period. It is important to note that there are material differences between the Fund and this benchmark.
Explanation of Fund Performance
The Fund uses proprietary quantitative models to invest in global stock and fixed-income markets. The Fund’s strategy is to overweight and/or underweight assets within this universe relative to its benchmark based on these models. The Fund uses ETFs and derivative instruments, such as futures and forward contracts, to gain exposure to five classes of global assets: U.S. stocks, developed international stocks, U.S. bonds, developed international bonds, and emerging market assets.
During 2016, each of the five asset groups in which the Fund invests posted gains. Relative to its benchmark, the Fund was hurt by its average underweight to all of these groups for the full year. Despite being generally underweight, there were meaningful changes in asset weights during the year. While the Fund remained underweight in bonds throughout the year, exposure to equities increased over the year to end at an overweight position. Bonds captured most of their positive return during the first half of the year before declining in the second half. Equities, on the other hand, suffered a meaningful decline during the first six weeks of 2016, where being underweight was a benefit but limited the participation in the rapid rebound as equities went on to post above-average returns for the year. The Fund’s outperformance during the fourth quarter, because of the overweight to equities, was not enough to offset the slow start.
The Fund relies primarily on a systematic process to identify trends and changes in the asset allocation of the broad hedge fund universe. The Fund has the ability to adjust its total exposure from 0% to 200%. For the period, the Fund’s average exposure to the five asset classes was slightly above 63%, split 44% to stocks and 19% to bonds. U.S. equities represented the largest weight of the equity group, but all equity categories were, on average, underweight relative to the benchmark. Portfolio weights to U.S. and international bonds were also underweight relative to the benchmark for the year at 13% and 6%, respectively.
| 2
Table of Contents
ASG DYNAMIC ALLOCATION FUND
The Fund’s portfolio is adjusted on a daily basis to incorporate new information about trends and hedge fund positioning, and seeks to control risk by maintaining an annual return standard deviation below 20%. Market volatility was low during 2016. The Fund’s annualized volatility was 6.2%, below the benchmark’s 7.8% and well below 20% due, in part, to maintaining an average market exposure less than 100%.
Outlook
The outlook for 2017 is highly unpredictable but offers both risk and opportunity for investors, as well as the potential for wide dispersion amongst and within asset classes. Potential macro themes include higher growth, more fiscal policy expansion and potentially higher inflation. There may also be increased volatility due to the recent election in the U.S., and upcoming elections in France and Germany.
Within the United States, the incoming Trump administration’s economic agenda could pursue tax and regulatory reform and large infrastructure projects. The exact details, and what can be passed even through a Republican Congress, are unclear, though growth expectations for the United States will be impacted. Further, how expectations and incoming economic data translate to future Fed policy may have a significant impact on bond yields, and interest rates could be expected to continue to rise, perhaps substantially. Similarly, with an aggressive growth and trade policy, the U.S. dollar should outperform, particularly against emerging markets and countries running large trade surpluses with the United States. There may also be a push-pull scenario in credit markets, where the push from a prospectively better economic growth profile may be counterbalanced by a pull from potentially significantly higher rates.
Rising rates and a strong U.S. dollar should impact policies across the globe, particularly in Europe, the United Kingdom and Japan, where aggressive monetary easing has been maintained. Investors have already been questioning the continued efficacy of further QE. As such, inflationary pressures could mount in Europe and Japan due to weakening currencies and stronger growth abroad. Policy makers might thus be persuaded to remove some monetary accommodation. Should growth in Europe falter, fiscal policy expansion may be more likely than monetary expansion, which could put further upward pressure on bond yields, notably in peripheral Europe.
The outlook for emerging markets, notably in China, is far murkier. Weakening currencies could lead to higher inflation expectations; trade surpluses may decline should trade deals be renegotiated with the incoming U.S. administration. Higher debt and leverage in emerging markets, especially China, combined with the potentially more attractive interest rate and growth outlook for the United States, make the group susceptible to capital outflows, creating a negative feedback loop to the economy(ies). Commodities may offer a potentially supportive factor for emerging markets. Despite projections of further gains in the U.S. dollar in 2017, commodity markets show potential for gains, should growth and inflation move higher.
3 |
Table of Contents
Growth of $10,000 Investment in Class A Shares4
November 30, 2015 (inception) through December 31, 2016
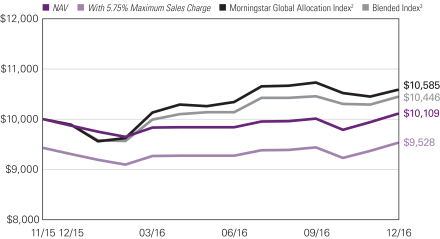
See notes to chart on page 5.
| 4
Table of Contents
ASG DYNAMIC ALLOCATION FUND
Average Annual Total Returns — December 31, 20164
| Expense Ratios5 | ||||||||||||||||
| 1 Year | Life of Fund | Gross | Net | |||||||||||||
| Class A (Inception 11/30/15) | ||||||||||||||||
| NAV | 2.41 | % | 1.01 | % | 1.74 | % | 1.25 | % | ||||||||
| With 5.75% Maximum Sales Charge | -3.46 | -4.35 | ||||||||||||||
| Class C (Inception 11/30/15) | 1.63 | 0.21 | ||||||||||||||
| NAV | 0.63 | 0.21 | 2.49 | 2.00 | ||||||||||||
| With CDSC1 | ||||||||||||||||
| Class Y (Inception 11/30/15) | 2.57 | 1.17 | ||||||||||||||
| NAV | 1.49 | 1.00 | ||||||||||||||
| Comparative Performance | ||||||||||||||||
| Morningstar® Global Allocation IndexSM 2 | 7.00 | 5.37 | ||||||||||||||
| Blended Index3 | 5.71 | 4.09 | ||||||||||||||
Performance data shown represents past performance and is no guarantee of, and not necessarily indicative of, future results. Total return and value will vary, and you may have a gain or loss when shares are sold. Current performance may be lower or higher than quoted. For most recent month-end performance, visit ngam.natixis.com. Performance for other share classes will be greater or less than shown based on differences in fees and sales charges. You may not invest directly in an index. Performance for periods less than one year is cumulative, not annualized. Returns reflect changes in share price and reinvestment of dividends and capital gains, if any. The table(s) do not reflect taxes shareholders might owe on any fund distributions or when they redeem their shares.
| 1 | Performance for Class C shares assumes a 1% contingent deferred sales charge (“CDSC”) applied when you sell shares within one year of purchase. |
| 2 | The Morningstar® Global Allocation IndexSM represents a diverse multi-asset-class portfolio of liquid global asset classes that reflects the global investment opportunities available to an investor with a moderate risk tolerance. |
| 3 | The Blended Index is an unmanaged, blended index composed of the following weights: 60% MSCI World Index (Net)/40% Bloomberg Barclays U.S. Aggregate Bond Index. The weightings of the indices that compose the Blended Index are rebalanced on a monthly basis to maintain the allocations as described above. These rebalancings will not necessarily correspond to the rebalancing of the Fund’s investment portfolio, and the relative weightings of the asset classes in the Fund will generally differ to some extent from the weightings in the Blended Index. |
| 4 | Fund performance has been increased by fee waivers and/or expense reimbursements, if any, without which performance would have been lower. |
| 5 | As of the most recent prospectus, the investment advisor has contractually agreed to waive fees and/or reimburse expenses (with certain exceptions) once the expense cap of the Fund has been exceeded. This arrangement is set to expire on 04/30/2017. When an expense cap has not been exceeded, the fund may have similar expense ratios. |
5 |
Table of Contents
| Managers | Symbols | |
| Andrew W. Lo, PhD | Class A GAFAX | |
| Alexander D. Healy, PhD | Class C GAFCX | |
| Peter A. Lee | Class N GAFNX | |
| Philippe P. Lüdi, CFA®, PhD | Class Y GAFYX | |
| Robert W. Sinnott | ||
| Robert S. Rickard | ||
| AlphaSimplex Group, LLC (Adviser) |
Investment Goal
The Fund pursues an absolute return strategy that seeks to provide capital appreciation consistent with the risk-return characteristics of a diversified portfolio of hedge funds. The secondary goal of the Fund is to achieve these returns with less volatility than major equity indices.
Market Conditions
Economic policy divergences and political shocks took center stage for investors and financial markets in 2016.
Equity markets began the year in risk-off fashion. Deflationary fears following the U.S. Federal Reserve’s (Fed) rate hike in December were the main catalyst. Concerns that higher rates in the United States would pull capital from emerging markets drove a sharp, widespread sell-off, led by China. As equities retreated, global bond yields plummeted in response and energy markets fell. Responding to the weakening global outlook and elevated risks of deflation, several major central banks eased policies further, compounding the divergence between the Fed’s positioning and the rest of the world’s. The Bank of Japan (BoJ) eased policy rates into negative territory while the European Central Bank (ECB) cut rates and expanded its Quantitative Easing (QE) program. Equity, fixed-income, credit and commodity markets recovered through the first quarter and stabilized throughout much of the second quarter as a result.
The macro event shocker in June was Brexit, the vote by the United Kingdom to leave the European Union (EU). Initially, polls indicated that the “remain” vote would win and investors were in risk-on mode. However, as the results became clear, the British pound staged a massive sell-off as panic set in. The initial panic was brief, however, and equity and bond markets recovered as investors assessed the benefits of a weaker pound and the prospect for easing from the Bank of England (BoE). The BoE did follow through, reducing interest rates and expanding its QE program.
The second half of the year was met with some caution ahead of the U.S. presidential election. Equity markets remained in narrow ranges as the campaign became more contentious. Other global macro events during this period included the BoJ targeting bond yields and the ECB announcing an extension of its QE program. Despite this further easing, bond yields inched higher prior to the U.S. election, as investors focused on the potential for an interest rate hike by the Fed in December. The move from the ECB and
| 6
Table of Contents
ASG GLOBAL ALTERNATIVES FUND
the BoJ had investors wondering if yields had already reached their lows, as the moves were perceived by investors as tapering rather than easing. Meanwhile, the British pound suffered what many referred to as a “flash crash” in October, as investors remained concerned about the Brexit fallout.
The win by Donald Trump stunned markets and investors alike. After the initial shock and very brief risk-off sentiment, investors began to anticipate that policies in a Trump administration with a Republican House and Senate would be geared towards generating stronger GDP growth. As such, equity markets recovered strongly while the U.S. dollar surged. Bond yields responded to both the Trump victory and the Fed’s interest rate hike in December. Emerging markets reacted negatively towards the Trump victory, as the prospect of trade adjustments could impact local economies. Additional pressure on emerging markets came from falling local currencies, resulting from the U.S. dollar surge and rising interest rates. China reacted to ongoing weakness in FX reserves, bad loans and money market data with tighter capital controls and liquidity provisions. Energy markets helped support commodity indexes for the year as the Organization of the Petroleum Exporting Countries (OPEC) announced the first cuts in nearly a decade.
Performance Results
For the 12 months ended December 31, 2016, Class A Shares of the ASG Global Alternatives Fund returned -4.39% at net asset value. Although the Fund does not seek to track any particular index, the Barclay Fund of Funds Index may be used as a benchmark for performance analysis. This benchmark returned 0.32% for the same period. It is important to note that there are material differences between the Fund and this benchmark.
Explanation of Fund Performance
The Fund seeks to take on exposures that reflect the liquid, broad market exposures of the hedge fund industry as estimated by a proprietary, statistical process. When the Fund takes on a “long” exposure to a market, the long exposure generally profits as the price of the underlying security rises but suffers losses when the price falls. When the Fund takes on a “short” exposure, the short exposure generally suffers losses as the price of the underlying security rises but profits as the price falls. The Fund typically makes extensive use of futures and forward contracts on global stock indices, fixed-income securities, currencies and commodities. As market events unfold, these exposures result in a profit or loss for the Fund.
2016 was a rollercoaster year for the Fund and for hedge funds broadly. For both, disappointing performance in the first half of the year was followed by a rebound in the second half. The Fund returned -9.83% in the first half of the year, and 6.03% in the second half, while the returns of the typical fund of funds (as indicated by the Barclay Fund of Funds Index) were -3.24% and 3.68%, respectively. As has generally been seen in the past, the Fund’s returns tended to be in the same direction as those of its benchmark but larger in magnitude. However, since the fund benchmarks to a higher volatility than the average hedge fund, there was a larger magnitude in both directions.
7 |
Table of Contents
The Fund’s losses in the first half of 2016 were driven by an array of adverse market moves. Seeking to capitalize on the inferred insights of hedge fund managers, the Fund was long equities, long the U.S. dollar, short bonds, and overweight international equities during much of the first half of 2016. However, in the first months of 2016, equities fell, and international equities fell further. In addition, the U.S. dollar fell sharply, and bond yields plunged from their already-low levels. Furthermore, in some cases, by the time markets rebounded, the Fund’s risk management controls had reduced the Fund’s target volatility, therefore limiting participation in the rebound. In combination, these factors led to the first half’s disappointing performance.
With gains in five out of six months, the performance of the Fund in the second half of 2016 contrasted sharply with that in the first. The bulk of these second-half gains resulted from long exposure to global developed equities. Short exposure to the euro against the U.S. dollar also contributed positively, as the value of the common currency declined.
Overall, in 2016, the Fund’s largest gains came from exposure to the U.S. 3-month LIBOR interest rates, copper, U.S. equities, U.K. equities, and the Canadian dollar. However, these gains were more than offset by losses incurred through exposure to Japanese equities, U.K. bonds, the Japanese yen, U.S. 10-year notes, and German government bonds. At times during 2016, the Fund had short exposure to various bonds, currencies, equities and commodities, which contributed negatively overall.
The contribution from the Fund’s money market holdings was modest, as short-maturity interest rates remained low.
The Fund’s portfolio is adjusted on a daily and monthly basis to incorporate new information about hedge funds’ exposures, and, on a daily basis, to control risk. The risk control mechanism is designed to target an average annual volatility of 9% or less — greater than the typical volatility of bonds, but less than the typical volatility of stocks. The Fund’s realized volatility in 2016 was 6.5%, which is in line with our expectations. We continue to scale the size of the Fund’s positions to keep total portfolio risk at or below its target.
Outlook
The outlook for 2017 is highly unpredictable but offers both risk and opportunity for investors, as well as the potential for wide dispersion amongst and within asset classes. Potential macro themes include higher growth, more fiscal policy expansion and potentially higher inflation. There may also be increased volatility due to recent elections in the U.S., and upcoming elections in France and Germany.
Within the United States, the incoming Trump administration’s economic agenda could pursue tax and regulatory reform and large infrastructure projects. The exact details, and what can be passed even through a Republican Congress, are unclear, though growth expectations for the United States will be impacted. Further, how expectations and incoming economic data translate to future Fed policy may have a significant impact on bond yields, and interest rates could be expected to continue to rise, perhaps substantially. Similarly, with an aggressive growth and trade policy, the U.S. dollar should outperform, particularly against emerging markets and countries running large trade surpluses with the
| 8
Table of Contents
ASG GLOBAL ALTERNATIVES FUND
United States. There may also be a push-pull scenario in credit markets, where the push from a prospectively better economic growth profile may be counterbalanced by a pull from potentially significantly higher rates.
Rising rates and a strong U.S. dollar should impact policies across the globe, particularly in Europe, the United Kingdom and Japan, where aggressive monetary easing has been maintained. Investors have already been questioning the continued efficacy of further QE. As such, inflationary pressures could mount in Europe and Japan due to weakening currencies and stronger growth abroad. Policy makers might thus be persuaded to remove some monetary accommodation. Should growth in Europe falter, fiscal policy expansion may be more likely than monetary expansion, which could put further upward pressure on bond yields, notably in peripheral Europe.
The outlook for emerging markets, notably in China, is far murkier. Weakening currencies could lead to higher inflation expectations; trade surpluses may decline should trade deals be renegotiated with the incoming U.S. administration. Higher debt and leverage in emerging markets, especially China, combined with the potentially more attractive interest rate and growth outlook for the United States, make the group susceptible to capital outflows, creating a negative feedback loop to the economy(ies). Commodities may offer a potentially supportive factor for emerging markets. Despite projections of further gains in the U.S. dollar in 2017, commodity markets show potential for gains, should growth and inflation move higher.
Growth of $10,000 Investment in Class A Shares3
September 30, 2008 (inception) through December 31, 2016
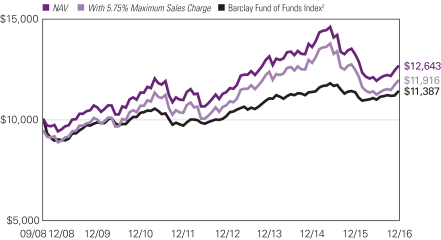
9 |
Table of Contents
Average Annual Total Returns — December 31, 20163
| Expense Ratios4 | ||||||||||||||||||||||||
| 1 Year | 5 Year | Life of Class | Gross | Net | ||||||||||||||||||||
| Class A (Inception 9/30/08) | Class A/C/Y | Class N | ||||||||||||||||||||||
| NAV | -4.39 | % | 2.90 | % | 2.88 | % | — | % | 1.53 | % | 1.53 | % | ||||||||||||
| With 5.75% Maximum Sales Charge | -9.89 | 1.68 | 2.15 | — | ||||||||||||||||||||
| Class C (Inception 9/30/08) | ||||||||||||||||||||||||
| NAV | -5.15 | 2.11 | 2.11 | — | 2.28 | 2.28 | ||||||||||||||||||
| With CDSC1 | -6.09 | 2.11 | 2.11 | — | ||||||||||||||||||||
| Class N (Inception 5/1/13) | ||||||||||||||||||||||||
| NAV | -4.05 | — | — | 1.32 | 1.23 | 1.23 | ||||||||||||||||||
| Class Y (Inception 9/30/08) | ||||||||||||||||||||||||
| NAV | -4.23 | 3.14 | 3.13 | — | 1.28 | 1.28 | ||||||||||||||||||
| Comparative Performance | ||||||||||||||||||||||||
| Barclay Fund of Funds Index2 | 0.32 | 3.27 | 1.59 | 2.05 | ||||||||||||||||||||
Performance data shown represents past performance and is no guarantee of, and not necessarily indicative of, future results. Total return and value will vary, and you may have a gain or loss when shares are sold. Current performance may be lower or higher than quoted. For most recent month-end performance, visit ngam.natixis.com. Performance for other share classes will be greater or less than shown based on differences in fees and sales charges. You may not invest directly in an index. Performance for periods less than one year is cumulative, not annualized. Returns reflect changes in share price and reinvestment of dividends and capital gains, if any. The table(s) do not reflect taxes shareholders might owe on any fund distributions or when they redeem their shares.
| 1 | Performance for Class C shares assumes a 1% contingent deferred sales charge (“CDSC”) applied when you sell shares within one year of purchase. |
| 2 | Barclay Fund of Funds Index is a measure of the average return of all Fund of Funds (“FoFs”) in the Barclay database. The index is simply the arithmetic average of the net returns of all the FoFs that have reported that month. Index returns are recalculated by BarclayHedge, Ltd. throughout each month. The fund does not expect to update the index returns provided if subsequent recalculations cause such returns to change. In addition, because of these recalculations, the Barclay Fund of Funds Index returns reported by the fund may differ from the index returns for the same period published by others. |
| 3 | Fund performance has been increased by fee waivers and/or expense reimbursements, if any, without which performance would have been lower. |
| 4 | As of the most recent prospectus, the investment advisor has contractually agreed to waive fees and/or reimburse expenses (with certain exceptions) once the expense cap of the Fund has been exceeded. This arrangement is set to expire on 04/30/2017. When an expense cap has not been exceeded, the fund may have similar expense ratios. |
| 10
Table of Contents
ASG MANAGED FUTURES STRATEGY FUND
| Managers | Symbols | |
| Andrew W. Lo, PhD | Class A AMFAX | |
| Alexander D. Healy, PhD | Class C ASFCX | |
| Peter A. Lee | Class Y ASFYX | |
| Philippe P. Lüdi, CFA®, PhD | ||
| Robert W. Sinnott | ||
| Robert S. Rickard | ||
| AlphaSimplex Group, LLC (Adviser) |
Investment Goal
The Fund pursues an absolute return strategy that seeks to provide capital appreciation.
Market Conditions
Economic policy divergences and political shocks took center stage for investors and financial markets in 2016.
Equity markets began the year in risk-off fashion. Deflationary fears following the U.S. Federal Reserve’s (Fed) rate hike in December were the main catalyst. Concerns that higher rates in the United States would pull capital from emerging markets drove a sharp, widespread sell-off, led by China. As equities retreated, global bond yields plummeted in response and energy markets fell. Responding to the weakening global outlook and elevated risks of deflation, several major central banks eased policies further, compounding the divergence between the Fed’s positioning and the rest of the world’s. The Bank of Japan (BoJ) eased policy rates into negative territory while the European Central Bank (ECB) cut rates and expanded its Quantitative Easing (QE) program. Equity, fixed-income, credit and commodity markets recovered through the first quarter and stabilized throughout much of the second quarter as a result.
The macro event shocker in June was Brexit, the vote by the United Kingdom to leave the European Union (EU). Initially, polls indicated that the “remain” vote would win and investors were in risk-on mode. However, as the results became clear, the British pound staged a massive sell-off as panic set in. The initial panic was brief, however, and equity and bond markets recovered as investors assessed the benefits of a weaker pound and the prospect for easing from the Bank of England (BoE). The BoE did follow through, reducing interest rates and expanding its QE program.
The second half of the year was met with some caution ahead of the U.S. presidential election. Equity markets remained in narrow ranges as the campaign became more contentious. Other global macro events during this period included the BoJ targeting bond yields and the ECB announcing an extension of its QE program. Despite this further easing, bond yields inched higher prior to the U.S. election, as investors focused on the potential for an interest rate hike by the Fed in December. The move from the ECB and the BoJ had investors wondering if yields had already reached their lows, as the moves were
11 |
Table of Contents
perceived by investors as tapering rather than easing. Meanwhile, the British pound suffered what many referred to as a “flash crash” in October, as investors remained concerned about the Brexit fallout.
The win by Donald Trump stunned markets and investors alike. After the initial shock and very brief risk-off sentiment, investors began to anticipate that policies in a Trump administration with a Republican House and Senate would be geared towards generating stronger GDP growth. As such, equity markets recovered strongly while the U.S. dollar surged. Bond yields responded to both the Trump victory and the Fed’s interest rate hike in December. Emerging markets reacted negatively towards the Trump victory, as the prospect of trade adjustments could impact local economies. Additional pressure on emerging markets came from falling local currencies, resulting from the U.S. dollar surge and rising interest rates. China reacted to ongoing weakness in FX reserves, bad loans and money market data with tighter capital controls and liquidity provisions. Energy markets helped support commodity indexes for the year as the Organization of the Petroleum Exporting Countries (OPEC) announced the first cuts in nearly a decade.
Performance Results
For the 12 months ended December 31, 2016, Class A shares of ASG Managed Futures Strategy Fund returned -5.69% at net asset value. Although the Fund does not seek to track any particular index, Credit Suisse Managed Futures Liquid Index may be used as a benchmark for performance analysis. This benchmark returned 4.19% over the same period. It is important to note that there are material differences between the Fund and this benchmark.
Explanation of Fund Performance
The Fund uses a set of proprietary quantitative models to identify trends in global stock, fixed-income, currency, and commodity markets. When the Fund takes on a “long” exposure to a market, that exposure generally profits as the price of the underlying security rises but suffers losses when its price falls; when it takes on a “short” exposure, that exposure generally suffers losses as the price of the underlying security rises but profits as its price falls. The Fund uses derivative instruments, such as futures and forward contracts, to capture these exposures.
For the 12-month period, the Fund’s performance was mixed. Losses came primarily from commodities, especially short positions in energies, which were driven by choppy energy markets and several short-lived rebounds based on changing production expectations from OPEC.
In currencies, the Fund gained from short positions in the British pound, especially following June’s Brexit vote. Long positions in the Japanese yen provided positive returns in the first and second quarters, but performed negatively in the fourth quarter after the U.S. election. Profitable trends in U.S. equity markets were outweighed by losses in Japanese, emerging market, and European equities. Long positions in fixed-income, especially European bonds, made up for some of these losses.
The first quarter of 2016 provided a proof point for trend-following strategies as a tool for adding diversification to equity-dominated portfolios. The Fund profited from a number of
| 12
Table of Contents
ASG MANAGED FUTURES STRATEGY FUND
short positions as negative trends in energies, equities, and currencies rocked markets, but suffered as these quickly rebounded. The Brexit surprise in June provided another proof point; the Fund’s fixed-income positions profited as yields declined. During the first two quarters of the year, the Fund had strong negative correlations to the S&P 500, another example of its diversification potential.
Choppy markets in every asset class, particularly during the second half of the year, created a challenging environment for trend-following funds. The Fund’s short-horizon models were able to capitalize on some of these trends, leading to net positive returns for those models, but these gains were more than offset by losses from other models. Long-horizon models outperformed for most of the year, but substantially underperformed during the fourth quarter as interest rates reversed course and began to rise quickly, especially following the surprise outcome of the U.S. presidential election in November.
The contribution from the Fund’s money market holdings was modest, as short-maturity interest rates remained low.
The Fund’s portfolio is adjusted on a daily basis to reflect market trends as well as to control risk. The risk control mechanism is designed to target an annualized portfolio volatility of 17% or less. The Fund’s realized volatility in 2016 was 12.4%, which is consistent with our risk management objectives. We continue to scale the size of the Fund’s positions to keep total portfolio risk within its target range.
Outlook
The outlook for 2017 is highly unpredictable but offers both risk and opportunity for investors, as well as the potential for wide dispersion amongst and within asset classes. Potential macro themes include higher growth, more fiscal policy expansion and potentially higher inflation. There may also be increased volatility due to recent elections in the U.S., and upcoming elections in France and Germany.
Within the United States, the incoming Trump administration’s economic agenda could pursue tax and regulatory reform and large infrastructure projects. The exact details, and what can be passed even through a Republican Congress, are unclear, though growth expectations for the United States will be impacted. Further, how expectations and incoming economic data translate to future Fed policy may have a significant impact on bond yields, and interest rates could be expected to continue to rise, perhaps substantially. Similarly, with an aggressive growth and trade policy, the U.S. dollar should outperform, particularly against emerging markets and countries running large trade surpluses with the United States. There may also be a push-pull scenario in credit markets, where the push from a prospectively better economic growth profile may be counterbalanced by a pull from potentially significantly higher rates.
Rising rates and a strong U.S. dollar should impact policies across the globe, particularly in Europe, the United Kingdom and Japan, where aggressive monetary easing has been maintained. Investors have already been questioning the continued efficacy of further QE. As such, inflationary pressures could mount in Europe and Japan due to weakening currencies and stronger growth abroad. Policy makers might thus be persuaded to remove
13 |
Table of Contents
some monetary accommodation. Should growth in Europe falter, fiscal policy expansion may be more likely than monetary expansion, which could put further upward pressure on bond yields, notably in peripheral Europe.
The outlook for emerging markets, notably in China, is far murkier. Weakening currencies could lead to higher inflation expectations; trade surpluses may decline should trade deals be renegotiated with the incoming U.S. administration. Higher debt and leverage in emerging markets, especially China, combined with the potentially more attractive interest rate and growth outlook for the United States, make the group susceptible to capital outflows, creating a negative feedback loop to the economy(ies). Commodities may offer a potentially supportive factor for emerging markets. Despite projections of further gains in the U.S. dollar in 2017, commodity markets show potential for gains, should growth and inflation move higher.
Growth of $10,000 Investment in Class A Shares4
July 30, 2010 (inception) through December 31, 2016

See notes to chart on page 15.
| 14
Table of Contents
ASG MANAGED FUTURES STRATEGY FUND
Average Annual Total Returns — December 31, 20164
| Expense Ratios5 | ||||||||||||||||||||
| 1 Year | 5 Year | Life of Fund | Gross | Net | ||||||||||||||||
| Class A (Inception 7/30/10) | ||||||||||||||||||||
| NAV | -5.69 | % | 2.53 | % | 4.02 | % | 1.73 | % | 1.73 | % | ||||||||||
| With 5.75% Maximum Sales Charge | -11.09 | 1.32 | 3.07 | |||||||||||||||||
| Class C (Inception 7/30/10) | ||||||||||||||||||||
| NAV | -6.45 | 1.73 | 3.22 | 2.48 | 2.48 | |||||||||||||||
| With CDSC1 | -7.39 | 1.73 | 3.22 | |||||||||||||||||
| Class Y (Inception 7/30/10) | ||||||||||||||||||||
| NAV | -5.47 | 2.77 | 4.26 | 1.48 | 1.48 | |||||||||||||||
| Comparative Performance | ||||||||||||||||||||
| Credit Suisse Managed Futures Liquid Index2 | 4.19 | 4.33 | 3.59 | |||||||||||||||||
| SG Trend Index3 | -6.19 | 2.16 | 2.64 | |||||||||||||||||
Performance data shown represents past performance and is no guarantee of, and not necessarily indicative of, future results. Total return and value will vary, and you may have a gain or loss when shares are sold. Current performance may be lower or higher than quoted. For most recent month-end performance, visit ngam.natixis.com. Performance for other share classes will be greater or less than shown based on differences in fees and sales charges. You may not invest directly in an index. Performance for periods less than one year is cumulative, not annualized. Returns reflect changes in share price and reinvestment of dividends and capital gains, if any. The table(s) do not reflect taxes shareholders might owe on any fund distributions or when they redeem their shares.
| 1 | Performance for Class C shares assumes a 1% contingent deferred sales charge (“CDSC”) applied when you sell shares within one year of purchase. |
| 2 | Effective March 7, 2016, the Credit Suisse Managed Futures Liquid Index replaced the SG Trend Index as the Fund’s primary benchmark because the Fund believes the Credit Suisse Managed Futures Liquid Index is a more appropriate comparison to the Fund’s investment strategies. Credit Suisse Managed Futures Liquid Index seeks to gain broad exposure to the Managed Futures strategy using a pre-defined quantitative methodology to invest in a range of asset classes including: equities, fixed income, commodities and currencies. |
| 3 | SG Trend Index is equal-weighted and reconstituted annually. The index calculates the net daily rate of return for a pool of trend following based hedge fund managers. You may not invest directly in an index. Effective January 5, 2016, the Newedge Trend Index was rebranded to the SG Trend Index. There has been no change to the calculation or definition of the index. |
| 4 | Fund performance has been increased by fee waivers and/or expense reimbursements, if any, without which performance would have been lower. |
| 5 | As of the most recent prospectus, the investment advisor has contractually agreed to waive fees and/or reimburse expenses (with certain exceptions) once the expense cap of the Fund has been exceeded. This arrangement is set to expire on 04/30/2017. When an expense cap has not been exceeded, the fund may have similar expense ratios. |
15 |
Table of Contents
ASG TACTICAL U.S. MARKET FUND
| Managers | Symbols | |
| Andrew W. Lo, PhD | Class A USMAX | |
| Alexander D. Healy, PhD | Class C USMCX | |
| Peter A. Lee | Class Y USMYX | |
| Philippe P. Lüdi, CFA®, PhD | ||
| Robert W. Sinnott | ||
| Robert S. Rickard | ||
| AlphaSimplex Group, LLC (Adviser) | ||
| Kevin H. Maeda | ||
| Serena V. Stone, CFA® | ||
| Active Index Advisors, a division of NGAM Advisors, L.P. (Subadviser) | ||
Investment Goal
The Fund seeks long-term capital appreciation, with emphasis on the protection of capital during unfavorable market conditions.
Market Conditions
Economic policy divergences and political shocks took center stage for investors and financial markets in 2016.
Equity markets began the year in risk-off fashion. Deflationary fears following the U.S. Federal Reserve’s (Fed) rate hike in December were the main catalyst. Concerns that higher rates in the United States would pull capital from emerging markets drove a sharp, widespread sell-off, led by China. As equities retreated, global bond yields plummeted in response and energy markets fell. Responding to the weakening global outlook and elevated risks of deflation, several major central banks eased policies further, compounding the divergence between the Fed’s positioning and the rest of the world’s. The Bank of Japan (BoJ) eased policy rates into negative territory while the European Central Bank (ECB) cut rates and expanded its Quantitative Easing (QE) program. Equity, fixed-income, credit and commodity markets recovered through the first quarter and stabilized throughout much of the second quarter as a result.
The macro event shocker in June was Brexit, the vote by the United Kingdom to leave the European Union (EU). Initially, polls indicated that the “remain” vote would win and investors were in risk-on mode. However, as the results became clear, the British pound staged a massive sell-off as panic set in. The initial panic was brief, however, and equity and bond markets recovered as investors assessed the benefits of a weaker pound and the prospect for easing from the Bank of England (BoE). The BoE did follow through, reducing interest rates and expanding its QE program.
The second half of the year was met with some caution ahead of the U.S. presidential election. Equity markets remained in narrow ranges as the campaign became more contentious. Other global macro events during this period included the BoJ targeting bond yields and the ECB announcing an extension of its QE program. Despite this further
| 16
Table of Contents
ASG TACTICAL U.S. MARKET FUND
easing, bond yields inched higher prior to the U.S. election, as investors focused on the potential for an interest rate hike by the Fed in December. The move from the ECB and the BoJ had investors wondering if yields had already reached their lows, as the moves were perceived by investors as tapering rather than easing. Meanwhile, the British pound suffered what many referred to as a “flash crash” in October, as investors remained concerned about the Brexit fallout.
The win by Donald Trump stunned markets and investors alike. After the initial shock and very brief risk-off sentiment, investors began to anticipate that policies in a Trump administration with a Republican House and Senate would be geared towards generating stronger GDP growth. As such, equity markets recovered strongly while the U.S. dollar surged. Bond yields responded to both the Trump victory and the Fed’s interest rate hike in December. Emerging markets reacted negatively towards the Trump victory, as the prospect of trade adjustments could impact local economies. Additional pressure on emerging markets came from falling local currencies, resulting from the U.S. dollar surge and rising interest rates. China reacted to ongoing weakness in FX reserves, bad loans and money market data with tighter capital controls and liquidity provisions. Energy markets helped support commodity indexes for the year as the Organization of the Petroleum Exporting Countries (OPEC) announced the first cuts in nearly a decade.
Performance Results
For the 12 months ended December 31, 2016, Class A shares of ASG Tactical U.S. Market Fund returned 4.09% at net asset value. The Fund’s benchmark, the S&P 500® Index, returned 11.96% over the same period. It is important to note that there are material differences between the Fund and its benchmark.
Explanation of Fund Performance
The Fund’s strategy is to manage a core portfolio of large-capitalization U.S. equities and exchange-traded funds, together with an overlay of futures contracts that is designed to increase or decrease the portfolio’s overall equity market exposure based on a proprietary model of risk-of-loss. During periods when the risk-of-loss in the U.S. equity market appears high, the futures overlay is employed to reduce the portfolio’s sensitivity to the market; during more favorable periods, the overlay is employed to increase the portfolio’s market participation.
During the 12-month period ended December 31, 2016, the core equity portfolio offered performance broadly consistent with the performance of U.S. equity markets, although it did underperform the benchmark for the period, due largely to stock-specific underperformance within the industrial, healthcare, energy and real estate sectors. In addition to the core equity portfolio, the Fund also held positions in futures contracts on the S&P 500® index in order to adjust the Fund’s market participation based on market conditions.
At the beginning of 2016, the manager’s systematic, quantitative assessment of recent risk and return in U.S. equity markets suggested that overall equity risk was high compared to historical norms, leading to a target equity exposure between 25% and 50%. While this defensive position throughout the first quarter helped to mitigate the sharp equity losses and volatility in January, it meant that the Fund did not participate fully in the
17 |
Table of Contents
benchmark’s ensuing rally that began in March, contributing to the difference in performance for the period. Although the Fund’s defensive position during the first half of the year did not result in outperformance versus the benchmark, it did materially reduce the Fund’s annualized volatility (8.4% vs. 13.1% for the benchmark) as well as the Fund’s maximum peak-to-trough drawdown (-4.9% vs. -10.3% for the benchmark). For the second half of the year, the Fund targeted exposure between 75% and 100%, reaching 100% exposure by mid-August. Then, in response to heightened volatility in advance of the U.S. election in November, the target exposure was reduced to 75% for most of the month of November; as volatility subsided, the Fund ended the year with a 100% target exposure.
Outlook
The outlook for 2017 is highly unpredictable but offers both risk and opportunity for investors, as well as the potential for wide dispersion amongst and within asset classes. Potential macro themes include higher growth, more fiscal policy expansion and potentially higher inflation. There may also be increased volatility due to recent elections in the U.S., and upcoming elections in France and Germany.
Within the United States, the incoming Trump administration’s economic agenda could pursue tax and regulatory reform and large infrastructure projects. The exact details, and what can be passed even through a Republican Congress, are unclear, though growth expectations for the United States will be impacted. Further, how expectations and incoming economic data translate to future Fed policy may have a significant impact on bond yields, and interest rates could be expected to continue to rise, perhaps substantially. Similarly, with an aggressive growth and trade policy, the U.S. dollar should outperform, particularly against emerging markets and countries running large trade surpluses with the United States. There may also be a push-pull scenario in credit markets, where the push from a prospectively better economic growth profile may be counterbalanced by a pull from potentially significantly higher rates.
Rising rates and a strong U.S. dollar should impact policies across the globe, particularly in Europe, the United Kingdom and Japan, where aggressive monetary easing has been maintained. Investors have already been questioning the continued efficacy of further QE. As such, inflationary pressures could mount in Europe and Japan due to weakening currencies and stronger growth abroad. Policy makers might thus be persuaded to remove some monetary accommodation. Should growth in Europe falter, fiscal policy expansion may be more likely than monetary expansion, which could put further upward pressure on bond yields, notably in peripheral Europe.
The outlook for emerging markets, notably in China, is far murkier. Weakening currencies could lead to higher inflation expectations; trade surpluses may decline should trade deals be renegotiated with the incoming U.S. administration. Higher debt and leverage in emerging markets, especially China, combined with the potentially more attractive interest rate and growth outlook for the United States, make the group susceptible to capital outflows, creating a negative feedback loop to the economy(ies). Commodities may offer a potentially supportive factor for emerging markets. Despite projections of further gains in the U.S. dollar in 2017, commodity markets show potential for gains, should growth and inflation move higher.
| 18
Table of Contents
ASG TACTICAL U.S. MARKET FUND
Growth of $10,000 Investment in Class A Shares4
September 30, 2013 (inception) through December 31, 2016
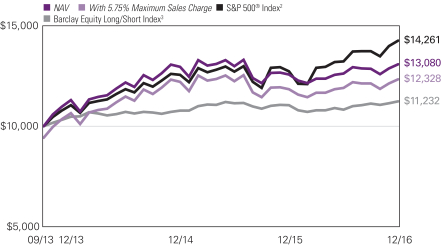
Top ten holdings as of December 31, 2016
| Security name | % of net assets |
|||||
| 1 | Amazon.com, Inc. | 1.84% | ||||
| 2 | Apple, Inc. | 1.70% | ||||
| 3 | Philip Morris International, Inc. | 1.43% | ||||
| 4 | Intel Corp. | 1.41% | ||||
| 5 | Microsoft Corp. | 1.35% | ||||
| 6 | Johnson & Johnson | 1.26% | ||||
| 7 | United Technologies Corp. | 1.26% | ||||
| 8 | AT&T, Inc. | 1.15% | ||||
| 9 | Exxon Mobil Corp. | 1.14% | ||||
| 10 | Procter & Gamble Co. (The) | 1.09% | ||||
The portfolio is actively managed and holdings are subject to change. There is no guarantee the Fund continues to invest in the securities referenced.
19 |
Table of Contents
Average Annual Total Returns — December 31, 20164
| Expense Ratios5 | ||||||||||||||||
| 1 Year | Life of Fund | Gross | Net | |||||||||||||
| Class A (Inception 9/30/13) | ||||||||||||||||
| NAV | 4.09 | % | 8.61 | % | 1.40 | % | 1.26 | % | ||||||||
| With 5.75% Maximum Sales Charge | -1.93 | 6.65 | ||||||||||||||
| Class C (Inception 9/30/13) | ||||||||||||||||
| NAV | 3.39 | 7.82 | 2.14 | 2.01 | ||||||||||||
| With CDSC1 | 2.39 | 7.82 | ||||||||||||||
| Class Y (Inception 9/30/13) | ||||||||||||||||
| NAV | 4.41 | 8.90 | 1.15 | 1.01 | ||||||||||||
| Comparative Performance | ||||||||||||||||
| S&P 500® Index2 | 11.96 | 11.53 | ||||||||||||||
| Barclay Equity Long/Short Index3 | 1.71 | 3.64 | ||||||||||||||
Performance data shown represents past performance and is no guarantee of, and not necessarily indicative of, future results. Total return and value will vary, and you may have a gain or loss when shares are sold. Current performance may be lower or higher than quoted. For most recent month-end performance, visit ngam.natixis.com. Performance for other share classes will be greater or less than shown based on differences in fees and sales charges. You may not invest directly in an index. Performance for periods less than one year is cumulative, not annualized. Returns reflect changes in share price and reinvestment of dividends and capital gains, if any. The table(s) do not reflect taxes shareholders might owe on any fund distributions or when they redeem their shares.
| 1 | Performance for Class C shares assumes a 1% contingent deferred sales charge (“CDSC”) applied when you sell shares within one year of purchase. |
| 2 | S&P 500® Index is widely recognized measure of U.S. stock market performance. It is an unmanaged index of 500 common stocks chosen for market size, liquidity, and industry group representation, among other factors. |
| 3 | Barclay Equity Long/Short Index is comprised of roughly 400 equity-oriented hedge funds which hold both long and short stock positions and tend to tactically vary their net market exposure, i.e., market beta, based on their assessment of market risk and expected return. Index returns are recalculated by BarclayHedge Ltd. Throughout each month. The fund does not expect to update the index returns provided if subsequent recalculations cause such returns to change. In addition, because of these recalculations, the Barclay Equity Long/Short Index returns reported by the fund may differ from the index returns for the same period published by others. |
| 4 | Fund performance has been increased by fee waivers and/or expense reimbursements, if any, without which performance would have been lower. |
| 5 | As of the most recent prospectus, the investment advisor has contractually agreed to waive fees and/or reimburse expenses (with certain exceptions) once the expense cap of the Fund has been exceeded. This arrangement is set to expire on 04/30/2017. When an expense cap has not been exceeded, the fund may have similar expense ratios. |
| 20
Table of Contents
ADDITIONAL INFORMATION
The views expressed in this report reflect those of the portfolio managers as of the dates indicated. The managers’ views are subject to change at any time without notice based on changes in market or other conditions. References to specific securities or industries should not be regarded as investment advice. Because the Funds are actively managed, there is no assurance that they will continue to invest in the securities or industries mentioned.
All investing involves risk, including the risk of loss. There is no assurance that any investment will meet its performance objectives or that losses will be avoided.
ADDITIONAL INDEX INFORMATION
This document may contain references to third party copyrights, indexes, and trademarks, each of which is the property of its respective owner. Such owner is not affiliated with Natixis Global Asset Management or any of its related or affiliated companies (collectively “NGAM”) and does not sponsor, endorse or participate in the provision of any NGAM services, funds or other financial products.
The index information contained herein is derived from third parties and is provided on an “as is” basis. The user of this information assumes the entire risk of use of this information. Each of the third party entities involved in compiling, computing or creating index information, disclaims all warranties (including, without limitation, any warranties of originality, accuracy, completeness, timeliness, non-infringement, merchantability and fitness for a particular purpose) with respect to such information.
PROXY VOTING INFORMATION
A description of the Natixis Funds’ proxy voting policies and procedures is available without charge, upon request, by calling Natixis Funds at 800-225-5478; on Natixis Funds’ website at ngam.natixis.com; and on the Securities and Exchange Commission’s (SEC) website at www.sec.gov. Information regarding how the Funds voted proxies relating to portfolio securities during the most recent 12-month period ended June 30 is available on Natixis Funds’ website and the SEC’s website.
QUARTERLY PORTFOLIO SCHEDULES
The Funds file a complete schedule of portfolio holdings with the SEC for the first and third quarters of each fiscal year on Form N-Q. The Funds’ Forms N-Q are available on the SEC’s website at www.sec.gov and may be reviewed and copied at the SEC’s Public Reference Room in Washington, DC. Information on the operation of the Public Reference Room may be obtained by calling 800-SEC-0330.
21 |
Table of Contents
UNDERSTANDING FUND EXPENSES
As a mutual fund shareholder, you incur different types of costs: transaction costs, including sales charges (loads) on purchases, contingent deferred sales charges on redemptions, and ongoing costs, including management fees, distribution and/or service fees (12b-1 fees), and other fund expenses. Certain exemptions may apply. These costs are described in more detail in the Funds’ prospectus. The following examples are intended to help you understand the ongoing costs of investing in the Funds and help you compare these with the ongoing costs of investing in other mutual funds.
The first line in the table for each class of Fund shares shows the actual account values and actual Fund expenses you would have paid on a $1,000 investment in the Fund from July 1, 2016 through December 31, 2016. To estimate the expenses you paid over the period, simply divide your account value by $1,000 (for example, $8,600 account value divided by $1,000 = 8.60) and multiply the result by the number in the Expenses Paid During Period column as shown for your Class.
The second line for the table of each class provides information about hypothetical account values and hypothetical expenses based on the Fund’s actual expense ratios and an assumed rate of return of 5% per year before expenses, which is not the Fund’s actual return. The hypothetical account values and expenses may not be used to estimate the actual ending account balance or expenses you paid on your investment for the period. You may use this information to compare the ongoing costs of investing in the Fund to other funds. To do so, compare this 5% hypothetical example with the 5% hypothetical examples that appear in the shareholder reports of the other funds.
Please note that the expenses shown reflect ongoing costs only, and do not include any transaction costs, such as sales charges. Therefore, the second line in the table of each Fund is useful in comparing ongoing costs only, and will not help you determine the relative costs of owning different funds. If transaction costs were included, total costs would be higher.
| 22
Table of Contents
| ASG DYNAMIC ALLOCATION FUND | BEGINNING ACCOUNT VALUE 7/1/2016 |
ENDING ACCOUNT VALUE 12/31/2016 |
EXPENSES PAID DURING PERIOD* 7/1/2016 – 12/31/2016 |
|||||||||
| Class A | ||||||||||||
| Actual | $1,000.00 | $1,027.20 | $5.91 | |||||||||
| Hypothetical (5% return before expenses) | $1,000.00 | $1,019.30 | $5.89 | |||||||||
| Class C | ||||||||||||
| Actual | $1,000.00 | $1,022.50 | $9.71 | |||||||||
| Hypothetical (5% return before expenses) | $1,000.00 | $1,015.53 | $9.68 | |||||||||
| Class Y | ||||||||||||
| Actual | $1,000.00 | $1,027.80 | $4.64 | |||||||||
| Hypothetical (5% return before expenses) | $1,000.00 | $1,020.56 | $4.62 | |||||||||
| * | Expenses are equal to the Fund’s annualized expense ratio (after waiver/reimbursement): 1.16%, 1.91% and 0.91% for Class A, C and Y, respectively, multiplied by the average account value over the period, multiplied by the number of days in the most recent fiscal half-year (184), divided by 366 (to reflect the half-year period). |
| ASG GLOBAL ALTERNATIVES FUND | BEGINNING ACCOUNT VALUE 7/1/2016 |
ENDING ACCOUNT VALUE 12/31/2016 |
EXPENSES PAID DURING PERIOD* 7/1/2016 – 12/31/2016 |
|||||||||
| Class A | ||||||||||||
| Actual | $1,000.00 | $1,060.30 | $8.08 | |||||||||
| Hypothetical (5% return before expenses) | $1,000.00 | $1,017.29 | $7.91 | |||||||||
| Class C | ||||||||||||
| Actual | $1,000.00 | $1,056.20 | $11.94 | |||||||||
| Hypothetical (5% return before expenses) | $1,000.00 | $1,013.52 | $11.69 | |||||||||
| Class N | ||||||||||||
| Actual | $1,000.00 | $1,062.60 | $6.43 | |||||||||
| Hypothetical (5% return before expenses) | $1,000.00 | $1,018.90 | $6.29 | |||||||||
| Class Y | ||||||||||||
| Actual | $1,000.00 | $1,061.50 | $6.79 | |||||||||
| Hypothetical (5% return before expenses) | $1,000.00 | $1,018.55 | $6.65 | |||||||||
| * | Expenses are equal to the Fund’s annualized expense ratio, including expenses of the Subsidiary (see Note 1 of Notes to Financial Statements) and interest expense: 1.56%, 2.31%, 1.24% and 1.31% for Class A, C, N and Y, respectively, multiplied by the average account value over the period, multiplied by the number of days in the most recent fiscal half-year (184), divided by 366 (to reflect the half-year period). |
23 |
Table of Contents
| ASG MANAGED FUTURES STRATEGY FUND | BEGINNING ACCOUNT VALUE 7/1/2016 |
ENDING ACCOUNT VALUE 12/31/2016 |
EXPENSES PAID DURING PERIOD* 7/1/2016 – 12/31/2016 |
|||||||||
| Class A | ||||||||||||
| Actual | $1,000.00 | $895.60 | $8.29 | |||||||||
| Hypothetical (5% return before expenses) | $1,000.00 | $1,016.39 | $8.82 | |||||||||
| Class C | ||||||||||||
| Actual | $1,000.00 | $891.20 | $11.84 | |||||||||
| Hypothetical (5% return before expenses) | $1,000.00 | $1,012.62 | $12.60 | |||||||||
| Class Y | ||||||||||||
| Actual | $1,000.00 | $896.10 | $7.10 | |||||||||
| Hypothetical (5% return before expenses) | $1,000.00 | $1,017.65 | $7.56 | |||||||||
| * | Expenses are equal to the Fund’s annualized expense ratio (after waiver/reimbursement), including expenses of the Subsidiary (see Note 1 of Notes to Financial Statements) and interest expense: 1.74%, 2.49% and 1.49% for Class A, C and Y, respectively, multiplied by the average account value over the period, multiplied by the number of days in the most recent fiscal half-year (184), divided by 366 (to reflect the half-year period). |
| ASG TACTICAL U.S. MARKET FUND | BEGINNING ACCOUNT VALUE 7/1/2016 |
ENDING ACCOUNT VALUE 12/31/2016 |
EXPENSES PAID DURING PERIOD* 7/1/2016 – 12/31/2016 |
|||||||||
| Class A | ||||||||||||
| Actual | $1,000.00 | $1,036.40 | $6.40 | |||||||||
| Hypothetical (5% return before expenses) | $1,000.00 | $1,018.85 | $6.34 | |||||||||
| Class C | ||||||||||||
| Actual | $1,000.00 | $1,032.10 | $10.22 | |||||||||
| Hypothetical (5% return before expenses) | $1,000.00 | $1,015.08 | $10.13 | |||||||||
| Class Y | ||||||||||||
| Actual | $1,000.00 | $1,037.80 | $5.12 | |||||||||
| Hypothetical (5% return before expenses) | $1,000.00 | $1,020.11 | $5.08 | |||||||||
| * | Expenses are equal to the Fund’s annualized expense ratio (after waiver/reimbursement): 1.25%, 2.00% and 1.00% for Class A, C and Y, respectively, multiplied by the average account value over the period, multiplied by the number of days in the most recent fiscal half-year (184), divided by 366 (to reflect the half-year period). |
| 24
Table of Contents
Portfolio of Investments – as of December 31, 2016
ASG Dynamic Allocation Fund
| Shares |
Description | Value (†) | ||||||
| Exchange-Traded Funds — 41.3% | ||||||||
| 6,209 | iShares® Core U.S. Aggregate Bond ETF | $ | 670,945 | |||||
| 6,044 | iShares® Edge MSCI Min Vol Emerging Markets ETF | 295,612 | ||||||
| 2,666 | iShares® JP Morgan USD Emerging Markets Bond ETF | 293,846 | ||||||
| 27,311 | SPDR® Bloomberg Barclays International Treasury Bond ETF(b) | 709,540 | ||||||
| 5,582 | Vanguard FTSE All World ex-U.S. Small-Cap ETF | 524,875 | ||||||
| 14,741 | Vanguard FTSE Developed Markets ETF | 538,636 | ||||||
| 8,851 | Vanguard FTSE Emerging Markets ETF | 316,689 | ||||||
| 11,253 | Vanguard FTSE Europe ETF | 539,469 | ||||||
| 9,196 | Vanguard FTSE Pacific ETF | 534,471 | ||||||
| 7,843 | Vanguard Intermediate-Term Corporate Bond ETF | 672,145 | ||||||
| 8,474 | Vanguard Mid-Cap ETF | 1,115,433 | ||||||
| 13,955 | Vanguard Total International Bond ETF | 757,617 | ||||||
| 9,725 | Vanguard Total Stock Market ETF | 1,121,487 | ||||||
| 12,299 | Vanguard Value ETF | 1,143,930 | ||||||
|
|
|
|||||||
| Total Exchange-Traded Funds (Identified Cost $9,166,215) |
9,234,695 | |||||||
|
|
|
|||||||
| Principal Amount |
||||||||
| Short-Term Investments — 57.2% | ||||||||
| Certificates of Deposit — 41.8% | ||||||||
| $ | 500,000 | KBC Bank NV (NY), 0.610%, 1/04/2017 | 499,993 | |||||
| 750,000 | Sumitomo Mitsui Bank (NY), 1.063%, 1/04/2017(c) | 750,060 | ||||||
| 800,000 | Landesbank Hessen (NY), 0.570%, 1/05/2017 | 800,019 | ||||||
| 800,000 | Bank of Tokyo-Mitsubishi UFJ Ltd. (NY), 0.640%, 1/05/2017 | 800,024 | ||||||
| 500,000 | Abbey National Treasury Services PLC (CT), 0.680%, 1/05/2017 | 499,998 | ||||||
| 800,000 | Dexia Credit Local, (Credit Support: Belgium/France/Luxembourg), 1.034%, 1/09/2017(c) | 800,094 | ||||||
| 500,000 | National Australia Bank, 1.100%, 2/08/2017(d) | 500,252 | ||||||
| 700,000 | Credit Industriel et Commercial (NY), 1.020%, 3/15/2017 | 700,633 | ||||||
| 500,000 | Sumitomo Mitsui Trust Bank (NY), 1.335%, 4/03/2017(c) | 500,546 | ||||||
| 500,000 | Deutsche Zentral-Genossenschaftsbank (NY), 1.200%, 4/24/2017 | 499,864 | ||||||
| 800,000 | Skandinaviska Enskilda Banken AB (NY), 1.074%, 6/02/2017(c)(d) | 800,221 | ||||||
| 500,000 | Bank of Nova Scotia (TX), 1.087%, 6/14/2017(c) | 500,006 | ||||||
| 500,000 | Norinchukin Bank (NY), 1.300%, 6/19/2017(d) | 500,188 | ||||||
| 500,000 | Banco Del Estado de Chile, 1.229%, 7/05/2017(c)(d) | 500,150 | ||||||
| 700,000 | Toronto Dominion Bank (NY), 1.382%, 8/10/2017(c)(d) | 701,151 | ||||||
|
|
|
|||||||
| 9,353,199 | ||||||||
|
|
|
|||||||
| Time Deposits — 8.5% | ||||||||
| 900,000 | Canadian Imperial Bank of Commerce, 0.520%, 1/03/2017 | 900,000 | ||||||
| 1,000,000 | National Bank of Kuwait, 0.550%, 1/03/2017(c) | 1,000,000 | ||||||
|
|
|
|||||||
| 1,900,000 | ||||||||
|
|
|
|||||||
| Commercial Paper — 3.6% | ||||||||
| 800,000 | Cofco Capital Corp., (Credit Support: Australian & New Zealand Banking Group Ltd.), 0.700%, 1/05/2017(e) | 799,930 | ||||||
|
|
|
|||||||
See accompanying notes to financial statements.
25 |
Table of Contents
Portfolio of Investments – as of December 31, 2016
ASG Dynamic Allocation Fund – (continued)
| Principal Amount |
Description | Value (†) | ||||||
| Treasuries — 3.3% | ||||||||
| $ | 200,000 | U.S. Treasury Bills, 0.325%, 1/19/2017(e)(f) | $ | 199,963 | ||||
| 150,000 | U.S. Treasury Bills, 0.323%, 2/16/2017(e)(f) | 149,920 | ||||||
| 400,000 | U.S. Treasury Bills, 0.249%, 3/23/2017(e)(f) | 399,561 | ||||||
|
|
|
|||||||
| 749,444 | ||||||||
|
|
|
|||||||
| Total Short-Term Investments (Identified Cost $12,799,822) |
12,802,573 | |||||||
|
|
|
|||||||
| Total Investments — 98.5% (Identified Cost $21,966,037)(a) |
22,037,268 | |||||||
| Other assets less liabilities — 1.5% | 334,754 | |||||||
|
|
|
|||||||
| Net Assets — 100.0% | $ | 22,372,022 | ||||||
|
|
|
|||||||
| (†) | See Note 2 of Notes to Financial Statements. | |||||||
| (a) | Federal Tax Information: | |||||||
| At December 31, 2016, the net unrealized appreciation on investments based on a cost of $21,978,317 for federal income tax purposes was as follows: | ||||||||
| Aggregate gross unrealized appreciation for all investments in which there is an excess of value over tax cost | $ | 258,982 | ||||||
| Aggregate gross unrealized depreciation for all investments in which there is an excess of tax cost over value | (200,031 | ) | ||||||
|
|
|
|||||||
| Net unrealized appreciation | $ | 58,951 | ||||||
|
|
|
|||||||
| (b) | Non-income producing security. | |||||||
| (c) | Variable rate security. Rate as of December 31, 2016 is disclosed. | |||||||
| (d) | Security (or a portion thereof) has been designated to cover the Fund’s obligations under open derivative contracts. | |||||||
| (e) | Interest rate represents discount rate at time of purchase; not a coupon rate. | |||||||
| (f) | Security (or a portion thereof) has been pledged as collateral for open derivative contracts. | |||||||
| ETF | Exchange-Traded Fund | |||||||
| SPDR | Standard & Poor’s Depositary Receipt | |||||||
At December 31, 2016, open long futures contracts were as follows:
| Financial Futures | Expiration Date |
Contracts | Notional Value |
Unrealized Appreciation (Depreciation) |
||||||||||||
| ASX SPI 200TM |
3/16/2017 | 6 | $ | 607,510 | $ | 8,594 | ||||||||||
| CAC 40® |
1/20/2017 | 12 | 613,489 | 9,889 | ||||||||||||
| E-mini Dow |
3/17/2017 | 25 | 2,465,000 | 19,115 | ||||||||||||
| E-mini NASDAQ 100 |
3/17/2017 | 25 | 2,432,000 | 738 | ||||||||||||
| E-mini S&P 500® |
3/17/2017 | 22 | 2,459,875 | (20,295 | ) | |||||||||||
| EURO STOXX 50® |
3/17/2017 | 18 | 619,505 | 12,241 | ||||||||||||
| FTSE 100 Index |
3/17/2017 | 7 | 606,227 | 10,177 | ||||||||||||
| FTSE/JSE Top 40 Index |
3/16/2017 | 9 | 288,999 | (6,125 | ) | |||||||||||
See accompanying notes to financial statements.
| 26
Table of Contents
Portfolio of Investments – as of December 31, 2016
ASG Dynamic Allocation Fund – (continued)
| Financial Futures – (continued) | Expiration Date |
Contracts | Notional Value |
Unrealized Appreciation (Depreciation) |
||||||||||||
| Hang Seng Index® |
1/26/2017 | 2 | $ | 282,009 | $ | 2,365 | ||||||||||
| Mini-Russell 2000 |
3/17/2017 | 36 | 2,442,420 | (50,630 | ) | |||||||||||
| MSCI Singapore |
1/27/2017 | 13 | 286,142 | (57 | ) | |||||||||||
| MSCI Taiwan Index |
1/23/2017 | 8 | 273,786 | 2,366 | ||||||||||||
| S&P CNX Nifty Futures Index |
1/25/2017 | 19 | 310,133 | 8,242 | ||||||||||||
| TOPIX |
3/09/2017 | 4 | 518,362 | 6,961 | ||||||||||||
|
|
|
|||||||||||||||
| Total |
|
$ | 3,581 | |||||||||||||
|
|
|
|||||||||||||||
Investment Summary at December 31, 2016
| Certificates of Deposit |
41.8 | % | ||
| Exchange-Traded Funds |
41.3 | |||
| Time Deposits |
8.5 | |||
| Commercial Paper |
3.6 | |||
| Treasuries |
3.3 | |||
|
|
|
|||
| Total Investments |
98.5 | |||
| Other assets less liabilities (including futures contracts) |
1.5 | |||
|
|
|
|||
| Net Assets |
100.0 | % | ||
|
|
|
See accompanying notes to financial statements.
27 |
Table of Contents
Consolidated Portfolio of Investments – as of December 31, 2016
ASG Global Alternatives Fund
| Principal Amount |
Description | Value (†) | ||||||
| Short-Term Investments — 97.2% | ||||||||
| Certificates of Deposit — 79.0% | ||||||||
| $ | 70,000,000 | KBC Bank NV (NY), 0.610%, 1/04/2017 | $ | 69,999,047 | ||||
| 66,000,000 | Bank of Tokyo-Mitsubishi UFJ Ltd. (NY), 0.640%, 1/05/2017 | 66,002,000 | ||||||
| 75,000,000 | Abbey National Treasury Services PLC (CT), 0.680%, 1/05/2017 | 74,999,747 | ||||||
| 50,000,000 | Oversea-Chinese Banking Corp. Ltd. (NY), 0.700%, 1/05/2017 | 49,999,993 | ||||||
| 47,000,000 | Royal Bank of Canada (NY), 0.860%, 1/05/2017 | 47,001,222 | ||||||
| 50,000,000 | Sumitomo Mitsui Trust Bank (NY), 0.690%, 1/06/2017 | 50,001,234 | ||||||
| 50,000,000 | Dexia Credit Local, (Credit Support: Belgium/France/Luxembourg), 1.034%, 1/09/2017(b) | 50,005,900 | ||||||
| 75,000,000 | Credit Agricole Corporate & Investment Bank (NY), 0.650%, 1/12/2017 | 75,002,650 | ||||||
| 70,000,000 | Landesbank Hessen (NY), 0.710%, 1/17/2017 | 70,007,903 | ||||||
| 5,000,000 | Sumitomo Mitsui Bank (NY), 1.439%, 1/20/2017(b) | 5,002,175 | ||||||
| 73,000,000 | Svenska Handelsbanken (NY), 1.205%, 2/03/2017(b) | 73,044,457 | ||||||
| 25,000,000 | Westpac Banking Corp. (NY), 1.171%, 2/06/2017(b) | 25,012,275 | ||||||
| 60,000,000 | National Australia Bank, 1.100%, 2/08/2017(c) | 60,030,240 | ||||||
| 57,000,000 | Skandinaviska Enskilda Banken AB (NY), 1.254%, 2/09/2017(b) | 57,039,900 | ||||||
| 25,000,000 | Royal Bank of Canada (NY), 1.336%, 2/17/2017(b)(c) | 25,020,900 | ||||||
| 50,000,000 | Mizuho Bank Ltd. (NY), 1.436%, 2/17/2017(b)(c) | 50,048,600 | ||||||
| 5,000,000 | Mizuho Bank Ltd. (NY), 1.200%, 3/06/2017 | 5,003,229 | ||||||
| 20,000,000 | Deutsche Zentral-Genossenschaftsbank (NY), 1.150%, 3/09/2017(c) | 20,000,720 | ||||||
| 60,000,000 | Credit Industriel et Commercial (NY), 1.020%, 3/15/2017 | 60,054,278 | ||||||
| 10,000,000 | Oversea-Chinese Banking Corp. Ltd. (NY), 1.090%, 3/17/2017 | 10,002,147 | ||||||
| 35,000,000 | Toronto Dominion Bank (NY), 1.060%, 4/05/2017 | 35,002,558 | ||||||
| 2,000,000 | Sumitomo Mitsui Bank (NY), 1.370%, 4/13/2017(b) | 2,002,124 | ||||||
| 30,000,000 | Deutsche Zentral-Genossenschaftsbank (NY), 1.200%, 4/24/2017 | 29,991,859 | ||||||
| 25,000,000 | Royal Bank of Canada (NY), 1.049%, 5/08/2017(b) | 25,013,150 | ||||||
| 70,000,000 | Bank of Montreal (IL), 1.302%, 5/12/2017(b) | 70,086,590 | ||||||
| 6,000,000 | Mizuho Bank Ltd. (NY), 1.336%, 5/17/2017(b) | 6,002,292 | ||||||
| 10,000,000 | Royal Bank of Canada (NY), 1.044%, 6/12/2017(b) | 10,001,410 | ||||||
| 50,000,000 | Bank of Nova Scotia (TX), 1.087%, 6/14/2017(b) | 50,000,600 | ||||||
| 50,000,000 | Norinchukin Bank (NY), 1.300%, 6/19/2017 | 50,018,776 | ||||||
| 50,000,000 | Banco Del Estado de Chile, 1.229%, 7/05/2017(b)(c) | 50,015,000 | ||||||
| 15,000,000 | Toronto Dominion Bank (NY), 1.382%, 8/10/2017(b) | 15,024,660 | ||||||
|
|
|
|||||||
| 1,286,437,636 | ||||||||
|
|
|
|||||||
| Time Deposits — 7.3% | ||||||||
| 42,000,000 | Canadian Imperial Bank of Commerce, 0.520%, 1/03/2017 | 42,000,000 | ||||||
| 77,000,000 | National Bank of Kuwait, 0.550%, 1/03/2017(b) | 77,000,000 | ||||||
|
|
|
|||||||
| 119,000,000 | ||||||||
|
|
|
|||||||
| Treasuries — 4.9% | ||||||||
| 35,500,000 | U.S. Treasury Bills, 0.325%, 1/19/2017(d)(e) | 35,493,468 | ||||||
| 21,400,000 | U.S. Treasury Bills, 0.450%, 2/16/2017(d)(e) | 21,388,487 | ||||||
| 22,900,000 | U.S. Treasury Bills, 0.500%, 3/23/2017(d)(e) | 22,874,879 | ||||||
|
|
|
|||||||
| 79,756,834 | ||||||||
|
|
|
|||||||
| Other Notes — 3.1% | ||||||||
| 50,000,000 | Bank of America N.A., 0.820%, 2/02/2017(b) | 50,000,750 | ||||||
|
|
|
|||||||
See accompanying notes to financial statements.
| 28
Table of Contents
Consolidated Portfolio of Investments – as of December 31, 2016
ASG Global Alternatives Fund – (continued)
| Principal Amount |
Description | Value (†) | ||||||
| Commercial Paper — 2.9% | ||||||||
| $ | 47,000,000 | Cofco Capital Corp., (Credit Support: Australian & New Zealand Banking Group Ltd.), 0.700%, 1/04/2017(d) | $ | 46,996,606 | ||||
|
|
|
|||||||
| Total Short-Term Investments (Identified Cost $1,581,756,774) |
1,582,191,826 | |||||||
|
|
|
|||||||
| Shares | ||||||||
| Exchange-Traded Funds — 2.9% | ||||||||
| 556,035 | iShares® iBoxx $ High Yield Corporate Bond ETF (Identified Cost $47,649,851) |
48,124,829 | ||||||
|
|
|
|||||||
| Total Investments — 100.1% (Identified Cost $1,629,406,625)(a) |
1,630,316,655 | |||||||
| Other assets less liabilities — (0.1)% | (1,417,854 | ) | ||||||
|
|
|
|||||||
| Net Assets — 100.0% | $ | 1,628,898,801 | ||||||
|
|
|
|||||||
| (†) | See Note 2 of Notes to Financial Statements. | |||||||
| (a) | Federal Tax Information: | |||||||
| At December 31, 2016, the net unrealized appreciation on investments based on a cost of $1,629,406,625 for federal income tax purposes was as follows: | ||||||||
| Aggregate gross unrealized appreciation for all investments in which there is an excess of value over tax cost | $ | 2,704,367 | ||||||
| Aggregate gross unrealized depreciation for all investments in which there is an excess of tax cost over value | (1,794,337 | ) | ||||||
|
|
|
|||||||
| Net unrealized appreciation | $ | 910,030 | ||||||
|
|
|
|||||||
| (b) | Variable rate security. Rate as of December 31, 2016 is disclosed. | |||||||
| (c) | Security (or a portion thereof) has been designated to cover the Fund’s obligations under open derivative contracts. | |||||||
| (d) | Interest rate represents discount rate at time of purchase; not a coupon rate. | |||||||
| (e) | Security (or a portion thereof) has been pledged as collateral for open derivative contracts. | |||||||
At December 31, 2016, the Fund had the following open forward foreign currency contracts:
| Contract to Buy/Sell |
Delivery Date |
Currency | Units of Currency |
Notional Value |
Unrealized Appreciation (Depreciation) |
|||||||||||||
| Buy1 | 3/15/2017 | Australian Dollar | 54,400,000 | $ | 39,190,740 | $ | (1,556,111 | ) | ||||||||||
| Sell1 | 3/15/2017 | Canadian Dollar | 66,500,000 | 49,571,053 | 1,228,641 | |||||||||||||
| Sell1 | 3/15/2017 | Swedish Krona | 214,000,000 | 23,585,873 | (85,705 | ) | ||||||||||||
| Buy1 | 3/15/2017 | Swiss Franc | 18,750,000 | 18,493,841 | (152,059 | ) | ||||||||||||
|
|
|
|||||||||||||||||
| Total | $ | (565,234 | ) | |||||||||||||||
|
|
|
|||||||||||||||||
1 Counterparty is UBS AG
See accompanying notes to financial statements.
29 |
Table of Contents
Consolidated Portfolio of Investments – as of December 31, 2016
ASG Global Alternatives Fund – (continued)
At December 31, 2016, open long futures contracts were as follows:
| Financial Futures | Expiration Date |
Contracts | Notional Value |
Unrealized Appreciation (Depreciation) |
||||||||||||
| DAX |
3/17/2017 | 562 | $ | 169,078,294 | $ | 3,614,136 | ||||||||||
| E-mini MSCI Emerging Markets Index |
3/17/2017 | 123 | 5,282,235 | (122,385 | ) | |||||||||||
| E-mini S&P 500® |
3/17/2017 | 3,994 | 446,579,125 | (3,684,470 | ) | |||||||||||
| FTSE 100 Index |
3/17/2017 | 2,859 | 247,600,640 | 5,302,480 | ||||||||||||
| Hang Seng Index® |
1/26/2017 | 465 | 65,567,004 | 549,214 | ||||||||||||
| Mini-Russell 2000 |
3/17/2017 | 1,334 | 90,505,230 | (2,018,070 | ) | |||||||||||
| TOPIX |
3/09/2017 | 955 | 123,758,835 | 3,050,921 | ||||||||||||
| UK Long Gilt |
3/29/2017 | 37 | 5,737,696 | 96,386 | ||||||||||||
| 10 Year U.S. Treasury Note |
3/22/2017 | 647 | 80,409,969 | (760,110 | ) | |||||||||||
|
|
|
|||||||||||||||
| Total |
$ | 6,028,102 | ||||||||||||||
|
|
|
|||||||||||||||
| Commodity Futures2 | Expiration Date |
Contracts | Notional Value |
Unrealized Appreciation (Depreciation) |
||||||||||||
| Aluminum LME |
3/15/2017 | 37 | $ 1,565,794 | $ | (27,010 | ) | ||||||||||
| Brent Crude Oil |
1/31/2017 | 219 | 12,443,580 | 480,810 | ||||||||||||
| Copper LME |
3/15/2017 | 323 | 44,693,106 | (1,891,324 | ) | |||||||||||
| WTI Crude Oil |
1/20/2017 | 11 | 590,920 | 11,140 | ||||||||||||
|
|
|
|||||||||||||||
| Total |
$ | (1,426,384 | ) | |||||||||||||
|
|
|
|||||||||||||||
At December 31, 2016, open short futures contracts were as follows:
| Financial Futures | Expiration Date |
Contracts | Notional Value |
Unrealized Appreciation (Depreciation) |
||||||||||||
| British Pound |
3/13/2017 | 19 | $ | 1,467,512 | $ | 43,888 | ||||||||||
| Euro |
3/13/2017 | 2,159 | 285,365,825 | 2,850,287 | ||||||||||||
| Eurodollar |
3/13/2017 | 4,561 | 1,128,391,400 | 838,175 | ||||||||||||
| German Euro Bund |
3/08/2017 | 484 | 83,631,602 | (1,479,395 | ) | |||||||||||
| Japanese Yen |
3/13/2017 | 288 | 30,949,200 | 422,131 | ||||||||||||
| 2 Year U.S. Treasury Note |
3/31/2017 | 1,019 | 220,804,563 | 134,172 | ||||||||||||
|
|
|
|||||||||||||||
| Total |
$ | 2,809,258 | ||||||||||||||
|
|
|
|||||||||||||||
| Commodity Futures2 | Expiration Date |
Contracts | Notional Value |
Unrealized Appreciation (Depreciation) |
||||||||||||
| Aluminum LME |
3/15/2017 | 37 | $ 1,565,794 | $ | 17,806 | |||||||||||
| Gold |
2/24/2017 | 409 | 47,104,530 | (449,750 | ) | |||||||||||
|
|
|
|||||||||||||||
| Total |
$ | (431,944 | ) | |||||||||||||
|
|
|
|||||||||||||||
2 Commodity futures are held by ASG Global Alternatives Cayman Fund Ltd., a wholly-owned subsidiary. See Note 1 of Notes to Financial Statements.
See accompanying notes to financial statements.
| 30
Table of Contents
Consolidated Portfolio of Investments – as of December 31, 2016
ASG Global Alternatives Fund – (continued)
Investment Summary at December 31, 2016
| Certificates of Deposit |
79.0 | % | ||
| Time Deposits |
7.3 | |||
| Treasuries |
4.9 | |||
| Other Notes |
3.1 | |||
| Exchange-Traded Funds |
2.9 | |||
| Commercial Paper |
2.9 | |||
|
|
|
|||
| Total Investments |
100.1 | |||
| Other assets less liabilities (including forward foreign currency and futures contracts) |
(0.1 | ) | ||
|
|
|
|||
| Net Assets |
100.0 | % | ||
|
|
|
See accompanying notes to financial statements.
31 |
Table of Contents
Consolidated Portfolio of Investments – as of December 31, 2016
ASG Managed Futures Strategy Fund
| Principal Amount |
Description | Value (†) | ||||||
| Short-Term Investments — 97.9% of Net Assets | ||||||||
| Certificates of Deposit — 79.3% | ||||||||
| $ | 75,000,000 | Sumitomo Mitsui Trust Bank (NY), 1.135%, 1/03/2017(b) | $ | 75,004,125 | ||||
| 125,000,000 | KBC Bank NV (NY), 0.610%, 1/04/2017 | 124,998,299 | ||||||
| 150,000,000 | Sumitomo Mitsui Bank (NY), 1.063%, 1/04/2017(b) | 150,012,000 | ||||||
| 125,000,000 | Landesbank Hessen (NY), 0.570%, 1/05/2017 | 125,002,952 | ||||||
| 125,000,000 | Abbey National Treasury Services PLC (CT), 0.680%, 1/05/2017 | 124,999,579 | ||||||
| 25,000,000 | Oversea-Chinese Banking Corp. Ltd. (NY), 0.700%, 1/05/2017 | 24,999,997 | ||||||
| 47,800,000 | Royal Bank of Canada (NY), 0.860%, 1/05/2017 | 47,801,243 | ||||||
| 50,000,000 | Sumitomo Mitsui Trust Bank (NY), 0.690%, 1/06/2017 | 50,001,234 | ||||||
| 100,000,000 | Dexia Credit Local, (Credit Support: Belgium/France/Luxembourg), 1.034%, 1/09/2017(b) | 100,011,800 | ||||||
| 2,976,000 | Skandinaviska Enskilda Banken AB (NY), 1.084%, 1/09/2017(b) | 2,976,393 | ||||||
| 66,400,000 | Oversea-Chinese Banking Corp. Ltd. (NY), 0.890%, 1/11/2017 | 66,404,174 | ||||||
| 125,000,000 | Credit Agricole Corporate & Investment Bank (NY), 0.650%, 1/12/2017 | 125,004,416 | ||||||
| 90,000,000 | Mizuho Bank Ltd. (NY), 1.330%, 1/13/2017(b) | 90,024,660 | ||||||
| 10,000,000 | Svenska Handelsbanken (NY), 1.206%, 1/17/2017(b) | 10,002,840 | ||||||
| 40,000,000 | Svenska Handelsbanken (NY), 1.306%, 1/27/2017(b) | 40,020,200 | ||||||
| 27,000,000 | Svenska Handelsbanken (NY), 1.205%, 2/03/2017(b) | 27,016,443 | ||||||
| 75,000,000 | Westpac Banking Corp. (NY), 1.171%, 2/06/2017(b) | 75,036,825 | ||||||
| 75,000,000 | National Australia Bank, 1.100%, 2/08/2017(c) | 75,037,800 | ||||||
| 50,000,000 | Skandinaviska Enskilda Banken AB (NY), 1.254%, 2/09/2017(b) | 50,035,000 | ||||||
| 50,000,000 | Royal Bank of Canada (NY), 1.336%, 2/17/2017(b) | 50,041,800 | ||||||
| 50,000,000 | Mizuho Bank Ltd. (NY), 1.436%, 2/17/2017(b) | 50,048,600 | ||||||
| 115,000,000 | Deutsche Zentral-Genossenschaftsbank (NY), 1.150%, 3/09/2017(c) | 115,004,140 | ||||||
| 125,000,000 | Credit Industriel et Commercial (NY), 1.020%, 3/15/2017 | 125,113,079 | ||||||
| 40,000,000 | Oversea-Chinese Banking Corp. Ltd. (NY), 1.090%, 3/17/2017 | 40,008,587 | ||||||
| 3,000,000 | Sumitomo Mitsui Trust Bank (NY), 1.335%, 4/03/2017(b) | 3,003,273 | ||||||
| 75,000,000 | Toronto Dominion Bank (NY), 1.060%, 4/05/2017 | 75,005,482 | ||||||
| 100,000,000 | Bank of Tokyo-Mitsubishi UFJ Ltd. (NY), 1.300%, 4/21/2017 | 100,094,972 | ||||||
| 19,500,000 | Deutsche Zentral-Genossenschaftsbank (NY), 1.200%, 4/24/2017 | 19,494,708 | ||||||
| 34,000,000 | Royal Bank of Canada (NY), 1.049%, 5/08/2017(b) | 34,017,884 | ||||||
| 120,000,000 | Bank of Montreal (IL), 1.302%, 5/12/2017(b)(c) | 120,148,440 | ||||||
| 39,300,000 | Royal Bank of Canada (NY), 1.044%, 6/12/2017(b) | 39,305,541 | ||||||
| 100,000,000 | Bank of Nova Scotia (TX), 1.087%, 6/14/2017(b) | 100,001,200 | ||||||
| 75,000,000 | Norinchukin Bank (NY), 1.300%, 6/19/2017 | 75,028,164 | ||||||
| 130,000,000 | Banco Del Estado de Chile, 1.229%, 7/05/2017(b) | 130,039,000 | ||||||
| 50,000,000 | Toronto Dominion Bank (NY), 1.382%, 8/10/2017(b)(c) | 50,082,200 | ||||||
|
|
|
|||||||
| 2,510,827,050 | ||||||||
|
|
|
|||||||
| Treasuries — 8.5% | ||||||||
| 101,000,000 | U.S. Treasury Bills, 0.245%-0.393%, 1/19/2017(d)(e)(f) | 100,981,416 | ||||||
| 95,500,000 | U.S. Treasury Bills, 0.322%-0.450%, 2/16/2017(d)(e)(f) | 95,448,621 | ||||||
| 29,500,000 | U.S. Treasury Bills, 0.455%-0.500%, 3/23/2017(d)(e)(f) | 29,467,639 | ||||||
| 44,500,000 | U.S. Treasury Bills, 0.530%, 4/20/2017(d)(e) | 44,428,399 | ||||||
|
|
|
|||||||
| 270,326,075 | ||||||||
|
|
|
|||||||
See accompanying notes to financial statements.
| 32
Table of Contents
Consolidated Portfolio of Investments – as of December 31, 2016
ASG Managed Futures Strategy Fund – (continued)
| Principal Amount |
Description | Value (†) | ||||||
| Time Deposits — 6.2% | ||||||||
| $ | 45,000,000 | Canadian Imperial Bank of Commerce, 0.520%, 1/03/2017 | $ | 45,000,000 | ||||
| 150,150,000 | National Bank of Kuwait, 0.550%, 1/03/2017(b) | 150,150,000 | ||||||
|
|
|
|||||||
| 195,150,000 | ||||||||
|
|
|
|||||||
| Other Notes — 2.4% | ||||||||
| 75,000,000 | Bank of America N.A., 0.820%, 2/02/2017(b) | 75,001,125 | ||||||
|
|
|
|||||||
| Commercial Paper — 1.5% | ||||||||
| 46,000,000 | Cofco Capital Corp., (Credit Support: Australian & New Zealand Banking Group Ltd.), 0.700%, 1/05/2017(d) | 45,995,975 | ||||||
|
|
|
|||||||
| Total Short-Term Investments (Identified Cost $3,096,470,672) |
3,097,300,225 | |||||||
|
|
|
|||||||
| Total Investments — 97.9% (Identified Cost $3,096,470,672)(a) |
3,097,300,225 | |||||||
| Other assets less liabilities — 2.1% | 67,039,163 | |||||||
|
|
|
|||||||
| Net Assets — 100.0% | $ | 3,164,339,388 | ||||||
|
|
|
|||||||
| (†) | See Note 2 of Notes to Financial Statements. | |||||||
| (a) | Federal Tax Information: | |||||||
| At December 31, 2016, the net unrealized appreciation on investments based on a cost of $3,096,470,672 for federal income tax purposes was as follows: | ||||||||
| Aggregate gross unrealized appreciation for all investments in which there is an excess of value over tax cost | $ | 862,361 | ||||||
| Aggregate gross unrealized depreciation for all investments in which there is an excess of tax cost over value | (32,808 | ) | ||||||
|
|
|
|||||||
| Net unrealized appreciation | $ | 829,553 | ||||||
|
|
|
|||||||
| (b) | Variable rate security. Rate as of December 31, 2016 is disclosed. | |||||||
| (c) | Security (or a portion thereof) has been designated to cover the Fund’s obligations under open derivative contracts. | |||||||
| (d) | Interest rate represents discount rate at time of purchase; not a coupon rate. | |||||||
| (e) | Security (or a portion thereof) has been pledged as collateral for open derivative contracts. | |||||||
| (f) | The Fund’s investment in U.S. Treasury Bills is comprised of various lots with differing discount rates. These separate investments, which have the same maturity date, have been aggregated for the purpose of presentation in the Portfolio of Investments. | |||||||
At December 31, 2016, the Fund had the following open forward foreign currency contracts:
| Contract to Buy/Sell |
Delivery Date |
Currency | Units of Currency |
Notional Value |
Unrealized Appreciation (Depreciation) |
|||||||||||||
| Buy1 | 3/15/2017 | Australian Dollar | 76,900,000 | $ | 55,400,145 | $ | (2,187,417 | ) | ||||||||||
| Sell1 | 3/15/2017 | Australian Dollar | 15,400,000 | 11,094,437 | (43,758 | ) | ||||||||||||
| Buy1 | 3/15/2017 | Canadian Dollar | 70,900,000 | 52,850,943 | (1,298,591 | ) | ||||||||||||
See accompanying notes to financial statements.
33 |
Table of Contents
Consolidated Portfolio of Investments – as of December 31, 2016
ASG Managed Futures Strategy Fund – (continued)
| Contract to Buy/Sell – (continued) |
Delivery Date |
Currency | Units of Currency |
Notional Value |
Unrealized Appreciation (Depreciation) |
|||||||||||||
| Sell1 | 3/15/2017 | Canadian Dollar | 9,700,000 | $ | 7,230,665 | $ | 34,228 | |||||||||||
| Sell1 | 3/15/2017 | Canadian Dollar | 87,300,000 | 65,075,985 | (627,209 | ) | ||||||||||||
| Sell1 | 3/15/2017 | Mexican Peso | 1,300,000,000 | 62,130,861 | 1,491,449 | |||||||||||||
| Buy1 | 3/15/2017 | New Zealand Dollar | 92,700,000 | 64,265,296 | (2,532,007 | ) | ||||||||||||
| Sell1 | 3/15/2017 | New Zealand Dollar | 10,300,000 | 7,140,589 | (56,400 | ) | ||||||||||||
| Buy1 | 3/15/2017 | Norwegian Krone | 78,000,000 | 9,036,806 | (236,057 | ) | ||||||||||||
| Sell1 | 3/15/2017 | Norwegian Krone | 286,000,000 | 33,134,956 | (179,432 | ) | ||||||||||||
| Buy1 | 3/15/2017 | Polish Zloty | 37,000,000 | 8,831,038 | (34,883 | ) | ||||||||||||
| Sell1 | 3/15/2017 | Polish Zloty | 680,500,000 | 162,419,497 | 436,312 | |||||||||||||
| Buy1 | 3/15/2017 | Singapore Dollar | 16,125,000 | 11,130,849 | (195,066 | ) | ||||||||||||
| Sell1 | 3/15/2017 | Singapore Dollar | 226,500,000 | 156,349,600 | 2,562,416 | |||||||||||||
| Sell1 | 3/15/2017 | Singapore Dollar | 18,500,000 | 12,770,276 | (14,761 | ) | ||||||||||||
| Buy1 | 3/15/2017 | South African Rand | 658,500,000 | 47,323,144 | (134,226 | ) | ||||||||||||
| Sell1 | 3/15/2017 | South African Rand | 78,000,000 | 5,605,475 | (80,949 | ) | ||||||||||||
| Buy1 | 3/15/2017 | Swedish Krona | 354,000,000 | 39,015,883 | 696,004 | |||||||||||||
| Buy1 | 3/15/2017 | Swedish Krona | 106,000,000 | 11,682,722 | (12,922 | ) | ||||||||||||
| Sell1 | 3/15/2017 | Swedish Krona | 2,450,000,000 | 270,025,179 | (981,204 | ) | ||||||||||||
| Buy1 | 3/15/2017 | Swiss Franc | 7,500,000 | 7,397,536 | (61,514 | ) | ||||||||||||
| Sell1 | 3/15/2017 | Swiss Franc | 180,250,000 | 177,787,460 | 1,461,792 | |||||||||||||
| Sell1 | 3/15/2017 | Turkish Lira | 425,400,000 | 118,774,909 | 896,156 | |||||||||||||
|
|
|
|||||||||||||||||
| Total | $ | (1,098,039 | ) | |||||||||||||||
|
|
|
|||||||||||||||||
1 Counterparty is UBS AG
At December 31, 2016, open long futures contracts were as follows:
| Financial Futures | Expiration Date |
Contracts | Notional Value |
Unrealized Appreciation (Depreciation) |
||||||||||||
|
AEX-Index® |
1/20/2017 | 1,803 | $ | 183,196,969 | $ | 3,449,205 | ||||||||||
| ASX SPI 200TM |
3/16/2017 | 1,180 | 119,476,946 | 2,274,737 | ||||||||||||
| CAC 40® |
1/20/2017 | 2,089 | 106,798,294 | 1,928,313 | ||||||||||||
| DAX |
3/17/2017 | 494 | 148,620,422 | 1,949,797 | ||||||||||||
| E-mini Dow |
3/17/2017 | 2,293 | 226,089,800 | 1,752,790 | ||||||||||||
| E-mini NASDAQ 100 |
3/17/2017 | 1,433 | 139,402,240 | (23,088 | ) | |||||||||||
| E-mini S&P 500® |
3/17/2017 | 1,166 | 130,373,375 | (1,075,635 | ) | |||||||||||
| Euribor |
6/19/2017 | 196 | 51,734,610 | 2,579 | ||||||||||||
| Euro Schatz |
3/08/2017 | 8,247 | 974,812,844 | 803,019 | ||||||||||||
| EURO STOXX 50® |
3/17/2017 | 2,783 | 95,782,313 | 1,734,999 | ||||||||||||
| Euro-BTP |
3/08/2017 | 332 | 47,288,130 | (36,369 | ) | |||||||||||
| Euro-OAT |
3/08/2017 | 758 | 121,138,547 | 1,144,389 | ||||||||||||
| FTSE 100 Index |
3/17/2017 | 1,087 | 94,138,474 | 2,016,256 | ||||||||||||
| FTSE MIB |
3/17/2017 | 394 | 39,697,356 | 23,646 | ||||||||||||
| German Euro BOBL |
3/08/2017 | 3,622 | 509,491,075 | 3,434,398 | ||||||||||||
| German Euro Bund |
3/08/2017 | 751 | 129,767,217 | 1,557,365 | ||||||||||||
| Hang Seng Index® |
1/26/2017 | 535 | 75,437,306 | 623,404 | ||||||||||||
| IBEX 35 |
1/20/2017 | 663 | 64,818,312 | 443,191 | ||||||||||||
See accompanying notes to financial statements.
| 34
Table of Contents
Consolidated Portfolio of Investments – as of December 31, 2016
ASG Managed Futures Strategy Fund – (continued)
| Financial Futures – (continued) | Expiration Date |
Contracts | Notional Value |
Unrealized Appreciation (Depreciation) |
||||||||||||
| Mini-Russell 2000 |
3/17/2017 | 2,051 | $ | 139,150,095 | $ | (3,103,320 | ) | |||||||||
| MSCI Singapore |
1/27/2017 | 3,232 | 71,139,389 | 5,329 | ||||||||||||
| MSCI Taiwan Index |
1/23/2017 | 2,941 | 100,650,592 | 870,402 | ||||||||||||
| Nikkei 225TM |
3/09/2017 | 882 | 143,725,307 | 2,894,449 | ||||||||||||
| OMXS30® |
1/20/2017 | 9,532 | 158,420,268 | (2,156,247 | ) | |||||||||||
| S&P CNX Nifty Futures Index |
1/25/2017 | 2,394 | 39,076,717 | 1,038,451 | ||||||||||||
| S&P/TSX 60 Index |
3/16/2017 | 1,466 | 195,859,740 | (48,833 | ) | |||||||||||
| Sterling |
3/15/2017 | 13,390 | 2,054,581,369 | (1,199,310 | ) | |||||||||||
| TOPIX |
3/09/2017 | 1,108 | 143,586,167 | 1,238,167 | ||||||||||||
| UK Long Gilt |
3/29/2017 | 571 | 88,546,606 | 1,475,071 | ||||||||||||
|
|
|
|||||||||||||||
| Total |
$ | 23,017,155 | ||||||||||||||
|
|
|
|||||||||||||||
| Commodity Futures2 | Expiration Date |
Contracts | Notional Value |
Unrealized Appreciation (Depreciation) |
||||||||||||
| Aluminum LME |
3/15/2017 | 1,490 | $ | 63,054,938 | $ | (717,063 | ) | |||||||||
| Brent Crude Oil |
1/31/2017 | 606 | 34,432,920 | 1,282,130 | ||||||||||||
| Coffee |
3/21/2017 | 439 | 22,561,856 | (4,701,900 | ) | |||||||||||
| Copper |
3/29/2017 | 964 | 60,382,550 | (162,962 | ) | |||||||||||
| Copper LME |
3/15/2017 | 533 | 73,750,544 | (3,103,470 | ) | |||||||||||
| Cotton |
3/09/2017 | 1,297 | 45,816,525 | 531,770 | ||||||||||||
| Gasoline |
1/31/2017 | 535 | 37,545,123 | 1,632,889 | ||||||||||||
| Live Cattle |
2/28/2017 | 121 | 5,616,820 | (98,180 | ) | |||||||||||
| Low Sulfur Gasoil |
2/10/2017 | 678 | 34,222,050 | 1,654,000 | ||||||||||||
| Natural Gas |
1/27/2017 | 592 | 22,046,080 | 1,720,840 | ||||||||||||
| New York Harbor ULSD |
1/31/2017 | 411 | 29,832,188 | 1,155,647 | ||||||||||||
| Nickel LME |
3/15/2017 | 599 | 35,979,534 | (3,834,798 | ) | |||||||||||
| Silver |
3/29/2017 | 160 | 12,791,200 | (538,675 | ) | |||||||||||
| Soybean |
3/14/2017 | 965 | 48,443,000 | (1,824,375 | ) | |||||||||||
| Soybean Meal |
3/14/2017 | 1,121 | 35,490,860 | 271,870 | ||||||||||||
| Soybean Oil |
3/14/2017 | 1,886 | 39,221,256 | 144,384 | ||||||||||||
| Sugar |
2/28/2017 | 739 | 16,148,037 | (2,542,456 | ) | |||||||||||
| WTI Crude Oil |
1/20/2017 | 576 | 30,942,720 | (70,310 | ) | |||||||||||
| Zinc LME |
3/15/2017 | 613 | 39,446,550 | (2,807,537 | ) | |||||||||||
|
|
|
|||||||||||||||
| Total |
$ | (12,008,196 | ) | |||||||||||||
|
|
|
|||||||||||||||
At December 31, 2016, open short futures contracts were as follows:
| Financial Futures | Expiration Date |
Contracts | Notional Value |
Unrealized Appreciation (Depreciation) |
||||||||||||
| British Pound |
3/13/2017 | 1,723 | $ | 133,080,212 | $ | 3,983,769 | ||||||||||
| Euro |
3/13/2017 | 2,658 | 351,321,150 | 3,339,562 | ||||||||||||
| Eurodollar |
3/13/2017 | 11,672 | 2,887,652,800 | 1,139,875 | ||||||||||||
| FTSE/JSE Top 40 Index |
3/16/2017 | 1,748 | 56,129,974 | 1,203,535 | ||||||||||||
| Japanese Yen |
3/13/2017 | 384 | 41,265,600 | (314,169 | ) | |||||||||||
| Ultra Long U.S. Treasury Bond |
3/22/2017 | 464 | 74,356,000 | (816,719 | ) | |||||||||||
See accompanying notes to financial statements.
35 |
Table of Contents
Consolidated Portfolio of Investments – as of December 31, 2016
ASG Managed Futures Strategy Fund – (continued)
| Financial Futures – (continued) | Expiration Date |
Contracts | Notional Value |
Unrealized Appreciation (Depreciation) |
||||||||||||
| 2 Year U.S. Treasury Note |
3/31/2017 | 4,919 | $ | 1,065,885,813 | $ | (1,267,670 | ) | |||||||||
| 3 Year Australia Government Bond |
3/15/2017 | 7,592 | 610,702,706 | 1,095,216 | ||||||||||||
| 5 Year U.S. Treasury Note |
3/31/2017 | 2,906 | 341,931,767 | 1,186,062 | ||||||||||||
| 10 Year Australia Government Bond |
3/15/2017 | 1,248 | 115,047,409 | (853,458 | ) | |||||||||||
| 10 Year Canada Government Bond |
3/22/2017 | 2,653 | 271,751,454 | (344,259 | ) | |||||||||||
| 10 Year U.S. Treasury Note |
3/22/2017 | 1,734 | 215,503,688 | 437,516 | ||||||||||||
| 30 Year U.S. Treasury Bond |
3/22/2017 | 437 | 65,836,781 | (804,500 | ) | |||||||||||
|
|
|
|||||||||||||||
| Total |
$ | 7,984,760 | ||||||||||||||
|
|
|
|||||||||||||||
| Commodity Futures2 | Expiration Date |
Contracts | Notional Value |
Unrealized Appreciation (Depreciation) |
||||||||||||
| Cocoa |
3/16/2017 | 2,059 | $ | 43,774,340 | $ | 9,135,490 | ||||||||||
| Copper LME |
3/15/2017 | 27 | 3,735,956 | 6,278 | ||||||||||||
| Corn |
3/14/2017 | 2,048 | 36,044,800 | (656,463 | ) | |||||||||||
| Gold |
2/24/2017 | 42 | 4,837,140 | (47,280 | ) | |||||||||||
| Wheat |
3/14/2017 | 3,225 | 65,790,000 | 800,813 | ||||||||||||
|
|
|
|||||||||||||||
| Total |
$ | 9,238,838 | ||||||||||||||
|
|
|
|||||||||||||||
2 Commodity futures are held by ASG Managed Futures Strategy Cayman Fund Ltd., a wholly-owned subsidiary. See Note 1 of Notes to Financial Statements.
Investment Summary at December 31, 2016
| Certificates of Deposit |
79.3 | % | ||
| Treasuries |
8.5 | |||
| Time Deposits |
6.2 | |||
| Other Notes |
2.4 | |||
| Other Investments, less than 2% each |
1.5 | |||
|
|
|
|||
| Total Investments |
97.9 | |||
| Other assets less liabilities (including forward foreign currency and futures contracts) |
2.1 | |||
|
|
|
|||
| Net Assets |
100.0 | % | ||
|
|
|
See accompanying notes to financial statements.
| 36
Table of Contents
Portfolio of Investments – as of December 31, 2016
ASG Tactical U.S. Market Fund
| Shares |
Description | Value (†) | ||||||
| Common Stocks — 54.9% of Net Assets | ||||||||
| Aerospace & Defense — 1.8% | ||||||||
| 1,492 | Boeing Co. (The) | $ | 232,274 | |||||
| 626 | Northrop Grumman Corp. | 145,595 | ||||||
| 7,880 | United Technologies Corp. | 863,806 | ||||||
|
|
|
|||||||
| 1,241,675 | ||||||||
|
|
|
|||||||
| Air Freight & Logistics — 0.5% | ||||||||
| 808 | FedEx Corp. | 150,449 | ||||||
| 1,834 | United Parcel Service, Inc., Class B | 210,250 | ||||||
|
|
|
|||||||
| 360,699 | ||||||||
|
|
|
|||||||
| Banks — 3.6% | ||||||||
| 24,223 | Bank of America Corp. | 535,328 | ||||||
| 6,361 | Fifth Third Bancorp | 171,556 | ||||||
| 8,088 | JPMorgan Chase & Co. | 697,914 | ||||||
| 11,433 | Regions Financial Corp. | 164,178 | ||||||
| 5,477 | U.S. Bancorp | 281,353 | ||||||
| 10,983 | Wells Fargo & Co. | 605,273 | ||||||
|
|
|
|||||||
| 2,455,602 | ||||||||
|
|
|
|||||||
| Beverages — 1.3% | ||||||||
| 8,876 | Coca-Cola Co. (The) | 367,999 | ||||||
| 1,790 | Dr Pepper Snapple Group, Inc. | 162,299 | ||||||
| 3,368 | PepsiCo, Inc. | 352,394 | ||||||
|
|
|
|||||||
| 882,692 | ||||||||
|
|
|
|||||||
| Biotechnology — 1.0% | ||||||||
| 1,780 | Amgen, Inc. | 260,254 | ||||||
| 515 | Biogen, Inc.(b) | 146,044 | ||||||
| 1,866 | Celgene Corp.(b) | 215,989 | ||||||
| 1,171 | Gilead Sciences, Inc. | 83,855 | ||||||
|
|
|
|||||||
| 706,142 | ||||||||
|
|
|
|||||||
| Capital Markets — 1.8% | ||||||||
| 4,680 | Bank of New York Mellon Corp. (The) | 221,738 | ||||||
| 1,620 | BlackRock, Inc. | 616,475 | ||||||
| 1,863 | CME Group, Inc. | 214,897 | ||||||
| 1,764 | S&P Global, Inc. | 189,701 | ||||||
|
|
|
|||||||
| 1,242,811 | ||||||||
|
|
|
|||||||
| Chemicals — 1.3% | ||||||||
| 943 | Air Products & Chemicals, Inc. | 135,622 | ||||||
| 2,396 | Dow Chemical Co. (The) | 137,099 | ||||||
| 2,472 | E.I. du Pont de Nemours & Co. | 181,445 | ||||||
| 508 | Ecolab, Inc. | 59,548 | ||||||
| 1,556 | Monsanto Co. | 163,707 | ||||||
| 1,333 | PPG Industries, Inc. | 126,315 | ||||||
| 418 | Sherwin-Williams Co. (The) | 112,333 | ||||||
|
|
|
|||||||
| 916,069 | ||||||||
|
|
|
|||||||
See accompanying notes to financial statements.
37 |
Table of Contents
Portfolio of Investments – as of December 31, 2016
ASG Tactical U.S. Market Fund – (continued)
| Shares |
Description | Value (†) | ||||||
| Commercial Services & Supplies — 0.1% | ||||||||
| 771 | Cintas Corp. | $ | 89,097 | |||||
|
|
|
|||||||
| Communications Equipment — 0.5% | ||||||||
| 8,211 | Cisco Systems, Inc. | 248,137 | ||||||
| 1,107 | Harris Corp. | 113,434 | ||||||
|
|
|
|||||||
| 361,571 | ||||||||
|
|
|
|||||||
| Construction & Engineering — 0.2% | ||||||||
| 1,954 | Fluor Corp. | 102,624 | ||||||
|
|
|
|||||||
| Consumer Finance — 0.3% | ||||||||
| 2,393 | Capital One Financial Corp. | 208,765 | ||||||
|
|
|
|||||||
| Containers & Packaging — 0.1% | ||||||||
| 1,305 | Sealed Air Corp. | 59,169 | ||||||
|
|
|
|||||||
| Diversified Financial Services — 1.0% | ||||||||
| 4,241 | Berkshire Hathaway, Inc., Class B(b) | 691,198 | ||||||
|
|
|
|||||||
| Diversified Telecommunication Services — 1.8% | ||||||||
| 18,671 | AT&T, Inc. | 794,078 | ||||||
| 8,522 | Verizon Communications, Inc. | 454,904 | ||||||
|
|
|
|||||||
| 1,248,982 | ||||||||
|
|
|
|||||||
| Electric Utilities — 1.0% | ||||||||
| 1,514 | American Electric Power Co., Inc. | 95,321 | ||||||
| 1,583 | Duke Energy Corp. | 122,872 | ||||||
| 1,889 | Eversource Energy | 104,330 | ||||||
| 679 | NextEra Energy, Inc. | 81,113 | ||||||
| 1,585 | PG&E Corp. | 96,320 | ||||||
| 2,672 | PPL Corp. | 90,982 | ||||||
| 2,361 | Southern Co. (The) | 116,138 | ||||||
|
|
|
|||||||
| 707,076 | ||||||||
|
|
|
|||||||
| Energy Equipment & Services — 0.6% | ||||||||
| 2,773 | Halliburton Co. | 149,992 | ||||||
| 3,295 | Schlumberger Ltd. | 276,615 | ||||||
|
|
|
|||||||
| 426,607 | ||||||||
|
|
|
|||||||
| Food & Staples Retailing — 0.7% | ||||||||
| 3,498 | CVS Health Corp. | 276,027 | ||||||
| 2,586 | Walgreens Boots Alliance, Inc. | 214,018 | ||||||
|
|
|
|||||||
| 490,045 | ||||||||
|
|
|
|||||||
| Food Products — 0.5% | ||||||||
| 877 | Archer-Daniels-Midland Co. | 40,035 | ||||||
| 6,505 | Mondelez International, Inc., Class A | 288,367 | ||||||
|
|
|
|||||||
| 328,402 | ||||||||
|
|
|
|||||||
| Health Care Equipment & Supplies — 1.5% | ||||||||
| 3,450 | Boston Scientific Corp.(b) | 74,624 | ||||||
| 2,135 | CR Bard, Inc. | 479,649 | ||||||
| 2,836 | Danaher Corp. | 220,754 | ||||||
| 3,626 | Medtronic PLC | 258,280 | ||||||
|
|
|
|||||||
| 1,033,307 | ||||||||
|
|
|
|||||||
See accompanying notes to financial statements.
| 38
Table of Contents
Portfolio of Investments – as of December 31, 2016
ASG Tactical U.S. Market Fund – (continued)
| Shares |
Description | Value (†) | ||||||
| Health Care Providers & Services — 1.5% | ||||||||
| 2,334 | Aetna, Inc. | $ | 289,439 | |||||
| 78 | McKesson Corp. | 10,955 | ||||||
| 4,547 | UnitedHealth Group, Inc. | 727,702 | ||||||
|
|
|
|||||||
| 1,028,096 | ||||||||
|
|
|
|||||||
| Hotels, Restaurants & Leisure — 0.8% | ||||||||
| 1,260 | Marriott International, Inc., Class A | 104,177 | ||||||
| 2,036 | McDonald’s Corp. | 247,822 | ||||||
| 3,658 | Starbucks Corp. | 203,092 | ||||||
|
|
|
|||||||
| 555,091 | ||||||||
|
|
|
|||||||
| Household Durables — 0.1% | ||||||||
| 1,718 | Lennar Corp., Class A | 73,754 | ||||||
|
|
|
|||||||
| Household Products — 1.1% | ||||||||
| 8,886 | Procter & Gamble Co. (The) | 747,135 | ||||||
|
|
|
|||||||
| Industrial Conglomerates — 1.7% | ||||||||
| 1,475 | 3M Co. | 263,391 | ||||||
| 21,584 | General Electric Co. | 682,054 | ||||||
| 1,973 | Honeywell International, Inc. | 228,572 | ||||||
|
|
|
|||||||
| 1,174,017 | ||||||||
|
|
|
|||||||
| Insurance — 1.3% | ||||||||
| 1,663 | Aon PLC | 185,474 | ||||||
| 1,555 | Assurant, Inc. | 144,397 | ||||||
| 2,125 | Chubb Ltd. | 280,755 | ||||||
| 2,487 | Lincoln National Corp. | 164,814 | ||||||
| 2,017 | Torchmark Corp. | 148,774 | ||||||
|
|
|
|||||||
| 924,214 | ||||||||
|
|
|
|||||||
| Internet & Direct Marketing Retail — 2.3% | ||||||||
| 1,690 | Amazon.com, Inc.(b) | 1,267,280 | ||||||
| 810 | Netflix, Inc.(b) | 100,278 | ||||||
| 127 | Priceline Group, Inc. (The)(b) | 186,190 | ||||||
|
|
|
|||||||
| 1,553,748 | ||||||||
|
|
|
|||||||
| Internet Software & Services — 2.4% | ||||||||
| 624 | Alphabet, Inc., Class A(b) | 494,489 | ||||||
| 630 | Alphabet, Inc., Class C(b) | 486,247 | ||||||
| 4,953 | eBay, Inc.(b) | 147,054 | ||||||
| 4,793 | Facebook, Inc., Class A(b) | 551,435 | ||||||
|
|
|
|||||||
| 1,679,225 | ||||||||
|
|
|
|||||||
| IT Services — 1.4% | ||||||||
| 1,837 | Accenture PLC, Class A | 215,168 | ||||||
| 1,781 | Automatic Data Processing, Inc. | 183,051 | ||||||
| 2,065 | International Business Machines Corp. | 342,769 | ||||||
| 3,853 | Paychex, Inc. | 234,571 | ||||||
|
|
|
|||||||
| 975,559 | ||||||||
|
|
|
|||||||
See accompanying notes to financial statements.
39 |
Table of Contents
Portfolio of Investments – as of December 31, 2016
ASG Tactical U.S. Market Fund – (continued)
| Shares |
Description | Value (†) | ||||||
| Machinery — 0.8% | ||||||||
| 2,367 | Deere & Co. | $ | 243,896 | |||||
| 1,418 | Fortive Corp. | 76,047 | ||||||
| 1,153 | Illinois Tool Works, Inc. | 141,196 | ||||||
| 1,721 | PACCAR, Inc. | 109,972 | ||||||
|
|
|
|||||||
| 571,111 | ||||||||
|
|
|
|||||||
| Media — 1.5% | ||||||||
| 368 | Charter Communications, Inc., Class A(b) | 105,955 | ||||||
| 5,237 | Comcast Corp., Class A | 361,615 | ||||||
| 2,022 | Time Warner, Inc. | 195,184 | ||||||
| 3,343 | Walt Disney Co. (The) | 348,407 | ||||||
|
|
|
|||||||
| 1,011,161 | ||||||||
|
|
|
|||||||
| Metals & Mining — 0.5% | ||||||||
| 10,064 | Newmont Mining Corp. | 342,880 | ||||||
|
|
|
|||||||
| Multi-Utilities — 1.0% | ||||||||
| 1,829 | CMS Energy Corp. | 76,123 | ||||||
| 7,422 | Consolidated Edison, Inc. | 546,853 | ||||||
| 797 | Sempra Energy | 80,210 | ||||||
|
|
|
|||||||
| 703,186 | ||||||||
|
|
|
|||||||
| Oil, Gas & Consumable Fuels — 3.7% | ||||||||
| 3,761 | Apache Corp. | 238,711 | ||||||
| 4,353 | Chevron Corp. | 512,348 | ||||||
| 3,373 | Cimarex Energy Co. | 458,391 | ||||||
| 729 | Concho Resources, Inc.(b) | 96,666 | ||||||
| 1,813 | EOG Resources, Inc. | 183,294 | ||||||
| 8,709 | Exxon Mobil Corp. | 786,074 | ||||||
| 1,718 | Phillips 66 | 148,452 | ||||||
| 1,997 | Valero Energy Corp. | 136,435 | ||||||
|
|
|
|||||||
| 2,560,371 | ||||||||
|
|
|
|||||||
| Pharmaceuticals — 2.7% | ||||||||
| 7,521 | Johnson & Johnson | 866,494 | ||||||
| 7,541 | Merck & Co., Inc. | 443,939 | ||||||
| 16,878 | Pfizer, Inc. | 548,198 | ||||||
|
|
|
|||||||
| 1,858,631 | ||||||||
|
|
|
|||||||
| Professional Services — 0.2% | ||||||||
| 849 | Equifax, Inc. | 100,377 | ||||||
|
|
|
|||||||
| REITs – Apartments — 0.2% | ||||||||
| 582 | AvalonBay Communities, Inc. | 103,101 | ||||||
|
|
|
|||||||
| REITs – Diversified — 0.3% | ||||||||
| 1,328 | American Tower Corp. | 140,343 | ||||||
| 850 | Vornado Realty Trust | 88,715 | ||||||
|
|
|
|||||||
| 229,058 | ||||||||
|
|
|
|||||||
| REITs – Regional Malls — 0.9% | ||||||||
| 3,271 | Simon Property Group, Inc. | 581,159 | ||||||
|
|
|
|||||||
See accompanying notes to financial statements.
| 40
Table of Contents
Portfolio of Investments – as of December 31, 2016
ASG Tactical U.S. Market Fund – (continued)
| Shares |
Description | Value (†) | ||||||
| REITs – Storage — 0.5% | ||||||||
| 1,563 | Public Storage | $ | 349,331 | |||||
|
|
|
|||||||
| Road & Rail — 0.3% | ||||||||
| 2,168 | Union Pacific Corp. | 224,778 | ||||||
|
|
|
|||||||
| Semiconductors & Semiconductor Equipment — 2.4% | ||||||||
| 1,946 | Analog Devices, Inc. | 141,319 | ||||||
| 1,255 | Broadcom Ltd. | 221,846 | ||||||
| 26,699 | Intel Corp. | 968,373 | ||||||
| 1,181 | Lam Research Corp. | 124,867 | ||||||
| 1,948 | NVIDIA Corp. | 207,929 | ||||||
|
|
|
|||||||
| 1,664,334 | ||||||||
|
|
|
|||||||
| Software — 1.9% | ||||||||
| 1,762 | Adobe Systems, Inc.(b) | 181,398 | ||||||
| 14,960 | Microsoft Corp. | 929,614 | ||||||
| 2,434 | Salesforce.com, Inc.(b) | 166,632 | ||||||
|
|
|
|||||||
| 1,277,644 | ||||||||
|
|
|
|||||||
| Specialty Retail — 1.8% | ||||||||
| 167 | AutoZone, Inc.(b) | 131,895 | ||||||
| 4,418 | Home Depot, Inc. (The) | 592,365 | ||||||
| 2,431 | Lowe’s Cos., Inc. | 172,893 | ||||||
| 377 | O’Reilly Automotive, Inc.(b) | 104,960 | ||||||
| 1,928 | TJX Cos., Inc. (The) | 144,851 | ||||||
| 331 | Ulta Salon, Cosmetics & Fragrance, Inc.(b) | 84,385 | ||||||
|
|
|
|||||||
| 1,231,349 | ||||||||
|
|
|
|||||||
| Technology Hardware, Storage & Peripherals — 1.9% | ||||||||
| 10,121 | Apple, Inc. | 1,172,214 | ||||||
| 2,690 | Seagate Technology PLC | 102,678 | ||||||
|
|
|
|||||||
| 1,274,892 | ||||||||
|
|
|
|||||||
| Textiles, Apparel & Luxury Goods — 0.3% | ||||||||
| 3,568 | NIKE, Inc., Class B | 181,362 | ||||||
| 702 | Under Armour, Inc., Class A(b) | 20,393 | ||||||
| 1,113 | Under Armour, Inc., Class C(b) | 28,014 | ||||||
|
|
|
|||||||
| 229,769 | ||||||||
|
|
|
|||||||
| Tobacco — 1.8% | ||||||||
| 886 | Altria Group, Inc. | 59,911 | ||||||
| 10,730 | Philip Morris International, Inc. | 981,688 | ||||||
| 3,137 | Reynolds American, Inc. | 175,797 | ||||||
|
|
|
|||||||
| 1,217,396 | ||||||||
|
|
|
|||||||
| Total Common Stocks (Identified Cost $32,174,255) |
37,793,900 | |||||||
|
|
|
|||||||
See accompanying notes to financial statements.
41 |
Table of Contents
Portfolio of Investments – as of December 31, 2016
ASG Tactical U.S. Market Fund – (continued)
| Principal Amount |
Description | Value (†) | ||||||
| Short-Term Investments — 45.3% | ||||||||
| Certificates of Deposit — 32.7% | ||||||||
| $ | 3,000,000 | Abbey National Treasury Services PLC (CT), 0.680%, 1/05/2017 | $ | 2,999,990 | ||||
| 2,000,000 | Oversea-Chinese Banking Corp. Ltd. (NY), 0.890%, 1/11/2017 | 2,000,126 | ||||||
| 3,000,000 | Credit Agricole Corporate & Investment Bank (NY), 0.650%, 1/12/2017 | 3,000,106 | ||||||
| 3,000,000 | Landesbank Hessen (NY), 0.710%, 1/17/2017 | 3,000,339 | ||||||
| 1,000,000 | Svenska Handelsbanken (NY), 1.205%, 2/03/2017(c)(d) | 1,000,609 | ||||||
| 1,000,000 | Royal Bank of Canada (NY), 1.336%, 2/17/2017(c)(d) | 1,000,836 | ||||||
| 1,000,000 | Mizuho Bank Ltd. (NY), 1.436%, 2/17/2017(c)(d) | 1,000,972 | ||||||
| 2,500,000 | Deutsche Zentral-Genossenschaftsbank (NY), 1.150%, 3/09/2017(d) | 2,500,090 | ||||||
| 3,000,000 | Credit Industriel et Commercial (NY), 1.020%, 3/15/2017 | 3,002,714 | ||||||
| 2,000,000 | Bank of Montreal (IL), 1.302%, 5/12/2017(c)(d) | 2,002,474 | ||||||
| 1,000,000 | Norinchukin Bank (NY), 1.300%, 6/19/2017(d) | 1,000,375 | ||||||
|
|
|
|||||||
| 22,508,631 | ||||||||
|
|
|
|||||||
| Time Deposits — 7.6% | ||||||||
| 2,200,000 | Canadian Imperial Bank of Commerce, 0.520%, 1/03/2017 | 2,200,000 | ||||||
| 3,000,000 | National Bank of Kuwait, 0.550%, 1/03/2017(c) | 3,000,000 | ||||||
|
|
|
|||||||
| 5,200,000 | ||||||||
|
|
|
|||||||
| Treasuries — 2.8% | ||||||||
| 550,000 | U.S. Treasury Bills, 0.325%, 1/19/2017(e)(f) | 549,899 | ||||||
| 700,000 | U.S. Treasury Bills, 0.450%, 2/16/2017(e)(f) | 699,623 | ||||||
| 700,000 | U.S. Treasury Bills, 0.500%, 3/23/2017(e)(f) | 699,232 | ||||||
|
|
|
|||||||
| 1,948,754 | ||||||||
|
|
|
|||||||
| Other Notes — 2.2% | ||||||||
| 1,500,000 | Bank of America N.A., 0.820%, 2/02/2017(c) | 1,500,022 | ||||||
|
|
|
|||||||
| Total Short-Term Investments (Identified Cost $31,148,723) |
31,157,407 | |||||||
|
|
|
|||||||
| Total Investments — 100.2% (Identified Cost $63,322,978)(a) |
68,951,307 | |||||||
| Other assets less liabilities — (0.2)% | (124,857 | ) | ||||||
|
|
|
|||||||
| Net Assets — 100.0% | $ | 68,826,450 | ||||||
|
|
|
|||||||
| (†) | See Note 2 of Notes to Financial Statements. | |||||||
| (a) | Federal Tax Information: | |||||||
| At December 31, 2016, the net unrealized appreciation on investments based on a cost of $63,422,816 for federal income tax purposes was as follows: | ||||||||
| Aggregate gross unrealized appreciation for all investments in which there is an excess of value over tax cost | $ | 5,802,087 | ||||||
| Aggregate gross unrealized depreciation for all investments in which there is an excess of tax cost over value | (273,596 | ) | ||||||
|
|
|
|||||||
| Net unrealized appreciation | $ | 5,528,491 | ||||||
|
|
|
|||||||
| (b) | Non-income producing security. | |||||||
See accompanying notes to financial statements.
| 42
Table of Contents
Portfolio of Investments – as of December 31, 2016
ASG Tactical U.S. Market Fund – (continued)
| (c) | Variable rate security. Rate as of December 31, 2016 is disclosed. | |||||||
| (d) | Security (or a portion thereof) has been designated to cover the Fund’s obligations under open derivative contracts. | |||||||
| (e) | Interest rate represents discount rate at time of purchase; not a coupon rate. | |||||||
| (f) | Security (or a portion thereof) has been pledged as collateral for open derivative contracts. | |||||||
| REITs | Real Estate Investment Trusts | |||||||
At December 31, 2016, open long futures contracts were as follows:
| Financial Futures | Expiration Date |
Contracts | Notional Value |
Unrealized Appreciation (Depreciation) |
||||||||||||
| E-mini S&P 500® |
3/17/2017 | 282 | $ | 31,531,125 | $ | (334,850 | ) | |||||||||
|
|
|
|||||||||||||||
Industry Summary at December 31, 2016
| Oil, Gas & Consumable Fuels |
3.7 | % | ||
| Banks |
3.6 | |||
| Pharmaceuticals |
2.7 | |||
| Internet Software & Services |
2.4 | |||
| Semiconductors & Semiconductor Equipment |
2.4 | |||
| Internet & Direct Marketing Retail |
2.3 | |||
| Other Investments, less than 2% each |
37.8 | |||
| Short-Term Investments |
45.3 | |||
|
|
|
|||
| Total Investments |
100.2 | |||
| Other assets less liabilities (including futures contracts) |
(0.2 | ) | ||
|
|
|
|||
| Net Assets |
100.0 | % | ||
|
|
|
See accompanying notes to financial statements.
43 |
Table of Contents
This Page Intentionally Left Blank
| 44
Table of Contents
Statements of Assets and Liabilities
December 31, 2016
| ASG Dynamic Allocation Fund |
ASG Global Alternatives Fund (Consolidated*) |
ASG Managed Futures Strategy Fund (Consolidated*) |
||||||||||
| ASSETS |
||||||||||||
| Investments at cost |
$ | 21,966,037 | $ | 1,629,406,625 | $ | 3,096,470,672 | ||||||
| Net unrealized appreciation |
71,231 | 910,030 | 829,553 | |||||||||
|
|
|
|
|
|
|
|||||||
| Investments at value |
22,037,268 | 1,630,316,655 | 3,097,300,225 | |||||||||
| Cash |
78,486 | 3,293,825 | 30,719,012 | |||||||||
| Due from brokers (Note 2) |
— | 3,710,000 | 55,221,041 | |||||||||
| Receivable for Fund shares sold |
16,093 | 4,003,035 | 25,074,211 | |||||||||
| Receivable for securities sold |
363,523 | — | — | |||||||||
| Dividends and interest receivable |
7,772 | 1,257,280 | 2,691,464 | |||||||||
| Unrealized appreciation on forward foreign currency contracts (Note 2) |
— | 1,228,641 | 7,578,357 | |||||||||
| Unrealized appreciation on futures contracts (Note 2) |
80,688 | 17,411,546 | 61,381,603 | |||||||||
| Prepaid expenses (Note 8) |
48 | 7,158 | 7,708 | |||||||||
|
|
|
|
|
|
|
|||||||
| TOTAL ASSETS |
22,583,878 | 1,661,228,140 | 3,279,973,621 | |||||||||
|
|
|
|
|
|
|
|||||||
| LIABILITIES |
||||||||||||
| Payable for Fund shares redeemed |
228 | 16,333,845 | 28,201,953 | |||||||||
| Unrealized depreciation on forward foreign currency contracts (Note 2) |
— | 1,793,875 | 8,676,396 | |||||||||
| Due to brokers (including variation margin on futures contracts) (Note 2) |
62,580 | 1,572,865 | 41,347,862 | |||||||||
| Unrealized depreciation on futures contracts (Note 2) |
77,107 | 10,432,514 | 33,149,046 | |||||||||
| Management fees payable (Note 6) |
10,928 | 1,697,226 | 3,428,336 | |||||||||
| Deferred Trustees’ fees (Note 6) |
8,996 | 170,965 | 123,088 | |||||||||
| Administrative fees payable (Note 6) |
838 | 87,444 | 270,310 | |||||||||
| Payable to distributor (Note 6d) |
2 | 12,054 | 41,986 | |||||||||
| Other accounts payable and accrued expenses |
51,177 | 228,551 | 395,256 | |||||||||
|
|
|
|
|
|
|
|||||||
| TOTAL LIABILITIES |
211,856 | 32,329,339 | 115,634,233 | |||||||||
|
|
|
|
|
|
|
|||||||
| NET ASSETS |
$ | 22,372,022 | $ | 1,628,898,801 | $ | 3,164,339,388 | ||||||
|
|
|
|
|
|
|
|||||||
| NET ASSETS CONSIST OF: |
||||||||||||
| Paid-in capital |
$ | 22,143,920 | $ | 1,860,886,569 | $ | 3,374,156,061 | ||||||
| Distributions in excess of net investment income/Accumulated net investment loss |
(28,474 | ) | (1,105,967 | ) | (24,682,283 | ) | ||||||
| Accumulated net realized gain (loss) on investments, futures contracts and foreign currency transactions |
183,736 | (238,205,525 | ) | (213,089,922 | ) | |||||||
| Net unrealized appreciation on investments, futures contracts and foreign currency translations |
72,840 | 7,323,724 | 27,955,532 | |||||||||
|
|
|
|
|
|
|
|||||||
| NET ASSETS |
$ | 22,372,022 | $ | 1,628,898,801 | $ | 3,164,339,388 | ||||||
|
|
|
|
|
|
|
|||||||
See accompanying notes to financial statements.
45 |
Table of Contents
Statements of Assets and Liabilities (continued)
December 31, 2016
| ASG Dynamic Allocation Fund |
ASG Global Alternatives Fund (Consolidated*) |
ASG Managed Futures Strategy Fund (Consolidated*) |
||||||||||
| COMPUTATION OF NET ASSET VALUE AND OFFERING PRICE: |
||||||||||||
| Class A shares: |
||||||||||||
| Net assets |
$ | 29,320 | $ | 76,207,081 | $ | 463,235,479 | ||||||
|
|
|
|
|
|
|
|||||||
| Shares of beneficial interest |
2,908 | 7,604,042 | 47,383,566 | |||||||||
|
|
|
|
|
|
|
|||||||
| Net asset value and redemption price per share |
$ | 10.08 | $ | 10.02 | $ | 9.78 | ||||||
|
|
|
|
|
|
|
|||||||
| Offering price per share (100/94.25 of net asset value) (Note 1) |
$ | 10.69 | $ | 10.63 | $ | 10.38 | ||||||
|
|
|
|
|
|
|
|||||||
| Class C shares: (redemption price per share is equal to net asset value less any applicable contingent deferred sales charge) (Note 1) |
||||||||||||
| Net assets |
$ | 8,994 | $ | 38,412,314 | $ | 71,183,995 | ||||||
|
|
|
|
|
|
|
|||||||
| Shares of beneficial interest |
899 | 4,084,955 | 7,553,853 | |||||||||
|
|
|
|
|
|
|
|||||||
| Net asset value and offering price per share |
$ | 10.01 | (a) | $ | 9.40 | $ | 9.42 | |||||
|
|
|
|
|
|
|
|||||||
| Class N shares: |
||||||||||||
| Net assets |
$ | — | $ | 9,638,544 | $ | — | ||||||
|
|
|
|
|
|
|
|||||||
| Shares of beneficial interest |
— | 945,980 | — | |||||||||
|
|
|
|
|
|
|
|||||||
| Net asset value, offering and redemption price per share |
$ | — | $ | 10.19 | $ | — | ||||||
|
|
|
|
|
|
|
|||||||
| Class Y shares: |
||||||||||||
| Net assets |
$ | 22,333,708 | $ | 1,504,640,862 | $ | 2,629,919,914 | ||||||
|
|
|
|
|
|
|
|||||||
| Shares of beneficial interest |
2,214,508 | 147,615,167 | 267,603,965 | |||||||||
|
|
|
|
|
|
|
|||||||
| Net asset value, offering and redemption price per share |
$ | 10.09 | $ | 10.19 | $ | 9.83 | ||||||
|
|
|
|
|
|
|
|||||||
| * | See Notes 1 and 2 of the Notes to Financial Statements. |
| (a) | Net asset value calculations reflect fractional share and dollar amounts. |
See accompanying notes to financial statements.
| 46
Table of Contents
Statements of Assets and Liabilities (continued)
December 31, 2016
| ASG Tactical U.S. Market Fund |
||||
| ASSETS |
||||
| Investments at cost |
$ | 63,322,978 | ||
| Net unrealized appreciation |
5,628,329 | |||
|
|
|
|||
| Investments at value |
68,951,307 | |||
| Cash |
205,796 | |||
| Due from brokers (including variation margin on futures contracts) (Note 2) |
210,045 | |||
| Receivable for Fund shares sold |
174,625 | |||
| Dividends and interest receivable |
91,302 | |||
| Prepaid expenses (Note 8) |
223 | |||
|
|
|
|||
| TOTAL ASSETS |
69,633,298 | |||
|
|
|
|||
| LIABILITIES |
||||
| Payable for Fund shares redeemed |
343,511 | |||
| Unrealized depreciation on futures contracts (Note 2) |
334,850 | |||
| Management fees payable (Note 6) |
51,643 | |||
| Deferred Trustees’ fees (Note 6) |
30,386 | |||
| Administrative fees payable (Note 6) |
2,837 | |||
| Payable to distributor (Note 6d) |
1,218 | |||
| Other accounts payable and accrued expenses |
42,403 | |||
|
|
|
|||
| TOTAL LIABILITIES |
806,848 | |||
|
|
|
|||
| NET ASSETS |
$ | 68,826,450 | ||
|
|
|
|||
| NET ASSETS CONSIST OF: |
||||
| Paid-in capital |
$ | 65,937,085 | ||
| Distributions in excess of net investment income |
(18,467 | ) | ||
| Accumulated net realized loss on investments and futures contracts |
(2,385,647 | ) | ||
| Net unrealized appreciation on investments and futures contracts |
5,293,479 | |||
|
|
|
|||
| NET ASSETS |
$ | 68,826,450 | ||
|
|
|
|||
| COMPUTATION OF NET ASSET VALUE AND OFFERING PRICE: |
||||
| Class A shares: |
||||
| Net assets |
$ | 8,365,192 | ||
|
|
|
|||
| Shares of beneficial interest |
707,004 | |||
|
|
|
|||
| Net asset value and redemption price per share |
$ | 11.83 | ||
|
|
|
|||
| Offering price per share (100/94.25 of net asset value) (Note 1) |
$ | 12.55 | ||
|
|
|
|||
| Class C shares: (redemption price per share is equal to net asset value less any applicable contingent deferred sales charge) (Note 1) |
||||
| Net assets |
$ | 1,973,093 | ||
|
|
|
|||
| Shares of beneficial interest |
170,197 | |||
|
|
|
|||
| Net asset value and offering price per share |
$ | 11.59 | ||
|
|
|
|||
| Class Y shares: |
||||
| Net assets |
$ | 58,488,165 | ||
|
|
|
|||
| Shares of beneficial interest |
4,926,968 | |||
|
|
|
|||
| Net asset value, offering and redemption price per share |
$ | 11.87 | ||
|
|
|
|||
See accompanying notes to financial statements.
47 |
Table of Contents
Statements of Operations
For the Year Ended December 31, 2016
| ASG Dynamic Allocation Fund |
ASG Global Alternatives Fund (Consolidated*) |
ASG Managed Futures Strategy Fund (Consolidated*) |
||||||||||
| INVESTMENT INCOME |
| |||||||||||
| Interest |
$ | 91,191 | $ | 16,268,677 | $ | 21,612,681 | ||||||
| Dividends |
166,294 | 799,479 | — | |||||||||
|
|
|
|
|
|
|
|||||||
| 257,485 | 17,068,156 | 21,612,681 | ||||||||||
|
|
|
|
|
|
|
|||||||
| Expenses |
| |||||||||||
| Management fees (Note 6) |
145,779 | 30,250,399 | 42,223,607 | |||||||||
| Service and distribution fees (Note 6) |
150 | 1,011,501 | 2,224,975 | |||||||||
| Administrative fees (Note 6) |
9,243 | 1,266,434 | 2,030,818 | |||||||||
| Trustees’ and directors’ fees and expenses (Note 6) |
15,645 | 98,357 | 116,801 | |||||||||
| Transfer agent fees and expenses (Notes 6 and 7) |
4,359 | 2,167,251 | 3,891,713 | |||||||||
| Audit and tax services fees |
59,693 | 75,294 | 75,984 | |||||||||
| Custodian fees and expenses |
19,908 | 232,881 | 866,859 | |||||||||
| Interest expense (Note 10) |
2,892 | 581,651 | 1,263,905 | |||||||||
| Legal fees |
343 | 41,905 | 54,176 | |||||||||
| Registration fees |
49,796 | 71,383 | 252,934 | |||||||||
| Shareholder reporting expenses |
886 | 84,257 | 293,445 | |||||||||
| Miscellaneous expenses (Note 8) |
11,480 | 100,689 | 130,030 | |||||||||
|
|
|
|
|
|
|
|||||||
| Total expenses |
320,174 | 35,982,002 | 53,425,247 | |||||||||
| Less waiver and/or expense reimbursement (Note 6) |
(129,688 | ) | (72 | ) | (426,591 | ) | ||||||
|
|
|
|
|
|
|
|||||||
| Net expenses |
190,486 | 35,981,930 | 52,998,656 | |||||||||
|
|
|
|
|
|
|
|||||||
| Net investment income (loss) |
66,999 | (18,913,774 | ) | (31,385,975 | ) | |||||||
|
|
|
|
|
|
|
|||||||
| NET REALIZED AND UNREALIZED GAIN (LOSS) ON INVESTMENTS, FUTURES CONTRACTS AND FOREIGN CURRENCY TRANSACTIONS |
||||||||||||
| Net realized gain (loss) on: |
| |||||||||||
| Investments |
(62,109 | ) | 154,370 | 83,466 | ||||||||
| Futures contracts |
510,668 | (152,667,375 | ) | (252,604,535 | ) | |||||||
| Foreign currency transactions |
(2,938 | ) | (73,341,761 | ) | 2,866,123 | |||||||
| Net change in unrealized appreciation (depreciation) on: |
| |||||||||||
| Investments |
155,271 | 1,153,720 | 982,398 | |||||||||
| Futures contracts |
(86,384 | ) | 15,268,044 | 42,307,353 | ||||||||
| Foreign currency translations |
(2,474 | ) | (1,501,117 | ) | (24,308,121 | ) | ||||||
|
|
|
|
|
|
|
|||||||
| Net realized and unrealized gain (loss) on investments, futures contracts and foreign currency transactions |
512,034 | (210,934,119 | ) | (230,673,316 | ) | |||||||
|
|
|
|
|
|
|
|||||||
| NET INCREASE (DECREASE) IN NET ASSETS RESULTING FROM OPERATIONS |
$ | 579,033 | $ | (229,847,893 | ) | $ | (262,059,291 | ) | ||||
|
|
|
|
|
|
|
|||||||
| * | See Notes 1 and 2 of the Notes to Financial Statements. |
See accompanying notes to financial statements.
| 48
Table of Contents
Statements of Operations (continued)
For the Year Ended December 31, 2016
| ASG Tactical U.S. Market Fund |
||||
| INVESTMENT INCOME |
| |||
| Interest |
$ | 196,309 | ||
| Dividends |
1,226,966 | |||
|
|
|
|||
| 1,423,275 | ||||
|
|
|
|||
| Expenses |
| |||
| Management fees (Note 6) |
718,855 | |||
| Service and distribution fees (Note 6) |
47,544 | |||
| Administrative fees (Note 6) |
39,871 | |||
| Trustees’ and directors’ fees and expenses (Note 6) |
21,280 | |||
| Transfer agent fees and expenses (Note 6) |
109,773 | |||
| Audit and tax services fees |
42,610 | |||
| Custodian fees and expenses |
24,450 | |||
| Legal fees |
1,303 | |||
| Registration fees |
53,531 | |||
| Shareholder reporting expenses |
8,194 | |||
| Miscellaneous expenses (Note 8) |
11,381 | |||
|
|
|
|||
| Total expenses |
1,078,792 | |||
| Less waiver and/or expense reimbursement (Note 6) |
(132,476 | ) | ||
|
|
|
|||
| Net expenses |
946,316 | |||
|
|
|
|||
| Net investment income |
476,959 | |||
|
|
|
|||
| NET REALIZED AND UNREALIZED GAIN (LOSS) ON INVESTMENTS AND FUTURES CONTRACTS |
||||
| Net realized gain (loss) on: |
| |||
| Investments |
3,119,348 | |||
| Futures contracts |
(1,146,081 | ) | ||
| Net change in unrealized appreciation (depreciation) on: |
| |||
| Investments |
1,322,769 | |||
| Futures contracts |
(341,400 | ) | ||
|
|
|
|||
| Net realized and unrealized gain on investments and futures contracts |
2,954,636 | |||
|
|
|
|||
| NET INCREASE IN NET ASSETS RESULTING FROM OPERATIONS |
$ | 3,431,595 | ||
|
|
|
|||
See accompanying notes to financial statements.
49 |
Table of Contents
Statements of Changes in Net Assets
| ASG Dynamic Allocation Fund | ||||||||
| Year Ended December 31, 2016 |
Period Ended December 31, 2015(a) |
|||||||
| FROM OPERATIONS: |
||||||||
| Net investment income |
$ | 66,999 | $ | 23,549 | ||||
| Net realized gain (loss) on investments, futures contracts and foreign currency transactions |
445,621 | (290,130 | ) | |||||
| Net change in unrealized appreciation (depreciation) on investments, futures contracts and foreign currency translations |
66,413 | 6,427 | ||||||
|
|
|
|
|
|||||
| Net increase (decrease) in net assets resulting from operations |
579,033 | (260,154 | ) | |||||
|
|
|
|
|
|||||
| FROM DISTRIBUTIONS TO SHAREHOLDERS: |
||||||||
| Net investment income |
||||||||
| Class A |
(52 | ) | (1 | ) | ||||
| Class C |
— | (b) | (10 | ) | ||||
| Class Y |
(73,629 | ) | (28,295 | ) | ||||
|
|
|
|
|
|||||
| Total distributions |
(73,681 | ) | (28,306 | ) | ||||
|
|
|
|
|
|||||
| NET INCREASE IN NET ASSETS FROM CAPITAL SHARE TRANSACTIONS (NOTE 12) |
1,763,046 | 20,392,084 | ||||||
|
|
|
|
|
|||||
| Net increase in net assets |
2,268,398 | 20,103,624 | ||||||
| NET ASSETS |
||||||||
| Beginning of the year |
20,103,624 | — | ||||||
|
|
|
|
|
|||||
| End of the year |
$ | 22,372,022 | $ | 20,103,624 | ||||
|
|
|
|
|
|||||
| DISTRIBUTIONS IN EXCESS OF NET INVESTMENT INCOME |
$ | (28,474 | ) | $ | (1,647 | ) | ||
|
|
|
|
|
|||||
| (a) | From commencement of operations on November 30, 2015 through December 31, 2015. |
| (b) | Amount rounds to less than $1. |
See accompanying notes to financial statements.
| 50
Table of Contents
Statements of Changes in Net Assets (continued)
| ASG Global Alternatives Fund (Consolidated*) |
||||||||
| Year Ended December 31, 2016 |
Year Ended December 31, 2015 |
|||||||
| FROM OPERATIONS: |
||||||||
| Net investment loss |
$ | (18,913,774 | ) | $ | (39,625,925 | ) | ||
| Net realized loss on investments, futures contracts and foreign currency transactions |
(225,854,766 | ) | (77,619,985 | ) | ||||
| Net change in unrealized appreciation (depreciation) on investments, futures contracts and foreign currency translations |
14,920,647 | (30,805,140 | ) | |||||
|
|
|
|
|
|||||
| Net decrease in net assets resulting from operations |
(229,847,893 | ) | (148,051,050 | ) | ||||
|
|
|
|
|
|||||
| FROM DISTRIBUTIONS TO SHAREHOLDERS: |
||||||||
| Net realized capital gains |
||||||||
| Class A |
— | (5,892,846 | ) | |||||
| Class C |
— | (3,221,998 | ) | |||||
| Class N |
— | (327,390 | ) | |||||
| Class Y |
— | (101,691,464 | ) | |||||
|
|
|
|
|
|||||
| Total distributions |
— | (111,133,698 | ) | |||||
|
|
|
|
|
|||||
| NET INCREASE (DECREASE) IN NET ASSETS FROM CAPITAL SHARE TRANSACTIONS (NOTE 12) |
(1,816,666,719 | ) | 909,684,061 | |||||
|
|
|
|
|
|||||
| Net increase (decrease) in net assets |
(2,046,514,612 | ) | 650,499,313 | |||||
| NET ASSETS |
||||||||
| Beginning of the year |
3,675,413,413 | 3,024,914,100 | ||||||
|
|
|
|
|
|||||
| End of the year |
$ | 1,628,898,801 | $ | 3,675,413,413 | ||||
|
|
|
|
|
|||||
| ACCUMULATED NET INVESTMENT LOSS |
$ | (1,105,967 | ) | $ | (1,146,629 | ) | ||
|
|
|
|
|
|||||
| * | See Notes 1 and 2 of the Notes to Financial Statements. |
See accompanying notes to financial statements.
51 |
Table of Contents
Statements of Changes in Net Assets (continued)
| ASG Managed Futures Strategy Fund (Consolidated*) |
||||||||
| Year Ended December 31, 2016 |
Year Ended December 31, 2015 |
|||||||
| FROM OPERATIONS: |
||||||||
| Net investment loss |
$ | (31,385,975 | ) | $ | (29,945,720 | ) | ||
| Net realized loss on investments, futures contracts and foreign currency transactions |
(249,654,946 | ) | (25,497,354 | ) | ||||
| Net change in unrealized appreciation (depreciation) on investments, futures contracts and foreign currency translations |
18,981,630 | (48,359,267 | ) | |||||
|
|
|
|
|
|||||
| Net decrease in net assets resulting from operations |
(262,059,291 | ) | (103,802,341 | ) | ||||
|
|
|
|
|
|||||
| FROM DISTRIBUTIONS TO SHAREHOLDERS: |
||||||||
| Net investment income |
||||||||
| Class A |
— | (7,522,300 | ) | |||||
| Class C |
— | (786,739 | ) | |||||
| Class Y |
(189,168 | ) | (42,550,883 | ) | ||||
| Net realized capital gains |
||||||||
| Class A |
— | (6,425,672 | ) | |||||
| Class C |
— | (1,507,709 | ) | |||||
| Class Y |
— | (46,853,908 | ) | |||||
|
|
|
|
|
|||||
| Total distributions |
(189,168 | ) | (105,647,211 | ) | ||||
|
|
|
|
|
|||||
| NET INCREASE IN NET ASSETS FROM CAPITAL SHARE TRANSACTIONS (NOTE 12) |
739,328,468 | 1,361,611,925 | ||||||
|
|
|
|
|
|||||
| Net increase in net assets |
477,080,009 | 1,152,162,373 | ||||||
| NET ASSETS |
||||||||
| Beginning of the year |
2,687,259,379 | 1,535,097,006 | ||||||
|
|
|
|
|
|||||
| End of the year |
$ | 3,164,339,388 | $ | 2,687,259,379 | ||||
|
|
|
|
|
|||||
| DISTRIBUTIONS IN EXCESS OF NET INVESTMENT INCOME |
$ | (24,682,283 | ) | $ | (17,817,084 | ) | ||
|
|
|
|
|
|||||
| * | See Notes 1 and 2 of the Notes to Financial Statements. |
See accompanying notes to financial statements.
| 52
Table of Contents
Statements of Changes in Net Assets (continued)
| ASG Tactical U.S. Market Fund | ||||||||
| Year Ended December 31, 2016 |
Year Ended December 31, 2015 |
|||||||
| FROM OPERATIONS: |
||||||||
| Net investment income |
$ | 476,959 | $ | 156,022 | ||||
| Net realized gain (loss) on investments and futures contracts |
1,973,267 | (3,711,014 | ) | |||||
| Net change in unrealized appreciation (depreciation) on investments and futures contracts |
981,369 | (262,375 | ) | |||||
|
|
|
|
|
|||||
| Net increase (decrease) in net assets resulting from operations |
3,431,595 | (3,817,367 | ) | |||||
|
|
|
|
|
|||||
| FROM DISTRIBUTIONS TO SHAREHOLDERS: |
||||||||
| Net investment income |
||||||||
| Class A |
(32,680 | ) | — | |||||
| Class Y |
(423,285 | ) | (151,475 | ) | ||||
| Net realized capital gains |
||||||||
| Class A |
— | (75,525 | ) | |||||
| Class C |
— | (17,212 | ) | |||||
| Class Y |
— | (587,682 | ) | |||||
|
|
|
|
|
|||||
| Total distributions |
(455,965 | ) | (831,894 | ) | ||||
|
|
|
|
|
|||||
| NET INCREASE (DECREASE) IN NET ASSETS FROM CAPITAL SHARE TRANSACTIONS (NOTE 12) |
(34,837,137 | ) | 35,738,421 | |||||
|
|
|
|
|
|||||
| Net increase (decrease) in net assets |
(31,861,507 | ) | 31,089,160 | |||||
| NET ASSETS |
||||||||
| Beginning of the year |
100,687,957 | 69,598,797 | ||||||
|
|
|
|
|
|||||
| End of the year |
$ | 68,826,450 | $ | 100,687,957 | ||||
|
|
|
|
|
|||||
| DISTRIBUTIONS IN EXCESS OF NET INVESTMENT INCOME |
$ | (18,467 | ) | $ | (15,158 | ) | ||
|
|
|
|
|
|||||
See accompanying notes to financial statements.
53 |
Table of Contents
Financial Highlights
For a share outstanding throughout each period.
| ASG Dynamic Allocation Fund—Class A | ||||||||
| Year Ended December 31, 2016 |
Period Ended December 31, 2015* |
|||||||
| Net asset value, beginning of the period |
$ | 9.86 | $ | 10.00 | ||||
|
|
|
|
|
|||||
| INCOME (LOSS) FROM INVESTMENT OPERATIONS: |
||||||||
| Net investment income(a) |
0.03 | 0.01 | ||||||
| Net realized and unrealized gain (loss) |
0.21 | (0.14 | ) | |||||
|
|
|
|
|
|||||
| Total from Investment Operations |
0.24 | (0.13 | ) | |||||
|
|
|
|
|
|||||
| LESS DISTRIBUTIONS FROM: |
||||||||
| Net investment income |
(0.02 | ) | (0.01 | ) | ||||
| Net realized capital gains |
— | — | ||||||
|
|
|
|
|
|||||
| Total Distributions |
(0.02 | ) | (0.01 | ) | ||||
|
|
|
|
|
|||||
| Net asset value, end of the period |
$ | 10.08 | $ | 9.86 | ||||
|
|
|
|
|
|||||
| Total return(b)(c) |
2.41 | % | (1.28 | )%(d) | ||||
| RATIOS TO AVERAGE NET ASSETS: |
||||||||
| Net assets, end of the period (000’s) |
$ | 29 | $ | 1 | ||||
| Net expenses(e) |
1.17 | %(f) | 1.15 | %(g) | ||||
| Gross expenses |
1.80 | %(f) | 3.96 | %(g) | ||||
| Net investment income |
0.31 | % | 1.19 | %(g) | ||||
| Portfolio turnover rate |
115 | %(h) | 11 | % | ||||
| * | From commencement of operations on November 30, 2015 through December 31, 2015. |
| (a) | Per share net investment income has been calculated using the average shares outstanding during the period. |
| (b) | A sales charge for Class A shares is not reflected in total return calculations. |
| (c) | Had certain expenses not been waived/reimbursed during the period, total returns would have been lower. |
| (d) | Periods less than one year, if applicable, are not annualized. |
| (e) | The investment adviser agreed to waive its fees and/or reimburse a portion of the Fund’s expenses during the period. Without this waiver/reimbursement, expenses would have been higher. |
| (f) | Includes interest expense. Without this expense the ratio of net expenses would have been 1.15% and the ratio of gross expenses would have been 1.78%. |
| (g) | Computed on an annualized basis for periods less than one year. |
| (h) | The variation in the Fund’s turnover rate from 2015 to 2016 was primarily due to sales of equity securities in early 2016 in an effort to reduce risk. By mid-2016, in an effort to gain more exposure, the Fund returned to its normal investment strategy. |
See accompanying notes to financial statements.
| 54
Table of Contents
Financial Highlights (continued)
For a share outstanding throughout each period.
| ASG Dynamic Allocation Fund—Class C | ||||||||
| Year Ended December 31, 2016 |
Period Ended December 31, 2015* |
|||||||
| Net asset value, beginning of the period |
$ | 9.85 | $ | 10.00 | ||||
|
|
|
|
|
|||||
| INCOME (LOSS) FROM INVESTMENT OPERATIONS: |
||||||||
| Net investment loss(a) |
(0.07 | ) | (0.00 | )(b) | ||||
| Net realized and unrealized gain (loss) |
0.23 | (0.14 | ) | |||||
|
|
|
|
|
|||||
| Total from Investment Operations |
0.16 | (0.14 | ) | |||||
|
|
|
|
|
|||||
| LESS DISTRIBUTIONS FROM: |
||||||||
| Net investment income |
(0.00 | )(b) | (0.01 | ) | ||||
| Net realized capital gains |
— | — | ||||||
|
|
|
|
|
|||||
| Total Distributions |
(0.00 | ) | (0.01 | ) | ||||
|
|
|
|
|
|||||
| Net asset value, end of the period |
$ | 10.01 | $ | 9.85 | ||||
|
|
|
|
|
|||||
| Total return(c)(d) |
1.63 | % | (1.37 | )%(e) | ||||
| RATIOS TO AVERAGE NET ASSETS: |
||||||||
| Net assets, end of the period (000’s) |
$ | 9 | $ | 8 | ||||
| Net expenses(f) |
1.91 | %(g) | 1.90 | %(h) | ||||
| Gross expenses |
2.51 | %(g) | 4.72 | %(h) | ||||
| Net investment loss |
(0.75 | )% | (0.16 | )%(h) | ||||
| Portfolio turnover rate |
115 | %(i) | 11 | % | ||||
| * | From commencement of operations on November 30, 2015 through December 31, 2015. |
| (a) | Per share net investment loss has been calculated using the average shares outstanding during the period. |
| (b) | Amount rounds to less than $0.01 per share. |
| (c) | A contingent deferred sales charge for Class C shares is not reflected in total return calculations. |
| (d) | Had certain expenses not been waived/reimbursed during the period, total returns would have been lower. Periods less than one year are not annualized. |
| (e) | Periods less than one year, if applicable, are not annualized. |
| (f) | The investment adviser agreed to waive its fees and/or reimburse a portion of the Fund’s expenses during the period. Without this waiver/reimbursement, expenses would have been higher. |
| (g) | Includes interest expense. Without this expense the ratio of net expenses would have been 1.90% and the ratio of gross expenses would have been 2.50%. |
| (h) | Computed on an annualized basis for periods less than one year. |
| (i) | The variation in the Fund’s turnover rate from 2015 to 2016 was primarily due to sales of equity securities in early 2016 in an effort to reduce risk. By mid-2016, in an effort to gain more exposure, the Fund returned to its normal investment strategy. |
See accompanying notes to financial statements.
55 |
Table of Contents
Financial Highlights (continued)
For a share outstanding throughout each period.
| ASG Dynamic Allocation Fund—Class Y | ||||||||
| Year Ended December 31, 2016 |
Period Ended December 31, 2015* |
|||||||
| Net asset value, beginning of the period |
$ | 9.86 | $ | 10.00 | ||||
|
|
|
|
|
|||||
| INCOME (LOSS) FROM INVESTMENT OPERATIONS: |
||||||||
| Net investment income(a) |
0.03 | 0.01 | ||||||
| Net realized and unrealized gain (loss) |
0.23 | (0.14 | ) | |||||
|
|
|
|
|
|||||
| Total from Investment Operations |
0.26 | (0.13 | ) | |||||
|
|
|
|
|
|||||
| LESS DISTRIBUTIONS FROM: |
||||||||
| Net investment income |
(0.03 | ) | (0.01 | ) | ||||
| Net realized capital gains |
— | — | ||||||
|
|
|
|
|
|||||
| Total Distributions |
(0.03 | ) | (0.01 | ) | ||||
|
|
|
|
|
|||||
| Net asset value, end of the period |
$ | 10.09 | $ | 9.86 | ||||
|
|
|
|
|
|||||
| Total return(b) |
2.57 | % | (1.26 | )%(c) | ||||
| RATIOS TO AVERAGE NET ASSETS: |
||||||||
| Net assets, end of the period (000’s) |
$ | 22,334 | $ | 20,095 | ||||
| Net expenses(d) |
0.91 | %(e) | 0.90 | %(f) | ||||
| Gross expenses |
1.54 | %(e) | 3.72 | %(f) | ||||
| Net investment income |
0.32 | % | 1.39 | %(f) | ||||
| Portfolio turnover rate |
115 | %(g) | 11 | % | ||||
| * | From commencement of operations on November 30, 2015 through December 31, 2015. |
| (a) | Per share net investment income has been calculated using the average shares outstanding during the period. |
| (b) | Had certain expenses not been waived/reimbursed during the period, total returns would have been lower. Periods less than one year are not annualized. |
| (c) | Periods less than one year, if applicable, are not annualized. |
| (d) | The investment adviser agreed to waive its fees and/or reimburse a portion of the Fund’s expenses during the period. Without this waiver/reimbursement, expenses would have been higher. |
| (e) | Includes interest expense. Without this expense the ratio of net expenses would have been 0.90% and the ratio of gross expenses would have been 1.53%. |
| (f) | Computed on an annualized basis for periods less than one year. |
| (g) | The variation in the Fund’s turnover rate from 2015 to 2016 was primarily due to sales of equity securities in early 2016 in an effort to reduce risk. By mid 2016, in an effort to gain more exposure, the Fund returned to its normal investment strategy. |
See accompanying notes to financial statements.
| 56
Table of Contents
Financial Highlights (continued)
For a share outstanding throughout each period.
| ASG Global Alternatives Fund (Consolidated*)—Class A | ||||||||||||||||||||
| Year Ended December 31, 2016 |
Year Ended December 31, 2015 |
Year Ended December 31, 2014 |
Year Ended December 31, 2013 |
Year Ended December 31, 2012 |
||||||||||||||||
| Net asset value, beginning of the period |
$ | 10.48 | $ | 11.12 | $ | 11.33 | $ | 10.62 | $ | 10.26 | ||||||||||
|
|
|
|
|
|
|
|
|
|
|
|||||||||||
| INCOME (LOSS) FROM INVESTMENT OPERATIONS: |
||||||||||||||||||||
| Net investment loss(a) |
(0.09 | ) | (0.14 | ) | (0.15 | ) | (0.15 | ) | (0.14 | ) | ||||||||||
| Net realized and unrealized gain (loss) |
(0.37 | ) | (0.12 | ) | 0.53 | 1.79 | 0.50 | |||||||||||||
|
|
|
|
|
|
|
|
|
|
|
|||||||||||
| Total from Investment Operations |
(0.46 | ) | (0.26 | ) | 0.38 | 1.64 | 0.36 | |||||||||||||
|
|
|
|
|
|
|
|
|
|
|
|||||||||||
| LESS DISTRIBUTIONS FROM: |
||||||||||||||||||||
| Net investment income |
— | — | — | (0.02 | ) | — | ||||||||||||||
| Net realized capital gains |
— | (0.38 | ) | (0.59 | ) | (0.91 | ) | — | ||||||||||||
|
|
|
|
|
|
|
|
|
|
|
|||||||||||
| Total Distributions |
— | (0.38 | ) | (0.59 | ) | (0.93 | ) | — | ||||||||||||
|
|
|
|
|
|
|
|
|
|
|
|||||||||||
| Net asset value, end of the period |
$ | 10.02 | $ | 10.48 | $ | 11.12 | $ | 11.33 | $ | 10.62 | ||||||||||
|
|
|
|
|
|
|
|
|
|
|
|||||||||||
| Total return(b) |
(4.39 | )% | (2.69 | )% | 3.53 | % | 15.69 | % | 3.51 | % | ||||||||||
| RATIOS TO AVERAGE NET ASSETS: |
||||||||||||||||||||
| Net assets, end of the period (000’s) |
$ | 76,207 | $ | 224,951 | $ | 150,462 | $ | 189,313 | $ | 126,226 | ||||||||||
| Net expenses |
1.56 | %(c) | 1.53 | %(d) | 1.55 | %(e) | 1.58 | %(f) | 1.61 | %(g)(h) | ||||||||||
| Gross expenses |
1.56 | %(c) | 1.53 | %(d) | 1.55 | %(e) | 1.58 | %(f) | 1.61 | %(g)(h) | ||||||||||
| Net investment loss |
(0.93 | )% | (1.27 | )% | (1.34 | )% | (1.35 | )% | (1.34 | )% | ||||||||||
| Portfolio turnover rate(i) |
— | % | — | % | — | % | — | % | — | % | ||||||||||
| * | See Notes 1 and 2 of the Notes to Financial Statements. |
| (a) | Per share net investment loss has been calculated using the average shares outstanding during the period. |
| (b) | A sales charge for Class A shares is not reflected in total return calculations. |
| (c) | Includes interest expense. Without this expense the ratio of net expenses would have been 1.54% and the ratio of gross expenses would have been 1.54%. |
| (d) | Includes interest expense. Without this expense the ratio of net expenses would have been 1.52% and the ratio of gross expenses would have been 1.52%. |
| (e) | Includes interest expense. Without this expense the ratio of net expenses would have been 1.53% and the ratio of gross expenses would have been 1.53%. |
| (f) | Includes interest expense. Without this expense the ratio of net expenses would have been 1.57% and the ratio of gross expenses would have been 1.57%. |
| (g) | Includes interest expense. Without this expense the ratio of net expenses would have been 1.60% and the ratio of gross expenses would have been 1.60%. |
| (h) | Includes fee/expense recovery of 0.01%. |
| (i) | Due to the short-term nature of the portfolio of investments there is no portfolio turnover calculation. |
See accompanying notes to financial statements.
57 |
Table of Contents
Financial Highlights (continued)
For a share outstanding throughout each period.
| ASG Global Alternatives Fund (Consolidated*)—Class C | ||||||||||||||||||||
| Year Ended December 31, 2016 |
Year Ended December 31, 2015 |
Year Ended December 31, 2014 |
Year Ended December 31, 2013 |
Year Ended December 31, 2012 |
||||||||||||||||
| Net asset value, beginning of the period |
$ | 9.91 | $ | 10.61 | $ | 10.92 | $ | 10.32 | $ | 10.05 | ||||||||||
|
|
|
|
|
|
|
|
|
|
|
|||||||||||
| INCOME (LOSS) FROM INVESTMENT OPERATIONS: |
||||||||||||||||||||
| Net investment loss(a) |
(0.15 | ) | (0.21 | ) | (0.22 | ) | (0.23 | ) | (0.21 | ) | ||||||||||
| Net realized and unrealized gain (loss) |
(0.36 | ) | (0.11 | ) | 0.50 | 1.74 | 0.48 | |||||||||||||
|
|
|
|
|
|
|
|
|
|
|
|||||||||||
| Total from Investment Operations |
(0.51 | ) | (0.32 | ) | 0.28 | 1.51 | 0.27 | |||||||||||||
|
|
|
|
|
|
|
|
|
|
|
|||||||||||
| LESS DISTRIBUTIONS FROM: |
||||||||||||||||||||
| Net investment income |
— | — | — | — | — | |||||||||||||||
| Net realized capital gains |
— | (0.38 | ) | (0.59 | ) | (0.91 | ) | — | ||||||||||||
|
|
|
|
|
|
|
|
|
|
|
|||||||||||
| Total Distributions |
— | (0.38 | ) | (0.59 | ) | (0.91 | ) | — | ||||||||||||
|
|
|
|
|
|
|
|
|
|
|
|||||||||||
| Net asset value, end of the period |
$ | 9.40 | $ | 9.91 | $ | 10.61 | $ | 10.92 | $ | 10.32 | ||||||||||
|
|
|
|
|
|
|
|
|
|
|
|||||||||||
| Total return(b) |
(5.15 | )% | (3.40 | )% | 2.73 | % | 14.86 | % | 2.69 | % | ||||||||||
| RATIOS TO AVERAGE NET ASSETS: |
||||||||||||||||||||
| Net assets, end of the period (000’s) |
$ | 38,412 | $ | 95,885 | $ | 87,941 | $ | 85,323 | $ | 71,227 | ||||||||||
| Net expenses |
2.31 | %(c) | 2.28 | %(d) | 2.31 | %(e) | 2.33 | %(f) | 2.36 | %(g)(h) | ||||||||||
| Gross expenses |
2.31 | %(c) | 2.28 | %(d) | 2.31 | %(e) | 2.33 | %(f) | 2.36 | %(g)(h) | ||||||||||
| Net investment loss |
(1.68 | )% | (2.03 | )% | (2.10 | )% | (2.10 | )% | (2.10 | )% | ||||||||||
| Portfolio turnover rate(i) |
— | % | — | % | — | % | — | % | — | % | ||||||||||
| * | See Notes 1 and 2 of the Notes to Financial Statements. |
| (a) | Per share net investment loss has been calculated using the average shares outstanding during the period. |
| (b) | A contingent deferred sales charge for Class C shares is not reflected in total return calculations. |
| (c) | Includes interest expense. Without this expense the ratio of net expenses would have been 2.29% and the ratio of gross expenses would have been 2.29%. |
| (d) | Includes interest expense. Without this expense the ratio of net expenses would have been 2.26% and the ratio of gross expenses would have been 2.26%. |
| (e) | Includes interest expense. Without this expense the ratio of net expenses would have been 2.28% and the ratio of gross expenses would have been 2.28%. |
| (f) | Includes interest expense. Without this expense the ratio of net expenses would have been 2.32% and the ratio of gross expenses would have been 2.32%. |
| (g) | Includes interest expense. Without this expense the ratio of net expenses would have been 2.35% and the ratio of gross expenses would have been 2.35%. |
| (h) | Includes fee/expense recovery of 0.01%. |
| (i) | Due to the short-term nature of the portfolio of investments there is no portfolio turnover calculation. |
See accompanying notes to financial statements.
| 58
Table of Contents
Financial Highlights (continued)
For a share outstanding throughout each period.
| ASG Global Alternatives Fund (Consolidated*)—Class N | ||||||||||||||||
| Year Ended December 31, 2016 |
Year Ended December 31, 2015 |
Year Ended December 31, 2014 |
Period Ended December 31, 2013** |
|||||||||||||
| Net asset value, beginning of the period |
$ | 10.63 | $ | 11.24 | $ | 11.42 | $ | 11.20 | ||||||||
|
|
|
|
|
|
|
|
|
|||||||||
| INCOME (LOSS) FROM INVESTMENT OPERATIONS: |
||||||||||||||||
| Net investment loss(a) |
(0.06 | ) | (0.11 | ) | (0.12 | ) | (0.09 | ) | ||||||||
| Net realized and unrealized gain (loss) |
(0.38 | ) | (0.12 | ) | 0.53 | 0.99 | ||||||||||
|
|
|
|
|
|
|
|
|
|||||||||
| Total from Investment Operations |
(0.44 | ) | (0.23 | ) | 0.41 | 0.90 | ||||||||||
|
|
|
|
|
|
|
|
|
|||||||||
| LESS DISTRIBUTIONS FROM: |
||||||||||||||||
| Net investment income |
— | — | — | — | ||||||||||||
| Net realized capital gains |
— | (0.38 | ) | (0.59 | ) | (0.68 | ) | |||||||||
|
|
|
|
|
|
|
|
|
|||||||||
| Total Distributions |
— | (0.38 | ) | (0.59 | ) | (0.68 | ) | |||||||||
|
|
|
|
|
|
|
|
|
|||||||||
| Net asset value, end of the period |
$ | 10.19 | $ | 10.63 | $ | 11.24 | $ | 11.42 | ||||||||
|
|
|
|
|
|
|
|
|
|||||||||
| Total return |
(4.05 | )% | (2.48 | )% | 3.77 | %(b) | 8.05 | %(b)(c) | ||||||||
| RATIOS TO AVERAGE NET ASSETS: |
||||||||||||||||
| Net assets, end of the period (000’s) |
$ | 9,639 | $ | 10,476 | $ | 1 | $ | 1 | ||||||||
| Net expenses |
1.24 | %(d) | 1.23 | %(e) | 1.27 | %(f)(g) | 1.32 | %(g)(h)(i) | ||||||||
| Gross expenses |
1.24 | %(d) | 1.23 | %(e) | 7.42 | %(f) | 3.22 | %(h)(i) | ||||||||
| Net investment loss |
(0.56 | )% | (0.97 | )% | (1.07 | )% | (1.12 | )%(i) | ||||||||
| Portfolio turnover rate(j) |
— | % | — | % | — | % | — | % | ||||||||
| * | See Notes 1 and 2 of the Notes to Financial Statements. |
| ** | From commencement of Class operations on May 1, 2013 through December 31, 2013. |
| (a) | Per share net investment loss has been calculated using the average shares outstanding during the period. |
| (b) | Had certain expenses not been waived/reimbursed during the period, total returns would have been lower. |
| (c) | Periods less than one year are not annualized. |
| (d) | Includes interest expense. Without this expense the ratio of net expenses would have been 1.22% and the ratio of gross expenses would have been 1.22%. |
| (e) | Includes interest expense. Without this expense the ratio of net expenses would have been 1.21% and the ratio of gross expenses would have been 1.21%. |
| (f) | Includes interest expense. Without this expense the ratio of net expenses would have been 1.25% and the ratio of gross expenses would have been 7.40%. |
| (g) | The investment adviser agreed to waive its fees and/or reimburse a portion of the Fund’s expenses during the period. Without this waiver/reimbursement, expenses would have been higher. |
| (h) | Includes interest expense. Without this expense the ratio of net expenses would have been 1.30% and the ratio of gross expenses would have been 3.20%. |
| (i) | Computed on an annualized basis for periods less than one year. |
| (j) | Due to the short-term nature of the portfolio of investments there is no portfolio turnover calculation. |
See accompanying notes to financial statements.
59 |
Table of Contents
Financial Highlights (continued)
For a share outstanding throughout each period.
| ASG Global Alternatives Fund (Consolidated*)—Class Y | ||||||||||||||||||||
| Year Ended December 31, 2016 |
Year Ended December 31, 2015 |
Year Ended December 31, 2014 |
Year Ended December 31, 2013 |
Year Ended December 31, 2012 |
||||||||||||||||
| Net asset value, beginning of the period |
$ | 10.64 | $ | 11.25 | $ | 11.43 | $ | 10.72 | $ | 10.34 | ||||||||||
|
|
|
|
|
|
|
|
|
|
|
|||||||||||
| INCOME (LOSS) FROM INVESTMENT OPERATIONS: |
||||||||||||||||||||
| Net investment loss(a) |
(0.07 | ) | (0.12 | ) | (0.12 | ) | (0.13 | ) | (0.11 | ) | ||||||||||
| Net realized and unrealized gain (loss) |
(0.38 | ) | (0.11 | ) | 0.53 | 1.82 | 0.49 | |||||||||||||
|
|
|
|
|
|
|
|
|
|
|
|||||||||||
| Total from Investment Operations |
(0.45 | ) | (0.23 | ) | 0.41 | 1.69 | 0.38 | |||||||||||||
|
|
|
|
|
|
|
|
|
|
|
|||||||||||
| LESS DISTRIBUTIONS FROM: |
||||||||||||||||||||
| Net investment income |
— | — | — | (0.07 | ) | — | ||||||||||||||
| Net realized capital gains |
— | (0.38 | ) | (0.59 | ) | (0.91 | ) | — | ||||||||||||
|
|
|
|
|
|
|
|
|
|
|
|||||||||||
| Total Distributions |
— | (0.38 | ) | (0.59 | ) | (0.98 | ) | — | ||||||||||||
|
|
|
|
|
|
|
|
|
|
|
|||||||||||
| Net asset value, end of the period |
$ | 10.19 | $ | 10.64 | $ | 11.25 | $ | 11.43 | $ | 10.72 | ||||||||||
|
|
|
|
|
|
|
|
|
|
|
|||||||||||
| Total return |
(4.23 | )% | (2.38 | )% | 3.77 | % | 16.05 | % | 3.68 | % | ||||||||||
| RATIOS TO AVERAGE NET ASSETS: |
||||||||||||||||||||
| Net assets, end of the period (000’s) |
$ | 1,504,641 | $ | 3,344,101 | $ | 2,786,510 | $ | 2,168,502 | $ | 1,002,226 | ||||||||||
| Net expenses |
1.31 | %(b) | 1.28 | %(c) | 1.31 | %(b) | 1.33 | %(d) | 1.36 | %(e)(f) | ||||||||||
| Gross expenses |
1.31 | %(b) | 1.28 | %(c) | 1.31 | %(b) | 1.33 | %(d) | 1.36 | %(e)(f) | ||||||||||
| Net investment loss |
(0.67 | )% | (1.03 | )% | (1.10 | )% | (1.10 | )% | (1.10 | )% | ||||||||||
| Portfolio turnover rate(g) |
— | % | — | % | — | % | — | % | — | % | ||||||||||
| * | See Notes 1 and 2 of the Notes to Financial Statements. |
| (a) | Per share net investment loss has been calculated using the average shares outstanding during the period. |
| (b) | Includes interest expense. Without this expense the ratio of net expenses would have been 1.29% and the ratio of gross expenses would have been 1.29%. |
| (c) | Includes interest expense. Without this expense the ratio of net expenses would have been 1.26% and the ratio of gross expenses would have been 1.26%. |
| (d) | Includes interest expense. Without this expense the ratio of net expenses would have been 1.32% and the ratio of gross expenses would have been 1.32%. |
| (e) | Includes interest expense. Without this expense the ratio of net expenses would have been 1.35% and the ratio of gross expenses would have been 1.35%. |
| (f) | Includes fee/expense recovery of 0.01%. |
| (g) | Due to the short-term nature of the portfolio of investments there is no portfolio turnover calculation. |
See accompanying notes to financial statements.
| 60
Table of Contents
Financial Highlights (continued)
For a share outstanding throughout each period.
| ASG Managed Futures Strategy Fund (Consolidated*)—Class A | ||||||||||||||||||||
| Year Ended December 31, 2016 |
Year Ended December 31, 2015 |
Year Ended December 31, 2014 |
Year Ended December 31, 2013 |
Year Ended December 31, 2012 |
||||||||||||||||
| Net asset value, beginning of the period |
$ | 10.37 | $ | 10.98 | $ | 10.25 | $ | 9.11 | $ | 10.34 | ||||||||||
|
|
|
|
|
|
|
|
|
|
|
|||||||||||
| INCOME (LOSS) FROM INVESTMENT OPERATIONS: |
||||||||||||||||||||
| Net investment loss(a) |
(0.12 | ) | (0.16 | ) | (0.16 | ) | (0.14 | ) | (0.14 | ) | ||||||||||
| Net realized and unrealized gain (loss) |
(0.47 | ) | 0.06 | (b) | 2.37 | 1.28 | (1.00 | ) | ||||||||||||
|
|
|
|
|
|
|
|
|
|
|
|||||||||||
| Total from Investment Operations |
(0.59 | ) | (0.10 | ) | 2.21 | 1.14 | (1.14 | ) | ||||||||||||
|
|
|
|
|
|
|
|
|
|
|
|||||||||||
| LESS DISTRIBUTIONS FROM: |
||||||||||||||||||||
| Net investment income |
— | (0.22 | ) | (0.29 | ) | — | (0.09 | ) | ||||||||||||
| Net realized capital gains |
— | (0.29 | ) | (1.19 | ) | — | — | |||||||||||||
|
|
|
|
|
|
|
|
|
|
|
|||||||||||
| Total Distributions |
— | (0.51 | ) | (1.48 | ) | — | (0.09 | ) | ||||||||||||
|
|
|
|
|
|
|
|
|
|
|
|||||||||||
| Net asset value, end of the period |
$ | 9.78 | $ | 10.37 | $ | 10.98 | $ | 10.25 | $ | 9.11 | ||||||||||
|
|
|
|
|
|
|
|
|
|
|
|||||||||||
| Total return(c) |
(5.69 | )%(d) | (1.38 | )% | 21.76 | %(d) | 12.51 | %(d) | (11.09 | )%(d) | ||||||||||
| RATIOS TO AVERAGE NET ASSETS: |
||||||||||||||||||||
| Net assets, end of the period (000’s) |
$ | 463,235 | $ | 486,160 | $ | 137,991 | $ | 125,903 | $ | 145,729 | ||||||||||
| Net expenses |
1.74 | %(e)(f) | 1.73 | %(g)(h) | 1.72 | %(f)(i) | 1.73 | %(f)(j) | 1.73 | %(f)(k) | ||||||||||
| Gross expenses |
1.75 | %(e) | 1.73 | %(g)(h) | 1.76 | %(i) | 1.78 | %(j) | 1.80 | %(k) | ||||||||||
| Net investment loss |
(1.11 | )% | (1.48 | )% | (1.53 | )% | (1.51 | )% | (1.49 | )% | ||||||||||
| Portfolio turnover rate(l) |
— | % | — | % | — | % | — | % | — | % | ||||||||||
| * | See Notes 1 and 2 of the Notes to Financial Statements. |
| (a) | Per share net investment loss has been calculated using the average shares outstanding during the period. |
| (b) | The amount shown for a share outstanding does not correspond with the aggregate realized and unrealized gain (loss) on investments for the period due to the timing of sales and redemptions of fund shares in relation to fluctuating market values of investments of the Fund. |
| (c) | A sales charge for Class A shares is not reflected in total return calculations. |
| (d) | Had certain expenses not been waived/reimbursed during the period, total returns would have been lower. |
| (e) | Includes interest expense. Without this expense the ratio of net expenses would have been 1.70% and the ratio of gross expenses would have been 1.71%. |
| (f) | The investment adviser agreed to waive its fees and/or reimburse a portion of the Fund’s expenses during the period. Without this waiver/reimbursement, expenses would have been higher. |
| (g) | Includes interest expense. Without this expense the ratio of net expenses would have been 1.70% and the ratio of gross expenses would have been 1.70%. |
| (h) | Includes fee/expense recovery of less than 0.01%. |
| (i) | Includes interest expense. Without this expense the ratio of net expenses would have been 1.70% and the ratio of gross expenses would have been 1.74%. |
| (j) | Includes interest expense. Without this expense the ratio of net expenses would have been 1.70% and the ratio of gross expenses would have been 1.75%. |
| (k) | Includes interest expense. Without this expense the ratio of net expenses would have been 1.70% and the ratio of gross expenses would have been 1.77%. |
| (l) | Due to the short-term nature of the portfolio of investments there is no portfolio turnover calculation. |
See accompanying notes to financial statements.
61 |
Table of Contents
Financial Highlights (continued)
For a share outstanding throughout each period.
| ASG Managed Futures Strategy Fund (Consolidated*)—Class C | ||||||||||||||||||||
| Year Ended December 31, 2016 |
Year Ended December 31, 2015 |
Year Ended December 31, 2014 |
Year Ended December 31, 2013 |
Year Ended December 31, 2012 |
||||||||||||||||
| Net asset value, beginning of the period |
$ | 10.07 | $ | 10.69 | $ | 10.03 | $ | 8.99 | $ | 10.25 | ||||||||||
|
|
|
|
|
|
|
|
|
|
|
|||||||||||
| INCOME (LOSS) FROM INVESTMENT OPERATIONS: |
||||||||||||||||||||
| Net investment loss(a) |
(0.19 | ) | (0.24 | ) | (0.24 | ) | (0.21 | ) | (0.21 | ) | ||||||||||
| Net realized and unrealized gain (loss) |
(0.46 | ) | 0.05 | (b) | 2.32 | 1.25 | (0.99 | ) | ||||||||||||
|
|
|
|
|
|
|
|
|
|
|
|||||||||||
| Total from Investment Operations |
(0.65 | ) | (0.19 | ) | 2.08 | 1.04 | (1.20 | ) | ||||||||||||
|
|
|
|
|
|
|
|
|
|
|
|||||||||||
| LESS DISTRIBUTIONS FROM: |
||||||||||||||||||||
| Net investment income |
— | (0.14 | ) | (0.23 | ) | — | (0.06 | ) | ||||||||||||
| Net realized capital gains |
— | (0.29 | ) | (1.19 | ) | — | — | |||||||||||||
|
|
|
|
|
|
|
|
|
|
|
|||||||||||
| Total Distributions |
— | (0.43 | ) | (1.42 | ) | — | (0.06 | ) | ||||||||||||
|
|
|
|
|
|
|
|
|
|
|
|||||||||||
| Net asset value, end of the period |
$ | 9.42 | $ | 10.07 | $ | 10.69 | $ | 10.03 | $ | 8.99 | ||||||||||
|
|
|
|
|
|
|
|
|
|
|
|||||||||||
| Total return(c) |
(6.45 | )%(d) | (2.23 | )% | 21.01 | %(d) | 11.57 | %(d) | (11.74 | )%(d) | ||||||||||
| RATIOS TO AVERAGE NET ASSETS: |
||||||||||||||||||||
| Net assets, end of the period (000’s) |
$ | 71,184 | $ | 67,479 | $ | 33,945 | $ | 18,770 | $ | 21,891 | ||||||||||
| Net expenses |
2.49 | %(e)(f) | 2.48 | %(g)(h) | 2.47 | %(f)(i) | 2.48 | %(f)(j) | 2.48 | %(f)(k) | ||||||||||
| Gross expenses |
2.50 | %(e) | 2.48 | %(g)(h) | 2.51 | %(i) | 2.53 | %(j) | 2.55 | %(k) | ||||||||||
| Net investment loss |
(1.86 | )% | (2.24 | )% | (2.28 | )% | (2.26 | )% | (2.24 | )% | ||||||||||
| Portfolio turnover rate(l) |
— | % | — | % | — | % | — | % | — | % | ||||||||||
| * | See Notes 1 and 2 of the Notes to Financial Statements. |
| (a) | Per share net investment loss has been calculated using the average shares outstanding during the period. |
| (b) | The amount shown for a share outstanding does not correspond with the aggregate realized and unrealized gain (loss) on investments for the period due to the timing of sales and redemptions of fund shares in relation to fluctuating market values of investments of the Fund. |
| (c) | A contingent deferred sales charge for Class C shares is not reflected in total return calculations. |
| (d) | Had certain expenses not been waived/reimbursed during the period, total returns would have been lower. |
| (e) | Includes interest expense. Without this expense the ratio of net expenses would have been 2.45% and the ratio of gross expenses would have been 2.46%. |
| (f) | The investment adviser agreed to waive its fees and/or reimburse a portion of the Fund’s expenses during the period. Without this waiver/reimbursement, expenses would have been higher. |
| (g) | Includes fee/expense recovery of less than 0.01%. |
| (h) | Includes interest expense. Without this expense the ratio of net expenses would have been 2.45% and the ratio of gross expenses would have been 2.45%. |
| (i) | Includes interest expense. Without this expense the ratio of net expenses would have been 2.45% and the ratio of gross expenses would have been 2.49%. |
| (j) | Includes interest expense. Without this expense the ratio of net expenses would have been 2.45% and the ratio of gross expenses would have been 2.50%. |
| (k) | Includes interest expense. Without this expense the ratio of net expenses would have been 2.45% and the ratio of gross expenses would have been 2.52%. |
| (l) | Due to the short-term nature of the portfolio of investments there is no portfolio turnover calculation. |
See accompanying notes to financial statements.
| 62
Table of Contents
Financial Highlights (continued)
For a share outstanding throughout each period.
| ASG Managed Futures Strategy Fund (Consolidated*)—Class Y | ||||||||||||||||||||
| Year Ended December 31, 2016 |
Year Ended December 31, 2015 |
Year Ended December 31, 2014 |
Year Ended December 31, 2013 |
Year Ended December 31, 2012 |
||||||||||||||||
| Net asset value, beginning of the period |
$ | 10.40 | $ | 11.01 | $ | 10.26 | $ | 9.10 | $ | 10.34 | ||||||||||
|
|
|
|
|
|
|
|
|
|
|
|||||||||||
| INCOME (LOSS) FROM INVESTMENT OPERATIONS: |
||||||||||||||||||||
| Net investment loss(a) |
(0.09 | ) | (0.14 | ) | (0.14 | ) | (0.12 | ) | (0.12 | ) | ||||||||||
| Net realized and unrealized gain (loss) |
(0.48 | ) | 0.05 | (b) | 2.40 | 1.28 | (1.00 | ) | ||||||||||||
|
|
|
|
|
|
|
|
|
|
|
|||||||||||
| Total from Investment Operations |
(0.57 | ) | (0.09 | ) | 2.26 | 1.16 | (1.12 | ) | ||||||||||||
|
|
|
|
|
|
|
|
|
|
|
|||||||||||
| LESS DISTRIBUTIONS FROM: |
||||||||||||||||||||
| Net investment income |
(0.00 | )(c) | (0.23 | ) | (0.32 | ) | (0.00 | )(c) | (0.12 | ) | ||||||||||
| Net realized capital gains |
— | (0.29 | ) | (1.19 | ) | — | — | |||||||||||||
|
|
|
|
|
|
|
|
|
|
|
|||||||||||
| Total Distributions |
(0.00 | ) | (0.52 | ) | (1.51 | ) | (0.00 | ) | (0.12 | ) | ||||||||||
|
|
|
|
|
|
|
|
|
|
|
|||||||||||
| Net asset value, end of the period |
$ | 9.83 | $ | 10.40 | $ | 11.01 | $ | 10.26 | $ | 9.10 | ||||||||||
|
|
|
|
|
|
|
|
|
|
|
|||||||||||
| Total return |
(5.47 | )%(d) | (1.22 | )% | 22.21 | %(d) | 12.75 | %(d) | (10.90 | )%(d) | ||||||||||
| RATIOS TO AVERAGE NET ASSETS: |
||||||||||||||||||||
| Net assets, end of the period (000’s) |
$ | 2,629,920 | $ | 2,133,620 | $ | 1,363,162 | $ | 695,307 | $ | 593,013 | ||||||||||
| Net expenses |
1.49 | %(e)(f) | 1.48 | %(g)(h) | 1.47 | %(f)(i) | 1.48 | %(f)(j) | 1.48 | %(f)(k) | ||||||||||
| Gross expenses |
1.50 | %(e) | 1.48 | %(g)(h) | 1.51 | %(i) | 1.53 | %(j) | 1.56 | %(k) | ||||||||||
| Net investment loss |
(0.85 | )% | (1.24 | )% | (1.28 | )% | (1.26 | )% | (1.24 | )% | ||||||||||
| Portfolio turnover rate(l) |
— | % | — | % | — | % | — | % | — | % | ||||||||||
| * | See Notes 1 and 2 of the Notes to Financial Statements. |
| (a) | Per share net investment loss has been calculated using the average shares outstanding during the period. |
| (b) | The amount shown for a share outstanding does not correspond with the aggregate realized and unrealized gain (loss) on investments for the period due to the timing of sales and redemptions of fund shares in relation to fluctuating market values of investments of the Fund. |
| (c) | Amount rounds to less than $0.01 per share. |
| (d) | Had certain expenses not been waived/reimbursed during the period, total returns would have been lower. |
| (e) | Includes interest expense. Without this expense the ratio of net expenses would have been 1.45% and the ratio of gross expenses would have been 1.46%. |
| (f) | The investment adviser agreed to waive its fees and/or reimburse a portion of the Fund’s expenses during the period. Without this waiver/reimbursement, expenses would have been higher. |
| (g) | Includes fee/expense recovery of less than 0.01%. |
| (h) | Includes interest expense. Without this expense the ratio of net expenses would have been 1.45% and the ratio of gross expenses would have been 1.45%. |
| (i) | Includes interest expense. Without this expense the ratio of net expenses would have been 1.45% and the ratio of gross expenses would have been 1.49%. |
| (j) | Includes interest expense. Without this expense the ratio of net expenses would have been 1.45% and the ratio of gross expenses would have been 1.51%. |
| (k) | Includes interest expense. Without this expense the ratio of net expenses would have been 1.45% and the ratio of gross expenses would have been 1.52%. |
| (l) | Due to the short-term nature of the portfolio of investments there is no portfolio turnover calculation. |
See accompanying notes to financial statements.
63 |
Table of Contents
Financial Highlights (continued)
For a share outstanding throughout each period.
| ASG Tactical U.S. Market Fund—Class A | ||||||||||||||||
| Year Ended December 31, 2016 |
Year Ended December 31, 2015 |
Year Ended December 31, 2014 |
Period Ended December 31, 2013* |
|||||||||||||
| Net asset value, beginning of the period |
$ | 11.41 | $ | 11.85 | $ | 11.02 | $ | 10.00 | ||||||||
|
|
|
|
|
|
|
|
|
|||||||||
| INCOME (LOSS) FROM INVESTMENT OPERATIONS: |
||||||||||||||||
| Net investment income (loss)(a) |
0.04 | (0.00 | )(b) | (0.01 | ) | (0.01 | ) | |||||||||
| Net realized and unrealized gain (loss) |
0.43 | (0.35 | ) | 1.60 | 1.31 | |||||||||||
|
|
|
|
|
|
|
|
|
|||||||||
| Total from Investment Operations |
0.47 | (0.35 | ) | 1.59 | 1.30 | |||||||||||
|
|
|
|
|
|
|
|
|
|||||||||
| LESS DISTRIBUTIONS FROM: |
||||||||||||||||
| Net investment income |
(0.05 | ) | — | — | — | |||||||||||
| Net realized capital gains |
— | (0.09 | ) | (0.76 | ) | (0.28 | ) | |||||||||
|
|
|
|
|
|
|
|
|
|||||||||
| Total Distributions |
(0.05 | ) | (0.09 | ) | (0.76 | ) | (0.28 | ) | ||||||||
|
|
|
|
|
|
|
|
|
|||||||||
| Net asset value, end of the period |
$ | 11.83 | $ | 11.41 | $ | 11.85 | $ | 11.02 | ||||||||
|
|
|
|
|
|
|
|
|
|||||||||
| Total return(c)(d) |
4.09 | % | (3.00 | )% | 14.69 | % | 12.96 | %(e) | ||||||||
| RATIOS TO AVERAGE NET ASSETS: |
||||||||||||||||
| Net assets, end of the period (000’s) |
$ | 8,365 | $ | 9,360 | $ | 3,089 | $ | 29 | ||||||||
| Net expenses(f) |
1.25 | % | 1.32 | % | 1.40 | % | 1.40 | %(g) | ||||||||
| Gross expenses |
1.40 | % | 1.39 | % | 1.57 | % | 2.21 | %(g) | ||||||||
| Net investment income (loss) |
0.36 | % | (0.03 | )% | (0.09 | )% | (0.38 | )%(g) | ||||||||
| Portfolio turnover rate |
42 | % | 149 | %(h) | 62 | % | 13 | % | ||||||||
| * | From commencement of operations on September 30, 2013 through December 31, 2013. |
| (a) | Per share net investment income (loss) has been calculated using the average shares outstanding during the period. |
| (b) | Amount rounds to less than $0.01 per share. |
| (c) | A sales charge for Class A shares is not reflected in total return calculations. |
| (d) | Had certain expenses not been waived/reimbursed during the period, total returns would have been lower. |
| (e) | Periods less than one year are not annualized. |
| (f) | The investment adviser agreed to waive its fees and/or reimburse a portion of the Fund’s expenses during the period. Without this waiver/reimbursement, expenses would have been higher. |
| (g) | Computed on an annualized basis for periods less than one year. |
| (h) | The variation in the Fund’s turnover rate from 2014 to 2015 was primarily due to sales of equity securities to take advantage of opportunities to harvest tax losses. |
See accompanying notes to financial statements.
| 64
Table of Contents
Financial Highlights (continued)
For a share outstanding throughout each period.
| ASG Tactical U.S. Market Fund—Class C | ||||||||||||||||
| Year Ended December 31, 2016 |
Year Ended December 31, 2015 |
Year Ended December 31, 2014 |
Period Ended December 31, 2013* |
|||||||||||||
| Net asset value, beginning of the period |
$ | 11.21 | $ | 11.73 | $ | 11.00 | $ | 10.00 | ||||||||
|
|
|
|
|
|
|
|
|
|||||||||
| INCOME (LOSS) FROM INVESTMENT OPERATIONS: |
||||||||||||||||
| Net investment loss(a) |
(0.05 | ) | (0.09 | ) | (0.10 | ) | (0.03 | ) | ||||||||
| Net realized and unrealized gain (loss) |
0.43 | (0.34 | ) | 1.59 | 1.31 | |||||||||||
|
|
|
|
|
|
|
|
|
|||||||||
| Total from Investment Operations |
0.38 | (0.43 | ) | 1.49 | 1.28 | |||||||||||
|
|
|
|
|
|
|
|
|
|||||||||
| LESS DISTRIBUTIONS FROM: |
||||||||||||||||
| Net investment income |
— | — | — | — | ||||||||||||
| Net realized capital gains |
— | (0.09 | ) | (0.76 | ) | (0.28 | ) | |||||||||
|
|
|
|
|
|
|
|
|
|||||||||
| Total Distributions |
— | (0.09 | ) | (0.76 | ) | (0.28 | ) | |||||||||
|
|
|
|
|
|
|
|
|
|||||||||
| Net asset value, end of the period |
$ | 11.59 | $ | 11.21 | $ | 11.73 | $ | 11.00 | ||||||||
|
|
|
|
|
|
|
|
|
|||||||||
| Total return(b)(c) |
3.39 | % | (3.79 | )% | 13.88 | % | 12.76 | %(d) | ||||||||
| RATIOS TO AVERAGE NET ASSETS: |
||||||||||||||||
| Net assets, end of the period (000’s) |
$ | 1,973 | $ | 2,202 | $ | 1,468 | $ | 8 | ||||||||
| Net expenses(e) |
2.00 | % | 2.07 | % | 2.15 | % | 2.15 | %(f) | ||||||||
| Gross expenses |
2.15 | % | 2.13 | % | 2.33 | % | 2.80 | %(f) | ||||||||
| Net investment loss |
(0.41 | )% | (0.79 | )% | (0.86 | )% | (1.00 | )%(f) | ||||||||
| Portfolio turnover rate |
42 | % | 149 | %(g) | 62 | % | 13 | % | ||||||||
| * | From commencement of operations on September 30, 2013 through December 31, 2013. |
| (a) | Per share net investment loss has been calculated using the average shares outstanding during the period. |
| (b) | A contingent deferred sales charge for Class C shares is not reflected in total return calculations. |
| (c) | Had certain expenses not been waived/reimbursed during the period, total returns would have been lower. |
| (d) | Periods less than one year are not annualized. |
| (e) | The investment adviser agreed to waive its fees and/or reimburse a portion of the Fund’s expenses during the period. Without this waiver/reimbursement, expenses would have been higher. |
| (f) | Computed on an annualized basis for periods less than one year. |
| (g) | The variation in the Fund’s turnover rate from 2014 to 2015 was primarily due to sales of equity securities to take advantage of opportunities to harvest tax losses. |
See accompanying notes to financial statements.
65 |
Table of Contents
Financial Highlights (continued)
For a share outstanding throughout each period.
| ASG Tactical U.S. Market Fund—Class Y | ||||||||||||||||
| Year Ended December 31, 2016 |
Year Ended December 31, 2015 |
Year Ended December 31, 2014 |
Period Ended December 31, 2013* |
|||||||||||||
| Net asset value, beginning of the period |
$ | 11.45 | $ | 11.88 | $ | 11.03 | $ | 10.00 | ||||||||
|
|
|
|
|
|
|
|
|
|||||||||
| INCOME (LOSS) FROM INVESTMENT OPERATIONS: |
||||||||||||||||
| Net investment income (loss)(a) |
0.07 | 0.02 | 0.01 | (0.00 | )(b) | |||||||||||
| Net realized and unrealized gain (loss) |
0.44 | (0.34 | ) | 1.61 | 1.31 | |||||||||||
|
|
|
|
|
|
|
|
|
|||||||||
| Total from Investment Operations |
0.51 | (0.32 | ) | 1.62 | 1.31 | |||||||||||
|
|
|
|
|
|
|
|
|
|||||||||
| LESS DISTRIBUTIONS FROM: |
||||||||||||||||
| Net investment income |
(0.09 | ) | (0.02 | ) | (0.01 | ) | — | |||||||||
| Net realized capital gains |
— | (0.09 | ) | (0.76 | ) | (0.28 | ) | |||||||||
|
|
|
|
|
|
|
|
|
|||||||||
| Total Distributions |
(0.09 | ) | (0.11 | ) | (0.77 | ) | (0.28 | ) | ||||||||
|
|
|
|
|
|
|
|
|
|||||||||
| Net asset value, end of the period |
$ | 11.87 | $ | 11.45 | $ | 11.88 | $ | 11.03 | ||||||||
|
|
|
|
|
|
|
|
|
|||||||||
| Total return(c) |
4.41 | % | (2.74 | )% | 14.92 | % | 13.06 | %(d) | ||||||||
| RATIOS TO AVERAGE NET ASSETS: |
||||||||||||||||
| Net assets, end of the period (000’s) |
$ | 58,488 | $ | 89,126 | $ | 65,042 | $ | 22,595 | ||||||||
| Net expenses(e) |
1.00 | % | 1.07 | % | 1.15 | % | 1.15 | %(f) | ||||||||
| Gross expenses |
1.15 | % | 1.14 | % | 1.32 | % | 1.93 | %(f) | ||||||||
| Net investment income (loss) |
0.58 | % | 0.20 | % | 0.10 | % | (0.13 | )%(f) | ||||||||
| Portfolio turnover rate |
42 | % | 149 | %(g) | 62 | % | 13 | % | ||||||||
| * | From commencement of operations on September 30, 2013 through December 31, 2013. |
| (a) | Per share net investment income (loss) has been calculated using the average shares outstanding during the period. |
| (b) | Amount rounds to less than $0.01 per share. |
| (c) | Had certain expenses not been waived/reimbursed during the period, total returns would have been lower. |
| (d) | Periods less than one year are not annualized. |
| (e) | The investment adviser agreed to waive its fees and/or reimburse a portion of the Fund’s expenses during the period. Without this waiver/reimbursement, expenses would have been higher. |
| (f) | Computed on an annualized basis for periods less than one year. |
| (g) | The variation in the Fund’s turnover rate from 2014 to 2015 was primarily due to sales of equity securities to take advantage of opportunities to harvest tax losses. |
See accompanying notes to financial statements.
| 66
Table of Contents
December 31, 2016
1. Organization. Natixis Funds Trust II (the “Trust”) is organized as a Massachusetts business trust. The Trust is registered under the Investment Company Act of 1940, as amended (the “1940 Act”), as an open-end management investment company. The Declaration of Trust permits the Board of Trustees to authorize the issuance of an unlimited number of shares of the Trust in multiple series. The financial statements for certain funds of the Trust are presented in separate reports. The following funds (individually, a “Fund” and collectively, the “Funds”) are included in this report:
ASG Dynamic Allocation Fund (the “Dynamic Allocation Fund”)
ASG Global Alternatives Fund (the “Global Alternatives Fund”)
ASG Managed Futures Strategy Fund (the “Managed Futures Strategy Fund”)
ASG Tactical U.S. Market Fund (the “Tactical U.S. Market Fund”)
Each Fund is a diversified investment company, except for Dynamic Allocation Fund, which is a non-diversified investment company.
Each Fund offers Class A, Class C and Class Y shares. Global Alternatives Fund also offers Class N shares. Class A shares are sold with a maximum front-end sales charge of 5.75%. Class C shares do not pay a front-end sales charge do not convert to any other class of shares, pay higher Rule 12b-1 fees than Class A shares and may be subject to a contingent deferred sales charge (“CDSC”) of 1.00% if those shares are redeemed within one year of acquisition, except for reinvested distributions. Class N and Class Y shares do not pay a front-end sales charge, a CDSC or Rule 12b-1 fees. Class N shares are offered with no initial minimum investment to certain retirement plans held in an omnibus fashion, and fund of funds that are distributed by NGAM Distribution, L.P. and with an initial minimum investment of $1,000,000 to other categories of investors. Class Y shares are generally intended for institutional investors with a minimum initial investment of $100,000, though some categories of investors are exempted from the minimum investment amount as outlined in the Funds’ prospectus.
Most expenses can be directly attributed to a Fund. Expenses which cannot be directly attributed to a Fund are generally apportioned based on the relative net assets of each of the funds in Natixis Funds Trust I, Natixis Funds Trust II, Natixis Funds Trust IV, Gateway Trust and Natixis ETF Trust (“Natixis Funds Trusts”), Loomis Sayles Funds I and Loomis Sayles Funds II (“Loomis Sayles Funds Trusts”). Expenses of a Fund are borne pro rata by the holders of each class of shares, except that each class bears expenses unique to that class (such as the Rule 12b-1 fees applicable to Class A and Class C) and transfer agent fees for Global Alternatives Fund are borne collectively for Class A, Class C and Class Y, and individually for Class N. In addition, each class votes as a class only with respect to its own Rule 12b-1 Plan. Shares of each class would receive their pro rata share of the net assets of a Fund if the Fund were liquidated. The Trustees approve separate distributions from net investment income on each class of shares.
67 |
Table of Contents
Notes to Financial Statements (continued)
December 31, 2016
Global Alternatives Fund and Managed Futures Strategy Fund invest in commodity-related instruments through ASG Global Alternatives Cayman Fund Ltd. and ASG Managed Futures Strategy Cayman Fund Ltd., wholly-owned subsidiaries (individually, a “Subsidiary” and collectively, the “Subsidiaries”) of Global Alternatives Fund and Managed Futures Strategy Fund, respectively, organized under the laws of the Cayman Islands. Subscription agreements were entered into between the Funds and their respective Subsidiaries with the intent that each Fund will remain the sole shareholder and primary beneficiary of its respective Subsidiary. The Subsidiaries are governed by a separate Board of Directors that is independent of the Funds’ Board of Trustees.
As of December 31, 2016, the value of each Fund’s investment in its respective Subsidiary was as follows:
| Fund |
Investment in Subsidiary |
Percentage of Net Assets |
||||||
| Global Alternatives Fund |
$ | 11,719,942 | 0.72 | % | ||||
| Managed Futures Strategy Fund |
88,509,600 | 2.80 | % | |||||
2. Significant Accounting Policies. The following is a summary of significant accounting policies consistently followed by each Fund in the preparation of its financial statements. The Funds’ financial statements follow the accounting and reporting guidelines provided for investment companies and are prepared in accordance with accounting principles generally accepted in the United States of America which require the use of management estimates that affect the reported amounts and disclosures in the financial statements. Actual results could differ from those estimates. Management has evaluated the events and transactions subsequent to year-end through the date the financial statements were issued and has determined that there were no material events that would require disclosure in the Funds’ financial statements.
a. Consolidation. The accompanying financial statements of Global Alternatives Fund and Managed Futures Strategy Fund present the consolidated accounts of the Funds and their respective Subsidiaries. All interfund accounts and transactions have been eliminated in consolidation.
b. Valuation. Fund securities and other investments are valued at market value based on market quotations obtained or determined by independent pricing services recommended by the adviser and approved by the Board of Trustees. Fund securities and other investments for which market quotations are not readily available are valued at fair value as determined in good faith by the adviser or subadviser pursuant to procedures approved by the Board of Trustees, as described below. Market value is determined as follows:
Debt securities and unlisted preferred equity securities are valued based on evaluated bids furnished to the Funds by an independent pricing service or bid prices obtained
| 68
Table of Contents
Notes to Financial Statements (continued)
December 31, 2016
from broker-dealers. Listed equity securities (including shares of closed-end investment companies and exchange-traded funds) are valued at the last sale price quoted on the exchange where they are traded most extensively or, if there is no reported sale during the day, the closing bid quotation as reported by an independent pricing service. Securities traded on the NASDAQ Global Select Market, NASDAQ Global Market and NASDAQ Capital Market are valued at the NASDAQ Official Closing Price (“NOCP”), or if lacking an NOCP, at the most recent bid quotations on the applicable NASDAQ Market. Unlisted equity securities (except unlisted preferred equity securities) are valued at the last sale price quoted in the market where they are traded most extensively or, if there is no reported sale during the day, the closing bid quotation as reported by an independent pricing service. If there is no last sale price or closing bid quotation available, unlisted equity securities will be valued using evaluated bids furnished by an independent pricing service, if available. In some foreign markets, an official close price and a last sale price may be available from the foreign exchange or market. In those cases, the official close price is used. Broker-dealer bid prices may be used to value debt and unlisted equity securities where an independent pricing service is unable to price a security or where an independent pricing service does not provide a reliable price for the security. Forward foreign currency contracts are valued utilizing interpolated rates determined based on information provided by an independent pricing service. Futures contracts are valued at the most recent settlement price on the exchange on which the adviser or subadviser believes that, over time, they are traded most extensively.
Fund securities and other investments for which market quotations are not readily available are valued at fair value as determined in good faith by the adviser or subadviser pursuant to procedures approved by the Board of Trustees. The Fund may also value securities and other investments at fair value in other circumstances such as when extraordinary events occur after the close of a foreign market but prior to the close of the New York Stock Exchange (“NYSE”). This may include situations relating to a single issuer (such as a declaration of bankruptcy or a delisting of the issuer’s security from the primary market on which it has traded) as well as events affecting the securities markets in general (such as market disruptions or closings and significant fluctuations in U.S. and/or foreign markets). When fair valuing its securities or other investments, the Funds may, among other things, use modeling tools or other processes that may take into account factors such as securities or other market activity and/or significant events that occur after the close of the foreign market and before the time the Fund’s net asset value (“NAV”) is calculated. Fair value pricing may require subjective determinations about the value of a security, and fair values used to determine the Fund’s NAV may differ from quoted or published prices, or from prices that are used by others, for the same securities. In addition, the use of fair value pricing may not always result in adjustments to the prices of securities held by the Fund.
69 |
Table of Contents
Notes to Financial Statements (continued)
December 31, 2016
As of December 31, 2016, futures contracts were fair valued pursuant to procedures approved by the Board of Trustees as events occurring after the close of the foreign market were believed to materially affect the value of the contracts, as follows:
| Notional |
Unrealized Appreciation/ Depreciation* |
Unrealized as a Percentage of Net Assets |
||||||||||
| Dynamic Allocation Fund |
$ | 4,406,162 | $ | 67,017 | 0.30 | % | ||||||
| Global Alternatives Fund |
606,004,773 | 12,516,751 | 0.77 | % | ||||||||
| Managed Futures Strategy Fund |
1,640,694,806 | 23,850,128 | 0.75 | % | ||||||||
| * | Amounts represent gross unrealized appreciation/(depreciation) at absolute value. |
c. Investment Transactions and Related Investment Income. Investment transactions are accounted for on a trade date plus one day basis for daily NAV calculation. However, for financial reporting purposes, investment transactions are reported on trade date. Dividend income is recorded on ex-dividend date, or in the case of certain foreign securities, as soon as the Fund is notified, and interest income is recorded on an accrual basis. Interest income is increased by the accretion of discount and decreased by the amortization of premium, if applicable. In determining net gain or loss on securities sold, the cost of securities has been determined on an identified cost basis. Investment income, non-class specific expenses and realized and unrealized gains and losses are allocated on a pro rata basis to each class based on the relative net assets of each class to the total net assets of the Fund.
d. Foreign Currency Translation. The books and records of the Funds are maintained in U.S. dollars. The values of securities, currencies and other assets and liabilities denominated in currencies other than U.S. dollars are translated into U.S. dollars based upon foreign exchange rates prevailing at the end of the period. Purchases and sales of investment securities, income and expenses are translated into U.S. dollars on the respective dates of such transactions.
Net realized foreign exchange gains or losses arise from sales of foreign currency, changes in exchange rates between the trade and settlement dates on securities transactions and the difference between the amounts of dividends, interest and foreign withholding taxes recorded on the Fund’s books and the U.S. dollar equivalent of the amounts actually received or paid. Net unrealized foreign exchange gains or losses arise from changes in the value of assets and liabilities, other than investment securities, as of the end of the fiscal period, resulting from changes in exchange rates. Net realized foreign exchange gains or losses and the net change in unrealized foreign exchange gains or losses are disclosed in the Statements of Operations.
The values of investment securities are presented at the foreign exchange rates prevailing at the end of the period for financial reporting purposes. Net realized and unrealized gains or losses on investments reported in the Statements of Operations
| 70
Table of Contents
Notes to Financial Statements (continued)
December 31, 2016
reflect gains or losses resulting from changes in exchange rates and fluctuations which arise due to changes in market prices of investment securities.
The Funds may use foreign currency exchange contracts to facilitate transactions in foreign-denominated investments. Losses may arise from changes in the value of the foreign currency or if the counterparties do not perform under the contracts’ terms.
e. Forward Foreign Currency Contracts. The Funds may enter into forward foreign currency contracts including forward foreign cross currency contracts, to acquire exposure to foreign currencies or to hedge the Funds’ investments against currency fluctuation. A contract can also be used to offset a previous contract. These contracts involve market risk in excess of the unrealized gain or loss reflected in the Funds’ Statements of Assets and Liabilities. The U.S. dollar value of the currencies a Fund has committed to buy or sell represents the aggregate exposure to each currency a Fund has acquired or hedged through currency contracts outstanding at period end. Gains or losses are recorded for financial statement purposes as unrealized until settlement date. Contracts are traded over-the-counter directly with a counterparty. Risks may arise upon entering into these contracts from the potential inability of counterparties to meet the terms of their contracts and from unanticipated movements in the value of a foreign currency relative to the U.S. dollar. When a Fund enters into a forward foreign currency contract, it is required to pledge cash or high-quality securities equal to a percentage of the notional amount of the contract to the counterparty as an independent amount of collateral. The Funds may pledge additional collateral to the counterparty to the extent of mark-to-market losses on open contracts.
f. Futures Contracts. The Funds and the Subsidiaries may enter into futures contracts. Futures contracts are agreements between two parties to buy and sell a particular commodity, instrument or index for a specified price on a specified future date.
When a Fund or a Subsidiary enters into a futures contract, it is required to deposit with (or for the benefit of) its broker an amount of cash or short-term high-quality securities as “initial margin.” As the value of the contract changes, the value of the futures contract position increases or declines. Subsequent payments, known as “variation margin,” are made or received by a Fund or the Subsidiary, depending on the price fluctuations in the fair value of the contract and the value of cash or securities on deposit with the broker. The aggregate principal amounts of the contracts are not recorded in the financial statements. Fluctuations in the value of the contracts are recorded in the Statements of Assets and Liabilities as an asset (liability) and in the Statements of Operations as unrealized appreciation (depreciation) until the contracts are closed, when they are recorded as realized gains (losses). Realized gain or loss on a futures position is equal to the difference between the value of the contract at the time it was opened and the value at the time it was closed, minus brokerage commissions. When a Fund or a Subsidiary enters into a futures contract certain risks may arise, such as illiquidity in the futures market, which may limit a Fund’s or a
71 |
Table of Contents
Notes to Financial Statements (continued)
December 31, 2016
Subsidiary’s ability to close out a futures contract prior to settlement date, and unanticipated movements in the value of securities, commodities or interest rates.
Futures contracts are exchange-traded. Exchange-traded futures contracts are standardized and are settled through a clearing house with fulfillment supported by the credit of the exchange. Therefore, counterparty credit risks to the Funds and the Subsidiaries are reduced; however, in the event that a counterparty enters into bankruptcy, a Fund’s claim against initial/variation margin on deposit with the counterparty may be subject to terms of a final settlement in bankruptcy court.
g. Due to/from Brokers. Transactions and positions in certain futures and forward foreign currency contracts are maintained and cleared by registered U.S. broker/dealers pursuant to customer agreements between the Funds or the Subsidiaries and the various broker/dealers. The due from brokers’ balances in the Statements of Assets and Liabilities for the Funds represent cash on deposit with the broker for open futures contracts and cash pledged as collateral for forward foreign currency contracts. The due to brokers’ balances in the Statements of Assets and Liabilities for the Funds represent net cash and foreign currency debit balances related to futures contracts. In certain circumstances the Funds’ or the Subsidiaries’ use of cash, and/or foreign currency held at brokers is restricted by regulation or broker mandated limits.
h. Federal and Foreign Income Taxes. The Trust treats each Fund as a separate entity for federal income tax purposes. Each Fund intends to meet the requirements of the Internal Revenue Code of 1986, as amended, applicable to regulated investment companies, and to distribute to its shareholders substantially all of its net investment income and any net realized capital gains at least annually. Management has performed an analysis of each Fund’s tax positions for the open tax years as of December 31, 2016 and has concluded that no provisions for income tax are required. The Funds’ federal tax returns for the prior three fiscal years, where applicable, remain subject to examination by the Internal Revenue Service. Management is not aware of any events that are reasonably possible to occur in the next twelve months that would result in the amounts of any unrecognized tax benefits significantly increasing or decreasing for the Funds. However, management’s conclusions regarding tax positions taken may be subject to review and adjustment at a later date based on factors including, but not limited to, new tax laws and accounting regulations and interpretations thereof.
Each Subsidiary is classified as a controlled foreign corporation under the Internal Revenue Code. As a U.S. shareholder of a controlled foreign corporation, the Global Alternatives Fund and Managed Futures Strategy Fund will each include in its taxable income its share of its Subsidiary’s current earnings and profits (including net realized gains). Any deficit realized by a Subsidiary will be disregarded for purposes of computing the Funds’ taxable income in the current period and also disregarded for all future periods. Such deficits if any, are reclassified to paid-in capital on the Statement
| 72
Table of Contents
Notes to Financial Statements (continued)
December 31, 2016
of Assets and Liabilities. Amounts reclassified to paid-in capital for Subsidiary deficits were as follows:
| Global Alternatives Fund: |
$ | 156,657,509 | ||
| Managed Futures Fund: |
$ | 217,437,985 |
i. Dividends and Distributions to Shareholders. Dividends and distributions are recorded on ex-dividend date. The timing and characterization of certain income and capital gain distributions are determined in accordance with federal tax regulations, which may differ from accounting principles generally accepted in the United States of America. Permanent differences are primarily due to differing treatments for book and tax purposes of items such as net operating losses, foreign currency gains and losses, non-deductible expenses, deferred Trustees’ fees, return of capital and capital gain distributions received, distributions in excess of income and /or capital gain and Subsidiary deficits. Permanent book and tax basis differences relating to shareholder distributions, net investment income and net realized gains will result in reclassifications to capital accounts reported on the Statements of Assets and Liabilities. Temporary differences between book and tax distributable earnings are primarily due to deferred Trustees’ fees, commissions on open futures contracts, wash sales, return of capital distributions received, futures and forward foreign currency contract mark-to-market. Amounts of income and capital gain available to be distributed on a tax basis are determined annually, and at other times during the Funds’ fiscal year as may be necessary to avoid knowingly declaring and paying a return of capital distribution. Distributions from net investment income and short-term capital gains are considered to be distributed from ordinary income for tax purposes.
The tax characterization of distributions is determined on an annual basis. The tax character of distributions paid to shareholders during the year ended December 31, 2016 and 2015 were as follows:
| 2016 Distributions Paid From: | 2015 Distributions Paid From: | |||||||||||||||||||||||
| Fund |
Ordinary |
Long-Term |
Total |
Ordinary |
Long-Term |
Total |
||||||||||||||||||
| Dynamic Allocation Fund |
$ | 73,681 | $ | — | $ | 73,681 | $ | 28,306 | $ | — | $ | 28,306 | ||||||||||||
| Global Alternatives Fund |
— | — | — | 52,520,875 | 58,612,823 | 111,133,698 | ||||||||||||||||||
| Managed Futures Strategy Fund |
189,168 | — | 189,168 | 64,840,640 | 40,806,571 | 105,647,211 | ||||||||||||||||||
| Tactical U.S. Market Fund |
455,965 | — | 455,965 | 339,969 | 491,925 | 831,894 | ||||||||||||||||||
Differences between these amounts and those reported in the Statements of Changes in Net Assets are primarily attributable to different book and tax treatment for short-term capital gains.
73 |
Table of Contents
Notes to Financial Statements (continued)
December 31, 2016
As of December 31, 2016, the components of distributable earnings on a tax basis were as follows:
| Dynamic |
Global |
Managed |
Tactical U.S. |
|||||||||||||
| Undistributed ordinary income |
$ | — | $ | — | $ | — | $ | 11,919 | ||||||||
| Undistributed long-term capital gains |
167,528 | — | — | — | ||||||||||||
|
|
|
|
|
|
|
|
|
|||||||||
| Total undistributed earnings |
167,528 | — | — | 11,919 | ||||||||||||
|
|
|
|
|
|
|
|
|
|||||||||
| Capital loss carryforward: |
||||||||||||||||
| Short-term: |
| |||||||||||||||
| No expiration date |
— | (187,489,285 | ) | (173,036,351 | ) | (2,620,659 | ) | |||||||||
| Long-term: |
| |||||||||||||||
| No expiration date |
— | (59,714,404 | ) | (22,192,500 | ) | — | ||||||||||
|
|
|
|
|
|
|
|
|
|||||||||
| Total capital loss carryforward |
— | (247,203,689 | ) | (195,228,851 | ) | (2,620,659 | ) | |||||||||
|
|
|
|
|
|
|
|
|
|||||||||
| Late-year ordinary loss deferrals* |
(19,478 | ) | (935,002 | ) | (24,559,196 | ) | — | |||||||||
|
|
|
|
|
|
|
|
|
|||||||||
| Unrealized appreciation |
89,048 | 16,321,888 | 10,094,461 | 5,528,491 | ||||||||||||
|
|
|
|
|
|
|
|
|
|||||||||
| Total accumulated earnings (losses) |
$ | 237,098 | $ | (231,816,803 | ) | $ | (209,693,586 | ) | $ | (2,919,751 | ) | |||||
|
|
|
|
|
|
|
|
|
|||||||||
| Capital loss carryforward utilized in the current year |
$ | 246,534 | $ | — | $ | — | $ | (1,577,971 | ) | |||||||
|
|
|
|
|
|
|
|
|
|||||||||
| * | Under current tax law, capital losses, foreign currency losses, and losses on passive foreign investment companies and contingent payment debt instruments after October 31 or December 31, as applicable, may be deferred and treated as occurring on the first day of the following taxable year. The Dynamic Allocation Fund, Global Alternatives Fund and Managed Futures Strategy Fund have deferred foreign currency losses that occurred after October 31, 2016. |
j. Indemnifications. Under the Trust’s organizational documents, its officers and Trustees are indemnified against certain liabilities arising out of the performance of their duties to the Funds. Additionally, in the normal course of business, the Funds enter into contracts with service providers that contain general indemnification clauses. The Funds’ maximum exposure under these arrangements is unknown as this would involve future claims that may be made against the Funds that have not yet occurred. However, based on experience, the Funds expect the risk of loss to be remote.
k. New Accounting Pronouncement. In October 2016, the SEC adopted amendments to rules under the Investment Company Act of 1940 (“final rules”) intended to modernize the reporting and disclosure of information by registered investment companies. The final rules amend Regulation S-X and require funds to provide standardized, enhanced derivative disclosures in fund financial statements in a format
| 74
Table of Contents
Notes to Financial Statements (continued)
December 31, 2016
designed for individual investors. The amendments to Regulation S-X also update the disclosures for other investments, including investments in and advances to affiliates, and amend the rules regarding the general form and content of fund financial statements. The compliance date for the amendments to Regulation S-X is August 1, 2017. Management is currently evaluating the amendments and the impact, if any, on the Funds’ financial statements.
3. Fair Value Measurements. In accordance with accounting standards related to fair value measurements and disclosures, the Funds have categorized the inputs utilized in determining the value of each Fund’s assets or liabilities. These inputs are summarized in the three broad levels listed below:
| • | Level 1 – quoted prices in active markets for identical assets or liabilities; |
| • | Level 2 – prices determined using other significant inputs that are observable either directly, or indirectly through corroboration with observable market data (which could include quoted prices for similar assets or liabilities, interest rates, credit risk, etc.); and |
| • | Level 3 – prices determined using significant unobservable inputs when quoted prices or observable inputs are unavailable such as when there is little or no market activity for an asset or liability (unobservable inputs reflect each Fund’s own assumptions in determining the fair value of assets or liabilities and would be based on the best information available). |
The inputs or methodology used for valuing securities are not necessarily an indication of the risk associated with investing in those securities.
The following is a summary of the inputs used to value the Funds’ investments as of December 31, 2016, at value:
ASG Dynamic Allocation Fund
Asset Valuation Inputs
| Description |
Level 1 |
Level 2 |
Level 3 |
Total |
||||||||||||
| Exchange-Traded Funds |
$ | 9,234,695 | $ | — | $ | — | $ | 9,234,695 | ||||||||
| Short-Term Investments(a) |
— | 12,802,573 | — | 12,802,573 | ||||||||||||
| Futures Contracts (unrealized appreciation) |
19,853 | 60,835 | — | 80,688 | ||||||||||||
|
|
|
|
|
|
|
|
|
|||||||||
| Total |
$ | 9,254,548 | $ | 12,863,408 | $ | — | $ | 22,117,956 | ||||||||
|
|
|
|
|
|
|
|
|
|||||||||
| Liability Valuation Inputs | ||||||||||||||||
| Description |
Level 1 |
Level 2 |
Level 3 |
Total |
||||||||||||
| Futures Contracts (unrealized depreciation) |
$ | (70,925 | ) | $ | (6,182 | ) | $ | — | $ | (77,107 | ) | |||||
|
|
|
|
|
|
|
|
|
|||||||||
| (a) | Details of the major categories of the Fund’s investments are reflected within the Portfolio of Investments. |
75 |
Table of Contents
Notes to Financial Statements (continued)
December 31, 2016
For the year ended December 31, 2016, there were no transfers among Levels 1, 2 and 3.
Global Alternatives Fund
Asset Valuation Inputs
| Description |
Level 1 |
Level 2 |
Level 3 |
Total |
||||||||||||
| Short-Term Investments(a) |
$ | — | $ | 1,582,191,826 | $ | — | $ | 1,582,191,826 | ||||||||
| Exchange-Traded Funds |
48,124,829 | — | — | 48,124,829 | ||||||||||||
| Forward Foreign Currency Contracts (unrealized appreciation) |
— | 1,228,641 | — | 1,228,641 | ||||||||||||
| Futures Contracts (unrealized appreciation) |
4,894,795 | 12,516,751 | — | 17,411,546 | ||||||||||||
|
|
|
|
|
|
|
|
|
|||||||||
| Total |
$ | 53,019,624 | $ | 1,595,937,218 | $ | — | $ | 1,648,956,842 | ||||||||
|
|
|
|
|
|
|
|
|
|||||||||
| Liability Valuation Inputs | ||||||||||||||||
| Description |
Level 1 |
Level 2 |
Level 3 |
Total |
||||||||||||
| Forward Foreign Currency Contracts (unrealized depreciation) |
$ | — | $ | (1,793,875 | ) | $ | — | $ | (1,793,875 | ) | ||||||
| Futures Contracts (unrealized depreciation) |
(10,432,514 | ) | — | — | (10,432,514 | ) | ||||||||||
|
|
|
|
|
|
|
|
|
|||||||||
| Total |
$ | (10,432,514 | ) | $ | (1,793,875 | ) | $ | — | $ | (12,226,389 | ) | |||||
|
|
|
|
|
|
|
|
|
|||||||||
| (a) | Details of the major categories of the Fund’s investments are reflected within the Consolidated Portfolio of Investments. |
For the year ended December 31, 2016, there were no transfers among Levels 1, 2 and 3.
Managed Futures Strategy Fund
Asset Valuation Inputs
| Description |
Level 1 |
Level 2 |
Level 3 |
Total |
||||||||||||
| Short-Term Investments(a) |
$ | — | $ | 3,097,300,225 | $ | — | $ | 3,097,300,225 | ||||||||
| Forward Foreign Currency Contracts (unrealized appreciation) |
— | 7,578,357 | — | 7,578,357 | ||||||||||||
| Futures Contracts (unrealized appreciation) |
39,687,722 | 21,693,881 | — | 61,381,603 | ||||||||||||
|
|
|
|
|
|
|
|
|
|||||||||
| Total |
$ | 39,687,722 | $ | 3,126,572,463 | $ | — | $ | 3,166,260,185 | ||||||||
|
|
|
|
|
|
|
|
|
|||||||||
| 76
Table of Contents
Notes to Financial Statements (continued)
December 31, 2016
| Managed Futures Strategy Fund (continued)
Liability Valuation Inputs
|
| |||||||||||||||
| Description |
Level 1 |
Level 2 |
Level 3 |
Total |
||||||||||||
| Forward Foreign Currency Contracts (unrealized depreciation) |
$ | — | $ | (8,676,396 | ) | $ | — | $ | (8,676,396 | ) | ||||||
| Financial Futures (unrealized depreciation) |
(30,992,799 | ) | (2,156,247 | ) | — | (33,149,046 | ) | |||||||||
|
|
|
|
|
|
|
|
|
|||||||||
| Total |
$ | (30,992,799 | ) | $ | (10,832,643 | ) | $ | — | $ | (41,825,442 | ) | |||||
|
|
|
|
|
|
|
|
|
|||||||||
| (a) | Details of the major categories of the Fund’s investments are reflected within the Consolidated Portfolio of Investments. |
For the year ended December 31, 2016, there were no transfers among Levels 1, 2 and 3.
Tactical U.S. Market Fund
Asset Valuation Inputs
| Description |
Level 1 |
Level 2 |
Level 3 |
Total |
||||||||||||
| Common Stocks(a) |
$ | 37,793,900 | $ | — | $ | — | $ | 37,793,900 | ||||||||
| Short-Term Investments |
— | 31,157,407 | — | 31,157,407 | ||||||||||||
|
|
|
|
|
|
|
|
|
|||||||||
| Total |
$ | 37,793,900 | $ | 31,157,407 | $ | — | $ | 68,951,307 | ||||||||
|
|
|
|
|
|
|
|
|
|||||||||
| Liability Valuation Inputs |
| |||||||||||||||
| Description |
Level 1 |
Level 2 |
Level 3 |
Total |
||||||||||||
| Futures Contracts (unrealized depreciation) |
$ | (334,850 | ) | $ | — | $ | — | $ | (334,850 | ) | ||||||
|
|
|
|
|
|
|
|
|
|||||||||
| (a) | Details of the major categories of the Fund’s investments are reflected within the Portfolio of Investments. |
For the year ended December 31, 2016, there were no transfers among Levels 1, 2 and 3.
4. Derivatives. Derivative instruments are defined as financial instruments whose value and performance are based on the value and performance of an underlying asset, reference rate or index. Derivative instruments that the Funds used during the period include forward foreign currency contracts and futures contracts.
Dynamic Allocation Fund tactically allocates its investments across a range of asset classes and global markets. The Fund will typically use derivative instruments, in particular long positions in futures and forward contracts, to achieve exposures to global equity and fixed income securities. The Fund may also hold short
77 |
Table of Contents
Notes to Financial Statements (continued)
December 31, 2016
positions in derivatives for hedging purposes. During the year ended December 31, 2016, the Fund used long futures contracts on U.S and foreign equity market indices and U.S. government bonds to gain investment exposures in accordance with its objectives.
Global Alternatives Fund seeks to achieve long and short exposure to global equity, bond, currency and commodity markets through a wide range of derivative instruments and direct investments. These investments are intended to provide the Fund with risk and return characteristics similar to those of a diversified portfolio of hedge funds. The Fund uses quantitative models to estimate the market exposures that drive the aggregate returns of a diverse set of hedge funds, and seeks to use a variety of derivative instruments to capture such exposures in the aggregate. Under normal market conditions, the Fund will make extensive use of derivative instruments, in particular futures and forward contracts on global equity and fixed income securities, securities indices, currencies, commodities and other instruments. During the year ended December 31, 2016, the Fund used long and short futures and forward contracts on U.S. and foreign government bonds, U.S. and foreign equity market indices, foreign currencies, commodities (through investments in the Subsidiary), and short-term interest rates in accordance with these objectives.
Managed Futures Strategy Fund seeks to generate positive absolute returns over time. The Fund uses a set of proprietary quantitative models to identify price trends in equity, fixed income, currency and commodity instruments, and may have both short and long exposures within an asset class based on an analysis of asset price trends. Under normal market conditions, the Fund will make extensive use of derivative instruments, in particular futures and forward contracts, to capture the exposures suggested by its absolute return strategy while also adding value through volatility management. These market exposures, which are expected to change over time, may include exposures to global equity and fixed income securities, securities indices, currencies, commodities and other instruments. During the year ended December 31, 2016, the Fund used long and short futures and forward contracts on U.S. and foreign government bonds, U.S. and foreign equity market indices, foreign currencies, commodities (through investments in the Subsidiary) and short-term interest rates to capture the exposures suggested by the quantitative investment models.
Tactical U.S. Market Fund seeks long-term capital appreciation, with emphasis on the protection of capital during unfavorable market conditions. The Fund uses long futures contracts on U.S. equity indices to increase exposure to the U.S. equity market to up to 130% of the Fund’s total assets and short futures on U.S. equity indices to decrease exposure to the U.S. equity market to as low as 0% of the Fund’s total assets (to limit the effects of extreme market drawdowns). During the year ended December 31, 2016, the Fund used long contracts on U.S. equity market indices to increase exposure to the U.S. equity market and also used short contracts on U.S. equity market indices to decrease exposure to the U.S. equity market in order to limit the effects of market drawdowns.
| 78
Table of Contents
Notes to Financial Statements (continued)
December 31, 2016
The following is a summary of derivative instruments for Dynamic Allocation Fund as of December 31, 2016, as reflected within the Statements of Assets and Liabilities:
| Assets |
Unrealized |
|||
| Exchange-traded asset derivatives |
||||
| Equity contracts |
$ | 80,688 | ||
| Liabilities |
Unrealized |
|||
| Exchange-traded liability derivatives |
||||
| Equity contracts |
$ | (77,107 | ) | |
Transactions in derivative instruments for Dynamic Allocation Fund for the year ended December 31, 2016, as reflected within the Statements of Operations were as follows:
| Net Realized Gain (Loss) on: |
Futures Contracts |
|||
| Interest rate contracts |
$ | (49,744 | ) | |
| Equity contracts |
560,412 | |||
|
|
|
|||
| Total |
$ | 510,668 | ||
|
|
|
|||
| Net Change in Unrealized Appreciation (Depreciation) on: |
Futures Contracts |
|||
| Interest rate contracts |
$ | 4,007 | ||
| Equity contracts |
(90,391 | ) | ||
|
|
|
|||
| Total |
$ | (86,384 | ) | |
|
|
|
|||
The following is a summary of derivative instruments for Global Alternatives Fund as of December 31, 2016, as reflected within the Statements of Assets and Liabilities:
| Assets |
Unrealized |
Unrealized |
||||||
| Over-the-counter asset derivatives |
||||||||
| Foreign exchange contracts |
$ | 1,228,641 | $ | — | ||||
|
|
|
|
|
|||||
| Exchange-traded asset derivatives |
||||||||
| Interest rate contracts |
$ | — | $ | 1,068,733 | ||||
| Foreign exchange contracts |
— | 3,316,306 | ||||||
| Equity contracts |
— | 12,516,751 | ||||||
| Commodity contracts |
— | 509,756 | ||||||
|
|
|
|
|
|||||
| Total exchange-traded asset derivatives |
$ | — | $ | 17,411,546 | ||||
|
|
|
|
|
|||||
| Total asset derivatives |
$ | 1,228,641 | $ | 17,411,546 | ||||
|
|
|
|
|
|||||
79 |
Table of Contents
Notes to Financial Statements (continued)
December 31, 2016
| Liabilities |
Unrealized |
Unrealized |
||||||
| Over-the-counter liability derivatives |
||||||||
| Foreign exchange contracts |
$ | (1,793,875 | ) | $ | — | |||
|
|
|
|
|
|||||
| Exchange-traded liability derivatives |
||||||||
| Interest rate contracts |
$ | — | $ | (2,239,505 | ) | |||
| Foreign exchange contracts |
— | — | ||||||
| Equity contracts |
— | (5,824,925 | ) | |||||
| Commodity contracts |
— | (2,368,084 | ) | |||||
|
|
|
|
|
|||||
| Total exchange-traded liability derivatives |
$ | — | $ | (10,432,514 | ) | |||
|
|
|
|
|
|||||
| Total liability derivatives |
$ | (1,793,875 | ) | $ | (10,432,514 | ) | ||
|
|
|
|
|
|||||
Transactions in derivative instruments for Global Alternatives Fund for the year ended December 31, 2016, as reflected within the Statements of Operations were as follows:
| Net Realized Gain (Loss) on: |
Futures Contracts |
Foreign Currency Transactions1 |
||||||
| Interest rate contracts |
$ | (110,906,486 | ) | $ | — | |||
| Foreign exchange contracts |
15,723,016 | (71,095,122 | ) | |||||
| Equity contracts |
(37,387,830 | ) | — | |||||
| Commodity contracts |
(20,096,075 | ) | — | |||||
|
|
|
|
|
|||||
| Total |
$ | (152,667,375 | ) | $ | (71,095,122 | ) | ||
|
|
|
|
|
|||||
| Net Change in Unrealized Appreciation (Depreciation) on: |
Futures Contracts |
Foreign Currency Translations1 |
||||||
| Interest rate contracts |
$ | 4,260,887 | $ | — | ||||
| Foreign exchange contracts |
3,316,306 | (1,501,188 | ) | |||||
| Equity contracts |
9,174,609 | — | ||||||
| Commodity contracts |
(1,483,758 | ) | — | |||||
|
|
|
|
|
|||||
| Total |
$ | 15,268,044 | $ | (1,501,188 | ) | |||
|
|
|
|
|
|||||
| 1 | Represents realized loss and change in unrealized appreciation (depreciation), respectively, for forward foreign currency contracts during the period. Does not include other foreign currency gains or losses included in the Statements of Operations. |
| 80
Table of Contents
Notes to Financial Statements (continued)
December 31, 2016
The following is a summary of derivative instruments for Managed Futures Strategy Fund as of December 31, 2016, as reflected within the Statements of Assets and Liabilities:
| Assets |
Unrealized |
Unrealized |
||||||
| Over-the-counter asset derivatives |
||||||||
| Foreign exchange contracts |
$ | 7,578,357 | $ | — | ||||
|
|
|
|
|
|||||
| Exchange-traded asset derivatives |
||||||||
| Interest rate contracts |
$ | — | $ | 12,275,490 | ||||
| Foreign exchange contracts |
— | 7,323,331 | ||||||
| Equity contracts |
— | 23,446,671 | ||||||
| Commodity contracts |
— | 18,336,111 | ||||||
|
|
|
|
|
|||||
| Total exchange-traded asset derivatives |
$ | — | $ | 61,381,603 | ||||
|
|
|
|
|
|||||
| Total asset derivatives |
$ | 7,578,357 | $ | 61,381,603 | ||||
|
|
|
|
|
|||||
| Liabilities |
Unrealized |
Unrealized |
||||||
| Over-the-counter liability derivatives |
||||||||
| Foreign exchange contracts |
$ | (8,676,396 | ) | $ | — | |||
|
|
|
|
|
|||||
| Exchange-traded liability derivatives |
||||||||
| Interest rate contracts |
$ | — | $ | (5,322,285 | ) | |||
| Foreign exchange contracts |
— | (314,169 | ) | |||||
| Equity contracts |
— | (6,407,123 | ) | |||||
| Commodity contracts |
— | (21,105,469 | ) | |||||
|
|
|
|
|
|||||
| Total exchange-traded liability derivatives |
$ | — | $ | (33,149,046 | ) | |||
|
|
|
|
|
|||||
| Total liability derivatives |
$ | (8,676,396 | ) | $ | (33,149,046 | ) | ||
|
|
|
|
|
|||||
Transactions in derivative instruments for Managed Futures Strategy Fund during the year ended December 31, 2016, as reflected within the Statements of Operations were as follows:
| Net Realized Gain (Loss) on: |
Futures Contracts |
Foreign Currency Transactions1 |
||||||
| Interest rate contracts |
$ | 22,715,989 | $ | — | ||||
| Foreign exchange contracts |
(36,423,606 | ) | 1,966,251 | |||||
| Equity contracts |
(56,847,710 | ) | — | |||||
| Commodity contracts |
(182,049,208 | ) | — | |||||
|
|
|
|
|
|||||
| Total |
$ | (252,604,535 | ) | $ | 1,966,251 | |||
|
|
|
|
|
|||||
81 |
Table of Contents
Notes to Financial Statements (continued)
December 31, 2016
| Net Change in Unrealized Appreciation (Depreciation) on: |
Futures Contracts |
Foreign Currency Translations1 |
||||||
| Interest rate contracts |
$ | 15,105,042 | $ | — | ||||
| Foreign exchange contracts |
7,009,162 | (24,290,107 | ) | |||||
| Equity contracts |
26,663,611 | — | ||||||
| Commodity contracts |
(6,470,462 | ) | — | |||||
|
|
|
|
|
|||||
| Total |
$ | 42,307,353 | $ | (24,290,107 | ) | |||
|
|
|
|
|
|||||
| 1 | Represents realized gain and change in unrealized appreciation (depreciation), respectively, for forward foreign currency contracts during the period. Does not include other foreign currency gains or losses included in the Statements of Operations. |
The following is a summary of derivative instruments for Tactical U.S. Market Fund as of December 31, 2016, as reflected within the Statements of Assets and Liabilities:
| Liabilities |
Unrealized |
|||
| Exchange-traded asset derivatives |
||||
| Equity contracts |
$ | (334,850 | ) | |
Transactions in derivative instruments for Tactical U.S. Market Fund during the year ended December 31, 2016, as reflected within the Statements of Operations were as follows:
| Net Realized Gain (Loss) on: |
Futures Contracts |
|||
| Equity contracts |
$ | (1,146,081 | ) | |
| Net Change in Unrealized Appreciation (Depreciation) on: |
Futures Contracts |
|||
| Equity contracts |
$ | (341,400 | ) | |
As the Funds value their derivatives at fair value and recognize changes in fair value through the Statements of Operations, they do not qualify for hedge accounting under authoritative guidance for derivative instruments. The Funds’ investments in derivatives may represent an economic hedge; however, they are considered to be non-hedge transactions for the purpose of these disclosures.
| 82
Table of Contents
Notes to Financial Statements (continued)
December 31, 2016
The volume of forward foreign currency contract and futures contract activity, as a percentage of net assets, based on gross month-end notional amounts outstanding during the period, including long and short positions at absolute value, was as follows for the year ended December 31, 2016:
| Dynamic Allocation Fund |
Futures |
|||||||
| Average Notional Amount Outstanding |
47.28 | % | ||||||
| Highest Notional Amount Outstanding |
77.70 | % | ||||||
| Lowest Notional Amount Outstanding |
0.00 | % | ||||||
| Notional Amount Outstanding as of December 31, 2016 |
63.50 | % | ||||||
| Global Alternatives Fund |
Forwards |
Futures |
||||||
| Average Notional Amount Outstanding |
78.20 | % | 236.40 | % | ||||
| Highest Notional Amount Outstanding |
181.85 | % | 394.37 | % | ||||
| Lowest Notional Amount Outstanding |
6.85 | % | 138.86 | % | ||||
| Notional Amount Outstanding as of December 31, 2016 |
8.03 | % | 189.89 | % | ||||
| Managed Futures Strategy Fund |
Forwards |
Futures |
||||||
| Average Notional Amount Outstanding |
245.50 | % | 652.34 | % | ||||
| Highest Notional Amount Outstanding |
411.87 | % | 853.86 | % | ||||
| Lowest Notional Amount Outstanding |
44.13 | % | 384.41 | % | ||||
| Notional Amount Outstanding as of December 31, 2016 |
44.13 | % | 425.53 | % | ||||
| Tactical U.S. Market Fund |
Futures |
|||||||
| Average Notional Amount Outstanding |
18.59 | % | ||||||
| Highest Notional Amount Outstanding |
45.81 | % | ||||||
| Lowest Notional Amount Outstanding |
3.36 | % | ||||||
| Notional Amount Outstanding as of December 31, 2016 |
45.81 | % | ||||||
Notional amounts outstanding at the end of the prior period, if applicable, are included in the average notional amount outstanding.
Unrealized gain and/or loss on open forwards and futures is recorded in the Statements of Assets and Liabilities. The aggregate notional values of forward and futures contracts are not recorded in the Statements of Assets and Liabilities, and therefore are not included in the Funds’ net assets.
Over-the-counter (“OTC”) derivatives, including forward foreign currency contracts, are entered into pursuant to International Swaps and Derivatives Association, Inc. (“ISDA”) agreements negotiated between the Funds and their counterparties. ISDA agreements typically contain, among other things, terms for the posting of collateral and master netting provisions in the event of a default or other termination event. Master netting provisions allow the Funds and the counterparty, in the event of a default or other termination event, to offset amounts owed by each related to derivative contracts, including any posted collateral, to one net amount payable by either the
83 |
Table of Contents
Notes to Financial Statements (continued)
December 31, 2016
Funds or the counterparty. The Funds’ ISDA agreements typically contain provisions that allow a counterparty to terminate open contracts early if the NAV of a Fund declines beyond a certain threshold. For financial reporting purposes, the Funds do not offset derivative assets and liabilities, and any related collateral pledged, on the Statements of Assets and Liabilities.
As of December 31, 2016, gross amounts of OTC derivative assets and liabilities not offset in the Statements of Assets and Liabilities and the related net amounts after taking into account master netting arrangements, by counterparty, are as follows:
Global Alternatives Fund
| Counterparty |
Gross Amounts of |
Offset |
Net Asset |
Collateral |
Net |
|||||||||||||||
| UBS AG |
$ | 1,228,641 | $ | (1,228,641 | ) | $ | — | $ | — | $ | — | |||||||||
| Counterparty |
Gross Amounts of |
Offset |
Net |
Collateral |
Net |
|||||||||||||||
| UBS AG |
$ | (1,793,875 | ) | $ | 1,228,641 | $ | (565,234 | ) | $ | 565,234 | $ | — | ||||||||
Managed Futures Strategy Fund
| Counterparty |
Gross Amounts of |
Offset |
Net Asset |
Collateral |
Net |
|||||||||||||||
| UBS AG |
$ | 7,578,357 | $ | (7,578,357 | ) | $ | — | $ | — | $ | — | |||||||||
| Counterparty |
Gross Amounts of |
Offset |
Net |
Collateral |
Net |
|||||||||||||||
| UBS AG |
$ | (8,676,396 | ) | $ | 7,578,357 | $ | (1,098,039 | ) | $ | 1,098,039 | $ | — | ||||||||
The Funds are required to pledge an independent amount of collateral to the counterparty for open forward foreign currency contracts. In addition to the independent amount, the amount of collateral pledged to the counterparty is subsequently increased (for losses) or decreased (for gains) based on the change in value of the contracts, as calculated by the
| 84
Table of Contents
Notes to Financial Statements (continued)
December 31, 2016
counterparty under the terms of the Funds’ ISDA agreements. As of December 31, 2016, amounts pledged to the counterparty (which may exceed the amounts shown in the table above) are as follows:
| Independent |
Increase |
Required |
Collateral |
Excess/ |
||||||||||||||||
| Global Alternatives Fund |
$ | 3,479,055 | $ | 975,511 | $ | 4,454,566 | $ | 3,710,000 | $ | (744,566 | ) | |||||||||
| Managed Futures Strategy Fund |
52,497,831 | (16,770 | ) | 52,481,061 | 55,221,041 | 2,739,980 | ||||||||||||||
Amounts in excess or short of the required collateral amount are received or paid by the Funds on the next business day, subject to collateral thresholds and minimum transfer requirements. The ISDA agreements include a tri-party control agreement under which collateral pledged from the Fund to the broker is held for the benefit of the broker, as secured party, at a third party custodian, State Street Bank and Trust Company (“State Street Bank”). Collateral pledged to the broker is reflected in “due from brokers” on the Statements of Assets and Liabilities.
Counterparty risk is managed based on policies and procedures established by each Fund’s adviser. Such policies and procedures may include, but are not limited to, minimum counterparty credit rating requirements, monitoring of counterparty credit default swap spreads and posting of collateral. A Fund’s risk of loss from counterparty credit risk on OTC derivatives is generally limited to the Fund’s aggregated unrealized gains and the amount of any collateral pledged to the counterparty, which may be offset by any collateral posted to the Fund by the counterparty. ISDA master agreements can help to manage counterparty risk by specifying collateral posting arrangements at pre-arranged exposure levels. Under these ISDA agreements, collateral is routinely transferred if the total net exposure in respect of certain transactions, net of existing collateral already in place, exceeds a specified amount (typically $250,000, depending on the counterparty). With exchange-traded derivatives, there is minimal counterparty credit risk to the Fund because the exchange’s clearinghouse, as counterparty to these instruments, stands between the buyer and the seller of the contract. Credit risk still exists in exchange-traded derivatives with respect to initial and variation margin that is held in a broker’s customer accounts. While brokers are required to segregate customer margin from their own assets, in the event that a broker becomes insolvent or goes into bankruptcy and at that time there is a shortfall in the aggregate amount of margin held by the broker for all its clients, U.S. bankruptcy laws will typically allocate that shortfall on a pro rata basis across all of the broker’s customers, potentially resulting in losses to the Fund. Based on balances reflected on each Fund’s Statement of Assets and Liabilities, the following table shows (i) the maximum amount of loss due to credit risk that, based on the gross fair value of
85 |
Table of Contents
Notes to Financial Statements (continued)
December 31, 2016
the financial instrument, the applicable Fund would incur if parties (including OTC derivative counterparties and brokers holding margin for exchange-traded derivatives) to the relevant financial instruments failed completely to perform according to the terms of the contracts and the collateral or other security, if any, for the amount due proved to be of no value to the Fund, and (ii) the amount of loss that the applicable Fund would incur after taking into account master netting provisions pursuant to ISDA agreements, as of December 31, 2016:
| Fund |
Maximum Amount of Loss - Gross |
Maximum Amount of Loss - Net |
||||||
| Dynamic Allocation Fund |
||||||||
| Exchange-traded counterparty credit risk |
||||||||
| Futures contracts |
$ | 80,688 | $ | 80,688 | ||||
| Margin with brokers |
835,525 | 835,525 | ||||||
|
|
|
|
|
|||||
| Total exchange-traded counterparty credit risk |
$ | 916,213 | $ | 916,213 | ||||
|
|
|
|
|
|||||
| Global Alternatives Fund |
||||||||
| Over-the-counter counterparty credit risk |
||||||||
| Forward foreign currency contracts |
$ | 1,228,641 | $ | — | ||||
| Collateral pledged to UBS AG |
3,710,000 | 3,710,000 | ||||||
|
|
|
|
|
|||||
| Total over-the-counter counterparty credit risk |
4,938,641 | 3,710,000 | ||||||
|
|
|
|
|
|||||
| Exchange-traded counterparty credit risk |
||||||||
| Futures contracts |
17,411,546 | 17,411,546 | ||||||
| Margin with brokers |
81,438,454 | 81,438,454 | ||||||
|
|
|
|
|
|||||
| Total exchange-traded counterparty credit risk |
98,850,000 | 98,850,000 | ||||||
|
|
|
|
|
|||||
| Total counterparty credit risk |
$ | 103,788,641 | $ | 102,560,000 | ||||
|
|
|
|
|
|||||
| Managed Futures Strategy Fund |
||||||||
| Over-the-counter counterparty credit risk |
||||||||
| Forward foreign currency contracts |
$ | 7,578,357 | $ | — | ||||
| Collateral pledged to UBS AG |
55,221,041 | 55,221,041 | ||||||
|
|
|
|
|
|||||
| Total over-the-counter counterparty credit risk |
62,799,398 | 55,221,041 | ||||||
|
|
|
|
|
|||||
| Exchange-traded counterparty credit risk |
||||||||
| Futures contracts |
61,381,603 | 61,381,603 | ||||||
| Margin with brokers |
270,603,057 | 270,603,057 | ||||||
|
|
|
|
|
|||||
| Total exchange-traded counterparty credit risk |
331,984,660 | 331,984,660 | ||||||
|
|
|
|
|
|||||
| Total counterparty credit risk |
$ | 394,784,058 | $ | 387,205,701 | ||||
|
|
|
|
|
|||||
| 86
Table of Contents
Notes to Financial Statements (continued)
December 31, 2016
| Fund |
Maximum Amount of Loss - Gross |
Maximum Amount of Loss - Net |
||||||
| Tactical U.S. Market Fund |
||||||||
| Exchange-traded counterparty credit risk |
||||||||
| Futures contracts |
$ | — | $ | — | ||||
| Margin with brokers |
2,158,800 | 2,158,800 | ||||||
|
|
|
|
|
|||||
| Total exchange-traded counterparty credit risk |
$ | 2,158,800 | $ | 2,158,800 | ||||
|
|
|
|
|
|||||
5. Purchases and Sales of Securities. For the year ended December 31, 2016, purchases and proceeds from sales or maturities of short-term investments were as follows:
| Fund |
Purchases |
Sales/ |
||||||
| Global Alternatives Fund |
$ | 92,607,642,578 | $ | 94,676,731,435 | ||||
| Managed Futures Strategy Fund |
104,057,891,031 | 103,513,910,070 | ||||||
For the year ended December 31, 2016, purchases and sales of securities (excluding short-term investments) were as follows:
| Fund |
Purchases |
Sales |
||||||
| Dynamic Allocation Fund |
$ | 11,367,792 | $ | 7,488,713 | ||||
| Tactical U.S. Market Fund |
23,936,013 | 48,726,764 | ||||||
6. Management Fees and Other Transactions with Affiliates.
a. Management Fees. AlphaSimplex Group, LLC (“AlphaSimplex”), which is a subsidiary of Natixis US, serves as investment adviser to the Funds. Under the terms of the management agreements, each Fund pays a management fee at the following annual rates, calculated daily and payable monthly, based on each Fund’s average daily net assets:
| Percentage of |
||||
| Fund |
||||
| Dynamic Allocation Fund |
0.70 | % | ||
| Tactical U.S. Market Fund |
0.80 | % | ||
Global Alternatives Fund pays a management fee at an annual rate of 1.15% on the first $2 billion of the Fund’s average daily net assets (less the net asset value of the Subsidiary), and 1.10% thereafter, calculated daily and payable monthly, less the management fees paid by the Subsidiary.
87 |
Table of Contents
Notes to Financial Statements (continued)
December 31, 2016
Managed Futures Strategy Fund pays a management fee at an annual rate of 1.25% on the first $2.5 billion of the Fund’s average daily net assets (less the net asset value of its Subsidiary), and 1.20% thereafter, calculated daily and payable monthly, less the management fees paid by the Subsidiary.
AlphaSimplex also serves as investment adviser to ASG Global Alternatives Cayman Fund Ltd. and ASG Managed Futures Strategy Cayman Fund Ltd., which pay AlphaSimplex a management fee at the annual rate of 1.15% and 1.25%, respectively, of its average daily net assets.
Additionally, AlphaSimplex has entered into a subadvisory agreement with NGAM Advisors, L.P. (“NGAM Advisors”), (through its division, Active Index Advisors (formerly Active Investment Advisors)), on behalf of Tactical U.S. Market Fund. NGAM Advisors is a wholly-owned subsidiary of Natixis US. Under the terms of the subadvisory agreement, the Fund pays a subadvisory fee at the annual rate of 0.10% of the average daily net assets of the Fund that are allocated by AlphaSimplex to be managed by NGAM Advisors.
Payments to AlphaSimplex were reduced by the amount of payments to NGAM Advisors as described above.
AlphaSimplex has given binding undertakings to the Funds to waive management fees and/or reimburse certain expenses, including expenses of each Subsidiary, if applicable, to limit the Funds’ operating expenses, exclusive of acquired fund fees and expenses, brokerage expenses, interest expense, taxes, organizational and extraordinary expenses, such as litigation and indemnification expenses. These undertakings are in effect until April 30, 2017, may be terminated before then only with the consent of the Funds’ Board of Trustees, and are reevaluated on an annual basis. Management fees payable, as reflected on the Statements of Assets and Liabilities, is net of waivers and/or expense reimbursements, if any, pursuant to these undertakings. Waivers/reimbursements that exceed management fees payable are reflected on the Statements of Assets and Liabilities as receivable from investment adviser.
For the year ended December 31, 2016, the expense limits as a percentage of average daily net assets under the expense limitation agreements were as follows:
| Expense Limit as a Percentage of Average Daily Net Assets |
||||||||||||||||
| Fund |
Class A |
Class C |
Class N |
Class Y |
||||||||||||
| Dynamic Allocation Fund |
1.15 | % | 1.90 | % | — | 0.90 | % | |||||||||
| Global Alternatives Fund |
1.60 | % | 2.35 | % | 1.30 | % | 1.35 | % | ||||||||
| Managed Futures Strategy Fund |
1.70 | % | 2.45 | % | — | 1.45 | % | |||||||||
| Tactical U.S. Market Fund |
1.25 | % | 2.00 | % | — | 1.00 | % | |||||||||
| 88
Table of Contents
Notes to Financial Statements (continued)
December 31, 2016
AlphaSimplex shall be permitted to recover expenses it has borne under the expense limitation agreements (whether through waiver of its management fees or otherwise) on a class by class basis in later periods to the extent the annual operating expenses of a class fall below a class’ expense limits, provided, however, that a class is not obligated to pay such waived/reimbursed fees or expenses more than one year after the end of the fiscal year in which the fees or expenses were waived/reimbursed.
For the year ended December 31, 2016, the management fees and waivers of management fees for each Fund were as follows:
| Fund |
Gross |
Waivers of |
Net |
Percentage of |
||||||||||||||||
| Gross |
Net |
|||||||||||||||||||
| Dynamic Allocation Fund |
$ | 145,779 | $ | 129,688 | $ | 16,091 | 0.70 | % | 0.08 | % | ||||||||||
| Global Alternatives Fund |
30,250,399 | — | 30,250,399 | 1.14 | % | 1.14 | % | |||||||||||||
| Managed Futures Strategy Fund |
42,223,607 | 426,591 | 41,797,016 | 1.24 | % | 1.22 | % | |||||||||||||
| Tactical U.S. Market Fund |
718,855 | 132,476 | 586,379 | 0.80 | % | 0.65 | % | |||||||||||||
| 1 | Management fee waivers are subject to possible recovery until December 31, 2017. |
For the year ended December 31, 2016, class-specific expenses have been reimbursed as follows:
| Fund |
Class N |
|||
| Global Alternatives Fund |
$ | 72 | ||
No expenses were recovered during the year ended December 31, 2016 under the terms of the expense limitation agreements.
b. Service and Distribution Fees. NGAM Distribution, L.P. (“NGAM Distribution”), which is a wholly-owned subsidiary of Natixis US, has entered into a distribution agreement with the Trust. Pursuant to this agreement, NGAM Distribution serves as principal underwriter of the Funds of the Trust.
Pursuant to Rule 12b-1 under the 1940 Act, the Trust has adopted a Service Plan relating to each Fund’s Class A shares (the “Class A Plans”) and a Distribution and Service Plan relating to each Fund’s Class C shares (the “Class C Plans”).
Under the Class A Plans, each Fund pays NGAM Distribution a monthly service fee at an annual rate not to exceed 0.25% of the average daily net assets attributable to the Funds’ Class A shares, as reimbursement for expenses incurred by NGAM Distribution in providing personal services to investors in Class A shares and/or the maintenance of shareholder accounts.
89 |
Table of Contents
Notes to Financial Statements (continued)
December 31, 2016
Under the Class C Plans, each Fund pays NGAM Distribution a monthly service fee at an annual rate not to exceed 0.25% of the average daily net assets attributable to the Funds’ Class C shares, as compensation for services provided by NGAM Distribution in providing personal services to investors in Class C shares and/or the maintenance of shareholder accounts.
Also under the Class C Plans, each Fund pays NGAM Distribution a monthly distribution fee at the annual rate of 0.75% of the average daily net assets attributable to the Funds’ Class C shares, as compensation for services provided by NGAM Distribution in connection with the marketing or sale of Class C shares.
For the year ended December 31, 2016, the service and distribution fees for each Fund were as follows:
| Service Fees | Distribution Fees | |||||||||||
| Fund |
Class A |
Class C |
Class C |
|||||||||
| Dynamic Allocation Fund |
$ | 45 | $ | 26 | $ | 79 | ||||||
| Global Alternatives Fund |
359,520 | 162,995 | 488,986 | |||||||||
| Managed Futures Strategy Fund |
1,401,788 | 205,797 | 617,390 | |||||||||
| Tactical U.S. Market Fund |
27,128 | 5,104 | 15,312 | |||||||||
c. Administrative Fees. NGAM Advisors provides certain administrative services for the Funds and contracts with State Street Bank to serve as sub-administrator. Pursuant to an agreement among Natixis Funds Trusts, Loomis Sayles Funds Trusts and NGAM Advisors, each Fund pays NGAM Advisors monthly its pro rata portion of fees equal to an annual rate of 0.0575% of the first $15 billion of the average daily net assets of the Natixis Funds Trusts and Loomis Sayles Funds Trusts, 0.0500% of the next $15 billion, 0.0400% of the next $30 billion, 0.0350% of the next $30 billion and 0.0325% of such assets in excess of $90 billion, subject to an annual aggregate minimum fee for the Natixis Funds Trusts and Loomis Sayles Funds Trusts of $10 million, which is reevaluated on an annual basis.
NGAM Advisors also provides certain administrative services to the Subsidiaries for which the Subsidiaries pay NGAM Advisors fees equal to an annual rate of 0.05% of the average daily net assets of each Subsidiary. Payments by the Funds are reduced by the amount of payments to NGAM Advisors by the Subsidiaries. In addition, NGAM Advisors and each Subsidiary contract with State Street Bank to serve as sub-administrator.
| 90
Table of Contents
Notes to Financial Statements (continued)
December 31, 2016
For the year ended December 31, 2016, the administrative fees paid to NGAM Advisors for each Fund were as follows (exclusive of sub-administrative fees paid to State Street Bank by the Subsidiaries):
| Fund |
Administrative Fees Paid to NGAM Advisors |
|||
| Dynamic Allocation Fund |
$ | 9,243 | ||
| Global Alternatives Fund |
1,180,125 | |||
| Managed Futures Strategy Fund |
1,515,403 | |||
| Tactical U.S. Market Fund |
39,871 | |||
d. Sub-Transfer Agent Fees. NGAM Distribution has entered into agreements, which include servicing agreements, with financial intermediaries that provide recordkeeping, processing, shareholder communications and other services to customers of the intermediaries that hold positions in the Funds and has agreed to compensate the intermediaries for providing those services. Intermediaries transact with the Funds primarily through the use of omnibus accounts on behalf of their customers who hold positions in the Funds. These services would have been provided by the Funds’ transfer agent and other service providers if the shareholders’ accounts were maintained directly at the Funds’ transfer agent. Accordingly, the Funds have agreed to reimburse NGAM Distribution for all or a portion of the servicing fees paid to these intermediaries. The reimbursement amounts (sub-transfer agent fees) paid to NGAM Distribution are subject to a current per-account equivalent fee limit approved by the Funds’ Board of Trustees, which is based on fees for similar services paid to the Funds’ transfer agent and other service providers. Class N shares do not bear such expenses.
For the year ended December 31, 2016, the sub-transfer agent fees (which are reflected in transfer agent fees and expenses in the Statements of Operations) for each Fund were as follows:
| Fund |
Sub-Transfer |
|||
| Dynamic Allocation Fund |
$ | 97 | ||
| Global Alternatives Fund |
1,564,868 | |||
| Managed Futures Strategy Fund |
3,145,243 | |||
| Tactical U.S. Market Fund |
100,277 | |||
91 |
Table of Contents
Notes to Financial Statements (continued)
December 31, 2016
As of December 31, 2016, the Funds owe NGAM Distribution the following reimbursements for sub-transfer agent fees (which are reflected in the Statements of Assets and Liabilities as payable to distributor):
| Fund |
Reimbursements of Sub-Transfer Agent Fees |
|||
| Dynamic Allocation Fund |
$ | 2 | ||
| Global Alternatives Fund |
12,054 | |||
| Managed Futures Strategy Fund |
41,986 | |||
| Tactical U.S. Market Fund |
1,218 | |||
Sub-transfer agent fees attributable to Class A, Class C and Class Y are allocated on a pro rata basis to each class based on the relative net assets of each class to the total net assets of those classes.
e. Commissions. Commissions (including CDSCs) on Fund shares retained by NGAM Distribution during the year ended December 31, 2016 were as follows:
| Fund |
Commissions |
|||
| Dynamic Allocation Fund |
$ | 77 | ||
| Global Alternatives Fund |
46,211 | |||
| Managed Futures Strategy Fund |
112,716 | |||
| Tactical U.S. Market Fund |
3,617 | |||
f. Trustees Fees and Expenses. The Trust does not pay any compensation directly to its officers or Trustees who are directors, officers or employees of NGAM Advisors, NGAM Distribution, Natixis US or their affiliates. The Chairperson of the Board of Trustees receives a retainer fee at the annual rate of $325,000. The Chairperson does not receive any meeting attendance fees for Board of Trustees meetings or committee meetings that she attends. Each Independent Trustee (other than the Chairperson) receives, in the aggregate, a retainer fee at the annual rate of $155,000. Each Independent Trustee also receives a meeting attendance fee of $10,000 for each meeting of the Board of Trustees that he or she attends in person and $5,000 for each meeting of the Board of Trustees that he or she attends telephonically. In addition, the chairperson of the Contract Review Committee and the chairperson of the Audit Committee each receive an additional retainer fee at the annual rate of $17,500. The chairperson of the Governance Committee receives an additional retainer fee at the annual rate of $10,000. Each Contract Review Committee member is compensated $6,000 for each Committee meeting that he or she attends in person and $3,000 for each meeting that he or she attends telephonically. Each Audit Committee member is compensated $6,000 for each Committee meeting that he or she attends in person and $3,000 for each meeting that he or she attends telephonically. These fees are allocated among the funds in the Natixis Funds Trusts and Loomis Sayles Funds Trusts based on
| 92
Table of Contents
Notes to Financial Statements (continued)
December 31, 2016
a formula that takes into account, among other factors, the relative net assets of each fund. Trustees are reimbursed for travel expenses in connection with attendance at meetings.
A deferred compensation plan (the “Plan”) is available to the Trustees on a voluntary basis. Deferred amounts remain in the Funds until distributed in accordance with the provisions of the Plan. The value of a participating Trustee’s deferral account is based on theoretical investments of deferred amounts, on the normal payment dates, in certain funds of the Natixis Funds Trusts and Loomis Sayles Funds Trusts as designated by the participating Trustees. Changes in the value of participants’ deferral accounts are allocated pro rata among the funds in the Natixis Funds Trusts and Loomis Sayles Funds Trusts, and are normally reflected as Trustees’ fees and expenses in the Statements of Operations. The portions of the accrued obligations allocated to the Funds under the Plan are reflected as Deferred Trustees’ fees in the Statements of Assets and Liabilities.
g. Affiliated Ownership. As of December 31, 2016, Natixis US and affiliates held shares of Dynamic Allocation Fund representing 72.34% of the Fund’s net assets. Investment activities of affiliated shareholders could have material impacts on the Funds.
h. Reimbursement of Transfer Agent Fees and Expenses. NGAM Advisors had given a binding contractual undertaking to the Global Alternatives Fund to reimburse any and all transfer agency expenses for the Fund’s Class N shares. This undertaking was in effect through April 30, 2016 and is not subject to recovery under the expense limitation agreement described above.
For the period January 1, 2016 through April 30, 2016, NGAM Advisors reimbursed the Fund $72 for transfer agency expenses related to Class N shares.
7. Class-Specific Transfer Agent Fees and Expenses. For the year ended December 31, 2016, Global Alternatives Fund incurred the following class-specific transfer agent fees and expenses:
| Class A |
Class C |
Class N |
Class Y |
|||||||||||||
| Transfer Agent Fees and Expenses |
$ | 117,867 | $ | 53,309 | $ | 247 | $ | 1,995,828 | ||||||||
Transfer agent fees and expenses attributable to Class A, Class C, and Class Y are allocated on a pro rata basis to each class based on the relative net assets of each class to the total net assets of those classes. Transfer agent fees and expenses attributable to Class N are allocated to Class N.
All other Funds in this report allocate transfer agent fees and expenses on a pro rata basis based on the relative net assets of each class to the total net assets of those classes.
93 |
Table of Contents
Notes to Financial Statements (continued)
December 31, 2016
8. Line of Credit. Effective April 14, 2016, each Fund, together with certain other funds of Natixis Funds Trusts and Loomis Sayles Funds Trusts, entered into a 364-day, $400,000,000 syndicated, committed, unsecured line of credit with Citibank, N.A. to be used for temporary or emergency purposes only. Any one Fund may borrow up to the full $400,000,000 under the line of credit (as long as all borrowings by all Funds in the aggregate do not exceed the $400,000,000 limit at any time), subject to each Fund’s investment restrictions. Interest is charged to the Funds at a rate equal to the greater of the eurodollar or the federal funds rate plus 1.00%. In addition, a commitment fee of 0.10% per annum, payable on the last business day of each month, is accrued and apportioned among the participating funds based on their average daily unused portion of the line of credit. The Funds paid an arrangement fee, an upfront fee, and other fees in connection with the new line of credit agreement, which are being amortized over a period of 364 days and are reflected as miscellaneous expenses on the Statements of Operations. The unamortized balance is reflected as prepaid expenses on the Statements of Assets and Liabilities.
Prior to April 14, 2016 each Fund, together with certain other funds of Natixis Funds Trusts and Loomis Sayles Funds Trusts, participated in a $150,000,000 committed unsecured line of credit provided by State Street Bank. Any one Fund was able to borrow up to the full $150,000,000 under the line of credit (as long as all borrowings by all Funds in the aggregate do not exceed the $150,000,000 limit at any time). Interest was charged to each participating Fund based on its borrowings at a rate per annum equal to the greater of the Federal Funds rate or overnight LIBOR, plus 1.25%. In addition, a commitment fee of 0.15% per annum, payable at the end of each calendar quarter, was accrued and apportioned among the participating funds based on their average daily unused portion of the line of credit.
For the year ended December 31, 2016, none of the Funds had borrowings under these agreements.
9. Concentration of Risk. Each Fund’s investments in foreign securities are subject to foreign currency fluctuations, higher volatility than U.S. securities, varying degrees of regulation and limited liquidity. Greater political, economic, credit and information risks are also associated with foreign securities.
The Funds’ (excluding Dynamic Allocation Fund and Tactical U.S. Market Fund) investments in commodity-related instruments may subject the Funds to greater volatility than investments in other securities. The value of these investments may be affected by changes in overall market movements, commodity index volatility, changes in interest rates, or factors affecting a particular industry or commodity.
Dynamic Allocation Fund is non-diversified, which means that it is not limited under the 1940 Act to a percentage of assets that it may invest in any one issuer. Because the Fund may invest in the securities of a limited number of issuers, an investment in the Fund may involve a higher degree of risk than would be present in a diversified portfolio.
| 94
Table of Contents
Notes to Financial Statements (continued)
December 31, 2016
10. Interest Expense. The Funds may incur interest expense on net cash and foreign currency debit balances, if any, for accounts held at brokers. Interest expense incurred for the year ended December 31, 2016 is reflected on the Statements of Operations.
11. Concentration of Ownership. From time to time, a Fund may have a concentration of one or more accounts constituting a significant percentage of shares outstanding. Investment activities by holders of such accounts could have material impacts on the Funds. As of December 31, 2016, based on management’s evaluation of the shareholder account base, the Funds had accounts representing controlling ownership of more than 5% of the Fund’s total outstanding shares. The number of such accounts, based on accounts that represent more than 5% of an individual class of shares, and the aggregate percentage of net assets represented by such holdings were as follows:
| Fund |
Number of 5% |
Percentage of |
Percentage of |
Total |
||||||||||||
| Dynamic Allocation Fund |
— | — | 72.34 | % | 72.34 | % | ||||||||||
| Global Alternatives Fund |
2 | 45.43 | % | — | 45.43 | % | ||||||||||
| Managed Futures Strategy Fund |
3 | 23.61 | %(a) | — | 23.61 | (a) | ||||||||||
| Tactical U.S. Market Fund |
2 | 78.65 | %(a) | — | 78.65 | %(a) | ||||||||||
Omnibus shareholder accounts for which NGAM Advisors understands that the intermediary has discretion over the underlying shareholder accounts or investment models where a shareholder account may be invested for a non-discretionary customer are included in the table above. For other omnibus accounts, the Funds do not have information on the individual shareholder accounts underlying the omnibus accounts; therefore, there could be other 5% shareholders in addition to those disclosed in the table above.
| (a) | Certain Fund shareholders are invested in the Fund as a result of the Fund’s inclusion in an investment portfolio model, utilized by certain third party intermediaries, developed by an affiliate of the Fund (ASG). Without this model or as a result of changes in this model, these shareholder positions in the Fund may not exist or could change in a material amount. ASG has no involvement in the decisions to invest in the models provided. |
95 |
Table of Contents
Notes to Financial Statements (continued)
December 31, 2016
12. Capital Shares. Each Fund may issue an unlimited number of shares of beneficial interest, without par value. Transactions in capital shares were as follows:
| |
Year Ended December 31, 2016 |
|
Period Ended December 31, 2015* |
|||||||||||||
| Dynamic Allocation Fund |
Shares | Amount | Shares | Amount | ||||||||||||
| Class A | ||||||||||||||||
| Issued from the sale of shares |
3,298 | $ | 32,218 | 100 | $ | 1,001 | ||||||||||
| Issued in connection with the reinvestment of distributions |
5 | 52 | — | (a) | 1 | |||||||||||
| Redeemed |
(495 | ) | (4,875 | ) | — | — | ||||||||||
|
|
|
|
|
|
|
|
|
|||||||||
| Net change |
2,808 | $ | 27,395 | 100 | $ | 1,002 | ||||||||||
|
|
|
|
|
|
|
|
|
|||||||||
| Class C | ||||||||||||||||
| Issued from the sale of shares |
571 | $ | 5,453 | 787 | $ | 7,776 | ||||||||||
| Issued in connection with the reinvestment of distributions |
— | (a) | — | (b) | 1 | 10 | ||||||||||
| Redeemed |
(460 | ) | (4,531 | ) | — | — | ||||||||||
|
|
|
|
|
|
|
|
|
|||||||||
| Net change |
111 | $ | 922 | 788 | $ | 7,786 | ||||||||||
|
|
|
|
|
|
|
|
|
|||||||||
| Class Y | ||||||||||||||||
| Issued from the sale of shares |
624,132 | $ | 6,173,414 | 2,035,576 | $ | 20,355,001 | ||||||||||
| Issued in connection with the reinvestment of distributions |
7,288 | 73,594 | 2,858 | 28,295 | ||||||||||||
| Redeemed |
(455,346 | ) | (4,512,279 | ) | — | — | ||||||||||
|
|
|
|
|
|
|
|
|
|||||||||
| Net change |
176,074 | $ | 1,734,729 | 2,038,434 | $ | 20,383,296 | ||||||||||
|
|
|
|
|
|
|
|
|
|||||||||
| Increase (decrease) from capital share transactions |
178,993 | $ | 1,763,046 | 2,039,322 | $ | 20,392,084 | ||||||||||
|
|
|
|
|
|
|
|
|
|||||||||
| * | From commencement of operations on November 30, 2015 through December 31, 2015. |
| (a) | Amount rounds to less than one share. |
| (b) | Amount rounds to less than $1. |
| 96
Table of Contents
Notes to Financial Statements (continued)
December 31, 2016
12. Capital Shares (continued).
| |
Year Ended December 31, 2016 |
|
Year Ended December 31, 2015 |
|||||||||||||
| Global Alternatives Fund |
Shares | Amount | Shares | Amount | ||||||||||||
| Class A | ||||||||||||||||
| Issued from the sale of shares |
4,133,496 | $ | 40,817,282 | 14,778,078 | $ | 164,389,197 | ||||||||||
| Issued in connection with the reinvestment of distributions |
— | — | 404,650 | 4,673,704 | ||||||||||||
| Redeemed |
(17,986,130 | ) | (173,576,797 | ) | (7,257,669 | ) | (79,108,509 | ) | ||||||||
|
|
|
|
|
|
|
|
|
|||||||||
| Net change |
(13,852,634 | ) | $ | (132,759,515 | ) | 7,925,059 | $ | 89,954,392 | ||||||||
|
|
|
|
|
|
|
|
|
|||||||||
| Class C | ||||||||||||||||
| Issued from the sale of shares |
321,722 | $ | 3,002,124 | 3,264,329 | $ | 34,921,431 | ||||||||||
| Issued in connection with the reinvestment of distributions |
— | — | 172,414 | 1,893,104 | ||||||||||||
| Redeemed |
(5,909,888 | ) | (53,789,898 | ) | (2,052,050 | ) | (21,338,390 | ) | ||||||||
|
|
|
|
|
|
|
|
|
|||||||||
| Net change |
(5,588,166 | ) | $ | (50,787,774 | ) | 1,384,693 | $ | 15,476,145 | ||||||||
|
|
|
|
|
|
|
|
|
|||||||||
| Class N | ||||||||||||||||
| Issued from the sale of shares |
38,340 | $ | 379,457 | 958,876 | $ | 10,941,431 | ||||||||||
| Issued in connection with the reinvestment of distributions |
— | — | 28,030 | 327,389 | ||||||||||||
| Redeemed |
(78,325 | ) | (780,214 | ) | (1,041 | ) | (11,304 | ) | ||||||||
|
|
|
|
|
|
|
|
|
|||||||||
| Net change |
(39,985 | ) | $ | (400,757 | ) | 985,865 | $ | 11,257,516 | ||||||||
|
|
|
|
|
|
|
|
|
|||||||||
| Class Y | ||||||||||||||||
| Issued from the sale of shares |
62,997,782 | $ | 625,624,429 | 181,073,867 | $ | 2,045,988,073 | ||||||||||
| Issued in connection with the reinvestment of distributions |
— | — | 4,360,784 | 51,021,174 | ||||||||||||
| Redeemed |
(229,760,358 | ) | (2,258,343,102 | ) | (118,756,904 | ) | (1,304,013,239 | ) | ||||||||
|
|
|
|
|
|
|
|
|
|||||||||
| Net change |
(166,762,576 | ) | $ | (1,632,718,673 | ) | 66,677,747 | $ | 792,996,008 | ||||||||
|
|
|
|
|
|
|
|
|
|||||||||
| Increase (decrease) from capital share transactions |
(186,243,361 | ) | $ | (1,816,666,719 | ) | 76,973,364 | $ | 909,684,061 | ||||||||
|
|
|
|
|
|
|
|
|
|||||||||
97 |
Table of Contents
Notes to Financial Statements (continued)
December 31, 2016
12. Capital Shares (continued).
| |
Year Ended December 31, 2016 |
|
Year Ended December 31, 2015 |
|||||||||||||
| Managed Futures Strategy Fund |
Shares | Amount | Shares | Amount | ||||||||||||
| Class A | ||||||||||||||||
| Issued from the sale of shares |
35,536,077 | $ | 380,621,435 | 50,367,993 | $ | 561,169,054 | ||||||||||
| Issued in connection with the reinvestment of distributions |
— | — | 1,094,218 | 12,444,469 | ||||||||||||
| Redeemed |
(35,043,240 | ) | (364,059,654 | ) | (17,133,458 | ) | (186,862,804 | ) | ||||||||
|
|
|
|
|
|
|
|
|
|||||||||
| Net change |
492,837 | $ | 16,561,781 | 34,328,753 | $ | 386,750,719 | ||||||||||
|
|
|
|
|
|
|
|
|
|||||||||
| Class C | ||||||||||||||||
| Issued from the sale of shares |
3,692,171 | $ | 38,675,810 | 4,818,851 | $ | 53,569,422 | ||||||||||
| Issued in connection with the reinvestment of distributions |
— | — | 131,418 | 1,506,670 | ||||||||||||
| Redeemed |
(2,839,728 | ) | (28,367,764 | ) | (1,425,560 | ) | (15,029,226 | ) | ||||||||
|
|
|
|
|
|
|
|
|
|||||||||
| Net change |
852,443 | $ | 10,308,046 | 3,524,709 | $ | 40,046,866 | ||||||||||
|
|
|
|
|
|
|
|
|
|||||||||
| Class Y | ||||||||||||||||
| Issued from the sale of shares |
196,340,237 | $ | 2,089,326,900 | 148,271,766 | $ | 1,669,938,004 | ||||||||||
| Issued in connection with the reinvestment of distributions |
14,752 | 146,350 | 6,023,176 | 69,790,109 | ||||||||||||
| Redeemed |
(133,953,574 | ) | (1,377,014,609 | ) | (72,933,494 | ) | (804,913,773 | ) | ||||||||
|
|
|
|
|
|
|
|
|
|||||||||
| Net change |
62,401,415 | $ | 712,458,641 | 81,361,448 | $ | 934,814,340 | ||||||||||
|
|
|
|
|
|
|
|
|
|||||||||
| Increase (decrease) from capital share transactions |
63,746,695 | $ | 739,328,468 | 119,214,910 | $ | 1,361,611,925 | ||||||||||
|
|
|
|
|
|
|
|
|
|||||||||
| |
Year Ended December 31, 2016 |
|
Year Ended December 31, 2015 |
|||||||||||||
| Tactical U.S. Market Fund |
Shares | Amount | Shares | Amount | ||||||||||||
| Class A | ||||||||||||||||
| Issued from the sale of shares |
803,091 | $ | 9,110,082 | 1,203,103 | $ | 14,190,927 | ||||||||||
| Issued in connection with the reinvestment of distributions |
2,636 | 31,318 | 5,943 | 70,786 | ||||||||||||
| Redeemed |
(919,309 | ) | (10,616,695 | ) | (649,247 | ) | (7,454,815 | ) | ||||||||
|
|
|
|
|
|
|
|
|
|||||||||
| Net change |
(113,582 | ) | $ | (1,475,295 | ) | 559,799 | $ | 6,806,898 | ||||||||
|
|
|
|
|
|
|
|
|
|||||||||
| Class C | ||||||||||||||||
| Issued from the sale of shares |
60,500 | $ | 680,339 | 148,989 | $ | 1,751,687 | ||||||||||
| Issued in connection with the reinvestment of distributions |
— | — | 1,460 | 17,184 | ||||||||||||
| Redeemed |
(86,641 | ) | (968,616 | ) | (79,209 | ) | (889,555 | ) | ||||||||
|
|
|
|
|
|
|
|
|
|||||||||
| Net change |
(26,141 | ) | $ | (288,277 | ) | 71,240 | $ | 879,316 | ||||||||
|
|
|
|
|
|
|
|
|
|||||||||
| Class Y | ||||||||||||||||
| Issued from the sale of shares |
2,782,073 | $ | 31,892,345 | 7,279,678 | $ | 86,150,712 | ||||||||||
| Issued in connection with the reinvestment of distributions |
34,967 | 416,807 | 61,361 | 727,986 | ||||||||||||
| Redeemed |
(5,673,700 | ) | (65,382,717 | ) | (5,032,247 | ) | (58,826,491 | ) | ||||||||
|
|
|
|
|
|
|
|
|
|||||||||
| Net change |
(2,856,660 | ) | $ | (33,073,565 | ) | 2,308,792 | $ | 28,052,207 | ||||||||
|
|
|
|
|
|
|
|
|
|||||||||
| Increase (decrease) from capital share transactions |
(2,996,383 | ) | $ | (34,837,137 | ) | 2,939,831 | $ | 35,738,421 | ||||||||
|
|
|
|
|
|
|
|
|
|||||||||
| 98
Table of Contents
Report of Independent Registered Public Accounting Firm
To the Trustees of Natixis Funds Trust II and Shareholders of ASG Dynamic Allocation Fund, ASG Global Alternatives Fund, ASG Managed Futures Strategy Fund, and ASG Tactical U.S. Market Fund:
In our opinion, the accompanying statements of assets and liabilities, including the portfolios of investments, and the related statements of operations and of changes in net assets and the financial highlights present fairly, in all material respects, the financial position of the ASG Dynamic Allocation Fund, ASG Global Alternatives Fund (Consolidated), ASG Managed Futures Strategy Fund (Consolidated), and ASG Tactical U.S. Market Fund, each a series of Natixis Funds Trust II (collectively, the “Funds”) as of December 31, 2016, and the results of each of their operations, the changes in each of their net assets and the financial highlights for each of the periods indicated, in conformity with accounting principles generally accepted in the United States of America. These financial statements and financial highlights (hereafter referred to as “financial statements”) are the responsibility of the Funds’ management. Our responsibility is to express an opinion on these financial statements based on our audits. We conducted our audits of these financial statements in accordance with the standards of the Public Company Accounting Oversight Board (United States). Those standards require that we plan and perform the audit to obtain reasonable assurance about whether the financial statements are free of material misstatement. An audit includes examining, on a test basis, evidence supporting the amounts and disclosures in the financial statements, assessing the accounting principles used and significant estimates made by management, and evaluating the overall financial statement presentation. We believe that our audits, which included confirmation of securities as of December 31, 2016 by correspondence with the custodian, agent banks and brokers, provide a reasonable basis for our opinion.
PricewaterhouseCoopers LLP
Boston, Massachusetts
February 22, 2017
99 |
Table of Contents
2016 U.S. Tax Distribution Information to Shareholders (Unaudited)
Corporate Dividends Received Deduction. For the fiscal year ended December 31, 2016, a percentage of dividends distributed by the Fund listed below qualifies for the dividends received deduction for corporate shareholders. This percentage is as follows:
| Fund |
Qualifying |
|||
| Tactical U.S. Market Fund |
100.00 | % | ||
Qualified Dividend Income. For the fiscal year ended December 31, 2016, a percentage of the ordinary income dividends paid by the Fund are considered qualified dividend income eligible for reduced tax rates. These lower rates range from 0% to 20% depending on an individual’s tax bracket. If the Fund paid a distribution during calendar year 2016, complete information will be reported in conjunction with Form 1099-DIV. This percentage is noted below:
| Fund |
Qualifying |
|||
| Tactical U.S. Market Fund |
100.00 | % | ||
| 100
Table of Contents
Trustee and Officer Information
The tables below provide certain information regarding the trustees and officers of Natixis Funds Trust II (the “Trust”). Unless otherwise indicated, the address of all persons below is 399 Boylston Street, Boston, MA 02116. The Funds’ Statement of Additional Information includes additional information about the trustees of the Trust and is available by calling Natixis Funds at 800-225-5478.
| Name and Year of |
Position(s) Held |
Principal |
Number of and Other |
Experience, | ||||
| INDEPENDENT TRUSTEES | ||||||||
| Kenneth A. Drucker (1945) |
Chairperson of the Board of Trustees since January 2017 Trustee since 2008 Ex Officio member of the Audit Committee, the Contract Review Committee and the Governance Committee |
Retired | 53 None |
Significant experience on the Board and on the boards of other business organizations (including at investment companies); executive experience (including as treasurer of an aerospace, automotive, and metal manufacturing corporation) | ||||
| Edmond J. English (1953) | Trustee since 2013 Audit Committee Member |
Chief Executive Officer of Bob’s Discount Furniture (retail) | 53 Director, Burlington Stores, Inc. (retail) |
Experience on the Board and significant experience on the boards of other business organizations (including retail companies and a bank); executive experience (including at a retail company) | ||||
101 |
Table of Contents
Trustee and Officer Information
| Name and Year of |
Position(s) Held |
Principal |
Number of and
Other |
Experience, | ||||
| INDEPENDENT TRUSTEES continued |
||||||||
| Richard A. Goglia (1951) |
Trustee since 2015 Audit Committee Member |
Retired; formerly Vice President and Treasurer of Raytheon Company (defense) | 53 None |
Experience on the Board and executive experience (including his role as vice president and treasurer of a defense company and experience at a financial services company) | ||||
| Wendell J. Knox (1948) |
Trustee since 2009 Contract Review Committee Member and Governance Committee Member |
Director of Abt Associates Inc. (research and consulting) | 53 Director, Eastern Bank (bank); Director, The Hanover Insurance Group (property and casualty insurance) |
Significant experience on the Board and on the boards of other business organizations (including at a bank and at a property and casualty insurance firm); executive experience (including roles as president and chief executive officer of a research and consulting company) | ||||
| 102
Table of Contents
Trustee and Officer Information
| Name and Year of |
Position(s) Held |
Principal |
Number of and
Other |
Experience, | ||||
| INDEPENDENT TRUSTEES continued |
||||||||
| Martin T. Meehan (1956) |
Trustee since 2012 Contract Review Committee Member |
President, University of Massachusetts; formerly, Chancellor and faculty member, University of Massachusetts Lowell | 53 None |
Experience on the Board and on the boards of other business organizations; experience as President of the University of Massachusetts; government experience (including as a member of the U.S. House of Representatives); academic experience | ||||
| Sandra O. Moose (1942) |
Trustee since 1993 Audit Committee Member and Governance Committee Member |
President, Strategic Advisory Services (management consulting) | 53 Formerly, Director, AES Corporation (international power company); formerly, Director, Verizon Communications (telecommunications company) |
Significant experience on the Board and on the boards of other business organizations (including at a telecommunications company, an international power company and a specialty chemicals corporation); executive experience (including at a management consulting company) | ||||
103 |
Table of Contents
Trustee and Officer Information
| Name and Year of |
Position(s) Held |
Principal |
Number of and
Other |
Experience, | ||||
| INDEPENDENT TRUSTEES continued |
||||||||
| James P. Palermo (1955) |
Trustee since 2016 Contract Review Committee Member |
Founding Partner, Breton Capital Management, LLC (private equity); Partner, STEP Partners, LLC (private equity); formerly, Chief Executive Officer of Global Client Management of The Bank of New York Mellon Corporation | 53 None |
Experience on the Board; financial services industry and executive experience (including roles as chief executive officer of client management and asset servicing for a banking and financial services company) | ||||
| Erik R. Sirri (1958) |
Trustee since 2009 Chairperson of the Audit Committee |
Professor of Finance at Babson College | 53 None |
Significant experience on the Board; experience as Director of the Division of Trading and Markets at the Securities and Exchange Commission; academic experience; training as an economist | ||||
| Peter J. Smail (1952) |
Trustee since 2009 Chairperson of the Contract Review Committee and Governance Committee Member |
Retired | 53 None |
Significant experience on the Board; mutual fund industry and executive experience (including roles as president and chief executive officer for an investment adviser) | ||||
| 104
Table of Contents
Trustee and Officer Information
| Name and Year of |
Position(s) Held |
Principal |
Number of and
Other |
Experience, | ||||
| INDEPENDENT TRUSTEES continued |
||||||||
| Cynthia L. Walker (1956) |
Trustee since 2005 Chairperson of the Governance Committee and Audit Committee Member |
Deputy Dean for Finance and Administration, Yale University School of Medicine | 53 None |
Significant experience on the Board; executive experience in a variety of academic organizations (including roles as dean for finance and administration) | ||||
| INTERESTED TRUSTEES | ||||||||
| Kevin P. Charleston3 (1965) One Financial Center Boston, MA 02111 |
Trustee since 2015 | President, Chief Executive Officer and Director; formerly, Chief Financial Officer, Loomis, Sayles & Company, L.P. | 53 None |
Experience on the Board; continuing service as President, Chief Executive Officer and Director of Loomis, Sayles & Company, L.P. | ||||
| David L. Giunta4 (1965) | Trustee since 2011 President and Chief Executive Officer |
President and Chief Executive Officer, NGAM Distribution Corporation, NGAM Advisors, L.P. and NGAM Distribution, L.P. | 53 None |
Significant experience on the Board; continuing experience as President and Chief Executive Officer of NGAM Advisors, L.P. | ||||
| 1 | Each trustee serves until retirement, resignation or removal from the Board. The current retirement age is 75. The position of Chairperson of the Board is appointed for a three-year term. |
| 2 | The trustees of the Trust serve as trustees of a fund complex that includes all series of the Natixis Funds Trust I, Natixis Funds Trust II, Natixis Funds Trust IV and Gateway Trust (collectively, the “Natixis Funds Trusts”), Loomis Sayles Funds I and Loomis Sayles Funds II (collectively, the “Loomis Sayles Funds Trusts”) and Natixis ETF Trust (collectively, the “Fund Complex”). |
| 3 | Mr. Charleston is deemed an “interested person” of the Trust because he holds the following positions with an affiliated person of the Trust: President and Chief Executive Officer of Loomis, Sayles & Company, L.P. |
| 4 | Mr. Giunta is deemed an “interested person” of the Trust because he holds the following positions with an affiliated person of the Trust: President and Chief Executive Officer of NGAM Distribution Corporation, NGAM Advisors, L.P. and NGAM Distribution, L.P. |
105 |
Table of Contents
Trustee and Officer Information
| Name and Year of Birth |
Position(s) Held with the Trust(s) |
Term of Office1 and Length of Time Served |
Principal Occupation(s) During Past 5 Years2 | |||
| OFFICERS OF THE TRUST | ||||||
| Russell L. Kane (1969) |
Secretary, Clerk and Chief Legal Officer | Since July 2016 | Executive Vice President, General Counsel, Secretary and Clerk, NGAM Distribution Corporation, NGAM Advisors, L.P. and NGAM Distribution, L.P.; formerly, Chief Compliance Officer for Mutual Funds, Senior Vice President, Deputy General Counsel, Assistant Secretary and Assistant Clerk, NGAM Distribution Corporation, NGAM Advisors, L.P. and NGAM Distribution, L.P. | |||
| Michael C. Kardok (1959) |
Treasurer, Principal Financial and Accounting Officer | Since October 2004 | Senior Vice President, NGAM Advisors, L.P. and NGAM Distribution, L.P. | |||
| Rosa Licea-Mailloux (1976) |
Chief Compliance Officer, Assistant Secretary and Anti-Money Laundering Officer | Since July 2016 | Senior Vice President, Deputy General Counsel, Assistant Secretary and Assistant Clerk, NGAM Distribution Corporation, NGAM Advisors, L.P. and NGAM Distribution, L.P.; formerly, Associate General Counsel, NGAM Distribution, L.P. | |||
| 1 | Each officer of the Trust serves for an indefinite term in accordance with the Trust’s current by-laws until the date his or her successor is elected and qualified, or until he or she sooner dies, retires, is removed or becomes disqualified. |
| 2 | Each person listed above, except as noted, holds the same position(s) with the Fund Complex. Previous positions during the past five years with NGAM Distribution, L.P., NGAM Advisors, L.P. or Loomis, Sayles & Company, L.P. are omitted, if not materially different from a trustee’s or officer’s current position with such entity. |
| 106
Table of Contents
Item 2. Code of Ethics.
The Registrant has adopted a code of ethics that applies to the Registrant’s principal executive officer, principal financial officer and persons performing similar functions. There have been no amendments or waivers of the Registrant’s code of ethics during the period.
Item 3. Audit Committee Financial Expert.
The Board of Trustees of the Registrant has established an audit committee. Mr. Edmond J. English, Richard A. Goglia, Ms. Sandra O. Moose, Mr. Erik R. Sirri and Ms. Cynthia L. Walker are members of the audit committee and have been designated as “audit committee financial experts” by the Board of Trustees. Each of these individuals is also an Independent Trustee of the Registrant.
Item 4. Principal Accountant Fees and Services.
Fees billed by the Principal Accountant for services rendered to the Registrant.
The table below sets forth fees billed by the principal accountant, PricewaterhouseCoopers LLP, for the past two fiscal years for professional services rendered in connection with a) the audit of the Registrant’s annual financial statements and services provided in connection with regulatory filings; b) audit-related services (including services that are reasonably related to the performance of the audit of the Registrant’s financial statements but not reported under “Audit Fees”); c) tax compliance, tax advice and tax planning and d) all other fees billed for professional services rendered by the principal accountant to the Registrant, other than the services provided as reported as a part of (a) through (c) of this Item.
| Audit fees | Audit-related fees1 | Tax fees2 | All other fees | |||||||||||||||||||||||||||||
| 1/1/15- 12/31/15 |
1/1/16- 12/31/16 |
1/1/15- 12/31/15 |
1/1/16- 12/31/16 |
1/1/15- 12/31/15 |
1/1/16- 12/31/16 |
1/1/15- 12/31/15 |
1/1/16- 12/31/16 |
|||||||||||||||||||||||||
| Natixis Funds Trust II |
$ | 471,113 | $ | 403,304 | $ | 1,144 | $ | 1,536 | $ | 118,264 | $ | 126,561 | $ | — | $ | — | ||||||||||||||||
| 1. | Audit-related fees consist of: |
2015 & 2016 – performance of agreed-upon procedures related to the Registrant’s deferred compensation.
| 2. | Tax fees consist of: |
2015 & 2016 – review of Registrant’s tax returns and liquidation services (2016)
Aggregate fees billed to the Registrant for non-audit services during 2015 and 2016 were $119,408 and $128,097 respectively.
Fees billed by the Principal Accountant for services rendered to the Adviser and Control Affiliates.
The following table sets forth the fees billed by the Registrant’s principal accountant for non-audit services rendered to AlphaSimplex Group, LLC (“ASG”), Loomis, Sayles & Company, L.P. (“Loomis”), NGAM Advisors, L.P. (“NGAM”), and entities controlling, controlled by or under common control with ASG, Loomis, and NGAM (“Control Affiliates”) that provide ongoing services to the Registrant, for engagements that related directly to the operations and financial reporting of the Registrant for the last two fiscal years.
| Audit-related fees | Tax fees | All other fees | ||||||||||||||||||||||
| 1/1/15- 12/31/15 |
1/1/16- 12/31/16 |
1/1/15- 12/31/15 |
1/1/16- 12/31/16 |
1/1/15- 12/31/15 |
1/1/16- 12/31/16 |
|||||||||||||||||||
| Control Affiliates |
$ | — | $ | — | $ | — | $ | — | $ | — | $ | — | ||||||||||||
Table of Contents
The following table sets forth the aggregate fees billed by the Registrant’s principal accountant for non-audit services rendered to ASG, Loomis, NGAM, Natixis AM US, and Control Affiliates that provide ongoing services to the Registrant, for the last two fiscal years, including the fees disclosed in the table above.
| Aggregate Non-Audit Fees |
||||||||
| 1/1/15- 12/31/15 |
1/1/16- 12/31/16 |
|||||||
| Control Affiliates |
$ | 355,914 | $ | 466,785 | ||||
None of the services described above were approved pursuant to (c)(7)(i)(C) of Regulation S-X.
Audit Committee Pre Approval Policies.
Annually, the Registrant’s Audit Committee reviews the audit, audit-related, tax and other non-audit services together with the projected fees, for services proposed to be rendered to the Trust and/or other entities for which pre-approval is required during the upcoming year. Any subsequent revisions to already pre-approved services or fees (including fee increases) and requests for pre-approval of new services would be presented for consideration quarterly as needed.
If, in the opinion of management, a proposed engagement by the Registrant’s independent accountants needs to commence before the next regularly scheduled Audit Committee meeting, any member of the Audit Committee who is an independent Board member is authorized to pre-approve the engagement, but only for engagements to provide audit, audit related and tax services. This approval is subject to review of the full Audit Committee at its next quarterly meeting. All other engagements require the approval of all the members of the Audit Committee.
Item 5. Audit Committee of Listed Registrants.
Not applicable.
Item 6. Schedule of Investments.
Included as part of the Report to Shareholders filed as Item 1 herewith.
Item 7. Disclosure of Proxy Voting Policies and Procedures for Closed-End Management Investment Companies.
Not applicable.
Item 8. Portfolio Managers of Closed-End Management Investment Companies.
Not applicable.
Item 9. Purchases of Equity Securities by Closed-End Management Investment Companies and Affiliated Purchasers.
Not applicable.
Item 10. Submission of Matters to a Vote of Securities Holders.
There were no material changes to the procedures by which shareholders may recommend nominees to the Registrant’s Board of Trustees.
Item 11. Controls and Procedures.
The Registrant’s principal executive officer and principal financial officer have concluded that the Registrant’s disclosure controls and procedures are sufficient to ensure that information required to be disclosed by the Registrant in this Form N-CSR was recorded, processed, summarized and reported within the time periods specified in the Securities and Exchange Commission’s rules and forms, based upon such officers’ evaluation of these controls and procedures as of a date within 90 days of the filing date of the report.
There were no changes in the Registrant’s internal control over financial reporting that occurred during the Registrant’s last fiscal quarter of the period covered by the report that has materially affected, or is reasonably likely to materially affect, the Registrant’s internal control over financial reporting.
Table of Contents
Item 12. Exhibits.
| (a) | (1) | Code of Ethics required by Item 2 hereof, filed herewith as Exhibit (a)(1). | ||
| (a) | (2) | Certifications of Principal Executive Officer and Principal Financial Officer pursuant to Rule 30a-2(a) under the Investment Company Act of 1940 [17 CFR 270.30a-2(a)], filed herewith as Exhibits (a)(2)(1)and (a)(2)(2), respectively. | ||
| (a) | (3) | Not applicable. | ||
| (b) | Certifications of Principal Executive Officer and Principal Financial Officer pursuant to Section 906 of Sarbanes-Oxley Act of 2002 filed herewith as Exhibit (b). | |||
Table of Contents
SIGNATURES
Pursuant to the requirements of the Securities Exchange Act of 1934 and the Investment Company Act of 1940, the Registrant has duly caused this report to be signed on its behalf by the undersigned, thereunto duly authorized.
| Natixis Funds Trust II | ||
| By: | /s/ David L. Giunta | |
| Name: | David L. Giunta | |
| Title: | President and Chief Executive Officer | |
| Date: | February 22, 2017 | |
Pursuant to the requirements of the Securities Exchange Act of 1934 and the Investment Company Act of 1940, this report has been signed by the following persons on behalf of the Registrant and in the capacities and on the dates indicated.
| By: | /s/ David L. Giunta | |
| Name: | David L. Giunta | |
| Title: | President and Chief Executive Officer | |
| Date: | February 22, 2017 | |
| By: | /s/ Michael C. Kardok | |
| Name: | Michael C. Kardok | |
| Title: | Treasurer | |
| Date: | February 22, 2017 | |