Table of Contents
UNITED STATES
SECURITIES AND EXCHANGE COMMISSION
Washington, D.C. 20549
FORM N-CSR
CERTIFIED SHAREHOLDER REPORT OF REGISTERED
MANAGEMENT INVESTMENT COMPANIES
Investment Company Act file number: 811-00242
Natixis Funds Trust II
(Exact name of Registrant as specified in charter)
399 Boylston Street, Boston, Massachusetts 02116
(Address of principal executive offices) (Zip code)
Coleen Downs Dinneen, Esq.
NGAM Distribution, L.P.
399 Boylston Street
Boston, Massachusetts 02116
(Name and address of agent for service)
Registrant’s telephone number, including area code: (617) 449-2810
Date of fiscal year end: November 30
Date of reporting period: November 30, 2012
Table of Contents
Item 1. Reports to Stockholders.
The Registrant’s annual report transmitted to shareholders pursuant to Rule 30e-1 under the Investment Company Act of 1940 is as follows:
Table of Contents
ANNUAL REPORT
November 30, 2012

ASG Growth Markets Fund
Gateway International Fund
Loomis Sayles Capital Income Fund
Loomis Sayles Senior Floating Rate and Fixed Income Fund
Vaughan Nelson Select Fund
Management Discussion and Investment Results page 1
Portfolio of Investments page 27
Financial Statements page 68
Table of Contents
ASG GROWTH MARKETS FUND
1 |
Table of Contents
futures and forwards that is designed to manage and contain the risks of emerging markets. The core equity portfolio, which represents about two-thirds of the fund’s assets, tracks the MSCI Emerging Markets Index (Net) with modest tilts toward low valuation stocks as well as high price-momentum stocks.
During the period, the core equity portfolio offered performance broadly consistent with the performance of investable portfolios of emerging market equities. The fund’s underperformance relative to its benchmark is largely the result of the manager’s efforts to contain emerging market exposures in response to increased volatility and losses in emerging markets late in 2011 and during the second quarter of 2012. The divergence between the fund and its benchmark occurred mostly in January, as a result of efforts to hedge the fund’s exposure to emerging markets in response to the substantial losses and elevated risk exhibited by those markets in the latter half of 2011.
Equity and currency risk were identified as significant factors explaining emerging market performance in 2011. Based on this, the portfolio’s risk-management overlay held short positions in equity futures and currency forwards as a hedge entering 2012. Over the course of the first quarter, the level of hedging was reduced as markets recovered and volatility declined; however, larger hedge positions were reinstated as emerging markets sold off from March through May.
Overlay exposures during the first half of 2012 and the beginning of the third quarter were generally intended to offset volatility in emerging markets. However, by the end of the third quarter of 2012, the management strategy called for the overlay portfolio to actively reinforce exposures that were viewed as driving the recent performance of emerging markets.
As a result of the fund’s active risk management, the annualized volatility over the 12-month period was 11.7%, lower than the 15.3% annualized volatility experienced by the MSCI Emerging Markets Index (Net) over the same period.
Outlook
The outlook for global markets remains uncertain and the chronic nature of the present crises remains a source of concern for the coming period. Complicating matters for emerging markets will be the outcome of the ongoing budgetary negotiations in the United States. Although the initial “fiscal cliff” – a reference to the tax hikes and spending cuts that were scheduled to occur at year-end 2012 unless Congress acted to avert them – has been avoided, uncertainty remains with issues surrounding the debt ceiling and United States government funding. Nations that export to the United States could be materially affected should the United States fall into economic decline. If legislators lose credibility with the plan put forth, there would be a negative impact on growth. With growth already weak in emerging markets and in Europe, a significant breakdown could trigger another global recession. Conversely, if the gap is bridged by a comprehensive and credible longer-term agreement, the occurrence of a more pronounced and sustainable rally in asset prices is certainly within reasonable expectations. With monetary conditions already quite loose, signs of improvement in industrial activity could trigger a sharp rebound in emerging market growth.
| 2
Table of Contents
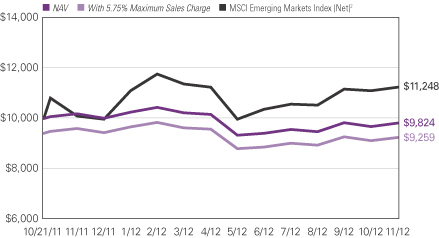
ASG GROWTH MARKETS FUND
Investment Results through November 30, 2012
Growth of $10,000 Investment in Class A Shares4
October 21, 2011 (inception) through November 30, 2012
3 |
Table of Contents
Average Annual Total Returns — November 30, 20124
| 1 Year | Since Inception | |||||||
| Class A (Inception 10/21/11) | ||||||||
| NAV | -3.69 | % | -1.59 | % | ||||
| With 5.75% Maximum Sales Charge | -9.21 | -6.71 | ||||||
| Class C (Inception 10/21/11) | ||||||||
| NAV | -4.45 | -2.29 | ||||||
| With CDSC1 | -5.40 | -2.29 | ||||||
| Class Y (Inception 10/21/11) | ||||||||
| NAV | -3.56 | -1.39 | ||||||
| Comparative Performance | ||||||||
| MSCI Emerging Markets Index (Net)2 | 11.35 | 11.21 | ||||||
| Morningstar Diversified Emerging Markets Fund Avg.3 | 8.46 | 9.02 | ||||||
Past performance does not guarantee future results. The chart and table do not reflect taxes shareholders might owe on any fund distributions or when they redeem their shares. Performance for periods less than one year is cumulative, not annualized. Returns reflect changes in share price and reinvestment of dividends and capital gains, if any. Unlike a fund, an index is not managed and does not reflect fees and expenses.
NOTES TO CHARTS
| 1 | Performance for Class C shares assumes a 1% contingent deferred sales charge (“CDSC”) applied when you sell shares within one year of purchase. |
| 2 | MSCI Emerging Markets Index (Net) is an unmanaged index that is designed to measure the equity market performance of emerging markets. |
| 3 | Morningstar Fund Averages are the average performance without sales charges of funds with similar investment objectives, as calculated by Morningstar, Inc. |
| 4 | Fund performance has been increased by fee waivers and/or expense reimbursements, if any, without which performance would have been lower. |
| 4
Table of Contents
GATEWAY INTERNATIONAL FUND
5 |
Table of Contents
encompassed two distinct market phases. From April 1 (the first day of the Fund’s first full-month of performance) through June 4, 2012, the Index declined 14.82%, primarily due to weakness in Europe and Japan. By comparison, the fund’s losses were only 8.60% over that same period. Outperformance over this period was driven by the fund’s hedging technique of selling index call options and buying index put options. From June 4 through November 30, 2012, the MSCI EAFE Index (Net) rallied, posting a 20.39% return, primarily on strength in Europe. During this period, the fund gained 8.53%. The fund’s hedging technique was primarily responsible for the performance differential over this period as well. When markets advance, the fund’s return will generally be consistent with the amount of net cash flow produced by the hedge, i.e. index call selling and index put buying. Because the fund sells index call options against the notional value of the portfolio, it foregoes the upside potential of the index in favor of call premium. Upside potential is further limited because the fund also hedges downside risk with index put options. The fund’s 8.53% gain over a period that was slightly less than six months reflects a return above expectations in light of its hedged risk profile. However, the gain was insufficient to fully recover the 8.60% lost during the earlier equity decline.
Index put options were valuable hedging tools during the equity market decline that occurred in the first two months of the fund’s operations, and, accordingly, the investment management team reduced put coverages in the European Indexes as put profits were realized. However, put coverages remained at more than 95% of notional value in the Asia-Pacific indexes throughout the period. As volatility diminished during the market rally, put coverage was restored to more than 95% in all six foreign indexes by November 30, 2012. All indexes were approximately 100% hedged with index call options.
Outlook
The investment thesis for the Gateway International Fund has two components. First, the globalization of the world economy over the last 20 years has motivated investors to embrace global equity investing as a core equity allocation. Second, given the expanded set of risks involved in investing outside the domestic economy, prudence and wealth preservation considerations have placed greater emphasis on a hedged approach. At Gateway, we continue to see uncertainties related to the resolution of the European crisis and the economic leadership provided by the new members of the central committee in China. Further, given the growing interdependence of world economies, these risks are heightened as the United States seeks to resolve its own fiscal dilemma. The trend of rising cross-correlations implies that the global investor faces growing vulnerability to systemic and tail risk events worldwide. These risks increase the need for heightened vigilance, and the Gateway International Fund continues to focus on risk management.
| 6
Table of Contents
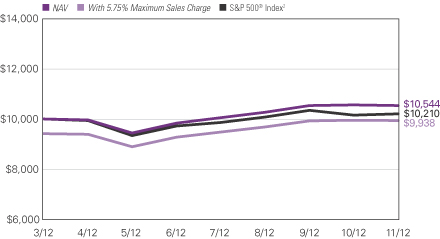
GATEWAY INTERNATIONAL FUND
Investment Results through November 30, 2012
Growth of $10,000 Investment in Class A Shares4
March 30, 2012 (inception) through November 30, 2012

7 |
Table of Contents
Total Returns — November 30, 20124
| Since Inception | ||||
| Class A (Inception 3/30/2012) | ||||
| NAV | -0.80 | % | ||
| With 5.75% Maximum Sales Charge | -6.50 | |||
| Class C (Inception 3/30/2012) | ||||
| NAV | -1.20 | |||
| With CDSC1 | -2.19 | |||
| Class Y (Inception 3/30/2012) | ||||
| NAV | -0.60 | |||
| Comparative Performance | ||||
| MSCI EAFE Index (Net)2 | 2.55 | |||
| Morningstar Long/Short Equity Fund Avg.3 | -1.42 | |||
Past performance does not guarantee future results. The chart and table do not reflect taxes shareholders might owe on any fund distributions or when they redeem their shares. Performance for periods less than one year is cumulative, not annualized. Returns reflect changes in share price and reinvestment of dividends and capital gains, if any. Unlike a fund, an index is not managed and does not reflect fees and expenses.
NOTES TO CHARTS
| 1 | Performance for Class C shares assumes a 1% contingent deferred sales charge (“CDSC”) applied when you sell shares within one year of purchase. |
| 2 | MSCI EAFE Index (Net) (Europe, Australasia, Far East) is an unmanaged index that is designed to measure the equity market performance of developed markets, excluding the United States and Canada. |
| 3 | Morningstar Fund Averages are the average performance without sales charges of funds with similar investment objectives, as calculated by Morningstar, Inc. |
| 4 | Fund performance has been increased by fee waivers and/or expense reimbursements, if any, without which performance would have been lower. |
| 8
Table of Contents
LOOMIS SAYLES CAPITAL INCOME FUND
Management Discussion
9 |
Table of Contents
ground for the period. Despite disappointing overall results from materials, Weyerhaeuser, a forest products company, benefited from the uptick in the housing market and was a strong contributor to performance. Although the technology sector posted negative returns, an underweight in the sector relative to the primary benchmark benefited the fund’s overall performance.
The fund’s consumer staples sector holdings detracted from performance, as our selections didn’t keep pace with the benchmark’s selections. In technology, software giant Microsoft declined as personal computers continued to lose ground to tablets. In the financials sector, positions in PNC, a diversified financial services company, and MetLife, an insurance company, lagged. Additionally, fears of higher taxes on dividends hurt the fund’s higher-yielding stocks in the telecom and utilities sectors.
In the fund’s fixed-income segment, financial securities in the investment-grade and high-yield universes aided performance. In particular, security selection within the banking industry led to sizeable gains. In addition, high-yield utilities, equity-sensitive convertibles and non-U.S.-dollar-denominated securities also boosted performance.
The fund’s below-investment-grade holdings within the home construction and healthcare industries posted strong results, but they were unable to buoy the overall industrials sector due to lagging results from selected holdings in the supermarket and retail industries. The fund’s investment-grade industrials also detracted from performance due to a specific wireline holding. Meanwhile, an underweight in investment-grade utilities, which posted modest gains for the period, dragged down results.
Outlook
Uncertainty related to ongoing fiscal challenges in the U.S. is driving market activity and may hinder economic growth moving forward. Given the terms of the agreement reached by the president and Congress, we think investors will still seek income-oriented securities. While we remain optimistic about the rebound in residential construction, yield-oriented stocks with attractive valuations are becoming more difficult to uncover.
In the fixed-income market, we believe security selection will remain critical, as we continue to review new issues and existing holdings for more attractive opportunities. We expect volatility in Europe to remain significant and growth to remain soft, with the possibility of a modest recession as governments implement additional fiscal reform.
| 10
Table of Contents
LOOMIS SAYLES CAPITAL INCOME FUND
Investment Results through November 30, 2012
Growth of $10,000 Investment in Class A Shares5
March 30, 2012 (inception) through November 30, 2012
11 |
Table of Contents
Total Returns — November 30, 20125
| Since Inception | ||||
| Class A (Inception 3/30/2012) | ||||
| NAV | 6.01 | % | ||
| With 5.75% Maximum Sales Charge | -0.09 | |||
| Class C (Inception 3/30/2012) | ||||
| NAV | 5.44 | |||
| With CDSC1 | 4.44 | |||
| Class Y (Inception 3/30/2012) | ||||
| NAV | 6.19 | |||
| Comparative Performance | ||||
| S&P 500® Index2 | 2.10 | |||
| Russell 1000® Value Index3 | 3.61 | |||
| Morningstar Aggressive Allocation Fund Avg.4 | 1.40 | |||
Past performance does not guarantee future results. The chart and table do not reflect taxes shareholders might owe on any fund distributions or when they redeem their shares. Performance for periods less than one year is cumulative, not annualized. Returns reflect changes in share price and reinvestment of dividends and capital gains, if any. Unlike a fund, an index is not managed and does not reflect fees and expenses.
NOTES TO CHARTS:
| 1 | Performance for Class C shares assumes a 1% contingent deferred sales charge (“CDSC”) applied when you sell shares within one year of purchase. |
| 2 | S&P 500® Index is a widely recognized measure of U.S. stock market performance. It is an unmanaged index of 500 common stocks chosen for market size, liquidity, and industry group representation, among other factors. |
| 3 | Russell 1000® Value Index is an unmanaged index that measures the performance of the large-cap value segment of the U.S. equity universe. It includes those Russell 1000® companies with lower price-to-book ratios and lower expected growth values. |
| 4 | Morningstar Fund Averages are the average performance without sales charges of funds with similar investment objectives, as calculated by Morningstar, Inc. |
| 5 | Fund performance has been increased by fee waivers and/or expense reimbursements, if any, without which performance would have been lower. |
| 12
Table of Contents
LOOMIS SAYLES SENIOR FLOATING RATE AND FIXED INCOME FUND
Management Discussion
13 |
Table of Contents
helped its price return, as new issues experienced price appreciation in the secondary market.
In addition, the fund’s bond holdings boosted its yield and helped drive outperformance relative to the benchmark. We continued to focus on bonds with relatively near-term maturities or expected calls (meaning we expect the issuer to retire the debt prior to the bond’s maturity date). We believe this focus is more appropriate in a bank loan portfolio than buying generic high-yield bonds, given the interest-rate sensitivity of bank loan investors.
The fund ended the period with approximately 83% of its assets invested in bank loans and 11% in bonds. The allocation to bank loans and bonds remained relatively stable throughout the period. We did not change the fund’s risk positioning during the period, other than to increase its cash position in May, which corresponded with the only month of negative performance in the bank loan market.
Outlook
With the 2012 election cycle over, the financial markets have been focusing on the management of the U.S. economy and continued uncertainty related to the ongoing fiscal challenges in the U.S. We expect heightened market volatility as Congress discusses solutions to lingering issues.
Technical factors appear to be in relative balance as we approach the end of 2012. The new issue calendar remains robust but we believe it likely will be met with equally robust inflows. S&P’s Leveraged Commentary & Data reports that $15 billion to $20 billion of CLOs are working toward completion by the end of the year. We believe this trend will continue and possibly expand in 2013.
| 14
Table of Contents
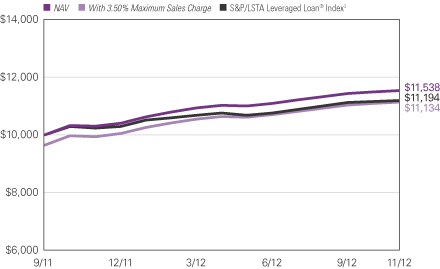
LOOMIS SAYLES SENIOR FLOATING RATE AND FIXED INCOME FUND
Investment Results through November 30, 2012
Growth of $10,000 Investment in Class A Shares5
September 30, 2011 (inception) through November 30, 2012
15 |
Table of Contents
Average Annual Total Returns — November 30, 20125
| 1 Year | Since Inception |
|||||||
| Class A (Inception 9/30/11) | ||||||||
| NAV | 12.02 | % | 13.04 | % | ||||
| With 3.50% Maximum Sales Charge | 8.13 | 9.61 | ||||||
| Class C (Inception 9/30/11) | ||||||||
| NAV | 11.18 | 12.20 | ||||||
| With CDSC2 | 10.18 | 12.20 | ||||||
| Class Y (Inception 9/30/11)1 | ||||||||
| NAV | 12.33 | 13.35 | ||||||
| Comparative Performance | ||||||||
| S&P/LSTA Leveraged Loan® Index3 | 9.36 | 10.17 | ||||||
| Morningstar Bank Loan Fund Avg.4 | 9.49 | 10.33 | ||||||
Past performance does not guarantee future results. The chart and table do not reflect taxes shareholders might owe on any fund distributions or when they redeem their shares. Performance for periods less than one year is cumulative, not annualized. Returns reflect changes in share price and reinvestment of dividends and capital gains, if any. Unlike a fund, an index is not managed and does not reflect fees and expenses.
NOTES TO CHARTS
| 1 | 9/30/11 represents the date Class Y shares were first registered for public sale under the Securities Act of 1933. 9/16/11 represents commencement of operations for Class Y shares for accounting and financial reporting purposes only. |
| 2 | Performance for Class C shares assumes a 1% contingent deferred sales charge (“CDSC”) applied when you sell shares within one year of purchase. |
| 3 | S&P/LSTA Leveraged Loan® Index reflects the market-weighted performance of institutional leveraged loans based upon real-time market weightings, spreads and interest payments. |
| 4 | Morningstar Fund Averages are the average performance without sales charges of funds with similar investment objectives, as calculated by Morningstar, Inc. |
| 5 | Fund performance has been increased by fee waivers and/or expense reimbursements, if any, without which performance would have been lower. |
| 16
Table of Contents
VAUGHAN NELSON SELECT FUND
17 |
Table of Contents
added to returns. MasterCard is a transaction processor and takes no credit risks. We believe that it should continue to benefit from the steady trend away from cash and checks to plastic. While the United States leads this trend, there is great potential overseas, where company results have been outstanding. Shares of Symantec, a leader in storage and security solutions, rose following the fund’s July purchase. Symantec had been undervalued compared to its peers, and we believe that investors are reevaluating the company in light of management changes. Relative to the benchmark, Apple was the main detractor in the technology group. We were slow to appreciate the potential of Apple’s new products and our commitment came late. Although shares weakened toward the end of the period, we are optimistic about Apple’s continued capacity to innovate and grow. Micros Systems, which provides point-of-sale systems and software to hotels, restaurants and retail stores, was also disappointing. Growth seems to have slowed despite the company’s long history of favorable earnings. We sold IBM after a strong run as revenues began to slow, and we eliminated Solera Holdings, which develops software for automobile accident claims, because we believe the slowdown in Europe threatens a key segment of its business.
In the healthcare sector, stock selection aided returns. Valeant Pharmaceuticals, a specialty drug company, continued to grow, chiefly through acquisition. Valeant acquires smaller drug companies that have attractive products but lack distribution capability. HCA shares rose following the fund’s timely purchase during a recent selloff, but a small position tempered gains. Hospital stocks generally rose in anticipation of reductions in their bad debt expense under the new healthcare law. These favorable returns were partially offset by a loss from Endo Health Solutions, which markets branded and generic drugs. Within the consumer staples sector, cigarette maker Altria pulled back. Unit sales slowed and pricing softened, pointing to potentially lower earnings. We sold the stock.
In commercial services, Corrections Corporation, which operates for-profit prisons, responded favorably to news that it might convert to a real estate investment trust and pay out higher dividends. The federal and state governments are finding it more cost-effective to outsource their prison functions, increasing the company’s long-term potential.
Within financials, global insurer XL Group performed well on the strength of solid third quarter results. Claims resulting from Hurricane Sandy appear to be well-managed. Insurance stocks often rally following major disasters in expectation of higher premiums.
Outlook
Economic growth remains on the weak side, but we believe it may improve in 2013 if Washington provides clarity on taxes, budgets and regulations. Better conditions in the housing market are helping to shore up consumer confidence and retail sales appear healthy. Stronger housing trends would also help boost employment. The market does not appear expensive to us; there are many growing companies whose stocks trade at good valuations. We seek those that are growing a little faster than their group but we are careful not to overpay.
| 18
Table of Contents
VAUGHAN NELSON SELECT FUND
Investment Results through November 30, 2012
Total Returns — November 30, 20124
| Since Inception | ||||
| Class A (Inception 6/29/2012) | ||||
| NAV | 5.00 | % | ||
| With 5.75% Maximum Sales Charge | -1.04 | |||
| Class C (Inception 6/29/2012) | ||||
| NAV | 4.70 | |||
| With CDSC1 | 3.70 | |||
| Class Y (Inception 6/29/2012) | ||||
| NAV | 5.10 | |||
| Comparative Performance | ||||
| S&P 500® Index2 | 4.99 | |||
| Morningstar Large Value Fund Avg.3 | 5.33 | |||
Past performance does not guarantee future results. The table does not reflect taxes shareholders might owe on any fund distributions or when they redeem their shares. Performance for periods less than one year is cumulative, not annualized. Returns reflect changes in share price and reinvestment of dividends and capital gains, if any. Unlike a fund, an index is not managed and does not reflect fees and expenses.
NOTES TO CHART
| 1 | Performance for Class C shares assumes a 1% contingent deferred sales charge (“CDSC”) applied when you sell shares within one year of purchase. |
| 2 | S&P 500® Index is a widely recognized U.S. stock market performance. It is an unmanaged index of 500 common stocks chosen for market size, liquidity, and industry group representation, among other factors. |
| 3 | Morningstar Fund Averages are the average performance without sales charges of funds with similar investment objectives, as calculated by Morningstar, Inc. |
| 4 | Fund performance has been increased by fee waivers and/or expense reimbursements, if any, without which performance would have been lower. |
19 |
Table of Contents
ADDITIONAL INFORMATION
The views expressed in this report reflect those of the portfolio managers as of the dates indicated. The managers’ views are subject to change at any time without notice based on changes in market or other conditions. References to specific securities or industries should not be regarded as investment advice. Because the funds are actively managed, there is no assurance that they will continue to invest in the securities or industries mentioned.
PROXY VOTING INFORMATION
A description of the funds’ proxy voting policies and procedures is available without charge, upon request, by calling Natixis Funds at 800-225-5478; on the funds’ website at ngam.natixis.com; and on the Securities and Exchange Commission’s (SEC) website at www.sec.gov. Information regarding how the funds voted proxies relating to portfolio securities during the 12-month period ended June 30, 2012 is available from the funds’ website and the SEC’s website.
QUARTERLY PORTFOLIO SCHEDULES
The funds file a complete schedule of portfolio holdings with the SEC for the first and third quarters of each fiscal year on Form N-Q. The funds’ Forms N-Q is available on the SEC’s website at www.sec.gov and may be reviewed and copied at the SEC’s Public Reference Room in Washington, DC. Information on the operation of the Public Reference Room may be obtained by calling 800-SEC-0330.
ADDITIONAL INDEX INFORMATION
This document may contain references to third party copyrights, indexes, and trademarks, each of which is the property of its respective owner. Such owner is not affiliated with Natixis Global Asset Management or any of its related or affiliated companies (collectively “NGAM”) and does not sponsor, endorse or participate in the provision of any NGAM services, funds or other financial products.
The index information contained herein is derived from third parties and is provided on an “as is” basis. The user of this information assumes the entire risk of use of this information. Each of the third party entities involved in compiling, computing or creating index information, disclaims all warranties (including, without limitation, any warranties of originality, accuracy, completeness, timeliness, non-infringement, merchantability and fitness for a particular purpose) with respect to such information.
| 20
Table of Contents
UNDERSTANDING FUND EXPENSES
As a mutual fund shareholder, you incur different costs: transaction costs, including sales charges (loads) on purchases and contingent deferred sales charges on redemptions and ongoing costs, including management fees, distribution and/or service fees (12b-1 fees), and other fund expenses. Certain exemptions may apply. These costs are described in more detail in the funds’ prospectus. The examples below are intended to help you understand the ongoing costs of investing in the funds and help you compare these with the ongoing costs of investing in other mutual funds.
The first line in the table of each class of fund shares shows the actual account values and actual fund expenses you would have paid on a $1,000 investment in the fund from June 1, 2012 through November 30, 2012 for ASG Growth Markets Fund, Gateway International Fund, Loomis Sayles Capital Income Fund and Loomis Sayles Senior Floating Rate and Fixed Income Fund and from June 29, 2012 through November 30, 2012 for Vaughan Nelson Select Fund. To estimate the expenses you paid over the period, simply divide your account value by $1,000 (for example $8,600 account value divided by $1,000 = 8.60) and multiply the result by the number in the Expenses Paid During Period column as shown below for your class.
The second line in the table for each class of fund shares provides information about hypothetical account values and hypothetical expenses based on the fund’s actual expense ratios and an assumed rate of return of 5% per year before expenses, which is not the fund’s actual return. The hypothetical account values and expenses may not be used to estimate the actual ending account balance or expenses you paid on your investment for the period. You may use this information to compare the ongoing costs of investing in the fund and other funds. To do so, compare this 5% hypothetical example with the 5% hypothetical examples that appear in the shareholder reports of the other funds.
Please note that the expenses shown reflect ongoing costs only, and do not include any transaction costs, such as sales charges. Therefore, the second line in the table of each fund is useful in comparing ongoing costs only, and will not help you determine the relative costs of owning different funds. If transaction costs were included, total costs would be higher.
| ASG GROWTH MARKETS FUND | BEGINNING ACCOUNT VALUE 6/1/2012 |
ENDING ACCOUNT VALUE 11/30/2012 |
EXPENSES PAID DURING PERIOD* 6/1/2012 – 11/30/2012 |
|||||||||
| Class A |
||||||||||||
| Actual |
$1,000.00 | $1,050.90 | $8.87 | |||||||||
| Hypothetical (5% return before expenses) |
$1,000.00 | $1,016.35 | $8.72 | |||||||||
| Class C |
||||||||||||
| Actual |
$1,000.00 | $1,046.60 | $12.64 | |||||||||
| Hypothetical (5% return before expenses) |
$1,000.00 | $1,012.65 | $12.43 | |||||||||
| Class Y |
||||||||||||
| Actual |
$1,000.00 | $1,051.90 | $7.59 | |||||||||
| Hypothetical (5% return before expenses) |
$1,000.00 | $1,017.60 | $7.47 | |||||||||
| * | Expenses are equal to the Fund’s annualized expense ratio (after waiver/reimbursement), including expenses of the Subsidiary (see Note 1 of Notes to Financial Statements) and interest expense: 1.73%, 2.47% and 1.48% for Class A, C and Y, respectively, multiplied by the average account value over the period, multiplied by the number of days in the most recent fiscal half-year, divided by 366 (to reflect the half-year period). |
21 |
Table of Contents
UNDERSTANDING FUND EXPENSES
| GATEWAY INTERNATIONAL FUND | BEGINNING ACCOUNT VALUE 6/1/2012 |
ENDING ACCOUNT VALUE 11/30/2012 |
EXPENSES
PAID DURING PERIOD* 6/1/2012 – 11/30/2012 |
|||||||||
| Class A |
||||||||||||
| Actual |
$1,000.00 | $1,079.40 | $7.02 | |||||||||
| Hypothetical (5% return before expenses) |
$1,000.00 | $1,018.25 | $6.81 | |||||||||
| Class C |
||||||||||||
| Actual |
$1,000.00 | $1,075.10 | $10.89 | |||||||||
| Hypothetical (5% return before expenses) |
$1,000.00 | $1,014.50 | $10.58 | |||||||||
| Class Y |
||||||||||||
| Actual |
$1,000.00 | $1,080.40 | $5.72 | |||||||||
| Hypothetical (5% return before expenses) |
$1,000.00 | $1,019.50 | $5.55 | |||||||||
| * | Expenses are equal to the Fund’s annualized expense ratio (after waiver/reimbursement): 1.35%, 2.10% and 1.10% for Class A, C and Y, respectively, multiplied by the average account value over the period, multiplied by the number of days in the most recent half-year, divided by 366 (to reflect the half-year period). |
| LOOMIS SAYLES CAPITAL INCOME FUND | BEGINNING ACCOUNT VALUE 6/1/2012 |
ENDING ACCOUNT VALUE 11/30/2012 |
EXPENSES
PAID DURING PERIOD* 6/1/2012 – 11/30/2012 |
|||||||||
| Class A |
||||||||||||
| Actual |
$1,000.00 | $1,120.60 | $6.36 | |||||||||
| Hypothetical (5% return before expenses) |
$1,000.00 | $1,019.00 | $6.06 | |||||||||
| Class C |
||||||||||||
| Actual |
$1,000.00 | $1,117.00 | $10.32 | |||||||||
| Hypothetical (5% return before expenses) |
$1,000.00 | $1,015.25 | $9.82 | |||||||||
| Class Y |
||||||||||||
| Actual |
$1,000.00 | $1,122.50 | $5.04 | |||||||||
| Hypothetical (5% return before expenses) |
$1,000.00 | $1,020.25 | $4.80 | |||||||||
| * | Expenses are equal to the Fund’s annualized expense ratio (after waiver/reimbursement): 1.20%, 1.95% and 0.95% for Class A, C and Y, respectively, multiplied by the average account value over the period, multiplied by the number of days in the most recent fiscal half-year, divided by 366 (to reflect the half-year period). |
| 22
Table of Contents
UNDERSTANDING FUND EXPENSES
| LOOMIS SAYLES SENIOR FLOATING RATE AND FIXED INCOME FUND |
BEGINNING ACCOUNT VALUE 6/1/2012 |
ENDING 11/30/2012 |
EXPENSES PAID DURING PERIOD* 6/1/2012 – 11/30/2012 |
|||||||||
| Class A |
||||||||||||
| Actual |
$1,000.00 | $1,048.60 | $5.63 | |||||||||
|
Hypothetical (5% return before expenses) |
$1,000.00 | $1,019.50 | $5.55 | |||||||||
| Class C |
||||||||||||
| Actual |
$1,000.00 | $1,044.40 | $9.46 | |||||||||
| Hypothetical (5% return before expenses) |
$1,000.00 | $1,015.75 | $9.32 | |||||||||
| Class Y |
||||||||||||
| Actual |
$1,000.00 | $1,050.70 | $4.36 | |||||||||
| Hypothetical (5% return before expenses) |
$1,000.00 | $1,020.75 | $4.29 | |||||||||
| * | Expenses are equal to the Fund’s annualized expense ratio (after waiver/reimbursement): 1.10%, 1.85% and 0.85% for Class A, C and Y, respectively, multiplied by the average account value over the period, multiplied by the number of days in the most recent fiscal half-year, divided by 366 (to reflect the half-year period). |
| VAUGHAN NELSON SELECT FUND | BEGINNING ACCOUNT VALUE 6/1/20121 |
ENDING ACCOUNT VALUE 11/30/2012 |
EXPENSES PAID DURING PERIOD 6/1/20121 – 11/30/2012 |
|||||||||
| Class A |
||||||||||||
| Actual |
$1,000.00 | $1,050.00 | $6.04 | 1 | ||||||||
|
Hypothetical (5% return before expenses) |
$1,000.00 | $1,018.00 | $7.06 | * | ||||||||
| Class C |
||||||||||||
| Actual |
$1,000.00 | $1,047.00 | $9.26 | 1 | ||||||||
| Hypothetical (5% return before expenses) |
$1,000.00 | $1,014.25 | $10.83 | * | ||||||||
| Class Y |
||||||||||||
| Actual |
$1,000.00 | $1,051.00 | $4.96 | 1 | ||||||||
| Hypothetical (5% return before expenses) |
$1,000.00 | $1,019.25 | $5.81 | * | ||||||||
| * | Hypothetical expenses are equal to the Fund’s annualized expense ratio (after waiver/reimbursement): 1.40%, 2.15% and 1.15% for Class A, C and Y, respectively, multiplied by the average account value over the period, multiplied by the number of days in the most recent half-year (183), divided by 366 (to reflect the half-year period). |
| 1 | Fund commenced operations on June 29, 2012. Actual expenses are equal to the Fund’s annualized expense ratio (after waiver/reimbursement): 1.40%, 2.15%, and 1.15% for Class A, C and Y, respectively, multiplied by the average account value over the period, multiplied by the number of days in the most recent fiscal period (154), divided by 366 (to reflect the partial period). |
23 |
Table of Contents
BOARD APPROVAL OF THE INITIAL ADVISORY AND SUB-ADVISORY AGREEMENTS FOR VAUGHAN NELSON SELECT FUND
The Investment Company Act of 1940, as amended (the “1940 Act”), requires that both the full Board of Trustees of the Trust and a majority of the Trustees who are not “interested persons” (as defined in the 1940 Act) of the Trust (the “Independent Trustees”), voting separately, initially approve for a two-year term any new investment advisory and sub-advisory agreements for a registered investment company, including a newly formed fund such as the Vaughan Nelson Select Fund (the “Fund”). The Trustees, including the Independent Trustees, unanimously approved the proposed investment advisory and sub-advisory agreements (together, the “Agreements”) for the Fund at an in-person meeting held on June 14, 2012.
In connection with this review, Fund management and other representatives of the Fund’s adviser, NGAM Advisors, L.P. (“NGAM Advisors”) and sub-adviser, Vaughan Nelson Investment Management, L.P. (“Vaughan Nelson,” and, together with NGAM Advisors, the “Advisors”), distributed to the Trustees materials including, among other items, (i) information on the proposed advisory fee and other expenses to be charged to the Fund, including information comparing the Fund’s expected expenses to those of peer groups of funds and information on fees charged to other accounts advised or sub-advised by Vaughan Nelson and the proposed expense cap, (ii) the Fund’s investment objective and strategies, (iii) the size, education and experience of the proposed portfolio managers and the investment strategies proposed to be used in managing the Fund, (iv) proposed arrangements for the distribution of the Fund’s shares, (v) the procedures proposed to be employed to determine the value of the Fund’s assets, (vi) the Fund’s investment policies and restrictions, policies on personal securities transactions and other compliance policies, (vii) information about Vaughan Nelson’s performance, and (viii) the general economic outlook with particular emphasis on the mutual fund industry. The Trustees also considered the fact that they oversee other funds advised or sub-advised by the Advisers as well as information about the Advisers they had received in connection with their oversight of those other funds. Because the Fund is newly formed and had not commenced operations at the time of the Trustees’ review, certain information, including data relating to Fund performance, was not available, and therefore could not be distributed to the Trustees. Throughout the process, the Trustees were afforded the opportunity to ask questions of, and request additional materials from, the Advisers.
In considering whether to initially approve the Agreements, the Board of Trustees, including the Independent Trustees, did not identify any single factor as determinative. Individual Trustees may have evaluated the information presented differently from one another, giving weight to various factors. Matters considered by the Trustees, including the Independent Trustees, in connection with their approval of the Agreements included, but were not limited to, the factors listed below:
The nature, extent and quality of the services to be provided to the Fund under the Agreements. The Trustees considered the nature, extent and quality of the services to be provided by the Advisers and their respective affiliates to the Fund, and the resources to be dedicated to the Fund by the Advisers and their respective affiliates. The Trustees considered their
| 24
Table of Contents
experience with other funds advised or sub-advised by the Advisers, as well as the fact that the Advisers are affiliates. In this regard, the Trustees considered not only the advisory and sub-advisory services proposed to be provided by the Advisers to the Fund, but also the monitoring and administrative services proposed to be provided by NGAM Advisors and its affiliates to the Fund.
The Trustees also considered the benefits to shareholders of investing in a mutual fund that is part of a family of funds that offers shareholders the right to exchange shares of one type of fund for shares of another type of fund, and provides a variety of fund and shareholder services.
After reviewing these and related factors, the Trustees concluded, within the context of their overall conclusions regarding the Agreements, that the scope of the services to be provided to the Fund under the Agreements seemed consistent with the Fund’s operational requirements, and that the Advisers had the capabilities, resources and personnel necessary to provide the advisory and sub-advisory services that would be required by the Fund. The Trustees determined that the nature, extent and quality of services proposed to be provided under the Agreements supported approval of the Agreements.
Investment performance of the Fund and the Advisers. Because the Fund had not yet commenced operations, performance information for the Fund was not considered; however, the Board considered the performance of other funds and accounts managed by Vaughan Nelson, and also reviewed simulated performance of an account managed in accordance with the Fund’s proposed strategies. Based on this and other information, the Trustees concluded, within the context of their overall conclusions regarding the Agreements, that the Advisers’ performance records and/or other relevant factors supported approval of the Agreements.
The costs of the services to be provided by the Advisers and their affiliates from their respective relationships with the Fund. Although the Fund had not yet commenced operations at the time of the Trustees’ review of the Agreements, the Trustees reviewed information comparing the proposed advisory and sub-advisory fees and estimated total expenses of the Fund’s share classes with the fees and expenses of comparable share classes of comparable funds identified by the Advisers, and with the fees and expenses of institutional accounts managed by Vaughan Nelson, as well as information about differences in such fees and the reasons for any such differences. In evaluating the fees charged to such comparable accounts, the Trustees considered, among other things, management’s representations about the differences between managing mutual funds as compared to other types of accounts, including the additional resources required to effectively manage mutual fund assets. In evaluating the Fund’s proposed advisory and sub-advisory fees, the Trustees also took into account the demands, complexity and quality of the investment management of the Fund and the need for the Advisers to offer competitive compensation. The Trustees also noted that the Fund would have an expense cap in place. In addition, the Trustees considered information regarding the administrative and distribution fees to be paid by the Fund to the Advisers’ affiliates.
Because the Fund had not yet commenced operations, historical profitability information with respect to the Fund was not considered. However, the Trustees noted the information
25 |
Table of Contents
provided in court cases in which adviser compensation or profitability were issues, the estimated expense level of the Fund, and that the Fund would be subject to an expense cap.
After reviewing these and related factors, the Trustees concluded, within the context of their overall conclusions regarding the Agreements, that the advisory and sub-advisory fees proposed to be charged to the Fund were fair and reasonable, and supported the approval of the Agreements.
Economies of scale. The Trustees considered the extent to which the Advisers may realize economies of scale or other efficiencies in managing the Fund, and whether those economies could be shared with the Fund through breakpoints in the advisory and sub-advisory fees or other means, such as expense waivers or caps. The Trustees noted that the Fund would be subject to an expense cap. After reviewing these and related factors, the Trustees concluded, within the context of their overall conclusions regarding the Agreements, that the extent to which economies of scale might be shared with the Fund supported the approval of the Agreements.
The Trustees also considered other factors, which included but were not limited to the following: the compliance-related resources the Advisers and their respective affiliates would provide to the Fund and the potential so-called “fallout benefits” to the Advisers, such as the engagement of affiliates of the Advisers to provide distribution and administrative services to the Fund, and the benefits of research made available to the Advisers by reason of brokerage commissions (if any) generated by the Fund’s securities transactions. The Trustees also considered the fact that NGAM Advisors’ parent company would benefit from the retention of affiliated advisers. The Trustees considered the possible conflicts of interest associated with these fallout and other benefits, and the reporting, disclosure and other processes in place to disclose and monitor such possible conflicts of interest.
Based on their evaluation of all factors that they deemed to be material, including those factors described above, and assisted by the advice of independent counsel, the Trustees, including the Independent Trustees, concluded that the Agreements should be approved.
| 26
Table of Contents
Consolidated Portfolio of Investments – as of November 30, 2012
ASG Growth Markets Fund
| Shares | Description | Value (†) | ||||||
| Common Stocks — 65.1% of Net Assets | ||||||||
| Brazil — 8.7% | ||||||||
| 11,300 | Banco Bradesco S.A., Sponsored Preference ADR(b) | $ | 190,292 | |||||
| 3,100 | Banco do Brasil S.A., Sponsored ADR | 32,550 | ||||||
| 4,659 | Banco Santander Brasil S.A., ADR | 31,169 | ||||||
| 6,700 | BM&FBovespa S.A. | 40,260 | ||||||
| 2,600 | BR Malls Participacoes S.A. | 33,400 | ||||||
| 1,500 | BR Properties S.A. | 17,690 | ||||||
| 1,500 | Braskem S.A., Sponsored ADR | 19,530 | ||||||
| 3,175 | BRF - Brasil Foods S.A., ADR | 58,261 | ||||||
| 4,400 | CCR S.A. | 37,806 | ||||||
| 500 | Cia Brasileira de Distribuicao Grupo Pao de Acucar, Preference ADR | 21,640 | ||||||
| 4,620 | Cia de Bebidas das Americas, Preference ADR(b) | 192,238 | ||||||
| 600 | Cia de Saneamento Basico do Estado de Sao Paulo, ADR | 48,822 | ||||||
| 900 | Cia de Saneamento de Minas Gerais-COPASA | 18,954 | ||||||
| 4,125 | Cia Energetica de Minas Gerais, Sponsored Preference ADR | 50,490 | ||||||
| 900 | Cia Hering | 20,150 | ||||||
| 1,000 | Cia Paranaense de Energia, Sponsored Preference ADR | 13,450 | ||||||
| 1,440 | Cielo S.A., Sponsored ADR | 38,909 | ||||||
| 1,200 | Cosan S.A. Industria e Comercio | 22,065 | ||||||
| 700 | CPFL Energia S.A., ADR | 15,288 | ||||||
| 2,100 | Duratex S.A. | 14,496 | ||||||
| 1,600 | EcoRodovias Infraestrutura e Logistica S.A. | 12,774 | ||||||
| 2,400 | EDP - Energias do Brasil S.A. | 13,613 | ||||||
| 895 | Embraer S.A., ADR | 22,312 | ||||||
| 2,500 | Fibria Celulose S.A., Sponsored ADR(c) | 25,275 | ||||||
| 4,100 | Gerdau S.A., Sponsored Preference ADR | 34,809 | ||||||
| 3,400 | Hypermarcas S.A.(c) | 24,504 | ||||||
| 12,900 | Itau Unibanco Holding S.A., Preference ADR(b) | 195,435 | ||||||
| 4,200 | JBS S.A.(c) | 10,634 | ||||||
| 1,200 | Localiza Rent a Car S.A. | 19,964 | ||||||
| 700 | Lojas Renner S.A. | 25,601 | ||||||
| 600 | Multiplan Empreendimentos Imobiliarios S.A. | 16,567 | ||||||
| 900 | Multiplus S.A. | 20,849 | ||||||
| 900 | Natura Cosmeticos S.A. | 23,823 | ||||||
| 2,300 | Obrascon Huarte Lain Brasil S.A. | 20,451 | ||||||
| 5,100 | Oi S.A., ADR | 19,329 | ||||||
| 7,423 | Petroleo Brasileiro S.A., ADR(b) | 133,391 | ||||||
| 11,000 | Petroleo Brasileiro S.A., Sponsored Preference ADR(b) | 193,050 | ||||||
| 3,400 | Raia Drogasil S.A. | 33,415 | ||||||
| 2,700 | Souza Cruz S.A. | 39,259 | ||||||
| 1,065 | Telefonica Brasil S.A., Preference ADR | 23,366 | ||||||
| 1,794 | Tim Participacoes S.A., ADR | 31,808 | ||||||
| 1,200 | Totvs S.A. | 22,458 | ||||||
| 3,000 | Ultrapar Participacoes S.A., Sponsored ADR | 61,680 | ||||||
| 6,738 | Vale S.A., Sponsored ADR(b) | 117,443 | ||||||
| 10,821 | Vale S.A., Sponsored Preference ADR(b) | 184,931 | ||||||
|
|
|
|||||||
| 2,244,201 | ||||||||
|
|
|
|||||||
See accompanying notes to financial statements.
27 |
Table of Contents
Consolidated Portfolio of Investments – as of November 30, 2012
ASG Growth Markets Fund – (continued)
| Shares | Description | Value (†) | ||||||
| Chile — 0.9% | ||||||||
| 325 | Banco de Chile, ADR | $ | 29,321 | |||||
| 1,298 | Banco Santander Chile, ADR | 34,955 | ||||||
| 600 | Cia Cervecerias Unidas S.A., ADR | 44,040 | ||||||
| 1,400 | Corpbanca S.A., ADR | 27,272 | ||||||
| 900 | Empresa Nacional de Electricidad S.A., Sponsored ADR | 40,428 | ||||||
| 2,000 | Enersis S.A., Sponsored ADR | 33,900 | ||||||
| 306 | Sociedad Quimica y Minera de Chile S.A., Sponsored ADR | 17,320 | ||||||
|
|
|
|||||||
| 227,236 | ||||||||
|
|
|
|||||||
| China — 16.3% | ||||||||
| 22,000 | Agile Property Holdings Ltd. | 29,625 | ||||||
| 104,000 | Agricultural Bank of China Ltd., Class H | 45,739 | ||||||
| 450,000 | Bank of China Ltd., Class H(b) | 189,800 | ||||||
| 37,000 | Bank of Communications Co. Ltd., Class H | 26,951 | ||||||
| 58,000 | Beijing Capital International Airport Co. Ltd., Class H | 41,530 | ||||||
| 16,000 | Belle International Holdings Ltd. | 33,596 | ||||||
| 24,000 | China BlueChemical Ltd., Class H | 14,977 | ||||||
| 63,000 | China Citic Bank Corp. Ltd., Class H | 32,329 | ||||||
| 39,000 | China Communications Construction Co. Ltd., Class H | 35,505 | ||||||
| 44,000 | China Communications Services Corp. Ltd., Class H | 24,922 | ||||||
| 432,000 | China Construction Bank Corp., Class H(b) | 331,012 | ||||||
| 40,000 | China Gas Holdings Ltd. | 28,805 | ||||||
| 3,297 | China Life Insurance Co. Ltd., ADR | 145,530 | ||||||
| 10,000 | China Mengniu Dairy Co. Ltd. | 28,060 | ||||||
| 20,000 | China Merchants Bank Co. Ltd., Class H | 38,212 | ||||||
| 55,000 | China Minsheng Banking Corp. Ltd., Class H | 54,049 | ||||||
| 35,000 | China Mobile Ltd.(b) | 398,661 | ||||||
| 12,000 | China National Building Material Co. Ltd., Class H | 15,631 | ||||||
| 14,000 | China Oilfield Services Ltd., Class H | 27,879 | ||||||
| 24,000 | China Overseas Land & Investment Ltd. | 70,733 | ||||||
| 1,003 | China Petroleum & Chemical Corp., ADR(b) | 106,218 | ||||||
| 28,000 | China Railway Construction Corp. Ltd., Class H | 31,237 | ||||||
| 57,000 | China Railway Group Ltd., Class H | 33,080 | ||||||
| 10,000 | China Resources Enterprise Ltd. | 35,664 | ||||||
| 12,000 | China Resources Gas Group Ltd. | 25,691 | ||||||
| 10,000 | China Resources Land Ltd. | 26,827 | ||||||
| 10,000 | China Resources Power Holdings Co. Ltd. | 22,319 | ||||||
| 18,500 | China Shenhua Energy Co. Ltd., Class H | 75,749 | ||||||
| 47,000 | China Shipping Container Lines Co. Ltd., Class H(c) | 12,367 | ||||||
| 12,000 | China State Construction International Holdings Ltd. | 15,077 | ||||||
| 929 | China Telecom Corp. Ltd., ADR | 50,473 | ||||||
| 20,000 | China Unicom Hong Kong Ltd. | 31,120 | ||||||
| 9,500 | China Vanke Co. Ltd., Class B | 14,729 | ||||||
| 49,600 | China Zhongwang Holdings Ltd.(c) | 17,404 | ||||||
| 50,000 | Chongqing Rural Commercial Bank, Class H | 22,954 | ||||||
| 1,151 | CNOOC Ltd., Sponsored ADR(b) | 245,347 | ||||||
| 53,125 | Country Garden Holdings Co. Ltd.(c) | 25,488 | ||||||
| 26,000 | CSR Corp. Ltd., Class H | 21,963 | ||||||
| 38,000 | Datang International Power Generation Co. Ltd., Class H | 13,261 | ||||||
See accompanying notes to financial statements.
| 28
Table of Contents
Consolidated Portfolio of Investments – as of November 30, 2012
ASG Growth Markets Fund – (continued)
| Shares | Description | Value (†) | ||||||
| China — continued | ||||||||
| 26,000 | Dongfeng Motor Group Co. Ltd., Class H | $ | 36,527 | |||||
| 6,000 | ENN Energy Holdings Ltd. | 26,998 | ||||||
| 68,000 | Evergrande Real Estate Group Ltd. | 33,937 | ||||||
| 84,000 | Franshion Properties China Ltd. | 28,825 | ||||||
| 35,000 | Geely Automobile Holdings Ltd. | 16,476 | ||||||
| 15,000 | Great Wall Motor Co. Ltd., Class H | 49,439 | ||||||
| 54,000 | Guangdong Investment Ltd. | 43,929 | ||||||
| 25,200 | Guangzhou R&F Properties Co. Ltd., Class H | 42,970 | ||||||
| 17,000 | Haier Electronics Group Co. Ltd.(c) | 23,374 | ||||||
| 2,500 | Hengan International Group Co. Ltd. | 22,656 | ||||||
| 33,000 | Huabao International Holdings Ltd. | 14,891 | ||||||
| 951 | Huaneng Power International, Inc., ADR | 32,420 | ||||||
| 385,000 | Industrial & Commercial Bank of China Ltd., Class H(b) | 259,672 | ||||||
| 7,000 | Inner Mongolia Yitai Coal Co., Class B | 38,872 | ||||||
| 22,000 | Jiangsu Expressway Co. Ltd., Class H | 19,672 | ||||||
| 10,000 | Jiangxi Copper Co. Ltd., Class H | 25,620 | ||||||
| 9,000 | Kingboard Chemical Holdings Ltd. | 26,697 | ||||||
| 14,000 | Kunlun Energy Co. Ltd. | 28,496 | ||||||
| 3,800 | Lenovo Group Ltd., ADR | 71,896 | ||||||
| 16,000 | Longfor Properties Co. Ltd. | 30,748 | ||||||
| 1,272 | PetroChina Co. Ltd., ADR(b) | 169,367 | ||||||
| 5,500 | Ping An Insurance (Group) Co. of China Ltd., Class H | 41,499 | ||||||
| 53,000 | Poly Hong Kong Investments Ltd.(c) | 36,638 | ||||||
| 8,000 | Shandong Weigao Group Medical Polymer Co. Ltd., Class H | 8,324 | ||||||
| 15,600 | Shanghai Pharmaceuticals Holding Co. Ltd., Class H | 29,182 | ||||||
| 25,500 | Shimao Property Holdings Ltd. | 51,631 | ||||||
| 56,000 | Shougang Fushan Resources Group Ltd. | 20,354 | ||||||
| 66,500 | Shui On Land Ltd. | 33,109 | ||||||
| 34,500 | Sino-Ocean Land Holdings Ltd. | 25,808 | ||||||
| 4,800 | Sinopharm Group Co. Ltd., Class H | 14,829 | ||||||
| 47,000 | Soho China Ltd. | 35,411 | ||||||
| 11,000 | Sun Art Retail Group Ltd. | 16,861 | ||||||
| 5,500 | Tencent Holdings Ltd. | 178,994 | ||||||
| 24,000 | Uni-President China Holdings Ltd. | 31,265 | ||||||
| 33,000 | Want Want China Holdings Ltd. | 48,210 | ||||||
| 6,000 | Weichai Power Co. Ltd., Class H | 22,569 | ||||||
| 1,715 | Yanzhou Coal Mining Co. Ltd., Sponsored ADR | 26,359 | ||||||
| 164,000 | Yuexiu Property Co. Ltd. | 52,881 | ||||||
| 28,000 | Zhejiang Expressway Co. Ltd., Class H | 21,373 | ||||||
| 5,000 | Zhuzhou CSR Times Electric Co. Ltd., Class H | 15,247 | ||||||
| 26,000 | Zijin Mining Group Co. Ltd., Class H | 10,477 | ||||||
|
|
|
|||||||
| 4,205,017 | ||||||||
|
|
|
|||||||
| Colombia — 0.7% | ||||||||
| 800 | BanColombia S.A., Sponsored Preference ADR | 51,416 | ||||||
| 2,116 | Ecopetrol S.A., Sponsored ADR | 123,024 | ||||||
|
|
|
|||||||
| 174,440 | ||||||||
|
|
|
|||||||
See accompanying notes to financial statements.
29 |
Table of Contents
Consolidated Portfolio of Investments – as of November 30, 2012
ASG Growth Markets Fund – (continued)
| Shares | Description | Value (†) | ||||||
| Egypt — 0.3% | ||||||||
| 6,664 | Commercial International Bank Egypt S.A.E., GDR | $ | 34,646 | |||||
| 474 | Orascom Construction Industries, GDR(c) | 17,717 | ||||||
| 13,295 | Orascom Telecom Holding S.A.E., GDR(c) | 38,177 | ||||||
|
|
|
|||||||
| 90,540 | ||||||||
|
|
|
|||||||
| India — 1.8% | ||||||||
| 1,591 | Axis Bank Ltd., GDR | 39,168 | ||||||
| 3,058 | HDFC Bank Ltd., ADR | 128,803 | ||||||
| 1,410 | ICICI Bank Ltd., Sponsored ADR | 57,796 | ||||||
| 2,413 | Infosys Ltd., Sponsored ADR(b) | 107,258 | ||||||
| 440 | Larsen & Toubro Ltd., GDR | 13,553 | ||||||
| 1,347 | Mahindra & Mahindra Ltd., Sponsored GDR | 23,168 | ||||||
| 396 | State Bank of India, Sponsored GDR | 32,511 | ||||||
| 2,160 | Tata Motors Ltd., Sponsored ADR | 54,151 | ||||||
|
|
|
|||||||
| 456,408 | ||||||||
|
|
|
|||||||
| Indonesia — 2.2% | ||||||||
| 99,000 | Astra International Tbk PT | 74,718 | ||||||
| 47,500 | Bank Central Asia Tbk PT | 43,541 | ||||||
| 31,000 | Bank Danamon Indonesia Tbk PT | 17,450 | ||||||
| 57,000 | Bank Mandiri Persero Tbk PT | 48,972 | ||||||
| 87,000 | Bank Negara Indonesia Persero Tbk PT | 33,528 | ||||||
| 80,000 | Bank Rakyat Indonesia Persero Tbk PT | 58,711 | ||||||
| 12,000 | Indocement Tunggal Prakarsa Tbk PT | 29,060 | ||||||
| 39,500 | Indofood Sukses Makmur Tbk PT | 24,085 | ||||||
| 41,500 | Indosat Tbk PT | 23,983 | ||||||
| 40,500 | Jasa Marga Persero Tbk PT | 24,061 | ||||||
| 135,000 | Kalbe Farma Tbk PT | 14,490 | ||||||
| 49,000 | Perusahaan Gas Negara Persero Tbk PT | 23,102 | ||||||
| 16,500 | Semen Gresik Persero Tbk PT | 25,429 | ||||||
| 9,000 | Tambang Batubara Bukit Asam Persero Tbk PT | 13,113 | ||||||
| 1,691 | Telekomunikasi Indonesia Persero Tbk PT, Sponsored ADR | 64,326 | ||||||
| 13,000 | Unilever Indonesia Tbk PT | 35,697 | ||||||
| 13,000 | United Tractors Tbk PT | 23,061 | ||||||
|
|
|
|||||||
| 577,327 | ||||||||
|
|
|
|||||||
| Korea — 11.4% | ||||||||
| 44 | AMOREPACIFIC Group | 19,705 | ||||||
| 177 | CJ Corp. | 17,587 | ||||||
| 331 | Daelim Industrial Co. Ltd. | 24,145 | ||||||
| 380 | Daewoo International Corp. | 14,025 | ||||||
| 470 | Dongbu Insurance Co. Ltd. | 20,206 | ||||||
| 115 | E-Mart Co. Ltd. | 23,187 | ||||||
| 1,060 | Hanwha Chem Corp. | 16,355 | ||||||
| 810 | Hanwha Corp. | 23,847 | ||||||
| 100 | Honam Petrochemical Corp. | 19,819 | ||||||
| 308 | Hyosung Corp. | 19,333 | ||||||
| 75 | Hyundai Glovis Co. Ltd. | 16,342 | ||||||
| 116 | Hyundai Heavy Industries Co. Ltd. | 22,656 | ||||||
See accompanying notes to financial statements.
| 30
Table of Contents
Consolidated Portfolio of Investments – as of November 30, 2012
ASG Growth Markets Fund – (continued)
| Shares | Description | Value (†) | ||||||
| Korea — continued | ||||||||
| 610 | Hyundai Hysco Co. Ltd. | $ | 25,424 | |||||
| 680 | Hyundai Marine & Fire Insurance Co. Ltd. | 21,001 | ||||||
| 336 | Hyundai Mobis | 88,704 | ||||||
| 917 | Hyundai Motor Co.(b) | 191,080 | ||||||
| 1,436 | Hyundai Motor Co., GDR | 47,503 | ||||||
| 2,670 | Hyundai Securities Co. | 20,141 | ||||||
| 133 | Hyundai Wia Corp. | 22,380 | ||||||
| 1,970 | Industrial Bank of Korea | 20,942 | ||||||
| 1,502 | KB Financial Group, Inc., ADR | 49,371 | ||||||
| 51 | KCC Corp. | 13,483 | ||||||
| 1,370 | Kia Motors Corp. | 78,285 | ||||||
| 2,531 | Korea Electric Power Corp., Sponsored ADR(c) | 31,055 | ||||||
| 5,260 | Korea Exchange Bank(c) | 35,448 | ||||||
| 610 | Korea Gas Corp. | 44,147 | ||||||
| 900 | Korea Investment Holdings Co. Ltd. | 32,747 | ||||||
| 3,370 | Korea Life Insurance Co. Ltd. | 23,432 | ||||||
| 84 | Korea Zinc Co. Ltd. | 33,859 | ||||||
| 475 | Korean Air Lines Co. Ltd.(c) | 19,731 | ||||||
| 645 | KT&G Corp. | 50,997 | ||||||
| 170 | Kumho Petro Chemical Co. Ltd. | 17,601 | ||||||
| 153 | LG Chem Ltd. | 44,134 | ||||||
| 390 | LG Corp. | 23,445 | ||||||
| 2,977 | LG Display Co. Ltd., ADR(c) | 47,275 | ||||||
| 576 | LG Electronics, Inc. | 40,673 | ||||||
| 71 | LG Household & Health Care Ltd. | 42,324 | ||||||
| 18 | Lotte Confectionery Co. Ltd. | 24,386 | ||||||
| 81 | Lotte Shopping Co. Ltd. | 26,803 | ||||||
| 108 | LS Corp. | 9,426 | ||||||
| 222 | LS Industrial Systems Co. Ltd. | 14,978 | ||||||
| 198 | NHN Corp. | 46,081 | ||||||
| 39 | Orion Corp. | 40,465 | ||||||
| 1,395 | POSCO, ADR | 103,774 | ||||||
| 294 | S1 Corp. | 18,620 | ||||||
| 454 | Samsung C&T Corp. | 24,929 | ||||||
| 580 | Samsung Card Co. | 19,474 | ||||||
| 327 | Samsung Electro-Mechanics Co. Ltd. | 31,899 | ||||||
| 1,221 | Samsung Electronics Co. Ltd., GDR(b) | 801,596 | ||||||
| 195 | Samsung Electronics Co. Ltd., Preference GDR | 74,793 | ||||||
| 221 | Samsung Fire & Marine Insurance Co. Ltd. | 44,643 | ||||||
| 1,230 | Samsung Heavy Industries Co. Ltd. | 41,490 | ||||||
| 328 | Samsung Life Insurance Co. Ltd. | 28,171 | ||||||
| 157 | Samsung SDI Co. Ltd. | 22,575 | ||||||
| 2,648 | Shinhan Financial Group Co. Ltd., ADR | 84,842 | ||||||
| 210 | SK Holdings Co. Ltd. | 34,853 | ||||||
| 1,480 | SK Hynix, Inc.(c) | 33,414 | ||||||
| 196 | SK Innovation Co. Ltd. | 30,032 | ||||||
| 2,940 | SK Networks Co. Ltd. | 22,467 | ||||||
| 1,900 | SK Telecom Co. Ltd., ADR | 29,013 | ||||||
See accompanying notes to financial statements.
31 |
Table of Contents
Consolidated Portfolio of Investments – as of November 30, 2012
ASG Growth Markets Fund – (continued)
| Shares | Description | Value (†) | ||||||
| Korea — continued | ||||||||
| 1,520 | Woori Investment & Securities Co. Ltd. | $ | 14,965 | |||||
| 123 | Yuhan Corp. | 19,257 | ||||||
|
|
|
|||||||
| 2,945,335 | ||||||||
|
|
|
|||||||
| Malaysia — 3.0% | ||||||||
| 16,600 | Alliance Financial Group Bhd | 22,383 | ||||||
| 9,500 | AMMB Holdings Bhd | 19,930 | ||||||
| 21,700 | Axiata Group Bhd | 42,249 | ||||||
| 91,600 | Berjaya Corp. Bhd | 16,554 | ||||||
| 800 | British American Tobacco Malaysia Bhd | 13,996 | ||||||
| 16,500 | CIMB Group Holdings Bhd | 40,540 | ||||||
| 29,000 | DiGi.Com Bhd | 46,055 | ||||||
| 8,300 | Genting Bhd | 24,562 | ||||||
| 23,200 | Genting Malaysia Bhd | 26,086 | ||||||
| 3,200 | Hong Leong Bank Bhd | 15,434 | ||||||
| 6,700 | Hong Leong Financial Group Bhd | 28,112 | ||||||
| 12,400 | IJM Corp. Bhd | 20,185 | ||||||
| 4,700 | Lafarge Malayan Cement Bhd | 14,800 | ||||||
| 19,200 | Malayan Banking Bhd | 57,155 | ||||||
| 15,100 | Maxis Bhd | 31,932 | ||||||
| 25,500 | MMC Corp. Bhd | 22,517 | ||||||
| 9,800 | Parkson Holdings Bhd | 14,600 | ||||||
| 3,600 | Petronas Dagangan Bhd | 27,366 | ||||||
| 5,700 | Petronas Gas Bhd | 34,488 | ||||||
| 3,100 | Public Bank Bhd | 15,848 | ||||||
| 8,100 | RHB Capital Bhd | 19,978 | ||||||
| 17,600 | Sime Darby Bhd | 51,906 | ||||||
| 18,800 | Telekom Malaysia Bhd | 33,825 | ||||||
| 15,700 | Tenaga Nasional Bhd | 35,817 | ||||||
| 12,300 | UMW Holdings Bhd | 42,960 | ||||||
| 77,546 | YTL Corp. Bhd | 45,094 | ||||||
| 28,700 | YTL Power International Bhd | 14,905 | ||||||
|
|
|
|||||||
| 779,277 | ||||||||
|
|
|
|||||||
| Mexico — 3.7% | ||||||||
| 29,000 | Alfa SAB de CV, Class A | 60,384 | ||||||
| 10,967 | America Movil SAB de CV, Series L, ADR(b) | 258,711 | ||||||
| 3,400 | Arca Continental SAB de CV | 24,448 | ||||||
| 9,362 | Cemex SAB de CV, Sponsored ADR(c) | 83,322 | ||||||
| 352 | Coca-Cola Femsa SAB de CV, Sponsored ADR | 49,660 | ||||||
| 1,400 | Fomento Economico Mexicano SAB de CV, Sponsored ADR | 137,312 | ||||||
| 500 | Grupo Aeroportuario del Pacifico SAB de CV, ADR | 25,510 | ||||||
| 8,300 | Grupo Bimbo SAB de CV, Series A | 19,541 | ||||||
| 4,800 | Grupo Carso SAB de CV, Series A1 | 19,852 | ||||||
| 11,400 | Grupo Financiero Banorte SAB de CV, Class O | 65,059 | ||||||
| 5,300 | Grupo Financiero Inbursa SAB de CV, Class O | 14,675 | ||||||
| 8,131 | Grupo Mexico SAB de CV, Series B | 26,719 | ||||||
| 3,700 | Grupo Modelo SAB de CV, Series C | 33,079 | ||||||
| 2,300 | Grupo Televisa SAB, Sponsored ADR | 54,441 | ||||||
See accompanying notes to financial statements.
| 32
Table of Contents
Consolidated Portfolio of Investments – as of November 30, 2012
ASG Growth Markets Fund – (continued)
| Shares | Description | Value (†) | ||||||
| Mexico — continued | ||||||||
| 3,700 | Mexichem SAB de CV | $ | 19,167 | |||||
| 2,464 | Wal-Mart de Mexico SAB de CV, Series V, Sponsored ADR | 77,052 | ||||||
|
|
|
|||||||
| 968,932 | ||||||||
|
|
|
|||||||
| Peru — 0.2% | ||||||||
| 334 | Credicorp Ltd. | 46,727 | ||||||
|
|
|
|||||||
| Philippines — 0.2% | ||||||||
| 700 | Philippine Long Distance Telephone Co., Sponsored ADR | 43,554 | ||||||
|
|
|
|||||||
| Russia — 4.3% | ||||||||
| 30,356 | Gazprom OAO, Sponsored ADR(b) | 270,221 | ||||||
| 3,124 | Lukoil OAO, Sponsored ADR(b)(c) | 196,872 | ||||||
| 1,209 | Magnit OJSC, Sponsored GDR | 42,727 | ||||||
| 2,525 | Mobile Telesystems OJSC, Sponsored ADR | 44,011 | ||||||
| 416 | NovaTek OAO, Sponsored GDR | 45,697 | ||||||
| 9,210 | Rosneft Oil Co., GDR(c) | 71,972 | ||||||
| 1,192 | Rostelecom OJSC, Sponsored ADR(c) | 24,687 | ||||||
| 12,521 | Sberbank of Russia, Sponsored ADR(b) | 148,433 | ||||||
| 6,006 | Surgutneftegas OJSC, Sponsored ADR | 50,685 | ||||||
| 11,284 | Surgutneftegas OJSC, Sponsored Preference ADR | 70,525 | ||||||
| 2,069 | Tatneft, Sponsored ADR | 82,030 | ||||||
| 1,088 | TMK OAO, GDR(c) | 16,746 | ||||||
| 937 | Uralkali OJSC, Sponsored GDR | 34,762 | ||||||
| 7,026 | VTB Bank OJSC, GDR | 23,449 | ||||||
|
|
|
|||||||
| 1,122,817 | ||||||||
|
|
|
|||||||
| South Africa — 5.8% | ||||||||
| 1,472 | ABSA Group Ltd. | 23,502 | ||||||
| 2,488 | Anglo American Platinum Ltd., ADR | 18,103 | ||||||
| 1,227 | AngloGold Ashanti Ltd., Sponsored ADR | 38,000 | ||||||
| 1,733 | Aspen Pharmacare Holdings Ltd.(c) | 30,489 | ||||||
| 352 | Assore Ltd. | 15,112 | ||||||
| 3,740 | Barloworld Ltd. | 30,601 | ||||||
| 1,612 | Bidvest Group Ltd. | 38,057 | ||||||
| 3,550 | Discovery Holdings Ltd. | 22,281 | ||||||
| 26,779 | FirstRand Ltd. | 87,428 | ||||||
| 2,974 | Gold Fields Ltd., Sponsored ADR | 36,521 | ||||||
| 8,104 | Growthpoint Properties Ltd. | 22,361 | ||||||
| 2,424 | Impala Platinum Holdings Ltd., Sponsored ADR | 39,390 | ||||||
| 2,485 | Imperial Holdings Ltd. | 52,672 | ||||||
| 305 | Kumba Iron Ore Ltd. | 18,619 | ||||||
| 2,853 | Liberty Holdings Ltd. | 33,927 | ||||||
| 11,429 | Life Healthcare Group Holdings Ltd. | 41,114 | ||||||
| 7,764 | MMI Holdings Ltd. | 18,188 | ||||||
| 2,124 | Mr Price Group Ltd. | 31,750 | ||||||
| 9,419 | MTN Group Ltd.(b) | 173,451 | ||||||
| 1,573 | Naspers Ltd., N Shares | 97,116 | ||||||
| 1,195 | Nedbank Group Ltd. | 24,124 | ||||||
| 7,746 | Netcare Ltd. | 15,412 | ||||||
| 2,844 | Remgro Ltd. | 47,849 | ||||||
See accompanying notes to financial statements.
33 |
Table of Contents
Consolidated Portfolio of Investments – as of November 30, 2012
ASG Growth Markets Fund – (continued)
| Shares | Description | Value (†) | ||||||
| South Africa — continued | ||||||||
| 1,959 | Reunert Ltd. | $ | 16,195 | |||||
| 10,827 | RMB Holdings Ltd. | 47,697 | ||||||
| 9,111 | RMI Holdings | 22,473 | ||||||
| 14,673 | Sanlam Ltd. | 67,502 | ||||||
| 2,994 | Sasol Ltd., Sponsored ADR(b) | 126,796 | ||||||
| 2,405 | Shoprite Holdings Ltd. | 51,808 | ||||||
| 1,557 | Spar Group Ltd. (The) | 21,805 | ||||||
| 6,617 | Standard Bank Group Ltd. | 78,273 | ||||||
| 4,568 | Steinhoff International Holdings Ltd.(c) | 14,066 | ||||||
| 1,304 | Truworths International Ltd. | 13,966 | ||||||
| 1,768 | Vodacom Group Ltd. | 23,660 | ||||||
| 6,515 | Woolworths Holdings Ltd. | 51,911 | ||||||
|
|
|
|||||||
| 1,492,219 | ||||||||
|
|
|
|||||||
| Taiwan — 5.1% | ||||||||
| 21,000 | Acer, Inc.(c) | 18,312 | ||||||
| 7,588 | Advanced Semiconductor Engineering, Inc., ADR | 31,338 | ||||||
| 6,000 | Asustek Computer, Inc. | 66,240 | ||||||
| 15,750 | Cathay Financial Holding Co. Ltd. | 16,785 | ||||||
| 11,400 | Cheng Shin Rubber Industry Co. Ltd. | 29,060 | ||||||
| 32,640 | Chinatrust Financial Holding Co. Ltd. | 18,932 | ||||||
| 2,681 | Chunghwa Telecom Co. Ltd., ADR | 86,194 | ||||||
| 38,000 | Compal Electronics, Inc. | 25,727 | ||||||
| 15,000 | CTCI Corp. | 28,615 | ||||||
| 8,000 | Delta Electronics, Inc. | 28,670 | ||||||
| 16,000 | Far EasTone Telecommunications Co. Ltd. | 40,079 | ||||||
| 10,000 | Formosa Chemicals & Fibre Corp. | 23,694 | ||||||
| 12,000 | Formosa Plastics Corp. | 31,615 | ||||||
| 14,699 | Fubon Financial Holding Co. Ltd. | 16,703 | ||||||
| 27,880 | Hon Hai Precision Industry Co. Ltd., GDR | 175,799 | ||||||
| 38,570 | Mega Financial Holding Co. Ltd. | 30,214 | ||||||
| 18,000 | Nan Ya Plastics Corp. | 31,855 | ||||||
| 4,000 | President Chain Store Corp. | 20,500 | ||||||
| 13,000 | Quanta Computer, Inc. | 32,704 | ||||||
| 14,000 | Taiwan Cement Corp. | 18,343 | ||||||
| 7,000 | Taiwan Mobile Co. Ltd. | 25,188 | ||||||
| 27,377 | Taiwan Semiconductor Manufacturing Co. Ltd., Sponsored ADR(b) | 472,801 | ||||||
| 20,330 | Uni-President Enterprises Corp. | 36,329 | ||||||
|
|
|
|||||||
| 1,305,697 | ||||||||
|
|
|
|||||||
| Turkey — 0.4% | ||||||||
| 654 | KOC Holding AS, ADR | 14,957 | ||||||
| 2,395 | Turkcell Iletisim Hizmetleri AS, ADR(c) | 36,284 | ||||||
| 12,786 | Turkiye Garanti Bankasi AS, ADR | 62,268 | ||||||
|
|
|
|||||||
| 113,509 | ||||||||
|
|
|
|||||||
| United States — 0.1% | ||||||||
| 698 | Southern Copper Corp. | 25,337 | ||||||
|
|
|
|||||||
| Total Common Stocks (Identified Cost $15,312,430) |
16,818,573 | |||||||
|
|
|
|||||||
See accompanying notes to financial statements.
| 34
Table of Contents
Consolidated Portfolio of Investments – as of November 30, 2012
ASG Growth Markets Fund – (continued)
| Shares |
Description | Value (†) | ||||||
| Preferred Stocks — 0.9% | ||||||||
| Brazil — 0.7% | ||||||||
| 1,300 | Bradespar S.A. | $ | 17,339 | |||||
| 1,800 | Cia Energetica de Sao Paulo, Class B | 14,699 | ||||||
| 10,670 | Itausa - Investimentos Itau S.A. | 48,087 | ||||||
| 8,900 | Klabin S.A. | 50,148 | ||||||
| 1,700 | Lojas Americanas S.A. | 14,957 | ||||||
| 3,100 | Marcopolo S.A. | 18,222 | ||||||
| 2,200 | Metalurgica Gerdau S.A. | 23,114 | ||||||
|
|
|
|||||||
| 186,566 | ||||||||
|
|
|
|||||||
| Korea — 0.2% | ||||||||
| 601 | Hyundai Motor Co. | 43,317 | ||||||
|
|
|
|||||||
| Total Preferred Stocks (Identified Cost $235,888) |
229,883 | |||||||
|
|
|
|||||||
| Principal Amount |
||||||||
| Short-Term Investments — 16.6% | ||||||||
| Treasuries — 11.2% | ||||||||
| $ | 300,000 | U.S. Treasury Bill, 0.090%, 12/13/2012(b)(d) | 299,996 | |||||
| 350,000 | U.S. Treasury Bill, 0.095%, 1/03/2013(b)(d) | 349,990 | ||||||
| 300,000 | U.S. Treasury Bill, 0.100%, 1/17/2013(b)(d) | 299,981 | ||||||
| 100,000 | U.S. Treasury Bill, 0.100%, 1/24/2013(b)(d) | 99,993 | ||||||
| 200,000 | U.S. Treasury Bill, 0.095%, 2/07/2013(b)(d) | 199,980 | ||||||
| 300,000 | U.S. Treasury Bill, 0.095%, 2/28/2013(b)(d) | 299,942 | ||||||
| 500,000 | U.S. Treasury Bill, 0.130%, 3/21/2013(b)(d) | 499,872 | ||||||
| 200,000 | U.S. Treasury Bill, 0.145%, 4/11/2013(b)(d) | 199,925 | ||||||
| 200,000 | U.S. Treasury Bills, 0.090%-0.100%, 12/06/2012(b)(d)(e) | 199,999 | ||||||
| 450,000 | U.S. Treasury Bills, 0.110%-0.145%, 12/27/2012(b)(d)(e) | 449,968 | ||||||
|
|
|
|||||||
| 2,899,646 | ||||||||
|
|
|
|||||||
| Certificates of Deposit — 2.7% | ||||||||
| 200,000 | National Bank of Canada, 0.150%, 12/03/2012 | 200,000 | ||||||
| 200,000 | Royal Bank of Canada, 0.150%, 12/03/2012 | 200,000 | ||||||
| 150,000 | Norinchukin Bank, 0.410%, 4/16/2013(b) | 150,023 | ||||||
| 150,000 | Westpac Banking Corp. (NY), 0.339%, 11/06/2013(b)(f) | 149,972 | ||||||
|
|
|
|||||||
| 699,995 | ||||||||
|
|
|
|||||||
| Commercial Paper — 2.1% | ||||||||
| 100,000 | Cofco Capital Corp., (Credit Support: Rabobank), 0.390%, 12/06/2012(b)(d) | 99,995 | ||||||
| 275,000 | General Electric Co., 0.120%, 12/27/2012(b)(d) | 274,979 | ||||||
| 150,000 | Vermont Economic Development Authority, (Credit Support: JPMorgan Chase), 0.200%, 1/15/2013(b) | 150,002 | ||||||
|
|
|
|||||||
| 524,976 | ||||||||
|
|
|
|||||||
| Financial Company Commercial Paper — 0.6% | ||||||||
| 150,000 | Societe Generale North America, 0.450%, 3/04/2013(b)(d) | 149,842 | ||||||
|
|
|
|||||||
| Total Short-Term Investments (Identified Cost $4,274,253) |
4,274,459 | |||||||
|
|
|
|||||||
See accompanying notes to financial statements.
35 |
Table of Contents
Consolidated Portfolio of Investments – as of November 30, 2012
ASG Growth Markets Fund – (continued)
| Principal Amount |
Description | Value (†) | ||||||
| Total Investments — 82.6% (Identified Cost $19,822,571)(a) |
$ | 21,322,915 | ||||||
| Other assets less liabilities — 17.4% | 4,503,370 | |||||||
|
|
|
|||||||
| Net Assets — 100.0% | $ | 25,826,285 | ||||||
|
|
|
|||||||
| (†) | See Note 2 of Notes to Financial Statements. | |||||||
| (a) | Federal Tax Information: | |||||||
| At November 30, 2012, the net unrealized appreciation on investments based on a cost of $19,825,605 for federal income tax purposes was as follows: | ||||||||
| Aggregate gross unrealized appreciation for all investments in which there is an excess of value over tax cost | $ | 2,365,331 | ||||||
| Aggregate gross unrealized depreciation for all investments in which there is an excess of tax cost over value | (868,021 | ) | ||||||
|
|
|
|||||||
| Net unrealized appreciation | $ | 1,497,310 | ||||||
|
|
|
|||||||
| (b) | All or a portion of this security has been designated to cover the Fund’s obligations under open forward foreign currency contracts or futures contracts. | |||||||
| (c) | Non-income producing security. | |||||||
| (d) | Interest rate represents discount rate at time of purchase; not a coupon rate. | |||||||
| (e) | The Fund’s investment in U.S. Treasury Bills is comprised of various lots with differing discount rates. These separate investments, which have the same maturity date, have been aggregated for the purpose of presentation in the Consolidated Portfolio of Investments. | |||||||
| (f) | Variable rate security. Rate as of November 30, 2012 is disclosed. | |||||||
| ADR/GDR | An American Depositary Receipt or Global Depositary Receipt is a certificate issued by a custodian bank representing the right to receive securities of the foreign issuer described. The values of ADRs and GDRs may be significantly influenced by trading on exchanges not located in the United States. | |||||||
At November 30, 2012, the Fund had the following open forward foreign currency contracts:
| Contract to Buy/Sell1 |
Delivery Date |
Currency | Units of Currency |
Notional Value |
Unrealized Appreciation (Depreciation) |
|||||||||||||
| Buy | 12/19/2012 | Australian Dollar | 1,100,000 | $ | 1,146,627 | $ | 11,424 | |||||||||||
| Buy | 12/19/2012 | Canadian Dollar | 1,000,000 | 1,006,370 | (19,270 | ) | ||||||||||||
| Buy | 12/19/2012 | Euro | 500,000 | 650,382 | 12,968 | |||||||||||||
| Buy | 12/19/2012 | Euro | 375,000 | 487,786 | (701 | ) | ||||||||||||
| Sell | 12/19/2012 | Euro | 625,000 | 812,977 | (15,895 | ) | ||||||||||||
| Sell | 12/19/2012 | Japanese Yen | 12,500,000 | 151,663 | 4,402 | |||||||||||||
| Buy | 12/19/2012 | New Zealand Dollar | 2,900,000 | 2,378,409 | 25,748 | |||||||||||||
| Sell | 12/19/2012 | New Zealand Dollar | 1,400,000 | 1,148,198 | (14,864 | ) | ||||||||||||
| Buy | 12/19/2012 | Norwegian Krone | 16,000,000 | 2,823,091 | 28,456 | |||||||||||||
| Buy | 12/19/2012 | Singapore Dollar | 6,375,000 | 5,222,821 | 32,524 | |||||||||||||
| Buy | 12/19/2012 | Swedish Krona | 4,000,000 | 600,940 | (3,026 | ) | ||||||||||||
| Sell | 12/19/2012 | Swedish Krona | 2,000,000 | 300,470 | 459 | |||||||||||||
| Buy | 12/19/2012 | Swiss Franc | 375,000 | 404,757 | 984 | |||||||||||||
See accompanying notes to financial statements.
| 36
Table of Contents
Consolidated Portfolio of Investments – as of November 30, 2012
ASG Growth Markets Fund – (continued)
| Contract to Buy/Sell1 |
Delivery Date |
Currency | Units of Currency |
Notional Value |
Unrealized Appreciation (Depreciation) |
|||||||||||||
| Sell | 12/19/2012 | Swiss Franc | 375,000 | $ | 404,757 | $ | (5,850 | ) | ||||||||||
| Buy | 12/19/2012 | Turkish Lira | 7,800,000 | 4,356,579 | 70,337 | |||||||||||||
| Sell | 12/19/2012 | Turkish Lira | 1,200,000 | 670,243 | (11,926 | ) | ||||||||||||
|
|
|
|||||||||||||||||
| Total | $ | 115,770 | ||||||||||||||||
|
|
|
|||||||||||||||||
1 Counterparty is UBS AG.
At November 30, 2012, open futures contracts purchased were as follows:
| Financial Futures | Expiration Date |
Contracts | Notional Value |
Unrealized Appreciation (Depreciation) |
||||||||||||
| AEX | 12/21/2012 | 11 | $ | 963,084 | $ | 18,884 | ||||||||||
| DAX | 12/21/2012 | 2 | 482,439 | 1,691 | ||||||||||||
| E-mini NASDAQ 100 | 12/21/2012 | 11 | 588,665 | (21,263 | ) | |||||||||||
| E-mini S&P 500® | 12/21/2012 | 2 | 141,440 | (920 | ) | |||||||||||
| Euribor | 6/17/2013 | 52 | 16,873,346 | (4,227 | ) | |||||||||||
| Euro Schatz | 12/06/2012 | 51 | 7,348,489 | (332 | ) | |||||||||||
| Eurodollar | 6/17/2013 | 1 | 249,162 | — | ||||||||||||
| FTSE 100 | 12/21/2012 | 17 | 1,599,739 | 7,570 | ||||||||||||
| FTSE JSE Top 40 | 12/20/2012 | 53 | 2,023,448 | 90,523 | ||||||||||||
| German Euro BOBL | 12/06/2012 | 39 | 6,410,181 | 24,281 | ||||||||||||
| Hang Seng | 12/28/2012 | 10 | 1,420,802 | 4,194 | ||||||||||||
| Mini-Russell 2000 | 12/21/2012 | 8 | 656,560 | (11,720 | ) | |||||||||||
| MSCI Singapore | 12/28/2012 | 15 | 856,546 | 21,383 | ||||||||||||
| MSCI Taiwan | 12/27/2012 | 25 | 686,250 | 20,500 | ||||||||||||
| Nikkei 225 | 12/14/2012 | 9 | 1,031,722 | 13,101 | ||||||||||||
| OMXS30 | 12/21/2012 | 69 | 1,126,260 | 39,668 | ||||||||||||
| S&P/TSX 60® | 12/20/2012 | 9 | 1,271,878 | (15,161 | ) | |||||||||||
| SGX CNX Nifty | 12/27/2012 | 185 | 2,186,700 | 74,925 | ||||||||||||
| Sterling | 6/19/2013 | 92 | 18,319,712 | (14,740 | ) | |||||||||||
| UK Long Gilt | 3/26/2013 | 11 | 2,103,384 | 10,030 | ||||||||||||
| 2 Year U.S. Treasury Note | 3/28/2013 | 5 | 1,102,266 | 547 | ||||||||||||
| 5 Year U.S. Treasury Note | 3/28/2013 | 97 | 12,097,719 | 40,164 | ||||||||||||
| 10 Year Canada Government Bond | 3/19/2013 | 38 | 5,229,758 | 31,751 | ||||||||||||
| 10 Year U.S. Treasury Note | 3/19/2013 | 5 | 668,203 | 3,789 | ||||||||||||
| 30 Year U.S. Treasury Bond | 3/19/2013 | 5 | 750,312 | 6,539 | ||||||||||||
|
|
|
|||||||||||||||
| Total | $ | 341,177 | ||||||||||||||
|
|
|
|||||||||||||||
See accompanying notes to financial statements.
37 |
Table of Contents
Consolidated Portfolio of Investments – as of November 30, 2012
ASG Growth Markets Fund – (continued)
| Commodity Futures2 | Expiration Date |
Contracts | Notional Value |
Unrealized Appreciation (Depreciation) |
||||||||||||
| Cocoa | 3/13/2013 | 3 | $ | 74,940 | $ | 600 | ||||||||||
| Copper LME | 12/19/2012 | 2 | 399,162 | (5,445 | ) | |||||||||||
| Gas Oil | 1/10/2013 | 9 | 857,700 | 5,850 | ||||||||||||
| KC Wheat | 3/14/2013 | 1 | 45,663 | 363 | ||||||||||||
| Silver | 3/26/2013 | 3 | 499,185 | 3,915 | ||||||||||||
| Soybean Meal | 1/14/2013 | 5 | 217,450 | 5,550 | ||||||||||||
| Wheat | 3/14/2013 | 1 | 43,175 | (438 | ) | |||||||||||
|
|
|
|||||||||||||||
| Total | $ | 10,395 | ||||||||||||||
|
|
|
|||||||||||||||
At November 30, 2012, open futures contracts sold were as follows:
| Financial Futures | Expiration Date |
Contracts | Notional Value |
Unrealized Appreciation (Depreciation) |
||||||||||||
| E-mini Dow | 12/21/2012 | 4 | $ | 260,160 | $ | (5,400 | ) | |||||||||
|
|
|
|||||||||||||||
| Commodity Futures2 | Expiration Date |
Contracts | Notional Value |
Unrealized Appreciation (Depreciation) |
||||||||||||
| Aluminum HG | 12/19/2012 | 12 | $ | 630,375 | $ | (50,591 | ) | |||||||||
| Coffee | 3/18/2013 | 3 | 169,425 | 5,569 | ||||||||||||
| Copper High Grade | 3/26/2013 | 1 | 91,250 | (3,087 | ) | |||||||||||
| Copper LME | 12/19/2012 | 4 | 798,325 | 13,075 | ||||||||||||
| Cotton | 3/06/2013 | 7 | 258,685 | (10,830 | ) | |||||||||||
| Live Cattle | 2/28/2013 | 1 | 52,160 | (600 | ) | |||||||||||
| Soybean | 1/14/2013 | 3 | 215,812 | (4,688 | ) | |||||||||||
| Soybean Oil | 1/14/2013 | 2 | 59,688 | (2,088 | ) | |||||||||||
| Sugar | 2/28/2013 | 6 | 129,965 | 5,443 | ||||||||||||
|
|
|
|||||||||||||||
| Total | $ | (47,797 | ) | |||||||||||||
|
|
|
|||||||||||||||
2 Commodity futures are held by ASG Growth Markets Cayman Fund Ltd., a wholly-owned subsidiary. See Note 1 of Notes to Financial Statements.
See accompanying notes to financial statements.
| 38
Table of Contents
Consolidated Portfolio of Investments – as of November 30, 2012
ASG Growth Markets Fund – (continued)
Industry Summary at November 30, 2012 (Unaudited)
| Commercial Banks |
11.9 | % | ||
| Oil, Gas & Consumable Fuels |
8.6 | |||
| Semiconductors & Semiconductor Equipment |
5.5 | |||
| Wireless Telecommunication Services |
5.0 | |||
| Metals & Mining |
3.2 | |||
| Automobiles |
2.6 | |||
| Real Estate Management & Development |
2.4 | |||
| Insurance |
2.0 | |||
| Other Investments, less than 2% each |
24.8 | |||
| Short-Term Investments |
16.6 | |||
|
|
|
|||
| Total Investments |
82.6 | |||
| Other assets less liabilities (including open forward foreign currency and futures contracts) |
17.4 | |||
|
|
|
|||
| Net Assets |
100.0 | % | ||
|
|
|
Currency Exposure Summary at November 30, 2012 (Unaudited)
| United States Dollar |
47.5 | % | ||
| Hong Kong Dollar |
12.8 | |||
| South Korean Won |
6.7 | |||
| South African Rand |
4.8 | |||
| Malaysian Ringgit |
3.0 | |||
| Brazilian Real |
2.6 | |||
| New Taiwan Dollar |
2.1 | |||
| Indonesian Rupiah |
2.0 | |||
| Mexican Peso |
1.1 | |||
|
|
|
|||
| Total Investments |
82.6 | |||
| Other assets less liabilities (including open forward foreign currency and futures contracts) |
17.4 | |||
|
|
|
|||
| Net Assets |
100.0 | % | ||
|
|
|
See accompanying notes to financial statements.
39 |
Table of Contents
Portfolio of Investments – as of November 30, 2012
Gateway International Fund
| Shares | Description | Value (†) | ||||||
| Common Stocks* — 97.3% of Net Assets | ||||||||
| Australia — 9.4% | ||||||||
| 5,983 | Amcor Ltd.(b) | $ | 49,354 | |||||
| 7,786 | Australia & New Zealand Banking Group Ltd.(b) | 198,147 | ||||||
| 9,070 | BHP Billiton Ltd.(b) | 326,632 | ||||||
| 8,555 | Brambles Ltd.(b) | 64,655 | ||||||
| 5,010 | Cardno Ltd.(b) | 31,142 | ||||||
| 4,303 | Commonwealth Bank of Australia(b) | 268,239 | ||||||
| 1,497 | CSL Ltd.(b) | 80,743 | ||||||
| 1,130 | McMillan Shakespeare Ltd.(b) | 15,685 | ||||||
| 6,515 | National Australia Bank Ltd.(b) | 165,388 | ||||||
| 5,180 | New Hope Corp. Ltd.(b) | 22,049 | ||||||
| 2,909 | Newcrest Mining Ltd.(b) | 77,749 | ||||||
| 6,013 | Oil Search Ltd.(b) | 44,641 | ||||||
| 2,662 | Orica Ltd.(b) | 66,946 | ||||||
| 5,088 | Origin Energy Ltd.(b) | 58,457 | ||||||
| 3,321 | Premier Investments Ltd.(b) | 21,922 | ||||||
| 4,406 | QBE Insurance Group Ltd.(b) | 50,345 | ||||||
| 12,574 | QR National Ltd.(b) | 47,412 | ||||||
| 2,147 | Rio Tinto Ltd.(b) | 131,833 | ||||||
| 5,713 | SAI Global Ltd.(b) | 25,634 | ||||||
| 622 | Shopping Centres Australasia Property Group(c) | 941 | ||||||
| 7,081 | Suncorp Group Ltd.(b) | 71,671 | ||||||
| 32,567 | Telstra Corp. Ltd.(b) | 146,508 | ||||||
| 3,357 | Wesfarmers Ltd.(b) | 124,517 | ||||||
| 7,577 | Westfield Group(b) | 82,485 | ||||||
| 8,232 | Westpac Banking Corp.(b) | 219,257 | ||||||
| 2,001 | Woodside Petroleum Ltd.(b) | 70,650 | ||||||
| 3,110 | Woolworths Ltd.(b) | 95,079 | ||||||
|
|
|
|||||||
| 2,558,081 | ||||||||
|
|
|
|||||||
| Euro Zone — 29.7% | ||||||||
| 1,850 | Accor S.A.(b) | 61,562 | ||||||
| 2,438 | Allianz SE, (Registered)(b) | 317,159 | ||||||
| 1,409 | Alstom S.A.(b) | 51,346 | ||||||
| 3,285 | Anheuser-Busch InBev NV(b) | 288,464 | ||||||
| 31,271 | Banco Bilbao Vizcaya Argentaria S.A.(b) | 265,319 | ||||||
| 51,748 | Banco Santander S.A.(b) | 398,643 | ||||||
| 4,461 | BASF SE(d) | 399,965 | ||||||
| 3,816 | Bayer AG, (Registered)(b) | 345,359 | ||||||
| 565 | Belgacom S.A.(b) | 16,612 | ||||||
| 5,196 | BNP Paribas S.A.(b) | 290,774 | ||||||
| 1,196 | Bouygues S.A.(b) | 29,556 | ||||||
| 454 | Casino Guichard Perrachon S.A.(b) | 41,217 | ||||||
| 5,674 | Daimler AG, (Registered)(b) | 280,629 | ||||||
| 2,790 | Danone S.A.(b) | 177,084 | ||||||
| 5,365 | Deutsche Bank AG, (Registered)(b) | 236,647 | ||||||
| 9,340 | E.ON AG(b) | 168,428 | ||||||
| 2,143 | Electricite de France S.A.(b) | 39,331 | ||||||
| 14,424 | ENI SpA(b) | 342,056 | ||||||
See accompanying notes to financial statements.
| 40
Table of Contents
Portfolio of Investments – as of November 30, 2012
Gateway International Fund – (continued)
| Shares | Description | Value (†) | ||||||
| Euro Zone — continued | ||||||||
| 14,215 | France Telecom S.A.(b) | $ | 151,202 | |||||
| 111,185 | Intesa Sanpaolo SpA(b) | 152,018 | ||||||
| 429 | Kerry Group PLC, Class A(b) | 22,446 | ||||||
| 437 | Kone OYJ, Class B(b) | 32,739 | ||||||
| 1,349 | Koninklijke DSM NV(b) | 77,768 | ||||||
| 1,094 | Legrand S.A.(b) | 44,364 | ||||||
| 249 | Linde AG(b) | 43,073 | ||||||
| 1,519 | LVMH Moet Hennessy Louis Vuitton S.A.(b) | 266,721 | ||||||
| 293 | Pernod-Ricard S.A.(b) | 33,199 | ||||||
| 2,261 | Sampo OYJ, A Shares(b) | 72,263 | ||||||
| 5,729 | Sanofi(b)(d) | 511,700 | ||||||
| 4,273 | SAP AG(d) | 333,632 | ||||||
| 3,277 | Schneider Electric S.A.(b) | 230,684 | ||||||
| 1,720 | SCOR SE(b) | 45,447 | ||||||
| 1,045 | SES S.A.(b) | 29,574 | ||||||
| 3,763 | Siemens AG, (Registered)(d) | 389,042 | ||||||
| 10,885 | Snam SpA(b) | 48,182 | ||||||
| 4,227 | Societe Generale S.A.(b)(c) | 153,230 | ||||||
| 388 | Sodexo(b) | 31,356 | ||||||
| 46,529 | Telecom Italia SpA(b) | 37,164 | ||||||
| 24,108 | Telefonica S.A.(d) | 316,692 | ||||||
| 620 | Thales S.A.(b) | 22,322 | ||||||
| 2,386 | ThyssenKrupp AG(b) | 48,330 | ||||||
| 10,374 | Total S.A.(d) | 519,899 | ||||||
| 393 | Umicore S.A.(b) | 20,435 | ||||||
| 7,781 | Unilever NV(b) | 295,280 | ||||||
| 4,373 | Vinci S.A.(b) | 193,274 | ||||||
| 736 | Volkswagen AG(b) | 149,911 | ||||||
| 689 | Wereldhave NV(b) | 42,342 | ||||||
|
|
|
|||||||
| 8,064,440 | ||||||||
|
|
|
|||||||
| Hong Kong — 3.5% | ||||||||
| 16,973 | AIA Group Ltd.(b) | 66,336 | ||||||
| 120,358 | Bank of China Ltd., Class H(b) | 50,764 | ||||||
| 119,564 | China Construction Bank Corp., Class H(b) | 91,614 | ||||||
| 7,626 | China Mobile Ltd.(b) | 86,862 | ||||||
| 8,952 | China Shenhua Energy Co. Ltd., Class H(b) | 36,655 | ||||||
| 3,620 | CLP Holdings Ltd.(b) | 31,631 | ||||||
| 26,320 | CNOOC Ltd.(b) | 55,940 | ||||||
| 2,420 | Hang Seng Bank Ltd.(b) | 36,886 | ||||||
| 3,305 | Hong Kong Exchanges & Clearing Ltd.(b) | 52,648 | ||||||
| 17,381 | HSBC Holdings PLC(b) | 177,560 | ||||||
| 103,977 | Industrial & Commercial Bank of China Ltd., Class H(b) | 70,129 | ||||||
| 8,600 | MTR Corp. Ltd.(b) | 34,392 | ||||||
| 33,452 | PetroChina Co. Ltd., Class H(b) | 44,460 | ||||||
| 1,662 | Tencent Holdings Ltd.(b) | 54,089 | ||||||
| 7,034 | Wharf Holdings Ltd.(b) | 54,390 | ||||||
|
|
|
|||||||
| 944,356 | ||||||||
|
|
|
|||||||
See accompanying notes to financial statements.
41 |
Table of Contents
Portfolio of Investments – as of November 30, 2012
Gateway International Fund – (continued)
| Shares | Description | Value (†) | ||||||
| Japan — 21.9% | ||||||||
| 5,137 | Advantest Corp.(b) | $ | 68,989 | |||||
| 1,674 | Air Water, Inc.(b) | 21,112 | ||||||
| 4,424 | Alps Electric Co. Ltd.(b) | 28,000 | ||||||
| 3,241 | Asahi Group Holdings Ltd.(b) | 72,939 | ||||||
| 2,431 | Astellas Pharma, Inc.(b) | 123,067 | ||||||
| 3,154 | Bridgestone Corp.(b) | 76,446 | ||||||
| 3,722 | Canon, Inc.(b)(d) | 131,678 | ||||||
| 2,978 | Chiyoda Corp.(b) | 43,132 | ||||||
| 2,407 | Coca-Cola West Co. Ltd.(b) | 37,422 | ||||||
| 2,934 | Credit Saison Co. Ltd.(b) | 65,476 | ||||||
| 4,417 | Daiichi Sankyo Co. Ltd.(b) | 68,293 | ||||||
| 2,695 | Daikin Industries Ltd.(b) | 84,972 | ||||||
| 3,568 | Dainippon Screen Manufacturing Co. Ltd.(b) | 19,685 | ||||||
| 3,000 | Denso Corp.(b) | 99,170 | ||||||
| 2,916 | Dentsu, Inc.(b) | 71,451 | ||||||
| 2,800 | Eisai Co. Ltd.(b) | 117,690 | ||||||
| 2,213 | FANUC Corp.(b)(d) | 374,692 | ||||||
| 2,131 | Fast Retailing Co. Ltd.(b)(d) | 486,037 | ||||||
| 3,481 | FUJIFILM Holdings Corp.(b) | 64,107 | ||||||
| 805 | Hamamatsu Photonics KK(b) | 28,461 | ||||||
| 4,197 | Hankyu Hanshin Holdings, Inc.(b) | 22,165 | ||||||
| 9,018 | Hanwa Co. Ltd.(b) | 29,827 | ||||||
| 3,539 | Hitachi Construction Machinery Co. Ltd.(b) | 62,261 | ||||||
| 5,287 | Honda Motor Co. Ltd.(b)(d) | 176,223 | ||||||
| 369 | Idemitsu Kosan Co. Ltd.(b) | 30,325 | ||||||
| 1,275 | Ito En Ltd.(b) | 23,562 | ||||||
| 2,696 | Japan Tobacco, Inc.(b) | 80,838 | ||||||
| 2,803 | JGC Corp.(b) | 92,828 | ||||||
| 5,152 | JTEKT Corp.(b) | 41,823 | ||||||
| 3,648 | Kamigumi Co. Ltd.(b) | 28,257 | ||||||
| 10,519 | Kaneka Corp.(b) | 52,976 | ||||||
| 2,627 | Kao Corp.(b) | 72,233 | ||||||
| 2,199 | KDDI Corp.(b)(d) | 163,172 | ||||||
| 2,368 | Keikyu Corp.(b) | 21,765 | ||||||
| 4,394 | Kokuyo Co. Ltd.(b) | 34,382 | ||||||
| 3,409 | Komatsu Ltd.(b) | 76,864 | ||||||
| 2,227 | Konami Corp.(b) | 53,893 | ||||||
| 1,077 | Kurita Water Industries Ltd.(b) | 23,530 | ||||||
| 2,372 | Kyocera Corp.(b)(d) | 219,500 | ||||||
| 247 | Lawson, Inc.(b) | 16,721 | ||||||
| 925 | MISUMI Group, Inc.(b) | 24,418 | ||||||
| 3,677 | Mitsubishi Corp.(b) | 69,992 | ||||||
| 3,928 | Mitsubishi Estate Co. Ltd.(b) | 76,031 | ||||||
| 721 | Mitsubishi UFJ Lease & Finance Co. Ltd.(b) | 31,516 | ||||||
| 5,317 | Mitsui & Co. Ltd.(b) | 73,798 | ||||||
| 3,833 | Mitsui Fudosan Co. Ltd.(b) | 80,345 | ||||||
| 2,151 | Nagase & Co. Ltd.(b) | 23,412 | ||||||
| 9,366 | Nagoya Railroad Co. Ltd.(b) | 25,017 | ||||||
See accompanying notes to financial statements.
| 42
Table of Contents
Portfolio of Investments – as of November 30, 2012
Gateway International Fund – (continued)
| Shares | Description | Value (†) | ||||||
| Japan — continued | ||||||||
| 2,833 | Nikon Corp.(b) | $ | 78,938 | |||||
| 10,972 | Nomura Holdings, Inc.(b) | 45,652 | ||||||
| 26 | NTT Data Corp.(b) | 75,606 | ||||||
| 6,886 | OKUMA Corp.(b) | 40,158 | ||||||
| 3,489 | Ricoh Co. Ltd.(b) | 32,527 | ||||||
| 2,501 | Secom Co. Ltd.(b) | 128,355 | ||||||
| 6,860 | Seino Holdings Corp.(b) | 41,671 | ||||||
| 2,726 | Seven & I Holdings Co. Ltd.(b) | 79,444 | ||||||
| 2,571 | Shin-Etsu Chemical Co. Ltd.(b)(d) | 151,844 | ||||||
| 3,307 | Shionogi & Co. Ltd.(b) | 56,052 | ||||||
| 6,522 | Softbank Corp.(b)(d) | 245,308 | ||||||
| 5,947 | Sumitomo Corp.(b) | 74,079 | ||||||
| 4,414 | Sumitomo Metal Mining Co. Ltd.(b) | 60,681 | ||||||
| 3,267 | Sumitomo Realty & Development Co. Ltd.(b) | 89,348 | ||||||
| 2,564 | Suzuki Motor Corp.(b) | 61,059 | ||||||
| 3,629 | Taiyo Nippon Sanso Corp.(b) | 20,186 | ||||||
| 3,814 | Taiyo Yuden Co. Ltd.(b) | 33,348 | ||||||
| 2,626 | Takeda Pharmaceutical Co. Ltd.(b) | 120,211 | ||||||
| 2,384 | TDK Corp.(b) | 93,736 | ||||||
| 2,636 | Terumo Corp.(b) | 112,011 | ||||||
| 2,380 | Tokyo Electron Ltd.(b)(d) | 106,621 | ||||||
| 7,020 | Toyo Ink SC Holdings Co. Ltd.(b) | 29,247 | ||||||
| 642 | Toyo Suisan Kaisha Ltd.(b) | 17,626 | ||||||
| 2,909 | Toyota Motor Corp.(b) | 125,253 | ||||||
| 4,032 | Toyota Tsusho Corp.(b) | 93,154 | ||||||
| 2,749 | Trend Micro, Inc.(b) | 72,057 | ||||||
| 3,739 | Yamato Holdings Co. Ltd.(b) | 56,123 | ||||||
|
|
|
|||||||
| 5,950,788 | ||||||||
|
|
|
|||||||
| Switzerland — 9.5% | ||||||||
| 468 | Aryzta AG(b)(c) | 23,673 | ||||||
| 880 | Baloise Holding AG, (Registered)(b) | 73,875 | ||||||
| 393 | Bank Sarasin & Cie AG, (Registered), Class B(b)(c) | 11,451 | ||||||
| 1,919 | Clariant AG, (Registered)(b)(c) | 23,161 | ||||||
| 248 | Dufry AG, (Registered)(b)(c) | 33,359 | ||||||
| 2,234 | EFG International AG(b)(c) | 19,377 | ||||||
| 2,414 | GAM Holding AG(b)(c) | 31,045 | ||||||
| 501 | Gategroup Holding AG(b)(c) | 12,343 | ||||||
| 385 | Kuehne & Nagel International AG, (Registered)(b) | 46,389 | ||||||
| 930 | Logitech International S.A., (Registered)(b)(c) | 6,577 | ||||||
| 596 | Meyer Burger Technology AG(b)(c) | 3,883 | ||||||
| 10,580 | Nestle S.A., (Registered)(d) | 692,542 | ||||||
| 1,008 | Nobel Biocare Holding AG, (Registered)(b)(c) | 7,968 | ||||||
| 8,602 | Novartis AG, (Registered)(b)(d) | 533,043 | ||||||
| 2,571 | OC Oerlikon Corp. AG, (Registered)(b)(c) | 27,545 | ||||||
| 2,245 | Roche Holding AG(b) | 442,254 | ||||||
| 462 | Schindler Holding AG(b) | 64,830 | ||||||
| 3,187 | Schmolz & Bickenbach AG, (Registered)(b)(c) | 8,364 | ||||||
| 178 | Sonova Holding AG, (Registered)(b)(c) | 19,444 | ||||||
See accompanying notes to financial statements.
43 |
Table of Contents
Portfolio of Investments – as of November 30, 2012
Gateway International Fund – (continued)
| Shares | Description | Value (†) | ||||||
| Switzerland — continued | ||||||||
| 320 | Sulzer AG, (Registered)(b) | $ | 49,618 | |||||
| 1,226 | Swatch Group AG (The), (Registered)(b) | 101,757 | ||||||
| 398 | Swiss Life Holding AG, (Registered)(b)(c) | 53,311 | ||||||
| 676 | Temenos Group AG, (Registered)(b)(c) | 11,496 | ||||||
| 1,432 | Transocean Ltd.(b) | 65,544 | ||||||
| 14,220 | UBS AG, (Registered)(b)(c) | 222,992 | ||||||
|
|
|
|||||||
| 2,585,841 | ||||||||
|
|
|
|||||||
| United Kingdom — 23.3% | ||||||||
| 2,056 | African Barrick Gold PLC(b) | 13,608 | ||||||
| 4,505 | Anglo American PLC(b) | 125,118 | ||||||
| 4,042 | AstraZeneca PLC(b) | 191,988 | ||||||
| 3,187 | Babcock International Group PLC(b) | 50,904 | ||||||
| 5,031 | Balfour Beatty PLC(b) | 20,839 | ||||||
| 37,546 | Barclays PLC(b) | 148,920 | ||||||
| 1,124 | Berkeley Group Holdings PLC(b)(c) | 29,591 | ||||||
| 10,118 | BG Group PLC(b) | 173,590 | ||||||
| 7,702 | BHP Billiton PLC(b) | 242,577 | ||||||
| 57,321 | BP PLC(b)(d) | 397,939 | ||||||
| 5,979 | British American Tobacco PLC(d) | 314,083 | ||||||
| 29,061 | BT Group PLC(b) | 108,690 | ||||||
| 2,865 | Bunzl PLC(b) | 47,241 | ||||||
| 9,425 | Capital & Counties Properties PLC(b) | 36,234 | ||||||
| 5,335 | Catlin Group Ltd.(b) | 41,296 | ||||||
| 2,463 | Close Brothers Group PLC(b) | 34,058 | ||||||
| 974 | Croda International PLC(b) | 37,173 | ||||||
| 920 | Derwent London PLC(b) | 30,455 | ||||||
| 8,328 | Diageo PLC(b) | 248,401 | ||||||
| 4,607 | Ferrexpo PLC(b) | 16,165 | ||||||
| 14,663 | GlaxoSmithKline PLC(d) | 314,024 | ||||||
| 3,847 | Great Portland Estates PLC(b) | 29,026 | ||||||
| 3,998 | Greene King PLC(b) | 39,194 | ||||||
| 5,085 | Halma PLC(b) | 35,584 | ||||||
| 13,970 | Hays PLC(b) | 17,431 | ||||||
| 3,691 | Hiscox Ltd.(b) | 28,435 | ||||||
| 53,468 | HSBC Holdings PLC(b)(d) | 546,023 | ||||||
| 3,729 | IG Group Holdings PLC(b) | 25,312 | ||||||
| 4,756 | Inchcape PLC(b) | 32,607 | ||||||
| 4,337 | Invensys PLC(b) | 21,928 | ||||||
| 1,386 | Jardine Lloyd Thompson Group PLC(b) | 17,099 | ||||||
| 3,458 | John Wood Group PLC(b) | 43,139 | ||||||
| 8,051 | Ladbrokes PLC(b) | 25,162 | ||||||
| 18,155 | Marston’s PLC(b) | 36,425 | ||||||
| 7,532 | Meggitt PLC(b) | 47,032 | ||||||
| 10,416 | Melrose Industries PLC(b) | 35,543 | ||||||
| 13,675 | National Grid PLC(b) | 154,573 | ||||||
| 4,462 | Pennon Group PLC(b) | 44,258 | ||||||
| 1,987 | Petropavlovsk PLC(b) | 10,890 | ||||||
| 11,861 | Prudential PLC(b) | 172,422 | ||||||
See accompanying notes to financial statements.
| 44
Table of Contents
Portfolio of Investments – as of November 30, 2012
Gateway International Fund – (continued)
| Shares |
Description | Value (†) | ||||||
| United Kingdom — continued | ||||||||
| 2,421 | Reckitt Benckiser Group PLC(b) | $ | 152,280 | |||||
| 20,368 | Rentokil Initial PLC(b) | 29,393 | ||||||
| 4,555 | Restaurant Group PLC(b) | 27,981 | ||||||
| 4,185 | Rio Tinto PLC(d) | 207,813 | ||||||
| 661 | Rotork PLC(b) | 26,283 | ||||||
| 17,839 | Royal Dutch Shell PLC, A Shares(d) | 597,276 | ||||||
| 3,676 | SABMiller PLC(b) | 166,677 | ||||||
| 857 | Spirax-Sarco Engineering PLC(b) | 30,034 | ||||||
| 6,626 | Standard Chartered PLC(b) | 154,552 | ||||||
| 1,469 | Telecity Group PLC(b) | 20,187 | ||||||
| 26,053 | Tesco PLC(b) | 135,912 | ||||||
| 986 | Ultra Electronics Holdings PLC(b) | 25,782 | ||||||
| 4,404 | Unilever PLC(b) | 168,982 | ||||||
| 148,934 | Vodafone Group PLC(b) | 384,195 | ||||||
| 2,500 | WH Smith PLC(b) | 26,028 | ||||||
| 7,636 | WPP PLC(b) | 104,842 | ||||||
| 5,433 | Xstrata PLC(b) | 90,076 | ||||||
|
|
|
|||||||
| 6,333,270 | ||||||||
|
|
|
|||||||
| Total Common Stocks (Identified Cost $25,156,817) |
26,436,776 | |||||||
|
|
|
|||||||
| Contracts | ||||||||
| Purchased Options — 0.1% | ||||||||
| Index Options — 0.1% | ||||||||
| 80 | On EURO STOXX 50® Index, Put expiring December 21, 2012 at 2250 | 1,189 | ||||||
| 39 | On EURO STOXX 50® Index, Put expiring December 21, 2012 at 2300 | 736 | ||||||
| 65 | On EURO STOXX 50® Index, Put expiring January 18, 2013 at 2200 | 2,670 | ||||||
| 54 | On EURO STOXX 50® Index, Put expiring January 18, 2013 at 2250 | 2,955 | ||||||
| 14 | On FTSE 100 Index, Put expiring December 21, 2012 at 5300 | 598 | ||||||
| 13 | On FTSE 100 Index, Put expiring January 18, 2013 at 5400 | 2,412 | ||||||
| 19 | On FTSE 100 Index, Put expiring February 15, 2013 at 5100 | 3,567 | ||||||
| 20 | On FTSE 100 Index, Put expiring February 15, 2013 at 5400 | 8,928 | ||||||
| 2 | On Hang Seng Index, OTC Put expiring December 28, 2012 at 19800(e) | 43 | ||||||
| 4 | On Hang Seng Index, OTC Put expiring January 30, 2013 at 19400(e) | 430 | ||||||
| 15 | On Nikkei 225 Index, Put expiring January 11, 2013 at 8000 | 835 | ||||||
| 10 | On Nikkei 225 Index, Put expiring January 11, 2013 at 8250 | 848 | ||||||
| 10 | On Nikkei 225 Index, Put expiring February 08, 2013 at 8000 | 1,642 | ||||||
| 16 | On Nikkei 225 Index, Put expiring February 08, 2013 at 8500 | 6,306 | ||||||
| 9 | On S&P ASX 200® Index, OTC Put expiring December 20, 2012 at 4000(e) | 15 | ||||||
| 9 | On S&P ASX 200® Index, OTC Put expiring December 20, 2012 at 4050(e) | 43 | ||||||
| 17 | On S&P ASX 200® Index, OTC Put expiring December 20, 2012 at 4200(e) | 459 | ||||||
| 9 | On S&P ASX 200® Index, OTC Put expiring January 17, 2013 at 4150(e) | 579 | ||||||
| 10 | On S&P ASX 200® Index, OTC Put expiring January 17, 2013 at 4200(e) | 716 | ||||||
| 7 | On Swiss Market Index, Put expiring December 21, 2012 at 5900 | 84 | ||||||
| 6 | On Swiss Market Index, Put expiring December 21, 2012 at 6100 | 119 | ||||||
| 22 | On Swiss Market Index, Put expiring January 18, 2013 at 6100 | 980 | ||||||
|
|
|
|||||||
| Total Purchased Options (Identified Cost $176,950) |
36,154 | |||||||
|
|
|
|||||||
See accompanying notes to financial statements.
45 |
Table of Contents
Portfolio of Investments – as of November 30, 2012
Gateway International Fund – (continued)
| Principal Amount |
Description | Value (†) | ||||||
| Short-Term Investments — 1.9% | ||||||||
| $ | 508,001 | Tri-Party Repurchase Agreement with Fixed Income Clearing Corporation, dated 11/30/2012 at 0.010% to be repurchased at $508,001 on 12/03/2012 collateralized by $525,000 Federal Home Loan Mortgage Corp., 0.750% due 1/12/2018 valued at $522,375 including accrued interest (Note 2 of Notes to Financial Statements) (Identified Cost $508,001) | $ | 508,001 | ||||
|
|
|
|||||||
| Total Investments — 99.3% (Identified Cost $25,841,768)(a) |
26,980,931 | |||||||
| Other assets less liabilities — 0.7% | 179,133 | |||||||
|
|
|
|||||||
| Net Assets — 100.0% | $ | 27,160,064 | ||||||
|
|
|
|||||||
| Contracts | ||||||||
| Written Options — (3.6%) | ||||||||
| Index Options — (3.6%) | ||||||||
| 54 | On EURO STOXX 50® Index, OTC Call expiring December 21, 2012 at 2450(e) | (96,791 | ) | |||||
| 57 | On EURO STOXX 50® Index, OTC Call expiring December 21, 2012 at 2500(e) | (68,733 | ) | |||||
| 81 | On EURO STOXX 50® Index, OTC Call expiring December 21, 2012 at 2550(e) | (56,580 | ) | |||||
| 46 | On EURO STOXX 50® Index, OTC Call expiring January 18, 2013 at 2500(e) | (64,587 | ) | |||||
| 12 | On FTSE 100 Index, OTC Call expiring December 21, 2012 at 5750(e) | (28,671 | ) | |||||
| 12 | On FTSE 100 Index, OTC Call expiring December 21, 2012 at 5850(e) | (14,426 | ) | |||||
| 15 | On FTSE 100 Index, OTC Call expiring December 21, 2012 at 5900(e) | (11,053 | ) | |||||
| 12 | On FTSE 100 Index, OTC Call expiring January 18, 2013 at 5650(e) | (49,186 | ) | |||||
| 15 | On FTSE 100 Index, OTC Call expiring January 18, 2013 at 5700(e) | (51,961 | ) | |||||
| 3 | On Hang Seng Index, OTC Call expiring December 28, 2012 at 21400(e) | (13,865 | ) | |||||
| 3 | On Hang Seng Index, OTC Call expiring January 30, 2013 at 21600(e) | (15,063 | ) | |||||
| 13 | On Nikkei 225 Index, OTC Call expiring December 14, 2012 at 8750(e) | (117,148 | ) | |||||
| 7 | On Nikkei 225 Index, OTC Call expiring December 14, 2012 at 9000(e) | (42,088 | ) | |||||
| 13 | On Nikkei 225 Index, OTC Call expiring January 11, 2013 at 8750(e) | (117,915 | ) | |||||
| 8 | On Nikkei 225 Index, OTC Call expiring January 11, 2013 at 9000(e) | (51,483 | ) | |||||
| 10 | On Nikkei 225 Index, OTC Call expiring January 11, 2013 at 9250(e) | (40,858 | ) | |||||
| 10 | On S&P ASX 200® Index, OTC Call expiring December 20, 2012 at 4425(e) | (11,480 | ) | |||||
| 9 | On S&P ASX 200® Index, OTC Call expiring December 20, 2012 at 4450(e) | (8,256 | ) | |||||
| 12 | On S&P ASX 200® Index, OTC Call expiring December 20, 2012 at 4475(e) | (9,222 | ) | |||||
| 9 | On S&P ASX 200® Index, OTC Call expiring December 20, 2012 at 4500(e) | (5,258 | ) | |||||
| 14 | On S&P ASX 200® Index, OTC Call expiring January 17, 2013 at 4500(e) | (11,613 | ) | |||||
| 15 | On Swiss Market Index, OTC Call expiring December 21, 2012 at 6550(e) | (45,458 | ) | |||||
| 12 | On Swiss Market Index, OTC Call expiring December 21, 2012 at 6600(e) | (30,389 | ) | |||||
| 8 | On Swiss Market Index, OTC Call expiring December 21, 2012 at 6700(e) | (12,513 | ) | |||||
|
|
|
|||||||
| Total Written Options (Premiums Received $659,257) |
$ | (974,597 | ) | |||||
|
|
|
|||||||
See accompanying notes to financial statements.
| 46
Table of Contents
Portfolio of Investments – as of November 30, 2012
Gateway International Fund – (continued)
| (†) | See Note 2 of Notes to Financial Statements. | |||||||
| * | Common stocks are grouped by geographical regions that correspond to the markets underlying each of the indices on which the Fund writes call options and buys put options. | |||||||
| (a) | Federal Tax Information: | |||||||
| At November 30, 2012, the net unrealized appreciation on investments based on a cost of $25,884,797 for federal income tax purposes was as follows: | ||||||||
| Aggregate gross unrealized appreciation for all investments in which there is an excess of value over tax cost | $ | 1,955,452 | ||||||
| Aggregate gross unrealized depreciation for all investments in which there is an excess of tax cost over value | (859,318 | ) | ||||||
|
|
|
|||||||
| Net unrealized appreciation | $ | 1,096,134 | ||||||
|
|
|
|||||||
| (b) | All or a portion of this security has been designated to cover the Fund’s obligations under open outstanding call options. | |||||||
| (c) | Non-income producing security. | |||||||
| (d) | All or a portion of this security has been pledged as collateral for outstanding call options. | |||||||
| (e) | Counterparty is UBS AG. | |||||||
| OTC | Over-the-Counter | |||||||
Industry Summary at November 30, 2012 (Unaudited)
| Commercial Banks |
12.6 | % | ||
| Pharmaceuticals |
10.2 | |||
| Oil, Gas & Consumable Fuels |
8.9 | |||
| Food Products |
5.2 | |||
| Metals & Mining |
5.2 | |||
| Insurance |
3.9 | |||
| Chemicals |
3.4 | |||
| Machinery |
3.3 | |||
| Wireless Telecommunication Services |
3.2 | |||
| Beverages |
3.2 | |||
| Automobiles |
2.8 | |||
| Diversified Telecommunication Services |
2.8 | |||
| Capital Markets |
2.2 | |||
| Specialty Retail |
2.1 | |||
| Other Investments, less than 2% each |
28.4 | |||
| Short-Term Investments |
1.9 | |||
|
|
|
|||
| Total Investments |
99.3 | |||
| Other assets less liabilities (including open written options) |
0.7 | |||
|
|
|
|||
| Net Assets |
100.0 | % | ||
|
|
|
See accompanying notes to financial statements.
47 |
Table of Contents
Portfolio of Investments – as of November 30, 2012
Gateway International Fund – (continued)
Country of Risk Summary at November 30, 2012 (Unaudited)
| Japan |
21.9 | % | ||
| United Kingdom |
21.5 | |||
| France |
10.7 | |||
| Germany |
10.0 | |||
| Australia |
9.4 | |||
| Switzerland |
9.3 | |||
| Netherlands |
3.7 | |||
| Spain |
3.6 | |||
| Italy |
2.1 | |||
| Other Investments, less than 2% each |
5.2 | |||
| Short-Term Investments |
1.9 | |||
|
|
|
|||
| Total Investments |
99.3 | |||
| Other assets less liabilities (including open written options) |
0.7 | |||
|
|
|
|||
| Net Assets |
100.0 | % | ||
|
|
|
Currency Exposure Summary at November 30, 2012 (Unaudited)
| Euro |
29.7 | % | ||
| British Pound |
23.4 | |||
| Japanese Yen |
21.9 | |||
| Swiss Franc |
9.5 | |||
| Australian Dollar |
9.4 | |||
| Hong Kong Dollar |
3.5 | |||
| United States Dollar |
1.9 | |||
|
|
|
|||
| Total Investments |
99.3 | |||
| Other assets less liabilities (including open written options) |
0.7 | |||
|
|
|
|||
| Net Assets |
100.0 | % | ||
|
|
|
See accompanying notes to financial statements.
| 48
Table of Contents
Portfolio of Investments – as of November 30, 2012
Loomis Sayles Capital Income Fund
| Shares | Description | Value (†) | ||||||
| Common Stocks — 78.9% of Net Assets | ||||||||
| Aerospace & Defense — 3.1% | ||||||||
| 4,406 | Honeywell International, Inc. | $ | 270,220 | |||||
| 5,070 | Northrop Grumman Corp. | 338,169 | ||||||
|
|
|
|||||||
| 608,389 | ||||||||
|
|
|
|||||||
| Beverages — 3.2% | ||||||||
| 10,114 | Coca-Cola Enterprises, Inc. | 315,355 | ||||||
| 4,378 | PepsiCo, Inc. | 307,379 | ||||||
|
|
|
|||||||
| 622,734 | ||||||||
|
|
|
|||||||
| Capital Markets — 2.2% | ||||||||
| 10,314 | Bank of New York Mellon Corp. (The) | 246,917 | ||||||
| 9,828 | Federated Investors, Inc., Class B | 195,086 | ||||||
|
|
|
|||||||
| 442,003 | ||||||||
|
|
|
|||||||
| Chemicals — 1.5% | ||||||||
| 6,784 | E.I. du Pont de Nemours & Co. | 292,662 | ||||||
|
|
|
|||||||
| Commercial Banks — 1.4% | ||||||||
| 5,040 | PNC Financial Services Group, Inc. | 282,946 | ||||||
|
|
|
|||||||
| Commercial Services & Supplies — 1.1% | ||||||||
| 6,381 | Waste Management, Inc. | 207,829 | ||||||
|
|
|
|||||||
| Communications Equipment — 1.6% | ||||||||
| 5,679 | Motorola Solutions, Inc.(b) | 309,222 | ||||||
|
|
|
|||||||
| Computers & Peripherals — 1.2% | ||||||||
| 402 | Apple, Inc. | 235,283 | ||||||
|
|
|
|||||||
| Construction Materials — 1.5% | ||||||||
| 3,312 | Martin Marietta Materials, Inc. | 298,080 | ||||||
|
|
|
|||||||
| Diversified Consumer Services — 1.9% | ||||||||
| 20,942 | H&R Block, Inc. | 377,584 | ||||||
|
|
|
|||||||
| Diversified Financial Services — 2.1% | ||||||||
| 10,118 | JPMorgan Chase & Co. | 415,647 | ||||||
|
|
|
|||||||
| Diversified Telecommunication Services — 2.7% | ||||||||
| 7,145 | AT&T, Inc. | 243,859 | ||||||
| 7,260 | CenturyLink, Inc. | 281,978 | ||||||
|
|
|
|||||||
| 525,837 | ||||||||
|
|
|
|||||||
| Electric Utilities — 3.2% | ||||||||
| 7,803 | FirstEnergy Corp. | 331,315 | ||||||
| 10,060 | PPL Corp. | 295,261 | ||||||
|
|
|
|||||||
| 626,576 | ||||||||
|
|
|
|||||||
| Electrical Equipment — 1.9% | ||||||||
| 7,117 | Eaton Corp. | 371,223 | ||||||
|
|
|
|||||||
| Energy Equipment & Services — 2.3% | ||||||||
| 4,387 | Diamond Offshore Drilling, Inc. | 302,703 | ||||||
| 3,235 | Transocean Ltd. | 149,457 | ||||||
|
|
|
|||||||
| 452,160 | ||||||||
|
|
|
|||||||
See accompanying notes to financial statements.
49 |
Table of Contents
Portfolio of Investments – as of November 30, 2012
Loomis Sayles Capital Income Fund – (continued)
| Shares | Description | Value (†) | ||||||
| Food & Staples Retailing — 1.4% | ||||||||
| 7,874 | Walgreen Co. | $ | 267,007 | |||||
|
|
|
|||||||
| Gas Utilities — 1.8% | ||||||||
| 6,684 | National Fuel Gas Co. | 348,103 | ||||||
|
|
|
|||||||
| Health Care Equipment & Supplies — 1.6% | ||||||||
| 4,860 | Baxter International, Inc.(c) | 322,072 | ||||||
|
|
|
|||||||
| Household Durables — 0.9% | ||||||||
| 6,151 | Leggett & Platt, Inc. | 171,305 | ||||||
|
|
|
|||||||
| Industrial Conglomerates — 1.7% | ||||||||
| 15,868 | General Electric Co.(c) | 335,291 | ||||||
|
|
|
|||||||
| Insurance — 4.1% | ||||||||
| 9,233 | MetLife, Inc. | 306,443 | ||||||
| 3,731 | Travelers Cos., Inc. (The) | 264,230 | ||||||
| 11,318 | Unum Group | 230,774 | ||||||
|
|
|
|||||||
| 801,447 | ||||||||
|
|
|
|||||||
| Internet Software & Services — 0.8% | ||||||||
| 4,306 | AOL, Inc.(d) | 161,561 | ||||||
|
|
|
|||||||
| Machinery — 1.1% | ||||||||
| 3,077 | Stanley Black & Decker, Inc. | 221,267 | ||||||
|
|
|
|||||||
| Media — 3.0% | ||||||||
| 7,212 | Comcast Corp., Class A | 268,142 | ||||||
| 6,098 | Viacom, Inc., Class B | 314,718 | ||||||
|
|
|
|||||||
| 582,860 | ||||||||
|
|
|
|||||||
| Multiline Retail — 1.1% | ||||||||
| 4,723 | Kohl’s Corp. | 210,882 | ||||||
|
|
|
|||||||
| Oil, Gas & Consumable Fuels — 7.3% | ||||||||
| 3,207 | Chevron Corp. | 338,948 | ||||||
| 3,803 | ExxonMobil Corp. | 335,196 | ||||||
| 8,517 | Kinder Morgan, Inc. | 287,960 | ||||||
| 8,645 | Regency Energy Partners L.P. | 193,389 | ||||||
| 5,774 | Total S.A., Sponsored ADR | 289,624 | ||||||
|
|
|
|||||||
| 1,445,117 | ||||||||
|
|
|
|||||||
| Pharmaceuticals — 8.3% | ||||||||
| 11,000 | Bristol-Myers Squibb Co. | 358,930 | ||||||
| 5,282 | GlaxoSmithKline PLC, Sponsored ADR | 227,179 | ||||||
| 8,360 | Merck & Co., Inc. | 370,348 | ||||||
| 14,663 | Pfizer, Inc. | 366,868 | ||||||
| 7,159 | Sanofi, ADR | 319,435 | ||||||
|
|
|
|||||||
| 1,642,760 | ||||||||
|
|
|
|||||||
| REITs - Diversified — 1.7% | ||||||||
| 12,393 | Weyerhaeuser Co. | 341,551 | ||||||
|
|
|
|||||||
| REITs - Warehouse/Industrials — 1.3% | ||||||||
| 7,739 | ProLogis, Inc. | 262,662 | ||||||
|
|
|
|||||||
See accompanying notes to financial statements.
| 50
Table of Contents
Portfolio of Investments – as of November 30, 2012
Loomis Sayles Capital Income Fund – (continued)
| Shares | Description | Value (†) | ||||||
| Road & Rail — 1.8% | ||||||||
| 5,932 | Norfolk Southern Corp. | $ | 358,174 | |||||
|
|
|
|||||||
| Semiconductors & Semiconductor Equipment — 1.5% | ||||||||
| 10,090 | Texas Instruments, Inc. | 297,352 | ||||||
|
|
|
|||||||
| Software — 1.4% | ||||||||
| 10,305 | Microsoft Corp. | 274,319 | ||||||
|
|
|
|||||||
| Specialty Retail — 3.1% | ||||||||
| 11,236 | American Eagle Outfitters, Inc. | 238,203 | ||||||
| 10,206 | Lowe’s Cos., Inc. | 368,335 | ||||||
|
|
|
|||||||
| 606,538 | ||||||||
|
|
|
|||||||
| Thrifts & Mortgage Finance — 1.2% | ||||||||
| 20,022 | People’s United Financial, Inc. | 244,068 | ||||||
|
|
|
|||||||
| Tobacco — 1.5% | ||||||||
| 2,476 | Lorillard, Inc. | 299,992 | ||||||
|
|
|
|||||||
| Wireless Telecommunication Services — 1.4% | ||||||||
| 10,969 | Vodafone Group PLC, Sponsored ADR | 283,000 | ||||||
|
|
|
|||||||
| Total Common Stocks (Identified Cost $14,882,740) |
15,545,503 | |||||||
|
|
|
|||||||
| Principal Amount (‡) |
||||||||
| Bonds and Notes — 18.5% | ||||||||
| Non-Convertible Bonds — 17.3% | ||||||||
| Banking — 3.5% | ||||||||
| $ | 300,000 | BNP Paribas S.A., (fixed rate to 6/25/2037, variable rate thereafter), 7.195%, 6/29/2049, 144A |
298,125 | |||||
| 100,000 | Morgan Stanley, 8.000%, 5/09/2017, (AUD) | 114,836 | ||||||
| 280,000 | Royal Bank of Scotland Group PLC, 4.700%, 7/03/2018 | 277,648 | ||||||
|
|
|
|||||||
| 690,609 | ||||||||
|
|
|
|||||||
| Brokerage — 0.7% | ||||||||
| 125,000 | Jefferies Group, Inc., 6.875%, 4/15/2021 | 138,438 | ||||||
|
|
|
|||||||
| Electric — 2.1% | ||||||||
| 400,000 | EDP Finance BV, 6.000%, 2/02/2018, 144A | 412,000 | ||||||
|
|
|
|||||||
| Government Sponsored — 1.2% | ||||||||
| 240,000 | Eksportfinans ASA, 2.000%, 9/15/2015 | 230,040 | ||||||
|
|
|
|||||||
| Healthcare — 1.4% | ||||||||
| 125,000 | HCA, Inc., 7.500%, 12/15/2023 | 126,875 | ||||||
| 150,000 | HCA, Inc., 7.500%, 11/06/2033 | 150,000 | ||||||
|
|
|
|||||||
| 276,875 | ||||||||
|
|
|
|||||||
| Home Construction — 1.6% | ||||||||
| 300,000 | Beazer Homes USA, Inc., 9.125%, 6/15/2018 | 309,000 | ||||||
|
|
|
|||||||
| Media Non-Cable — 1.1% | ||||||||
| 80,000 | R.R. Donnelley & Sons Co., 7.250%, 5/15/2018 | 77,000 | ||||||
| 150,000 | R.R. Donnelley & Sons Co., 8.250%, 3/15/2019 | 150,750 | ||||||
|
|
|
|||||||
| 227,750 | ||||||||
|
|
|
|||||||
See accompanying notes to financial statements.
51 |
Table of Contents
Portfolio of Investments – as of November 30, 2012
Loomis Sayles Capital Income Fund – (continued)
| Principal Amount (‡) |
Description | Value (†) | ||||||
| Non-Convertible Bonds — (continued) | ||||||||
| Non-Captive Consumer — 1.4% | ||||||||
| $ | 300,000 | SLM Corp., Series A, MTN, 5.625%, 8/01/2033 | $ | 279,750 | ||||
|
|
|
|||||||
| Retailers — 0.8% | ||||||||
| 125,000 | J.C. Penney Corp., Inc., 6.375%, 10/15/2036 | 94,687 | ||||||
| 70,000 | J.C. Penney Corp., Inc., 7.400%, 4/01/2037 | 59,588 | ||||||
|
|
|
|||||||
| 154,275 | ||||||||
|
|
|
|||||||
| Supermarket — 1.1% | ||||||||
| 400,000 | New Albertson’s, Inc., 8.000%, 5/01/2031 | 222,000 | ||||||
|
|
|
|||||||
| Wirelines — 2.4% | ||||||||
| 100,000 | Level 3 Financing, Inc., 8.125%, 7/01/2019 | 107,000 | ||||||
| 400,000 | Telecom Italia Capital S.A., 6.000%, 9/30/2034 | 369,000 | ||||||
|
|
|
|||||||
| 476,000 | ||||||||
|
|
|
|||||||
| Total Non-Convertible Bonds (Identified Cost $3,249,089) |
3,416,737 | |||||||
|
|
|
|||||||
| Convertible Bonds — 1.2% | ||||||||
| Brokerage — 0.3% | ||||||||
| 60,000 | Jefferies Group, Inc., 3.875%, 11/01/2029 | 59,625 | ||||||
|
|
|
|||||||
| Independent Energy — 0.9% | ||||||||
| 185,000 | Chesapeake Energy Corp., 2.750%, 11/15/2035 | 175,865 | ||||||
|
|
|
|||||||
| Total Convertible Bonds (Identified Cost $224,995) |
235,490 | |||||||
|
|
|
|||||||
| Total Bonds and Notes (Identified Cost $3,474,084) |
3,652,227 | |||||||
|
|
|
|||||||
| Short-Term Investments — 2.3% | ||||||||
| 445,879 | Tri-Party Repurchase Agreement with Fixed Income Clearing Corporation, dated 11/30/2012 at 0.010% to be repurchased at $445,879 on 12/03/2012 collateralized by $390,000 Federal Home Loan
Bank, 5.375% due 5/18/2016 valued at $456,300 including accrued interest (Note 2 of Notes to Financial Statements) (Identified Cost $445,879) |
445,879 | ||||||
|
|
|
|||||||
| Total Investments — 99.7% (Identified Cost $18,802,703)(a) |
19,643,609 | |||||||
| Other assets less liabilities — 0.3% | 53,619 | |||||||
|
|
|
|||||||
| Net Assets — 100.0% | $ | 19,697,228 | ||||||
|
|
|
|||||||
| Shares | ||||||||
| Written Options — (0.0%) | ||||||||
| Options on Securities — (0.0%) | ||||||||
| 1,200 | Baxter International, Inc., Call expiring December 22, 2012 at 67.50 | $ | (570 | ) | ||||
| 1,200 | E.I. du Pont de Nemours & Co., Put expiring December 22, 2012 at 41 | (246 | ) | |||||
See accompanying notes to financial statements.
| 52
Table of Contents
Portfolio of Investments – as of November 30, 2012
Loomis Sayles Capital Income Fund – (continued)
| Shares | Description | Value (†) | ||||||
| Options on Securities — continued | ||||||||
| 1,000 | Lowe’s Cos., Inc., Call expiring December 22, 2012 at 36 | $ | (915 | ) | ||||
| 1,000 | Norfolk Southern Corp., Put expiring December 22, 2012 at 57.50 | (300 | ) | |||||
| 1,200 | PNC Financial Services Group, Inc., Put expiring January 19, 2013 at 50 | (432 | ) | |||||
|
|
|
|||||||
| Total Written Options (Premiums Received $2,509) |
$ | (2,463 | ) | |||||
|
|
|
|||||||
| (‡) | Principal Amount stated in U.S. dollars unless otherwise noted. | |||||||
| (†) | See Note 2 of Notes to Financial Statements. | |||||||
| (a) | Federal Tax Information: | |||||||
| At November 30, 2012, the net unrealized appreciation on investments based on a cost of $18,817,497 for federal income tax purposes was as follows: | ||||||||
| Aggregate gross unrealized appreciation for all investments in which there is an excess of value over tax cost | $ | 1,264,839 | ||||||
| Aggregate gross unrealized depreciation for all investments in which there is an excess of tax cost over value | (438,727 | ) | ||||||
|
|
|
|||||||
| Net unrealized appreciation | $ | 826,112 | ||||||
|
|
|
|||||||
| (b) | All or a portion of this security has been pledged as collateral for outstanding options. | |||||||
| (c) | All or a portion of this security has been designated to cover the Fund’s obligations under open outstanding options. | |||||||
| (d) | Non-income producing security. | |||||||
| 144A | All or a portion of these securities are exempt from registration under Rule 144A of the Securities Act of 1933. These securities may be resold in transactions exempt from registration, normally to qualified institutional buyers. At November 30, 2012, the value of Rule 144A holdings amounted to $710,125 or 3.6% of net assets. | |||||||
| ADR | An American Depositary Receipt is a certificate issued by a custodian bank representing the right to receive securities of the foreign issuer described. The values of ADRs may be significantly influenced by trading on exchanges not located in the United States. | |||||||
| MTN | Medium Term Note | |||||||
| REITs | Real Estate Investment Trusts | |||||||
| AUD | Australian Dollar | |||||||
See accompanying notes to financial statements.
53 |
Table of Contents
Portfolio of Investments – as of November 30, 2012
Loomis Sayles Capital Income Fund – (continued)
Industry Summary at November 30, 2012 (Unaudited)
| Pharmaceuticals |
8.3 | % | ||
| Oil, Gas & Consumable Fuels |
7.3 | |||
| Insurance |
4.1 | |||
| Banking |
3.5 | |||
| Electric Utilities |
3.2 | |||
| Beverages |
3.2 | |||
| Aerospace & Defense |
3.1 | |||
| Specialty Retail |
3.1 | |||
| Media |
3.0 | |||
| Diversified Telecommunication Services |
2.7 | |||
| Wirelines |
2.4 | |||
| Energy Equipment & Services |
2.3 | |||
| Capital Markets |
2.2 | |||
| Diversified Financial Services |
2.1 | |||
| Electric |
2.1 | |||
| Other Investments, less than 2% each |
44.8 | |||
| Short-Term Investments |
2.3 | |||
|
|
|
|||
| Total Investments |
99.7 | |||
| Other assets less liabilities (including open written options) |
0.3 | |||
|
|
|
|||
| Net Assets |
100.0 | % | ||
|
|
|
See accompanying notes to financial statements.
| 54
Table of Contents
Portfolio of Investments – as of November 30, 2012
Loomis Sayles Senior Floating Rate and Fixed Income Fund
| Principal Amount |
Description | Value (†) | ||||||
| Senior Loans — 83.1% of Net Assets | ||||||||
| Aerospace & Defense — 1.5% | ||||||||
| $ | 450,000 | Camp International Holding Company, New 2nd Lien Term Loan, 10.000%, 11/29/2019(b) | $ | 456,975 | ||||
| 727,000 | Engility Corporation, Term Loan, 5.750%, 7/13/2017(b) | 717,004 | ||||||
| 207,141 | PRV Aerospace LLC, Term Loan B, 5/09/2018(c) | 206,623 | ||||||
| 199,500 | PRV Aerospace LLC, Term Loan B, 6.500%, 5/09/2018(b) | 199,001 | ||||||
| 324,000 | Six3 Systems, Inc., Term Loan B, 7.000%, 10/04/2019(b) | 324,000 | ||||||
| 74,300 | Transdigm, Inc., Add-On Term Loan B2, 4.000%, 2/14/2017(b) | 74,610 | ||||||
| 236,625 | Wyle Services Corporation, Term Loan B, 5.000%, 3/27/2017(b) | 237,217 | ||||||
|
|
|
|||||||
| 2,215,430 | ||||||||
|
|
|
|||||||
| Airlines — 0.8% | ||||||||
| 1,260,000 | Delta Air Lines, Inc., Term Loan B1, 5.250%, 10/10/2018(b) | 1,264,725 | ||||||
|
|
|
|||||||
| Automotive — 2.7% | ||||||||
| 145,825 | August LuxUK Holding Company S.A.R.L., Luxco Term Loan, 6.250%, 4/27/2018(b) | 147,283 | ||||||
| 112,175 | August U.S. Holding Company, Inc., Term Loan B, 6.250%, 4/27/2018(b) | 113,297 | ||||||
| 850,862 | Diversified Machine, Inc., Term Loan B, 9.279%, 12/01/2016(d) | 838,806 | ||||||
| 365,540 | Grede LLC, Term Loan B, 7.000%, 4/03/2017(b) | 365,083 | ||||||
| 919,000 | Navistar International Corporation, Term Loan B, 7.000%, 8/17/2017(b) | 920,737 | ||||||
| 576,227 | TI Group Automotive Systems LLC, New Term Loan, 6.750%, 3/14/2018(b) | 579,108 | ||||||
| 400,000 | Transtar Holding Company, New 2nd Lien Term Loan, 10/09/2019(c) | 400,000 | ||||||
| 700,000 | Transtar Holding Company, New 2nd Lien Term Loan, 9.750%, 10/09/2019(b) | 700,000 | ||||||
|
|
|
|||||||
| 4,064,314 | ||||||||
|
|
|
|||||||
| Banking — 1.1% | ||||||||
| 1,213,681 | Harland Clarke Holdings Corp., Extended Term Loan B2, 5.459%, 6/30/2017(b) | 1,118,103 | ||||||
| 550,000 | US FT Holdco, Inc., Term Loan B, 7.500%, 11/30/2017(b) | 552,063 | ||||||
|
|
|
|||||||
| 1,670,166 | ||||||||
|
|
|
|||||||
| Building Materials — 2.4% | ||||||||
| 635,000 | CPG International, Inc., Term Loan, 5.750%, 9/18/2019(b) | 638,175 | ||||||
| 1,200,000 | QS0001 Corp., Second Lien Term Loan, 9.250%, 9/29/2016(b) | 1,215,000 | ||||||
| 1,007,000 | Roofing Supply Group LLC, Term Loan, 7.038%, 5/24/2019(d) | 1,007,836 | ||||||
| 224,226 | Wilsonart International Holdings LLC, Term Loan B, 10/31/2019(c) | 225,347 | ||||||
| 482,000 | Wilsonart International Holdings LLC, Term Loan B, 5.500%, 10/31/2019(b) | 484,410 | ||||||
|
|
|
|||||||
| 3,570,768 | ||||||||
|
|
|
|||||||
| Chemicals — 4.8% | ||||||||
| 933,934 | Ascend Performance Materials LLC, Term Loan B, 6.750%, 4/10/2018(b) | 915,255 | ||||||
| 510,277 | AZ Chem US, Inc., Recap Term Loan, 7.250%, 12/22/2017(b) | 517,931 | ||||||
| 339,150 | Emerald Performance Materials LLC, Term Loan B, 6.750%, 5/18/2018(b) | 339,150 | ||||||
| 792,155 | Ineos US Finance LLC, 6 year Term Loan, 6.500%, 5/04/2018(b) | 801,185 | ||||||
| 756,832 | Kleopatra Acquisition Corp., Term Loan B1, 5.750%, 12/21/2016(b) | 758,724 | ||||||
| 444,375 | Kronos Worldwide, Inc., Term Loan B, 5.750%, 6/13/2018(b) | 446,783 | ||||||
| 209,000 | Nexeo Solutions LLC, Incremental Term Loan, 5.000%, 9/08/2017(b) | 204,885 | ||||||
| 524,684 | Nexeo Solutions LLC, Term Loan B, 9/08/2017(c) | 514,353 | ||||||
| 379,360 | Nexeo Solutions LLC, Term Loan B, 5.000%, 9/08/2017(b) | 371,891 | ||||||
| 405,791 | PetroLogistics LP, Term Loan B, 7.000%, 3/23/2017(b) | 411,817 | ||||||
| 438,795 | Taminco Global Chemical Corporation, Term Loan B1, 5.250%, 2/15/2019(b) | 441,695 | ||||||
See accompanying notes to financial statements.
55 |
Table of Contents
Portfolio of Investments – as of November 30, 2012
Loomis Sayles Senior Floating Rate and Fixed Income Fund – (continued)
| Principal Amount |
Description | Value (†) | ||||||
| Chemicals — continued | ||||||||
| $ | 1,540,000 | Univar, Inc., Term Loan B, 5.000%, 6/30/2017(b) | $ | 1,530,052 | ||||
|
|
|
|||||||
| 7,253,721 | ||||||||
|
|
|
|||||||
| Consumer Cyclical Services — 5.1% | ||||||||
| 450,000 | AlixPartners LLP, 2nd Lien Term Loan, 10.750%, 12/27/2019(b) | 454,126 | ||||||
| 515,000 | Allied Security Holdings LLC, 1st Lien Term Loan, 2/03/2017(c) | 515,257 | ||||||
| 297,413 | Catalina Marketing Corporation, 2017 Term Loan B, 5.709%, 9/29/2017(b) | 297,413 | ||||||
| 212,000 | Garda World Security Corp., Term Loan B, 4.500%, 11/13/2019(b) | 214,120 | ||||||
| 517,730 | Go Daddy Operating Company LLC, New Term Loan, 5.500%, 12/17/2018(b) | 516,436 | ||||||
| 916,465 | Inmar, Inc., New Term Loan B, 6.500%, 8/04/2017(b) | 917,592 | ||||||
| 728,000 | SNL Financial LC, New Term Loan B, 5.500%, 10/23/2018(b) | 726,180 | ||||||
| 919,674 | SourceHov LLC, 1st Lien Term Loan, 6.625%, 4/28/2017(b) | 906,642 | ||||||
| 525,000 | Southern Graphics, Inc., Term Loan, 5.000%, 10/17/2019(b) | 524,344 | ||||||
| 863,300 | SRA International, Inc., Term Loan B, 6.500%, 7/20/2018(b) | 820,135 | ||||||
| 694,000 | Sterling Infosystems, Inc., Term Loan A, 2/01/2018(c) | 692,265 | ||||||
| 159,200 | Sterling Infosystems, Inc., Term Loan A, 7.252%, 2/01/2018(d) | 158,802 | ||||||
| 492,756 | U.S. Security Holdings, Inc., New Term Loan, 6.000%, 7/28/2017(b) | 493,988 | ||||||
| 336,158 | West Corporation, Term Loan B6, 5.750%, 6/29/2018(b) | 341,200 | ||||||
|
|
|
|||||||
| 7,578,500 | ||||||||
|
|
|
|||||||
| Consumer Products — 2.5% | ||||||||
| 800,000 | Advantage Sales & Marketing, Inc., 2nd Lien Term Loan, 9.250%, 6/18/2018(b) | 799,504 | ||||||
| 187,018 | FGI Operating Company LLC, Term Loan, 5.502%, 4/19/2019(d) | 188,421 | ||||||
| 554,901 | HMK Intermediate Holdings LLC, Term Loan, 7.250%, 3/29/2019(b) | 556,288 | ||||||
| 912,000 | Serta Simmons Holdings LLC, Term Loan, 5.000%, 10/01/2019(b) | 910,860 | ||||||
| 400,000 | SRAM LLC, 2nd Lien Term Loan, 8.500%, 12/07/2018(b) | 404,000 | ||||||
| 634,000 | Tempur-Pedic International, Inc., New Term Loan B, 11/20/2019(c) | 636,060 | ||||||
| 300,000 | Visant Holding Corp., Term Loan B, 5.250%, 12/22/2016(b) | 270,450 | ||||||
|
|
|
|||||||
| 3,765,583 | ||||||||
|
|
|
|||||||
| Diversified Manufacturing — 0.6% | ||||||||
| 397,978 | Douglas Dynamics Holdings, Inc., New Term Loan, 5.750%, 4/18/2018(b) | 393,501 | ||||||
| 485,238 | Edwards (Cayman Islands II) Limited, Extended 1st Lien Term Loan, 5.500%, 5/31/2016(b) | 485,034 | ||||||
|
|
|
|||||||
| 878,535 | ||||||||
|
|
|
|||||||
| Electric — 1.1% | ||||||||
| 1,035,000 | Calpine Corporation, Term Loan B3, 4.500%, 4/02/2018(b) | 1,041,252 | ||||||
| 300,000 | Mirion Technologies, Inc., 1st Lien Term Loan, 3/30/2018(c) | 300,000 | ||||||
| 234,113 | Mirion Technologies, Inc., 1st Lien Term Loan, 6.250%, 3/30/2018(b) | 234,113 | ||||||
|
|
|
|||||||
| 1,575,365 | ||||||||
|
|
|
|||||||
| Entertainment — 1.0% | ||||||||
| 438,372 | ClubCorp Club Operations, Inc., Term Loan B, 5.000%, 11/30/2016(b) | 443,852 | ||||||
| 543,000 | Party City Holdings, Inc., New Term Loan B, 5.750%, 7/26/2019(b) | 547,751 | ||||||
| 219,450 | SMG (Stadium Management Group), New Term Loan B, 5.500%, 6/07/2018(b) | 219,999 | ||||||
| 234,000 | WMG Acquisition Corp., Term Loan, 5.250%, 10/25/2018(b) | 235,682 | ||||||
|
|
|
|||||||
| 1,447,284 | ||||||||
|
|
|
|||||||
See accompanying notes to financial statements.
| 56
Table of Contents
Portfolio of Investments – as of November 30, 2012
Loomis Sayles Senior Floating Rate and Fixed Income Fund – (continued)
| Principal Amount |
Description | Value (†) | ||||||
| Environmental — 0.5% | ||||||||
| $ | 768,000 | ADS Waste Holdings, Inc., Term Loan B, 5.250%, 10/09/2019(b) | $ | 776,064 | ||||
|
|
|
|||||||
| Financial Other — 3.6% | ||||||||
| 800,000 | Connolly Holdings, Inc., 2nd Lien Term Loan, 10.500%, 7/15/2019(b) | 816,000 | ||||||
| 253,500 | Hamilton Lane Advisors LLC, Term Loan, 6.500%, 2/28/2018(b) | 252,232 | ||||||
| 695,000 | Harbourvest Partners LLC, Term Loan B, 4.750%, 11/21/2017(b) | 695,869 | ||||||
| 834,007 | Ipreo Holdings LLC, Term Loan B2, 6.500%, 8/05/2017(b) | 836,092 | ||||||
| 35,735 | Ipreo Holdings LLC, Term Loan B3, 6.500%, 8/05/2017(b) | 35,825 | ||||||
| 1,102,000 | Nuveen Investments, Inc., New 2nd Lien Term Loan, 8.250%, 2/28/2019(b) | 1,118,530 | ||||||
| 637,665 | Triple Point Technology, Inc., New 1st Lien Term Loan, 6.250%, 10/27/2017(b) | 636,070 | ||||||
| 1,000,000 | Wall Street Systems, Inc., New 2nd Lien Term Loan, 9.250%, 10/26/2020(b) | 1,000,000 | ||||||
|
|
|
|||||||
| 5,390,618 | ||||||||
|
|
|
|||||||
| Food & Beverage — 2.2% | ||||||||
| 500,000 | Arctic Glacier USA, Inc., Term Loan B, 7/19/2018(c) | 503,750 | ||||||
| 367,650 | Arctic Glacier USA, Inc., Term Loan B, 8.500%, 7/19/2018(b) | 370,407 | ||||||
| 550,000 | CPM Acquisition Corp., 2nd Lien Term Loan, 10.250%, 2/28/2018(b) | 554,125 | ||||||
| 450,000 | Del Monte Foods Company, Term Loan, 4.500%, 3/08/2018(b) | 450,162 | ||||||
| 456,705 | DS Waters Enterprises LP, 1st Lien Term Loan, 10.500%, 8/29/2017(b) | 469,265 | ||||||
| 666,000 | Milk Specialties Company, New Term Loan B, 7.000%, 11/07/2018(b) | 657,675 | ||||||
| 275,000 | OSI Restaurant Partners LLC, New Term Loan B, 4.750%, 10/25/2019(b) | 277,406 | ||||||
|
|
|
|||||||
| 3,282,790 | ||||||||
|
|
|
|||||||
| Gaming — 0.5% | ||||||||
| 450,000 | Peninsula Gaming LLC, Term Loan, 5.750%, 8/03/2017(b) | 455,908 | ||||||
| 267,655 | Tropicana Entertainment, Inc., Term Loan B, 7.500%, 3/16/2018(b) | 269,885 | ||||||
|
|
|
|||||||
| 725,793 | ||||||||
|
|
|
|||||||
| Healthcare — 8.9% | ||||||||
| 1,000,000 | AssuraMed Holding, Inc., 2nd Lien Term Loan, 9.250%, 4/24/2020(b) | 1,005,000 | ||||||
| 297,603 | ATI Physical Therapy, Term Loan, 7.500%, 3/11/2016(b) | 297,603 | ||||||
| 455,556 | Aurora Diagnostics LLC, Term Loan B, 6.250%, 5/26/2016(b) | 454,417 | ||||||
| 1,000,000 | CHG Buyer Corporation, 2nd Lien Term Loan, 9.000%, 11/19/2020(b) | 997,190 | ||||||
| 668,660 | Convatec, Inc., Term Loan, 5.000%, 12/22/2016(b) | 672,338 | ||||||
| 463,670 | DJO Finance LLC, Term Loan B3, 6.250%, 9/15/2017(b) | 465,325 | ||||||
| 496,000 | Equinox Fitness Clubs, 1st Lien Term Loan, 11/16/2019(c) | 494,760 | ||||||
| 228,000 | Kindred Healthcare, Inc., Add on Term Loan B, 6.000%, 6/01/2018(b) | 223,440 | ||||||
| 600,000 | Kindred Healthcare, Inc., Term Loan, 5.250%, 6/01/2018(b) | 588,498 | ||||||
| 656,000 | Kinetic Concepts, Inc., Term Loan C1, 5.500%, 5/04/2018(b) | 660,454 | ||||||
| 297,750 | National Healing Corporation, 1st Lien Term Loan, 8.250%, 11/30/2017(b) | 298,494 | ||||||
| 179,550 | Physiotherapy Associates Holdings, Inc., 1st Lien Term Loan, 6.010%, 4/30/2018(d) | 179,401 | ||||||
| 350,000 | PLATO, Inc., 2nd Lien Term Loan, 11.250%, 5/09/2019(b) | 339,500 | ||||||
| 400,000 | Press Ganey Associates, Inc., 2nd Lien Term Loan, 8.250%, 10/18/2018(b) | 398,000 | ||||||
| 804,000 | Renaissance Learning, Inc., New Term Loan B, 5.750%, 11/13/2018(b) | 804,000 | ||||||
| 400,000 | Rural/Metro Corporation, Term Loan, 6/29/2018(c) | 393,332 | ||||||
| 500,000 | Rural/Metro Corporation, Term Loan, 5.750%, 6/29/2018(b) | 491,665 | ||||||
| 450,000 | Sheridan Holdings, Inc., New 2nd Lien Term Loan, 9.000%, 7/01/2019(b) | 454,500 | ||||||
| 296,250 | Surgical Care Affiliates, Inc., Incremental Term Loan B, 5.500%, 6/29/2018(b) | 295,015 | ||||||
See accompanying notes to financial statements.
57 |
Table of Contents
Portfolio of Investments – as of November 30, 2012
Loomis Sayles Senior Floating Rate and Fixed Income Fund – (continued)
| Principal Amount |
Description | Value (†) | ||||||
| Healthcare — continued | ||||||||
| $ | 920,000 | TriZetto Group, Inc., (The), 2nd Lien Term Loan D, 8.500%, 3/27/2019(b) | $ | 911,665 | ||||
| 436,894 | TriZetto Group, Inc., (The), Term Loan B, 4.750%, 5/02/2018(b) | 430,777 | ||||||
| 915,000 | Truven Health Analytics, Inc., New Term Loan B, 5.750%, 6/06/2019(b) | 914,771 | ||||||
| 293,525 | United Surgical Partners International, Inc., Incremental Term Loan, 6.000%, 4/03/2019(b) | 294,259 | ||||||
| 1,195,000 | Valitas Health Services, Inc., Term Loan B, 5.750%, 6/02/2017(b) | 1,192,013 | ||||||
|
|
|
|||||||
| 13,256,417 | ||||||||
|
|
|
|||||||
| Industrial Other — 6.0% | ||||||||
| 1,000,000 | Brand Energy & Infrastructure Services, Inc., New 2nd Lien Term Loan, 9.750%, 10/23/2019(b) | 983,500 | ||||||
| 805,000 | Dexter Axle Company, Term Loan B, 7.000%, 11/01/2018(b) | 809,025 | ||||||
| 782,000 | GCA Services Group, Inc., Term Loan B, 5.250%, 11/01/2019(b) | 778,739 | ||||||
| 520,695 | Generac Power Systems, Inc., New Term Loan B, 6.250%, 2/08/2019(b) | 531,109 | ||||||
| 298,500 | Hupah Finance, Inc., Term Loan B, 6.274%, 1/21/2019(d) | 301,112 | ||||||
| 710,000 | Intelligrated, Inc., 1st Lien Term Loan, 6.750%, 7/30/2018(b) | 716,212 | ||||||
| 241,337 | Jimmy Sanders, Inc., Term Loan, 11/14/2018(c) | 234,852 | ||||||
| 767,000 | Jimmy Sanders, Inc., Term Loan, 6.750%, 11/14/2018(b) | 746,391 | ||||||
| 671,000 | MRC Global, Inc., Term Loan B, 6.250%, 10/24/2019(b) | 671,000 | ||||||
| 804,000 | New Breed, Inc., Term Loan B, 6.000%, 10/01/2019(b) | 795,960 | ||||||
| 274,592 | ON Assignment, Inc., Term Loan B, 5.000%, 5/15/2019(b) | 275,965 | ||||||
| 355,000 | Rexnord Corporation, REFI Term Loan B, 4.500%, 4/02/2018(b) | 357,812 | ||||||
| 91,500 | Schaeffler AG, USD Term Loan C2, 6.000%, 1/27/2017(b) | 92,615 | ||||||
| 281,185 | Tank Holding Corp., New Term Loan B, 5.500%, 7/09/2019(b) | 281,537 | ||||||
| 424,365 | TriNet Group, Inc., Term Loan B, 6.500%, 10/24/2018(b) | 424,365 | ||||||
| 547,122 | Unifrax Corporation, New Term Loan, 6.500%, 11/28/2018(b) | 551,679 | ||||||
| 426,000 | WireCo WorldGroup, Inc., New Term Loan, 6.000%, 2/15/2017(b) | 430,793 | ||||||
|
|
|
|||||||
| 8,982,666 | ||||||||
|
|
|
|||||||
| Media Cable — 0.2% | ||||||||
| 271,250 | Crown Media Holdings, Inc., Term Loan B, 5.750%, 7/14/2018(b) | 271,589 | ||||||
|
|
|
|||||||
| Media Non-Cable — 3.0% | ||||||||
| 396,679 | Cumulus Media Holdings, Inc., First Lien Term Loan, 5.750%, 9/17/2018(b) | 398,167 | ||||||
| 1,013,530 | Dex Media West LLC, New Term Loan, 7.000%, 10/24/2014(b) | 681,599 | ||||||
| 197,667 | Entercom Radio LLC, Term Loan B, 5.012%, 11/23/2018(d) | 198,222 | ||||||
| 719,000 | Getty Images, Inc., Term Loan B, 4.750%, 10/18/2019(b) | 721,495 | ||||||
| 300,000 | Hubbard Radio LLC, 2nd Lien Term Loan, 8.750%, 4/30/2018(b) | 303,750 | ||||||
| 613,459 | Rovi Solutions Corporation, Term Loan B2, 4.000%, 3/29/2019(b) | 602,723 | ||||||
| 900,000 | SuperMedia, Inc., Exit Term Loan, 12/31/2015(c) | 586,125 | ||||||
| 195,542 | SuperMedia, Inc., Exit Term Loan, 11.000%, 12/31/2015(b) | 127,347 | ||||||
| 899,795 | Univision Communications, Inc., Extended Term Loan, 4.459%, 3/31/2017(b) | 878,281 | ||||||
|
|
|
|||||||
| 4,497,709 | ||||||||
|
|
|
|||||||
| Metals & Mining — 4.5% | ||||||||
| 448,861 | American Rock Salt Holdings LLC, Term Loan, 5.500%, 4/25/2017(b) | 443,156 | ||||||
| 1,103,465 | Arch Coal, Inc., Term Loan B, 5.750%, 5/16/2018(b) | 1,113,120 | ||||||
| 410,952 | Fairmount Minerals Ltd., New Term Loan B, 5.250%, 3/15/2017(b) | 409,497 | ||||||
| 1,210,180 | FMG America Finance, Inc., Term Loan, 5.250%, 10/18/2017(b) | 1,213,205 | ||||||
See accompanying notes to financial statements.
| 58
Table of Contents
Portfolio of Investments – as of November 30, 2012
Loomis Sayles Senior Floating Rate and Fixed Income Fund – (continued)
| Principal Amount |
Description | Value (†) | ||||||
| Metals & Mining — continued | ||||||||
| $ | 438,750 | Patriot Coal Corporation, DIP First-Out Term Loan, 9.250%, 10/04/2013(b) | $ | 440,123 | ||||
| 681,000 | Phoenix Services LLC, Term Loan, 6/30/2017(c) | 673,339 | ||||||
| 641,010 | Preferred Proppants LLC, Term Loan B, 7.500%, 12/15/2016(b) | 589,730 | ||||||
| 300,490 | Tube City IMS Corporation, Term Loan, 5.750%, 3/20/2019(b) | 303,119 | ||||||
| 566,000 | United Distribution Group, Inc., Term Loan, 7.500%, 10/09/2018(b) | 543,360 | ||||||
| 1,000,000 | Walter Energy, Inc., Term Loan B, 4/02/2018(c) | 1,002,500 | ||||||
|
|
|
|||||||
| 6,731,149 | ||||||||
|
|
|
|||||||
| Non-Captive Diversified — 1.1% | ||||||||
| 167,403 | AWAS Finance Luxembourg 2012 S.A., New Term Loan, 4.750%, 7/16/2018(b) | 169,496 | ||||||
| 1,475,362 | Istar Financial, Inc., Term Loan, 5.750%, 9/28/2017(b) | 1,475,731 | ||||||
|
|
|
|||||||
| 1,645,227 | ||||||||
|
|
|
|||||||
| Oil Field Services — 1.0% | ||||||||
| 450,000 | Pinnacle Holdco S.A.R.L., 2nd Lien Term Loan, 10.500%, 7/24/2020(b) | 453,096 | ||||||
| 700,000 | Pinnacle Holdco S.A.R.L., Term Loan, 7/24/2019(c) | 698,600 | ||||||
| 141,151 | Utex Industries, Inc., Add on Term Loan B, 7.010%, 12/15/2016(d) | 141,681 | ||||||
| 186,056 | Utex Industries, Inc., Term Loan B, 7.010%, 12/15/2016(d) | 186,753 | ||||||
|
|
|
|||||||
| 1,480,130 | ||||||||
|
|
|
|||||||
| Packaging — 1.7% | ||||||||
| 712,000 | BWAY Corporation, Term Loan B, 4.500%, 8/07/2017(b) | 717,340 | ||||||
| 331,539 | Husky Injection Molding Systems Ltd, New Term Loan B, 5.750%, 6/29/2018(b) | 335,683 | ||||||
| 265,000 | Pro Mach, Inc., New Term Loan B, 5.000%, 7/06/2017(b) | 266,325 | ||||||
| 1,000,000 | Reynolds Group Holdings, Inc., New Dollar Term Loan, 4.750%, 9/28/2018(b) | 1,007,390 | ||||||
| 224,438 | TricorBraun, Inc., New Term Loan B, 5.500%, 5/03/2018(b) | 224,718 | ||||||
|
|
|
|||||||
| 2,551,456 | ||||||||
|
|
|
|||||||
| Paper — 0.4% | ||||||||
| 250,000 | Hoffmaster Group, Inc., 2nd Lien Term Loan, 11.000%, 1/03/2019(b) | 249,375 | ||||||
| 400,000 | NewPage Corporation, DIP Term Loan, 8.750%, 3/07/2013(b) | 399,752 | ||||||
|
|
|
|||||||
| 649,127 | ||||||||
|
|
|
|||||||
| Pharmaceuticals — 2.2% | ||||||||
| 287,000 | IMS Health, Inc., New Term Loan B, 4.500%, 8/25/2017(b) | 289,092 | ||||||
| 771,247 | Inc Research, Inc., Term Loan B, 7.000%, 7/12/2018(b) | 774,625 | ||||||
| 224,430 | inVentiv Health, Inc., Combined Term Loan, 6.500%, 8/04/2016(b) | 211,526 | ||||||
| 200,000 | inVentiv Health, Inc., Incremental Term Loan B3, 5/15/2018(c) | 195,000 | ||||||
| 495,745 | inVentiv Health, Inc., Incremental Term Loan B3, 6.750%, 5/15/2018(b) | 483,351 | ||||||
| 895,000 | Par Pharmaceutical Companies, Inc., Term Loan B, 5.000%, 9/30/2019(b) | 892,020 | ||||||
| 397,388 | Pharmaceutical Product Development, Inc., Term Loan B, 6.250%, 12/05/2018(b) | 403,102 | ||||||
|
|
|
|||||||
| 3,248,716 | ||||||||
|
|
|
|||||||
| Pipelines — 0.4% | ||||||||
| 645,000 | NGPL PipeCo LLC, Term Loan B, 6.750%, 9/15/2017(b) | 657,365 | ||||||
|
|
|
|||||||
| Property & Casualty Insurance — 1.3% | ||||||||
| 385,000 | AmWINS Group, Inc., New 2nd Lien Term Loan, 9.250%, 12/06/2019(b) | 388,207 | ||||||
| 600,000 | Applied Systems, Inc., 2nd Lien Term Loan, 9.500%, 6/08/2017(b) | 603,000 | ||||||
| 900,000 | Cunningham Lindsey Group, Inc., 2nd Lien Term Loan, 6/10/2020(c) | 910,125 | ||||||
|
|
|
|||||||
| 1,901,332 | ||||||||
|
|
|
|||||||
See accompanying notes to financial statements.
59 |
Table of Contents
Portfolio of Investments – as of November 30, 2012
Loomis Sayles Senior Floating Rate and Fixed Income Fund – (continued)
| Principal Amount |
Description | Value (†) | ||||||
| Restaurants — 1.2% | ||||||||
| $ | 170,000 | Brasa Holdings, Inc., 1st Lien Term Loan, 7.500%, 7/19/2019(b) | $ | 170,850 | ||||
| 300,000 | Brasa Holdings, Inc., 2nd Lien Term Loan, 11.000%, 1/20/2020(b) | 301,500 | ||||||
| 356,000 | Centerplate, Inc., Term Loan B, 5.753%, 10/15/2018(d) | 356,890 | ||||||
| 412,925 | Landry’s, Inc., Term Loan B, 6.500%, 4/24/2018(b) | 416,022 | ||||||
| 311,212 | P.F. Chang’s China Bistro, Inc., Term Loan B, 6.250%, 7/02/2019(b) | 313,919 | ||||||
| 288,161 | Sagittarius Restaurants LLC, Term Loan B, 7.505%, 5/18/2015(d) | 287,081 | ||||||
|
|
|
|||||||
| 1,846,262 | ||||||||
|
|
|
|||||||
| Retailers — 3.5% | ||||||||
| 500,000 | BJ’s Wholesale Club, Inc., New 2nd Lien Term Loan, 9.750%, 3/26/2020(b) | 513,000 | ||||||
| 830,055 | David’s Bridal, Inc., New Term Loan B, 5.000%, 10/11/2019(b) | 825,904 | ||||||
| 1,179,000 | Evergreen Acqco 1 LP, New Term Loan, 5.000%, 7/09/2019(b) | 1,179,884 | ||||||
| 677,963 | Gymboree Corporation, (The), Initial Term Loan, 5.000%, 2/23/2018(b) | 653,895 | ||||||
| 598,500 | Harbor Freight Tools USA, Inc., Term Loan B, 5.500%, 11/14/2017(b) | 601,989 | ||||||
| 498,734 | J Crew Group, Inc., New Term Loan B, 4.500%, 3/07/2018(b) | 499,547 | ||||||
| 447,750 | RGIS Services LLC, Term Loan C, 5.500%, 10/18/2017(b) | 448,579 | ||||||
| 582,000 | Sportsman’s Warehouse Holdings, Inc., Term Loan B, 8.500%, 11/13/2018(b) | 576,180 | ||||||
|
|
|
|||||||
| 5,298,978 | ||||||||
|
|
|
|||||||
| Supermarkets — 1.0% | ||||||||
| 685,000 | Acosta, Inc., Term Loan D, 5.000%, 3/02/2018(b) | 690,569 | ||||||
| 296,241 | Sprouts Farmers Markets Holdings LLC, Term Loan, 6.000%, 4/18/2018(b) | 299,203 | ||||||
| 441,893 | Supervalu, Inc., New Term Loan B, 8.000%, 8/30/2018(b) | 445,635 | ||||||
|
|
|
|||||||
| 1,435,407 | ||||||||
|
|
|
|||||||
| Technology — 9.3% | ||||||||
| 212,431 | Aspect Software, Inc., New Term Loan B, 7.000%, 5/06/2016(b) | 208,448 | ||||||
| 200,000 | Blackboard, Inc., 2nd Lien Term Loan, 11.500%, 4/04/2019(b) | 189,700 | ||||||
| 485,000 | Blackboard, Inc., Term Loan B, 10/04/2018(c) | 487,425 | ||||||
| 173,136 | Blackboard, Inc., Term Loan B, 7.500%, 10/04/2018(b) | 174,002 | ||||||
| 801,903 | Blackboard, Inc., Term Loan B2, 6.250%, 10/04/2018(b) | 800,099 | ||||||
| 279,000 | CDC Consona Corporation, Term Loan B, 7.250%, 8/06/2018(b) | 279,000 | ||||||
| 875,000 | CompuCom Systems, Inc., 2nd Lien Term Loan, 10.250%, 10/04/2019(b) | 860,781 | ||||||
| 500,000 | Deltek, Inc., 2nd Lien Tem Loan, 10.000%, 10/10/2019(b) | 506,875 | ||||||
| 1,479,773 | Eastman Kodak Company, DIP Term Loan B, 8.500%, 7/19/2013(b) | 1,477,923 | ||||||
| 1,000,000 | EIG Investors Corp., New 2nd Lien Term Loan, 10.250%, 11/08/2019(b) | 995,000 | ||||||
| 600,000 | First Data Corporation, 2017 Term Loan B, 5.208%, 3/24/2017(b) | 585,000 | ||||||
| 600,000 | First Data Corporation, Extended 2017 US Term Loan, 5.208%, 3/24/2017(b) | 588,450 | ||||||
| 850,000 | Freescale Semiconductor, Inc., Extended Term Loan B, 4.462%, 12/01/2016(b) | 823,862 | ||||||
| 291,391 | Genesys Telecom Holdings, U.S., Inc., Term Loan B, 6.750%, 1/31/2019(b) | 293,940 | ||||||
| 810,700 | Infor (US), Inc., Term Loan B2, 5.250%, 4/05/2018(b) | 818,199 | ||||||
| 431,830 | Nxp B.V., Incremental Term Loan B, 5.250%, 3/19/2019(b) | 434,529 | ||||||
| 208,425 | Openlink International Intermediate, Inc., Initial Term Loan, 7.750%, 10/30/2017(b) | 208,946 | ||||||
| 400,000 | Rocket Software, Inc., 2nd Lien Term Loan, 10.250%, 2/08/2019(b) | 401,000 | ||||||
| 29,364 | Rocket Software, Inc., Delayed Draw Term Loan, 5.750%, 2/08/2018(b) | 29,364 | ||||||
| 385,035 | Shield Finance Co. S.A.R.L., New Term Loan B, 6.500%, 5/10/2019(b) | 384,554 | ||||||
| 556,000 | Sirius Computer Solutions, Inc., Term Loan B, 11/30/2018(c) | 550,440 | ||||||
| 1,000,000 | SumTotal Systems, Inc., 2nd Lien Term Loan, 10.250%, 5/16/2019(b) | 985,000 | ||||||
See accompanying notes to financial statements.
| 60
Table of Contents
Portfolio of Investments – as of November 30, 2012
Loomis Sayles Senior Floating Rate and Fixed Income Fund – (continued)
| Principal Amount |
Description | Value (†) | ||||||
| Technology — continued | ||||||||
| $ | 441,635 | Telx Group, Inc., Term Loan B, 6.250%, 9/26/2017(b) | $ | 444,948 | ||||
| 875,000 | Vision Solutions, Inc., 2nd Lien Term Loan, 9.500%, 7/23/2017(b) | 840,000 | ||||||
| 300,000 | Web.com Group, Inc., 2nd Lien Term Loan, 10/26/2018(c) | 307,500 | ||||||
| 266,667 | Web.com Group, Inc., 2nd Lien Term Loan, 11.000%, 10/26/2018(b) | 273,333 | ||||||
|
|
|
|||||||
| 13,948,318 | ||||||||
|
|
|
|||||||
| Transportation Services — 0.9% | ||||||||
| 643,000 | FleetPride Corporation, 1st Lien Term Loan, 5.250%, 11/19/2019(b) | 641,798 | ||||||
| 355,215 | Road Infrastructure Investment LLC, Term Loan B, 6.250%, 3/30/2018(b) | 354,327 | ||||||
| 413,237 | Wabash National Corporation, Term Loan B, 6.000%, 5/02/2019(b) | 417,369 | ||||||
|
|
|
|||||||
| 1,413,494 | ||||||||
|
|
|
|||||||
| Utility Other — 0.5% | ||||||||
| 400,000 | Sensus USA, Inc., 2nd Lien Term Loan, 5/09/2018(c) | 402,000 | ||||||
| 300,000 | Sensus USA, Inc., 2nd Lien Term Loan, 8.500%, 5/09/2018(b) | 301,500 | ||||||
|
|
|
|||||||
| 703,500 | ||||||||
|
|
|
|||||||
| Wireless — 0.7% | ||||||||
| 200,000 | Asurion LLC, New 1st Lien Term Loan, 5.500%, 5/24/2018(b) | 201,594 | ||||||
| 267,516 | Asurion LLC, New 2nd Lien Term Loan, 9.000%, 5/24/2019(b) | 275,006 | ||||||
| 400,000 | Hawaiian Telcom Communications, Inc., Term Loan B, 7.000%, 2/28/2017(b) | 406,752 | ||||||
| 234,000 | SBA Finance, Add on Term Loan, 3.750%, 9/27/2019(b) | 234,702 | ||||||
|
|
|
|||||||
| 1,118,054 | ||||||||
|
|
|
|||||||
| Wirelines — 4.9% | ||||||||
| 531,375 | CCGI Holding Corporation, Term Loan B, 7.500%, 12/20/2017(b) | 520,747 | ||||||
| 824,000 | Consolidated Communications, Inc., Term Loan B3, 12/31/2018(c) | 820,910 | ||||||
| 1,902,676 | Fairpoint Communications, Inc., New Term Loan B, 6.500%, 1/22/2016(b) | 1,822,402 | ||||||
| 478,000 | Fibertech Networks LLC, New Term Loan, 12/18/2019(c) | 480,988 | ||||||
| 467,742 | Global Tel*Link Corporation, New Term Loan B, 6.000%, 12/14/2017(b) | 468,911 | ||||||
| 947,000 | Level 3 Financing, Inc., Term Loan, 4.750%, 8/01/2019(b) | 951,735 | ||||||
| 394,987 | Sidera Networks, Inc., Term Loan, 6.000%, 8/26/2016(b) | 393,704 | ||||||
| 895,654 | U.S. Telepacific Corporation, New Term Loan B, 5.750%, 2/23/2017(b) | 883,715 | ||||||
| 914,031 | Zayo Group LLC, REFI Term Loan B, 5.250%, 7/02/2019(b) | 919,616 | ||||||
|
|
|
|||||||
| 7,262,728 | ||||||||
|
|
|
|||||||
| Total Senior Loans (Identified Cost $123,378,281) |
124,359,280 | |||||||
|
|
|
|||||||
| Bonds and Notes — 10.5% | ||||||||
| Chemicals — 0.9% | ||||||||
| 1,000,000 | INEOS Group Holdings, S.A., 8.500%, 2/15/2016, 144A | 980,000 | ||||||
| 400,000 | Momentive Performance Materials, Inc., 12.500%, 6/15/2014 | 413,000 | ||||||
|
|
|
|||||||
| 1,393,000 | ||||||||
|
|
|
|||||||
| Consumer Products — 0.4% | ||||||||
| 600,000 | Visant Corp., 10.000%, 10/01/2017 | 522,000 | ||||||
|
|
|
|||||||
| Entertainment — 0.7% | ||||||||
| 1,000,000 | ClubCorp Club Operations, Inc., 10.000%, 12/01/2018 | 1,111,250 | ||||||
|
|
|
|||||||
See accompanying notes to financial statements.
61 |
Table of Contents
Portfolio of Investments – as of November 30, 2012
Loomis Sayles Senior Floating Rate and Fixed Income Fund – (continued)
| Principal Amount |
Description | Value (†) | ||||||
| Gaming — 0.2% | ||||||||
| $ | 300,000 | MGM Resorts International, 7.625%, 1/15/2017 | $ | 318,750 | ||||
|
|
|
|||||||
| Healthcare — 0.6% | ||||||||
| 500,000 | Alere, Inc., 9.000%, 5/15/2016 | 525,000 | ||||||
| 400,000 | Surgical Care Affiliates, Inc., 10.000%, 7/15/2017, 144A | 415,000 | ||||||
|
|
|
|||||||
| 940,000 | ||||||||
|
|
|
|||||||
| Media Non-Cable — 1.0% | ||||||||
| 525,000 | Clear Channel Communications, Inc., 5.500%, 9/15/2014 | 488,250 | ||||||
| 1,000,000 | Intelsat Luxembourg S.A., 11.250%, 2/04/2017 | 1,060,000 | ||||||
|
|
|
|||||||
| 1,548,250 | ||||||||
|
|
|
|||||||
| Metals & Mining — 0.3% | ||||||||
| 500,000 | Ryerson, Inc./Joseph T Ryerson & Son, Inc., 9.000%, 10/15/2017, 144A | 495,000 | ||||||
|
|
|
|||||||
| Non-Captive Consumer — 0.7% | ||||||||
| 1,100,000 | Springleaf Finance Corp., MTN, 5.750%, 9/15/2016 | 984,500 | ||||||
|
|
|
|||||||
| Oil Field Services — 1.8% | ||||||||
| 800,000 | Global Geophysical Services, Inc., 10.500%, 5/01/2017 | 734,000 | ||||||
| 1,200,000 | Hercules Offshore, Inc., 10.500%, 10/15/2017, 144A | 1,275,000 | ||||||
| 700,000 | Parker Drilling Co., 9.125%, 4/01/2018 | 745,500 | ||||||
|
|
|
|||||||
| 2,754,500 | ||||||||
|
|
|
|||||||
| Property & Casualty Insurance — 0.7% | ||||||||
| 700,000 | USI Holdings Corp., 9.750%, 5/15/2015, 144A | 721,000 | ||||||
| 300,000 | White Mountains Re Group Ltd., (fixed rate to 6/30/2017, variable rate thereafter), 7.506%, 5/29/2049, 144A | 309,126 | ||||||
|
|
|
|||||||
| 1,030,126 | ||||||||
|
|
|
|||||||
| Supermarket — 0.7% | ||||||||
| 1,100,000 | SUPERVALU, Inc., 7.500%, 11/15/2014 | 1,039,500 | ||||||
|
|
|
|||||||
| Technology — 0.3% | ||||||||
| 400,000 | First Data Corp., 9.875%, 9/24/2015 | 409,000 | ||||||
|
|
|
|||||||
| Wireless — 1.5% | ||||||||
| 1,000,000 | Clearwire Communications LLC/Clearwire Finance, Inc., 12.000%, 12/01/2015, 144A | 1,055,000 | ||||||
| 1,100,000 | Wind Acquisition Finance, S.A., 11.750%, 7/15/2017, 144A | 1,124,750 | ||||||
|
|
|
|||||||
| 2,179,750 | ||||||||
|
|
|
|||||||
| Wirelines — 0.7% | ||||||||
| 1,000,000 | Integra Telecom Holdings, Inc., 10.750%, 4/15/2016, 144A | 1,030,000 | ||||||
|
|
|
|||||||
| Total Bonds and Notes (Identified Cost $15,622,957) |
15,755,626 | |||||||
|
|
|
|||||||
| Short-Term Investments — 10.1% | ||||||||
| 46,331 | Repurchase Agreement with State Street Bank and Trust Company, dated 11/30/2012 at 0.010% to be repurchased at $46,331 on 12/03/2012 collateralized by $50,000 Federal National Mortgage
Association, 2.080% due 11/02/2022 valued at $50,393 including accrued interest (Note 2 of Notes to Financial Statements) |
46,331 | ||||||
See accompanying notes to financial statements.
| 62
Table of Contents
Portfolio of Investments – as of November 30, 2012
Loomis Sayles Senior Floating Rate and Fixed Income Fund – (continued)
| Principal Amount |
Description | Value (†) | ||||||
| $ | 15,132,167 | Tri-Party Repurchase Agreement with Fixed Income Clearing Corporation, dated 11/30/2012 at 0.010% to be repurchased at $15,132,180 on 12/03/2012 collateralized by $15,445,000 U.S. Treasury
Bill, due 12/27/2012 valued at $15,437,278 including accrued interest (Note 2 of Notes to Financial Statements) |
$ | 15,132,167 | ||||
|
|
|
|||||||
| Total Short-Term Investments (Identified Cost $15,178,498) |
15,178,498 | |||||||
|
|
|
|||||||
| Total Investments — 103.7% (Identified Cost $154,179,736)(a) |
155,293,404 | |||||||
| Other assets less liabilities — (3.7)% | (5,602,017 | ) | ||||||
|
|
|
|||||||
| Net Assets — 100.0% | $ | 149,691,387 | ||||||
|
|
|
|||||||
| (†) | See Note 2 of Notes to Financial Statements. | |||||||
| (a) | Federal Tax Information: | |||||||
| At November 30, 2012, the net unrealized appreciation on investments based on a cost of $154,291,106 for federal income tax purposes was as follows: | ||||||||
| Aggregate gross unrealized appreciation for all investments in which there is an excess of value over tax cost | $ | 1,404,184 | ||||||
| Aggregate gross unrealized depreciation for all investments in which there is an excess of tax cost over value | (401,886 | ) | ||||||
|
|
|
|||||||
| Net unrealized appreciation | $ | 1,002,298 | ||||||
|
|
|
|||||||
| (b) | Variable rate security. Rate as of November 30, 2012 is disclosed. | |||||||
| (c) | Position is unsettled. Contract rate was not determined at November 30, 2012 and does not take effect until settlement date. | |||||||
| (d) | Variable rate security. Rate shown represents the weighted average rate of underlying contracts at November 30, 2012. | |||||||
| 144A | All or a portion of these securities are exempt from registration under Rule 144A of the Securities Act of 1933. These securities may be resold in transactions exempt from registration, normally to qualified institutional buyers. At November 30, 2012, the value of Rule 144A holdings amounted to $7,404,876 or 4.9% of net assets. | |||||||
| MTN | Medium Term Note | |||||||
See accompanying notes to financial statements.
63 |
Table of Contents
Portfolio of Investments – as of November 30, 2012
Loomis Sayles Senior Floating Rate and Fixed Income Fund – (continued)
Industry Summary at November 30, 2012 (Unaudited)
| Technology |
9.6 | % | ||
| Healthcare |
9.5 | |||
| Industrial Other |
6.0 | |||
| Chemicals |
5.7 | |||
| Wirelines |
5.6 | |||
| Consumer Cyclical Services |
5.1 | |||
| Metals & Mining |
4.8 | |||
| Media Non-Cable |
4.0 | |||
| Financial Other |
3.6 | |||
| Retailers |
3.5 | |||
| Consumer Products |
2.9 | |||
| Oil Field Services |
2.8 | |||
| Automotive |
2.7 | |||
| Building Materials |
2.4 | |||
| Wireless |
2.2 | |||
| Food & Beverage |
2.2 | |||
| Pharmaceuticals |
2.2 | |||
| Property & Casualty Insurance |
2.0 | |||
| Other Investments, less than 2% each |
16.8 | |||
| Short-Term Investments |
10.1 | |||
|
|
|
|||
| Total Investments |
103.7 | |||
| Other assets less liabilities |
(3.7 | ) | ||
|
|
|
|||
| Net Assets |
100.0 | % | ||
|
|
|
See accompanying notes to financial statements.
| 64
Table of Contents
Portfolio of Investments – as of November 30, 2012
Vaughan Nelson Select Fund
| Shares | Description | Value (†) | ||||||
| Common Stocks — 94.6% of Net Assets | ||||||||
| Aerospace & Defense — 3.3% | ||||||||
| 1,400 | Precision Castparts Corp. | $ | 256,746 | |||||
|
|
|
|||||||
| Capital Markets — 2.2% | ||||||||
| 7,600 | SEI Investments Co. | 167,276 | ||||||
|
|
|
|||||||
| Chemicals — 2.1% | ||||||||
| 1,500 | Praxair, Inc. | 160,815 | ||||||
|
|
|
|||||||
| Commercial Banks — 2.9% | ||||||||
| 6,100 | CIT Group, Inc.(b) | 226,005 | ||||||
|
|
|
|||||||
| Commercial Services & Supplies — 7.9% | ||||||||
| 10,975 | Corrections Corp. of America | 372,052 | ||||||
| 8,325 | Republic Services, Inc. | 237,013 | ||||||
|
|
|
|||||||
| 609,065 | ||||||||
|
|
|
|||||||
| Computers & Peripherals — 4.8% | ||||||||
| 625 | Apple, Inc. | 365,800 | ||||||
|
|
|
|||||||
| Containers & Packaging — 5.3% | ||||||||
| 9,100 | Ball Corp. | 406,679 | ||||||
|
|
|
|||||||
| Diversified Financial Services — 3.9% | ||||||||
| 5,375 | CME Group, Inc., Class A | 297,076 | ||||||
|
|
|
|||||||
| Diversified Telecommunication Services — 2.0% | ||||||||
| 7,325 | Cogent Communications Group, Inc. | 154,851 | ||||||
|
|
|
|||||||
| Energy Equipment & Services — 3.3% | ||||||||
| 3,600 | Oil States International, Inc.(b) | 254,592 | ||||||
|
|
|
|||||||
| Food Products — 1.6% | ||||||||
| 2,050 | H.J. Heinz Co. | 119,843 | ||||||
|
|
|
|||||||
| Industrial Conglomerates — 5.1% | ||||||||
| 4,325 | 3M Co. | 393,359 | ||||||
|
|
|
|||||||
| Insurance — 3.1% | ||||||||
| 9,925 | XL Group PLC | 241,475 | ||||||
|
|
|
|||||||
| Internet Software & Services — 5.7% | ||||||||
| 625 | Google, Inc., Class A(b) | 436,481 | ||||||
|
|
|
|||||||
| IT Services — 4.6% | ||||||||
| 725 | MasterCard, Inc., Class A | 354,293 | ||||||
|
|
|
|||||||
| Media — 1.9% | ||||||||
| 2,875 | Viacom, Inc., Class B | 148,379 | ||||||
|
|
|
|||||||
| Oil, Gas & Consumable Fuels — 4.0% | ||||||||
| 4,300 | Plains Exploration & Production Co.(b) | 153,510 | ||||||
| 5,550 | QEP Resources, Inc. | 156,066 | ||||||
|
|
|
|||||||
| 309,576 | ||||||||
|
|
|
|||||||
| Pharmaceuticals — 6.2% | ||||||||
| 7,675 | Endo Health Solutions, Inc.(b) | 219,965 | ||||||
| 4,700 | Valeant Pharmaceuticals International, Inc.(b) | 259,816 | ||||||
|
|
|
|||||||
| 479,781 | ||||||||
|
|
|
|||||||
See accompanying notes to financial statements.
65 |
Table of Contents
Portfolio of Investments – as of November 30, 2012
Vaughan Nelson Select Fund – (continued)
| Shares | Description | Value (†) | ||||||
| Professional Services — 4.1% | ||||||||
| 5,925 | Towers Watson & Co., Class A | $ | 313,314 | |||||
|
|
|
|||||||
| Semiconductors & Semiconductor Equipment — 5.4% | ||||||||
| 6,700 | Avago Technologies Ltd. | 235,170 | ||||||
| 6,425 | Veeco Instruments, Inc.(b) | 182,856 | ||||||
|
|
|
|||||||
| 418,026 | ||||||||
|
|
|
|||||||
| Software — 9.8% | ||||||||
| 6,800 | MICROS Systems, Inc.(b) | 295,528 | ||||||
| 24,550 | Symantec Corp.(b) | 460,558 | ||||||
|
|
|
|||||||
| 756,086 | ||||||||
|
|
|
|||||||
| Specialty Retail — 5.4% | ||||||||
| 5,675 | Advance Auto Parts, Inc. | 415,126 | ||||||
|
|
|
|||||||
| Total Common Stocks (Identified Cost $7,196,591) |
7,284,644 | |||||||
|
|
|
|||||||
| Principal Amount |
||||||||
| Short-Term Investments — 6.0% | ||||||||
| $ | 459,803 | Tri-Party Repurchase Agreement with Fixed Income Clearing Corporation, dated 11/30/2012 at 0.010% to be repurchased at $459,803 on 12/03/2012 collateralized by $470,000 Federal National Mortgage Association, 1.060% due 10/12/2017 valued at $471,175 including accrued interest (Note 2 of Notes to Financial Statements) (Identified Cost $459,803) | 459,803 | |||||
|
|
|
|||||||
| Total Investments — 100.6% (Identified Cost $7,656,394)(a) |
7,744,447 | |||||||
| Other assets less liabilities — (0.6)% | (48,717 | ) | ||||||
|
|
|
|||||||
| Net Assets — 100.0% | $ | 7,695,730 | ||||||
|
|
|
|||||||
| (†) | See Note 2 of Notes to Financial Statements. | |||||||
| (a) | Federal Tax Information: | |||||||
| At November 30, 2012, the net unrealized depreciation on investments based on a cost of $7,751,368 for federal income tax purposes was as follows: | ||||||||
| Aggregate gross unrealized appreciation for all investments in which there is an excess of value over tax cost | $ | 158,035 | ||||||
| Aggregate gross unrealized depreciation for all investments in which there is an excess of tax cost over value | (164,956 | ) | ||||||
|
|
|
|||||||
| Net unrealized depreciation | $ | (6,921 | ) | |||||
|
|
|
|||||||
| (b) | Non-income producing security. | |||||||
See accompanying notes to financial statements.
| 66
Table of Contents
Portfolio of Investments – as of November 30, 2012
Vaughan Nelson Select Fund – (continued)
Industry Summary at November 30, 2012 (Unaudited)
| Software |
9.8 | % | ||
| Commercial Services & Supplies |
7.9 | |||
| Pharmaceuticals |
6.2 | |||
| Internet Software & Services |
5.7 | |||
| Semiconductors & Semiconductor Equipment |
5.4 | |||
| Specialty Retail |
5.4 | |||
| Containers & Packaging |
5.3 | |||
| Industrial Conglomerates |
5.1 | |||
| Computers & Peripherals |
4.8 | |||
| IT Services |
4.6 | |||
| Professional Services |
4.1 | |||
| Oil, Gas & Consumable Fuels |
4.0 | |||
| Diversified Financial Services |
3.9 | |||
| Aerospace & Defense |
3.3 | |||
| Energy Equipment & Services |
3.3 | |||
| Insurance |
3.1 | |||
| Commercial Banks |
2.9 | |||
| Capital Markets |
2.2 | |||
| Chemicals |
2.1 | |||
| Diversified Telecommunication Services |
2.0 | |||
| Other Investments, less than 2% each |
3.5 | |||
| Short-Term Investments |
6.0 | |||
|
|
|
|||
| Total Investments |
100.6 | |||
| Other assets less liabilities |
(0.6 | ) | ||
|
|
|
|||
| Net Assets |
100.0 | % | ||
|
|
|
See accompanying notes to financial statements.
67 |
Table of Contents
Statements of Assets and Liabilities
November 30, 2012
| ASG Growth Markets Fund (Consolidated*) |
Gateway International Fund |
Loomis Sayles Capital Income Fund |
||||||||||
| ASSETS |
||||||||||||
| Investments at cost |
$ | 19,822,571 | $ | 25,841,768 | $ | 18,802,703 | ||||||
| Net unrealized appreciation |
1,500,344 | 1,139,163 | 840,906 | |||||||||
|
|
|
|
|
|
|
|||||||
| Investments at value |
21,322,915 | 26,980,931 | 19,643,609 | |||||||||
| Cash |
2,240,597 | — | — | |||||||||
| Due from brokers (including variation margin on futures contracts) (Note 2) |
1,944,617 | — | — | |||||||||
| Foreign currency at value (identified cost $7,280, $1,096,653 and $0) |
7,238 | 1,098,252 | — | |||||||||
| Receivable for Fund shares sold |
— | 38,160 | — | |||||||||
| Receivable from investment adviser (Note 6) |
— | 10,424 | 909 | |||||||||
| Receivable for securities sold |
— | 761 | — | |||||||||
| Dividends and interest receivable |
14,173 | 96,788 | 119,354 | |||||||||
| Unrealized appreciation on forward foreign currency contracts (Note 2) |
187,302 | — | — | |||||||||
| Tax reclaims receivable |
— | 18,529 | 2,385 | |||||||||
| Unrealized appreciation on futures contracts (Note 2) |
449,905 | — | — | |||||||||
|
|
|
|
|
|
|
|||||||
| TOTAL ASSETS |
26,166,747 | 28,243,845 | 19,766,257 | |||||||||
|
|
|
|
|
|
|
|||||||
| LIABILITIES |
||||||||||||
| Options written, at value (premiums received $0, $659,257 and $2,509) (Note 2) |
— | 974,597 | 2,463 | |||||||||
| Payable for securities purchased |
— | 10,887 | — | |||||||||
| Unrealized depreciation on forward foreign currency contracts (Note 2) |
71,532 | — | — | |||||||||
| Unrealized depreciation on futures contracts (Note 2) |
151,530 | — | — | |||||||||
| Management fees payable (Note 6) |
4,058 | — | — | |||||||||
| Deferred Trustees’ fees (Note 6) |
9,493 | 6,124 | 6,096 | |||||||||
| Administrative fees payable (Note 6) |
15,590 | 1,004 | 712 | |||||||||
| Payable to distributor (Note 6d) |
6 | 60 | 36 | |||||||||
| Other accounts payable and accrued expenses |
88,253 | 91,109 | 59,722 | |||||||||
|
|
|
|
|
|
|
|||||||
| TOTAL LIABILITIES |
340,462 | 1,083,781 | 69,029 | |||||||||
|
|
|
|
|
|
|
|||||||
| NET ASSETS |
$ | 25,826,285 | $ | 27,160,064 | $ | 19,697,228 | ||||||
|
|
|
|
|
|
|
|||||||
| NET ASSETS CONSIST OF: |
||||||||||||
| Paid-in capital |
$ | 26,543,545 | $ | 26,827,907 | $ | 18,677,274 | ||||||
| Undistributed net investment income |
397,293 | 526,288 | 147,370 | |||||||||
| Accumulated net realized gain (loss) on investments, futures contracts, options written and foreign currency transactions |
(3,030,854 | ) | (1,017,868 | ) | 31,630 | |||||||
| Net unrealized appreciation on investments, futures contracts, options written and foreign currency translations |
1,916,301 | 823,737 | 840,954 | |||||||||
|
|
|
|
|
|
|
|||||||
| NET ASSETS |
$ | 25,826,285 | $ | 27,160,064 | $ | 19,697,228 | ||||||
|
|
|
|
|
|
|
|||||||
| * | See Notes 1 and 2 of the Notes to Financial Statements. |
See accompanying notes to financial statements.
|68
Table of Contents
Statements of Assets and Liabilities (continued)
November 30, 2012
| ASG Growth Markets Fund (Consolidated*) |
Gateway International Fund |
Loomis Sayles Capital Income Fund |
||||||||||
| COMPUTATION OF NET ASSET VALUE AND |
||||||||||||
| Class A shares: |
||||||||||||
| Net assets |
$ | 500,519 | $ | 5,632,034 | $ | 2,691,026 | ||||||
|
|
|
|
|
|
|
|||||||
| Shares of beneficial interest |
51,518 | 567,939 | 257,928 | |||||||||
|
|
|
|
|
|
|
|||||||
| Net asset value and redemption price per share |
$ | 9.72 | $ | 9.92 | $ | 10.43 | ||||||
|
|
|
|
|
|
|
|||||||
| Offering price per share (100/[100-maximum sales charge] of net asset value) (Note 1) |
$ | 10.31 | $ | 10.53 | $ | 11.07 | ||||||
|
|
|
|
|
|
|
|||||||
| Class C shares: (redemption price per share is equal to net asset value less any applicable contingent deferred sales charge) (Note 1) |
||||||||||||
| Net assets |
$ | 38,221 | $ | 241,199 | $ | 61,494 | ||||||
|
|
|
|
|
|
|
|||||||
| Shares of beneficial interest |
3,960 | 24,410 | 5,901 | |||||||||
|
|
|
|
|
|
|
|||||||
| Net asset value and offering price per share |
$ | 9.65 | $ | 9.88 | $ | 10.42 | ||||||
|
|
|
|
|
|
|
|||||||
| Class Y shares: |
||||||||||||
| Net assets |
$ | 25,287,545 | $ | 21,286,831 | $ | 16,944,708 | ||||||
|
|
|
|
|
|
|
|||||||
| Shares of beneficial interest |
2,597,253 | 2,141,187 | 1,623,165 | |||||||||
|
|
|
|
|
|
|
|||||||
| Net asset value, offering and redemption price |
$ | 9.74 | $ | 9.94 | $ | 10.44 | ||||||
|
|
|
|
|
|
|
|||||||
| * | See Notes 1 and 2 of the Notes to Financial Statements. |
See accompanying notes to financial statements.
69 |
Table of Contents
Statements of Assets and Liabilities (continued)
November 30, 2012
| Loomis Sayles Senior Floating Rate and Fixed Income Fund |
Vaughan Nelson Select Fund |
|||||||
| ASSETS |
||||||||
| Investments at cost |
$ | 154,179,736 | $ | 7,656,394 | ||||
| Net unrealized appreciation |
1,113,668 | 88,053 | ||||||
|
|
|
|
|
|||||
| Investments at value |
155,293,404 | 7,744,447 | ||||||
| Receivable for Fund shares sold |
5,649,197 | 40,400 | ||||||
| Receivable from investment adviser (Note 6) |
— | 14,126 | ||||||
| Receivable for securities sold |
814,706 | — | ||||||
| Dividends receivable |
955,496 | 7,248 | ||||||
|
|
|
|
|
|||||
| TOTAL ASSETS |
162,712,803 | 7,806,221 | ||||||
|
|
|
|
|
|||||
| LIABILITIES |
||||||||
| Payable for securities purchased |
12,770,976 | — | ||||||
| Payable for Fund shares redeemed |
67,129 | 51,052 | ||||||
| Management fees payable (Note 6) |
28,479 | — | ||||||
| Deferred Trustees’ fees (Note 6) |
10,436 | 3,090 | ||||||
| Administrative fees payable (Note 6) |
4,960 | 318 | ||||||
| Payable to distributor (Note 6d) |
2,091 | 11 | ||||||
| Other accounts payable and accrued expenses |
137,345 | 56,020 | ||||||
|
|
|
|
|
|||||
| TOTAL LIABILITIES |
13,021,416 | 110,491 | ||||||
|
|
|
|
|
|||||
| NET ASSETS |
$ | 149,691,387 | $ | 7,695,730 | ||||
|
|
|
|
|
|||||
| NET ASSETS CONSIST OF: |
||||||||
| Paid-in capital |
$ | 146,903,791 | $ | 7,435,283 | ||||
| Undistributed net investment income |
878,372 | 3,398 | ||||||
| Accumulated net realized gain on investments |
795,556 | 168,996 | ||||||
| Net unrealized appreciation on investments |
1,113,668 | 88,053 | ||||||
|
|
|
|
|
|||||
| NET ASSETS |
$ | 149,691,387 | $ | 7,695,730 | ||||
|
|
|
|
|
|||||
| COMPUTATION OF NET ASSET VALUE AND OFFERING PRICE: |
||||||||
| Class A shares: |
||||||||
| Net assets |
$ | 80,141,143 | $ | 776,765 | ||||
|
|
|
|
|
|||||
| Shares of beneficial interest |
7,585,792 | 73,981 | ||||||
|
|
|
|
|
|||||
| Net asset value and redemption price per share |
$ | 10.56 | $ | 10.50 | ||||
|
|
|
|
|
|||||
| Offering price per share (100/[100-maximum sales charge] of net asset value) (Note 1) |
$ | 10.94 | $ | 11.14 | ||||
|
|
|
|
|
|||||
| Class C shares: (redemption price per share is equal to net asset value less any applicable contingent deferred sales charge) (Note 1) |
||||||||
| Net assets |
$ | 22,655,192 | $ | 159,466 | ||||
|
|
|
|
|
|||||
| Shares of beneficial interest |
2,148,677 | 15,231 | ||||||
|
|
|
|
|
|||||
| Net asset value and offering price per share |
$ | 10.54 | $ | 10.47 | ||||
|
|
|
|
|
|||||
| Class Y shares: |
||||||||
| Net assets |
$ | 46,895,052 | $ | 6,759,499 | ||||
|
|
|
|
|
|||||
| Shares of beneficial interest |
4,437,975 | 642,984 | ||||||
|
|
|
|
|
|||||
| Net asset value, offering and redemption price per share |
$ | 10.57 | $ | 10.51 | ||||
|
|
|
|
|
|||||
See accompanying notes to financial statements.
| 70
Table of Contents
Statements of Operations
For the Year Ended November 30, 2012
| ASG Growth Markets Fund (Consolidated*) |
Gateway International Fund (a) |
Loomis Sayles Capital Income Fund (a) |
||||||||||
| INVESTMENT INCOME |
||||||||||||
| Interest |
$ | 10,501 | $ | 25 | $ | 162,833 | ||||||
| Dividends |
512,563 | 638,608 | 405,638 | (c) | ||||||||
| Less net foreign taxes withheld |
(53,169 | ) | (46,491 | ) | (3,016 | ) | ||||||
|
|
|
|
|
|
|
|||||||
| 469,895 | 592,142 | 565,455 | ||||||||||
|
|
|
|
|
|
|
|||||||
| Expenses |
||||||||||||
| Management fees (Note 6) |
309,333 | 121,064 | 70,161 | |||||||||
| Service and distribution fees (Note 6) |
1,083 | 7,319 | 3,419 | |||||||||
| Administrative fees (Note 6) |
69,910 | 7,253 | 5,255 | |||||||||
| Trustees’ and directors’ fees and expenses (Note 6) |
33,268 | 12,374 | 12,293 | |||||||||
| Transfer agent fees and expenses (Note 6) |
768 | 4,065 | 2,745 | |||||||||
| Audit and tax services fees |
65,181 | 47,000 | 45,450 | |||||||||
| Commitment fees (Note 7) |
77 | 52 | 38 | |||||||||
| Custodian fees and expenses |
142,668 | 91,101 | 12,113 | |||||||||
| Interest expense (Note 10) |
7,403 | — | — | |||||||||
| Legal fees |
3,390 | 213 | 153 | |||||||||
| Registration fees |
44,069 | 51,660 | 21,272 | |||||||||
| Security pricing fees |
— | 27,110 | — | |||||||||
| Shareholder reporting expenses |
5,939 | 4,378 | 4,915 | |||||||||
| Miscellaneous expenses |
21,140 | 7,569 | 4,511 | |||||||||
|
|
|
|
|
|
|
|||||||
| Total expenses |
704,229 | 381,158 | 182,325 | |||||||||
| Less waiver and/or expense reimbursement (Note 6) |
(321,879 | ) | (196,241 | ) | (67,819 | ) | ||||||
|
|
|
|
|
|
|
|||||||
| Net expenses |
382,350 | 184,917 | 114,506 | |||||||||
|
|
|
|
|
|
|
|||||||
| Net investment income |
87,545 | 407,225 | 450,949 | |||||||||
|
|
|
|
|
|
|
|||||||
| NET REALIZED AND UNREALIZED GAIN (LOSS) ON INVESTMENTS, FUTURES CONTRACTS, OPTIONS WRITTEN AND FOREIGN CURRENCY TRANSACTIONS |
||||||||||||
| Net realized gain (loss) on: |
||||||||||||
| Investments |
(96,460 | ) | (974,062 | ) | 7,878 | |||||||
| Futures contracts |
(2,066,362 | ) | — | — | ||||||||
| Options written |
— | (19,302 | ) | 14,989 | ||||||||
| Foreign currency transactions |
(635,933 | ) | 77,204 | 153 | ||||||||
| Net change in unrealized appreciation (depreciation) on: |
||||||||||||
| Investments |
1,285,101 | 1,139,163 | 840,906 | |||||||||
| Futures contracts |
338,823 | — | — | |||||||||
| Options written |
— | (315,340 | ) | 46 | ||||||||
| Foreign currency translations |
156,756 | (86 | ) | 2 | ||||||||
|
|
|
|
|
|
|
|||||||
| Net realized and unrealized gain (loss) on investments, futures contracts, options written and foreign currency transactions |
(1,018,075 | ) | (92,423 | ) | 863,974 | |||||||
|
|
|
|
|
|
|
|||||||
| NET INCREASE (DECREASE) IN NET ASSETS RESULTING FROM OPERATIONS |
$ | (930,530 | ) | $ | 314,802 | $ | 1,314,923 | |||||
|
|
|
|
|
|
|
|||||||
| * | See Notes 1 and 2 of the Notes to Financial Statements. |
| (a) | From commencement of operations on March 30, 2012 through November 30, 2012. |
| (b) | From commencement of operations on June 29, 2012 through November 30, 2012. |
| (c) | Includes a non-recurring dividend of $49,707. |
See accompanying notes to financial statements.
71 |
Table of Contents
Statements of Operations (continued)
For the Year Ended November 30, 2012
| Loomis Sayles Senior Floating Rate and Fixed Income Fund |
Vaughan Nelson Select Fund (b) |
|||||||
| INVESTMENT INCOME |
||||||||
| Interest |
$ | 5,219,028 | $ | 14 | ||||
| Dividends |
— | 35,882 | ||||||
|
|
|
|
|
|||||
| 5,219,028 | 35,896 | |||||||
|
|
|
|
|
|||||
| Expenses |
||||||||
| Management fees (Note 6) |
385,751 | 27,462 | ||||||
| Service and distribution fees (Note 6) |
97,540 | 2,270 | ||||||
| Administrative fees (Note 6) |
28,979 | 1,446 | ||||||
| Trustees’ fees and expenses (Note 6) |
18,599 | 6,447 | ||||||
| Transfer agent fees and expenses (Note 6) |
20,023 | 966 | ||||||
| Audit and tax services fees |
65,466 | 50,220 | ||||||
| Commitment fees (Note 7) |
87,500 | 10 | ||||||
| Custodian fees and expenses |
128,619 | 6,982 | ||||||
| Legal fees |
5,948 | 35 | ||||||
| Registration fees |
67,380 | 12,085 | ||||||
| Shareholder reporting expenses |
25,997 | 799 | ||||||
| Miscellaneous expenses |
13,952 | 2,506 | ||||||
|
|
|
|
|
|||||
| Total expenses |
945,754 | 111,228 | ||||||
| Less waiver and/or expense reimbursement (Note 6) |
(301,670 | ) | (71,802 | ) | ||||
|
|
|
|
|
|||||
| Net expenses |
644,084 | 39,426 | ||||||
|
|
|
|
|
|||||
| Net investment income (loss) |
4,574,944 | (3,530 | ) | |||||
|
|
|
|
|
|||||
| NET REALIZED AND UNREALIZED GAIN ON INVESTMENTS |
||||||||
| Net realized gain on: |
||||||||
| Investments |
829,435 | 168,996 | ||||||
| Net change in unrealized appreciation (depreciation) on: |
||||||||
| Investments |
1,083,149 | 88,053 | ||||||
|
|
|
|
|
|||||
| Net realized and unrealized gain on investments |
1,912,584 | 257,049 | ||||||
|
|
|
|
|
|||||
| NET INCREASE IN NET ASSETS RESULTING FROM OPERATIONS |
$ | 6,487,528 | $ | 253,519 | ||||
|
|
|
|
|
|||||
See accompanying notes to financial statements.
| 72
Table of Contents
Statements of Changes in Net Assets
| ASG Growth Markets Fund (Consolidated*) |
Gateway International Fund |
|||||||||||
| Year Ended November 30, 2012 |
Period Ended November 30, 2011(a) |
Period Ended November 30, 2012(b) |
||||||||||
| FROM OPERATIONS: |
||||||||||||
| Net investment income (loss) |
$ | 87,545 | $ | (20,915 | ) | $ | 407,225 | |||||
| Net realized gain (loss) on investments, futures contracts, options written and foreign currency transactions |
(2,798,755 | ) | 387,126 | (916,160 | ) | |||||||
| Net change in unrealized appreciation (depreciation) on investments, futures contracts, options written and foreign currency translations |
1,780,680 | 135,621 | 823,737 | |||||||||
|
|
|
|
|
|
|
|||||||
| Net increase (decrease) in net assets resulting from operations |
(930,530 | ) | 501,832 | 314,802 | ||||||||
|
|
|
|
|
|
|
|||||||
| FROM DISTRIBUTIONS TO SHAREHOLDERS: |
||||||||||||
| Net investment income |
||||||||||||
| Class A |
(197 | ) | — | — | ||||||||
| Class C |
(2 | ) | — | — | ||||||||
| Class Y |
(114,012 | ) | — | — | ||||||||
| Net realized capital gains |
||||||||||||
| Class A |
(336 | ) | — | — | ||||||||
| Class C |
(7 | ) | — | — | ||||||||
| Class Y |
(183,323 | ) | — | — | ||||||||
|
|
|
|
|
|
|
|||||||
| Total distributions |
(297,877 | ) | — | — | ||||||||
|
|
|
|
|
|
|
|||||||
| NET INCREASE IN NET ASSETS FROM CAPITAL SHARE TRANSACTIONS (NOTE 12) |
1,420,548 | 25,132,312 | 26,845,262 | |||||||||
|
|
|
|
|
|
|
|||||||
| Net increase in net assets |
192,141 | 25,634,144 | 27,160,064 | |||||||||
| NET ASSETS |
||||||||||||
| Beginning of the period |
25,634,144 | — | — | |||||||||
|
|
|
|
|
|
|
|||||||
| End of the period |
$ | 25,826,285 | $ | 25,634,144 | $ | 27,160,064 | ||||||
|
|
|
|
|
|
|
|||||||
| UNDISTRIBUTED (DISTRIBUTIONS IN EXCESS OF) NET INVESTMENT INCOME |
$ | 397,293 | $ | 112,257 | $ | 526,288 | ||||||
|
|
|
|
|
|
|
|||||||
| * | See Notes 1 and 2 of the Notes to Financial Statements. |
| (a) | From commencement of operations on October 21, 2011 through November 30, 2011. |
| (b) | From commencement of operations on March 30, 2012 through November 30, 2012. |
| (c) | From commencement of operations on September 16, 2011 through November 30, 2011. |
| (d) | From commencement of operations on June 29, 2012 through November 30, 2012. |
See accompanying notes to financial statements.
73 |
Table of Contents
Statements of Changes in Net Assets (continued)
| Loomis Sayles Capital Income Fund |
Loomis Sayles Senior Floating Rate and Fixed Income Fund |
Vaughan Nelson Select Fund |
||||||||||||
| Period Ended November 30, 2012(b) |
Year Ended November 30, 2012 |
Period Ended November 30, 2011(c) |
Period Ended November 30, 2012(d) |
|||||||||||
| $ | 450,949 | $ | 4,574,944 | $ | 426,895 | $ | (3,530 | ) | ||||||
| 23,020 | 829,435 | 77,982 | 168,996 | |||||||||||
| 840,954 | 1,083,149 | 30,519 | 88,053 | |||||||||||
|
|
|
|
|
|
|
|
|
|||||||
| 1,314,923 | 6,487,528 | 535,396 | 253,519 | |||||||||||
|
|
|
|
|
|
|
|
|
|||||||
| (33,392 | ) | (889,553 | ) | (1,145 | ) | — | ||||||||
| (655 | ) | (248,770 | ) | (9 | ) | — | ||||||||
| (271,773 | ) | (2,591,476 | ) | (435,951 | ) | — | ||||||||
| — | (454 | ) | — | — | ||||||||||
| — | (31 | ) | — | — | ||||||||||
| — | (73,417 | ) | — | — | ||||||||||
|
|
|
|
|
|
|
|
|
|||||||
| (305,820 | ) | (3,803,701 | ) | (437,105 | ) | — | ||||||||
|
|
|
|
|
|
|
|
|
|||||||
| 18,688,125 | 106,119,381 | 40,789,888 | 7,442,211 | |||||||||||
|
|
|
|
|
|
|
|
|
|||||||
| 19,697,228 | 108,803,208 | 40,888,179 | 7,695,730 | |||||||||||
| — | 40,888,179 | — | — | |||||||||||
|
|
|
|
|
|
|
|
|
|||||||
| $ | 19,697,228 | $ | 149,691,387 | $ | 40,888,179 | $ | 7,695,730 | |||||||
|
|
|
|
|
|
|
|
|
|||||||
| $ | 147,370 | $ | 878,372 | $ | (1,240 | ) | $ | 3,398 | ||||||
|
|
|
|
|
|
|
|
|
|||||||
See accompanying notes to financial statements.
| 74
Table of Contents
Financial Highlights
For a share outstanding throughout each period.
| Income (Loss) from Investment Operations: |
Less Distributions: | |||||||||||||||||||||||||||
| Net asset value, beginning of the period |
Net investment income (loss) (a) |
Net realized and unrealized gain (loss) |
Total from investment operations |
Dividends from net investment income |
Distributions from net realized capital gains |
Total distributions |
||||||||||||||||||||||
| ASG GROWTH MARKETS FUND (CONSOLIDATED*) |
| |||||||||||||||||||||||||||
| Class A |
||||||||||||||||||||||||||||
| 11/30/2012 |
$ | 10.20 | $ | 0.04 | $ | (0.40 | ) | $ | (0.36 | ) | $ | (0.05 | ) | $ | (0.07 | ) | $ | (0.12 | ) | |||||||||
| 11/30/2011(g) |
10.00 | (0.01 | ) | 0.21 | 0.20 | — | — | — | ||||||||||||||||||||
| Class C |
||||||||||||||||||||||||||||
| 11/30/2012 |
10.19 | (0.04 | ) | (0.40 | ) | (0.44 | ) | (0.03 | ) | (0.07 | ) | (0.10 | ) | |||||||||||||||
| 11/30/2011(g) |
10.00 | (0.02 | ) | 0.21 | 0.19 | — | — | — | ||||||||||||||||||||
| Class Y |
||||||||||||||||||||||||||||
| 11/30/2012 |
10.20 | 0.03 | (0.37 | ) | (0.34 | ) | (0.05 | ) | (0.07 | ) | (0.12 | ) | ||||||||||||||||
| 11/30/2011(g) |
10.00 | (0.01 | ) | 0.21 | 0.20 | — | — | — | ||||||||||||||||||||
| GATEWAY INTERNATIONAL FUND |
| |||||||||||||||||||||||||||
| Class A |
||||||||||||||||||||||||||||
| 11/30/2012(h) |
$ | 10.00 | $ | 0.09 | $ | (0.17 | ) | $ | (0.08 | ) | $ | — | $ | — | $ | — | ||||||||||||
| Class C |
||||||||||||||||||||||||||||
| 11/30/2012(h) |
10.00 | 0.05 | (0.17 | ) | (0.12 | ) | — | — | — | |||||||||||||||||||
| Class Y |
||||||||||||||||||||||||||||
| 11/30/2012(h) |
10.00 | 0.18 | (0.24 | ) | (0.06 | ) | — | — | — | |||||||||||||||||||
| LOOMIS SAYLES CAPITAL INCOME FUND |
| |||||||||||||||||||||||||||
| Class A |
||||||||||||||||||||||||||||
| 11/30/2012(h) |
$ | 10.00 | $ | 0.25 | (i) | $ | 0.34 | $ | 0.59 | $ | (0.16 | ) | $ | — | $ | (0.16 | ) | |||||||||||
| Class C |
||||||||||||||||||||||||||||
| 11/30/2012(h) |
10.00 | 0.20 | (i) | 0.34 | 0.54 | (0.12 | ) | — | (0.12 | ) | ||||||||||||||||||
| Class Y |
||||||||||||||||||||||||||||
| 11/30/2012(h) |
10.00 | 0.26 | (i) | 0.35 | 0.61 | (0.17 | ) | — | (0.17 | ) | ||||||||||||||||||
| * | See Notes 1 and 2 of the Notes to Financial Statements. |
| (a) | Per share net investment income (loss) has been calculated using the average shares outstanding during the period. |
| (b) | A sales charge for Class A shares and a contingent deferred sales charge for Class C shares are not reflected in total return calculations. Periods less than one year, if applicable, are not annualized. |
| (c) | Had certain expenses not been waived/reimbursed during the period, if applicable, total returns would have been lower. |
| (d) | The investment adviser agreed to waive its fees and/or reimburse a portion of the Fund’s expenses during the period. Without this waiver/reimbursement, if applicable, expenses would have been higher. |
| (e) | Computed on an annualized basis for periods less than one year, if applicable. |
| (f) | Portfolio turnover is calculated based on purchases and sales of long-term securities and does not include short-term investments, futures contracts, options written and/or forward foreign currency contracts. |
| (g) | From commencement of operations on October 21, 2011 through November 30, 2011. |
See accompanying notes to financial statements.
75 |
Table of Contents
| Ratios to Average Net Assets: | ||||||||||||||||||||||||||||||||||
| Net asset value, end of the period |
Total return (%) (b)(c) |
Net assets, end of the period (000’s) |
Net expenses, excluding interest expense (%) (d)(e) |
Gross expenses, excluding interest expense (%) (e) |
Net expenses including interest expense (%) (d)(e) |
Gross expenses including interest expense (%) (e) |
Net investment income (loss) (%) (e) |
Portfolio turnover rate (%) (f) |
||||||||||||||||||||||||||
| $ | 9.72 | (3.69 | ) | $ | 501 | 1.70 | 3.01 | 1.73 | 3.05 | 0.47 | 31 | |||||||||||||||||||||||
| 10.20 | 2.00 | 16 | 1.70 | 9.56 | 1.70 | 9.56 | (0.86 | ) | 0 | |||||||||||||||||||||||||
| 9.65 | (4.45 | ) | 38 | 2.45 | 3.80 | 2.48 | 3.83 | (0.45 | ) | 31 | ||||||||||||||||||||||||
| 10.19 | 2.00 | 1 | 2.45 | 7.30 | 2.46 | 7.31 | (1.91 | ) | 0 | |||||||||||||||||||||||||
| 9.74 | (3.56 | ) | 25,288 | 1.45 | 2.70 | 1.48 | 2.73 | 0.34 | 31 | |||||||||||||||||||||||||
| 10.20 | 2.10 | 25,617 | 1.45 | 6.20 | 1.45 | 6.21 | (0.75 | ) | 0 | |||||||||||||||||||||||||
| $ | 9.92 | (0.80 | ) | $ | 5,632 | 1.35 | 2.36 | 1.35 | 2.36 | 1.37 | 20 | |||||||||||||||||||||||
| 9.88 | (1.20 | ) | 241 | 2.10 | 3.13 | 2.10 | 3.13 | 0.73 | 20 | |||||||||||||||||||||||||
| 9.94 | (0.60 | ) | 21,287 | 1.10 | 2.36 | 1.10 | 2.36 | 2.76 | 20 | |||||||||||||||||||||||||
| $ | 10.43 | 6.01 | (i) | $ | 2,691 | 1.20 | 1.74 | 1.20 | 1.74 | 3.67 | (i) | 14 | ||||||||||||||||||||||
| 10.42 | 5.44 | (i) | 61 | 1.95 | 2.53 | 1.95 | 2.53 | 3.01 | (i) | 14 | ||||||||||||||||||||||||
| 10.44 | 6.19 | (i) | 16,945 | 0.95 | 1.53 | 0.95 | 1.53 | 3.88 | (i) | 14 | ||||||||||||||||||||||||
| (h) | From commencement of operations on March 30, 2012 through November 30, 2012. |
| (i) | Includes a non-recurring dividend. Without this dividend, net investment income per share would have been $0.23, $0.17 and $0.23 for Class A, Class C and Class Y shares, respectively, total return would have been 5.71%, 5.14% and 5.89% for Class A, Class C and Class Y shares, respectively, and the ratio of net investment income to average net assets would have been 3.31%, 2.53% and 3.45% for Class A, Class C and Class Y shares, respectively. |
See accompanying notes to financial statements.
| 76
Table of Contents
Financial Highlights (continued)
For a share outstanding throughout each period.
| Income (Loss) from Investment Operations: |
Less Distributions: | |||||||||||||||||||||||||||
| Net asset value, beginning of the period |
Net investment income (loss) (a)(b) |
Net realized and unrealized gain (loss) |
Total from investment operations |
Dividends from net investment income |
Distributions from net realized capital gains |
Total distributions |
||||||||||||||||||||||
| LOOMIS SAYLES SENIOR FLOATING RATE AND FIXED INCOME FUND |
| |||||||||||||||||||||||||||
| Class A |
||||||||||||||||||||||||||||
| 11/30/2012 |
$ | 10.02 | $ | 0.68 | $ | 0.49 | $ | 1.17 | $ | (0.61 | ) | $ | (0.02 | ) | $ | (0.63 | ) | |||||||||||
| 11/30/2011(h) |
9.83 | 0.12 | 0.17 | 0.29 | (0.10 | ) | — | (0.10 | ) | |||||||||||||||||||
| Class C |
||||||||||||||||||||||||||||
| 11/30/2012 |
10.02 | 0.60 | 0.49 | 1.09 | (0.55 | ) | (0.02 | ) | (0.57 | ) | ||||||||||||||||||
| 11/30/2011(h) |
9.83 | 0.09 | 0.19 | 0.28 | (0.09 | ) | — | (0.09 | ) | |||||||||||||||||||
| Class Y |
||||||||||||||||||||||||||||
| 11/30/2012 |
10.02 | 0.79 | 0.41 | 1.20 | (0.63 | ) | (0.02 | ) | (0.65 | ) | ||||||||||||||||||
| 11/30/2011(i) |
10.00 | 0.11 | 0.02 | 0.13 | (0.11 | ) | — | (0.11 | ) | |||||||||||||||||||
| VAUGHAN NELSON SELECT FUND |
| |||||||||||||||||||||||||||
| Class A |
||||||||||||||||||||||||||||
| 11/30/2012(l) |
$ | 10.00 | $ | (0.00 | ) | $ | 0.50 | $ | 0.50 | $ | — | $ | — | $ | — | |||||||||||||
| Class C |
||||||||||||||||||||||||||||
| 11/30/2012(l) |
10.00 | (0.03 | ) | 0.50 | 0.47 | — | — | — | ||||||||||||||||||||
| Class Y |
||||||||||||||||||||||||||||
| 11/30/2012(l) |
10.00 | (0.00 | ) | 0.51 | 0.51 | — | — | — | ||||||||||||||||||||
| (a) | Per share net investment income (loss) has been calculated using the average shares outstanding during the period. |
| (b) | Amount rounds to less than $0.01 per share, if applicable. |
| (c) | A sales charge for Class A shares and a contingent deferred sales charge for Class C shares are not reflected in total return calculations. Periods less than one year, if applicable, are not annualized. |
| (d) | Had certain expenses not been waived/reimbursed during the period, if applicable, total returns would have been lower. |
| (e) | The investment adviser agreed to waive its fees and/or reimburse a portion of the Fund’s expenses during the period. Without this waiver/reimbursement, if applicable, expenses would have been higher. |
| (f) | Computed on an annualized basis for periods less than one year, if applicable. |
| (g) | Portfolio turnover is calculated based on purchases and sales of long-term securities and does not include short-term investments, futures contracts, options written and/or forward foreign currency contracts. |
See accompanying notes to financial statements.
77 |
Table of Contents
| Ratios to Average Net Assets: | ||||||||||||||||||||||||||
| Net asset value, end of the period |
Total return (%) (c)(d) |
Net assets, end of the period (000’s) |
Net expenses (%) (e)(f) |
Gross expenses (%) (f) |
Net investment income (loss) (%) (f) |
Portfolio turnover rate (%) (g) |
||||||||||||||||||||
| $ | 10.56 | 12.02 | $ | 80,141 | 1.10 | 1.48 | 6.46 | 90 | ||||||||||||||||||
| 10.02 | 3.00 | 252 | 1.10 | 7.66 | 7.00 | 17 | ||||||||||||||||||||
| 10.54 | 11.18 | 22,655 | 1.85 | 2.26 | 5.75 | 90 | ||||||||||||||||||||
| 10.02 | 2.87 | 1 | 1.85 | 5.00 | 5.50 | 17 | ||||||||||||||||||||
| 10.57 | 12.33 | 46,895 | 0.85 | 1.37 | 7.57 | 90 | ||||||||||||||||||||
| 10.02 | 1.29 | (j) | 40,636 | 1.01 | (k) | 3.60 | 5.17 | 17 | ||||||||||||||||||
| $ | 10.50 | 5.00 | $ | 777 | 1.40 | 3.36 | (0.11 | ) | 72 | |||||||||||||||||
| 10.47 | 4.70 | 159 | 2.15 | 4.48 | (0.78 | ) | 72 | |||||||||||||||||||
| 10.51 | 5.10 | 6,759 | 1.15 | 3.46 | (0.10 | ) | 72 | |||||||||||||||||||
| (h) | From commencement of Class operations on September 30, 2011 through November 30, 2011. |
| (i) | From commencement of operations on September 16, 2011 through November 30, 2011. |
| (j) | For the period September 30, 2011 (the date Class Y shares were first registered under the Securities Act of 1933) through November 30, 2011, the total return for Class Y shares was 3.04%. |
| (k) | Prior to September 30, 2011, there was no expense limitation agreement in place for Class Y. |
| (l) | From commencement of operations on June 29, 2012 through November 30, 2012. |
See accompanying notes to financial statements.
| 78
Table of Contents
Notes to Financial Statements
November 30, 2012
1. Organization. Gateway Trust and Natixis Funds Trust II (the “Trusts” and each a “Trust”) are each organized as a Massachusetts business trust. Each Trust is registered under the Investment Company Act of 1940, as amended (the “1940 Act”), as an open-end management investment company. Each Declaration of Trust permits the Board of Trustees to authorize the issuance of an unlimited number of shares of the Trust in multiple series. The financial statements for certain funds of the Trusts are presented in separate reports. The following funds (individually, a “Fund” and collectively, the “Funds”) are included in this report:
Gateway Trust:
Gateway International Fund
Natixis Funds Trust II:
ASG Growth Markets Fund (the “Growth Markets Fund”)
Loomis Sayles Capital Income Fund (the “Capital Income Fund”)
Loomis Sayles Senior Floating Rate and Fixed Income Fund (the “Senior Floating Rate and Fixed Income Fund”)
Vaughan Nelson Select Fund (the “Select Fund”)
The Gateway International Fund commenced operations on March 30, 2012 via contribution to the Fund by Natixis Global Asset Management, L.P. (“Natixis US”) and affiliates of $15,002,000 and by Gateway Investment Advisers, LLC (“Gateway Advisers”) of $5,000,000.
The Capital Income Fund commenced operations on March 30, 2012 via contribution to the Fund by Natixis US and affiliates of $5,002,000 and by Loomis, Sayles & Company, L.P. (“Loomis Sayles”) of $5,000,000.
The Select Fund commenced operations on June 29, 2012 via contribution to the Fund by Natixis US and affiliates of $5,002,000.
Capital Income Fund and Gateway International Fund are each a diversified investment company, while Growth Markets Fund, Senior Floating Rate and Fixed Income Fund and Select Fund are each a non-diversified investment company.
Each Fund offers Class A, Class C and Class Y shares. Class A shares are sold with a maximum front-end sales charge of 5.75% for Growth Markets Fund, Gateway International Fund, Capital Income Fund and Select Fund and 3.50% for Senior Floating Rate and Fixed Income Fund. Class C shares do not pay a front-end sales charge, do not convert to any other class of shares, pay higher Rule 12b-1 fees than Class A shares and may be subject to a contingent deferred sales charge (“CDSC”) of 1.00% if those shares are redeemed within one year of acquisition, except for reinvested distributions. Class Y shares do not pay a front-end sales charge, a CDSC or Rule 12b-1 fees. Class Y shares are generally intended for institutional investors with a minimum initial investment of $100,000, though some categories of investors are exempted from the minimum investment amount as outlined in the Funds’ prospectus.
79 |
Table of Contents
Notes to Financial Statements (continued)
November 30, 2012
Most expenses of the Trusts can be directly attributed to a Fund. Expenses which cannot be directly attributed to a Fund are generally apportioned based on the relative net assets of each of the funds in the Trusts. Expenses of a Fund are borne pro rata by the holders of each class of shares, except that each class bears expenses unique to that class (including the Rule 12b-1 service and distribution fees). In addition, each class votes as a class only with respect to its own Rule 12b-1 Plan. Shares of each class would receive their pro rata share of the net assets of a Fund if the Fund were liquidated. The Trustees approve separate distributions from net investment income on each class of shares.
Growth Markets Fund invests in commodity-related instruments through ASG Growth Markets Cayman Fund Ltd., a wholly-owned subsidiary (the “Subsidiary”) of Growth Markets Fund, organized under the laws of the Cayman Islands. A subscription agreement was entered into between Growth Markets Fund and its Subsidiary with the intent that Growth Markets Fund will remain the sole shareholder and primary beneficiary of its Subsidiary. The Subsidiary is governed by a separate Board of Directors that is independent of the Growth Markets Fund’s Board of Trustees.
As of November 30, 2012, the value of Growth Markets Fund’s investment in its Subsidiary was as follows:
| Fund |
Investment in Subsidiary |
Percentage of Net Assets |
||||||
| Growth Markets Fund |
$ | 2,296,106 | 8.9 | % | ||||
2. Significant Accounting Policies. The following is a summary of significant accounting policies consistently followed by each Fund in the preparation of its financial statements. The Funds’ financial statements are prepared in accordance with accounting principles generally accepted in the United States of America which require the use of management estimates that affect the reported amounts and disclosures in the financial statements. Actual results could differ from those estimates. Management has evaluated the events and transactions subsequent to year-end through the date the financial statements were issued and has determined that there were no material events that would require disclosure in the Funds’ financial statements.
a. Consolidation. The accompanying financial statements of Growth Markets Fund present the consolidated accounts of the Fund and its Subsidiary. All interfund accounts and transactions have been eliminated in consolidation.
b. Valuation. Equity securities, including shares of closed-end investment companies and exchange-traded funds, for which market quotations are readily available are valued at market value, as reported by independent pricing services recommended by the investment adviser and subadviser and approved by the Board of Trustees. Such independent pricing services generally use the security’s last sale price on the exchange or market where the security is primarily traded or, if there is no reported
| 80
Table of Contents
Notes to Financial Statements (continued)
November 30, 2012
sale during the day, the closing bid price. Securities traded on the NASDAQ Global Select Market, NASDAQ Global Market and NASDAQ Capital Market are valued at the NASDAQ Official Closing Price (“NOCP”), or if lacking a NOCP, at the most recent bid quotation on the applicable NASDAQ Market. Debt securities (other than short-term obligations purchased with an original or remaining maturity of sixty days or less) and unlisted equity securities are generally valued on the basis of evaluated bids furnished to the Funds by an independent pricing service recommended by the investment adviser and subadviser and approved by the Board of Trustees, which service determines valuations for normal, institutional-size trading units of such securities using market information, transactions for comparable securities and various relationships between securities which are generally recognized by institutional traders. Senior loans are priced at bid prices supplied by an independent pricing service, if available. Broker-dealer bid quotations may also be used to value debt and equity securities and senior loans where an independent pricing service is unable to price a security or where an independent pricing service does not provide a reliable price for the security. Forward foreign currency contracts are valued utilizing interpolated prices determined from information provided by an independent pricing service. Futures contracts are valued at their most recent settlement price. Domestic exchange-traded single equity option contracts are valued at the mean of the National Best Bid and Offer quotations. International index options traded on foreign exchanges are valued at the most recent settlement price. Other exchange-traded options are valued at the average of the closing bid and ask quotations. Over-the-counter (“OTC”) international index options are valued at mid prices (between the bid and the ask price) supplied by an independent pricing service. OTC international index options not priced through an independent pricing service are valued based on quotations obtained from broker-dealers. Investments in other open-end investment companies are valued at their net asset value each day. Short-term obligations purchased with an original or remaining maturity of sixty days or less are valued at amortized cost, which approximates market value. Securities for which market quotations are not readily available are valued at fair value as determined in good faith by the Funds’ investment adviser or subadviser using consistently applied procedures under the general supervision of the Board of Trustees.
The Funds may hold securities traded in foreign markets. Foreign securities are valued at the closing market price in the foreign market. Additionally, Gateway International Fund may hold index options traded in foreign markets. If events occurring after the close of the foreign market (but before the close of regular trading on the New York Stock Exchange) are believed to materially affect the value of those securities or options, such securities or options are fair valued pursuant to procedures approved by the Board of Trustees. When fair valuing securities or options, the Funds may, among other things, use modeling tools or other processes that may take into account factors such as market activity and/or significant events that occur after the close of the foreign market and before the Funds calculate their net asset values. As of November 30, 2012, approximately 49% of the market value of Growth Markets Fund’s
81 |
Table of Contents
Notes to Financial Statements (continued)
November 30, 2012
investments, 98% of the market value of Gateway International Fund’s investments and 100% of the market value of Gateway International Fund’s written options were fair valued pursuant to procedures approved by the Board of Trustees.
c. Investment Transactions and Related Investment Income. Investment transactions are accounted for on a trade date plus one day basis for daily net asset value calculation. However, for financial reporting purposes, investment transactions are reported on trade date. Dividend income is recorded on ex-dividend date, or in the case of certain foreign securities, as soon as a Fund is notified, and interest income is recorded on an accrual basis. Interest income is increased by the accretion of discount and decreased by the amortization of premium. In determining net gain or loss on securities sold, the cost of securities has been determined on an identified cost basis. Investment income, non-class specific expenses and realized and unrealized gains and losses are allocated on a pro rata basis to each class based on the relative net assets of each class to the total net assets of the Fund.
d. Foreign Currency Translation. The books and records of the Funds are maintained in U.S. dollars. The values of securities, currencies and other assets and liabilities denominated in currencies other than U.S. dollars are translated into U.S. dollars based upon foreign exchange rates prevailing at the end of the period. Purchases and sales of investment securities, income and expenses are translated on the respective dates of such transactions.
Since the values of investment securities are presented at the foreign exchange rates prevailing at the end of the period, it is not practical to isolate that portion of the results of operations arising from changes in exchange rates from fluctuations which arise due to changes in market prices of investment securities. Such changes are included with the net realized and unrealized gain or loss on investments.
Net realized foreign exchange gains or losses arise from sales of foreign currency, currency gains or losses realized between the trade and settlement dates on securities transactions and the difference between the amounts of dividends, interest and foreign withholding taxes recorded on the Funds’ books and the U.S. dollar equivalent of the amounts actually received or paid. Net unrealized foreign exchange gains and losses arise from changes in the value of assets and liabilities, other than investment securities, at the end of the fiscal period, resulting from changes in exchange rates.
Each Fund may use foreign currency exchange contracts to facilitate transactions in foreign-denominated investments. Losses may arise from changes in the value of the foreign currency or if the counterparties do not perform under the contracts’ terms.
e. Forward Foreign Currency Contracts. The Funds may enter into forward foreign currency contracts, including forward foreign cross currency contracts, to acquire exposure to foreign currencies or to hedge the Funds’ investments against currency fluctuation. A contract can also be used to offset a previous contract. These contracts
| 82
Table of Contents
Notes to Financial Statements (continued)
November 30, 2012
involve market risk in excess of the unrealized gain or loss reflected in the Funds’ Statements of Assets and Liabilities. The U.S. dollar value of the currencies a Fund has committed to buy or sell represents the aggregate exposure to each currency a Fund has acquired or hedged through currency contracts outstanding at period end. Gains or losses are recorded for financial statement purposes as unrealized until settlement date. Risks may arise upon entering into these contracts from the potential inability of counterparties to meet the terms of their contracts and from unanticipated movements in the value of a foreign currency relative to the U.S. dollar. Certain contracts may require the movement of cash and/or securities as collateral for the Funds’ or counterparty’s net obligations under the contracts.
f. Futures Contracts. The Funds and the Subsidiary may enter into futures contracts. Futures contracts are agreements between two parties to buy and sell a particular commodity, instrument or index for a specified price on a specified future date.
When a Fund or the Subsidiary enters into a futures contract, it is required to deposit with (or for the benefit of) its broker an amount of cash or short-term high-quality securities as “initial margin.” As the value of the contract changes, the value of the futures contract position increases or declines. Subsequent payments, known as “variation margin,” are made or received by a Fund or the Subsidiary, depending on the price fluctuations in the fair value of the contract and the value of cash or securities on deposit with the broker. The aggregate principal amounts of the contracts are not recorded in the financial statements. Fluctuations in the value of the contracts are recorded in the Statements of Assets and Liabilities as an asset (liability) and in the Statements of Operations as unrealized appreciation (depreciation) until the contracts are closed, when they are recorded as realized gains (losses). Realized gain or loss on a futures position is equal to the difference between the value of the contract at the time it was opened and the value at the time it was closed, minus brokerage commissions. When a Fund or the Subsidiary enters into a futures contract certain risks may arise, such as illiquidity in the futures market, which may limit a Fund’s or the Subsidiary’s ability to close out a futures contract prior to settlement date, and unanticipated movements in the value of securities, commodities or interest rates.
Futures contracts are exchange-traded. Exchange-traded futures contracts are standardized and are settled through a clearing house with fulfillment supported by the credit of the exchange. Therefore, counterparty credit risks to the Funds and the Subsidiary are reduced.
g. Option Contracts. Certain Funds may enter into option contracts. When a Fund purchases an option, it pays a premium and the option is subsequently marked to market to reflect current value. Premiums paid for purchasing options which expire are treated as realized losses. Premiums paid for purchasing options which are exercised are added to the cost or deducted from the proceeds on the underlying instrument to determine the realized gain or loss. If the Fund enters into a closing sale transaction,
83 |
Table of Contents
Notes to Financial Statements (continued)
November 30, 2012
the difference between the premium paid and the proceeds of the closing sale transaction is treated as a realized gain or loss. The risk associated with purchasing options is limited to the premium paid.
When a Fund writes an option, an amount equal to the net premium received (the premium less commission) is recorded as a liability and is subsequently adjusted to the current value. Net premiums received for written options which expire are treated as realized gains. Net premiums received for written options which are exercised are deducted from the cost or added to the proceeds on the underlying instrument to determine the realized gain or loss. If the Fund enters into a closing purchase transaction, the difference between the net premium received and any amount paid on effecting a closing purchase transaction, including commission, is treated as a realized gain or, if the net premium received is less than the amount paid, as a realized loss. The Fund, as writer of a written option, bears the risk of an unfavorable change in the market value of the instrument underlying the written option.
Exchange-traded options contracts are standardized and are settled through a clearing house with fulfillment supported by the credit of the exchange. Therefore, counterparty credit risks to the Funds are reduced. Over-the-counter options are subject to the risk that the counterparty is unable or unwilling to meet its obligations under the option.
h. Due from Brokers. Transactions and positions in certain futures and forward foreign currency contracts are maintained and cleared by registered U.S. broker/dealers pursuant to customer agreements between a Fund or the Subsidiary and the various broker/dealers. Due from brokers’ balances in the Consolidated Statement of Assets and Liabilities for Growth Markets Fund represent cash, foreign currency, and any initial and/or variation margin applicable to open futures contracts and/or cash pledged as collateral for forward foreign currency contracts. In certain circumstances the Fund’s or the Subsidiary’s use of cash, securities and foreign currency held at brokers pledged as collateral is restricted by regulation or broker mandated limits.
i. Federal and Foreign Income Taxes. The Trusts treat each fund as a separate entity for federal income tax purposes. Each Fund intends to meet the requirements of the Internal Revenue Code of 1986, as amended, applicable to regulated investment companies, and to distribute to its shareholders substantially all of its net investment income and any net realized capital gains at least annually. Management has performed an analysis of each Fund’s tax positions for the open tax years as of November 30, 2012 and has concluded that no provisions for income tax are required. The Funds’ federal tax returns for the prior fiscal year, where applicable, remain subject to examination by the Internal Revenue Service. Management is not aware of any events that are reasonably possible to occur in the next twelve months that would result in the amounts of any unrecognized tax benefits significantly increasing or decreasing for the Funds. However, management’s conclusions regarding tax positions taken may be subject to review and adjustment at a later date based on factors including, but not limited to, new tax laws and accounting regulations and interpretations thereof.
| 84
Table of Contents
Notes to Financial Statements (continued)
November 30, 2012
The Subsidiary is classified as a controlled foreign corporation under the Internal Revenue Code. As a U.S. shareholder of a controlled foreign corporation, Growth Markets Fund will include in its taxable income any distributions paid by the Subsidiary which would be comprised of the Subsidiary’s current earnings and profits (including net realized gains). Any deficit generated by the Subsidiary will be disregarded for purposes of computing the Fund’s taxable income in the current period and also disregarded for all future periods.
A Fund may be subject to foreign withholding taxes on investment income and taxes on capital gains on investments that are accrued and paid based upon the Fund’s understanding of the tax rules and regulations that exist in the countries in which the Fund invests. Foreign withholding taxes on dividend and interest income are reflected on the Statements of Operations as a reduction of investment income, net of amounts eligible to be reclaimed. Dividends and interest receivable on the Statements of Assets and Liabilities are net of foreign withholding taxes. Foreign withholding taxes eligible to be reclaimed are reflected on the Statements of Assets and Liabilities as tax reclaims receivable. Capital gains taxes paid are included in net realized gain (loss) on investments in the Statements of Operations. Accrued but unpaid capital gains taxes are reflected as foreign taxes payable on the Statements of Assets and Liabilities, if applicable, and reduce unrealized gains on investments. In the event that realized gains on investments are subsequently offset by realized losses, taxes paid on realized gains may be returned to a Fund. Such amounts, if applicable, are reflected as foreign tax rebates receivable on the Statements of Assets and Liabilities and are recorded as a realized gain when received.
j. Dividends and Distributions to Shareholders. Dividends and distributions are recorded on ex-dividend date. The timing and characterization of certain income and capital gain distributions are determined annually in accordance with federal tax regulations, which may differ from accounting principles generally accepted in the United States of America. Permanent differences are primarily due to differing treatments for book and tax purposes of items such as non-deductible expenses, dividend redesignations, Subsidiary dividends, foreign currency transactions, paydown gains and losses, capital gain distributions from Real Estate Investment Trusts, passive foreign investment company gains and losses, re-allocation of deferred compensation from a closed fund and premium amortization. Permanent book and tax basis differences relating to shareholder distributions, net investment income, and net realized gains will result in reclassifications to capital accounts. Temporary differences between book and tax distributable earnings are primarily due to deferred Trustees’ fees, commissions on open futures contracts, wash sales, passive foreign investment company adjustments, premium amortization, forward foreign currency, futures and option contracts mark to market and Subsidiary basis adjustments. Distributions from net investment income and short-term capital gains are considered to be distributed from ordinary income for tax purposes.
85 |
Table of Contents
Notes to Financial Statements (continued)
November 30, 2012
The tax characterization of distributions is determined on an annual basis. The tax character of distributions paid to shareholders during the periods ended November 30, 2012 and 2011 were as follows:
| 2012 Distributions Paid From: | ||||||||||||
| Fund |
Ordinary Income |
Long-Term |
Total |
|||||||||
| Growth Markets Fund |
$ | 297,877 | $ | — | $ | 297,877 | ||||||
| Gateway International Fund |
— | — | — | |||||||||
| Capital Income Fund |
305,820 | — | 305,820 | |||||||||
| Senior Floating Rate and Fixed Income Fund |
3,803,701 | — | 3,803,701 | |||||||||
| Select Fund |
— | — | — | |||||||||
| 2011 Distributions Paid From: | ||||||||||||
| Fund |
Ordinary Income |
Long-Term |
Total |
|||||||||
| Growth Markets Fund |
$ | — | $ | — | $ | — | ||||||
| Senior Floating Rate and Fixed Income Fund |
437,105 | — | 437,105 | |||||||||
Differences between these amounts and those reported in the Statement of Changes in Net Assets are primarily attributable to different book and tax treatment for short-term capital gains.
As of November 30, 2012, the components of distributable earnings on a tax basis were as follows:
| Growth Markets Fund |
Gateway |
Capital Income |
Senior Floating |
Select Fund |
||||||||||||||||
| Undistributed ordinary income |
$ | 444,413 | $ | 532,438 | $ | 190,917 | $ | 1,821,301 | $ | 270,458 | ||||||||||
| Undistributed long-term capital gains |
— | — | 8,973 | — | — | |||||||||||||||
|
|
|
|
|
|
|
|
|
|
|
|||||||||||
| Total undistributed earnings |
444,413 | 532,438 | 199,890 | 1,821,301 | 270,458 | |||||||||||||||
|
|
|
|
|
|
|
|
|
|
|
|||||||||||
| Capital loss carryforward: |
||||||||||||||||||||
| Short-term: |
||||||||||||||||||||
| No expiration date |
(1,614,268 | ) | (983,410 | ) | — | — | — | |||||||||||||
| Long-term: |
||||||||||||||||||||
| No expiration date |
(133,784 | ) | (34,401 | ) | — | — | — | |||||||||||||
|
|
|
|
|
|
|
|
|
|
|
|||||||||||
| Total capital loss carryforward |
(1,748,052 | ) | (1,017,811 | ) | — | — | — | |||||||||||||
|
|
|
|
|
|
|
|
|
|
|
|||||||||||
| 86
Table of Contents
Notes to Financial Statements (continued)
November 30, 2012
| Growth Markets Fund |
Gateway |
Capital Income |
Senior Floating |
Select Fund |
||||||||||||||||
| Late-year ordinary and post-October capital loss deferrals* |
$ | — | $ | — | $ | — | $ | (25,568 | ) | $ | — | |||||||||
| Unrealized appreciation (depreciation) |
595,871 | 823,653 | 826,160 | 1,002,298 | (6,921 | ) | ||||||||||||||
|
|
|
|
|
|
|
|
|
|
|
|||||||||||
| Total accumulated earnings (losses) |
$ | (707,768 | ) | $ | 338,280 | $ | 1,026,050 | $ | 2,798,031 | $ | 263,537 | |||||||||
|
|
|
|
|
|
|
|
|
|
|
|||||||||||
| * | Under current tax law, capital losses, foreign currency losses, and losses on passive foreign investment companies and contingent payment debt instruments after October 31 or December 31, as applicable, may be deferred and treated as occurring on the first day of the following taxable year. |
k. Repurchase Agreements. It is each Fund’s policy that the market value of the collateral for repurchase agreements be at least equal to 102% of the repurchase price, including interest. Certain repurchase agreements are tri-party arrangements whereby the collateral is held in a segregated account for the benefit of the Fund and on behalf of the counterparty. Repurchase agreements could involve certain risks in the event of default or insolvency of the counterparty including possible delays or restrictions upon a Fund’s ability to dispose of the underlying securities.
l. Indemnifications. Under the Trusts’ organizational documents, its officers and Trustees are indemnified against certain liabilities arising out of the performance of their duties to the Funds. Additionally, in the normal course of business, the Funds enter into contracts with service providers that contain general indemnification clauses. The Funds’ maximum exposure under these arrangements is unknown as this would involve future claims that may be made against the Funds that have not yet occurred. However, based on experience, the Funds expect the risk of loss to be remote.
m. New Accounting Pronouncement. In December 2011, Accounting Standards Update (“ASU”) No. 2011-11, “Disclosures about Offsetting Assets and Liabilities,” was issued and is effective for interim and annual periods beginning after January 1, 2013. The ASU enhances disclosure requirements with respect to an entity’s rights of setoff and related arrangements associated with its financial and derivative instruments. Management is currently evaluating the impact the adoption of ASU 2011-11 may have on the Funds’ financial statement disclosures.
3. Fair Value Measurements. In accordance with accounting standards related to fair value measurements and disclosures, the Funds have categorized the inputs utilized in determining the value of each Fund’s assets or liabilities. These inputs are summarized in the three broad levels listed below:
| • | Level 1 – quoted prices in active markets for identical assets or liabilities; |
87 |
Table of Contents
Notes to Financial Statements (continued)
November 30, 2012
| • | Level 2 – prices determined using other significant inputs that are observable either directly, or indirectly through corroboration with observable market data (which could include quoted prices for similar assets or liabilities, interest rates, credit risk, etc.); and |
| • | Level 3 – prices determined using significant unobservable inputs when quoted prices or observable inputs are unavailable such as when there is little or no market activity for an asset or liability (unobservable inputs reflect each Fund’s own assumptions in determining the fair value of assets or liabilities and would be based on the best information available). |
The inputs or methodology used for valuing securities are not necessarily an indication of the risk associated with investing in those securities.
The following is a summary of the inputs used to value the Funds’ investments as of November 30, 2012, at value:
Growth Markets Fund
Asset Valuation Inputs
| Description |
Level 1 |
Level 2 |
Level 3 |
Total |
||||||||||||
| Common Stocks |
||||||||||||||||
| China |
$ | 847,610 | $ | 3,357,407 | $ | — | $ | 4,205,017 | ||||||||
| Egypt |
— | 90,540 | — | 90,540 | ||||||||||||
| India |
348,008 | 108,400 | — | 456,408 | ||||||||||||
| Indonesia |
64,326 | 513,001 | — | 577,327 | ||||||||||||
| Korea |
345,330 | 2,600,005 | — | 2,945,335 | ||||||||||||
| Malaysia |
— | 779,277 | — | 779,277 | ||||||||||||
| Russia |
114,536 | 1,008,281 | — | 1,122,817 | ||||||||||||
| South Africa |
258,810 | 1,233,409 | — | 1,492,219 | ||||||||||||
| Taiwan |
590,333 | 715,364 | — | 1,305,697 | ||||||||||||
| All Other Common Stocks(a) |
3,843,936 | — | — | 3,843,936 | ||||||||||||
|
|
|
|
|
|
|
|
|
|||||||||
| Total Common Stocks |
6,412,889 | 10,405,684 | — | 16,818,573 | ||||||||||||
|
|
|
|
|
|
|
|
|
|||||||||
| Preferred Stocks(a) |
186,566 | 43,317 | — | 229,883 | ||||||||||||
| Short-Term Investments(a) |
— | 4,274,459 | — | 4,274,459 | ||||||||||||
|
|
|
|
|
|
|
|
|
|||||||||
| Total Investments |
6,599,455 | 14,723,460 | — | 21,322,915 | ||||||||||||
|
|
|
|
|
|
|
|
|
|||||||||
| Forward Foreign Currency Contracts (unrealized appreciation) |
— | 187,302 | — | 187,302 | ||||||||||||
| Futures Contracts (unrealized appreciation) |
449,905 | — | — | 449,905 | ||||||||||||
|
|
|
|
|
|
|
|
|
|||||||||
| Total |
$ | 7,049,360 | $ | 14,910,762 | $ | — | $ | 21,960,122 | ||||||||
|
|
|
|
|
|
|
|
|
|||||||||
| 88
Table of Contents
Notes to Financial Statements (continued)
November 30, 2012
Growth Markets Fund (continued)
Liability Valuation Inputs
| Description |
Level 1 |
Level 2 |
Level 3 |
Total |
||||||||||||
| Forward Foreign Currency Contracts (unrealized depreciation) |
$ | — | $ | (71,532 | ) | $ | — | $ | (71,532 | ) | ||||||
| Futures Contracts (unrealized depreciation) |
(151,530 | ) | — | — | (151,530 | ) | ||||||||||
|
|
|
|
|
|
|
|
|
|||||||||
| Total |
$ | (151,530 | ) | $ | (71,532 | ) | $ | — | $ | (223,062 | ) | |||||
|
|
|
|
|
|
|
|
|
|||||||||
| (a) | Details of the major categories of the Fund’s investments are reflected within the Consolidated Portfolio of Investments. |
Common stocks valued at $56,544 were transferred from Level 1 to Level 2 during the year ended November 30, 2012. At November 30, 2011, these securities were valued at the market price in the foreign market in accordance with the Fund’s valuation policies; at November 30, 2012, these securities were fair valued pursuant to procedures approved by the Board of Trustees as events occurring after the close of the foreign market were believed to materially affect the value of the securities.
All transfers are recognized as of the beginning of the reporting period.
Gateway International Fund
Asset Valuation Inputs
| Description |
Level 1 |
Level 2 |
Level 3 |
Total |
||||||||||||
| Common Stocks |
||||||||||||||||
| Australia |
$ | 941 | $ | 2,557,140 | $ | — | $ | 2,558,081 | ||||||||
| All Other Common Stocks(a) |
— | 23,878,695 | — | 23,878,695 | ||||||||||||
|
|
|
|
|
|
|
|
|
|||||||||
| Total Common Stocks |
941 | 26,435,835 | — | 26,436,776 | ||||||||||||
|
|
|
|
|
|
|
|
|
|||||||||
| Purchased Options(a) |
— | 36,154 | — | 36,154 | ||||||||||||
| Short-Term Investments |
— | 508,001 | — | 508,001 | ||||||||||||
|
|
|
|
|
|
|
|
|
|||||||||
| Total |
$ | 941 | $ | 26,979,990 | $ | — | $ | 26,980,931 | ||||||||
|
|
|
|
|
|
|
|
|
|||||||||
| Liability Valuation Inputs | ||||||||||||||||
| Description |
Level 1 |
Level 2 |
Level 3 |
Total |
||||||||||||
| Written Options(a) |
$ | — | $ | (974,597 | ) | $ | — | $ | (974,597 | ) | ||||||
|
|
|
|
|
|
|
|
|
|||||||||
| (a) | Details of the major categories of the Fund’s investments are reflected within the Portfolio of Investments. |
Since the Gateway International Fund commenced operations during the year ended November 30, 2012, there are no transfers to recognize between Levels 1, 2 and 3.
89 |
Table of Contents
Notes to Financial Statements (continued)
November 30, 2012
Capital Income Fund
Asset Valuation Inputs
| Description |
Level 1 |
Level 2 |
Level 3 |
Total |
||||||||||||
| Common Stocks(a) |
$ | 15,545,503 | $ | — | $ | — | $ | 15,545,503 | ||||||||
| Bonds and Notes(a) |
— | 3,652,227 | — | 3,652,227 | ||||||||||||
| Short-Term Investments |
— | 445,879 | — | 445,879 | ||||||||||||
|
|
|
|
|
|
|
|
|
|||||||||
| Total |
$ | 15,545,503 | $ | 4,098,106 | $ | — | $ | 19,643,609 | ||||||||
|
|
|
|
|
|
|
|
|
|||||||||
| Liability Valuation Inputs | ||||||||||||||||
| Description |
Level 1 |
Level 2 |
Level 3 |
Total |
||||||||||||
| Written Options(a) |
$ | (2,463 | ) | $ | — | $ | — | $ | (2,463 | ) | ||||||
|
|
|
|
|
|
|
|
|
|||||||||
| (a) | Details of the major categories of the Fund’s investments are reflected within the Portfolio of Investments. |
Since the Capital Income Fund commenced operations during the year ended November 30, 2012, there are no transfers to recognize between Levels 1, 2 and 3.
Senior Floating Rate and Fixed Income Fund
Asset Valuation Inputs
| Description |
Level 1 |
Level 2 |
Level 3 |
Total |
||||||||||||
| Senior Loans(a) |
$ | — | $ | 124,359,280 | $ | — | $ | 124,359,280 | ||||||||
| Bonds and Notes(a) |
— | 15,755,626 | — | 15,755,626 | ||||||||||||
| Short-Term Investments |
— | 15,178,498 | — | 15,178,498 | ||||||||||||
|
|
|
|
|
|
|
|
|
|||||||||
| Total |
$ | — | $ | 155,293,404 | $ | — | $ | 155,293,404 | ||||||||
|
|
|
|
|
|
|
|
|
|||||||||
| (a) | Details of the major categories of the Fund’s investments are reflected within the Portfolio of Investments. |
For the year ended November 30, 2012, there were no transfers between Levels 1, 2 and 3.
Select Fund
Asset Valuation Inputs
| Description |
Level 1 |
Level 2 |
Level 3 |
Total |
||||||||||||
| Common Stocks(a) |
$ | 7,284,644 | $ | — | $ | — | $ | 7,284,644 | ||||||||
| Short-Term Investments |
— | 459,803 | — | 459,803 | ||||||||||||
|
|
|
|
|
|
|
|
|
|||||||||
| Total |
$ | 7,284,644 | $ | 459,803 | $ | — | $ | 7,744,447 | ||||||||
|
|
|
|
|
|
|
|
|
|||||||||
| (a) | Details of the major categories of the Fund’s investments are reflected within the Portfolio of Investments. |
Since the Select Fund commenced operations during the year ended November 30, 2012, there are no transfers to recognize between Levels 1, 2 and 3.
| 90
Table of Contents
Notes to Financial Statements (continued)
November 30, 2012
4. Derivatives. Derivative instruments are defined as financial instruments whose value and performance are based on the value and performance of another security or financial instrument. Derivative instruments that the Funds used during the period include forward foreign currency contracts and futures contracts for the Growth Markets Fund and options contracts for the Gateway International Fund and Capital Income Fund.
Growth Markets Fund seeks to complement its equity portfolio with a portfolio of derivatives, in particular, futures and forward contracts, designed to enhance return and mitigate losses. The Fund uses quantitative models to estimate the market exposures that drive the aggregate returns of one or more broad-based measures of emerging market equity index performance as well as identify the market exposures best suited to limit the volatility and risk of loss associated with the underlying equity portfolio. These market exposures, which are expected to vary over time, may include exposures to the returns of global equity and fixed income securities, commodities and currencies. During the year ended November 30, 2012, the Fund used long and short contracts on U.S. and foreign equity market indices, U.S. government bonds, short-term interest rates, foreign currencies and commodities (through investments in the Subsidiary) and long contracts on foreign government bonds in accordance with these objectives.
Gateway International Fund seeks to capture the majority of the returns associated with international developed market equity investments, while exposing investors to less risk than such investments generally. To meet this investment goal, the Fund invests in a broadly diversified portfolio of common stocks of non-U.S. companies, including, but not limited to, Australia, the United Kingdom, the Euro Zone, Hong Kong, Japan and Switzerland, while also writing index call options. Writing index call options can reduce the Fund’s volatility, provide a steady cash flow and be an important source of the Fund’s return, although it also may reduce the Fund’s ability to profit from increases in the value of its equity portfolio. The Fund also buys index put options, which can protect the Fund from a significant market decline that may occur over a short period of time. The value of an index put option generally increases as the prices of stocks constituting the index decrease and decreases as those stocks increase in price. The Fund typically sells call options and buys put options on market indices that represent a significant portion of the capitalization in each of the markets in which the Fund’s equity investments are traded. The combination of the diversified stock portfolio, the steady cash flow from writing of index call options and the downside protection from purchased index put options is intended to provide the Fund with the majority of the returns associated with equity market investments while exposing investors to less risk than other equity investments. During the period ended November 30, 2012, the Fund used written index call options and purchased index put options in accordance with this objective.
Capital Income Fund is subject to the risk of unpredictable declines in the value of individual equity securities and periods of below average performance in individual securities or in the equity market as a whole. The Fund may use purchased put options and written call options to hedge against a decline in value of an equity security that it
91 |
Table of Contents
Notes to Financial Statements (continued)
November 30, 2012
owns and may use written put options to offset the cost of options used for hedging purposes. The Fund may also use purchased call options and written put options for investment purposes. During the period ended November 30, 2012, the Fund engaged in written call option transactions for hedging purposes and written put option transactions for investment purposes.
Growth Markets Fund and Gateway International Fund are party to agreements with counterparties that govern transactions in forward foreign currency contracts and over-the-counter options. These agreements contain credit-risk-related contingent features that allow the counterparties to terminate open contracts early if the net asset value of a Fund declines beyond a certain threshold. If such features were to be triggered, the counterparties could request immediate settlement of open contracts at current fair value. As of November 30, 2012, the fair value of derivative positions (including open trades) subject to credit-risk-related contingent features that are in a net liability position by counterparty, and the value of collateral pledged to counterparties for such contracts is as follows:
| Fund |
Counterparty |
Derivatives |
Collateral Pledged |
|||||||||
| Gateway International Fund |
UBS AG | $ | (972,312 | ) | $ | 7,862,740 | ||||||
Forward foreign currency contracts and over-the-counter options are subject to the risk that the counterparty will be unwilling or unable to meet its obligations under the contracts. Certain Funds have mitigated this risk by entering into master netting agreements with counterparties that allow the Fund and the counterparty to offset amounts owed by each related to derivative contracts to one net amount payable by either the Fund or the counterparty. The maximum amount of loss that the Funds would incur if counterparties failed to meet their obligations, and the amount of loss that the Funds would incur after taking into account master netting arrangements are as follows as of November 30, 2012:
| Fund |
Maximum Amount |
Maximum Amount of Loss - Net |
||||||
| Growth Markets Fund |
$ | 187,302 | $ | 115,770 | ||||
| Gateway International Fund |
2,285 | — | ||||||
Counterparty risk is managed based on policies and procedures established by each Fund’s adviser and/or subadviser. Such policies and procedures may include, but are not limited to, minimum counterparty credit rating requirements, monitoring of counterparty credit default swap spreads and posting of collateral. Collateral is posted based on the requirements established under International Swaps and Derivatives Association (“ISDA”) agreements negotiated between each Fund and the derivative counterparties. In lieu of receiving cash collateral, Growth Markets Fund may use unrealized gains on forward foreign currency contracts to meet counterparty margin requirements for open positions. The risk of loss to a Fund from counterparty default should be limited to the extent a Fund is undercollateralized; however, final settlement
| 92
Table of Contents
Notes to Financial Statements (continued)
November 30, 2012
of a Fund’s claim against any collateral received may be subject to bankruptcy court proceedings.
The following is a summary of derivative instruments for Growth Markets Fund as of November 30, 2012:
| Consolidated Statements of Assets and |
Interest |
Foreign Exchange |
Equity Contracts |
Commodity |
||||||||||||
| Assets |
||||||||||||||||
| Unrealized appreciation on forward foreign currency contracts |
$ | — | $ | 187,302 | $ | — | $ | — | ||||||||
| Unrealized appreciation on futures contracts |
117,101 | — | 292,439 | 40,365 | ||||||||||||
| Liabilities |
||||||||||||||||
| Unrealized depreciation on forward foreign currency contracts |
— | (71,532 | ) | — | — | |||||||||||
| Unrealized depreciation on futures contracts |
(19,299 | ) | — | (54,464 | ) | (77,767 | ) | |||||||||
Transactions in derivative instruments for Growth Markets Fund during the year ended November 30, 2012 were as follows:
| Consolidated Statements of |
Interest Rate |
Foreign |
Equity Contracts |
Commodity |
||||||||||||
| Net Realized Gain (Loss) on: |
||||||||||||||||
| Foreign currency transactions* |
$ | — | $ | (633,537 | ) | $ | — | $ | — | |||||||
| Futures contracts |
237,896 | — | (1,247,043 | ) | (1,057,215 | ) | ||||||||||
| Net Change in Unrealized Appreciation (Depreciation) on: |
||||||||||||||||
| Foreign currency translations* |
— | 155,861 | — | — | ||||||||||||
| Futures contracts |
88,589 | — | 295,552 | (45,318 | ) | |||||||||||
| * | Represents realized loss and change in unrealized appreciation (depreciation) for forward foreign currency contracts during the period. |
The following is a summary of derivative instruments for the Gateway International Fund as of November 30, 2012:
| Statements of Assets and Liabilities Caption |
Equity |
|||
| Assets |
||||
| Investments at value* |
$ | 36,154 | ||
| Liabilities |
||||
| Options written, at value |
(974,597 | ) | ||
| * | Represents purchased options, at value. |
93 |
Table of Contents
Notes to Financial Statements (continued)
November 30, 2012
Transactions in derivative instruments for the Gateway International Fund during the period ended November 30, 2012 were as follows:
| Statements of Operations Caption |
Equity |
|||
| Net Realized Gain (Loss) on: |
||||
| Investments* |
$ | (344,749 | ) | |
| Options written |
(19,302 | ) | ||
| Net Change in Unrealized Appreciation (Depreciation) on: |
||||
| Investments* |
(140,796 | ) | ||
| Options written |
(315,340 | ) | ||
| * | Represents realized loss and change in unrealized appreciation (depreciation), respectively, for purchased options during the period. |
The following is a summary of derivative instruments for the Capital Income Fund as of November 30, 2012:
| Statements of Assets and Liabilities Caption |
Equity |
|||
| Liabilities |
||||
| Options written, at value |
$ | (2,463 | ) | |
Transactions in derivative instruments for the Capital Income Fund during the period ended November 30, 2012 were as follows:
| Statements of Operations Caption |
Equity |
|||
| Net Realized Gain (Loss) on: |
||||
| Options written |
$ | 14,989 | ||
| Net Change in Unrealized Appreciation (Depreciation) on: |
||||
| Options written |
46 | |||
As the Funds value their derivatives at fair value and recognize changes in fair value through the Statements of Operations, they do not qualify for hedge accounting under authoritative guidance for derivative instruments. The Funds’ investments in derivatives may represent an economic hedge; however, they are considered to be non-hedge transactions for the purpose of these disclosures.
| 94
Table of Contents
Notes to Financial Statements (continued)
November 30, 2012
The volume of forward foreign currency contract and futures contract activity, as a percentage of net assets, for Growth Markets Fund, based on gross month-end notional amounts outstanding during the period, including long and short positions at absolute value, was as follows for the year ended November 30, 2012:
| Growth Markets Fund |
Forwards |
Futures |
||||||
| Average Notional Amount Outstanding |
64.37 | % | 244.29 | % | ||||
| Highest Notional Amount Outstanding |
122.52 | % | 371.81 | % | ||||
| Lowest Notional Amount Outstanding |
26.52 | % | 169.66 | % | ||||
| Notional Amount Outstanding as of November 30, 2012 |
87.38 | % | 352.32 | % | ||||
Notional amounts outstanding at the end of the prior period are included in the averages above.
Unrealized gain and/or loss on open forwards and futures are recorded in the Consolidated Statement of Assets and Liabilities. The aggregate notional values of forwards and futures are not recorded in the Consolidated Statement of Assets and Liabilities, and therefore are not included in Growth Markets Fund’s net assets.
The volume of option contract activity, as a percentage of investments in common stocks, for Gateway International Fund, based on month-end notional amounts outstanding during the period, at absolute value, was as follows for the period ended November 30, 2012:
| Gateway International Fund* |
Call Options |
Put Options |
||||||
| Average Notional Amount Outstanding |
97.69 | % | 91.10 | % | ||||
| Highest Notional Amount Outstanding |
99.12 | % | 98.30 | % | ||||
| Lowest Notional Amount Outstanding |
93.88 | % | 83.62 | % | ||||
| Notional Amount Outstanding as of November 30, 2012 |
98.30 | % | 98.30 | % | ||||
| * | Notional amounts outstanding are determined by multiplying option contracts by the contract multiplier by the price of the option’s underlying index. |
The volume of option contract activity, as a percentage of net assets, for Capital Income Fund, based on month-end market values of equity securities underlying written options, at absolute value, was as follows for the period ended November 30, 2012:
| Capital Income Fund** |
Call Options Written |
Put Options Written |
||||||
| Average Market Value of Underlying Securities |
0.75 | % | 0.57 | % | ||||
| Highest Market Value of Underlying Securities |
2.70 | % | 0.91 | % | ||||
| Lowest Market Value of Underlying Securities |
0.00 | % | 0.00 | % | ||||
| Market Value of Underlying Securities as of November 30, 2012 |
0.59 | % | 0.91 | % | ||||
| ** | Market value of underlying securities is determined by multiplying option shares by the price of the option’s underlying security, as determined by the Fund’s Pricing Policies and Procedures. |
95 |
Table of Contents
Notes to Financial Statements (continued)
November 30, 2012
The following is a summary of the Gateway International Fund’s written option activity:
| Gateway International Fund |
Number of |
Premiums |
||||||
| Options written |
2,747 | $ | 3,770,201 | |||||
| Options terminated in closing purchase transactions |
(2,289 | ) | (3,090,042 | ) | ||||
| Options expired |
(8 | ) | (20,902 | ) | ||||
|
|
|
|
|
|||||
| Outstanding at November 30, 2012 |
450 | $ | 659,257 | |||||
|
|
|
|
|
|||||
The following is a summary of the Capital Income Fund’s written option activity:
| Capital Income Fund |
Number of |
Premiums |
||||||
| Options written |
409 | $ | 25,652 | |||||
| Options terminated in closing purchase transactions |
(280 | ) | (18,753 | ) | ||||
| Options exercised |
(61 | ) | (3,505 | ) | ||||
| Options expired |
(12 | ) | (885 | ) | ||||
|
|
|
|
|
|||||
| Outstanding at November 30, 2012 |
56 | $ | 2,509 | |||||
|
|
|
|
|
|||||
5. Purchases and Sales of Securities. For the year ended November 30, 2012, purchases and proceeds from sales or maturities of short-term obligations were as follows:
| Fund |
Purchases |
Sales/ |
||||||
| Growth Markets Fund |
$ | 161,313,445 | $ | 163,013,740 | ||||
For the period ended November 30, 2012, purchases and sales of securities (excluding short-term investments and U.S. Government/Agency securities and including paydowns) were as follows:
| Fund |
Purchases |
Sales |
||||||
| Growth Markets Fund |
$ | 5,341,901 | $ | 6,328,045 | ||||
| Gateway International Fund |
29,903,867 | 4,110,230 | ||||||
| Capital Income Fund |
20,593,940 | 2,257,767 | ||||||
| Senior Floating Rate and Fixed Income Fund |
153,715,599 | 56,812,875 | ||||||
| Select Fund |
12,135,789 | 5,108,190 | ||||||
6. Management Fees and Other Transactions with Affiliates.
a. Management Fees. AlphaSimplex Group, LLC (“AlphaSimplex”), which is a subsidiary of Natixis US, serves as investment adviser to Growth Markets Fund. Under the terms of the management agreement, the Fund pays a management fee at the annual rate of 1.20%, calculated daily and payable monthly, based on the Fund’s average daily net assets, less the net asset value of the Subsidiary.
| 96
Table of Contents
Notes to Financial Statements (continued)
November 30, 2012
AlphaSimplex also serves as investment adviser to the Subsidiary, which pays AlphaSimplex a management fee at the annual rate of 1.20% of its average daily net assets.
AlphaSimplex has entered into subadvisory agreements with Reich & Tang Asset Management, LLC (“Reich & Tang”), which is a subsidiary of Natixis US, and Westpeak Global Advisors, LLC (“Westpeak”) on behalf of Growth Markets Fund. Payments to AlphaSimplex are reduced by the amount of payments to Reich & Tang and Westpeak.
Gateway Advisers, which is a subsidiary of Natixis US, serves as investment adviser to the Gateway International Fund. Under the terms of the management agreement, the Fund pays a management fee at the annual rate of 0.75%, calculated daily and payable monthly, based on the Fund’s average daily net assets.
Loomis Sayles serves as investment adviser to Capital Income Fund and Senior Floating Rate and Fixed Income Fund. Under the terms of the management agreements, each Fund pays a management fee at the annual rate of 0.60%, calculated daily and payable monthly, based on Capital Income Fund’s average daily net assets and Senior Floating Rate and Fixed Income Fund’s daily managed assets, which include borrowings used for leverage.
NGAM Advisors, L.P. (“NGAM Advisors”), serves as investment adviser to the Select Fund. Under the terms of the management agreement, the Fund pays a management fee at the annual rate of 0.85%, calculated daily and payable monthly, based on the Fund’s average daily net assets.
NGAM Advisors has entered into subadvisory agreement with Vaughan Nelson Investment Management, L.P. (“Vaughan Nelson”). Payments to NGAM Advisors are reduced by the amount of payments to Vaughan Nelson.
AlphaSimplex, Gateway Advisers, Loomis Sayles and NGAM Advisors have given binding undertakings to the Funds to waive management fees and/or reimburse certain expenses, including expenses of the Subsidiary, if applicable, to limit the Funds’ operating expenses, exclusive of acquired fund fees and expenses, brokerage expenses, interest expense, taxes and extraordinary expenses. These undertakings are in effect until March 31, 2013, except for Vaughan Nelson Select Fund, which is until March 31, 2014, and are reevaluated on an annual basis. Management fees payable, as reflected on the Statements of Assets and Liabilities, is net of waivers and/or expense reimbursements, if any, pursuant to these undertakings. Waivers/reimbursements that exceed management fees payable are reflected on the Statements of Assets and Liabilities as receivable from investment adviser.
97 |
Table of Contents
Notes to Financial Statements (continued)
November 30, 2012
For the period ended November 30, 2012, the expense limits as a percentage of average daily net assets under the expense limitation agreements were as follows:
| Expense Limit as a Percentage of Average Daily Net Assets |
||||||||||||
| Fund |
Class A |
Class C |
Class Y |
|||||||||
| Growth Markets Fund |
1.70 | % | 2.45 | % | 1.45 | % | ||||||
| Gateway International Fund |
1.35 | % | 2.10 | % | 1.10 | % | ||||||
| Capital Income Fund |
1.20 | % | 1.95 | % | 0.95 | % | ||||||
| Senior Floating Rate and Fixed Income Fund |
1.10 | % | 1.85 | % | 0.85 | % | ||||||
| Select Fund |
1.40 | % | 2.15 | % | 1.15 | % | ||||||
AlphaSimplex, Gateway Advisers, Loomis Sayles and NGAM Advisors shall be permitted to recover expenses they have borne under the expense limitation agreements (whether through waiver of its management fees or otherwise) on a class by class basis in later periods to the extent the annual operating expenses of a class fall below a class’ expense limits, provided, however, that a class is not obligated to pay such waived/reimbursed fees or expenses more than one year after the end of the fiscal year in which the fees or expenses were waived/reimbursed.
For the period ended November 30, 2012, the management fees and waivers of management fees for each Fund were as follows:
| Gross Management Fees |
Waivers of Management Fees(1) |
Net Management Fees |
Percentage of Average Daily Net Assets |
|||||||||||||||||
| Fund |
Gross |
Net |
||||||||||||||||||
| Growth Markets Fund |
$ | 309,333 | $ | 309,333 | $ | — | 1.20 | % | — | |||||||||||
| Gateway International Fund |
121,064 | 121,064 | — | 0.75 | % | — | ||||||||||||||
| Capital Income Fund |
70,161 | 67,819 | 2,342 | 0.60 | % | 0.02 | % | |||||||||||||
| Senior Floating Rate and Fixed Income Fund |
385,751 | 301,670 | 84,081 | 0.60 | % | 0.13 | % | |||||||||||||
| Select Fund |
27,462 | 27,462 | — | 0.85 | % | — | ||||||||||||||
| (1) | Management fee waivers are subject to possible recovery until November 30, 2013. |
For the period ended November 30, 2012 expenses have been reimbursed as follows:
| Fund |
Reimbursement(2) |
|||
| Growth Markets Fund |
$ | 12,546 | ||
| Gateway International Fund |
75,177 | |||
| Select Fund |
44,340 | |||
| (2) | Expense reimbursements are subject to possible recovery until November 30, 2013. |
| 98
Table of Contents
Notes to Financial Statements (continued)
November 30, 2012
No expenses were recovered for Growth Markets Fund and Senior Floating Rate and Fixed Income Fund during the year ended November 30, 2012.
Certain officers and employees of Loomis Sayles are also officers or Trustees of the Trusts. Loomis Sayles’ general partner is indirectly owned by Natixis US, which is part of Natixis Global Asset Management, an international asset management group based in Paris, France.
b. Service and Distribution Fees. NGAM Distribution has entered into a distribution agreement with the Trusts. Pursuant to this agreement, NGAM Distribution serves as principal underwriter of the Funds of the Trusts.
Pursuant to Rule 12b-1 under the 1940 Act, the Trusts have adopted a Service Plan relating to each Fund’s Class A shares (the “Class A Plans”) and a Distribution and Service Plan relating to each Fund’s Class C shares (the “Class C Plans”).
Under the Class A Plans, each Fund pays NGAM Distribution a monthly service fee at an annual rate not to exceed 0.25% of the average daily net assets attributable to the Funds’ Class A shares, as reimbursement for expenses incurred by NGAM Distribution in providing personal services to investors in Class A shares and/or the maintenance of shareholder accounts.
Under the Class C Plans, each Fund pays NGAM Distribution a monthly service fee at an annual rate not to exceed 0.25% of the average daily net assets attributable to the Funds’ Class C shares, as compensation for services provided by NGAM Distribution in providing personal services to investors in Class C shares and/or the maintenance of shareholder accounts.
Also under the Class C Plans, each Fund pays NGAM Distribution a monthly distribution fee at the annual rate of 0.75% of the average daily net assets attributable to the Funds’ Class C shares, as compensation for services provided by NGAM Distribution in connection with the marketing or sale of Class C shares.
For the period ended November 30, 2012, the service and distribution fees for each Fund were as follows:
| Service Fees | Distribution Fees | |||||||||||
| Fund |
Class A |
Class C |
Class C |
|||||||||
| Growth Markets Fund |
$ | 879 | $ | 51 | $ | 153 | ||||||
| Gateway International Fund |
6,563 | 189 | 567 | |||||||||
| Capital Income Fund |
3,032 | 97 | 290 | |||||||||
| Senior Floating Rate and Fixed Income Fund |
42,967 | 13,643 | 40,930 | |||||||||
| Select Fund |
1,990 | 70 | 210 | |||||||||
c. Administrative Fees. NGAM Advisors provides certain administrative services for the Funds and contracts with State Street Bank and Trust Company (“State Street Bank”) to serve as sub-administrator. Pursuant to an agreement among Natixis Funds
99 |
Table of Contents
Notes to Financial Statements (continued)
November 30, 2012
Trust I, Natixis Funds Trust II, Natixis Funds Trust IV, Gateway Trust (“Natixis Funds Trusts”), Loomis Sayles Funds I, Loomis Sayles Funds II (“Loomis Sayles Funds Trusts”), Hansberger International Series and NGAM Advisors, each Fund pays NGAM Advisors monthly its pro rata portion of fees equal to an annual rate of 0.0575% of the first $15 billion of the average daily net assets of the Natixis Funds Trusts, Loomis Sayles Funds Trusts and Hansberger International Series, 0.0500% of the next $15 billion, 0.0400% of the next $30 billion and 0.0350% of such assets in excess of $60 billion, subject to an annual aggregate minimum fee for the Natixis Funds Trusts, Loomis Sayles Funds Trusts and Hansberger International Series of $10 million, which is reevaluated on an annual basis.
NGAM Advisors also provides certain administrative services to the Subsidiary for which the Subsidiary pays NGAM Advisors fees equal to an annual rate of 0.05% of the average daily net assets of the Subsidiary. Payments by the Fund are reduced by the amount of payments to NGAM Advisors by the Subsidiary. In addition, NGAM Advisors and the Subsidiary contract with State Street Bank to serve as sub-administrator.
For the period ended November 30, 2012, the administrative fees for each Fund were as follows (exclusive of sub-administrative fees paid to State Street Bank by the Subsidiary):
| Fund |
Administrative |
|||
| Growth Markets Fund |
$ | 11,694 | ||
| Gateway International Fund |
7,253 | |||
| Capital Income Fund |
5,255 | |||
| Senior Floating Rate and Fixed Income Fund |
28,979 | |||
| Select Fund |
1,446 | |||
d. Sub-Transfer Agent Fees. NGAM Distribution has entered into agreements, which include servicing agreements, with financial intermediaries that provide recordkeeping, processing, shareholder communications and other services to customers of the intermediaries that hold positions in the Funds and has agreed to compensate the intermediaries for providing those services. Intermediaries transact with the Funds primarily through the use of omnibus accounts on behalf of their customers who hold positions in the Funds. These services would have been provided by the Funds’ transfer agent and other service providers if the shareholders’ accounts were maintained directly at the Funds’ transfer agent. Accordingly, the Funds have agreed to reimburse NGAM Distribution for all or a portion of the servicing fees paid to these intermediaries. The reimbursement amounts (sub-transfer agent fees) paid to NGAM Distribution are subject to a current per-account equivalent fee limit approved by the Funds’ Board, which is based on fees for similar services paid to the Funds’ transfer agent and other service providers.
| 100
Table of Contents
Notes to Financial Statements (continued)
November 30, 2012
For the period ended November 30, 2012, the sub-transfer agent fees (which are reflected in transfer agent fees and expenses in the Statements of Operations) for each Fund were as follows:
| Fund |
Sub-Transfer |
|||
| Growth Markets Fund |
$ | 694 | ||
| Gateway International Fund |
3,068 | |||
| Capital Income Fund |
1,975 | |||
| Senior Floating Rate and Fixed Income Fund |
18,848 | |||
| Select Fund |
514 | |||
As of November 30, 2012, the Funds owe NGAM Distribution the following reimbursements for sub-transfer agent fees:
| Fund |
Reimbursements of |
|||
| Growth Markets Fund |
$ | 6 | ||
| Gateway International Fund |
60 | |||
| Capital Income Fund |
36 | |||
| Senior Floating Rate and Fixed Income Fund |
2,091 | |||
| Select Fund |
11 | |||
e. Commissions. Commissions (including CDSCs) on Fund shares retained by NGAM Distribution during the period ended November 30, 2012 were as follows:
| Fund |
Commissions |
|||
| Growth Markets Fund |
$ | 1,112 | ||
| Gateway International Fund |
2,303 | |||
| Capital Income Fund |
115 | |||
| Senior Floating Rate and Fixed Income Fund |
112,884 | |||
| Select Fund |
527 | |||
f. Trustees Fees and Expenses. The Trusts do not pay any compensation directly to their officers or Trustees who are directors, officers or employees of NGAM Advisors, NGAM Distribution, Natixis US or their affiliates. Effective January 1, 2012, the Chairperson of the Board receives a retainer fee at the annual rate of $265,000. The Chairperson does not receive any meeting attendance fees for Board of Trustees meetings or committee meetings that she attends. Each Independent Trustee (other than the Chairperson) receives, in the aggregate, a retainer fee at the annual rate of $95,000. Each Independent Trustee also receives a meeting attendance fee of $10,000 for each meeting of the Board of Trustees that he or she attends in person and $5,000 for each meeting of the Board of Trustees that he or she attends telephonically. In addition, each committee chairman receives an additional retainer fee at the annual
101 |
Table of Contents
Notes to Financial Statements (continued)
November 30, 2012
rate of $15,000. Each Contract Review and Governance Committee member is compensated $6,000 for each Committee meeting that he or she attends in person and $3,000 for each meeting that he or she attends telephonically. Each Audit Committee member is compensated $7,500 for each Committee meeting that he or she attends in person and $3,750 for each meeting that he or she attends telephonically. These fees are allocated among the funds in the Natixis Funds Trusts, Loomis Sayles Funds Trusts and Hansberger International Series based on a formula that takes into account, among other factors, the relative net assets of each fund. Trustees are reimbursed for travel expenses in connection with attendance at meetings.
Prior to January 1, 2012, the Chairperson of the Board received a retainer fee at the annual rate of $250,000 and each Independent Trustee (other than the Chairperson) received, in aggregate, a retainer fee at the annual rate of $80,000. All other Trustee fees remain unchanged.
Effective January 1, 2013, the Chairperson of the Board will receive a retainer fee at the annual rate of $285,000 and each Independent Trustee (other than the Chairperson) will receive, in the aggregate, a retainer fee at the annual rate of $115,000. In addition, each committee chairman will receive an additional retainer fee at an annual rate of $17,500, and each Audit Committee member will be compensated $6,000 for each Committee meeting that he or she will attend in person and $3,000 for each meeting that he or she will attend telephonically. All other Trustee fees will remain unchanged.
A deferred compensation plan (the “Plan”) is available to the Trustees on a voluntary basis. Deferred amounts remain in the Funds until distributed in accordance with the provisions of the Plan. The value of a participating Trustee’s deferral account is based on theoretical investments of deferred amounts, on the normal payment dates, in certain funds of the Natixis Funds Trusts, Loomis Sayles Funds Trusts and Hansberger International Series as designated by the participating Trustees. Changes in the value of participants’ deferral accounts are allocated pro rata among the funds in the Natixis Funds Trusts, Loomis Sayles Funds Trusts, and Hansberger International Series, and are normally reflected as Trustees’ fees and expenses in the Statements of Operations. The portions of the accrued obligations allocated to the Funds under the Plan are reflected as Deferred Trustees’ fees in the Statements of Assets and Liabilities.
g. Affiliated Ownership. As of November 30, 2012, Gateway Advisers, Loomis Sayles Employees’ Profit Sharing Retirement Plan (“Loomis Sayles Retirement Plan”) and Natixis US held shares of the Funds representing the following percentages of net assets:
| 102
Table of Contents
Notes to Financial Statements (continued)
November 30, 2012
| Fund |
Gateway Advisers |
Loomis Sayles Retirement Plan |
Natixis US |
Percentage Affiliated Ownership |
||||||||||||
| Growth Markets Fund |
— | — | 95.41 | % | 95.41 | % | ||||||||||
| Gateway International Fund |
18.30 | % | — | 54.90 | % | 73.20 | % | |||||||||
| Capital Income Fund |
— | — | 51.33 | % | 51.33 | % | ||||||||||
| Senior Floating Rate and Fixed Income Fund |
— | 0.07 | % | — | 0.07 | % | ||||||||||
| Select Fund |
— | — | 68.28 | % | 68.28 | % | ||||||||||
7. Line of Credit. Each Fund, together with certain other funds of Natixis Funds Trusts, Loomis Sayles Funds Trusts and Hansberger International Series, participates in a $200,000,000 committed unsecured line of credit provided by State Street Bank, with an individual limit of $125,000,000 for each fund that participates in the line of credit. Interest is charged to each participating fund based on its borrowings at a rate per annum equal to the greater of the Federal Funds rate or overnight LIBOR, plus 1.25%. In addition, a commitment fee of 0.10% per annum, payable at the end of each calendar quarter, is accrued and apportioned among the participating funds based on their average daily unused portion of the line of credit. Prior to April 19, 2012, the commitment fee was 0.125% per annum.
For the period ended November 30, 2012, none of the Funds had borrowings under these agreements.
Senior Floating Rate and Fixed Income Fund has entered into a committed, secured line of credit with the Bank of Nova Scotia (the “Bank”), under which it may borrow for investment or liquidity purposes. The commitment of the Bank to make loans to the Fund shall not exceed $35,000,000 at any one time. Interest is charged to the Fund based upon the terms set forth in the agreement. In addition, a commitment fee of 0.25% per annum (0.125% per annum for dates upon which the loan balance exceeds 50% of the commitment), payable at the end of each calendar quarter, is accrued by the Fund based on the unused portion of the line of credit.
For the year ended November 30, 2012, Senior Floating Rate and Fixed Income Fund had no borrowings under this agreement.
8. Brokerage Commission Recapture. Certain Funds have entered into agreements with certain brokers whereby the brokers will rebate a portion of brokerage commissions. All amounts rebated by the brokers are returned to the Funds under such agreements and are included in realized gains on investments in the Consolidated Statements of Operations. For the period ended November 30, 2012, amounts rebated under these agreements were as follows:
| Fund |
Rebates |
|||
| Capital Income Fund |
$ | 615 | ||
103 |
Table of Contents
Notes to Financial Statements (continued)
November 30, 2012
9. Concentration of Risk. Each Fund’s investments in foreign securities are subject to foreign currency fluctuations, higher volatility than U.S. securities, varying degrees of regulation and limited liquidity. Greater political, economic, credit and information risks are also associated with foreign securities.
The Growth Markets Fund, Senior Floating Rate and Fixed Income Fund and Select Fund are non-diversified, which means that they are not limited under the 1940 Act to a percentage of assets that they may invest in any one issuer. Because the Funds may invest in the securities of a limited number of issuers, an investment in the Funds may involve a higher degree of risk than would be present in a diversified portfolio.
Growth Markets Fund’s investments in emerging markets companies, which may be smaller and have shorter operating histories than companies in developed markets, involves risks in addition to, and greater than, those generally associated with investing in companies in developed foreign markets. The extent of economic development, political stability, market depth, infrastructure, capitalization and regulatory oversight in emerging market economies is generally less than in more developed markets.
Growth Markets Fund’s investments in commodity-related instruments may subject the Fund to greater volatility than investments in other securities. The value of these investments may be affected by changes in overall market movements, commodity index volatility, changes in interest rates, or factors affecting a particular industry or commodity.
The senior loans in which Senior Floating Rate and Fixed Income Fund expects to invest will generally not be rated investment grade by the rating agencies. Economic downturns generally increase non-payment rates and a senior loan could lose a substantial part of its value prior to default. Senior loans are subject to credit risk, and secured loans may not be adequately collateralized. The interest rates of senior loans reset frequently, and thus senior loans are subject to interest rate risk. Senior loans typically have less liquidity than investment grade bonds and there may be less public information available about them as compared to investment grade bonds.
10. Interest Expense. Growth Markets Fund incurs interest expense on net cash and foreign currency debit balances, if any, for accounts held at brokers. Interest expense incurred for the year ended November 30, 2012 is reflected on the Consolidated Statement of Operations.
11. Concentration of Ownership. From time to time, the Funds may have a concentration of one or more accounts constituting a significant percentage of shares outstanding. Investment activities by holders of such accounts could have material impacts on the Funds. As of November 30, 2012, based on management’s evaluation of the shareholder account base, the Funds had accounts representing controlling ownership of more than 5% of the Fund’s total outstanding shares. The number of such accounts, including affiliated accounts, based on accounts that represent more than 5% of an individual class of shares, and the aggregate percentage of net assets represented by such holdings was as follows:
| 104
Table of Contents
Notes to Financial Statements (continued)
November 30, 2012
| Fund |
Number of |
Percentage of Non-Affiliated |
Percentage of Ownership (Note 6) |
Total Percentage of |
||||||||||||
| Growth Markets Fund |
— | — | 95.41 | % | 95.41 | % | ||||||||||
| Gateway International Fund |
— | — | 73.20 | % | 73.20 | % | ||||||||||
| Capital Income Fund |
1 | 26.21 | % | 51.33 | % | 77.54 | % | |||||||||
| Senior Floating Rate and Fixed Income Fund |
— | — | 0.07 | % | 0.07 | % | ||||||||||
| Select Fund |
— | — | 68.28 | % | 68.28 | % | ||||||||||
Shareholder positions in the Funds may be held by intermediaries utilizing omnibus accounts. The Funds may not have information on the individual shareholder accounts underlying omnibus accounts; therefore, there could be other 5% shareholders in addition to those disclosed in the table above.
12. Capital Shares. Each Fund may issue an unlimited number of shares of beneficial interest, without par value. Transactions in capital shares were as follows:
| |
Year Ended November 30, 2012 |
|
|
Period Ended November 30, 2011* |
| |||||||||||
| Growth Markets Fund |
Shares | Amount | Shares | Amount | ||||||||||||
| Class A | ||||||||||||||||
| Issued from the sale of shares |
134,713 | $ | 1,294,596 | 1,589 | $ | 16,102 | ||||||||||
| Issued in connection with the reinvestment of distributions |
54 | 532 | — | — | ||||||||||||
| Redeemed |
(84,838 | ) | (795,781 | ) | — | — | ||||||||||
|
|
|
|
|
|
|
|
|
|||||||||
| Net change |
49,929 | $ | 499,347 | 1,589 | $ | 16,102 | ||||||||||
|
|
|
|
|
|
|
|
|
|||||||||
| Class C | ||||||||||||||||
| Issued from the sale of shares |
3,859 | $ | 35,701 | 100 | $ | 1,000 | ||||||||||
| Issued in connection with the reinvestment of distributions |
1 | 10 | — | — | ||||||||||||
| Redeemed |
— | — | — | — | ||||||||||||
|
|
|
|
|
|
|
|
|
|||||||||
| Net change |
3,860 | $ | 35,711 | 100 | $ | 1,000 | ||||||||||
|
|
|
|
|
|
|
|
|
|||||||||
| Class Y | ||||||||||||||||
| Issued from the sale of shares |
239,677 | $ | 2,336,889 | 2,511,272 | $ | 25,115,210 | ||||||||||
| Issued in connection with the reinvestment of distributions |
30,033 | 297,335 | — | — | ||||||||||||
| Redeemed |
(183,729 | ) | (1,748,734 | ) | — | — | ||||||||||
|
|
|
|
|
|
|
|
|
|||||||||
| Net change |
85,981 | $ | 885,490 | 2,511,272 | $ | 25,115,210 | ||||||||||
|
|
|
|
|
|
|
|
|
|||||||||
| Increase (decrease) from capital share transactions |
139,770 | $ | 1,420,548 | 2,512,961 | $ | 25,132,312 | ||||||||||
|
|
|
|
|
|
|
|
|
|||||||||
| * | From commencement of operations on October 21, 2011 through November 30, 2011. |
105 |
Table of Contents
Notes to Financial Statements (continued)
November 30, 2012
12. Capital Shares (continued).
| |
Period Ended November 30, 2012* |
| ||||||
| Gateway International Fund |
Shares | Amount | ||||||
| Class A | ||||||||
| Issued from the sale of shares |
743,675 | $ | 6,958,219 | |||||
| Issued in connection with the reinvestment of distributions |
— | — | ||||||
| Redeemed |
(175,736 | ) | (1,706,996 | ) | ||||
|
|
|
|
|
|||||
| Net change |
567,939 | $ | 5,251,223 | |||||
|
|
|
|
|
|||||
| Class C | ||||||||
| Issued from the sale of shares |
25,838 | $ | 247,839 | |||||
| Issued in connection with the reinvestment of distributions |
— | — | ||||||
| Redeemed |
(1,428 | ) | (13,724 | ) | ||||
|
|
|
|
|
|||||
| Net change |
24,410 | $ | 234,115 | |||||
|
|
|
|
|
|||||
| Class Y | ||||||||
| Issued from the sale of shares |
2,141,187 | $ | 21,359,924 | |||||
| Issued in connection with the reinvestment of distributions |
— | — | ||||||
| Redeemed |
— | — | ||||||
|
|
|
|
|
|||||
| Net change |
2,141,187 | $ | 21,359,924 | |||||
|
|
|
|
|
|||||
| Increase (decrease) from capital share transactions |
2,733,536 | $ | 26,845,262 | |||||
|
|
|
|
|
|||||
| * | From commencement of operations on March 30, 2012 through November 30, 2012. |
| |
Period Ended November 30, 2012* |
| ||||||
| Capital Income Fund |
Shares | Amount | ||||||
| Class A | ||||||||
| Issued from the sale of shares |
256,182 | $ | 2,501,881 | |||||
| Issued in connection with the reinvestment of distributions |
3,281 | 33,392 | ||||||
| Redeemed |
(1,535 | ) | (15,003 | ) | ||||
|
|
|
|
|
|||||
| Net change |
257,928 | $ | 2,520,270 | |||||
|
|
|
|
|
|||||
| Class C | ||||||||
| Issued from the sale of shares |
8,878 | $ | 88,659 | |||||
| Issued in connection with the reinvestment of distributions |
42 | 415 | ||||||
| Redeemed |
(3,019 | ) | (31,338 | ) | ||||
|
|
|
|
|
|||||
| Net change |
5,901 | $ | 57,736 | |||||
|
|
|
|
|
|||||
| Class Y | ||||||||
| Issued from the sale of shares |
2,108,202 | $ | 20,894,145 | |||||
| Issued in connection with the reinvestment of distributions |
26,964 | 271,510 | ||||||
| Redeemed |
(512,001 | ) | (5,055,536 | ) | ||||
|
|
|
|
|
|||||
| Net change |
1,623,165 | $ | 16,110,119 | |||||
|
|
|
|
|
|||||
| Increase (decrease) from capital share transactions |
1,886,994 | $ | 18,688,125 | |||||
|
|
|
|
|
|||||
| * | From commencement of operations on March 30, 2012 through November 30, 2012. |
| 106
Table of Contents
Notes to Financial Statements (continued)
November 30, 2012
12. Capital Shares (continued).
| |
Year Ended November 30, 2012 |
|
|
Period Ended November 30, 2011* |
| |||||||||||
| Senior Floating Rate and Fixed Income Fund |
Shares | Amount | Shares | Amount | ||||||||||||
| Class A | ||||||||||||||||
| Issued from the sale of shares |
7,851,102 | $ | 82,521,992 | 27,583 | $ | 277,148 | ||||||||||
| Issued in connection with the reinvestment of distributions |
82,627 | 866,967 | 114 | 1,145 | ||||||||||||
| Redeemed |
(373,030 | ) | (3,928,307 | ) | (2,604 | ) | (26,365 | ) | ||||||||
|
|
|
|
|
|
|
|
|
|||||||||
| Net change |
7,560,699 | $ | 79,460,652 | 25,093 | $ | 251,928 | ||||||||||
|
|
|
|
|
|
|
|
|
|||||||||
| Class C | ||||||||||||||||
| Issued from the sale of shares |
2,156,428 | $ | 22,597,310 | 102 | $ | 1,000 | ||||||||||
| Issued in connection with the reinvestment of distributions |
21,262 | 222,780 | 1 | 9 | ||||||||||||
| Redeemed |
(29,116 | ) | (306,126 | ) | — | — | ||||||||||
|
|
|
|
|
|
|
|
|
|||||||||
| Net change |
2,148,574 | $ | 22,513,964 | 103 | $ | 1,009 | ||||||||||
|
|
|
|
|
|
|
|
|
|||||||||
| Class Y | ||||||||||||||||
| Issued from the sale of shares |
6,914,612 | $ | 72,446,814 | 4,010,040 | $ | 40,101,000 | ||||||||||
| Issued in connection with the reinvestment of distributions |
255,066 | 2,638,403 | 43,595 | 435,951 | ||||||||||||
| Redeemed |
(6,785,338 | ) | (70,940,452 | ) | — | — | ||||||||||
|
|
|
|
|
|
|
|
|
|||||||||
| Net change |
384,340 | $ | 4,144,765 | 4,053,635 | $ | 40,536,951 | ||||||||||
|
|
|
|
|
|
|
|
|
|||||||||
| Increase (decrease) from capital share transactions |
10,093,613 | $ | 106,119,381 | 4,078,831 | $ | 40,789,888 | ||||||||||
|
|
|
|
|
|
|
|
|
|||||||||
| * | From commencement of operations on September 30, 2011 through November 30, 2011 for Class A shares and Class C shares and from commencement of operations on September 16, 2011 through November 30, 2011 for Class Y shares. |
107 |
Table of Contents
Notes to Financial Statements (continued)
November 30, 2012
12. Capital Shares (continued).
| |
Period Ended November 30, 2012* |
| ||||||
| Select Fund |
Shares | Amount | ||||||
| Class A | ||||||||
| Issued from the sale of shares |
267,859 | $ | 2,765,506 | |||||
| Issued in connection with the reinvestment of distributions |
— | — | ||||||
| Redeemed |
(193,878 | ) | (1,990,029 | ) | ||||
|
|
|
|
|
|||||
| Net change |
73,981 | $ | 775,477 | |||||
|
|
|
|
|
|||||
| Class C | ||||||||
| Issued from the sale of shares |
15,231 | $ | 160,427 | |||||
| Issued in connection with the reinvestment of distributions |
— | — | ||||||
| Redeemed |
— | — | ||||||
|
|
|
|
|
|||||
| Net change |
15,231 | $ | 160,427 | |||||
|
|
|
|
|
|||||
| Class Y | ||||||||
| Issued from the sale of shares |
646,002 | $ | 6,538,025 | |||||
| Issued in connection with the reinvestment of distributions |
— | — | ||||||
| Redeemed |
(3,018 | ) | (31,718 | ) | ||||
|
|
|
|
|
|||||
| Net change |
642,984 | $ | 6,506,307 | |||||
|
|
|
|
|
|||||
| Increase (decrease) from capital share transactions |
732,196 | $ | 7,442,211 | |||||
|
|
|
|
|
|||||
| * | From commencement of operations on June 29, 2012 through November 30, 2012. |
| 108
Table of Contents
Report of Independent Registered Public Accounting Firm
To the Board of Trustees of Gateway Trust and Natixis Funds Trust II and Shareholders of Gateway International Fund, ASG Growth Markets Fund, Loomis Sayles Capital Income Fund, Loomis Sayles Senior Floating Rate and Fixed Income Fund and Vaughan Nelson Select Fund:
In our opinion, the accompanying statements of assets and liabilities, including the portfolios of investments, and the related statements of operations and of changes in net assets and the financial highlights present fairly, in all material respects, the financial position of the Gateway International Fund, a series of Gateway Trust; and ASG Growth Markets Fund (Consolidated), Loomis Sayles Capital Income Fund, Loomis Sayles Senior Floating Rate and Fixed Income Fund and Vaughan Nelson Select Fund, each a series of Natixis Funds Trust II (collectively, the “Funds”), at November 30, 2012, and the results of each of their operations, the changes in each of their net assets and the financial highlights for the periods indicated, in conformity with accounting principles generally accepted in the United States of America. These financial statements and financial highlights (hereafter referred to as “financial statements”) are the responsibility of the Funds’ management; our responsibility is to express an opinion on these financial statements based on our audits. We conducted our audits of these financial statements in accordance with the standards of the Public Company Accounting Oversight Board (United States). Those standards require that we plan and perform the audits to obtain reasonable assurance about whether the financial statements are free of material misstatement. An audit includes examining, on a test basis, evidence supporting the amounts and disclosures in the financial statements, assessing the accounting principles used and significant estimates made by management, and evaluating the overall financial statement presentation. We believe that our audits, which included confirmation of securities at November 30, 2012 by correspondence with the custodian and brokers, provide a reasonable basis for our opinion.
PricewaterhouseCoopers LLP
Boston, Massachusetts
January 22, 2013
109 |
Table of Contents
2012 U.S. Tax Distribution Information to Shareholders (Unaudited)
Corporate Dividends Received Deduction. For the fiscal year ended November 30, 2012, a percentage of dividends distributed by the Funds listed below qualify for the dividends received deduction for corporate shareholders. These percentages are as follows:
| Fund |
Qualifying |
|||
| Growth Markets |
0.05 | % | ||
| Capital Income |
68.16 | % | ||
Qualified Dividend Income. For the fiscal year ended November 30, 2012, the Funds below will designate up to the maximum amount allowable pursuant to the Internal Revenue Code as qualified dividend income eligible for reduced tax rates. These lower rates range from 0% to 15% depending on an individual’s tax bracket. If the Funds pay a distribution during calendar year 2012, complete information will be reported in conjunction with Form 1099-DIV.
| Fund |
| Growth Markets |
| Gateway International |
| Capital Income |
| Select |
Foreign Tax Credit. For the year ended November 30, 2012, the Fund intends to pass through foreign tax credits and have derived gross income from sources within foreign countries amounting to:
| Fund |
Foreign Tax Credit |
Foreign Source |
||||||
| Growth Markets |
$ | 44,163 | $ | 512,563 | ||||
| Gateway International |
42,550 | 638,608 | ||||||
| 110
Table of Contents
Trustee and Officer Information
The tables below provide certain information regarding the trustees and officers of Natixis Funds Trust II and Gateway Trust (the “Trusts”). Unless otherwise indicated, the address of all persons below is 399 Boylston Street, Boston, MA 02116. The Funds’ Statements of Additional Information include additional information about the trustees of the Trusts and are available by calling Natixis Funds at 800-225-5478.
| Name and Year of Birth |
Position(s) Held |
Principal Occupation(s) 5 Years |
Number of Fund Complex and Other 5 Years |
Experience, | ||||
| INDEPENDENT TRUSTEES | ||||||||
| Charles D. Baker (1956) | Trustee From 2005 to 2009 and since 2011 for Natixis Funds Trust II; and from 2007 to 2009 and since 2011 for Gateway Trust Contract Review and Governance Committee Member |
Executive in Residence at General Catalyst Partners (venture capital and growth equity firm); formerly, President and Chief Executive Officer, Harvard Pilgrim Health Care (health care organization) | 44 Director, Athenahealth, Inc. (software company) |
Significant experience on the Board of Trustees of the Trusts; executive experience (including president and chief executive officer of a health care organization and executive officer of a venture capital and growth equity firm) | ||||
| Daniel M. Cain3 (1945) |
Interested Trustee of Natixis Funds Trust II Independent Trustee of Gateway Trust Since 1996 for Natixis Funds Trust II; and since 2007 for Gateway Trust Chairman of the Contract Review and Governance Committee |
Chairman (formerly, President and Chief Executive Officer) of Cain Brothers & Company, Incorporated (investment banking) | 44 Director, Sheridan Healthcare Inc. (physician practice management) |
Significant experience on the Board of Trustees of the Trusts and on the board of other business organizations (including at a health care organization); experience in the financial industry (including roles as chairman and former chief executive officer of an investment banking firm) | ||||
111 |
Table of Contents
Trustee and Officer Information
| Name and Year of Birth |
Position(s) Held |
Principal Occupation(s) 5 Years |
Number of Fund Complex and Other 5 Years |
Experience, | ||||
| INDEPENDENT TRUSTEES continued |
||||||||
| Kenneth A. Drucker (1945) |
Trustee Since 2008 for Natixis Funds Trust II and Gateway Trust Chairman of the Audit Committee |
Retired | 44 Formerly, Director, M Fund, Inc. (investment company); Director, Gateway Trust (investment company) |
Significant experience on the Board of Trustees of the Trusts and on the board of other business organizations (including at investment companies); executive experience (including as treasurer of an aerospace, automotive, and metal manufacturing corporation) | ||||
| Edmond J. English4 (1953) |
Trustee Since 2013 for Natixis Funds Trust II and Gateway Trust Contract Review and Governance Committee Member |
Chief Executive Officer of Bob’s Discount Furniture (retail) | 44 Formerly, Director, BJ’s Wholesale Club (retail); formerly, Director, Citizens Financial Group (bank) |
Significant experience on the board of other business organizations (including at a retail company and a bank); executive experience (including at a retail company) | ||||
| 112
Table of Contents
Trustee and Officer Information
| Name and Year of Birth |
Position(s) Held |
Principal Occupation(s) 5 Years |
Number of Fund Complex and Other 5 Years |
Experience, | ||||
| INDEPENDENT TRUSTEES | ||||||||
| Wendell J. Knox (1948) |
Trustee Since 2009 for Natixis Funds Trust II and Gateway Trust Audit Committee Member |
Director (formerly, President and Chief Executive Officer) of Abt Associates Inc. (research and consulting) | 44 Director, Eastern Bank (commercial bank); Director, The Hanover Insurance Group (property and casualty insurance) |
Significant experience on the Board of Trustees of the Trusts and on the board of other business organizations (including at a commercial bank and at a property and casualty insurance firm); executive experience (including roles as president and chief executive officer of a consulting company) | ||||
| Martin T. Meehan5 (1956) | Trustee Since 2012 for Natixis Funds Trust II and Gateway Trust Contract Review and Governance Committee Member |
Chancellor and faculty member, University of Massachusetts Lowell | 44 Director, Lowell Cooperative Bank (commercial bank); formerly, Director, Qteros, Inc. (biofuels); formerly, Trustee, Suffolk University (education); formerly, Director, D’Youville Foundation (senior care) |
Experience as Chancellor of the University of Massachusetts Lowell; experience on the board of other business organizations; government experience (including as a member of the U.S. House of Representatives); academic experience | ||||
113 |
Table of Contents
Trustee and Officer Information
| Name and Year of Birth |
Position(s) Held |
Principal Occupation(s) 5 Years |
Number of Fund Complex and Other 5 Years |
Experience, | ||||
| INDEPENDENT TRUSTEES continued |
||||||||
| Sandra O. Moose (1942) |
Chairperson of the Board of Trustees since November 2005 Trustee Since 1993 for Natixis Funds Trust II; and since 2007 for Gateway Trust Ex officio member of the Audit Committee and Contract Review and Governance Committee |
President, Strategic Advisory Services (management consulting) | 44 Director, Verizon Communications; Director, AES Corporation (international power company); formerly, Director, Rohm and Haas Company (specialty chemicals) |
Significant experience on the Board of Trustees of the Trusts and on the board of other business organizations (including at an international power company and a specialty chemicals corporation); executive experience (including at a management consulting company) | ||||
| Erik R. Sirri (1958) |
Trustee Since 2009 for Natixis Funds Trust II and Gateway Trust Audit Committee Member6 |
Professor of Finance at Babson College; formerly, Director of the Division of Trading and Markets at the Securities and Exchange Commission | 44 None |
Experience on the Board of Trustees of the Trusts; experience as Director of the Division of Trading and Markets at the Securities and Exchange Commission; academic experience; training as an economist | ||||
| 114
Table of Contents
Trustee and Officer Information
| Name and Year of Birth |
Position(s) Held |
Principal Occupation(s) 5 Years |
Number of Fund Complex and Other 5 Years |
Experience, | ||||
| INDEPENDENT TRUSTEES | ||||||||
| Peter J. Smail (1952) |
Trustee Since 2009 for Natixis Funds Trust II and Gateway Trust Contract Review and Governance Committee Member |
Retired; formerly, President and Chief Executive Officer of Pyramis Global Advisors (investment management) | 44 None |
Experience on the Board of Trustees of the Trusts; mutual fund industry and executive experience (including roles as president and chief executive officer for an investment adviser) | ||||
| Cynthia L. Walker (1956) |
Trustee Since 2005 for Natixis Funds Trust II; and since 2007 for Gateway Trust Audit Committee Member |
Deputy Dean for Finance and Administration, Yale University School of Medicine; formerly, Executive Dean for Administration, Harvard Medical School | 44 None |
Significant experience on the Board of Trustees of the Trusts; executive experience in a variety of academic organizations (including roles as dean for finance and administration) | ||||
| INTERESTED TRUSTEES | ||||||||
| Robert J. Blanding7 (1947) 555 California Street San Francisco, CA 94104 |
Trustee Since 2003 for Natixis Funds Trust II; and since 2007 for Gateway Trust |
President, Chairman, Director and Chief Executive Officer, Loomis, Sayles & Company, L.P. | 44 None |
Significant experience on the Board of Trustees of the Trusts; continuing service as President, Chairman, and Chief Executive Officer of Loomis, Sayles & Company, L.P. | ||||
115 |
Table of Contents
Trustee and Officer Information
| Name and Year of Birth |
Position(s) Held |
Principal Occupation(s) 5 Years |
Number of Fund Complex and Other 5 Years |
Experience, | ||||
| INTERESTED TRUSTEES continued |
||||||||
| David L. Giunta8 (1965) | Trustee Since 2011 for Natixis Funds Trust II and Gateway Trust President and Chief Executive Officer of Natixis Funds Trust II and Gateway Trust since 2008 |
President and Chief Executive Officer, NGAM Distribution Corporation, NGAM Advisors, L.P. and NGAM Distribution, L.P.; formerly President, Fidelity Charitable Gift Fund; and formerly, Senior Vice President, Fidelity Brokerage Company | 44 None |
Experience on the Board of Trustees of the Trusts; continuing experience as President and Chief Executive Officer of NGAM Advisors, L.P. | ||||
| John T. Hailer9 (1960) |
Trustee Since 2000 for Natixis Funds Trust II; since 2007 for Gateway Trust |
President and Chief Executive Officer-U.S. and Asia, Natixis Global Asset Management, L.P.; formerly, President and Chief Executive Officer, NGAM Distribution Corporation, NGAM Advisors L.P. and NGAM Distribution, L.P. | 44 None |
Significant experience on the Board of Trustees of the Trusts; continuing experience as Chief Executive Officer-U.S. and Asia, Natixis Global Asset Management, L.P. | ||||
| 1 | Each trustee serves until retirement, resignation or removal from the Board of Trustees of the Trusts. The current retirement age is 72. The position of Chairperson of the Board is appointed for a two-year term. Ms. Moose was appointed to serve an additional two year term as the Chairperson of the Board on November 18, 2011. |
| 2 | The trustees of the Trusts serve as trustees of a fund complex that includes all series of the Natixis Funds Trust I, Natixis Funds Trust II, Natixis Funds Trust IV and Gateway Trust (collectively, the “Natixis Funds Trusts”), Loomis Sayles Funds I and Loomis Sayles Funds II (collectively, the “Loomis Sayles Funds Trusts”), and Hansberger International Series (collectively, the “Fund Complex”). |
| 116
Table of Contents
Trustee and Officer Information
| 3 | Mr. Cain is deemed an “interested person” of Natixis Funds Trust II because he is an affiliated person of Cain Brothers & Company, LLC, a registered broker-dealer that has executed portfolio transactions on behalf of certain institutional separate accounts managed by McDonnell Investment Management, LLC, the sub-adviser to the McDonnell Intermediate Municipal Bond Fund, a series of Natixis Funds Trust II. |
| 4 | Mr. English was appointed as a trustee effective January 1, 2013. |
| 5 | Mr. Meehan was appointed as a trustee effective July 1, 2012. |
| 6 | Mr. Sirri was appointed to the Audit Committee effective January 1, 2013 and served as a member of the Contract Review and Governance Committee until that time. |
| 7 | Mr. Blanding is deemed an “interested person” of the Trusts because he holds the following positions with an affiliated person of the Trusts: President, Chairman, Director and Chief Executive Officer of Loomis, Sayles & Company, L.P. |
| 8 | Mr. Giunta is deemed an “interested person” of the Trusts because he holds the following positions with an affiliated person of the Trusts: President and Chief Executive Officer of NGAM Distribution Corporation, NGAM Advisors, L.P. and NGAM Distribution, L.P. |
| 9 | Mr. Hailer is deemed an “interested person” of the Trusts because he holds the following positions with an affiliated person of the Trusts: President and Chief Executive Officer – U.S. and Asia, Natixis Global Asset Management, L.P. |
117 |
Table of Contents
Trustee and Officer Information
| Name and Year of Birth |
Position(s) Held with the Trusts |
Term of Office1 and |
Principal Occupation | |||
| OFFICERS OF THE TRUST | ||||||
| Coleen Downs Dinneen (1960) |
Secretary, Clerk and Chief Legal Officer | Since September 2004 | Executive Vice President, General Counsel, Secretary and Clerk (formerly, Senior Vice President, Deputy General Counsel, Assistant Secretary and Assistant Clerk), NGAM Distribution Corporation, NGAM Advisors, L.P. and NGAM Distribution, L.P. | |||
| Russell L. Kane (1969) |
Chief Compliance Officer, Assistant Secretary and Anti-Money Laundering Officer |
Chief Compliance Officer, since May 2006; Assistant Secretary since June 2004; and Anti-Money Laundering Officer since April 2007 | Chief Compliance Officer for Mutual Funds, Senior Vice President, Deputy General Counsel, Assistant Secretary and Assistant Clerk, NGAM Distribution Corporation, NGAM Advisors, L.P. and NGAM Distribution, L.P. | |||
| Michael C. Kardok (1959) |
Treasurer, Principal Financial and Accounting Officer | Since October 2004 | Senior Vice President, NGAM Advisors, L.P. and NGAM Distribution, L.P. | |||
| 1 | Each officer of the Trusts serves for an indefinite term in accordance with the Trusts’ current by-laws until the date his or her successor is elected and qualified, or until he or she sooner dies, retires, is removed or becomes disqualified. |
| 2 | Each person listed above, except as noted, holds the same position(s) with the Fund Complex. Previous positions during the past five years with NGAM Distribution, L.P., NGAM Advisors, L.P. or Loomis, Sayles & Company, L.P. are omitted, if not materially different from a trustee’s or officer’s current position with such entity. |
| 118
Table of Contents
Item 2. Code of Ethics.
The Registrant has adopted a code of ethics that applies to the Registrant’s principal executive officer, principal financial officer and persons performing similar functions. There have been no amendments or waivers of the Registrant’s code of ethics during the period.
Item 3. Audit Committee Financial Expert.
The Board of Trustees of the Registrant has established an audit committee. Mr. Kenneth A. Drucker, Mr. Wendell J.
Knox,
Mr. Erik R. Sirri and Ms. Cynthia L. Walker are members of the audit committee and have been designated as “audit committee financial experts” by the Board of Trustees. Each of these individuals is also an
Independent Trustee of the Registrant.
Item 4. Principal Accountant Fees and Services.
Fees billed by the Principal Accountant for services rendered to the Registrant.
The table below sets forth fees billed by the principal accountant, PricewaterhouseCoopers LLP, for the past two fiscal years for professional services rendered in connection with a) the audit of the Registrant’s annual financial statements and services provided in connection with regulatory filings; b) audit-related services (including services that are reasonably related to the performance of the audit of the Registrant’s financial statements but not reported under “Audit Fees”); c) tax compliance, tax advice and tax planning; and d) all other fees billed for professional services rendered by the principal accountant to the Registrant, other than the services provided reported as a part of (a) through (c) of this Item.
| Audit fees | Audit-related fees1 | Tax fees2 | All other fees | |||||||||||||||||||||||||||||
| Commencement of operations*- 11/30/11 |
12/1/11- 11/30/12 |
Commencement of operations*- 11/30/11 |
12/1/11- 11/30/12 |
Commencement of operations*- 11/30/11 |
12/1/11- 11/30/12 |
Commencement of operations*- 11/30/11 |
12/1/11- 11/30/12 |
|||||||||||||||||||||||||
| Natixis Funds Trust II-ASG Growth Markets Fund, Loomis Sayles Capital Income Fund**, |
$ | 88,300 | $ | 187,075 | $ | — | $ | 12 | $ | 14,370 | $ | 58,140 | $ | — | $ | — | ||||||||||||||||
| Loomis Sayles Senior Floating Rate and Fixed Income Fund and Vaughan Nelson Select Fund*** |
||||||||||||||||||||||||||||||||
| * | October 21, 2011 for ASG Growth Markets Fund and September 16, 2011 for Loomis Sayles Senior Floating Rate and Fixed Income Fund. |
| ** | Loomis Sayles Capital Income Fund commenced operations on March 30, 2012. |
| *** | Vaughan Nelson Select Fund commenced operations on June 29, 2012. |
1. Audit-related fees consist of:
2012 – performance of agreed-upon procedures related to the Registrant’s deferred compensation plan.
2. Tax fees consist of:
2011 – review of the Registrant’s tax returns.
2012 – review of the Registrant’s tax returns, consulting services with respect to complex security types, and consulting services with respect to Cayman subsidiary.
Table of Contents
Aggregate fees billed to the Registrant for non-audit services during the period September 16, 2011 through November 30, 2011 and fiscal year 2012 were $14,370 and $58,152.
The following table sets forth the fees billed by the Registrant’s principal accountant for non-audit services rendered to AlphaSimplex Group, LLC (“ASG”) and Loomis Sayles & Company, L.P. (“Loomis”) entities controlling, controlled by or under common control with ASG, Loomis and NGAM (“Control Affiliates”) that provide ongoing services to the Registrant, for engagements that related directly to the operations and financial reporting of the Registrant for the period September 16, 2011 through November 30, 2011 and the fiscal year 2012.
| Audit-related fees | Tax fees | All other fees | ||||||||||||||||||||||
| 9/16/11- 11/30/11 |
12/1/12- 11/30/12 |
9/16/11- 11/30/11 |
12/1/12- 11/30/12 |
9/16/11- 11/30/11 |
12/1/12- 11/30/12 |
|||||||||||||||||||
| Control Affiliates |
$ | — | $ | — | $ | — | $ | — | $ | — | $ | — | ||||||||||||
The following table sets forth the aggregate fees billed by the Registrant’s principal accountant for non-audit services rendered to ASG, Loomis and Control Affiliates that provide ongoing services to the Registrant, for the last two fiscal years, including the fees disclosed in the table above.
| Aggregate Non-Audit Fees | ||||||||
| 12/1/10- 11/30/11 |
12/1/11- 11/30/12 |
|||||||
| Control Affiliates |
$ | 70,656 | $ | 77,334 | ||||
None of the services described above were approved pursuant to (c)(7)(i)(C) of Regulation S-X.
Audit Committee Pre-Approval Policies.
Annually, the Registrant’s Audit Committee reviews the audit, audit-related, tax and other non-audit services together with the projected fees, for services proposed to be rendered to the Trust and/or other entities for which pre-approval is required during the upcoming year. Any subsequent revisions to already pre-approved services or fees (including fee increases) and requests for pre-approval of new services would be presented for consideration quarterly as needed.
If, in the opinion of management, a proposed engagement by the Registrant’s independent accountants needs to commence before the next regularly scheduled Audit Committee meeting, any member of the Audit Committee who is an independent Board member is authorized to pre-approve the engagement, but only for engagements to provide audit, audit-related and tax services. This approval is subject to review of the full Audit Committee at its next quarterly meeting. All other engagements require the approval of all the members of the audit committee.
Item 5. Audit Committee of Listed Registrants.
Not applicable.
Item 6. Schedule of Investments.
Included as part of the Report to Shareholders filed as Item 1 herewith.
Item 7. Disclosure of Proxy Voting Policies and Procedures for Closed-End Management Investment Companies.
Not applicable.
Item 8. Portfolio Managers of Closed-End Management Investment Companies.
Not applicable.
Item 9. Purchases of Equity Securities by Closed-End Management Investment Companies and Affiliated Purchasers.
Not applicable.
Table of Contents
Item 10. Submission of Matters to a Vote of Securities Holders.
There were no material changes to the procedures by which shareholders may recommend nominees to the Registrant’s Board of Trustees.
Item 11. Controls and Procedures.
The Registrant’s principal executive officer and principal financial officer have concluded that the Registrant’s disclosure controls and procedures are sufficient to ensure that information required to be disclosed by the Registrant in this Form N-CSR was recorded, processed, summarized and reported within the time periods specified in the Securities and Exchange Commission’s rules and forms, based upon such officers’ evaluation of these controls and procedures as of a date within 90 days of the filing date of the report.
There were no changes in the Registrant’s internal control over financial reporting that occurred during the Registrant’s last fiscal quarter of the period covered by this report that has materially affected, or is reasonably likely to materially affect, the Registrant’s internal control over financial reporting.
Item 12. Exhibits.
| (a) (1) |
Code of Ethics required by Item 2 hereof, filed herewith as Exhibit (a)(1). | |||
| (a) (2) |
Certifications of Principal Executive Officer and Principal Financial Officer pursuant to Rule 30a-2(a) under the Investment Company Act of 1940 (17 CFR 270.30a-2(a)), filed herewith as Exhibits (a)(2)(1) and (a)(2)(2), respectively. | |||
| (a) (3) |
Not applicable. | |||
| (b) |
Certifications of Principal Executive Officer and Principal Financial Officer pursuant to Section 906 of Sarbanes-Oxley Act of 2002 are filed herewith as Exhibit (b). | |||
Table of Contents
SIGNATURES
Pursuant to the requirements of the Securities Exchange Act of 1934 and the Investment Company Act of 1940, the Registrant has duly caused this report to be signed on its behalf by the undersigned, thereunto duly authorized.
| Natixis Funds Trust II | ||||
| By: | /s/ David L. Giunta |
|||
| Name: | David L. Giunta | |||
| Title: | President and Chief Executive Officer | |||
| Date: | January 22, 2013 | |||
Pursuant to the requirements of the Securities Exchange Act of 1934 and the Investment Company Act of 1940, this report has been signed by the following persons on behalf of the Registrant and in the capacities and on the dates indicated.
| By: | /s/ David L. Giunta |
|||
| Name: | David L. Giunta | |||
| Title: | President and Chief Executive Officer | |||
| Date: | January 22, 2013 | |||
| By: | /s/ Michael C. Kardok |
|||
| Name: | Michael C. Kardok | |||
| Title: | Treasurer | |||
| Date: | January 22, 2013 | |||