Table of Contents
UNITED STATES
SECURITIES AND EXCHANGE COMMISSION
Washington, D.C. 20549
FORM N-CSR
CERTIFIED SHAREHOLDER REPORT OF REGISTERED
MANAGEMENT INVESTMENT COMPANIES
Investment Company Act file number: 811-00242
| Natixis Funds Trust II |
(Exact name of Registrant as specified in charter)
| 399 Boylston Street, Boston, Massachusetts 02116 |
(Address of principal executive offices) (Zip code)
| Coleen Downs Dinneen, Esq. NGAM Distribution, L.P. 399 Boylston Street Boston, Massachusetts 02116 |
(Name and address of agent for service)
Registrant’s telephone number, including area code: (617) 449-2810
Date of fiscal year end: November 30
Date of reporting period: May 31, 2012
Table of Contents
Item 1. Reports to Stockholders.
The Registrant’s semi-annual report transmitted to shareholders pursuant to Rule 30e-1 under the Investment Company Act of 1940 is as follows:
Table of Contents
SEMIANNUAL REPORT
May 31, 2012

ASG Growth Markets Fund
Gateway International Fund
Loomis Sayles Capital Income Fund
Loomis Sayles Senior Floating Rate and Fixed Income Fund
Management Discussion and Investment Results page 1
Portfolio of Investments page 15
Financial Statements page 31
Table of Contents
ASG GROWTH MARKETS FUND
1 |
Table of Contents
ASG GROWTH MARKETS FUND
Investment Results through May 31, 2012
| 2
Table of Contents
GATEWAY INTERNATIONAL FUND
3 |
Table of Contents
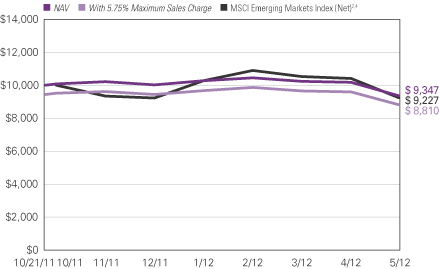
GATEWAY INTERNATIONAL FUND
Investment Results through May 31, 2012
| 4
Table of Contents
LOOMIS SAYLES CAPITAL INCOME FUND
Management Discussion
5 |
Table of Contents
LOOMIS SAYLES CAPITAL INCOME FUND
Investment Results through May 31, 2012
| 6
Table of Contents
LOOMIS SAYLES SENIOR FLOATING RATE AND FIXED INCOME FUND
Management Discussion
7 |
Table of Contents
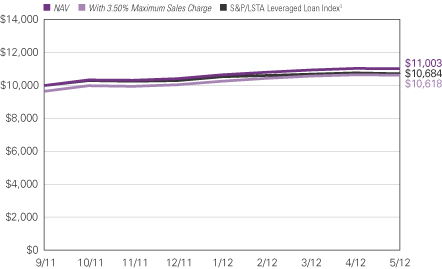
LOOMIS SAYLES SENIOR FLOATING RATE AND FIXED INCOME FUND
Investment Results through May 31, 2012
| 8
Table of Contents
ADDITIONAL INFORMATION
The views expressed in this report reflect those of the portfolio managers as of the dates indicated. The managers’ views are subject to change at any time without notice based on changes in market or other conditions. References to specific securities or industries should not be regarded as investment advice. Because the funds are actively managed, there is no assurance that they will continue to invest in the securities or industries mentioned.
Before investing, consider a fund’s investment objectives, risks, charges and expenses. Visit ngam.natixis.com or call 800-225-5478 for a prospectus and/or a summary prospectus, both of which contain this and other information. Read it carefully.
9 |
Table of Contents
UNDERSTANDING FUND EXPENSES
| ASG GROWTH MARKETS FUND | BEGINNING ACCOUNT VALUE 12/1/2011 |
ENDING ACCOUNT VALUE 5/31/2012 |
EXPENSES PAID DURING PERIOD* 12/1/2011 – 5/31/2012 |
|||||||||
| Class A |
||||||||||||
| Actual |
$1,000.00 | $916.50 | $8.29 | |||||||||
| Hypothetical (5% return before expenses) |
$1,000.00 | $1,016.35 | $8.72 | |||||||||
| Class C |
||||||||||||
| Actual |
$1,000.00 | $912.90 | $11.81 | |||||||||
| Hypothetical (5% return before expenses) |
$1,000.00 | $1,012.65 | $12.43 | |||||||||
| Class Y |
||||||||||||
| Actual |
$1,000.00 | $916.80 | $7.09 | |||||||||
| Hypothetical (5% return before expenses) |
$1,000.00 | $1,017.60 | $7.47 | |||||||||
| * | Expenses are equal to the Fund’s annualized expense ratio (after waiver/reimbursement), including expenses of the Subsidiary (see Note 1 of Notes to Financial Statements) and interest expense: 1.73%, 2.47% and 1.48% for Class A, C and Y, respectively, multiplied by the average account value over the period, multiplied by the number of days in the most recent fiscal half-year, divided by 366 (to reflect the half-year period). |
| 10
Table of Contents
UNDERSTANDING FUND EXPENSES
| GATEWAY INTERNATIONAL FUND | BEGINNING ACCOUNT VALUE 12/1/20111 |
ENDING ACCOUNT VALUE 5/31/2012 |
EXPENSES PAID DURING PERIOD 12/1/20111 – 5/31/2012 |
|||||||||
| Class A |
||||||||||||
| Actual |
$1,000.00 | $919.00 | $2.19 | 1 | ||||||||
| Hypothetical (5% return before expenses) |
$1,000.00 | $1,018.25 | $6.81 | * | ||||||||
| Class C |
||||||||||||
| Actual |
$1,000.00 | $919.00 | $3.41 | 1 | ||||||||
| Hypothetical (5% return before expenses) |
$1,000.00 | $1,014.50 | $10.58 | * | ||||||||
| Class Y |
||||||||||||
| Actual |
$1,000.00 | $920.00 | $1.79 | 1 | ||||||||
| Hypothetical (5% return before expenses) |
$1,000.00 | $1,019.50 | $5.55 | * | ||||||||
| * | Hypothetical expenses are equal to the Fund’s annualized expense ratio (after waiver/reimbursement): 1.35%, 2.10% and 1.10% for Class A, C and Y, respectively, multiplied by the average account value over the period, multiplied by the number of days in the most recent half-year (183), divided by 366 (to reflect the half-year period). |
| 1 | Fund commenced operations on March 30, 2012. Actual expenses are equal to the Fund’s annualized expense ratio (after waiver/reimbursement): 1.35%, 2.10% and 1.10% for Class A, C and Y, respectively, multiplied by the average account value over the period, multiplied by the number of days in the most recent fiscal period (62), divided by 366 (to reflect the partial period). |
| LOOMIS SAYLES CAPITAL INCOME FUND | BEGINNING ACCOUNT VALUE 12/1/20111 |
ENDING ACCOUNT VALUE 5/31/2012 |
EXPENSES PAID DURING PERIOD 12/1/20111 – 5/31/2012 |
|||||||||
| Class A |
||||||||||||
| Actual |
$1,000.00 | $946.00 | $1.98 | 1 | ||||||||
| Hypothetical (5% return before expenses) |
$1,000.00 | $1,019.00 | $6.06 | * | ||||||||
| Class C |
||||||||||||
| Actual |
$1,000.00 | $944.00 | $3.21 | 1 | ||||||||
| Hypothetical (5% return before expenses) |
$1,000.00 | $1,015.25 | $9.82 | * | ||||||||
| Class Y |
||||||||||||
| Actual |
$1,000.00 | $946.00 | $1.57 | 1 | ||||||||
| Hypothetical (5% return before expenses) |
$1,000.00 | $1,020.25 | $4.80 | * | ||||||||
| * | Hypothetical expenses are equal to the Fund’s annualized expense ratio (after waiver/reimbursement): 1.20%, 1.95% and 0.95% for Class A, C and Y, respectively, multiplied by the average account value over the period, multiplied by the number of days in the most recent half-year (183), divided by 366 (to reflect the half-year period). |
| 1 | Fund commenced operations on March 30, 2012. Actual expenses are equal to the Fund’s annualized expense ratio (after waiver/reimbursement): 1.20%, 1.95% and 0.95% for Class A, C and Y, respectively, multiplied by the average account value over the period, multiplied by the number of days in the most recent fiscal period (62), divided by 366 (to reflect the partial period). |
11 |
Table of Contents
UNDERSTANDING FUND EXPENSES
| LOOMIS SAYLES SENIOR FLOATING RATE AND FIXED INCOME FUND |
BEGINNING ACCOUNT VALUE 12/1/2011 |
ENDING ACCOUNT VALUE 5/31/2012 |
EXPENSES PAID DURING PERIOD* 12/1/2011 – 5/31/2012 |
|||||||||
| Class A |
||||||||||||
| Actual |
$1,000.00 | $1,068.20 | $5.69 | |||||||||
| Hypothetical (5% return before expenses) |
$1,000.00 | $1,019.50 | $5.55 | |||||||||
| Class C |
||||||||||||
| Actual |
$1,000.00 | $1,064.60 | $9.55 | |||||||||
| Hypothetical (5% return before expenses) |
$1,000.00 | $1,015.75 | $9.32 | |||||||||
| Class Y |
||||||||||||
| Actual |
$1,000.00 | $1,069.20 | $4.40 | |||||||||
| Hypothetical (5% return before expenses) |
$1,000.00 | $1,020.75 | $4.29 | |||||||||
| * | Expenses are equal to the Fund’s annualized expense ratio (after waiver/reimbursement): 1.10%, 1.85% and 0.85% for Class A, C and Y, respectively, multiplied by the average account value over the period, multiplied by the number of days in the most recent fiscal half-year, divided by 366 (to reflect the half-year period). |
| 12
Table of Contents
BOARD APPROVAL OF THE INITIAL ADVISORY AGREEMENTS FOR GATEWAY INTERNATIONAL FUND AND LOOMIS SAYLES CAPITAL INCOME FUND
The Investment Company Act of 1940, as amended (the “1940 Act”), requires that both the full Board of Trustees of the Trusts and a majority of the Trustees who are not “interested persons” (as defined in the 1940 Act) of the Trusts (the “Independent Trustees”), voting separately, initially approve for a two-year term any new investment advisory agreements for a registered investment company, including newly formed funds such as the Gateway International Fund and the Loomis Sayles Capital Income Fund (each a “Fund” and collectively, the “Funds”). The Trustees, including the Independent Trustees, unanimously approved the proposed investment advisory agreements (together, the “Agreements”) for the Funds at an in-person meeting held on March 9, 2012.
In connection with this review, Fund management and other representatives of the Gateway International Fund’s adviser, Gateway Investment Advisers, LLC (“Gateway”), and the Loomis Sayles Capital Income Fund’s adviser, Loomis, Sayles & Company, L.P. (“Loomis Sayles”) (collectively, the “Advisers”), distributed to the Trustees materials including, among other items, (i) information on the proposed advisory fees and other expenses to be charged to the Funds, including information comparing the Funds’ expenses to those of peer groups of funds and information on fees charged to other accounts advised or sub-advised by the Advisers and the proposed expense cap, (ii) the Funds’ investment objectives and strategies, (iii) the size, education and experience of the Advisers’ respective investment staff and the investment strategies proposed to be used in managing the Funds, (iv) proposed arrangements for the distribution of the Funds’ shares, (v) the procedures proposed to be employed to determine the value of the Funds’ assets, (vi) each Fund’s investment policies and restrictions, policies on personal securities transactions and other compliance policies, (vii) information about the Advisers’ performance, and (viii) the general economic outlook with particular emphasis on the mutual fund industry. The Trustees also considered the fact that they oversee other funds advised or sub-advised by the Advisers as well as information about the Advisers they had received in connection with their oversight of those other funds. Because the Funds are newly formed and had not commenced operations at the time of the Trustees’ review, certain information, including data relating to Fund performance, was not available, and therefore could not be distributed to the Trustees. Throughout the process, the Trustees were afforded the opportunity to ask questions of, and request additional materials from, the Advisers.
In considering whether to initially approve the Agreements, the Board of Trustees, including the Independent Trustees, did not identify any single factor as determinative. Individual Trustees may have evaluated the information presented differently from one another, giving weight to various factors. Matters considered by the Trustees, including the Independent Trustees, in connection with their approval of the Agreements included, but were not limited to, the factors listed below:
The nature, extent and quality of the services to be provided to the Funds under the Agreements. The Trustees considered the nature, extent and quality of the services to be provided by the Advisers and their respective affiliates to the Funds, and the resources to be dedicated to the Funds by the Advisers and their respective affiliates. The Trustees considered their experience with other funds advised or sub-advised by the Advisers, as well as any affiliations between the Advisers and Natixis Global Asset Management, L.P. (“Natixis US”). In this regard, the Trustees considered not only the advisory services proposed to be provided by the Advisers to the Funds, but also the monitoring and administrative services proposed to be provided by NGAM Advisors, L.P. (“NGAM Advisors”) and its affiliates to the Funds.
The Trustees also considered the benefits to shareholders of investing in a mutual fund that is part of a family of funds that offers shareholders the right to exchange shares of one type of fund for shares of another type of fund, and provides a variety of fund and shareholder services.
After reviewing these and related factors, the Trustees concluded, within the context of their overall conclusions regarding the Agreements, that the scope of the services to be provided to the Funds under the Agreements seemed consistent with the Funds’ operational requirements, and that the Advisers had the capabilities, resources and personnel necessary to provide the advisory services that would be required by the Funds. The Trustees determined that the nature, extent and quality of services proposed to be provided under the Agreements supported approval of the Agreements.
Investment performance of the Funds and the Advisers. Because the Funds had not yet commenced operations, performance information for the Funds was not considered; however, the Board considered the performance of other funds and accounts managed by the Advisers, and also reviewed simulated performance of accounts managed in accordance with each Fund’s proposed strategies. Based on this and other information, the Trustees concluded, within the context of their overall conclusions regarding the Agreements, that the Advisers’ performance records and/or other relevant factors supported approval of the Agreements.
The costs of the services to be provided by the Advisers and their affiliates from their respective relationships with the Funds. Although the Funds had not yet commenced operations at the time of the Trustees’ review of the Agreements, the Trustees reviewed information comparing the proposed advisory fees and estimated total expenses of the Funds’ share classes with the fees and expenses of comparable share classes of comparable funds identified by the Advisers, and, in the case of Gateway, with the fees and expenses of other funds and institutional accounts managed by Gateway, as well as information about differences in such fees and the reasons for any such differences.
13 |
Table of Contents
BOARD APPROVAL OF THE INITIAL ADVISORY AGREEMENTS FOR GATEWAY INTERNATIONAL FUND AND LOOMIS SAYLES CAPITAL INCOME FUND
In evaluating the fees charged to such comparable accounts, the Trustees considered, among other things, management’s representations about the differences between managing mutual funds as compared to other types of accounts, including the additional resources required to effectively manage mutual fund assets. In evaluating the Funds’ proposed advisory fees, the Trustees also took into account the demands, complexity and quality of the investment management of the Funds and the need for the Advisers to offer competitive compensation. The Trustees also noted that each of the Funds would have an expense cap in place. In addition, the Trustees considered information regarding the administrative and distribution fees to be paid by the Funds to the Advisers’ affiliates.
Because the Funds had not yet commenced operations, historical profitability information with respect to the Funds was not considered. However, the Trustees noted the information provided in court cases in which adviser compensation or profitability were issues, the estimated expense levels of each of the Funds, and that each of the Funds would be subject to an expense cap.
After reviewing these and related factors, the Trustees concluded, within the context of their overall conclusions regarding the Agreements, that the advisory fees proposed to be charged to the Funds were fair and reasonable, and supported the approval of the Agreements.
Economies of scale. The Trustees considered the extent to which the Advisers may realize economies of scale or other efficiencies in managing the Funds, and whether those economies could be shared with the Funds through breakpoints in the advisory fees or other means, such as expense waivers or caps. The Trustees noted that each Fund is subject to an expense cap. After reviewing these and related factors, the Trustees concluded, within the context of their overall conclusions regarding the Agreements, that the extent to which economies of scale might be shared with the Funds supported the approval of the Agreements.
The Trustees also considered other factors, which included but were not limited to the following: the compliance-related resources the Advisers and their respective affiliates would provide to the Funds and the potential so-called “fallout benefits” to the Advisers, such as the engagement of affiliates of the Advisers to provide distribution and administrative services to the Funds, and the benefits of research made available to the Advisers by reason of brokerage commissions (if any) generated by the Funds’ securities transactions. The Trustees also considered the fact that NGAM Advisors’ parent company would benefit from the retention of affiliated advisers. The Trustees considered the possible conflicts of interest associated with these fallout and other benefits, and the reporting, disclosure and other processes in place to disclose and monitor such possible conflicts of interest.
Based on their evaluation of all factors that they deemed to be material, including those factors described above, and assisted by the advice of independent counsel, the Trustees, including the Independent Trustees, concluded that the Agreements should be approved.
| 14
Table of Contents
Consolidated Portfolio of Investments – as of May 31, 2012 (Unaudited)
ASG Growth Markets Fund
| Shares |
Description | Value (†) | ||||||
| Common Stocks — 61.7% of Net Assets | ||||||||
| Brazil — 9.1% | ||||||||
| 11,300 | Banco Bradesco S.A., Sponsored Preference ADR(b) | $ | 165,432 | |||||
| 3,100 | Banco do Brasil S.A., Sponsored ADR | 30,690 | ||||||
| 3,600 | Banco Santander Brasil S.A., ADR | 28,620 | ||||||
| 6,700 | BM&FBovespa S.A. | 31,725 | ||||||
| 2,600 | BR Malls Participacoes S.A. | 28,619 | ||||||
| 1,500 | Braskem S.A., Sponsored ADR | 16,800 | ||||||
| 4,535 | BRF - Brasil Foods S.A., ADR | 70,610 | ||||||
| 4,400 | CCR S.A. | 34,251 | ||||||
| 1,400 | CETIP S.A. - Mercados Organizados | 20,200 | ||||||
| 500 | Cia Brasileira de Distribuicao Grupo Pao de Acucar, Preference ADR | 19,160 | ||||||
| 4,300 | Cia de Bebidas das Americas, Preference ADR(b) | 164,905 | ||||||
| 600 | Cia de Saneamento Basico do Estado de Sao Paulo, ADR | 41,838 | ||||||
| 4,125 | Cia Energetica de Minas Gerais, Sponsored Preference ADR | 71,074 | ||||||
| 1,300 | Cia Hering | 27,007 | ||||||
| 1,000 | Cia Paranaense de Energia, Sponsored Preference ADR | 20,320 | ||||||
| 1,440 | Cielo S.A., Sponsored ADR | 38,736 | ||||||
| 1,200 | Cosan S.A. Industria e Comercio | 17,826 | ||||||
| 700 | CPFL Energia S.A., ADR | 17,010 | ||||||
| 2,600 | EcoRodovias Infraestrutura e Logistica S.A. | 20,807 | ||||||
| 2,400 | EDP - Energias do Brasil S.A. | 15,351 | ||||||
| 895 | Embraer S.A., ADR | 25,239 | ||||||
| 2,500 | Fibria Celulose S.A., Sponsored ADR(c) | 16,300 | ||||||
| 4,100 | Gerdau S.A., Sponsored Preference ADR | 32,595 | ||||||
| 3,400 | Hypermarcas S.A.(c) | 18,594 | ||||||
| 12,900 | Itau Unibanco Holding S.A., Preference ADR(b) | 186,663 | ||||||
| 4,900 | JBS, S.A.(c) | 13,241 | ||||||
| 1,200 | Localiza Rent a Car S.A. | 19,040 | ||||||
| 700 | Lojas Renner S.A. | 20,182 | ||||||
| 600 | Multiplan Empreendimentos Imobiliarios S.A. | 14,250 | ||||||
| 2,700 | Odontoprev S.A. | 14,458 | ||||||
| 2,593 | Oi S.A. | 12,215 | ||||||
| 1,700 | Oi S.A., ADR | 20,468 | ||||||
| 7,423 | Petroleo Brasileiro S.A., ADR(b) | 145,194 | ||||||
| 11,000 | Petroleo Brasileiro S.A., Sponsored Preference ADR(b) | 207,900 | ||||||
| 2,500 | Raia Drogasil, S.A. | 23,118 | ||||||
| 2,100 | Redecard S.A. | 32,278 | ||||||
| 3,200 | Rossi Residencial S.A. | 8,377 | ||||||
| 2,700 | Souza Cruz S.A. | 36,145 | ||||||
| 1,700 | Sul America S.A. | 11,826 | ||||||
| 1,000 | TAM S.A., Preference ADR(c) | 21,740 | ||||||
| 1,800 | Telefonica Brasil S.A., Preference ADR | 42,516 | ||||||
| 2,100 | Tim Participacoes S.A., ADR | 51,345 | ||||||
| 700 | Totvs S.A. | 12,668 | ||||||
| 1,100 | Tractebel Energia S.A. | 18,244 | ||||||
| 3,000 | Ultrapar Participacoes S.A., Sponsored ADR | 61,260 | ||||||
| 6,738 | Vale S.A., Sponsored ADR(b) | 123,373 | ||||||
| 10,821 | Vale S.A., Sponsored Preference ADR(b) | 196,077 | ||||||
|
|
|
|||||||
| 2,266,287 | ||||||||
|
|
|
|||||||
| Chile — 0.9% | ||||||||
| 319 | Banco de Chile, ADR | 26,251 | ||||||
| 500 | Banco Santander Chile, ADR | 37,220 | ||||||
| 600 | Cia Cervecerias Unidas S.A., ADR | 38,982 | ||||||
| 1,400 | Corpbanca S.A., ADR | 25,998 | ||||||
| 900 | Empresa Nacional de Electricidad S.A., Sponsored ADR | 42,624 | ||||||
| 2,000 | Enersis S.A., Sponsored ADR | 34,400 | ||||||
| Chile — continued | ||||||||
| 500 | Sociedad Quimica y Minera de Chile S.A., Sponsored ADR | $ | 25,985 | |||||
|
|
|
|||||||
| 231,460 | ||||||||
|
|
|
|||||||
| China — 14.6% | ||||||||
| 22,000 | Agile Property Holdings Ltd. | 25,328 | ||||||
| 84,000 | Agricultural Bank of China Ltd., Class H | 33,934 | ||||||
| 22,000 | Air China Ltd., Class H(c) | 13,535 | ||||||
| 6,000 | Alibaba.com Ltd.(c) | 10,369 | ||||||
| 26,000 | Angang Steel Co. Ltd., Class H(c) | 14,787 | ||||||
| 4,500 | Anhui Conch Cement Co. Ltd., Class H(c) | 13,764 | ||||||
| 363,000 | Bank of China Ltd., Class H(b) | 138,460 | ||||||
| 37,000 | Bank of Communications Co. Ltd., Class H | 23,912 | ||||||
| 58,000 | Beijing Capital International Airport Co. Ltd., Class H | 36,324 | ||||||
| 5,500 | Beijing Enterprises Holdings Ltd. | 31,502 | ||||||
| 16,000 | Belle International Holdings Ltd. | 25,532 | ||||||
| 32,000 | Bosideng International Holdings Ltd. | 7,239 | ||||||
| 24,000 | Brilliance China Automotive Holdings Ltd.(c) | 23,595 | ||||||
| 24,000 | China BlueChemical Ltd., Class H(c) | 16,734 | ||||||
| 46,000 | China Citic Bank Corp. Ltd., Class H | 23,763 | ||||||
| 9,000 | China Coal Energy Co. Ltd., Class H | 8,324 | ||||||
| 39,000 | China Communications Construction Co. Ltd., Class H(c) | 36,520 | ||||||
| 26,000 | China Communications Services Corp. Ltd., Class H(c) | 12,941 | ||||||
| 339,000 | China Construction Bank Corp., Class H(b) | 235,821 | ||||||
| 40,000 | China Gas Holdings Ltd. | 19,560 | ||||||
| 2,700 | China Life Insurance Co. Ltd., ADR | 95,094 | ||||||
| 10,000 | China Mengniu Dairy Co. Ltd. | 27,492 | ||||||
| 13,000 | China Merchants Bank Co. Ltd., Class H(c) | 25,096 | ||||||
| 44,000 | China Minsheng Banking Corp. Ltd., Class H | 41,787 | ||||||
| 35,500 | China Mobile Ltd.(b) | 360,082 | ||||||
| 24,000 | China Overseas Land & Investment Ltd. | 50,193 | ||||||
| 1,299 | China Petroleum & Chemical Corp., ADR(b) | 115,949 | ||||||
| 10,000 | China Resources Enterprise Ltd. | 31,618 | ||||||
| 12,000 | China Resources Gas Group Ltd. | 22,816 | ||||||
| 10,000 | China Resources Land Ltd. | 18,765 | ||||||
| 10,000 | China Resources Power Holdings Co. Ltd. | 18,162 | ||||||
| 21,000 | China Shenhua Energy Co. Ltd., Class H | 73,709 | ||||||
| 95,000 | China Shipping Container Lines Co. Ltd., Class H(c) | 23,738 | ||||||
| 10,000 | China State Construction International Holdings Ltd. | 9,257 | ||||||
| 1,400 | China Telecom Corp. Ltd., ADR | 63,910 | ||||||
| 32,000 | China Unicom Hong Kong Ltd. | 43,450 | ||||||
| 10,400 | China Vanke Co. Ltd., Class B(c) | 13,596 | ||||||
| 22,000 | China ZhengTong Auto Services Holdings Ltd.(c) | 13,837 | ||||||
| 49,600 | China Zhongwang Holdings Ltd.(c) | 19,334 | ||||||
| 30,000 | Chongqing Rural Commercial Bank, Class H | 12,736 | ||||||
| 1,151 | CNOOC Ltd., Sponsored ADR(b) | 206,432 | ||||||
| 88,125 | Country Garden Holdings Co. Ltd.(c) | 32,788 | ||||||
| 14,000 | Daphne International Holdings Ltd. | 15,116 | ||||||
| 40,000 | Datang International Power Generation Co. Ltd., Class H(c) | 13,838 | ||||||
| 26,000 | Dongfeng Motor Group Co. Ltd., Class H(c) | 43,752 | ||||||
| 32,000 | Dongyue Group | 20,813 | ||||||
| 6,000 | ENN Energy Holdings Ltd.(c) | 23,000 | ||||||
| 68,000 | Evergrande Real Estate Group Ltd.(c) | 37,216 | ||||||
| 84,000 | Franshion Properties China Ltd. | 24,294 | ||||||
| 25,000 | Geely Automobile Holdings Ltd. | 9,042 | ||||||
| 7,000 | Golden Eagle Retail Group Ltd. | 15,256 | ||||||
| 112,000 | GOME Electrical Appliances Holding Ltd. | 17,568 | ||||||
| 11,000 | Great Wall Motor Co. Ltd., Class H | 22,478 | ||||||
| 54,000 | Guangdong Investment Ltd. | 35,359 | ||||||
| 25,200 | Guangzhou R&F Properties Co. Ltd., Class H | 33,276 | ||||||
| 17,000 | Haier Electronics Group Co. Ltd.(c) | 19,971 | ||||||
| 3,500 | Hengan International Group Co. Ltd. | 33,384 | ||||||
See accompanying notes to financial statements.
15 |
Table of Contents
Consolidated Portfolio of Investments – as of May 31, 2012 (Unaudited)
ASG Growth Markets Fund – (continued)
| Shares |
Description | Value (†) | ||||||
| China — continued | ||||||||
| 951 | Huaneng Power International, Inc., Sponosored ADR(c) | $ | 23,832 | |||||
| 332,000 | Industrial & Commercial Bank of China Ltd., Class H(b) | 202,578 | ||||||
| 7,000 | Inner Mongolia Yitai Coal Co., Class B | 35,637 | ||||||
| 6,000 | Jiangxi Copper Co. Ltd., Class H | 12,604 | ||||||
| 5,000 | Kingboard Chemical Holdings Ltd. | 10,733 | ||||||
| 14,000 | Kunlun Energy Co. Ltd. | 23,929 | ||||||
| 3,800 | Lenovo Group Ltd., ADR | 64,258 | ||||||
| 10,500 | Longfor Properties Co. Ltd. | 16,231 | ||||||
| 1,416 | PetroChina Co. Ltd., ADR(b) | 178,515 | ||||||
| 14,000 | PICC Property & Casualty Co. Ltd., Class H | 15,466 | ||||||
| 3,000 | Ping An Insurance (Group) Co. of China Ltd., Class H | 21,977 | ||||||
| 53,000 | Poly Hong Kong Investments Ltd.(c) | 25,742 | ||||||
| 366,000 | Renhe Commercial Holdings Co. Ltd. | 17,839 | ||||||
| 28,000 | Shanghai Electric Group Co. Ltd., Class H | 12,689 | ||||||
| 8,800 | Shanghai Pharmaceuticals Holding Co. Ltd., Class H(c) | 10,600 | ||||||
| 25,500 | Shimao Property Holdings Ltd. | 33,920 | ||||||
| 30,000 | Shougang Fushan Resources Group Ltd. | 9,781 | ||||||
| 66,500 | Shui On Land Ltd. | 25,918 | ||||||
| 34,500 | Sino-Ocean Land Holdings Ltd. | 14,044 | ||||||
| 86,000 | Sinofert Holdings Ltd. | 14,813 | ||||||
| 412 | Sinopec Shanghai Petrochemical Co. Ltd., Sponsored ADR | 11,800 | ||||||
| 46,000 | Skyworth Digital Holdings Ltd. | 20,609 | ||||||
| 47,000 | Soho China Ltd. | 31,934 | ||||||
| 5,200 | Tencent Holdings Ltd. | 142,647 | ||||||
| 12,000 | Tingyi Cayman Islands Holding Corp. | 28,452 | ||||||
| 4,000 | Tsingtao Brewery Co. Ltd., Class H(c) | 25,101 | ||||||
| 33,000 | Want Want China Holdings Ltd. | 37,681 | ||||||
| 5,000 | Weichai Power Co. Ltd., Class H(c) | 22,026 | ||||||
| 7,000 | Wumart Stores, Inc., Class H(c) | 15,436 | ||||||
| 1,715 | Yanzhou Coal Mining Co. Ltd., Sponsored ADR(c) | 28,572 | ||||||
| 17,000 | Yingde Gases(c) | 15,856 | ||||||
| 108,000 | Yuexiu Property Co. Ltd. | 25,921 | ||||||
| 5,500 | Zhongsheng Group Holdings Ltd. | 8,826 | ||||||
|
|
|
|||||||
| 3,622,115 | ||||||||
|
|
|
|||||||
| Colombia — 0.7% | ||||||||
| 800 | BanColombia S.A., Sponsored Preference ADR | 47,368 | ||||||
| 1,895 | Ecopetrol S.A., Sponsored ADR | 112,866 | ||||||
|
|
|
|||||||
| 160,234 | ||||||||
|
|
|
|||||||
| Egypt — 0.2% | ||||||||
| 5,246 | Commercial International Bank Egypt S.A.E., GDR | 20,984 | ||||||
| 474 | Orascom Construction Industries, GDR | 19,287 | ||||||
| 8,074 | Orascom Telecom Holding S.A.E., GDR(c) | 20,080 | ||||||
|
|
|
|||||||
| 60,351 | ||||||||
|
|
|
|||||||
| India — 1.3% | ||||||||
| 1,591 | Axis Bank Ltd., GDR | 27,577 | ||||||
| 3,058 | HDFC Bank Ltd., ADR(c) | 85,502 | ||||||
| 1,410 | ICICI Bank Ltd., Sponsored ADR | 39,692 | ||||||
| 2,108 | Infosys Ltd., Sponsored ADR(b) | 88,747 | ||||||
| 1,347 | Mahindra & Mahindra Ltd., Sponsored GDR | 15,257 | ||||||
| 396 | State Bank of India, Sponsored GDR | 28,819 | ||||||
| 2,160 | Tata Motors Ltd., Sponsored ADR | 44,906 | ||||||
|
|
|
|||||||
| 330,500 | ||||||||
|
|
|
|||||||
| Indonesia — 2.4% | ||||||||
| 125,500 | Aneka Tambang Persero Tbk PT | 15,320 | ||||||
| 12,500 | Astra International Tbk PT | 85,248 | ||||||
| 58,000 | Bank Central Asia Tbk PT | 43,142 | ||||||
| 31,000 | Bank Danamon Indonesia Tbk PT | 17,465 | ||||||
| Indonesia — continued | ||||||||
| 68,000 | Bank Mandiri Persero Tbk PT | $ | 49,696 | |||||
| 58,000 | Bank Negara Indonesia Persero Tbk PT | 22,747 | ||||||
| 107,000 | Bank Rakyat Indonesia Persero Tbk PT | 64,020 | ||||||
| 118,500 | Charoen Pokphand Indonesia Tbk PT | 32,962 | ||||||
| 4,000 | Gudang Garam Tbk PT | 22,945 | ||||||
| 12,000 | Indocement Tunggal Prakarsa Tbk PT | 22,659 | ||||||
| 55,000 | Indofood Sukses Makmur Tbk PT | 27,568 | ||||||
| 41,500 | Indosat Tbk PT | 17,154 | ||||||
| 33,000 | Kalbe Farma Tbk PT | 13,567 | ||||||
| 56,000 | Perusahaan Gas Negara Persero Tbk PT | 21,970 | ||||||
| 16,500 | Semen Gresik Persero Tbk PT | 19,129 | ||||||
| 1,691 | Telekomunikasi Indonesia Persero Tbk PT, Sponsored ADR | 55,059 | ||||||
| 13,000 | Unilever Indonesia Tbk PT | 28,397 | ||||||
| 13,000 | United Tractors Tbk PT | 31,799 | ||||||
|
|
|
|||||||
| 590,847 | ||||||||
|
|
|
|||||||
| Korea — 10.9% | ||||||||
| 14 | Amorepacific Corp. | 12,859 | ||||||
| 675 | Celltrion, Inc. | 19,176 | ||||||
| 183 | Cheil Industries, Inc. | 15,062 | ||||||
| 93 | CJ CheilJedang Corp. | 26,477 | ||||||
| 196 | CJ Corp. | 13,436 | ||||||
| 438 | Daelim Industrial Co. Ltd. | 36,894 | ||||||
| 470 | Dongbu Insurance Co. Ltd. | 18,790 | ||||||
| 75 | E-Mart Co. Ltd. | 16,774 | ||||||
| 252 | GS Holdings | 11,805 | ||||||
| 760 | Hana Financial Group, Inc. | 23,925 | ||||||
| 1,060 | Hanwha Chem Corp. | 18,490 | ||||||
| 810 | Hanwha Corp. | 19,284 | ||||||
| 100 | Honam Petrochemical Corp. | 21,109 | ||||||
| 308 | Hyosung Corp. | 13,751 | ||||||
| 148 | Hyundai Department Store Co. Ltd. | 18,162 | ||||||
| 267 | Hyundai Engineering & Construction Co. Ltd. | 15,012 | ||||||
| 114 | Hyundai Glovis Co. Ltd. | 20,123 | ||||||
| 116 | Hyundai Heavy Industries Co. Ltd. | 26,177 | ||||||
| 1,000 | Hyundai Hysco Co. Ltd. | 31,303 | ||||||
| 680 | Hyundai Marine & Fire Insurance Co. Ltd. | 16,922 | ||||||
| 378 | Hyundai Mobis | 88,534 | ||||||
| 957 | Hyundai Motor Co.(b) | 197,486 | ||||||
| 1,436 | Hyundai Motor Co., GDR | 42,561 | ||||||
| 2,670 | Hyundai Securities Co. | 18,397 | ||||||
| 226 | Hyundai Wia Corp. | 33,340 | ||||||
| 1,970 | Industrial Bank of Korea | 19,999 | ||||||
| 640 | Kangwon Land, Inc. | 13,666 | ||||||
| 1,502 | KB Financial Group, Inc., ADR | 46,832 | ||||||
| 1,650 | Kia Motors Corp. | 111,961 | ||||||
| 1,600 | Korea Electric Power Corp., Sponsored ADR(c) | 15,040 | ||||||
| 3,610 | Korea Exchange Bank | 25,113 | ||||||
| 380 | Korea Gas Corp. | 13,300 | ||||||
| 370 | Korea Investment Holdings Co. Ltd. | 12,556 | ||||||
| 3,370 | Korea Life Insurance Co. Ltd.(c) | 17,394 | ||||||
| 84 | Korea Zinc Co. Ltd. | 25,253 | ||||||
| 475 | Korean Air Lines Co. Ltd.(c) | 18,154 | ||||||
| 1,370 | KP Chemical Corp. | 16,776 | ||||||
| 645 | KT&G Corp. | 42,954 | ||||||
| 170 | Kumho Petro Chemical Co. Ltd. | 16,868 | ||||||
| 190 | LG Chem Ltd. | 46,710 | ||||||
| 200 | LG Corp. | 9,297 | ||||||
| 1,995 | LG Display Co. Ltd., ADR(c) | 17,536 | ||||||
| 333 | LG Electronics, Inc. | 18,619 | ||||||
| 71 | LG Household & Health Care Ltd. | 35,121 | ||||||
| 3,960 | LG Uplus Corp. | 18,194 | ||||||
See accompanying notes to financial statements.
| 16
Table of Contents
Consolidated Portfolio of Investments – as of May 31, 2012 (Unaudited)
ASG Growth Markets Fund – (continued)
| Shares |
Description | Value (†) | ||||||
| Korea — continued | ||||||||
| 18 | Lotte Confectionery Co. Ltd. | $ | 23,692 | |||||
| 81 | Lotte Shopping Co. Ltd. | 21,641 | ||||||
| 150 | Mando Corp. | 20,423 | ||||||
| 105 | NCSoft Corp. | 21,324 | ||||||
| 198 | NHN Corp. | 40,665 | ||||||
| 39 | Orion Corp. | 31,785 | ||||||
| 1,200 | POSCO, ADR | 90,876 | ||||||
| 294 | S1 Corp. | 14,070 | ||||||
| 625 | Samsung C&T Corp. | 35,941 | ||||||
| 580 | Samsung Card Co. | 16,304 | ||||||
| 229 | Samsung Electro-Mechanics Co. Ltd. | 19,758 | ||||||
| 1,291 | Samsung Electronics Co. Ltd., GDR(b) | 663,246 | ||||||
| 213 | Samsung Electronics Co. Ltd., Preference GDR | 64,533 | ||||||
| 122 | Samsung Engineering Co. Ltd. | 19,399 | ||||||
| 109 | Samsung Fire & Marine Insurance Co. Ltd. | 19,434 | ||||||
| 1,230 | Samsung Heavy Industries Co. Ltd. | 37,986 | ||||||
| 328 | Samsung Life Insurance Co. Ltd. | 27,107 | ||||||
| 1,500 | Shinhan Financial Group Co. Ltd., ADR | 96,630 | ||||||
| 203 | SK C&C Co. Ltd. | 16,120 | ||||||
| 127 | SK Holdings Co. Ltd. | 13,162 | ||||||
| 1,930 | SK Hynix, Inc.(c) | 37,715 | ||||||
| 2,940 | SK Networks Co. Ltd. | 20,997 | ||||||
| 1,900 | SK Telecom Co. Ltd., ADR | 21,166 | ||||||
| 430 | Woongjin Coway Co. Ltd. | 12,858 | ||||||
| 1,400 | Woori Finance Holdings Co. Ltd. | 13,025 | ||||||
|
|
|
|||||||
| 2,717,049 | ||||||||
|
|
|
|||||||
| Malaysia — 3.1% | ||||||||
| 22,100 | AirAsia Bhd | 24,457 | ||||||
| 16,600 | Alliance Financial Group Bhd | 21,388 | ||||||
| 9,500 | AMMB Holdings Bhd | 18,572 | ||||||
| 21,700 | Axiata Group Bhd | 36,702 | ||||||
| 57,200 | Berjaya Corp. Bhd | 14,499 | ||||||
| 800 | British American Tobacco Malaysia Bhd | 13,707 | ||||||
| 16,500 | CIMB Group Holdings Bhd | 38,972 | ||||||
| 29,000 | DiGi.Com Bhd | 36,505 | ||||||
| 8,300 | Genting Bhd | 26,106 | ||||||
| 23,200 | Genting Malaysia Bhd | 26,926 | ||||||
| 4,500 | Genting Plantations Bhd | 13,201 | ||||||
| 6,600 | Hong Leong Bank Bhd | 25,552 | ||||||
| 9,700 | Hong Leong Financial Group Bhd | 36,645 | ||||||
| 12,400 | IJM Corp. Bhd | 20,227 | ||||||
| 3,100 | Kuala Lumpur Kepong Bhd | 21,805 | ||||||
| 19,200 | Malayan Banking Bhd | 52,896 | ||||||
| 11,000 | Maxis Bhd | 21,441 | ||||||
| 25,500 | MMC Corp. Bhd | 21,629 | ||||||
| 9,800 | Parkson Holdings Bhd | 14,664 | ||||||
| 5,300 | Petronas Dagangan Bhd | 34,524 | ||||||
| 5,700 | Petronas Gas Bhd | 30,880 | ||||||
| 3,100 | Public Bank Bhd | 13,466 | ||||||
| 8,100 | RHB Capital Bhd | 18,935 | ||||||
| 14,900 | Sime Darby Bhd | 45,428 | ||||||
| 18,800 | Telekom Malaysia Bhd | 31,875 | ||||||
| 11,600 | Tenaga Nasional Bhd | 24,375 | ||||||
| 12,300 | UMW Holdings Bhd | 30,885 | ||||||
| 58,700 | YTL Corp. Bhd | 34,019 | ||||||
| 28,700 | YTL Power International Bhd | 14,984 | ||||||
|
|
|
|||||||
| 765,265 | ||||||||
|
|
|
|||||||
| Mexico — 3.3% | ||||||||
| 2,900 | Alfa SAB de CV, Class A | 36,172 | ||||||
| 11,043 | America Movil SAB de CV, Series L, ADR(b) | 260,173 | ||||||
| 3,400 | Arca Continental SAB de CV | 16,839 | ||||||
| 6,676 | Cemex SAB de CV, Sponsored ADR(c) | 36,985 | ||||||
| Mexico — continued | ||||||||
| 300 | Coca-Cola Femsa SAB de CV, Sponsored ADR | $ | 34,512 | |||||
| 2,400 | El Puerto de Liverpool SAB de CV | 17,310 | ||||||
| 1,400 | Fomento Economico Mexicano SAB de CV, Sponsored ADR | 110,362 | ||||||
| 500 | Grupo Aeroportuario del Pacifico SAB de CV, ADR | 17,780 | ||||||
| 8,300 | Grupo Bimbo SAB de CV, Series A | 18,196 | ||||||
| 600 | Grupo Elektra S.A. de CV | 21,407 | ||||||
| 5,400 | Grupo Financiero Banorte SAB de CV, Class O | 24,125 | ||||||
| 12,431 | Grupo Mexico SAB de CV, Series B | 32,822 | ||||||
| 3,300 | Grupo Modelo SAB de CV, Series C | 22,939 | ||||||
| 2,300 | Grupo Televisa SAB, Sponsored ADR | 43,677 | ||||||
| 800 | Industrias Penoles SAB de CV | 30,550 | ||||||
| 5,200 | Kimberly-Clark de Mexico SAB de CV, Class A | 9,026 | ||||||
| 3,200 | Minera Frisco SAB de CV(c) | 12,521 | ||||||
| 3,459 | Wal-Mart de Mexico SAB de CV, Series V, Sponsored ADR | 83,120 | ||||||
|
|
|
|||||||
| 828,516 | ||||||||
|
|
|
|||||||
| Peru — 0.2% | ||||||||
| 353 | Cia de Minas Buenaventura, S.A., ADR | 13,816 | ||||||
| 265 | Credicorp Ltd. | 33,064 | ||||||
|
|
|
|||||||
| 46,880 | ||||||||
|
|
|
|||||||
| Philippines — 0.2% | ||||||||
| 700 | Philippine Long Distance Telephone Co., Sponsored ADR | 37,569 | ||||||
|
|
|
|||||||
| Russia — 4.1% | ||||||||
| 3,068 | Federal Grid Co. Unified Energy System JSC, GDR(c) | 8,192 | ||||||
| 31,915 | Gazprom OAO, Sponsored ADR(b)(c) | 282,017 | ||||||
| 3,124 | Lukoil OAO, Sponsored ADR(b)(c) | 163,019 | ||||||
| 1,209 | Magnit OJSC, Sponsored GDR(c) | 29,794 | ||||||
| 1,299 | MMC Norilsk Nickel OJSC, ADR(c) | 19,308 | ||||||
| 1,810 | Mobile Telesystems OJSC, Sponsored ADR(c) | 30,118 | ||||||
| 767 | NovaTek OAO, Sponsored GDR | 73,510 | ||||||
| 8,521 | Rosneft Oil Co., GDR(c) | 52,718 | ||||||
| 1,578 | Rostelecom OJSC, Sponsored ADR(c) | 30,285 | ||||||
| 12,521 | Sberbank of Russia, Sponsored ADR(b) | 123,938 | ||||||
| 6,006 | Surgutneftegas OJSC, Sponsored ADR(c) | 45,440 | ||||||
| 8,609 | Surgutneftegas OJSC, Sponsored Preference ADR(c) | 42,873 | ||||||
| 1,625 | Tatneft, Sponsored ADR(c) | 49,912 | ||||||
| 1,612 | Uralkali OJSC, Sponsored GDR | 56,251 | ||||||
| 7,026 | VTB Bank OJSC, GDR(c) | 22,183 | ||||||
|
|
|
|||||||
| 1,029,558 | ||||||||
|
|
|
|||||||
| South Africa — 5.6% | ||||||||
| 1,472 | ABSA Group Ltd. | 26,050 | ||||||
| 2,488 | Anglo American Platinum Ltd., ADR | 23,014 | ||||||
| 1,474 | AngloGold Ashanti Ltd., Sponsored ADR | 53,152 | ||||||
| 1,733 | Aspen Pharmacare Holdings Ltd.(c) | 24,014 | ||||||
| 2,122 | Aveng Ltd. | 9,637 | ||||||
| 3,740 | Barloworld Ltd. | 37,293 | ||||||
| 1,612 | Bidvest Group Ltd. | 34,124 | ||||||
| 2,172 | Discovery Holdings Ltd. | 12,739 | ||||||
| 1,032 | Exxaro Resources Ltd. | 23,095 | ||||||
| 24,136 | FirstRand Ltd. | 73,448 | ||||||
| 1,924 | Foschini Group Ltd. (The) | 27,006 | ||||||
| 4,365 | Gold Fields Ltd., Sponsored ADR | 57,836 | ||||||
| 8,104 | Growthpoint Properties Ltd. | 19,786 | ||||||
| 1,903 | Impala Platinum Holdings Ltd., Sponsored ADR | 29,211 | ||||||
| 1,913 | Imperial Holdings Ltd. | 37,387 | ||||||
| 305 | Kumba Iron Ore Ltd. | 18,935 | ||||||
| 3,711 | Liberty Holdings Ltd. | 38,090 | ||||||
| 11,429 | Life Healthcare Group Holdings Ltd. | 39,365 | ||||||
| 7,764 | MMI Holdings Ltd. | 15,292 | ||||||
See accompanying notes to financial statements.
17 |
Table of Contents
Consolidated Portfolio of Investments – as of May 31, 2012 (Unaudited)
ASG Growth Markets Fund – (continued)
| Shares |
Description | Value (†) | ||||||
| South Africa — continued | ||||||||
| 9,419 | MTN Group Ltd.(b) | $ | 149,439 | |||||
| 1,427 | Naspers Ltd., N Shares | 75,721 | ||||||
| 1,195 | Nedbank Group Ltd. | 23,275 | ||||||
| 7,746 | Netcare Ltd. | 13,889 | ||||||
| 2,616 | Pretoria Portland Cement Co. Ltd. | 8,603 | ||||||
| 2,071 | Remgro Ltd. | 32,235 | ||||||
| 1,959 | Reunert Ltd. | 15,718 | ||||||
| 10,827 | RMB Holdings Ltd. | 42,747 | ||||||
| 14,673 | Sanlam Ltd. | 57,891 | ||||||
| 2,800 | Sasol Ltd., Sponsored ADR(b) | 118,944 | ||||||
| 1,916 | Shoprite Holdings Ltd. | 31,171 | ||||||
| 932 | Spar Group Ltd. (The) | 12,089 | ||||||
| 5,666 | Standard Bank Group Ltd. | 76,239 | ||||||
| 4,568 | Steinhoff International Holdings Ltd.(c) | 13,992 | ||||||
| 3,528 | Telkom S.A. Ltd. | 9,518 | ||||||
| 1,125 | Tiger Brands Ltd. | 32,123 | ||||||
| 3,066 | Vodacom Group Ltd. | 36,758 | ||||||
| 7,776 | Woolworths Holdings Ltd. | 44,710 | ||||||
|
|
|
|||||||
| 1,394,536 | ||||||||
|
|
|
|||||||
| Taiwan — 4.9% | ||||||||
| 21,000 | Acer, Inc. | 21,467 | ||||||
| 6,657 | Advanced Semiconductor Engineering, Inc., ADR | 30,822 | ||||||
| 6,000 | Asustek Computer, Inc. | 60,035 | ||||||
| 4,000 | Catcher Technology Co. Ltd. | 25,362 | ||||||
| 15,000 | Cathay Financial Holding Co. Ltd. | 14,668 | ||||||
| 10,000 | Cheng Shin Rubber Industry Co. Ltd. | 24,099 | ||||||
| 40,000 | China Steel Corp. | 37,519 | ||||||
| 30,000 | Chinatrust Financial Holding Co. Ltd. | 16,706 | ||||||
| 2,681 | Chunghwa Telecom Co. Ltd., ADR | 80,001 | ||||||
| 38,000 | Compal Electronics, Inc. | 39,173 | ||||||
| 16,000 | Far EasTone Telecommunications Co. Ltd. | 35,550 | ||||||
| 13,000 | Formosa Chemicals & Fibre Corp. | 34,368 | ||||||
| 6,000 | Formosa Petrochemical Corp. | 16,366 | ||||||
| 17,000 | Formosa Plastics Corp. | 44,408 | ||||||
| 25,346 | Hon Hai Precision Industry Co. Ltd., GDR | 147,076 | ||||||
| 38,000 | Mega Financial Holding Co. Ltd. | 26,383 | ||||||
| 18,000 | Nan Ya Plastics Corp. | 31,548 | ||||||
| 4,000 | President Chain Store Corp. | 21,072 | ||||||
| 13,000 | Quanta Computer, Inc. | 33,924 | ||||||
| 6,000 | Synnex Technology International Corp. | 13,398 | ||||||
| 21,000 | Taiwan Cement Corp. | 23,676 | ||||||
| 11,000 | Taiwan Mobile Co. Ltd. | 34,840 | ||||||
| 26,272 | Taiwan Semiconductor Manufacturing Co. Ltd., Sponsored ADR(b) | 360,715 | ||||||
| 19,000 | Uni-President Enterprises Corp. | 28,524 | ||||||
| 5,308 | United Microelectronics Corp., Sponosored ADR | 11,200 | ||||||
|
|
|
|||||||
| 1,212,900 | ||||||||
|
|
|
|||||||
| Turkey — 0.2% | ||||||||
| 1,045 | KOC Holding AS, ADR | 16,977 | ||||||
| 10,700 | Turkiye Garanti Bankasi AS, ADR | 35,203 | ||||||
|
|
|
|||||||
| 52,180 | ||||||||
|
|
|
|||||||
| Total Common Stocks (Identified Cost $15,877,321) |
15,346,247 | |||||||
|
|
|
|||||||
| Preferred Stocks — 1.1% | ||||||||
| Brazil — 0.8% | ||||||||
| 1,300 | Bradespar S.A. | 20,342 | ||||||
| 700 | Cia de Transmissao de Energia Electrica Paulista | 20,686 | ||||||
| 1,800 | Cia Energetica de Sao Paulo, Class B | 31,049 | ||||||
| 1,300 | Eletropaulo Metropolitana Eletricidade de Sao Paulo S.A. | 15,470 | ||||||
| 10,670 | Itausa - Investimentos Itau S.A. | 46,609 | ||||||
| Brazil — continued | ||||||||
| 8,900 | Klabin S.A. | $ | 37,509 | |||||
| 1,918 | Lojas Americanas S.A. | 11,552 | ||||||
| 2,200 | Metalurgica Gerdau S.A. | 21,762 | ||||||
|
|
|
|||||||
| 204,979 | ||||||||
|
|
|
|||||||
| Korea — 0.3% | ||||||||
| 747 | Hyundai Motor Co. | 48,080 | ||||||
| 276 | LG Chem Ltd. | 21,328 | ||||||
|
|
|
|||||||
| 69,408 | ||||||||
|
|
|
|||||||
| Total Preferred Stocks (Identified Cost $304,771) |
274,387 | |||||||
|
|
|
|||||||
| Principal Amount |
||||||||
| Short-Term Investments — 29.9% | ||||||||
| Treasuries — 16.8% | ||||||||
| $ | 300,000 | U.S. Treasury Bill, 0.070%, 6/07/2012(b)(d) |
299,997 | |||||
| 250,000 | U.S. Treasury Bill, 0.025%, 6/21/2012(b)(d) |
249,997 | ||||||
| 300,000 | U.S. Treasury Bill, 0.090%, 6/28/2012(b)(d) |
299,994 | ||||||
| 250,000 | U.S. Treasury Bill, 0.060%, 7/19/2012(b)(d) |
249,988 | ||||||
| 250,000 | U.S. Treasury Bill, 0.100%, 8/02/2012(b)(d) |
249,979 | ||||||
| 300,000 | U.S. Treasury Bill, 0.130%, 9/06/2012(b)(d) |
299,943 | ||||||
| 300,000 | U.S. Treasury Bill, 0.145%, 9/13/2012(b)(d) |
299,933 | ||||||
| 300,000 | U.S. Treasury Bill, 0.135%, 9/20/2012(b)(d) |
299,921 | ||||||
| 500,000 | U.S. Treasury Bill, 0.115%, 10/18/2012(b)(d) |
499,778 | ||||||
| 320,000 | U.S. Treasury Bill, 0.130%, 10/25/2012(b)(d) |
319,851 | ||||||
| 300,000 | U.S. Treasury Bill, 0.130%, 11/29/2012(b)(d) |
299,819 | ||||||
| 250,000 | U.S. Treasury Note, 1.875%, 6/15/2012(b) |
250,156 | ||||||
| 300,000 | U.S. Treasury Note, 0.625%, 7/31/2012(b) |
300,258 | ||||||
| 250,000 | U.S. Treasury Note, 1.375%, 10/15/2012(b) |
251,152 | ||||||
|
|
|
|||||||
| 4,170,766 | ||||||||
|
|
|
|||||||
| Commercial Paper — 6.5% | ||||||||
| 350,000 | Louis Dreyfus Corp., (Credit Support: Barclays Bank), 0.380%, 6/01/2012(d) |
350,000 | ||||||
| 320,000 | Cofco Capital Corp., (Credit Support: Rabobank), 0.380%, 6/12/2012(b)(d) |
319,963 | ||||||
| 335,000 | Tennessee State School Bond Authority, 0.170%, 6/19/2012(b) |
334,990 | ||||||
| 300,000 | General Electric Co., 0.130%, 6/27/2012(b)(d) |
299,972 | ||||||
| 300,000 | Vermont Economic Development Authority, (Credit Support: JPMorgan Chase), 0.180%, 7/17/2012(b) |
300,000 | ||||||
|
|
|
|||||||
| 1,604,925 | ||||||||
|
|
|
|||||||
| Certificates of Deposit — 4.9% | ||||||||
| 350,000 | Commerzbank AG, 0.200%, 6/01/2012 |
350,000 | ||||||
| 330,000 | Societe Generale S.A., 0.389%, 7/03/2012(b)(e) |
329,928 | ||||||
See accompanying notes to financial statements.
| 18
Table of Contents
Consolidated Portfolio of Investments – as of May 31, 2012 (Unaudited)
ASG Growth Markets Fund – (continued)
| Principal Amount |
Description | Value (†) | ||||||
| Certificates of Deposit — continued | ||||||||
| $ | 250,000 | Canadian Imperial Bank of Commerce (NY), 0.329%, 7/25/2012(b)(e) |
$ | 250,002 | ||||
| 300,000 | Westpac Banking Corp. (NY), 0.466%, 2/04/2013(b)(e) |
299,942 | ||||||
|
|
|
|||||||
| 1,229,872 | ||||||||
|
|
|
|||||||
| Financial Company Commercial Paper — 1.2% | ||||||||
| 300,000 | Nestle Capital Corp., 0.180%, 8/28/2012(b)(d) |
299,896 | ||||||
|
|
|
|||||||
| Repurchase Agreements — 0.5% | ||||||||
| 113,144 | Tri-Party Repurchase Agreement with Fixed Income Clearing Corporation, dated 5/31/2012 at 0.000% to be repurchased at $113,144 on 6/01/2012 collateralized by $105,000 Federal Home Loan Mortgage Corp., 4.750% due 11/17/2015 valued at $119,569 including accrued interest (Note 2 of Notes to Financial Statements) | 113,144 | ||||||
|
|
|
|||||||
| Total Short-Term Investments (Identified Cost $7,418,488) |
7,418,603 | |||||||
|
|
|
|||||||
| Total Investments – 92.7% (Identified Cost $23,600,580)(a) |
23,039,237 | |||||||
| Other assets less liabilities – 7.3% | 1,816,855 | |||||||
|
|
|
|||||||
| Net Assets – 100.0% | $ | 24,856,092 | ||||||
|
|
|
|||||||
| (†) | See Note 2 of Notes to Financial Statements. | |||||||
| (a) | Federal Tax Information (Amounts exclude certain adjustments made at the end of the Fund’s fiscal year for tax purposes. Such adjustments are primarily due to wash sales.): | |||||||
| At May 31, 2012, the net unrealized depreciation on investments based on a cost of $23,600,580 for federal income tax purposes was as follows: | ||||||||
| Aggregate gross unrealized appreciation for all investments in which there is an excess of value over tax cost | $ | 851,414 | ||||||
| Aggregate gross unrealized depreciation for all investments in which there is an excess of tax cost over value | (1,412,757 | ) | ||||||
|
|
|
|||||||
| Net unrealized depreciation | $ | (561,343 | ) | |||||
|
|
|
|||||||
| (b) | All or a portion of this security has been designated to cover the Fund’s obligations under open forward foreign currency contracts or futures contracts. | |||||||
| (c) | Non-income producing security. | |||||||
| (d) | Interest rate represents discount rate at time of purchase; not a coupon rate. | |||||||
| (e) | Variable rate security. Rate as of May 31, 2012 is disclosed. | |||||||
| ADR/ GDR | An American Depositary Receipt or Global Depositary Receipt is a certificate issued by a custodian bank representing the right to receive securities of the foreign issuer described. The values of ADRs and GDRs may be significantly influenced by trading on exchanges not located in the United States. | |||||||
At May 31, 2012, the Fund had the following open forward foreign currency contracts:
| Contract to Buy/Sell1 |
Delivery Date |
Currency | Units | Notional Value |
Unrealized Appreciation (Depreciation) |
|||||||||||||
| Sell | 6/20/2012 | Australian Dollar | 1,000,000 | $ | 972,658 | $ | 12,955 | |||||||||||
| Buy | 6/20/2012 | Canadian Dollar | 900,000 | 871,015 | (35,994 | ) | ||||||||||||
| Sell | 6/20/2012 | Canadian Dollar | 1,500,000 | 1,451,691 | 35,111 | |||||||||||||
| Buy | 6/20/2012 | Euro | 500,000 | 618,294 | (42,102 | ) | ||||||||||||
| Sell | 6/20/2012 | Euro | 1,500,000 | 1,854,882 | 109,289 | |||||||||||||
| Buy | 6/20/2012 | New Zealand Dollar | 900,000 | 677,560 | (55,436 | ) | ||||||||||||
| Sell | 6/20/2012 | New Zealand Dollar | 2,200,000 | 1,656,257 | 63,868 | |||||||||||||
| Buy | 6/20/2012 | Norwegian Krone | 4,000,000 | 653,740 | (44,729 | ) | ||||||||||||
| Sell | 6/20/2012 | Norwegian Krone | 12,000,000 | 1,961,220 | 87,458 | |||||||||||||
| Buy | 6/20/2012 | Singapore Dollar | 1,375,000 | 1,067,071 | (41,037 | ) | ||||||||||||
| Sell | 6/20/2012 | Singapore Dollar | 4,000,000 | 3,104,206 | 27,679 | |||||||||||||
| Buy | 6/20/2012 | Swedish Krona | 8,000,000 | 1,100,561 | (58,154 | ) | ||||||||||||
| Sell | 6/20/2012 | Swedish Krona | 10,000,000 | 1,375,702 | 89,692 | |||||||||||||
| Buy | 6/20/2012 | Swiss Franc | 250,000 | 257,441 | (16,528 | ) | ||||||||||||
| Sell | 6/20/2012 | Swiss Franc | 250,000 | 257,441 | 14,407 | |||||||||||||
| Buy | 6/20/2012 | Turkish Lira | 3,600,000 | 1,921,453 | (86,095 | ) | ||||||||||||
| Sell | 6/20/2012 | Turkish Lira | 6,900,000 | 3,682,785 | 63,772 | |||||||||||||
|
|
|
|||||||||||||||||
| Total | $ | 124,156 | ||||||||||||||||
|
|
|
|||||||||||||||||
1 Counterparty is UBS AG.
At May 31, 2012, open futures contracts purchased were as follows:
| Financial Futures | Expiration Date |
Contracts | Notional Value |
Unrealized Appreciation (Depreciation) |
||||||||||||
| E-mini Dow |
6/15/2012 | 15 | $ | 928,725 | $ | (29,175 | ) | |||||||||
| E-mini NASDAQ 100 |
6/15/2012 | 3 | 151,440 | (4,779 | ) | |||||||||||
| E-mini S&P 500 |
6/15/2012 | 10 | 654,625 | (18,875 | ) | |||||||||||
| Euribor |
9/17/2012 | 23 | 7,071,129 | 6,755 | ||||||||||||
| Euro Schatz |
6/07/2012 | 70 | 9,589,865 | 40,248 | ||||||||||||
| Eurodollar |
9/17/2012 | 1 | 248,613 | (87 | ) | |||||||||||
| German Euro BOBL |
6/07/2012 | 10 | 1,569,737 | 36,724 | ||||||||||||
| German Euro Bund |
6/07/2012 | 3 | 541,699 | 28,452 | ||||||||||||
| Mini-Russell 2000 |
6/15/2012 | 1 | 76,110 | (6,590 | ) | |||||||||||
| UK Long Gilt |
9/26/2012 | 2 | 371,737 | 6,442 | ||||||||||||
| 2 Year U.S. Treasury Note |
9/28/2012 | 28 | 6,171,375 | 3,938 | ||||||||||||
| 5 Year U.S. Treasury Note |
9/28/2012 | 29 | 3,601,437 | 13,594 | ||||||||||||
| 10 Year Canada Government Bond |
9/19/2012 | 11 | 1,472,276 | 14,697 | ||||||||||||
| 10 Year Japan Government Bond |
6/11/2012 | 1 | 1,832,695 | 23,864 | ||||||||||||
| 10 Year U.S. Treasury Note |
9/19/2012 | 14 | 1,875,125 | 19,359 | ||||||||||||
| 30 Year U.S. Treasury Bond |
9/19/2012 | 8 | 1,197,750 | 22,500 | ||||||||||||
|
|
|
|||||||||||||||
| Total |
$ | 157,067 | ||||||||||||||
|
|
|
|||||||||||||||
See accompanying notes to financial statements.
19 |
Table of Contents
Consolidated Portfolio of Investments – as of May 31, 2012 (Unaudited)
ASG Growth Markets Fund – (continued)
| Commodity Futures2 | Expiration Date |
Contracts | Notional Value |
Unrealized Appreciation (Depreciation) |
||||||||||||
| Copper LME |
6/20/2012 | 1 | $ | 186,000 | $ | (27,466 | ) | |||||||||
| Heating Oil |
6/29/2012 | 4 | 454,138 | (27,250 | ) | |||||||||||
| Nickel |
6/20/2012 | 3 | 291,042 | (29,946 | ) | |||||||||||
| Soybean |
7/13/2012 | 13 | 871,000 | (83,675 | ) | |||||||||||
| Soybean Meal |
7/13/2012 | 5 | 197,250 | 200 | ||||||||||||
| Wheat |
7/13/2012 | 4 | 128,750 | (1,000 | ) | |||||||||||
|
|
|
|||||||||||||||
| Total |
$ | (169,137 | ) | |||||||||||||
|
|
|
|||||||||||||||
At May 31, 2012, open futures contracts sold were as follows:
| Financial Futures | Expiration Date |
Contracts | Notional Value |
Unrealized Appreciation (Depreciation) |
||||||||||||
| DAX |
6/15/2012 | 1 | $ | 192,863 | $ | 4,977 | ||||||||||
| FTSE 100 |
6/15/2012 | 1 | 81,507 | 609 | ||||||||||||
| FTSE JSE Top 40 |
6/21/2012 | 7 | 241,295 | 569 | ||||||||||||
| Hang Seng |
6/28/2012 | 1 | 119,371 | (419 | ) | |||||||||||
| MSCI Singapore |
6/28/2012 | 5 | 247,012 | (78 | ) | |||||||||||
| MSCI Taiwan |
6/28/2012 | 3 | 77,490 | (1,830 | ) | |||||||||||
| Nikkei 225 |
6/08/2012 | 2 | 217,713 | 1,787 | ||||||||||||
| OMXS30 |
6/15/2012 | 12 | 160,892 | 2,846 | ||||||||||||
| S&P/TSX 60 |
6/14/2012 | 9 | 1,142,547 | (1,975 | ) | |||||||||||
| Sterling |
9/19/2012 | 66 | 12,595,381 | (12,831 | ) | |||||||||||
|
|
|
|||||||||||||||
| Total |
$ | (6,345 | ) | |||||||||||||
|
|
|
|||||||||||||||
| Commodity Futures2 | Expiration Date |
Contracts | Notional Value |
Unrealized Appreciation (Depreciation) |
||||||||||||
| Aluminum HG |
6/20/2012 | 3 | $ | 147,188 | $ | 12,139 | ||||||||||
| Cocoa |
7/16/2012 | 3 | 62,490 | 1,050 | ||||||||||||
| Coffee |
7/19/2012 | 4 | 240,975 | 19,538 | ||||||||||||
| Copper High Grade |
7/27/2012 | 8 | 673,100 | 31,075 | ||||||||||||
| Copper LME |
6/20/2012 | 1 | 186,000 | 22,696 | ||||||||||||
| Corn |
7/13/2012 | 2 | 55,525 | 5,100 | ||||||||||||
| Cotton |
7/09/2012 | 2 | 71,550 | 16,710 | ||||||||||||
| Gas Oil |
7/12/2012 | 1 | 86,675 | 3,400 | ||||||||||||
| Live Cattle |
8/31/2012 | 5 | 237,800 | 430 | ||||||||||||
| Nickel |
6/20/2012 | 3 | 291,042 | 37,434 | ||||||||||||
| Silver |
7/27/2012 | 3 | 416,355 | 56,940 | ||||||||||||
| Soybean Oil |
7/13/2012 | 33 | 974,160 | 42,714 | ||||||||||||
| Sugar |
6/29/2012 | 1 | 21,750 | 2,632 | ||||||||||||
| Wheat |
7/13/2012 | 9 | 299,250 | (2,363 | ) | |||||||||||
|
|
|
|||||||||||||||
| Total |
$ | 249,495 | ||||||||||||||
|
|
|
|||||||||||||||
2 Commodity futures are held by ASG Growth Markets Cayman Fund Ltd., a wholly-owned subsidiary. See Note 1 of Notes to Financial Statements.
Industry Summary at May 31, 2012 (Unaudited)
| Commercial Banks |
10.4 | % | ||
| Oil, Gas & Consumable Fuels |
8.4 | |||
| Semiconductors & Semiconductor Equipment |
4.7 | |||
| Wireless Telecommunication Services |
4.6 | |||
| Metals & Mining |
3.9 | |||
| Automobiles |
2.6 | |||
| Real Estate Management & Development |
2.0 | |||
| Other Investments, less than 2% each |
26.2 | |||
| Short-Term Investments |
29.9 | |||
|
|
|
|||
| Total Investments |
92.7 | |||
| Other assets less liabilities (including open forward foreign currency and futures contracts) |
7.3 | |||
|
|
|
|||
| Net Assets |
100.0 | % | ||
|
|
|
Currency Exposure at May 31, 2012 (Unaudited)
| United States Dollar |
58.8 | % | ||
| Hong Kong Dollar |
11.3 | |||
| South Korean Won |
6.9 | |||
| South African Rand |
4.5 | |||
| Malaysian Ringgit |
3.1 | |||
| Brazilian Real |
2.6 | |||
| New Taiwan Dollar |
2.3 | |||
| Indonesian Rupiah |
2.2 | |||
| Mexican Peso |
1.0 | |||
|
|
|
|||
| Total Investments |
92.7 | |||
| Other assets less liabilities (including open forward foreign currency and futures contracts) |
7.3 | |||
|
|
|
|||
| Net Assets |
100.0 | % | ||
|
|
|
See accompanying notes to financial statements.
| 20
Table of Contents
Portfolio of Investments – as of May 31, 2012 (Unaudited)
Gateway International Fund
| Shares | Description | Value (†) | ||||||
| Common Stocks* — 92.8% of Net Assets | ||||||||
| Australia — 8.3% | ||||||||
| 4,527 | Amcor Ltd. | $ | 32,918 | |||||
| 5,546 | Australia & New Zealand Banking Group Ltd.(b) | 112,739 | ||||||
| 6,608 | BHP Billiton Ltd.(b) | 203,693 | ||||||
| 5,903 | Brambles Ltd.(b) | 38,275 | ||||||
| 2,335 | Cardno Ltd. | 16,829 | ||||||
| 3,028 | Commonwealth Bank of Australia(b) | 145,676 | ||||||
| 4,417 | Consolidated Media Holdings Ltd.(b) | 13,930 | ||||||
| 1,195 | CSL Ltd.(b) | 43,762 | ||||||
| 1,321 | Macquarie Group Ltd.(b) | 34,634 | ||||||
| 954 | McMillan Shakespeare Ltd.(b) | 10,367 | ||||||
| 4,740 | National Australia Bank Ltd.(b) | 103,673 | ||||||
| 1,367 | New Hope Corp. Ltd.(b) | 5,529 | ||||||
| 1,899 | Newcrest Mining Ltd.(b) | 45,993 | ||||||
| 4,122 | Oil Search Ltd. | 27,311 | ||||||
| 1,816 | Orica Ltd. | 43,722 | ||||||
| 3,563 | Origin Energy Ltd.(b) | 44,681 | ||||||
| 1,285 | Premier Investments Ltd.(b) | 5,995 | ||||||
| 2,867 | QBE Insurance Group Ltd.(b) | 34,524 | ||||||
| 8,633 | QR National Ltd. | 28,618 | ||||||
| 1,546 | Rio Tinto Ltd.(b) | 85,579 | ||||||
| 2,442 | SAI Global Ltd.(b) | 11,090 | ||||||
| 4,556 | Suncorp Group Ltd. | 34,394 | ||||||
| 25,118 | Telstra Corp. Ltd.(b) | 86,902 | ||||||
| 2,473 | Wesfarmers Ltd.(b) | 70,278 | ||||||
| 5,756 | Westfield Group(b) | 50,838 | ||||||
| 12,748 | Westfield Retail Trust(b) | 33,753 | ||||||
| 6,006 | Westpac Banking Corp.(b) | 118,533 | ||||||
| 1,471 | Woodside Petroleum Ltd.(b) | 46,056 | ||||||
| 2,464 | Woolworths Ltd.(b) | 63,439 | ||||||
|
|
|
|||||||
| 1,593,731 | ||||||||
|
|
|
|||||||
| Euro Zone — 29.4% | ||||||||
| 1,162 | Accor S.A.(b) | 34,628 | ||||||
| 2,023 | Allianz SE, (Registered)(b) | 183,850 | ||||||
| 1,030 | Alstom S.A.(b) | 30,008 | ||||||
| 24,851 | Banco Bilbao Vizcaya Argentaria S.A.(b) | 141,944 | ||||||
| 43,982 | Banco Santander S.A.(b) | 234,289 | ||||||
| 3,783 | BASF SE(b)(c) | 265,489 | ||||||
| 3,384 | Bayer AG, (Registered)(b) | 214,776 | ||||||
| 1,406 | Bayerische Motoren Werke AG(b) | 106,797 | ||||||
| 1,670 | Belgacom S.A.(b) | 44,038 | ||||||
| 4,510 | BNP Paribas S.A.(b) | 144,510 | ||||||
| 1,497 | Bouygues S.A.(b) | 36,356 | ||||||
| 478 | Casino Guichard Perrachon S.A.(b) | 40,159 | ||||||
| 3,827 | Daimler AG, (Registered)(b) | 178,081 | ||||||
| 2,937 | Danone S.A.(b) | 188,385 | ||||||
| 3,965 | Deutsche Bank AG, (Registered)(b)(d) | 143,726 | ||||||
| 8,204 | E.ON AG(b) | 150,460 | ||||||
| 1,829 | Electricite de France S.A.(b) | 35,268 | ||||||
| 11,425 | ENI SpA(b) | 220,095 | ||||||
| 6,659 | GDF Suez(b) | 131,779 | ||||||
| 1,005 | Groupe Bruxelles Lambert S.A.(b) | 62,978 | ||||||
| 11,284 | ING Groep NV(b)(d) | 65,288 | ||||||
| 68,740 | Intesa Sanpaolo SpA(b)(d) | 72,502 | ||||||
| 812 | Kerry Group PLC, Class A(b) | 34,585 | ||||||
| 832 | Kone OYJ-B(b) | 46,569 | ||||||
| 755 | Koninklijke DSM NV(b) | 35,959 | ||||||
| 1,374 | Legrand S.A.(b) | 41,394 | ||||||
| 206 | Linde AG(b) | 31,764 | ||||||
| 1,316 | LVMH Moet Hennessy Louis Vuitton S.A.(b) | 194,795 | ||||||
| 377 | Pernod-Ricard S.A.(b) | 36,822 | ||||||
| 2,080 | RWE AG(b) | 76,209 | ||||||
| 1,749 | Sampo OYJ, A Shares(b) | 40,507 | ||||||
| Shares | Description | Value (†) | ||||||
| Euro Zone — continued | ||||||||
| 5,274 | Sanofi(b)(c) | $ | 359,250 | |||||
| 3,714 | SAP AG(b)(c) | 213,108 | ||||||
| 1,484 | SCOR SE(b) | 32,233 | ||||||
| 2,030 | SES S.A.(b) | 45,455 | ||||||
| 3,705 | Siemens AG, (Registered)(b)(c) | 305,894 | ||||||
| 10,612 | Snam SpA(b) | 42,930 | ||||||
| 3,882 | Societe Generale S.A.(b)(d) | 77,534 | ||||||
| 608 | Sodexo(b) | 44,196 | ||||||
| 62,950 | Telecom Italia SpA(b) | 43,002 | ||||||
| 22,529 | Telefonica S.A.(b)(c) | 250,775 | ||||||
| 1,066 | Thales S.A.(b) | 31,586 | ||||||
| 1,624 | ThyssenKrupp AG(b) | 26,933 | ||||||
| 9,289 | Total S.A.(b)(c) | 400,347 | ||||||
| 765 | Umicore S.A.(b) | 36,472 | ||||||
| 22,372 | UniCredit SpA(b)(d) | 69,027 | ||||||
| 6,860 | Unilever NV(b) | 215,509 | ||||||
| 578 | Volkswagen AG(b) | 87,425 | ||||||
| 639 | Wendel S.A.(b) | 42,037 | ||||||
| 574 | Wereldhave NV(b) | 35,001 | ||||||
|
|
|
|||||||
| 5,622,724 | ||||||||
|
|
|
|||||||
| Hong Kong — 2.8% | ||||||||
| 11,000 | AIA Group Ltd.(b) | 35,763 | ||||||
| 3,000 | Cheung Kong Holdings Ltd.(b) | 34,399 | ||||||
| 95,000 | China Construction Bank Corp., Class H(b) | 66,086 | ||||||
| 9,000 | China Life Insurance Co. Ltd., Class H(b) | 21,163 | ||||||
| 6,000 | China Mobile Ltd.(b) | 60,859 | ||||||
| 20,000 | China Petroleum & Chemical Corp., Class H(b) | 17,825 | ||||||
| 17,000 | CNOOC Ltd.(b) | 30,572 | ||||||
| 12,000 | HSBC Holdings PLC(b) | 94,737 | ||||||
| 4,000 | Hutchison Whampoa Ltd.(b) | 32,760 | ||||||
| 76,000 | Industrial & Commercial Bank of China Ltd., Class H(b) | 46,373 | ||||||
| 24,000 | PetroChina Co. Ltd., Class H(b) | 30,265 | ||||||
| 3,000 | Sun Hung Kai Properties Ltd.(b) | 33,709 | ||||||
| 1,000 | Tencent Holdings Ltd.(b) | 27,432 | ||||||
|
|
|
|||||||
| 531,943 | ||||||||
|
|
|
|||||||
| Japan — 21.9% | ||||||||
| 3,503 | Advantest Corp.(b) | 47,367 | ||||||
| 1,918 | Air Water, Inc.(b) | 22,100 | ||||||
| 2,679 | Asahi Group Holdings Ltd.(b) | 57,204 | ||||||
| 2,106 | Astellas Pharma, Inc.(b) | 82,702 | ||||||
| 2,674 | Canon, Inc.(b)(c) | 106,697 | ||||||
| 1,163 | Coca-Cola West Co. Ltd.(b) | 19,523 | ||||||
| 2,130 | Credit Saison Co. Ltd.(b) | 40,622 | ||||||
| 2,111 | Daikin Industries Ltd.(b) | 54,235 | ||||||
| 2,092 | Denso Corp.(b) | 62,909 | ||||||
| 2,109 | Dentsu, Inc.(b) | 59,006 | ||||||
| 2,076 | Eisai Co. Ltd.(b) | 84,659 | ||||||
| 1,621 | FANUC Corp.(b)(c) | 278,563 | ||||||
| 1,595 | Fast Retailing Co. Ltd.(b)(c) | 355,228 | ||||||
| 2,344 | FUJIFILM Holdings Corp.(b) | 43,804 | ||||||
| 497 | Hamamatsu Photonics KK(b) | 17,330 | ||||||
| 4,051 | Hankyu Hanshin Holdings, Inc.(b) | 19,632 | ||||||
| 5,138 | Hanwa Co. Ltd.(b) | 18,976 | ||||||
| 2,259 | Hitachi Construction Machinery Co. Ltd.(b) | 43,342 | ||||||
| 3,625 | Honda Motor Co. Ltd.(b)(c) | 115,232 | ||||||
| 183 | Idemitsu Kosan Co. Ltd.(b) | 16,546 | ||||||
| 1,313 | Ito En Ltd.(b) | 22,208 | ||||||
| 3,324 | ITOCHU Corp.(b) | 36,357 | ||||||
| 2,002 | JGC Corp.(b) | 54,848 | ||||||
| 3,091 | Kamigumi Co. Ltd.(b) | 23,989 | ||||||
| 4,504 | Kaneka Corp.(b) | 24,779 | ||||||
| 2,221 | Kao Corp.(b) | 57,369 | ||||||
| 17 | KDDI Corp.(b)(c) | 104,970 | ||||||
See accompanying notes to financial statements.
21 |
Table of Contents
Portfolio of Investments – as of May 31, 2012 (Unaudited)
Gateway International Fund – (continued)
| Shares | Description | Value (†) | ||||||
| Japan — continued | ||||||||
| 2,204 | Keikyu Corp.(b) | $ | 19,254 | |||||
| 3,324 | Kokuyo Co. Ltd.(b) | 22,865 | ||||||
| 2,065 | Komatsu Ltd.(b) | 49,291 | ||||||
| 1,826 | Konami Corp.(b) | 38,428 | ||||||
| 2,985 | Kuraray Co. Ltd.(b) | 37,937 | ||||||
| 853 | Kurita Water Industries Ltd.(b) | 18,679 | ||||||
| 1,742 | Kyocera Corp.(b)(c) | 143,641 | ||||||
| 315 | Lawson, Inc.(b) | 22,067 | ||||||
| 589 | Mabuchi Motor Co. Ltd.(b) | 22,676 | ||||||
| 832 | MISUMI Group, Inc.(b) | 18,017 | ||||||
| 2,521 | Mitsubishi Corp.(b) | 49,192 | ||||||
| 2,697 | Mitsubishi Estate Co. Ltd.(b) | 41,797 | ||||||
| 3,256 | Mitsubishi Logistics Corp.(b) | 32,032 | ||||||
| 454 | Mitsubishi UFJ Lease & Finance Co. Ltd.(b) | 16,997 | ||||||
| 2,939 | Mitsui & Co. Ltd.(b) | 41,308 | ||||||
| 2,716 | Mitsui Fudosan Co. Ltd.(b) | 45,131 | ||||||
| 2,557 | Mitsumi Electric Co. Ltd.(b)(d) | 17,198 | ||||||
| 1,652 | Nagase & Co. Ltd.(b) | 19,226 | ||||||
| 9,859 | Nagoya Railroad Co. Ltd.(b) | 26,043 | ||||||
| 2,571 | NGK Insulators Ltd.(b) | 26,663 | ||||||
| 1,934 | Nikon Corp.(b) | 53,618 | ||||||
| 3,349 | Nippon Electric Glass Co. Ltd.(b) | 20,839 | ||||||
| 20 | NTT Data Corp.(b) | 57,350 | ||||||
| 1,854 | Olympus Corp.(b)(d) | 29,697 | ||||||
| 261 | ORIX Corp.(b) | 22,519 | ||||||
| 5,076 | Pacific Metals Co. Ltd.(b) | 20,430 | ||||||
| 792 | Ricoh Leasing Co. Ltd.(b) | 18,114 | ||||||
| 2,026 | Secom Co. Ltd.(b) | 89,448 | ||||||
| 2,873 | Seino Holdings Corp.(b) | 18,683 | ||||||
| 2,242 | Seven & I Holdings Co. Ltd.(b) | 67,413 | ||||||
| 1,946 | Shin-Etsu Chemical Co. Ltd.(b)(c) | 99,771 | ||||||
| 2,678 | Shiseido Co. Ltd.(b) | 42,099 | ||||||
| 4,958 | Softbank Corp.(b)(c) | 154,784 | ||||||
| 2,387 | Sony Corp.(b) | 31,629 | ||||||
| 3,388 | Sumitomo Corp.(b) | 45,423 | ||||||
| 3,649 | Sumitomo Metal Mining Co. Ltd.(b) | 41,103 | ||||||
| 2,322 | Sumitomo Realty & Development Co. Ltd.(b) | 48,597 | ||||||
| 2,549 | Suzuki Motor Corp.(b) | 52,831 | ||||||
| 4,049 | Taiyo Nippon Sanso Corp.(b) | 24,441 | ||||||
| 2,502 | Taiyo Yuden Co. Ltd.(b) | 21,985 | ||||||
| 2,080 | Takeda Pharmaceutical Co. Ltd.(b) | 86,933 | ||||||
| 1,727 | TDK Corp.(b) | 74,376 | ||||||
| 1,951 | Terumo Corp.(b) | 70,072 | ||||||
| 1,657 | Tokio Marine Holdings, Inc.(b) | 35,975 | ||||||
| 1,765 | Tokyo Electron Ltd.(b)(c) | 79,404 | ||||||
| 5,999 | Toyo Ink SC Holdings Co. Ltd.(b) | 20,331 | ||||||
| 2,977 | Toyo Seikan Kaisha Ltd.(b) | 33,618 | ||||||
| 755 | Toyo Suisan Kaisha Ltd.(b) | 19,313 | ||||||
| 861 | Toyota Industries Corp.(b) | 22,698 | ||||||
| 2,007 | Toyota Motor Corp.(b) | 77,129 | ||||||
| 2,845 | Toyota Tsusho Corp.(b) | 52,392 | ||||||
| 1,862 | Trend Micro, Inc.(b) | 50,942 | ||||||
| 3,239 | Yamaha Corp.(b) | 27,659 | ||||||
|
|
|
|||||||
| 4,190,255 | ||||||||
|
|
|
|||||||
| Switzerland — 7.9% | ||||||||
| 527 | Actelion Ltd., (Registered)(b)(d) | 19,977 | ||||||
| 227 | Aryzta AG(b)(d) | 10,247 | ||||||
| 555 | Baloise Holding AG, (Registered)(b) | 34,378 | ||||||
| 161 | Bank Sarasin & Cie AG, (Registered), Class B(b)(d) | 4,312 | ||||||
| 985 | Clariant AG, (Registered)(b)(d) | 10,111 | ||||||
| 113 | Dufry AG, (Registered)(b)(d) | 12,849 | ||||||
| 1,177 | EFG International AG(b)(d) | 8,338 | ||||||
| 87 | EFG International Zuerich, (Rights)(d) | — | ||||||
| 1,349 | GAM Holding AG(b)(d) | 14,239 | ||||||
| Shares | Description | Value (†) | ||||||
| Switzerland — continued | ||||||||
| 250 | Gategroup Holding AG(b)(d) | $ | 6,286 | |||||
| 194 | Geberit AG, (Registered)(b)(d) | 37,738 | ||||||
| 910 | Julius Baer Group Ltd.(b)(d) | 28,746 | ||||||
| 240 | Kuehne & Nagel International AG, (Registered)(b) | 25,587 | ||||||
| 930 | Logitech International S.A., (Registered)(b)(d) | 9,505 | ||||||
| 194 | Lonza Group AG, (Registered)(b)(d) | 6,919 | ||||||
| 475 | Meyer Burger Technology AG(b)(d) | 7,521 | ||||||
| 7,229 | Nestle S.A., (Registered)(c) | 410,206 | ||||||
| 523 | Nobel Biocare Holding AG, (Registered)(b)(d) | 5,529 | ||||||
| 5,707 | Novartis AG, (Registered)(c) | 297,322 | ||||||
| 1,323 | OC Oerlikon Corp. AG, (Registered)(b)(d) | 11,094 | ||||||
| 1,522 | Roche Holding AG(b) | 238,193 | ||||||
| 264 | Schindler Holding AG(b) | 29,297 | ||||||
| 1,436 | Schmolz & Bickenbach AG, (Registered)(b)(d) | 7,353 | ||||||
| 64 | Sonova Holding AG, (Registered)(b)(d) | 6,024 | ||||||
| 174 | Sulzer AG, (Registered)(b) | 20,858 | ||||||
| 739 | Swatch Group AG (The), (Registered)(b) | 49,337 | ||||||
| 242 | Swiss Life Holding AG, (Registered)(b)(d) | 19,483 | ||||||
| 219 | Swiss Prime Site AG, (Registered)(b)(d) | 17,475 | ||||||
| 440 | Temenos Group AG, (Registered)(b)(d) | 7,100 | ||||||
| 906 | Transocean Ltd.(b) | 36,677 | ||||||
| 9,533 | UBS AG, (Registered)(b)(d) | 108,245 | ||||||
|
|
|
|||||||
| 1,500,946 | ||||||||
|
|
|
|||||||
| United Kingdom — 22.5% | ||||||||
| 2,056 | African Barrick Gold PLC(b) | 10,451 | ||||||
| 3,279 | Anglo American PLC(b) | 99,944 | ||||||
| 3,338 | AstraZeneca PLC(b) | 134,839 | ||||||
| 1,777 | Babcock International Group PLC(b) | 23,336 | ||||||
| 4,451 | Balfour Beatty PLC(b) | 18,725 | ||||||
| 21,931 | Barclays PLC(b) | 60,170 | ||||||
| 903 | Berkeley Group Holdings PLC(b)(d) | 17,433 | ||||||
| 7,850 | BG Group PLC(b) | 151,278 | ||||||
| 5,391 | BHP Billiton PLC(b) | 141,270 | ||||||
| 41,154 | BP PLC(b)(c) | 250,175 | ||||||
| 4,642 | British American Tobacco PLC(b)(c) | 219,406 | ||||||
| 23,402 | BT Group PLC(b) | 74,451 | ||||||
| 2,304 | Bunzl PLC(b) | 36,384 | ||||||
| 5,802 | Capital & Counties Properties PLC(b) | 17,335 | ||||||
| 3,475 | Catlin Group Ltd.(b) | 21,529 | ||||||
| 1,583 | Close Brothers Group PLC(b) | 16,880 | ||||||
| 750 | Croda International PLC(b) | 25,981 | ||||||
| 755 | Derwent London PLC(b) | 20,357 | ||||||
| 6,445 | Diageo PLC(b) | 153,560 | ||||||
| 2,833 | Ferrexpo PLC(b) | 8,670 | ||||||
| 11,436 | GlaxoSmithKline PLC(b)(c) | 253,411 | ||||||
| 3,847 | Great Portland Estates PLC(b) | 22,444 | ||||||
| 2,851 | Greene King PLC(b) | 21,557 | ||||||
| 4,456 | Halma PLC(b) | 26,921 | ||||||
| 11,656 | Hays PLC(b) | 13,090 | ||||||
| 3,691 | Hiscox Ltd.(b) | 22,547 | ||||||
| 40,440 | HSBC Holdings PLC(b)(c) | 318,981 | ||||||
| 2,343 | IG Group Holdings PLC(b) | 15,680 | ||||||
| 3,601 | Inchcape PLC(b) | 17,490 | ||||||
| 4,943 | Intermediate Capital Group PLC(b) | 18,882 | ||||||
| 3,338 | Invensys PLC(b) | 11,323 | ||||||
| 1,619 | Jardine Lloyd Thompson Group PLC(b) | 17,069 | ||||||
| 1,511 | John Wood Group PLC(b) | 16,395 | ||||||
| 7,073 | Ladbrokes PLC(b) | 18,539 | ||||||
| 13,420 | Marston’s PLC(b) | 20,416 | ||||||
| 5,234 | Meggitt PLC(b) | 30,575 | ||||||
| 3,353 | Melrose PLC(b) | 22,027 | ||||||
| 9,928 | National Grid PLC(b) | 99,575 | ||||||
| 2,346 | Pennon Group PLC(b) | 26,530 | ||||||
| 1,987 | Petropavlovsk PLC(b) | 11,267 | ||||||
See accompanying notes to financial statements.
| 22
Table of Contents
Portfolio of Investments – as of May 31, 2012 (Unaudited)
Gateway International Fund – (continued)
| Shares | Description | Value (†) | ||||||
| United Kingdom — continued | ||||||||
| 8,818 | Prudential PLC(b) | $ | 92,567 | |||||
| 1,958 | Reckitt Benckiser Group PLC(b) | 104,194 | ||||||
| 12,926 | Rentokil Initial PLC(b) | 15,038 | ||||||
| 3,573 | Restaurant Group PLC(b) | 15,446 | ||||||
| 3,341 | Rio Tinto PLC(b)(c) | 143,741 | ||||||
| 494 | Rotork PLC(b) | 15,494 | ||||||
| 13,820 | Royal Dutch Shell PLC, A Shares(b)(c) | 429,564 | ||||||
| 3,117 | SABMiller PLC(b) | 115,198 | ||||||
| 2,713 | Shaftesbury PLC(b) | 21,172 | ||||||
| 671 | Spirax-Sarco Engineering PLC(b) | 21,438 | ||||||
| 6,273 | Standard Chartered PLC(b) | 127,016 | ||||||
| 1,411 | Telecity Group PLC(b)(d) | 17,850 | ||||||
| 19,912 | Tesco PLC(b) | 92,927 | ||||||
| 477 | Ultra Electronics Holdings PLC(b) | 12,275 | ||||||
| 3,532 | Unilever PLC(b) | 111,140 | ||||||
| 109,630 | Vodafone Group PLC(b) | 292,381 | ||||||
| 2,500 | WH Smith PLC(b) | 18,589 | ||||||
| 5,645 | WPP PLC(b) | 67,584 | ||||||
| 5,465 | Xstrata PLC(b) | 78,066 | ||||||
|
|
|
|||||||
| 4,298,573 | ||||||||
|
|
|
|||||||
| Total Common Stocks (Identified Cost $20,529,217) |
17,738,172 | |||||||
|
|
|
|||||||
| Contracts | ||||||||
| Purchased Options — 1.0% | ||||||||
| Index Options — 1.0% | ||||||||
| 87 | On Euro STOXX 50 Index, Put expiring June 15, 2012 at 2000 |
18,918 | ||||||
| 47 | On Euro STOXX 50 Index, Put expiring June 15, 2012 at 2050 |
16,751 | ||||||
| 39 | On Euro STOXX 50 Index, Put expiring July 20, 2012 at 1850 |
14,708 | ||||||
| 39 | On Euro STOXX 50 Index, Put expiring July 20, 2012 at 1950 |
23,519 | ||||||
| 24 | On FTSE 100 Index, Put expiring June 15, 2012 at 4900 |
5,867 | ||||||
| 12 | On FTSE 100 Index, Put expiring July 20, 2012 at 4600 |
8,141 | ||||||
| 15 | On FTSE 100 Index, Put expiring July 20, 2012 at 4700 |
12,326 | ||||||
| 2 | On Hang Seng Index, OTC Put expiring July 30, 2012 at 17000(e) |
4,089 | ||||||
| 2 | On Hang Seng Index, OTC Put expiring July 30, 2012 at 17400(e) |
5,184 | ||||||
| 5 | On Nikkei 225 Index, Put expiring July 13, 2012 at 7500 |
3,244 | ||||||
| 10 | On Nikkei 225 Index, Put expiring July 13, 2012 at 7750 |
9,363 | ||||||
| 9 | On Nikkei 225 Index, Put expiring July 13, 2012 at 8250 |
19,267 | ||||||
| 8 | On Nikkei 225 Index, Put expiring August 10, 2012 at 7500 |
9,210 | ||||||
| 6 | On Nikkei 225 Index, Put expiring August 10, 2012 at 8000 |
12,755 | ||||||
| 9 | On S&P ASX 200 Index, OTC Put expiring June 21, 2012 at 3700(e) |
1,022 | ||||||
| 9 | On S&P ASX 200 Index, OTC Put expiring June 21, 2012 at 3900(e) |
2,663 | ||||||
| 9 | On S&P ASX 200 Index, OTC Put expiring July 19, 2012 at 3800(e) |
4,334 | ||||||
| 10 | On S&P ASX 200 Index, OTC Put expiring July 19, 2012 at 3950(e) |
7,993 | ||||||
| Index Options — continued | ||||||||
| 2 | On S&P ASX 200 Index, OTC Put expiring August 16, 2012 at 3700(e) |
$ | 1,130 | |||||
| 6 | On Swiss Market Index, Put expiring June 15, 2012 at 5400 |
415 | ||||||
| 6 | On Swiss Market Index, Put expiring June 15, 2012 at 5600 |
1,052 | ||||||
| 6 | On Swiss Market Index, Put expiring July 20, 2012 at 5400 |
2,893 | ||||||
| 6 | On Swiss Market Index, Put expiring July 20, 2012 at 5500 |
3,798 | ||||||
|
|
|
|||||||
| Total Purchased Options (Identified Cost $204,122) |
188,642 | |||||||
|
|
|
|||||||
| Principal Amount |
||||||||
| Short-Term Investments — 3.5% | ||||||||
| $ | 665,901 | Tri-Party Repurchase Agreement with Fixed Income Clearing Corporation, dated 5/31/2012 at 0.000% to be repurchased at $665,901 on 6/01/2012 collateralized by $665,000 U.S. Treasury Note,
1.250% due 10/31/2015 valued at $683,520 including accrued interest (Note 2 of Notes to Financial Statements) (Identified Cost $665,901) |
665,901 | |||||
|
|
|
|||||||
| Total Investments — 97.3% (Identified Cost $21,399,240)(a) |
18,592,715 | |||||||
| Other assets less liabilities — 2.7% | 515,430 | |||||||
|
|
|
|||||||
| Net Assets — 100.0% | $ | 19,108,145 | ||||||
|
|
|
|||||||
| Contracts | ||||||||
| Written Options — (1.5%) | ||||||||
| Index Options — (1.5%) | ||||||||
| 39 | On Euro STOXX 50 Index, OTC Call expiring June 15, 2012 at 2100(e) |
$ | (27,903 | ) | ||||
| 49 | On Euro STOXX 50 Index, OTC Call expiring June 15, 2012 at 2150(e) |
(19,136 | ) | |||||
| 39 | On Euro STOXX 50 Index, OTC Call expiring June 15, 2012 at 2250(e) |
(3,587 | ) | |||||
| 38 | On Euro STOXX 50 Index, OTC Call expiring July 20, 2012 at 2150(e) |
(34,616 | ) | |||||
| 47 | On Euro STOXX 50 Index, OTC Call expiring July 20, 2012 at 2200(e) |
(30,528 | ) | |||||
| 12 | On FTSE 100 Index, OTC Call expiring June 15, 2012 at 5300(e) |
(18,232 | ) | |||||
| 15 | On FTSE 100 Index, OTC Call expiring June 15, 2012 at 5500(e) |
(4,933 | ) | |||||
| 12 | On FTSE 100 Index, OTC Call expiring July 20, 2012 at 5300(e) |
(35,385 | ) | |||||
| 12 | On FTSE 100 Index, OTC Call expiring July 20, 2012 at 5350(e) |
(29,658 | ) | |||||
| 2 | On Hang Seng Index, OTC Call expiring June 28, 2012 at 19000(e) |
(3,772 | ) | |||||
| 2 | On Hang Seng Index, OTC Call expiring July 30, 2012 at 19200(e) |
(5,424 | ) | |||||
| 11 | On Nikkei 225 Index, OTC Call expiring June 08, 2012 at 8750(e) |
(3,297 | ) | |||||
| 12 | On Nikkei 225 Index, OTC Call expiring July 13, 2012 at 8750(e) |
(22,198 | ) | |||||
| 5 | On Nikkei 225 Index, OTC Call expiring July 13, 2012 at 9000(e) |
(4,781 | ) | |||||
| 10 | On Nikkei 225 Index, OTC Call expiring July 13, 2012 at 9250(e) |
(4,178 | ) | |||||
See accompanying notes to financial statements.
23 |
Table of Contents
Portfolio of Investments – as of May 31, 2012 (Unaudited)
Gateway International Fund – (continued)
| Contracts | Description | Value (†) | ||||||
| Index Options — continued | ||||||||
| 6 | On S&P ASX 200 Index, OTC Call expiring June 21, 2012 at 4050(e) |
$ | (4,983 | ) | ||||
| 5 | On S&P ASX 200 Index, OTC Call expiring June 21, 2012 at 4150(e) |
(1,794 | ) | |||||
| 9 | On S&P ASX 200 Index, OTC Call expiring June 21, 2012 at 4300(e) |
(668 | ) | |||||
| 9 | On S&P ASX 200 Index, OTC Call expiring July 19, 2012 at 4150(e) |
(6,860 | ) | |||||
| 10 | On S&P ASX 200 Index, OTC Call expiring July 19, 2012 at 4300(e) |
(2,777 | ) | |||||
| 6 | On Swiss Market Index, OTC Call expiring June 15, 2012 at 5850(e) |
(5,135 | ) | |||||
| 6 | On Swiss Market Index, OTC Call expiring June 15, 2012 at 5900(e) |
(3,640 | ) | |||||
| 6 | On Swiss Market Index, OTC Call expiring June 15, 2012 at 6100(e) |
(595 | ) | |||||
| 6 | On Swiss Market Index, OTC Call expiring July 20, 2012 at 5850(e) |
(10,033 | ) | |||||
|
|
|
|||||||
| Total Written Options (Premiums Received $513,993) |
$ | (284,113 | ) | |||||
|
|
|
|||||||
| (†) | See Note 2 of Notes to Financial Statements. | |||||||
| * | Common stocks are grouped by geographical regions that correspond to the markets underlying each of the indices on which the Fund writes call options and buys put options. | |||||||
| (a) | Federal Tax Information: | |||||||
| At May 31, 2012, the net unrealized depreciation on investments based on a cost of $21,399,240 for federal income tax purposes was as follows: | ||||||||
| Aggregate gross unrealized appreciation for all investments in which there is an excess of value over tax cost | $ | 40,410 | ||||||
| Aggregate gross unrealized depreciation for all investments in which there is an excess of tax cost over value | (2,846,935 | ) | ||||||
|
|
|
|||||||
| Net unrealized depreciation | $ | (2,806,525 | ) | |||||
|
|
|
|||||||
| (b) | All or a portion of this security has been designated to cover the Fund’s obligations under outstanding call options. | |||||||
| (c) | All or a portion of this security has been pledged as collateral for outstanding call options. | |||||||
| (d) | Non-income producing security. | |||||||
| (e) | Counterparty is UBS AG. | |||||||
| OTC | Over-the-Counter | |||||||
Industry Summary at May 31, 2012 (Unaudited)
| Commercial Banks |
10.1 | % | ||
| Pharmaceuticals |
9.2 | |||
| Oil, Gas & Consumable Fuels |
8.7 | |||
| Food Products |
5.2 | |||
| Metals & Mining |
5.0 | |||
| Chemicals |
3.4 | |||
| Insurance |
3.3 | |||
| Automobiles |
3.2 | |||
| Wireless Telecommunication Services |
3.2 | |||
| Machinery |
3.1 | |||
| Diversified Telecommunication Services |
2.6 | |||
| Beverages |
2.1 | |||
| Specialty Retail |
2.1 | |||
| Other Investments, less than 2% each |
32.6 | |||
| Short-Term Investments |
3.5 | |||
|
|
|
|||
| Total Investments |
97.3 | |||
| Other assets less liabilities (including open written options) |
2.7 | |||
|
|
|
|||
| Net Assets |
100.0 | % | ||
|
|
|
Country of Risk Summary at May 31, 2012 (Unaudited)
| Japan |
21.9 | % | ||
| United Kingdom |
19.5 | |||
| Germany |
10.4 | |||
| France |
10.0 | |||
| Australia |
8.3 | |||
| Switzerland |
7.7 | |||
| Netherlands |
4.4 | |||
| Spain |
3.3 | |||
| Italy |
3.1 | |||
| Other Investments, less than 2% each |
5.2 | |||
| Short-Term Investments |
3.5 | |||
|
|
|
|||
| Total Investments |
97.3 | |||
| Other assets less liabilities (including open written options) |
2.7 | |||
|
|
|
|||
| Net Assets |
100.0 | % | ||
|
|
|
Currency Exposure Summary at May 31, 2012 (Unaudited)
| Euro |
29.8 | % | ||
| British Pound |
22.7 | |||
| Japanese Yen |
22.3 | |||
| Australian Dollar |
8.3 | |||
| Swiss Franc |
7.9 | |||
| United States Dollar |
3.5 | |||
| Hong Kong Dollar |
2.8 | |||
|
|
|
|||
| Total Investments |
97.3 | |||
| Other assets less liabilities (including open written options) |
2.7 | |||
|
|
|
|||
| Net Assets |
100.0 | % | ||
|
|
|
See accompanying notes to financial statements.
| 24
Table of Contents
Portfolio of Investments – as of May 31, 2012 (Unaudited)
Loomis Sayles Capital Income Fund
| Shares |
Description | Value (†) | ||||||
| Common Stocks — 78.0% of Net Assets | ||||||||
| Aerospace & Defense — 3.1% | ||||||||
| 3,983 | Honeywell International, Inc. | $ | 221,694 | |||||
| 4,782 | Northrop Grumman Corp. | 280,942 | ||||||
|
|
|
|||||||
| 502,636 | ||||||||
|
|
|
|||||||
| Beverages — 3.7% | ||||||||
| 11,531 | Coca-Cola Enterprises, Inc. | 315,488 | ||||||
| 4,219 | PepsiCo, Inc. | 286,259 | ||||||
|
|
|
|||||||
| 601,747 | ||||||||
|
|
|
|||||||
| Capital Markets — 3.7% | ||||||||
| 9,974 | Bank of New York Mellon Corp. (The) | 203,071 | ||||||
| 1,188 | BlackRock, Inc. | 202,910 | ||||||
| 9,058 | Federated Investors, Inc., Class B | 181,975 | ||||||
|
|
|
|||||||
| 587,956 | ||||||||
|
|
|
|||||||
| Commercial Banks — 1.5% | ||||||||
| 4,038 | PNC Financial Services Group, Inc. | 248,014 | ||||||
|
|
|
|||||||
| Communications Equipment — 1.8% | ||||||||
| 6,009 | Motorola Solutions, Inc. | 288,913 | ||||||
|
|
|
|||||||
| Computers & Peripherals — 1.1% | ||||||||
| 314 | Apple, Inc.(b) | 181,407 | ||||||
|
|
|
|||||||
| Construction Materials — 1.4% | ||||||||
| 3,305 | Martin Marietta Materials, Inc. | 222,988 | ||||||
|
|
|
|||||||
| Diversified Consumer Services — 1.6% | ||||||||
| 16,794 | H&R Block, Inc. | 256,444 | ||||||
|
|
|
|||||||
| Diversified Financial Services — 1.6% | ||||||||
| 7,739 | JPMorgan Chase & Co. | 256,548 | ||||||
|
|
|
|||||||
| Diversified Telecommunication Services — 3.8% | ||||||||
| 5,857 | AT&T, Inc. | 200,134 | ||||||
| 6,996 | CenturyLink, Inc. | 274,383 | ||||||
| 3,221 | Verizon Communications, Inc. | 134,122 | ||||||
|
|
|
|||||||
| 608,639 | ||||||||
|
|
|
|||||||
| Electric Utilities — 3.3% | ||||||||
| 5,530 | FirstEnergy Corp. | 258,749 | ||||||
| 10,220 | PPL Corp. | 279,721 | ||||||
|
|
|
|||||||
| 538,470 | ||||||||
|
|
|
|||||||
| Energy Equipment & Services — 2.2% | ||||||||
| 3,895 | Diamond Offshore Drilling, Inc. | 226,611 | ||||||
| 3,233 | Transocean Ltd. | 132,004 | ||||||
|
|
|
|||||||
| 358,615 | ||||||||
|
|
|
|||||||
| Food & Staples Retailing — 1.6% | ||||||||
| 8,277 | Walgreen Co. | 252,614 | ||||||
|
|
|
|||||||
| Food Products — 2.2% | ||||||||
| 16,569 | Sara Lee Corp. | 346,292 | ||||||
|
|
|
|||||||
| Gas Utilities — 1.9% | ||||||||
| 6,906 | National Fuel Gas Co. | 298,547 | ||||||
|
|
|
|||||||
| Health Care Equipment & Supplies — 1.6% | ||||||||
| 4,986 | Baxter International, Inc. | 252,391 | ||||||
|
|
|
|||||||
| Household Durables — 1.1% | ||||||||
| 8,686 | Leggett & Platt, Inc. | 180,582 | ||||||
|
|
|
|||||||
| Industrial Conglomerates — 1.8% | ||||||||
| 15,526 | General Electric Co. | 296,391 | ||||||
|
|
|
|||||||
| Insurance — 2.9% | ||||||||
| 7,716 | MetLife, Inc. | 225,384 | ||||||
| 3,757 | Travelers Cos., Inc. (The) | 234,775 | ||||||
|
|
|
|||||||
| 460,159 | ||||||||
|
|
|
|||||||
| Shares |
Description | Value (†) | ||||||
| Machinery — 2.6% | ||||||||
| 5,927 | Eaton Corp. | $ | 252,846 | |||||
| 2,495 | Stanley Black & Decker, Inc. | 165,294 | ||||||
|
|
|
|||||||
| 418,140 | ||||||||
|
|
|
|||||||
| Media — 3.3% | ||||||||
| 9,264 | Comcast Corp., Class A | 267,822 | ||||||
| 5,447 | Viacom, Inc., Class B | 259,986 | ||||||
|
|
|
|||||||
| 527,808 | ||||||||
|
|
|
|||||||
| Multiline Retail — 1.3% | ||||||||
| 4,451 | Kohl’s Corp. | 203,945 | ||||||
|
|
|
|||||||
| Oil, Gas & Consumable Fuels — 6.1% | ||||||||
| 2,384 | Chevron Corp. | 234,371 | ||||||
| 4,621 | ExxonMobil Corp. | 363,349 | ||||||
| 6,388 | Regency Energy Partners L.P. | 137,470 | ||||||
| 5,774 | Total S.A., Sponsored ADR | 248,686 | ||||||
|
|
|
|||||||
| 983,876 | ||||||||
|
|
|
|||||||
| Pharmaceuticals — 8.7% | ||||||||
| 8,264 | Bristol-Myers Squibb Co. | 275,522 | ||||||
| 5,034 | GlaxoSmithKline PLC, Sponsored ADR | 222,050 | ||||||
| 8,416 | Merck & Co., Inc. | 316,273 | ||||||
| 14,673 | Pfizer, Inc. | 320,898 | ||||||
| 7,499 | Sanofi, ADR | 255,191 | ||||||
|
|
|
|||||||
| 1,389,934 | ||||||||
|
|
|
|||||||
| REITs — Diversified — 1.5% | ||||||||
| 11,857 | Weyerhaeuser Co. | 236,073 | ||||||
|
|
|
|||||||
| REITs — Warehouse/Industrials — 1.5% | ||||||||
| 7,315 | ProLogis, Inc. | 233,934 | ||||||
|
|
|
|||||||
| Road & Rail — 2.2% | ||||||||
| 5,479 | Norfolk Southern Corp. | 358,984 | ||||||
|
|
|
|||||||
| Semiconductors & Semiconductor Equipment — 1.5% | ||||||||
| 8,606 | Texas Instruments, Inc. | 245,099 | ||||||
|
|
|
|||||||
| Software — 1.8% | ||||||||
| 9,665 | Microsoft Corp. | 282,121 | ||||||
|
|
|
|||||||
| Specialty Retail — 1.4% | ||||||||
| 11,757 | American Eagle Outfitters, Inc. | 227,028 | ||||||
|
|
|
|||||||
| Thrifts & Mortgage Finance — 1.1% | ||||||||
| 15,053 | People’s United Financial, Inc. | 175,067 | ||||||
|
|
|
|||||||
| Tobacco — 1.4% | ||||||||
| 1,842 | Lorillard, Inc. | 227,671 | ||||||
|
|
|
|||||||
| Wireless Telecommunication Services — 1.7% | ||||||||
| 10,290 | Vodafone Group PLC, Sponsored ADR | 275,669 | ||||||
|
|
|
|||||||
| Total Common Stocks (Identified Cost $13,223,870) |
12,524,702 | |||||||
|
|
|
|||||||
| Principal Amount (‡) |
||||||||
| Bonds and Notes — 18.0% | ||||||||
| Non-Convertible Bonds —17.4% | ||||||||
| Banking — 3.6% | ||||||||
| $ | 300,000 | BNP Paribas S.A., (fixed rate to 6/25/2037, variable rate thereafter), | ||||||
| 7.195%, 6/29/2049, 144A | 243,750 | |||||||
| 100,000 | Morgan Stanley, | |||||||
| 8.000%, 5/09/2017, (AUD) | 102,378 | |||||||
| 280,000 | Royal Bank of Scotland Group PLC, | |||||||
| 4.700%, 7/03/2018 | 235,348 | |||||||
|
|
|
|||||||
| 581,476 | ||||||||
|
|
|
|||||||
See accompanying notes to financial statements.
25 |
Table of Contents
Portfolio of Investments – as of May 31, 2012 (Unaudited)
Loomis Sayles Capital Income Fund – (continued)
| Principal Amount (‡) |
Description | Value (†) | ||||||
| Brokerage — 0.8% | ||||||||
| $ | 125,000 | Jefferies Group, Inc., 6.875%, 4/15/2021 |
$ | 120,625 | ||||
|
|
|
|||||||
| Electric — 2.2% | ||||||||
| 400,000 | EDP Finance BV, | |||||||
| 6.000%, 2/02/2018, 144A | 352,152 | |||||||
|
|
|
|||||||
| Government Sponsored — 1.3% | ||||||||
| 240,000 | Eksportfinans ASA, | |||||||
| 2.000%, 9/15/2015 | 215,507 | |||||||
|
|
|
|||||||
| Healthcare — 0.7% | ||||||||
| 125,000 | HCA, Inc., | |||||||
| 7.500%, 12/15/2023 | 118,750 | |||||||
|
|
|
|||||||
| Home Construction — 1.6% | ||||||||
| 300,000 | Beazer Homes USA, Inc., | |||||||
| 9.125%, 6/15/2018 | 250,500 | |||||||
|
|
|
|||||||
| Media Non-Cable — 0.9% | ||||||||
| 150,000 | R.R. Donnelley & Sons Co., | |||||||
| 8.250%, 3/15/2019 | 142,875 | |||||||
|
|
|
|||||||
| Non-Captive Consumer — 1.3% | ||||||||
| 250,000 | SLM Corp., Series A, MTN, | |||||||
| 5.625%, 8/01/2033 | 201,250 | |||||||
|
|
|
|||||||
| Retailers — 0.6% | ||||||||
| 125,000 | J.C. Penney Corp., Inc., | |||||||
| 6.375%, 10/15/2036 | 96,562 | |||||||
|
|
|
|||||||
| Supermarket — 1.9% | ||||||||
| 400,000 | New Albertson’s, Inc., | |||||||
| 8.000%, 5/01/2031 | 307,000 | |||||||
|
|
|
|||||||
| Wirelines — 2.5% | ||||||||
| 100,000 | Level 3 Financing, Inc., | |||||||
| 8.125%, 7/01/2019 | 100,000 | |||||||
| 400,000 | Telecom Italia Capital S.A., | |||||||
| 6.000%, 9/30/2034 | 308,000 | |||||||
|
|
|
|||||||
| 408,000 | ||||||||
|
|
|
|||||||
| Total Non-Convertible Bonds (Identified Cost $2,908,429) |
2,794,697 | |||||||
|
|
|
|||||||
| Convertible Bonds — 0.6% | ||||||||
| Independent Energy — 0.6% | ||||||||
| 100,000 | Chesapeake Energy Corp., 2.750%, 11/15/2035 |
|||||||
| (Identified Cost $90,615) | 88,375 | |||||||
|
|
|
|||||||
| Total Bonds and Notes (Identified Cost $2,999,044) |
2,883,072 | |||||||
|
|
|
|||||||
| Shares | ||||||||
| Preferred Stocks — 0.6% | ||||||||
| Banking — 0.6% | ||||||||
| 4,050 | Citigroup Capital XII, (fixed rate to 3/30/2015, variable rate thereafter), | |||||||
| 8.500% | ||||||||
| (Identified Cost $104,004) | 104,490 | |||||||
|
|
|
|||||||
| Short-Term Investments — 8.1% | ||||||||
| $ | 1,297,172 | Tri-Party Repurchase Agreement with Fixed Income Clearing Corporation, dated 5/31/2012 at 0.000% to be repurchased at $1,297,172 on 6/01/2012 collateralized by $1,165,000 Federal Home Loan Mortgage Corp., 4.750% due 11/17/2015 valued at $1,326,644 including accrued interest (Note 2 of Notes to Financial Statements) (Identified Cost $1,297,172) | 1,297,172 | |||||
|
|
|
|||||||
| Total Investments — 104.7% | ||||||||
| (Identified Cost $17,624,090)(a) | 16,809,436 | |||||||
| Other assets less liabilities — (4.7)% | (760,118 | ) | ||||||
|
|
|
|||||||
| Net Assets — 100.0% | $ | 16,049,318 | ||||||
|
|
|
|||||||
| (‡) | Principal Amount stated in U.S. dollars unless otherwise noted. | |||||||
| (†) | See Note 2 of Notes to Financial Statements. | |||||||
| (a) | Federal Tax Information (Amortization of premium on debt securities is excluded for tax purposes.): | |||||||
| At May 31, 2012, the net unrealized depreciation on investments based on a cost of $17,624,109 for federal income tax purposes was as follows: | ||||||||
| Aggregate gross unrealized appreciation for all investments in which there is an excess of value over tax cost | $ | 115,974 | ||||||
| Aggregate gross unrealized depreciation for all investments in which there is an excess of tax cost over value | (930,647 | ) | ||||||
|
|
|
|||||||
| Net unrealized depreciation | $ | (814,673 | ) | |||||
|
|
|
|||||||
| (b) | Non-income producing security. | |||||||
| 144A | All or a portion of these securities are exempt from registration under Rule 144A of the Securities Act of 1933. These securities may be resold in transactions exempt from registration, normally to qualified institutional buyers. At May 31, 2012, the value of Rule 144A holdings amounted to $595,902 or 3.7% of net assets. | |||||||
| ADR | An American Depositary Receipt is a certificate issued by a custodian bank representing the right to receive securities of the foreign issuer described. The values of ADRs may be significantly influenced by trading on exchanges not located in the United States. | |||||||
| MTN | Medium Term Note | |||||||
| REITs | Real Estate Investment Trusts | |||||||
| AUD | Australian Dollar | |||||||
Industry Summary at May 31, 2012 (Unaudited)
| Pharmaceuticals |
8.7 | % | ||
| Oil, Gas & Consumable Fuels |
6.1 | |||
| Banking |
4.2 | |||
| Diversified Telecommunication Services |
3.8 | |||
| Beverages |
3.7 | |||
| Capital Markets |
3.7 | |||
| Electric Utilities |
3.3 | |||
| Media |
3.3 | |||
| Aerospace & Defense |
3.1 | |||
| Insurance |
2.9 | |||
| Machinery |
2.6 | |||
| Wirelines |
2.5 | |||
| Road & Rail |
2.2 | |||
| Energy Equipment & Services |
2.2 | |||
| Electric |
2.2 | |||
| Food Products |
2.2 | |||
| Other Investments, less than 2% each |
39.9 | |||
| Short-Term Investments |
8.1 | |||
|
|
|
|||
| Total Investments |
104.7 | |||
| Other assets less liabilities |
(4.7 | ) | ||
|
|
|
|||
| Net Assets |
100.0 | % | ||
|
|
|
See accompanying notes to financial statements.
| 26
Table of Contents
Portfolio of Investments – as of May 31, 2012 (Unaudited)
Loomis Sayles Senior Floating Rate and Fixed Income Fund
| Principal Amount |
Description | Value (†) | ||||||
| Senior Loans — 83.9% of Net Assets | ||||||||
| Aerospace & Defense — 1.7% | ||||||||
| $ | 450,000 | Camp Systems International, Inc., New 2nd Lien Term Loan, 11/30/2019(b) |
$ | 449,437 | ||||
| 200,000 | PRV Aerospace LLC, Term Loan B, 5/10/2018(b) |
199,000 | ||||||
| 237,350 | Wyle Services Corporation, Term Loan B, 5.000%, 3/27/2017(c) |
234,383 | ||||||
|
|
|
|||||||
| 882,820 | ||||||||
|
|
|
|||||||
| Automotive — 3.7% | ||||||||
| 145,825 | August LuxUK Holding Company S.A.R.L., Luxco Term Loan, 6.250%, 4/27/2018(c) |
146,189 | ||||||
| 112,175 | August U.S. Holding Company, Inc., Term Loan B, 6.250%, 4/27/2018(c) | 112,456 | ||||||
| 289,312 | Diversified Machine, Inc., Term Loan B, 9.250%, 12/01/2016(c) |
284,611 | ||||||
| 373,000 | Grede LLC, Term Loan B, 7.000%, 4/03/2017(c) |
368,338 | ||||||
| 364,734 | HHI Holdings LLC, New Term Loan B, 7.002%, 3/21/2017(d) |
363,366 | ||||||
| 199,000 | Stackpole Powertrain International USA LLC, Term Loan B, 7.500%, 8/02/2017(c) |
197,756 | ||||||
| 478,872 | TI Automotive Limited, New Term Loan, 6.750%, 3/14/2018(c) |
473,686 | ||||||
|
|
|
|||||||
| 1,946,402 | ||||||||
|
|
|
|||||||
| Banking — 1.3% | ||||||||
| 590,972 | Clarke American Corp., Term Loan B, 6/30/2014(b) |
537,294 | ||||||
| 154,613 | US FT Holdco, Inc., Term Loan B, 7.500%, 11/30/2017(c) |
153,968 | ||||||
|
|
|
|||||||
| 691,262 | ||||||||
|
|
|
|||||||
| Building Materials — 0.9% | ||||||||
| 198,492 | CPG International, Inc., New Term Loan B, 6.000%, 2/18/2017(c) |
191,049 | ||||||
| 252,000 | Roofing Supply Group LLC, Term Loan, 5/24/2019(b) |
251,370 | ||||||
|
|
|
|||||||
| 442,419 | ||||||||
|
|
|
|||||||
| Chemicals — 5.8% | ||||||||
| 412,311 | Ascend Performance Materials LLC, Term Loan B, 6.750%, 4/10/2018(c) | 400,630 | ||||||
| 169,864 | AZ Chem US, Inc., Recap Term Loan, 7.250%, 12/22/2017(c) |
170,217 | ||||||
| 340,000 | Emerald Performance Materials LLC, Term Loan B, 7.750%, 5/18/2018(c) | 336,600 | ||||||
| 342,000 | Ineos US Finance LLC, 6 year Term Loan, 5/04/2018(b) | 334,975 | ||||||
| 347,368 | Nexeo Solutions LLC, Term Loan B, 5.023%, 9/08/2017(d) |
338,250 | ||||||
| 407,830 | PetroLogistics L.P., Term Loan B, 7.000%, 3/23/2017(c) |
402,732 | ||||||
| 425,000 | PQ Corporation, 2nd Lien Term Loan, 6.739%, 7/30/2015(c) |
398,370 | ||||||
| 441,000 | Taminco Global Chemical Corporation, Term Loan B1, 5.250%, 2/15/2019(c) | 439,126 | ||||||
| 230,730 | Univar, Inc., Term Loan B, 5.000%, 6/30/2017(c) |
224,212 | ||||||
|
|
|
|||||||
| 3,045,112 | ||||||||
|
|
|
|||||||
| Consumer Cyclical Services — 3.9% | ||||||||
| $ | 450,000 | AlixPartners LLP, 2nd Lien Term Loan, 11/29/2019(b) |
$ | 438,750 | ||||
| 297,413 | Catalina Marketing Corporation, Extended Term Loan B, 5.739%, 9/29/2017(c) |
285,517 | ||||||
| 130,345 | Go Daddy Operating Company LLC, New Term Loan, 5.500%, 12/17/2018(c) | 127,901 | ||||||
| 250,000 | Language Line LLC, 2nd Lien Term Loan, 10.500%, 12/20/2016(c) |
245,938 | ||||||
| 111,000 | Monitronics International, Inc., Term Loan B, 5.500%, 3/16/2018(c) |
109,751 | ||||||
| 447,750 | SourceHov LLC, 1st Lien Term Loan, 6.625%, 4/28/2017(c) |
425,922 | ||||||
| 271,693 | SRA International, Inc., Term Loan B, 6.500%, 7/20/2018(c) |
264,900 | ||||||
| 160,000 | Sterling Infosystems, Inc., Term Loan A, 7.269%, 2/01/2018(d) |
158,000 | ||||||
|
|
|
|||||||
| 2,056,679 | ||||||||
|
|
|
|||||||
| Consumer Products — 2.0% | ||||||||
| 300,000 | Advantage Sales & Marketing, Inc., 2nd Lien Term Loan, 9.250%, 6/18/2018(c) |
298,500 | ||||||
| 58,400 | Freedom Group, Inc., Term Loan, 5.500%, 4/12/2019(c) |
58,181 | ||||||
| 282,000 | HMK Intermediate Holdings LLC, Term Loan, 7.250%, 3/29/2019(c) |
281,648 | ||||||
| 400,000 | SRAM LLC, 2nd Lien Term Loan, 8.500%, 12/07/2018(c) |
400,000 | ||||||
|
|
|
|||||||
| 1,038,329 | ||||||||
|
|
|
|||||||
| Diversified Manufacturing — 1.4% | ||||||||
| 400,000 | Douglas Dynamics Holdings, Inc., New Term Loan, 5.750%, 4/18/2018(c) | 393,332 | ||||||
| 346,658 | Edwards (Cayman Islands II) Limited, Extended 1st Lien Term Loan, 5.500%, 5/31/2016(c) |
342,976 | ||||||
|
|
|
|||||||
| 736,308 | ||||||||
|
|
|
|||||||
| Electric — 0.5% | ||||||||
| 235,290 | Mirion Technologies, Inc., 1st Lien Term Loan, 6.250%, 3/30/2018(c) |
233,525 | ||||||
|
|
|
|||||||
| Entertainment — 0.9% | ||||||||
| 248,116 | Clubcorp Club Operations, Inc., Term Loan B, 6.000%, 11/30/2016(c) |
248,942 | ||||||
| 210,000 | EMI Music Publishing Limited, Term Loan B, 11/14/2017(b) | 208,687 | ||||||
|
|
|
|||||||
| 457,629 | ||||||||
|
|
|
|||||||
| Financial Other — 2.0% | ||||||||
| 260,000 | Hamilton Lane Advisors LLC, Term Loan, 6.500%, 2/28/2018(c) |
258,700 | ||||||
| 352,916 | Harbourvest Partners LLC, Term Loan B, 6.250%, 12/16/2016(c) |
352,916 | ||||||
| 435,000 | Nuveen Investments, Inc., New 2nd Lien Term Loan, 8.250%, 2/28/2019(c) | 437,584 | ||||||
|
|
|
|||||||
| 1,049,200 | ||||||||
|
|
|
|||||||
| Food & Beverage — 2.0% | ||||||||
| 459,000 | DS Waters Enterprises, L.P., 1st Lien Term Loan, 10.500%, 8/29/2017(c) | 460,721 | ||||||
| 199,500 | Milk Specialties Company, Term Loan B, 8.500%, 12/23/2017(c) |
197,505 | ||||||
| 400,000 | Wm. Bolthouse Farms, Inc., New 2nd Lien Term Loan, 9.500%, 8/11/2016(c) | 400,600 | ||||||
|
|
|
|||||||
| 1,058,826 | ||||||||
|
|
|
|||||||
See accompanying notes to financial statements.
27 |
Table of Contents
Portfolio of Investments – as of May 31, 2012 (Unaudited)
Loomis Sayles Senior Floating Rate and Fixed Income Fund – (continued)
| Principal Amount |
Description | Value (†) | ||||||
| Gaming — 0.5% | ||||||||
| $ | 269,000 | Tropicana Entertainment, Inc., Term Loan B, 7.500%, 3/16/2018(c) |
$ | 265,301 | ||||
|
|
|
|||||||
| Healthcare — 9.1% | ||||||||
| 90,000 | AMN Healthcare, Inc., New Term Loan B, 6.500%, 4/05/2018(c) |
90,338 | ||||||
| 299,126 | ATI Physical Therapy, Term Loan, 7.500%, 3/11/2016(c) |
292,643 | ||||||
| 352,000 | Bausch & Lomb, Inc., Term Loan B, 5/17/2019(b) |
345,650 | ||||||
| 389,147 | Convatec, Inc., Term Loan, 5.750%, 12/22/2016(c) |
386,131 | ||||||
| 466,000 | DJO Finance LLC, Term Loan B3, 6.250%, 9/15/2017(c) |
460,371 | ||||||
| 297,583 | Education Management LLC, Extended Term Loan C2, 4.500%, 6/01/2016(c) | 262,617 | ||||||
| 299,250 | National Healing Corporation, 1st Lien Term Loan, 8.250%, 11/30/2017(c) | 296,258 | ||||||
| 180,000 | Physiotherapy Associates Holdings, Inc., 1st Lien Term Loan, 6.000%, 4/30/2018(c) |
178,799 | ||||||
| 350,000 | PLATO Learning, Inc., 2nd Lien Term Loan, 11.250%, 5/09/2019(c) |
344,750 | ||||||
| 400,000 | Press Ganey Associates, Inc., 2nd Lien Term Loan, 8.250%, 10/18/2018(c) | 401,000 | ||||||
| 400,000 | Sheridan Holdings, Inc., 2nd Lien Term Loan, 5.989%, 6/15/2015(c) |
387,500 | ||||||
| 297,750 | Surgical Care Affiliates, Inc., Incremental Term Loan B, 5.500%, 6/29/2018(c) |
290,803 | ||||||
| 295,000 | United Surgical Partners International, Inc., Incremental Term Loan, 6.000%, 4/03/2019(c) |
292,050 | ||||||
| 397,000 | Valitas Health Services, Inc., Term Loan B, 5.750%, 6/02/2017(c) |
389,060 | ||||||
| 337,000 | Wolverine Healthcare, Term Loan B, 6/06/2019(b) |
331,524 | ||||||
|
|
|
|||||||
| 4,749,494 | ||||||||
|
|
|
|||||||
| Industrial Other — 3.8% | ||||||||
| 454,000 | Brickman Group Holdings, Inc., New Term Loan B, 10/14/2016(b) |
452,865 | ||||||
| 522,000 | Generac Power Systems, Inc., New Term Loan B, 5/22/2018(b) |
516,127 | ||||||
| 300,000 | Hupah Finance, Inc., Term Loan B, 6.250%, 1/21/2019(c) |
300,939 | ||||||
| 300,000 | ON Assignment, Inc., Term Loan B, 5/15/2019(b) |
296,625 | ||||||
| 91,500 | Schaeffler AG, USD Term Loan C2, 6.000%, 1/27/2017(c) |
91,043 | ||||||
| 299,250 | Unifrax Corporation, New Term Loan, 6.500%, 11/28/2018(c) |
301,246 | ||||||
|
|
|
|||||||
| 1,958,845 | ||||||||
|
|
|
|||||||
| Media Cable — 0.5% | ||||||||
| 272,750 | Crown Media Holdings, Inc., Term Loan B, 5.750%, 7/14/2018(c) |
272,409 | ||||||
|
|
|
|||||||
| Media Non-Cable — 4.8% | ||||||||
| 398,792 | Cumulus Media, Inc., First Lien Term Loan, 5.750%, 9/17/2018(c) |
395,678 | ||||||
| 887,034 | Dex Media West LLC, New Term Loan, 7.250%, 10/24/2014(c) |
542,865 | ||||||
| 114,400 | Entercom Radio LLC, Term Loan B, 6.250%, 11/23/2018(c) |
114,209 | ||||||
| 300,000 | Hubbard Radio LLC, 2nd Lien Term Loan, 8.750%, 4/30/2018(c) |
300,501 | ||||||
| Media Non-Cable — continued | ||||||||
| $ | 1,005,030 | SuperMedia, Inc., Exit Term Loan, 11.000%, 12/31/2015(c) |
$ | 571,862 | ||||
| 650,000 | Univision Communications, Inc., Extended Term Loan, 4.489%, 3/31/2017(c) |
595,647 | ||||||
|
|
|
|||||||
| 2,520,762 | ||||||||
|
|
|
|||||||
| Metals & Mining — 3.9% | ||||||||
| 639,000 | Arch Coal, Inc., Term Loan B, 5.750%, 5/16/2018(c) |
619,830 | ||||||
| 300,000 | Fairmount Minerals Ltd., New Term Loan B, 5.250%, 3/15/2017(c) |
294,750 | ||||||
| 130,000 | Noranda Aluminum Acquisition Corporation, New Term Loan B, 5.750%, 2/24/2019(c) |
130,055 | ||||||
| 19,286 | Phoenix Services LLC, Delayed Draw Term Loan, 9.000%, 9/29/2017(c) |
19,286 | ||||||
| 199,290 | Phoenix Services LLC, Term Loan B, 9.000%, 9/29/2017(c) |
199,290 | ||||||
| 473,813 | Preferred Sands Holding Company LLC, Term Loan B, 7.500%, 12/15/2016(c) |
461,967 | ||||||
| 302,000 | Tube City IMS Corporation, Term Loan, 5.750%, 3/20/2019(c) |
301,245 | ||||||
|
|
|
|||||||
| 2,026,423 | ||||||||
|
|
|
|||||||
| Non-Captive Diversified — 0.8% | ||||||||
| 434,000 | Flying Fortress, Inc., 1st Lien Term Loan, 5.000%, 6/30/2017(c) |
432,915 | ||||||
|
|
|
|||||||
| Oil Field Services — 0.6% | ||||||||
| 144,770 | Utex Industries, Inc., New Term Loan B, 7.750%, 12/15/2016(c) |
143,504 | ||||||
| 191,153 | Utex Industries, Inc., Term Loan B, 7.010%, 12/15/2016(d) |
189,480 | ||||||
|
|
|
|||||||
| 332,984 | ||||||||
|
|
|
|||||||
| Packaging — 1.1% | ||||||||
| 341,109 | Husky Injection Molding Systems Ltd., Senior Debt B, 6.500%, 6/29/2018(c) |
338,550 | ||||||
| 225,000 | TricorBraun, Inc., New Term Loan B, 5.500%, 5/03/2018(c) |
224,550 | ||||||
|
|
|
|||||||
| 563,100 | ||||||||
|
|
|
|||||||
| Paper — 1.3% | ||||||||
| 250,000 | Hoffmaster Group, Inc., 2nd Lien Term Loan, 11.000%, 1/03/2019(c) |
250,000 | ||||||
| 400,000 | NewPage Corporation, DIP Term Loan, 8.000%, 3/07/2013(c) |
403,168 | ||||||
|
|
|
|||||||
| 653,168 | ||||||||
|
|
|
|||||||
| Pharmaceuticals — 3.0% | ||||||||
| 322,873 | Inc Research, Inc., Term Loan B, 7.000%, 7/12/2018(c) |
319,645 | ||||||
| 297,750 | inVentiv Health, Inc., Incremental Term Loan B3, 6.750%, 5/15/2018(c) |
282,490 | ||||||
| 399,390 | Pharmaceutical Product Development, Inc., Term Loan B, 6.250%, 12/05/2018(c) |
399,461 | ||||||
| 595,500 | Quintiles Transnational Corp., New Term Loan B, 5.000%, 6/08/2018(c) |
586,383 | ||||||
|
|
|
|||||||
| 1,587,979 | ||||||||
|
|
|
|||||||
| Pipelines — 1.8% | ||||||||
| 482,000 | Energy Transfer Equity, L.P., New Term Loan B, 3.750%, 3/21/2017(c) |
467,940 | ||||||
| 470,000 | NGPL PipeCo LLC, Term Loan B, 7.750%, 9/15/2017(c) |
459,035 | ||||||
|
|
|
|||||||
| 926,975 | ||||||||
|
|
|
|||||||
See accompanying notes to financial statements.
| 28
Table of Contents
Portfolio of Investments – as of May 31, 2012 (Unaudited)
Loomis Sayles Senior Floating Rate and Fixed Income Fund – (continued)
| Principal Amount |
Description | Value (†) | ||||||
| Property & Casualty Insurance — 2.4% | ||||||||
| $ | 385,000 | AmWINS Group, Inc., New 2nd Lien Term Loan, 12/06/2019(b) | $ | 377,300 | ||||
| 400,000 | Applied Systems, Inc., 2nd Lien Term Loan, 9.250%, 6/08/2017(c) |
397,332 | ||||||
| 496,233 | Vertafore, Inc., Term Loan, 5.250%, 7/29/2016(c) |
491,271 | ||||||
|
|
|
|||||||
| 1,265,903 | ||||||||
|
|
|
|||||||
| Restaurants — 0.9% | ||||||||
| 415,000 | Landry’s, Inc., Term Loan B, 6.500%, 4/24/2018(c) |
412,095 | ||||||
| 55,214 | NPC International, Inc., Term Loan B, 5.250%, 12/28/2018(c) |
55,076 | ||||||
|
|
|
|||||||
| 467,171 | ||||||||
|
|
|
|||||||
| Retailers — 2.6% | ||||||||
| 300,000 | BJ’s Wholesale Club, Inc., 2nd Lien Term Loan, 10.000%, 3/29/2019(c) |
306,999 | ||||||
| 600,000 | Harbor Freight Tools USA, Inc., Term Loan B, 11/14/2017(b) | 594,300 | ||||||
| 450,000 | RGIS Services LLC, Add on Term Loan, 10/18/2017(b) |
446,625 | ||||||
|
|
|
|||||||
| 1,347,924 | ||||||||
|
|
|
|||||||
| Supermarkets — 1.1% | ||||||||
| 293,798 | Acosta, Inc., Term Loan, 4.750%, 3/01/2018(c) |
289,831 | ||||||
| 297,744 | Sprouts Farmers Markets Holdings LLC, Term Loan, 6.000%, 4/18/2018(c) |
293,651 | ||||||
|
|
|
|||||||
| 583,482 | ||||||||
|
|
|
|||||||
| Technology — 11.7% | ||||||||
| 282,748 | Aspect Software, Inc., New Term Loan B, 6.250%, 5/06/2016(c) |
280,568 | ||||||
| 200,000 | Blackboard, Inc., 2nd Lien Term Loan, 11.500%, 4/04/2019(c) |
184,250 | ||||||
| 279,700 | Blackboard, Inc., Term Loan B, 7.500%, 10/04/2018(c) |
266,590 | ||||||
| 329,886 | Eastman Kodak Company, DIP Term Loan B, 8.500%, 7/19/2013(c) |
329,784 | ||||||
| 540,000 | EIG Investors Corp., New Term Loan B, 7.750%, 4/20/2018(c) |
537,748 | ||||||
| 600,000 | First Data Corporation, Extended Term Loan B, 4.239%, 3/23/2018(c) |
542,034 | ||||||
| 400,000 | Freescale Semiconductor, Inc., Extended Term Loan B, 4.489%, 12/01/2016(c) |
374,832 | ||||||
| 150,000 | Genesys Telecom Holdings, U.S., Inc., Term Loan B, 6.750%, 1/31/2019(c) |
149,813 | ||||||
| 161,000 | Hyland Software, Inc., New Term Loan B, 6.000%, 12/19/2016(c) |
159,994 | ||||||
| 400,000 | Kronos, Inc., 2nd Lien Tranche B1, 10.579%, 6/11/2018(c) |
404,000 | ||||||
| 161,000 | Lawson Software, Inc., Term Loan B, 6.250%, 4/05/2018(c) |
160,684 | ||||||
| 434,000 | Nxp B.V., Incremental Term Loan B, 5.250%, 3/19/2019(c) |
424,595 | ||||||
| 209,475 | Openlink International Intermediate, Inc., Initial Term Loan, 7.752%, 10/30/2017(d) |
209,999 | ||||||
| 400,000 | Rocket Software, Inc., 2nd Lien Term Loan, 10.250%, 2/08/2019(c) |
398,668 | ||||||
| 386,000 | Shield Finance Co. S.A.R.L, New Term Loan B, 5/03/2019(b) | 378,763 | ||||||
| Technology — continued | ||||||||
| $ | 300,000 | Ship US Bidco, Inc., New Term Loan B2A, 5.250%, 11/30/2017(c) |
$ | 299,625 | ||||
| 74,812 | Telx Group, Inc., Incremental Term Loan, 7.750%, 9/26/2017(c) |
74,485 | ||||||
| 248,750 | Telx Group, Inc., Term Loan B, 7.750%, 9/26/2017(c) |
247,663 | ||||||
| 300,000 | Wall Street Systems, Inc., 2nd Lien Term Loan, 9.000%, 6/20/2018(c) |
297,000 | ||||||
| 400,000 | Web.com Group, Inc., 2nd Lien Term Loan, 11.000%, 10/26/2018(c) |
400,000 | ||||||
|
|
|
|||||||
| 6,121,095 | ||||||||
|
|
|
|||||||
| Transportation Services — 1.2% | ||||||||
| 357,000 | Road Infrastucture Investment LLC, Term Loan B, 6.250%, 3/30/2018(c) | 351,645 | ||||||
| 290,000 | Wabash National Corporation, Term Loan B, 6.000%, 5/02/2019(c) |
287,100 | ||||||
|
|
|
|||||||
| 638,745 | ||||||||
|
|
|
|||||||
| Utility Other — 0.6% | ||||||||
| 300,000 | Sensus USA, Inc., 2nd Lien Term Loan, 8.500%, 5/09/2018(c) |
297,000 | ||||||
|
|
|
|||||||
| Wireless — 1.9% | ||||||||
| 600,000 | Asurion LLC, New 2nd Lien Term Loan, 9.000%, 5/24/2019(c) |
602,628 | ||||||
| 400,000 | Hawaiian Telcom Communications, Inc., Term Loan B, 7.000%, 2/28/2017(c) |
394,500 | ||||||
|
|
|
|||||||
| 997,128 | ||||||||
|
|
|
|||||||
| Wirelines — 4.2% | ||||||||
| 378,378 | Covad Communications Group, Term Loan, 12.000%, 11/03/2015(c) |
378,378 | ||||||
| 648,750 | FairPoint Communications, Inc., New Term Loan B, 6.500%, 1/22/2016(c) |
541,369 | ||||||
| 500,000 | Global Tel*Link Corporation, New Term Loan B, 6.000%, 12/14/2017(c) |
497,500 | ||||||
| 396,992 | Sidera Networks, Inc., Term Loan, 6.000%, 8/26/2016(c) |
388,557 | ||||||
| 423,649 | U.S. Telepacific Corporation, New Term Loan B, 5.750%, 2/23/2017(c) |
398,759 | ||||||
|
|
|
|||||||
| 2,204,563 | ||||||||
|
|
|
|||||||
| Total Senior Loans (Identified Cost $43,484,358) |
43,851,877 | |||||||
|
|
|
|||||||
| Bonds and Notes — 9.3% | ||||||||
| Airlines — 0.8% | ||||||||
| 400,000 | Continental Airlines, Inc., 6.750%, 9/15/2015, 144A |
403,000 | ||||||
|
|
|
|||||||
| Chemicals — 0.8% | ||||||||
| 400,000 | Momentive Performance Materials, Inc., 12.500%, 6/15/2014 |
419,000 | ||||||
|
|
|
|||||||
| Entertainment — 0.6% | ||||||||
| 293,000 | AMC Entertainment, Inc., 8.000%, 3/01/2014 |
293,732 | ||||||
|
|
|
|||||||
| Food & Beverage — 0.5% | ||||||||
| 300,000 | Chiquita Brands International, Inc., 7.500%, 11/01/2014 |
282,000 | ||||||
|
|
|
|||||||
| Gaming — 0.6% | ||||||||
| 300,000 | MGM Resorts International, 7.625%, 1/15/2017 |
303,375 | ||||||
|
|
|
|||||||
| Healthcare — 1.0% | ||||||||
| 500,000 | Alere, Inc., 9.000%, 5/15/2016 |
500,000 | ||||||
|
|
|
|||||||
See accompanying notes to financial statements.
29 |
Table of Contents
Portfolio of Investments – as of May 31, 2012 (Unaudited)
Loomis Sayles Senior Floating Rate and Fixed Income Fund – (continued)
| Principal Amount |
Description | Value (†) | ||||||
| Media Non-Cable — 1.4% | ||||||||
| $ | 425,000 | Clear Channel Communications, Inc., 5.500%, 9/15/2014 |
$ | 363,375 | ||||
| 400,000 | Intelsat Luxembourg S.A., 11.250%, 2/04/2017 |
393,000 | ||||||
|
|
|
|||||||
| 756,375 | ||||||||
|
|
|
|||||||
| Oil Field Services — 1.6% | ||||||||
| 400,000 | Global Geophysical Services, Inc., 10.500%, 5/01/2017 |
390,000 | ||||||
| 400,000 | McJunkin Red Man Corp., 9.500%, 12/15/2016 |
428,000 | ||||||
|
|
|
|||||||
| 818,000 | ||||||||
|
|
|
|||||||
| Property & Casualty Insurance — 0.5% | ||||||||
| 300,000 | White Mountains Re Group Ltd., (fixed rate to 6/30/2017, variable rate thereafter), 7.506%, 5/29/2049, 144A |
284,133 | ||||||
|
|
|
|||||||
| Technology — 0.8% | ||||||||
| 400,000 | Lender Processing Services, Inc., 8.125%, 7/01/2016 |
416,000 | ||||||
|
|
|
|||||||
| Wirelines — 0.7% | ||||||||
| 400,000 | Integra Telecom Holdings, Inc., 10.750%, 4/15/2016, 144A |
383,000 | ||||||
|
|
|
|||||||
| Total Bonds and Notes (Identified Cost $4,858,151) |
4,858,615 | |||||||
|
|
|
|||||||
| Short-Term Investments — 14.0% | ||||||||
| 526,462 | Repurchase Agreement with State Street Bank and Trust Company, dated 5/31/2012 at 0.000% to be repurchased at $526,462 on 6/01/2012 collateralized by $433,100 U.S. Treasury Bond, 3.750% due 8/15/2041 valued at $535,954 including accrued interest (Note 2 of Notes to Financial Statements) | 526,462 | ||||||
| 6,820,536 | Tri-Party Repurchase Agreement with Fixed Income Clearing Corporation, dated 5/31/2012 at 0.000% to be repurchased at $6,820,536 on 6/01/2012 collateralized by $6,770,000 U.S. Treasury Note, 1.250% due 10/31/2015 valued at $6,958,545 including accrued interest (Note 2 of Notes to Financial Statements) | 6,820,536 | ||||||
|
|
|
|||||||
| Total Short-Term Investments (Identified Cost $7,346,998) |
7,346,998 | |||||||
|
|
|
|||||||
| Total Investments — 107.2% (Identified Cost $55,689,507)(a) |
56,057,490 | |||||||
| Other assets less liabilities — (7.2)% | (3,764,215 | ) | ||||||
|
|
|
|||||||
| Net Assets — 100.0% | $ | 52,293,275 | ||||||
|
|
|
|||||||
| (†) | See Note 2 of Notes to Financial Statements. | |||||||
| (a) | Federal Tax Information (Amounts exclude certain adjustments made at the end of the Fund’s fiscal year for tax purposes. Such adjustments are primarily due to wash sales. Amortization of premium on debt securities is excluded for tax purposes.): | |||||||
| At May 31, 2012, the net unrealized appreciation on investments based on a cost of $55,693,402 for federal income tax purposes was as follows: | ||||||||
| Aggregate gross unrealized appreciation for all investments in which there is an excess of value over tax cost | $ | 639,431 | ||||||
| Aggregate gross unrealized depreciation for all investments in which there is an excess of tax cost over value | (275,343 | ) | ||||||
|
|
|
|||||||
| Net unrealized appreciation | $ | 364,088 | ||||||
|
|
|
|||||||
| (b) | Position is unsettled. Contract rate was not determined at May 31, 2012 and does not take effect until settlement date. | |||||||
| (c) | Variable rate security. Rate as of May 31, 2012 is disclosed. | |||||||
| (d) | Variable rate security. Rate shown represents the weighted average rate of underlying contracts at May 31, 2012. | |||||||
| 144A | All or a portion of these securities are exempt from registration under Rule 144A of the Securities Act of 1933. These securities may be resold in transactions exempt from registration, normally to qualified institutional buyers. At May 31, 2012, the value of Rule 144A holdings amounted to $1,070,133 or 2.0% of net assets. | |||||||
Industry Summary at May 31, 2012 (Unaudited)
| Technology |
12.5 | % | ||
| Healthcare |
10.1 | |||
| Chemicals |
6.6 | |||
| Media Non-Cable |
6.2 | |||
| Wirelines |
4.9 | |||
| Consumer Cyclical Services |
3.9 | |||
| Metals & Mining |
3.9 | |||
| Industrial Other |
3.8 | |||
| Automotive |
3.7 | |||
| Pharmaceuticals |
3.0 | |||
| Property & Casualty Insurance |
2.9 | |||
| Retailers |
2.6 | |||
| Food & Beverage |
2.5 | |||
| Oil Field Services |
2.2 | |||
| Financial Other |
2.0 | |||
| Consumer Products |
2.0 | |||
| Other Investments, less than 2% each |
20.4 | |||
| Short-Term Investments |
14.0 | |||
|
|
|
|||
| Total Investments |
107.2 | |||
| Other assets less liabilities |
(7.2 | ) | ||
|
|
|
|||
| Net Assets |
100.0 | % | ||
|
|
|
See accompanying notes to financial statements.
| 30
Table of Contents
Consolidated* Statements of Assets and Liabilities
May 31, 2012 (Unaudited)
| ASG Growth Markets Fund |
Gateway International Fund |
Loomis Sayles Capital Income Fund |
Loomis Sayles Senior Floating Rate and Fixed Income Fund |
|||||||||||||
| ASSETS |
||||||||||||||||
| Investments at cost |
$ | 23,487,436 | $ | 20,733,339 | $ | 16,326,918 | $ | 48,342,509 | ||||||||
| Repurchase agreement(s) at cost |
113,144 | 665,901 | 1,297,172 | 7,346,998 | ||||||||||||
| Net unrealized appreciation (depreciation) |
(561,343 | ) | (2,806,525 | ) | (814,654 | ) | 367,983 | |||||||||
|
|
|
|
|
|
|
|
|
|||||||||
| Investments at value |
23,039,237 | 18,592,715 | 16,809,436 | 56,057,490 | ||||||||||||
| Cash |
665,323 | — | 126,941 | — | ||||||||||||
| Due from brokers (including variation margin on futures contracts) (Note 2) |
796,911 | — | — | — | ||||||||||||
| Foreign currency at value (identified cost $19,465, $658,744, $0 and $0) |
19,074 | 647,587 | — | — | ||||||||||||
| Receivable for Fund shares sold |
— | 130,000 | 13,000 | 763,587 | ||||||||||||
| Receivable from investment adviser (Note 6) |
5,993 | 20,344 | 10,113 | 5,329 | ||||||||||||
| Receivable for securities sold |
2 | 262,620 | — | 1,676,800 | ||||||||||||
| Dividends and interest receivable |
72,214 | 57,110 | 96,209 | 425,710 | ||||||||||||
| Unrealized appreciation on forward foreign currency contracts (Note 2) |
504,231 | — | — | — | ||||||||||||
| Tax reclaims receivable |
— | 19,207 | 1,766 | — | ||||||||||||
| Unrealized appreciation on futures contracts (Note 2) |
479,419 | — | — | — | ||||||||||||
|
|
|
|
|
|
|
|
|
|||||||||
| TOTAL ASSETS |
25,582,404 | 19,729,583 | 17,057,465 | 58,928,916 | ||||||||||||
|
|
|
|
|
|
|
|
|
|||||||||
| LIABILITIES |
||||||||||||||||
| Options written, at value (premiums received $0, $513,993, $0 and $0) (Note 2) |
— | 284,113 | — | — | ||||||||||||
| Payable for securities purchased |
— | 276,567 | 982,406 | 6,563,839 | ||||||||||||
| Payable for Fund shares redeemed |
3,057 | — | — | — | ||||||||||||
| Unrealized depreciation on forward foreign currency contracts (Note 2) |
380,075 | — | — | — | ||||||||||||
| Unrealized depreciation on futures contracts (Note 2) |
248,339 | — | — | — | ||||||||||||
| Deferred Trustees’ fees (Note 6) |
5,381 | 2,041 | 2,026 | 6,091 | ||||||||||||
| Administrative fees payable (Note 6) |
15,931 | 743 | 587 | 2,010 | ||||||||||||
| Payable to distributor (Note 6d) |
2 | 1 | 6 | 49 | ||||||||||||
| Other accounts payable and accrued expenses |
73,527 | 57,973 | 23,122 | 63,652 | ||||||||||||
|
|
|
|
|
|
|
|
|
|||||||||
| TOTAL LIABILITIES |
726,312 | 621,438 | 1,008,147 | 6,635,641 | ||||||||||||
|
|
|
|
|
|
|
|
|
|||||||||
| NET ASSETS |
$ | 24,856,092 | $ | 19,108,145 | $ | 16,049,318 | $ | 52,293,275 | ||||||||
|
|
|
|
|
|
|
|
|
|||||||||
| NET ASSETS CONSIST OF: |
||||||||||||||||
| Paid-in capital |
$ | 26,879,477 | $ | 20,736,275 | $ | 16,803,798 | $ | 50,843,992 | ||||||||
| Undistributed net investment income |
24,000 | 218,115 | 72,239 | 189,796 | ||||||||||||
| Accumulated net realized gain (loss) on investments, futures contracts, options written and foreign currency transactions |
(1,854,438 | ) | 743,117 | (12,058 | ) | 891,504 | ||||||||||
| Net unrealized appreciation (depreciation) on investments, futures contracts, options written and foreign currency translations |
(192,947 | ) | (2,589,362 | ) | (814,661 | ) | 367,983 | |||||||||
|
|
|
|
|
|
|
|
|
|||||||||
| NET ASSETS |
$ | 24,856,092 | $ | 19,108,145 | $ | 16,049,318 | $ | 52,293,275 | ||||||||
|
|
|
|
|
|
|
|
|
|||||||||
| COMPUTATION OF NET ASSET VALUE AND OFFERING PRICE: |
||||||||||||||||
| Class A shares: |
||||||||||||||||
| Net assets |
$ | 517,408 | $ | 38,239 | $ | 1,368,138 | $ | 6,124,880 | ||||||||
|
|
|
|
|
|
|
|
|
|||||||||
| Shares of beneficial interest |
55,983 | 4,161 | 144,592 | 591,192 | ||||||||||||
|
|
|
|
|
|
|
|
|
|||||||||
| Net asset value and redemption price per share |
$ | 9.24 | $ | 9.19 | $ | 9.46 | $ | 10.36 | ||||||||
|
|
|
|
|
|
|
|
|
|||||||||
| Offering price per share (100/[100 – maximum sales charge] of net asset value) (Note 1) |
$ | 9.80 | $ | 9.75 | $ | 10.04 | $ | 10.74 | ||||||||
|
|
|
|
|
|
|
|
|
|||||||||
| Class C shares: (redemption price per share is equal to net asset value less any applicable contingent deferred sales charge) (Note 1) |
||||||||||||||||
| Net assets |
$ | 36,400 | $ | 55,902 | $ | 59,599 | $ | 2,358,380 | ||||||||
|
|
|
|
|
|
|
|
|
|||||||||
| Shares of beneficial interest |
3,949 | 6,085 | 6,311 | 227,945 | ||||||||||||
|
|
|
|
|
|
|
|
|
|||||||||
| Net asset value and offering price per share |
$ | 9.22 | $ | 9.19 | $ | 9.44 | $ | 10.35 | ||||||||
|
|
|
|
|
|
|
|
|
|||||||||
| Class Y shares: |
||||||||||||||||
| Net assets |
$ | 24,302,284 | $ | 19,014,004 | $ | 14,621,581 | $ | 43,810,015 | ||||||||
|
|
|
|
|
|
|
|
|
|||||||||
| Shares of beneficial interest |
2,626,945 | 2,066,911 | 1,545,395 | 4,228,421 | ||||||||||||
|
|
|
|
|
|
|
|
|
|||||||||
| Net asset value, offering and redemption price per share |
$ | 9.25 | $ | 9.20 | $ | 9.46 | $ | 10.36 | ||||||||
|
|
|
|
|
|
|
|
|
|||||||||
| * | Consolidated, where applicable. See Notes 1 and 2 of the Notes to Financial Statements. |
See accompanying notes to financial statements.
31 |
Table of Contents
Consolidated* Statements of Operations
For the Six Months Ended May 31, 2012 (Unaudited)
| ASG Growth Markets Fund |
Gateway International Fund (a) |
Loomis Sayles Capital Income Fund (a) |
Loomis Sayles Senior Floating Rate and Fixed Income Fund |
|||||||||||||
| INVESTMENT INCOME |
||||||||||||||||
| Interest |
$ | 5,854 | $ | — | $ | 31,503 | $ | 1,842,216 | ||||||||
| Dividends |
232,627 | 283,208 | 65,242 | — | ||||||||||||
| Less net foreign taxes withheld |
(19,604 | ) | (28,431 | ) | (1,766 | ) | — | |||||||||
|
|
|
|
|
|
|
|
|
|||||||||
| 218,877 | 254,777 | 94,979 | 1,842,216 | |||||||||||||
|
|
|
|
|
|
|
|
|
|||||||||
| Expenses |
||||||||||||||||
| Management fees (Note 6) |
156,766 | 24,973 | 14,270 | 136,196 | ||||||||||||
| Service and distribution fees (Note 6) |
175 | 36 | 146 | 3,775 | ||||||||||||
| Administrative fees (Note 6) |
34,807 | 1,506 | 1,077 | 10,348 | ||||||||||||
| Trustees’ and directors’ fees and expenses (Note 6) |
16,490 | 4,078 | 4,029 | 9,669 | ||||||||||||
| Transfer agent fees and expenses (Note 6) |
276 | 79 | 180 | 502 | ||||||||||||
| Audit and tax services fees |
33,895 | 11,762 | 11,375 | 23,617 | ||||||||||||
| Custodian fees and expenses |
68,218 | 32,069 | 3,801 | 62,335 | ||||||||||||
| Interest expense (Note 9) |
3,323 | — | — | — | ||||||||||||
| Legal fees |
2,345 | 72 | 377 | 606 | ||||||||||||
| Registration fees |
16,923 | 14,750 | 8,813 | 18,473 | ||||||||||||
| Shareholder reporting expenses |
1,701 | 828 | 1,523 | 8,675 | ||||||||||||
| Miscellaneous expenses |
14,577 | 7,221 | 2,651 | 50,237 | ||||||||||||
|
|
|
|
|
|
|
|
|
|||||||||
| Total expenses |
349,496 | 97,374 | 48,242 | 324,433 | ||||||||||||
| Less waiver and/or expense reimbursement (Note 6) |
(156,573 | ) | (60,712 | ) | (25,502 | ) | (127,714 | ) | ||||||||
|
|
|
|
|
|
|
|
|
|||||||||
| Net expenses |
192,923 | 36,662 | 22,740 | 196,719 | ||||||||||||
|
|
|
|
|
|
|
|
|
|||||||||
| Net investment income |
25,954 | 218,115 | 72,239 | 1,645,497 | ||||||||||||
|
|
|
|
|
|
|
|
|
|||||||||
| NET REALIZED AND UNREALIZED GAIN (LOSS) ON INVESTMENTS, |
||||||||||||||||
| Net realized gain (loss) on: |
||||||||||||||||
| Investments |
141,814 | (21,948 | ) | (12,156 | ) | 892,235 | ||||||||||
| Futures contracts |
(1,688,039 | ) | — | — | — | |||||||||||
| Options written |
— | 684,495 | — | — | ||||||||||||
| Foreign currency transactions |
(384,543 | ) | 80,570 | 98 | — | |||||||||||
| Net change in unrealized appreciation (depreciation) on: |
||||||||||||||||
| Investments |
(776,586 | ) | (2,806,525 | ) | (814,654 | ) | 337,464 | |||||||||
| Futures contracts |
271,528 | — | — | — | ||||||||||||
| Options written |
— | 229,880 | — | — | ||||||||||||
| Foreign currency translations |
176,490 | (12,717 | ) | (7 | ) | — | ||||||||||
|
|
|
|
|
|
|
|
|
|||||||||
| Net realized and unrealized gain (loss) on investments, futures contracts, options written and foreign currency transactions |
(2,259,336 | ) | (1,846,245 | ) | (826,719 | ) | 1,229,699 | |||||||||
|
|
|
|
|
|
|
|
|
|||||||||
| NET INCREASE (DECREASE) IN NET ASSETS RESULTING FROM OPERATIONS |
$ | (2,233,382 | ) | $ | (1,628,130 | ) | $ | (754,480 | ) | $ | 2,875,196 | |||||
|
|
|
|
|
|
|
|
|
|||||||||
| * | Consolidated, where applicable. See Notes 1 and 2 of the Notes to Financial Statements. |
| (a) | From commencement of operations on March 30, 2012 through May 31, 2012. |
See accompanying notes to financial statements.
| 32
Table of Contents
Consolidated* Statements of Changes in Net Assets
| ASG Growth Markets Fund | Gateway International Fund | |||||||||||
| Six Months Ended May 31, 2012 (Unaudited) |
Period Ended November 30, 2011 (a) |
Period Ended May 31, 2012 (Unaudited) (b) |
||||||||||
| FROM OPERATIONS: |
| |||||||||||
| Net investment income (loss) |
$ | 25,954 | $ | (20,915 | ) | $ | 218,115 | |||||
| Net realized gain (loss) on investments, futures contracts, options written and foreign currency transactions |
(1,930,768 | ) | 387,126 | 743,117 | ||||||||
| Net change in unrealized appreciation (depreciation) on investments, futures contracts, options written and foreign currency translations |
(328,568 | ) | 135,621 | (2,589,362 | ) | |||||||
|
|
|
|
|
|
|
|||||||
| Net increase (decrease) in net assets resulting from operations |
(2,233,382 | ) | 501,832 | (1,628,130 | ) | |||||||
|
|
|
|
|
|
|
|||||||
| FROM DISTRIBUTIONS TO SHAREHOLDERS: |
||||||||||||
| Net investment income |
||||||||||||
| Class A |
(197 | ) | — | — | ||||||||
| Class C |
(2 | ) | — | — | ||||||||
| Class Y |
(114,012 | ) | — | — | ||||||||
| Net realized capital gains |
||||||||||||
| Class A |
(336 | ) | — | — | ||||||||
| Class C |
(7 | ) | — | — | ||||||||
| Class Y |
(183,323 | ) | — | — | ||||||||
|
|
|
|
|
|
|
|||||||
| Total distributions |
(297,877 | ) | — | — | ||||||||
|
|
|
|
|
|
|
|||||||
| NET INCREASE IN NET ASSETS FROM CAPITAL SHARE TRANSACTIONS (NOTE 11) |
1,753,207 | 25,132,312 | 20,736,275 | |||||||||
|
|
|
|
|
|
|
|||||||
| Net increase (decrease) in net assets |
(778,052 | ) | 25,634,144 | 19,108,145 | ||||||||
| NET ASSETS |
||||||||||||
| Beginning of the period |
25,634,144 | — | — | |||||||||
|
|
|
|
|
|
|
|||||||
| End of the period |
$ | 24,856,092 | $ | 25,634,144 | $ | 19,108,145 | ||||||
|
|
|
|
|
|
|
|||||||
| UNDISTRIBUTED NET INVESTMENT INCOME |
$ | 24,000 | $ | 112,257 | $ | 218,115 | ||||||
|
|
|
|
|
|
|
|||||||
| * | Consolidated, where applicable. See Notes 1 and 2 of the Notes to Financial Statements. |
| (a) | From commencement of operations on October 21, 2011 through November 30, 2011. |
| (b) | From commencement of operations on March 30, 2012 through May 31, 2012. |
| (c) | From commencement of operations on September 16, 2011 through November 30, 2011. |
See accompanying notes to financial statements.
33 |
Table of Contents
| Loomis Sayles Capital
Income Fund |
Loomis Sayles Senior Floating Rate and Fixed Income Fund |
|||||||||||
| Period Ended May 31, 2012 (Unaudited) (b) |
Six Months Ended May 31, 2012 (Unaudited) |
Period Ended November 30, 2011 (c) |
||||||||||
| FROM OPERATIONS: |
| |||||||||||
| Net investment income |
$ | 72,239 | $ | 1,645,497 | $ | 426,895 | ||||||
| Net realized gain (loss) on investments and foreign currency transactions |
(12,058 | ) | 892,235 | 77,982 | ||||||||
| Net change in unrealized appreciation (depreciation) on investments and foreign currency translations |
(814,661 | ) | 337,464 | 30,519 | ||||||||
|
|
|
|
|
|
|
|||||||
| Net increase (decrease) in net assets resulting from operations |
(754,480 | ) | 2,875,196 | 535,396 | ||||||||
|
|
|
|
|
|
|
|||||||
| FROM DISTRIBUTIONS TO SHAREHOLDERS: |
||||||||||||
| Net investment income |
||||||||||||
| Class A |
— | (35,444 | ) | (1,145 | ) | |||||||
| Class C |
— | (15,537 | ) | (9 | ) | |||||||
| Class Y |
— | (1,403,480 | ) | (435,951 | ) | |||||||
| Net realized capital gains |
||||||||||||
| Class A |
— | (454 | ) | — | ||||||||
| Class C |
— | (31 | ) | — | ||||||||
| Class Y |
— | (73,417 | ) | — | ||||||||
|
|
|
|
|
|
|
|||||||
| Total distributions |
— | (1,528,363 | ) | (437,105 | ) | |||||||
|
|
|
|
|
|
|
|||||||
| NET INCREASE IN NET ASSETS FROM CAPITAL SHARE TRANSACTIONS (NOTE 11) |
16,803,798 | 10,058,263 | 40,789,888 | |||||||||
|
|
|
|
|
|
|
|||||||
| Net increase in net assets |
16,049,318 | 11,405,096 | 40,888,179 | |||||||||
| NET ASSETS |
||||||||||||
| Beginning of the period |
— | 40,888,179 | — | |||||||||
|
|
|
|
|
|
|
|||||||
| End of the period |
$ | 16,049,318 | $ | 52,293,275 | $ | 40,888,179 | ||||||
|
|
|
|
|
|
|
|||||||
| UNDISTRIBUTED (DISTRIBUTIONS IN EXCESS OF) NET INVESTMENT INCOME |
$ | 72,239 | $ | 189,796 | $ | (1,240 | ) | |||||
|
|
|
|
|
|
|
|||||||
| 34
Table of Contents
Financial Highlights
For a share outstanding throughout each period.
| Income (Loss) from Investment Operations: |
Less Distributions: | |||||||||||||||||||||||||||
| Net asset value, beginning of the period |
Net investment income (loss) (a) |
Net realized and unrealized gain (loss) |
Total from investment operations |
Dividends from net investment income |
Distributions from net realized capital gains |
Total distributions |
||||||||||||||||||||||
| ASG GROWTH MARKETS FUND |
||||||||||||||||||||||||||||
| Class A |
||||||||||||||||||||||||||||
| 5/31/2012(g) |
$ | 10.20 | $ | 0.03 | $ | (0.88 | ) | $ | (0.85 | ) | $ | (0.04 | ) | $ | (0.07 | ) | $ | (0.11 | ) | |||||||||
| 11/30/2011(h) |
10.00 | (0.01 | ) | 0.21 | 0.20 | — | — | — | ||||||||||||||||||||
| Class C |
||||||||||||||||||||||||||||
| 5/31/2012(g) |
10.19 | 0.01 | (0.89 | ) | (0.88 | ) | (0.02 | ) | (0.07 | ) | (0.09 | ) | ||||||||||||||||
| 11/30/2011(h) |
10.00 | (0.02 | ) | 0.21 | 0.19 | — | — | — | ||||||||||||||||||||
| Class Y |
||||||||||||||||||||||||||||
| 5/31/2012(g) |
10.20 | 0.01 | (0.85 | ) | (0.84 | ) | (0.04 | ) | (0.07 | ) | (0.11 | ) | ||||||||||||||||
| 11/30/2011(h) |
10.00 | (0.01 | ) | 0.21 | 0.20 | — | — | — | ||||||||||||||||||||
| GATEWAY INTERNATIONAL FUND |
||||||||||||||||||||||||||||
| Class A |
||||||||||||||||||||||||||||
| 5/31/2012(i) |
$ | 10.00 | $ | 0.11 | $ | (0.92 | ) | $ | (0.81 | ) | $ | — | $ | — | $ | — | ||||||||||||
| Class C |
||||||||||||||||||||||||||||
| 5/31/2012(i) |
10.00 | 0.10 | (0.91 | ) | (0.81 | ) | — | — | — | |||||||||||||||||||
| Class Y |
||||||||||||||||||||||||||||
| 5/31/2012(i) |
10.00 | 0.11 | (0.91 | ) | (0.80 | ) | — | — | — | |||||||||||||||||||
| LOOMIS SAYLES CAPITAL INCOME FUND |
|
|||||||||||||||||||||||||||
| Class A |
||||||||||||||||||||||||||||
| 5/31/2012(i) |
$ | 10.00 | $ | 0.08 | $ | (0.62 | ) | $ | (0.54 | ) | $ | — | $ | — | $ | — | ||||||||||||
| Class C |
||||||||||||||||||||||||||||
| 5/31/2012(i) |
10.00 | 0.04 | (0.60 | ) | (0.56 | ) | — | — | — | |||||||||||||||||||
| Class Y |
||||||||||||||||||||||||||||
| 5/31/2012(i) |
10.00 | 0.05 | (0.59 | ) | (0.54 | ) | — | — | — | |||||||||||||||||||
| LOOMIS SAYLES SENIOR FLOATING RATE AND FIXED INCOME FUND |
|
|||||||||||||||||||||||||||
| Class A |
||||||||||||||||||||||||||||
| 5/31/2012(g) |
$ | 10.02 | $ | 0.38 | $ | 0.30 | $ | 0.68 | $ | (0.32 | ) | $ | (0.02 | ) | $ | (0.34 | ) | |||||||||||
| 11/30/2011(j) |
9.83 | 0.12 | 0.17 | 0.29 | (0.10 | ) | — | (0.10 | ) | |||||||||||||||||||
| Class C |
||||||||||||||||||||||||||||
| 5/31/2012(g) |
10.02 | 0.33 | 0.31 | 0.64 | (0.29 | ) | (0.02 | ) | (0.31 | ) | ||||||||||||||||||
| 11/30/2011(j) |
9.83 | 0.09 | 0.19 | 0.28 | (0.09 | ) | — | (0.09 | ) | |||||||||||||||||||
| Class Y |
||||||||||||||||||||||||||||
| 5/31/2012(g) |
10.02 | 0.37 | 0.32 | 0.69 | (0.33 | ) | (0.02 | ) | (0.35 | ) | ||||||||||||||||||
| 11/30/2011(k) |
10.00 | 0.11 | 0.02 | 0.13 | (0.11 | ) | — | (0.11 | ) | |||||||||||||||||||
| (a) | Per share net investment income (loss) has been calculated using the average shares outstanding during the period. |
| (b) | A sales charge for Class A shares and a contingent deferred sales charge for Class C shares are not reflected in total return calculations. Periods less than one year, if applicable, are not annualized. |
| (c) | Had certain expenses not been waived/reimbursed during the period, if applicable, total returns would have been lower. |
| (d) | The investment adviser agreed to waive its fees and/or reimburse a portion of the Fund’s expenses during the period. Without this waiver/reimbursement, if applicable, expenses would have been higher. |
| (e) | Computed on an annualized basis for periods less than one year, if applicable. |
| (f) | Portfolio turnover is calculated based on purchases and sales of long-term securities and does not include short-term investments, futures contracts, options written and/or forward foreign currency contracts. |
| (g) | For the six months ended May 31, 2012 (Unaudited). |
| (h) | From commencement of operations on October 21, 2011 through November 30, 2011. |
| (i) | From commencement of operations on March 30, 2012 through May 31, 2012. |
| (j) | From commencement of Class operations on September 30, 2011 through November 30, 2011. |
| (k) | From commencement of operations on September 16, 2011 through November 30, 2011. |
See accompanying notes to financial statements.
35 |
Table of Contents
| Ratios to Average Net Assets: | ||||||||||||||||||||||||||||||||||
| Net asset value, end of the period |
Total return (%) (b)(c) |
Net assets, end of the period (000’s) |
Net expenses, excluding interest expense (%) (d)(e) |
Gross expenses, excluding interest expense (%) (e) |
Net expenses including interest expense (%) (d)(e) |
Gross expenses including interest expense (%) (e) |
Net investment income (loss) (%) (e) |
Portfolio turnover rate(%) (f) |
||||||||||||||||||||||||||
| $ | 9.24 | (8.35 | ) | $ | 517 | 1.70 | 3.21 | 1.73 | 3.23 | 0.65 | 16 | |||||||||||||||||||||||
| 10.20 | 2.00 | 16 | 1.70 | 9.56 | 1.70 | 9.56 | (0.86 | ) | 0 | |||||||||||||||||||||||||
| 9.22 | (8.71 | ) | 36 | 2.45 | 4.36 | 2.47 | 4.38 | 0.20 | 16 | |||||||||||||||||||||||||
| 10.19 | 2.00 | 1 | 2.45 | 7.30 | 2.46 | 7.31 | (1.91 | ) | 0 | |||||||||||||||||||||||||
| 9.25 | (8.32 | ) | 24,302 | 1.45 | 2.65 | 1.48 | 2.67 | 0.20 | 16 | |||||||||||||||||||||||||
| 10.20 | 2.10 | 25,617 | 1.45 | 6.20 | 1.45 | 6.21 | (0.75 | ) | 0 | |||||||||||||||||||||||||
| $ | 9.19 | (8.10 | ) | $ | 38 | 1.35 | 4.08 | 1.35 | 4.08 | 6.83 | 6 | |||||||||||||||||||||||
| 9.19 | (8.10 | ) | 56 | 2.10 | 4.44 | 2.10 | 4.44 | 6.47 | 6 | |||||||||||||||||||||||||
| 9.20 | (8.00 | ) | 19,014 | 1.10 | 2.92 | 1.10 | 2.92 | 6.55 | 6 | |||||||||||||||||||||||||
| $ | 9.46 | (5.40 | ) | $ | 1,368 | 1.20 | 4.91 | 1.20 | 4.91 | 4.90 | 4 | |||||||||||||||||||||||
| 9.44 | (5.60 | ) | 60 | 1.95 | 3.13 | 1.95 | 3.13 | 2.68 | 4 | |||||||||||||||||||||||||
| 9.46 | (5.40 | ) | 14,622 | 0.95 | 1.99 | 0.95 | 1.99 | 3.01 | 4 | |||||||||||||||||||||||||
| $ | 10.36 | 6.82 | $ | 6,125 | 1.10 | 1.91 | 1.10 | 1.91 | 7.37 | 65 | ||||||||||||||||||||||||
| 10.02 | 3.00 | 252 | 1.10 | 7.66 | 1.10 | 7.66 | 7.00 | 17 | ||||||||||||||||||||||||||
| 10.35 | 6.46 | 2,358 | 1.85 | 2.57 | 1.85 | 2.57 | 6.34 | 65 | ||||||||||||||||||||||||||
| 10.02 | 2.87 | 1 | 1.85 | 5.00 | 1.85 | 5.00 | 5.50 | 17 | ||||||||||||||||||||||||||
| 10.36 | 6.92 | 43,810 | 0.85 | 1.40 | 0.85 | 1.40 | 7.26 | 65 | ||||||||||||||||||||||||||
| 10.02 | 1.29 | (l) | 40,636 | 1.01 | (m) | 3.60 | 1.01 | (m) | 3.60 | 5.17 | 17 | |||||||||||||||||||||||
| (l) | For the period September 30, 2011 (the date Class Y shares were first registered under the Securities Act of 1933) through November 30, 2011, the total return for Class Y shares was 3.04%. |
| (m) | Prior to September 30, 2011, there was no expense limitation agreement in place for Class Y. |
| 36
Table of Contents
Notes to Financial Statements
May 31, 2012 (Unaudited)
1. Organization. Gateway Trust and Natixis Funds Trust II (the “Trusts” and each a “Trust”) are each organized as a Massachusetts business trust. Each Trust is registered under the Investment Company Act of 1940, as amended (the “1940 Act”), as an open-end management investment company. Each Declaration of Trust permits the Board of Trustees to authorize the issuance of an unlimited number of shares of the Trust in multiple series. The financial statements for certain funds of the Trusts are presented in separate reports. The following funds (individually, a “Fund” and collectively, the “Funds”) are included in this report:
Gateway Trust:
Gateway International Fund
Natixis Funds Trust II:
ASG Growth Markets Fund (the “Growth Markets Fund”)
Loomis Sayles Capital Income Fund (the “Capital Income Fund”)
Loomis Sayles Senior Floating Rate and Fixed Income Fund (the “Senior Floating Rate and Fixed Income Fund”)
The Gateway International Fund commenced operations on March 30, 2012 via contribution to the Fund by Natixis Global Asset Management, L.P. (“Natixis US”) and affiliates of $15,002,000 and by Gateway Investment Advisers, LLC (“Gateway Advisers”) of $5,000,000.
The Capital Income Fund commenced operations on March 30, 2012 via contribution to the Fund by Natixis US and affiliates of $5,002,000 and by Loomis, Sayles & Company, L.P. (“Loomis Sayles”) of $5,000,000.
Capital Income Fund and Gateway International Fund are each a diversified investment company, while Growth Markets Fund and Senior Floating Rate and Fixed Income Fund, are each a non-diversified investment company.
Effective January 1, 2012, the name of the Funds’ administrator changed from Natixis Asset Management Advisors, L.P. to NGAM Advisors, L.P. (“NGAM Advisors”) and the name of the Funds’ distributor changed from Natixis Distributors, L.P. to NGAM Distribution, L.P. (“NGAM Distribution”).
Each Fund offers Class A, Class C and Class Y shares. Class A shares are sold with a maximum front-end sales charge of 5.75% for Growth Markets Fund, Gateway International Fund and Capital Income Fund and 3.50% for Senior Floating Rate and Fixed Income Fund. Class C shares do not pay a front-end sales charge, do not convert to any other class of shares, pay higher Rule 12b-1 fees than Class A shares and may be subject to a contingent deferred sales charge (“CDSC”) of 1.00% if those shares are redeemed within one year of acquisition, except for reinvested distributions. Class Y shares do not pay a front-end sales charge, a CDSC or Rule 12b-1 fees. Class Y shares are generally intended for institutional investors with a minimum initial investment of $100,000, though some categories of investors are exempted from the minimum investment amount as outlined in the Funds’ prospectus.
Most expenses of the Trusts can be directly attributed to a Fund. Expenses which cannot be directly attributed to a Fund are generally apportioned based on the relative net assets of each of the funds in the Trusts. Expenses of a Fund are borne pro rata by the holders of each class of shares, except that each class bears expenses unique to that class (including the Rule 12b-1 service and distribution fees). In addition, each class votes as a class only with respect to its own Rule 12b-1 Plan. Shares of each class would receive their pro rata share of the net assets of a Fund if the Fund were liquidated. The Trustees approve separate distributions from net investment income on each class of shares.
Growth Markets Fund invests in commodity-related instruments through investments in a wholly-owned subsidiary organized under the laws of the Cayman Islands. ASG Growth Markets Cayman Fund Ltd. is a wholly-owned subsidiary (the “Subsidiary”) of Growth Markets Fund. A subscription agreement was entered into between the Growth Markets Fund and its Subsidiary with the intent that the Growth Markets Fund will remain the sole shareholder and primary beneficiary of its Subsidiary. The Subsidiary is governed by a separate Board of Directors that is independent of the Growth Markets Fund’s Board of Trustees.
As of May 31, 2012, the value of Growth Markets Fund’s investment in its Subsidiary was as follows:
| Fund |
|
Commencement Date of Subsidiary |
|
|
Investment in Subsidiary |
|
|
Percentage of Net Assets |
| |||
| Growth Markets Fund |
October 21, 2011 | $ | 1,002,982 | 4.0% |
37 |
Table of Contents
Notes to Financial Statements (continued)
May 31, 2012 (Unaudited)
2. Significant Accounting Policies. The following is a summary of significant accounting policies consistently followed by each Fund in the preparation of its financial statements. The Funds’ financial statements are prepared in accordance with accounting principles generally accepted in the United States of America which require the use of management estimates that affect the reported amounts and disclosures in the financial statements. Actual results could differ from those estimates. Management has evaluated the events and transactions subsequent to period-end through the date the financial statements were issued and has determined that there were no material events that would require disclosure in the Funds’ financial statements.
a. Consolidation. The accompanying financial statements of Growth Markets Fund present the consolidated accounts of the Fund and its wholly-owned investment. All interfund accounts and transactions have been eliminated in consolidation.
b. Valuation. Equity securities, including shares of closed-end investment companies and exchange-traded funds, for which market quotations are readily available are valued at market value, as reported by independent pricing services recommended by the investment adviser and subadviser and approved by the Board of Trustees. Such independent pricing services generally use the security’s last sale price on the exchange or market where the security is primarily traded or, if there is no reported sale during the day, the closing bid price. Securities traded on the NASDAQ Global Select Market, NASDAQ Global Market and NASDAQ Capital Market are valued at the NASDAQ Official Closing Price (“NOCP”), or if lacking a NOCP, at the most recent bid quotation on the applicable NASDAQ Market. Debt securities (other than short-term obligations purchased with an original or remaining maturity of sixty days or less) and unlisted equity securities are generally valued on the basis of evaluated bids furnished to the Funds by an independent pricing service recommended by the investment adviser or subadviser and approved by the Board of Trustees, which service determines valuations for normal, institutional-size trading units of such securities using market information, transactions for comparable securities and various relationships between securities which are generally recognized by institutional traders. Senior loans are priced at bid prices supplied by an independent pricing service, if available. Broker-dealer bid quotations may also be used to value debt and equity securities and senior loans where an independent pricing service is unable to price a security or where an independent pricing service does not provide a reliable price for the security. Forward foreign currency contracts are valued utilizing interpolated prices determined from information provided by an independent pricing service. Futures contracts are valued at their most recent settlement price. Domestic exchange-traded single equity option contracts are valued at the mean of the National Best Bid and Offer quotations. International index options traded on foreign exchanges are valued at the most recent settlement price. Other exchange-traded options are valued at the average of the closing bid and ask quotations. Over-the-counter (“OTC”) international index options are valued at mid prices (between the bid and the ask price) supplied by an independent pricing service. OTC international index options not priced through an independent pricing service are valued based on quotations obtained from broker-dealers. Investments in other open-end investment companies are valued at their net asset value each day. Short-term obligations purchased with an original or remaining maturity of sixty days or less are valued at amortized cost, which approximates market value. Securities for which market quotations are not readily available are valued at fair value as determined in good faith by the Funds’ investment adviser or subadviser using consistently applied procedures under the general supervision of the Board of Trustees.
The Funds may hold securities traded in foreign markets. Foreign securities are valued at the market price in the foreign market. Additionally, Gateway International Fund may hold index options traded in foreign markets. If events occurring after the close of the foreign market (but before the close of regular trading on the New York Stock Exchange) are believed to materially affect the value of those securities or options, such securities or options are fair valued pursuant to procedures approved by the Board of Trustees. When fair valuing securities or options, the Funds may, among other things, use modeling tools or other processes that may take into account factors such as market activity and/or significant events that occur after the close of the foreign market and before the Funds calculate their net asset values. As of May 31, 2012, approximately 41% of the market value of Growth Markets Fund’s investments, 96% of the market value of Gateway International Fund’s investments and 100% of the market value of Gateway International Fund’s written options were fair valued pursuant to procedures approved by the Board of Trustees.
c. Investment Transactions and Related Investment Income. Investment transactions are accounted for on a trade date plus one basis for daily net asset value calculation. However, for financial reporting purposes, investment transactions are reported on trade date. Dividend income is recorded on ex-dividend date, or in the case of certain foreign securities, as soon as a Fund is notified, and interest income is recorded on an accrual basis. Interest income is increased by the accretion of discount and decreased by the amortization of premium. Investment income is recorded net of foreign taxes withheld when applicable. In determining net gain or loss on securities sold, the cost of securities has been determined on an identified cost basis. Investment income, non-class specific expenses and realized and unrealized gains and losses are allocated on a pro rata basis to each class based on the relative net assets of each class to the total net assets of the Fund.
d. Foreign Currency Translation. The books and records of the Funds are maintained in U.S. dollars. The values of securities, currencies and other assets and liabilities denominated in currencies other than U.S. dollars are translated into U.S. dollars based upon
| 38
Table of Contents
Notes to Financial Statements (continued)
May 31, 2012 (Unaudited)
foreign exchange rates prevailing at the end of the period. Purchases and sales of investment securities, income and expenses are translated on the respective dates of such transactions.
Since the values of investment securities are presented at the foreign exchange rates prevailing at the end of the period, it is not practical to isolate that portion of the results of operations arising from changes in exchange rates from fluctuations which arise due to changes in market prices of investment securities. Such changes are included with the net realized and unrealized gain or loss on investments.
Net realized foreign exchange gains or losses arise from sales of foreign currency, currency gains or losses realized between the trade and settlement dates on securities transactions and the difference between the amounts of dividends, interest and foreign withholding taxes recorded on the Funds’ books and the U.S. dollar equivalent of the amounts actually received or paid. Net unrealized foreign exchange gains and losses arise from changes in the value of assets and liabilities, other than investment securities, at the end of the fiscal period, resulting from changes in exchange rates.
Each Fund may use foreign currency exchange contracts to facilitate transactions in foreign-denominated investments. Losses may arise from changes in the value of the foreign currency or if the counterparties do not perform under the contracts’ terms.
e. Forward Foreign Currency Contracts. The Funds may enter into forward foreign currency contracts, including forward foreign cross currency contracts, to acquire exposure to foreign currencies or to hedge the Funds’ investments against currency fluctuation. A contract can also be used to offset a previous contract. These contracts involve market risk in excess of the unrealized gain or loss reflected in the Funds’ Consolidated Statements of Assets and Liabilities. The U.S. dollar value of the currencies a Fund has committed to buy or sell represents the aggregate exposure to each currency a Fund has acquired or hedged through currency contracts outstanding at period end. Gains or losses are recorded for financial statement purposes as unrealized until settlement date. Risks may arise upon entering into these contracts from the potential inability of counterparties to meet the terms of their contracts and from unanticipated movements in the value of a foreign currency relative to the U.S. dollar. Certain contracts may require the movement of cash and/or securities as collateral for the Funds’ or counterparty’s net obligations under the contracts.
f. Futures Contracts. The Funds and the Subsidiary may enter into futures contracts. Futures contracts are agreements between two parties to buy and sell a particular commodity, instrument or index for a specified price on a specified future date.
When a Fund or the Subsidiary enters into a futures contract, it is required to deposit with (or for the benefit of) its broker an amount of cash or short-term high-quality securities as “initial margin.” As the value of the contract changes, the value of the futures contract position increases or declines. Subsequent payments, known as “variation margin,” are made or received by a Fund or a Subsidiary, depending on the price fluctuations in the fair value of the contract and the value of cash or securities on deposit with the broker. The aggregate principal amounts of the contracts are not recorded in the financial statements. Fluctuations in the value of the contracts are recorded in the Consolidated Statements of Assets and Liabilities as an asset (liability) and in the Consolidated Statements of Operations as unrealized appreciation (depreciation) until the contracts are closed, when they are recorded as realized gains (losses). Realized gain or loss on a futures position is equal to the difference between the value of the contract at the time it was opened and the value at the time it was closed, minus brokerage commissions. When a Fund or the Subsidiary enters into a futures contract certain risks may arise, such as illiquidity in the futures market, which may limit a Fund’s or the Subsidiary’s ability to close out a futures contract prior to settlement date, and unanticipated movements in the value of securities, commodities or interest rates.
Futures contracts are exchange-traded. Exchange-traded futures are standardized contracts and are settled through a clearing house with fulfillment supported by the credit of the exchange. Therefore, counterparty credit risks to the Funds and the Subsidiary are reduced.
g. Option Contracts. Certain Funds may enter into option contracts. When a Fund purchases an option, it pays a premium and the option is subsequently marked to market to reflect current value. Premiums paid for purchasing options which expire are treated as realized losses. Premiums paid for purchasing options which are exercised are added to the cost or deducted from the proceeds on the underlying instrument to determine the realized gain or loss. If the Fund enters into a closing sale transaction, the difference between the premium paid and the proceeds of the closing sale transaction is treated as a realized gain or loss. The risk associated with purchasing options is limited to the premium paid.
When a Fund writes an option, an amount equal to the net premium received (the premium less commission) is recorded as a liability and is subsequently adjusted to the current value. Net premiums received for written options which expire are treated as realized
39 |
Table of Contents
Notes to Financial Statements (continued)
May 31, 2012 (Unaudited)
gains. Net premiums received for written options which are exercised are deducted from the cost or added to the proceeds on the underlying instrument to determine the realized gain or loss. If the Fund enters into a closing purchase transaction, the difference between the net premium received and any amount paid on effecting a closing purchase transaction, including commission, is treated as a realized gain or, if the net premium received is less than the amount paid, as a realized loss. The Fund, as writer of a written option, bears the risk of an unfavorable change in the market value of the instrument underlying the written option.
Exchange-traded options are standardized contracts and are settled through a clearing house with fulfillment supported by the credit of the exchange. Therefore, counterparty credit risks to the Funds are reduced. Over-the-counter options are subject to the risk that the counterparty is unable or unwilling to meet its obligations under the option.
h. Due from Brokers. Transactions and positions in certain futures and forward foreign currency contracts are maintained and cleared by registered U.S. broker/dealers pursuant to customer agreements between a Fund or the Subsidiary and the various broker/dealers. Due from brokers’ balances in the Consolidated Statements of Assets and Liabilities for Growth Markets Fund represent cash, foreign currency and any initial and/or variation margin applicable to open futures contracts and/or cash pledged as collateral for forward foreign currency contracts. In certain circumstances the Fund’s or the Subsidiary’s use of cash and foreign currency held at brokers is restricted by regulation or broker mandated limits.
i. Federal and Foreign Income Taxes. The Trusts treat each Fund as a separate entity for federal income tax purposes. Each Fund intends to meet the requirements of the Internal Revenue Code of 1986, as amended, applicable to regulated investment companies, and to distribute to its shareholders substantially all of its net investment income and any net realized capital gains at least annually. Management has performed an analysis of each Fund’s tax positions for the open tax years as of May 31, 2012 and has concluded that no provisions for income tax are required. The Funds’ federal tax returns for the prior three fiscal years, where applicable, remain subject to examination by the Internal Revenue Service. Management is not aware of any events that are reasonably possible to occur in the next six months that would result in the amounts of any unrecognized tax benefits significantly increasing or decreasing for the Funds. However, management’s conclusions regarding tax positions taken may be subject to review and adjustment at a later date based on factors including, but not limited to, new tax laws and accounting regulations and interpretations thereof.
The Subsidiary is classified as a controlled foreign corporation under the Internal Revenue Code. As a U.S. shareholder of a controlled foreign corporation, Growth Markets Fund will include in its taxable income its share of its Subsidiary’s current earnings and profits (including net realized gains). For the period ended November 30, 2011, the Fund was paid its share of its Subsidiary’s earnings and profits (including net realized gains) in the form of a distribution. Any deficit generated by the Subsidiary will be disregarded for purposes of computing the Fund’s taxable income in the current period and also disregarded for all future periods.
A Fund may be subject to foreign taxes on income and gains on investments that are accrued based upon the Fund’s understanding of the tax rules and regulations that exist in the countries in which the Fund invests. Foreign governments may also impose taxes or other payments on investments with respect to foreign securities. Such taxes are accrued as applicable.
j. Dividends and Distributions to Shareholders. Dividends and distributions are recorded on ex-dividend date. The timing and characterization of certain income and capital gain distributions are determined annually in accordance with federal tax regulations, which may differ from accounting principles generally accepted in the United States of America. Permanent differences are primarily due to differing treatments for book and tax purposes of items such as non-deductible expenses, dividend redesignations, Subsidiary dividends, foreign currency transactions and premium amortization. Permanent book and tax basis differences relating to shareholder distributions, net investment income, and net realized gains will result in reclassifications to capital accounts. Temporary differences between book and tax distributable earnings are primarily due to deferred Trustees’ fees, commissions on open futures contracts, wash sales, passive foreign investment companies adjustments, forward foreign currency and futures contracts mark to market and Subsidiary basis adjustments. Distributions from net investment income and short-term capital gains are considered to be distributed from ordinary income for tax purposes.
The tax characterization of distributions is determined on an annual basis. The tax character of distributions paid to shareholders during the period ended November 30, 2011 was as follows:
| 2011 Distributions Paid From: |
||||||||||||
| Fund |
Ordinary Income |
Long-Term Capital Gains |
Total | |||||||||
| Growth Markets Fund |
$ | — | $ | — | $ | — | ||||||
| Senior Floating Rate and Fixed Income Fund |
437,105 | — | 437,105 | |||||||||
| 40
Table of Contents
Notes to Financial Statements (continued)
May 31, 2012 (Unaudited)
k. Repurchase Agreements. It is each Fund’s policy that the market value of the collateral for repurchase agreements be at least equal to 102% of the repurchase price, including interest. Certain repurchase agreements are tri-party arrangements whereby the collateral is held in a segregated account for the benefit of the Fund and on behalf of the counterparty. Repurchase agreements could involve certain risks in the event of default or insolvency of the counterparty including possible delays or restrictions upon a Fund’s ability to dispose of the underlying securities.
l. Indemnifications. Under the Trusts’ organizational documents, its officers and Trustees are indemnified against certain liabilities arising out of the performance of their duties to the Funds. Additionally, in the normal course of business, the Funds enter into contracts with service providers that contain general indemnification clauses. The Funds’ maximum exposure under these arrangements is unknown as this would involve future claims that may be made against the Funds that have not yet occurred. However, based on experience, the Funds expect the risk of loss to be remote.
3. Fair Value Measurements. In accordance with accounting standards related to fair value measurements and disclosures, the Funds have categorized the inputs utilized in determining the value of each Fund’s assets or liabilities. These inputs are summarized in the three broad levels listed below:
| • | Level 1 – quoted prices in active markets for identical assets or liabilities; |
| • | Level 2 – prices determined using other significant inputs that are observable either directly, or indirectly through corroboration with observable market data (which could include quoted prices for similar assets or liabilities, interest rates, credit risk, etc.); and |
| • | Level 3 – prices determined using significant unobservable inputs when quoted prices or observable inputs are unavailable such as when there is little or no market activity for an asset or liability (unobservable inputs reflect each Fund’s own assumptions in determining the fair value of assets or liabilities and would be based on the best information available). |
The inputs or methodology used for valuing securities are not necessarily an indication of the risk associated with investing in those securities.
The following is a summary of the inputs used to value the Funds’ investments as of May 31, 2012, at value:
Growth Markets Fund
Asset Valuation Inputs
| Description |
Level 1 |
Level 2 |
Level 3 |
Total |
||||||||||||
| Common Stocks |
||||||||||||||||
| China |
$ | 788,362 | $ | 2,833,753 | $ | — | $ | 3,622,115 | ||||||||
| India |
258,847 | 71,653 | — | 330,500 | ||||||||||||
| Indonesia |
55,059 | 535,788 | — | 590,847 | ||||||||||||
| Korea |
331,034 | 2,386,015 | — | 2,717,049 | ||||||||||||
| Malaysia |
— | 765,265 | — | 765,265 | ||||||||||||
| Russia |
81,183 | 948,375 | — | 1,029,558 | ||||||||||||
| South Africa |
282,157 | 1,112,379 | — | 1,394,536 | ||||||||||||
| Taiwan |
482,738 | 730,162 | — | 1,212,900 | ||||||||||||
| All Other Common Stocks(a) |
3,683,477 | — | — | 3,683,477 | ||||||||||||
|
|
|
|
|
|
|
|
|
|||||||||
| Total Common Stocks |
5,962,857 | 9,383,390 | — | 15,346,247 | ||||||||||||
|
|
|
|
|
|
|
|
|
|||||||||
| Preferred Stocks(a) |
204,979 | 69,408 | — | 274,387 | ||||||||||||
| Short-Term Investments(a) |
— | 7,418,603 | — | 7,418,603 | ||||||||||||
|
|
|
|
|
|
|
|
|
|||||||||
| Total Investments |
6,167,836 | 16,871,401 | — | 23,039,237 | ||||||||||||
|
|
|
|
|
|
|
|
|
|||||||||
| Forward Foreign Currency Contracts (unrealized appreciation) |
— | 504,231 | — | 504,231 | ||||||||||||
| Futures Contracts (unrealized appreciation) |
479,419 | — | — | 479,419 | ||||||||||||
|
|
|
|
|
|
|
|
|
|||||||||
| Total |
$ | 6,647,255 | $ | 17,375,632 | $ | — | $ | 24,022,887 | ||||||||
|
|
|
|
|
|
|
|
|
|||||||||
41 |
Table of Contents
Notes to Financial Statements (continued)
May 31, 2012 (Unaudited)
Liability Valuation Inputs
| Description |
Level 1 |
Level 2 |
Level 3 |
Total |
||||||||||||
| Forward Foreign Currency Contracts (unrealized depreciation) |
$ | — | $ | (380,075 | ) | $ | — | $ | (380,075 | ) | ||||||
| Futures Contracts (unrealized depreciation) |
(248,339 | ) | — | — | (248,339 | ) | ||||||||||
|
|
|
|
|
|
|
|
|
|||||||||
| Total |
$ | (248,339 | ) | $ | (380,075 | ) | $ | — | $ | (628,414 | ) | |||||
|
|
|
|
|
|
|
|
|
|||||||||
| (a) | Details of the major categories of the Fund’s investments are reflected within the Consolidated Portfolio of Investments. |
Common stocks valued at $43,692 were transferred from Level 1 to Level 2 during the period ended May 31, 2012. At November 30, 2011, these securities were valued at the market price in the foreign market in accordance with the Fund’s valuation policies; at May 31, 2012, these securities were fair valued pursuant to procedures approved by the Board of Trustees as events occurring after the close of the foreign market were believed to materially affect the value of the securities.
All transfers are recognized as of the beginning of the reporting period.
Gateway International Fund
Asset Valuation Inputs
| Description |
Level 1 |
Level 2 |
Level 3 |
Total |
||||||||||||
| Common Stocks(a) |
$ | — | $ | 17,738,172 | $ | — | $ | 17,738,172 | ||||||||
| Purchased Options(a) |
— | 188,642 | — | 188,642 | ||||||||||||
| Short-Term Investments |
— | 665,901 | — | 665,901 | ||||||||||||
|
|
|
|
|
|
|
|
|
|||||||||
| Total |
$ | — | $ | 18,592,715 | $ | — | $ | 18,592,715 | ||||||||
|
|
|
|
|
|
|
|
|
|||||||||
Liability Valuation Inputs
| Description |
Level 1 |
Level 2 |
Level 3 |
Total |
||||||||||||
| Written Options(a) |
$ | — | $ | (284,113 | ) | $ | — | $ | (284,113 | ) | ||||||
|
|
|
|
|
|
|
|
|
|||||||||
| (a) | Details of the major categories of the Fund’s investments are reflected within the Portfolio of Investments. |
For the period ended May 31, 2012, there were no transfers between Levels 1, 2 and 3.
Capital Income Fund
Asset Valuation Inputs
| Description |
Level 1 |
Level 2 |
Level 3 |
Total |
||||||||||||
| Common Stocks(a) |
$ | 12,524,702 | $ | — | $ | — | $ | 12,524,702 | ||||||||
| Bonds and Notes(a) |
— | 2,883,072 | — | 2,883,072 | ||||||||||||
| Preferred Stocks(a) |
104,490 | — | — | 104,490 | ||||||||||||
| Short-Term Investments |
— | 1,297,172 | — | 1,297,172 | ||||||||||||
|
|
|
|
|
|
|
|
|
|||||||||
| Total |
$ | 12,629,192 | $ | 4,180,244 | $ | — | $ | 16,809,436 | ||||||||
|
|
|
|
|
|
|
|
|
|||||||||
| (a) | Details of the major categories of the Fund’s investments are reflected within the Portfolio of Investments. |
| 42
Table of Contents
Notes to Financial Statements (continued)
May 31, 2012 (Unaudited)
For the period ended May 31, 2012, there were no transfers between Levels 1, 2 and 3.
Senior Floating Rate and Fixed Income Fund
Asset Valuation Inputs
| Description |
Level 1 |
Level 2 |
Level 3 |
Total |
||||||||||||
| Senior Loans(a) |
$ | — | $ | 43,851,877 | $ | — | $ | 43,851,877 | ||||||||
| Bonds and Notes(a) |
— | 4,858,615 | — | 4,858,615 | ||||||||||||
| Short-Term Investments |
— | 7,346,998 | — | 7,346,998 | ||||||||||||
|
|
|
|
|
|
|
|
|
|||||||||
| Total |
$ | — | $ | 56,057,490 | $ | — | $ | 56,057,490 | ||||||||
|
|
|
|
|
|
|
|
|
|||||||||
| (a) | Details of the major categories of the Fund’s investments are reflected within the Portfolio of Investments. |
For the six months ended May 31, 2012, there were no transfers between Levels 1, 2 and 3.
In May 2011, Accounting Standards Update (“ASU”) No. 2011-04, “Amendments to Achieve Common Fair Value Measurement and Disclosure Requirements” was issued and is effective for interim and annual periods beginning after December 15, 2011. The ASU requires reporting entities to disclose i) the amounts of any transfers between Level 1 and Level 2, and the reasons for the transfers; and ii) for Level 3 fair value measurements, a) quantitative information about significant unobservable inputs used, b) a description of the valuation processes used by the reporting entity, and c) a narrative description of the sensitivity of the fair value measurement to changes in unobservable inputs if a change in those inputs might result in a significantly higher or lower fair value measurement. Notwithstanding the projected regulatory implementation date of August 31, 2012 for the Fund, Management has already implemented disclosure of all transfers between Level 1 and Level 2, and the reasons for the transfers. Management has evaluated the disclosure requirements for Level 3 fair value measurements and expects the impact on the Funds’ financial statements to be limited.
4. Derivatives. Derivative instruments are defined as financial instruments whose value and performance are based on the value and performance of another security or financial instrument. Derivative instruments that certain Funds used during the period include forward foreign currency contracts, futures contracts and options contracts.
Growth Markets Fund seeks to complement its equity portfolio with a portfolio of derivatives designed to enhance return and mitigate losses. The Fund uses quantitative models to estimate the market exposures that drive the aggregate returns of one or more broad-based measures of emerging market equity index performance as well as identify the market exposures best suited to limit the volatility and risk of loss associated with the underlying equity portfolio. These market exposures, which are expected to vary over time, may include exposures to the returns of global equity and fixed income securities, commodities and currencies. During the period ended May 31, 2012, the Fund used long and short contracts on U.S. and foreign equity market indices, U.S. government bonds, short-term interest rates, foreign currencies and commodities (through investments in the Subsidiary) and long contracts on foreign government bonds in accordance with these objectives.
Gateway International Fund seeks to capture the majority of the returns associated with international developed market equity investments, while exposing investors to less risk than such investments generally. To meet this investment goal, the Fund invests in a broadly diversified portfolio of common stocks of non-U.S. companies, including, but not limited to, Australia, the United Kingdom, the Euro Zone, Hong Kong, Japan and Switzerland, while also writing index call options. Writing index call options can reduce the Fund’s volatility, provide a steady cash flow and be an important source of the Fund’s return, although it also may reduce the Fund’s ability to profit from increases in the value of its equity portfolio. The Fund also buys index put options, which can protect the Fund from a significant market decline that may occur over a short period of time. The value of an index put option generally increases as the prices of stocks constituting the index decrease and decreases as those stocks increase in price. The Fund typically sells call options and buys put options on market indices that represent a significant portion of the capitalization in each of the markets in which the Fund’s equity investments are traded. The combination of the diversified stock portfolio, the steady cash flow from writing of index call options and the downside protection from purchased index put options is intended to provide the Fund with the majority of the returns associated with equity market investments while exposing investors to less risk than other equity investments. During the period ended May 31, 2012, the Fund used written index call options and purchased index put options in accordance with this objective.
Capital Income Fund is subject to the risk of unpredictable declines in the value of individual equity securities and periods of below-average performance in individual securities or in the equity market as a whole. The Fund may use purchased put options and written call options to hedge against a decline in value of an equity security that it owns and may use written put options to offset the cost of options used for hedging purposes. The Fund may also use purchased call options and written put options for investment purposes. During the period ended May 31, 2012, the Fund engaged in option transactions for investment purposes.
43 |
Table of Contents
Notes to Financial Statements (continued)
May 31, 2012 (Unaudited)
Growth Markets Fund and Gateway International Fund are party to agreements with counterparties that govern transactions in forward foreign currency contracts and over-the-counter options. These agreements contain credit-risk-related contingent features that allow the counterparties to terminate open contracts early if the net asset value of a Fund declines beyond a certain threshold. If such features were to be triggered, the counterparties could request immediate settlement of open contracts at current fair value. As of May 31, 2012, the fair value of derivative positions (including open trades) subject to credit-risk-related contingent features that are in a net liability position by counterparty, and the value of collateral pledged to counterparties for such contracts is as follows:
| Fund |
Counterparty |
Derivatives |
Collateral Pledged |
|||||||||
| Gateway International Fund |
UBS AG | $ | (257,698 | ) | $ | 5,235,014 | ||||||
Forward foreign currency contracts and over-the-counter options are subject to the risk that the counterparty will be unwilling or unable to meet its obligations under the contracts. Certain Funds have mitigated this risk by entering into master netting agreements with counterparties that allow the Fund and the counterparty to offset amounts owed by each related to derivative contracts to one net amount payable by either the Fund or the counterparty. The maximum amount of loss that the Funds would incur if counterparties failed to meet their obligations, and the amount of loss that the Funds would incur after taking into account master netting arrangements are as follows as of May 31, 2012:
| Fund |
Maximum Amount |
Maximum Amount of Loss - Net |
||||||
| Growth Markets Fund |
$ | 504,231 | $ | 124,156 | ||||
| Gateway International Fund |
26,415 | — | ||||||
Counterparty risk is managed based on policies and procedures established by each Fund’s adviser and/or subadviser. Such policies and procedures may include, but are not limited to, minimum counterparty credit rating requirements, monitoring of counterparty credit default swap spreads and posting of collateral. Collateral is posted based on the requirements established under International Swap and Derivative Association (“ISDA”) agreements negotiated between each Fund and the derivative counterparties. In lieu of receiving cash collateral, Growth Markets Fund may use unrealized gains on forward foreign currency contracts to meet counterparty margin requirements for open positions. This risk of loss to a Fund from counterparty default should be limited to the extent a Fund is undercollateralized; however, final settlement of a Fund’s claim against any collateral received may be subject to bankruptcy court proceedings.
The following is a summary of derivative instruments for Growth Markets Fund as of May 31, 2012:
| Consolidated Statements of Assets and Liabilities Caption |
Interest |
Foreign Exchange |
Equity Contracts |
Commodity |
||||||||||||
| Assets |
||||||||||||||||
| Unrealized appreciation on forward foreign currency contracts |
$ | — | $ | 504,231 | $ | — | $ | — | ||||||||
| Unrealized appreciation on futures contracts |
216,573 | — | 10,788 | 252,058 | ||||||||||||
| Liabilities |
||||||||||||||||
| Unrealized depreciation on forward foreign currency contracts |
— | (380,075 | ) | — | — | |||||||||||
| Unrealized depreciation on futures contracts |
(12,918 | ) | — | (63,721 | ) | (171,700 | ) | |||||||||
Transactions in derivative instruments for Growth Markets Fund during the six months ended May 31, 2012 were as follows:
| Consolidated Statements of Operations Caption |
Interest Rate |
Foreign |
Equity Contracts |
Commodity |
||||||||||||
| Net Realized Gain (Loss) on: |
||||||||||||||||
| Foreign currency transactions* |
$ | — | $ | (382,568 | ) | $ | — | $ | — | |||||||
| Futures contracts |
167,226 | — | (1,331,987 | ) | (523,278 | ) | ||||||||||
| Net Change in Unrealized Appreciation (Depreciation) on: |
||||||||||||||||
| Foreign currency translations* |
— | 164,247 | — | — | ||||||||||||
| Futures contracts |
194,442 | — | 4,644 | 72,442 | ||||||||||||
* Represents realized loss and change in unrealized appreciation (depreciation) for forward foreign currency contracts during the period.
| 44
Table of Contents
Notes to Financial Statements (continued)
May 31, 2012 (Unaudited)
The following is a summary of derivative instruments for the Gateway International Fund as of May 31, 2012:
| Consolidated Statements of Assets and Liabilities Caption |
Equity |
|||
| Assets |
||||
| Investments at value* |
$ | 188,642 | ||
| Liabilities |
||||
| Options written, at value |
(284,113 | ) | ||
* Represents purchased options, at value.
Transactions in derivative instruments for the Gateway International Fund during the period ended May 31, 2012 were as follows:
| Consolidated Statements of Operations Caption |
Equity |
|||
| Net Realized Gain (Loss) on: |
||||
| Investments* |
$ | 160,324 | ||
| Options written |
684,495 | |||
| Net Change in Unrealized Appreciation (Depreciation) on: |
||||
| Investments* |
(15,480 | ) | ||
| Options written |
229,880 | |||
* Represents realized gain and change in unrealized appreciation (depreciation), respectively, for purchased options during the period.
Capital Income Fund had transactions in written options during the period ended May 31, 2012, which generated no net realized gain (loss).
As the Funds value their derivatives at fair value and recognize changes in fair value through the Consolidated Statements of Operations, they do not qualify for hedge accounting under authoritative guidance for derivative instruments. The Funds’ investments in derivatives may represent an economic hedge; however, they are considered to be non-hedge transactions for the purpose of these disclosures.
The volume of forward foreign currency contract and future contract activity, as a percentage of net assets, for Growth Markets Fund, based on gross month-end notional amounts outstanding during the period, including long and short positions at absolute value, was as follows for the six months ended May 31, 2012:
| Growth Markets Fund |
Forwards |
Futures |
||||||
| Average Notional Amount Outstanding |
54.72% | 184.86% | ||||||
| Highest Notional Amount Outstanding |
94.48% | 234.64% | ||||||
| Lowest Notional Amount Outstanding |
26.52% | 169.66% | ||||||
| Notional Amount Outstanding as of May 31, 2012 |
94.48% | 234.64% | ||||||
Notional amounts outstanding at the end of the prior period are included in the averages above.
Unrealized gain and/or loss on open forwards and futures are recorded in the Consolidated Statements of Assets and Liabilities. The aggregate notional values of forwards and futures are not recorded in the Consolidated Statements of Assets and Liabilities, and therefore are not included in Growth Markets Fund’s net assets.
The volume of option contract activity, as a percentage of investments in common stocks, for Gateway International Fund, based on month-end notional amounts outstanding during the period, at absolute value, was as follows for the period ended May 31, 2012:
| Gateway International Fund* |
Call Options |
Put Options |
||||||
| Average Notional Amount Outstanding |
97.69% | 97.69% | ||||||
| Highest Notional Amount Outstanding |
97.83% | 97.83% | ||||||
| Lowest Notional Amount Outstanding |
97.55% | 97.55% | ||||||
| Notional Amount Outstanding as of May 31, 2012 |
97.83% | 97.83% | ||||||
* Notional amounts outstanding are determined by multiplying option contracts by the contract multiplier by the price of the option’s underlying index.
45 |
Table of Contents
Notes to Financial Statements (continued)
May 31, 2012 (Unaudited)
The volume of option contract activity, as a percentage of net assets, for Capital Income Fund, based on month-end market values of equity securities underlying written options, at absolute value, was as follows for the period ended May 31, 2012:
| Capital Income Fund** |
Put Options Written |
|||
| Average Market Value of Underlying Securities |
0.25% | |||
| Highest Market Value of Underlying Securities |
0.52% | |||
| Lowest Market Value of Underlying Securities |
0.00% | |||
| Market Value of Underlying Securities as of May 31, 2012 |
0.00% | |||
** Market value of underlying securities is determined by multiplying option shares by the price of the option’s underlying security, as determined by Capital Income Fund’s Pricing Policies and Procedures.
The following is a summary of Gateway International Fund’s written option activity:
| Number of |
Premiums |
|||||||
| Options written |
1,010 | $ | 1,301,900 | |||||
| Options terminated in closing purchase transactions |
(642 | ) | (787,907 | ) | ||||
| Options expired |
— | — | ||||||
|
|
|
|
|
|||||
| Outstanding at May 31, 2012 |
368 | $ | 513,993 | |||||
|
|
|
|
|
|||||
The following is a summary of Capital Income Fund’s written option activity:
| Number of |
Premiums |
|||||||
| Options written |
16 | $ | 1,588 | |||||
| Options terminated in closing purchase transactions |
— | — | ||||||
| Options exercised |
(16 | ) | (1,588 | ) | ||||
| Options expired |
— | — | ||||||
|
|
|
|
|
|||||
| Outstanding at May 31, 2012 |
— | $ | — | |||||
|
|
|
|
|
|||||
5. Purchases and Sales of Securities. For the six months ended May 31, 2012, purchases and proceeds from sales or maturities of short-term obligations were as follows:
| Fund |
Purchases |
Sales/Maturities |
||||||
| Growth Markets Fund |
$ | 105,816,337 | $ | 104,370,050 | ||||
For the period ended May 31, 2012, purchases and sales of securities (excluding short-term investments and U.S. Government/Agency securities and including paydowns) were as follows:
| Fund |
Purchases |
Sales |
||||||
| Growth Markets Fund |
$ | 2,810,448 | $ | 3,401,851 | ||||
| Gateway International Fund |
21,483,736 | 774,435 | ||||||
| Capital Income Fund |
16,796,887 | 459,361 | ||||||
| Senior Floating Rate and Fixed Income Fund |
35,613,784 | 28,694,130 | ||||||
6. Management Fees and Other Transactions with Affiliates.
a. Management Fees. AlphaSimplex Group, LLC (“AlphaSimplex”), which is a subsidiary of Natixis US, serves as investment adviser to Growth Markets Fund. Under the terms of the management agreement, the Fund pays a management fee at the annual rate of 1.20%, calculated daily and payable monthly, based on the Fund’s average daily net assets, less the net asset value of the Subsidiary.
AlphaSimplex also serves as investment adviser to the Subsidiary, which pays AlphaSimplex a management fee at the annual rate of 1.20% of its average daily net assets.
| 46
Table of Contents
Notes to Financial Statements (continued)
May 31, 2012 (Unaudited)
AlphaSimplex has entered into subadvisory agreements with Reich & Tang Asset Management, LLC (“Reich & Tang”), which is a subsidiary of Natixis US, and Westpeak Global Advisors, LLC (“Westpeak”) on behalf of Growth Markets Fund. Payments to AlphaSimplex are reduced by the amount of payments to Reich & Tang and Westpeak.
Gateway Advisers, which is a subsidiary of Natixis US, serves as investment adviser to the Gateway International Fund. Under the terms of the management agreement, the Fund pays a management fee at the annual rate of 0.75%, calculated daily and payable monthly, based on the Fund’s average daily net assets.
Loomis Sayles serves as investment adviser to Capital Income Fund and Senior Floating Rate and Fixed Income Fund. Under the terms of the management agreements, each Fund pays a management fee at the annual rate of 0.60%, calculated daily and payable monthly, based on Capital Income Fund’s average daily net assets and Senior Floating Rate and Fixed Income Fund’s daily managed assets, which include borrowings used for leverage.
AlphaSimplex, Gateway Advisers and Loomis Sayles have given binding undertakings to the Funds to waive management fees and/or reimburse certain expenses, including expenses of the Subsidiary, if applicable, to limit the Funds’ operating expenses, exclusive of acquired fund fees and expenses, brokerage expenses, interest expense, taxes and extraordinary expenses. These undertakings are in effect until March 31, 2013 and are reevaluated on an annual basis. Management fees payable, as reflected on the Consolidated Statements of Assets and Liabilities, is net of waivers and/or expense reimbursements, if any, pursuant to these undertakings. Waivers/reimbursements that exceed management fees payable are reflected on the Consolidated Statements of Assets and Liabilities as receivable from investment adviser.
For the period ended May 31, 2012, the expense limits as a percentage of average daily net assets under the expense limitation agreements were as follows:
| Expense Limit as a Percentage of Average Daily Net Assets |
||||||||||||
| Fund |
Class A |
Class C |
Class Y |
|||||||||
| Growth Markets Fund |
1.70% | 2.45% | 1.45% | |||||||||
| Gateway International Fund |
1.35% | 2.10% | 1.10% | |||||||||
| Capital Income Fund |
1.20% | 1.95% | 0.95% | |||||||||
| Senior Floating Rate and Fixed Income Fund |
1.10% | 1.85% | 0.85% | |||||||||
AlphaSimplex, Gateway Advisers and Loomis Sayles shall be permitted to recover expenses they have borne under the expense limitation agreements (whether through waiver of its management fees or otherwise) on a class by class basis in later periods to the extent the expenses of a class fall below a class’ expense limits, provided, however, that a class is not obligated to pay such waived/reimbursed fees or expenses more than one year after the end of the fiscal year in which the fees or expenses were waived/reimbursed.
For the period ended May 31, 2012, the management fees and waivers of management fees for each Fund were as follows:
| Fund |
Gross Management Fees |
Waivers of Management Fees1 |
Net Management Fees |
Percentage of Average Daily Net Assets |
||||||||||||||||
| Gross |
Net |
|||||||||||||||||||
| Growth Markets Fund |
$ | 156,766 | $ | 156,573 | $ | 193 | 1.20% | 0.00% | ||||||||||||
| Gateway International Fund |
24,973 | 24,973 | — | 0.75% | — | |||||||||||||||
| Capital Income Fund |
14,270 | 14,270 | — | 0.60% | — | |||||||||||||||
| Senior Floating Rate and Fixed Income Fund |
136,196 | 127,714 | 8,482 | 0.60% | 0.04% | |||||||||||||||
| 1 | Management fee waivers are subject to possible recovery until November 30, 2013. |
For the period ended May 31, 2012 expenses have been reimbursed as follows:
| Fund |
Reimbursement2 |
|||
| Gateway International Fund |
$ | 35,739 | ||
| Capital Income Fund |
11,232 | |||
| 2 | Expense reimbursements are subject to possible recovery until November 30, 2013. |
47 |
Table of Contents
Notes to Financial Statements (continued)
May 31, 2012 (Unaudited)
No expenses were recovered for any of the Funds during the period ended May 31, 2012 under the terms of the expense limitation agreements.
Certain officers and employees of Loomis Sayles are also officers or Trustees of the Trusts. Loomis Sayles’ general partner is indirectly owned by Natixis US, which is part of Natixis Global Asset Management, an international asset management group based in Paris, France.
b. Service and Distribution Fees. NGAM Distribution has entered into a distribution agreement with the Trusts. Pursuant to this agreement, NGAM Distribution serves as principal underwriter of the Funds of the Trusts.
Pursuant to Rule 12b-1 under the 1940 Act, the Trusts have adopted a Service Plan relating to each Fund’s Class A shares (the “Class A Plans”) and a Distribution and Service Plan relating to each Fund’s Class C shares (the “Class C Plans”).
Under the Class A Plans, each Fund pays NGAM Distribution a monthly service fee at an annual rate not to exceed 0.25% of the average daily net assets attributable to the Funds’ Class A shares, as reimbursement for expenses incurred by NGAM Distribution in providing personal services to investors in Class A shares and/or the maintenance of shareholder accounts.
Under the Class C Plans, each Fund pays NGAM Distribution a monthly service fee at an annual rate not to exceed 0.25% of the average daily net assets attributable to the Funds’ Class C shares, as compensation for services provided by NGAM Distribution in providing personal services to investors in Class C shares and/or the maintenance of shareholder accounts.
Also under the Class C Plans, each Fund pays NGAM Distribution a monthly distribution fee at the annual rate of 0.75% of the average daily net assets attributable to the Funds’ Class C shares, as compensation for services provided by NGAM Distribution in connection with the marketing or sale of Class C shares.
For the period ended May 31, 2012, the Funds paid the following service and distribution fees:
| Service Fees | Distribution Fees |
|||||||||||
| Fund |
Class A |
Class C |
Class C |
|||||||||
| Growth Markets Fund |
$ | 157 | $ | 4 | $ | 14 | ||||||
| Gateway International Fund |
4 | 8 | 24 | |||||||||
| Capital Income Fund |
77 | 17 | 52 | |||||||||
| Senior Floating Rate and Fixed Income Fund |
1,287 | 622 | 1,866 | |||||||||
c. Administrative Fees. NGAM Advisors provides certain administrative services for the Funds and contracts with State Street Bank and Trust Company (“State Street Bank”) to serve as sub-administrator. Pursuant to an agreement among Natixis Funds Trust I, Natixis Funds Trust II, Natixis Funds Trust IV, Gateway Trust (“Natixis Funds Trusts”), Loomis Sayles Funds I, Loomis Sayles Funds II (“Loomis Sayles Funds Trusts”), Hansberger International Series and NGAM Advisors, each Fund pays NGAM Advisors monthly its pro rata portion of fees equal to an annual rate of 0.0575% of the first $15 billion of the average daily net assets of the Natixis Funds Trusts, Loomis Sayles Funds Trusts and Hansberger International Series, 0.0500% of the next $15 billion, 0.0400% of the next $30 billion and 0.0350% of such assets in excess of $60 billion, subject to an annual aggregate minimum fee for the Natixis Funds Trusts, Loomis Sayles Funds Trusts and Hansberger International Series of $10 million, which is reevaluated on an annual basis.
NGAM Advisors also provides certain administrative services to the Subsidiary for which the Subsidiary pays NGAM Advisors fees equal to an annual rate of 0.05% of the average daily net assets of the Subsidiary. Payments by the Fund are reduced by the amount of payments to NGAM Advisors by the Subsidiary. In addition, NGAM Advisors and the Subsidiary contract with State Street Bank to serve as sub-administrator.
For the period ended May 31, 2012, each Fund paid the following administrative fees to NGAM Advisors (exclusive of sub-administrative fees paid to State Street Bank by the Subsidiary):
| 48
Table of Contents
Notes to Financial Statements (continued)
May 31, 2012 (Unaudited)
| Fund |
Administrative |
|||
| Growth Markets Fund |
$ | 5,978 | ||
| Gateway International Fund |
1,506 | |||
| Capital Income Fund |
1,077 | |||
| Senior Floating Rate and Fixed Income Fund |
10,348 | |||
d. Sub-Transfer Agent Fees. NGAM Distribution has entered into agreements with financial intermediaries to provide certain recordkeeping, processing, shareholder communications and other services to customers of the intermediaries and has agreed to compensate the intermediaries for providing those services. Certain services would be provided by the Funds if the shares of those customers were registered directly with the Fund’s transfer agent. Accordingly, the Funds have agreed to reimburse NGAM Distribution for a portion of the intermediary fees attributable to shares of the Funds held by the intermediaries (which generally is a percentage of the value of shares held) not to exceed what the Funds would have paid their transfer agent had each customer’s shares been registered directly with the transfer agent instead of being held through the intermediaries.
For the period ended May 31, 2012, the Funds paid the following sub-transfer agent fees, which are reflected in transfer agent fees and expenses in the Consolidated Statements of Operations:
| Fund |
Sub-Transfer |
|||
| Growth Markets Fund |
$ | 78 | ||
| Gateway International Fund |
2 | |||
| Capital Income Fund |
10 | |||
| Senior Floating Rate and Fixed Income Fund |
199 | |||
As of May 31, 2012, the Funds owe NGAM Distribution the following reimbursements for sub-transfer agent fees:
| Fund |
Reimbursement of |
|||
| Growth Markets Fund |
$ | 2 | ||
| Gateway International Fund |
1 | |||
| Capital Income Fund |
6 | |||
| Senior Floating Rate and Fixed Income Fund |
49 | |||
e. Commissions. Commissions (including CDSCs) on Fund shares retained by NGAM Distribution during the period ended May 31, 2012 were as follows:
| Fund |
Commissions |
|||
| Growth Markets Fund |
$ | 1,112 | ||
| Capital Income Fund |
115 | |||
| Senior Floating Rate and Fixed Income Fund |
13,763 | |||
f. Trustees Fees and Expenses. The Trusts do not pay any compensation directly to their officers or Trustees who are directors, officers or employees of NGAM Advisors, NGAM Distribution, Natixis US or their affiliates. Effective January 1, 2012, the Chairperson of the Board receives a retainer fee at the annual rate of $265,000. The Chairperson does not receive any meeting attendance fees for Board of Trustees meetings or committee meetings that she attends. Each Independent Trustee (other than the Chairperson) receives, in the aggregate, a retainer fee at the annual rate of $95,000. Each Independent Trustee also receives a meeting attendance fee of $10,000 for each meeting of the Board of Trustees that he or she attends in person and $5,000 for each meeting of the Board of Trustees that he or she attends telephonically. In addition, each committee chairman receives an additional retainer fee at the annual rate of $15,000. Each Contract Review and Governance Committee member is compensated $6,000 for each Committee meeting that he or she attends in person and $3,000 for each meeting that he or she attends telephonically. Each Audit Committee member is compensated $7,500 for each Committee meeting that he or she attends in person and $3,750 for each meeting that he or she attends telephonically. These fees are allocated among the funds in the Natixis Funds Trusts, Loomis Sayles Funds Trusts and Hansberger International Series based on a formula that takes into account, among other factors, the relative net assets of each fund. Trustees are reimbursed for travel expenses in connection with attendance at meetings.
49 |
Table of Contents
Notes to Financial Statements (continued)
May 31, 2012 (Unaudited)
Prior to January 1, 2012, the Chairperson of the Board received a retainer fee at the annual rate of $250,000 and each Independent Trustee (other than the Chairperson) received, in aggregate, a retainer fee at the annual rate of $80,000. All other Trustee fees remain unchanged.
A deferred compensation plan (the “Plan”) is available to the Trustees on a voluntary basis. Deferred amounts remain in the Funds until distributed in accordance with the provisions of the Plan. The value of a participating Trustee’s deferral account is based on theoretical investments of deferred amounts, on the normal payment dates, in certain funds of the Natixis Funds Trusts, Loomis Sayles Funds Trusts and Hansberger International Series as designated by the participating Trustees. Changes in the value of participants’ deferral accounts are allocated pro rata among the funds in the Natixis Funds Trusts, Loomis Sayles Funds Trusts, and Hansberger International Series, and are normally reflected as Trustees’ fees and expenses in the Consolidated Statements of Operations. The portions of the accrued obligations allocated to the Funds under the Plan are reflected as Deferred Trustees’ fees in the Consolidated Statements of Assets and Liabilities.
g. Affiliated Ownership. As of May 31, 2012, Gateway Advisers, Loomis Sayles and Natixis US held shares of the Funds representing the following percentages of net assets:
| Fund |
Gateway |
Loomis Sayles |
Natixis |
Percentage of Affiliated Ownership |
||||||||||||
| Growth Markets Fund |
— | — | 94.15% | 94.15% | ||||||||||||
| Gateway International Fund |
24.07% | — | 72.22% | 96.29% | ||||||||||||
| Capital Income Fund |
— | 29.47% | 29.47% | 58.94% | ||||||||||||
| Senior Floating Rate and Fixed Income Fund |
— | 41.42% | 31.87% | 73.29% | ||||||||||||
7. Line of Credit. Each Fund, together with certain other funds of Natixis Funds Trusts, Loomis Sayles Funds Trusts and Hansberger International Series, participates in a $200,000,000 committed unsecured line of credit provided by State Street Bank, with an individual limit of $125,000,000 for each fund that participates in the line of credit. Interest is charged to each participating fund based on its borrowings at a rate per annum equal to the greater of the Federal Funds rate or overnight LIBOR, plus 1.25%. In addition, a commitment fee of 0.10% per annum, payable at the end of each calendar quarter, is accrued and apportioned among the participating funds based on their average daily unused portion of the line of credit. Prior to April 19, 2012, the commitment fee was 0.125% per annum.
For the period ended May 31, 2012, none of the Funds had borrowings under these agreements.
Senior Floating Rate and Fixed Income Fund has entered into a committed, secured line of credit with the Bank of Nova Scotia (the “Bank”), under which it expects to borrow for investment purposes. The commitment of the Bank to make loans to the Fund shall not exceed $35,000,000 at any one time. Interest is charged to the Fund based upon the terms set forth in the agreement. In addition, a commitment fee of 0.25% per annum (0.125% per annum for dates upon which the loan balance exceeds 50% of the commitment), payable at the end of each calendar quarter is accrued by the Fund based on the unused portion of the line of credit.
For the six months ended May 31, 2012, Senior Floating Rate and Fixed Income Fund had no borrowings under this agreement.
8. Concentration of Risk. Each Fund’s investments in foreign securities are subject to foreign currency fluctuations, higher volatility than U.S. securities, varying degrees of regulation and limited liquidity. Greater political, economic, credit and information risks are also associated with foreign securities.
The Growth Markets Fund and Senior Floating Rate and Fixed Income Fund are non-diversified, which means that they are not limited under the 1940 Act to a percentage of assets that they may invest in any one issuer. Because the Funds may invest in the securities of a limited number of issuers, an investment in the Funds may involve a higher degree of risk than would be present in a diversified portfolio.
| 50
Table of Contents
Notes to Financial Statements (continued)
May 31, 2012 (Unaudited)
Growth Markets Fund’s investments in emerging markets companies, which may be smaller and have shorter operating histories than companies in developed markets, involves risks in addition to, and greater than, those generally associated with investing in companies in developed foreign markets. The extent of economic development, political stability, market depth, infrastructure, capitalization and regulatory oversight in emerging market economies is generally less than in more developed markets.
Growth Markets Fund’s investments in commodity-related instruments may subject the Fund to greater volatility than investments in other securities. The value of these investments may be affected by changes in overall market movements, commodity index volatility, changes in interest rates, or factors affecting a particular industry or commodity.
The senior loans in which Senior Floating Rate and Fixed Income Fund expect to invest will generally not be rated investment grade by the rating agencies. Economic downturns generally increase non-payment rates and a senior loan could lose a substantial part of its value prior to default. Senior loans are subject to credit risk, and secured loans may not be adequately collateralized. The interest rates of senior loans reset frequently, and thus senior loans are subject to interest rate risk. Senior loans typically have less liquidity than investment grade bonds and there may be less public information available about them as compared to investment grade bonds.
9. Interest Expense. Growth Markets Fund incurs interest expense on net cash and foreign currency debit balances, if any, for accounts held at brokers. Interest expense incurred for the six months ended May 31, 2012 is reflected on the Consolidated Statements of Operations.
10. Concentration of Ownership. From time to time, the Funds may have a concentration of one or more shareholders holding a significant percentage of shares outstanding. Investment activities of these shareholders could have material impacts on the Funds. As of May 31, 2012, the Funds had shareholders that owned more than 5% of the Fund’s total outstanding shares. The number of shareholders owning more than 5% of total outstanding shares of the Fund, based on accounts that represent more than 5% of an individual class of shares, and the aggregate percentage of net assets represented by such holdings, including affiliated accounts, was as follows:
| Fund |
Number of 5% Non-affiliated |
Percentage of |
Percentage of |
Total |
||||||||||||
| Growth Markets Fund |
— | — | 94.15% | 94.15% | ||||||||||||
| Gateway International Fund |
— | — | 96.29% | 96.29% | ||||||||||||
| Capital Income Fund |
1 | 30.11% | 58.94% | 89.05% | ||||||||||||
| Senior Floating Rate and Fixed Income Fund |
— | — | 73.29% | 73.29% | ||||||||||||
11. Capital Shares. Each Fund may issue an unlimited number of shares of beneficial interest, without par value. Transactions in capital shares were as follows:
| |
Six Months Ended May 31, 2012 |
|
|
Period Ended November 30, 2011* |
| |||||||||||
| Growth Markets Fund | Shares | Amount | Shares | Amount | ||||||||||||
| Class A | ||||||||||||||||
| Issued from the sale of shares |
76,358 | $ | 758,255 | 1,589 | $ | 16,102 | ||||||||||
| Issued in connection with the reinvestment of distributions |
54 | 532 | — | — | ||||||||||||
| Redeemed |
(22,018 | ) | (207,464 | ) | — | — | ||||||||||
|
|
|
|
|
|
|
|
|
|||||||||
| Net change |
54,394 | $ | 551,323 | 1,589 | $ | 16,102 | ||||||||||
|
|
|
|
|
|
|
|
|
|||||||||
| Class C | ||||||||||||||||
| Issued from the sale of shares |
3,848 | $ | 35,600 | 100 | $ | 1,000 | ||||||||||
| Issued in connection with the reinvestment of distributions |
1 | 10 | — | — | ||||||||||||
| Redeemed |
— | — | — | — | ||||||||||||
|
|
|
|
|
|
|
|
|
|||||||||
| Net change |
3,849 | $ | 35,610 | 100 | $ | 1,000 | ||||||||||
|
|
|
|
|
|
|
|
|
|||||||||
| Class Y | ||||||||||||||||
| Issued from the sale of shares |
122,442 | $ | 1,234,334 | 2,511,272 | $ | 25,115,210 | ||||||||||
| Issued in connection with the reinvestment of distributions |
30,034 | 297,334 | — | — | ||||||||||||
| Redeemed |
(36,803 | ) | (365,394 | ) | — | — | ||||||||||
|
|
|
|
|
|
|
|
|
|||||||||
| Net change |
115,673 | $ | 1,166,274 | 2,511,272 | $ | 25,115,210 | ||||||||||
|
|
|
|
|
|
|
|
|
|||||||||
| Increase (decrease) from capital share transactions |
173,916 | $ | 1,753,207 | 2,512,961 | $ | 25,132,312 | ||||||||||
|
|
|
|
|
|
|
|
|
|||||||||
* From commencement of operations on October 21, 2011 through November 30, 2011.
51 |
Table of Contents
Notes to Financial Statements (continued)
May 31, 2012 (Unaudited)
11. Capital Shares (continued).
| |
Period Ended May 31, 2012* |
| ||||||
| Gateway International Fund | Shares | Amount | ||||||
| Class A | ||||||||
| Issued from the sale of shares |
4,161 | $ | 39,501 | |||||
| Issued in connection with the reinvestment of distributions |
— | — | ||||||
| Redeemed |
— | — | ||||||
|
|
|
|
|
|||||
| Net change |
4,161 | $ | 39,501 | |||||
|
|
|
|
|
|||||
| Class C | ||||||||
| Issued from the sale of shares |
6,085 | $ | 58,273 | |||||
| Issued in connection with the reinvestment of distributions |
— | — | ||||||
| Redeemed |
— | — | ||||||
|
|
|
|
|
|||||
| Net change |
6,085 | $ | 53,273 | |||||
|
|
|
|
|
|||||
| Class Y | ||||||||
| Issued from the sale of shares |
2,066,911 | $ | 20,638,501 | |||||
| Issued in connection with the reinvestment of distributions |
— | — | ||||||
| Redeemed |
— | — | ||||||
|
|
|
|
|
|||||
| Net change |
2,066,911 | $ | 20,638,501 | |||||
|
|
|
|
|
|||||
| Increase (decrease) from capital share transactions |
2,077,157 | $ | 20,736,275 | |||||
|
|
|
|
|
|||||
* From commencement of operations on March 30, 2012 through May 31, 2012.
| |
Period Ended May 31, 2012* |
| ||||||
| Capital Income Fund | Shares | Amount | ||||||
| Class A | ||||||||
| Issued from the sale of shares |
144,784 | $ | 1,403,905 | |||||
| Issued in connection with the reinvestment of distributions |
— | — | ||||||
| Redeemed |
(192 | ) | (1,883 | ) | ||||
|
|
|
|
|
|||||
| Net change |
144,592 | $ | 1,402,022 | |||||
|
|
|
|
|
|||||
| Class C | ||||||||
| Issued from the sale of shares |
6,311 | $ | 62,492 | |||||
| Issued in connection with the reinvestment of distributions |
— | — | ||||||
| Redeemed |
— | — | ||||||
|
|
|
|
|
|||||
| Net change |
6,311 | $ | 62,492 | |||||
|
|
|
|
|
|||||
| Class Y | ||||||||
| Issued from the sale of shares |
1,545,395 | $ | 15,339,284 | |||||
| Issued in connection with the reinvestment of distributions |
— | — | ||||||
| Redeemed |
— | — | ||||||
|
|
|
|
|
|||||
| Net change |
1,545,395 | $ | 15,339,284 | |||||
|
|
|
|
|
|||||
| Increase (decrease) from capital share transactions |
1,696,298 | $ | 16,803,798 | |||||
|
|
|
|
|
|||||
* From commencement of operations on March 30, 2012 through May 31, 2012.
| 52
Table of Contents
Notes to Financial Statements (continued)
May 31, 2012 (Unaudited)
11. Capital Shares (continued).
| |
Six Months Ended May 31, 2012 |
|
|
Period Ended November 30, 2011* |
| |||||||||||
| Senior Floating Rate and Fixed Income Fund | Shares | Amount | Shares | Amount | ||||||||||||
| Class A | ||||||||||||||||
| Issued from the sale of shares |
568,037 | $ | 5,907,787 | 27,583 | $ | 277,148 | ||||||||||
| Issued in connection with the reinvestment of distributions |
3,265 | 33,763 | 114 | 1,145 | ||||||||||||
| Redeemed |
(5,203 | ) | (54,264 | ) | (2,604 | ) | (26,365 | ) | ||||||||
|
|
|
|
|
|
|
|
|
|||||||||
| Net change |
566,099 | $ | 5,887,286 | 25,093 | $ | 251,928 | ||||||||||
|
|
|
|
|
|
|
|
|
|||||||||
| Class C | ||||||||||||||||
| Issued from the sale of shares |
226,797 | $ | 2,353,794 | 102 | $ | 1,000 | ||||||||||
| Issued in connection with the reinvestment of distributions |
1,247 | 12,905 | 1 | 9 | ||||||||||||
| Redeemed |
(202 | ) | (2,076 | ) | — | — | ||||||||||
|
|
|
|
|
|
|
|
|
|||||||||
| Net change |
227,842 | $ | 2,364,623 | 103 | $ | 1,009 | ||||||||||
|
|
|
|
|
|
|
|
|
|||||||||
| Class Y | ||||||||||||||||
| Issued from the sale of shares |
598,191 | $ | 6,213,475 | 4,010,040 | $ | 40,101,000 | ||||||||||
| Issued in connection with the reinvestment of distributions |
143,009 | 1,469,241 | 43,595 | 435,951 | ||||||||||||
| Redeemed |
(566,414 | ) | (5,876,362 | ) | — | — | ||||||||||
|
|
|
|
|
|
|
|
|
|||||||||
| Net change |
174,786 | $ | 1,806,354 | 4,053,635 | $ | 40,536,951 | ||||||||||
|
|
|
|
|
|
|
|
|
|||||||||
| Increase (decrease) from capital share transactions |
968,727 | $ | 10,058,263 | 4,078,831 | $ | 40,789,888 | ||||||||||
|
|
|
|
|
|
|
|
|
|||||||||
* From commencement of operations on September 30, 2011 through November 30, 2011 for Class A shares and Class C shares and from commencement of operations on September 16, 2011 through November 30, 2011 for Class Y shares.
53 |
Table of Contents
Item 2. Code of Ethics.
Not applicable.
Item 3. Audit Committee Financial Expert.
Not applicable.
Item 4. Principal Accountant Fees and Services.
Not applicable.
Item 5. Audit Committee of Listed Registrants.
Not applicable.
Item 6. Schedule of Investments.
Included as part of the Report to Shareholders filed as Item 1 herewith.
Item 7. Disclosure of Proxy Voting Policies and Procedures for Closed-End Management Investment Companies.
Not applicable.
Item 8. Portfolio Managers of Closed-End Management Investment Companies
Not applicable.
Item 9. Purchases of Equity Securities by Closed-End Management Investment Companies and Affiliated Purchasers.
Not applicable.
Item 10. Submission of Matters to a Vote of Securities Holders.
There were no material changes to the procedures by which shareholders may recommend nominees to the Registrant’s Board of Trustees.
Item 11. Controls and Procedures.
The Registrant’s principal executive officer and principal financial officer have concluded that the Registrant’s disclosure controls and procedures are sufficient to ensure that information required to be disclosed by the Registrant in this Form N-CSR was recorded, processed, summarized and reported within the time periods specified in the Securities and Exchange Commission’s rules and forms, based upon such officers’ evaluation of these controls and procedures as of a date within 90 days of the filing date of the report.
There were no changes in the Registrant’s internal control over financial reporting that occurred during the Registrant’s last fiscal quarter of the period covered by the report that has materially affected, or is reasonably likely to materially affect, the Registrant’s internal control over financial reporting.
Item 12. Exhibits.
| (a) (1) | Not applicable |
| (a) (2) | Certifications of Principal Executive Officer and Principal Financial Officer pursuant to 30a-2(a) under the Investment Company Act of 1940 (17 CFR 270.30a-2(a)), filed herewith as Exhibits (a)(2)(1) and (a)(2)(2), respectively. |
| (a) (3) | Not applicable. |
| (b) | Certifications of Principal Executive Officer and Principal Financial Officer pursuant to Section 906 of Sarbanes-Oxley Act of 2002 are filed herewith as Exhibit (b). |
Table of Contents
SIGNATURES
Pursuant to the requirements of the Securities Exchange Act of 1934 and the Investment Company Act of 1940, the Registrant has duly caused this report to be signed on its behalf by the undersigned, thereunto duly authorized.
| Natixis Funds Trust II | ||
| By: | /s/ David L. Giunta | |
| Name: | David L. Giunta | |
| Title: | President and Chief Executive Officer | |
| Date: | July 19, 2012 | |
Pursuant to the requirements of the Securities Exchange Act of 1934 and the Investment Company Act of 1940, this report has been signed by the following persons on behalf of the Registrant and in the capacities and on the dates indicated.
| By: | /s/ David L. Giunta | |
| Name: | David L. Giunta | |
| Title: | President and Chief Executive Officer | |
| Date: | July 19, 2012 | |
| By: | /s/ Michael C. Kardok | |
| Name: | Michael C. Kardok | |
| Title: | Treasurer | |
| Date: | July 19, 2012 |