EXHIBIT 99.2
PART II.
Diluted earnings (loss) attributable to common shareholders were $904 million ($2.18 per share) in 2016, compared with $938 million ($2.23 per share) in 2015 and $555 million ($1.29 per share) in 2014. Adjusted Operating Earnings is a non-GAAP measure and is defined as net earnings from continuing operations (a GAAP measure) excluding special items and non-operating pension expense. International Paper generated Adjusted Operating Earnings Attributable to Common Shareholders of $1.4 billion ($3.35 per share) in 2016, compared with $1.5 billion ($3.65 per share) in 2015, and $1.3 billion ($3.00 per share) in 2014 (see reconciliation on page 19).
Despite a tough global environment, International Paper delivered another year of solid performance, with continued strong cash flow generation and a return on invested capital in excess of our cost of capital. During 2016, we took steps to further strengthen our portfolio. We completed the acquisition of Weyerhaeuser’s pulp business, which we have combined with IP’s legacy pulp business to form our new Global Cellulose Fibers business. We also completed the conversion of a machine at the Riegelwood, North Carolina mill to produce fluff pulp, which coupled with the newly acquired pulp business, gives the Company the capacity to grow both fluff and high-value specialty pulp products. In addition, we also acquired a top-quartile mill asset in Madrid, which we will convert in the second half of 2017 to produce recycled containerboard to support our EMEA Industrial Packaging business. Finally, we were able to return cash to our shareholders in the form of a 5% increase in the annual dividend, making it the fifth consecutive year of a dividend increase.
Our 2016 results reflect margin pressure across most of our businesses throughout the year along with escalating input costs, primarily natural gas and OCC, in the later portion of the year. Full-year 2016 earnings were impacted by price erosion and weaker mix across many of our businesses, in particular, our North American Industrial Packaging business which experienced lower export pricing and the impact of early 2016 pricing index changes to boxes. Volume was positive compared to 2015, primarily driven by increased North American box demand. Manufacturing operations, despite solid performance across our mill systems, were negatively impacted by the Riegelwood conversion and ramp up,
Hurricane Matthew, and inventory valuation charges associated with the October containerboard price increase. We did see signs of strengthening in some of our key markets in the second half of the year, which enabled us to announce and implement price increases across various businesses that will benefit us in 2017. Our Ilim joint venture had another solid year in 2016, experiencing strong demand which led to record full-year production.
Looking ahead to the 2017 first quarter, we expect sales volumes for North American Industrial Packaging to be slightly higher despite seasonally lower daily shipments due to four more shipping days. Sales volumes for Global Cellulose Fibers will be higher due to the full-quarter impact of the newly acquired pulp business. In addition, sales volumes for EMEA Industrial Packaging, North American Printing Papers and North American Consumer Packaging are also expected to be seasonally higher. Pricing is expected to increase for both North American Industrial Packaging and Brazilian Industrial Packaging, reflecting the continuing implementation of box price increases announced in 2016. Pricing for both North American Printing Papers and North American Consumer Packaging is expected to be lower due to market pressures. Planned maintenance outages are expected to increase due to a heavy outage quarter, including a significant outage currently underway at the Global Cellulose Fibers Port Wentworth mill. Input costs are expected to increase primarily for our North American operations, largely driven by natural gas, wood and OCC. Additionally, we expect the results of Ilim to be sequentially lower, primarily due to seasonally lower volumes and seasonally higher input costs.
Looking to full year 2017, we are encouraged by an improving economic climate and are eager to begin the integration of our newly acquired pulp business, driving the anticipated synergies to the bottom line. We expect higher earnings in our North American Industrial Packaging business through benefits from the previously announced price increase, growing demand from our customers and improvement initiatives. We also expect to improve margins with continued strong operations and extensive cost reduction efforts across many of our other businesses. Additionally, we are on track for our planned conversion of the Madrid mill in the second half of the year, which will enable a better offering for our customers and earnings improvement for our EMEA Industrial Packaging business. Finally, with the strong cash flow that we expect from all of these initiatives, we will continue to allocate capital to create value with a near-term focus on debt reduction and returning value to our shareholders.
Adjusted Operating Earnings and Adjusted Operating Earnings Per Share are non-GAAP measures. Diluted
1
earnings (loss) and Diluted earnings (loss) per share attributable to common shareholders are the most direct comparable GAAP measures. The Company calculates Adjusted Operating Earnings by excluding the after-tax effect of items considered by management to be unusual, from the earnings reported under GAAP, non-operating pension expense (includes all U.S. pension costs, excluding service costs and prior service costs), and discontinued operations. Adjusted Operating Earnings Per Share is calculated by dividing Adjusted Operating Earnings by diluted average shares of common stock outstanding. Management uses this measure to focus on on-going operations, and believes that it is useful to investors because it enables them to perform meaningful comparisons of past and present operating results. The Company believes that using this information, along with the most direct comparable GAAP measure, provides for a more complete analysis of the results of operations.
Diluted earnings (loss) attributable to common shareholders were $0.53 in the 2016 fourth quarter, compared with $0.75 in the 2016 third quarter and $0.43 in the 2015 fourth quarter. Adjusted Operating Earnings attributable to common shareholders of $303 million ($0.73 per share) in the 2016 fourth quarter were lower than both the $380 million ($0.91 per share) in the 2016 third quarter and the $361 million ($0.87 per share) in the 2015 fourth quarter.
The following are reconciliations of Diluted earnings (loss) attributable to common shareholders to Adjusted operating earnings attributable to common shareholders.
2016 | 2015 | 2014 | |||||||
Diluted Earnings (Loss) Attributable to Shareholders | $ | 904 | $ | 938 | $ | 555 | |||
Add back - Discontinued operations (gain) loss | 5 | — | 13 | ||||||
Diluted Earnings (Loss) from Continuing Operations | 909 | 938 | 568 | ||||||
Add back - Non-operating pension (income) expense | 610 | 258 | 212 | ||||||
Add back - Net special items expense (income) | 182 | 559 | 1,052 | ||||||
Income tax effect - Non-operating pension and special items expense | (309 | ) | (221 | ) | (536 | ) | |||
Adjusted Operating Earnings (Loss) Attributable to Shareholders | $ | 1,392 | $ | 1,534 | $ | 1,296 | |||
2016 | 2015 | 2014 | |||||||
Diluted Earnings (Loss) Per Share Attributable to Shareholders | $ | 2.18 | $ | 2.23 | $ | 1.29 | |||
Add back - Discontinued operations (gain) loss per share | 0.01 | — | 0.02 | ||||||
Diluted Earnings (Loss) Per Share from Continuing Operations | 2.19 | 2.23 | 1.31 | ||||||
Add back - Non-operating pension (income) expense | 1.47 | 0.61 | 0.49 | ||||||
Add back - Net special items expense (income) | 0.44 | 1.33 | 2.44 | ||||||
Income tax effect - Non-operating pension and special items expense | (0.75 | ) | (0.52 | ) | (1.24 | ) | |||
Adjusted Operating Earnings (Loss) Per Share Attributable to Shareholders | $ | 3.35 | $ | 3.65 | $ | 3.00 | |||
Three Months Ended December 31, 2016 | Three Months Ended September 30, 2016 | Three Months Ended December 31, 2015 | ||||||||||
Diluted Earnings (Loss) Attributable to Shareholders | $ | 218 | $ | 312 | $ | 178 | ||||||
Add back - Discontinued operations (gain) loss | — | — | — | |||||||||
Diluted Earnings (Loss) from Continuing Operations | 218 | 312 | 178 | |||||||||
Add back - Non-operating pension (income) expense | 37 | 42 | 60 | |||||||||
Add back - Net special items expense (income) | 45 | 66 | 158 | |||||||||
Income tax effect - Non-operating pension and special items expense | 3 | (40 | ) | (35 | ) | |||||||
Adjusted Operating Earnings (Loss) Attributable to Shareholders | $ | 303 | $ | 380 | $ | 361 | ||||||
2
Three Months Ended December 31, 2016 | Three Months Ended September 30, 2016 | Three Months Ended December 31, 2015 | ||||||||||
Diluted Earnings (Loss) Per Share Attributable to Shareholders | $ | 0.53 | $ | 0.75 | $ | 0.43 | ||||||
Add back - Discontinued operations (gain) loss per share | — | — | — | |||||||||
Diluted Earnings (Loss) Per Share from Continuing Operations | 0.53 | 0.75 | 0.43 | |||||||||
Add back - Non-operating pension (income) expense per share | 0.09 | 0.10 | 0.14 | |||||||||
Add back - Net special items expense (income) per share | 0.11 | 0.16 | 0.38 | |||||||||
Income tax effect per share - Non-operating pension and special items expense | — | (0.10 | ) | (0.08 | ) | |||||||
Adjusted Operating Earnings (Loss) Per Share Attributable to Shareholders | $ | 0.73 | $ | 0.91 | $ | 0.87 | ||||||
Free Cash Flow is a non-GAAP measure and the most directly comparable GAAP measure is cash provided by operations. Management believes that Free Cash Flow is useful to investors as a liquidity measure because it measures the amount of cash generated that is available, after reinvesting in the business, to maintain a strong balance sheet, pay dividends, repurchase stock, repay debt and make investments for future growth. It should not be inferred that the entire free cash flow amount is available for discretionary expenditures. By adjusting for certain items that are not indicative of the Company's ongoing performance, free cash flow also enables investors to perform meaningful comparisons between past and present periods. Free Cash Flow of $1.9 billion generated in 2016 was higher than the $1.8 billion generated in 2015, but lower than the $2.1 billion generated in 2014 (see reconciliation on page 30).
Free Cash Flow of $467 million generated in the 2016 fourth quarter was lower than the $575 million generated in the 2016 third quarter and the $501 million generated in the 2015 fourth quarter (see reconciliation on page 30).
Results of Operations
Business Segment Operating Profits are used by International Paper’s management to measure the earnings performance of its businesses. Management believes that this measure allows a better understanding of trends in costs, operating efficiencies, prices and volumes. Business Segment Operating Profits are defined as earnings (loss) from continuing operations before income taxes and equity earnings, but including the impact of equity earnings and noncontrolling interests, excluding corporate items and corporate special items. Business Segment Operating Profits are defined by the
Securities and Exchange Commission as a non-GAAP financial measure, and are not GAAP alternatives to net income or any other operating measure prescribed by accounting principles generally accepted in the United States.
International Paper operates in four segments: Industrial Packaging, Global Cellulose Fibers, Printing Papers and Consumer Packaging.
The following table presents a reconciliation of net earnings (loss) from continuing operations attributable to International Paper Company to its total Business Segment Operating Profit:
In millions | 2016 | 2015 | 2014 | ||||||
Earnings (Loss) From Continuing Operations Attributable to International Paper Company | $ | 909 | $ | 938 | $ | 568 | |||
Add back (deduct) | |||||||||
Income tax provision (benefit) | 247 | 466 | 123 | ||||||
Equity (earnings) loss, net of taxes | (198 | ) | (117 | ) | 200 | ||||
Noncontrolling interests, net of taxes | (2 | ) | (21 | ) | (19 | ) | |||
Earnings (Loss) From Continuing Operations Before Income Taxes and Equity Earnings | 956 | 1,266 | 872 | ||||||
Interest expense, net | 520 | 555 | 601 | ||||||
Noncontrolling interests/equity earnings included in operations | 1 | 8 | 2 | ||||||
Corporate items | 67 | 34 | 49 | ||||||
Corporate special items (income) expense | 46 | 238 | 320 | ||||||
Non-operating pension expense | 610 | 258 | 212 | ||||||
Earnings (Loss) From Continuing Operations Before Income Taxes and Equity Earnings | $ | 2,200 | $ | 2,359 | $ | 2,056 | |||
Business Segment Operating Profit | |||||||||
Industrial Packaging | $1,648 | $1,851 | $1,893 | ||||||
Global Cellulose Fibers | (179 | ) | 68 | 62 | |||||
Printing Papers | 540 | 465 | (77 | ) | |||||
Consumer Packaging | 191 | (25 | ) | 178 | |||||
Total Business Segment Operating Profit | $ | 2,200 | $ | 2,359 | $ | 2,056 | |||
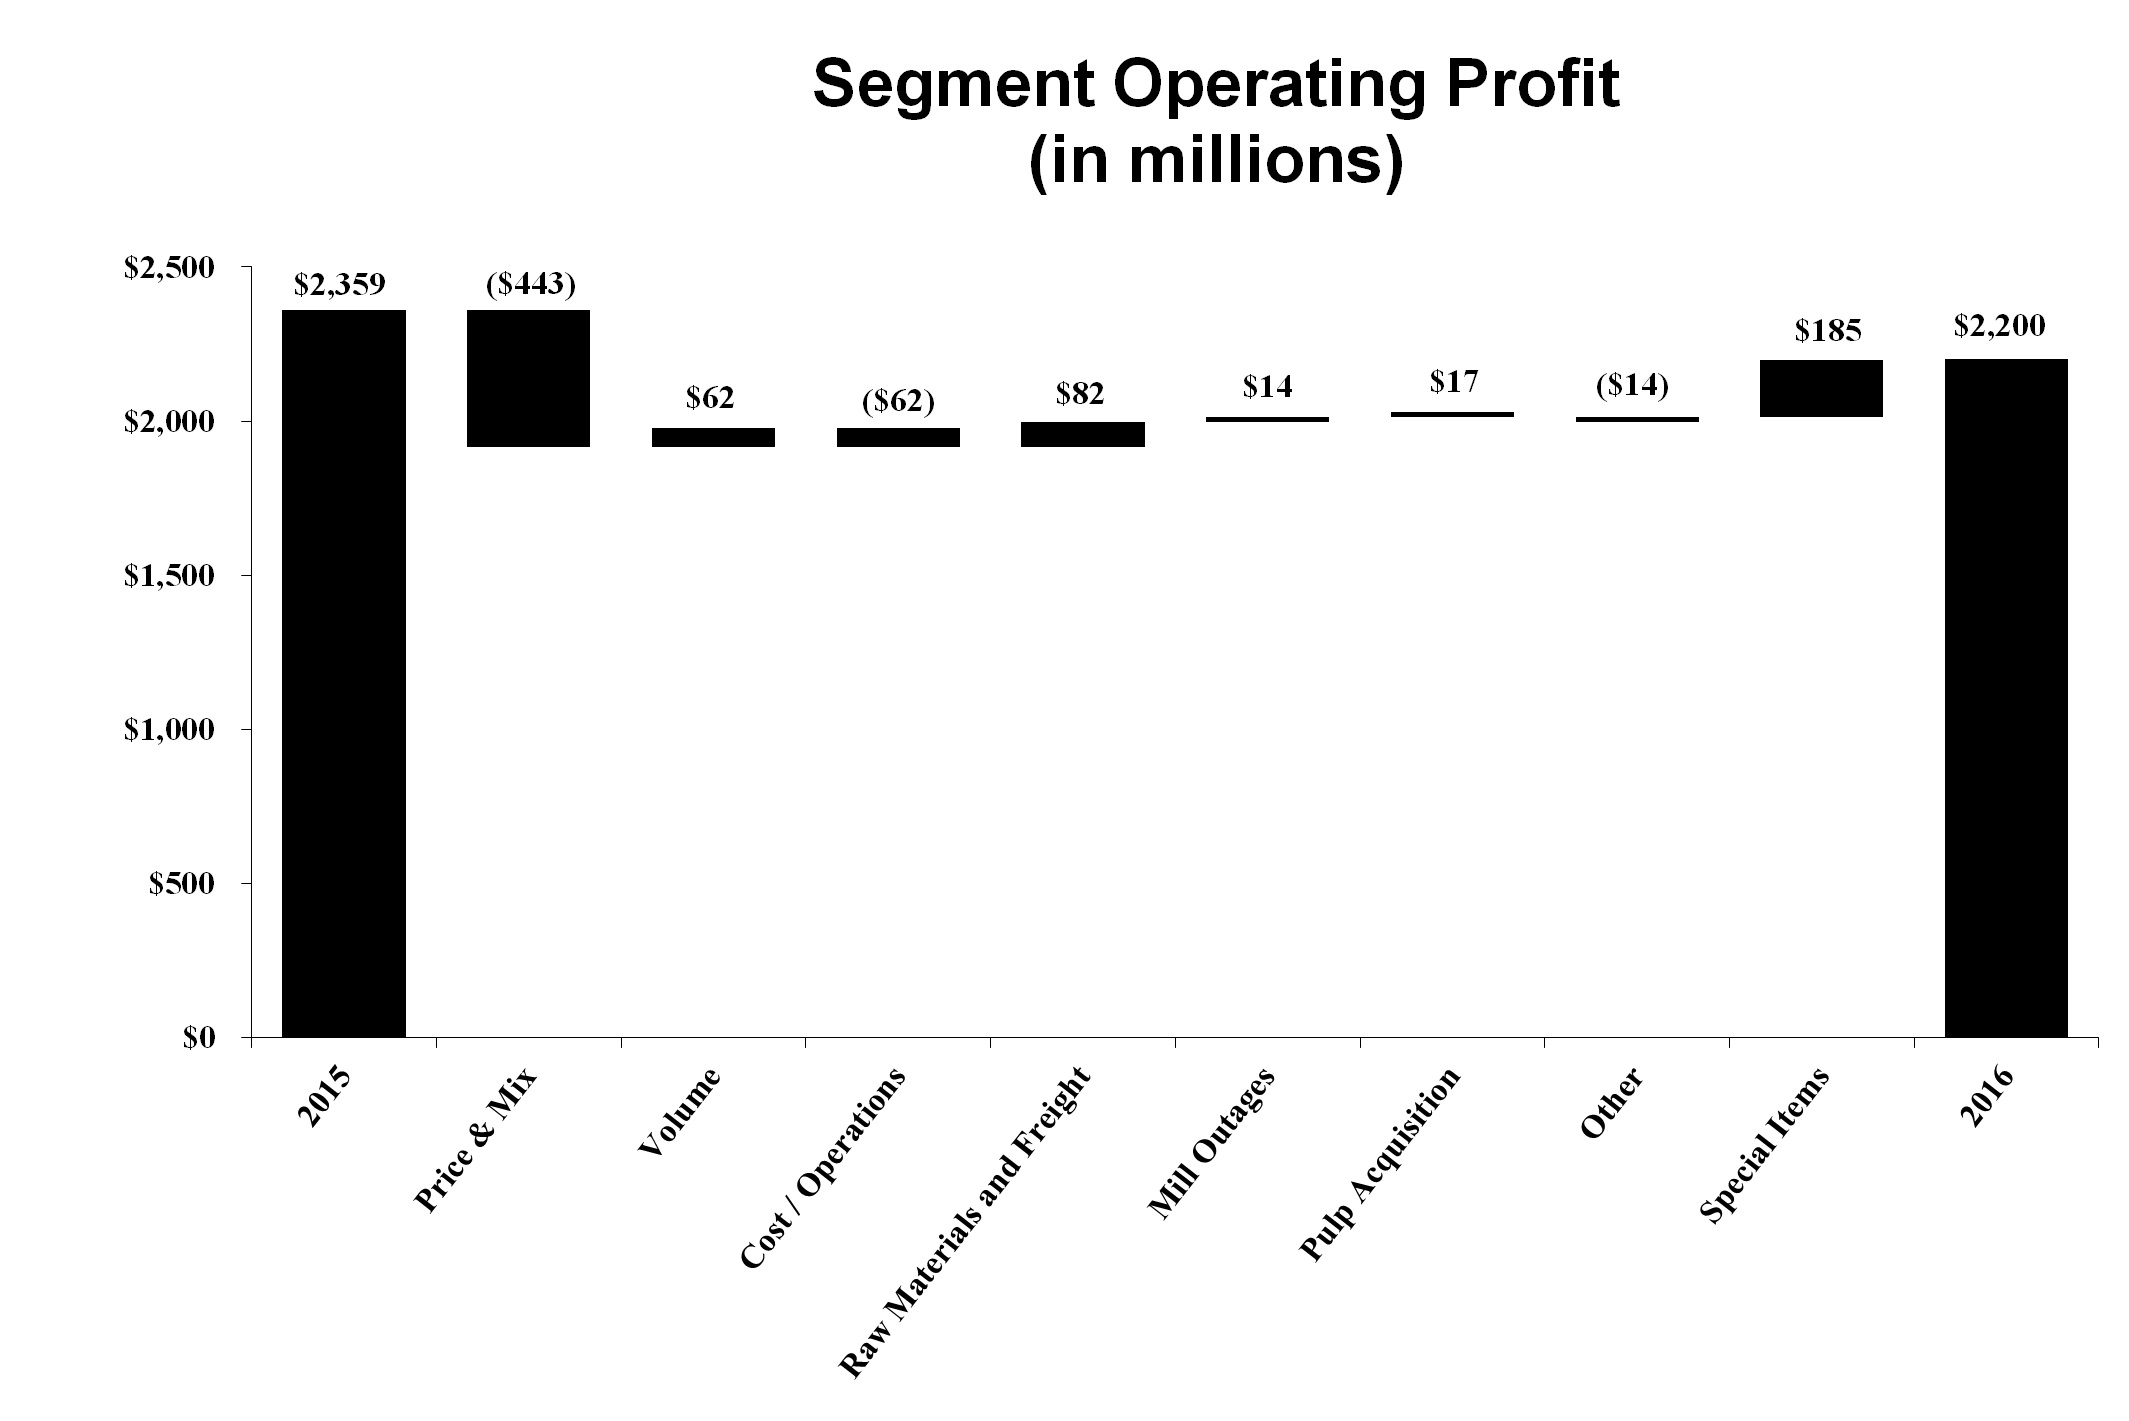
Business Segment Operating Profits in 2016 included a net loss from special items of $136 million compared with $321 million in 2015 and $732 million in 2014. Operationally, compared with 2015, the benefits from higher sales volumes ($62 million), lower maintenance outage costs ($14 million), lower input costs ($82 million) and the incremental operating earnings from the newly acquired pulp business ($17 million) were offset by lower average sales price realizations and mix ($443 million), higher operating costs ($62 million) and higher other costs ($14 million).
3
The principal changes in operating profit by segment were as follows:
• | Industrial Packaging’s profits of $1.6 billion were $203 million lower than in 2015 as the benefits of higher sales volumes, lower maintenance outage costs and lower input costs were more than offset by lower average sales price realizations and mix, higher operating costs and higher other costs. In addition, operating profits in 2016 included a charge of $70 million for impairment and other costs associated with the sale of our corrugated packaging business in Asia and a charge of $7 million related to the closure of a mill in Turkey. In 2015, operating profits included a goodwill and trade name impairment charge of $137 million related to our Brazil Packaging business. |
• | Global Cellulose Fibers' operating loss of $179 million was $247 million unfavorable versus 2015 as the benefits of higher sales volumes, lower input costs, lower other costs and the earnings from the newly acquired business were more than offset by lower average sales price realizations and mix, higher operating costs and higher maintenance outage costs. The operating loss in 2016 included $31 million of costs associated with the acquisition of the pulp business and a charge of $19 million to amortize the newly acquired pulp business inventory fair value adjustment. |
• | Printing Papers’ profits of $540 million represented a $75 million increase in operating profits from 2015. The benefits from higher sales volumes, higher average sales price realizations and mix, lower operating costs, lower maintenance outage costs and lower input costs were partially offset by higher other costs. |
• | Consumer Packaging’s operating profit of $191 million represented a $216 million increase in operating profits from 2015. The benefits from lower operating costs, lower maintenance outage costs, and lower input costs were partially offset by lower |
sales volumes, lower average sales price realizations and mix and higher other costs. In addition, operating profits in 2016 included a charge of $9 million related to the conversion of our Riegelwood mill to 100% pulp production. In 2015, operating losses included an asset impairment charge of $174 million related to the sale of our 55% equity share of the IP-Sun JV in Asia, a net cost of $8 million related to costs for our Riegelwood mill conversion, net of proceeds from the sale of the Carolina Coated Bristols brand, and $2 million of sheet plant closure costs.
Liquidity and Capital Resources
For the year ended December 31, 2016, International Paper generated $2.5 billion of cash flow from operations compared with $2.6 billion in 2015 and $3.1 billion in 2014. Cash flow from operations included $750 million, $750 million and $353 million of cash pension contributions in 2016, 2015 and 2014, respectively. Capital spending for 2016 totaled $1.3 billion, or 110% of depreciation and amortization expense. Net increases in debt totaled $1.9 billion, the proceeds from which were primarily used to fund the acquisition of the Weyerhaeuser pulp business. Our liquidity position remains strong, supported by approximately $2.1 billion of credit facilities that we believe are adequate to meet future liquidity requirements. Maintaining an investment-grade credit rating for our long-term debt continues to be an important element in our overall financial strategy.
We expect strong cash generation again in 2017 and will continue our balanced use of cash through the payment of dividends, reducing total debt and making investments for future growth.
Capital spending for 2017 is targeted at $1.5 billion, or about 107% of depreciation and amortization.
Legal
See Note 11 Commitments and Contingent Liabilities on pages 61 through 63 of Item 8. Financial Statements and Supplementary Data for a discussion of legal matters.
While the operating results for International Paper’s various business segments are driven by a number of business-specific factors, changes in International Paper’s operating results are closely tied to changes in general economic conditions in North America, Europe, Russia, Latin America, Asia, Africa and the Middle East. Factors that impact the demand for our products include industrial non-durable goods production, consumer spending, commercial printing and advertising activity, white-collar employment levels, and movements in currency exchange rates.
4
Product prices are affected by general economic trends, inventory levels, currency exchange rate movements and worldwide capacity utilization. In addition to these revenue-related factors, net earnings are impacted by various cost drivers, the more significant of which include changes in raw material costs, principally wood, recycled fiber and chemical costs; energy costs; freight costs; salary and benefits costs, including pensions; and manufacturing conversion costs.
The following is a discussion of International Paper’s results of operations for the year ended December 31, 2016, and the major factors affecting these results compared to 2015 and 2014.
For the year ended December 31, 2016, International Paper reported net sales of $21.1 billion, compared with $22.4 billion in 2015 and $23.6 billion in 2014. International net sales (including U.S. exports) totaled $7.2 billion or 34% of total sales in 2016. This compares with international net sales of $7.8 billion in 2015 and $9.3 billion in 2014.
Full year 2016 net earnings attributable to International Paper Company totaled $904 million ($2.18 per share), compared with net earnings of $938 million ($2.23 per share) in 2015 and $555 million ($1.29 per share) in 2014. Amounts in 2016 and 2014 include the results of discontinued operations.
Earnings from continuing operations attributable to International Paper Company after taxes in 2016, 2015 and 2014 were as follows:
In millions | 2016 | 2015 | 2014 | |||||||||
Earnings from continuing operations attributable to International Paper Company | $ | 909 | (a) | $ | 938 | (b) | $ | 568 | (c) | |||
(a) Includes $108 million of net special items charges and $375 million of non-operating pension expense which included a pre-tax charge of $439 million ($270 million after taxes) for a settlement accounting charge associated with payments under a term-vested lump sum buyout.
(b) Includes $439 million of net special items charges and $157 million of non-operating pension expense.
(c) Includes $599 million of net special items gains and $129 million of non-operating pension expense in 2014.
Compared with 2015, the benefits from higher sales volumes, lower maintenance outage costs, lower input costs, incremental earnings from the acquisition of Weyerhaeuser's pulp business, lower interest expense and lower tax expense were offset by lower average sales price realizations and mix, higher operating costs and higher corporate and other costs. In addition, 2016 results included higher equity earnings, net of taxes,
relating to the Company’s investment in Ilim Holding, SA.

See Business Segment Results on pages 25 through 30 for a discussion of the impact of these factors by segment.
Discontinued Operations
2016:
In 2016, there was $5 million of discontinued operations expense associated with a legal settlement related to the xpedx business.
2015:
There were no discontinued operations in 2015.
2014:
In 2014, $24 million of net income adjustments were recorded relating to discontinued businesses, including $16 million of costs associated with the spin-off of the xpedx business and $9 million of costs associated with the divestiture of the Temple-Inland Building Products business. Also included are the operating earnings of the xpedx business prior to the spin-off on July 1, 2014.
Income Taxes
A net income tax provision of $247 million was recorded for 2016 including tax benefits of $63 million related to legal entity restructurings, a tax expense of $31 million associated with a tax rate change in Luxembourg, a tax expense of $23 million associated with the $750 million of 2016 cash pension contributions, and a tax benefit of $14 million related to the closure of a federal tax audit. Excluding these items, a $51 million tax benefit for other special items and a $235 million tax benefit related to non-operating pension expense, the tax provision was $556 million, or 32% of pre-tax earnings before equity earnings.
A net income tax provision of $466 million was recorded for 2015 including a tax benefit of $62 million related to internal restructurings, a tax expense of $23 million for the tax impact of the 2015 cash pension contribution of $750 million and a $2 million tax expense for other
5
items. Excluding these items, an $83 million net tax benefit for other special items and a $101 million tax benefit related to non-operating pension expense, the tax provision was $687 million, or 33% of pre-tax earnings before equity earnings.
A net income tax provision of $123 million was recorded for 2014 including a tax benefit of $90 million related to internal restructurings and a net $9 million tax expense for other items. Excluding these items, a $372 million net tax benefit for other special items and a $83 million tax benefit related to non-operating pension expense, the tax provision was $659 million, or 31% of pre-tax earnings before equity earnings.
Equity Earnings, Net of Taxes
Equity earnings, net of taxes in 2016, 2015 and 2014 consisted principally of the Company’s share of earnings from its 50% investment in Ilim Holding S.A. in Russia (see page 29 and 30).
Interest Expense and Noncontrolling Interest
Net corporate interest expense totaled $520 million in 2016, $555 million in 2015 and $601 million in 2014. The decrease in 2016 compared with 2015 is due to lower average interest rates. The decrease in 2015 compared with 2014 also reflects lower average interest rates.
Net earnings attributable to noncontrolling interests totaled a loss of $2 million in 2016 compared with a loss of $21 million in 2015 and a loss of $19 million in 2014. The decrease in 2016 reflects the sale of our equity share of the IP-Sun JV in 2015. The decrease in 2015 compared with 2014 also reflects the sale of our interest in the IP-Sun JV and lower earnings for the joint venture in China prior to its divestiture.
Special Items
Restructuring and Other Charges
International Paper continually evaluates its operations for improvement opportunities targeted to (a) focus our portfolio on our core businesses, (b) realign capacity to operate fewer facilities with the same revenue capability and close high cost facilities, and (c) reduce costs. Annually, strategic operating plans are developed by each of our businesses. If it subsequently becomes apparent that a facility’s plan will not be achieved, a
decision is then made to, among other outcomes, (a) invest additional capital to upgrade the facility, (b) shut down the facility and record the corresponding charge, or (c) evaluate the expected recovery of the carrying value of the facility to determine if an impairment of the assets have occurred. In recent years, this policy has led to the shutdown of a number of facilities and the recording of significant asset impairment charges and severance costs. It is possible that additional charges and costs will be incurred in future periods in our core businesses should such triggering events occur.
During 2016, 2015 and 2014, pre-tax restructuring and other charges totaling $54 million, $252 million and $846 million were recorded in the business segments. Details of these charges are as follows:
Restructuring and Other | ||||||||||||
In millions | 2016 | 2015 | 2014 | |||||||||
Business Segments | ||||||||||||
Riegelwood mill conversion costs net of proceeds from the sale of Carolina Coated Bristols brand | $ | 9 | (a) | $ | 8 | (a) | $ | — | ||||
Turkey mill closure | 7 | (b) | — | — | ||||||||
Courtland mill shutdown | — | — | 554 | (c) | ||||||||
Other items | — | 2 | (a) | 15 | (d) | |||||||
16 | 10 | 569 | ||||||||||
Corporate | ||||||||||||
Early debt extinguishment costs (see Note 13) | $ | 29 | 207 | 276 | ||||||||
India Packaging business evaluation write-off | 17 | — | — | |||||||||
Gain on sale of investment in Arizona Chemical | (8 | ) | — | — | ||||||||
Timber monetization restructuring | — | 16 | — | |||||||||
Legal liability reserve adjustment | — | 15 | — | |||||||||
Other Items | — | 4 | 1 | |||||||||
38 | 242 | 277 | ||||||||||
Total | $ | 54 | $ | 252 | $ | 846 | ||||||
(a) Recorded in the Consumer Packaging business segment.
(b) Recorded in the Industrial Packaging business segment.
(c) Recorded in the Printing Papers business segment.
(d) Recorded in the Industrial Packaging business segment ($7 million) and Consumer Packaging business segment ($8 million).
6
Other Corporate Special Items
In addition, other corporate special items totaling $8 million, $4 million and $43 million were recorded in 2016, 2015 and 2014, respectively. Details of these charges were as follows:
Other Corporate Items | |||||||||
In millions | 2016 | 2015 | 2014 | ||||||
Write-off of certain regulatory pre-engineering costs | $ | 8 | $ | — | $ | — | |||
Sale of investment by ASG and impairment of that investment | — | — | 47 | ||||||
Other | — | (4 | ) | (4 | ) | ||||
Total | $ | 8 | $ | (4 | ) | $ | 43 | ||
Impairments of Goodwill
No goodwill impairment charges were recorded in 2016.
In the fourth quarter of 2015, in conjunction with the annual testing of its reporting units for possible goodwill impairments, the Company calculated the estimated fair value of its Brazil Packaging business and determined that all of the goodwill in the business, totaling $137 million, should be written off. The decline in the fair value of the Brazil Packaging business and resulting impairment charge was due to the negative impacts on the cash flows of the business caused by the continued decline of the overall Brazilian economy.
In the fourth quarter of 2014, in conjunction with the annual testing of its reporting units for possible goodwill impairments, the Company calculated the estimated fair value of its Asia Industrial Packaging business using expected discounted future cash flows and determined that due to a change in the strategic outlook, all of the goodwill of this business, totaling $100 million, should be written off. The decline in the fair value of the Asia Industrial Packaging business and resulting impairment charge was due to a change in the strategic outlook for the business.
Net Losses on Sales and Impairments of Businesses
Net losses on sales and impairments of businesses included in special items totaled a pre-tax loss of $70 million in 2016, a pre-tax loss of $174 million in 2015 and a pre-tax loss of $38 million in 2014. See Note 7 Divestitures / Spinoff on pages 56 and 57 of Item 8. Financial Statements and Supplementary Data) for further discussion.
Business Segment Operating Profits
Business segment operating profits of $2.2 billion in 2016 decreased from $2.4 billion in 2015. The benefits from higher sales volumes ($62 million), higher maintenance outage costs ($14 million), lower input costs ($82 million) and the incremental operating
earnings from the newly acquired pulp business ($17 million) were more than offset by lower average sales price realizations and mix ($443 million), higher operating costs ($62 million) and higher other costs ($14 million). Special items were a $136 million net loss in 2016 compared with a net loss of $321 million in 2015.
Market-related downtime in 2016 increased to approximately 448,000 tons from approximately 440,000 tons in 2015.
DESCRIPTION OF BUSINESS SEGMENTS
International Paper’s business segments discussed below are consistent with the internal structure used to manage these businesses. All segments are differentiated on a common product, common customer basis consistent with the business segmentation generally used in the forest products industry.
Industrial Packaging
International Paper is the largest manufacturer of containerboard in the United States. Our U.S. production capacity is over 13 million tons annually. Our products include linerboard, medium, whitetop, recycled linerboard, recycled medium and saturating kraft. About 80% of our production is converted domestically into corrugated boxes and other packaging by our 166 U.S. container plants. Additionally, we recycle approximately one million tons of OCC and mixed and white paper through our 18 recycling plants. In EMEA, our operations include two recycled fiber containerboard mills in Morocco and Turkey and 26 container plants in France, Italy, Spain, Morocco and Turkey. During 2016 we acquired a newsprint mill in Spain which we intend to convert to a recycled containerboard mill during 2017. In Brazil our operations include three containerboard mills and four box plants. Our container plants are supported by regional design centers, which offer total packaging solutions and supply chain initiatives.
Global Cellulose Fibers
Our cellulose fibers product portfolio includes fluff, market and specialty pulps. Our fluff pulp is used to make absorbent hygiene products like baby diapers, feminine care, adult incontinence and other non-woven products, and our market pulp is used for tissue and paper products. We continue to invest in exploring new innovative uses for our products, such as our specialty pulps, which are used for non-absorbent end uses including textiles, filtration, construction material, paints and coatings, reinforced plastics and more. Our products are made in the United States, Canada, France, Poland, and Russia and are sold around the world. International Paper facilities have annual dried pulp capacity of about 4 million metric tonnes.
7
Printing Papers
International Paper is one of the world’s largest producers of printing and writing papers. The primary product in this segment is uncoated papers. This business produces papers for use in copiers, desktop and laser printers and digital imaging. End use applications include advertising and promotional materials such as brochures, pamphlets, greeting cards, books, annual reports and direct mail. Uncoated papers also produces a variety of grades that are converted by our customers into envelopes, tablets, business forms and file folders. Uncoated papers are sold under private label and International Paper brand names that include Hammermill, Springhill, Williamsburg, Postmark, Accent, Great White, Chamex, Ballet, Rey, Pol, and Svetocopy. The mills producing uncoated papers are located in the United States, France, Poland, Russia, Brazil and India. The mills have uncoated paper production capacity of approximately 4 million tons annually. Brazilian operations function through International Paper do Brasil, Ltda, which owns or manages approximately 329,000 acres of forestlands in Brazil.
Consumer Packaging
International Paper is one of the world’s largest producers of solid bleached sulfate board with annual U.S. production capacity of about 1.2 million tons . Our coated paperboard business produces high quality coated paperboard for a variety of packaging and foodservice end uses. Our Everest®, Fortress®, and Starcote® brands are used in packaging applications for everyday products such as food, cosmetics, pharmaceuticals and tobacco products. Our U.S. capacity is supplemented by about 395,000 tons of capacity at our mills producing coated board in Poland and Russia.
Our Foodservice business produces cups, lids, food containers and plates through three domestic plants and four international facilities.
Ilim Holding S.A.
In October 2007, International Paper and Ilim Holding S.A. (Ilim) completed a 50:50 joint venture to operate a pulp and paper business located in Russia. Ilim’s facilities include three paper mills located in Bratsk, Ust-Ilimsk, and Koryazhma, Russia, with combined total pulp and paper capacity of over 3.4 million tons. Ilim has exclusive harvesting rights on timberland and forest areas exceeding 14.9 million acres (6.0 million hectares).
Products and brand designations appearing in italics are trademarks of International Paper or a related company.
BUSINESS SEGMENT RESULTS
The following tables present net sales and operating profit (loss) which is the Company's measure of segment profitability. The tables include a detail of special items in each year, where applicable, in order to show operating profit before special items.
During the first quarter of 2017, as a result of an internal reorganization, the net sales and operating profits for the Asian Distribution operations are included in the results of the businesses that manufacture the products. As such, prior year amounts have been reclassified to conform with current year presentation.
Industrial Packaging
Demand for Industrial Packaging products is closely correlated with non-durable industrial goods production, as well as with demand for processed foods, poultry, meat and agricultural products. In addition to prices and volumes, major factors affecting the profitability of Industrial Packaging are raw material and energy costs, freight costs, manufacturing efficiency and product mix.
Industrial Packaging | |||||||||
In millions | 2016 | 2015 | 2014 | ||||||
Net Sales | $ | 13,899 | $ | 14,240 | $ | 14,749 | |||
Operating Profit (Loss) | $ | 1,648 | $ | 1,851 | $ | 1,893 | |||
Turkey mill closure | 7 | — | — | ||||||
Asia Packaging restructuring and impairment | 70 | — | 7 | ||||||
Brazil Packaging goodwill and trade name impairment | — | 137 | — | ||||||
Temple-Inland acquisition | — | — | 16 | ||||||
Multi-employer pension withdrawal liability | — | — | 35 | ||||||
Box plant closures | — | — | (5 | ) | |||||
EMEA Packaging restructuring | — | — | 5 | ||||||
Turkey acquisition | — | — | 1 | ||||||
Brazil Packaging integration costs | — | — | (1 | ) | |||||
Asia Packaging goodwill impairment | — | — | 100 | ||||||
Operating Profit Before Special Items | $ | 1,725 | $ | 1,988 | $ | 2,051 | |||
Industrial Packaging net sales for 2016 decreased 2% to $13.9 billion compared with $14.2 billion in 2015, and 6% compared with $14.7 billion in 2014. Operating profits in 2016 were 11% lower than in 2015 and 13% lower than in 2014. Comparing 2016 with 2015, benefits from higher sales volumes ($61 million), lower maintenance outage costs ($15 million) and lower input costs ($42 million) were offset by lower average sales price realizations and mix ($278 million), higher operating costs ($101 million) and higher other costs ($2 million). In addition, special items were an expense
8
of $77 million in 2016 compared with $137 million in 2015.
North American Industrial Packaging | |||||||||
In millions | 2016 | 2015 | 2014 | ||||||
Sales | $ | 12,307 | $ | 12,618 | $ | 12,752 | |||
Operating Profit (Loss) | $ | 1,757 | $ | 2,009 | $ | 1,986 | |||
Temple-Inland acquisition | — | — | 16 | ||||||
Multi-employer pension withdrawal liability | — | — | 35 | ||||||
Box plant closures | — | — | (5 | ) | |||||
Operating Profit Before Special Items | $ | 1,757 | $ | 2,009 | $ | 2,032 | |||
North American Industrial Packaging's sales volumes increased in 2016 compared with 2015 reflecting higher box shipments and higher shipments of containerboard to export markets. In 2016, the business took about 914,000 tons of total downtime of which about 445,000 were economic downtime and 469,000 were maintenance downtime. The business took about 814,000 tons of total downtime in 2015 of which 363,000 were economic downtime and 451,000 were maintenance downtime. Average sales price realizations were significantly lower for containerboard due to pricing pressures in export markets. Average sales prices for boxes were lower primarily due to contract de-escalators that were triggered in the first quarter by a decrease in a key containerboard price index. Input costs for wood, energy and freight fuel surcharges were lower, but for recycled fiber were higher. Planned maintenance downtime costs were $16 million lower in 2016 than in 2015.
Looking ahead to the first quarter of 2017, compared with the fourth quarter of 2016, sales volumes for boxes are expected to be slightly higher despite seasonally lower daily shipments due to four more shipping days. Shipments of containerboard to export markets are expected to decrease. Average sales price realizations should increase, reflecting the continuing implementation of the box price increase announced in the fourth quarter of 2016. Input costs are expected to be higher for recycled fiber, energy and wood. Planned maintenance downtime spending is expected to be about $57 million higher. Operating costs are expected to improve. In addition, the Company is evaluating the financial impact of the digester incident that occurred on January 22, 2017 at the Pensacola mill. It is currently estimated that the total impact will be in excess of $50 million, but that property damage and business interruption insurance will cover a significant portion of the costs. The timing of these costs and potential insurance recoveries is unknown.
EMEA Industrial Packaging | |||||||||
In millions | 2016 | 2015 | 2014 | ||||||
Net Sales | $ | 1,227 | $ | 1,114 | $ | 1,307 | |||
Operating Profit (Loss) | $ | 15 | $ | 13 | $ | 25 | |||
Turkey Mill Closure | 7 | — | — | ||||||
EMEA Packaging restructuring | — | — | 5 | ||||||
Turkey acquisition | — | — | 1 | ||||||
Operating Profit Before Special Items | $ | 22 | $ | 13 | $ | 31 | |||
EMEA Industrial Packaging's sales volumes in 2016 were higher than in 2015 reflecting improved market demand in the Eurozone and recovery from the prior year labor strikes in Turkey. Average sales margins improved due to sales price increases and material cost decreases. Input costs for energy were lower, but operations were negatively impacted by foreign exchange rates, primarily in Turkey. Operating earnings in 2015 included a gain of $4 million related to the change in ownership of our OCC collection operations in Turkey.
Entering the first quarter of 2017, compared with the fourth quarter of 2016 sales volumes are expected to be slightly lower. Average sales margins are expected to be slightly lower. Input costs for energy should be flat, but operating costs are expected to be lower.
On June 30, 2016 the Company completed the acquisition of Holmen Paper's newsprint mill in Madrid, Spain. Under the terms of the agreement, International Paper purchased the Madrid newsprint mill as well as associated recycling operations and a 50% ownership interest in a cogeneration facility. The Company intends to convert the mill to produce recycled containerboard in 2017 with an expected capacity of 419,000 tons. Once completed, the converted mill will support the Company's corrugated packaging business in EMEA.
Brazilian Industrial Packaging | |||||||||
In millions | 2016 | 2015 | 2014 | ||||||
Net Sales | $ | 232 | $ | 228 | $ | 349 | |||
Operating Profit (Loss) | $ | (43 | ) | $ | (163 | ) | $ | (3 | ) |
Brazil Packaging goodwill and trade name impairment | — | 137 | — | ||||||
Brazil Packaging integration costs | — | — | (1 | ) | |||||
Operating Profit Before Special Items | $ | (43 | ) | $ | (26 | ) | $ | (4 | ) |
Brazilian Industrial Packaging's 2016 sales volumes decreased compared with 2015 for boxes and sheets due to overall weak economic conditions, but increased for containerboard. Average sales price realizations were higher. Input costs increased, primarily for recycled fiber. Operating costs were higher largely due to the effects of inflation. Planned maintenance downtime costs were $1 million higher in 2016 compared with 2015.
9
Looking ahead to the first quarter of 2017, compared with the fourth quarter of 2016 sales volumes are expected to be lower for containerboard and sheets, but higher for boxes. Average sales margins should improve reflecting a sales price increase for boxes. Input costs are expected to be slightly lower, but offset by higher operating costs. Planned maintenance downtime costs are expected to be $1 million higher.
Asian Industrial Packaging | |||||||||
In millions | 2016 | 2015 | 2014 | ||||||
Net Sales | $ | 133 | $ | 280 | $ | 341 | |||
Operating Profit (Loss) | $ | (81 | ) | $ | (8 | ) | $ | (115 | ) |
Asia Packaging restructuring and impairment | 70 | — | 7 | ||||||
Asia Packaging goodwill impairment | — | — | 100 | ||||||
Operating Profit Before Special Items | $ | (11 | ) | $ | (8 | ) | $ | (8 | ) |
Asian Industrial Packaging's sales volumes in the first half of 2016 for boxes were higher than the comparable period in 2015, but average sales margins were lower due to competitive pressures and weak economic conditions.
On June 30, 2016, the Company completed the sale of its corrugated packaging business in China and Southeast Asia to Xiamen Bridge Hexing Equity Investment Partnership Enterprise. See Note 7 Divestitures / Spinoff on pages 56 and 57 of Item 8. Financial Statements and Supplementary Data for further discussion of the sale of this business.
Global Cellulose Fibers
Demand for Cellulose Fibers products is closely correlated with changes in demand for absorbent hygiene products and is further affected by changes in currency rates that can benefit or hurt producers in different geographic regions. Principal cost drivers include manufacturing efficiency, raw material and energy costs and freight costs.
Global Cellulose Fibers | |||||||||
In millions | 2016 | 2015 | 2014 | ||||||
Net Sales | $ | 1,092 | $ | 975 | $ | 1,046 | |||
Operating Profit (Loss) | $ | (179 | ) | $ | 68 | $ | 62 | ||
Acquisition costs | 31 | — | — | ||||||
Inventory fair value step-up amortization | 19 | — | — | ||||||
Operating Profit Before Special Items | $ | (129 | ) | $ | 68 | $ | 62 | ||
Global Cellulose Fibers results for 2016 include net sales of $111 million and an operating loss of $(21) million (including $38 million of special items) associated with the newly acquired pulp business from the date of acquisition on December 1, 2016. See Note 6 Acquisitions and Joint Ventures on pages 54 through
56 of Item 8. Financial Statements and Supplementary Data for additional information about the acquisition. Net sales for 2016 increased 12% to $1.1 billion compared with $975 million in 2015 and 4% compared with $1.0 billion in 2014. Operating profits in 2016 were significantly lower than in both 2015 and 2014. Comparing 2016 with 2015, benefits from higher sales volumes ($10 million), lower input costs ($6 million), and lower other costs ($1 million) were offset by lower average sales price realizations and mix ($36 million), higher operating costs ($59 million) and higher planned maintenance downtime costs ($38 million). In addition, special items expense in 2016 was $50 million.
Sales volumes for the legacy business were higher for both fluff and market pulp. Average sales margins decreased, reflecting lower sales price realizations for both fluff pulp and softwood market pulp and an unfavorable mix resulting from the Riegelwood conversion and ramp-up. In Europe and Russia, average sales margins decreased due to competitive pressures. Input costs were slightly lower. Planned maintenance downtime costs were $38 million higher in 2016 primarily related to the Riegelwood mill. Operating costs were higher due to costs associated with the Riegelwood mill conversion.
Entering the first quarter of 2017, sales volumes will be higher due to the full-quarter impact of the acquisition. Average sales price realizations are expected to be stable and mix will continue to be challenged due to the ramp-up of the Riegelwood mill. Input costs are expected to increase primarily for wood. Planned maintenance downtime costs should be $47 million higher than in the fourth quarter of 2016 due to a large outage and capital investment project to upgrade the recovery boiler, turbine and power system at our Port Wentworth mill.
Printing Papers
Demand for Printing Papers products is closely correlated with changes in commercial printing and advertising activity, direct mail volumes and, for uncoated cut-size products, with changes in white-collar employment levels that affect the usage of copy and laser printer paper. Principal cost drivers include manufacturing efficiency, raw material and energy costs and freight costs.
Printing Papers | |||||||||
In millions | 2016 | 2015 | 2014 | ||||||
Net Sales | $ | 4,058 | $ | 4,056 | $ | 4,615 | |||
Operating Profit (Loss) | $ | 540 | $ | 465 | $ | (77 | ) | ||
Courtland mill closure | — | — | 554 | ||||||
Brazil tax amnesty | — | — | 32 | ||||||
India legal contingency | — | — | (20 | ) | |||||
Operating Profit Before Special Items | $ | 540 | $ | 465 | $ | 489 | |||
10
Printing Papers net sales for 2016 of $4.1 billion were even with $4.1 billion in 2015, but decreased 12% compared with $4.6 billion in 2014. Operating profits in 2016 were 16% higher than in 2015 and significantly higher than in 2014. Comparing 2016 with 2015, benefits from higher sales volumes ($11 million), higher average sales price realizations and mix ($25 million), lower operating costs ($20 million), lower planned maintenance downtime costs ($23 million) and lower input costs ($4 million) were partly offset by higher other costs ($8 million).
North American Printing Papers | |||||||||
In millions | 2016 | 2015 | 2014 | ||||||
Net Sales | $ | 1,890 | $ | 1,942 | $ | 2,055 | |||
Operating Profit (Loss) | $ | 236 | $ | 179 | $ | (398 | ) | ||
Courtland mill closure | — | — | 554 | ||||||
Operating Profit Before Special Items | $ | 236 | $ | 179 | $ | 156 | |||
North American Printing Papers' sales volumes for 2016 were unchanged from 2015. Average sales price realizations decreased for both cutsize paper and rolls. Average sales margins were also impacted by an unfavorable mix. Input costs were lower, mainly for wood. Planned maintenance downtime costs were $24 million lower in 2016. Manufacturing operating costs also improved.
Entering the first quarter of 2017, sales volumes are expected to be seasonally higher. Average sales margins should decrease reflecting lower average sales price realizations partially offset by a more favorable geographic mix. Input costs are expected to be higher, primarily for energy. Planned maintenance downtime costs are expected to be about $23 million higher with outages scheduled in the 2017 first quarter.
Brazilian Papers | |||||||||
In millions | 2016 | 2015 | 2014 | ||||||
Net Sales | $ | 897 | $ | 878 | $ | 1,061 | |||
Operating Profit (Loss) | $ | 173 | $ | 186 | $ | 177 | |||
Brazil tax amnesty | — | — | 32 | ||||||
Operating Profit Before Special Items | $ | 173 | $ | 186 | $ | 209 | |||
Brazilian Papers' sales volumes for in 2016 were lower compared with 2015 under weak economic conditions. Average sales price realizations improved for domestic uncoated freesheet paper due to the realization of price increases implemented in the first half of 2016. Sales prices to export markets decreased. Raw material costs increased for energy, wood, chemicals and virgin fiber. Operating costs were higher than in 2015, largely due to inflation. Planned maintenance downtime costs were $1 million lower.
Looking ahead to 2017, compared with the fourth quarter of 2016 sales volumes for uncoated freesheet
paper in the first quarter are expected to be seasonally weaker in both domestic and export markets. Average sales price realizations should increase due to the implementation of a domestic sales price increase for both cutsize and offset paper. Input costs are expected to be slightly higher for chemicals and energy.
European Papers | |||||||||
In millions | 2016 | 2015 | 2014 | ||||||
Net Sales | $ | 1,109 | $ | 1,064 | $ | 1,321 | |||
Operating Profit (Loss) | $ | 142 | $ | 111 | $ | 136 | |||
European Papers' sales volumes for uncoated freesheet paper in 2016 were higher in both Russia and Europe compared with 2015. Average sales price realizations improved for uncoated freesheet paper following price increases implemented in 2015 in Europe and in the first quarter of 2016 in Russia. Input costs were lower for wood, energy and chemicals in Europe, but were higher in Russia. Planned maintenance downtime costs were $4 million lower in 2016 than in 2015.
Entering 2017, sales volumes for uncoated freesheet paper in the first quarter are expected to be seasonally weaker in Russia but higher in Europe. Average sales price realizations are expected to be stable with price increases implemented in certain markets. Input costs should be slightly lower. Planned maintenance downtime costs should be $15 million lower than in the fourth quarter of 2016.
Indian Papers | |||||||||
In millions | 2016 | 2015 | 2014 | ||||||
Net Sales | $ | 167 | $ | 172 | $ | 178 | |||
Operating Profit (Loss) | $ | (11 | ) | $ | (11 | ) | $ | 8 | |
India legal contingency | — | — | (20 | ) | |||||
Operating Profit Before Special Items | $ | (11 | ) | $ | (11 | ) | $ | (12 | ) |
Indian Papers' average sales price realizations in 2016 were slightly higher than in 2015. Sales volumes were flat. Input costs were lower for wood and chemicals. Operating costs were higher in 2016, while planned maintenance downtime costs were even with 2015. Looking ahead to the first quarter of 2017, sales volumes are expected to be slightly lower, but seasonally strong. Average sales price realizations are expected to be stable.
Consumer Packaging
Demand and pricing for Consumer Packaging products correlate closely with consumer spending and general economic activity. In addition to prices and volumes, major factors affecting the profitability of Consumer Packaging are raw material and energy costs, freight costs, manufacturing efficiency and product mix.
11
Consumer Packaging | |||||||||
In millions | 2016 | 2015 | 2014 | ||||||
Net Sales | $ | 1,955 | $ | 2,940 | $ | 3,403 | |||
Operating Profit (Loss) | $ | 191 | $ | (25 | ) | $ | 178 | ||
Riegelwood conversion costs net of proceeds from the sale of the Carolina coated bristols brand | 9 | 8 | — | ||||||
Asia Coated Paperboard goodwill and PP&E impairment | — | 174 | — | ||||||
NA Coated Paperboard sheet plant closures | — | 2 | 8 | ||||||
Operating Profit Before Special Items | $ | 200 | $ | 159 | $ | 186 | |||
Consumer Packaging net sales in 2016 decreased 34% to $2.0 billion from $2.9 billion in 2015, and decreased 43% from $3.4 billion in 2014. Operating profits increased significantly from 2015 and increased 7% from 2014. Comparing 2016 with 2015, benefits from lower operating costs ($78 million), lower planned maintenance downtime costs ($13 million) and lower input costs ($30 million) were partially offset by lower sales volumes ($20 million), lower average sales price realizations and mix ($56 million), and higher other costs ($4 million). In addition, special items expense was $9 million in 2016 and $184 million in 2015.
North American Consumer Packaging | |||||||||
In millions | 2016 | 2015 | 2014 | ||||||
Net Sales | $ | 1,628 | $ | 1,939 | $ | 1,993 | |||
Operating Profit (Loss) | $ | 98 | $ | 81 | $ | 92 | |||
Riegelwood conversion costs net of proceeds from the sale of the Carolina coated bristols brand | 9 | 8 | — | ||||||
NA Coated Paperboard sheet plant closures | — | 2 | 8 | ||||||
Operating Profit Before Special Items | $ | 107 | $ | 91 | $ | 100 | |||
North American Consumer Packaging coated paperboard sales volumes in 2016 were lower than in 2015 primarily due to our exit from the coated bristols market. Average sales price realizations decreased year over year due to competitive pressures. Input costs decreased for wood, chemicals and energy. Planned maintenance downtime costs were $11 million lower in 2016. Operating costs decreased, reflecting the impact of cost savings initiatives and lower depreciation expense.
Foodservice sales volumes decreased slightly in 2016 compared with 2015. Average sales margins decreased due to lower sales price realizations partially offset by lower resin costs and a more favorable mix. Operating costs were higher, while distribution costs were lower.
Looking ahead to the first quarter of 2017, Coated Paperboard sales volumes are expected to be seasonally higher than in the fourth quarter of 2016. Average sales price realizations are expected to be
lower due to market pressures. Input costs are expected to be higher for energy and chemicals, partially offset by lower wood costs. Planned maintenance downtime costs should be $11 million lower with no maintenance outages scheduled in the first quarter. Foodservice sales volumes are expected to be seasonally lower. Sales margins are expected to continue under pressure, partially offset by lower operating costs.
European Consumer Packaging | |||||||||
In millions | 2016 | 2015 | 2014 | ||||||
Net Sales | $ | 327 | $ | 319 | $ | 365 | |||
Operating Profit (Loss) | $ | 93 | $ | 87 | $ | 91 | |||
European Consumer Packaging's sales volumes in 2016 compared with 2015 increased in both Europe and Russia. Average sales price realizations were higher in Russia. In Europe average sales margins decreased reflecting lower average sales prices. Input cost, primarily for wood and energy were lower in Europe, but were higher in Russia. Planned maintenance downtime costs were $2 million lower in 2016.
Looking forward to the first quarter of 2017, compared with the fourth quarter of 2016, sales volumes are expected to increase. Average sales price realizations are expected to be flat in both Europe and Russia. Input costs are expected to be higher.
Asian Consumer Packaging | |||||||||
In millions | 2016 | 2015 | 2014 | ||||||
Net Sales | $ | — | $ | 682 | $ | 1,045 | |||
Operating Profit (Loss) | $ | — | $ | (193 | ) | $ | (5 | ) | |
Asia Coated Paperboard goodwill and PP&E impairment | — | 174 | — | ||||||
Operating Profit Before Special Items | $ | — | $ | (19 | ) | $ | (5 | ) | |
The Company sold its 55% equity share in IP Asia Coated Paperboard (IP-Sun JV) in October 2015. See Note 7 Divestitures / Spinoff on pages 56 and 57 of Item 8. Financial Statements and Supplementary Data for further discussion of the sale of the IP Sun JV. Net sales and operating profits presented below include results through September 30, 2015.
Equity Earnings, Net of Taxes – Ilim Holding S.A.
International Paper accounts for its investment in Ilim Holding S.A. (Ilim), a separate reportable industry segment, using the equity method of accounting.
The Company recorded equity earnings, net of taxes, related to Ilim of $199 million in 2016 compared with a loss of $131 million in 2015 and a loss of $194 million in 2014. Operating results recorded in 2016 included an after-tax non-cash foreign exchange gain of $25 million compared with an after-tax foreign exchange loss of $75 million in 2015 and an after-tax foreign exchange loss of $269 million in 2014 primarily on the
12
remeasurement of Ilim's U.S. dollar-denominated net debt.
Sales volumes for the joint venture increased year over year for shipments to China of softwood pulp and linerboard, but decreased for hardwood pulp. Sales volumes in the domestic Russian market increased for softwood pulp, hardwood pulp and paper, but decreased for linerboard. Average sales price realizations were lower in 2016 for sales of softwood pulp and hardwood pulp to export markets and linerboard to the Russian domestic market, but were partially offset by higher average sales price realizations for sales of paper to export and domestic Russian markets. Input costs increased year-over-year for wood, chemicals and energy. Maintenance outage costs were also higher in 2016. The Company received cash dividends from the joint venture of $60 million in 2016, $35 million in 2015 and $56 million in 2014.
Entering the first quarter of 2017, sales volumes are expected to be seasonally lower than in the fourth quarter of 2016 due to the January holidays in China and the seasonal slowdown in Russia. Average sales price realizations are expected to increase for exported hardwood pulp, softwood pulp and for sales of paper in the domestic Russian market. Average sales price realizations for linerboard in the Russian domestic market are expected to be lower. Distribution costs and input costs for energy are projected to be higher.
Overview
A major factor in International Paper’s liquidity and capital resource planning is its generation of operating cash flow, which is highly sensitive to changes in the pricing and demand for our major products. While changes in key cash operating costs, such as energy, raw material and transportation costs, do have an effect on operating cash generation, we believe that our focus on pricing and cost controls has improved our cash flow generation over an operating cycle.
Cash uses during 2016 were primarily focused on working capital requirements, capital spending, debt reductions, pension contributions, the acquisitions of the Weyerhaeuser pulp business and the mill asset in Madrid, and returning cash to shareholders.
Cash Provided by Operating Activities
Cash provided by operations totaled $2.5 billion in 2016 compared with $2.6 billion for 2015 and $3.1 billion for 2014. Cash provided by working capital components, accounts receivable and inventory less accounts payable and accrued liabilities, interest payable and other totaled $71 million in 2016, compared with a cash
use of $222 million in 2015 and a cash use of $158 million in 2014.
The Company generated Free Cash Flow of approximately $1.9 billion, $1.8 billion and $2.1 billion in 2016, 2015 and 2014, respectively. The following are reconciliations of free cash flow to cash provided by operations:
In millions | 2016 | 2015 | 2014 | ||||||
Cash provided by operations | $ | 2,478 | $ | 2,580 | $ | 3,077 | |||
Adjustments: | |||||||||
Cash invested in capital projects | (1,348 | ) | (1,487 | ) | (1,366 | ) | |||
Cash contribution to pension plan | 750 | 750 | 353 | ||||||
Free Cash Flow | $ | 1,880 | $ | 1,843 | $ | 2,064 | |||
In millions | Three Months Ended December 31, 2016 | Three Months Ended September 30, 2016 | Three Months Ended December 31, 2015 | ||||||
Cash provided by operations | $ | 912 | $ | 341 | $ | 990 | |||
Adjustments: | |||||||||
Cash invested in capital projects | (445 | ) | (266 | ) | (489 | ) | |||
Cash contribution to pension plan | — | 500 | — | ||||||
Free Cash Flow | $ | 467 | $ | 575 | $ | 501 | |||
Investment Activities
Investment activities in 2016 were up from 2015 reflecting the purchase of Weyerhaeuser's pulp business for $2.2 billion in cash, the purchase of the Holmen business for $57 million in cash, net of cash acquired, and proceeds from the sale of the Asia Packaging business of $108 million, net of cash divested. In 2015, investment activity includes higher capital spending and the use of $198 million of cash in conjunction with the timber monetization restructuring (see Note 12 Variable Interest Entities and Preferred Securities of Subsidiaries on pages 64 through 66 of Item 8. Financial Statements and Supplementary Data). In addition, 2014 investment activity includes the receipt of approximately $400 million in connection with the spin-off of the xpedx distribution business. The Company maintains an average capital spending target around depreciation or amortization levels or modestly above due to strategic plans over the course of an economic cycle. Capital spending was $1.3 billion in 2016, or 110% of depreciation and amortization, compared with $1.5 billion in 2015, or 115% of depreciation and amortization, and $1.4 billion, or 97% of depreciation and amortization in 2014. Across our businesses, capital spending as a percentage of depreciation and amortization ranged from 37.3% to 161.1% in 2016.
13
The following table shows capital spending for operations by business segment for the years ended December 31, 2016, 2015 and 2014.
In millions | 2016 | 2015 | 2014 | ||||||
Industrial Packaging | $ | 816 | $ | 858 | $ | 754 | |||
Global Cellulose Fibers | 174 | 129 | 75 | ||||||
Printing Papers | 215 | 232 | 243 | ||||||
Consumer Packaging | 124 | 216 | 233 | ||||||
Subtotal | 1,329 | 1,435 | 1,305 | ||||||
Corporate and other | 19 | 52 | 61 | ||||||
Capital Spending | $ | 1,348 | $ | 1,487 | $ | 1,366 | |||
Capital expenditures in 2017 are currently expected to be about $1.5 billion, or 107% of depreciation and amortization.
Acquisitions and Joint Ventures
See Note 6 Acquisitions and Joint Ventures on pages 54 through 56 of Item 8. Financial Statements and Supplementary Data for a discussion of the Company's acquisitions.
Financing Activities
Amounts related to early debt extinguishment during the years ended December 31, 2016, 2015 and 2014 were as follows:
In millions | 2016 | 2015 | 2014 | ||||||
Debt reductions (a) | $ | 266 | $ | 2,151 | $ | 1,625 | |||
Pre-tax early debt extinguishment costs (b) | 29 | 207 | 276 | ||||||
(a) | Reductions related to notes with interest rates ranging from 2.00% to 9.38% with original maturities from 2015 to 2030 for the years ended December 31, 2016, 2015 and 2014. Includes the $630 million payment for a portion of the Special Purpose Entity Liability for the year ended December 31, 2015 (see Note 12 Variable Interest Entities on pages 64 through 67 of Item 8. Financial Statements and Supplementary Data). |
(b) | Amounts are included in Restructuring and other charges in the accompanying consolidated statements of operations. |
2016: Financing activities during 2016 included debt issuances of $3.8 billion and retirements of $1.9 billion for a net increase of $1.9 billion.
International Paper utilizes interest rate swaps to change the mix of fixed and variable rate debt and manage interest expense. At December 31, 2016, International Paper had no interest rate swap contracts outstanding (see Note 14 Derivatives and Hedging Activities on pages 67 through 70 of Item 8. Financial Statements and Supplementary Data). During 2016, the amortization of deferred gains on previously terminated swaps had no impact on the weighted average cost of long-term recourse debt. The inclusion of the offsetting interest income from short-term
investments reduced the effective rate from 5.3% to 4.8%.
In 2016, International Paper issued $1.1 billion of 3.00% senior unsecured notes with a maturity date in 2027, and $1.2 billion of 4.40% senior unsecured notes with a maturity date in 2047, the proceeds from which were primarily used to fund the acquisition of Weyerhaeuser's pulp business. In addition, the Company repaid approximately $266 million of notes with an interest rate of 7.95% and an original maturity of 2018. Pre-tax early debt retirement costs of $29 million related to the debt repayments, including the $31 million of cash premiums, are included in restructuring and other charges in the accompanying consolidated statement of operations for the twelve months ended December 31, 2016.
In June 2016, International Paper entered into a commercial paper program with a borrowing capacity of $750 million. Under the terms of the program, individual maturities on borrowings may vary, but not exceed one year from the date of issue. Interest bearing notes may be issued either as fixed notes or floating rate notes. As of December 31, 2016, the Company had $165 million outstanding under this program.
Other financing activities during 2016 included the net repurchase of approximately 0.9 million shares of treasury stock, including restricted stock withholding. Repurchases of common stock and payments of restricted stock withholding taxes totaled $132.3 million, including $100.1 million related to shares repurchased under the Company's share repurchase program.
In October 2016, International Paper announced that the quarterly dividend would be increased from $0.44 per share to $0.46 per share, effective for the 2016 fourth quarter.
2015: Financing activities during 2015 included debt issuances of $6.9 billion and retirements of $6.9 billion for a net decrease of $74 million.
During 2015, the Company restructured the timber monetization which resulted in the use of $630 million in cash to pay down a portion of the third party bank loans and refinance the loans on nonrecourse terms. (see Note 12 Variable Interest Entities on pages 64 through 66 of Item 8. Financial Statements and Supplementary Data).
International Paper utilizes interest rate swaps to change the mix of fixed and variable rate debt and manage interest expense. At December 31, 2015, International Paper had interest rate swaps with a total notional amount of $17 million and maturities in 2018 (see Note 14 Derivatives and Hedging Activities on pages 67 through 70 of Item 8. Financial Statements and Supplementary Data). During 2015, existing swaps
14
and the amortization of deferred gains on previously terminated swaps decreased the weighted average cost of debt from 5.9% to an effective rate of 5.8%. The inclusion of the offsetting interest income from short-term investments reduced this effective rate to 5.1%.
In 2015, International Paper issued $700 million of 3.80% senior unsecured notes with a maturity date in 2026, $600 million of 5.00% senior unsecured notes with a maturity date in 2035, and $700 million of 5.15% senior unsecured notes with a maturity date in 2046. The proceeds from this borrowing were used to repay approximately $1.0 billion of notes with interest rates ranging from 4.75% to 9.38% and original maturities from 2018 to 2022, along with $211 million of cash premiums associated with the debt repayments. Additionally, the proceeds from this borrowing were used to make a $750 million voluntary cash contribution to the Company's pension plan. Pre-tax early debt retirement costs of $207 million related to the debt repayments, including the $211 million of cash premiums, are included in restructuring and other charges in the accompanying consolidated statement of operations for the twelve months ended December 31, 2015.
Other financing activities during 2015 included the net repurchase of approximately 8.0 million shares of treasury stock, including restricted stock withholding, and the issuance of 62,000 shares of common stock for various plans, including stock option exercises that generated approximately $2.4 million of cash. Repurchases of common stock and payments of restricted stock withholding taxes totaled $604.6 million, including $522.6 million related to shares repurchased under the Company's share repurchase program.
In October 2015, International Paper announced that the quarterly dividend would be increased from $0.40 per share to $0.44 per share, effective for the 2015 fourth quarter.
2014: Financing activities during 2014 included debt issuances of $2.0 billion and retirements of $2.1 billion, for a net decrease of $113 million.
International Paper utilizes interest rate swaps to change the mix of fixed and variable rate debt and manage interest expense. At December 31, 2014, International Paper had interest rate swaps with a total notional amount of $230 million and maturities in 2018 (see Note 14 Derivatives and Hedging Activities on pages 67 through 70 of Item 8. Financial Statements and Supplementary Data). During 2014, existing swaps and the amortization of deferred gains on previously terminated swaps decreased the weighted average cost of debt from 6.8% to an effective rate of 6.7%. The
inclusion of the offsetting interest income from short-term investments reduced this effective rate to 6.3%.
During the second quarter of 2014, International Paper issued $800 million of 3.65% senior unsecured notes with a maturity date in 2024 and $800 million of 4.80% senior unsecured notes with a maturity date in 2044. The proceeds from this borrowing were used to repay approximately $960 million of notes with interest rates ranging from 7.95% to 9.38% and original maturities from 2018 to 2019. Pre-tax early debt retirement costs of $262 million related to these debt repayments, including $258 million of cash premiums, are included in Restructuring and other charges in the accompanying consolidated statement of operations for the twelve months ended December 31, 2014.
Other financing activities during 2014 included the net repurchase of approximately 17.9 million shares of treasury stock, including restricted stock withholding, and the issuance of 1.6 million shares of common stock for various plans, including stock options exercises that generated approximately $66 million of cash. Repurchases of common stock and payments of restricted stock withholding taxes totaled $1.06 billion, including $983 million related to shares repurchased under the Company's share repurchase program.
In September 2014, International Paper announced that the quarterly dividend would be increased from $0.35 per share to $0.40 per share, effective for the 2014 fourth quarter.
Variable Interest Entities
Information concerning variable interest entities is set forth in Note 12 Variable Interest Entities on pages 64 through 66 of Item 8. Financial Statements and Supplementary Data for discussion.
Liquidity and Capital Resources Outlook for 2017
Capital Expenditures and Long-Term Debt
International Paper expects to be able to meet projected capital expenditures, service existing debt and meet working capital and dividend requirements during 2017 through current cash balances and cash from operations. Additionally, the Company has existing credit facilities totaling $2.1 billion available at December 31, 2016.
The Company’s financial covenants require the maintenance of a minimum net worth of $9 billion and a total debt-to-capital ratio of less than 60%. Net worth is defined as the sum of common stock, paid-in capital and retained earnings, less treasury stock plus any cumulative goodwill impairment charges. The calculation also excludes accumulated other comprehensive income/loss and Nonrecourse Financial Liabilities of Special Purpose Entities. The
15
total debt-to-capital ratio is defined as total debt divided by the sum of total debt plus net worth. The Company was in compliance with all its debt covenants at December 31, 2016 and was well below the thresholds stipulated under the covenants as defined in the credit agreements.
The Company will continue to rely upon debt and capital markets for the majority of any necessary long-term funding not provided by operating cash flows. Funding decisions will be guided by our capital structure planning objectives. The primary goals of the Company’s capital structure planning are to maximize financial flexibility and preserve liquidity while reducing interest expense. The majority of International Paper’s debt is accessed through global public capital markets where we have a wide base of investors.
Maintaining an investment grade credit rating is an important element of International Paper’s financing strategy. At December 31, 2016, the Company held long-term credit ratings of BBB (stable outlook) and Baa2 (stable outlook) by S&P and Moody’s, respectively.
Contractual obligations for future payments under existing debt and lease commitments and purchase obligations at December 31, 2016, were as follows:
In millions | 2017 | 2018 | 2019 | 2020 | 2021 | Thereafter | ||||||||||||
Maturities of long-term debt (a) | $ | 239 | $ | 690 | $ | 433 | $ | 179 | $ | 612 | $ | 9,161 | ||||||
Lease obligations | 119 | 91 | 69 | 51 | 38 | 125 | ||||||||||||
Purchase obligations (b) | 3,165 | 635 | 525 | 495 | 460 | 2,332 | ||||||||||||
Total (c) | $ | 3,523 | $ | 1,416 | $ | 1,027 | $ | 725 | $ | 1,110 | $ | 11,618 | ||||||
(a) | Total debt includes scheduled principal payments only. |
(b) | Includes $2 billion relating to fiber supply agreements entered into at the time of the 2006 Transformation Plan forestland sales and in conjunction with the 2008 acquisition of Weyerhaeuser Company’s Containerboard, Packaging and Recycling business. Also includes $1.1 billion relating to fiber supply agreements assumed in conjunction with the 2016 acquisition of Weyerhaeuser's pulp business. |
(c) | Not included in the above table due to the uncertainty as to the amount and timing of the payment are unrecognized tax benefits of approximately $77 million. |
We consider the undistributed earnings of our foreign subsidiaries as of December 31, 2016, to be indefinitely reinvested and, accordingly, no U.S. income taxes have been provided thereon. As of December 31, 2016, the amount of cash associated with indefinitely reinvested foreign earnings was approximately $620 million. We do not anticipate the need to repatriate funds to the United States to satisfy domestic liquidity needs arising in the ordinary course of business, including liquidity needs associated with our domestic debt service requirements.
Pension Obligations and Funding
At December 31, 2016, the projected benefit obligation for the Company’s U.S. defined benefit plans determined under U.S. GAAP was approximately $3.4 billion higher than the fair value of plan assets. Approximately $3.0 billion of this amount relates to plans that are subject to minimum funding requirements. Under current IRS funding rules, the calculation of minimum funding requirements differs from the calculation of the present value of plan benefits(the projected benefit obligation) for accounting purposes. In December 2008, the Worker, Retiree and Employer Recovery Act of 2008 (WERA) was passed by the U.S. Congress which provided for pension funding relief and technical corrections. Funding contributions depend on the funding method selected by the Company, and the timing of its implementation, as well as on actual demographic data and the targeted funding level. The Company continually reassesses the amount and timing of any discretionary contributions and elected to make contributions totaling $750 million for both years ended December 31, 2016 and 2015. At this time, we do not expect to have any required contributions to our plans in 2017, although the Company may elect to make future voluntary contributions. The timing and amount of future contributions, which could be material, will depend on a number of factors, including the actual earnings and changes in values of plan assets and changes in interest rates. International Paper announced a voluntary, limited-time opportunity for former employees who are participants in the Retirement Plan of International Paper Company (the Pension Plan) to request early payment of their entire Pension Plan benefit in the form of a single lump sum payment. The amount of total payments under this program was approximately $1.2 billion, and were made from Plan trust assets on June 30, 2016. Based on the level of payments made, settlement accounting rules applied and resulted in a plan remeasurement as of the June 30, 2016 payment date. As a result of settlement accounting, the Company recognized a pro-rata portion of the unamortized net actuarial loss, after remeasurement, resulting in a $439 million non-cash charge to the Company's earnings in the second quarter of 2016. Additional payments of $8 million and $9 million were made during the third and fourth quarters, respectively, due to mandatory cash payouts and a small lump sum payout, and the Pension Plan was subsequently remeasured at September 30, 2016 and December 31, 2016. As a result of settlement accounting, the Company recognized non-cash settlement charges of $3 million in both the third and fourth quarters of 2016.
16
Ilim Holding S.A. Shareholder’s Agreement
In October 2007, in connection with the formation of the Ilim Holding S.A. joint venture, International Paper entered into a shareholder’s agreement that includes provisions relating to the reconciliation of disputes among the partners. This agreement provides that at any time, either the Company or its partners may commence procedures specified under the deadlock agreement. If these or any other deadlock procedures under the shareholder's agreement are commenced, although it is not obligated to do so, the Company may in certain situations choose to purchase its partners' 50% interest in Ilim. Any such transaction would be subject to review and approval by Russian and other relevant anti-trust authorities. Based on the provisions of the agreement, the Company estimates that the current purchase price for its partners' 50% interests would be approximately $1.5 billion, which could be satisfied by payment of cash or International Paper common stock, or some combination of the two, at the Company's option. The purchase by the Company of its partners’ 50% interest in Ilim would result in the consolidation of Ilim's financial position and results of operations in all subsequent periods. The parties have informed each other that they have no current intention to commence procedures specified under the deadlock provisions of the shareholder’s agreement.
The preparation of financial statements in conformity with accounting principles generally accepted in the United States requires International Paper to establish accounting policies and to make estimates that affect both the amounts and timing of the recording of assets, liabilities, revenues and expenses. Some of these estimates require judgments about matters that are inherently uncertain.
Accounting policies whose application may have a significant effect on the reported results of operations and financial position of International Paper, and that can require judgments by management that affect their application, include the accounting for contingencies, impairment or disposal of long-lived assets and goodwill, pensions and postretirement benefit obligations, stock options and income taxes. The Company has discussed the selection of critical accounting policies and the effect of significant estimates with the Audit and Finance Committee of the Company’s Board of Directors.
Contingent Liabilities
Accruals for contingent liabilities, including legal and environmental matters, are recorded when it is probable that a liability has been incurred or an asset impaired and the amount of the loss can be reasonably
estimated. Liabilities accrued for legal matters require judgments regarding projected outcomes and range of loss based on historical experience and recommendations of legal counsel. Liabilities for environmental matters require evaluations of relevant environmental regulations and estimates of future remediation alternatives and costs.
Impairment of Long-Lived Assets and Goodwill
An impairment of a long-lived asset exists when the asset’s carrying amount exceeds its fair value, and is recorded when the carrying amount is not recoverable through cash flows from future operations. A goodwill impairment exists when the carrying amount of goodwill exceeds its fair value. Assessments of possible impairments of long-lived assets and goodwill are made when events or changes in circumstances indicate that the carrying value of the asset may not be recoverable through future operations. Additionally, testing for possible impairment of goodwill and intangible asset balances is required annually. The amount and timing of any impairment charges based on these assessments require the estimation of future cash flows and the fair market value of the related assets based on management’s best estimates of certain key factors, including future selling prices and volumes, operating, raw material, energy and freight costs, and various other projected operating economic factors. As these key factors change in future periods, the Company will update its impairment analyses to reflect its latest estimates and projections.
Under the provisions of Accounting Standards Codification (ASC) 350, “Intangibles – Goodwill and Other,” the testing of goodwill for possible impairment is a two-step process. In the first step, the fair value of the Company’s reporting units is compared with their carrying value, including goodwill. If fair value exceeds the carrying value, goodwill is not considered to be impaired. If the fair value of a reporting unit is below the carrying value, then step two is performed to measure the amount of the goodwill impairment loss for the reporting unit. This analysis requires the determination of the fair value of all of the individual assets and liabilities of the reporting unit, including any currently unrecognized intangible assets, as if the reporting unit had been purchased on the analysis date. Once these fair values have been determined, the implied fair value of the unit’s goodwill is calculated as the excess, if any, of the fair value of the reporting unit determined in step one over the fair value of the net assets determined in step two. The carrying value of goodwill is then reduced to this implied value, or to zero if the fair value of the assets exceeds the fair value of the reporting unit, through a goodwill impairment charge.
The impairment analysis requires a number of judgments by management. In calculating the estimated fair value of its reporting units in step one,
17
the Company uses the projected future cash flows to be generated by each unit, discounted using the estimated discount rate for each reporting unit. These calculations require many estimates, including discount rates, future growth rates, and cost and pricing trends for each reporting unit. Subsequent changes in economic and operating conditions can affect these assumptions and could result in additional interim testing and goodwill impairment charges in future periods. Upon completion, the resulting estimated fair values are then analyzed for reasonableness by comparing them to earnings multiples for historic industry business transactions, and by comparing the sum of the reporting unit fair values and other corporate assets and liabilities divided by diluted common shares outstanding to the Company’s market price per share on the analysis date.
No goodwill impairment charges were recorded in 2016.
In the fourth quarter of 2015, in conjunction with the annual testing of its reporting units for possible goodwill impairments, the Company calculated the estimated fair value of its Brazil Packaging business using the discounted future cash flows and determined that all of the goodwill in the business, totaling $137 million, should be written off. The decline in the fair value of the Brazil Packaging business and resulting impairment charge was due to the negative impacts on the cash flows of the business caused by the continued decline of the overall Brazilian economy.
In the fourth quarter of 2014, in conjunction with the annual testing of its reporting units for possible goodwill impairments, the Company calculated the estimated fair value of its Asia Industrial Packaging business using the discounted future cash flows and determined that all of the goodwill in this business, totaling $100 million, should be written off. The decline in the fair value of the Asia Industrial Packaging business and resulting impairment charge was due to a change in the strategic outlook for the business.
Pension and Postretirement Benefit Obligations
The charges recorded for pension and other postretirement benefit obligations are determined annually in conjunction with International Paper’s consulting actuary, and are dependent upon various assumptions including the expected long-term rate of return on plan assets, discount rates, projected future compensation increases, health care cost trend rates and mortality rates.
The calculations of pension and postretirement benefit obligations and expenses require decisions about a number of key assumptions that can significantly affect liability and expense amounts, including the expected long-term rate of return on plan assets, the discount
rate used to calculate plan liabilities, the projected rate of future compensation increases and health care cost trend rates.
Benefit obligations and fair values of plan assets as of December 31, 2016, for International Paper’s pension and postretirement plans were as follows:
In millions | Benefit Obligation | Fair Value of Plan Assets | ||||
U.S. qualified pension | $ | 13,307 | $ | 10,312 | ||
U.S. nonqualified pension | 376 | — | ||||
U.S. postretirement | 280 | — | ||||
Non-U.S. pension | 219 | 153 | ||||
Non-U.S. postretirement | 23 | — | ||||
The table below shows assumptions used by International Paper to calculate U.S. pension obligations for the years shown:
2016 | 2015 | 2014 | ||||
Discount rate | 4.10 | % | 4.40 | % | 4.10 | % |
Rate of compensation increase | 3.75 | % | 3.75 | % | 3.75 | % |
Additionally, health care cost trend rates used in the calculation of U.S. postretirement obligations for the years shown were:
2016 | 2015 | |||
Health care cost trend rate assumed for next year | 6.50 | % | 7.00 | % |
Rate that the cost trend rate gradually declines to | 5.00 | % | 5.00 | % |
Year that the rate reaches the rate it is assumed to remain | 2022 | 2022 | ||
International Paper determines these actuarial assumptions, after consultation with our actuaries, on December 31 of each year to calculate liability information as of that date and pension and postretirement expense for the following year. The expected long-term rate of return on plan assets is based on projected rates of return for current and planned asset classes in the plan’s investment portfolio. The discount rate assumption was determined based on a hypothetical settlement portfolio selected from a universe of high quality corporate bonds.
The expected long-term rate of return on U.S. pension plan assets used to determine net periodic cost for the year ended December 31, 2016 was 7.75%.
Increasing (decreasing) the expected long-term rate of return on U.S. plan assets by an additional 0.25% would decrease (increase) 2017 pension expense by approximately $26 million, while a (decrease) increase of 0.25% in the discount rate would (increase) decrease pension expense by approximately $33 million. The effect on net postretirement benefit cost from a 1%
18
increase or decrease in the annual health care cost trend rate would be approximately $1 million.
Actual rates of return earned on U.S. pension plan assets for each of the last 10 years were:
Year | Return | Year | Return | ||
2016 | 7.1 | % | 2011 | 2.5 | % |
2015 | 1.3 | % | 2010 | 15.1 | % |
2014 | 6.4 | % | 2009 | 23.8 | % |
2013 | 14.1 | % | 2008 | (23.6 | )% |
2012 | 14.1 | % | 2007 | 9.6 | % |
The 2012, 2013 and 2014 returns above represent weighted averages of International Paper and Temple-Inland asset returns. International Paper and Temple-Inland assets were combined in October 2014. The annualized time-weighted rate of return earned on U.S. pension plan assets was 8.5% and 6.3% for the past five and ten years, respectively. The following graph shows the growth of a $1,000 investment in International Paper’s U.S. Pension Plan Master Trust. The graph portrays the time-weighted rate of return from 2006 – 2016.

ASC 715, “Compensation – Retirement Benefits,” provides for delayed recognition of actuarial gains and losses, including amounts arising from changes in the estimated projected plan benefit obligation due to changes in the assumed discount rate, differences between the actual and expected return on plan assets, and other assumption changes. These net gains and losses are recognized in pension expense prospectively over a period that approximates the average remaining service period of active employees expected to receive benefits under the plans to the extent that they are not offset by gains and losses in subsequent years. The estimated net loss and prior service cost that will be amortized from accumulated other comprehensive income into net periodic pension cost for the U.S. pension plans over the next fiscal year are $341 million and $28 million, respectively.
Net periodic pension and postretirement plan expenses, calculated for all of International Paper’s plans, were as follows:
In millions | 2016 | 2015 | 2014 | 2013 | 2012 | ||||||||||
Pension expense | |||||||||||||||
U.S. plans (non-cash) | $ | 809 | $ | 461 | $ | 387 | $ | 545 | $ | 342 | |||||
Non-U.S. plans | 4 | 6 | — | 5 | 3 | ||||||||||
Postretirement expense | |||||||||||||||
U.S. plans | 13 | 8 | 7 | (1 | ) | (4 | ) | ||||||||
Non-U.S. plans | 1 | 5 | 7 | 7 | 1 | ||||||||||
Net expense | $ | 827 | $ | 480 | $ | 401 | $ | 556 | $ | 342 | |||||
The increase in 2016 U.S. pension expense principally reflects a decrease in the discount rate and a large settlement charge in 2016 related to the optional lump sum payout partially offset by a higher return on assets and lower amortization of actuarial losses.
Assuming that discount rates, expected long-term returns on plan assets and rates of future compensation increases remain the same as in 2016, projected future net periodic pension and postretirement plan expenses would be as follows:
In millions | 2018 (1) | 2017 (1) | ||||
Pension expense | ||||||
U.S. plans (non-cash) | $ | 252 | $ | 310 | ||
Non-U.S. plans | 3 | 4 | ||||
Postretirement expense | ||||||
U.S. plans | 15 | 18 | ||||
Non-U.S. plans | 1 | 1 | ||||
Net expense | $ | 271 | $ | 333 | ||
(1) | Based on assumptions at December 31, 2016. |
The Company estimates that it will record net pension expense of approximately $310 million for its U.S. defined benefit plans in 2017, with the decrease from expense of $809 million in 2016 mainly related to no expected settlement charges in 2017 and an increase in the assumed discount rate to 4.10% in 2017 from 4.05% in 2016, partially offset by a lower return on asset assumption of 7.50% in 2017, down from 7.75% in 2016.
The market value of plan assets for International Paper’s U.S. qualified pension plan at December 31, 2016 totaled approximately $10.3 billion, consisting of approximately 51% equity securities, 27% debt securities, 10% real estate and 12% other assets. Plan assets include an immaterial amount of International Paper common stock.
The Company’s funding policy for its qualified pension plans is to contribute amounts sufficient to meet legal funding requirements, plus any additional amounts that the Company may determine to be appropriate
19
considering the funded status of the plan, tax deductibility, the cash flows generated by the Company, and other factors. The Company continually reassesses the amount and timing of any discretionary contributions and could elect to make voluntary contributions in the future. There are no required contributions to the U.S. qualified plan in 2017. The nonqualified defined benefit plans are funded to the extent of benefit payments, which totaled $21 million for the year ended December 31, 2016.
Income Taxes
International Paper records its global tax provision based on the respective tax rules and regulations for the jurisdictions in which it operates. Where the Company believes that a tax position is supportable for income tax purposes, the item is included in its income
tax returns. Where treatment of a position is uncertain, liabilities are recorded based upon the Company’s evaluation of the “more likely than not” outcome considering technical merits of the position based on
specific tax regulations and facts of each matter. Changes to recorded liabilities are only made when an identifiable event occurs that changes the likely outcome, such as settlement with the relevant tax authority, the expiration of statutes of limitation for the subject tax year, change in tax laws, or a recent court case that addresses the matter.
Valuation allowances are recorded to reduce deferred tax assets when it is more likely than not that a tax benefit will not be realized. Significant judgment is required in evaluating the need for and magnitude of appropriate valuation allowances against deferred tax assets. The realization of these assets is dependent on generating future taxable income, as well as successful implementation of various tax planning strategies.
While International Paper believes that these judgments and estimates are appropriate and reasonable under the circumstances, actual resolution of these matters may differ from recorded estimated amounts.
The Company’s effective income tax rates, before equity earnings and discontinued operations, were 26%, 37% and 14% for 2016, 2015 and 2014, respectively. These effective tax rates include the tax effects of certain special items that can significantly affect the effective income tax rate in a given year, but may not recur in subsequent years. Management believes that the effective tax rate computed after excluding these special items may provide a better estimate of the rate that might be expected in future years if no additional special items were to occur in those years. Excluding these special items, the effective income tax rate for 2016 was 32% of pre-tax earnings compared with 33% in 2015 and 31% in 2014. We estimate that the 2017 effective income tax rate will
be approximately 33% based on expected earnings and business conditions.
Business Combinations
The Company’s acquisitions of businesses are accounted for in accordance with ASC 805, "Business Combinations", as amended. We allocate the total purchase price of the assets acquired and liabilities assumed based on their estimated fair value as of the business combination date. In developing estimates of fair values for long-lived assets, including identifiable intangible assets, the Company utilizes a variety of inputs including forecasted cash flows, anticipated growth rates, discount rates, estimated replacement costs and depreciation and obsolescence factors. Determining the fair value for specifically identified intangible assets such as customer lists and developed technology involves judgment. We may refine our estimates and make adjustments to the assets acquired and liabilities assumed over a measurement period, not to exceed one year. Upon the conclusion of the measurement period or the final determination of the values of assets acquired and liabilities assumed, whichever comes first, any subsequent adjustments are charged to the consolidated statements of earnings. Subsequent actual results of the underlying business activity supporting the specifically identified intangible assets could change, requiring us to record impairment charges or adjust their economic lives in future periods.
There were no new accounting pronouncements issued or effective during the fiscal year which have had or are expected to have a material impact on the Company’s consolidated financial statements. See Note 2 Recent Accounting Developments on pages 49 through 52 of Item 8. Financial Statements and Supplementary Data for a discussion of new accounting pronouncements.
Information concerning the Company’s environmental and legal proceedings is set forth in Note 11 Commitments and Contingencies on pages 61 through 63 of Item 8. Financial Statements and Supplementary Data.
While inflationary increases in certain input costs, such as energy, wood fiber and chemical costs, have an impact on the Company’s operating results, changes in general inflation have had minimal impact on our operating results in each of the last three years. Sales prices and volumes are more strongly influenced by economic supply and demand factors in specific markets and by exchange rate fluctuations than by inflationary factors.
20
International Paper has operations in a number of countries. Its operations in those countries also export to, and compete with, imports from other regions. As such, currency movements can have a number of direct and indirect impacts on the Company’s financial statements. Direct impacts include the translation of international operations’ local currency financial statements into U.S. dollars and the remeasurement impact associated with non-functional currency financial assets and liabilities. Indirect impacts include the change in competitiveness of imports into, and exports out of, the United States (and the impact on local currency pricing of products that are traded internationally). In general, a weaker U.S. dollar and stronger local currency is beneficial to International Paper. The currencies that have the most impact are the Euro, the Brazilian real, the Polish zloty and the Russian ruble.
We use financial instruments, including fixed and variable rate debt, to finance operations, for capital spending programs and for general corporate purposes. Additionally, financial instruments, including various derivative contracts, are used to hedge exposures to interest rate, commodity and foreign currency risks. We do not use financial instruments for trading purposes. Information related to International Paper’s debt obligations is included in Note 13 Debt and Lines of Credit on pages 66 and 67 of Item 8. Financial Statements and Supplementary Data. A discussion of derivatives and hedging activities is included in Note 14 Derivatives and Hedging Activities on pages 67 through 70 of Item 8. Financial Statements and Supplementary Data.
The fair value of our debt and financial instruments varies due to changes in market interest and foreign currency rates and commodity prices since the inception of the related instruments. We assess this market risk utilizing a sensitivity analysis. The sensitivity analysis measures the potential loss in earnings, fair values and cash flows based on a hypothetical 10% change (increase and decrease) in interest and currency rates and commodity prices.
Interest Rate Risk
Our exposure to market risk for changes in interest rates relates primarily to short- and long-term debt obligations and investments in marketable securities. We invest in investment-grade securities of financial institutions and money market mutual funds with a minimum rating of AAA and limit exposure to any one issuer or fund. Our investments in marketable securities at December 31, 2016 and 2015 are stated at cost, which approximates market due to their short-term nature. Our interest rate
risk exposure related to these investments was not material.
We issue fixed and floating rate debt in a proportion that management deems appropriate based on current and projected market conditions. Derivative instruments, such as, interest rate swaps, may be used to execute this strategy. At December 31, 2016 and 2015, the net fair value liability of financial instruments with exposure to interest rate risk was approximately $11.3 billion and $9.3 billion, respectively. The potential loss in fair value resulting from a 10% adverse shift in quoted interest rates would have been approximately $623 million and $565 million at December 31, 2016 and 2015, respectively.
Commodity Price Risk
The objective of our commodity exposure management is to minimize volatility in earnings due to large fluctuations in the price of commodities. Commodity swap or forward purchase contracts may be used to manage risks associated with market fluctuations in energy prices. The net fair value of such outstanding energy hedge contracts at December 31, 2016 and 2015 was approximately a $2 million and a $7 million liability, respectively. The potential loss in fair value resulting from a 10% adverse change in the underlying commodity prices would have been approximately $1 million at December 31, 2016 and 2015, respectively.
Foreign Currency Risk
International Paper transacts business in many currencies and is also subject to currency exchange rate risk through investments and businesses owned and operated in foreign countries. Our objective in managing the associated foreign currency risks is to minimize the effect of adverse exchange rate fluctuations on our after-tax cash flows. We address these risks on a limited basis by entering into cross-currency and interest rate swaps, or foreign exchange contracts. At December 31, 2016 and 2015, the net fair value of financial instruments with exposure to foreign currency risk was approximately a $1 million liability and a $4 million asset, respectively. The potential loss in fair value for such financial instruments from a 10% adverse change in quoted foreign currency exchange rates would have been approximately $23 million and $30 million at December 31, 2016 and 2015, respectively.
21