SEC File Nos. 002-33371
811-01880
UNITED STATES
SECURITIES AND EXCHANGE COMMISSION
Washington, D.C. 20549
FORM N-1A
Registration Statement
Under
the Securities Act Of 1933
Post-Effective Amendment No. 89
and
Registration Statement
Under
the Investment Company Act Of 1940
Amendment No. 70
THE INCOME FUND OF AMERICA
(Exact Name of Registrant as Specified in Charter)
6455 Irvine Center Drive
Irvine, California 92618-4518
(Address of Principal Executive Offices)
Registrant's Telephone Number, Including Area Code:
(213) 486-9200
Michael W. Stockton, Secretary
The Income Fund of America
333 South Hope Street
Los Angeles, California 90071-1406
(Name and Address of Agent for Service)
Copies to:
Michael Glazer
Morgan, Lewis & Bockius LLP
300 South Grand Avenue, 22nd Floor
Los Angeles, California 90071-3132
(Counsel for the Registrant)
Approximate date of proposed public offering:
It is proposed that this filing will become effective on April 7, 2017, pursuant to paragraph (b) of Rule 485.
 |
The
Income Fund Prospectus April 7, 2017 |
| Class | A | C | T | F-1 | F-2 | F-3 | 529-A | 529-C | 529-E | 529-T |
| AMECX | IFACX | TIAFX | IFAFX | AMEFX | FIFAX | CIMAX | CIMCX | CIMEX | TFAAX | |
| Class | 529-F-1 | R-1 | R-2 | R-2E | R-3 | R-4 | R-5E | R-5 | R-6 | |
| CIMFX | RIDAX | RIDBX | RIEBX | RIDCX | RIDEX | RIDHX | RIDFX | RIDGX |
Table of contents
| Investment objectives | 1 |
| Fees and expenses of the fund | 1 |
| Principal investment strategies | 2 |
| Principal risks | 3 |
| Investment results | 4 |
| Management | 6 |
| Purchase and sale of fund shares | 6 |
| Tax information | 6 |
| Payments to broker-dealers and other financial intermediaries | 6 |
| Investment objectives, strategies and risks | 7 |
| Management and organization | 10 |
| Shareholder information | 13 |
| Purchase, exchange and sale of shares | 14 |
| How to sell shares | 18 |
| Distributions and taxes | 21 |
| Choosing a share class | 22 |
| Sales charges | 23 |
| Sales charge reductions and waivers | 25 |
| Rollovers from retirement plans to IRAs | 33 |
| Plans of distribution | 35 |
| Other compensation to dealers | 36 |
| Fund expenses | 38 |
| Financial highlights | 39 |
| The U.S. Securities and Exchange Commission has not approved or disapproved of these securities. Further, it has not determined that this prospectus is accurate or complete. Any representation to the contrary is a criminal offense. |
Investment objectives The fund’s investment objectives are to provide you with current income while secondarily striving for capital growth.
Fees and expenses of the fund This table describes the fees and expenses that you may pay if you buy and hold shares of the fund. You may qualify for sales charge discounts if you and your family invest, or agree to invest in the future, at least $25,000 in American Funds. More information about these and other discounts is available from your financial professional and in the “Sales charge reductions and waivers” section on page 25 of the prospectus and on page 70 of the fund’s statement of additional information.
| Shareholder fees (fees paid directly from your investment) | ||||||
| Share class: | A
and 529-A |
C
and 529-C |
529-E | T
and 529-T |
All F and 529-F share classes | All
R share classes |
| Maximum sales charge (load) imposed on purchases (as a percentage of offering price) | 5.75% | none | none | 2.50% | none | none |
| Maximum deferred sales charge (load) (as a percentage of the amount redeemed) | 1.001 | 1.00% | none | none | none | none |
| Maximum sales charge (load) imposed on reinvested dividends | none | none | none | none | none | none |
| Redemption or exchange fees | none | none | none | none | none | none |
| Annual fund operating expenses (expenses that you pay each year as a percentage of the value of your investment) | |||||||
| Share class: | A | C | T | F-1 | F-2 | F-3 | 529-A |
| Management fees | 0.22% | 0.22% | 0.22% | 0.22% | 0.22% | 0.22% | 0.22% |
| Distribution and/or service (12b-1) fees | 0.24 | 1.00 | 0.25 | 0.25 | none | none | 0.23 |
| Other expenses | 0.10 | 0.14 | 0.142 | 0.18 | 0.17 | 0.062 | 0.21 |
| Total annual fund operating expenses | 0.56 | 1.36 | 0.61 | 0.65 | 0.39 | 0.28 | 0.66 |
| Share class: | 529-C | 529-E | 529-T | 529-F-1 | R-1 | R-2 | R-2E |
| Management fees | 0.22% | 0.22% | 0.22% | 0.22% | 0.22% | 0.22% | 0.22% |
| Distribution and/or service (12b-1) fees | 0.99 | 0.50 | 0.25 | 0.00 | 1.00 | 0.74 | 0.60 |
| Other expenses | 0.22 | 0.17 | 0.192 | 0.21 | 0.15 | 0.40 | 0.273 |
| Total annual fund operating expenses | 1.43 | 0.89 | 0.66 | 0.43 | 1.37 | 1.36 | 1.09 |
| Share class: | R-3 | R-4 | R-5E | R-5 | R-6 | ||
| Management fees | 0.22% | 0.22% | 0.22% | 0.22% | 0.22% | ||
| Distribution and/or service (12b-1) fees | 0.50 | 0.25 | none | none | none | ||
| Other expenses | 0.20 | 0.15 | 0.27 | 0.11 | 0.06 | ||
| Total annual fund operating expenses | 0.92 | 0.62 | 0.49 | 0.33 | 0.28 |
1 A contingent deferred sales charge of 1.00% applies on certain redemptions made within one year following purchases of $1 million or more made without an initial sales charge. Contingent deferred sales charge is calculated based on the lesser of the offering price and market value of shares being sold.
2 Based on estimated amounts for the current fiscal year.
3 Restated to reflect current fees.
Example This example is intended to help you compare the cost of investing in the fund with the cost of investing in other mutual funds.
The example assumes that you invest $10,000 in the fund for the time periods indicated and then redeem all of your shares at the end of those periods. The example also assumes that your investment has a 5% return each year and that the fund’s operating expenses remain the same. You may be required to pay brokerage commissions on your purchases and sales of Class F-2 or F-3 shares of the fund, which are not reflected in the
1 The Income Fund of America / Prospectus
example. Although your actual costs may be higher or lower, based on these assumptions your costs would be:
| Share class: | A | C | T | F-1 | F-2 | F-3 | 529-A | 529-C | 529-E | 529-T | 529-F-1 | R-1 | R-2 |
| 1 year | $ 629 | $ 238 | $311 | $ 66 | $ 40 | $ 29 | $ 639 | $ 246 | $ 91 | $ 317 | $ 44 | $ 139 | $ 138 |
| 3 years | 744 | 431 | 440 | 208 | 125 | 90 | 774 | 452 | 284 | 461 | 138 | 434 | 431 |
| 5 years | 870 | 745 | 582 | 362 | 219 | 157 | 922 | 782 | 493 | 618 | 241 | 750 | 745 |
| 10 years | 1,236 | 1,635 | 993 | 810 | 493 | 356 | 1,350 | 1,713 | 1,096 | 1,072 | 542 | 1,646 | 1,635 |
| Share class: | R-2E | R-3 | R-4 | R-5E | R-5 | R-6 | For the share classes listed to the right, you would pay the following if you did not redeem your shares: | Share class: | C | 529-C |
| 1 year | $ 111 | $ 94 | $ 63 | $ 50 | $ 34 | $ 29 | 1 year | $ 138 | $ 146 | |
| 3 years | 347 | 293 | 199 | 157 | 106 | 90 | 3 years | 431 | 452 | |
| 5 years | 601 | 509 | 346 | 274 | 185 | 157 | 5 years | 745 | 782 | |
| 10 years | 1,329 | 1,131 | 774 | 616 | 418 | 356 | 10 years | 1,635 | 1,713 |
Portfolio turnover The fund pays transaction costs, such as commissions, when it buys and sells securities (or “turns over” its portfolio). A higher portfolio turnover rate may indicate higher transaction costs and may result in higher taxes when fund shares are held in a taxable account. These costs, which are not reflected in annual fund operating expenses or in the example, affect the fund’s investment results. During the most recent fiscal year, the fund’s portfolio turnover rate was 52% of the average value of its portfolio.
Principal investment strategies Normally the fund invests primarily in income-producing securities. These include equity securities, such as dividend-paying common stocks, and debt securities, such as interest-paying bonds.
Generally at least 60% of the fund’s assets will be invested in common stocks and other equity-type securities. However, the composition of the fund’s investments in equity, debt and cash or money market instruments may vary substantially depending on various factors, including market conditions. The fund may also invest up to 25% of its assets in equity securities of issuers domiciled outside the United States, including issuers in developing countries. In addition, the fund may invest up to 20% of its assets in lower quality, higher yielding nonconvertible debt securities (rated Ba1 and BB+ or below by Nationally Recognized Statistical Rating Organizations designated by the fund’s investment adviser or unrated but determined to be of equivalent quality by the fund’s investment adviser); such securities are sometimes referred to as “junk bonds.” The fund may also invest up to 10% of its assets in debt securities of issuers domiciled outside the United States; however, these securities must be denominated in U.S. dollars.
The investment adviser uses a system of multiple portfolio managers in managing the fund’s assets. Under this approach, the portfolio of the fund is divided into segments managed by individual managers who decide how their respective segments will be invested.
The fund relies on the professional judgment of its investment adviser to make decisions about the fund’s portfolio investments. The basic investment philosophy of the investment adviser is to seek to invest in attractively valued companies that, in its opinion, represent good, long-term investment opportunities. The investment adviser believes that an important way to accomplish this is through fundamental analysis, which may include meeting with company executives and employees, suppliers, customers and competitors. Securities may be sold when the investment adviser believes that they no longer represent relatively attractive investment opportunities.
The Income Fund of America / Prospectus 2
Principal risks This section describes the principal risks associated with the fund’s principal investment strategies. You may lose money by investing in the fund. The likelihood of loss may be greater if you invest for a shorter period of time. Investors in the fund should have a long-term perspective and be able to tolerate potentially sharp declines in value.
Market conditions — The prices of, and the income generated by, the common stocks and other securities held by the fund may decline – sometimes rapidly or unpredictably – due to various factors, including events or conditions affecting the general economy or particular industries; overall market changes; local, regional or global political, social or economic instability; governmental or governmental agency responses to economic conditions; and currency exchange rate, interest rate and commodity price fluctuations.
Issuer risks — The prices of, and the income generated by, securities held by the fund may decline in response to various factors directly related to the issuers of such securities, including reduced demand for an issuer’s goods or services, poor management performance and strategic initiatives such as mergers, acquisitions or dispositions and the market response to any such initiatives.
Investing in income-oriented stocks — Income provided by the fund may be reduced by changes in the dividend policies of, and the capital resources available for dividend payments at, the companies in which the fund invests.
Investing in debt instruments — The prices of, and the income generated by, bonds and other debt securities held by the fund may be affected by changing interest rates and by changes in the effective maturities and credit ratings of these securities.
Rising interest rates will generally cause the prices of bonds and other debt securities to fall. Falling interest rates may cause an issuer to redeem, call or refinance a debt security before its stated maturity, which may result in the fund having to reinvest the proceeds in lower yielding securities. Longer maturity debt securities generally have greater sensitivity to changes in interest rates and may be subject to greater price fluctuations than shorter maturity debt securities.
Bonds and other debt securities are also subject to credit risk, which is the possibility that the credit strength of an issuer will weaken and/or an issuer of a debt security will fail to make timely payments of principal or interest and the security will go into default. Lower quality debt securities generally have higher rates of interest and may be subject to greater price fluctuations than higher quality debt securities. Credit risk is gauged, in part, by the credit ratings of the debt securities in which the fund invests. However, ratings are only the opinions of the rating agencies issuing them and are not guarantees as to credit quality or an evaluation of market risk. The fund’s investment adviser relies on its own credit analysts to research issuers and issues in seeking to mitigate various credit and default risks.
Investing in lower rated debt instruments — Lower rated bonds and other lower rated debt securities generally have higher rates of interest and involve greater risk of default or price declines due to changes in the issuer’s creditworthiness than those of higher quality debt securities. The market prices of these securities may fluctuate more than the prices of higher quality debt securities and may decline significantly in periods of general economic difficulty. These risks may be increased with respect to investments in junk bonds.
3 The Income Fund of America / Prospectus
Investing outside the United States — Securities of issuers domiciled outside the United States, or with significant operations or revenues outside the United States, may lose value because of adverse political, social, economic or market developments (including social instability, regional conflicts, terrorism and war) in the countries or regions in which the issuers operate or generate revenue. These securities may also lose value due to changes in foreign currency exchange rates against the U.S. dollar and/or currencies of other countries. Issuers of these securities may be more susceptible to actions of foreign governments, such as the imposition of price controls or punitive taxes, that could adversely impact the value of these securities. Securities markets in certain countries may be more volatile and/or less liquid than those in the United States. Investments outside the United States may also be subject to different accounting practices and different regulatory, legal and reporting standards and practices, and may be more difficult to value, than those in the United States. In addition, the value of investments outside the United States may be reduced by foreign taxes, including foreign withholding taxes on interest and dividends. Further, there may be increased risks of delayed settlement of securities purchased or sold by the fund. The risks of investing outside the United States may be heightened in connection with investments in emerging markets.
Management — The investment adviser to the fund actively manages the fund’s investments. Consequently, the fund is subject to the risk that the methods and analyses employed by the investment adviser in this process may not produce the desired results. This could cause the fund to lose value or its investment results to lag relevant benchmarks or other funds with similar objectives.
Your investment in the fund is not a bank deposit and is not insured or guaranteed by the Federal Deposit Insurance Corporation or any other governmental agency, entity or person. You should consider how this fund fits into your overall investment program.
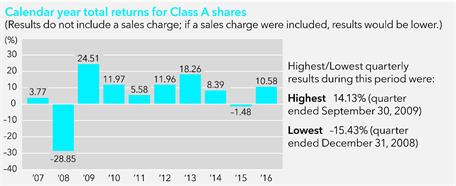
Investment results The following bar chart shows how the fund’s investment results have varied from year to year, and the following table shows how the fund’s average annual total returns for various periods compare with a broad measure of securities market results and other applicable measures of market results. This information provides some indication of the risks of investing in the fund. The 65%/35% S&P 500 Index/Bloomberg Barclays U.S. Aggregate Index is a composite blend of 65% of the S&P 500 Index and 35% of the Bloomberg Barclays U.S. Aggregate Index and represents a broad measure of the U.S. stock and bond markets, including market sectors in which the fund may invest. The Lipper Income Funds Index includes the fund and other funds that disclose investment objectives and/or strategies reasonably comparable to those of the fund. Past investment results (before and after taxes) are not predictive of future investment results. Updated information on the fund’s investment results can be obtained by visiting americanfunds.com.
The Income Fund of America / Prospectus 4
| Average annual total returns For the periods ended December 31, 2016 (with maximum sales charge): | |||||
| Share class | Inception date | 1 year | 5 years | 10 years | Lifetime |
| A — Before taxes | 12/1/1973 | 4.24% | 8.07% | 4.82% | 10.87% |
| — After taxes on distributions | 3.33 | 7.04 | 3.72 | N/A | |
| — After taxes on distributions and sale of fund shares | 2.87 | 6.18 | 3.59 | N/A | |
| Share classes (before taxes) | Inception date | 1 year | 5 years | 10 years | Lifetime |
| C | 3/15/2001 | 8.67% | 8.47% | 4.59% | 6.57% |
| F-1 | 3/15/2001 | 10.51 | 9.27 | 5.38 | 7.09 |
| F-2 | 8/1/2008 | 10.78 | 9.54 | N/A | 7.61 |
| 529-A | 2/15/2002 | 4.15 | 7.95 | 4.73 | 6.82 |
| 529-C | 2/19/2002 | 8.65 | 8.40 | 4.52 | 6.45 |
| 529-E | 2/25/2002 | 10.28 | 8.98 | 5.07 | 6.93 |
| 529-F-1 | 9/17/2002 | 10.76 | 9.49 | 5.58 | 8.27 |
| R-1 | 6/17/2002 | 9.69 | 8.46 | 4.59 | 6.49 |
| R-2 | 5/31/2002 | 9.70 | 8.47 | 4.56 | 6.26 |
| R-2E | 8/29/2014 | 10.06 | N/A | N/A | 3.45 |
| R-3 | 6/4/2002 | 10.16 | 8.94 | 5.05 | 6.84 |
| R-4 | 6/27/2002 | 10.52 | 9.27 | 5.37 | 7.50 |
| R-5E | 11/20/2015 | 10.64 | N/A | N/A | 8.31 |
| R-5 | 5/15/2002 | 10.89 | 9.60 | 5.69 | 7.36 |
| R-6 | 5/1/2009 | 10.89 | 9.64 | N/A | 12.16 |
| Indexes | 1 year | 5 years | 10 years | Lifetime (from Class A inception) |
| S&P 500 Index (reflects no deductions for sales charges, account fees, expenses or U.S. federal income taxes) | 11.96% | 14.66% | 6.95% | 10.86% |
| Bloomberg Barclays U.S. Aggregate Index (reflects no deductions for sales charges, account fees, expenses or U.S. federal income taxes) | 2.65 | 2.23 | 4.34 | N/A |
| 65%/35% S&P 500 Index/Bloomberg Barclays U.S. Aggregate Index (reflects no deductions for sales charges, account fees, expenses or U.S. federal income taxes) | 8.77 | 10.31 | 6.33 | N/A |
| Lipper Income Funds Index (reflects no deductions for sales charges, account fees or U.S. federal income taxes) | 6.86 | 5.93 | 4.34 | N/A |
| Class
A annualized 30–day yield at January 31, 2017: 2.91% (For current yield information, please call American FundsLine® at (800) 325-3590.) | ||||
5 The Income Fund of America / Prospectus
After-tax returns are shown only for Class A shares; after-tax returns for other share classes will vary. After-tax returns are calculated using the highest individual federal income tax rates in effect during each year of the periods shown and do not reflect the impact of state and local taxes. Your actual after-tax returns depend on your individual tax situation and likely will differ from the results shown above. In addition, after-tax returns are not relevant if you hold your fund shares through a tax-favored arrangement, such as a 401(k) plan, individual retirement account (IRA) or 529 college savings plan.
Management
Investment
adviser Capital Research and Management CompanySM
Portfolio managers The individuals primarily responsible for the
portfolio management of the fund are:
| Portfolio
manager/ Fund title (if applicable) |
Portfolio manager experience in this fund |
Primary
title with investment adviser |
| Hilda L. Applbaum Vice Chairman of the Board | 19 years | Partner – Capital World Investors |
| David C. Barclay President | 21 years | Partner – Capital Fixed Income Investors |
| Dina N. Perry Senior Vice President | 25 years | Partner – Capital World Investors |
| Andrew B. Suzman Senior Vice President | 17 years | Partner – Capital World Investors |
| Paul Flynn Vice President | 4 years | Partner – Capital World Investors |
| Joanna F. Jonsson Vice President | 14 years | Partner – Capital World Investors |
| John H. Smet Vice President | 24 years | Partner – Capital Fixed Income Investors |
| David A. Daigle | 10 years | Partner – Capital Fixed Income Investors |
| James R. Mulally | 10 years | Partner – Capital Fixed Income Investors |
Purchase and sale of fund shares The minimum amount to establish an account for all share classes is $250 and the minimum to add to an account is $50. For a payroll deduction retirement plan account, payroll deduction savings plan account or employer-sponsored 529 account, the minimum is $25 to establish or add to an account.
If you are a retail investor, you may sell (redeem) shares on any business day through your dealer or financial advisor or by writing to American Funds Service Company® at P.O. Box 6007, Indianapolis, Indiana 46206-6007; telephoning American Funds Service Company at (800) 421-4225; faxing American Funds Service Company at (888) 421-4351; or accessing our website at americanfunds.com. Please contact your plan administrator or recordkeeper to sell (redeem) shares from your retirement plan.
Tax information Dividends and capital gain distributions you receive from the fund are subject to federal income taxes and may also be subject to state and local taxes, unless you are tax-exempt or your account is tax-favored.
Payments to broker-dealers and other financial intermediaries If you purchase shares of the fund through a broker-dealer or other financial intermediary (such as a bank), the fund and the fund’s distributor or its affiliates may pay the intermediary for the sale of fund shares and related services. These payments may create a conflict of interest by influencing the broker-dealer or other intermediary and your individual financial advisor to recommend the fund over another investment. Ask your individual financial advisor or visit your financial intermediary’s website for more information.
The Income Fund of America / Prospectus 6
Investment objectives, strategies and risks The fund’s investment objectives are to provide you with current income while secondarily striving for capital growth. While it has no present intention to do so, the fund’s board may change the fund’s investment objectives without shareholder approval upon 60 days’ written notice to shareholders. Normally the fund invests primarily in income-producing securities. These include equity securities, such as dividend-paying common stocks, and debt securities, such as interest-paying bonds.
Generally at least 60% of the fund’s assets will be invested in common stocks and other equity-type securities. However, the composition of the fund’s investments in equity, debt and cash or money market instruments may vary substantially depending on various factors, including market conditions. The fund may also invest up to 25% of its assets in equity securities of issuers domiciled outside the United States, including issuers in developing countries. In addition, the fund may invest up to 20% of its assets in lower quality, higher yielding nonconvertible debt securities (rated Ba1 and BB+ or below by Nationally Recognized Statistical Rating Organizations designated by the fund’s investment adviser or unrated but determined to be of equivalent quality by the fund’s investment adviser); such securities are sometimes referred to as “junk bonds.” The fund may also invest up to 10% of its assets in debt securities of issuers domiciled outside the United States; however, these securities must be denominated in U.S. dollars.
The fund may also hold cash or money market instruments, including commercial paper and short-term securities issued by the U.S. government, its agencies and instrumentalities. The percentage of the fund invested in such holdings varies and depends on various factors, including market conditions and purchases and redemptions of fund shares. The investment adviser may determine that it is appropriate to invest a substantial portion of the fund’s assets in such instruments in response to certain circumstances, such as periods of market turmoil. In addition, for temporary defensive purposes, the fund may invest without limitation in such instruments. A larger percentage of such holdings could moderate the fund’s investment results in a period of rising market prices. Alternatively, a larger percentage of such holdings could reduce the magnitude of the fund’s loss in a period of falling market prices and provide liquidity to make additional investments or to meet redemptions.
The following are principal risks associated with the fund’s investment strategies.
Market conditions — The prices of, and the income generated by, the common stocks and other securities held by the fund may decline – sometimes rapidly or unpredictably – due to various factors, including events or conditions affecting the general economy or particular industries; overall market changes; local, regional or global political, social or economic instability; governmental or governmental agency responses to economic conditions; and currency exchange rate, interest rate and commodity price fluctuations.
Issuer risks — The prices of, and the income generated by, securities held by the fund may decline in response to various factors directly related to the issuers of such securities, including reduced demand for an issuer’s goods or services, poor management performance and strategic initiatives such as mergers, acquisitions or dispositions and the market response to any such initiatives.
7 The Income Fund of America / Prospectus
Investing in income-oriented stocks — Income provided by the fund may be reduced by changes in the dividend policies of, and the capital resources available for dividend payments at, the companies in which the fund invests.
Investing in debt instruments — The prices of, and the income generated by, bonds and other debt securities held by the fund may be affected by changing interest rates and by changes in the effective maturities and credit ratings of these securities.
Rising interest rates will generally cause the prices of bonds and other debt securities to fall. Falling interest rates may cause an issuer to redeem, call or refinance a debt security before its stated maturity, which may result in the fund having to reinvest the proceeds in lower yielding securities. Longer maturity debt securities generally have greater sensitivity to changes in interest rates and may be subject to greater price fluctuations than shorter maturity debt securities.
Bonds and other debt securities are also subject to credit risk, which is the possibility that the credit strength of an issuer will weaken and/or an issuer of a debt security will fail to make timely payments of principal or interest and the security will go into default. Lower quality debt securities generally have higher rates of interest and may be subject to greater price fluctuations than higher quality debt securities. Credit risk is gauged, in part, by the credit ratings of the debt securities in which the fund invests. However, ratings are only the opinions of the rating agencies issuing them and are not guarantees as to credit quality or an evaluation of market risk. The fund’s investment adviser relies on its own credit analysts to research issuers and issues in seeking to mitigate various credit and default risks.
Investing in lower rated debt instruments — Lower rated bonds and other lower rated debt securities generally have higher rates of interest and involve greater risk of default or price declines due to changes in the issuer’s creditworthiness than those of higher quality debt securities. The market prices of these securities may fluctuate more than the prices of higher quality debt securities and may decline significantly in periods of general economic difficulty. These risks may be increased with respect to investments in junk bonds.
Investing outside the United States — Securities of issuers domiciled outside the United States, or with significant operations or revenues outside the United States, may lose value because of adverse political, social, economic or market developments (including social instability, regional conflicts, terrorism and war) in the countries or regions in which the issuers operate or generate revenue. These securities may also lose value due to changes in foreign currency exchange rates against the U.S. dollar and/or currencies of other countries. Issuers of these securities may be more susceptible to actions of foreign governments, such as the imposition of price controls or punitive taxes, that could adversely impact the value of these securities. Securities markets in certain countries may be more volatile and/or less liquid than those in the United States. Investments outside the United States may also be subject to different accounting practices and different regulatory, legal and reporting standards and practices, and may be more difficult to value, than those in the United States. In addition, the value of investments outside the United States may be reduced by foreign taxes, including foreign withholding taxes on interest and dividends. Further, there may be increased risks of delayed settlement of securities purchased or sold by the fund. The risks of
The Income Fund of America / Prospectus 8
investing outside the United States may be heightened in connection with investments in emerging markets.
Management — The investment adviser to the fund actively manages the fund’s investments. Consequently, the fund is subject to the risk that the methods and analyses employed by the investment adviser in this process may not produce the desired results. This could cause the fund to lose value or its investment results to lag relevant benchmarks or other funds with similar objectives.
The following are certain additional risks associated with the fund’s investment strategies.
Investing in emerging markets — Investing in emerging markets may involve risks in addition to and greater than those generally associated with investing in the securities markets of developed countries. For instance, developing countries may have less developed legal and accounting systems than those in developed countries. The governments of these countries may be less stable and more likely to impose capital controls, nationalize a company or industry, place restrictions on foreign ownership and on withdrawing sale proceeds of securities from the country, and/or impose punitive taxes that could adversely affect the prices of securities. In addition, the economies of these countries may be dependent on relatively few industries that are more susceptible to local and global changes. Securities markets in these countries can also be relatively small and have substantially lower trading volumes. As a result, securities issued in these countries may be more volatile and less liquid, and may be more difficult to value, than securities issued in countries with more developed economies and/or markets. Less certainty with respect to security valuations may lead to additional challenges and risks in calculating the fund’s net asset value. Additionally, there may be increased settlement risks for transactions in local securities.
Exposure to country, region, industry or sector — Subject to the fund’s investment limitations, the fund may have significant exposure to a particular country, region, industry or sector. Such exposure may cause the fund to be more impacted by risks relating to the country, region, industry or sector than a fund without such levels of exposure. For example, if the fund has significant exposure in a particular country, then social, economic, regulatory or other issues that negatively affect that country may have a greater impact on the fund than on a fund that is more geographically diversified.
Interest rate risk — The values and liquidity of the securities held by the fund may be affected by changing interest rates. For example, the values of debt securities may decline when interest rates rise and increase when interest rates fall. Longer maturity debt securities generally have greater sensitivity to changes in interest rates and may be subject to greater price fluctuations than shorter maturity debt securities. The fund may invest in variable and floating rate securities. Although the values of such securities are generally less sensitive to interest rate changes than those of other debt securities, the value of variable and floating rate securities may decline if their interest rates do not rise as quickly, or as much, as general interest rates. Conversely, floating rate securities will not generally increase in value if interest rates decline. During periods of extremely low short-term interest rates, certain of the fund’s debt securities may not be able to maintain a positive yield and, given the current historically low interest rate environment, risks associated with rising rates are currently heightened.
9 The Income Fund of America / Prospectus
Liquidity risk — Certain fund holdings may be deemed to be less liquid or illiquid because they cannot be readily sold without significantly impacting the value of the holdings. Liquidity risk may result from the lack of an active market for a holding, legal or contractual restrictions on resale, or the reduced number and capacity of market participants to make a market in such holding. Market prices for less liquid or illiquid holdings may be volatile, and reduced liquidity may have an adverse impact on the market price of such holdings. Additionally, the sale of less liquid or illiquid holdings may involve substantial delays (including delays in settlement) and additional costs and the fund may be unable to sell such holdings when necessary to meet its liquidity needs.
In addition to the principal investment strategies described above, the fund has other investment practices that are described in the statement of additional information, which includes a description of other risks related to the fund’s principal investment strategies and other investment practices. The fund’s investment results will depend on the ability of the fund’s investment adviser to navigate the risks discussed above as well as those described in the statement of additional information.
Fund comparative indexes The investment results table in this prospectus shows how the fund’s average annual total returns compare with various broad measures of market results. The S&P 500 Index is a market capitalization-weighted index based on the results of 500 widely held common stocks. This index is unmanaged, and its results include reinvested dividends and/or distributions but do not reflect the effect of sales charges, commissions, account fees, expenses or U.S. federal income taxes. The Bloomberg Barclays U.S. Aggregate Index represents the U.S. investment-grade fixed-rate bond market. This index is unmanaged, and its results include reinvested dividends and/or distributions but do not reflect the effect of sales charges, commissions, account fees, expenses or U.S. federal income taxes. The 65%/35% S&P 500 Index/Bloomberg Barclays U.S. Aggregate Index blends the S&P 500 Index with the Bloomberg Barclays U.S. Aggregate Index by weighting their cumulative total returns at 65% and 35%, respectively. This assumes the blend is rebalanced monthly. The Lipper Income Funds Index is an equally weighted index of funds that normally seek a high level of current income through investing in income-producing stocks, bonds and money market instruments. The results of the underlying funds in the index include the reinvestment of dividends and capital gain distributions, as well as brokerage commissions paid by the funds for portfolio transactions and other fund expenses, but do not reflect the effect of sales charges, account fees or U.S. federal income taxes. Neither the Bloomberg Barclays Index, the 65%/35% S&P 500 Index/Bloomberg Barclays U.S. Aggregate Index nor the Lipper Index was in existence when Capital Research and Management Company became the fund’s investment adviser; therefore, lifetime results are not shown.
Fund results All fund results in this prospectus reflect the reinvestment of dividends and capital gain distributions, if any. Unless otherwise noted, fund results reflect any fee waivers and/or expense reimbursements in effect during the periods presented.
Management and organization
Investment adviser Capital Research and Management Company, an experienced investment management organization founded in 1931, serves as the investment adviser to the fund and other funds, including the American Funds. Capital Research and Management Company is a wholly owned subsidiary of The Capital Group Companies, Inc. and is located at 333 South Hope Street, Los Angeles, California 90071. Capital Research and Management Company manages the investment portfolio and business
The Income Fund of America / Prospectus 10
affairs of the fund. The total management fee paid by the fund to its investment adviser for the most recent fiscal year, as a percentage of average net assets, appears in the Annual Fund Operating Expenses table under “Fees and expenses of the fund.” As described more fully in the fund’s statement of additional information, the management fee is based on the daily net assets of the fund and the fund’s monthly gross investment income. A discussion regarding the basis for approval of the fund’s Investment Advisory and Service Agreement by the fund’s board of trustees is contained in the fund’s semi-annual report to shareholders for the fiscal period ended January 31, 2017.
Capital Research and Management Company manages equity assets through three equity investment divisions and fixed-income assets through its fixed-income investment division, Capital Fixed Income Investors. The three equity investment divisions — Capital World Investors, Capital Research Global Investors and Capital International Investors — make investment decisions independently of one another.
The equity investment divisions may, in the future, be incorporated as wholly owned subsidiaries of Capital Research and Management Company. In that event, Capital Research and Management Company would continue to be the investment adviser, and day-to-day investment management of equity assets would continue to be carried out through one or more of these subsidiaries. Although not currently contemplated, Capital Research and Management Company could incorporate its fixed-income investment division in the future and engage it to provide day-to-day investment management of fixed-income assets. Capital Research and Management Company and each of the funds it advises have received an exemptive order from the U.S. Securities and Exchange Commission that allows Capital Research and Management Company to use, upon approval of the fund’s board, its management subsidiaries and affiliates to provide day-to-day investment management services to the fund, including making changes to the management subsidiaries and affiliates providing such services. The fund’s shareholders have approved this arrangement; however, there is no assurance that Capital Research and Management Company will incorporate its investment divisions or exercise any authority granted to it under the exemptive order.
Portfolio holdings Portfolio holdings information for the fund is available on the American Funds website at americanfunds.com. A description of the fund’s policies and procedures regarding disclosure of information about its portfolio holdings is available in the statement of additional information.
The Capital SystemSM Capital Research and Management Company uses a system of multiple portfolio managers in managing mutual fund assets. Under this approach, the portfolio of a fund is divided into segments managed by individual managers who decide how their respective segments will be invested. In addition, Capital Research and Management Company’s investment analysts may make investment decisions with respect to a portion of a fund’s portfolio. Investment decisions are subject to a fund’s objective(s), policies and restrictions and the oversight of the appropriate investment-related committees of Capital Research and Management Company and its investment divisions. The table below shows the investment experience and role in management of the fund for each of the fund’s primary portfolio managers.
11 The Income Fund of America / Prospectus
| Portfolio manager | Investment experience |
Experience in this fund |
Role
in management of the fund |
| Hilda L. Applbaum | Investment
professional for 30 years in total; 22 years with Capital Research and Management Company or affiliate |
19
years (plus 3 years of prior experience as an investment analyst for the fund) |
Serves as an equity portfolio manager |
| David C. Barclay | Investment
professional for 36 years in total; 29 years with Capital Research and Management Company or affiliate |
21 years | Serves as a fixed-income portfolio manager |
| Dina N. Perry | Investment
professional for 39 years in total; 25 years with Capital Research and Management Company or affiliate |
25 years | Serves as an equity portfolio manager |
| Andrew B. Suzman | Investment
professional for 24 years, all with Capital Research and Management Company or affiliate |
17
years (plus 4 years of prior experience as an investment analyst for the fund) |
Serves as an equity portfolio manager |
| Paul Flynn | Investment
professional for 21 years in total; 19 years with Capital Research and Management Company or affiliate |
4 years (plus
5 years of |
Serves as an equity portfolio manager |
| Joanna F. Jonsson | Investment
professional for 28 years in total; 27 years with Capital Research and Management Company or affiliate |
14
years (plus 9 years of prior experience as an investment analyst for the fund) |
Serves as an equity portfolio manager |
| John H. Smet | Investment
professional for 35 years in total; 34 years with Capital Research and Management Company or affiliate |
24 years | Serves as a fixed-income portfolio manager |
The Income Fund of America / Prospectus 12
| Portfolio manager | Investment experience |
Experience in this fund |
Role
in management of the fund |
| David A. Daigle | Investment
professional for 23 years, all with Capital Research and Management Company or affiliate |
10
years (plus 11 years of prior experience as an investment analyst for the fund) |
Serves as a fixed-income portfolio manager |
| James R. Mulally | Investment
professional for 41 years in total; 37 years with Capital Research and Management Company or affiliate |
10 years | Serves as a fixed-income portfolio manager |
Information regarding the portfolio managers’ compensation, their ownership of securities in the fund and other accounts they manage is in the statement of additional information.
Certain privileges and/or services described on the following pages of this prospectus and in the statement of additional information may not be available to you, depending on your investment dealer or retirement plan recordkeeper. Please see your financial advisor, investment dealer or retirement plan recordkeeper for more information.
Shareholder information
Shareholder services American Funds Service Company, the fund’s transfer agent, offers a wide range of services that you can use to alter your investment program should your needs or circumstances change. These services may be terminated or modified at any time upon 60 days’ written notice.

A more detailed description of policies and services is included in the fund’s statement of additional information and the owner’s guide sent to new American Funds shareholders entitled Welcome. Class 529 shareholders should also refer to the applicable program description for information on policies and services relating specifically to their account(s). These documents are available by writing to or calling American Funds Service Company.
13 The Income Fund of America / Prospectus
Unless otherwise noted, references to Class A, C, T or F-1 shares on the following pages also refer to the corresponding Class 529-A, 529-C, 529-T or 529-F-1 shares. Unless otherwise noted, references to Class F shares refer to Class F-1, F-2 and F-3 shares and references to Class R shares refer to Class R-1, R-2, R-2E, R-3, R-4, R-5E, R-5 and R-6 shares.
Purchase, exchange and sale of shares The fund’s transfer agent, on behalf of the fund and American Funds Distributors,® the fund’s distributor, is required by law to obtain certain personal information from you or any other person(s) acting on your behalf in order to verify your or such person’s identity. If you do not provide the information, the transfer agent may not be able to open your account. If the transfer agent is unable to verify your identity or that of any other person(s) authorized to act on your behalf, or believes it has identified potentially criminal activity, the fund and American Funds Distributors reserve the right to close your account or take such other action they deem reasonable or required by law.
When purchasing shares, you should designate the fund or funds in which you wish to invest. Subject to the exception below, if no fund is designated, your money will be held uninvested (without liability to the transfer agent for loss of income or appreciation pending receipt of proper instructions) until investment instructions are received, but for no more than three business days. Your investment will be made at the net asset value (plus any applicable sales charge, in the case of Class A or Class T shares) next determined after investment instructions are received and accepted by the transfer agent. If investment instructions are not received, your money will be invested in Class A shares (or, if you are investing through a financial intermediary who offers only Class T shares, in Class T shares) of American Funds U.S. Government Money Market FundSM on the third business day after receipt of your investment.
If the amount of your cash investment is $10,000 or less, no fund is designated, and you made a cash investment (excluding exchanges) within the last 16 months, your money will be invested in the same proportion and in the same fund or funds and in the same class of shares in which your last cash investment was made.
Different procedures may apply to certain employer-sponsored arrangements, including, but not limited to, SEPs and SIMPLE IRAs.
Valuing shares The net asset value of each share class of the fund is the value of a single share of that class. The fund calculates the net asset value each day the New York Stock Exchange is open for trading as of approximately 4 p.m. New York time, the normal close of regular trading. If, for example, the New York Stock Exchange closes at 1 p.m. New York time, the fund’s net asset value would still be determined as of 4 p.m. New York time. In this example, portfolio securities traded on the New York Stock Exchange would be valued at their closing prices unless the investment adviser determines that a “fair value” adjustment is appropriate due to subsequent events.
Equity securities are valued primarily on the basis of market quotations, and debt securities are valued primarily on the basis of prices from third-party pricing services. The fund has adopted procedures for making fair value determinations if market quotations or prices from third-party pricing services, as applicable, are not readily available or are not considered reliable. For example, if events occur between the close of markets outside the United States and the close of regular trading on the New York Stock Exchange that, in the opinion of the investment adviser, materially affect the value
The Income Fund of America / Prospectus 14
of any of the fund’s equity securities that trade principally in those international markets, those securities will be valued in accordance with fair value procedures. Similarly, fair value procedures may be employed if an issuer defaults on its debt securities and there is no market for its securities. Use of these procedures is intended to result in more appropriate net asset values and, where applicable, to reduce potential arbitrage opportunities otherwise available to short-term investors.
Because the fund may hold securities that are listed primarily on foreign exchanges that trade on weekends or days when the fund does not price its shares, the values of securities held in the fund may change on days when you will not be able to purchase or redeem fund shares.
Your shares will be purchased at the net asset value (plus any applicable sales charge, in the case of Class A or Class T shares) or sold at the net asset value next determined after American Funds Service Company receives your request, provided that your request contains all information and legal documentation necessary to process the transaction. A contingent deferred sales charge may apply at the time you sell certain Class A and C shares.
Purchase of Class A, C and T shares You may generally open an account and purchase Class A, C and T shares by contacting any financial advisor (who may impose transaction charges in addition to those described in this prospectus) authorized to sell the fund’s shares. You may purchase additional shares in various ways, including through your financial advisor and by mail, telephone, the Internet and bank wire.
Automatic conversion of Class C shares Class C shares automatically convert to Class F-1 shares in the month of the 10-year anniversary of the purchase date; however, Class 529-C shares will not convert to Class 529-F-1 shares. The Internal Revenue Service currently takes the position that such automatic conversions are not taxable. Should its position change, the automatic conversion feature may be suspended. If this were to happen, you would have the option of converting your Class C shares to Class F-1 shares at the anniversary date described above. This exchange would be based on the relative net asset values of the two classes in question, without the imposition of a sales charge or fee, but you might face certain tax consequences as a result.
Purchase of Class F shares You may generally open an account and purchase Class F shares only through fee-based programs of investment dealers that have special agreements with the fund’s distributor, through financial intermediaries that have been approved by, and that have special agreements with, the fund’s distributor to offer Class F shares to self-directed investment brokerage accounts that may charge a transaction fee, through certain registered investment advisors and through other intermediaries approved by the fund’s distributor. These intermediaries typically charge ongoing fees for services they provide. Intermediary fees are not paid by the fund and normally range from .75% to 1.50% of assets annually, depending on the services offered.
Class F-2 and F-3 shares may also be available on brokerage platforms of firms that have agreements with the fund’s distributor to offer such shares solely when acting as an agent for the investor. An investor transacting in Class F-2 or F-3 shares in these programs may be required to pay a commission and/or other forms of compensation to the broker. Shares of the fund are available in other share classes that have different fees and expenses.
15 The Income Fund of America / Prospectus
In addition, Class F-3 shares are available to institutional investors, which include, but are not limited to, charitable organizations, governmental institutions and corporations, with a minimum investment amount of $1,000,000.
Purchase of Class 529 shares Class 529 shares may be purchased only through an account established with a 529 college savings plan managed by the American Funds organization. You may open this type of account and purchase Class 529 shares by contacting any financial advisor (who may impose transaction charges in addition to those described in this prospectus) authorized to sell such an account. You may purchase additional shares in various ways, including through your financial advisor and by mail, telephone, the Internet and bank wire.
Class 529-E shares may be purchased only by employees participating through an eligible employer plan.
Accounts holding Class 529 shares are subject to a $10 account setup fee and an annual $10 account maintenance fee. These fees are waived until further notice.
Investors residing in any state may purchase Class 529 shares through an account established with a 529 college savings plan managed by the American Funds organization. Class 529-A, 529-C, 529-T and 529-F-1 shares are structured similarly to the corresponding Class A, C, T and F-1 shares. For example, the same initial sales charges apply to Class 529-A shares as to Class A shares.
Purchase of Class R shares Class R shares are generally available only to retirement plans established under Internal Revenue Code Sections 401(a), 403(b) or 457, and to nonqualified deferred compensation plans and certain voluntary employee benefit association and post-retirement benefit plans. Class R shares also are generally available only to retirement plans for which plan level or omnibus accounts are held on the books of the fund. Class R-5E, R-5 and R-6 shares are generally available only to fee-based programs or through retirement plan intermediaries. In addition, Class R-5 and R-6 shares are available for investment by other registered investment companies approved by the fund’s investment adviser or distributor. Class R shares generally are not available to retail nonretirement accounts, traditional and Roth individual retirement accounts (IRAs), Coverdell Education Savings Accounts, SEPs, SARSEPs, SIMPLE IRAs and 529 college savings plans.
Purchases by employer-sponsored retirement plans Eligible retirement plans generally may open an account and purchase Class A or R shares by contacting any investment dealer (who may impose transaction charges in addition to those described in this prospectus) authorized to sell these classes of the fund’s shares. Some or all R share classes may not be available through certain investment dealers. Additional shares may be purchased through a plan’s administrator or recordkeeper.
Class A shares are generally not available for retirement plans using the PlanPremier® or Recordkeeper Direct® recordkeeping programs. These programs are proprietary recordkeeping solutions for small retirement plans.
Employer-sponsored retirement plans that are eligible to purchase Class R shares may instead purchase Class A shares and pay the applicable Class A sales charge, provided that their recordkeepers can properly apply a sales charge on plan investments. These plans are not eligible to make initial purchases of $1 million or more in Class A shares and thereby invest in Class A shares without a sales charge, nor are they eligible to
The Income Fund of America / Prospectus 16
establish a statement of intention that qualifies them to purchase Class A shares without a sales charge. More information about statements of intention can be found under “Sales charge reductions and waivers” in this prospectus. Plans investing in Class A shares with a sales charge may purchase additional Class A shares in accordance with the sales charge table in this prospectus.
Employer-sponsored retirement plans that invested in Class A shares of any of the American Funds without any sales charge before April 1, 2004, and that continue to meet the eligibility requirements in effect as of that date for purchasing Class A shares at net asset value, may continue to purchase Class A shares of the American Funds without any initial or contingent deferred sales charge.
A 403(b) plan may not invest in Class A or C shares of any of the American Funds unless it was invested in Class A or C shares before January 1, 2009.
Purchase minimums and maximums Purchase minimums described in this prospectus may be waived in certain cases. In addition, the fund reserves the right to redeem the shares of any shareholder for their then current net asset value per share if the shareholder’s aggregate investment in the fund falls below the fund’s minimum initial investment amount. See the statement of additional information for details.
For accounts established with an automatic investment plan, the initial purchase minimum of $250 may be waived if the purchases (including purchases through exchanges from another fund) made under the plan are sufficient to reach $250 within five months of account establishment.
The effective purchase maximums for Class 529-A, 529-C, 529-E, 529-T and 529-F-1 shares will reflect the maximum applicable contribution limits under state law. See the applicable program description for more information.
The purchase maximum for Class C shares is $500,000 per transaction. In addition, if you have significant American Funds holdings, you may not be eligible to invest in Class C or 529-C shares. Specifically, you may not purchase Class C or 529-C shares if you are eligible to purchase Class A or 529-A shares at the $1 million or more sales charge discount rate (that is, at net asset value). See “Sales charge reductions and waivers” in this prospectus and the statement of additional information for more details regarding sales charge discounts.
Exchange Except for Class T shares or as otherwise described in this prospectus, you may exchange your shares for shares of the same class of other American Funds without a sales charge. Class A, C, T or F-1 shares of any American Fund (other than American Funds U.S. Government Money Market Fund, as described below) may be exchanged for the corresponding 529 share class without a sales charge. Exchanges from Class A, C, T or F-1 shares to the corresponding 529 share class, particularly in the case of Uniform Gifts to Minors Act or Uniform Transfers to Minors Act custodial accounts, may result in significant legal and tax consequences, as described in the applicable program description. Please consult your financial advisor before making such an exchange.
Except as indicated above, Class T shares are not eligible for exchange privileges. Accordingly, an exchange of your Class T shares for Class T shares of any other American Fund will normally be subject to any applicable sales charges.
17 The Income Fund of America / Prospectus
Exchanges of shares from American Funds U.S. Government Money Market Fund initially purchased without a sales charge to shares of another American Fund generally will be subject to the appropriate sales charge applicable to the other fund. For purposes of computing the contingent deferred sales charge on Class C shares, the length of time you have owned your shares will be measured from the first day of the month in which shares were purchased and will not be affected by any permitted exchange.
Exchanges have the same tax consequences as ordinary sales and purchases. For example, to the extent you exchange shares held in a taxable account that are worth more now than what you paid for them, the gain will be subject to taxation.
See “Transactions by telephone, fax or the Internet” in the section “How to sell shares” of this prospectus for information regarding electronic exchanges.
Please see the statement of additional information for details and limitations on moving investments in certain share classes to different share classes and on moving investments held in certain accounts to different accounts.
How to sell shares
You may sell (redeem) shares in any of the following ways:
Employer-sponsored retirement plans
Shares held in eligible retirement plans may be sold through the plan’s administrator or recordkeeper.
Through your dealer or financial advisor (certain charges may apply)
· Shares held for you in your dealer’s name must be sold through the dealer.
· Generally, Class F shares must be sold through intermediaries such as dealers or financial advisors.
Writing to American Funds Service Company
· Requests must be signed by the registered shareholder(s).
· A signature guarantee is required if the redemption is:
— more than $125,000;
— made payable to someone other than the registered shareholder(s); or
— sent to an address other than the address of record or to an address of record that has been changed within the previous 10 days.
· American Funds Service Company reserves the right to require signature guarantee(s) on any redemption.
· Additional documentation may be required for redemptions of shares held in corporate, partnership or fiduciary accounts.
Telephoning or faxing American Funds Service Company or using the Internet
· Redemptions by telephone, fax or the Internet (including American FundsLine and americanfunds.com) are limited to $125,000 per American Funds shareholder each day.
· Checks must be made payable to the registered shareholder.
· Checks must be mailed to an address of record that has been used with the account for at least 10 days.
The Income Fund of America / Prospectus 18
If you recently purchased shares and subsequently request a redemption of those shares, you will receive proceeds from the redemption once a sufficient period of time has passed to reasonably ensure that checks or drafts, including certified or cashier’s checks, for the shares purchased have cleared (normally 10 business days).
Although payment of redemptions normally will be in cash, the fund’s declaration of trust permits payment of the redemption price wholly or partly with portfolio securities or other fund assets under conditions and circumstances determined by the fund’s board of trustees. The disposal of the securities received in-kind may be subject to brokerage costs and, until sold, such securities remain at market risk and liquidity risk, including the risk that such securities are or become difficult to sell. If the fund pays your redemption with illiquid or less liquid securities, you will bear the risk of not being able to sell such securities.
Transactions by telephone, fax or the Internet Generally, you are automatically eligible to redeem or exchange shares by telephone, fax or the Internet, unless you notify us in writing that you do not want any or all of these services. You may reinstate these services at any time.
Unless you decide not to have telephone, fax or Internet services on your account(s), you agree to hold the fund, American Funds Service Company, any of its affiliates or mutual funds managed by such affiliates, and each of their respective directors, trustees, officers, employees and agents harmless from any losses, expenses, costs or liabilities (including attorney fees) that may be incurred in connection with the exercise of these privileges, provided that American Funds Service Company employs reasonable procedures to confirm that the instructions received from any person with appropriate account information are genuine. If reasonable procedures are not employed, American Funds Service Company and/or the fund may be liable for losses due to unauthorized or fraudulent instructions.
Frequent trading of fund shares The fund and American Funds Distributors reserve the right to reject any purchase order for any reason. The fund is not designed to serve as a vehicle for frequent trading. Frequent trading of fund shares may lead to increased costs to the fund and less efficient management of the fund’s portfolio, potentially resulting in dilution of the value of the shares held by long-term shareholders. Accordingly, purchases, including those that are part of exchange activity, that the fund or American Funds Distributors has determined could involve actual or potential harm to the fund may be rejected.
The fund, through its transfer agent, American Funds Service Company, maintains surveillance procedures that are designed to detect frequent trading in fund shares. Under these procedures, various analytics are used to evaluate factors that may be indicative of frequent trading. For example, transactions in fund shares that exceed certain monetary thresholds may be scrutinized. American Funds Service Company also may review transactions that occur close in time to other transactions in the same account or in multiple accounts under common ownership or influence. Trading activity that is identified through these procedures or as a result of any other information available to the fund will be evaluated to determine whether such activity might constitute frequent trading. These procedures may be modified from time to time as appropriate to improve the detection of frequent trading, to facilitate monitoring for
19 The Income Fund of America / Prospectus
frequent trading in particular retirement plans or other accounts and to comply with applicable laws.
In addition to the fund’s broad ability to restrict potentially harmful trading as described above, the fund’s board of trustees has adopted a “purchase blocking policy” under which any shareholder redeeming shares having a value of $5,000 or more from a fund will be precluded from investing in that fund for 30 calendar days after the redemption transaction. This policy also applies to redemptions and purchases that are part of exchange transactions. Under the fund’s purchase blocking policy, certain purchases will not be prevented and certain redemptions will not trigger a purchase block, such as:
· purchases and redemptions of shares having a value of less than $5,000;
· transactions in Class 529 shares;
· purchases and redemptions by investment companies managed or sponsored by the fund’s investment adviser or its affiliates, including reallocations and transactions allowing the investment company to meet its redemptions and purchases;
· retirement plan contributions, loans and distributions (including hardship withdrawals) identified as such on the retirement plan recordkeeper’s system;
· purchase transactions involving in-kind transfers of shares of the fund, rollovers, Roth IRA conversions and IRA recharacterizations, if the entity maintaining the shareholder account is able to identify the transaction as one of these types of transactions; and
· systematic redemptions and purchases, if the entity maintaining the shareholder account is able to identify the transaction as a systematic redemption or purchase.
Generally, purchases and redemptions will not be considered “systematic” unless the transaction is prescheduled for a specific date.
The fund reserves the right to waive the purchase blocking policy with respect to specific shareholder accounts if American Funds Service Company determines that its surveillance procedures are adequate to detect frequent trading in fund shares in such accounts.
American Funds Service Company will work with certain intermediaries (such as investment dealers holding shareholder accounts in street name, retirement plan recordkeepers, insurance company separate accounts and bank trust companies) to apply their own procedures, provided that American Funds Service Company believes the intermediary’s procedures are reasonably designed to enforce the frequent trading policies of the fund. You should refer to disclosures provided by the intermediaries with which you have an account to determine the specific trading restrictions that apply to you.
If American Funds Service Company identifies any activity that may constitute frequent trading, it reserves the right to contact the intermediary and request that the intermediary either provide information regarding an account owner’s transactions or restrict the account owner’s trading. If American Funds Service Company is not satisfied that the intermediary has taken appropriate action, American Funds Service Company may terminate the intermediary’s ability to transact in fund shares.
There is no guarantee that all instances of frequent trading in fund shares will be prevented.
The Income Fund of America / Prospectus 20
Notwithstanding the fund’s surveillance procedures and purchase blocking policy described above, all transactions in fund shares remain subject to the right of the fund, American Funds Distributors and American Funds Service Company to restrict potentially abusive trading generally, including the types of transactions described above that will not be prevented or trigger a block under the purchase blocking policy. See the statement of additional information for more information about how American Funds Service Company may address other potentially abusive trading activity in the American Funds.
Distributions and taxes
Dividends and distributions The fund intends to distribute dividends to you, usually in March, June, September and December.
Capital gains, if any, are usually distributed in December. When a dividend or capital gain is distributed, the net asset value per share is reduced by the amount of the payment.
You may elect to reinvest dividends and/or capital gain distributions to purchase additional shares of this fund or other American Funds, or you may elect to receive them in cash. Dividends and capital gain distributions for 529 share classes and retirement plan shareholders will be reinvested automatically.
Taxes on dividends and distributions For federal tax purposes, dividends and distributions of short-term capital gains are taxable as ordinary income. The fund’s distributions of net long-term capital gains are taxable as long-term capital gains. Any dividends or capital gain distributions you receive from the fund will normally be taxable to you when made, regardless of whether you reinvest dividends or capital gain distributions or receive them in cash.
Dividends and capital gain distributions that are automatically reinvested in a tax-favored retirement or education savings account do not result in federal or state income tax at the time of reinvestment.
Taxes on transactions Your redemptions, including exchanges, may result in a capital gain or loss for federal tax purposes. A capital gain or loss on your investment is the difference between the cost of your shares, including any sales charges, and the amount you receive when you sell them.
Exchanges within a tax-favored retirement plan account will not result in a capital gain or loss for federal or state income tax purposes. With limited exceptions, distributions from a retirement plan account are taxable as ordinary income.
Shareholder fees Fees borne directly by the fund normally have the effect of reducing a shareholder’s taxable income on distributions. By contrast, fees paid directly to advisors by a fund shareholder for ongoing advice are deductible for income tax purposes only to the extent that they (combined with certain other qualifying expenses) exceed 2% of such shareholder’s adjusted gross income.
Please see your tax advisor for more information. Holders of Class 529 shares should refer to the applicable program description for more information regarding the tax consequences of selling Class 529 shares.
21 The Income Fund of America / Prospectus
Choosing a share class The fund offers different classes of shares through this prospectus. The services or share classes available to you may vary depending upon how you wish to purchase shares of the fund.
Each share class represents an investment in the same portfolio of securities, but each class has its own sales charge and expense structure, allowing you to choose the class that best fits your situation. For example, while Class F-1 shares are subject to 12b-1 fees and subtransfer agency fees payable to third-party service providers, Class F-2 shares are subject only to subtransfer agency fees payable to third-party service providers (and not 12b-1 fees) and Class F-3 shares are not subject to any such additional fees. The different fee structures allow the investor to choose how to pay for advisory platform expenses. Class R shares offer different levels of 12b-1 and recordkeeping fees so that a plan can choose the class that best meets the cost associated with obtaining investment related services and participant level recordkeeping for the plan. When you purchase shares of the fund for an individual-type account, you should choose a share class. If none is chosen, your investment will be made in Class A shares or, in the case of a 529 plan investment, Class 529-A shares (or, if you are investing through a financial intermediary who offers only Class T and 529-T shares, your investment will be made in Class T or Class 529-T shares, as applicable).
Factors you should consider when choosing a class of shares include:
· how long you expect to own the shares;
· how much you intend to invest;
· total expenses associated with owning shares of each class;
· whether you qualify for any reduction or waiver of sales charges (for example, Class A or 529-A or Class T or 529-T shares may be a less expensive option over time, particularly if you qualify for a sales charge reduction or waiver);
· whether you want or need the flexibility to effect exchanges among the American Funds without the imposition of a sales charge (for example, while Class A shares offer such exchange privileges, Class T shares do not);
· whether you plan to take any distributions in the near future (for example, the contingent deferred sales charge will not be waived if you sell your Class 529-C shares to cover higher education expenses); and
· availability of share classes:
— Class C shares are not available to retirement plans that do not currently invest in such shares and that are eligible to invest in Class R shares, including retirement plans established under Internal Revenue Code Sections 401(a) (including 401(k) plans), 403(b) or 457;
— Class F and 529-F-1 shares are generally available only to fee-based programs of investment dealers that have special agreements with the fund’s distributor, to financial intermediaries that have been approved by, and that have special agreements with, the fund’s distributor to offer Class F and 529-F-1 shares to self-directed investment brokerage accounts that may charge a transaction fee, to certain registered investment advisors and to other intermediaries approved by the fund’s distributor;
— Class F-3 shares are also available to institutional investors, which include, but are not limited to, charitable organizations, governmental institutions and corporations, with a minimum investment amount of $1,000,000; and
The Income Fund of America / Prospectus 22
— Class R shares are generally available only to retirement plans established under Internal Revenue Code Sections 401(a) (including 401(k) plans), 403(b) or 457, and to nonqualified deferred compensation plans and certain voluntary employee benefit association and post-retirement benefit plans.
Each investor’s financial considerations are different. You should speak with your financial advisor to help you decide which share class is best for you.
Sales charges
Class A shares The initial sales charge you pay each time you buy Class A shares differs depending upon the amount you invest and may be reduced or eliminated for larger purchases as indicated below. The “offering price,” the price you pay to buy shares, includes any applicable sales charge, which will be deducted directly from your investment. Shares acquired through reinvestment of dividends or capital gain distributions are not subject to an initial sales charge.
| Sales
charge as a percentage of: |
|||
| Investment | Offering price | Net
amount invested |
Dealer
commission as a percentage of offering price |
| Less than $25,000 | 5.75% | 6.10% | 5.00% |
| $25,000 but less than $50,000 | 5.00 | 5.26 | 4.25 |
| $50,000 but less than $100,000 | 4.50 | 4.71 | 3.75 |
| $100,000 but less than $250,000 | 3.50 | 3.63 | 2.75 |
| $250,000 but less than $500,000 | 2.50 | 2.56 | 2.00 |
| $500,000 but less than $750,000 | 2.00 | 2.04 | 1.60 |
| $750,000 but less than $1 million | 1.50 | 1.52 | 1.20 |
| $1 million or more and certain other investments described below | none | none | see below |
The sales charge, expressed as a percentage of the offering price or the net amount invested, may be higher or lower than the percentages described in the table above due to rounding. This is because the dollar amount of the sales charge is determined by subtracting the net asset value of the shares purchased from the offering price, which is calculated to two decimal places using standard rounding criteria. The impact of rounding will vary with the size of the investment and the net asset value of the shares. Similarly, any contingent deferred sales charge paid by you on investments in Class A shares may be higher or lower than the 1% charge described below due to rounding.
Except as provided below, investments in Class A shares of $1 million or more may be subject to a 1% contingent deferred sales charge if the shares are sold within one year of purchase. The contingent deferred sales charge is based on the original purchase cost or the current market value of the shares being sold, whichever is less.
Class A share purchases not subject to sales charges The following investments are not subject to any initial or contingent deferred sales charge if American Funds Service Company is properly notified of the nature of the investment:
· investments made by accounts that are part of qualified fee-based programs that purchased Class A shares before the discontinuation of the relevant investment
23 The Income Fund of America / Prospectus
dealer’s load-waived Class A share program with the American Funds and that continue to be held through fee-based programs; and
· rollover investments from retirement plans to IRAs that are described in the “Rollovers from retirement plans to IRAs” section of this prospectus.
The distributor may pay dealers a commission of up to 1% on investments made in Class A shares with no initial sales charge. The fund may reimburse the distributor for these payments through its plans of distribution (see “Plans of distribution” in this prospectus).
A transfer from the Virginia Prepaid Education ProgramSM or the Virginia Education Savings TrustSM to a CollegeAmerica account will be made with no sales charge. No commission will be paid to the dealer on such a transfer. Investment dealers will be compensated solely with an annual service fee that begins to accrue immediately.
Pursuant to a determination of eligibility by a vice president or more senior officer of the Capital Research and Management Company Fund Business Management Group, or by his or her designee, Class A shares of the American Funds may be sold at net asset value to:
(1) currently registered representatives and assistants directly employed by such representatives, retired registered representatives with respect to accounts established while active, or full-time employees (collectively, “Eligible Persons”) (and their (a) spouses or equivalents if recognized under local law, (b) parents and children, including parents and children in step and adoptive relationships, sons-in-law and daughters-in-law, and (c) parents-in-law, if the Eligible Persons or the spouses, children or parents of the Eligible Persons are listed in the account registration with the parents-in-law) of dealers who have sales agreements with American Funds Distributors (or who clear transactions through such dealers), plans for the dealers, and plans that include as participants only the Eligible Persons, their spouses, parents and/or children (these policies are subject to the dealer’s policies and system capabilities);
(2) currently registered investment advisors (“RIAs”) and assistants directly employed by such RIAs, retired RIAs with respect to accounts established while active, or full-time employees (collectively, “Eligible RIAs”) (and their (a) spouses or equivalents if recognized under local law, (b) parents and children, including parents and children in step and adoptive relationships, sons-in-law and daughters-in-law and (c) parents-in-law, if the Eligible RIAs or the spouses, children or parents of the Eligible RIAs are listed in the account registration with the parents-in-law) of RIA firms that are authorized to sell shares of the funds, plans for the RIA firms, and plans that include as participants only the Eligible RIAs, their spouses, parents and/or children (these policies are subject to the RIA’s policies and system capabilities);
(3) insurance company separate accounts;
(4) accounts managed by subsidiaries of The Capital Group Companies, Inc.;
(5) an individual or entity with a substantial business relationship with The Capital Group Companies, Inc. or its affiliates, or an individual or entity related or relating to such individual or entity;
The Income Fund of America / Prospectus 24
(6) wholesalers and full-time employees directly supporting wholesalers involved in the distribution of insurance company separate accounts whose underlying investments are managed by any affiliate of The Capital Group Companies, Inc.;
(7) full-time employees of banks that have sales agreements with American Funds Distributors who are solely dedicated to directly supporting the sale of mutual funds; and
(8) current or former clients of Capital Group Private Client Services and their family members who purchase their shares through Capital Group Private Client Services or American Funds Service Company.
Shares are offered at net asset value to these persons and organizations due to anticipated economies in sales effort and expense. Once an account is established under this net asset value privilege, additional investments can be made at net asset value for the life of the account. Depending on the financial intermediary holding your account, these privileges may be unavailable. Investors should consult their financial intermediary for further information.
Certain other investors may qualify to purchase shares without a sales charge, such as employees of The Capital Group Companies, Inc. and its affiliates. Please see the statement of additional information for further details.
Class C shares
Class C shares are sold without any initial sales charge. American Funds Distributors pays 1% of the amount invested to dealers who sell Class C shares. A contingent deferred sales charge of 1% applies if Class C shares are sold within one year of purchase. The contingent deferred sales charge is eliminated one year after purchase.
Any contingent deferred sales charge paid by you on sales of Class C shares, expressed as a percentage of the applicable redemption amount, may be higher or lower than the percentages described above due to rounding.
Class T shares The initial sales charge you pay each time you buy Class T shares differs depending upon the amount you invest and may be reduced for larger purchases as indicated below. The “offering price,” the price you pay to buy shares, includes any applicable sales charge, which will be deducted directly from your investment. Shares acquired through reinvestment of dividends or capital gain distributions are not subject to an initial sales charge.
| Sales
charge as a percentage of: | ||
| Investment | Offering price | Net
amount invested |
| Less than $250,000 | 2.50% | 2.56% |
| $250,000 but less than $500,000 | 2.00 | 2.04 |
| $500,000 but less than $1 million | 1.50 | 1.52 |
| $1 million or more | 1.00 | 1.01 |
The sales charge, expressed as a percentage of the offering price or the net amount invested, may be higher or lower than the percentages described in the table above due to rounding. This is because the dollar amount of the sales charge is determined by subtracting the net asset value of the shares purchased from the offering price, which is
24A The Income Fund of America / Prospectus
calculated to two decimal places using standard rounding criteria. The impact of rounding will vary with the size of the investment and the net asset value of the shares.
Class 529-E and Class F shares Class 529-E and Class F shares (including Class 529-F-1 shares) are sold without any initial or contingent deferred sales charge.
Class R shares Class R shares are sold without any initial or contingent deferred sales charge. The distributor will pay dealers annually asset-based compensation of up to 1.00% for sales of Class R-1 shares, up to .75% for Class R-2 shares, up to .60% for Class R-2E shares, up to .50% for Class R-3 shares and up to .25% for Class R-4 shares. No dealer compensation is paid from fund assets on sales of Class R-5E, R-5 or R-6 shares. The fund may reimburse the distributor for these payments through its plans of distribution.
See “Plans of distribution” in this prospectus for ongoing compensation paid to your dealer or financial advisor for all share classes.
Contingent deferred sales charges Shares acquired through reinvestment of dividends or capital gain distributions are not subject to a contingent deferred sales charge. In addition, the contingent deferred sales charge may be waived in certain circumstances. See “Contingent deferred sales charge waivers” in the “Sales charge reductions and waivers” section of this prospectus. For purposes of determining the contingent deferred sales charge, if you sell only some of your shares, shares that are not subject to any contingent deferred sales charge will be sold first, followed by shares that you have owned the longest.
Sales charge reductions and waivers To receive a reduction in your Class A initial sales charge, you must let your financial advisor or American Funds Service Company know at the time you purchase shares that you qualify for such a reduction. If you do not let your advisor or American Funds Service Company know that you are eligible for a reduction, you may not receive the sales charge discount to which you are otherwise entitled. In order to determine your eligibility to receive a sales charge discount, it may be necessary for you to provide your advisor or American Funds Service Company with information and records (including account statements) of all relevant accounts invested in the American Funds. You may need to invest directly through American Funds Service Company in order to receive the sales charge waivers described in this prospectus. Investors should consult their financial intermediary for further information.
In addition to the information in this prospectus, you may obtain more information about share classes, sales charges and sales charge reductions and waivers through a link on the home page of the American Funds website at americanfunds.com, from the statement of additional information or from your financial advisor.
Reducing your Class A initial sales charge Consistent with the policies described in this prospectus, you and your “immediate family” (your spouse — or equivalent, if recognized under local law — and your children under the age of 21) may combine all of your American Funds investments to reduce Class A sales charges. In addition, two or more retirement plans of an employer or an employer’s affiliates may combine all of their American Funds investments to reduce Class A sales charges. Certain investments in the American Funds Target Date Retirement Series,® American Funds Portfolio SeriesSM, American Funds College Target Date Series® and American Funds Retirement Income Portfolio SeriesSM may also be combined for this purpose. Please see the applicable
The Income Fund of America / Prospectus 25
series’ prospectus for further information. However, for this purpose, investments representing direct purchases of American Funds U.S. Government Money Market Fund are excluded. Following are different ways that you may qualify for a reduced Class A sales charge:
Aggregating accounts To receive a reduced Class A sales charge, investments made by you and your immediate family (see above) may be aggregated if made for your own account(s) and/or certain other accounts, such as:
· individual-type employee benefit plans, such as an IRA, single-participant Keogh-type plan, or a participant account of a 403(b) plan that is treated as an individual-type plan for sales charge purposes (see “Purchases by certain 403(b) plans” under “Rollovers from retirement plans to IRAs” below);
· SEP plans and SIMPLE IRA plans established after November 15, 2004, by an employer adopting any plan document other than a prototype plan produced by American Funds Distributors;
· business accounts solely controlled by you or your immediate family (for example, you own the entire business);
· trust accounts established by you or your immediate family (for trusts with only one primary beneficiary, upon the trustor’s death the trust account may be aggregated with such beneficiary’s own accounts; for trusts with multiple primary beneficiaries, upon the trustor’s death the trustees of the trust may instruct American Funds Service Company to establish separate trust accounts for each primary beneficiary; each primary beneficiary’s separate trust account may then be aggregated with such beneficiary’s own accounts);
· endowments or foundations established and controlled by you or your immediate family; or
· 529 accounts, which will be aggregated at the account owner level (Class 529-E accounts may only be aggregated with an eligible employer plan).
Individual purchases by a trustee(s) or other fiduciary(ies) may also be aggregated if the investments are:
· for a single trust estate or fiduciary account, including employee benefit plans other than the individual-type employee benefit plans described above;
· made for two or more employee benefit plans of a single employer or of affiliated employers as defined in the Investment Company Act of 1940, as amended (“1940 Act”), excluding the individual-type employee benefit plans described above;
· for a diversified common trust fund or other diversified pooled account not specifically formed for the purpose of accumulating fund shares;
· for nonprofit, charitable or educational organizations, or any endowments or foundations established and controlled by such organizations, or any employer-sponsored retirement plans established for the benefit of the employees of such organizations, their endowments, or their foundations;
· for participant accounts of a 403(b) plan that is treated as an employer-sponsored plan for sales charge purposes (see “Purchases by certain 403(b) plans” under “Rollovers from retirement plans to IRAs” below), or made for participant accounts of two or more such plans, in each case of a single employer or affiliated employers as defined in the 1940 Act; or
26 The Income Fund of America / Prospectus
· for a SEP or SIMPLE IRA plan established after November 15, 2004, by an employer adopting a prototype plan produced by American Funds Distributors.
Purchases made for nominee or street name accounts (securities held in the name of an investment dealer or another nominee such as a bank trust department instead of the customer) may not be aggregated with those made for other accounts and may not be aggregated with other nominee or street name accounts unless otherwise qualified as described above.
Joint accounts may be aggregated with other accounts belonging to the primary owner and/or his or her immediate family. The primary owner of a joint account is the individual responsible for taxes on the account.
Investments made through employer-sponsored retirement plan accounts will not be aggregated with individual-type accounts.
Concurrent purchases You may reduce your Class A sales charge by combining simultaneous purchases (including, upon your request, purchases for gifts) of all classes of shares in the American Funds, as well as applicable holdings in the American Funds Target Date Retirement Series, American Funds Portfolio Series, American Funds Retirement Income Portfolio Series and American Funds College Target Date Series. Shares of American Funds U.S. Government Money Market Fund purchased through an exchange, reinvestment or cross-reinvestment from a fund having a sales charge also qualify. However, direct purchases of American Funds U.S. Government Money Market Fund are excluded. If you currently have individual holdings in American Legacy variable annuity contracts or variable life insurance policies that were established on or before March 31, 2007, you may continue to combine purchases made under such contracts and policies to reduce your Class A sales charge.
Rights of accumulation Subject to the limitations described in the aggregation policy, you may take into account your accumulated holdings in all share classes of the American Funds, as well as applicable holdings in the American Funds Target Date Retirement Series, American Funds Portfolio Series, American Funds Retirement Income Portfolio Series and American Funds College Target Date Series, to determine your sales charge on investments in accounts eligible to be aggregated. Direct purchases of American Funds U.S. Government Money Market Fund are excluded. Subject to your investment dealer’s or recordkeeper’s capabilities, your accumulated holdings will be calculated as the higher of (a) the current value of your existing holdings (the “market value”) as of the day prior to your American Funds investment or (b) the amount you invested (including reinvested dividends and capital gains, but excluding capital appreciation) less any withdrawals (the “cost value”). Depending on the entity on whose books your account is held, the value of your holdings in that account may not be eligible for calculation at cost value. For example, accounts held in nominee or street name may not be eligible for calculation at cost value and instead may be calculated at market value for purposes of rights of accumulation.
The value of all of your holdings in accounts established in calendar year 2005 or earlier will be assigned an initial cost value equal to the market value of those holdings as of the last business day of 2005. Thereafter, the cost value of such accounts will increase or decrease according to actual investments or withdrawals. You must contact your financial advisor or American Funds Service Company if you have additional information that is relevant to the calculation of the value of your holdings.
The Income Fund of America / Prospectus 27
When determining your American Funds Class A sales charge, if your investment is not in an employer-sponsored retirement plan, you may also continue to take into account the market value (as of the day prior to your American Funds investment) of your individual holdings in various American Legacy variable annuity contracts and variable life insurance policies that were established on or before March 31, 2007. An employer-sponsored retirement plan may also continue to take into account the market value of its investments in American Legacy Retirement Investment Plans that were established on or before March 31, 2007.
You may not purchase Class C or 529-C shares if such combined holdings cause you to be eligible to purchase Class A or 529-A shares at the $1 million or more sales charge discount rate (i.e., at net asset value).
If you make a gift of American Funds Class A shares, upon your request, you may purchase the shares at the sales charge discount allowed under rights of accumulation of all of your American Funds and applicable American Legacy accounts.
You should retain any records necessary to substantiate the historical amounts you have invested.
Statement of intention You may reduce your Class A sales charge by establishing a statement of intention. A statement of intention is a nonbinding commitment that allows you to combine all purchases of all share classes of the American Funds (excluding American Funds U.S. Government Money Market Fund) that you intend to make over a 13-month period to determine the applicable sales charge; however, purchases made under a right of reinvestment, appreciation of your holdings, and reinvested dividends and capital gains do not count as purchases made during the statement period. Your accumulated holdings (as described and calculated under “Rights of accumulation” above) eligible to be aggregated as of the day immediately before the start of the statement period may be credited toward satisfying the statement. A portion of your account may be held in escrow to cover additional Class A sales charges that may be due if your total purchases over the statement period do not qualify you for the applicable sales charge reduction. Employer-sponsored retirement plans may be restricted from establishing statements of intention. See the discussion regarding employer-sponsored retirement plans under “Purchase, exchange and sale of shares” in this prospectus for more information.
The statement of intention period starts on the date on which your first purchase made toward satisfying the statement of intention is processed. Your accumulated holdings (as described above under “Rights of accumulation”) eligible to be aggregated as of the day immediately before the start of the statement of intention period may be credited toward satisfying the statement of intention.
You may revise the commitment you have made in your statement of intention upward at any time during the statement of intention period. If your prior commitment has not been met by the time of the revision, the statement of intention period during which purchases must be made will remain unchanged. Purchases made from the date of the revision will receive the reduced sales charge, if any, resulting from the revised statement of intention. If your prior commitment has been met by the time of the revision, your original statement of intention will be considered met and a new statement of intention will be established.
28 The Income Fund of America / Prospectus
The statement of intention will be considered completed if the shareholder dies within the 13-month statement of intention period. Commissions to dealers will not be adjusted or paid on the difference between the statement of intention amount and the amount actually invested before the shareholder’s death.
When a shareholder elects to use a statement of intention, shares equal to 5% of the dollar amount specified in the statement of intention may be held in escrow in the shareholder’s account out of the initial purchase (or subsequent purchases, if necessary) by American Funds Service Company. All dividends and any capital gain distributions on shares held in escrow will be credited to the shareholder’s account in shares (or paid in cash, if requested). If the intended investment is not completed within the specified statement of intention period the investments made during the statement period will be adjusted to reflect the difference between the sales charge actually paid and the sales charge which would have been paid if the total of such purchases had been made at a single time. Any dealers assigned to the shareholder’s account at the time a purchase was made during the statement period will receive a corresponding commission adjustment if appropriate.
In addition, if you currently have individual holdings in American Legacy variable annuity contracts or variable life insurance policies that were established on or before March 31, 2007, you may continue to apply purchases under such contracts and policies to a statement of intention.
Shareholders purchasing shares at a reduced sales charge under a statement of intention indicate their acceptance of these terms and those in the prospectus with their first purchase.
Reducing your Class T initial sales charge Consistent with the policies described in this prospectus, the initial sales charge you pay each time you buy Class T shares may differ depending upon the amount you invest and may be reduced for larger purchases. Additionally, Class T shares acquired through reinvestment of dividends or capital gain distributions are not subject to an initial sales charge. Sales charges on Class T shares are normally applied on a transaction-by-transaction basis, and, accordingly, Class T shares are not generally eligible for any other sales charge waivers or reductions, including through the aggregation of Class T shares concurrently purchased by other related accounts or in other American Funds. The sales charge applicable to Class T shares may not be reduced by establishing a statement of intention, and rights of accumulation are not available for Class T shares.
The Income Fund of America / Prospectus 29
Right of reinvestment If you notify American Funds Service Company prior to the time of reinvestment, you may reinvest proceeds from a redemption, dividend payment or capital gain distribution without a sales charge in the same fund or other American Funds, provided that the reinvestment occurs within 90 days after the date of the redemption, dividend payment or distribution and is made into the same account from which you redeemed the shares or received the dividend payment or distribution. If the account has been closed, you may reinvest without a sales charge if the new receiving account has the same registration as the closed account and the reinvestment is made within 90 days after the date of redemption, dividend payment or distribution.
Proceeds from a redemption and all dividend payments and capital gain distributions will be reinvested in the same share class from which the original redemption, dividend payment or distribution was made. Any contingent deferred sales charge on Class A or C shares will be credited to your account. Redemption proceeds of Class A shares representing direct purchases in American Funds U.S. Government Money Market Fund that are reinvested in other American Funds will be subject to a sales charge.
Proceeds will be reinvested at the next calculated net asset value after your request is received by American Funds Service Company, provided that your request contains all information and legal documentation necessary to process the transaction. For purposes of this “right of reinvestment policy,” automatic transactions (including, for example, automatic purchases, withdrawals and payroll deductions) and ongoing retirement plan contributions are not eligible for investment without a sales charge. You may not reinvest proceeds in the American Funds as described in this paragraph if such proceeds are subject to a purchase block as described under “Frequent trading of fund shares” in this prospectus. This paragraph does not apply to certain rollover investments as described under “Rollovers from retirement plans to IRAs” in this prospectus. Depending on the financial intermediary holding your account, your reinvestment privileges may be unavailable or differ from those described in this prospectus. Investors should consult their financial intermediary for further information.
30 The Income Fund of America / Prospectus
Contingent deferred sales charge waivers The contingent deferred sales charge on Class A and C shares may be waived in the following cases:
· permitted exchanges of shares, except if shares acquired by exchange are then redeemed within the period during which a contingent deferred sales charge would apply to the initial shares purchased;
· tax-free returns of excess contributions to IRAs;
· redemptions due to death or postpurchase disability of the shareholder (this generally excludes accounts registered in the names of trusts and other entities);
· in the case of joint tenant accounts, if one joint tenant dies, a surviving joint tenant, at the time he or she notifies American Funds Service Company of the other joint tenant’s death and removes the decedent’s name from the account, may redeem shares from the account without incurring a contingent deferred sales charge; however, redemptions made after American Funds Service Company is notified of the death of a joint tenant will be subject to a contingent deferred sales charge;
· for 529 share classes only, redemptions due to a beneficiary’s death, postpurchase disability or receipt of a scholarship (to the extent of the scholarship award);
· redemptions due to the complete termination of a trust upon the death of the trustor/grantor or beneficiary, but only if such termination is specifically provided for in the trust document; and
· the following types of transactions, if they do not exceed 12% of the value of an account annually:
— required minimum distributions taken from retirement accounts upon the shareholder’s attainment of age 70½ (required minimum distributions that continue to be taken by the beneficiary(ies) after the account owner is deceased also qualify for a waiver); and
— redemptions through an automatic withdrawal plan (“AWP”) (see “Automatic withdrawals” under “Shareholder account services and privileges” in the statement of additional information). For each AWP payment, assets that are not subject to a contingent deferred sales charge, such as shares acquired through reinvestment of dividends and/or capital gain distributions, will be redeemed first and will count toward the 12% limit. If there is an insufficient amount of assets not subject to a contingent deferred sales charge to cover a particular AWP payment, shares subject to the lowest contingent deferred sales charge will be redeemed next until the 12% limit is reached. Any dividends and/or capital gain distributions taken in cash by a shareholder who receives payments through an AWP will also count toward the 12% limit. In the case of an AWP, the 12% limit is calculated at the time an automatic redemption is first made, and is recalculated at the time each additional automatic redemption is made. Shareholders who establish an AWP should be aware that the amount of a payment not subject to a contingent deferred sales charge may vary over time depending on fluctuations in the value of their accounts. This privilege may be revised or terminated at any time.
For purposes of this paragraph, “account” means your investment in the applicable class of shares of the particular fund from which you are making the redemption.
Pursuant to a determination of eligibility by a vice president or more senior officer of the Capital Research and Management Company Fund Business Management Group, or by
The Income Fund of America / Prospectus 31
his or her designee, the contingent deferred sales charge on Class A shares of the American Funds may be waived for bulk conversions to another share class in cases where the fund’s transfer agent determines the benefit to the fund of collecting the contingent deferred sales charge would be outweighed by the cost of applying it.
Contingent deferred sales charge waivers are allowed only in the cases listed here and in the statement of additional information. For example, contingent deferred sales charge waivers will not be allowed on redemptions of Class 529-C shares due to termination of CollegeAmerica; a determination by the Internal Revenue Service that CollegeAmerica does not qualify as a qualified tuition program under the Code; proposal or enactment of law that eliminates or limits the tax-favored status of CollegeAmerica; or elimination of the fund by Virginia529 as an option for additional investment within CollegeAmerica.
To have your Class A or C contingent deferred sales charge waived, you must inform your advisor or American Funds Service Company at the time you redeem shares that you qualify for such a waiver.
32 The Income Fund of America / Prospectus
Rollovers from retirement plans to IRAs Assets from retirement plans may be invested in Class A, C or F shares through an IRA rollover, subject to the other provisions of this prospectus. Class C shares are not available if the assets are being rolled over from investments held in the American Funds Recordkeeper Direct and PlanPremier retirement plan recordkeeping programs.
Rollovers to IRAs from retirement plans that are rolled into Class A shares will be subject to applicable sales charges. The following rollovers to Class A shares will be made without a sales charge:
· rollovers to Capital Bank and Trust CompanySM IRAs if the assets were invested in American Funds at the time of distribution;
· rollovers to IRAs from 403(b) plans with Capital Bank and Trust Company as custodian; and
· rollovers to Capital Bank and Trust Company IRAs from investments held in the American Funds Recordkeeper Direct and PlanPremier retirement plan recordkeeping programs.
IRA rollover assets that roll over without a sales charge as described above will not be subject to a contingent deferred sales charge, and investment dealers will be compensated solely with an annual service fee that begins to accrue immediately. All other rollovers invested in Class A shares, as well as future contributions to the IRA, will be subject to sales charges and to the terms and conditions generally applicable to Class A share investments as described in this prospectus and in the statement of additional information.
Other sales charge waivers Sales charges (including contingent deferred sales charges) may be waived pursuant to a determination of eligibility by a vice president or more senior officer of the Capital Research and Management Company Fund Business Management Group, or by his or her designee. For example, waivers of all or a portion of the contingent deferred sales charge on Class C shares may be granted for transactions requested by financial intermediaries as a result of (i) pending or anticipated regulatory matters that require investor accounts to be moved to a different share class or (ii) conversions of IRAs from brokerage to advisory accounts in cases where new investments in brokerage IRA accounts have been restricted by the intermediary.
Purchases by SEP plans and SIMPLE IRA plans Participant accounts in a Simplified Employee Pension (SEP) plan or a Savings Incentive Match Plan for Employees of Small Employers IRA (SIMPLE IRA) will be aggregated at the plan level for Class A sales charge purposes if an employer adopts a prototype plan produced by American Funds Distributors or (a) the employer or plan sponsor submits all contributions for all participating employees in a single contribution transmittal or the contributions are identified as related to the same plan; (b) each transmittal is accompanied by checks or wire transfers and generally must be submitted through the transfer agent’s automated contribution system if held on the fund’s books; and (c) if the fund is expected to carry separate accounts in the name of each plan participant and (i) the employer or plan sponsor notifies the funds’ transfer agent or the intermediary holding the account that the separate accounts of all plan participants should be linked and (ii) all new participant accounts are established by submitting the appropriate documentation on behalf of each new participant. Participant accounts in a SEP or SIMPLE plan that are eligible to aggregate their assets at the plan level may not also aggregate the assets with their individual accounts. The ability to link SEP and SIMPLE IRA accounts at the plan level may
The Income Fund of America / Prospectus 33
not be available to you depending on the policies and system capabilities of your financial intermediary.
Purchases by certain 403(b) plans A 403(b) plan may not invest in Class A or C shares of any of the American Funds unless such plan was invested in Class A or C shares before January 1, 2009.
Participant accounts of a 403(b) plan that invested in Class A or C shares of any of the American Funds and were treated as an individual-type plan for sales charge purposes before January 1, 2009, may continue to be treated as accounts of an individual-type plan for sales charge purposes. Participant accounts of a 403(b) plan that invested in Class A or C shares of any of the American Funds and were treated as an employer-sponsored plan for sales charge purposes before January 1, 2009, may continue to be treated as accounts of an employer-sponsored plan for sales charge purposes. Participant accounts of a 403(b) plan that was established on or after January 1, 2009, are treated as accounts of an employer-sponsored plan for sales charge purposes.
Moving between accounts American Funds investments by certain account types may be moved to other account types without incurring additional Class A sales charges. These transactions include:
· redemption proceeds from a non-retirement account (for example, a joint tenant account) used to purchase fund shares in an IRA or other individual-type retirement account;
· required minimum distributions from an IRA or other individual-type retirement account used to purchase fund shares in a non-retirement account; and
· death distributions paid to a beneficiary’s account that are used by the beneficiary to purchase fund shares in a different account.
These privileges are generally available only if your account is held directly with the fund’s transfer agent or if the financial intermediary holding your account has the systems, policies and procedures to support providing the privileges on their systems. Investors should consult their financial intermediary for further information.
34 The Income Fund of America / Prospectus
Plans of distribution The fund has plans of distribution, or “12b-1 plans,” for certain share classes under which it may finance activities intended primarily to sell shares, provided that the categories of expenses are approved in advance by the fund’s board of trustees. The plans provide for payments, based on annualized percentages of average daily net assets, of:
| Up to: | Share class(es) |
| 0.25% | Class A shares |
| 0.50% | Class T, 529-A, 529-T, F-1, 529-F-1 and R-4 shares |
| 0.75% | Class 529-E and R-3 shares |
| 0.85% | Class R-2E shares |
| 1.00% | Class C, 529-C, R-1 and R-2 shares |
For all share classes indicated above, up to .25% may be used to pay service fees to qualified dealers for providing certain shareholder services. The amount remaining for each share class, if any, may be used for distribution expenses.
The 12b-1 fees paid by each applicable share class of the fund, as a percentage of average net assets for the most recent fiscal year, are indicated in the Annual Fund Operating Expenses table on page 1 of this prospectus. Since these fees are paid out of the fund’s assets on an ongoing basis, over time they may cost you more than paying other types of sales charges or service fees and reduce the return on your investment. The higher fees for Class C shares may cost you more over time than paying the initial sales charge for Class A or T shares.
The Income Fund of America / Prospectus 35
Other compensation to dealers American Funds Distributors, at its expense, provides additional compensation to investment dealers. These payments may be made, at the discretion of American Funds Distributors, to the top 100 dealers (or their affiliates) that have sold shares of the American Funds. A number of factors will be considered in determining payments, including the qualifying dealer’s sales, assets and positive cash flows, and the quality of the dealer’s relationship with American Funds Distributors. The payment will be determined using a formula applied consistently to dealers based on the relevant facts and circumstances. The level of payments made to a qualifying firm in any given year will vary and (excluding payments for meetings as described below) will represent the sum of (a) up to .10% of the previous year’s American Funds sales by that dealer and (b) up to .02% of American Funds assets attributable to that dealer, with an adjustment made for the dealer’s positive cash flows and the quality of the dealer’s relationship with American Funds Distributors. For calendar year 2016, aggregate payments made by American Funds Distributors to dealers were less than .02% of the average assets of the American Funds. Aggregate payments made by American Funds Distributors to dealers may also change from year to year. American Funds Distributors makes these payments to help defray the costs incurred by qualifying dealers in connection with efforts to educate financial advisors about the American Funds so that they can make recommendations and provide services that are suitable and meet shareholder needs. These payments may also be made to help defray the costs associated with the dealer firms’ provision of account related services and activities. American Funds Distributors will, on an annual basis, determine the advisability of continuing these payments.
Firms receiving additional compensation payments must sign a letter acknowledging the purpose of the payment and American Funds Distributors’ goal that the payment will help facilitate education of the firm’s financial advisors about the American Funds to help the advisors make suitable recommendations and better serve their clients who invest in the funds. The letters generally require the firms to (1) have significant assets invested in the American Funds, (2) perform the due diligence necessary to classify the American Funds as “approved” or “preferred” (or an equivalent) on their platform, (3) not provide financial advisors, branch managers or associated persons with any financial incentives to promote the sales of one approved fund group over another approved group, (4) provide opportunities for their clients to obtain individualized advice, (5) provide American Funds Distributors broad access to their financial advisors and product platforms and develop a business plan to achieve such access, and (6) work with the fund’s transfer agent to promote operational efficiencies and to facilitate necessary communication between the American Funds and the firm’s clients who own shares of the American Funds.
American Funds Distributors may also pay expenses associated with meetings and other training and educational opportunities conducted by selling dealers, advisory platform providers and other intermediaries to facilitate educating financial advisors and shareholders about the American Funds. For example, some of these expenses may include, but not be limited to, meeting sponsor fees, meeting location fees, and fees to obtain lists of financial advisors to better tailor training and education opportunities.
If investment advisers, distributors or other affiliates of mutual funds pay additional compensation or other incentives to investment dealers in differing amounts, dealer firms and their advisors may have financial incentives for recommending a particular
36 The Income Fund of America / Prospectus
mutual fund over other mutual funds or investments. You should consult with your financial advisor and review carefully any disclosure by your financial advisor’s firm as to compensation received.
The Income Fund of America / Prospectus 37
Fund expenses Note that references to Class A, C, T and F-1 shares in this “Fund expenses” section do not include the corresponding Class 529 shares.
In periods of market volatility, assets of the fund may decline significantly, causing total annual fund operating expenses (as a percentage of the value of your investment) to become higher than the numbers shown in the Annual Fund Operating Expenses table on page 1 of this prospectus.
For all share classes, “Other expenses” items in the Annual Fund Operating Expenses table in this prospectus include fees for administrative services provided by the fund’s investment adviser and its affiliates. Administrative services include, but are not limited to, coordinating, monitoring, assisting and overseeing third parties that provide services to fund shareholders. The fund’s investment adviser receives an administrative services fee at the annual rate of .01% of the average daily net assets of the fund attributable to Class A shares and .05% of the average daily net assets of the fund attributable to Class C, T, F, R and 529 shares for its provision of administrative services.
The “Other expenses” items in the Annual Fund Operating Expenses table also include custodial, legal, transfer agent and subtransfer agent/recordkeeping payments and various other expenses applicable to all share classes.
Subtransfer agency and recordkeeping fees Subtransfer agent/recordkeeping payments may be made to third parties (including affiliates of the fund’s investment adviser) that provide subtransfer agent, recordkeeping and/or shareholder services with respect to certain shareholder accounts in lieu of the transfer agent providing such services. The amount paid for subtransfer agent/recordkeeping services varies depending on the share class and services provided, and typically ranges from $3 to $19 per account. Although Class F-3 shares are not subject to any subtransfer agency or recordkeeping fees, Class F-1 and F-2 shares are subject to subtransfer agency fees of up to .12% of fund assets. For Class 529 shares, an expense of up to a maximum of .10% paid to a state or states for oversight and administrative services is included as an “Other expenses” item.
For employer-sponsored retirement plans, the amount paid for subtransfer agent/ recordkeeping services varies depending on the share class selected. The table below shows the maximum payments to entities providing these services to retirement plans.
| Payments | |
| Class A | 0.05%
of assets or $12 per participant position* |
| Class R-1 | 0.10% of assets |
| Class R-2 | 0.35% of assets |
| Class R-2E | 0.20% of assets |
| Class R-3 | 0.15% of assets |
| Class R-4 | 0.10% of assets |
| Class R-5E | 0.15% of assets |
| Class R-5 | 0.05% of assets |
| Class R-6 | none |
* Payment amount depends on the date services commenced.
38 The Income Fund of America / Prospectus
Financial highlights The Financial Highlights table is intended to help you understand the fund’s results for the past five fiscal years (and for the six months ended January 31, 2017). Certain information reflects financial results for a single share of a particular class. The total returns in the table represent the rate that an investor would have earned or lost on an investment in the fund (assuming reinvestment of all dividends and capital gain distributions). The information in the Financial Highlights table (other than information for the six months ended January 31, 2017) has been audited by Deloitte & Touche LLP, whose current report, along with the fund’s financial statements, is included in the statement of additional information, which is available upon request. The information for the six-month period presented has been derived from the fund’s unaudited financial statements and includes all adjustments that management considers necessary for a fair presentation of such information for the period presented.
| Income (loss) from investment operations1 | Dividends and distributions | |||||||||||
| Net asset value, beginning of period |
Net investment income2 |
Net gains (losses) on securities (both realized and unrealized) |
Total from investment operations |
Dividends (from net investment income) |
Distributions (from capital gains) |
Total
dividends and distributions |
Net asset value, end of period |
Total
return3 |
Net assets, end of period (in millions) |
Ratio of expenses to average net assets2 |
Ratio of net income to average net assets2 | |
| Class A: | ||||||||||||
| Six months ended 1/31/20174,5 | $21.70 | $.31 | $ .28 | $ .59 | $(.34) | $ — | $ (.34) | $21.95 | 2.76%6 | $74,710 | .55%7 | 2.86%7 |
| Year ended 7/31/2016 | 21.31 | .66 | .76 | 1.42 | (.66) | (.37) | (1.03) | 21.70 | 7.10 | 75,437 | .56 | 3.22 |
| Year ended 7/31/2015 | 21.45 | .69 | (.04) | .65 | (.79) | — | (.79) | 21.31 | 3.01 | 72,952 | .55 | 3.19 |
| Year ended 7/31/2014 | 19.64 | .78 | 1.69 | 2.47 | (.66) | — | (.66) | 21.45 | 12.78 | 71,290 | .57 | 3.76 |
| Year ended 7/31/2013 | 17.66 | .67 | 1.99 | 2.66 | (.68) | — | (.68) | 19.64 | 15.33 | 63,968 | .58 | 3.58 |
| Year ended 7/31/2012 | 16.97 | .66 | .73 | 1.39 | (.70) | — | (.70) | 17.66 | 8.45 | 56,153 | .59 | 3.92 |
| Class B: | ||||||||||||
| Six months ended 1/31/20174, 5 | 21.59 | .25 | .25 | .50 | (.23) | — | (.23) | 21.86 | 2.346 | 36 | 1.307 | 2.267 |
| Year ended 7/31/2016 | 21.17 | .50 | .77 | 1.27 | (.48) | (.37) | (.85) | 21.59 | 6.35 | 112 | 1.31 | 2.45 |
| Year ended 7/31/2015 | 21.30 | .53 | (.05) | .48 | (.61) | — | (.61) | 21.17 | 2.23 | 301 | 1.30 | 2.45 |
| Year ended 7/31/2014 | 19.50 | .61 | 1.69 | 2.30 | (.50) | — | (.50) | 21.30 | 11.92 | 601 | 1.32 | 2.99 |
| Year ended 7/31/2013 | 17.53 | .53 | 1.97 | 2.50 | (.53) | — | (.53) | 19.50 | 14.48 | 818 | 1.33 | 2.86 |
| Year ended 7/31/2012 | 16.85 | .53 | .71 | 1.24 | (.56) | — | (.56) | 17.53 | 7.56 | 1,161 | 1.34 | 3.19 |
| (The Financial Highlights table continues on the following page.) | ||||||||||||
| The Income Fund of America / Prospectus 39 |
| Income (loss) from investment operations1 | Dividends and distributions | |||||||||||
| Net asset value, beginning of period |
Net investment income2 |
Net gains (losses) on securities (both realized and unrealized) |
Total from investment operations |
Dividends (from net investment income) |
Distributions (from capital gains) |
Total
dividends and distributions |
Net asset value, end of period |
Total
return3 |
Net assets, end of period (in millions) |
Ratio of expenses to average net assets2 |
Ratio of net income to average net assets2 | |
| Class C: | ||||||||||||
| Six months ended 1/31/20174,5 | $21.44 | $.22 | $ .27 | $ .49 | $(.25) | $ — | $ (.25) | $21.68 | 2.34%6 | $5,840 | 1.34%7 | 2.08%7 |
| Year ended 7/31/2016 | 21.06 | .49 | .76 | 1.25 | (.50) | (.37) | (.87) | 21.44 | 6.27 | 6,196 | 1.36 | 2.41 |
| Year ended 7/31/2015 | 21.21 | .51 | (.04) | .47 | (.62) | — | (.62) | 21.06 | 2.19 | 6,390 | 1.35 | 2.39 |
| Year ended 7/31/2014 | 19.42 | .60 | 1.69 | 2.29 | (.50) | — | (.50) | 21.21 | 11.91 | 6,597 | 1.37 | 2.95 |
| Year ended 7/31/2013 | 17.47 | .51 | 1.97 | 2.48 | (.53) | — | (.53) | 19.42 | 14.41 | 6,389 | 1.38 | 2.79 |
| Year ended 7/31/2012 | 16.80 | .52 | .71 | 1.23 | (.56) | — | (.56) | 17.47 | 7.55 | 6,096 | 1.38 | 3.13 |
| Class F-1: | ||||||||||||
| Six months ended 1/31/20174,5 | 21.65 | .30 | .28 | .58 | (.33) | — | (.33) | 21.90 | 2.736 | 4,589 | .647 | 2.777 |
| Year ended 7/31/2016 | 21.26 | .64 | .76 | 1.40 | (.64) | (.37) | (1.01) | 21.65 | 7.02 | 4,421 | .65 | 3.12 |
| Year ended 7/31/2015 | 21.40 | .67 | (.04) | .63 | (.77) | — | (.77) | 21.26 | 2.94 | 4,160 | .64 | 3.10 |
| Year ended 7/31/2014 | 19.60 | .76 | 1.68 | 2.44 | (.64) | — | (.64) | 21.40 | 12.66 | 3,841 | .65 | 3.71 |
| Year ended 7/31/2013 | 17.62 | .65 | 2.00 | 2.65 | (.67) | — | (.67) | 19.60 | 15.30 | 3,554 | .65 | 3.50 |
| Year ended 7/31/2012 | 16.94 | .65 | .72 | 1.37 | (.69) | — | (.69) | 17.62 | 8.35 | 2,563 | .64 | 3.87 |
| Class F-2: | ||||||||||||
| Six months ended 1/31/20174,5 | 21.69 | .33 | .28 | .61 | (.36) | — | (.36) | 21.94 | 2.866 | 6,735 | .387 | 2.997 |
| Year ended 7/31/2016 | 21.30 | .70 | .75 | 1.45 | (.69) | (.37) | (1.06) | 21.69 | 7.28 | 5,076 | .39 | 3.38 |
| Year ended 7/31/2015 | 21.44 | .73 | (.04) | .69 | (.83) | — | (.83) | 21.30 | 3.20 | 4,042 | .38 | 3.35 |
| Year ended 7/31/2014 | 19.63 | .80 | 1.71 | 2.51 | (.70) | — | (.70) | 21.44 | 12.97 | 2,975 | .40 | 3.89 |
| Year ended 7/31/2013 | 17.65 | .70 | 1.99 | 2.69 | (.71) | — | (.71) | 19.63 | 15.53 | 1,434 | .41 | 3.74 |
| Year ended 7/31/2012 | 16.97 | .69 | .72 | 1.41 | (.73) | — | (.73) | 17.65 | 8.59 | 1,020 | .40 | 4.09 |
| Class F-3: | ||||||||||||
| Period from 1/27/2017 to 1/31/20174,5,8 | 22.07 | —9 | (.12) | (.12) | — | — | — | 21.95 | (.54)6 | —10 | —6,11 | .026 |
| 40 The Income Fund of America / Prospectus |
| Income (loss) from investment operations1 | Dividends and distributions | |||||||||||
| Net asset value, beginning of period |
Net investment income2 |
Net gains (losses) on securities (both realized and unrealized) |
Total from investment operations |
Dividends (from net investment income) |
Distributions (from capital gains) |
Total
dividends and distributions |
Net asset value, end of period |
Total
return3 |
Net assets, end of period (in millions) |
Ratio of expenses to average net assets2 |
Ratio of net income to average net assets2 | |
| Class 529-A: | ||||||||||||
| Six months ended 1/31/20174,5 | $21.66 | $.30 | $ .28 | $ .58 | $(.33) | $ — | $ (.33) | $21.91 | 2.73%6 | $1,536 | .63%7 | 2.78%7 |
| Year ended 7/31/2016 | 21.27 | .64 | .76 | 1.40 | (.64) | (.37) | (1.01) | 21.66 | 7.00 | 1,525 | .66 | 3.11 |
| Year ended 7/31/2015 | 21.41 | .67 | (.04) | .63 | (.77) | — | (.77) | 21.27 | 2.92 | 1,489 | .65 | 3.09 |
| Year ended 7/31/2014 | 19.60 | .75 | 1.70 | 2.45 | (.64) | — | (.64) | 21.41 | 12.69 | 1,463 | .67 | 3.66 |
| Year ended 7/31/2013 | 17.63 | .65 | 1.98 | 2.63 | (.66) | — | (.66) | 19.60 | 15.19 | 1,298 | .68 | 3.48 |
| Year ended 7/31/2012 | 16.95 | .64 | .72 | 1.36 | (.68) | — | (.68) | 17.63 | 8.30 | 1,102 | .68 | 3.82 |
| Class 529-B: | ||||||||||||
| Six months ended 1/31/20174, 5 | 21.65 | .23 | .26 | .49 | (.21) | — | (.21) | 21.93 | 2.286 | 2 | 1.437 | 2.167 |
| Year ended 7/31/2016 | 21.23 | .48 | .76 | 1.24 | (.45) | (.37) | (.82) | 21.65 | 6.18 | 8 | 1.45 | 2.32 |
| Year ended 7/31/2015 | 21.36 | .50 | (.05) | .45 | (.58) | — | (.58) | 21.23 | 2.10 | 20 | 1.43 | 2.33 |
| Year ended 7/31/2014 | 19.55 | .58 | 1.70 | 2.28 | (.47) | — | (.47) | 21.36 | 11.79 | 34 | 1.45 | 2.85 |
| Year ended 7/31/2013 | 17.57 | .50 | 1.99 | 2.49 | (.51) | — | (.51) | 19.55 | 14.35 | 45 | 1.46 | 2.73 |
| Year ended 7/31/2012 | 16.89 | .51 | .71 | 1.22 | (.54) | — | (.54) | 17.57 | 7.41 | 58 | 1.47 | 3.06 |
| Class 529-C: | ||||||||||||
| Six months ended 1/31/20174,5 | 21.57 | .22 | .28 | .50 | (.25) | — | (.25) | 21.82 | 2.306 | 454 | 1.407 | 2.027 |
| Year ended 7/31/2016 | 21.18 | .48 | .76 | 1.24 | (.48) | (.37) | (.85) | 21.57 | 6.20 | 463 | 1.43 | 2.34 |
| Year ended 7/31/2015 | 21.33 | .50 | (.05) | .45 | (.60) | — | (.60) | 21.18 | 2.09 | 466 | 1.42 | 2.32 |
| Year ended 7/31/2014 | 19.53 | .59 | 1.69 | 2.28 | (.48) | — | (.48) | 21.33 | 11.82 | 470 | 1.44 | 2.88 |
| Year ended 7/31/2013 | 17.56 | .50 | 1.99 | 2.49 | (.52) | — | (.52) | 19.53 | 14.36 | 420 | 1.45 | 2.71 |
| Year ended 7/31/2012 | 16.89 | .51 | .71 | 1.22 | (.55) | — | (.55) | 17.56 | 7.43 | 370 | 1.47 | 3.04 |
| (The Financial Highlights table continues on the following page.) | ||||||||||||
| The Income Fund of America / Prospectus 41 |
| Income (loss) from investment operations1 | Dividends and distributions | |||||||||||
| Net asset value, beginning of period |
Net investment income2 |
Net gains (losses) on securities (both realized and unrealized) |
Total from investment operations |
Dividends (from net investment income) |
Distributions (from capital gains) |
Total
dividends and distributions |
Net asset value, end of period |
Total
return3 |
Net assets, end of period (in millions) |
Ratio of expenses to average net assets2 |
Ratio of net income to average net assets2 | |
| Class 529-E: | ||||||||||||
| Six months ended 1/31/20174,5 | $21.60 | $.28 | $ .27 | $ .55 | $(.31) | $ — | $(.31) | $21.84 | 2.57%6 | $66 | .86%7 | 2.55%7 |
| Year ended 7/31/2016 | 21.21 | .59 | .76 | 1.35 | (.59) | (.37) | (.96) | 21.60 | 6.76 | 66 | .89 | 2.88 |
| Year ended 7/31/2015 | 21.35 | .62 | (.04) | .58 | (.72) | — | (.72) | 21.21 | 2.68 | 64 | .89 | 2.85 |
| Year ended 7/31/2014 | 19.55 | .70 | 1.69 | 2.39 | (.59) | — | (.59) | 21.35 | 12.39 | 65 | .91 | 3.41 |
| Year ended 7/31/2013 | 17.58 | .60 | 1.99 | 2.59 | (.62) | — | (.62) | 19.55 | 14.95 | 59 | .92 | 3.24 |
| Year ended 7/31/2012 | 16.91 | .60 | .71 | 1.31 | (.64) | — | (.64) | 17.58 | 7.99 | 52 | .93 | 3.57 |
| Class 529-F-1: | ||||||||||||
| Six months ended 1/31/20174,5 | 21.66 | .33 | .28 | .61 | (.36) | — | (.36) | 21.91 | 2.856 | 64 | .407 | 3.017 |
| Year ended 7/31/2016 | 21.27 | .69 | .76 | 1.45 | (.69) | (.37) | (1.06) | 21.66 | 7.25 | 61 | .43 | 3.34 |
| Year ended 7/31/2015 | 21.41 | .72 | (.04) | .68 | (.82) | — | (.82) | 21.27 | 3.16 | 58 | .42 | 3.31 |
| Year ended 7/31/2014 | 19.60 | .80 | 1.70 | 2.50 | (.69) | — | (.69) | 21.41 | 12.94 | 52 | .44 | 3.89 |
| Year ended 7/31/2013 | 17.63 | .69 | 1.98 | 2.67 | (.70) | — | (.70) | 19.60 | 15.44 | 44 | .45 | 3.70 |
| Year ended 7/31/2012 | 16.95 | .68 | .72 | 1.40 | (.72) | — | (.72) | 17.63 | 8.53 | 36 | .46 | 4.04 |
| Class R-1: | ||||||||||||
| Six months ended 1/31/20174,5 | 21.57 | .22 | .27 | .49 | (.25) | — | (.25) | 21.81 | 2.316 | 128 | 1.397 | 2.037 |
| Year ended 7/31/2016 | 21.18 | .49 | .76 | 1.25 | (.49) | (.37) | (.86) | 21.57 | 6.25 | 133 | 1.37 | 2.40 |
| Year ended 7/31/2015 | 21.33 | .51 | (.05) | .46 | (.61) | — | (.61) | 21.18 | 2.16 | 139 | 1.36 | 2.38 |
| Year ended 7/31/2014 | 19.53 | .60 | 1.69 | 2.29 | (.49) | — | (.49) | 21.33 | 11.88 | 133 | 1.39 | 2.93 |
| Year ended 7/31/2013 | 17.56 | .52 | 1.98 | 2.50 | (.53) | — | (.53) | 19.53 | 14.43 | 120 | 1.39 | 2.78 |
| Year ended 7/31/2012 | 16.89 | .52 | .71 | 1.23 | (.56) | — | (.56) | 17.56 | 7.50 | 122 | 1.40 | 3.11 |
| 42 The Income Fund of America / Prospectus |
| Income (loss) from investment operations1 | Dividends and distributions | |||||||||||
| Net asset value, beginning of period |
Net investment income2 |
Net gains (losses) on securities (both realized and unrealized) |
Total from investment operations |
Dividends (from net investment income) |
Distributions (from capital gains) |
Total
dividends and distributions |
Net asset value, end of period |
Total
return3 |
Net assets, end of period (in millions) |
Ratio of expenses to average net assets2 |
Ratio of net income to average net assets2 | |
| Class R-2: | ||||||||||||
| Six months ended 1/31/20174,5 | $21.47 | $.22 | $ .27 | $ .49 | $(.25) | $ — | $(.25) | $21.71 | 2.33%6 | $ 555 | 1.41%7 | 2.01%7 |
| Year ended 7/31/2016 | 21.09 | .49 | .75 | 1.24 | (.49) | (.37) | (.86) | 21.47 | 6.25 | 577 | 1.36 | 2.41 |
| Year ended 7/31/2015 | 21.23 | .52 | (.04) | .48 | (.62) | — | (.62) | 21.09 | 2.24 | 599 | 1.32 | 2.42 |
| Year ended 7/31/2014 | 19.45 | .60 | 1.68 | 2.28 | (.50) | — | (.50) | 21.23 | 11.85 | 635 | 1.37 | 2.95 |
| Year ended 7/31/2013 | 17.49 | .52 | 1.98 | 2.50 | (.54) | — | (.54) | 19.45 | 14.47 | 609 | 1.36 | 2.80 |
| Year ended 7/31/2012 | 16.82 | .52 | .71 | 1.23 | (.56) | — | (.56) | 17.49 | 7.52 | 567 | 1.40 | 3.11 |
| Class R-2E: | ||||||||||||
| Six months ended 1/31/20174,5 | 21.66 | .24 | .29 | .53 | (.29) | — | (.29) | 21.90 | 2.486 | 14 | 1.117 | 2.207 |
| Year ended 7/31/2016 | 21.29 | .58 | .75 | 1.33 | (.59) | (.37) | (.96) | 21.66 | 6.64 | 7 | 1.03 | 2.86 |
| Period from 8/29/2014 to 7/31/20154,12 | 21.98 | .54 | (.47) | .07 | (.76) | — | (.76) | 21.29 | .286,13 | —10 | .967,13 | 2.737,13 |
| Class R-3: | ||||||||||||
| Six months ended 1/31/20174,5 | 21.62 | .27 | .27 | .54 | (.30) | — | (.30) | 21.86 | 2.546 | 1,189 | .967 | 2.467 |
| Year ended 7/31/2016 | 21.23 | .59 | .75 | 1.34 | (.58) | (.37) | (.95) | 21.62 | 6.71 | 1,217 | .92 | 2.85 |
| Year ended 7/31/2015 | 21.37 | .61 | (.04) | .57 | (.71) | — | (.71) | 21.23 | 2.65 | 1,275 | .92 | 2.83 |
| Year ended 7/31/2014 | 19.57 | .69 | 1.69 | 2.38 | (.58) | — | (.58) | 21.37 | 12.35 | 1,357 | .94 | 3.38 |
| Year ended 7/31/2013 | 17.60 | .60 | 1.98 | 2.58 | (.61) | — | (.61) | 19.57 | 14.91 | 1,323 | .94 | 3.22 |
| Year ended 7/31/2012 | 16.92 | .60 | .72 | 1.32 | (.64) | — | (.64) | 17.60 | 8.01 | 1,204 | .96 | 3.55 |
| Class R-4: | ||||||||||||
| Six months ended 1/31/20174,5 | 21.67 | .30 | .27 | .57 | (.33) | — | (.33) | 21.91 | 2.696 | 1,215 | .647 | 2.777 |
| Year ended 7/31/2016 | 21.27 | .65 | .76 | 1.41 | (.64) | (.37) | (1.01) | 21.67 | 7.07 | 1,189 | .62 | 3.15 |
| Year ended 7/31/2015 | 21.42 | .68 | (.06) | .62 | (.77) | — | (.77) | 21.27 | 2.90 | 1,203 | .62 | 3.12 |
| Year ended 7/31/2014 | 19.61 | .76 | 1.70 | 2.46 | (.65) | — | (.65) | 21.42 | 12.71 | 1,192 | .64 | 3.67 |
| Year ended 7/31/2013 | 17.63 | .66 | 1.99 | 2.65 | (.67) | — | (.67) | 19.61 | 15.29 | 1,045 | .64 | 3.52 |
| Year ended 7/31/2012 | 16.95 | .65 | .72 | 1.37 | (.69) | — | (.69) | 17.63 | 8.33 | 880 | .65 | 3.86 |
| (The Financial Highlights table continues on the following page.) | ||||||||||||
| The Income Fund of America / Prospectus 43 |
| Income (loss) from investment operations1 | Dividends and distributions | |||||||||||
| Net asset value, beginning of period |
Net investment income2 |
Net gains (losses) on securities (both realized and unrealized) |
Total from investment operations |
Dividends (from net investment income) |
Distributions (from capital gains) |
Total
dividends and distributions |
Net asset value, end of period |
Total
return3 |
Net assets, end of period (in millions) |
Ratio of expenses to average net assets2 |
Ratio of net income to average net assets2 | |
| Class R-5E: | ||||||||||||
| Six months ended 1/31/20174,5 | $21.69 | $.29 | $ .30 | $ .59 | $(.34) | $ — | $ (.34) | $21.94 | 2.78%6 | $ —10 | .56%7 | 2.70%7 |
| Period from 11/20/2015 to 7/31/20164,14 | 21.03 | .47 | 1.07 | 1.54 | (.51) | (.37) | (.88) | 21.69 | 7.706 | —10 | .487 | 3.307 |
| Class R-5: | ||||||||||||
| Six months ended 1/31/20174,5 | 21.70 | .33 | .29 | .62 | (.37) | — | (.37) | 21.95 | 2.896 | 557 | .337 | 3.077 |
| Year ended 7/31/2016 | 21.31 | .71 | .76 | 1.47 | (.71) | (.37) | (1.08) | 21.70 | 7.34 | 516 | .33 | 3.46 |
| Year ended 7/31/2015 | 21.45 | .74 | (.04) | .70 | (.84) | — | (.84) | 21.31 | 3.25 | 658 | .32 | 3.41 |
| Year ended 7/31/2014 | 19.64 | .82 | 1.70 | 2.52 | (.71) | — | (.71) | 21.45 | 13.03 | 567 | .34 | 3.98 |
| Year ended 7/31/2013 | 17.66 | .71 | 1.99 | 2.70 | (.72) | — | (.72) | 19.64 | 15.60 | 525 | .34 | 3.83 |
| Year ended 7/31/2012 | 16.97 | .70 | .73 | 1.43 | (.74) | — | (.74) | 17.66 | 8.70 | 462 | .35 | 4.17 |
| Class R-6: | ||||||||||||
| Six months ended 1/31/20174,5 | 21.71 | .34 | .28 | .62 | (.37) | — | (.37) | 21.96 | 2.916 | 5,331 | .277 | 3.127 |
| Year ended 7/31/2016 | 21.32 | .72 | .76 | 1.48 | (.72) | (.37) | (1.09) | 21.71 | 7.39 | 4,606 | .28 | 3.49 |
| Year ended 7/31/2015 | 21.46 | .75 | (.04) | .71 | (.85) | — | (.85) | 21.32 | 3.30 | 3,176 | .28 | 3.45 |
| Year ended 7/31/2014 | 19.65 | .83 | 1.70 | 2.53 | (.72) | — | (.72) | 21.46 | 13.08 | 2,566 | .29 | 4.03 |
| Year ended 7/31/2013 | 17.66 | .72 | 2.00 | 2.72 | (.73) | — | (.73) | 19.65 | 15.72 | 1,631 | .29 | 3.85 |
| Year ended 7/31/2012 | 16.98 | .71 | .72 | 1.43 | (.75) | — | (.75) | 17.66 | 8.69 | 1,025 | .30 | 4.21 |
| 44 The Income Fund of America / Prospectus |
| Year ended July 31 | ||||||||
| Portfolio turnover rate for all share classes | Six
months ended January 31, 20174,5,6 |
2016 | 2015 | 2014 | 2013 | 2012 | ||
| Including mortgage dollar roll transactions | 19% | 52% | 45% | 39% | 47% | 41% | ||
| Excluding mortgage dollar roll transactions | 15% | 39% | 32% | Not available | ||||
1 Based on average shares outstanding.
2 For the year ended July 31, 2014, this column reflects the impact of a corporate action event that resulted in a one-time increase to net investment income. If the corporate action event had not occurred, the Class A net investment income per share would have been lower by $.11; the Class A ratio of expenses to average net assets would have been lower by .01 percentage points; and the Class A ratio of net income to average net assets would have been lower by .51 percentage points. The impact to the other share classes would have been similar.
3 Total returns exclude any applicable sales charges, including contingent deferred sales charges.
4 Based on operations for the period shown and, accordingly, is not representative of a full year.
5 Unaudited.
6 Not annualized.
7 Annualized.
8 Class F-3 shares were offered beginning January 27, 2017.
9 Amount less than $.01.
10 Amount less than $1 million.
11 Amount less than .01%.
12 Class R-2E shares were offered beginning August 29, 2014.
13 All or a significant portion of assets in this class consisted of seed capital invested by Capital Research and Management Company and/or its affiliates. Fees for distribution services are not charged or accrued on these seed capital assets. If such fees were paid by the fund on seed capital assets, fund expenses would have been higher and net income and total return would have been lower.
14 Class R-5E shares were offered beginning November 20, 2015.
| The Income Fund of America / Prospectus 45 |
| For shareholder services | American
Funds Service Company (800) 421-4225 |
||
| For retirement plan services | Call your employer or plan administrator | ||
| For 529 plans | American
Funds Service Company (800) 421-4225, ext. 529 |
||
| For 24-hour information | American
FundsLine (800) 325-3590 americanfunds.com For Class R share information, visit AmericanFundsRetirement.com |
||
| Telephone calls you have with American Funds may be monitored or recorded for quality assurance, verification and recordkeeping purposes. By speaking to American Funds on the telephone, you consent to such monitoring and recording. | |||
Multiple translations This prospectus may be translated into other languages. If there is any inconsistency or ambiguity as to the meaning of any word or phrase in a translation, the English text will prevail. Liability is not limited as a result of any material misstatement or omission introduced in the translation.
Annual/Semi-annual report to shareholders The shareholder reports contain additional information about the fund, including financial statements, investment results, portfolio holdings, a discussion of market conditions and the fund’s investment strategies, and the independent registered public accounting firm’s report (in the annual report).
Program description The CollegeAmerica® 529 program description contains additional information about the policies and services related to 529 plan accounts.
Statement of additional information (SAI) and codes of ethics The current SAI, as amended from time to time, contains more detailed information about the fund, including the fund’s financial statements, and is incorporated by reference into this prospectus. This means that the current SAI, for legal purposes, is part of this prospectus. The codes of ethics describe the personal investing policies adopted by the fund, the fund’s investment adviser and its affiliated companies.
The codes of ethics and current SAI are on file with the U.S. Securities and Exchange Commission (SEC). These and other related materials about the fund are available for review or to be copied at the SEC’s Public Reference Room in Washington, D.C., (202) 551-8090, on the EDGAR database on the SEC’s website at sec.gov or, after payment of a duplicating fee, via email request to publicinfo@sec.gov or by writing to the SEC’s Public Reference Section, 100 F Street, NE, Washington, D.C. 20549-1520. The codes of ethics, current SAI and shareholder reports are also available, free of charge, on our website, americanfunds.com.
E-delivery and household mailings Each year you are automatically sent an updated summary prospectus and annual and semi-annual reports for the fund. You may also occasionally receive proxy statements for the fund. In order to reduce the volume of mail you receive, when possible, only one copy of these documents will be sent to shareholders who are part of the same family and share the same household address. You may elect to receive these documents electronically in lieu of paper form by enrolling in e-delivery on our website, americanfunds.com.
If you would like to opt out of household-based mailings or receive a complimentary copy of the current SAI, codes of ethics, annual/semi-annual report to shareholders or applicable program description, please call American Funds Service Company at (800) 421-4225 or write to the secretary of the fund at 6455 Irvine Center Drive, Irvine, California 92618.
Securities Investor Protection Corporation (SIPC) Shareholders may obtain information about SIPC® on its website at sipc.org or by calling (202) 371-8300.
 |
MFGEPRX-006-0517P
Litho in USA CGD/CF/8013 Investment Company File No. 811-01880 |
THE FUND MAKES AVAILABLE A SPANISH TRANSLATION OF THE ABOVE PROSPECTUS IN CONNECTION WITH THE PUBLIC OFFERING AND SALE OF ITS SHARES. THE ENGLISH LANGUAGE PROSPECTUS ABOVE IS A FAIR AND ACCURATE REPRESENTATION OF THE SPANISH EQUIVALENT.
| /s/ | MICHAEL W. STOCKTON |
| MICHAEL W. STOCKTON | |
| SECRETARY |
The Income Fund of America®
Part B
Statement of Additional Information
April 7, 2017
This document is not a prospectus but should be read in conjunction with the current prospectus of The Income Fund of America (the “fund”) dated April 7, 2017. You may obtain a prospectus from your financial advisor, by calling American Funds Service Company® at (800) 421-4225 or by writing to the fund at the following address:
The
Income Fund of America
Attention: Secretary
6455
Irvine Center Drive
Irvine, California 92618
Certain privileges and/or services described below may not be available to all shareholders (including shareholders who purchase shares at net asset value through eligible retirement plans) depending on the shareholder’s investment dealer or retirement plan recordkeeper. Please see your financial advisor, investment dealer, plan recordkeeper or employer for more information.
| Class A | AMECX | Class 529-A | CIMAX | Class R-1 | RIDAX |
| Class C | IFACX | Class 529-C | CIMCX | Class R-2 | RIDBX |
| Class T | TIAFX | Class 529-E | CIMEX | Class R-2E | RIEBX |
| Class F-1 | IFAFX | Class 529-T | TFAAX | Class R-3 | RIDCX |
| Class F-2 | AMEFX | Class 529-F-1 | CIMFX | Class R-4 | RIDEX |
| Class F-3 | FIFAX | Class R-5E | RIDHX | ||
| Class R-5 | RIDFX | ||||
| Class R-6 | RIDGX |
Table of Contents
| Item | Page no. |
| Certain investment limitations and guidelines | 2 |
| Description of certain securities, investment techniques and risks | 3 |
| Fund policies | 21 |
| Management of the fund | 23 |
| Execution of portfolio transactions | 51 |
| Disclosure of portfolio holdings | 54 |
| Price of shares | 56 |
| Taxes and distributions | 59 |
| Purchase and exchange of shares | 62 |
| Sales charges | 67 |
| Sales charge reductions and waivers | 70 |
| Selling shares | 75 |
| Shareholder account services and privileges | 76 |
| General information | 79 |
| Appendix | 88 |
Investment
portfolio
Financial statements
The Income Fund of America — Page 1
Certain investment limitations and guidelines
The following limitations and guidelines are considered at the time of purchase, under normal circumstances, and are based on a percentage of the fund’s net assets unless otherwise noted. This summary is not intended to reflect all of the fund’s investment limitations.
Income-producing securities
· The fund will invest at least 65% of its assets in income-producing securities.
Equity securities
· The fund will generally invest at least 60% of its assets in equity securities. However, the composition of the fund’s investments in equity, debt and cash or money market instruments may vary substantially depending on various factors, including market conditions. At times the fund may be substantially invested in equity or debt securities (i.e., more than 60%) or may be solely invested in equity or debt securities (i.e., 100%).
Debt instruments
· The fund may invest up to 20% of its assets in straight debt securities (i.e., debt securities that do not have equity conversion or purchase rights) rated BB+ or below and Ba1 or below by Nationally Recognized Statistical Rating Organizations designated by the fund’s investment adviser or unrated but determined to be of equivalent quality by the fund’s investment adviser. The fund currently intends to look to the ratings from Moody’s Investors Service, Standard & Poor’s Ratings Services and Fitch Ratings. If rating agencies differ, securities will be considered to have received the highest of these ratings, consistent with the fund's investment policies.
Investing outside the U.S.
· The fund may invest up to 25% of its assets in equity securities of issuers domiciled outside the United States.
· The fund may invest up to 10% of its assets in debt securities of issuers domiciled outside the United States (must be U.S. dollar denominated).
· In determining the domicile of an issuer, the fund’s investment adviser will consider the domicile determination of a leading provider of global indexes, such as Morgan Stanley Capital International, and may also take into account such factors as where the issuer’s securities are listed and where the issuer is legally organized, maintains principal corporate offices, conducts its principal operations and/or generates revenues.
* * * * * *
The fund may experience difficulty liquidating certain portfolio securities during significant market declines or periods of heavy redemptions.
The Income Fund of America — Page 2
Description of certain securities, investment techniques and risks
The descriptions below are intended to supplement the material in the prospectus under “Investment objectives, strategies and risks.”
Equity securities — Equity securities represent an ownership position in a company. Equity securities held by the fund typically consist of common stocks and may also include securities with equity conversion or purchase rights. The prices of equity securities fluctuate based on, among other things, events specific to their issuers and market, economic and other conditions. For example, prices of these securities can be affected by financial contracts held by the issuer or third parties (such as derivatives) relating to the security or other assets or indices. Holders of equity securities are not creditors of the issuer. If an issuer liquidates, holders of equity securities are entitled to their pro rata share of the issuer’s assets, if any, after creditors (including the holders of fixed income securities and senior equity securities) are paid.
There may be little trading in the secondary market for particular equity securities, which may adversely affect the fund’s ability to value accurately or dispose of such equity securities. Adverse publicity and investor perceptions, whether or not based on fundamental analysis, may decrease the value and/or liquidity of equity securities.
Investing in smaller capitalization stocks — The fund may invest in the stocks of smaller capitalization companies (typically companies with market capitalizations of $4.0 billion and below at the time of purchase). Investing in smaller capitalization stocks can involve greater risk than is customarily associated with investing in stocks of larger, more established companies. For example, smaller companies often have limited product lines, limited operating histories, limited markets or financial resources, may be dependent on one or a few key persons for management and can be more susceptible to losses. Also, their securities may be thinly traded (and therefore have to be sold at a discount from current prices or sold in small lots over an extended period of time), may be followed by fewer investment research analysts and may be subject to wider price swings, thus creating a greater chance of loss than securities of larger capitalization companies.
Debt instruments — Debt securities, also known as “fixed-income securities,” are used by issuers to borrow money. Bonds, notes, debentures, asset-backed securities (including those backed by mortgages), and loan participations and assignments are common types of debt securities. Generally, issuers pay investors periodic interest and repay the amount borrowed either periodically during the life of the security and/or at maturity. Some debt securities, such as zero coupon bonds, do not pay current interest, but are purchased at a discount from their face values and their values accrete over time to face value at maturity. Some debt securities bear interest at rates that are not fixed, but that vary with changes in specified market rates or indices. The market prices of debt securities fluctuate depending on such factors as interest rates, credit quality and maturity. In general, market prices of debt securities decline when interest rates rise and increase when interest rates fall. These fluctuations will generally be greater for longer-term debt securities than for shorter-term debt securities. Prices of these securities can also be affected by financial contracts held by the issuer or third parties (such as derivatives) relating to the security or other assets or indices.
Lower rated debt securities, rated Ba1/BB+ or below by Nationally Recognized Statistical Rating Organizations, are described by the rating agencies as speculative and involve greater risk of default or price changes due to changes in the issuer’s creditworthiness than higher rated debt securities, or they may already be in default. Such securities are sometimes referred to as “junk bonds” or high yield bonds. The market prices of these securities may fluctuate more than higher quality securities and may decline significantly in periods of general economic difficulty. It may be more difficult to dispose of, and to determine the value of, lower rated debt securities. Investment grade bonds in the ratings
The Income Fund of America — Page 3
categories A or Baa/BBB also may be more susceptible to changes in market or economic conditions than bonds rated in the highest rating categories.
Certain additional risk factors relating to debt securities are discussed below:
Sensitivity to interest rate and economic changes — Debt securities may be sensitive to economic changes, political and corporate developments, and interest rate changes. In addition, during an economic downturn or a period of rising interest rates, issuers that are highly leveraged may experience increased financial stress that could adversely affect their ability to meet projected business goals, to obtain additional financing and to service their principal and interest payment obligations. Periods of economic change and uncertainty also can be expected to result in increased volatility of market prices and yields of certain debt securities and derivative instruments. For example, during the financial crisis of 2007-2009, the Federal Reserve implemented a number of economic policies that impacted, and may continue to impact, interest rates and the market. These policies, as well as potential actions by governmental entities both in and outside of the U.S., may expose fixed-income markets to heightened volatility and may reduce liquidity for certain investments, which could cause the value of the fund’s portfolio to decline.
Payment expectations — Debt securities may contain redemption or call provisions. If an issuer exercises these provisions in a lower interest rate market, the fund may have to replace the security with a lower yielding security, resulting in decreased income to investors. If the issuer of a debt security defaults on its obligations to pay interest or principal or is the subject of bankruptcy proceedings, the fund may incur losses or expenses in seeking recovery of amounts owed to it.
Liquidity and valuation — There may be little trading in the secondary market for particular debt securities, which may affect adversely the fund’s ability to value accurately or dispose of such debt securities. Adverse publicity and investor perceptions, whether or not based on fundamental analysis, may decrease the value and/or liquidity of debt securities.
The investment adviser attempts to reduce the risks described above through diversification of the fund’s portfolio and by credit analysis of each issuer, as well as by monitoring broad economic trends and corporate and legislative developments, but there can be no assurance that it will be successful in doing so.
Credit ratings for debt securities provided by rating agencies reflect an evaluation of the safety of principal and interest payments, not market value risk. The rating of an issuer is a rating agency’s view of past and future potential developments related to the issuer and may not necessarily reflect actual outcomes. There can be a lag between the time of developments relating to an issuer and the time a rating is assigned and updated. The investment adviser considers these ratings of securities as one of many criteria in making its investment decisions.
Bond rating agencies may assign modifiers (such as +/–) to ratings categories to signify the relative position of a credit within the rating category. Investment policies that are based on ratings categories should be read to include any security within that category, without giving consideration to the modifier except where otherwise provided. See the Appendix to this statement of additional information for more information about credit ratings.
The Income Fund of America — Page 4
Securities with equity and debt characteristics — Certain securities have a combination of equity and debt characteristics. Such securities may at times behave more like equity than debt or vice versa.
Preferred stock — Preferred stock represents an equity interest in an issuer that generally entitles the holder to receive, in preference to common stockholders and the holders of certain other stocks, dividends and a fixed share of the proceeds resulting from a liquidation of the issuer. Preferred stocks may pay fixed or adjustable rates of return, and preferred stock dividends may be cumulative or non-cumulative and participating or non-participating. Cumulative dividend provisions require all or a portion of prior unpaid dividends to be paid before dividends can be paid to the issuer’s common stockholders, while prior unpaid dividends on non-cumulative preferred stock are forfeited. Participating preferred stock may be entitled to a dividend exceeding the issuer’s declared dividend in certain cases, while non-participating preferred stock is entitled only to the stipulated dividend. Preferred stock is subject to issuer-specific and market risks applicable generally to equity securities. As with debt securities, the prices and yields of preferred stocks often move with changes in interest rates and the issuer’s credit quality. Additionally, a company’s preferred stock typically pays dividends only after the company makes required payments to holders of its bonds and other debt. Accordingly, the price of preferred stock will usually react more strongly than bonds and other debt to actual or perceived changes in the issuing company’s financial condition or prospects. Preferred stock of smaller companies may be more vulnerable to adverse developments than preferred stock of larger companies.
Convertible securities — A convertible security is a debt obligation, preferred stock or other security that may be converted, within a specified period of time and at a stated conversion rate, into common stock or other equity securities of the same or a different issuer. The conversion may occur automatically upon the occurrence of a predetermined event or at the option of either the issuer or the security holder. Under certain circumstances, a convertible security may also be called for redemption or conversion by the issuer after a particular date and at predetermined price specified upon issue. If a convertible security held by the fund is called for redemption or conversion, the fund could be required to tender the security for redemption, convert it into the underlying common stock, or sell it to a third party.
The holder of a convertible security is generally entitled to participate in the capital appreciation resulting from a market price increase in the issuer’s common stock and to receive interest paid or accrued until the convertible security matures or is redeemed, converted or exchanged. Before conversion, convertible securities have characteristics similar to non-convertible debt or preferred securities, as applicable. Convertible securities rank senior to common stock in an issuer’s capital structure and, therefore, normally entail less risk than the issuer’s common stock. However, convertible securities may also be subordinate to any senior debt obligations of the issuer, and, therefore, an issuer’s convertible securities may entail more risk than such senior debt obligations. Convertible securities usually offer lower interest or dividend yields than non-convertible debt securities of similar credit quality because of the potential for capital appreciation. In addition, convertible securities are often lower-rated securities.
Because of the conversion feature, the price of a convertible security will normally fluctuate in some proportion to changes in the price of the underlying asset, and, accordingly, convertible securities are subject to risks relating to the activities of the issuer and/or general market and economic conditions. The income component of a convertible security may cushion the security against declines in the price of the underlying asset but may also cause the price of the security to fluctuate based upon changes in interest rates and the credit quality of the issuer. As with a straight fixed-income security, the price of a convertible security tends to increase when interest rates decline and decrease when interest rates rise. Like the price of a common
The Income Fund of America — Page 5
stock, the price of a convertible security also tends to increase as the price of the underlying stock rises and to decrease as the price of the underlying stock declines.
Hybrid securities — A hybrid security is a type of security that also has equity and debt characteristics. Like equities, which have no final maturity, a hybrid security may be perpetual. On the other hand, like debt securities, a hybrid security may be callable at the option of the issuer on a date specified at issue. Additionally, like common equities, which may stop paying dividends at virtually any time without violating any contractual terms or conditions, hybrids typically allow for issuers to withhold payment of interest until a later date or to suspend coupon payments entirely without triggering an event of default. Hybrid securities are normally at the bottom of an issuer’s debt capital structure because holders of an issuer’s hybrid securities are structurally subordinated to the issuer’s senior creditors. In bankruptcy, hybrid security holders should only get paid after all senior creditors of the issuer have been paid but before any disbursements are made to the issuer’s equity holders. Accordingly, hybrid securities may be more sensitive to economic changes than more senior debt securities. Such securities may also be viewed as more equity-like by the market when the issuer or its parent company experiences financial difficulties.
Contingent convertible securities, which are also known as contingent capital securities, are a form of hybrid security that are intended to either convert into equity or have their principal written down upon the occurrence of certain trigger events. One type of contingent convertible security has characteristics designed to absorb losses, by providing that the liquidation value of the security may be adjusted downward to below the original par value or written off entirely under certain circumstances. For instance, if losses have eroded the issuer’s capital level below a specified threshold, the liquidation value of the security may be reduced in whole or in part. The write-down of the security’s par value may occur automatically and would not entitle holders to institute bankruptcy proceedings against the issuer. In addition, an automatic write-down could result in a reduced income rate if the dividend or interest payment associated with the security is based on the security’s par value. Such securities may, but are not required to, provide for circumstances under which the liquidation value of the security may be adjusted back up to par, such as an improvement in capitalization or earnings. Another type of contingent convertible security provides for mandatory conversion of the security into common shares of the issuer under certain circumstances. The mandatory conversion might relate, for example, to the issuer’s failure to maintain a capital minimum. Since the common stock of the issuer may not pay a dividend, investors in such instruments could experience reduced yields (or no yields at all) and conversion would deepen the subordination of the investor, effectively worsening the investor’s standing in the case of the issuer’s insolvency. An automatic write-down or conversion event with respect to a contingent convertible security will typically be triggered by a reduction in the issuer’s capital level, but may also be triggered by regulatory actions, such as a change in regulatory capital requirements, or by other factors.
Investing outside the U.S. — Securities of issuers domiciled outside the United States, or with significant operations or revenues outside the United States, may lose value because of adverse political, social, economic or market developments (including social instability, regional conflicts, terrorism and war) in the countries or regions in which the issuers are domiciled, operate or generate revenue. These issuers may also be more susceptible to actions of foreign governments such as the imposition of price controls or punitive taxes that could adversely impact the value of these securities. To the extent the fund invests in securities that are denominated in currencies other than the U.S. dollar, these securities may also lose value due to changes in foreign currency exchange rates against the U.S. dollar and/or currencies of other countries. Securities markets in certain countries may be more volatile or less liquid than those in the United States. Investments outside the United States may also be subject to different accounting practices and different regulatory, legal and reporting standards, and may be more difficult to value, than those in the United States. In addition, the value of investments outside the United States may be reduced by foreign taxes, including foreign withholding taxes on interest and dividends.
The Income Fund of America — Page 6
Further, there may be increased risks of delayed settlement of securities purchased or sold by the fund. The risks of investing outside the United States may be heightened in connection with investments in emerging markets.
Additional costs could be incurred in connection with the fund’s investment activities outside the United States. Brokerage commissions may be higher outside the United States, and the fund will bear certain expenses in connection with its currency transactions. Furthermore, increased custodian costs may be associated with maintaining assets in certain jurisdictions.
Investing in emerging markets — Investing in emerging markets may involve risks in addition to and greater than those generally associated with investing in the securities markets of developed countries. For instance, developing countries may have less developed legal and accounting systems than those in developed countries. The governments of these countries may be less stable and more likely to impose capital controls, nationalize a company or industry, place restrictions on foreign ownership and on withdrawing sale proceeds of securities from the country, and/or impose punitive taxes that could adversely affect the prices of securities. In addition, the economies of these countries may be dependent on relatively few industries that are more susceptible to local and global changes. Securities markets in these countries can also be relatively small and have substantially lower trading volumes. As a result, securities issued in these countries may be more volatile and less liquid, and may be more difficult to value, than securities issued in countries with more developed economies and/or markets. Additionally, there may be increased settlement risks for transactions in local securities.
Although there is no universally accepted definition, the investment adviser generally considers an emerging market to be a market that is in the earlier stages of its industrialization cycle with a low per capita gross domestic product (“GDP”) and a low market capitalization to GDP ratio relative to those in the United States and the European Union, and would include markets commonly referred to as “frontier markets.”
Certain risk factors related to emerging markets
Currency fluctuations — Certain emerging markets’ currencies have experienced and in the future may experience significant declines against the U.S. dollar. For example, if the U.S. dollar appreciates against foreign currencies, the value of the fund’s emerging markets securities holdings would generally depreciate and vice versa. Further, the fund may lose money due to losses and other expenses incurred in converting various currencies to purchase and sell securities valued in currencies other than the U.S. dollar, as well as from currency restrictions, exchange control regulation and currency devaluations.
Government regulation — Certain developing countries lack uniform accounting, auditing and financial reporting and disclosure standards, have less governmental supervision of financial markets than in the United States, and do not honor legal rights enjoyed in the United States. Certain governments may be more unstable and present greater risks of nationalization or restrictions on foreign ownership of local companies. Repatriation of investment income, capital and the proceeds of sales by foreign investors may require governmental registration and/or approval in some developing countries. While the fund will only invest in markets where these restrictions are considered acceptable by the investment adviser, a country could impose new or additional repatriation restrictions after the fund’s investment. If this happened, the fund’s response might include, among other things, applying to the appropriate authorities for a waiver of the restrictions or engaging in transactions in other markets designed to offset the risks of decline in that country. Such restrictions will be considered in relation to the fund’s liquidity needs and other factors. Further, some attractive equity securities may not be available to the fund if foreign shareholders already hold the maximum amount legally permissible.
The Income Fund of America — Page 7
While government involvement in the private sector varies in degree among developing countries, such involvement may in some cases include government ownership of companies in certain sectors, wage and price controls or imposition of trade barriers and other protectionist measures. With respect to any developing country, there is no guarantee that some future economic or political crisis will not lead to price controls, forced mergers of companies, expropriation, or creation of government monopolies to the possible detriment of the fund’s investments.
Fluctuations in inflation rates — Rapid fluctuations in inflation rates may have negative impacts on the economies and securities markets of certain emerging market countries.
Less developed securities markets — Emerging markets may be less well-developed than other markets. These markets have lower trading volumes than the securities markets of more developed countries and may be unable to respond effectively to increases in trading volume. Consequently, these markets may be substantially less liquid than those of more developed countries, and the securities of issuers located in these markets may have limited marketability. These factors may make prompt liquidation of substantial portfolio holdings difficult or impossible at times.
Settlement risks — Settlement systems in developing countries are generally less well organized than those of developed markets. Supervisory authorities may also be unable to apply standards comparable to those in developed markets. Thus, there may be risks that settlement may be delayed and that cash or securities belonging to the fund may be in jeopardy because of failures of or defects in the systems. In particular, market practice may require that payment be made before receipt of the security being purchased or that delivery of a security be made before payment is received. In such cases, default by a broker or bank (the “counterparty”) through whom the transaction is effected might cause the fund to suffer a loss. The fund will seek, where possible, to use counterparties whose financial status is such that this risk is reduced. However, there can be no certainty that the fund will be successful in eliminating this risk, particularly as counterparties operating in developing countries frequently lack the standing or financial resources of those in developed countries. There may also be a danger that, because of uncertainties in the operation of settlement systems in individual markets, competing claims may arise with respect to securities held by or to be transferred to the fund.
Insufficient market information — The fund may encounter problems assessing investment opportunities in certain emerging markets in light of limitations on available information and different accounting, auditing and financial reporting standards. In such circumstances, the fund’s investment adviser will seek alternative sources of information, and to the extent the investment adviser is not satisfied with the sufficiency of the information obtained with respect to a particular market or security, the fund will not invest in such market or security.
Taxation — Taxation of dividends, interest and capital gains received by the fund varies among developing countries and, in some cases, is comparatively high. In addition, developing countries typically have less well-defined tax laws and procedures and such laws may permit retroactive taxation so that the fund could become subject in the future to local tax liability that it had not reasonably anticipated in conducting its investment activities or valuing its assets.
Litigation — The fund and its shareholders may encounter substantial difficulties in obtaining and enforcing judgments against individuals residing outside of the U.S. and companies domiciled outside of the U.S.
The Income Fund of America — Page 8
Fraudulent securities — Securities purchased by the fund may subsequently be found to be fraudulent or counterfeit, resulting in a loss to the fund.
Synthetic local access instruments — Participation notes, market access warrants and other similar structured investment vehicles (collectively, “synthetic local access instruments”) are instruments used by investors to obtain exposure to equity investments in local markets where direct ownership by foreign investors is not permitted or is otherwise restricted by local law. Synthetic local access instruments, which are generally structured and sold over-the-counter by a local branch of a bank or broker-dealer that is permitted to purchase equity securities in the local market, are designed to replicate exposure to one or more underlying equity securities. The price and performance of a synthetic local access instrument are normally intended to track the price and performance of the underlying equity assets as closely as possible. However, there can be no assurance that the results of synthetic local access instruments will replicate exactly the performance of the underlying securities due to transaction costs, taxes and other fees and expenses. The holder of a synthetic local access instrument may also be entitled to receive any dividends paid in connection with the underlying equity assets, but usually does not receive voting rights as it would if such holder directly owned the underlying assets.
Investments in synthetic local access instruments involve the same risks associated with a direct investment in the shares of the companies the instruments seek to replicate, including, in particular, the risks associated with investing outside the United States. Synthetic local access instruments also involve risks that are in addition to the risks normally associated with a direct investment in the underlying equity securities. For instance, synthetic local access instruments represent unsecured, unsubordinated contractual obligations of the banks or broker-dealers that issue them. Consequently, a purchaser of a synthetic local access instrument relies on the creditworthiness of such a bank or broker-dealer counterparty and has no rights under the instrument against the issuer of the underlying equity securities. Additionally, there is no guarantee that a liquid market for a synthetic local access instrument will exist or that the issuer of the instrument will be willing to repurchase the instrument when an investor wishes to sell it.
Depositary receipts — Depositary receipts are securities that evidence ownership interests in, and represent the right to receive, a security or a pool of securities that have been deposited with a bank or trust depository. The fund may invest in American Depositary Receipts (“ADRs”), European Depositary Receipts (“EDRs”), Global Depositary Receipts (“GDRs”), and other similar securities. For ADRs, the depository is typically a U.S. financial institution and the underlying securities are issued by a non-U.S. entity. For other depositary receipts, the depository may be a non-U.S. or a U.S. entity, and the underlying securities may be issued by a non-U.S. or a U.S. entity. Depositary receipts will not necessarily be denominated in the same currency as their underlying securities. Generally, ADRs are issued in registered form, denominated in U.S. dollars, and designed for use in the U.S. securities markets. Other depositary receipts, such as EDRs and GDRs, may be issued in bearer form, may be denominated in either U.S. dollars or in non-U.S. currencies, and are primarily designed for use in securities markets outside the United States. ADRs, EDRs and GDRs can be sponsored by the issuing bank or trust company or the issuer of the underlying securities. Although the issuing bank or trust company may impose charges for the collection of dividends and the conversion of such securities into the underlying securities, generally no fees are imposed on the purchase or sale of these securities other than transaction fees ordinarily involved with trading stock. Such securities may be less liquid or may trade at a lower price than the underlying securities of the issuer. Additionally, the issuers of securities underlying depositary receipts may not be obligated to timely disclose information that is considered material under the securities laws of the United States. Therefore, less information may be available regarding these issuers than about the issuers of other securities and there may not be a correlation between such information and the market value of the depositary receipts.
The Income Fund of America — Page 9
Currency transactions — The fund may enter into currency transactions to provide for the purchase or sale of a currency needed to purchase a security denominated in that currency (often referred to as a spot or cover transaction). In addition, the fund may enter into forward currency contracts to protect against changes in currency exchange rates. The fund may also enter into forward currency contracts to seek to increase total return. A forward currency contract is an obligation to purchase or sell a specific currency at a future date, which may be any fixed number of days from the date of the contract agreed upon by the parties, at a price set at the time of the contract. Although forward contracts entered into by the fund will typically involve the purchase or sale of a currency against the U.S. dollar, the fund also may purchase or sell one currency against another currency (other than the U.S. dollar).
Currency exchange rates generally are determined by forces of supply and demand in the foreign exchange markets and the relative merits of investment in different countries as viewed from an international perspective. Currency exchange rates can also be affected unpredictably by intervention by U.S. or foreign governments or central banks or by currency controls or political developments in the United States or abroad.
Generally, the fund will not attempt to protect against all potential changes in exchange rates and the use of forward contracts does not eliminate the risk of fluctuations in the prices of the underlying securities. If the value of the underlying securities declines or the amount of the fund’s commitment increases because of changes in exchange rates, the fund may need to provide additional cash or securities to satisfy its commitment under the forward contract. The fund is also subject to the risk that it may be delayed or prevented from obtaining payments owed to it under the forward contract as a result of the insolvency or bankruptcy of the counterparty with which it entered into the forward contract or the failure of the counterparty to comply with the terms of the contract.
While entering into forward currency transactions could minimize the risk of loss due to a decline in the value of the hedged currency, it could also limit any potential gain that may result from an increase in the value of the currency. In addition, the fund may use foreign currency contracts in order to increase exposure to a certain currency or to shift exposure to currency fluctuations from one currency to another. Entering into forward currency transactions may change the fund’s exposure to currency exchange rates and could result in losses to the fund if currencies do not perform as expected by the fund’s investment adviser. For example, if the fund’s investment adviser increases the fund’s exposure to a foreign currency using forward contracts and that foreign currency’s value declines, the fund may incur a loss. Forward currency contracts may give rise to leverage, or exposure to potential gains and losses in excess of the initial amount invested. Leverage magnifies gains and losses and could cause the fund to be subject to more volatility than if it had not been leveraged, thereby resulting in a heightened risk of loss. The fund will segregate liquid assets that will be marked to market daily to meet its forward contract commitments to the extent required by the U.S. Securities and Exchange Commission.
Forward currency transactions also may affect the character and timing of income, gain, or loss recognized by the fund for U.S. tax purposes. The use of forward currency contracts could result in the application of the mark-to-market provisions of the Internal Revenue Code and may cause an increase (or decrease) in the amount of taxable dividends paid by the fund.
Obligations backed by the “full faith and credit” of the U.S. government — U.S. government obligations include the following types of securities:
U.S. Treasury securities — U.S. Treasury securities include direct obligations of the U.S. Treasury, such as Treasury bills, notes and bonds. For these securities, the payment of principal and interest is unconditionally guaranteed by the U.S. government, and thus they are of high credit quality. Such securities are subject to variations in market value due to fluctuations in
The Income Fund of America — Page 10
interest rates and in government policies, but, if held to maturity, are expected to be paid in full (either at maturity or thereafter).
Federal agency securities — The securities of certain U.S. government agencies and government-sponsored entities are guaranteed as to the timely payment of principal and interest by the full faith and credit of the U.S. government. Such agencies and entities include, but are not limited to, the Federal Financing Bank (“FFB”), the Government National Mortgage Association (“Ginnie Mae”), the Veterans Administration (“VA”), the Federal Housing Administration (“FHA”), the Export-Import Bank (“Exim Bank”), the Overseas Private Investment Corporation (“OPIC”), the Commodity Credit Corporation (“CCC”) and the Small Business Administration (“SBA”).
Other federal agency obligations — Additional federal agency securities are neither direct obligations of, nor guaranteed by, the U.S. government. These obligations include securities issued by certain U.S. government agencies and government-sponsored entities. However, they generally involve some form of federal sponsorship: some operate under a congressional charter; some are backed by collateral consisting of “full faith and credit” obligations as described above; some are supported by the issuer’s right to borrow from the Treasury; and others are supported only by the credit of the issuing government agency or entity. These agencies and entities include, but are not limited to: the Federal Home Loan Banks, the Federal Home Loan Mortgage Corporation (“Freddie Mac”), the Federal National Mortgage Association (“Fannie Mae”), the Tennessee Valley Authority and the Federal Farm Credit Bank System.
In 2008, Freddie Mac and Fannie Mae were placed into conservatorship by their new regulator, the Federal Housing Finance Agency (“FHFA”). Simultaneously, the U.S. Treasury made a commitment of indefinite duration to maintain the positive net worth of both firms. As conservator, the FHFA has the authority to repudiate any contract either firm has entered into prior to the FHFA’s appointment as conservator (or receiver should either firm go into default) if the FHFA, in its sole discretion determines that performance of the contract is burdensome and repudiation would promote the orderly administration of Fannie Mae’s or Freddie Mac’s affairs. While the FHFA has indicated that it does not intend to repudiate the guaranty obligations of either entity, doing so could adversely affect holders of their mortgage-backed securities. For example, if a contract were repudiated, the liability for any direct compensatory damages would accrue to the entity’s conservatorship estate and could only be satisfied to the extent the estate had available assets. As a result, if interest payments on Fannie Mae or Freddie Mac mortgage-backed securities held by the fund were reduced because underlying borrowers failed to make payments or such payments were not advanced by a loan servicer, the fund’s only recourse might be against the conservatorship estate, which might not have sufficient assets to offset any shortfalls.
The FHFA, in its capacity as conservator, has the power to transfer or sell any asset or liability of Fannie Mae or Freddie Mac. The FHFA has indicated it has no current intention to do this; however, should it do so a holder of a Fannie Mae or Freddie Mac mortgage-backed security would have to rely on another party for satisfaction of the guaranty obligations and would be exposed to the credit risk of that party.
Certain rights provided to holders of mortgage-backed securities issued by Fannie Mae or Freddie Mac under their operative documents may not be enforceable against the FHFA, or enforcement may be delayed during the course of the conservatorship or any future receivership. For example, the operative documents may provide that upon the occurrence of an event of default by Fannie Mae or Freddie Mac, holders of a requisite percentage of the mortgage-backed security may replace the entity as trustee. However, under the Federal Housing Finance Regulatory Reform Act of 2008, holders may not enforce this right if the event of default arises solely because a conservator or receiver has been appointed.
The Income Fund of America — Page 11
Pass-through securities — The fund may invest in various debt obligations backed by pools of mortgages or other assets including, but not limited to, loans on single family residences, home equity loans, mortgages on commercial buildings, credit card receivables and leases on airplanes or other equipment. Principal and interest payments made on the underlying asset pools backing these obligations are typically passed through to investors, net of any fees paid to any insurer or any guarantor of the securities. Pass-through securities may have either fixed or adjustable coupons. These securities include:
Mortgage-backed securities — These securities may be issued by U.S. government agencies and government-sponsored entities, such as Ginnie Mae, Fannie Mae and Freddie Mac, and by private entities. The payment of interest and principal on mortgage-backed obligations issued by U.S. government agencies may be guaranteed by the full faith and credit of the U.S. government (in the case of Ginnie Mae), or may be guaranteed by the issuer (in the case of Fannie Mae and Freddie Mac). However, these guarantees do not apply to the market prices and yields of these securities, which vary with changes in interest rates.
Mortgage-backed securities issued by private entities are structured similarly to those issued by U.S. government agencies. However, these securities and the underlying mortgages are not guaranteed by any government agencies and the underlying mortgages are not subject to the same underwriting requirements. These securities generally are structured with one or more types of credit enhancements such as insurance or letters of credit issued by private companies. Borrowers on the underlying mortgages are usually permitted to prepay their underlying mortgages. Prepayments can alter the effective maturity of these instruments. In addition, delinquencies, losses or defaults by borrowers can adversely affect the prices and volatility of these securities. Such delinquencies and losses can be exacerbated by declining or flattening housing and property values. This, along with other outside pressures, such as bankruptcies and financial difficulties experienced by mortgage loan originators, decreased investor demand for mortgage loans and mortgage-related securities and increased investor demand for yield, can adversely affect the value and liquidity of mortgage-backed securities.
Collateralized mortgage obligations (CMOs) — CMOs are also backed by a pool of mortgages or mortgage loans, which are divided into two or more separate bond issues. CMOs issued by U.S. government agencies are backed by agency mortgages, while privately issued CMOs may be backed by either government agency mortgages or private mortgages. Payments of principal and interest are passed through to each bond issue at varying schedules resulting in bonds with different coupons, effective maturities and sensitivities to interest rates. Some CMOs may be structured in a way that when interest rates change, the impact of changing prepayment rates on the effective maturities of certain issues of these securities is magnified. CMOs may be less liquid or may exhibit greater price volatility than other types of mortgage or asset-backed securities.
Commercial mortgage-backed securities — These securities are backed by mortgages on commercial property, such as hotels, office buildings, retail stores, hospitals and other commercial buildings. These securities may have a lower prepayment uncertainty than other mortgage-related securities because commercial mortgage loans generally prohibit or impose penalties on prepayments of principal. In addition, commercial mortgage-related securities often are structured with some form of credit enhancement to protect against potential losses on the underlying mortgage loans. Many of the risks of investing in commercial mortgage-backed securities reflect the risks of investing in the real estate securing the underlying mortgage loans, including the effects of local and other economic conditions on real estate markets, the ability of tenants to make rental payments and the ability of a property to attract and retain tenants. Commercial mortgage-backed securities may be less liquid or exhibit greater price volatility than other types of mortgage or asset-backed securities and may be more difficult to value.
The Income Fund of America — Page 12
Asset-backed securities — These securities are backed by other assets such as credit card, automobile or consumer loan receivables, retail installment loans or participations in pools of leases. Credit support for these securities may be based on the underlying assets and/or provided through credit enhancements by a third party. The values of these securities are sensitive to changes in the credit quality of the underlying collateral, the credit strength of the credit enhancement, changes in interest rates and at times the financial condition of the issuer. Obligors of the underlying assets also may make prepayments that can change effective maturities of the asset-backed securities. These securities may be less liquid and more difficult to value than other securities.
“IOs” and “POs” are issued in portions or tranches with varying maturities and characteristics. Some tranches may only receive the interest paid on the underlying mortgages (IOs) and others may only receive the principal payments (POs). The values of IOs and POs are extremely sensitive to interest rate fluctuations and prepayment rates, and IOs are also subject to the risk of early repayment of the underlying mortgages that will substantially reduce or eliminate interest payments.
Equity-linked notes — The fund may purchase equity-linked notes to enhance the current income of its portfolio. Equity-linked notes are hybrid instruments that are specially designed to combine the characteristics of one or more reference securities — usually a single stock, a stock index or a basket of stocks — and a related equity derivative, such as a put or call option, in a single note form. For example, an equity-linked note that refers to the stock of an issuer may be the economic equivalent of holding a position in that stock and simultaneously selling a call option on that stock with a strike price greater than the current stock price. The holder of the note would be exposed to decreases in the price of the equity to the same extent as if it held the equity directly. However, if the stock appreciated in value, the noteholder would only benefit from stock price increases up to the strike price (i.e., the point at which the holder of the call option would be expected to exercise its right to buy the underlying stock). Additionally, the terms of an equity-linked note may provide for periodic interest payments to holders at either a fixed or floating rate.
As described in the example above, the return on an equity-linked note is generally tied to the performance of the underlying reference security or securities. In addition to any interest payments made during the term of the note, at maturity, the noteholder usually receives a return of principal based on the capital appreciation of the linked securities. Depending on the terms of the issuance, the maximum principal amount to be repaid on the equity-linked note may be capped. For example, in consideration for greater current income or yield, a noteholder may forego its participation in the capital appreciation of the underlying equity assets above a predetermined price limit. Alternatively, if the linked securities have depreciated in value, or if their price fluctuates outside of a preset range, the noteholder may receive only the principal amount of the note, or may lose the principal invested in the equity-linked note entirely.
The price of an equity-linked note is derived from the value of the underlying linked securities. The level and type of risk involved in the purchase of an equity-linked note by the fund is similar to the risk involved in the purchase of the underlying linked securities. However, the value of an equity-linked note is also dependent on the individual credit of the issuer of the note, which, in the case of an unsecured note, will generally be a major financial institution, and, in the case of a collateralized note, will generally be a trust or other special purpose vehicle or finance subsidiary established by a major financial institution for the limited purpose of issuing the note. An investment in an equity-linked note bears the risk that the issuer of the note will default or become bankrupt. In such an event, the fund may have difficulty being repaid, or may fail to be repaid, the principal amount of, or income from, its investment. Like other structured products, equity-linked notes are frequently secured by collateral consisting of a combination of debt or related equity securities to which payments under the notes are linked. If so secured, the fund would look to this underlying collateral for satisfaction of claims in the event that the issuer of an equity-linked note defaulted under the terms of the note. However, depending on the law of the jurisdictions in which an issuer is organized and in which the note is
The Income Fund of America — Page 13
issued, in the event of default, the fund may incur substantial expenses in seeking recovery under an equity-linked note, and may have limited legal recourse in attempting to do so.
Equity-linked notes are often privately placed and may not be rated, in which case the fund will be more dependent than would otherwise be the case on the ability of the investment adviser to evaluate the creditworthiness of the issuer, the underlying security, any collateral features of the note, and the potential for loss due to market and other factors. Ratings of issuers of equity-linked notes refer only to the creditworthiness of the issuer and strength of related collateral arrangements or other credit supports, and do not take into account, or attempt to rate, any potential risks of the underlying equity securities. The fund’s successful use of equity-linked notes will usually depend on the investment adviser’s ability to accurately forecast movements in the prices of the underlying securities. Should the prices of the underlying securities move in an unexpected manner, or should the structure of a note respond to market conditions differently than anticipated, the fund may not achieve the anticipated benefits of the investment in the equity-linked note, and the fund may realize losses, which could be significant and could include the fund’s entire principal investment in the note.
Equity-linked notes are generally designed for the over-the-counter institutional investment market, and the secondary market for equity-linked notes may be limited. The lack of a liquid secondary market may have an adverse effect on the ability of the fund to accurately value and/or sell the equity-linked notes in its portfolio.
Real estate investment trusts — Real estate investment trusts ("REITs"), which primarily invest in real estate or real estate-related loans, may issue equity or debt securities. Equity REITs own real estate properties, while mortgage REITs hold construction, development and/or long-term mortgage loans. The values of REITs may be affected by changes in the value of the underlying property of the trusts, the creditworthiness of the issuer, property taxes, interest rates, tax laws and regulatory requirements, such as those relating to the environment. Both types of REITs are dependent upon management skill and the cash flows generated by their holdings, the real estate market in general and the possibility of failing to qualify for any applicable pass-through tax treatment or failing to maintain any applicable exemptive status afforded under relevant laws.
Inflation linked bonds — The fund may invest in inflation linked bonds issued by governments, their agencies or instrumentalities and corporations.
The principal amount of an inflation linked bond is adjusted in response to changes in the level of an inflation index, such as the Consumer Price Index for Urban Consumers (“CPURNSA”). If the index measuring inflation falls, the principal value or coupon of these securities will be adjusted downward. Consequently, the interest payable on these securities will be reduced. Also, if the principal value of these securities is adjusted according to the rate of inflation, the adjusted principal value repaid at maturity may be less than the original principal. In the case of U.S. Treasury Inflation-Protected Securities (“TIPS”), currently the only inflation linked security that is issued by the U.S Treasury, the principal amounts are adjusted daily based upon changes in the rate of inflation (as currently represented by the non-seasonally adjusted CPURNSA, calculated with a three-month lag). TIPS may pay interest semi-annually, equal to a fixed percentage of the inflation-adjusted principal amount. The interest rate on these bonds is fixed at issuance, but over the life of the bond this interest may be paid on an increasing or decreasing principal amount that has been adjusted for inflation. The current market value of TIPS is not guaranteed and will fluctuate. However, the U.S. government guarantees that, at maturity, principal will be repaid at the higher of the original face value of the security (in the event of deflation) or the inflation adjusted value.
Other non-U.S. sovereign governments also issue inflation linked securities that are tied to their own local consumer price indexes and that offer similar deflationary protection. In certain of these non-U.S. jurisdictions, the repayment of the original bond principal upon the maturity of an inflation linked bond
The Income Fund of America — Page 14
is not guaranteed, allowing for the amount of the bond repaid at maturity to be less than par. Corporations also periodically issue inflation linked securities tied to CPURNSA or similar inflationary indexes. While TIPS and non-U.S. sovereign inflation linked securities are currently the largest part of the inflation linked market, the fund may invest in corporate inflation linked securities.
The value of inflation linked securities is expected to change in response to the changes in real interest rates. Real interest rates, in turn, are tied to the relationship between nominal interest rates and the rate of inflation. If inflation were to rise at a faster rate than nominal interest rates, real interest rates would decline, leading to an increase in value of the inflation linked securities. In contrast, if nominal interest rates were to increase at a faster rate than inflation, real interest rates might rise, leading to a decrease in value of inflation linked securities. There can be no assurance, however, that the value of inflation linked securities will be directly correlated to the changes in interest rates. If interest rates rise due to reasons other than inflation, investors in these securities may not be protected to the extent that the increase is not reflected in the security’s inflation measure.
The interest rate for inflation linked bonds is fixed at issuance as a percentage of this adjustable principal. Accordingly, the actual interest income may both rise and fall as the principal amount of the bonds adjusts in response to movements of the consumer price index. For example, typically interest income would rise during a period of inflation and fall during a period of deflation.
The market for inflation linked securities may be less developed or liquid, and more volatile, than certain other securities markets. There is a limited number of inflation linked securities currently available for the fund to purchase, making the market less liquid and more volatile than the U.S. Treasury and agency markets.
Reinsurance related notes and bonds — The fund may invest in reinsurance related notes and bonds. These instruments, which are typically issued by special purpose reinsurance companies, transfer an element of insurance risk to the note or bond holders. For example, such a note or bond could provide that the reinsurance company would not be required to repay all or a portion of the principal value of the note or bond if losses due to a catastrophic event under the policy (such as a major hurricane) exceed certain dollar thresholds. Consequently, the fund may lose the entire amount of its investment in such bonds or notes if such an event occurs and losses exceed certain dollar thresholds. In this instance, investors would have no recourse against the insurance company. These instruments may be issued with fixed or variable interest rates and rated in a variety of credit quality categories by the rating agencies.
Cash and cash equivalents — The fund may hold cash or invest in cash equivalents. Cash equivalents include, but are not limited to: (a) commercial paper (for example, short-term notes with maturities typically up to 12 months in length issued by corporations, governmental bodies or bank/corporation sponsored conduits (asset-backed commercial paper)); (b) short-term bank obligations (for example, certificates of deposit, bankers’ acceptances (time drafts on a commercial bank where the bank accepts an irrevocable obligation to pay at maturity)) or bank notes; (c) savings association and savings bank obligations (for example, bank notes and certificates of deposit issued by savings banks or savings associations); (d) securities of the U.S. government, its agencies or instrumentalities that mature, or that may be redeemed, in one year or less; and (e) corporate bonds and notes that mature, or that may be redeemed, in one year or less.
Restricted or illiquid securities — The fund may purchase securities subject to restrictions on resale. Restricted securities may only be sold pursuant to an exemption from registration under the Securities Act of 1933, as amended (the “1933 Act”), or in a registered public offering. Where registration is required, the holder of a registered security may be obligated to pay all or part of the registration expense and a considerable period may elapse between the time it decides to seek registration and the time it may be permitted to sell a security under an effective registration statement. Difficulty in
The Income Fund of America — Page 15
selling such securities may result in a loss to the fund or cause it to incur additional administrative costs.
Some fund holdings (including some restricted securities) may be deemed illiquid if they cannot be sold in the ordinary course of business at approximately the price at which the fund values them. The determination of whether a holding is considered liquid or illiquid is made by the fund’s adviser under procedures adopted by the fund’s board. The fund’s adviser makes this determination based on factors it deems relevant, such as the frequency and volume of trading, the commitment of dealers to make markets and the availability of qualified investors, all of which can change from time to time. The fund may incur significant additional costs in disposing of illiquid securities. If the fund holds more than 15% of its net assets in illiquid assets due to appreciation of illiquid securities, the depreciation of liquid securities or changes in market conditions, the fund will seek over time to increase its investments in liquid securities to the extent practicable.
Repurchase agreements — The fund may enter into repurchase agreements under which the fund buys a security and obtains a simultaneous commitment from the seller to repurchase the security at a specified time and price. Because the security purchased constitutes collateral for the repurchase obligation, a repurchase agreement may be considered a loan by the fund that is collateralized by the security purchased. Repurchase agreements permit the fund to maintain liquidity and earn income over periods of time as short as overnight. The seller must maintain with a custodian collateral equal to at least the repurchase price, including accrued interest. The fund will only enter into repurchase agreements involving securities of the type in which it could otherwise invest. If the seller under the repurchase agreement defaults, the fund may incur a loss if the value of the collateral securing the repurchase agreement has declined and may incur disposition costs and delays in connection with liquidating the collateral. If bankruptcy proceedings are commenced with respect to the seller, realization of the collateral by the fund may be delayed or limited.
Loan assignments and participations — The fund may invest in loans or other forms of indebtedness that represent interests in amounts owed by corporations or other borrowers (collectively “borrowers”). The investment adviser defines debt securities to include investments in loans, such as loan assignments and participations. Loans may be originated by the borrower in order to address its working capital needs, as a result of a reorganization of the borrower’s assets and liabilities (recapitalizations), to merge with or acquire another company (mergers and acquisitions), to take control of another company (leveraged buy-outs), to provide temporary financing (bridge loans), or for other corporate purposes. Most corporate loans are variable or floating rate obligations.
Some loans may be secured in whole or in part by assets or other collateral. In other cases, loans may be unsecured or may become undersecured by declines in the value of assets or other collateral securing such loan. The greater the value of the assets securing the loan the more the lender is protected against loss in the case of nonpayment of principal or interest. Loans made to highly leveraged borrowers may be especially vulnerable to adverse changes in economic or market conditions and may involve a greater risk of default.
Some loans may represent revolving credit facilities or delayed funding loans, in which a lender agrees to make loans up to a maximum amount upon demand by the borrower during a specified term. These commitments may have the effect of requiring the fund to increase its investment in a company at a time when it might not otherwise decide to do so (including at a time when the company’s financial condition makes it unlikely that such amounts will be repaid). To the extent that the fund is committed to advance additional funds, the fund will segregate assets determined to be liquid in an amount sufficient to meet such commitments.
Some loans may represent debtor-in-possession financings (commonly known as “DIP financings”). DIP financings are arranged when an entity seeks the protections of the bankruptcy court under Chapter
The Income Fund of America — Page 16
11 of the U.S. Bankruptcy Code. These financings allow the entity to continue its business operations while reorganizing under Chapter 11. Such financings constitute senior liens on unencumbered collateral (i.e., collateral not subject to other creditors’ claims). There is a risk that the entity will not emerge from Chapter 11 and be forced to liquidate its assets under Chapter 7 of the U.S. Bankruptcy Code. In the event of liquidation, the fund’s only recourse will be against the collateral securing the DIP financing.
The investment adviser generally makes investment decisions based on publicly available information, but may rely on non-public information if necessary. Borrowers may offer to provide lenders with material, non-public information regarding a specific loan or the borrower in general. The investment adviser generally chooses not to receive this information. As a result, the investment adviser may be at a disadvantage compared to other investors that may receive such information. The investment adviser’s decision not to receive material, non-public information may impact the investment adviser’s ability to assess a borrower’s requests for amendments or waivers of provisions in the loan agreement. However, the investment adviser may on a case-by-case basis decide to receive such information when it deems prudent. In these situations the investment adviser may be restricted from trading the loan or buying or selling other debt and equity securities of the borrower while it is in possession of such material, non-public information, even if such loan or other security is declining in value.
The fund normally acquires loan obligations through an assignment from another lender, but also may acquire loan obligations by purchasing participation interests from lenders or other holders of the interests. When the fund purchases assignments, it acquires direct contractual rights against the borrower on the loan. The fund acquires the right to receive principal and interest payments directly from the borrower and to enforce its rights as a lender directly against the borrower. However, because assignments are arranged through private negotiations between potential assignees and potential assignors, the rights and obligations acquired by a fund as the purchaser of an assignment may differ from, and be more limited than, those held by the assigning lender. Loan assignments are often administered by a financial institution that acts as agent for the holders of the loan, and the fund may be required to receive approval from the agent and/or borrower prior to the purchase of a loan. Risks may also arise due to the inability of the agent to meet its obligations under the loan agreement.
Loan participations are loans or other direct debt instruments that are interests in amounts owed by the borrower to another party. They may represent amounts owed to lenders or lending syndicates, to suppliers of goods or services, or to other parties. The fund will have the right to receive payments of principal, interest and any fees to which it is entitled only from the lender selling the participation and only upon receipt by the lender of the payments from the borrower. In connection with purchasing participations, the fund generally will have no right to enforce compliance by the borrower with the terms of the loan agreement relating to the loan, nor any rights of set-off against the borrower. In addition, the fund may not directly benefit from any collateral supporting the loan in which it has purchased the participation and the fund will have to rely on the agent bank or other financial intermediary to apply appropriate credit remedies. As a result, the fund will be subject to the credit risk of both the borrower and the lender that is selling the participation. In the event of the insolvency of the lender selling a participation, a fund may be treated as a general creditor of the lender and may not benefit from any set-off between the lender and the borrower.
Loan assignments and participations are generally subject to legal or contractual restrictions on resale and are not currently listed on any securities exchange or automatic quotation system. Risks may arise due to delayed settlements of loan assignments and participations. The investment adviser expects that most loan assignments and participations purchased for the fund will trade on a secondary market. However, although secondary markets for investments in loans are growing among institutional investors, there may be a limited number of investors interested in a specific loan. It is possible that loan participations, in particular, could be sold only to a limited number of institutional investors. If there is no active secondary market for a particular loan, it may be difficult for the
The Income Fund of America — Page 17
investment adviser to sell the fund’s interest in such loan at a price that is acceptable to it and to obtain pricing information on such loan.
Investments in loan participations and assignments present the possibility that the fund could be held liable as a co-lender under emerging legal theories of lender liability. In addition, if the loan is foreclosed, the fund could be part owner of any collateral and could bear the costs and liabilities of owning and disposing of the collateral. In addition, some loan participations and assignments may not be rated by major rating agencies and may not be protected by securities laws.
Forward commitment, when issued and delayed delivery transactions — The fund may enter into commitments to purchase or sell securities at a future date. When the fund agrees to purchase such securities, it assumes the risk of any decline in value of the security from the date of the agreement. If the other party to such a transaction fails to deliver or pay for the securities, the fund could miss a favorable price or yield opportunity, or could experience a loss.
The fund may enter into roll transactions, such as a mortgage dollar roll where the fund sells mortgage-backed securities for delivery in the current month and simultaneously contracts to repurchase substantially similar (same type, coupon, and maturity) securities on a specified future date, at a pre-determined price. During the period between the sale and repurchase (the “roll period”), the fund forgoes principal and interest paid on the mortgage-backed securities. The fund is compensated by the difference between the current sales price and the lower forward price for the future purchase (often referred to as the “drop”), if any, as well as by the interest earned on the cash proceeds of the initial sale. The fund could suffer a loss if the contracting party fails to perform the future transaction and the fund is therefore unable to buy back the mortgage-backed securities it initially sold. The fund also takes the risk that the mortgage-backed securities that it repurchases at a later date will have less favorable market characteristics than the securities originally sold (e.g., greater prepayment risk). These transactions are accounted for as purchase and sale transactions, which may increase the fund’s portfolio turnover rate.
With to be announced (TBA) transactions, the particular securities (i.e., specified mortgage pools) to be delivered or received are not identified at the trade date, but are “to be announced” at a later settlement date. However, securities to be delivered must meet specified criteria, including face value, coupon rate and maturity, and be within industry-accepted “good delivery” standards.
The fund will not use these transactions for the purpose of leveraging and will segregate liquid assets that will be marked to market daily in an amount sufficient to meet its payment obligations in these transactions. Although these transactions will not be entered into for leveraging purposes, to the extent the fund’s aggregate commitments in connection with these transactions exceed its segregated assets, the fund temporarily could be in a leveraged position (because it may have an amount greater than its net assets subject to market risk). Should market values of the fund’s portfolio securities decline while the fund is in a leveraged position, greater depreciation of its net assets would likely occur than if it were not in such a position. The fund will not borrow money to settle these transactions and, therefore, will liquidate other portfolio securities in advance of settlement if necessary to generate additional cash to meet its obligations. After a transaction is entered into, the fund may still dispose of or renegotiate the transaction. Additionally, prior to receiving delivery of securities as part of a transaction, the fund may sell such securities.
Cybersecurity risks — With the increased use of technologies such as the Internet to conduct business, the fund has become potentially more susceptible to operational and information security risks through breaches in cybersecurity. In general, a breach in cybersecurity can result from either a deliberate attack or an unintentional event. Cybersecurity breaches may involve, among other things, infection by computer viruses or other malicious software code or unauthorized access to the fund’s digital information systems, networks or devices through “hacking” or other means, in each case for
The Income Fund of America — Page 18
the purpose of misappropriating assets or sensitive information (including, for example, personal shareholder information), corrupting data or causing operational disruption or failures in the physical infrastructure or operating systems that support the fund. Cybersecurity risks also include the risk of losses of service resulting from external attacks that do not require unauthorized access to the fund’s systems, networks or devices. For example, denial-of-service attacks on the investment adviser’s or an affiliate’s website could effectively render the fund’s network services unavailable to fund shareholders and other intended end-users. Any such cybersecurity breaches or losses of service may cause the fund to lose proprietary information, suffer data corruption or lose operational capacity, which, in turn, could cause the fund to incur regulatory penalties, reputational damage, additional compliance costs associated with corrective measures and/or financial loss. While the fund and its investment adviser have established business continuity plans and risk management systems designed to prevent or reduce the impact of cybersecurity attacks, there are inherent limitations in such plans and systems due in part to the ever-changing nature of technology and cybersecurity attack tactics, and there is a possibility that certain risks have not been adequately identified or prepared for.
In addition, cybersecurity failures by or breaches of the fund’s third-party service providers (including, but not limited to, the fund’s investment adviser, transfer agent, custodian, administrators and other financial intermediaries) may disrupt the business operations of the service providers and of the fund, potentially resulting in financial losses, the inability of fund shareholders to transact business with the fund and of the fund to process transactions, the inability of the fund to calculate its net asset value, violations of applicable privacy and other laws, rules and regulations, regulatory fines, penalties, reputational damage, reimbursement or other compensatory costs and/or additional compliance costs associated with implementation of any corrective measures. The fund and its shareholders could be negatively impacted as a result of any such cybersecurity breaches, and there can be no assurance that the fund will not suffer losses relating to cybersecurity attacks or other informational security breaches affecting the fund’s third-party service providers in the future, particularly as the fund cannot control any cybersecurity plans or systems implemented by such service providers.
Cybersecurity risks may also impact issuers of securities in which the fund invests, which may cause the fund’s investments in such issuers to lose value.
Interfund borrowing and lending — Pursuant to an exemptive order issued by the U.S. Securities and Exchange Commission, the fund may lend money to, and borrow money from, other funds advised by Capital Research and Management Company or its affiliates. The fund will borrow through the program only when the costs are equal to or lower than the costs of bank loans. The fund will lend through the program only when the returns are higher than those available from an investment in repurchase agreements. Interfund loans and borrowings normally extend overnight, but can have a maximum duration of seven days. Loans may be called on one day's notice. The fund may have to borrow from a bank at a higher interest rate if an interfund loan is called or not renewed. Any delay in repayment to a lending fund could result in a lost investment opportunity or additional borrowing costs.
* * * * * *
The Income Fund of America — Page 19
Portfolio turnover — Portfolio changes will be made without regard to the length of time particular investments may have been held. Short-term trading profits are not the fund’s objective, and changes in its investments are generally accomplished gradually, though short-term transactions may occasionally be made. Higher portfolio turnover may involve correspondingly greater transaction costs in the form of dealer spreads or brokerage commissions. It may also result in the realization of net capital gains, which are taxable when distributed to shareholders, unless the shareholder is exempt from taxation or his or her account is tax-favored.
Fixed-income securities are generally traded on a net basis and usually neither brokerage commissions nor transfer taxes are involved. Transaction costs are usually reflected in the spread between the bid and asked price.
The fund’s portfolio turnover rates for the fiscal years ended July 31, 2016 and 2015 were 52% and 45%, respectively. The fund's portfolio turnover rate excluding mortgage dollar roll transactions for the fiscal year ended July 31, 2016 was 39%. See "Forward commitment, when issued and delayed delivery transactions" above for more information on mortgage dollar rolls. The portfolio turnover rate would equal 100% if each security in a fund’s portfolio were replaced once per year. See “Financial highlights” in the prospectus for the fund’s annual portfolio turnover rate for each of the last five fiscal years.
The Income Fund of America — Page 20
Fund policies
All percentage limitations in the following fund policies are considered at the time securities are purchased and are based on the fund’s net assets unless otherwise indicated. None of the following policies involving a maximum percentage of assets will be considered violated unless the excess occurs immediately after, and is caused by, an acquisition by the fund. In managing the fund, the fund’s investment adviser may apply more restrictive policies than those listed below.
Fundamental policies — The fund has adopted the following policies, which may not be changed without approval by holders of a majority of its outstanding shares. Such majority is currently defined in the Investment Company Act of 1940, as amended (the “1940 Act”), as the vote of the lesser of (a) 67% or more of the voting securities present at a shareholder meeting, if the holders of more than 50% of the outstanding voting securities are present in person or by proxy, or (b) more than 50% of the outstanding voting securities.
1. Except as permitted by (i) the 1940 Act and the rules and regulations thereunder, or other successor law governing the regulation of registered investment companies, or interpretations or modifications thereof by the U.S. Securities and Exchange Commission (“SEC”), SEC staff or other authority of competent jurisdiction, or (ii) exemptive or other relief or permission from the SEC, SEC staff or other authority of competent jurisdiction, the fund may not:
a. Borrow money;
b. Issue senior securities;
c. Underwrite the securities of other issuers;
d. Purchase or sell real estate or commodities;
e. Make loans; or
f. Purchase the securities of any issuer if, as a result of such purchase, the fund’s investments would be concentrated in any particular industry.
2. The fund may not invest in companies for the purpose of exercising control or management.
Nonfundamental policies — The following policy may be changed without shareholder approval:
The fund may not acquire securities of open-end investment companies or unit investment trusts registered under the 1940 Act in reliance on Sections 12(d)(1)(F) or 12(d)(1)(G) of the 1940 Act.
The Income Fund of America — Page 21
Additional information about the fund’s policies — The information below is not part of the fund’s fundamental or nonfundamental policies. This information is intended to provide a summary of what is currently required or permitted by the 1940 Act and the rules and regulations thereunder, or by the interpretive guidance thereof by the SEC or SEC staff, for particular fundamental policies of the fund. Information is also provided regarding the fund’s current intention with respect to certain investment practices permitted by the 1940 Act.
For purposes of fundamental policy 1a, the fund may borrow money in amounts of up to 33-1/3% of its total assets from banks for any purpose. Additionally, the fund may borrow up to 5% of its total assets from banks or other lenders for temporary purposes (a loan is presumed to be for temporary purposes if it is repaid within 60 days and is not extended or renewed). The percentage limitations in this policy are considered at the time securities are purchased and thereafter.
For purposes of fundamental policies 1a and 1e, the fund may borrow money from, or loan money to, other funds managed by Capital Research and Management Company or its affiliates to the extent permitted by applicable law and an exemptive order issued by the SEC.
For purposes of fundamental policy 1b, a senior security does not include any promissory note or evidence of indebtedness if such loan is for temporary purposes only and in an amount not exceeding 5% of the value of the total assets of the fund at the time the loan is made (a loan is presumed to be for temporary purposes if it is repaid within 60 days and is not extended or renewed). Further, to the extent the fund covers its commitments under certain types of agreements and transactions, including mortgage-dollar-roll transactions, sale-buybacks, when-issued, delayed-delivery, or forward commitment transactions, and other similar trading practices, by segregating or earmarking liquid assets equal in value to the amount of the fund’s commitment, such agreement or transaction will not be considered a senior security by the fund.
For purposes of fundamental policy 1c, the policy will not apply to the fund to the extent the fund may be deemed an underwriter within the meaning of the 1933 Act in connection with the purchase and sale of fund portfolio securities in the ordinary course of pursuing its investment objectives and strategies.
For purposes of fundamental policy 1e, the fund may not lend more than 33-1/3% of its total assets, provided that this limitation shall not apply to the fund’s purchase of debt obligations.
For purposes of fundamental policy 1f, the fund may not invest more than 25% of its total assets in the securities of issuers in a particular industry. This policy does not apply to investments in securities of the U.S. Government, its agencies or Government Sponsored Enterprises or repurchase agreements with respect thereto.
The Income Fund of America — Page 22
Management of the fund
Board of trustees and officers
Independent trustees1
The fund’s nominating and governance committee and board select independent trustees with a view toward constituting a board that, as a body, possesses the qualifications, skills, attributes and experience to appropriately oversee the actions of the fund’s service providers, decide upon matters of general policy and represent the long-term interests of fund shareholders. In doing so, they consider the qualifications, skills, attributes and experience of the current board members, with a view toward maintaining a board that is diverse in viewpoint, experience, education and skills.
The fund seeks independent trustees who have high ethical standards and the highest levels of integrity and commitment, who have inquiring and independent minds, mature judgment, good communication skills, and other complementary personal qualifications and skills that enable them to function effectively in the context of the fund’s board and committee structure and who have the ability and willingness to dedicate sufficient time to effectively fulfill their duties and responsibilities.
Each independent trustee has a significant record of accomplishments in governance, business, not-for-profit organizations, government service, academia, law, accounting or other professions. Although no single list could identify all experience upon which the fund’s independent trustees draw in connection with their service, the following table summarizes key experience for each independent trustee. These references to the qualifications, attributes and skills of the trustees are pursuant to the disclosure requirements of the SEC, and shall not be deemed to impose any greater responsibility or liability on any trustee or the board as a whole. Notwithstanding the accomplishments listed below, none of the independent trustees is considered an “expert” within the meaning of the federal securities laws with respect to information in the fund’s registration statement.
The Income Fund of America — Page 23
| Name, year of birth and position with fund (year first elected as a trustee2) | Principal
occupation(s) during the past five years |
Number
of portfolios in fund complex overseen by trustee3 |
Other
directorships4 held by trustee during the past five years |
Other Relevant Experience |
| William
H. Baribault, 1945 Trustee (2012) |
CEO and President, Richard Nixon Foundation; Chairman of the Board and CEO, Oakwood Enterprises (private investment and consulting) | 80 | General Finance Corporation | · Service as chief executive officer for multiple companies · Corporate board experience · Service on advisory and trustee boards for charitable, educational and nonprofit organizations |
| Vanessa
C. L. Chang, 1952 Trustee (2012) |
Director, EL & EL Investments (real estate) | 17 | Edison
International; Sykes Enterprises; Transocean Ltd. |
· Service as a chief executive officer, insurance-related (claims/dispute resolution) internet company · Senior management experience, investment banking · Former partner, public accounting firm · Corporate board experience · Service on advisory and trustee boards for charitable, educational and nonprofit organizations · Former member of the Governing Council of the Independent Directors Council · CPA (inactive) |
The Income Fund of America — Page 24
| Name, year of birth and position with fund (year first elected as a trustee2) | Principal
occupation(s) during the past five years |
Number
of portfolios in fund complex overseen by trustee3 |
Other
directorships4 held by trustee during the past five years |
Other Relevant Experience |
| Linda
Griego, 1947 Trustee (2012) |
President and CEO, Griego Enterprises, Inc. (business management company) | 7 | AECOM Technology Corporation; CBS Corporation | · Former Deputy Mayor, City of Los Angeles · Service in numerous federal, state and city commission appointments focused on, among other areas, economic development · Service as president for a television production company focused on programming for the Latino market · Corporate board experience · Board service for hospitals, and philanthropic, educational and nonprofit organizations |
The Income Fund of America — Page 25
| Name, year of birth and position with fund (year first elected as a trustee2) | Principal
occupation(s) during the past five years |
Number
of portfolios in fund complex overseen by trustee3 |
Other
directorships4 held by trustee during the past five years |
Other Relevant Experience |
| Leonade
D. Jones, 1947 Trustee (1993) |
Retired | 10 | None | · Service as treasurer of a diversified media and education company · Founder of e-commerce and educational loan exchange businesses · Corporate board and investment advisory committee experience · Service on advisory and trustee boards for charitable, educational, public and nonprofit organizations · Member of the Governing Council of the Independent Directors Council · JD, MBA |
| William
D. Jones, 1955 Trustee (2008) |
Real estate developer/owner, President and CEO, CityLink Investment Corporation (acquires, develops and manages real estate ventures in urban communities) and City Scene Management Company (provides commercial asset management services) | 8 | Sempra Energy | · Senior investment and management experience, real estate · Corporate board experience · Service as director, Federal Reserve Boards of San Francisco and Los Angeles · Service on advisory and trustee boards for charitable, educational, municipal and nonprofit organizations · MBA |
The Income Fund of America — Page 26
| Name, year of birth and position with fund (year first elected as a trustee2) | Principal
occupation(s) during the past five years |
Number
of portfolios in fund complex overseen by trustee3 |
Other
directorships4 held by trustee during the past five years |
Other Relevant Experience |
| James
J. Postl, 1946 Trustee (2008) |
Retired | 4 | Pulte, Inc.
|
· Service as chief executive officer for multiple international companies · Senior corporate management experience · Corporate board experience · Service on advisory and trustee boards for charitable, educational and nonprofit organizations |
| Margaret
Spellings, 1957 Trustee (2012) |
President, The University of North Carolina; former President, George W. Bush Foundation; former President and CEO, Margaret Spellings & Company (public policy and strategic consulting); former President, U.S. Chamber Foundation and Senior Advisor to the President and CEO, U.S. Chamber of Commerce | 81 | ClubCorp Holdings, Inc. Former director of Apollo Education Group, Inc. (until 2013) |
· Former U.S. Secretary of Education, U.S. Department of Education · Former Assistant to the President for Domestic Policy, The White House · Former senior advisor to the Governor of Texas · Service on advisory and trustee boards for charitable and nonprofit organizations |
The Income Fund of America — Page 27
| Name, year of birth and position with fund (year first elected as a trustee2) | Principal
occupation(s) during the past five years |
Number
of portfolios in fund complex overseen by trustee3 |
Other
directorships4 held by trustee during the past five years |
Other Relevant Experience |
| Isaac
Stein, 1946 Chairman of the Board (Independent and Non-Executive) (2004) |
Private investor; former President, Waverley Associates (private investment fund); Chairman Emeritus of the Board of Trustees, Stanford University | 4 | Former director of Maxygen, Inc. (until 2013); Alexza Pharmaceuticals, Inc. (until 2016) | · Service as chief executive officer, apparel company · Service as chief financial officer and general counsel, international materials science company · Former partner, law firm · Corporate board experience · Service on advisory and trustee boards for charitable and nonprofit organizations · JD, MBA |
The Income Fund of America — Page 28
Interested trustee(s)5,6
Interested trustees have similar qualifications, skills and attributes as the independent trustees. Interested trustees are senior executive officers and/or directors of Capital Research and Management Company or its affiliates. Such management roles with the fund’s service providers also permit the interested trustees to make a significant contribution to the fund’s board.
| Name,
year of birth and position with fund (year first elected as a trustee/officer2) |
Principal
occupation(s) during the past five years and positions held with affiliated entities or the Principal Underwriter of the fund |
Number
of portfolios in fund complex overseen by trustee 3 |
Other
directorships4 held by trustee during the past five years |
| Hilda
L. Applbaum, 1961 Vice Chairman of the Board (1998) |
Partner – Capital World Investors, Capital Research and Management Company | 1 | None |
Other officers6
| Name,
year of birth and position with fund (year first elected as an officer2) |
Principal
occupation(s) during the past five years and positions held with affiliated entities or the Principal Underwriter of the fund |
| David
C. Barclay, 1956 President (1998) |
Partner – Capital Fixed Income Investors, Capital Research and Management Company |
| Dina
N. Perry, 1945 Senior Vice President (1994) |
Partner – Capital World Investors, Capital Research and Management Company; Director, The Capital Group Companies, Inc.* |
| Paul
F. Roye, 1953 Senior Vice President (2007) |
Senior Vice President and Senior Counsel – Fund Business Management Group, Capital Research and Management Company; Director, Capital Research and Management Company |
| Andrew
B. Suzman, 1967 Senior Vice President (2004) |
Partner – Capital World Investors, Capital Research and Management Company; Director, Capital Strategy Research, Inc.*; Director, The Capital Group Companies, Inc.* |
| Paul
Flynn, 1966 Vice President (2017) |
Partner – Capital World Investors, Capital International Sàrl* |
| Joanna
F. Jonsson, 1963 Vice President (2006) |
Partner – Capital World Investors, Capital Research and Management Company; Partner – Capital World Investors, Capital Bank and Trust Company*; Director, Capital Research and Management Company |
| Donald
H. Rolfe, 1972 Vice President (2012) |
Senior Vice President and Senior Counsel – Fund Business Management Group, Capital Research and Management Company |
| Anirudh
Samsi, 1971 Vice President (2016) |
Partner – Capital World Investors, Capital Research and Management Company |
| John
H. Smet, 1956 Vice President (1994) |
Partner – Capital Fixed Income Investors, Capital Research and Management Company; Director, Capital Research and Management Company |
| Michael
W. Stockton, 1967 Secretary (2014) |
Vice President — Fund Business Management Group, Capital Research and Management Company |
| Brian
C. Janssen, 1972 Treasurer (2016) |
Vice President – Investment Operations, Capital Research and Management Company |
| Viviane
T. Russo, 1981 Assistant Secretary (2014) |
Associate – Fund Business Management Group, Capital Research and Management Company |
The Income Fund of America — Page 29
| Name,
year of birth and position with fund (year first elected as an officer2) |
Principal
occupation(s) during the past five years and positions held with affiliated entities or the Principal Underwriter of the fund |
| Dori
Laskin, 1951 Assistant Treasurer (2011) |
Vice President – Investment Operations, Capital Research and Management Company |
| Hong
T. Le, 1978 Assistant Treasurer (2016) |
Assistant Vice President – Investment Operations, Capital Research and Management Company |
* Company affiliated with Capital Research and Management Company.
1 The term independent trustee refers to a trustee who is not an “interested person” of the fund within the meaning of the 1940 Act.
2 Trustees and officers of the fund serve until their resignation, removal or retirement.
3 Funds managed by Capital Research and Management Company or its affiliates.
4 This includes all directorships/trusteeships (other than those in the American Funds or other funds managed by Capital Research and Management Company or its affiliates) that are held by each trustee as a director/trustee of a public company or a registered investment company. Unless otherwise noted, all directorships/trusteeships are current.
5 The term interested trustee refers to a trustee who is an “interested person” of the fund within the meaning of the 1940 Act, on the basis of his or her affiliation with the fund’s investment adviser, Capital Research and Management Company, or affiliated entities (including the fund’s principal underwriter).
6 All of the trustees and/or officers listed, with the exception of Paul Flynn and Anirudh Samsi, are officers and/or directors/trustees of one or more of the other funds for which Capital Research and Management Company serves as investment adviser.
The address for all trustees and officers of the fund is 333 South Hope Street, 55th Floor, Los Angeles, California 90071, Attention: Secretary.
The Income Fund of America — Page 30
Fund shares owned by trustees as of December 31, 2016:
| Name | Dollar
range1 of fund shares owned |
Aggregate dollar range1 of shares owned in all funds in the American Funds family overseen by trustee |
Dollar range1,2 of independent trustees deferred compensation3 allocated to fund |
Aggregate dollar range1,2 of independent trustees deferred compensation3 allocated to all funds within American Funds family overseen by trustee |
| Independent trustees | ||||
| William H. Baribault | $10,001 – $50,000 | Over $100,000 | $10,001 – $50,000 | $50,001 – $100,000 |
| Vanessa C. L. Chang | $50,001 – $100,000 | Over $100,000 | N/A | N/A |
| Linda Griego | Over $100,000 | Over $100,000 | N/A | N/A |
| Leonade D. Jones | Over $100,000 | Over $100,000 | Over $100,000 | Over $100,000 |
| William D. Jones | $50,001 – $100,000 | Over $100,000 | $50,001 – $100,000 | Over $100,000 |
| James J. Postl | Over $100,000 | Over $100,000 | Over $100,000 | Over $100,000 |
| Margaret Spellings | None | Over $100,000 | $50,001 – $100,000 | Over $100,000 |
| Isaac Stein | Over $100,000 | Over $100,000 | Over $100,000 | Over $100,000 |
| Name | Dollar
range1 of fund shares owned |
Aggregate dollar range1 of shares owned in all funds in the American Funds family overseen by trustee |
| Interested trustee | ||
| Hilda L. Applbaum | Over $100,000 | Over $100,000 |
1 Ownership disclosure is made using the following ranges: None; $1 – $10,000; $10,001 – $50,000; $50,001 – $100,000; and Over $100,000. The amounts listed for interested trustees include shares owned through The Capital Group Companies, Inc. retirement plan and 401(k) plan.
2 N/A indicates that the listed individual, as of December 31, 2016, was not a trustee of a particular fund, did not allocate deferred compensation to the fund or did not participate in the deferred compensation plan.
3 Eligible trustees may defer their compensation under a nonqualified deferred compensation plan. Amounts deferred by the trustee accumulate at an earnings rate determined by the total return of one or more American Funds as designated by the trustee.
The Income Fund of America — Page 31
Trustee compensation — No compensation is paid by the fund to any officer or trustee who is a director, officer or employee of the investment adviser or its affiliates. Except for the independent trustees listed in the “Board of trustees and officers — Independent trustees” table under the “Management of the fund” section in this statement of additional information, all other officers and trustees of the fund are directors, officers or employees of the investment adviser or its affiliates. The boards of funds advised by the investment adviser typically meet either individually or jointly with the boards of one or more other such funds with substantially overlapping board membership (in each case referred to as a “board cluster”). The fund typically pays each independent trustee an annual fee, which ranges from $13,150 to $30,000, based primarily on the total number of board clusters on which that independent trustee serves.
In addition, the fund generally pays independent trustees attendance and other fees for meetings of the board and its committees. Board and committee chairs receive additional fees for their services.
Independent trustees also receive attendance fees for certain special joint meetings and information sessions with directors and trustees of other groupings of funds advised by the investment adviser. The fund and the other funds served by each independent trustee each pay an equal portion of these attendance fees.
No pension or retirement benefits are accrued as part of fund expenses. Independent trustees may elect, on a voluntary basis, to defer all or a portion of their fees through a deferred compensation plan in effect for the fund. The fund also reimburses certain expenses of the independent trustees.
The Income Fund of America — Page 32
Trustee compensation earned during the fiscal year ended July 31, 2016:
| Name | Aggregate
compensation (including voluntarily deferred compensation1) from the fund |
Total
compensation (including voluntarily deferred compensation1) from all funds managed by Capital Research and Management Company or its affiliates |
| William H. Baribault | $35,438 | $383,042 |
| Vanessa C. L. Chang | 38,469 | 315,217 |
| Linda Griego | 39,743 | 257,806 |
| Leonade D. Jones2 | 36,535 | 371,412 |
| William D. Jones2 | 36,032 | 305,000 |
| James J. Postl2 | 51,875 | 207,500 |
| Margaret Spellings2 | 37,878 | 397,705 |
| Isaac Stein2 | 60,688 | 242,750 |
1 Amounts may be deferred by eligible trustees under a nonqualified deferred compensation plan adopted by the fund in 1993. Deferred amounts accumulate at an earnings rate determined by the total return of one or more American Funds as designated by the trustees. Compensation shown in this table for the fiscal year ended July 31, 2016 does not include earnings on amounts deferred in previous fiscal years. See footnote 2 to this table for more information.
2 Since the deferred compensation plan’s adoption, the total amount of deferred compensation accrued by the fund (plus earnings thereon) through the end of the 2016 fiscal year for participating trustees is as follows: Leonade D. Jones ($208,293), William D. Jones ($61,311), James J. Postl ($586,788), Margaret Spellings ($47,251) and Isaac Stein ($439,007). Amounts deferred and accumulated earnings thereon are not funded and are general unsecured liabilities of the fund until paid to the trustees.
Fund organization and the board of trustees — The fund, an open-end, diversified management investment company, was organized as a Delaware corporation on March 8, 1969, reorganized as a Maryland corporation on December 16, 1983, and reorganized as a Delaware statutory trust on October 1, 2010. All fund operations are supervised by the fund’s board of trustees which meets periodically and performs duties required by applicable state and federal laws.
Delaware law charges trustees with the duty of managing the business affairs of the trust. Trustees are considered to be fiduciaries of the trust and owe duties of care and loyalty to the trust and its shareholders.
Independent board members are paid certain fees for services rendered to the fund as described above. They may elect to defer all or a portion of these fees through a deferred compensation plan in effect for the fund.
The fund has several different classes of shares. Shares of each class represent an interest in the same investment portfolio. Each class has pro rata rights as to voting, redemption, dividends and liquidation, except that each class bears different distribution expenses and may bear different transfer agent fees and other expenses properly attributable to the particular class as approved by the board of trustees and set forth in the fund’s rule 18f-3 Plan. Each class’ shareholders have exclusive voting rights with respect to the respective class’ rule 12b-1 plans adopted in connection with the distribution of shares and on other matters in which the interests of one class are different from interests in another class. Shares of all classes of the fund vote together on matters that affect all classes in substantially the same manner. Each class votes as a class on matters that affect that class alone. Note that 529 college savings plan account owners invested in Class 529 shares are not shareholders of the fund and, accordingly, do not have the rights of a shareholder, such as the right to vote proxies relating to fund shares. As the legal owner of the fund’s Class 529 shares, Virginia College Savings PlanSM (Virginia529SM) will vote any proxies relating to the fund’s Class 529 shares. In addition, the trustees
The Income Fund of America — Page 33
have the authority to establish new series and classes of shares, and to split or combine outstanding shares into a greater or lesser number, without shareholder approval.
The fund does not hold annual meetings of shareholders. However, significant matters that require shareholder approval, such as certain elections of board members or a change in a fundamental investment policy, will be presented to shareholders at a meeting called for such purpose. Shareholders have one vote per share owned.
The fund’s declaration of trust and by-laws, as well as separate indemnification agreements with independent trustees, provide in effect that, subject to certain conditions, the fund will indemnify its officers and trustees against liabilities or expenses actually and reasonably incurred by them relating to their service to the fund. However, trustees are not protected from liability by reason of their willful misfeasance, bad faith, gross negligence or reckless disregard of the duties involved in the conduct of their office.
Removal of trustees by shareholders — At any meeting of shareholders, duly called and at which a quorum is present, shareholders may, by the affirmative vote of the holders of two-thirds of the votes entitled to be cast, remove any trustee from office and may elect a successor or successors to fill any resulting vacancies for the unexpired terms of removed trustees. In addition, the trustees of the fund will promptly call a meeting of shareholders for the purpose of voting upon the removal of any trustees when requested in writing to do so by the record holders of at least 10% of the outstanding shares.
Leadership structure — The board’s chair is currently an independent trustee who is not an “interested person” of the fund within the meaning of the 1940 Act. The board has determined that an independent chair facilitates oversight and enhances the effectiveness of the board. The independent chair’s duties include, without limitation, generally presiding at meetings of the board, approving board meeting schedules and agendas, leading meetings of the independent trustees in executive session, facilitating communication with committee chairs, and serving as the principal independent trustee contact for fund management and counsel to the independent trustees and the fund.
Risk oversight — Day-to-day management of the fund, including risk management, is the responsibility of the fund’s contractual service providers, including the fund’s investment adviser, principal underwriter/distributor and transfer agent. Each of these entities is responsible for specific portions of the fund’s operations, including the processes and associated risks relating to the fund’s investments, integrity of cash movements, financial reporting, operations and compliance. The board of trustees oversees the service providers’ discharge of their responsibilities, including the processes they use to manage relevant risks. In that regard, the board receives reports regarding the operations of the fund’s service providers, including risks. For example, the board receives reports from investment professionals regarding risks related to the fund’s investments and trading. The board also receives compliance reports from the fund’s and the investment adviser’s chief compliance officers addressing certain areas of risk.
Committees of the fund’s board, which are comprised of independent board members, none of whom is an “interested person” of the fund within the meaning of the 1940 Act, as well as joint committees of independent board members of funds managed by Capital Research and Management Company, also explore risk management procedures in particular areas and then report back to the full board. For example, the fund’s audit committee oversees the processes and certain attendant risks relating to financial reporting, valuation of fund assets, and related controls. Similarly, a joint review and advisory committee oversees certain risk controls relating to the fund’s transfer agency services.
Not all risks that may affect the fund can be identified or processes and controls developed to eliminate or mitigate their effect. Moreover, it is necessary to bear certain risks (such as investment-
The Income Fund of America — Page 34
related risks) to achieve the fund’s objectives. As a result of the foregoing and other factors, the ability of the fund’s service providers to eliminate or mitigate risks is subject to limitations.
Committees of the board of trustees — The fund has an audit committee comprised of William H. Baribault, Vanessa C. L. Chang, Linda Griego, Leonade D. Jones, James J. Postl and Margaret Spellings. The committee provides oversight regarding the fund’s accounting and financial reporting policies and practices, its internal controls and the internal controls of the fund’s principal service providers. The committee acts as a liaison between the fund’s independent registered public accounting firm and the full board of trustees. The audit committee held five meetings during the 2016 fiscal year.
The fund has a contracts committee comprised of all of its independent board members. The committee’s principal function is to request, review and consider the information deemed necessary to evaluate the terms of certain agreements between the fund and its investment adviser or the investment adviser’s affiliates, such as the Investment Advisory and Service Agreement, Principal Underwriting Agreement, Administrative Services Agreement and Plans of Distribution adopted pursuant to rule 12b-1 under the 1940 Act, that the fund may enter into, renew or continue, and to make its recommendations to the full board of trustees on these matters. The contracts committee held one meeting during the 2016 fiscal year.
The fund has a nominating and governance committee comprised of Linda Griego, Leonade D. Jones, William D. Jones, James J. Postl, Margaret Spellings and Isaac Stein. The committee periodically reviews such issues as the board’s composition, responsibilities, committees, compensation and other relevant issues, and recommends any appropriate changes to the full board of trustees. The committee also evaluates, selects and nominates independent trustee candidates to the full board of trustees. While the committee normally is able to identify from its own and other resources an ample number of qualified candidates, it will consider shareholder suggestions of persons to be considered as nominees to fill future vacancies on the board. Such suggestions must be sent in writing to the nominating and governance committee of the fund, addressed to the fund’s secretary, and must be accompanied by complete biographical and occupational data on the prospective nominee, along with a written consent of the prospective nominee for consideration of his or her name by the committee. The nominating and governance committee held two meetings during the 2016 fiscal year.
Proxy voting procedures and principles — The fund’s investment adviser, in consultation with the fund’s board, has adopted Proxy Voting Procedures and Principles (the “Principles”) with respect to voting proxies of securities held by the fund, other American Funds and American Funds Insurance Series. The complete text of these principles is available on the American Funds website at americanfunds.com. Proxies are voted by a committee of the appropriate equity investment division of the investment adviser under authority delegated by the funds’ boards. Therefore, if more than one fund invests in the same company, they may vote differently on the same proposal.
The Principles, which have been in effect in substantially their current form for many years, provide an important framework for analysis and decision-making by all funds. However, they are not exhaustive and do not address all potential issues. The Principles provide a certain amount of flexibility so that all relevant facts and circumstances can be considered in connection with every vote. As a result, each proxy received is voted on a case-by-case basis considering the specific circumstances of each proposal. The voting process reflects the funds’ understanding of the company’s business, its management and its relationship with shareholders over time.
The investment adviser seeks to vote all U.S. proxies; however, in certain circumstances it may be impracticable or impossible to do so. Proxies for companies outside the U.S. also are voted, provided there is sufficient time and information available. After a proxy statement is received, the investment adviser prepares a summary of the proposals contained in the proxy statement. A notation of any
The Income Fund of America — Page 35
potential conflicts of interest also is included in the summary (see below for a description of Capital Research and Management Company’s special review procedures).
For proxies of securities managed by a particular investment division of the investment adviser, the initial voting recommendation is made by one or more of the division’s investment analysts familiar with the company and industry. A second recommendation is made by a proxy coordinator (an investment analyst or other individual with experience in corporate governance and proxy voting matters) within the appropriate investment division, based on knowledge of these Principles and familiarity with proxy-related issues. The proxy summary and voting recommendations are made available to the appropriate proxy voting committee for a final voting decision.
In addition to its proprietary proxy voting, governance and executive compensation research, Capital Research and Management Company may utilize research provided by Institutional Shareholder Services, Glass-Lewis & Co. or other third-party advisory firms on a case-by-case basis. It does not, as a policy, follow the voting recommendations provided by these firms. It periodically assesses the information provided by the advisory firms and reports to the Joint Proxy Committee of the American Funds (“JPC”), as appropriate.
The JPC is composed of independent board members from each American Funds board. The JPC’s role is to facilitate appropriate oversight of the proxy voting process and provide valuable input on corporate governance and related matters. Members of the JPC also may be called upon to resolve voting conflicts involving funds co-managed by the investment adviser’s equity investment divisions and vote proxies when necessary as a result of regulatory requirements (see below for more information).
From time to time the investment adviser may vote proxies issued by, or on proposals sponsored or publicly supported by (a) a client with substantial assets managed by the investment adviser or its affiliates, (b) an entity with a significant business relationship with the American Funds organization, or (c) a company with a director of an American Fund on its board (each referred to as an “Interested Party”). Other persons or entities may also be deemed an Interested Party if facts or circumstances appear to give rise to a potential conflict. The investment adviser analyzes these proxies and proposals on their merits and does not consider these relationships when casting its vote.
The investment adviser has developed procedures to identify and address instances where a vote could appear to be influenced by such a relationship. Under the procedures, prior to a final vote being cast by the investment adviser, the relevant proxy committees’ voting results for proxies issued by Interested Parties are reviewed by a Special Review Committee (“SRC”) of the investment division voting the proxy if the vote was in favor of the Interested Party.
If a potential conflict is identified according to the procedure above, the SRC will be provided with a summary of any relevant communications with the Interested Party, the rationale for the voting decision, information on the organization’s relationship with the party and any other pertinent information. The SRC will evaluate the information and determine whether the decision was in the best interest of fund shareholders. It will then accept or override the voting decision or determine alternative action. The SRC includes senior investment professionals and legal and compliance professionals.
In cases where a fund is co-managed and a portfolio company is held by more than one of the investment adviser’s equity investment divisions, voting ties are resolved by one of the following methods. First, for those funds that have delegated tie-breaking authority to the investment adviser, the outcome will be determined by the equity investment division or divisions with the larger position in the portfolio company as of the record date for the shareholder meeting. For the remaining funds, members of the JPC representing those funds will determine the outcome based on a review of the
The Income Fund of America — Page 36
same information provided to the relevant investment analysts, proxy coordinators and proxy committee members.
Information regarding how the fund voted proxies relating to portfolio securities during the 12-month period ended June 30 of each year will be available on or about September 1 of each year (a) without charge, upon request by calling American Funds Service Company at (800) 421-4225, (b) on the American Funds website and (c) on the SEC’s website at sec.gov.
The following summary sets forth the general positions of the American Funds, American Funds Insurance Series and the investment adviser on various proposals. A copy of the full Principles is available upon request, free of charge, by calling American Funds Service Company or visiting the American Funds website.
Director matters — The election of a company’s slate of nominees for director generally is supported. Votes may be withheld for some or all of the nominees if this is determined to be in the best interest of shareholders or if, in the opinion of the investment adviser, such nominee has not fulfilled his or her fiduciary duty. Separation of the chairman and CEO positions also may be supported.
Governance provisions — Typically, proposals to declassify a board (elect all directors annually) are supported based on the belief that this increases the directors’ sense of accountability to shareholders. Proposals for cumulative voting generally are supported in order to promote management and board accountability and an opportunity for leadership change. Proposals designed to make director elections more meaningful, either by requiring a majority vote or by requiring any director receiving more withhold votes than affirmative votes to tender his or her resignation, generally are supported.
Shareholder rights — Proposals to repeal an existing poison pill generally are supported. (There may be certain circumstances, however, when a proxy voting committee of a fund or an investment division of the investment adviser believes that a company needs to maintain anti-takeover protection.) Proposals to eliminate the right of shareholders to act by written consent or to take away a shareholder’s right to call a special meeting typically are not supported.
Compensation and benefit plans — Option plans are complicated, and many factors are considered in evaluating a plan. Each plan is evaluated based on protecting shareholder interests and a knowledge of the company and its management. Considerations include the pricing (or repricing) of options awarded under the plan and the impact of dilution on existing shareholders from past and future equity awards. Compensation packages should be structured to attract, motivate and retain existing employees and qualified directors; however, they should not be excessive.
Routine matters — The ratification of auditors, procedural matters relating to the annual meeting and changes to company name are examples of items considered routine. Such items generally are voted in favor of management’s recommendations unless circumstances indicate otherwise.
The Income Fund of America — Page 37
Principal fund shareholders — The following table identifies those investors who own of record, or are known by the fund to own beneficially, 5% or more of any class of its shares as of the opening of business on March 8, 2017. Unless otherwise indicated, the ownership percentages below represent ownership of record rather than beneficial ownership.
| Name and address | Ownership | Ownership percentage | |
| Edward
D. Jones & Co. Omnibus Account Saint Louis, MO |
Record | Class A Class C Class F-2 Class 529-A |
34.46% 10.23 12.53 19.12 |
Wells Fargo Clearing Services, LLC Custody Account Saint Louis, MO |
Record | Class A Class C Class F-1 Class F-2 |
8.59 12.78 8.82 11.74 |
Pershing, LLC Custody Account Jersey City, NJ |
Record | Class A Class C Class F-1 Class F-2 Class F-3 Class 529-F-1 |
5.92 8.07 12.62 10.93 27.52 5.43 |
Morgan Stanley & Co., Inc. Omnibus Account Jersey City, NJ |
Record | Class C Class F-1 Class F-2 |
8.12 7.80 9.64 |
Merrill Lynch Omnibus Account Jacksonville, FL |
Record | Class C Class F-1 Class F-2 |
8.11 9.26 9.42 |
Raymond James Omnibus Account St. Petersburg, FL |
Record | Class C Class F-1 Class F-2 Class 529-C |
7.61 8.32 5.31 5.04 |
National Financial Services, LLC Omnibus Account Jersey City, NJ |
Record | Class C Class F-1 Class F-2 |
5.01 11.68 7.87 |
Charles Schwab & Co., Inc. Custody Account San Francisco, CA |
Record | Class F-1 Class F-2 Class F-3 |
12.60 6.02 20.14 |
UBS WM USA Omnibus Account Weehawken, NJ |
Record | Class F-2 | 7.95 |
LPL Financial Omnibus Account San Diego, CA |
Record | Class F-2 | 6.93 |
J. P. Morgan Securities, LLC Omnibus Account Brooklyn, NY |
Record | Class F-3 | 48.71 |
Hartford Life Insurance Co. Separate Account 401K Plan Hartford, CT |
Record Beneficial |
Class R-1 Class R-3 |
48.88 5.70 |
Massachusetts Mutual Life Insurance Company 401K Plan Springfield, MA |
Record Beneficial |
Class R-1 | 8.78 |
California Machinist 401K Plan Phoenix, AZ |
Record Beneficial |
Class R-2E | 18.71 |
Retirement Plan Greenwood Village, CO |
Beneficial | Class R-2E | 8.57 |
The Income Fund of America — Page 38
| Name and address | Ownership | Ownership percentage | |
Cerium Networks, Inc. 401K Plan Greenwood Village, CO |
Record Beneficial |
Class R-2E | 6.26 |
401K Plan Greenwood Village, CO |
Beneficial | Class R-2E | 5.10 |
Voya Retirement Insurance & Annuity Company Omnibus Account Hartford, CT |
Record | Class R-3 | 11.99 |
State Street Bank & Trust Co. Omnibus Account Harrison, NY |
Record | Class R-4 | 14.34 |
John Hancock Life Insurance Co. USA Omnibus Account Boston, MA |
Record | Class R-5 | 24.48 |
Nationwide Trust Company Columbus, OH |
Record | Class R-5 | 12.85 |
Twin City Pipe Trades Retirement Plan Phoenix, AZ |
Record Beneficial |
Class R-5 | 9.71 |
Wells Fargo Bank 401K Plan Charlotte, NC |
Record Beneficial |
Class R-5 | 8.03 |
TIAA-Creft Trust Co. Retirement Plan Saint Louis, MO |
Record Beneficial |
Class R-5E | 92.61 |
American Funds Income Portfolio Irvine, CA |
Record | Class R-6 | 18. 41 |
American Funds 2020 Target Date Retirement Fund Los Angeles, CA |
Record | Class R-6 | 10.18 |
American Funds 2030 Target Date Retirement Fund Los Angeles, CA |
Record | Class R-6 | 7.55 |
American Funds 2025 Target Date Retirement Fund Los Angeles, CA |
Record | Class R-6 | 7.09 |
American Funds 2015 Target Date Retirement Fund Los Angeles, CA |
Record | Class R-6 | 6.88 |
American Funds 2035 Target Date Retirement Fund Los Angeles, CA |
Record | Class R-6 | 5.63 |
As of March 8, 2017, the officers and trustees of the fund, as a group, owned beneficially or of record less than 1% of the outstanding shares of the fund.
Unless otherwise noted, references in this statement of additional information to Class F shares, Class R shares or Class 529 shares refer to all F share classes, all R share classes or all 529 share classes, respectively.
Investment adviser — Capital Research and Management Company, the fund’s investment adviser, founded in 1931, maintains research facilities in the United States and abroad (Beijing, Geneva, Hong Kong, London, Los Angeles, Mumbai, New York, San Francisco, Singapore, Tokyo and Washington, D.C.). These facilities are staffed with experienced investment professionals. The investment adviser is located at 333 South Hope Street, Los Angeles, CA 90071. It is a wholly owned subsidiary of The Capital Group Companies, Inc., a holding company for several investment management subsidiaries. Capital Research and Management Company manages equity assets through three equity investment divisions and fixed-income assets through its fixed-income investment division, Capital Fixed Income Investors. The three equity investment divisions — Capital World Investors, Capital Research Global
The Income Fund of America — Page 39
Investors and Capital International Investors — make investment decisions independently of one another. Portfolio managers in Capital International Investors rely on a research team that also provides investment services to institutional clients and other accounts advised by affiliates of Capital Research and Management Company. The investment adviser, which is deemed under the Commodity Exchange Act (the “CEA”) to be the operator of the fund, has claimed an exclusion from the definition of the term commodity pool operator under the CEA with respect to the fund and, therefore, is not subject to registration or regulation as such under the CEA with respect to the fund.
The investment adviser has adopted policies and procedures that address issues that may arise as a result of an investment professional’s management of the fund and other funds and accounts. Potential issues could involve allocation of investment opportunities and trades among funds and accounts, use of information regarding the timing of fund trades, investment professional compensation and voting relating to portfolio securities. The investment adviser believes that its policies and procedures are reasonably designed to address these issues.
Compensation of investment professionals — As described in the prospectus, the investment adviser uses a system of multiple portfolio managers in managing fund assets. In addition, Capital Research and Management Company’s investment analysts may make investment decisions with respect to a portion of a fund’s portfolio within their research coverage.
Portfolio managers and investment analysts are paid competitive salaries by Capital Research and Management Company. In addition, they may receive bonuses based on their individual portfolio results. Investment professionals also may participate in profit-sharing plans. The relative mix of compensation represented by bonuses, salary and profit-sharing plans will vary depending on the individual’s portfolio results, contributions to the organization and other factors.
To encourage a long-term focus, bonuses based on investment results are calculated by comparing pretax total investment returns to relevant benchmarks over the most recent one-, three-, five- and eight-year periods, with increasing weight placed on each succeeding measurement period. For portfolio managers, benchmarks may include measures of the marketplaces in which the fund invests and measures of the results of comparable mutual funds. For investment analysts, benchmarks may include relevant market measures and appropriate industry or sector indexes reflecting their areas of expertise. Capital Research and Management Company makes periodic subjective assessments of analysts’ contributions to the investment process and this is an element of their overall compensation. The investment results of each of the fund’s portfolio managers may be measured against one or more benchmarks, depending on his or her investment focus, such as: a custom average consisting of one share class per fund of high yield funds that disclose investment objectives and strategies comparable to those of the fund; Bloomberg Barclays U.S. Aggregate Index; a custom index of higher yielding securities from the MSCI World ex-USA Index; a custom index of higher yielding securities from the MSCI USA Index; Bloomberg Barclays U.S. Corporate High Yield Index 2% Issuer Cap; a custom average consisting of one share class per fund of corporate debt funds BBB-rated that disclose investment objectives and strategies comparable to those of the fund; Bloomberg Barclays Baa Corporate Index; Lipper Income Funds Index; Lipper Equity Income Funds Index; and a custom average consisting of one share class per fund of core bond funds that disclose investment objectives and strategies comparable to those of the fund. From time to time, Capital Research and Management Company may adjust or customize these benchmarks to better reflect the universe of comparably managed funds of competitive investment management firms.
Portfolio manager fund holdings and other managed accounts — As described below, portfolio managers may personally own shares of the fund. In addition, portfolio managers may manage portions of other mutual funds or accounts advised by Capital Research and Management Company or its affiliates.
The Income Fund of America — Page 40
The following table reflects information as of July 31, 2016:
| Portfolio manager |
Dollar
range of fund shares owned1 |
Number of other registered investment companies (RICs) for which portfolio manager is a manager (assets of RICs in billions)2 |
Number of other pooled investment vehicles (PIVs) for which portfolio manager is a manager (assets of PIVs in billions)3 |
Number of other accounts for which portfolio manager is a manager (assets of other accounts in billions)4 | |||
| Hilda L. Applbaum | Over $1,000,000 | 2 | $96.8 | 2 | $0.21 | None | |
| David C. Barclay | Over $1,000,000 | 3 | $29.1 | None | None | ||
| Dina N. Perry | Over $1,000,000 | 2 | $173.8 | 1 | $2.98 | None | |
| Andrew B. Suzman | Over $1,000,000 | 21 | $214.4 | None | None | ||
| Paul Flynn | $100,001 – $500,000 | 1 | $0.3 | 2 | $0.21 | None | |
| Joanna F. Jonsson | Over $1,000,000 | 21 | $283.0 | 2 | $0.21 | None | |
| John H. Smet | Over $1,000,000 | 20 | $204.2 | None | None | ||
| David A. Daigle | $100,001 – $500,000 | 7 | $85.0 | 2 | $0.75 | 2 | $0.39 |
| James R. Mulally | $100,001 – $500,000 | 8 | $120.7 | 1 | $0.05 | None | |
1 Ownership disclosure is made using the following ranges: None; $1 – $10,000; $10,001 – $50,000; $50,001 – $100,000; $100,001 – $500,000; $500,001 – $1,000,000; and Over $1,000,000. The amounts listed include shares owned through The Capital Group Companies, Inc. retirement plan and 401(k) plan.
2 Indicates other RIC(s) managed by Capital Research and Management Company or its affiliates for which the portfolio manager also has significant day to day management responsibilities. Assets noted are the total net assets of the RIC(s) and are not the total assets managed by the individual, which is a substantially lower amount. No RIC has an advisory fee that is based on the performance of the RIC.
3 Indicates other PIV(s) managed by Capital Research and Management Company or its affiliates for which the portfolio manager also has significant day to day management responsibilities. Assets noted are the total net assets of the PIV(s) and are not the total assets managed by the individual, which is a substantially lower amount. No PIV has an advisory fee that is based on the performance of the PIV.
4 Indicates other accounts managed by Capital Research and Management Company or its affiliates for which the portfolio manager also has significant day to day management responsibilities. Assets noted are the total net assets of the other accounts and are not the total assets managed by the individual, which is a substantially lower amount. No account has an advisory fee that is based on the performance of the account. Personal brokerage accounts of portfolio managers and their families are not reflected.
The fund’s investment adviser has adopted policies and procedures to mitigate material conflicts of interest that may arise in connection with a portfolio manager’s management of the fund, on the one hand, and investments in the other pooled investment vehicles and other accounts, on the other hand, such as material conflicts relating to the allocation of investment opportunities that may be suitable for both the fund and such other accounts.
The Income Fund of America — Page 41
Investment Advisory and Service Agreement — The Investment Advisory and Service Agreement (the “Agreement”) between the fund and the investment adviser will continue in effect until January 31, 2018, unless sooner terminated, and may be renewed from year to year thereafter, provided that any such renewal has been specifically approved at least annually by (a) the board of trustees, or by the vote of a majority (as defined in the 1940 Act) of the outstanding voting securities of the fund, and (b) the vote of a majority of trustees who are not parties to the Agreement or interested persons (as defined in the 1940 Act) of any such party, cast in person at a meeting called for the purpose of voting on such approval. The Agreement provides that the investment adviser has no liability to the fund for its acts or omissions in the performance of its obligations to the fund not involving willful misconduct, bad faith, gross negligence or reckless disregard of its obligations under the Agreement. The Agreement also provides that either party has the right to terminate it, without penalty, upon 60 days’ written notice to the other party, and that the Agreement automatically terminates in the event of its assignment (as defined in the 1940 Act). In addition, the Agreement provides that the investment adviser may delegate all, or a portion of, its investment management responsibilities to one or more subsidiary advisers approved by the fund’s board, pursuant to an agreement between the investment adviser and such subsidiary. Any such subsidiary adviser will be paid solely by the investment adviser out of its fees.
In addition to providing investment advisory services, the investment adviser furnishes the services and pays the compensation and travel expenses of persons to perform the fund’s executive, administrative, clerical and bookkeeping functions, and provides suitable office space, necessary small office equipment and utilities, general purpose accounting forms, supplies and postage used at the fund’s offices. The fund pays all expenses not assumed by the investment adviser, including, but not limited to: custodian, stock transfer and dividend disbursing fees and expenses; shareholder recordkeeping and administrative expenses; costs of the designing, printing and mailing of reports, prospectuses, proxy statements and notices to its shareholders; taxes; expenses of the issuance and redemption of fund shares (including stock certificates, registration and qualification fees and expenses); expenses pursuant to the fund’s plans of distribution (described below); legal and auditing expenses; compensation, fees and expenses paid to independent trustees; association dues; costs of stationery and forms prepared exclusively for the fund; and costs of assembling and storing shareholder account data.
The Income Fund of America — Page 42
The management fee is based upon the daily net assets of the fund and monthly gross investment income. Gross investment income is determined in accordance with generally accepted accounting principles and does not include gains or losses from sales of capital assets.
The management fee is based upon the following annualized rates and daily net asset levels, plus 2.25% of the fund’s gross investment income for the preceding month:
| Rate | Net asset level | |
| In excess of | Up to | |
| 0.25% | $ 0 | $ 500,000,000 |
| 0.23 | 500,000,000 | 1,000,000,000 |
| 0.21 | 1,000,000,000 | 1,500,000,000 |
| 0.19 | 1,500,000,000 | 2,500,000,000 |
| 0.17 | 2,500,000,000 | 4,000,000,000 |
| 0.16 | 4,000,000,000 | 6,500,000,000 |
| 0.15 | 6,500,000,000 | 10,500,000,000 |
| 0.144 | 10,500,000,000 | 13,000,000,000 |
| 0.141 | 13,000,000,000 | 17,000,000,000 |
| 0.138 | 17,000,000,000 | 21,000,000,000 |
| 0.135 | 21,000,000,000 | 27,000,000,000 |
| 0.133 | 27,000,000,000 | 34,000,000,000 |
| 0.131 | 34,000,000,000 | 44,000,000,000 |
| 0.129 | 44,000,000,000 | 55,000,000,000 |
| 0.127 | 55,000,000,000 | 71,000,000,000 |
| 0.125 | 71,000,000,000 | 89,000,000,000 |
| 0.123 | 89,000,000,000 | 115,000,000,000 |
| 0.121 | 115,000,000,000 | |
For the fiscal years ended July 31, 2016, 2015 and 2014, the investment adviser received from the fund management fees of $207,936,000, $211,829,000 and $206,680,000, respectively.
Administrative services — The investment adviser and its affiliates provide certain administrative services for shareholders of the fund’s Class A, C, T, F, R and 529 shares. Services include, but are not limited to, coordinating, monitoring, assisting and overseeing third parties that provide services to fund shareholders.
These services are provided pursuant to an Administrative Services Agreement (the “Administrative Agreement”) between the fund and the investment adviser relating to the fund’s Class A, C, T, F, R and 529 shares. The Administrative Agreement will continue in effect until January 31, 2018, unless sooner renewed or terminated, and may be renewed from year to year thereafter, provided that any such renewal has been specifically approved at least annually by the vote of a majority of the members of the fund’s board who are not parties to the Administrative Agreement or interested persons (as defined in the 1940 Act) of any such party, cast in person at a meeting called for the purpose of voting on such approval. The fund may terminate the Administrative Agreement at any time by vote of a majority of independent board members. The investment adviser has the right to terminate the Administrative Agreement upon 60 days’ written notice to the fund. The Administrative Agreement automatically terminates in the event of its assignment (as defined in the 1940 Act).
Under the Administrative Agreement, the investment adviser receives an administrative services fee at the annual rate of .01% of the average daily net assets of the fund attributable to Class A shares and .05% of the average daily net assets of the fund attributable to Class C, T, F, R and 529 shares for administrative services. Administrative services fees are paid monthly and accrued daily.
The Income Fund of America — Page 43
During the 2016 fiscal year, administrative services fees were:
| Administrative services fee | |
| Class A | $7,106,000 |
| Class C | 3,001,000 |
| Class F-1 | 2,056,000 |
| Class F-2 | 2,118,000 |
| Class 529-A | 720,000 |
| Class 529-C | 222,000 |
| Class 529-E | 31,000 |
| Class 529-F-1 | 28,000 |
| Class R-1 | 65,000 |
| Class R-2 | 279,000 |
| Class R-2E | 2,000 |
| Class R-3 | 595,000 |
| Class R-4 | 566,000 |
| Class R-5E | —* |
| Class R-5 | 298,000 |
| Class R-6 | 1,825,000 |
*Amount less than $1,000.
Principal Underwriter and plans of distribution — American Funds Distributors, Inc. (the “Principal Underwriter”) is the principal underwriter of the fund’s shares. The Principal Underwriter is located at 333 South Hope Street, Los Angeles, CA 90071; 6455 Irvine Center Drive, Irvine, CA 92618; 3500 Wiseman Boulevard, San Antonio, TX 78251; and 12811 North Meridian Street, Carmel, IN 46032.
The Principal Underwriter receives revenues relating to sales of the fund’s shares, as follows:
· For Class A and 529-A shares, the Principal Underwriter receives commission revenue consisting of the balance of the Class A and 529-A sales charge remaining after the allowances by the Principal Underwriter to investment dealers.
· For Class C and 529-C shares, the Principal Underwriter receives any contingent deferred sales charges that apply during the first year after purchase.
In addition, the fund reimburses the Principal Underwriter for advancing immediate service fees to qualified dealers and advisors upon the sale of Class C and 529-C shares. The fund also reimburses the Principal Underwriter for service fees (and, in the case of Class 529-E shares, commissions) paid on a quarterly basis to intermediaries, such as qualified dealers or financial advisors, in connection with investments in Class T, F-1, 529-E, 529-T, 529-F-1, R-1, R-2, R-2E, R-3 and R-4 shares.
The Income Fund of America — Page 44
Commissions, revenue or service fees retained by the Principal Underwriter after allowances or compensation to dealers were:
| Fiscal year | Commissions, revenue or fees retained |
Allowance
or compensation to dealers | |
| Class A | 2016 | $18,344,000 | $77,613,000 |
| 2015 | 23,148,000 | 98,559,000 | |
| 2014 | 22,017,000 | 94,709,000 | |
| Class C | 2016 | 1,562,000 | 7,114,000 |
| 2015 | — | 10,486,000 | |
| 2014 | 57,000 | 9,289,000 | |
| Class 529-A | 2016 | 470,000 | 2,106,000 |
| 2015 | 551,000 | 2,480,000 | |
| 2014 | 562,000 | 2,551,000 | |
| Class 529-C | 2016 | 18,000 | 335,000 |
| 2015 | 26,000 | 424,000 | |
| 2014 | 23,000 | 447,000 |
Plans of distribution — The fund has adopted plans of distribution (the “Plans”) pursuant to rule 12b-1 under the 1940 Act. The Plans permit the fund to expend amounts to finance any activity primarily intended to result in the sale of fund shares, provided the fund’s board of trustees has approved the category of expenses for which payment is being made.
Each Plan is specific to a particular share class of the fund. As the fund has not adopted a Plan for Class F-2, F-3, R-5E, R-5 or R-6, no 12b-1 fees are paid from Class F-2, F-3, R-5E, R-5 or R-6 share assets and the following disclosure is not applicable to these share classes.
Payments under the Plans may be made for service-related and/or distribution-related expenses. Service-related expenses include paying service fees to qualified dealers. Distribution-related expenses include commissions paid to qualified dealers. The amounts actually paid under the Plans for the past fiscal year, expressed as a percentage of the fund’s average daily net assets attributable to the applicable share class, are disclosed in the prospectus under “Fees and expenses of the fund.” Further information regarding the amounts available under each Plan is in the “Plans of Distribution” section of the prospectus.
The Income Fund of America — Page 45
Following is a brief description of the Plans:
Class A and 529-A — For Class A and 529-A shares, up to .25% of the fund’s average daily net assets attributable to such shares is reimbursed to the Principal Underwriter for paying service-related expenses, and the balance available under the applicable Plan may be paid to the Principal Underwriter for distribution-related expenses. The fund may annually expend up to .25% for Class A shares and up to .50% for Class 529-A shares under the applicable Plan; however, for Class 529-A shares, the board of trustees has approved payments to the Principal Underwriter of up to .25% of the fund’s average daily net assets, in the aggregate, for paying service- and distribution-related expenses.
Distribution-related expenses for Class A and 529-A shares include dealer commissions and wholesaler compensation paid on sales of shares of $1 million or more purchased without a sales charge. Commissions on these “no load” purchases (which are described in further detail under the “Sales Charges” section of this statement of additional information) in excess of the Class A and 529-A Plan limitations and not reimbursed to the Principal Underwriter during the most recent fiscal quarter are recoverable for 15 months, provided that the reimbursement of such commissions does not cause the fund to exceed the annual expense limit. After 15 months, these commissions are not recoverable.
Class T and 529-T — For Class T and 529-T shares, the fund may annually expend up to .50% under the applicable Plan; however, the fund’s board of trustees has approved payments to the Principal Underwriter of up to .25% of the fund’s average daily net assets attributable to Class T and 529-T shares for paying service-related expenses.
Other share classes — The Plans for each of the other share classes that have adopted Plans provide for payments to the Principal Underwriter for paying service-related and distribution-related expenses of up to the following amounts of the fund’s average daily net assets attributable to such shares:
| Share class | Service related payments1 |
Distribution related payments1 |
Total allowable under the Plans2 |
| Class C | 0.25% | 0.75% | 1.00% |
| Class F-1 | 0.25 | — | 0.50 |
| Class 529-C | 0.25 | 0.75 | 1.00 |
| Class 529-E | 0.25 | 0.25 | 0.75 |
| Class 529-F-1 | 0.25 | — | 0.50 |
| Class R-1 | 0.25 | 0.75 | 1.00 |
| Class R-2 | 0.25 | 0.50 | 1.00 |
| Class R-2E | 0.25 | 0.35 | 0.85 |
| Class R-3 | 0.25 | 0.25 | 0.75 |
| Class R-4 | 0.25 | — | 0.50 |
1 Amounts in these columns represent the amounts approved by the board of trustees under the applicable Plan.
2 The fund may annually expend the amounts set forth in this column under the current Plans with the approval of the board of trustees.
Payment of service fees — Payment of service fees to investment dealers generally begins 13 months after establishment of an account in Class A, C, 529-A or 529-C shares. Service fees are not paid on certain investments made at net asset value including accounts established by registered representatives and their family members as described in the “Sales charges” section of this statement of additional information.
The Income Fund of America — Page 46
During the 2016 fiscal year, 12b-1 expenses accrued and paid, and if applicable, unpaid, were:
| 12b-1 expenses | 12b-1
unpaid liability outstanding | |
| Class A | $169,801,000 | $ — |
| Class C | 59,929,000 | — |
| Class F-1 | 10,268,000 | — |
| Class 529-A | 3,244,000 | 128,000 |
| Class 529-C | 4,394,000 | 168,000 |
| Class 529-E | 310,000 | 21,000 |
| Class 529-F-1 | — | — |
| Class R-1 | 1,294,000 | — |
| Class R-2 | 4,145,000 | — |
| Class R-2E | 19,000 | — |
| Class R-3 | 5,925,000 | — |
| Class R-4 | 2,824,000 | — |
Approval of the Plans — As required by rule 12b-1 and the 1940 Act, the Plans (together with the Principal Underwriting Agreement) have been approved by the full board of trustees and separately by a majority of the independent trustees of the fund who have no direct or indirect financial interest in the operation of the Plans or the Principal Underwriting Agreement. In addition, the selection and nomination of independent trustees of the fund are committed to the discretion of the independent trustees during the existence of the Plans.
Potential benefits of the Plans to the fund and its shareholders include enabling shareholders to obtain advice and other services from a financial advisor at a reasonable cost, the likelihood that the Plans will stimulate sales of the fund benefiting the investment process through growth or stability of assets and the ability of shareholders to choose among various alternatives in paying for sales and service. The Plans may not be amended to materially increase the amount spent for distribution without shareholder approval. Plan expenses are reviewed quarterly by the board of trustees and the Plans must be renewed annually by the board of trustees.
A portion of the fund’s 12b-1 expense is paid to financial advisors to compensate them for providing ongoing services. If you have questions regarding your investment in the fund or need assistance with your account, please contact your financial advisor. If you need a financial advisor, please call American Funds Distributors at (800) 421-4120 for assistance.
Fee to Virginia529 — With respect to Class 529 shares, as compensation for its oversight and administration, Virginia529 receives a quarterly fee accrued daily and calculated at the annual rate of .10% on the first $20 billion of the net assets invested in Class 529 shares of the American Funds, .05% on net assets between $20 billion and $100 billion and .03% on net assets over $100 billion. The fee for any given calendar quarter is accrued and calculated on the basis of average net assets of Class 529 shares of the American Funds for the last month of the prior calendar quarter.
The Income Fund of America — Page 47
Other compensation to dealers — As of July 2016, the top dealers (or their affiliates) that American Funds Distributors anticipates will receive additional compensation (as described in the prospectus) include:
AIG Advisor Group
AIG Capital Services Inc
FSC Securities Corporation
Royal Alliance Associates, Inc.
SagePoint Financial, Inc.
Woodbury Financial Services, Inc.
American Portfolios Financial Services, Inc.
American Portfolios Advisors, Inc
American Portfolios Financial Services, Inc.
AXA Advisors, LLC
Cadaret, Grant & Co., Inc.
Cambridge
Cambridge Advisors, Inc.
Cambridge Appleton Trust
Cambridge Associates, LLC (USA)
Cambridge Investment Research Advisors, Inc.
Cambridge Investment Research, Inc.
Cambridge Southern Financial Advisors
Cetera Financial Group
Cetera Advisor Networks LLC
Cetera Advisors LLC
Cetera Financial Specialists LLC
Cetera Investment Services LLC
CIMAS, LLC
First Allied Securities Inc
Investors Capital Corp.
J.P. Turner & Company, L.L.C.
Legend Equities Corporation
Summit Brokerage Services, Inc.
Commonwealth
Commonwealth Advisory Group, LTD
Commonwealth Bank and Trust Company
Commonwealth Financial Advisors, LLC
Commonwealth Financial Group, Inc.
Commonwealth Financial Network
Commonwealth Retirement Services, Inc.
D.A. Davidson & Co.
Edward Jones
Hefren-Tillotson, Inc.
The Income Fund of America — Page 48
HTK / Janney Montgomery Group
Hornor, Townsend & Kent, Inc.
Janney Montgomery Scott LLC
J.J.B. Hilliard Lyons
Hilliard Lyons Trust Company LLC
J. J. B. Hilliard, W. L. Lyons, LLC
J.P. Morgan Chase Banc One
J.P. Morgan Securities LLC
JP Morgan Chase Bank, N.A.
Ladenburg Thalmann Group
Investacorp, Inc.
KMS Financial Services, Inc.
Ladenburg, Thalmann & Co., Inc.
Securities America, Inc.
Securities Service Network Inc.
Triad Advisors, Inc.
Lincoln Network
Lincoln Financial Advisors Corporation
Lincoln Financial Distributors, Inc.
Lincoln Financial Securities Corporation
LPL Financial LLC
Mass Mutual / MML
MassMutual Trust Company FSB
MML Distributors LLC
MML Investors Services, LLC
The Massmutual Trust Company FSB
Merrill Lynch Banc of America
Bank Of America
Bank of America, NA
Merrill Lynch, Pierce, Fenner & Smith Incorporated
Metlife Enterprises
MetLife Advisers, LLC
Metlife Securities Inc.
New England Securities
Morgan Stanley Smith Barney LLC
NFP Securities
Kestra Investment Services LLC
NFP Advisor Services, LLC
NFP Retirement
NMIS
Northwestern Mutual Investment Services, LLC
Northwestern Mutual Wealth Management Co
NPH / Jackson National
Invest Financial Corporation
Investment Centers of America, Inc.
National Planning Corporation
SII Investments, Inc.
Park Avenue Securities LLC
The Income Fund of America — Page 49
PFS
PFS Investments Inc.
Puplava Securities, Inc.
PNC Network
PNC Bank, National Association
PNC Investments LLC
Raymond James Group
Raymond James & Associates, Inc.
Raymond James (USA) LTD.
Raymond James Financial Services Advisors, Inc.
Raymond James Financial Services Inc.
RBC
RBC Capital Markets, LLC
RBC Capital Markets Corporation
RBC Trust Company
Robert W. Baird & Co, Incorporated
Securian / H. Beck / CRI
CRI Securities, LLC
H. Beck, Inc.
Securian Financial Services, Inc.
Stifel, Nicolaus & Co
Sterne Agee Investment Advisor Services, Inc.
Stifel Trust Company, N.A.
Stifel, Nicolaus & Company, Incorported
Transamerica Financial Advisors, Inc.
UBS
UBS Financial Services, Inc.
UBS Securities, LLC
Voya Financial Advisors Inc
Wells Fargo Network
First Clearing LLC
Wells Fargo
Wells Fargo Advisors Financial Network, LLC
Wells Fargo Advisors Latin American Channel
Wells Fargo Advisors LLC (WBS)
Wells Fargo Advisors Private Client Group
Wells Fargo Advisors, LLC
Wells Fargo Bank, N.A.
Wells Fargo Securities, LLC
The Income Fund of America — Page 50
Execution of portfolio transactions
The investment adviser places orders with broker-dealers for the fund’s portfolio transactions. Purchases and sales of equity securities on a securities exchange or an over-the-counter market are effected through broker-dealers who receive commissions for their services. Generally, commissions relating to securities traded on foreign exchanges will be higher than commissions relating to securities traded on U.S. exchanges and may not be subject to negotiation. Equity securities may also be purchased from underwriters at prices that include underwriting fees. Purchases and sales of fixed-income securities are generally made with an issuer or a primary market maker acting as principal with no stated brokerage commission. The price paid to an underwriter for fixed-income securities includes underwriting fees. Prices for fixed-income securities in secondary trades usually include undisclosed compensation to the market maker reflecting the spread between the bid and ask prices for the securities.
In selecting broker-dealers, the investment adviser strives to obtain “best execution” (the most favorable total price reasonably attainable under the circumstances) for the fund’s portfolio transactions, taking into account a variety of factors. These factors include the size and type of transaction, the nature and character of the markets for the security to be purchased or sold, the cost, quality, likely speed and reliability of execution and settlement, the broker-dealer’s or execution venue’s ability to offer liquidity and anonymity and the potential for minimizing market impact. The investment adviser considers these factors, which involve qualitative judgments, when selecting broker-dealers and execution venues for fund portfolio transactions. The investment adviser views best execution as a process that should be evaluated over time as part of an overall relationship with particular broker-dealer firms. The investment adviser and its affiliates negotiate commission rates with broker-dealers based on what they believe is necessary to obtain best execution. They seek, on an ongoing basis, to determine what the reasonable levels of commission rates are in the marketplace in respect of both execution and research — taking various considerations into account, including the extent to which a broker-dealer has put its own capital at risk, historical commission rates, commission rates that other institutional investors are paying, and the provision of brokerage and research products and services. The fund does not consider the investment adviser as having an obligation to obtain the lowest commission rate available for a portfolio transaction to the exclusion of price, service and qualitative considerations. Brokerage commissions are only a small part of total execution costs and other factors, such as market impact and speed of execution, contribute significantly to overall transaction costs.
The investment adviser may execute portfolio transactions with broker-dealers who provide certain brokerage and/or investment research services to it, either directly or through a commission sharing arrangement, but only when in the investment adviser’s judgment the broker-dealer is capable of providing best execution for that transaction. The receipt of these services permits the investment adviser to supplement its own research and analysis and makes available the views of, and information from, individuals and the research staffs of other firms. Such views and information may be provided in the form of written reports, telephone contacts and meetings with securities analysts. These services may include, among other things, reports and other communications with respect to individual companies, industries, countries and regions, economic, political and legal developments, as well as scheduling meetings with corporate executives and seminars and conferences related to relevant subject matters. The investment adviser considers these services to be supplemental to its own internal research efforts and therefore the receipt of investment research from broker-dealers does not tend to reduce the expenses involved in the investment adviser’s research efforts. If broker-dealers were to discontinue providing such services, it is unlikely the investment adviser would attempt to replicate them on its own, in part because they would then no longer provide an independent, supplemental viewpoint. Nonetheless, if it were to attempt to do so, the investment adviser would incur substantial additional costs. Research services that the investment adviser receives from broker-dealers may be used by the investment adviser in servicing the fund and other funds and accounts that it advises; however, not all such services will necessarily benefit the fund.
The Income Fund of America — Page 51
The investment adviser may pay commissions in excess of what other broker-dealers might have charged for certain portfolio transactions in recognition of brokerage and/or investment research services. In this regard, the investment adviser has adopted a brokerage allocation procedure consistent with the requirements of Section 28(e) of the U.S. Securities Exchange Act of 1934. Section 28(e) permits the investment adviser and its affiliates to cause an account to pay a higher commission to a broker-dealer to compensate the broker-dealer or another service provider for certain brokerage and/or investment research services provided to the investment adviser and its affiliates, if the investment adviser and each affiliate makes a good faith determination that such commissions are reasonable in relation to the value of the services provided by such broker-dealer to the investment adviser and its affiliates in terms of that particular transaction or the investment adviser’s overall responsibility to the fund and other accounts that it advises. Certain brokerage and/or investment research services may not necessarily benefit all accounts paying commissions to each such broker-dealer; therefore, the investment adviser and its affiliates assess the reasonableness of commissions in light of the total brokerage and investment research services provided to the investment adviser and its affiliates. Further, investment research services may be used by all investment associates of the investment adviser and its affiliates, regardless of whether they advise accounts with trading activity that generates eligible commissions.
In accordance with their internal brokerage allocation procedure, the investment adviser and its affiliates periodically assess the brokerage and investment research services provided by each broker-dealer and each other service provider from which they receive such services. As part of its ongoing relationships, the investment adviser and its affiliates routinely meet with firms to discuss the level and quality of the brokerage and research services provided, as well as the value and cost of such services. In valuing the brokerage and investment research services the investment adviser and its affiliates receive from broker-dealers and other research providers in connection with its good faith determination of reasonableness, the investment adviser and its affiliates take various factors into consideration, including the quantity, quality and usefulness of the services to the investment adviser and its affiliates. Based on this information and applying their judgment, the investment adviser and its affiliates set an annual research budget.
Research analysts and portfolio managers periodically participate in a research poll to determine the usefulness and value of the research provided by individual broker-dealers and research providers. Based on the results of this research poll, the investment adviser and its affiliates may, through commission sharing arrangements with certain broker-dealers, direct a portion of commissions paid to a broker-dealer to be used to compensate the broker-dealer for proprietary research or to be paid to a third-party research provider for research it has provided.
When executing portfolio transactions in the same equity security for the funds and accounts, or portions of funds and accounts, over which the investment adviser, through its equity investment divisions, has investment discretion, each investment division within the adviser and its affiliates normally aggregates its respective purchases or sales and executes them as part of the same transaction or series of transactions. When executing portfolio transactions in the same fixed-income security for the fund and the other funds or accounts over which it or one of its affiliated companies has investment discretion, the investment adviser normally aggregates such purchases or sales and executes them as part of the same transaction or series of transactions. The objective of aggregating purchases and sales of a security is to allocate executions in an equitable manner among the funds and other accounts that have concurrently authorized a transaction in such security.
The investment adviser currently owns an interest in IEX Group and Luminex Trading and Analytics. The investment adviser may place orders on these or other exchanges or alternative trading systems in which it, or one of its affiliates, has an ownership interest, provided such ownership interest is less than five percent of the total ownership interests in the entity. The investment adviser is subject to the same best execution obligations when trading on any such exchange or alternative trading system.
The Income Fund of America — Page 52
Purchase and sale transactions may be effected directly among and between certain funds or accounts advised by the investment adviser or its affiliates, including the fund. The investment adviser maintains cross-trade policies and procedures and places a cross-trade only when such a trade is in the best interest of all participating clients and is not prohibited by the participating funds’ or accounts’ investment management agreement or applicable law.
The investment adviser may place orders for the fund’s portfolio transactions with broker-dealers who have sold shares of the funds managed by the investment adviser or its affiliated companies; however, it does not consider whether a broker-dealer has sold shares of the funds managed by the investment adviser or its affiliated companies when placing any such orders for the fund’s portfolio transactions.
Forward currency contracts are traded directly between currency traders (usually large commercial banks) and their customers. The cost to the fund of engaging in such contracts varies with factors such as the currency involved, the length of the contract period and the market conditions then prevailing. Because such contracts are entered into on a principal basis, their prices usually include undisclosed compensation to the market maker reflecting the spread between the bid and ask prices for the contracts. The fund may incur additional fees in connection with the purchase or sale of certain contracts.
Brokerage commissions paid on portfolio transactions for the fiscal years ended July 31, 2016, 2015 and 2014 amounted to $26,609,341, $21,966,000, and $25,240,000, respectively. The volume of trading activity increased during the year, resulting in an increase in brokerage commissions paid on portfolio transactions.
The fund is required to disclose information regarding investments in the securities of its “regular” broker-dealers (or parent companies of its regular broker-dealers) that derive more than 15% of their revenue from broker-dealer, underwriter or investment adviser activities. A regular broker-dealer is (a) one of the 10 broker-dealers that received from the fund the largest amount of brokerage commissions by participating, directly or indirectly, in the fund’s portfolio transactions during the fund’s most recently completed fiscal year; (b) one of the 10 broker-dealers that engaged as principal in the largest dollar amount of portfolio transactions of the fund during the fund’s most recently completed fiscal year; or (c) one of the 10 broker-dealers that sold the largest amount of securities of the fund during the fund’s most recently completed fiscal year.
At the end of the fund’s most recently completed fiscal year, the fund’s regular broker-dealers included Morgan Stanley & Co. LLC, Citigroup Inc., Goldman Sachs Group, Inc., Credit Suisse Group AG, and Wells Fargo & Company. As of the fund’s most recently completed fiscal year, the fund held debt securities of Morgan Stanley & Co. LLC in the amount of $44,968,000 and Credit Suisse Group AG in the amount of $24,066,000. The fund held equity and debt securities of Citigroup Inc. in the amount of $256,630,000, Goldman Sachs Group, Inc., in the amount of $314,639,000 and Wells Fargo & Company in the amount of $1,117,390,000.
The Income Fund of America — Page 53
Disclosure of portfolio holdings
The fund’s investment adviser, on behalf of the fund, has adopted policies and procedures with respect to the disclosure of information about fund portfolio securities. These policies and procedures have been reviewed by the fund’s board of trustees, and compliance will be periodically assessed by the board in connection with reporting from the fund’s Chief Compliance Officer.
Under these policies and procedures, the fund’s complete list of portfolio holdings available for public disclosure, dated as of the end of each calendar quarter, is permitted to be posted on the American Funds website no earlier than the 10th day after such calendar quarter. In practice, the publicly disclosed portfolio is typically posted on the American Funds website within 30 days after the end of the calendar quarter. The publicly disclosed portfolio may exclude certain securities when deemed to be in the best interest of the fund as permitted by applicable regulations. In addition, the fund’s list of top 10 equity portfolio holdings measured by percentage of net assets, dated as of the end of each calendar month, is permitted to be posted on the American Funds website no earlier than the 10th day after such month. Such portfolio holdings information may be disclosed to any person pursuant to an ongoing arrangement to disclose portfolio holdings information to such person no earlier than one day after the day on which the information is posted on the American Funds website.
The fund’s custodian, outside counsel, auditor, financial printers, proxy voting service providers, pricing information vendors, consultants or agents operating under a contract with the investment adviser or its affiliates, co-litigants (such as in connection with a bankruptcy proceeding related to a fund holding) and certain other third parties described below, each of which requires portfolio holdings information for legitimate business and fund oversight purposes, may receive fund portfolio holdings information earlier. See the “General information” section in this statement of additional information for further information about the fund’s custodian, outside counsel and auditor.
The fund’s portfolio holdings, dated as of the end of each calendar month, are made available to up to 20 key broker-dealer relationships with research departments to help them evaluate the fund for eligibility on approved lists or in model portfolios. These firms include certain of those listed under the “Other compensation to dealers” section of this statement of additional information and certain broker-dealer firms that offer trading platforms for registered investment advisers. Monthly holdings may be provided to these intermediaries no earlier than the 10th day after the end of the calendar month. In practice, monthly holdings are provided within 30 days after the end of the calendar month. Holdings may also be disclosed more frequently to certain statistical and data collection agencies including Morningstar, Lipper, Inc., Value Line, Vickers Stock Research, Bloomberg and Thomson Financial Research.
Affiliated persons of the fund, including officers of the fund and employees of the investment adviser and its affiliates, who receive portfolio holdings information are subject to restrictions and limitations on the use and handling of such information pursuant to applicable codes of ethics, including requirements not to trade in securities based on confidential and proprietary investment information, to maintain the confidentiality of such information, and to pre-clear securities trades and report securities transactions activity, as applicable. For more information on these restrictions and limitations, please see the “Code of ethics” section in this statement of additional information and the Code of Ethics. Third-party service providers of the fund and other entities, as described in this statement of additional information, receiving such information are subject to confidentiality obligations. When portfolio holdings information is disclosed other than through the American Funds website to persons not affiliated with the fund, such persons will be bound by agreements (including confidentiality agreements) or fiduciary or other obligations that restrict and limit their use of the information to legitimate business uses only. None of the fund, its investment adviser or any of their affiliates receives compensation or other consideration in connection with the disclosure of information about portfolio securities.
The Income Fund of America — Page 54
Subject to board policies, the authority to disclose a fund’s portfolio holdings, and to establish policies with respect to such disclosure, resides with the appropriate investment-related committees of the fund’s investment adviser. In exercising their authority, the committees determine whether disclosure of information about the fund’s portfolio securities is appropriate and in the best interest of fund shareholders. The investment adviser has implemented policies and procedures to address conflicts of interest that may arise from the disclosure of fund holdings. For example, the investment adviser’s code of ethics specifically requires, among other things, the safeguarding of information about fund holdings and contains prohibitions designed to prevent the personal use of confidential, proprietary investment information in a way that would conflict with fund transactions. In addition, the investment adviser believes that its current policy of not selling portfolio holdings information and not disclosing such information to unaffiliated third parties until such holdings have been made public on the American Funds website (other than to certain fund service providers and other third parties for legitimate business and fund oversight purposes) helps reduce potential conflicts of interest between fund shareholders and the investment adviser and its affiliates.
The fund’s investment adviser and its affiliates provide investment advice to clients other than the fund that have investment objectives that may be substantially similar to those of the fund. These clients also may have portfolios consisting of holdings substantially similar to those of the fund and generally have access to current portfolio holdings information for their accounts. These clients do not owe the fund’s investment adviser or the fund a duty of confidentiality with respect to disclosure of their portfolio holdings.
The Income Fund of America — Page 55
Price of shares
Shares are purchased at the offering price or sold at the net asset value price next determined after the purchase or sell order is received by the fund or the Transfer Agent provided that your request contains all information and legal documentation necessary to process the transaction. The Transfer Agent may accept written orders for the sale of fund shares on a future date. These orders are subject to the Transfer Agent’s policies, which generally allow shareholders to provide a written request to sell shares at the net asset value on a specified date no more than five business days after receipt of the order by the Transfer Agent. Any request to sell shares on a future date will be rejected if the request is not in writing, if the requested transaction date is more than five business days after the Transfer Agent receives the request or if the request does not contain all information and legal documentation necessary to process the transaction.
The offering or net asset value price is effective for orders received prior to the time of determination of the net asset value and, in the case of orders placed with dealers or their authorized designees, accepted by the Principal Underwriter, the Transfer Agent, a dealer or any of their designees. In the case of orders sent directly to the fund or the Transfer Agent, an investment dealer should be indicated. The dealer is responsible for promptly transmitting purchase and sell orders to the Principal Underwriter.
Orders received by the investment dealer or authorized designee, the Transfer Agent or the fund after the time of the determination of the net asset value will be entered at the next calculated offering price. Note that investment dealers or other intermediaries may have their own rules about share transactions and may have earlier cut-off times than those of the fund. For more information about how to purchase through your intermediary, contact your intermediary directly.
Prices that appear in the newspaper do not always indicate prices at which you will be purchasing and redeeming shares of the fund, since such prices generally reflect the previous day’s closing price, while purchases and redemptions are made at the next calculated price. The price you pay for shares, the offering price, is based on the net asset value per share, which is calculated once daily as of approximately 4 p.m. New York time, which is the normal close of trading on the New York Stock Exchange, each day the New York Stock Exchange is open. If, for example, the New York Stock Exchange closes at 1 p.m. New York time, the fund’s share price would still be determined as of 4 p.m. New York time. In such example, portfolio securities traded on the New York Stock Exchange would be valued at their closing prices unless the investment adviser determines that a fair value adjustment is appropriate due to subsequent events. The New York Stock Exchange is currently closed on weekends and on the following holidays: New Year’s Day; Martin Luther King, Jr. Day; Presidents’ Day; Good Friday; Memorial Day; Independence Day; Labor Day; Thanksgiving; and Christmas Day. Each share class of the fund has a separately calculated net asset value (and share price).
All portfolio securities of funds managed by Capital Research and Management Company (other than American Funds U.S. Government Money Market Fund) are valued, and the net asset values per share for each share class are determined, as indicated below. The fund follows standard industry practice by typically reflecting changes in its holdings of portfolio securities on the first business day following a portfolio trade.
Equity securities, including depositary receipts, are generally valued at the official closing price of, or the last reported sale price on, the exchange or market on which such securities are traded, as of the close of business on the day the securities are being valued or, lacking any sales, at the last available bid price. Prices for each security are taken from the principal exchange or market on which the security trades.
The Income Fund of America — Page 56
Fixed-income securities, including short-term securities, are generally valued at prices obtained from one or more pricing vendors. The pricing vendors base prices on, among other things, benchmark yields, transactions, bids, offers, quotations from dealers and trading systems, new issues, underlying equity of the issuer, interest rate volatilities, spreads and other relationships observed in the markets among comparable securities and proprietary pricing models such as yield measures calculated using factors such as cash flows, prepayment information, default rates, delinquency and loss assumptions, financial or collateral characteristics or performance, credit enhancements, liquidation value calculations, specific deal information and other reference data. The fund’s investment adviser performs certain checks on vendor prices prior to calculation of the fund’s net asset value. When the investment adviser deems it appropriate to do so (such as when vendor prices are unavailable or not deemed to be representative), fixed-income securities will be valued in good faith at the mean quoted bid and ask prices that are reasonably and timely available (or bid prices, if ask prices are not available) or at prices for securities of comparable maturity, quality and type.
Securities with both fixed-income and equity characteristics (e.g., convertible bonds, preferred stocks, units comprised of more than one type of security, etc.), or equity securities traded principally among fixed-income dealers, are generally valued in the manner described above for either equity or fixed-income securities, depending on which method is deemed most appropriate by the investment adviser.
Forward currency contracts are valued at the mean of representative quoted bid and ask prices, generally based on prices supplied by one or more pricing vendors.
Assets or liabilities initially expressed in terms of currencies other than U.S. dollars are translated prior to the next determination of the net asset value of the fund’s shares into U.S. dollars at the prevailing market rates.
Securities and other assets for which representative market quotations are not readily available or are considered unreliable by the investment adviser are valued at fair value as determined in good faith under fair value guidelines adopted by authority of the fund’s board. Subject to board oversight, the fund’s board has appointed the fund’s investment adviser to make fair valuation determinations, which are directed by a valuation committee established by the fund’s investment adviser. The board receives regular reports describing fair-valued securities and the valuation methods used.
The valuation committee has adopted guidelines and procedures (consistent with SEC rules and guidance) to consider certain relevant principles and factors when making fair value determinations. As a general principle, securities lacking readily available market quotations, or that have quotations that are considered unreliable by the investment adviser, are valued in good faith by the valuation committee based upon what the fund might reasonably expect to receive upon their current sale. Fair valuations and valuations of investments that are not actively trading involve judgment and may differ materially from valuations that would have been used had greater market activity occurred. The valuation committee considers relevant indications of value that are reasonably and timely available to it in determining the fair value to be assigned to a particular security, such as the type and cost of the security, contractual or legal restrictions on resale of the security, relevant financial or business developments of the issuer, actively traded similar or related securities, conversion or exchange rights on the security, related corporate actions, significant events occurring after the close of trading in the security and changes in overall market conditions. The valuation committee employs additional fair value procedures to address issues related to equity securities that trade principally in markets outside the United States. Such securities may trade in markets that open and close at different times, reflecting time zone differences. If significant events occur after the close of a market (and before the fund’s net asset values are next determined) which affect the value of equity securities held in the fund’s portfolio, appropriate adjustments from closing market prices may be made to reflect these events. Events of this type could include, for example, earthquakes and other natural disasters or significant price changes in other markets (e.g., U.S. stock markets).
The Income Fund of America — Page 57
Each class of shares represents interests in the same portfolio of investments and is identical in all respects to each other class, except for differences relating to distribution, service and other charges and expenses, certain voting rights, differences relating to eligible investors, the designation of each class of shares, conversion features and exchange privileges. Expenses attributable to the fund, but not to a particular class of shares, are borne by each class pro rata based on relative aggregate net assets of the classes. Expenses directly attributable to a class of shares are borne by that class of shares. Liabilities attributable to particular share classes, such as liabilities for repurchase of fund shares, are deducted from total assets attributable to such share classes.
Net assets so obtained for each share class are then divided by the total number of shares outstanding of that share class, and the result, rounded to the nearest cent, is the net asset value per share for that class.
The Income Fund of America — Page 58
Taxes and distributions
Disclaimer: Some of the following information may not apply to certain shareholders, including those holding fund shares in a tax-favored account, such as a retirement plan or education savings account. Shareholders should consult their tax advisors about the application of federal, state and local tax law in light of their particular situation.
Taxation as a regulated investment company — The fund intends to qualify each year as a “regulated investment company” under Subchapter M of the Internal Revenue Code of 1986, as amended (the “Code”), so that it will not be liable for federal tax on income and capital gains distributed to shareholders. In order to qualify as a regulated investment company, and avoid being subject to federal income taxes, the fund intends to distribute substantially all of its net investment income and realized net capital gains on a fiscal year basis, and intends to comply with other tests applicable to regulated investment companies under Subchapter M.
The Code includes savings provisions allowing the fund to cure inadvertent failures of certain qualification tests required under Subchapter M. However, should the fund fail to qualify under Subchapter M, the fund would be subject to federal, and possibly state, corporate taxes on its taxable income and gains.
Amounts not distributed by the fund on a timely basis in accordance with a calendar year distribution requirement may be subject to a nondeductible 4% excise tax. Unless an applicable exception applies, to avoid the tax, the fund must distribute during each calendar year an amount equal to the sum of (a) at least 98% of its ordinary income (not taking into account any capital gains or losses) for the calendar year, (b) at least 98.2% of its capital gains in excess of its capital losses for the twelve month period ending on October 31, and (c) all ordinary income and capital gains for previous years that were not distributed during such years.
Dividends paid by the fund from ordinary income or from an excess of net short-term capital gain over net long-term capital loss are taxable to shareholders as ordinary income dividends.
The fund may declare a capital gain distribution consisting of the excess of net realized long-term capital gains over net realized short-term capital losses. Net capital gains for a fiscal year are computed by taking into account any capital loss carryforward of the fund. For fund fiscal years beginning on or after December 22, 2010, capital losses may be carried forward indefinitely and retain their character as either short-term or long-term. Under prior law, net capital losses could be carried forward for eight tax years and were treated as short-term capital losses. The fund is required to use capital losses arising in fiscal years beginning on or after December 22, 2010 before using capital losses arising in fiscal years prior to December 22, 2010.
The fund may retain a portion of net capital gain for reinvestment and may elect to treat such capital gain as having been distributed to shareholders of the fund. Shareholders may receive a credit for the tax that the fund paid on such undistributed net capital gain and would increase the basis in their shares of the fund by the difference between the amount of includible gains and the tax deemed paid by the shareholder.
Distributions of net capital gain that the fund properly designates as a capital gain distribution generally will be taxable as long-term capital gain, regardless of the length of time the shares of the fund have been held by a shareholder. Any loss realized upon the redemption of shares held at the time of redemption for six months or less from the date of their purchase will be treated as a long-term capital loss to the extent of any capital gain distributions (including any undistributed amounts treated as distributed capital gains, as described above) during such six-month period.
The Income Fund of America — Page 59
Capital gain distributions by the fund result in a reduction in the net asset value of the fund’s shares. Investors should consider the tax implications of buying shares just prior to a capital gain distribution. The price of shares purchased at that time includes the amount of the forthcoming distribution. Those purchasing just prior to a distribution will subsequently receive a partial return of their investment capital upon payment of the distribution, which will be taxable to them.
Redemptions and exchanges of fund shares — Redemptions of shares, including exchanges for shares of other American Funds, may result in federal, state and local tax consequences (gain or loss) to the shareholder.
Any loss realized on a redemption or exchange of shares of the fund will be disallowed to the extent substantially identical shares are reacquired within the 61-day period beginning 30 days before and ending 30 days after the shares are disposed of. Any loss disallowed under this rule will be added to the shareholder’s tax basis in the new shares purchased.
If a shareholder exchanges or otherwise disposes of shares of the fund within 90 days of having acquired such shares, and if, as a result of having acquired those shares, the shareholder subsequently pays a reduced or no sales charge for shares of the fund, or of a different fund acquired before January 31st of the year following the year the shareholder exchanged or otherwise disposed of the original fund shares, the sales charge previously incurred in acquiring the fund’s shares will not be taken into account (to the extent such previous sales charges do not exceed the reduction in sales charges) for the purposes of determining the amount of gain or loss on the exchange, but will be treated as having been incurred in the acquisition of such other fund(s).
Tax consequences of investing in non-U.S. securities — Dividend and interest income received by the fund from sources outside the United States may be subject to withholding and other taxes imposed by such foreign jurisdictions. Tax conventions between certain countries and the United States, however, may reduce or eliminate these foreign taxes. Some foreign countries impose taxes on capital gains with respect to investments by foreign investors.
If more than 50% of the value of the total assets of the fund at the close of the taxable year consists of securities of foreign corporations, the fund may elect to pass through to shareholders the foreign taxes paid by the fund. If such an election is made, shareholders may claim a credit or deduction on their federal income tax returns for, and will be required to treat as part of the amounts distributed to them, their pro rata portion of qualified taxes paid by the fund to foreign countries. The application of the foreign tax credit depends upon the particular circumstances of each shareholder.
Foreign currency gains and losses, including the portion of gain or loss on the sale of debt securities attributable to fluctuations in foreign exchange rates, are generally taxable as ordinary income or loss. These gains or losses may increase or decrease the amount of dividends payable by the fund to shareholders. A fund may elect to treat gain and loss on certain foreign currency contracts as capital gain and loss instead of ordinary income or loss.
If the fund invests in stock of certain passive foreign investment companies (PFICs), the fund intends to mark-to-market these securities and recognize any gains at the end of its fiscal and excise tax years. Deductions for losses are allowable only to the extent of any previously recognized gains. Both gains and losses will be treated as ordinary income or loss, and the fund is required to distribute any resulting income. If the fund is unable to identify an investment as a PFIC security and thus does not make a timely mark-to-market election, the fund may be subject to adverse tax consequences.
Other tax considerations — After the end of each calendar year, individual shareholders holding fund shares in taxable accounts will receive a statement of the federal income tax status of all distributions.
The Income Fund of America — Page 60
Shareholders of the fund also may be subject to state and local taxes on distributions received from the fund.
For fund shares acquired on or after January 1, 2012, the fund is required to report cost basis information for redemptions, including exchanges, to both shareholders and the IRS.
Shareholders may obtain more information about cost basis online at americanfunds.com/costbasis.
Under the backup withholding provisions of the Code, the fund generally will be required to withhold federal income tax on all payments made to a shareholder if the shareholder either does not furnish the fund with the shareholder’s correct taxpayer identification number or fails to certify that the shareholder is not subject to backup withholding. Backup withholding also applies if the IRS notifies the shareholder or the fund that the taxpayer identification number provided by the shareholder is incorrect or that the shareholder has previously failed to properly report interest or dividend income.
The foregoing discussion of U.S. federal income tax law relates solely to the application of that law to U.S. persons (i.e., U.S. citizens and legal residents and U.S. corporations, partnerships, trusts and estates). Each shareholder who is not a U.S. person should consider the U.S. and foreign tax consequences of ownership of shares of the fund, including the possibility that such a shareholder may be subject to U.S. withholding taxes.
The Income Fund of America — Page 61
Unless otherwise noted, all references in the following pages to Class A, C, T or F-1 shares also refer to the corresponding Class 529-A, 529-C, 529-T or 529-F-1 shares. Class 529 shareholders should also refer to the applicable program description for information on policies and services specifically relating to these accounts. Shareholders holding shares through an eligible retirement plan should contact their plan’s administrator or recordkeeper for information regarding purchases, sales and exchanges.
Purchase and exchange of shares
Purchases by individuals — As described in the prospectus, you may generally open an account and purchase fund shares by contacting a financial advisor or investment dealer authorized to sell the fund’s shares. You may make investments by any of the following means:
Contacting your financial advisor — Deliver or mail a check to your financial advisor.
By mail — For initial investments, you may mail a check, made payable to the fund, directly to the address indicated on the account application. Please indicate an investment dealer on the account application. You may make additional investments by filling out the “Account Additions” form at the bottom of a recent transaction confirmation and mailing the form, along with a check made payable to the fund, using the envelope provided with your confirmation.
The amount of time it takes for us to receive regular U.S. postal mail may vary and there is no assurance that we will receive such mail on the day you expect. Mailing addresses for regular U.S. postal mail can be found in the prospectus. To send investments or correspondence to us via overnight mail or courier service, use either of the following addresses:
American Funds
12711 North Meridian Street
Carmel, IN 46032-9181
American Funds
5300 Robin Hood Road
Norfolk, VA 23513-2407
By telephone — Using the American FundsLine. Please see the “Shareholder account services and privileges” section of this statement of additional information for more information regarding this service.
By Internet — Using americanfunds.com. Please see the “Shareholder account services and privileges” section of this statement of additional information for more information regarding this service.
The Income Fund of America — Page 62
By wire — If you are making a wire transfer, instruct your bank to wire funds to:
Wells Fargo Bank
ABA Routing No. 121000248
Account No. 4600-076178
Your bank should include the following information when wiring funds:
For credit to the account of:
American Funds Service Company
(fund’s name)
For further credit to:
(shareholder’s fund account number)
(shareholder’s name)
You may contact American Funds Service Company at (800) 421-4225 if you have questions about making wire transfers.
Other purchase information — Class 529 shares may be purchased only through CollegeAmerica by investors establishing qualified higher education savings accounts. Class 529-E shares may be purchased only by investors participating in CollegeAmerica through an eligible employer plan. The American Funds state tax-exempt funds are qualified for sale only in certain jurisdictions, and tax-exempt funds in general should not serve as retirement plan investments. In addition, the fund and the Principal Underwriter reserve the right to reject any purchase order.
Class R-5 and R-6 shares may be made available to certain charitable foundations organized and maintained by The Capital Group Companies, Inc. or its affiliates.
Class R-5 and R-6 shares may also be made available to Virginia529 for use in the Virginia Education Savings Trust and the Virginia Prepaid Education Program and other registered investment companies approved by the fund’s investment adviser or distributor. Class R-6 shares are also available to other post employment benefits plans.
Purchase minimums and maximums — All investments are subject to the purchase minimums and maximums described in the prospectus. As noted in the prospectus, purchase minimums may be waived or reduced in certain cases.
In the case of American Funds non-tax-exempt funds, the initial purchase minimum of $25 may be waived for the following account types:
· Payroll deduction retirement plan accounts (such as, but not limited to, 403(b), 401(k), SIMPLE IRA, SARSEP and deferred compensation plan accounts); and
· Employer-sponsored CollegeAmerica accounts.
The Income Fund of America — Page 63
The following account types may be established without meeting the initial purchase minimum:
· Retirement accounts that are funded with employer contributions; and
· Accounts that are funded with monies set by court decree.
The following account types may be established without meeting the initial purchase minimum, but shareholders wishing to invest in two or more funds must meet the normal initial purchase minimum of each fund:
· Accounts that are funded with (a) transfers of assets, (b) rollovers from retirement plans, (c) rollovers from 529 college savings plans or (d) required minimum distribution automatic exchanges; and
· American Funds U.S. Government Money Market Fund accounts registered in the name of clients of Capital Group Private Client Services.
Certain accounts held on the fund’s books, known as omnibus accounts, contain multiple underlying accounts that are invested in shares of the fund. These underlying accounts are maintained by entities such as financial intermediaries and are subject to the applicable initial purchase minimums as described in the prospectus and this statement of additional information. However, in the case where the entity maintaining these accounts aggregates the accounts’ purchase orders for fund shares, such accounts are not required to meet the fund’s minimum amount for subsequent purchases.
Exchanges — With the exception of Class T shares, for which rights of exchange are not generally available, you may only exchange shares without a sales charge into other American Funds within the same share class; however, Class A, C, T or F-1 shares may also generally be exchanged without a sales charge for the corresponding 529 share class.
Notwithstanding the above, exchanges from Class A shares of American Funds U.S. Government Money Market Fund may be made to Class C shares of other American Funds for dollar cost averaging purposes. However, exchanges are not permitted from Class A shares of American Funds U.S. Government Money Market Fund to Class C shares of (1) American Funds Short-Term Tax-Exempt Bond Fund, (2) Intermediate Bond Fund of America, (3) Limited Term Tax-Exempt Bond Fund of America, (4) Short-Term Bond Fund of America or (5) American Funds Inflation Linked Bond Fund.
Exchange purchases are subject to the minimum investment requirements of the fund purchased and no sales charge generally applies. However, exchanges of shares from American Funds U.S. Government Money Market Fund are subject to applicable sales charges, unless the American Funds U.S. Government Money Market Fund shares were acquired by an exchange from a fund having a sales charge, or by reinvestment or cross-reinvestment of dividends or capital gain distributions.
Exchanges of Class F shares generally may only be made through fee-based programs of investment firms that have special agreements with the fund’s distributor and certain registered investment advisors.
You may exchange shares of other classes by contacting the Transfer Agent, by contacting your investment dealer or financial advisor, by using American FundsLine or americanfunds.com, or by telephoning (800) 421-4225 toll-free, or faxing (see “American Funds Service Company service areas” in the prospectus for the appropriate fax numbers) the Transfer Agent. For more information, see “Shareholder account services and privileges” in this statement of additional information. These transactions have the same tax consequences as ordinary sales and purchases.
Shares held in employer-sponsored retirement plans may be exchanged into other American Funds by contacting your plan administrator or recordkeeper. Exchange redemptions and purchases are
The Income Fund of America — Page 64
processed simultaneously at the share prices next determined after the exchange order is received (see “Price of shares” in this statement of additional information).
Conversion — Currently, Class C shares of the fund automatically convert to Class F-1 shares in the month of the 10-year anniversary of the purchase date. The board of trustees of the fund reserves the right at any time, without shareholder approval, to amend the conversion feature of the Class C shares, including without limitation, providing for conversion into a different share class or for no conversion. In making its decision, the board of trustees will consider, among other things, the effect of any such amendment on shareholders.
Frequent trading of fund shares — As noted in the prospectus, certain redemptions may trigger a purchase block lasting 30 calendar days under the fund’s “purchase blocking policy.” Under this policy, systematic redemptions will not trigger a purchase block and systematic purchases will not be prevented if the entity maintaining the shareholder account is able to identify the transaction as a systematic redemption or purchase. For purposes of this policy, systematic redemptions include, for example, regular periodic automatic redemptions and statement of intention escrow share redemptions. Systematic purchases include, for example, regular periodic automatic purchases and automatic reinvestments of dividends and capital gain distributions. Generally, purchases and redemptions will not be considered “systematic” unless the transaction is prescheduled for a specific date.
Other potentially abusive activity — In addition to implementing purchase blocks, American Funds Service Company will monitor for other types of activity that could potentially be harmful to the American Funds — for example, short-term trading activity in multiple funds. When identified, American Funds Service Company will request that the shareholder discontinue the activity. If the activity continues, American Funds Service Company will freeze the shareholder account to prevent all activity other than redemptions of fund shares.
Moving between share classes
If you wish to “move” your investment between share classes (within the same fund or between different funds), we generally will process your request as an exchange of the shares you currently hold for shares in the new class or fund. Below is more information about how sales charges are handled for various scenarios.
Exchanging Class C shares for Class A or Class T shares — If you exchange Class C shares for Class A or Class T shares, you are still responsible for paying any Class C contingent deferred sales charges and applicable Class A or Class T sales charges.
Exchanging Class C shares for Class F shares — If you are part of a qualified fee-based program or approved self-directed platform and you wish to exchange your Class C shares for Class F shares to be held in the program, you are still responsible for paying any applicable Class C contingent deferred sales charges.
Exchanging Class F shares for Class A shares — You can exchange Class F shares held in a qualified fee-based program for Class A shares without paying an initial Class A sales charge if you are leaving or have left the fee-based program. You can exchange Class F shares received in a conversion from Class C shares for Class A shares at any time without paying an initial Class A sales charge if you notify American Funds Service Company of the conversion when you make your request. If you have already redeemed your Class F shares, the foregoing requirements apply and you must purchase Class A shares within 90 days after redeeming your Class F shares to receive the Class A shares without paying an initial Class A sales charge.
The Income Fund of America — Page 65
Exchanging Class A or Class T shares for Class F shares — If you are part of a qualified fee-based program or approved self-directed platform and you wish to exchange your Class A or Class T shares for Class F shares to be held in the program, any Class A or Class T sales charges (including contingent deferred sales charges) that you paid or are payable will not be credited back to your account.
Exchanging Class A shares for Class R shares — Provided it is eligible to invest in Class R shares, a retirement plan currently invested in Class A shares may exchange its shares for Class R shares. Any Class A sales charges that the retirement plan previously paid will not be credited back to the plan’s account.
Moving between Class F shares — If you are part of a qualified fee-based program that offers Class F shares, you may exchange your Class F shares for any other Class F shares to be held in the program. For example, if you hold Class F-2 shares, you may exchange your shares for Class F-1 or Class F-3 shares to be held in the program.
Moving between other share classes — If you desire to move your investment between share classes and the particular scenario is not described in this statement of additional information, please contact American Funds Service Company at (800) 421-4225 for more information.
Non-reportable transactions — Automatic conversions described in the prospectus will be non-reportable for tax purposes. In addition, an exchange of shares from one share class of a fund to another share class of the same fund will be treated as a non-reportable exchange for tax purposes, provided that the exchange request is received in writing by American Funds Service Company and processed as a single transaction. However, a movement between a 529 share class and a non-529 share class of the same fund will be reportable.
The Income Fund of America — Page 66
Sales charges
Class A purchases
Purchases by certain 403(b) plans
A 403(b) plan may not invest in Class A or C shares of any of the American Funds unless such plan was invested in Class A or C shares before January 1, 2009.
Participant accounts of a 403(b) plan that invested in Class A or C shares of any of the American Funds and were treated as an individual-type plan for sales charge purposes before January 1, 2009, may continue to be treated as accounts of an individual-type plan for sales charge purposes. Participant accounts of a 403(b) plan that invested in Class A or C shares of any of the American Funds and were treated as an employer-sponsored plan for sales charge purposes before January 1, 2009, may continue to be treated as accounts of an employer-sponsored plan for sales charge purposes. Participant accounts of a 403(b) plan that was established on or after January 1, 2009, are treated as accounts of an employer-sponsored plan for sales charge purposes.
Purchases by SEP plans and SIMPLE IRA plans
Participant accounts in a Simplified Employee Pension (SEP) plan or a Savings Incentive Match Plan for Employees of Small Employers IRA (SIMPLE IRA) will be aggregated at the plan level for Class A sales charge purposes if an employer adopts a prototype plan produced by American Funds Distributors, Inc. or (a) the employer or plan sponsor submits all contributions for all participating employees in a single contribution transmittal or the contributions are identified as related to the same plan; (b) each transmittal is accompanied by checks or wire transfers and generally must be submitted through the transfer agent’s automated contribution system if held on the fund’s books; and (c) if the fund is expected to carry separate accounts in the name of each plan participant and (i) the employer or plan sponsor notifies the funds’ transfer agent or the intermediary holding the account that the separate accounts of all plan participants should be linked and (ii) all new participant accounts are established by submitting the appropriate documentation on behalf of each new participant. Participant accounts in a SEP or SIMPLE plan that are eligible to aggregate their assets at the plan level may not also aggregate the assets with their individual accounts. The ability to link SEP and SIMPLE IRA accounts at the plan level may not be available to you depending on the policies and system capabilities of your financial intermediary.
The Income Fund of America — Page 67
Other purchases
Pursuant to a determination of eligibility by a vice president or more senior officer of the Capital Research and Management Company Fund Administration Unit, or by his or her designee, Class A shares of the American Funds may be sold at net asset value to:
| (1) | current or retired directors, trustees, officers and advisory board members of, and certain lawyers who provide services to, the funds managed by Capital Research and Management Company, current or retired employees and partners of The Capital Group Companies, Inc. and its affiliated companies, certain family members of the above persons, and trusts or plans primarily for such persons; | |
| (2) | companies exchanging securities with the fund through a merger, acquisition or exchange offer; and | |
| (3) | The Capital Group Companies, Inc. and its affiliated companies. |
Shares are offered at net asset value to these persons and organizations due to anticipated economies in sales effort and expense. Once an account is established under this net asset value privilege, additional investments can be made at net asset value for the life of the account. Depending on the financial intermediary holding your account, these privileges may be unavailable. Investors should consult their financial intermediary for further information.
Transfers to CollegeAmerica — A transfer from the Virginia Prepaid Education ProgramSM or the Virginia Education Savings TrustSM to a CollegeAmerica account will be made with no sales charge. No commission will be paid to the dealer on such a transfer. Investment dealers will be compensated solely with an annual service fee that begins to accrue immediately.
Moving between accounts — American Funds investments by certain account types may be moved to other account types without incurring additional Class A sales charges. These transactions include:
· redemption proceeds from a non-retirement account (for example, a joint tenant account) used to purchase fund shares in an IRA or other individual-type retirement account;
· required minimum distributions from an IRA or other individual-type retirement account used to purchase fund shares in a non-retirement account; and
· death distributions paid to a beneficiary’s account that are used by the beneficiary to purchase fund shares in a different account.
These privileges are generally available only if your account is held directly with the fund’s transfer agent or if the financial intermediary holding your account has the systems, policies and procedures to support providing the privileges on their systems. Investors should consult their financial intermediary for further information.
Loan repayments — Repayments on loans taken from a retirement plan are not subject to sales charges if American Funds Service Company is notified of the repayment.
Dealer commissions and compensation — Commissions (up to 1.00%) are paid to dealers who initiate and are responsible for certain Class A share purchases not subject to initial sales charges. These purchases consist of a) purchases of $1 million or more, and b) purchases by employer-sponsored defined contribution-type retirement plans investing $1 million or more or with 100 or more eligible employees. Commissions on such investments (other than IRA rollover assets that roll over at no sales
The Income Fund of America — Page 68
charge under the fund’s IRA rollover policy as described in the prospectus) are paid to dealers at the following rates: 1.00% on amounts of less than $10 million, .50% on amounts of at least $10 million but less than $25 million and .25% on amounts of at least $25 million. Commissions are based on cumulative investments over the life of the account with no adjustment for redemptions, transfers, or market declines. For example, if a shareholder has accumulated investments in excess of $10 million (but less than $25 million) and subsequently redeems all or a portion of the account(s), purchases following the redemption will generate a dealer commission of .50%.
A dealer concession of up to 1% may be paid by the fund under its Class A plan of distribution to reimburse the Principal Underwriter in connection with dealer and wholesaler compensation paid by it with respect to investments made with no initial sales charge.
The Income Fund of America — Page 69
Sales charge reductions and waivers
Reducing your Class A sales charge — As described in the prospectus, there are various ways to reduce your sales charge when purchasing Class A shares. Additional information about Class A sales charge reductions is provided below.
Statement of intention — By establishing a statement of intention (the "Statement"), you enter into a nonbinding commitment to purchase shares of the American Funds (excluding American Funds U.S. Government Money Market Fund) over a 13-month period and receive the same sales charge (expressed as a percentage of your purchases) as if all shares had been purchased at once, unless the Statement is upgraded as described below.
The Statement period starts on the date on which your first purchase made toward satisfying the Statement is processed. Your accumulated holdings (as described in the paragraph below titled “Rights of accumulation”) eligible to be aggregated as of the day immediately before the start of the Statement period may be credited toward satisfying the Statement.
You may revise the commitment you have made in your Statement upward at any time during the Statement period. If your prior commitment has not been met by the time of the revision, the Statement period during which purchases must be made will remain unchanged. Purchases made from the date of the revision will receive the reduced sales charge, if any, resulting from the revised Statement. If your prior commitment has been met by the time of the revision, your original Statement will be considered met and a new Statement will be established.
The Statement will be considered completed if the shareholder dies within the 13-month Statement period. Commissions to dealers will not be adjusted or paid on the difference between the Statement amount and the amount actually invested before the shareholder’s death.
When a shareholder elects to use a Statement, shares equal to 5% of the dollar amount specified in the Statement may be held in escrow in the shareholder’s account out of the initial purchase (or subsequent purchases, if necessary) by the Transfer Agent. All dividends and any capital gain distributions on shares held in escrow will be credited to the shareholder’s account in shares (or paid in cash, if requested). If the intended investment is not completed within the specified Statement period the investments made during the statement period will be adjusted to reflect the difference between the sales charge actually paid and the sales charge which would have been paid if the total of such purchases had been made at a single time. Any dealers assigned to the shareholder’s account at the time a purchase was made during the Statement period will receive a corresponding commission adjustment if appropriate.
In addition, if you currently have individual holdings in American Legacy variable annuity contracts or variable life insurance policies that were established on or before March 31, 2007, you may continue to apply purchases under such contracts and policies to a Statement.
Shareholders purchasing shares at a reduced sales charge under a Statement indicate their acceptance of these terms and those in the prospectus with their first purchase.
Aggregation — Qualifying investments for aggregation include those made by you and your “immediate family” as defined in the prospectus, if all parties are purchasing shares for their own accounts and/or:
The Income Fund of America — Page 70
· individual-type employee benefit plans, such as an IRA, single-participant Keogh-type plan, or a participant account of a 403(b) plan that is treated as an individual-type plan for sales charge purposes (see “Purchases by certain 403(b) plans” under “Sales charges” in this statement of additional information);
· SEP plans and SIMPLE IRA plans established after November 15, 2004, by an employer adopting any plan document other than a prototype plan produced by American Funds Distributors, Inc.;
· business accounts solely controlled by you or your immediate family (for example, you own the entire business);
· trust accounts established by you or your immediate family (for trusts with only one primary beneficiary, upon the trustor’s death the trust account may be aggregated with such beneficiary’s own accounts; for trusts with multiple primary beneficiaries, upon the trustor’s death the trustees of the trust may instruct American Funds Service Company to establish separate trust accounts for each primary beneficiary; each primary beneficiary’s separate trust account may then be aggregated with such beneficiary’s own accounts);
· endowments or foundations established and controlled by you or your immediate family; or
· 529 accounts, which will be aggregated at the account owner level (Class 529-E accounts may only be aggregated with an eligible employer plan).
Individual purchases by a trustee(s) or other fiduciary(ies) may also be aggregated if the investments are:
· for a single trust estate or fiduciary account, including employee benefit plans other than the individual-type employee benefit plans described above;
· made for two or more employee benefit plans of a single employer or of affiliated employers as defined in the 1940 Act, excluding the individual-type employee benefit plans described above;
· for a diversified common trust fund or other diversified pooled account not specifically formed for the purpose of accumulating fund shares;
· for nonprofit, charitable or educational organizations, or any endowments or foundations established and controlled by such organizations, or any employer-sponsored retirement plans established for the benefit of the employees of such organizations, their endowments, or their foundations;
· for participant accounts of a 403(b) plan that is treated as an employer-sponsored plan for sales charge purposes (see “Purchases by certain 403(b) plans” under “Sales charges” in this statement of additional information), or made for participant accounts of two or more such plans, in each case of a single employer or affiliated employers as defined in the 1940 Act; or
· for a SEP or SIMPLE IRA plan established after November 15, 2004, by an employer adopting a prototype plan produced by American Funds Distributors, Inc.
Purchases made for nominee or street name accounts (securities held in the name of an investment dealer or another nominee such as a bank trust department instead of the customer) may not be aggregated with those made for other accounts and may not be aggregated with other nominee or street name accounts unless otherwise qualified as described above.
The Income Fund of America — Page 71
Joint accounts may be aggregated with other accounts belonging to the primary owner and/or his or her immediate family. The primary owner of a joint account is the individual responsible for taxes on the account.
Concurrent purchases — As described in the prospectus, you may reduce your Class A sales charge by combining purchases of all classes of shares in the American Funds, as well as applicable holdings in the American Funds Target Date Retirement Series, American Funds Portfolio Series, American Funds Retirement Income Portfolio Series and American Funds College Target Date Series. Shares of American Funds U.S. Government Money Market Fund purchased through an exchange, reinvestment or cross-reinvestment from a fund having a sales charge also qualify. However, direct purchases of American Funds U.S. Government Money Market Fund are excluded. If you currently have individual holdings in American Legacy variable annuity contracts or variable life insurance policies that were established on or before March 31, 2007, you may continue to combine purchases made under such contracts and policies to reduce your Class A sales charge.
Rights of accumulation — Subject to the limitations described in the aggregation policy, you may take into account your accumulated holdings in all share classes of the American Funds, as well as applicable holdings in the American Funds Target Date Retirement Series, American Funds Portfolio Series, American Funds Retirement Income Portfolio Series and American Funds College Target Date Series, to determine your sales charge on investments in accounts eligible to be aggregated. Direct purchases of American Funds U.S. Government Money Market Fund are excluded. Subject to your investment dealer’s or recordkeeper’s capabilities, your accumulated holdings will be calculated as the higher of (a) the current value of your existing holdings (the “market value”) as of the day prior to your American Funds investment or (b) the amount you invested (including reinvested dividends and capital gains, but excluding capital appreciation) less any withdrawals (the “cost value”). Depending on the entity on whose books your account is held, the value of your holdings in that account may not be eligible for calculation at cost value. For example, accounts held in nominee or street name may not be eligible for calculation at cost value and instead may be calculated at market value for purposes of rights of accumulation.
The value of all of your holdings in accounts established in calendar year 2005 or earlier will be assigned an initial cost value equal to the market value of those holdings as of the last business day of 2005. Thereafter, the cost value of such accounts will increase or decrease according to actual investments or withdrawals. You must contact your financial advisor or American Funds Service Company if you have additional information that is relevant to the calculation of the value of your holdings.
When determining your American Funds Class A sales charge, if your investment is not in an employer-sponsored retirement plan, you may also continue to take into account the market value (as of the day prior to your American Funds investment) of your individual holdings in various American Legacy variable annuity contracts and variable life insurance policies that were established on or before March 31, 2007. An employer-sponsored retirement plan may also continue to take into account the market value of its investments in American Legacy Retirement Investment Plans that were established on or before March 31, 2007.
You may not purchase Class C or 529-C shares if such combined holdings cause you to be eligible to purchase Class A or 529-A shares at the $1 million or more sales charge discount rate (i.e. at net asset value).
The Income Fund of America — Page 72
If you make a gift of American Funds Class A shares, upon your request, you may purchase the shares at the sales charge discount allowed under rights of accumulation of all of your American Funds and applicable American Legacy accounts.
Reducing your Class T sales charge — As described in the prospectus, the initial sales charge you pay each time you buy Class T shares may differ depending upon the amount you invest and may be reduced for larger purchases. Additionally, Class T shares acquired through reinvestment of dividends or capital gain distributions are not subject to an initial sales charge. Sales charges on Class T shares are normally applied on a transaction-by-transaction basis, and, accordingly, Class T shares are not generally eligible for any other sales charge waivers or reductions, including through the aggregation of Class T shares concurrently purchased by other related accounts or in other American Funds. The sales charge applicable to Class T shares may not be reduced by establishing a statement of intention, and rights of accumulation are not available for Class T shares.
CDSC waivers for Class A and C shares — As noted in the prospectus, a contingent deferred sales charge (“CDSC”) may be waived for redemptions due to death or post-purchase disability of a shareholder (this generally excludes accounts registered in the names of trusts and other entities). In the case of joint tenant accounts, if one joint tenant dies, a surviving joint tenant, at the time he or she notifies the Transfer Agent of the other joint tenant’s death and removes the decedent’s name from the account, may redeem shares from the account without incurring a CDSC. Redemptions made after the Transfer Agent is notified of the death of a joint tenant will be subject to a CDSC.
In addition, a CDSC may be waived for the following types of transactions, if they do not exceed 12% of the value of an “account” (defined below) annually (the “12% limit”):
· Required minimum distributions taken from retirement accounts upon the shareholder’s attainment of age 70½ (required minimum distributions that continue to be taken by the beneficiary(ies) after the account owner is deceased also qualify for a waiver).
· Redemptions through an automatic withdrawal plan (“AWP”) (see “Automatic withdrawals” under “Shareholder account services and privileges” in this statement of additional information). For each AWP payment, assets that are not subject to a CDSC, such as shares acquired through reinvestment of dividends and/or capital gain distributions, will be redeemed first and will count toward the 12% limit. If there is an insufficient amount of assets not subject to a CDSC to cover a particular AWP payment, shares subject to the lowest CDSC will be redeemed next until the 12% limit is reached. Any dividends and/or capital gain distributions taken in cash by a shareholder who receives payments through an AWP will also count toward the 12% limit. In the case of an AWP, the 12% limit is calculated at the time an automatic redemption is first made, and is recalculated at the time each additional automatic redemption is made. Shareholders who establish an AWP should be aware that the amount of a payment not subject to a CDSC may vary over time depending on fluctuations in the value of their accounts. This privilege may be revised or terminated at any time.
For purposes of this paragraph, “account” means your investment in the applicable class of shares of the particular fund from which you are making the redemption.
Pursuant to a determination of eligibility by a vice president or more senior officer of the Capital Research and Management Company Fund Administration Unit, or by his or her designee, the CDSC on Class A shares of the American Funds may be waived for bulk conversions to another share class in cases where the fund’s transfer agent determines the benefit to the fund of collecting the CDSC would be outweighed by the cost of applying it.
The Income Fund of America — Page 73
CDSC waivers are allowed only in the cases listed here and in the prospectus. For example, CDSC waivers will not be allowed on redemptions of Class 529-C shares due to termination of CollegeAmerica; a determination by the Internal Revenue Service that CollegeAmerica does not qualify as a qualified tuition program under the Code; proposal or enactment of law that eliminates or limits the tax-favored status of CollegeAmerica; or elimination of the fund by Virginia529 as an option for additional investment within CollegeAmerica.
Other sales charge waivers — Sales charges (including contingent deferred sales charges) may be waived pursuant to a determination of eligibility by a vice president or more senior officer of the Capital Research and Management Company Fund Business Management Group, or by his or her designee. For example, waivers of all or a portion of the contingent deferred sales charge on Class C shares may be granted for transactions requested by financial intermediaries as a result of (i) pending or anticipated regulatory matters that require investor accounts to be moved to a different share class or (ii) conversions of IRAs from brokerage to advisory accounts in cases where new investments in brokerage IRA accounts have been restricted by the intermediary.
The Income Fund of America — Page 74
Selling shares
The methods for selling (redeeming) shares are described more fully in the prospectus. If you wish to sell your shares by contacting American Funds Service Company directly, any such request must be signed by the registered shareholders. To contact American Funds Service Company via overnight mail or courier service, see “Purchase and exchange of shares.”
A signature guarantee may be required for certain redemptions. In such an event, your signature may be guaranteed by a domestic stock exchange or the Financial Industry Regulatory Authority, bank, savings association or credit union that is an eligible guarantor institution. The Transfer Agent reserves the right to require a signature guarantee on any redemptions.
Additional documentation may be required for sales of shares held in corporate, partnership or fiduciary accounts. You must include with your written request any shares you wish to sell that are in certificate form.
If you sell Class A or C shares and request a specific dollar amount to be sold, we will sell sufficient shares so that the sale proceeds, after deducting any applicable CDSC, equals the dollar amount requested.
If you hold multiple American Funds and a CDSC applies to the shares you are redeeming, the CDSC will be calculated based on the applicable class of shares of the particular fund from which you are making the redemption.
Redemption proceeds will not be mailed until sufficient time has passed to provide reasonable assurance that checks or drafts (including certified or cashier’s checks) for shares purchased have cleared (which may take up to 10 business days from the purchase date). Except for delays relating to clearance of checks for share purchases or in extraordinary circumstances (and as permissible under the 1940 Act), sale proceeds will be paid on or before the seventh day following receipt and acceptance of an order. Interest will not accrue or be paid on amounts that represent uncashed distribution or redemption checks.
You may request that redemption proceeds of $1,000 or more from American Funds U.S. Government Money Market Fund be wired to your bank by writing American Funds Service Company. A signature guarantee is required on all requests to wire funds.
The Income Fund of America — Page 75
Shareholder account services and privileges
The following services and privileges are generally available to all shareholders. However, certain services and privileges described in the prospectus and this statement of additional information may not be available for Class 529 shareholders or if your account is held with an investment dealer or through an employer-sponsored retirement plan.
Automatic investment plan — An automatic investment plan enables you to make monthly or quarterly investments in the American Funds through automatic debits from your bank account. To set up a plan, you must fill out an account application and specify the amount that you would like to invest and the date on which you would like your investments to occur. The plan will begin within 30 days after your account application is received. Your bank account will be debited on the day or a few days before your investment is made, depending on the bank’s capabilities. The Transfer Agent will then invest your money into the fund you specified on or around the date you specified. If the date you specified falls on a weekend or holiday, your money will be invested on the following business day. However, if the following business day falls in the next month, your money will be invested on the business day immediately preceding the weekend or holiday. If your bank account cannot be debited due to insufficient funds, a stop-payment or the closing of the account, the plan may be terminated and the related investment reversed. You may change the amount of the investment or discontinue the plan at any time by contacting the Transfer Agent.
Automatic reinvestment — Dividends and capital gain distributions are reinvested in additional shares of the same class and fund at net asset value unless you indicate otherwise on the account application. You also may elect to have dividends and/or capital gain distributions paid in cash by informing the fund, the Transfer Agent or your investment dealer. Dividends and capital gain distributions paid to retirement plan shareholders or shareholders of the 529 share classes will be automatically reinvested.
If you have elected to receive dividends and/or capital gain distributions in cash, and the postal or other delivery service is unable to deliver checks to your address of record, or you do not respond to mailings from American Funds Service Company with regard to uncashed distribution checks, your distribution option may be automatically converted to having all dividends and other distributions reinvested in additional shares.
Cross-reinvestment of dividends and distributions — For all share classes, except Class T shares and the 529 classes of shares, you may cross-reinvest dividends and capital gains (distributions) into other American Funds in the same share class at net asset value, subject to the following conditions:
(1) the aggregate value of your account(s) in the fund(s) paying distributions equals or exceeds $5,000 (this is waived if the value of the account in the fund receiving the distributions equals or exceeds that fund’s minimum initial investment requirement);
(2) if the value of the account of the fund receiving distributions is below the minimum initial investment requirement, distributions must be automatically reinvested; and
(3) if you discontinue the cross-reinvestment of distributions, the value of the account of the fund receiving distributions must equal or exceed the minimum initial investment requirement. If you do not meet this requirement within 90 days of notification, the fund has the right to automatically redeem the account.
Depending on the financial intermediary holding your account, your reinvestment privileges may be unavailable or differ from those described in this statement of additional information. Investors should consult their financial intermediary for further information.
The Income Fund of America — Page 76
Automatic exchanges — For all share classes other than Class T shares, you may automatically exchange shares of the same class in amounts of $50 or more among any of the American Funds on any day (or preceding business day if the day falls on a nonbusiness day) of each month you designate.
Automatic withdrawals — Depending on the type of account, for all share classes except R shares, you may automatically withdraw shares from any of the American Funds. You can make automatic withdrawals of $50 or more. You can designate the day of each period for withdrawals and request that checks be sent to you or someone else. Withdrawals may also be electronically deposited to your bank account. The Transfer Agent will withdraw your money from the fund you specify on or around the date you specify. If the date you specified falls on a weekend or holiday, the redemption will take place on the previous business day. However, if the previous business day falls in the preceding month, the redemption will take place on the following business day after the weekend or holiday. You should consult with your advisor or intermediary to determine if your account is eligible for automatic withdrawals.
Withdrawal payments are not to be considered as dividends, yield or income. Generally, automatic investments may not be made into a shareholder account from which there are automatic withdrawals. Withdrawals of amounts exceeding reinvested dividends and distributions and increases in share value would reduce the aggregate value of the shareholder’s account. The Transfer Agent arranges for the redemption by the fund of sufficient shares, deposited by the shareholder with the Transfer Agent, to provide the withdrawal payment specified.
Redemption proceeds from an automatic withdrawal plan are not eligible for reinvestment without a sales charge.
Account statements — Your account is opened in accordance with your registration instructions. Transactions in the account, such as additional investments, will be reflected on regular confirmation statements from the Transfer Agent. Dividend and capital gain reinvestments, purchases through automatic investment plans and certain retirement plans, as well as automatic exchanges and withdrawals, will be confirmed at least quarterly.
American FundsLine and americanfunds.com — You may check your share balance, the price of your shares or your most recent account transaction; redeem shares (up to $125,000 per American Funds shareholder each day) from nonretirement plan accounts; or exchange shares around the clock with American FundsLine or using americanfunds.com. To use American FundsLine, call (800) 325-3590 from a TouchTone™ telephone. Redemptions and exchanges through American FundsLine and americanfunds.com are subject to the conditions noted above and in “Telephone and Internet purchases, redemptions and exchanges” below. You will need your fund number (see the list of the American Funds under the “General information — fund numbers” section in this statement of additional information), personal identification number (generally the last four digits of your Social Security number or other tax identification number associated with your account) and account number.
Generally, all shareholders are automatically eligible to use these services. However, if you are not currently authorized to do so, you may complete an American FundsLink Authorization Form. Once you establish this privilege, you, your financial advisor or any person with your account information may use these services.
Telephone and Internet purchases, redemptions and exchanges — By using the telephone (including American FundsLine) or the Internet (including americanfunds.com), or fax purchase, redemption and/or exchange options, you agree to hold the fund, the Transfer Agent, any of its affiliates or mutual funds managed by such affiliates, and each of their respective directors, trustees, officers, employees and agents harmless from any losses, expenses, costs or liabilities (including attorney fees) that may be incurred in connection with the exercise of these privileges. Generally, all shareholders are
The Income Fund of America — Page 77
automatically eligible to use these services. However, you may elect to opt out of these services by writing the Transfer Agent (you may also reinstate them at any time by writing the Transfer Agent). If the Transfer Agent does not employ reasonable procedures to confirm that the instructions received from any person with appropriate account information are genuine, it and/or the fund may be liable for losses due to unauthorized or fraudulent instructions. In the event that shareholders are unable to reach the fund by telephone because of technical difficulties, market conditions or a natural disaster, redemption and exchange requests may be made in writing only.
Checkwriting — You may establish check writing privileges for Class A shares (but not Class 529-A shares) of American Funds U.S. Government Money Market Fund upon meeting the fund’s initial purchase minimum of $1,000. This can be done by using an account application. If you request check writing privileges, you will be provided with checks that you may use to draw against your account. These checks may be made payable to anyone you designate and must be signed by the authorized number of registered shareholders exactly as indicated on your account application.
Redemption of shares — The fund’s declaration of trust permits the fund to direct the Transfer Agent to redeem the shares of any shareholder for their then current net asset value per share if at such time the shareholder of record owns shares having an aggregate net asset value of less than the minimum initial investment amount required of new shareholders as set forth in the fund’s current registration statement under the 1940 Act, and subject to such further terms and conditions as the board of trustees of the fund may from time to time adopt.
While payment of redemptions normally will be in cash, the fund’s declaration of trust permits payment of the redemption price wholly or partly with portfolio securities or other fund assets under conditions and circumstances determined by the fund’s board of trustees. For example, redemptions could be made in this manner if the board determined that making payments wholly in cash over a particular period would be unfair and/or harmful to other fund shareholders.
Share certificates — Shares are credited to your account. The fund does not issue share certificates.
The Income Fund of America — Page 78
General information
Custodian of assets — Securities and cash owned by the fund, including proceeds from the sale of shares of the fund and of securities in the fund’s portfolio, are held by JP Morgan Chase Bank N.A., 270 Park Avenue, New York, NY 10017-2070, as custodian. If the fund holds securities of issuers outside the U.S., the custodian may hold these securities pursuant to subcustodial arrangements in banks outside the U.S. or branches of U.S. banks outside the U.S.
Transfer agent services — American Funds Service Company, a wholly owned subsidiary of the investment adviser, maintains the records of shareholder accounts, processes purchases and redemptions of the fund’s shares, acts as dividend and capital gain distribution disbursing agent, and performs other related shareholder service functions. The principal office of American Funds Service Company is located at 6455 Irvine Center Drive, Irvine, CA 92618. Transfer agent fees are paid according to a fee schedule, based principally on the number of accounts serviced, contained in a Shareholder Services Agreement between the fund and American Funds Service Company.
In the case of certain shareholder accounts, third parties who may be unaffiliated with the investment adviser provide transfer agency and shareholder services in place of American Funds Service Company. These services are rendered under agreements with American Funds Service Company or its affiliates and the third parties receive compensation according to such agreements. Compensation for transfer agency and shareholder services, whether paid to American Funds Service Company or such third parties, is ultimately paid from fund assets and is reflected in the expenses of the fund as disclosed in the prospectus.
During the 2016 fiscal year, transfer agent fees, gross of any payments made by American Funds Service Company to third parties, were:
| Transfer agent fee | |
| Class A | $54,344,000 |
| Class C | 4,638,000 |
| Class F-1 | 4,992,000 |
| Class F-2 | 4,545,000 |
| Class 529-A | 931,000 |
| Class 529-C | 311,000 |
| Class 529-E | 18,000 |
| Class 529-F-1 | 36,000 |
| Class R-1 | 114,000 |
| Class R-2 | 1,854,000 |
| Class R-2E | 5,000 |
| Class R-3 | 1,663,000 |
| Class R-4 | 1,040,000 |
| Class R-5E | —* |
| Class R-5 | 273,000 |
| Class R-6 | 16,000 |
*Amount less than $1,000.
Independent registered public accounting firm — Deloitte & Touche LLP, 695 Town Center Drive, Costa Mesa, CA 92626, serves as the fund’s independent registered public accounting firm, providing audit services, preparation of tax returns and review of certain documents to be filed with the SEC. The financial statements included in this statement of additional information from the annual report have been audited by Deloitte & Touche LLP, an independent registered public accounting firm, as stated in their report appearing herein. Such financial statements have been so included in reliance upon the report of such firm given upon their authority as experts in accounting and auditing. The selection of the fund’s independent registered public accounting firm is reviewed and determined annually by the board of trustees.
The Income Fund of America — Page 79
Independent legal counsel — Morgan, Lewis & Bockius LLP, 300 South Grand Avenue, 22nd Floor, Los Angeles, CA 90071, serves as independent legal counsel (“counsel”) for the fund and for independent trustees in their capacities as such. A determination with respect to the independence of the fund’s counsel will be made at least annually by the independent trustees of the fund, as prescribed by applicable 1940 Act rules.
Prospectuses, reports to shareholders and proxy statements — The fund’s fiscal year ends on July 31. Shareholders are provided updated summary prospectuses annually and at least semi-annually with reports showing the fund’s investment portfolio or summary investment portfolio, financial statements and other information. Shareholders may request a copy of the fund’s current prospectus at no cost by calling (800) 421-4225 or by sending an email request to prospectus@americanfunds.com. Shareholders may also access the fund’s current summary prospectus, prospectus, statement of additional information and shareholder reports at americanfunds.com/prospectus. The fund’s annual financial statements are audited by the fund’s independent registered public accounting firm, Deloitte & Touche LLP. In addition, shareholders may also receive proxy statements for the fund. In an effort to reduce the volume of mail shareholders receive from the fund when a household owns more than one account, the Transfer Agent has taken steps to eliminate duplicate mailings of summary prospectuses, shareholder reports and proxy statements. To receive additional copies of a summary prospectus, report or proxy statement, shareholders should contact the Transfer Agent.
Shareholders may also elect to receive updated summary prospectuses, annual reports and semi-annual reports electronically by signing up for electronic delivery on our website, americanfunds.com. Upon electing the electronic delivery of updated summary prospectuses and other reports, a shareholder will no longer automatically receive such documents in paper form by mail. A shareholder who elects electronic delivery is able to cancel this service at any time and return to receiving updated summary prospectuses and other reports in paper form by mail.
Summary prospectuses, prospectuses, annual reports and semi-annual reports that are mailed to shareholders by the American Funds organization are printed with ink containing soy and/or vegetable oil on paper containing recycled fibers.
Codes of ethics — The fund and Capital Research and Management Company and its affiliated companies, including the fund’s Principal Underwriter, have adopted codes of ethics that allow for personal investments, including securities in which the fund may invest from time to time. These codes include a ban on acquisitions of securities pursuant to an initial public offering; restrictions on acquisitions of private placement securities; preclearance and reporting requirements; review of duplicate confirmation statements; annual recertification of compliance with codes of ethics; blackout periods on personal investing for certain investment personnel; ban on short-term trading profits for investment personnel; limitations on service as a director of publicly traded companies; disclosure of personal securities transactions; and policies regarding political contributions.
The Income Fund of America — Page 80
Determination of net asset value, redemption price and maximum offering price per share for Class A shares — January 31, 2017
| Net
asset value and redemption price per share (Net assets divided by shares outstanding) |
$21.95 |
| Maximum
offering price per share (100/94.25 of net asset value per share, which takes into account the fund’s current maximum sales charge) |
$23.29 |
Other information — The fund reserves the right to modify the privileges described in this statement of additional information at any time.
The fund’s financial statements, including the investment portfolio and the report of the fund’s independent registered public accounting firm contained in the annual report, are included in this statement of additional information.
The Income Fund of America — Page 81
Fund numbers — Here are the fund numbers for use with our automated telephone line, American FundsLine®, or when making share transactions:
| Fund numbers | ||||||
| Fund | Class A | Class C | Class T | Class F-1 | Class F-2 | Class F-3 |
| Stock and stock/fixed income funds | ||||||
| AMCAP Fund® | 002 | 302 | 43002 | 402 | 602 | 702 |
| American Balanced Fund® | 011 | 311 | 43011 | 411 | 611 | 711 |
| American Funds Developing World Growth and Income FundSM | 30100 | 33100 | 43100 | 34100 | 36100 | 37100 |
| American Funds Global Balanced FundSM | 037 | 337 | 43037 | 437 | 637 | 737 |
| American Mutual Fund® | 003 | 303 | 43003 | 403 | 603 | 703 |
| Capital Income Builder® | 012 | 312 | 43012 | 412 | 612 | 712 |
| Capital World Growth and Income Fund® | 033 | 333 | 43033 | 433 | 633 | 733 |
| EuroPacific Growth Fund® | 016 | 316 | 43016 | 416 | 616 | 716 |
| Fundamental Investors® | 010 | 310 | 43010 | 410 | 610 | 710 |
| The Growth Fund of America® | 005 | 305 | 43005 | 405 | 605 | 705 |
| The Income Fund of America® | 006 | 306 | 43006 | 406 | 606 | 706 |
| International Growth and Income FundSM | 034 | 334 | 43034 | 434 | 634 | 734 |
| The Investment Company of America® | 004 | 304 | 43004 | 404 | 604 | 704 |
| The New Economy Fund® | 014 | 314 | 43014 | 414 | 614 | 714 |
| New Perspective Fund® | 007 | 307 | 43007 | 407 | 607 | 707 |
| New World Fund® | 036 | 336 | 43036 | 436 | 636 | 736 |
| SMALLCAP World Fund® | 035 | 335 | 43035 | 435 | 635 | 735 |
| Washington Mutual Investors FundSM | 001 | 301 | 43001 | 401 | 601 | 701 |
| Fixed income funds | ||||||
| American Funds Emerging Markets Bond Fund SM | 30114 | 33114 | 43114 | 34114 | 36114 | 37114 |
| American Funds Corporate Bond Fund SM | 032 | 332 | 43032 | 432 | 632 | 732 |
| American Funds Inflation Linked Bond Fund® | 060 | 360 | 43060 | 460 | 660 | 760 |
| American Funds Mortgage Fund® | 042 | 342 | 43042 | 442 | 642 | 742 |
| American
Funds Short-Term Tax-Exempt Bond Fund® |
039 | N/A | 43039 | 439 | 639 | 739 |
| American Funds Strategic Bond FundSM | 30112 | 33112 | 43112 | 34112 | 36112 | 37112 |
| American
Funds Tax-Exempt Fund of New York® |
041 | 341 | 43041 | 441 | 641 | 741 |
| American High-Income Municipal Bond Fund® | 040 | 340 | 43040 | 440 | 640 | 740 |
| American High-Income Trust® | 021 | 321 | 43021 | 421 | 621 | 721 |
| The Bond Fund of America® | 008 | 308 | 43008 | 408 | 608 | 708 |
| Capital World Bond Fund® | 031 | 331 | 43031 | 431 | 631 | 731 |
| Intermediate Bond Fund of America® | 023 | 323 | 43023 | 423 | 623 | 723 |
| Limited
Term Tax-Exempt Bond Fund of America® |
043 | 343 | 43043 | 443 | 643 | 743 |
| Short-Term Bond Fund of America® | 048 | 348 | 43048 | 448 | 648 | 748 |
| The Tax-Exempt Bond Fund of America® | 019 | 319 | 43019 | 419 | 619 | 719 |
| The Tax-Exempt Fund of California® | 020 | 320 | 43020 | 420 | 620 | 720 |
| U.S. Government Securities Fund® | 022 | 322 | 43022 | 422 | 622 | 722 |
| Money market fund | ||||||
| American
Funds U.S. Government Money Market FundSM |
059 | 359 | 43059 | 459 | 659 | 759 |
The Income Fund of America — Page 82
| Fund numbers | |||||
| Fund | Class
529-A |
Class 529-C |
Class 529-E |
Class 529-T |
Class 529-F-1 |
| Stock and stock/fixed income funds | |||||
| AMCAP Fund | 1002 | 1302 | 1502 | 46002 | 1402 |
| American Balanced Fund | 1011 | 1311 | 1511 | 46011 | 1411 |
| American Funds Developing World Growth and Income Fund | 10100 | 13100 | 15100 | 46100 | 14100 |
| American Funds Global Balanced Fund | 1037 | 1337 | 1537 | 46037 | 1437 |
| American Mutual Fund | 1003 | 1303 | 1503 | 46003 | 1403 |
| Capital Income Builder | 1012 | 1312 | 1512 | 46012 | 1412 |
| Capital World Growth and Income Fund | 1033 | 1333 | 1533 | 46033 | 1433 |
| EuroPacific Growth Fund | 1016 | 1316 | 1516 | 46016 | 1416 |
| Fundamental Investors | 1010 | 1310 | 1510 | 46010 | 1410 |
| The Growth Fund of America | 1005 | 1305 | 1505 | 46005 | 1405 |
| The Income Fund of America | 1006 | 1306 | 1506 | 46006 | 1406 |
| International Growth and Income Fund | 1034 | 1334 | 1534 | 46034 | 1434 |
| The Investment Company of America | 1004 | 1304 | 1504 | 46004 | 1404 |
| The New Economy Fund | 1014 | 1314 | 1514 | 46014 | 1414 |
| New Perspective Fund | 1007 | 1307 | 1507 | 46007 | 1407 |
| New World Fund | 1036 | 1336 | 1536 | 46036 | 1436 |
| SMALLCAP World Fund | 1035 | 1335 | 1535 | 46035 | 1435 |
| Washington Mutual Investors Fund | 1001 | 1301 | 1501 | 46001 | 1401 |
| Fixed income funds | |||||
| American Funds Emerging Markets Bond Fund | 10114 | 13114 | 15114 | 46114 | 14114 |
| American Funds Corporate Bond Fund | 1032 | 1332 | 1532 | 46032 | 1432 |
| American Funds Inflation Linked Bond Fund | 1060 | 1360 | 1560 | 46060 | 1460 |
| American Funds Mortgage Fund | 1042 | 1342 | 1542 | 46042 | 1442 |
| American Funds Strategic Bond Fund | 10112 | 13112 | 15112 | 46112 | 14112 |
| American High-Income Trust | 1021 | 1321 | 1521 | 46021 | 1421 |
| The Bond Fund of America | 1008 | 1308 | 1508 | 46008 | 1408 |
| Capital World Bond Fund | 1031 | 1331 | 1531 | 46031 | 1431 |
| Intermediate Bond Fund of America | 1023 | 1323 | 1523 | 46023 | 1423 |
| Short-Term Bond Fund of America | 1048 | 1348 | 1548 | 46048 | 1448 |
| U.S. Government Securities Fund | 1022 | 1322 | 1522 | 46022 | 1422 |
| Money market fund | |||||
| American
Funds U.S. Government Money Market Fund |
1059 | 1359 | 1559 | 46059 | 1459 |
The Income Fund of America — Page 83
| Fund numbers | ||||||||
| Fund | Class R-1 |
Class R-2 |
Class R-2E |
Class R-3 |
Class R-4 |
Class R-5E |
Class R-5 |
Class R-6 |
| Stock and stock/fixed income funds | ||||||||
| AMCAP Fund | 2102 | 2202 | 4102 | 2302 | 2402 | 2702 | 2502 | 2602 |
| American Balanced Fund | 2111 | 2211 | 4111 | 2311 | 2411 | 2711 | 2511 | 2611 |
| American Funds Developing World Growth and Income Fund | 21100 | 22100 | 41100 | 23100 | 24100 | 27100 | 25100 | 26100 |
| American Funds Global Balanced Fund | 2137 | 2237 | 4137 | 2337 | 2437 | 2737 | 2537 | 2637 |
| American Mutual Fund | 2103 | 2203 | 4103 | 2303 | 2403 | 2703 | 2503 | 2603 |
| Capital Income Builder | 2112 | 2212 | 4112 | 2312 | 2412 | 2712 | 2512 | 2612 |
| Capital World Growth and Income Fund | 2133 | 2233 | 4133 | 2333 | 2433 | 2733 | 2533 | 2633 |
| EuroPacific Growth Fund | 2116 | 2216 | 4116 | 2316 | 2416 | 2716 | 2516 | 2616 |
| Fundamental Investors | 2110 | 2210 | 4110 | 2310 | 2410 | 2710 | 2510 | 2610 |
| The Growth Fund of America | 2105 | 2205 | 4105 | 2305 | 2405 | 2705 | 2505 | 2605 |
| The Income Fund of America | 2106 | 2206 | 4106 | 2306 | 2406 | 2706 | 2506 | 2606 |
| International Growth and Income Fund | 2134 | 2234 | 41034 | 2334 | 2434 | 27034 | 2534 | 2634 |
| The Investment Company of America | 2104 | 2204 | 4104 | 2304 | 2404 | 2704 | 2504 | 2604 |
| The New Economy Fund | 2114 | 2214 | 4114 | 2314 | 2414 | 2714 | 2514 | 2614 |
| New Perspective Fund | 2107 | 2207 | 4107 | 2307 | 2407 | 2707 | 2507 | 2607 |
| New World Fund | 2136 | 2236 | 4136 | 2336 | 2436 | 2736 | 2536 | 2636 |
| SMALLCAP World Fund | 2135 | 2235 | 4135 | 2335 | 2435 | 2735 | 2535 | 2635 |
| Washington Mutual Investors Fund | 2101 | 2201 | 4101 | 2301 | 2401 | 2701 | 2501 | 2601 |
| Fixed income funds | ||||||||
| American Funds Emerging Markets Bond Fund | 21114 | 22114 | 41114 | 23114 | 24114 | 27114 | 25114 | 26114 |
| American Funds Corporate Bond Fund | 2132 | 2232 | 4132 | 2332 | 2432 | 2732 | 2532 | 2632 |
| American Funds Inflation Linked Bond Fund | 2160 | 2260 | 4160 | 2360 | 2460 | 2760 | 2560 | 2660 |
| American Funds Mortgage Fund | 2142 | 2242 | 4142 | 2342 | 2442 | 2742 | 2542 | 2642 |
| American Funds Strategic Bond Fund | 21112 | 22112 | 41112 | 23112 | 24112 | 27112 | 25112 | 26112 |
| American High-Income Trust | 2121 | 2221 | 4121 | 2321 | 2421 | 2721 | 2521 | 2621 |
| The Bond Fund of America | 2108 | 2208 | 4108 | 2308 | 2408 | 2708 | 2508 | 2608 |
| Capital World Bond Fund | 2131 | 2231 | 4131 | 2331 | 2431 | 2731 | 2531 | 2631 |
| Intermediate Bond Fund of America | 2123 | 2223 | 4123 | 2323 | 2423 | 2723 | 2523 | 2623 |
| Short-Term Bond Fund of America | 2148 | 2248 | 4148 | 2348 | 2448 | 2748 | 2548 | 2648 |
| U.S. Government Securities Fund | 2122 | 2222 | 4122 | 2322 | 2422 | 2722 | 2522 | 2622 |
| Money market fund | ||||||||
| American
Funds U.S. Government Money Market Fund |
2159 | 2259 | 4159 | 2359 | 2459 | 2759 | 2559 | 2659 |
The Income Fund of America — Page 84
| Fund numbers | ||||||
| Fund | Class A | Class C | Class T | Class F-1 | Class F-2 | Class F-3 |
| American Funds Target Date Retirement Series® | ||||||
| American Funds 2060 Target Date Retirement Fund® | 083 | 383 | 43083 | 483 | 683 | 783 |
| American Funds 2055 Target Date Retirement Fund® | 082 | 382 | 43082 | 482 | 682 | 782 |
| American Funds 2050 Target Date Retirement Fund® | 069 | 369 | 43069 | 469 | 669 | 769 |
| American Funds 2045 Target Date Retirement Fund® | 068 | 368 | 43068 | 468 | 668 | 768 |
| American Funds 2040 Target Date Retirement Fund® | 067 | 367 | 43067 | 467 | 667 | 767 |
| American Funds 2035 Target Date Retirement Fund® | 066 | 366 | 43066 | 466 | 36066 | 766 |
| American Funds 2030 Target Date Retirement Fund® | 065 | 365 | 43065 | 465 | 665 | 765 |
| American Funds 2025 Target Date Retirement Fund® | 064 | 364 | 43064 | 464 | 664 | 764 |
| American Funds 2020 Target Date Retirement Fund® | 063 | 363 | 43063 | 463 | 663 | 763 |
| American Funds 2015 Target Date Retirement Fund® | 062 | 362 | 43062 | 462 | 662 | 762 |
| American Funds 2010 Target Date Retirement Fund® | 061 | 361 | 43061 | 461 | 661 | 761 |
| Fund numbers | ||||||||
| Fund | Class R-1 |
Class R-2 |
Class R-2E |
Class R-3 |
Class R-4 |
Class R-5E |
Class R-5 |
Class R-6 |
| American Funds Target Date Retirement Series® | ||||||||
| American
Funds 2060 Target Date Retirement Fund® |
2183 | 2283 | 4183 | 2383 | 2483 | 2783 | 2583 | 2683 |
| American
Funds 2055 Target Date Retirement Fund® |
2182 | 2282 | 4182 | 2382 | 2482 | 2782 | 2582 | 2682 |
| American
Funds 2050 Target Date Retirement Fund® |
2169 | 2269 | 4169 | 2369 | 2469 | 2769 | 2569 | 2669 |
| American
Funds 2045 Target Date Retirement Fund® |
2168 | 2268 | 4168 | 2368 | 2468 | 2768 | 2568 | 2668 |
| American
Funds 2040 Target Date Retirement Fund® |
2167 | 2267 | 4167 | 2367 | 2467 | 2767 | 2567 | 2667 |
| American
Funds 2035 Target Date Retirement Fund® |
2166 | 2266 | 4166 | 2366 | 2466 | 2766 | 2566 | 2666 |
| American
Funds 2030 Target Date Retirement Fund® |
2165 | 2265 | 4165 | 2365 | 2465 | 2765 | 2565 | 2665 |
| American
Funds 2025 Target Date Retirement Fund® |
2164 | 2264 | 4164 | 2364 | 2464 | 2764 | 2564 | 2664 |
| American
Funds 2020 Target Date Retirement Fund® |
2163 | 2263 | 4163 | 2363 | 2463 | 2763 | 2563 | 2663 |
| American
Funds 2015 Target Date Retirement Fund® |
2162 | 2262 | 4162 | 2362 | 2462 | 2762 | 2562 | 2662 |
| American
Funds 2010 Target Date Retirement Fund® |
2161 | 2261 | 4161 | 2361 | 2461 | 2761 | 2561 | 2661 |
The Income Fund of America — Page 85
| Fund numbers | |||||
| Fund | Class
529-A |
Class
529-C |
Class
529-E |
Class
529-T |
Class
529-F-1 |
| American Funds College Target Date Series® | |||||
| American Funds College 2033 Fund® | 10103 | 13103 | 15103 | 46103 | 14103 |
| American Funds College 2030 Fund® | 1094 | 1394 | 1594 | 46094 | 1494 |
| American Funds College 2027 Fund® | 1093 | 1393 | 1593 | 46093 | 1493 |
| American Funds College 2024 Fund® | 1092 | 1392 | 1592 | 46092 | 1492 |
| American Funds College 2021 Fund® | 1091 | 1391 | 1591 | 46091 | 1491 |
| American Funds College 2018 Fund® | 1090 | 1390 | 1590 | 46090 | 1490 |
| American Funds College Enrollment Fund® | 1088 | 1388 | 1588 | 46088 | 1488 |
| Fund numbers | ||||||
| Fund | Class A | Class C | Class T | Class F-1 | Class F-2 | Class F-3 |
| American Funds Portfolio SeriesSM | ||||||
| American Funds Global Growth PortfolioSM | 055 | 355 | 43055 | 455 | 655 | 755 |
| American Funds Growth PortfolioSM | 053 | 353 | 43053 | 453 | 653 | 753 |
| American Funds Growth and Income PortfolioSM | 051 | 351 | 43051 | 451 | 651 | 751 |
| American Funds Balanced PortfolioSM | 050 | 350 | 43050 | 450 | 650 | 750 |
| American Funds Income PortfolioSM | 047 | 347 | 43047 | 447 | 647 | 747 |
| American Funds Tax-Advantaged Income PortfolioSM | 046 | 346 | 43046 | 446 | 646 | 746 |
| American Funds Preservation PortfolioSM | 045 | 345 | 43045 | 445 | 645 | 745 |
| American Funds Tax-Exempt Preservation PortfolioSM | 044 | 344 | 43044 | 444 | 644 | 744 |
| Fund numbers | |||||
| Fund | Class 529-A |
Class 529-C |
Class 529-E |
Class 529-T |
Class 529-F-1 |
| American Funds Global Growth Portfolio | 1055 | 1355 | 1555 | 46055 | 1455 |
| American Funds Growth Portfolio | 1053 | 1353 | 1553 | 46053 | 1453 |
| American Funds Growth and Income Portfolio | 1051 | 1351 | 1551 | 46051 | 1451 |
| American Funds Balanced Portfolio | 1050 | 1350 | 1550 | 46050 | 1450 |
| American Funds Income Portfolio | 1047 | 1347 | 1547 | 46047 | 1447 |
| American Funds Tax-Advantaged Income Portfolio | N/A | N/A | N/A | N/A | N/A |
| American Funds Preservation Portfolio | 1045 | 1345 | 1545 | 46045 | 1445 |
| American Funds Tax-Exempt Preservation Portfolio | N/A | N/A | N/A | N/A | N/A |
| Fund numbers | ||||||||
| Fund | Class R-1 |
Class R-2 |
Class R-2E |
Class R-3 |
Class R-4 |
Class R-5E |
Class R-5 |
Class R-6 |
| American Funds Global Growth Portfolio | 2155 | 2255 | 4155 | 2355 | 2455 | 2755 | 2555 | 2655 |
| American Funds Growth Portfolio | 2153 | 2253 | 4153 | 2353 | 2453 | 2753 | 2553 | 2653 |
| American Funds Growth and Income Portfolio | 2151 | 2251 | 4151 | 2351 | 2451 | 2751 | 2551 | 2651 |
| American Funds Balanced Portfolio | 2150 | 2250 | 4150 | 2350 | 2450 | 2750 | 2550 | 2650 |
| American Funds Income Portfolio | 2147 | 2247 | 4147 | 2347 | 2447 | 2747 | 2547 | 2647 |
| American Funds Tax-Advantaged Income Portfolio | N/A | N/A | N/A | N/A | N/A | N/A | N/A | N/A |
| American Funds Preservation Portfolio | 2145 | 2245 | 4145 | 2345 | 2445 | 2745 | 2545 | 2645 |
| American Funds Tax-Exempt Preservation Portfolio | N/A | N/A | N/A | N/A | N/A | N/A | N/A | N/A |
The Income Fund of America — Page 86
| Fund numbers | ||||||
| Fund | Class A | Class C | Class T | Class F-1 | Class F-2 | Class F-3 |
| American Funds Retirement Income Portfolio SeriesSM | ||||||
| American Funds Retirement Income Portfolio – ConservativeSM | 30109 | 33109 | 43109 | 34109 | 36109 | 37109 |
| American Funds Retirement Income Portfolio – ModerateSM | 30110 | 33110 | 43110 | 34110 | 36110 | 37110 |
| American Funds Retirement Income Portfolio – EnhancedSM | 30111 | 33111 | 43111 | 34111 | 36111 | 37111 |
| Fund numbers | ||||||||
| Fund | Class R-1 |
Class R-2 |
Class R-2E |
Class R-3 |
Class R-4 |
Class R-5E |
Class R-5 |
Class R-6 |
| American Funds Retirement Income Portfolio – Conservative | 21109 | 22109 | 41109 | 23109 | 24109 | 27109 | 25109 | 26109 |
| American Funds Retirement Income Portfolio – Moderate | 21110 | 22110 | 41110 | 23110 | 24110 | 27110 | 25110 | 26110 |
| American Funds Retirement Income Portfolio – Enhanced | 21111 | 22111 | 41111 | 23111 | 24111 | 27111 | 25111 | 26111 |
The Income Fund of America — Page 87
Appendix
The following descriptions of debt security ratings are based on information provided by Moody’s Investors Service, Standard & Poor’s Ratings Services and Fitch Ratings, Inc.
Description of bond ratings
Moody’s
Long-term rating scale
Aaa
Obligations rated Aaa are judged to be of the highest quality, subject
to the lowest level of credit risk.
Aa
Obligations rated Aa are judged to be of high quality and are subject
to very low credit risk.
A
Obligations rated A are considered upper-medium grade and are subject
to low credit risk.
Baa
Obligations rated Baa are judged to be medium-grade and subject to moderate
credit risk and as such may possess certain speculative characteristics.
Ba
Obligations rated Ba are judged to be speculative and are subject to substantial
credit risk.
B
Obligations rated B are considered speculative and are subject to high
credit risk.
Caa
Obligations rated Caa are judged to be speculative and of poor standing
and are subject to very high credit risk.
Ca
Obligations rated Ca are highly speculative and are likely in, or very
near, default, with some prospect of recovery of principal and interest.
C
Obligations rated C are the lowest rated and are typically in default,
with little prospect for recovery of principal or interest.
Note: Moody’s appends numerical modifiers 1, 2, and 3 to each generic rating classification from Aa through Caa. The modifier 1 indicates that the obligation ranks in the higher end of its generic rating category; the modifier 2 indicates a mid-range ranking; and the modifier 3 indicates a ranking in the lower end of that generic rating category. Additionally, a “(hyb)” indicator is appended to all ratings of hybrid securities issued by banks, insurers, finance companies and securities firms.
The Income Fund of America — Page 88
Standard
& Poor’s
Long-term issue credit ratings
AAA
An obligation rated AAA has the highest rating assigned by Standard &
Poor’s. The obligor’s capacity to meet its financial commitment on the obligation is extremely strong.
AA
An obligation rated AA differs from the highest-rated obligations only
to a small degree. The obligor’s capacity to meet its financial commitment on the obligation is very strong.
A
An obligation rated A is somewhat more susceptible to the adverse effects
of changes in circumstances and economic conditions than obligations in higher-rated categories. However, the obligor’s capacity
to meet its financial commitment on the obligation is still strong.
BBB
An obligation rated BBB exhibits adequate protection parameters. However,
adverse economic conditions or changing circumstances are more likely to lead to a weakened capacity of the obligor to meet its
financial commitment on the obligation.
BB, B, CCC, CC, and C
Obligations rated BB, B, CCC, CC, and C are regarded as having significant speculative characteristics. BB indicates the least degree of speculation and C the highest. While such obligations will likely have some quality and protective characteristics, these may be outweighed by large uncertainties or major exposures to adverse conditions.
BB
An obligation rated BB is less vulnerable to nonpayment than other speculative
issues. However, it faces major ongoing uncertainties or exposure to adverse business, financial, or economic conditions which
could lead to the obligor’s inadequate capacity to meet its financial commitment on the obligation.
B
An obligation rated B is more vulnerable to nonpayment than obligations
rated BB, but the obligor currently has the capacity to meet its financial commitment on the obligation. Adverse business, financial,
or economic conditions will likely impair the obligor’s capacity or willingness to meet its financial commitment on the obligation.
CCC
An obligation rated CCC is currently vulnerable to nonpayment and is dependent
upon favorable business, financial, and economic conditions for the obligor to meet its financial commitment on the obligation.
In the event of adverse business, financial, or economic conditions, the obligor is not likely to have the capacity to meet its
financial commitment on the obligation.
CC
An obligation rated CC is currently highly vulnerable to nonpayment. The
CC rating is used when a default has not occurred, but Standard & Poor’s expects default to be a virtual certainty, regardless
of the anticipated time to default.
The Income Fund of America — Page 89
C
An obligation rated C is currently highly vulnerable to nonpayment, and
the obligation is expected to have lower relative seniority or lower ultimate recovery compared to obligations that are rated
higher.
D
An obligation rated D is in default or in breach of an imputed promise.
For non-hybrid capital instruments, the D rating category is used when payments on an obligation are not made on the date due,
unless Standard & Poor’s believes that such payments will be made within five business days in the absence of a stated
grace period or within the earlier of the stated grace period or 30 calendar days. The D rating also will be used upon the filing
of a bankruptcy petition or the taking of similar action and where default on an obligation is a virtual certainty, for example
due to automatic stay provisions. An obligation’s rating is lowered to D if it is subject to a distressed exchange offer.
Plus (+) or minus (–)
The ratings from AA to CCC may be modified by the addition of a plus or minus sign to show relative standing within the major rating categories.
NR
This indicates that no rating has been requested, that there is insufficient information on which to base a rating, or that Standard & Poor’s does not rate a particular obligation as a matter of policy.
The Income Fund of America — Page 90
Fitch
Ratings, Inc.
Long-term credit ratings
AAA
Highest credit quality. AAA ratings denote the lowest expectation of default
risk. They are assigned only in case of exceptionally strong capacity for payment of financial commitments. This capacity is highly
unlikely to be adversely affected by foreseeable events.
AA
Very high credit quality. AA ratings denote expectations of very low default
risk. They indicate very strong capacity for payment of financial commitments. This capacity is not significantly vulnerable to
foreseeable events.
A
High credit quality. A ratings denote expectations of low default risk.
The capacity for payment of financial commitments is considered strong. This capacity may, nevertheless, be more vulnerable to
changes in circumstances or in economic conditions than is the case for higher ratings.
BBB
Good credit quality. BBB ratings indicate that expectations of default
risk are low. The capacity for payment of financial commitments is considered adequate but adverse changes in circumstances and
economic conditions are more likely to impair this capacity.
BB
Speculative. BB ratings indicate an elevated vulnerability to default
risk, particularly in the event of adverse changes in business or economic conditions over time; however, business or financial
flexibility exists which supports the servicing of financial commitments.
B
Highly speculative. B ratings indicate that material default risk is present,
but a limited margin of safety remains. Financial commitments are currently being met; however, capacity for continued payment
is vulnerable to deterioration in the business and economic environment.
CCC
Substantial credit risk. Default is a real possibility.
CC
Very high levels of credit risk. Default of some kind appears probable.
C
Exceptionally high levels of credit risk. Default is imminent or inevitable,
or the issuer is in standstill. Conditions that are indicative of a C category rating for an issuer include:
· The issuer has entered into a grace or cure period following nonpayment of a material financial obligation;
· The issuer has entered into a temporary negotiated waiver or standstill agreement following a payment default on a material financial obligation; or
· Fitch Ratings otherwise believes a condition of RD or D to be imminent or inevitable, including through the formal announcement of a distressed debt exchange.
The Income Fund of America — Page 91
RD
Restricted default. RD ratings indicate an issuer that in Fitch Ratings’
opinion has experienced an uncured payment default on a bond, loan or other material financial obligation but which has not entered
into bankruptcy filings, administration, receivership, liquidation or other formal winding up procedure, and which has not otherwise
ceased operating. This would include:
· The selective payment default on a specific class or currency of debt;
· The uncured expiry of any applicable grace period, cure period or default forbearance period following a payment default on a bank loan, capital markets security or other material financial obligation;
· The extension of multiple waivers or forbearance periods upon a payment default on one or more material financial obligations, either in series or in parallel; or
· Execution of a distressed debt exchange on one or more material financial obligations.
D
Default. D ratings indicate an issuer that in Fitch Ratings’ opinion
has entered into bankruptcy filings, administration, receivership, liquidation or other formal winding up procedure, or which
has otherwise ceased business.
Default ratings are not assigned prospectively to entities or their obligations; within this context, nonpayment on an instrument that contains a deferral feature or grace period will generally not be considered a default until after the expiration of the deferral or grace period, unless a default is otherwise driven by bankruptcy or other similar circumstance, or by a distressed debt exchange.
Imminent default typically refers to the occasion where a payment default has been intimated by the issuer, and is all but inevitable. This may, for example, be where an issuer has missed a scheduled payment, but (as is typical) has a grace period during which it may cure the payment default. Another alternative would be where an issuer has formally announced a distressed debt exchange, but the date of the exchange still lies several days or weeks in the immediate future.
In all cases, the assignment of a default rating reflects the agency’s opinion as to the most appropriate rating category consistent with the rest of its universe of ratings, and may differ from the definition of default under the terms of an issuer’s financial obligations or local commercial practice.
Note: The modifiers “+” or “–” may be appended to a rating to denote relative status within major rating categories. Such suffixes are not added to the AAA long-term rating category, or to categories below B.
The Income Fund of America — Page 92
Description of commercial paper ratings
Moody’s
Global short-term rating scale
P-1
Issuers (or supporting institutions) rated Prime-1 have a superior ability to repay short-term debt obligations.
P-2
Issuers (or supporting institutions) rated Prime-2 have a strong ability to repay short-term debt obligations.
P-3
Issuers (or supporting institutions) rated Prime-3 have an acceptable ability to repay short-term obligations.
NP
Issuers (or supporting institutions) rated Not Prime do not fall within any of the Prime rating categories.
Standard & Poor’s
Commercial paper ratings (highest three ratings)
A-1
A short-term obligation rated A-1 is rated in the highest category by Standard & Poor’s. The obligor’s capacity to meet its financial commitment on the obligation is strong. Within this category, certain obligations are designated with a plus sign (+). This indicates that the obligor’s capacity to meet its financial commitment on these obligations is extremely strong.
A-2
A short-term obligation rated A-2 is somewhat more susceptible to the adverse effects of changes in circumstances and economic conditions than obligations in higher rating categories. However, the obligor’s capacity to meet its financial commitment on the obligation is satisfactory.
A-3
A short-term obligation rated A-3 exhibits adequate protection parameters. However, adverse economic conditions or changing circumstances are more likely to lead to a weakened capacity of the obligor to meet its financial commitment on the obligation.
The Income Fund of America — Page 93

| Common stocks 71.28% Industrials 10.61% |
Shares | Value (000) |
| General Electric Co. | 72,451,053 | $2,151,796 |
| Lockheed Martin Corp. | 7,624,400 | 1,916,240 |
| Boeing Co. | 7,175,000 | 1,172,539 |
| BAE Systems PLC | 130,916,776 | 958,515 |
| Norfolk Southern Corp. | 5,000,000 | 587,300 |
| Waste Management, Inc. | 7,886,128 | 548,086 |
| Ryanair Holdings PLC (ADR)1 | 6,452,401 | 539,808 |
| Caterpillar Inc. | 5,240,000 | 501,258 |
| Hubbell Inc.2 | 3,430,000 | 418,734 |
| PACCAR Inc | 6,220,500 | 418,702 |
| KONE Oyj, Class B | 9,223,000 | 417,166 |
| Cummins Inc. | 2,650,000 | 389,577 |
| Edenred SA | 12,231,900 | 266,265 |
| Macquarie Infrastructure Corp. | 3,170,000 | 237,718 |
| Sandvik AB | 7,408,000 | 99,935 |
| Abertis Infraestructuras, SA, Class A, non-registered shares | 6,901,362 | 98,676 |
| R.R. Donnelley & Sons Co.2 | 3,893,927 | 66,781 |
| Geberit AG | 127,000 | 54,109 |
| Douglas Dynamics, Inc.2 | 1,444,000 | 48,807 |
| LSC Communications, Inc. | 705,140 | 18,489 |
| Fastenal Co. | 300,000 | 14,904 |
| CEVA Group PLC1,2,3,4 | 35,229 | 6,165 |
| Atrium Corp.1,3,5 | 1,807 | 2 |
| 10,931,572 | ||
| Information technology 9.42% | ||
| Microsoft Corp. | 51,193,209 | 3,309,641 |
| Intel Corp. | 54,217,100 | 1,996,274 |
| Taiwan Semiconductor Manufacturing Co., Ltd.3 | 181,623,000 | 1,080,198 |
| Taiwan Semiconductor Manufacturing Co., Ltd. (ADR) | 3,836,470 | 118,586 |
| Analog Devices, Inc. | 12,633,724 | 946,771 |
| Texas Instruments Inc. | 11,573,000 | 874,224 |
| International Business Machines Corp. | 2,186,100 | 381,518 |
| Maxim Integrated Products, Inc. | 7,046,000 | 313,406 |
| Paychex, Inc. | 4,419,800 | 266,470 |
| Linear Technology Corp. | 2,700,000 | 170,451 |
| Vanguard International Semiconductor Corp.3 | 77,068,000 | 139,030 |
| Quanta Computer Inc.3 | 33,916,655 | 69,216 |
| Corporate Risk Holdings I, Inc.1,2,3 | 2,205,215 | 25,140 |
| Corporate Risk Holdings Corp.1,2,3 | 11,149 | — |
| Versum Materials, Inc.1 | 661,943 | 18,501 |
| 9,709,426 | ||
| Consumer staples 7.92% | ||
| Procter & Gamble Co. | 20,176,700 | 1,767,479 |
| Coca-Cola Co. | 25,191,000 | 1,047,190 |
| Altria Group, Inc. | 14,436,900 | 1,027,618 |
| Common stocks Consumer staples (continued) |
Shares | Value (000) |
| Reynolds American Inc. | 16,693,668 | $1,003,790 |
| Philip Morris International Inc. | 9,303,607 | 894,356 |
| British American Tobacco PLC | 13,117,000 | 808,476 |
| Kellogg Co. | 6,050,000 | 439,895 |
| Nestlé SA | 5,767,217 | 421,373 |
| Hershey Co. | 3,000,000 | 316,410 |
| Kraft Heinz Co. | 2,278,000 | 203,403 |
| Sysco Corp. | 2,285,000 | 119,871 |
| General Mills, Inc. | 1,750,000 | 109,340 |
| 8,159,201 | ||
| Financials 7.14% | ||
| JPMorgan Chase & Co. | 23,391,165 | 1,979,594 |
| Wells Fargo & Co. | 26,969,805 | 1,519,209 |
| CME Group Inc., Class A | 10,140,400 | 1,227,800 |
| National Australia Bank Ltd. | 21,460,000 | 493,629 |
| BM&FBOVESPA SA - Bolsa de Valores, Mercadorias e Futuros, ordinary nominative | 76,813,000 | 450,723 |
| Toronto-Dominion Bank (CAD denominated) | 8,480,000 | 439,298 |
| PacWest Bancorp | 5,868,000 | 325,087 |
| BlackRock, Inc. | 600,000 | 224,388 |
| Umpqua Holdings Corp. | 10,543,206 | 193,046 |
| Apollo Global Management, LLC, Class A | 5,479,700 | 116,389 |
| Redwood Trust, Inc.2 | 5,444,717 | 84,393 |
| Svenska Handelsbanken AB, Class A | 5,236,729 | 78,188 |
| AXA SA | 2,685,000 | 65,853 |
| T. Rowe Price Group, Inc. | 960,000 | 64,742 |
| Prudential PLC | 2,970,000 | 57,240 |
| Aozora Bank, Ltd. | 8,673,000 | 31,647 |
| 7,351,226 | ||
| Energy 6.87% | ||
| Spectra Energy Corp | 32,425,000 | 1,350,501 |
| Royal Dutch Shell PLC, Class B (ADR) | 11,698,000 | 672,284 |
| Royal Dutch Shell PLC, Class B | 22,202,147 | 624,661 |
| Royal Dutch Shell PLC, Class A | 1,232,485 | 33,296 |
| Royal Dutch Shell PLC, Class A (ADR) | 93,410 | 5,081 |
| Chevron Corp. | 11,623,000 | 1,294,221 |
| BP PLC | 179,819,900 | 1,069,650 |
| Schlumberger Ltd. | 5,980,500 | 500,628 |
| ConocoPhillips | 9,450,000 | 460,782 |
| Enbridge Inc. (CAD denominated) | 5,746,614 | 244,659 |
| Enbridge Inc. | 100,450 | 4,279 |
| Exxon Mobil Corp. | 2,670,000 | 223,986 |
| Helmerich & Payne, Inc. | 2,879,000 | 204,870 |
| Keyera Corp. | 5,190,000 | 152,360 |
| Pembina Pipeline Corp. | 3,680,289 | 114,177 |
| Coal India Ltd. | 17,000,000 | 77,477 |
| Ascent Resources - Utica, LLC, Class A1,3 | 110,214,618 | 24,688 |
| Peyto Exploration & Development Corp. | 810,000 | 17,629 |
| Southwestern Energy Co.1 | 528,225 | 4,759 |
| 7,079,988 |
| Common stocks Health care 6.08% |
Shares | Value (000) |
| Merck & Co., Inc. | 46,370,159 | $2,874,486 |
| GlaxoSmithKline PLC | 63,811,000 | 1,226,590 |
| AstraZeneca PLC | 13,399,159 | 706,947 |
| Bristol-Myers Squibb Co. | 13,763,500 | 676,614 |
| Pfizer Inc. | 17,831,257 | 565,786 |
| Sanofi | 1,460,000 | 117,401 |
| Eli Lilly and Co. | 1,174,000 | 90,433 |
| Rotech Healthcare Inc.1,2,3 | 543,172 | 4,378 |
| 6,262,635 | ||
| Consumer discretionary 5.17% | ||
| McDonald’s Corp. | 13,798,965 | 1,691,339 |
| General Motors Co. | 16,877,712 | 617,893 |
| Target Corp. | 9,450,000 | 609,336 |
| Home Depot, Inc. | 3,710,000 | 510,422 |
| ProSiebenSat.1 Media SE | 9,835,000 | 417,031 |
| Las Vegas Sands Corp. | 5,750,000 | 302,335 |
| Hasbro, Inc. | 3,516,373 | 290,136 |
| Nokian Renkaat Oyj2 | 7,240,161 | 271,363 |
| Marriott International, Inc., Class A | 2,120,000 | 179,352 |
| Charter Communications, Inc., Class A1 | 433,120 | 140,309 |
| Sands China Ltd. | 26,953,800 | 119,850 |
| Taylor Wimpey plc | 42,915,000 | 90,213 |
| SES SA, Class A (FDR) | 2,870,000 | 55,798 |
| Pearson PLC | 3,573,236 | 27,825 |
| Adelphia Recovery Trust, Series ACC-11,3 | 9,913,675 | 8 |
| 5,323,210 | ||
| Materials 4.58% | ||
| E.I. du Pont de Nemours and Co. | 14,953,953 | 1,129,024 |
| Dow Chemical Co. | 11,804,900 | 703,926 |
| WestRock Co.2 | 13,184,832 | 703,543 |
| LyondellBasell Industries NV | 6,880,000 | 641,698 |
| BASF SE | 5,000,000 | 481,025 |
| Boral Ltd.2 | 72,364,400 | 319,408 |
| Air Products and Chemicals, Inc. | 2,048,886 | 286,352 |
| Rio Tinto PLC | 6,142,000 | 269,737 |
| Amcor Ltd. | 7,785,000 | 84,429 |
| Praxair, Inc. | 397,300 | 47,056 |
| Potash Corp. of Saskatchewan Inc. | 2,000,000 | 37,200 |
| Warrior Met Coal, LLC, Class B1,3,5 | 30,461 | 9,138 |
| Warrior Met Coal, LLC, Class A1,3,5 | 10,285 | 3,086 |
| 4,715,622 | ||
| Real estate 3.73% | ||
| Crown Castle International Corp. REIT | 10,836,000 | 951,726 |
| Digital Realty Trust, Inc. REIT | 7,885,000 | 848,663 |
| Iron Mountain Inc. REIT2 | 13,811,680 | 494,458 |
| Lamar Advertising Co. REIT, Class A | 5,383,322 | 406,548 |
| Public Storage REIT | 1,818,000 | 390,870 |
| OUTFRONT Media Inc. REIT2 | 9,064,824 | 248,648 |
| Simon Property Group, Inc. REIT | 970,100 | 178,275 |
| Prologis, Inc. REIT | 2,860,000 | 139,711 |
| Link REIT | 19,651,812 | 134,619 |
| Common stocks Real estate (continued) |
Shares | Value (000) |
| Fibra Uno Administración, SA de CV REIT | 30,266,800 | $43,281 |
| Macquarie Mexican REIT | 3,816,839 | 3,758 |
| 3,840,557 | ||
| Telecommunication services 3.34% | ||
| Verizon Communications Inc. | 34,285,921 | 1,680,353 |
| Telstra Corp. Ltd. | 134,400,000 | 509,645 |
| AT&T Inc. | 10,670,000 | 449,847 |
| Vodafone Group PLC | 97,600,000 | 238,625 |
| Vodafone Group PLC (ADR) | 1,000,000 | 24,900 |
| NTT DoCoMo, Inc. | 8,090,000 | 193,921 |
| Deutsche Telekom AG | 11,025,000 | 192,328 |
| TalkTalk Telecom Group PLC2 | 58,421,891 | 115,019 |
| Mobile TeleSystems PJSC (ADR) | 2,270,000 | 23,767 |
| NII Holdings, Inc.1,2 | 5,194,089 | 14,673 |
| 3,443,078 | ||
| Utilities 2.56% | ||
| Power Assets Holdings Ltd. | 82,093,500 | 788,781 |
| Dominion Resources, Inc. | 7,335,000 | 559,514 |
| DTE Energy Co. | 3,500,000 | 345,240 |
| Duke Energy Corp. | 3,999,999 | 314,160 |
| EDP - Energias de Portugal, SA | 68,246,105 | 198,029 |
| National Grid PLC | 11,600,000 | 135,377 |
| SSE PLC | 6,627,751 | 124,149 |
| PG&E Corp. | 983,607 | 60,875 |
| Enel SPA | 14,584,600 | 60,835 |
| Cheung Kong Infrastructure Holdings Ltd. | 6,033,000 | 48,636 |
| 2,635,596 | ||
| Miscellaneous 3.86% | ||
| Other common stocks in initial period of acquisition | 3,977,453 | |
| Total common stocks (cost: $54,918,262,000) | 73,429,564 | |
| Preferred securities 0.41% Financials 0.33% |
||
| Citigroup Inc., Series K, depositary shares | 2,261,729 | 62,899 |
| Citigroup Inc. 7.257% preferred | 2,368,637 | 61,158 |
| U.S. Bancorp, Series G, noncumulative convertible preferred | 2,270,400 | 57,691 |
| PNC Financial Services Group, Inc., Series P, noncumulative depositary shares | 2,000,000 | 56,720 |
| HSBC Holdings PLC, Series 2, 8.00% | 1,505,000 | 39,220 |
| Wells Fargo & Co., Class A, Series Q, 5.85% depositary shares preferred noncumulative | 1,263,198 | 32,805 |
| Goldman Sachs Group, Inc., Series J, 5.50% depositary shares | 1,200,000 | 30,732 |
| 341,225 | ||
| Real estate 0.08% | ||
| Vornado Realty Trust REIT, Series I, 6.625% | 3,380,000 | 85,954 |
| Total preferred securities (cost: $408,715,000) | 427,179 |
| Rights & warrants 0.00% Utilities 0.00% |
Shares | Value (000) |
| Vistra Energy Corp.1,3,5,6 | 485,782 | $607 |
| Energy 0.00% | ||
| Gener8 Maritime, Inc., warrants, expire 20171,3,5 | 8,514 | — |
| Miscellaneous 0.00% | ||
| Other rights & warrants in initial period of acquisition | — | |
| Total rights & warrants (cost: $2,948,000) | 607 | |
| Convertible stocks 0.67% Real estate 0.19% |
||
| American Tower Corp., Series B, 5.50% depository share, convertible preferred 2018 | 1,375,000 | 138,641 |
| American Tower Corp., Series A, convertible preferred | 600,000 | 61,206 |
| 199,847 | ||
| Telecommunication services 0.14% | ||
| Frontier Communications Corp., Series A, convertible preferred | 1,925,000 | 140,737 |
| Industrials 0.10% | ||
| Arconic Inc., Class B, Series 1, cummulative convertible preferred 2017 | 2,500,000 | 91,675 |
| CEVA Group PLC, Series A-1, 4.022% convertible preferred1,2,3,4,7 | 29,937 | 10,478 |
| CEVA Group PLC, Series A-2, 3.022% convertible preferred1,2,3,4,7 | 13,633 | 3,067 |
| 105,220 | ||
| Energy 0.05% | ||
| Southwestern Energy Co., Series B, 6.25% convertible preferred 2018 | 2,060,000 | 45,588 |
| Consumer staples 0.03% | ||
| Bunge Ltd. 4.875% convertible preferred | 322,700 | 32,270 |
| Miscellaneous 0.16% | ||
| Other convertible stocks in initial period of acquisition | 166,524 | |
| Total convertible stocks (cost: $855,602,000) | 690,186 | |
| Convertible bonds 0.77% Financials 0.73% |
Principal amount (000) |
|
| Goldman Sachs, Equity Linked Notes (Weyerhaeuser Co.), 4.55% 2017 | $ 6,625 | 205,605 |
| Barclays PLC, Equity Linked Notes (Weyerhaeuser Co.), 5.12% 2017 | 7,159 | 221,169 |
| Goldman Sachs, Equity Linked Notes (Costco Wholesale Corp.), 3.64% 2017 | 1,112 | 177,354 |
| Goldman Sachs, Equity Linked Notes (Weyerhaeuser Co.), 4.99% 2018 | 4,186 | 129,828 |
| Lloyds Banking Group PLC, convertible notes, 7.50% 2049 | 21,200 | 22,044 |
| 756,000 | ||
| Consumer discretionary 0.01% | ||
| DISH DBS Corp. 3.375% 20265 | 10,725 | 12,582 |
| Convertible bonds Energy 0.01% |
Principal amount (000) |
Value (000) |
| American Energy (Permian Basin), convertible notes, 8.00% 20225,8 | $19,676 | $6,591 |
| Miscellaneous 0.02% | ||
| Other convertible bonds in initial period of acquisition | 17,164 | |
| Total convertible bonds (cost: $775,122,000) | 792,337 | |
| Bonds, notes & other debt instruments 21.79% Corporate bonds & notes 14.31% Energy 2.24% |
||
| American Energy (Marcellus), Term Loan A, 8.50% 20217,9,10 | 29,601 | 4,607 |
| American Energy (Marcellus), Term Loan B, 5.25% 20207,9,10 | 30,600 | 18,819 |
| American Energy (Permian Basin), 7.381% 20195,7 | 10,000 | 8,600 |
| American Energy (Permian Basin) 7.125% 20205 | 33,860 | 28,950 |
| American Energy (Permian Basin) 7.375% 20215 | 11,835 | 10,178 |
| Anadarko Petroleum Corp. 5.55% 2026 | 15,605 | 17,585 |
| Anadarko Petroleum Corp. 6.45% 2036 | 1,095 | 1,323 |
| Anadarko Petroleum Corp. 6.60% 2046 | 3,620 | 4,554 |
| Antero Resources Corp. 5.375% 20245 | 2,950 | 3,031 |
| Antero Resources Corp. 5.00% 20255 | 7,500 | 7,369 |
| APT Pipelines Ltd. 4.20% 20255 | 11,000 | 11,061 |
| Blue Racer Midstream LLC / Blue Racer Finance Corp. 6.125% 20225 | 9,810 | 10,106 |
| Boardwalk Pipeline Partners 3.375% 2023 | 2,160 | 2,116 |
| Canadian Natural Resources Ltd. 5.70% 2017 | 7,350 | 7,437 |
| Canadian Natural Resources Ltd. 3.80% 2024 | 1,440 | 1,449 |
| Canadian Natural Resources Ltd. 6.50% 2037 | 1,000 | 1,171 |
| Cenovus Energy Inc. 3.00% 2022 | 5,970 | 5,825 |
| Cenovus Energy Inc. 3.80% 2023 | 19,005 | 18,930 |
| Cheniere Energy, Inc. 7.00% 20245 | 7,260 | 8,140 |
| Cheniere Energy, Inc. 5.875% 20255 | 7,600 | 8,065 |
| Chesapeake Energy Corp. 4.272% 20197 | 27,450 | 27,519 |
| Chesapeake Energy Corp. 4.875% 2022 | 18,385 | 17,236 |
| Chesapeake Energy Corp. 8.00% 20225 | 8,165 | 8,747 |
| Chesapeake Energy Corp. 8.00% 20255 | 13,575 | 14,016 |
| Chesapeake Energy Corp., Term Loan, 8.50% 20217,9,10 | 15,150 | 16,603 |
| Chevron Corp. 1.561% 2019 | 1,850 | 1,847 |
| Concho Resources Inc. 5.50% 2023 | 7,000 | 7,297 |
| ConocoPhillips 4.20% 2021 | 6,520 | 6,909 |
| ConocoPhillips 4.95% 2026 | 4,025 | 4,428 |
| ConocoPhillips 5.95% 2046 | 10,035 | 12,352 |
| CONSOL Energy Inc. 5.875% 2022 | 56,200 | 54,654 |
| DCP Midstream Operating LP 4.95% 2022 | 13,815 | 14,402 |
| Denbury Resources Inc. 9.00% 20215 | 4,000 | 4,390 |
| Devon Energy Corp. 5.00% 2045 | 8,575 | 8,632 |
| Diamond Offshore Drilling, Inc. 4.875% 2043 | 43,845 | 32,226 |
| Ecopetrol SA 5.875% 2023 | 2,820 | 3,027 |
| Ecopetrol SA 5.375% 2026 | 3,885 | 3,895 |
| Ecopetrol SA 5.875% 2045 | 1,055 | 938 |
| El Paso Pipeline Partners Operating Co., LLC 5.00% 2021 | 5,000 | 5,389 |
| El Paso Pipeline Partners Operating Co., LLC 4.70% 2042 | 33,265 | 31,290 |
| Enbridge Energy Partners, LP 9.875% 2019 | 10,500 | 12,108 |
| Enbridge Energy Partners, LP 4.375% 2020 | 16,770 | 17,726 |
| Enbridge Energy Partners, LP 5.875% 2025 | 20,800 | 23,211 |
| Bonds, notes & other debt instruments Corporate bonds & notes (continued) Energy (continued) |
Principal amount (000) |
Value (000) |
| Enbridge Energy Partners, LP 5.50% 2040 | $1,200 | $1,193 |
| Enbridge Energy Partners, LP 7.375% 2045 | 32,885 | 40,743 |
| Enbridge Energy Partners, LP, Series B, 6.50% 2018 | 5,225 | 5,497 |
| Enbridge Energy Partners, LP, Series B, 7.50% 2038 | 6,000 | 7,276 |
| Enbridge Inc. 5.60% 2017 | 20,067 | 20,214 |
| Enbridge Inc. 4.00% 2023 | 22,395 | 23,058 |
| Enbridge Inc. 3.50% 2024 | 515 | 509 |
| Enbridge Inc. 4.25% 2026 | 4,790 | 4,939 |
| Enbridge Inc. 5.50% 2046 | 6,815 | 7,395 |
| Energy Transfer Partners, LP 4.15% 2020 | 5,000 | 5,230 |
| Energy Transfer Partners, LP 7.50% 2020 | 9,250 | 10,383 |
| Energy Transfer Partners, LP 5.875% 2024 | 11,800 | 12,655 |
| Energy Transfer Partners, LP 4.75% 2026 | 2,500 | 2,604 |
| Energy Transfer Partners, LP 4.20% 2027 | 1,660 | 1,650 |
| Energy Transfer Partners, LP 5.50% 2027 | 16,580 | 17,243 |
| Energy Transfer Partners, LP 6.125% 2045 | 11,010 | 12,048 |
| Energy Transfer Partners, LP 5.30% 2047 | 1,985 | 1,961 |
| EnLink Midstream Partners, LP 2.70% 2019 | 1,660 | 1,668 |
| EnLink Midstream Partners, LP 4.40% 2024 | 4,410 | 4,431 |
| EnLink Midstream Partners, LP 4.15% 2025 | 11,760 | 11,576 |
| EnLink Midstream Partners, LP 5.05% 2045 | 9,810 | 9,053 |
| Ensco PLC 5.20% 2025 | 11,300 | 10,339 |
| Ensco PLC 5.75% 2044 | 22,295 | 18,003 |
| Enterprise Products Operating LLC 5.20% 2020 | 3,910 | 4,273 |
| Enterprise Products Operating LLC 2.85% 2021 | 4,805 | 4,848 |
| EOG Resources, Inc. 4.15% 2026 | 3,830 | 4,016 |
| EP Energy Corp. 6.375% 2023 | 7,495 | 6,577 |
| Extraction Oil & Gas Holdings LLC 7.875% 20215 | 2,900 | 3,118 |
| Genesis Energy, LP 6.75% 2022 | 13,675 | 14,530 |
| Halliburton Co. 3.80% 2025 | 10,395 | 10,591 |
| Halliburton Co. 5.00% 2045 | 1,860 | 1,999 |
| Jupiter Resources Inc. 8.50% 20225 | 20,625 | 18,356 |
| Kinder Morgan Energy Partners, LP 2.65% 2019 | 1,890 | 1,907 |
| Kinder Morgan Energy Partners, LP 9.00% 2019 | 1,660 | 1,877 |
| Kinder Morgan Energy Partners, LP 4.15% 2022 | 12,145 | 12,583 |
| Kinder Morgan Energy Partners, LP 3.45% 2023 | 7,500 | 7,482 |
| Kinder Morgan Energy Partners, LP 3.50% 2023 | 1,015 | 1,014 |
| Kinder Morgan Energy Partners, LP 4.25% 2024 | 5,555 | 5,692 |
| Kinder Morgan Energy Partners, LP 6.95% 2038 | 460 | 546 |
| Kinder Morgan Energy Partners, LP 5.00% 2043 | 20,000 | 19,615 |
| Kinder Morgan Energy Partners, LP 5.40% 2044 | 9,660 | 10,058 |
| Kinder Morgan Energy Partners, LP 5.50% 2044 | 6,786 | 7,018 |
| Kinder Morgan Finance Co. 5.05% 2046 | 4,155 | 4,146 |
| Kinder Morgan, Inc. 3.05% 2019 | 8,070 | 8,213 |
| Kinder Morgan, Inc. 4.30% 2025 | 15,855 | 16,325 |
| Kinder Morgan, Inc. 5.55% 2045 | 6,160 | 6,526 |
| NGL Energy Partners LP 5.125% 2019 | 18,715 | 18,809 |
| NGL Energy Partners LP 6.875% 2021 | 27,425 | 28,385 |
| NGL Energy Partners LP 7.50% 20235 | 50 | 53 |
| NGPL PipeCo LLC 7.119% 20175 | 59,720 | 61,810 |
| NGPL PipeCo LLC 9.625% 20195 | 71,250 | 74,812 |
| Noble Corp. PLC 5.25% 2018 | 7,555 | 7,631 |
| Noble Corp. PLC 7.75% 2024 | 5,000 | 4,981 |
| Noble Corp. PLC 7.20% 2025 | 28,105 | 27,964 |
| Bonds, notes & other debt instruments Corporate bonds & notes (continued) Energy (continued) |
Principal amount (000) |
Value (000) |
| Noble Corp. PLC 8.20% 2045 | $26,305 | $24,497 |
| Oasis Petroleum Inc. 6.875% 2022 | 3,650 | 3,759 |
| Odebrecht Drilling Norbe VIII/IX Ltd 6.35% 20215,10 | 1,330 | 622 |
| Odebrecht Offshore Drilling Finance Ltd. 6.75% 20225,10 | 4,093 | 1,391 |
| Parsley Energy, Inc. 6.25% 20245 | 3,050 | 3,290 |
| Parsley Energy, Inc. 5.375% 20255 | 6,950 | 7,158 |
| PDC Energy Inc. 7.75% 2022 | 43,300 | 46,169 |
| Petrobras Global Finance Co. 6.85% 2115 | 2,775 | 2,338 |
| Petrobras International Finance Co. 5.75% 2020 | 6,535 | 6,823 |
| Petrobras International Finance Co. 5.375% 2021 | 28,655 | 28,942 |
| Petróleos Mexicanos 3.50% 2018 | 14,280 | 14,454 |
| Petróleos Mexicanos 5.50% 2019 | 13,925 | 14,600 |
| Petróleos Mexicanos 6.375% 2021 | 15,935 | 17,077 |
| Petróleos Mexicanos 5.375% 20225 | 2,510 | 2,565 |
| Petróleos Mexicanos 3.50% 2023 | 11,000 | 10,202 |
| Petróleos Mexicanos 4.50% 2026 | 5,225 | 4,759 |
| Petróleos Mexicanos 6.875% 2026 | 8,550 | 9,074 |
| Petróleos Mexicanos 6.50% 20275 | 3,830 | 3,947 |
| Petróleos Mexicanos 5.625% 2046 | 7,290 | 6,097 |
| Petróleos Mexicanos 6.75% 2047 | 5,540 | 5,242 |
| Phillips 66 Partners LP 3.605% 2025 | 1,640 | 1,621 |
| Phillips 66 Partners LP 3.55% 2026 | 745 | 725 |
| Phillips 66 Partners LP 4.68% 2045 | 245 | 231 |
| Phillips 66 Partners LP 4.90% 2046 | 6,315 | 6,204 |
| Pioneer Natural Resources Co. 3.45% 2021 | 7,015 | 7,203 |
| QGOG Atlantic/Alaskan Rigs Ltd. 5.25% 20195,10 | 6,143 | 5,990 |
| Range Resources Corp. 4.875% 2025 | 20,650 | 20,200 |
| Ras Laffan Liquefied Natural Gas II 5.298% 20205,10 | 13,318 | 14,038 |
| Ras Laffan Liquefied Natural Gas III 6.75% 2019 | 4,000 | 4,445 |
| Ras Laffan Liquefied Natural Gas III 6.75% 20195 | 1,000 | 1,111 |
| Ras Laffan Liquefied Natural Gas III 5.838% 20275,10 | 10,325 | 11,648 |
| Regency Energy Partners LP and Regency Energy Finance Corp. 6.50% 2021 | 14,855 | 15,326 |
| Regency Energy Partners LP and Regency Energy Finance Corp. 5.00% 2022 | 35 | 38 |
| Regency Energy Partners LP and Regency Energy Finance Corp. 5.50% 2023 | 10,875 | 11,369 |
| Rice Energy Inc. 6.25% 2022 | 16,125 | 16,810 |
| Rice Energy Inc. 7.25% 2023 | 1,350 | 1,455 |
| Rowan Companies Inc. 7.375% 2025 | 3,650 | 3,823 |
| Royal Dutch Shell PLC 1.75% 2021 | 9,560 | 9,292 |
| Royal Dutch Shell PLC 2.50% 2026 | 400 | 373 |
| Royal Dutch Shell PLC 3.75% 2046 | 2,900 | 2,686 |
| Sabine Pass Liquefaction, LLC 5.625% 2021 | 42,125 | 45,811 |
| Sabine Pass Liquefaction, LLC 6.25% 2022 | 7,000 | 7,840 |
| Sabine Pass Liquefaction, LLC 5.625% 2023 | 14,500 | 15,805 |
| Sabine Pass Liquefaction, LLC 5.75% 2024 | 8,860 | 9,691 |
| Sabine Pass Liquefaction, LLC 5.625% 2025 | 27,765 | 30,264 |
| Sabine Pass Liquefaction, LLC 5.00% 20275 | 20,010 | 21,036 |
| Schlumberger BV 3.00% 20205 | 6,645 | 6,792 |
| Schlumberger BV 3.625% 20225 | 7,065 | 7,342 |
| Schlumberger BV 4.00% 20255 | 8,575 | 8,973 |
| Seven Generations Energy Ltd. 6.75% 20235 | 15,485 | 16,646 |
| Shell International Finance BV 1.875% 2021 | 20,205 | 19,811 |
| Shell International Finance BV 2.875% 2026 | 4,635 | 4,453 |
| SM Energy Co. 5.625% 2025 | 18,250 | 17,976 |
| SM Energy Co. 6.75% 2026 | 2,625 | 2,743 |
| Bonds, notes & other debt instruments Corporate bonds & notes (continued) Energy (continued) |
Principal amount (000) |
Value (000) |
| Southwestern Energy Co. 4.10% 2022 | $33,270 | $31,024 |
| Southwestern Energy Co. 6.70% 2025 | 44,150 | 44,481 |
| Spectra Energy Partners, LP 4.75% 2024 | 3,250 | 3,470 |
| Spectra Energy Partners, LP 3.375% 2026 | 1,030 | 991 |
| Spectra Energy Partners, LP 4.50% 2045 | 1,280 | 1,231 |
| Statoil ASA 3.125% 2017 | 10,000 | 10,105 |
| Statoil ASA 2.75% 2021 | 3,085 | 3,113 |
| Statoil ASA 3.25% 2024 | 850 | 860 |
| Statoil ASA 4.25% 2041 | 3,000 | 3,040 |
| Sunoco LP 6.25% 2021 | 35,305 | 36,287 |
| Targa Resources Corp. 4.125% 2019 | 40,955 | 41,774 |
| Targa Resources Corp. 5.125% 20255 | 4,100 | 4,259 |
| Targa Resources Partners LP 6.75% 2024 | 11,255 | 12,352 |
| Targa Resources Partners LP 5.375% 20275 | 4,100 | 4,269 |
| TC PipeLines, LP 4.375% 2025 | 5,135 | 5,210 |
| Teekay Corp. 8.50% 2020 | 69,741 | 69,044 |
| Tesoro Corp. 4.75% 20235 | 2,600 | 2,681 |
| Tesoro Corp. 5.125% 20265 | 9,400 | 9,835 |
| Tesoro Logistics LP 5.50% 2019 | 16,200 | 17,273 |
| Tesoro Logistics LP 6.125% 2021 | 1,080 | 1,133 |
| Tesoro Logistics LP 6.25% 2022 | 7,900 | 8,453 |
| Tesoro Logistics LP 6.375% 2024 | 1,220 | 1,331 |
| Tesoro Logistics LP 5.25% 2025 | 6,725 | 7,036 |
| TransCanada PipeLines Ltd. 7.625% 2039 | 10,750 | 15,454 |
| TransCanada PipeLines Ltd., junior subordinated 6.35% 2067 | 27,495 | 25,364 |
| TransCanada PipeLines Ltd., junior subordinated 5.625% 2075 | 1,680 | 1,726 |
| Transocean Inc. 8.125% 2021 | 20,000 | 20,800 |
| Transocean Inc. 9.00% 20235 | 5,875 | 6,283 |
| Valero Energy Partners LP 4.375% 2026 | 2,400 | 2,434 |
| Weatherford International PLC 7.75% 2021 | 4,725 | 4,896 |
| Weatherford International PLC 4.50% 2022 | 15,280 | 13,676 |
| Weatherford International PLC 8.25% 2023 | 23,725 | 24,259 |
| Weatherford International PLC 9.875% 20245 | 9,775 | 10,581 |
| Weatherford International PLC 7.00% 2038 | 2,625 | 2,284 |
| Weatherford International PLC 6.75% 2040 | 72,630 | 61,191 |
| Western Gas Partners LP 2.60% 2018 | 1,150 | 1,157 |
| Western Gas Partners LP 3.95% 2025 | 3,045 | 3,035 |
| Western Gas Partners LP 4.65% 2026 | 2,610 | 2,713 |
| Whiting Petroleum Corp. 6.50% 2018 | 2,410 | 2,410 |
| Williams Companies, Inc. 3.70% 2023 | 20,055 | 19,814 |
| Williams Partners LP 5.25% 2020 | 1,960 | 2,125 |
| Williams Partners LP 4.00% 2021 | 2,900 | 2,988 |
| Williams Partners LP 4.30% 2024 | 3,190 | 3,290 |
| Williams Partners LP 3.90% 2025 | 11,775 | 11,762 |
| Williams Partners LP 4.00% 2025 | 11,705 | 11,800 |
| Williams Partners LP 4.90% 2045 | 3,260 | 3,152 |
| Williams Partners LP 5.10% 2045 | 8,580 | 8,567 |
| Woodside Finance Ltd. 4.60% 20215 | 18,935 | 20,015 |
| WPX Energy Inc. 6.00% 2022 | 7,800 | 8,151 |
| 2,305,537 |
| Bonds, notes & other debt instruments Corporate bonds & notes (continued) Consumer discretionary 2.03% |
Principal amount (000) |
Value (000) |
| 21st Century Fox America, Inc. 4.95% 2045 | $415 | $421 |
| Adient Global Holdings Ltd. 4.875% 20265 | 2,030 | 1,998 |
| Amazon.com, Inc. 4.80% 2034 | 12,000 | 13,365 |
| American Honda Finance Corp. 1.20% 2019 | 11,000 | 10,820 |
| American Honda Finance Corp. 2.25% 2019 | 8,500 | 8,567 |
| American Honda Finance Corp. 1.65% 2021 | 8,850 | 8,546 |
| Bayerische Motoren Werke AG 2.00% 20215 | 2,000 | 1,961 |
| Bayerische Motoren Werke AG 2.25% 20235 | 1,000 | 961 |
| Boyd Gaming Corp. 6.875% 2023 | 16,125 | 17,375 |
| Burger King Corp. 4.625% 20225 | 9,000 | 9,259 |
| Burger King Corp. 6.00% 20225 | 26,025 | 27,164 |
| Cablevision Systems Corp. 7.75% 2018 | 20,800 | 21,944 |
| Cablevision Systems Corp. 8.00% 2020 | 20,000 | 22,154 |
| Cablevision Systems Corp. 6.75% 2021 | 24,749 | 26,939 |
| Cablevision Systems Corp. 5.50% 20275 | 7,850 | 7,978 |
| Carnival Corp. 3.95% 2020 | 11,290 | 11,919 |
| CBS Corp. 1.95% 2017 | 5,000 | 5,011 |
| CBS Outdoor Americas Inc. 5.25% 20222 | 28,750 | 29,864 |
| CBS Outdoor Americas Inc. 5.625% 20242 | 3,396 | 3,557 |
| CCO Holdings LLC and CCO Holdings Capital Corp. 3.579% 2020 | 11,045 | 11,323 |
| CCO Holdings LLC and CCO Holdings Capital Corp. 4.464% 2022 | 9,715 | 10,168 |
| CCO Holdings LLC and CCO Holdings Capital Corp. 6.625% 2022 | 1,400 | 1,451 |
| CCO Holdings LLC and CCO Holdings Capital Corp. 5.875% 20245 | 4,025 | 4,316 |
| CCO Holdings LLC and CCO Holdings Capital Corp. 4.908% 2025 | 32,510 | 34,146 |
| CCO Holdings LLC and CCO Holdings Capital Corp. 5.50% 20265 | 14,350 | 15,068 |
| CCO Holdings LLC and CCO Holdings Capital Corp. 5.75% 20265 | 68,675 | 72,946 |
| CCO Holdings LLC and CCO Holdings Capital Corp. 6.384% 2035 | 5,750 | 6,502 |
| CCO Holdings LLC and CCO Holdings Capital Corp. 6.484% 2045 | 4,475 | 5,105 |
| Cengage Learning Acquisitions, Inc., Term Loan B, 5.25% 20237,9,10 | 19,172 | 17,892 |
| Cengage Learning Acquisitions, Inc. 9.50% 20245 | 5,250 | 4,489 |
| Clear Channel Worldwide Holdings, Inc. 7.625% 2020 | 72,260 | 72,712 |
| Comcast Corp. 3.00% 2024 | 10,500 | 10,396 |
| Comcast Corp. 2.35% 2027 | 5,220 | 4,748 |
| Comcast Corp. 3.30% 2027 | 1,500 | 1,479 |
| Comcast Corp. 6.45% 2037 | 25,000 | 31,796 |
| Comcast Corp. 4.75% 2044 | 9,855 | 10,479 |
| Cumulus Media Holdings Inc. 7.75% 2019 | 34,160 | 14,091 |
| Cumulus Media Inc., Term Loan B, 4.25% 20207,9,10 | 10,624 | 7,028 |
| DaimlerChrysler North America Holding Corp. 1.375% 20175 | 8,585 | 8,582 |
| DaimlerChrysler North America Holding Corp. 1.50% 20195 | 11,000 | 10,851 |
| DaimlerChrysler North America Holding Corp. 2.25% 20195 | 14,000 | 14,018 |
| DaimlerChrysler North America Holding Corp. 2.25% 20205 | 10,660 | 10,632 |
| DaimlerChrysler North America Holding Corp. 2.00% 20215 | 9,725 | 9,428 |
| DaimlerChrysler North America Holding Corp. 3.30% 20255 | 2,000 | 1,995 |
| DaimlerChrysler North America Holding Corp. 3.45% 20275 | 2,735 | 2,729 |
| DaimlerChrysler North America Holding Corp. 8.50% 2031 | 2,000 | 3,015 |
| Delta 2 (Formula One), Term Loan B, 8.068% 20227,9,10 | 9,275 | 9,352 |
| DISH DBS Corp. 4.625% 2017 | 23,825 | 24,182 |
| DISH DBS Corp. 4.25% 2018 | 16,575 | 16,948 |
| DISH DBS Corp. 7.875% 2019 | 1,425 | 1,573 |
| Dollar Tree Inc. 5.25% 2020 | 4,025 | 4,141 |
| Dollar Tree Inc. 5.75% 2023 | 16,550 | 17,568 |
| Federated Department Stores, Inc. 6.90% 2029 | 7,925 | 8,638 |
| Ford Motor Co. 4.346% 2026 | 2,000 | 2,010 |
| Bonds, notes & other debt instruments Corporate bonds & notes (continued) Consumer discretionary (continued) |
Principal amount (000) |
Value (000) |
| Ford Motor Co. 5.291% 2046 | $5,000 | $4,991 |
| Ford Motor Credit Co. 2.145% 2018 | 8,170 | 8,197 |
| Ford Motor Credit Co. 2.375% 2018 | 10,905 | 10,968 |
| Ford Motor Credit Co. 2.597% 2019 | 7,270 | 7,278 |
| Ford Motor Credit Co. 2.943% 2019 | 9,000 | 9,113 |
| Ford Motor Credit Co. 3.157% 2020 | 10,000 | 10,080 |
| Ford Motor Credit Co. 3.219% 2022 | 16,000 | 15,930 |
| Ford Motor Credit Co. 4.375% 2023 | 8,850 | 9,184 |
| Ford Motor Credit Co. 3.664% 2024 | 7,000 | 6,861 |
| Ford Motor Credit Co. 4.134% 2025 | 5,000 | 5,003 |
| Gannett Co., Inc. 5.125% 2019 | 7,925 | 8,133 |
| Gannett Co., Inc. 4.875% 20215 | 2,315 | 2,379 |
| Gannett Co., Inc. 5.50% 20245 | 2,955 | 3,002 |
| General Motors Co. 4.00% 2025 | 5,740 | 5,669 |
| General Motors Co. 6.60% 2036 | 13,260 | 15,335 |
| General Motors Co. 5.20% 2045 | 8,000 | 7,850 |
| General Motors Co. 6.75% 2046 | 13,230 | 15,652 |
| General Motors Financial Co. 6.75% 2018 | 2,760 | 2,928 |
| General Motors Financial Co. 2.35% 2019 | 18,500 | 18,344 |
| General Motors Financial Co. 3.50% 2019 | 8,795 | 8,984 |
| General Motors Financial Co. 3.70% 2020 | 2,725 | 2,791 |
| General Motors Financial Co. 3.20% 2021 | 10,250 | 10,211 |
| General Motors Financial Co. 4.375% 2021 | 21,275 | 22,197 |
| General Motors Financial Co. 3.45% 2022 | 33,990 | 33,968 |
| General Motors Financial Co. 3.45% 2022 | 3,000 | 3,000 |
| General Motors Financial Co. 4.00% 2026 | 8,116 | 7,879 |
| Hilton Worldwide Finance LLC 5.625% 2021 | 9,565 | 9,851 |
| Hilton Worldwide Holdings Inc. 4.25% 20245 | 5,150 | 5,079 |
| Hilton Worldwide, Term Loan B, 3.50% 20207,9,10 | 972 | 981 |
| Hilton Worldwide, Term Loan B, 3.271% 20237,9,10 | 13,217 | 13,368 |
| Home Depot, Inc. 2.125% 2026 | 5,000 | 4,598 |
| Home Depot, Inc. 5.95% 2041 | 12,500 | 15,868 |
| Hyundai Capital America 2.00% 20195 | 5,070 | 5,025 |
| Hyundai Capital America 2.60% 20205 | 2,250 | 2,244 |
| Hyundai Capital America 3.00% 20205 | 2,000 | 2,009 |
| Hyundai Capital America 2.45% 20215 | 14,000 | 13,657 |
| iHeartCommunications, Inc. 9.00% 2019 | 27,760 | 23,336 |
| iHeartCommunications, Inc. 10.625% 2023 | 10,020 | 7,941 |
| iHeartCommunications, Inc., Term Loan D, 7.528% 20197,9,10 | 6,900 | 5,801 |
| International Game Technology 6.25% 20225 | 14,000 | 14,989 |
| Limited Brands, Inc. 8.50% 2019 | 16,105 | 18,214 |
| Limited Brands, Inc. 7.00% 2020 | 21,271 | 23,558 |
| Limited Brands, Inc. 6.625% 2021 | 23,754 | 26,189 |
| Limited Brands, Inc. 6.875% 2035 | 24,450 | 23,961 |
| McClatchy Co. 9.00% 2022 | 10,550 | 11,289 |
| McDonald’s Corp. 3.70% 2026 | 1,355 | 1,377 |
| McDonald’s Corp. 4.875% 2045 | 2,165 | 2,309 |
| McGraw-Hill Global Education Holdings, LLC, Term Loan B, 5.00% 20227,9,10 | 12,870 | 12,382 |
| Mediacom Broadband LLC and Mediacom Broadband Corp. 5.50% 2021 | 17,225 | 17,742 |
| Mediacom LLC and Mediacom Capital Corp. 7.25% 2022 | 7,775 | 8,079 |
| MGM Resorts International 6.75% 2020 | 7,350 | 8,159 |
| MGM Resorts International 7.75% 2022 | 17,000 | 19,842 |
| Michaels Stores, Inc. 5.875% 20205 | 14,125 | 14,531 |
| Myriad International Holdings 6.375% 20175 | 12,500 | 12,761 |
| Bonds, notes & other debt instruments Corporate bonds & notes (continued) Consumer discretionary (continued) |
Principal amount (000) |
Value (000) |
| Myriad International Holdings 6.375% 2017 | $2,500 | $2,552 |
| Myriad International Holdings 6.00% 20205 | 45,655 | 49,517 |
| Myriad International Holdings 6.00% 2020 | 25,705 | 27,879 |
| Myriad International Holdings 5.50% 2025 | 6,140 | 6,279 |
| NBC Universal Enterprise, Inc. 1.707% 20185,7 | 8,625 | 8,685 |
| NBC Universal Enterprise, Inc. 5.25% 20495 | 37,105 | 38,960 |
| Needle Merger Sub Corp. 8.125% 20195 | 13,363 | 13,363 |
| Neiman Marcus Group LTD Inc. 8.00% 20215 | 34,355 | 21,472 |
| Neiman Marcus Group LTD Inc. 8.75% 20215,8 | 14,555 | 8,551 |
| Neiman Marcus, Term Loan B, 4.25% 20207,9,10 | 36,333 | 30,277 |
| Newell Rubbermaid Inc. 2.60% 2019 | 6,450 | 6,533 |
| Newell Rubbermaid Inc. 3.15% 2021 | 22,180 | 22,535 |
| Newell Rubbermaid Inc. 3.85% 2023 | 11,335 | 11,699 |
| Newell Rubbermaid Inc. 4.20% 2026 | 15,600 | 16,176 |
| Newell Rubbermaid Inc. 5.50% 2046 | 47,795 | 54,154 |
| PETCO Animal Supplies, Inc., Term Loan B1, 4.25% 20237,9,10 | 6,633 | 6,553 |
| PETsMART, Inc. 7.125% 20235 | 41,825 | 41,198 |
| Playa Resorts Holding BV 8.00% 20205 | 24,490 | 25,898 |
| Playa Resorts Holding BV, Term Loan B, 4.00% 20197,9,10 | 5,318 | 5,340 |
| President & Fellows of Harvard College 3.619% 2037 | 10,000 | 9,886 |
| RCI Banque 3.50% 20185 | 14,650 | 14,912 |
| Sally Holdings LLC and Sally Capital Inc. 5.625% 2025 | 11,325 | 11,891 |
| Schaeffler Finance BV 4.25% 20215 | 7,070 | 7,247 |
| Schaeffler Verwaltungs 4.125% 20215,8 | 4,325 | 4,364 |
| Schaeffler Verwaltungs 4.50% 20235,8 | 1,250 | 1,241 |
| Schaeffler Verwaltungs 4.75% 20265,8 | 275 | 271 |
| Seminole Tribe of Florida 6.535% 20205,10 | 6,260 | 6,385 |
| Sotheby’s Holdings, Inc. 5.25% 20225 | 9,160 | 9,252 |
| Standard Pacific Corp. 8.375% 2021 | 3,155 | 3,691 |
| Starbucks Corp. 4.30% 2045 | 1,500 | 1,577 |
| Tenneco Inc. 5.00% 2026 | 5,050 | 5,056 |
| Thomson Reuters Corp. 1.30% 2017 | 1,510 | 1,510 |
| Thomson Reuters Corp. 1.65% 2017 | 4,350 | 4,358 |
| Thomson Reuters Corp. 4.30% 2023 | 1,285 | 1,357 |
| Thomson Reuters Corp. 5.65% 2043 | 1,425 | 1,582 |
| TI Automotive Ltd. 8.75% 20235 | 19,170 | 20,704 |
| Time Warner Cable Inc. 6.75% 2018 | 18,630 | 19,838 |
| Time Warner Cable Inc. 5.00% 2020 | 35,000 | 37,254 |
| Time Warner Inc. 4.75% 2021 | 15,000 | 16,069 |
| Toyota Motor Credit Corp. 1.45% 2018 | 2,000 | 2,002 |
| Toyota Motor Credit Corp. 1.70% 2019 | 2,000 | 2,000 |
| Toyota Motor Credit Corp. 2.15% 2020 | 13,000 | 13,034 |
| Toyota Motor Credit Corp. 2.60% 2022 | 7,140 | 7,141 |
| Toyota Motor Credit Corp. 3.20% 2027 | 1,330 | 1,326 |
| Univision Communications Inc. 6.75% 20225 | 6,530 | 6,873 |
| Univision Communications Inc. 5.125% 20235 | 1,250 | 1,246 |
| Univision Communications Inc. 5.125% 20255 | 1,305 | 1,249 |
| Univision Communications Inc., Term Loan C3, 4.00% 20207,9,10 | 16,781 | 16,838 |
| Volkswagen International Finance NV 2.375% 20175 | 14,500 | 14,523 |
| Warner Music Group 5.625% 20225 | 10,694 | 11,055 |
| Warner Music Group 6.75% 20225 | 8,000 | 8,460 |
| Warner Music Group 5.00% 20235 | 3,250 | 3,266 |
| Warner Music Group 4.875% 20245 | 4,650 | 4,642 |
| WPP Finance 2010 3.75% 2024 | 2,000 | 2,016 |
| Bonds, notes & other debt instruments Corporate bonds & notes (continued) Consumer discretionary (continued) |
Principal amount (000) |
Value (000) |
| Wynn Las Vegas, LLC and Wynn Capital Corp. 5.375% 2022 | $6,725 | $6,893 |
| Wynn Las Vegas, LLC and Wynn Capital Corp. 4.25% 20235 | 10,313 | 10,055 |
| Wynn Las Vegas, LLC and Wynn Capital Corp. 5.50% 20255 | 15,900 | 15,980 |
| Wynn Macau, Ltd. 5.25% 20215 | 36,025 | 36,948 |
| YUM! Brands, Inc. 5.00% 20245 | 9,945 | 10,123 |
| ZF Friedrichshafen AG 4.00% 20205 | 5,065 | 5,297 |
| ZF Friedrichshafen AG 4.50% 20225 | 16,795 | 17,299 |
| ZF Friedrichshafen AG 4.75% 20255 | 22,595 | 23,057 |
| 2,090,056 | ||
| Health care 1.93% | ||
| Abbott Laboratories 2.90% 2021 | 26,060 | 26,031 |
| Abbott Laboratories 3.40% 2023 | 9,070 | 9,062 |
| Abbott Laboratories 3.75% 2026 | 33,385 | 33,007 |
| Abbott Laboratories 4.75% 2036 | 9,120 | 9,151 |
| Abbott Laboratories 4.90% 2046 | 18,240 | 18,451 |
| AbbVie Inc. 2.30% 2021 | 14,335 | 14,119 |
| AbbVie Inc. 2.90% 2022 | 7,200 | 7,124 |
| AbbVie Inc. 3.20% 2022 | 2,675 | 2,684 |
| AbbVie Inc. 3.60% 2025 | 10,000 | 9,884 |
| AbbVie Inc. 3.20% 2026 | 15,275 | 14,513 |
| AbbVie Inc. 4.50% 2035 | 5,705 | 5,629 |
| AbbVie Inc. 4.30% 2036 | 1,080 | 1,035 |
| AbbVie Inc. 4.45% 2046 | 19,140 | 17,929 |
| Aetna Inc. 1.70% 2018 | 18,275 | 18,279 |
| Aetna Inc. 1.90% 2019 | 21,000 | 21,028 |
| Aetna Inc. 2.40% 2021 | 31,295 | 31,451 |
| Aetna Inc. 2.80% 2023 | 1,575 | 1,564 |
| Aetna Inc. 3.20% 2026 | 12,415 | 12,435 |
| Aetna Inc. 4.25% 2036 | 1,855 | 1,866 |
| Allergan PLC 3.00% 2020 | 14,890 | 15,131 |
| Allergan PLC 3.45% 2022 | 20,180 | 20,483 |
| Allergan PLC 3.80% 2025 | 35,940 | 35,931 |
| Allergan PLC 4.55% 2035 | 11,250 | 11,126 |
| Allergan PLC 4.75% 2045 | 19,865 | 19,667 |
| Amgen Inc. 1.85% 2021 | 5,745 | 5,545 |
| Amgen Inc. 2.70% 2022 | 5,100 | 5,085 |
| Amgen Inc. 4.40% 2045 | 5,305 | 5,059 |
| Baxalta Inc. 4.00% 2025 | 10,140 | 10,192 |
| Bayer AG 2.375% 20195 | 4,810 | 4,827 |
| Becton, Dickinson and Co. 2.675% 2019 | 3,136 | 3,187 |
| Becton, Dickinson and Co. 4.685% 2044 | 3,800 | 3,941 |
| Boston Scientific Corp. 2.85% 2020 | 7,875 | 7,983 |
| Boston Scientific Corp. 6.00% 2020 | 5,375 | 5,914 |
| Boston Scientific Corp. 3.375% 2022 | 4,300 | 4,384 |
| Boston Scientific Corp. 3.85% 2025 | 11,200 | 11,299 |
| Catholic Health Initiatives, Series 2012, 1.60% 2017 | 1,000 | 1,001 |
| Celgene Corp. 3.625% 2024 | 7,000 | 7,049 |
| Celgene Corp. 5.00% 2045 | 9,185 | 9,531 |
| Centene Corp. 5.625% 2021 | 29,717 | 31,271 |
| Centene Corp. 4.75% 2022 | 49,463 | 50,452 |
| Centene Corp. 6.125% 2024 | 9,437 | 10,050 |
| Centene Corp. 4.75% 2025 | 24,615 | 24,353 |
| Community Health Systems Inc. 5.125% 2021 | 8,130 | 7,683 |
| Bonds, notes & other debt instruments Corporate bonds & notes (continued) Health care (continued) |
Principal amount (000) |
Value (000) |
| Concordia Healthcare Corp., Term Loan B, 5.25% 20217,9,10 | $2,269 | $1,788 |
| Concordia Healthcare Corp. 9.50% 20225 | 28,878 | 12,418 |
| Concordia Healthcare Corp. 7.00% 20235 | 22,294 | 8,235 |
| DaVita HealthCare Partners Inc. 5.125% 2024 | 1,775 | 1,762 |
| DaVita HealthCare Partners Inc. 5.00% 2025 | 12,590 | 12,330 |
| DJO Finance LLC 10.75% 2020 | 14,473 | 12,230 |
| DJO Finco Inc. 8.125% 20215 | 42,900 | 37,323 |
| EMD Finance LLC 1.70% 20185 | 18,900 | 18,848 |
| EMD Finance LLC 2.40% 20205 | 22,050 | 22,014 |
| EMD Finance LLC 2.95% 20225 | 18,600 | 18,566 |
| EMD Finance LLC 3.25% 20255 | 29,900 | 29,294 |
| Endo Finance LLC & Endo Finco Inc. 6.00% 20235 | 17,135 | 14,693 |
| Endo Pharmaceuticals Holdings Inc. 5.75% 20225 | 14,631 | 12,820 |
| Gilead Sciences, Inc. 1.95% 2022 | 4,780 | 4,621 |
| Gilead Sciences, Inc. 2.50% 2023 | 4,035 | 3,914 |
| Gilead Sciences, Inc. 2.95% 2027 | 6,650 | 6,339 |
| Gilead Sciences, Inc. 4.00% 2036 | 5,490 | 5,288 |
| Gilead Sciences, Inc. 4.15% 2047 | 4,935 | 4,631 |
| HCA Inc. 3.75% 2019 | 16,657 | 16,990 |
| HCA Inc. 6.50% 2020 | 22,590 | 24,736 |
| HCA Inc. 4.75% 2023 | 580 | 602 |
| HCA Inc. 5.00% 2024 | 2,080 | 2,171 |
| HCA Inc. 5.375% 2025 | 50,000 | 51,063 |
| HCA Inc. 5.25% 2026 | 14,150 | 14,787 |
| HCA Inc. 4.50% 2027 | 4,625 | 4,573 |
| Healthsouth Corp. 5.75% 2024 | 5,425 | 5,534 |
| Healthsouth Corp. 5.75% 2025 | 12,892 | 12,989 |
| Humana Inc. 3.85% 2024 | 4,400 | 4,471 |
| Humana Inc. 4.95% 2044 | 12,800 | 13,517 |
| Immucor, Inc. 11.125% 2019 | 3,455 | 3,274 |
| IMS Health Holdings, Inc. 5.00% 20265 | 18,050 | 18,215 |
| inVentiv Health, Inc. 7.50% 20245 | 9,625 | 10,130 |
| inVentiv Health, Inc., Term Loan B, 4.75% 20237,9,10 | 26,508 | 26,738 |
| Kindred Healthcare, Inc. 8.00% 2020 | 10,825 | 10,717 |
| Kindred Healthcare, Inc. 8.75% 2023 | 7,000 | 6,396 |
| Kinetic Concepts, Inc. 7.875% 20215 | 2,925 | 3,166 |
| Kinetic Concepts, Inc. 9.625% 20215 | 98,026 | 105,206 |
| Kinetic Concepts, Inc. 12.50% 20215 | 40,540 | 45,405 |
| Laboratory Corporation of America Holdings 4.70% 2045 | 885 | 881 |
| Mallinckrodt PLC 4.875% 20205 | 21,910 | 21,691 |
| Mallinckrodt PLC 5.75% 20225 | 2,060 | 1,921 |
| Mallinckrodt PLC 5.625% 20235 | 15,430 | 13,752 |
| McKesson Corp. 2.284% 2019 | 4,870 | 4,890 |
| MEDNAX, Inc. 5.25% 20235 | 2,110 | 2,184 |
| Medtronic, Inc. 4.375% 2035 | 3,903 | 4,090 |
| Medtronic, Inc. 4.625% 2045 | 11,035 | 11,774 |
| Merck & Co., Inc. 1.10% 2018 | 6,710 | 6,702 |
| Molina Healthcare, Inc. 5.375% 2022 | 50,688 | 52,589 |
| Pfizer Inc. 7.20% 2039 | 1,353 | 1,955 |
| Quintiles Transnational Corp. 4.875% 20235 | 32,825 | 33,358 |
| Roche Holdings, Inc. 2.875% 20215 | 15,000 | 15,277 |
| Roche Holdings, Inc. 2.375% 20275 | 11,810 | 11,066 |
| Rotech Healthcare Inc., Term Loan, 13.00% 20202,3,7,8,9,10 | 24,476 | 24,281 |
| Rotech Healthcare Inc., Term Loan A, 5.50% 20182,3,7,9,10 | 11,707 | 11,648 |
| Bonds, notes & other debt instruments Corporate bonds & notes (continued) Health care (continued) |
Principal amount (000) |
Value (000) |
| Rotech Healthcare Inc., Term Loan B, 10.00% 20192,3,7,9,10 | $9,200 | $9,154 |
| Shire PLC 2.40% 2021 | 32,865 | 31,966 |
| Shire PLC 2.875% 2023 | 13,520 | 12,933 |
| Shire PLC 3.20% 2026 | 15,145 | 14,248 |
| St. Jude Medical, Inc. 2.80% 2020 | 9,100 | 9,154 |
| Tenet Healthcare Corp. 4.375% 2021 | 24,495 | 24,755 |
| Tenet Healthcare Corp. 7.50% 20225 | 1,825 | 1,962 |
| Tenet Healthcare Corp. 8.125% 2022 | 1,864 | 1,892 |
| Tenet Healthcare Corp. 6.75% 2023 | 11,056 | 10,476 |
| Tenet Healthcare Corp., First Lien, 6.25% 2018 | 2,500 | 2,641 |
| Tenet Healthcare Corp., First Lien, 4.75% 2020 | 15,420 | 15,728 |
| Tenet Healthcare Corp., First Lien, 6.00% 2020 | 59,900 | 63,344 |
| Tenet Healthcare Corp., First Lien, 4.50% 2021 | 21,490 | 21,705 |
| Teva Pharmaceutical Finance Company BV 1.40% 2018 | 15,425 | 15,320 |
| Teva Pharmaceutical Finance Company BV 1.70% 2019 | 15,730 | 15,450 |
| Teva Pharmaceutical Finance Company BV 2.20% 2021 | 18,990 | 18,143 |
| Teva Pharmaceutical Finance Company BV 2.80% 2023 | 9,460 | 8,874 |
| Teva Pharmaceutical Finance Company BV 3.15% 2026 | 21,400 | 19,462 |
| Teva Pharmaceutical Finance Company BV 4.10% 2046 | 12,945 | 10,885 |
| Thermo Fisher Scientific Inc. 2.40% 2019 | 6,000 | 6,065 |
| Thermo Fisher Scientific Inc. 4.15% 2024 | 4,000 | 4,204 |
| Thermo Fisher Scientific Inc. 5.30% 2044 | 365 | 410 |
| UnitedHealth Group Inc. 1.40% 2017 | 6,500 | 6,502 |
| UnitedHealth Group Inc. 6.00% 2017 | 12,430 | 12,654 |
| UnitedHealth Group Inc. 3.35% 2022 | 7,030 | 7,256 |
| UnitedHealth Group Inc. 3.75% 2025 | 5,710 | 5,937 |
| UnitedHealth Group Inc. 4.625% 2035 | 1,080 | 1,175 |
| UnitedHealth Group Inc. 4.75% 2045 | 1,800 | 1,979 |
| Valeant Pharmaceuticals International Inc. 7.00% 20205 | 864 | 786 |
| VPI Escrow Corp. 6.75% 20185 | 39,715 | 39,367 |
| VPI Escrow Corp. 6.375% 20205 | 87,584 | 77,402 |
| VPI Escrow Corp. 7.50% 20215 | 5,665 | 4,943 |
| VRX Escrow Corp. 5.375% 20205 | 33,820 | 29,212 |
| VRX Escrow Corp. 5.875% 20235 | 14,545 | 11,145 |
| VRX Escrow Corp. 6.125% 20255 | 41,070 | 30,905 |
| WellPoint, Inc. 2.30% 2018 | 1,370 | 1,378 |
| WellPoint, Inc. 2.25% 2019 | 12,500 | 12,557 |
| Zimmer Holdings, Inc. 2.00% 2018 | 4,640 | 4,655 |
| Zimmer Holdings, Inc. 2.70% 2020 | 10,770 | 10,836 |
| Zimmer Holdings, Inc. 3.15% 2022 | 18,860 | 18,863 |
| Zimmer Holdings, Inc. 3.55% 2025 | 3,720 | 3,638 |
| 1,992,200 | ||
| Financials 1.90% | ||
| ACE INA Holdings Inc. 2.30% 2020 | 4,485 | 4,498 |
| ACE INA Holdings Inc. 2.875% 2022 | 9,345 | 9,426 |
| ACE INA Holdings Inc. 3.15% 2025 | 5,885 | 5,878 |
| ACE INA Holdings Inc. 3.35% 2026 | 1,955 | 1,971 |
| ACE INA Holdings Inc. 4.35% 2045 | 1,395 | 1,460 |
| Allstate Corp. 4.20% 2046 | 550 | 555 |
| Ally Financial Inc. 8.00% 2031 | 6,664 | 7,947 |
| American Express Co. 6.15% 2017 | 12,610 | 12,948 |
| American Express Credit Co. 1.55% 2017 | 4,525 | 4,528 |
| Bank of America Corp. 5.75% 2017 | 8,100 | 8,375 |
| Bonds, notes & other debt instruments Corporate bonds & notes (continued) Financials (continued) |
Principal amount (000) |
Value (000) |
| Bank of America Corp. 5.625% 2020 | $9,000 | $9,888 |
| Bank of America Corp. 5.00% 2021 | 3,500 | 3,800 |
| Bank of America Corp. 2.503% 2022 | 12,500 | 12,094 |
| Bank of America Corp. 3.124% 2023 | 10,500 | 10,478 |
| Bank of America Corp. 3.248% 2027 | 34,094 | 32,151 |
| Bank of America Corp. 3.824% 2028 | 2,600 | 2,586 |
| Bank of America Corp. junior subordinated 6.25% noncumulative (undated) | 5,525 | 5,775 |
| Bank of America Corp., Series AA, 6.10% (undated) | 11,175 | 11,664 |
| Bank of America Corp., Series DD, 6.30% (undated) | 6,560 | 7,036 |
| Bank of America Corp., Series M, junior subordinated 8.125% noncumulative (undated) | 26,211 | 27,366 |
| Barclays Bank PLC 3.25% 2021 | 8,600 | 8,632 |
| Barclays Bank PLC 3.65% 2025 | 10,000 | 9,665 |
| BB&T Corp. 2.45% 2020 | 19,000 | 19,178 |
| Berkshire Hathaway Inc. 2.90% 2020 | 6,000 | 6,189 |
| Berkshire Hathaway Inc. 2.20% 2021 | 1,790 | 1,791 |
| BNP Paribas 4.375% 20265 | 8,850 | 8,850 |
| BPCE SA group 2.65% 2021 | 4,000 | 3,997 |
| BPCE SA group 2.75% 2021 | 6,650 | 6,612 |
| BPCE SA group 5.70% 20235 | 18,630 | 19,944 |
| BPCE SA group 5.15% 20245 | 10,060 | 10,273 |
| CIT Group Inc. 4.25% 2017 | 9,000 | 9,101 |
| CIT Group Inc. 5.00% 20185 | 11,000 | 11,179 |
| CIT Group Inc. 3.875% 2019 | 72,805 | 74,534 |
| CIT Group Inc., Series C, 5.50% 20195 | 13,650 | 14,395 |
| Citigroup Inc. 2.05% 2019 | 10,500 | 10,479 |
| Citigroup Inc. 8.50% 2019 | 4,894 | 5,571 |
| Citigroup Inc. 2.021% 20217 | 29,780 | 29,801 |
| Citigroup Inc. 2.35% 2021 | 13,000 | 12,743 |
| Citigroup Inc. 2.70% 2021 | 10,500 | 10,448 |
| Citigroup Inc. 2.90% 2021 | 30,500 | 30,430 |
| Citigroup Inc. 3.20% 2026 | 13,970 | 13,269 |
| Citigroup Inc. 3.887% 2028 | 19,000 | 19,017 |
| Citigroup Inc., Series P, 5.95% (undated) | 14,683 | 14,955 |
| Citigroup Inc., Series A, junior subordinated 5.95% (undated) | 13,295 | 13,740 |
| Citigroup Inc., Series Q, junior subordinated 5.95% (undated) | 10,675 | 11,096 |
| Citigroup Inc., Series T, 6.25% (undated) | 8,357 | 8,838 |
| CNA Financial Corp. 3.95% 2024 | 5,000 | 5,073 |
| Crédit Agricole SA 3.375% 20225 | 7,975 | 7,989 |
| Crédit Agricole SA 4.375% 20255 | 21,920 | 21,720 |
| Credit Suisse Group AG 3.45% 2021 | 8,750 | 8,830 |
| Credit Suisse Group AG 3.80% 2023 | 14,925 | 14,939 |
| Danske Bank AS 2.00% 20215 | 18,150 | 17,642 |
| Goldman Sachs Group, Inc. 2.55% 2019 | 16,200 | 16,314 |
| Goldman Sachs Group, Inc. 2.60% 2020 | 7,900 | 7,941 |
| Goldman Sachs Group, Inc. 2.35% 2021 | 9,505 | 9,251 |
| Goldman Sachs Group, Inc. 2.398% 20217 | 18,526 | 18,799 |
| Goldman Sachs Group, Inc. 5.25% 2021 | 3,000 | 3,289 |
| Goldman Sachs Group, Inc. 3.00% 2022 | 6,765 | 6,726 |
| Goldman Sachs Group, Inc. 5.75% 2022 | 20,000 | 22,443 |
| Goldman Sachs Group, Inc. 3.50% 2026 | 4,755 | 4,641 |
| Goldman Sachs Group, Inc. 3.85% 2027 | 4,405 | 4,408 |
| Goldman Sachs Group, Inc. 5.30% (undated) | 9,875 | 9,682 |
| HBOS PLC 6.75% 20185 | 17,300 | 18,268 |
| HSBC Holdings PLC 2.95% 2021 | 14,000 | 14,003 |
| Bonds, notes & other debt instruments Corporate bonds & notes (continued) Financials (continued) |
Principal amount (000) |
Value (000) |
| HSBC Holdings PLC 4.25% 2024 | $9,000 | $9,111 |
| HSBK (Europe) BV 7.25% 20175 | 8,790 | 8,900 |
| Icahn Enterprises Finance Corp. 3.50% 2017 | 24,075 | 24,077 |
| Icahn Enterprises Finance Corp. 6.25% 20225 | 5,850 | 5,908 |
| Intercontinentalexchange, Inc. 2.50% 2018 | 12,000 | 12,164 |
| Intesa Sanpaolo SpA 5.017% 20245 | 41,610 | 38,379 |
| iStar Financial Inc. 4.00% 2017 | 28,625 | 28,840 |
| iStar Financial Inc. 4.875% 2018 | 11,575 | 11,734 |
| iStar Financial Inc., Series B, 9.00% 2017 | 39,360 | 40,295 |
| JPMorgan Chase & Co. 1.35% 2017 | 4,240 | 4,241 |
| JPMorgan Chase & Co. 2.25% 2020 | 10,000 | 10,019 |
| JPMorgan Chase & Co. 2.55% 2020 | 11,150 | 11,191 |
| JPMorgan Chase & Co. 2.40% 2021 | 14,000 | 13,850 |
| JPMorgan Chase & Co. 3.782% 2028 | 10,440 | 10,489 |
| JPMorgan Chase & Co., Series Z, junior subordinated 5.30% (undated) | 36,425 | 37,518 |
| JPMorgan Chase & Co., Series S, junior subordinated 6.75% (undated) | 33,363 | 36,554 |
| JPMorgan Chase & Co., Series I, junior subordinated 7.90% (undated) | 74,825 | 77,257 |
| Keybank National Association 2.50% 2019 | 9,000 | 9,081 |
| Leucadia National Corp. 5.50% 2023 | 13,255 | 14,113 |
| Liberty Mutual Group Inc. 4.25% 20235 | 4,400 | 4,623 |
| Liberty Mutual Group Inc., Series A, 7.80% 20875 | 19,415 | 22,230 |
| Lloyds Banking Group PLC 3.00% 2022 | 6,000 | 5,985 |
| Lloyds Banking Group PLC 4.50% 2024 | 9,000 | 9,178 |
| Lloyds Banking Group PLC 4.582% 2025 | 7,000 | 7,044 |
| MetLife Global Funding I 2.30% 20195 | 8,435 | 8,498 |
| MetLife Global Funding I 2.00% 20205 | 5,135 | 5,107 |
| MetLife Global Funding I 2.50% 20205 | 4,000 | 4,010 |
| MetLife Capital Trust IV, junior subordinated 7.875% 20675 | 14,430 | 18,037 |
| MetLife Capital Trust X, junior subordinated 9.25% 20685 | 500 | 694 |
| Metropolitan Life Global Funding I, 3.45% 20265 | 1,830 | 1,839 |
| Mitsubishi UFJ Financial Group, Inc. 2.19% 2021 | 11,000 | 10,708 |
| Morgan Stanley 2.50% 2021 | 10,500 | 10,377 |
| Morgan Stanley 2.625% 2021 | 10,500 | 10,350 |
| Morgan Stanley 3.875% 2026 | 11,000 | 11,089 |
| Morgan Stanley 3.625% 2027 | 35,150 | 34,662 |
| Nationwide Mutual Insurance Co. 3.253% 20245,7 | 8,150 | 8,043 |
| Navient Corp. 4.875% 2019 | 20,000 | 20,188 |
| Navient Corp. 5.50% 2023 | 10,980 | 10,362 |
| New York Life Global Funding 1.50% 20195 | 1,830 | 1,811 |
| New York Life Global Funding 2.10% 20195 | 11,000 | 11,071 |
| New York Life Global Funding 1.95% 20205 | 1,820 | 1,813 |
| New York Life Global Funding 1.70% 20215 | 17,500 | 16,898 |
| PNC Bank 2.40% 2019 | 7,825 | 7,894 |
| PNC Financial Services Group, Inc. 2.854% 2022 | 8,395 | 8,386 |
| PNC Financial Services Group, Inc. 3.90% 2024 | 3,000 | 3,081 |
| PNC Financial Services Group, Inc., Series O, junior subordinated 6.75% (undated) | 10,250 | 11,275 |
| PNC Preferred Funding Trust I, junior subordinated 2.613% (undated)5,7 | 23,800 | 22,997 |
| Prudential Financial, Inc. 3.50% 2024 | 9,000 | 9,178 |
| QBE Insurance Group Ltd. 2.40% 20185 | 16,910 | 16,987 |
| Rabobank Nederland 2.25% 2019 | 8,000 | 8,042 |
| Rabobank Nederland 2.50% 2021 | 6,525 | 6,522 |
| Rabobank Nederland 2.75% 2022 | 8,725 | 8,712 |
| Rabobank Nederland 4.625% 2023 | 8,000 | 8,462 |
| Rabobank Nederland 4.375% 2025 | 9,000 | 9,221 |
| Bonds, notes & other debt instruments Corporate bonds & notes (continued) Financials (continued) |
Principal amount (000) |
Value (000) |
| RBS Capital Trust II 6.425% noncumulative trust (undated) | $6,005 | $6,095 |
| Royal Bank of Scotland Group PLC, junior subordinated 6.99% (undated)5 | 12,735 | 14,040 |
| Skandinaviska Enskilda Banken AB 1.875% 2021 | 11,000 | 10,632 |
| Skandinaviska Enskilda Banken AB 2.625% 2021 | 10,500 | 10,523 |
| SMFG Preferred Capital USD 3 Ltd., junior subordinated 9.50% 20495 | 67,890 | 74,364 |
| Société Générale, junior subordinated 5.922% (undated)5 | 45,073 | 45,242 |
| Starwood Property Trust, Inc. 5.00% 20215 | 7,275 | 7,411 |
| Svenska Handelsbanken AB 1.875% 2021 | 7,270 | 7,037 |
| Synovus Financial Corp. 7.875% 2019 | 23,506 | 26,039 |
| UBS Group AG 2.95% 20205 | 10,000 | 10,014 |
| UBS Group AG 4.125% 20255 | 4,425 | 4,475 |
| US Bancorp. 2.625% 2022 | 8,415 | 8,437 |
| US Bancorp. 3.70% 2024 | 10,000 | 10,429 |
| US Bancorp. 2.375% 2026 | 6,000 | 5,576 |
| US Bank NA 2.00% 2020 | 3,500 | 3,503 |
| Wells Fargo & Co. 2.55% 2020 | 4,350 | 4,358 |
| Wells Fargo & Co. 2.10% 2021 | 10,800 | 10,515 |
| Wells Fargo & Co. 2.50% 2021 | 15,000 | 14,857 |
| Wells Fargo & Co. 4.60% 2021 | 45,000 | 48,314 |
| Wells Fargo & Co. 3.069% 2023 | 10,500 | 10,494 |
| Wells Fargo & Co., Series K, junior subordinated 7.98% (undated) | 86,566 | 91,003 |
| 1,959,562 | ||
| Telecommunication services 1.48% | ||
| Altice Financing SA 6.625% 20235 | 20,555 | 21,519 |
| Altice Finco SA 6.50% 20225 | 5,500 | 5,754 |
| Altice NV 7.50% 20265 | 2,100 | 2,222 |
| AT&T Inc. 3.20% 2022 | 9,895 | 9,887 |
| AT&T Inc. 4.250% 2027 | 6,800 | 6,794 |
| AT&T Inc. 8.25% 2031 | 2,015 | 2,787 |
| AT&T Inc. 4.50% 2035 | 4,000 | 3,774 |
| AT&T Inc. 5.25% 2037 | 7,000 | 6,967 |
| AT&T Inc. 4.75% 2046 | 6,250 | 5,731 |
| AT&T Inc. 5.45% 2047 | 3,400 | 3,381 |
| AT&T Inc. 4.50% 2048 | 3,227 | 2,828 |
| CenturyLink, Inc. 7.50% 2024 | 13,594 | 14,427 |
| Cequel Communications Holdings I, LLC and Cequel Capital Corp. 6.375% 20205 | 59,899 | 61,696 |
| Cequel Communications Holdings I, LLC and Cequel Capital Corp. 7.75% 20255 | 2,225 | 2,473 |
| Deutsche Telekom International Finance BV 1.95% 20215 | 6,000 | 5,793 |
| Deutsche Telekom International Finance BV 2.82% 20225 | 10,500 | 10,443 |
| Deutsche Telekom International Finance BV 3.60% 20275 | 5,000 | 4,950 |
| Deutsche Telekom International Finance BV 9.25% 2032 | 8,420 | 13,155 |
| France Télécom 4.125% 2021 | 15,000 | 15,881 |
| France Télécom 9.00% 2031 | 5,000 | 7,582 |
| Frontier Communications Corp. 8.125% 2018 | 1,217 | 1,318 |
| Frontier Communications Corp. 8.875% 2020 | 6,450 | 6,893 |
| Frontier Communications Corp. 9.25% 2021 | 22,395 | 23,459 |
| Frontier Communications Corp. 8.75% 2022 | 1,000 | 1,015 |
| Frontier Communications Corp. 10.50% 2022 | 24,075 | 25,264 |
| Frontier Communications Corp. 7.125% 2023 | 6,225 | 5,603 |
| Frontier Communications Corp. 7.625% 2024 | 20,000 | 17,750 |
| Frontier Communications Corp. 11.00% 2025 | 61,986 | 62,916 |
| Inmarsat PLC 4.875% 20225 | 24,175 | 23,812 |
| Inmarsat PLC 6.50% 20245 | 10,250 | 10,551 |
| Bonds, notes & other debt instruments Corporate bonds & notes (continued) Telecommunication services (continued) |
Principal amount (000) |
Value (000) |
| Intelsat Jackson Holding Co. 7.25% 2019 | $34,800 | $30,080 |
| Intelsat Jackson Holding Co. 7.25% 2020 | 35,279 | 27,870 |
| Ligado Networks, Term Loan, 9.75% 20207,8,9,10 | 93,739 | 90,801 |
| MetroPCS Wireless, Inc. 6.25% 2021 | 54,275 | 56,375 |
| MetroPCS Wireless, Inc. 6.625% 2023 | 46,600 | 49,638 |
| Neptune Finco Corp. (Altice NV) 6.625% 20255 | 1,950 | 2,133 |
| Neptune Finco Corp. (Altice NV) 10.875% 20255 | 525 | 626 |
| Numericable Group SA 6.00% 20225 | 12,850 | 13,268 |
| Numericable Group SA 6.25% 20245 | 2,125 | 2,146 |
| Numericable Group SA 7.375% 20265 | 4,375 | 4,506 |
| Orange SA 5.50% 2044 | 3,000 | 3,489 |
| Qwest Capital Funding, Inc. 7.625% 2021 | 3,900 | 4,022 |
| SoftBank Corp. 4.50% 20205 | 54,420 | 55,917 |
| SoftBank Group Corp. 3.36% 20235,10 | 21,450 | 21,530 |
| Sprint Capital Corp. 6.90% 2019 | 5,025 | 5,377 |
| Sprint Nextel Corp. 9.00% 20185 | 5,000 | 5,488 |
| Sprint Nextel Corp. 7.00% 2020 | 43,350 | 46,493 |
| Sprint Nextel Corp. 7.25% 2021 | 36,155 | 38,776 |
| Sprint Nextel Corp. 11.50% 2021 | 16,130 | 20,122 |
| Sprint Nextel Corp. 7.875% 2023 | 21,488 | 23,542 |
| Sprint Nextel Corp. 7.125% 2024 | 14,000 | 14,805 |
| Telefónica Emisiones, SAU 3.192% 2018 | 8,500 | 8,624 |
| Telefónica Emisiones, SAU 5.134% 2020 | 7,950 | 8,543 |
| T-Mobile US, Inc. 6.542% 2020 | 36,700 | 37,801 |
| T-Mobile US, Inc. 6.731% 2022 | 3,695 | 3,852 |
| T-Mobile US, Inc. 6.375% 2025 | 6,650 | 7,207 |
| T-Mobile US, Inc. 6.50% 2026 | 61,400 | 67,709 |
| Trilogy International Partners, LLC 13.375% 20195 | 63,800 | 65,873 |
| Verizon Communications Inc. 1.75% 2021 | 4,280 | 4,090 |
| Verizon Communications Inc. 3.00% 2021 | 2,516 | 2,527 |
| Verizon Communications Inc. 2.625% 2026 | 2,150 | 1,954 |
| Verizon Communications Inc. 4.272% 2036 | 47,686 | 44,536 |
| Verizon Communications Inc. 6.00% 2041 | 28,000 | 32,219 |
| Verizon Communications Inc. 3.85% 2042 | 1,402 | 1,173 |
| Verizon Communications Inc. 4.125% 2046 | 46,341 | 40,068 |
| Verizon Communications Inc. 4.522% 2048 | 78,900 | 71,554 |
| Wind Acquisition SA 4.75% 20205 | 75,260 | 76,953 |
| Wind Acquisition SA 7.375% 20215 | 65,200 | 67,964 |
| Windstream Holdings, Inc. 7.75% 2021 | 44,275 | 45,391 |
| Zayo Group Holdings, Inc. 5.75% 20275 | 8,375 | 8,584 |
| Ziggo Bond Finance BV 5.50% 20275 | 25,075 | 24,981 |
| 1,525,232 | ||
| Industrials 1.09% | ||
| 3M Co. 2.25% 2026 | 5,750 | 5,394 |
| 3M Co. 3.125% 2046 | 1,750 | 1,548 |
| ABB Finance (USA) Inc. 1.625% 2017 | 1,000 | 1,002 |
| ABB Finance (USA) Inc. 2.875% 2022 | 1,000 | 1,010 |
| AerCap Holdings NV 2.75% 2017 | 150 | 151 |
| European Aeronautic Defence and Space Company 2.70% 20235 | 885 | 877 |
| Allison Transmission Holdings, Inc. 5.00% 20245 | 13,525 | 13,660 |
| American Airlines, Inc., 5.50% 20195 | 3,350 | 3,490 |
| American Airlines, Inc., Series 2013-2, Class A, 4.95% 202410 | 7,117 | 7,593 |
| ABC Supply Co., Inc. 5.625% 20215 | 325 | 336 |
| Bonds, notes & other debt instruments Corporate bonds & notes (continued) Industrials (continued) |
Principal amount (000) |
Value (000) |
| American Builders & Contractors Supply Co. Inc. 5.75% 20235 | $1,740 | $1,814 |
| ARAMARK Corp. 5.125% 2024 | 14,525 | 15,215 |
| ARAMARK Corp. 5.125% 20245 | 5,000 | 5,238 |
| Associated Materials, LLC 9.00% 20245 | 67,900 | 69,597 |
| Bohai Financial Investment Holding Co., Ltd. 5.25% 20225 | 14,200 | 14,573 |
| Bohai Financial Investment Holding Co., Ltd. 5.50% 20245 | 8,250 | 8,487 |
| Builders Firstsource, Inc. 10.75% 20235 | 5,200 | 6,052 |
| Builders FirstSource, Inc. 5.625% 20245 | 20,230 | 20,862 |
| CEVA Group PLC 7.00% 20212,5 | 2,250 | 1,958 |
| CEVA Group PLC 9.00% 20212,5 | 1,050 | 709 |
| CEVA Group PLC, Apollo Global Securities LLC LOC, 5.602% 20212,7,9,10 | 2,527 | 2,233 |
| CEVA Logistics Canada, ULC, Term Loan, 6.539% 20212,7,9,10 | 447 | 395 |
| CEVA Logistics Holdings BV, Term Loan, 6.539% 20212,7,9,10 | 2,591 | 2,290 |
| CEVA Logistics U.S. Holdings Inc., Term Loan B, 6.539% 20212,7,9,10 | 3,574 | 3,158 |
| Continental Airlines, Inc., Series 1998-1, Class B, 6.748% 201810 | 429 | 431 |
| Continental Airlines, Inc., Series 1998-1, Class A, 6.648% 201910 | 1,262 | 1,272 |
| Continental Airlines, Inc., Series 1997-4, Class A, 6.90% 201910 | 117 | 118 |
| Continental Airlines, Inc., Series 2000-2, Class B, 8.307% 201910 | 61 | 64 |
| Continental Airlines, Inc., Series 1999-1, Class A, 6.545% 202010 | 8,661 | 9,078 |
| Continental Airlines, Inc., Series 1999-1, Class B, 6.795% 202010 | 49 | 51 |
| Continental Airlines, Inc., Series 1999-2, Class A1, 7.256% 202110 | 281 | 302 |
| Continental Airlines, Inc., Series 1999-2, Class B, 7.566% 202110 | 1 | 1 |
| Continental Airlines, Inc., Series 2001-1, Class A1, 6.703% 202210 | 840 | 894 |
| Continental Airlines, Inc., Series 2007-1, Class B, 6.903% 202210 | 5,618 | 5,905 |
| Continental Airlines, Inc., Series 2000-2, Class A1, 7.707% 202210 | 1,364 | 1,463 |
| Continental Airlines, Inc., Series 2000-1, Class A1, 8.048% 202210 | 2,749 | 3,014 |
| Continental Airlines, Inc., Series 2000-1, Class B, 8.388% 202210 | 6 | 6 |
| Corporate Risk Holdings LLC 9.50% 20192,5 | 45,000 | 47,250 |
| Corporate Risk Holdings LLC 13.50% 20202,3,5,8 | 15,170 | 16,739 |
| DAE Aviation Holdings, Inc. 10.00% 20235 | 42,805 | 45,480 |
| Deck Chassis Acquisition Inc. 10.00% 20235 | 24,975 | 26,786 |
| Delta Air Lines, Inc., Series 2002-1, Class G1, MBIA insured, 6.718% 202410 | 4,184 | 4,749 |
| ERAC USA Finance Co. 5.25% 20205 | 5,000 | 5,429 |
| Euramax International, Inc. 12.00% 20205 | 25,250 | 27,649 |
| Fortive Corp. 2.35% 20215 | 2,825 | 2,788 |
| Gates Global LLC 6.00% 20225 | 30,675 | 30,407 |
| Gates Global LLC, Term Loan B, 4.25% 20217,9,10 | 7,939 | 7,931 |
| General Electric Capital Corp. 2.342% 2020 | 13,195 | 13,239 |
| General Electric Capital Corp., Series A, 6.00% 2019 | 2,577 | 2,844 |
| General Electric Co. 2.70% 2022 | 7,750 | 7,794 |
| General Electric Co. 4.125% 2042 | 11,000 | 11,188 |
| General Electric Co. 5.00% (undated) | 189,095 | 196,281 |
| Hardwoods Acquisition Inc 7.50% 20215 | 17,285 | 15,297 |
| HD Supply, Inc. 5.25% 20215 | 14,350 | 15,157 |
| HDTFS Inc. 6.75% 2019 | 5,645 | 5,631 |
| HDTFS Inc. 5.875% 2020 | 22,750 | 21,612 |
| HDTFS Inc. 5.50% 20245 | 9,475 | 8,006 |
| Honeywell International Inc. 1.85% 2021 | 5,820 | 5,697 |
| Honeywell International Inc. 2.50% 2026 | 3,500 | 3,295 |
| KLX Inc. 5.875% 20225 | 5,825 | 6,124 |
| LMI Aerospace Inc. 7.375% 2019 | 16,300 | 16,707 |
| Lockheed Martin Corp. 1.85% 2018 | 2,535 | 2,543 |
| Lockheed Martin Corp. 2.50% 2020 | 3,250 | 3,279 |
| Lockheed Martin Corp. 3.10% 2023 | 695 | 703 |
| Bonds, notes & other debt instruments Corporate bonds & notes (continued) Industrials (continued) |
Principal amount (000) |
Value (000) |
| Lockheed Martin Corp. 3.55% 2026 | $1,480 | $1,502 |
| Lockheed Martin Corp. 4.50% 2036 | 560 | 593 |
| Lockheed Martin Corp. 4.70% 2046 | 9,560 | 10,325 |
| LSC Communications, Inc. 8.75% 20235 | 18,725 | 19,755 |
| LSC Communications, Inc., Term Loan B, 7.00% 20223,7,9,10 | 6,380 | 6,444 |
| Navios Maritime Acquisition Corp. and Navios Acquisition Finance (US) Inc. 8.125% 20215 | 25,800 | 23,542 |
| Navios Maritime Holdings Inc. 7.375% 20225 | 6,450 | 4,467 |
| Navios Maritime Holdings Inc. and Navios Maritime Finance II (US) Inc. 8.125% 2019 | 7,475 | 5,840 |
| Nielsen Finance LLC and Nielsen Finance Co. 4.50% 2020 | 11,250 | 11,517 |
| Ply Gem Industries, Inc. 6.50% 2022 | 14,100 | 14,557 |
| Ply Gem Industries, Inc. 6.50% 2022 | 13,510 | 14,135 |
| PrimeSource Building Products Inc 9.00% 20235 | 2,810 | 2,880 |
| R.R. Donnelley & Sons Co. 7.625% 20202 | 3,700 | 3,941 |
| R.R. Donnelley & Sons Co. 7.875% 20212 | 23,445 | 25,262 |
| R.R. Donnelley & Sons Co. 7.00% 20222 | 1,477 | 1,473 |
| R.R. Donnelley & Sons Co. 6.50% 20232 | 14,280 | 14,032 |
| Roper Technologies, Inc. 2.80% 2021 | 1,035 | 1,035 |
| Roper Technologies, Inc. 3.80% 2026 | 2,500 | 2,499 |
| Siemens AG 1.70% 20215 | 11,000 | 10,589 |
| Siemens AG 2.35% 20265 | 1,500 | 1,384 |
| Siemens AG 4.40% 20455 | 1,000 | 1,049 |
| Silver II Borrower S.C.A./Silver II U.S. Holdings, LLC 7.75% 20205 | 47,095 | 40,266 |
| TRAC Intermodal 11.00% 2019 | 2,535 | 2,682 |
| TransDigm Inc. 5.50% 2020 | 27,125 | 27,362 |
| TransDigm Inc. 6.50% 2024 | 29,700 | 29,886 |
| TransDigm Inc. 6.50% 2025 | 6,650 | 6,708 |
| United Air Lines, Inc., Series 2007-1, Class B, 7.336% 20215,10 | 3,142 | 3,291 |
| United Air Lines, Inc., Series 2007-1, Class A, 6.636% 202410 | 5,288 | 5,631 |
| United Rentals, Inc. 5.50% 2025 | 8,625 | 8,981 |
| United Rentals, Inc. 5.875% 2026 | 5,175 | 5,401 |
| Virgin Australia Holdings Ltd. 8.50% 20195 | 41,650 | 43,056 |
| Virgin Australia Holdings Ltd. 7.875% 20215 | 1,750 | 1,759 |
| Watco Companies 6.375% 20235 | 10,670 | 11,230 |
| 1,123,920 | ||
| Utilities 0.98% | ||
| Abu Dhabi National Energy Co. PJSC (TAQA) 6.165% 20175 | 2,000 | 2,067 |
| Abu Dhabi National Energy Co. PJSC (TAQA) 3.625% 20235 | 2,000 | 2,018 |
| AES Corp. 8.00% 2020 | 14,275 | 16,505 |
| AES Corp. 7.375% 2021 | 27,590 | 31,177 |
| AES Corp. 4.875% 2023 | 2,000 | 2,000 |
| AES Corp. 5.50% 2024 | 8,500 | 8,649 |
| AES Corp. 5.50% 2025 | 27,225 | 27,701 |
| AES Corp. 6.00% 2026 | 12,910 | 13,426 |
| American Electric Power Co., Inc. 2.95% 2022 | 12,065 | 12,144 |
| American Electric Power Co., Inc. 2.75% 2026 | 10,000 | 9,462 |
| Berkshire Hathaway Energy Co. 2.40% 2020 | 7,749 | 7,792 |
| Calpine Corp. 6.00% 20225 | 3,425 | 3,588 |
| Calpine Corp. 5.375% 2023 | 14,200 | 14,058 |
| Calpine Corp. 7.875% 20235 | 4,486 | 4,693 |
| Calpine Corp. 5.875% 20245 | 10,620 | 11,178 |
| Calpine Corp. 5.25% 20265 | 4,070 | 4,121 |
| CMS Energy Corp. 8.75% 2019 | 6,000 | 6,898 |
| CMS Energy Corp. 6.25% 2020 | 13,480 | 14,975 |
| Bonds, notes & other debt instruments Corporate bonds & notes (continued) Utilities (continued) |
Principal amount (000) |
Value (000) |
| CMS Energy Corp. 5.05% 2022 | $9,730 | $10,669 |
| CMS Energy Corp. 3.00% 2026 | 12,000 | 11,531 |
| CMS Energy Corp. 2.95% 2027 | 4,000 | 3,812 |
| Colbun SA 6.00% 20205 | 2,000 | 2,169 |
| Colbun SA 4.50% 20245 | 1,500 | 1,516 |
| Comision Federal de Electricidad 4.875% 20245 | 2,000 | 2,022 |
| Comision Federal de Electricidad 4.75% 20275 | 370 | 358 |
| Consumers Energy Co., First Mortgage Bonds, 6.70% 2019 | 13,400 | 15,012 |
| Consumers Energy Co. 5.65% 2020 | 4,058 | 4,459 |
| Consumers Energy Co. 3.375% 2023 | 841 | 871 |
| Consumers Energy Co. 3.125% 2024 | 2,520 | 2,526 |
| Dominion Resources, Inc. 4.104% 2021 | 2,000 | 2,080 |
| Dominion Resources, Inc. 2.75% 2022 | 156 | 156 |
| Duke Energy Corp. 1.80% 2021 | 6,827 | 6,590 |
| Duke Energy Florida, LLC 3.20% 2027 | 8,000 | 8,025 |
| Duke Energy Indiana, Inc. 4.90% 2043 | 14,785 | 16,419 |
| Duke Energy Progress Inc. 4.15% 2044 | 3,935 | 3,983 |
| Dynegy Finance Inc. 6.75% 2019 | 11,310 | 11,663 |
| Dynegy Finance Inc. 7.375% 2022 | 15,980 | 15,860 |
| Dynegy Finance Inc. 7.625% 2024 | 8,915 | 8,536 |
| E.ON International Finance BV 5.80% 20185 | 15,000 | 15,717 |
| EDP Finance BV 4.125% 20205 | 6,000 | 6,179 |
| EDP Finance BV 5.25% 20215 | 22,500 | 23,988 |
| Electricité de France SA 3.625% 20255 | 780 | 782 |
| Electricité de France SA 6.95% 20395 | 8,000 | 10,183 |
| Electricité de France SA 4.875% 20445 | 2,000 | 2,033 |
| Electricité de France SA 5.25% 20495 | 26,955 | 25,742 |
| Emera Inc. 6.75% 2076 | 45,424 | 49,739 |
| Emera US Finance LP 2.15% 2019 | 3,975 | 3,974 |
| Emera US Finance LP 2.70% 2021 | 6,505 | 6,461 |
| Emera US Finance LP 3.55% 2026 | 3,300 | 3,243 |
| Empresa Nacional de Electricidad SA 4.25% 2024 | 900 | 910 |
| Enel Finance International SA 6.00% 20395 | 3,000 | 3,430 |
| Enel Società per Azioni 8.75% 20735 | 12,000 | 13,710 |
| Entergy Corp. 5.59% 2024 | 1,221 | 1,417 |
| Entergy Corp. 2.40% 2026 | 5,740 | 5,398 |
| Entergy Corp. 2.95% 2026 | 13,058 | 12,348 |
| Entergy Corp. 4.44% 2026 | 6 | 6 |
| Entergy Louisiana, LLC 3.30% 2022 | 4 | 4 |
| Eversource Energy 2.50% 2021 | 2 | 2 |
| Eversource Energy 2.375% 2022 | 2,824 | 2,781 |
| Eversource Energy 2.80% 2023 | 388 | 382 |
| Exelon Corp. 2.45% 2021 | 840 | 832 |
| Exelon Corp. 3.95% 2025 | 5,740 | 5,865 |
| Exelon Corp. 3.40% 2026 | 12,295 | 12,031 |
| Exelon Corp. 4.45% 2046 | 3,400 | 3,392 |
| FirstEnergy Corp. 7.375% 2031 | 7,202 | 9,408 |
| FirstEnergy Corp., Series B, 4.25% 2023 | 41,767 | 43,598 |
| Iberdrola Finance Ireland 5.00% 20195 | 1,060 | 1,131 |
| Israel Electric Corp. Ltd. 8.10% 20965 | 4,905 | 5,800 |
| MidAmerican Energy Co. 5.95% 2017 | 10,625 | 10,857 |
| MidAmerican Energy Co. 2.40% 2019 | 9,000 | 9,102 |
| MidAmerican Energy Holdings Co. 5.75% 2018 | 10,000 | 10,491 |
| Mississippi Power Co. 4.25% 2042 | 10,000 | 8,803 |
| Bonds, notes & other debt instruments Corporate bonds & notes (continued) Utilities (continued) |
Principal amount (000) |
Value (000) |
| National Rural Utilities Cooperative Finance Corp. 2.95% 2024 | $6,000 | $5,988 |
| Nevada Power Co., General and Refunding Mortgage Notes, Series V, 7.125% 2019 | 1,490 | 1,651 |
| New York State Electric & Gas Corp. 3.25% 20265 | 3,000 | 2,982 |
| Niagara Mohawk Power Corp. 3.508% 20245 | 3,150 | 3,212 |
| Niagara Mohawk Power Corp. 4.278% 20345 | 2,000 | 2,039 |
| Northern States Power Co. 4.125% 2044 | 11,000 | 11,212 |
| Northern States Power Co., First Mortgage Bonds, 2.15% 2022 | 2,503 | 2,446 |
| Northern States Power Co., First Mortgage Bonds, 2.60% 2023 | 4,075 | 4,078 |
| NRG Energy, Inc. 6.25% 2022 | 24,775 | 25,642 |
| NRG Energy, Inc. 6.625% 2023 | 2,000 | 2,070 |
| NRG Energy, Inc. 7.25% 20265 | 17,575 | 18,476 |
| NRG Energy, Inc. 6.625% 20275 | 28,360 | 28,325 |
| Ohio Power Co., Series G, 6.60% 2033 | 2,090 | 2,594 |
| Ohio Power Co., Series D, 6.60% 2033 | 353 | 437 |
| Pacific Gas and Electric Co. 3.25% 2021 | 4,317 | 4,425 |
| Pacific Gas and Electric Co. 3.25% 2023 | 5,195 | 5,301 |
| Pacific Gas and Electric Co. 3.85% 2023 | 12,825 | 13,531 |
| Pacific Gas and Electric Co. 3.40% 2024 | 7,207 | 7,353 |
| Pacific Gas and Electric Co. 3.75% 2024 | 602 | 629 |
| Pacific Gas and Electric Co. 3.75% 2042 | 1,119 | 1,065 |
| Pacific Gas and Electric Co. 4.30% 2045 | 1,900 | 1,964 |
| Pacific Gas and Electric Co. 4.00% 2046 | 5,000 | 4,968 |
| PacifiCorp., First Mortgage Bonds, 5.65% 2018 | 5,500 | 5,818 |
| Progress Energy, Inc. 7.00% 2031 | 8,000 | 10,594 |
| Progress Energy, Inc. 7.75% 2031 | 8,000 | 11,052 |
| Public Service Co. of Colorado 2.25% 2022 | 3,834 | 3,765 |
| Public Service Enterprise Group Inc. 2.00% 2021 | 6,838 | 6,639 |
| Puget Energy, Inc. 6.50% 2020 | 6,317 | 7,121 |
| Puget Energy, Inc. 6.00% 2021 | 3,945 | 4,421 |
| Puget Energy, Inc. 5.625% 2022 | 7,652 | 8,473 |
| Puget Energy, Inc. 3.65% 2025 | 884 | 870 |
| Sierra Pacific Power Co. 2.60% 2026 | 12,491 | 11,915 |
| Southern California Edison Co. 1.845% 202210 | 6,541 | 6,443 |
| Southern Co. 5.50% 2057 | 9,655 | 9,999 |
| Talen Energy Corp. 6.50% 2018 | 6,500 | 6,776 |
| Talen Energy Corp. 4.625% 20195 | 57,035 | 55,467 |
| Tampa Electric Co. 2.60% 2022 | 911 | 889 |
| Tampa Electric Co. 4.35% 2044 | 8,330 | 8,330 |
| Teco Finance, Inc. 1.61% 20187 | 1,360 | 1,361 |
| Teco Finance, Inc. 5.15% 2020 | 11,553 | 12,379 |
| TEX Operations Co. LLC, Term Loan B, 5.00% 20237,9,10 | 14,209 | 14,282 |
| TEX Operations Co. LLC, Term Loan C, 5.00% 20237,9,10 | 3,241 | 3,257 |
| Veolia Environnement 6.75% 2038 | 500 | 633 |
| Virginia Electric and Power Co. 2.95% 2022 | 5,073 | 5,176 |
| Virginia Electric and Power Co. 3.45% 2024 | 560 | 575 |
| Virginia Electric and Power Co. 3.10% 2025 | 2,625 | 2,605 |
| Virginia Electric and Power Co. 2.95% 2026 | 6,000 | 5,837 |
| Virginia Electric and Power Co., Series B, 5.95% 2017 | 4,500 | 4,625 |
| Xcel Energy Inc. 2.40% 2021 | 2,836 | 2,821 |
| Xcel Energy Inc. 6.50% 2036 | 9,680 | 12,211 |
| Xcel Energy Inc. 4.80% 2041 | 712 | 753 |
| 1,005,923 |
| Bonds, notes & other debt instruments Corporate bonds & notes (continued) Materials 0.93% |
Principal amount (000) |
Value (000) |
| AK Steel Holding Corp. 7.50% 2023 | $1,825 | $2,004 |
| Aleris International, Inc. 7.875% 2020 | 2,850 | 2,924 |
| Aleris International, Inc. 9.50% 20215 | 1,175 | 1,284 |
| Anglo American Capital PLC 4.125% 20215 | 4,800 | 4,908 |
| ArcelorMittal 7.25% 2022 | 22,385 | 25,351 |
| ArcelorMittal 6.125% 2025 | 3,825 | 4,224 |
| ArcelorMittal 7.75% 2041 | 53,255 | 58,181 |
| Ball Corp. 4.375% 2020 | 15,225 | 16,053 |
| BHP Billiton Finance (USA) Ltd. 3.85% 2023 | 4,100 | 4,345 |
| BHP Billiton Finance Ltd. 6.75% 20755 | 5,000 | 5,700 |
| CF Industries, Inc. 4.50% 20265 | 7,285 | 7,307 |
| CF Industries, Inc. 4.95% 2043 | 26,745 | 23,068 |
| Chemours Co. 6.625% 2023 | 36,185 | 36,095 |
| Chemours Co. 7.00% 2025 | 40,090 | 40,150 |
| Cliffs Natural Resources Inc. 8.00% 20205 | 1,925 | 2,012 |
| Cliffs Natural Resources Inc. 8.25% 20205 | 57,000 | 61,987 |
| Cliffs Natural Resources Inc. 4.875% 2021 | 4,945 | 4,673 |
| CRH America, Inc. 3.875% 20255 | 2,000 | 2,045 |
| CRH America, Inc. 5.125% 20455 | 1,000 | 1,077 |
| Dow Chemical Co. 5.25% 2041 | 4,000 | 4,370 |
| Eastman Chemical Co. 2.70% 2020 | 12,000 | 12,146 |
| First Quantum Minerals Ltd. 6.75% 20205 | 77,005 | 79,364 |
| First Quantum Minerals Ltd. 7.00% 20215 | 76,242 | 78,339 |
| First Quantum Minerals Ltd. 7.25% 20225 | 7,615 | 7,824 |
| FMG Resources 3.75% 20197,9,10 | 2,477 | 2,495 |
| FMG Resources 9.75% 20225 | 62,745 | 73,098 |
| Freeport-McMoRan Copper & Gold Inc. 3.55% 2022 | 26,275 | 24,698 |
| Freeport-McMoRan Inc. 3.875% 2023 | 7,000 | 6,492 |
| Freeport-McMoRan Inc. 6.875% 20235 | 9,000 | 9,427 |
| Georgia Gulf Corp. 4.625% 2021 | 25,425 | 26,537 |
| Georgia-Pacific Corp. 2.539% 20195 | 12,000 | 12,162 |
| Hexion Inc. 13.75% 20225 | 925 | 937 |
| Holcim Ltd. 6.00% 20195 | 1,607 | 1,766 |
| Holcim Ltd. 5.15% 20235 | 12,595 | 13,886 |
| Huntsman International LLC 4.875% 2020 | 18,750 | 19,453 |
| International Paper Co. 7.30% 2039 | 5,615 | 7,318 |
| Monsanto Co. 4.40% 2044 | 13,090 | 12,886 |
| Novelis Corp. 6.25% 20245 | 5,150 | 5,453 |
| Novelis Corp. 5.875% 20265 | 15,300 | 15,625 |
| Owens-Illinois, Inc. 5.00% 20225 | 3,360 | 3,486 |
| Owens-Illinois, Inc. 5.875% 20235 | 12,780 | 13,475 |
| Owens-Illinois, Inc. 6.375% 20255 | 5,225 | 5,568 |
| Paperworks Industries Inc. 9.50% 20195 | 2,458 | 2,132 |
| Platform Specialty Products Corp. 10.375% 20215 | 19,991 | 22,290 |
| Praxair, Inc. 2.25% 2020 | 6,287 | 6,280 |
| Rayonier Advanced Materials Inc. 5.50% 20245 | 31,065 | 29,356 |
| Reynolds Group Inc. 5.75% 2020 | 32,935 | 33,950 |
| Reynolds Group Inc. 6.875% 202110 | 3,241 | 3,323 |
| Rio Tinto Finance PLC 3.75% 2025 | 4,150 | 4,311 |
| Rio Tinto PLC 4.125% 2042 | 4,340 | 4,323 |
| Ryerson Inc. 11.00% 20225 | 61,727 | 68,943 |
| Smurfit Capital Funding PLC 7.50% 2025 | 2,425 | 2,843 |
| Summit Materials, Inc. 8.50% 2022 | 875 | 982 |
| Summit Materials, Inc. 6.125% 2023 | 9,325 | 9,675 |
| Bonds, notes & other debt instruments Corporate bonds & notes (continued) Materials (continued) |
Principal amount (000) |
Value (000) |
| Teck Resources Ltd. 5.20% 2042 | $1,000 | $935 |
| Tembec Industries Inc. 9.00% 20195 | 7,520 | 7,652 |
| United States Steel Corp. 7.375% 2020 | 1,200 | 1,291 |
| United States Steel Corp. 8.375% 20215 | 3,000 | 3,337 |
| Vale Overseas Ltd. 5.875% 2021 | 4,245 | 4,553 |
| Vale Overseas Ltd. 4.375% 2022 | 1,305 | 1,320 |
| Vale Overseas Ltd. 6.25% 2026 | 2,370 | 2,554 |
| Xstrata Canada Financial Corp. 4.95% 20215 | 2,100 | 2,261 |
| Zekelman Industries Inc. 9.875% 20235 | 6,435 | 7,288 |
| Zekelman Industries Inc., Term Loan B, 6.00% 20217,9,10 | 3,980 | 4,029 |
| 963,821 | ||
| Information technology 0.82% | ||
| Analog Devices, Inc. 2.50% 2021 | 1,450 | 1,437 |
| Analog Devices, Inc. 3.125% 2023 | 2,000 | 1,990 |
| Analog Devices, Inc. 3.50% 2026 | 1,885 | 1,857 |
| Apple Inc. 1.55% 2021 | 13,040 | 12,610 |
| Apple Inc. 2.25% 2021 | 10,250 | 10,256 |
| Apple Inc. 2.45% 2026 | 3,500 | 3,272 |
| Blackboard Inc. 9.75% 20215 | 258 | 265 |
| Blackboard Inc., Term Loan B4, 6.023% 20217,9,10 | 3,176 | 3,192 |
| BMC Software, Inc. 9.00% 20195,8 | 525 | 512 |
| BMC Software, Inc. 8.125% 20215 | 22,150 | 21,486 |
| BMC Software, Inc., Term Loan B, 5.00% 20207,9,10 | 1,045 | 1,044 |
| Broadcom Ltd. 3.00% 20225 | 33,750 | 33,637 |
| Broadcom Ltd. 3.625% 20245 | 25,750 | 25,726 |
| Broadcom Ltd. 3.875% 20275 | 31,445 | 31,347 |
| Camelot Finance SA 7.875% 20245 | 15,995 | 16,955 |
| Camelot Finance SA, Term Loan B, 4.75% 20237,9,10 | 13,267 | 13,398 |
| Cisco Systems, Inc. 1.85% 2021 | 9,300 | 9,086 |
| Dell Inc. 2.65% 2020 | 26,975 | 26,176 |
| Dell Inc. 4.42% 20215 | 6,540 | 6,833 |
| Dell Inc. 5.45% 20235 | 25,000 | 26,884 |
| Dell Inc. 8.35% 20465 | 9,895 | 12,394 |
| EchoStar Corp. 6.625% 20265 | 17,800 | 18,468 |
| Ellucian, Inc. 9.00% 20235 | 775 | 825 |
| First Data Corp. 6.75% 20205 | 2,441 | 2,523 |
| First Data Corp. 5.375% 20235 | 10,950 | 11,306 |
| First Data Corp. 7.00% 20235 | 113,375 | 120,461 |
| First Data Corp. 5.00% 20245 | 8,325 | 8,439 |
| First Data Corp. 5.75% 20245 | 7,650 | 7,908 |
| Genesys Telecommunications Laboratories, Inc., Term Loan B, 5.00% 20237,9,10 | 4,825 | 4,886 |
| Genesys Telecommunications Laboratories, Inc. 10.00% 20245 | 10,400 | 11,258 |
| Gogo Inc. 12.50% 20225 | 41,325 | 44,734 |
| Harris Corp. 2.70% 2020 | 1,315 | 1,315 |
| Harris Corp. 3.832% 2025 | 740 | 755 |
| Harris Corp. 4.854% 2035 | 2,775 | 2,947 |
| Harris Corp. 5.054% 2045 | 5,735 | 6,221 |
| Infor (US), Inc. 6.50% 2022 | 2,000 | 2,063 |
| Infor Inc. 5.75% 20205 | 5,375 | 5,610 |
| Jabil Circuit, Inc. 8.25% 2018 | 20,925 | 22,379 |
| Jabil Circuit, Inc. 5.625% 2020 | 10,650 | 11,527 |
| JDA Software Group, Inc. 7.375% 20245 | 2,925 | 3,079 |
| JDA Software Group, Inc., Term Loan B, 4.50% 20237,9,10 | 9,500 | 9,559 |
| Bonds, notes & other debt instruments Corporate bonds & notes (continued) Information technology (continued) |
Principal amount (000) |
Value (000) |
| Kronos Inc., Term Loan B, 5.00% 20237,9,10 | $8,410 | $8,507 |
| Kronos Inc., Term Loan B, 9.25% 20247,9,10 | 34,170 | 35,355 |
| Microsoft Corp. 1.55% 2021 | 26,630 | 25,790 |
| Microsoft Corp. 2.40% 2022 | 18,945 | 18,950 |
| Microsoft Corp. 2.65% 2022 | 6,000 | 6,010 |
| Microsoft Corp. 2.875% 2024 | 21,285 | 21,253 |
| Microsoft Corp. 2.40% 2026 | 3,000 | 2,797 |
| Microsoft Corp. 3.30% 2027 | 21,215 | 21,262 |
| Microsoft Corp. 4.20% 2035 | 6,000 | 6,199 |
| Microsoft Corp. 3.70% 2046 | 1,750 | 1,610 |
| Microsoft Corp. 4.25% 2047 | 2,750 | 2,783 |
| NXP BV and NXP Funding LLC 4.125% 20205 | 21,000 | 21,788 |
| NXP BV and NXP Funding LLC 4.125% 20215 | 11,600 | 12,005 |
| Oracle Corp. 1.90% 2021 | 7,250 | 7,085 |
| Oracle Corp. 2.65% 2026 | 19,500 | 18,382 |
| Oracle Corp. 4.00% 2046 | 1,650 | 1,552 |
| Qorvo, Inc. 7.00% 2025 | 15,875 | 17,621 |
| Seagate Technology LLC 4.75% 2023 | 12,550 | 12,683 |
| Solera Holdings, Inc. 10.50% 20245 | 18,800 | 21,432 |
| Visa Inc. 3.15% 2025 | 8,000 | 7,989 |
| Western Digital Corp. 7.375% 20235 | 7,175 | 7,919 |
| Western Digital Corp. 10.50% 20245 | 3,500 | 4,134 |
| Western Digital Corp., Term Loan B1, 4.526% 20237,9,10 | 3,980 | 4,032 |
| 843,758 | ||
| Real estate 0.51% | ||
| Alexandria Real Estate Equities, Inc. 2.75% 2020 | 795 | 796 |
| Alexandria Real Estate Equities, Inc. 3.90% 2023 | 1,600 | 1,630 |
| Alexandria Real Estate Equities, Inc. 4.30% 2026 | 2,200 | 2,262 |
| Alexandria Real Estate Equities, Inc. 4.50% 2029 | 1,355 | 1,371 |
| American Campus Communities, Inc. 3.35% 2020 | 3,380 | 3,444 |
| American Campus Communities, Inc. 3.75% 2023 | 3,985 | 4,042 |
| American Campus Communities, Inc. 4.125% 2024 | 19,700 | 20,214 |
| American Tower Corp. 3.40% 2019 | 6,400 | 6,561 |
| American Tower Corp. 7.25% 2019 | 15,025 | 16,468 |
| Brandywine Operating Partnership, LP 5.70% 2017 | 20 | 20 |
| Brandywine Operating Partnership, LP 3.95% 2023 | 1,729 | 1,722 |
| Communications Sales & Leasing, Inc. 6.00% 20235 | 17,350 | 18,261 |
| Communications Sales & Leasing, Inc. 8.25% 2023 | 17,213 | 18,762 |
| Corporate Office Properties LP 3.60% 2023 | 320 | 312 |
| Corporate Office Properties LP 5.25% 2024 | 9,630 | 10,148 |
| Corporate Office Properties LP 5.00% 2025 | 4,145 | 4,306 |
| Crescent Resources 8.875% 20215 | 1,200 | 1,251 |
| Crown Castle International Corp. 4.875% 2022 | 9,800 | 10,560 |
| DCT Industrial Trust Inc. 4.50% 2023 | 5,570 | 5,729 |
| DDR Corp. 3.625% 2025 | 5,000 | 4,822 |
| Developers Diversified Realty Corp. 7.50% 2017 | 38,667 | 39,053 |
| Developers Diversified Realty Corp. 4.75% 2018 | 5,000 | 5,130 |
| Developers Diversified Realty Corp. 7.875% 2020 | 6,505 | 7,576 |
| EPR Properties 4.50% 2025 | 7,945 | 7,851 |
| EPR Properties 4.75% 2026 | 9,810 | 9,753 |
| ERP Operating LP 7.125% 2017 | 10,000 | 10,388 |
| Essex Portfolio L.P. 3.625% 2022 | 9,550 | 9,806 |
| Essex Portfolio L.P. 3.25% 2023 | 4,400 | 4,391 |
| Bonds, notes & other debt instruments Corporate bonds & notes (continued) Real estate (continued) |
Principal amount (000) |
Value (000) |
| Essex Portfolio L.P. 3.875% 2024 | $5,900 | $6,015 |
| Gaming and Leisure Properties, Inc. 4.375% 2021 | 1,700 | 1,772 |
| Gaming and Leisure Properties, Inc. 5.375% 2026 | 11,400 | 11,899 |
| Hospitality Properties Trust 6.70% 2018 | 12,625 | 12,915 |
| Hospitality Properties Trust 4.25% 2021 | 20,500 | 21,249 |
| Hospitality Properties Trust 5.00% 2022 | 6,500 | 6,849 |
| Hospitality Properties Trust 4.50% 2023 | 11,060 | 11,241 |
| Hospitality Properties Trust 4.50% 2025 | 5,940 | 5,814 |
| Host Hotels & Resorts LP 4.50% 2026 | 5,675 | 5,826 |
| Iron Mountain Inc. 6.00% 20202,5 | 30,925 | 32,471 |
| Iron Mountain Inc. 6.00% 20232 | 950 | 1,012 |
| Iron Mountain Inc. 5.75% 20242 | 4,325 | 4,412 |
| iStar Financial Inc. 5.00% 2019 | 14,275 | 14,534 |
| Kimco Realty Corp. 6.875% 2019 | 10,000 | 11,239 |
| Kimco Realty Corp. 3.40% 2022 | 5,460 | 5,551 |
| Kimco Realty Corp. 2.70% 2024 | 3,090 | 2,959 |
| Prologis, Inc. 4.25% 2023 | 25,000 | 26,642 |
| Realogy Corp. 4.50% 20195 | 29,400 | 30,466 |
| Realogy Corp. 5.25% 20215 | 27,600 | 28,566 |
| Realogy Corp. 4.875% 20235 | 7,825 | 7,668 |
| Scentre Group 2.375% 20215 | 4,575 | 4,510 |
| Scentre Group 3.25% 20255 | 3,140 | 3,052 |
| Scentre Group 3.50% 20255 | 10,455 | 10,363 |
| Select Income REIT 3.60% 2020 | 5,775 | 5,817 |
| Select Income REIT 4.15% 2022 | 3,300 | 3,297 |
| WEA Finance LLC 2.70% 20195 | 8,525 | 8,627 |
| WEA Finance LLC 3.25% 20205 | 10,195 | 10,397 |
| WEA Finance LLC 3.75% 20245 | 4,400 | 4,463 |
| 526,255 | ||
| Consumer staples 0.40% | ||
| Altria Group, Inc. 9.25% 2019 | 18,542 | 21,833 |
| Altria Group, Inc. 2.625% 2020 | 10,420 | 10,571 |
| Altria Group, Inc. 4.00% 2024 | 1,500 | 1,575 |
| Altria Group, Inc. 2.625% 2026 | 1,100 | 1,035 |
| Altria Group, Inc. 9.95% 2038 | 23,500 | 39,522 |
| Altria Group, Inc. 4.25% 2042 | 20,000 | 19,405 |
| Altria Group, Inc. 4.50% 2043 | 4,000 | 4,053 |
| Altria Group, Inc. 5.375% 2044 | 2,595 | 2,955 |
| Altria Group, Inc. 3.875% 2046 | 2,595 | 2,385 |
| Anheuser-Busch InBev NV 7.75% 2019 | 25,000 | 27,816 |
| Anheuser-Busch InBev NV 2.65% 2021 | 2,875 | 2,895 |
| Anheuser-Busch InBev NV 4.95% 2042 | 7,000 | 7,604 |
| Anheuser-Busch InBev NV 4.90% 2046 | 2,215 | 2,381 |
| BJ’s Wholesale Club, Term Loan B, 4.75% 20247,9,10 | 7,705 | 7,731 |
| BJ’s Wholesale Club, Term Loan, 8.50% 20257,9,10 | 7,820 | 7,957 |
| British American Tobacco International Finance PLC 3.95% 20255 | 8,000 | 8,178 |
| Constellation Brands, Inc. 3.875% 2019 | 6,000 | 6,272 |
| Constellation Brands, Inc. 6.00% 2022 | 2,825 | 3,235 |
| CVS Health Corp. 2.125% 2021 | 4,010 | 3,925 |
| CVS Health Corp. 2.875% 2026 | 3,795 | 3,605 |
| Imperial Tobacco Finance PLC 3.50% 20235 | 10,000 | 10,150 |
| Kraft Foods Inc. 5.00% 2042 | 30,000 | 30,755 |
| Kraft Heinz Co. 4.375% 2046 | 4,555 | 4,276 |
| Bonds, notes & other debt instruments Corporate bonds & notes (continued) Consumer staples (continued) |
Principal amount (000) |
Value (000) |
| Molson Coors Brewing Co. 1.45% 2019 | $4,245 | $4,190 |
| Molson Coors Brewing Co. 2.10% 2021 | 5,475 | 5,345 |
| Molson Coors Brewing Co. 3.00% 2026 | 6,255 | 5,895 |
| Molson Coors Brewing Co. 4.20% 2046 | 4,200 | 3,894 |
| Mondelez International, Inc. 1.625% 20195 | 6,000 | 5,912 |
| PepsiCo, Inc. 1.70% 2021 | 2,630 | 2,559 |
| PepsiCo, Inc. 2.375% 2026 | 1,100 | 1,037 |
| PepsiCo, Inc. 3.45% 2046 | 1,500 | 1,359 |
| Pernod Ricard SA 4.45% 20225 | 9,500 | 10,122 |
| Philip Morris International Inc. 3.60% 2023 | 7,245 | 7,522 |
| Philip Morris International Inc. 4.25% 2044 | 2,000 | 1,958 |
| Reynolds American Inc. 2.30% 2018 | 1,990 | 2,003 |
| Reynolds American Inc. 3.25% 2020 | 5,510 | 5,655 |
| Reynolds American Inc. 3.25% 2022 | 6,150 | 6,208 |
| Reynolds American Inc. 4.00% 2022 | 890 | 931 |
| Reynolds American Inc. 4.45% 2025 | 22,110 | 23,146 |
| Reynolds American Inc. 5.70% 2035 | 3,760 | 4,315 |
| Reynolds American Inc. 6.15% 2043 | 1,820 | 2,175 |
| Reynolds American Inc. 5.85% 2045 | 10,200 | 11,896 |
| The JM Smucker Co. 3.00% 2022 | 2,850 | 2,887 |
| Walgreens Boots Alliance, Inc. 2.60% 2021 | 16,805 | 16,791 |
| Walgreens Boots Alliance, Inc. 3.30% 2021 | 13,000 | 13,281 |
| Walgreens Boots Alliance, Inc. 3.10% 2023 | 900 | 899 |
| Walgreens Boots Alliance, Inc. 3.45% 2026 | 1,770 | 1,729 |
| Walgreens Boots Alliance, Inc. 4.65% 2046 | 1,045 | 1,050 |
| Wal-Mart Stores, Inc. 3.30% 2024 | 10,755 | 11,055 |
| WM. Wrigley Jr. Co 2.40% 20185 | 1,200 | 1,212 |
| WM. Wrigley Jr. Co 2.90% 20195 | 1,285 | 1,308 |
| WM. Wrigley Jr. Co 3.375% 20205 | 22,500 | 23,214 |
| 409,662 | ||
| Total corporate bonds & notes | 14,745,926 | |
| U.S. Treasury bonds & notes 5.19% U.S. Treasury 4.80% |
||
| U.S. Treasury 0.625% 2018 | 53,360 | 53,137 |
| U.S. Treasury 0.75% 201811 | 170,000 | 169,655 |
| U.S. Treasury 1.125% 2018 | 4,000 | 4,007 |
| U.S. Treasury 0.875% 2019 | 93,000 | 92,073 |
| U.S. Treasury 0.875% 2019 | 86,000 | 84,869 |
| U.S. Treasury 1.00% 2019 | 25,000 | 24,860 |
| U.S. Treasury 1.50% 2019 | 18,000 | 18,074 |
| U.S. Treasury 1.625% 2019 | 13,640 | 13,742 |
| U.S. Treasury 1.75% 2019 | 56,000 | 56,502 |
| U.S. Treasury 3.625% 2019 | 90,000 | 95,061 |
| U.S. Treasury 1.25% 2020 | 180,000 | 178,769 |
| U.S. Treasury 1.375% 2020 | 85,000 | 84,040 |
| U.S. Treasury 1.375% 2020 | 43,000 | 42,786 |
| U.S. Treasury 1.375% 2020 | 40,000 | 39,591 |
| U.S. Treasury 1.50% 2020 | 22,000 | 21,938 |
| U.S. Treasury 1.125% 2021 | 36,000 | 34,838 |
| U.S. Treasury 1.375% 2021 | 139,000 | 136,979 |
| U.S. Treasury 1.75% 2022 | 118,672 | 116,586 |
| U.S. Treasury 2.00% 2022 | 104,000 | 103,397 |
| Bonds, notes & other debt instruments U.S. Treasury bonds & notes (continued) U.S. Treasury (continued) |
Principal amount (000) |
Value (000) |
| U.S. Treasury 1.375% 2023 | $137,270 | $130,115 |
| U.S. Treasury 2.25% 2023 | 126,750 | 126,799 |
| U.S. Treasury 6.25% 2023 | 44,000 | 55,010 |
| U.S. Treasury 2.00% 2025 | 482,035 | 466,851 |
| U.S. Treasury 1.50% 2026 | 127,191 | 116,899 |
| U.S. Treasury 1.625% 2026 | 91,701 | 85,654 |
| U.S. Treasury 2.00% 2026 | 113,314 | 108,888 |
| U.S. Treasury 5.50% 2028 | 52,000 | 67,316 |
| U.S. Treasury 4.50% 2036 | 36,185 | 45,729 |
| U.S. Treasury 4.625% 2040 | 15,150 | 19,372 |
| U.S. Treasury 4.375% 2041 | 20,800 | 25,771 |
| U.S. Treasury 4.75% 2041 | 30,900 | 40,307 |
| U.S. Treasury 2.75% 2042 | 16,275 | 15,416 |
| U.S. Treasury 2.75% 2042 | 10,900 | 10,330 |
| U.S. Treasury 3.125% 2043 | 33,675 | 34,182 |
| U.S. Treasury 3.00% 2044 | 161,350 | 159,696 |
| U.S. Treasury 3.125% 2044 | 131,950 | 133,813 |
| U.S. Treasury 3.375% 2044 | 148,415 | 157,675 |
| U.S. Treasury 2.50% 2045 | 49,975 | 44,621 |
| U.S. Treasury 2.875% 2045 | 929,150 | 895,468 |
| U.S. Treasury 3.00% 2045 | 115,091 | 113,671 |
| U.S. Treasury 3.00% 2045 | 51,200 | 50,608 |
| U.S. Treasury 2.25% 2046 | 99,052 | 83,287 |
| U.S. Treasury 2.50% 2046 | 249,817 | 222,347 |
| U.S. Treasury 2.50% 2046 | 174,666 | 155,378 |
| U.S. Treasury 2.875% 2046 | 214,595 | 207,134 |
| 4,943,241 | ||
| U.S. Treasury inflation-protected securities 0.39% | ||
| U.S. Treasury Inflation-Protected Security 0.125% 202112 | 34,625 | 35,137 |
| U.S. Treasury Inflation-Protected Security 0.625% 202412 | 62,066 | 63,893 |
| U.S. Treasury Inflation-Protected Security 0.375% 202512 | 54,483 | 54,804 |
| U.S. Treasury Inflation-Protected Security 0.625% 202612 | 46,686 | 47,636 |
| U.S. Treasury Inflation-Protected Security 0.375% 202712 | 39,966 | 39,900 |
| U.S. Treasury Inflation-Protected Security 1.375% 204412 | 82,670 | 91,580 |
| U.S. Treasury Inflation-Protected Security 1.00% 204612 | 71,490 | 72,950 |
| 405,900 | ||
| Total U.S. Treasury bonds & notes | 5,349,141 | |
| Mortgage-backed obligations 1.77% | ||
| Aventura Mall Trust, Series A, 3.743% 20325,7,10 | 4,900 | 5,165 |
| Banc of America Commercial Mortgage Inc., Series 2007-3, Class A4, 5.602% 20497,10 | 364 | 364 |
| Core Industrial Trust, Series 2015-CALW, Class A, 3.04% 20345,10 | 10,675 | 10,935 |
| Countrywide Alternative Loan Trust, Series 2005-54CB, Class 2A5, 5.50% 203510 | 4,603 | 4,017 |
| Countrywide Alternative Loan Trust, Series 2007-HY4, Class 3A1, 3.195% 20477,10 | 3,265 | 2,397 |
| CS First Boston Mortgage Securities Corp., Series 2004-5, Class IVA1, 6.00% 203410 | 1,003 | 1,024 |
| CS First Boston Mortgage Securities Corp., Series 2007-C5, Class A4, 5.695% 20407,10 | 8,000 | 8,092 |
| CS First Boston Mortgage Securities Corp., Series 2007-C2, Class AM, 5.615% 20497,10 | 10,000 | 10,031 |
| EQTY 2014-INNS Mortgage Trust Commercial Mortgage Pass-Through Certificates, Series 2014-A, 1.616% 20315,7,10 |
4,929 | 4,939 |
| Fannie Mae 5.50% 201810 | 6 | 6 |
| Fannie Mae 6.00% 202110 | 90 | 96 |
| Fannie Mae 4.50% 202410 | 1,347 | 1,423 |
| Bonds, notes & other debt instruments Mortgage-backed obligations (continued) |
Principal amount (000) |
Value (000) |
| Fannie Mae 5.50% 202410 | $124 | $134 |
| Fannie Mae 4.50% 202510 | 1,212 | 1,278 |
| Fannie Mae 4.50% 202510 | 811 | 861 |
| Fannie Mae 4.50% 202510 | 791 | 835 |
| Fannie Mae 4.50% 202510 | 593 | 626 |
| Fannie Mae 6.00% 202610 | 2,281 | 2,575 |
| Fannie Mae 7.00% 202610 | 374 | 425 |
| Fannie Mae 2.50% 202710 | 1,100 | 1,112 |
| Fannie Mae 2.50% 202710 | 835 | 845 |
| Fannie Mae 2.50% 202710 | 810 | 820 |
| Fannie Mae 2.50% 202710 | 640 | 647 |
| Fannie Mae 2.50% 202710 | 467 | 472 |
| Fannie Mae 2.50% 202710 | 406 | 411 |
| Fannie Mae 2.50% 202710 | 374 | 379 |
| Fannie Mae 2.50% 202810 | 27,871 | 28,178 |
| Fannie Mae 2.50% 202810 | 10,089 | 10,208 |
| Fannie Mae 2.50% 202810 | 1,459 | 1,475 |
| Fannie Mae 2.50% 202810 | 1,298 | 1,312 |
| Fannie Mae 2.50% 202810 | 1,154 | 1,167 |
| Fannie Mae 2.50% 202810 | 1,054 | 1,066 |
| Fannie Mae 2.50% 202810 | 1,041 | 1,053 |
| Fannie Mae 2.50% 202810 | 959 | 970 |
| Fannie Mae 2.50% 202810 | 913 | 924 |
| Fannie Mae 2.50% 202810 | 680 | 687 |
| Fannie Mae 2.50% 202810 | 642 | 649 |
| Fannie Mae 2.50% 202810 | 567 | 573 |
| Fannie Mae 2.50% 202810 | 530 | 537 |
| Fannie Mae 2.50% 202810 | 438 | 443 |
| Fannie Mae 2.50% 202810 | 401 | 406 |
| Fannie Mae 2.50% 202810 | 389 | 389 |
| Fannie Mae 2.50% 202810 | 385 | 388 |
| Fannie Mae 2.50% 202810 | 351 | 355 |
| Fannie Mae 2.50% 202810 | 347 | 351 |
| Fannie Mae 2.50% 202810 | 347 | 347 |
| Fannie Mae 2.50% 202810 | 335 | 339 |
| Fannie Mae 2.50% 202810 | 331 | 335 |
| Fannie Mae 2.50% 202810 | 320 | 324 |
| Fannie Mae 2.50% 202810 | 234 | 237 |
| Fannie Mae 2.50% 202810 | 79 | 80 |
| Fannie Mae 2.50% 202810 | 44 | 44 |
| Fannie Mae 6.00% 202810 | 2,463 | 2,779 |
| Fannie Mae 7.00% 202810 | 858 | 982 |
| Fannie Mae 7.00% 202810 | 168 | 191 |
| Fannie Mae 2.50% 203110 | 28,972 | 29,003 |
| Fannie Mae 2.50% 203210 | 69,528 | 69,603 |
| Fannie Mae 2.50% 20326,10 | 44,500 | 44,437 |
| Fannie Mae 5.50% 203310 | 366 | 409 |
| Fannie Mae 3.00% 203510 | 3,223 | 3,252 |
| Fannie Mae 3.50% 203510 | 2,409 | 2,493 |
| Fannie Mae 5.50% 203510 | 337 | 376 |
| Fannie Mae 5.50% 203610 | 2,180 | 2,440 |
| Fannie Mae 6.00% 203610 | 745 | 843 |
| Fannie Mae 6.00% 203610 | 625 | 707 |
| Fannie Mae 6.00% 203610 | 178 | 201 |
| Fannie Mae 6.00% 203710 | 9,830 | 11,125 |
| Bonds, notes & other debt instruments Mortgage-backed obligations (continued) |
Principal amount (000) |
Value (000) |
| Fannie Mae 6.00% 203710 | $1,704 | $1,947 |
| Fannie Mae 6.00% 203710 | 1,147 | 1,298 |
| Fannie Mae 6.00% 203710 | 87 | 95 |
| Fannie Mae 6.50% 203710 | 581 | 667 |
| Fannie Mae 6.50% 203710 | 513 | 580 |
| Fannie Mae 6.50% 203710 | 369 | 417 |
| Fannie Mae 6.50% 203710 | 111 | 127 |
| Fannie Mae 7.00% 203710 | 283 | 311 |
| Fannie Mae 7.00% 203710 | 98 | 107 |
| Fannie Mae 7.50% 203710 | 182 | 203 |
| Fannie Mae 7.50% 203710 | 112 | 120 |
| Fannie Mae 7.50% 203710 | 86 | 92 |
| Fannie Mae 5.50% 203810 | 474 | 529 |
| Fannie Mae 6.00% 203810 | 2,274 | 2,568 |
| Fannie Mae 6.00% 203810 | 1,444 | 1,635 |
| Fannie Mae 6.00% 203810 | 1,156 | 1,322 |
| Fannie Mae 4.50% 203910 | 18,620 | 20,171 |
| Fannie Mae 6.00% 203910 | 1,366 | 1,541 |
| Fannie Mae 6.50% 203910 | 441 | 504 |
| Fannie Mae 4.00% 204010 | 9,548 | 10,077 |
| Fannie Mae 4.00% 204010 | 5,289 | 5,570 |
| Fannie Mae 4.00% 204010 | 400 | 423 |
| Fannie Mae 4.50% 204010 | 54 | 58 |
| Fannie Mae 4.50% 204010 | 37 | 40 |
| Fannie Mae 5.00% 204010 | 5,931 | 6,478 |
| Fannie Mae 4.00% 204110 | 8,031 | 8,488 |
| Fannie Mae 4.00% 204110 | 6,286 | 6,644 |
| Fannie Mae 4.00% 204110 | 611 | 646 |
| Fannie Mae 4.00% 204110 | 366 | 387 |
| Fannie Mae 4.00% 204110 | 301 | 318 |
| Fannie Mae 4.00% 204110 | 197 | 209 |
| Fannie Mae 4.50% 204110 | 172 | 185 |
| Fannie Mae 5.00% 204110 | 380 | 416 |
| Fannie Mae 5.00% 204110 | 355 | 389 |
| Fannie Mae 5.00% 204110 | 272 | 298 |
| Fannie Mae 5.00% 204110 | 230 | 251 |
| Fannie Mae 3.50% 204210 | 14,687 | 15,086 |
| Fannie Mae 4.00% 204210 | 7,138 | 7,544 |
| Fannie Mae 4.00% 204210 | 2,994 | 3,168 |
| Fannie Mae 4.00% 204210 | 1,028 | 1,088 |
| Fannie Mae 4.00% 204310 | 8,194 | 8,678 |
| Fannie Mae 4.00% 204310 | 7,753 | 8,210 |
| Fannie Mae 4.00% 204310 | 3,283 | 3,483 |
| Fannie Mae 4.00% 204310 | 3,123 | 3,308 |
| Fannie Mae 4.00% 204310 | 2,875 | 3,045 |
| Fannie Mae 4.00% 204310 | 2,790 | 2,954 |
| Fannie Mae 4.00% 204310 | 2,576 | 2,733 |
| Fannie Mae 4.00% 204310 | 2,116 | 2,240 |
| Fannie Mae 3.50% 204510 | 16,805 | 17,250 |
| Fannie Mae 4.00% 204510 | 62,239 | 65,346 |
| Fannie Mae 4.00% 204510 | 52,175 | 55,119 |
| Fannie Mae 4.00% 204510 | 8,411 | 8,888 |
| Fannie Mae 3.00% 204610 | 75,134 | 74,413 |
| Fannie Mae 3.50% 204610 | 30,022 | 30,809 |
| Fannie Mae 3.50% 204610 | 9,669 | 9,889 |
| Bonds, notes & other debt instruments Mortgage-backed obligations (continued) |
Principal amount (000) |
Value (000) |
| Fannie Mae 3.50% 204610 | $9,339 | $9,551 |
| Fannie Mae 3.50% 204610 | 1,620 | 1,656 |
| Fannie Mae 4.00% 204610 | 24,515 | 25,741 |
| Fannie Mae 4.00% 204610 | 22,815 | 23,955 |
| Fannie Mae 4.00% 204610 | 18,195 | 19,105 |
| Fannie Mae 4.00% 204610 | 7,323 | 7,689 |
| Fannie Mae 4.00% 204610 | 5,775 | 6,063 |
| Fannie Mae 4.00% 204610 | 3,860 | 4,053 |
| Fannie Mae 4.50% 204610 | 20,830 | 22,435 |
| Fannie Mae 4.50% 204610 | 6,085 | 6,549 |
| Fannie Mae 3.50% 20476,10 | 6,000 | 6,131 |
| Fannie Mae 4.00% 20476,10 | 68,962 | 72,211 |
| Fannie Mae 4.50% 20476,10 | 8,000 | 8,583 |
| Fannie Mae 6.50% 204710 | 466 | 519 |
| Fannie Mae 6.50% 204710 | 330 | 367 |
| Fannie Mae 6.50% 204710 | 288 | 321 |
| Fannie Mae 6.50% 204710 | 182 | 203 |
| Fannie Mae 6.50% 204710 | 122 | 136 |
| Fannie Mae 6.50% 204710 | 78 | 87 |
| Fannie Mae 7.00% 204710 | 518 | 585 |
| Fannie Mae 7.00% 204710 | 286 | 323 |
| Fannie Mae 7.00% 204710 | 191 | 216 |
| Fannie Mae 7.00% 204710 | 100 | 113 |
| Fannie Mae, Series 2012-M14, Class A2, multifamily 2.301% 20227,10 | 4,285 | 4,240 |
| Fannie Mae, Series 2012-M9, Class A2, multifamily 2.482% 202210 | 12,231 | 12,197 |
| Fannie Mae, Series 2012-M5, Class A2, multifamily 2.715% 202210 | 7,000 | 7,064 |
| Fannie Mae, Series 2013-M14, Class A2, multifamily 3.329% 20237,10 | 8,367 | 8,672 |
| Fannie Mae, Series 2014-M2, Class A2, multifamily 3.513% 20237,10 | 9,215 | 9,600 |
| Fannie Mae, Series 2014-M9, multifamily 3.103% 20247,10 | 7,990 | 8,178 |
| Fannie Mae, Series 2014-M3, Class A2, multifamily 3.471% 20247,10 | 10,000 | 10,436 |
| Fannie Mae, Series 2001-4, Class GA, 9.342% 20257,10 | 49 | 55 |
| Fannie Mae, Series 2001-4, Class NA, 9.644% 20257,10 | 1 | 1 |
| Fannie Mae, Series 2001-20, Class E, 9.586% 20317,10 | 49 | 53 |
| Fannie Mae, Series 2007-33, Class HE, 5.50% 203710 | 3,539 | 3,884 |
| Fannie Mae, Series 2007-24, Class P, 6.00% 203710 | 1,947 | 2,131 |
| Fannie Mae, Series 2001-50, Class BA, 7.00% 204110 | 319 | 363 |
| Fannie Mae, Series 2001-T10, Class A1, 7.00% 204110 | 318 | 362 |
| Fannie Mae, Series 2002-W3, Class A5, 7.50% 204110 | 208 | 240 |
| Fannie Mae, Series 2002-W1, Class 2A, 6.157% 20427,10 | 535 | 608 |
| Financial Asset Securitization, Inc., Series 1997-NAM1, Class B1, 7.75% 202710 | 7 | 7 |
| Freddie Mac 5.00% 202310 | 1,489 | 1,584 |
| Freddie Mac 5.00% 202310 | 1,474 | 1,569 |
| Freddie Mac 5.00% 202310 | 1,329 | 1,416 |
| Freddie Mac 5.00% 202310 | 518 | 555 |
| Freddie Mac 3.50% 203410 | 12,201 | 12,632 |
| Freddie Mac 3.00% 203510 | 11,718 | 11,829 |
| Freddie Mac 3.50% 203510 | 24,791 | 25,685 |
| Freddie Mac 3.50% 203510 | 19,971 | 20,691 |
| Freddie Mac 3.50% 203510 | 3,304 | 3,423 |
| Freddie Mac 4.50% 203510 | 10,111 | 10,911 |
| Freddie Mac 5.50% 203710 | 385 | 427 |
| Freddie Mac 5.50% 203810 | 1,201 | 1,332 |
| Freddie Mac 6.50% 203810 | 1,173 | 1,323 |
| Freddie Mac 4.50% 203910 | 922 | 993 |
| Freddie Mac 5.00% 203910 | 2,428 | 2,691 |
| Bonds, notes & other debt instruments Mortgage-backed obligations (continued) |
Principal amount (000) |
Value (000) |
| Freddie Mac 5.00% 203910 | $1,546 | $1,707 |
| Freddie Mac 5.00% 203910 | 875 | 951 |
| Freddie Mac 5.50% 203910 | 577 | 640 |
| Freddie Mac 4.50% 204010 | 21,671 | 23,343 |
| Freddie Mac 4.00% 204110 | 1,672 | 1,768 |
| Freddie Mac 4.50% 204110 | 1,953 | 2,104 |
| Freddie Mac 4.50% 204110 | 1,901 | 2,052 |
| Freddie Mac 4.50% 204110 | 1,343 | 1,445 |
| Freddie Mac 5.00% 204110 | 146 | 160 |
| Freddie Mac 4.50% 204210 | 3,466 | 3,737 |
| Freddie Mac 4.50% 204210 | 2,028 | 2,184 |
| Freddie Mac 4.00% 204310 | 5,368 | 5,682 |
| Freddie Mac 4.00% 204310 | 5,228 | 5,528 |
| Freddie Mac 4.00% 204310 | 4,402 | 4,660 |
| Freddie Mac 4.00% 204310 | 3,133 | 3,317 |
| Freddie Mac 4.00% 204310 | 2,683 | 2,849 |
| Freddie Mac 4.00% 204310 | 1,939 | 2,039 |
| Freddie Mac 3.50% 204510 | 31,658 | 32,576 |
| Freddie Mac 4.00% 204510 | 31,480 | 33,305 |
| Freddie Mac 3.50% 204610 | 56,496 | 57,739 |
| Freddie Mac 3.50% 204610 | 43,199 | 44,130 |
| Freddie Mac 3.50% 204610 | 14,096 | 14,406 |
| Freddie Mac 4.00% 204610 | 54,358 | 57,038 |
| Freddie Mac 4.00% 204610 | 25,528 | 26,875 |
| Freddie Mac 4.00% 204610 | 18,250 | 19,239 |
| Freddie Mac 4.00% 204610 | 15,520 | 16,361 |
| Freddie Mac 4.00% 204610 | 13,298 | 13,963 |
| Freddie Mac 4.50% 204610 | 14,985 | 16,145 |
| Freddie Mac 4.50% 204610 | 6,009 | 6,472 |
| Freddie Mac 3.50% 20476,10 | 11,500 | 11,742 |
| Freddie Mac 3.50% 204710 | 1,940 | 1,990 |
| Freddie Mac, Series 2890, Class KT, 4.50% 201910 | 5,888 | 6,033 |
| Freddie Mac, Series K019, Class A2, multifamily 2.272% 202210 | 8,000 | 8,004 |
| Freddie Mac, Series K021, Class A2, multifamily 2.396% 202210 | 8,280 | 8,303 |
| Freddie Mac, Series K025, Class A2, multifamily 2.682% 202210 | 7,000 | 7,104 |
| Freddie Mac, Series 2289, Class NB, 9.00% 20227,10 | 5 | 6 |
| Freddie Mac, Series 2013-DN2, Class M1, 2.221% 20237,10 | 1,003 | 1,008 |
| Freddie Mac, Series K036, Class A1, multifamily 2.777% 202310 | 10,030 | 10,256 |
| Freddie Mac, Series K028, Class A2, multifamily 3.111% 202310 | 9,800 | 10,172 |
| Freddie Mac, Series K036, Class A2, multifamily 3.527% 20237,10 | 9,150 | 9,686 |
| Freddie Mac, Series 2013-DN1, Class M1, 4.171% 20237,10 | 1,345 | 1,368 |
| Freddie Mac, Series 2014-HQ2, Class M1, 2.221% 20247,10 | 1,424 | 1,430 |
| Freddie Mac, Series 2014-HQ2, Class M2, 2.971% 20247,10 | 5,815 | 5,960 |
| Freddie Mac, Series K043, Class A2, multifamily 3.062% 202410 | 26,000 | 26,641 |
| Freddie Mac, Series 2014-DN4, Class M2, 3.171% 20247,10 | 912 | 916 |
| Freddie Mac, Series 2015-HQ2, Class M2, 2.721% 20257,10 | 3,600 | 3,663 |
| Freddie Mac, Series K049, Class A2, multifamily 3.01% 202510 | 15,000 | 15,253 |
| Freddie Mac, Series 3257, Class PA, 5.50% 203610 | 3,949 | 4,435 |
| Freddie Mac, Series 3286, Class JN, 5.50% 203710 | 3,106 | 3,409 |
| Freddie Mac, Series 3318, Class JT, 5.50% 203710 | 1,769 | 1,942 |
| Government National Mortgage Assn. 10.00% 202110 | 113 | 121 |
| Government National Mortgage Assn. 10.00% 202510 | 86 | 91 |
| Government National Mortgage Assn. 4.50% 204110 | 1,135 | 1,221 |
| Government National Mortgage Assn. 4.50% 204510 | 6,025 | 6,467 |
| Government National Mortgage Assn. 4.50% 204610 | 2,303 | 2,473 |
| Bonds, notes & other debt instruments Mortgage-backed obligations (continued) |
Principal amount (000) |
Value (000) |
| Government National Mortgage Assn. 4.50% 204710 | $17,488 | $18,803 |
| Greenwich Capital Commercial Funding Corp., Series 2007-GG11, Class AM, 5.867% 20497,10 |
7,879 | 8,026 |
| GSR Mortgage Loan Trust, Series 2004-2F, Class VIIA1, 4.50% 201910 | 256 | 254 |
| IndyMac INDX Mortgage Loan Trust, Series 2006-AR5, Class 2A1, 3.033% 20367,10 | 4,906 | 4,261 |
| J.P. Morgan Chase Commercial Mortgage Securities Trust, Series 2006-LDP9, Class AM, 5.372% 204710 | 11,529 | 11,524 |
| J.P. Morgan Chase Commercial Mortgage Securities Corp., Series 2007-CB19, Class A1A, 5.734% 20497,10 | 9,327 | 9,367 |
| J.P. Morgan Chase Commercial Mortgage Securities Corp., Series 2007-CB19, Class A4, 5.734% 20497,10 | 7,382 | 7,400 |
| J.P. Morgan Chase Commercial Mortgage Securities Corp., Series 2007-C1, Class A4, 5.716% 205110 | 3,686 | 3,760 |
| J.P. Morgan Chase Commercial Mortgage Securities Corp., Series 2007-LD12, Class AM, 6.044% 20517,10 | 20,950 | 21,372 |
| L.A. Arena Funding, LLC, Series 1, Class A, 7.656% 20265,10 | 3,195 | 3,385 |
| LB-UBS Commercial Mortgage Trust, Series 2007-C2, Class A1A, 5.387% 204010 | 5,438 | 5,441 |
| LB-UBS Commercial Mortgage Trust, Series 2007-C2, Class A3, 5.43% 204010 | 1,635 | 1,635 |
| LB-UBS Commercial Mortgage Trust, Series 2007-C2, Class AM, 5.493% 20407,10 | 18,000 | 18,086 |
| LB-UBS Commercial Mortgage Trust, Series 2007-C6, Class AM, 6.114% 20407,10 | 10,035 | 10,258 |
| Merrill Lynch Mortgage Trust, Series 2007-C1, Class A4, 5.827% 20507,10 | 3,198 | 3,218 |
| ML-CFC Commercial Mortgage Trust, Series 2007-8, Class A3, 5.887% 20497,10 | 10,390 | 10,486 |
| Morgan Stanley Capital I Trust, Series 2014-CPT, Class A, 3.35% 20295,10 | 8,745 | 9,074 |
| Mortgage Repurchase Agreement Financing Trust, Series 2016-3, Class A1, 1.763% 20183,5,7,10 | 9,900 | 9,900 |
| National Australia Bank 1.25% 20185,10 | 5,000 | 4,986 |
| Station Place Securitization Trust, Series 2016-3, Class A, 1.871% 20483,5,7,10 | 10,500 | 10,500 |
| Structured Adjustable Rate Mortgage Loan Trust, Series 2006-4, Class 6A, 3.18% 20367,10 | 2,993 | 2,453 |
| Wachovia Bank Commercial Mortgage Trust, Series 2007-C31, Class AM, 5.591% 20477,10 | 19,050 | 19,125 |
| Wachovia Bank Commercial Mortgage Trust, Series 2007-C32, Class A3, 5.716% 20497,10 | 7,048 | 7,068 |
| Wachovia Bank Commercial Mortgage Trust, Series 2007-C33, Class AM, 5.965% 20517,10 | 8,500 | 8,606 |
| 1,822,790 | ||
| Asset-backed obligations 0.35% | ||
| Aesop Funding LLC, Series 2014-2A, Class A, 2.50% 20215,10 | 10,500 | 10,525 |
| Aesop Funding LLC, Series 2015-1, Class A, 2.50% 20215,10 | 10,000 | 9,927 |
| Aesop Funding LLC, Series 2015-2A, Class A, 2.63% 20215,10 | 5,680 | 5,652 |
| American Express Credit Account Master Trust, Series 2014-4, Class A, 1.43% 202010 | 7,155 | 7,164 |
| AmeriCredit Automobile Receivables Trust, Series 2015-1, Class A3, 1.26% 201910 | 3,721 | 3,717 |
| AmeriCredit Automobile Receivables Trust, Series 2014-4, Class A3, 1.27% 201910 | 2,908 | 2,908 |
| AmeriCredit Automobile Receivables Trust, Series 2015-2, Class C, 2.40% 202110 | 6,000 | 6,049 |
| Avant Loans Funding Trust, Series 2016-A, Class A, 4.11% 20195,10 | 1,325 | 1,327 |
| Avant Loans Funding Trust, Series 2015-A, Class A, 4.00% 20215,10 | 708 | 710 |
| Bank of the West Auto Trust, Series 2014-1, Class A3, 1.09% 20195,10 | 1,151 | 1,151 |
| Cabela’s Master Credit Card Trust, Series 2016-1, Class A1, 1.78% 202210 | 8,230 | 8,219 |
| Capital One Multi-asset Execution Trust, Series 2014-A5, Class A, 1.48% 202010 | 8,000 | 8,012 |
| CarMaxAuto Owner Trust, Series 2014-4, Class A3, 1.25% 201910 | 4,510 | 4,509 |
| Chase Issuance Trust, Series 2016-A7, Class A, 1.06% 201910 | 23,000 | 22,981 |
| Chase Issuance Trust, Series 2016-A6, Class A6, 1.10% 202010 | 41,310 | 41,231 |
| Chesapeake Funding LLC, Series 2014-1A, Class A, 1.186% 20265,7,10 | 2,146 | 2,139 |
| Citibank Credit Card Issuance Trust, Series 2008-A2, Class A2, 1.926% 20207,10 | 14,000 | 14,134 |
| Countryplace Manufactured Housing Contract, Series 2005-1, Class A4, AMBAC insured, 5.20% 20355,7,10 | 1,112 | 1,145 |
| CWHEQ Revolving Home Equity Loan Trust, Series 2006-I, Class 2A, FSA insured, 0.908% 20377,10 | 1,303 | 1,194 |
| CWHEQ Revolving Home Equity Loan Trust, Series 2007-B, Class A, FSA insured, 0.918% 20377,10 | 2,318 | 2,067 |
| Drive Auto Receivables Trust, Series 2015-BA, Class C, 2.76% 20215,10 | 7,970 | 8,012 |
| Drive Auto Receivables Trust, Series 2015-AA, Class C, 3.06% 20215,10 | 8,900 | 8,977 |
| Drive Auto Receivables Trust, Series 2015-DA, Class C, 3.38% 20215,10 | 7,225 | 7,338 |
| Drive Auto Receivables Trust, Series 2016-AA, Class C, 3.91% 20215,10 | 10,000 | 10,132 |
| Enterprise Fleet Financing LLC, Series 2014-1, Class A2, 0.87% 20195,10 | 53 | 53 |
| Fifth Third Auto Trust, Series 2014-3, Class A3, 0.96% 201910 | 1,828 | 1,827 |
| Ford Credit Auto Owner Trust, Series 2014-1A, 2.26% 20255,10 | 2,405 | 2,428 |
| Bonds, notes & other debt instruments Asset-backed obligations (continued) |
Principal amount (000) |
Value (000) |
| Ford Credit Auto Owner Trust, Series 2015-1, Class A, 2.12% 20265,10 | $6,300 | $6,324 |
| Ford Credit Auto Owner Trust, Series 2014-2A, 2.31% 20265,10 | 10,110 | 10,209 |
| Ford Credit Auto Owner Trust, Series 2016-2, Class A, 2.03% 20275,10 | 10,500 | 10,356 |
| Ford Credit Auto Owner Trust, Series 2016-1, Class A, 2.31% 20275,10 | 16,000 | 16,006 |
| Ford Credit Auto Owner Trust, Series 2015-2, Class A, 2.44% 20275,10 | 17,160 | 17,301 |
| Ford Credit Floorplan Master Owner Trust, Series 2015-2, Class A1, 1.98% 202210 | 7,780 | 7,770 |
| Hertz Fleet Lease Funding LP, Series 2014-1A, 1.163% 20285,7,10 | 797 | 797 |
| Hertz Vehicle Financing LLC, Rental Car Asset-backed Notes, Series 2013-1A, Class A2, 1.83% 20195,10 | 8,500 | 8,433 |
| Hertz Vehicle Financing LLC, Rental Car Asset-backed Notes, Series 2015-3A, Class A, 2.67% 20215,10 | 6,290 | 6,220 |
| Hertz Vehicle Financing LLC, Rental Car Asset-backed Notes, Series 2015-1, Class A, 2.73% 20215,10 | 7,518 | 7,510 |
| Hertz Vehicle Financing LLC, Rental Car Asset-backed Notes, Series 2015-1, Class A, 3.52% 20215,10 | 2,210 | 2,222 |
| Home Equity Mortgage Trust, Series 2006-6, Class 2A1, 0.971% 20377,10 | 12,777 | 1,292 |
| Honda Auto Receivables Owner Trust, Series 2014-3, Class A3, 0.88% 201810 | 2,523 | 2,521 |
| IndyMac Home Equity Mortgage Loan Asset-backed Trust, Series 2007-H1, Class A1, FSA insured, 0.931% 20377,10 |
1,326 | 1,210 |
| RAMP Trust, Series 2003-RZ4, Class A7, 5.29% 20337,10 | 67 | 69 |
| Santander Drive Auto Receivables Trust, Series 2014-4, Class B, 1.82% 201910 | 2,685 | 2,687 |
| Santander Drive Auto Receivables Trust, Series 2014-2, Class C, 2.33% 201910 | 5,000 | 5,022 |
| Santander Drive Auto Receivables Trust, Series 2015-2, Class C, 2.44% 202110 | 16,550 | 16,668 |
| Santander Drive Auto Receivables Trust, Series 2015-1, Class C, 2.57% 202110 | 5,340 | 5,384 |
| Santander Drive Auto Receivables Trust, Series 2016-2, Class C, 2.66% 202110 | 2,430 | 2,438 |
| Santander Drive Auto Receivables Trust, Series 2015-5, Class C, 2.74% 202110 | 6,915 | 6,972 |
| Social Professional Loan Program LLC, Series 2015-D, Class A2, 2.72% 20365,10 | 6,761 | 6,807 |
| TAL Advantage V LLC, Series 2013-2A, Class A, 3.55% 20385,10 | 11,651 | 11,315 |
| TAL Advantage V LLC, Series 2014-1A, Class A, 3.51% 20395,10 | 2,727 | 2,630 |
| Verizon Owner Trust, Series 2016-1A, Class A, 1.42% 20215,10 | 3,500 | 3,479 |
| Volkswagen Auto Loan Enhanced Trust, Series 2014-2, Class A3, 0.95% 201910 | 5,805 | 5,791 |
| World Omni Auto Receivables Trust, Series 2014-B, Class A3, 1.14% 202010 | 3,009 | 3,005 |
| 363,966 | ||
| Bonds & notes of governments & government agencies outside the U.S. 0.07% | ||
| CPPIB Capital Inc. 1.25% 20195 | 3,900 | 3,849 |
| Hungary 6.25% 2020 | 3,410 | 3,750 |
| Saudi Arabia (Kingdom of) 3.25% 20265 | 12,000 | 11,469 |
| Spain (Kingdom of) 4.00% 20185 | 31,765 | 32,464 |
| United Mexican States 3.60% 2025 | 6,000 | 5,844 |
| United Mexican States 4.125% 2026 | 6,900 | 6,931 |
| United Mexican States 5.55% 2045 | 3,500 | 3,602 |
| 67,909 | ||
| Federal agency bonds & notes 0.06% | ||
| CoBank, ACB 1.563% 20225,7 | 3,700 | 3,592 |
| Fannie Mae 6.25% 2029 | 32,000 | 42,677 |
| Federal Home Loan Bank 0.875% 2018 | 12,860 | 12,821 |
| 59,090 | ||
| Municipals 0.04% California 0.03% |
||
| Various Purpose G.O. Bonds, 6.20% 2019 | 24,675 | 27,015 |
| Bonds, notes & other debt instruments Municipals (continued) New Jersey 0.01% |
Principal amount (000) |
Value (000) |
| Econ. Dev. Auth., School Facs. Construction Rev. Ref. Bonds, Series 2015-YY, 4.447% 2020 |
$6,000 | $6,095 |
| Transportation Trust Fund Auth., Transportation System Rev. Ref. Bonds, Series 2013-B, 1.758% 2018 |
8,500 | 8,378 |
| 14,473 | ||
| 41,488 | ||
| Total bonds, notes & other debt instruments (cost: $22,134,468,000) | 22,450,310 | |
| Short-term securities 5.07% | ||
| Apple Inc. 0.64%–0.88% due 2/6/2017–5/18/20175 | 276,500 | 276,007 |
| CAFCO, LLC 1.22% due 2/23/20175 | 25,000 | 24,988 |
| Chariot Funding, LLC 0.90% due 3/17/20175 | 50,000 | 49,947 |
| Chevron Corp. 0.85%–0.88% due 5/8/2017–6/6/20175 | 200,000 | 199,554 |
| Ciesco LLC 1.23% due 2/23/20175 | 40,000 | 39,980 |
| Coca-Cola Co. 0.85%–0.98% due 5/9/2017–7/17/20175 | 178,935 | 178,388 |
| Danaher Corp. 0.76%–0.77% due 2/17/2017–3/3/2017 | 100,000 | 99,954 |
| Estée Lauder Companies Inc. 0.73%–0.78% due 2/6/2017–2/28/20175 | 72,800 | 72,770 |
| ExxonMobil Corp. 0.74% due 2/27/2017 | 69,800 | 69,768 |
| Fannie Mae 0.41%–0.51% due 2/1/2017–4/17/2017 | 240,000 | 239,871 |
| Federal Farm Credit Banks 0.44%–0.90% due 2/9/2017–12/13/2017 | 370,000 | 369,160 |
| Federal Home Loan Bank 0.37%–0.64% due 2/1/2017–7/21/2017 | 1,842,600 | 1,840,907 |
| Freddie Mac 0.44% due 2/2/2017 | 50,000 | 49,999 |
| GE Capital Treasury Services (U.S.) LLC 0.80% due 4/18/2017 | 50,000 | 49,918 |
| General Electric Co. 0.78% due 3/31/2017 | 50,000 | 49,943 |
| John Deere Canada ULC 0.70% due 2/17/20175 | 50,000 | 49,985 |
| Merck & Co. Inc. 0.55% due 2/23/20175 | 50,000 | 49,980 |
| Microsoft Corp. 0.74%–0.83% due 2/14/2017–3/1/20175 | 288,000 | 287,912 |
| National Rural Utilities Cooperative Finance Corp. 0.71%–0.75% due 2/17/2017–3/17/2017 | 70,000 | 69,950 |
| PepsiCo Inc. 0.68% due 2/13/20175 | 50,000 | 49,989 |
| Qualcomm Inc. 0.73%–0.80% due 3/8/2017–4/11/20175 | 110,100 | 109,978 |
| U.S. Treasury Bills 0.42%–0.62% due 2/9/2017–7/27/2017 | 888,200 | 887,732 |
| Walt Disney Co. 0.80% due 4/21/2017–5/9/20175 | 73,900 | 73,756 |
| Wells Fargo Bank, N.A. 1.23% due 7/18/2017 | 30,000 | 30,013 |
| Total short-term securities (cost: $5,220,186,000) | 5,220,449 | |
| Total investment securities 99.99% (cost: $84,315,303,000) | 103,010,632 | |
| Other assets less liabilities 0.01% | 9,905 | |
| Net assets 100.00% | $103,020,537 |
| Settlement date |
Counterparty | Contract amount | Unrealized depreciation at 1/31/2017 (000) | ||
| Receive (000) |
Deliver (000) | ||||
| Sales: | |||||
| Australian dollars | 2/23/2017 | HSBC Bank | $37,895 | A$52,300 | $(1,749) |
| Australian dollars | 3/13/2017 | JPMorgan Chase | $96,742 | A$130,000 | (1,756) |
| British pounds | 2/17/2017 | JPMorgan Chase | $133,796 | £109,000 | (3,362) |
| British pounds | 3/3/2017 | Citibank | $31,850 | £25,900 | (749) |
| British pounds | 3/13/2017 | HSBC Bank | $237,636 | £195,043 | (7,936) |
| British pounds | 3/13/2017 | Barclays Bank PLC | $237,560 | £195,043 | (8,011) |
| $(23,563) | |||||
| 1 | Security did not produce income during the last 12 months. |
| 2 | Represents an affiliated company as defined under the Investment Company Act of 1940. |
| 3 | Valued under fair value procedures adopted by authority of the board of trustees. The total value of all such securities, including those in “Miscellaneous,“ was $1,491,625,000, which represented 1.45% of the net assets of the fund. This amount includes $1,288,444,000 related to certain securities trading outside the U.S. whose values were adjusted as a result of significant market movements following the close of local trading. |
| 4 | Acquired through a private placement transaction exempt from registration under the Securities Act of 1933. May be subject to legal or contractual restrictions on resale. Further details on these holdings appear below. |
| 5 | Acquired in a transaction exempt from registration under Rule 144A or Section 4(2) of the Securities Act of 1933. May be resold in the U.S. in transactions exempt from registration, normally to qualified institutional buyers. The total value of all such securities was $6,656,071,000, which represented 6.46% of the net assets of the fund. |
| 6 | Purchased on a TBA basis. |
| 7 | Coupon rate may change periodically. |
| 8 | Payment in kind; the issuer has the option of paying additional securities in lieu of cash. |
| 9 | Loan participations and assignments; may be subject to legal or contractual restrictions on resale. The total value of all such loans was $472,426,000, which represented .46% of the net assets of the fund. |
| 10 | Principal payments may be made periodically. Therefore, the effective maturity date may be earlier than the stated maturity date. |
| 11 | A portion of this security was pledged as collateral. The total value of pledged collateral was $24,206,000, which represented .02% of the net assets of the fund. |
| 12 | Index-linked bond whose principal amount moves with a government price index. |
| Private placement securities | Acquisition date |
Cost (000) |
Value (000) |
Percent of net assets |
| CEVA Group PLC, Series A-1, 4.022% convertible preferred | 4/3/2013 | $29,938 | $10,478 | .01% |
| CEVA Group PLC | 5/2/2013 | 34,036 | 6,165 | .01 |
| CEVA Group PLC, Series A-2, 3.022% convertible preferred | 5/2/2013 | 13,172 | 3,067 | .00 |
| Total private placement securities | $ 77,146 | $ 19,710 | .02% |
| Key to abbreviations and symbols | |
| A$ = Australian dollars | |
| ADR = American Depositary Receipts | |
| Auth. = Authority | |
| £ = British pounds | |
| CAD = Canadian dollars | |
| Dev. = Development | |
| Econ. = Economic | |
| Facs. = Facilities | |
| FDR = Fiduciary Depositary Receipts | |
| G.O. = General Obligation | |
| LOC = Letter of Credit | |
| Ref. = Refunding | |
| Rev. = Revenue | |
| TBA = To-be-announced |
| MFGEFPX-006-0317O-S54131 | The Income Fund of America — Page 38 of 38 |
| Summary investment portfolio January 31, 2017 | unaudited |
| Common stocks 71.28% | Shares | Value (000) | ||||||
| Industrials 10.61% | ||||||||
| General Electric Co. | 72,451,053 | $ | 2,151,796 | |||||
| Lockheed Martin Corp. | 7,624,400 | 1,916,240 | ||||||
| Boeing Co. | 7,175,000 | 1,172,539 | ||||||
| BAE Systems PLC | 130,916,776 | 958,515 | ||||||
| Norfolk Southern Corp. | 5,000,000 | 587,300 | ||||||
| Waste Management, Inc. | 7,886,128 | 548,086 | ||||||
| Ryanair Holdings PLC (ADR)1 | 6,452,401 | 539,808 | ||||||
| Caterpillar Inc. | 5,240,000 | 501,258 | ||||||
| Other securities | 2,556,030 | |||||||
| 10,931,572 | ||||||||
| Information technology 9.42% | ||||||||
| Microsoft Corp. | 51,193,209 | 3,309,641 | ||||||
| Intel Corp. | 54,217,100 | 1,996,274 | ||||||
| Taiwan Semiconductor Manufacturing Co., Ltd.2 | 181,623,000 | 1,080,198 | ||||||
| Taiwan Semiconductor Manufacturing Co., Ltd. (ADR) | 3,836,470 | 118,586 | ||||||
| Analog Devices, Inc. | 12,633,724 | 946,771 | ||||||
| Texas Instruments Inc. | 11,573,000 | 874,224 | ||||||
| Other securities | 1,383,732 | |||||||
| 9,709,426 | ||||||||
| Consumer staples 7.92% | ||||||||
| Procter & Gamble Co. | 20,176,700 | 1,767,479 | ||||||
| Coca-Cola Co. | 25,191,000 | 1,047,190 | ||||||
| Altria Group, Inc. | 14,436,900 | 1,027,618 | ||||||
| Reynolds American Inc. | 16,693,668 | 1,003,790 | ||||||
| Philip Morris International Inc. | 9,303,607 | 894,356 | ||||||
| British American Tobacco PLC | 13,117,000 | 808,476 | ||||||
| Other securities | 1,610,292 | |||||||
| 8,159,201 | ||||||||
| Financials 7.14% | ||||||||
| JPMorgan Chase & Co. | 23,391,165 | 1,979,594 | ||||||
| Wells Fargo & Co. | 26,969,805 | 1,519,209 | ||||||
| CME Group Inc., Class A | 10,140,400 | 1,227,800 | ||||||
| National Australia Bank Ltd. | 21,460,000 | 493,629 | ||||||
| Other securities | 2,130,994 | |||||||
| 7,351,226 | ||||||||
| Energy 6.87% | ||||||||
| Spectra Energy Corp | 32,425,000 | 1,350,501 | ||||||
| Royal Dutch Shell PLC, Class B (ADR) | 11,698,000 | 672,284 | ||||||
| Royal Dutch Shell PLC, Class B | 22,202,147 | 624,661 | ||||||
| Royal Dutch Shell PLC, Class A | 1,232,485 | 33,296 | ||||||
| Royal Dutch Shell PLC, Class A (ADR) | 93,410 | 5,081 | ||||||
| Chevron Corp. | 11,623,000 | 1,294,221 | ||||||
| BP PLC | 179,819,900 | 1,069,650 | ||||||
| The Income Fund of America | 7 |
| Common stocks (continued) | Shares | Value (000) | ||||||
| Energy (continued) | ||||||||
| Schlumberger Ltd. | 5,980,500 | $ | 500,628 | |||||
| Other securities | 1,529,666 | |||||||
| 7,079,988 | ||||||||
| Health care 6.08% | ||||||||
| Merck & Co., Inc. | 46,370,159 | 2,874,486 | ||||||
| GlaxoSmithKline PLC | 63,811,000 | 1,226,590 | ||||||
| AstraZeneca PLC | 13,399,159 | 706,947 | ||||||
| Bristol-Myers Squibb Co. | 13,763,500 | 676,614 | ||||||
| Pfizer Inc. | 17,831,257 | 565,786 | ||||||
| Other securities | 212,212 | |||||||
| 6,262,635 | ||||||||
| Consumer discretionary 5.17% | ||||||||
| McDonald’s Corp. | 13,798,965 | 1,691,339 | ||||||
| General Motors Co. | 16,877,712 | 617,893 | ||||||
| Target Corp. | 9,450,000 | 609,336 | ||||||
| Home Depot, Inc. | 3,710,000 | 510,422 | ||||||
| Other securities | 1,894,220 | |||||||
| 5,323,210 | ||||||||
| Materials 4.58% | ||||||||
| E.I. du Pont de Nemours and Co. | 14,953,953 | 1,129,024 | ||||||
| Dow Chemical Co. | 11,804,900 | 703,926 | ||||||
| WestRock Co.3 | 13,184,832 | 703,543 | ||||||
| LyondellBasell Industries NV | 6,880,000 | 641,698 | ||||||
| Other securities | 1,537,431 | |||||||
| 4,715,622 | ||||||||
| Real estate 3.73% | ||||||||
| Crown Castle International Corp. REIT | 10,836,000 | 951,726 | ||||||
| Digital Realty Trust, Inc. REIT | 7,885,000 | 848,663 | ||||||
| Iron Mountain Inc. REIT3 | 13,811,680 | 494,458 | ||||||
| Other securities | 1,545,710 | |||||||
| 3,840,557 | ||||||||
| Telecommunication services 3.34% | ||||||||
| Verizon Communications Inc. | 34,285,921 | 1,680,353 | ||||||
| Telstra Corp. Ltd. | 134,400,000 | 509,645 | ||||||
| Other securities | 1,253,080 | |||||||
| 3,443,078 | ||||||||
| Utilities 2.56% | ||||||||
| Power Assets Holdings Ltd. | 82,093,500 | 788,781 | ||||||
| Dominion Resources, Inc. | 7,335,000 | 559,514 | ||||||
| Other securities | 1,287,301 | |||||||
| 2,635,596 | ||||||||
| Miscellaneous 3.86% | ||||||||
| Other common stocks in initial period of acquisition | 3,977,453 | |||||||
| Total common stocks (cost: $54,918,262,000) | 73,429,564 | |||||||
| 8 | The Income Fund of America |
| Preferred securities 0.41% | Shares | Value (000) | ||||||
| Financials 0.33% | ||||||||
| Wells Fargo & Co., Class A, Series Q, 5.85% depositary shares preferred noncumulative | 1,263,198 | $ | 32,805 | |||||
| Other securities | 308,420 | |||||||
| 341,225 | ||||||||
| Real estate 0.08% | ||||||||
| Other securities | 85,954 | |||||||
| Total preferred securities (cost: $408,715,000) | 427,179 | |||||||
| Rights & warrants 0.00% | ||||||||
| Utilities 0.00% | ||||||||
| Other securities | 607 | |||||||
| Total rights & warrants (cost: $2,948,000) | 607 | |||||||
| Convertible stocks 0.67% | ||||||||
| Other 0.51% | ||||||||
| Other securities | 523,662 | |||||||
| Miscellaneous 0.16% | ||||||||
| Other convertible stocks in initial period of acquisition | 166,524 | |||||||
| Total convertible stocks (cost: $855,602,000) | 690,186 | |||||||
| Convertible bonds 0.77% | Principal amount (000) | |||||||
| Other 0.75% | ||||||||
| Other securities | 775,173 | |||||||
| Miscellaneous 0.02% | ||||||||
| Other convertible bonds in initial period of acquisition | 17,164 | |||||||
| Total convertible bonds (cost: $775,122,000) | 792,337 | |||||||
| Bonds, notes & other debt instruments 21.79% | ||||||||
| Corporate bonds & notes 14.31% | ||||||||
| Energy 2.24% | ||||||||
| Chevron Corp. 1.561% 2019 | $ | 1,850 | 1,847 | |||||
| Royal Dutch Shell PLC 1.75%–3.75% 2021–2046 | 12,860 | 12,351 | ||||||
| Shell International Finance BV 1.88%–2.88% 2021–2026 | 24,840 | 24,264 | ||||||
| Spectra Energy Partners, LP 3.38%–4.75% 2024–2045 | 5,560 | 5,692 | ||||||
| Other securities | 2,261,383 | |||||||
| 2,305,537 | ||||||||
| Consumer discretionary 2.03% | ||||||||
| McDonald’s Corp. 3.70%–4.88% 2026–2045 | 3,520 | 3,686 | ||||||
| Other securities | 2,086,370 | |||||||
| 2,090,056 | ||||||||
| The Income Fund of America | 9 |
| Bonds, notes & other debt instruments (continued) | Principal amount (000) | Value (000) | ||||||
| Corporate bonds & notes (continued) | ||||||||
| Health care 1.93% | ||||||||
| Merck & Co., Inc. 1.10% 2018 | $ | 6,710 | $ | 6,702 | ||||
| Other securities | 1,985,498 | |||||||
| 1,992,200 | ||||||||
| Financials 1.90% | ||||||||
| JPMorgan Chase & Co. 1.35%–7.90% 2017–2049 | 194,443 | 201,119 | ||||||
| Wells Fargo & Co. 2.10%–7.98% 2020–2049 | 172,216 | 179,541 | ||||||
| Other securities | 1,578,902 | |||||||
| 1,959,562 | ||||||||
| Telecommunication services 1.48% | ||||||||
| Verizon Communications Inc. 1.75%–6.00% 2021–2048 | 211,275 | 198,121 | ||||||
| Other securities | 1,327,111 | |||||||
| 1,525,232 | ||||||||
| Industrials 1.09% | ||||||||
| General Electric Capital Corp. 2.34%–6.00% 2019–2020 | 15,772 | 16,083 | ||||||
| General Electric Co. 2.70%–5.00% 2022–2049 | 207,845 | 215,263 | ||||||
| Lockheed Martin Corp. 1.85%–4.70% 2018–2046 | 18,080 | 18,945 | ||||||
| Other securities | 873,629 | |||||||
| 1,123,920 | ||||||||
| Information technology 0.82% | ||||||||
| Microsoft Corp. 1.55%–4.25% 2021–2047 | 107,575 | 106,654 | ||||||
| Other securities | 737,104 | |||||||
| 843,758 | ||||||||
| Consumer staples 0.40% | ||||||||
| Altria Group, Inc. 2.63%–9.95% 2019–2046 | 84,252 | 103,334 | ||||||
| Reynolds American Inc. 2.30%–6.15% 2018–2045 | 52,430 | 56,329 | ||||||
| Other securities | 249,999 | |||||||
| 409,662 | ||||||||
| Other corporate bonds & notes 2.42% | ||||||||
| Other securities | 2,495,999 | |||||||
| Total corporate bonds & notes | 14,745,926 | |||||||
| U.S. Treasury bonds & notes 5.19% | ||||||||
| U.S. Treasury 4.80% | ||||||||
| U.S. Treasury 2.875% 2045 | 929,150 | 895,468 | ||||||
| U.S. Treasury 0.63%–6.25% 2018–20464 | 4,110,929 | 4,047,773 | ||||||
| 4,943,241 | ||||||||
| U.S. Treasury inflation-protected securities 0.39% | ||||||||
| U.S. Treasury Inflation-Protected Securities 0.13%–1.38% 2021–20465 | 391,986 | 405,900 | ||||||
| Total U.S. Treasury bonds & notes | 5,349,141 | |||||||
| Mortgage-backed obligations 1.77% | ||||||||
| Fannie Mae 2.30%–9.64% 2018–20476,7,8 | 885,354 | 917,661 | ||||||
| Other securities | 905,129 | |||||||
| 1,822,790 | ||||||||
| 10 | The Income Fund of America |
| Principal amount (000) | Value (000) | |||||||
| Federal agency bonds & notes 0.06% | ||||||||
| Fannie Mae 6.25% 2029 | $ | 32,000 | $ | 42,677 | ||||
| Federal Home Loan Bank 0.875% 2018 | 12,860 | 12,821 | ||||||
| Other securities | 3,592 | |||||||
| 59,090 | ||||||||
| Other bonds & notes 0.46% | ||||||||
| Other securities | 473,363 | |||||||
| Total bonds, notes & other debt instruments (cost: $22,134,468,000) | 22,450,310 | |||||||
| Short-term securities 5.07% | ||||||||
| Chariot Funding, LLC 0.90% due 3/17/20179 | 50,000 | 49,947 | ||||||
| Chevron Corp. 0.85%–0.88% due 5/8/2017–6/6/20179 | 200,000 | 199,554 | ||||||
| Coca-Cola Co. 0.85%–0.98% due 5/9/2017–7/17/20179 | 178,935 | 178,388 | ||||||
| Fannie Mae 0.41%–0.51% due 2/1/2017–4/17/2017 | 240,000 | 239,871 | ||||||
| Federal Home Loan Bank 0.37%–0.64% due 2/1/2017–7/21/2017 | 1,842,600 | 1,840,907 | ||||||
| GE Capital Treasury Services (U.S.) LLC 0.80% due 4/18/2017 | 50,000 | 49,918 | ||||||
| General Electric Co. 0.78% due 3/31/2017 | 50,000 | 49,943 | ||||||
| Merck & Co. Inc. 0.55% due 2/23/20179 | 50,000 | 49,980 | ||||||
| Microsoft Corp. 0.74%–0.83% due 2/14/2017–3/1/20179 | 288,000 | 287,912 | ||||||
| U.S. Treasury Bills 0.42%–0.62% due 2/9/2017–7/27/2017 | 888,200 | 887,732 | ||||||
| Wells Fargo Bank, N.A. 1.23% due 7/18/2017 | 30,000 | 30,013 | ||||||
| Other securities | 1,356,284 | |||||||
| Total short-term securities (cost: $5,220,186,000) | 5,220,449 | |||||||
| Total investment securities 99.99% (cost: $84,315,303,000) | 103,010,632 | |||||||
| Other assets less liabilities 0.01% | 9,905 | |||||||
| Net assets 100.00% | $ | 103,020,537 | ||||||
This summary investment portfolio is designed to streamline the report and help investors better focus on the fund’s principal holdings. See the inside back cover for details on how to obtain a complete schedule of portfolio holdings.
As permitted by U.S. Securities and Exchange Commission regulations, “Miscellaneous” securities include holdings in their first year of acquisition that have not previously been publicly disclosed.
“Other securities” includes all issues that are not disclosed separately in the summary investment portfolio.
| The Income Fund of America | 11 |
Forward currency contracts
The fund has entered into forward currency contracts as shown in the following table. The average month-end notional amount of open forward currency contracts while held was $937,282,000.
| Contract amount | Unrealized depreciation | ||||||||||||
| Receive | Deliver | at 1/31/2017 | |||||||||||
| Settlement date | Counterparty | (000) | (000) | (000) | |||||||||
| Sales: | |||||||||||||
| Australian dollars | 2/23/2017 | HSBC Bank | $37,895 | A$52,300 | $ | (1,749 | ) | ||||||
| Australian dollars | 3/13/2017 | JPMorgan Chase | $96,742 | A$130,000 | (1,756 | ) | |||||||
| British pounds | 2/17/2017 | JPMorgan Chase | $133,796 | £109,000 | (3,362 | ) | |||||||
| British pounds | 3/3/2017 | Citibank | $31,850 | £25,900 | (749 | ) | |||||||
| British pounds | 3/13/2017 | HSBC Bank | $237,636 | £195,043 | (7,936 | ) | |||||||
| British pounds | 3/13/2017 | Barclays Bank PLC | $237,560 | £195,043 | (8,011 | ) | |||||||
| $ | (23,563 | ) | |||||||||||
Investments in affiliates
A company is an affiliate of the fund under the Investment Company Act of 1940 if the fund’s holdings in that company represent 5% or more of the outstanding voting shares. The value of the fund’s affiliated-company holdings is either shown in the summary investment portfolio or included in the value of “Other securities” under the respective industry sectors. Further details on such holdings and related transactions during the six months ended January 31, 2017, appear below.
| Beginning shares or principal amount | Additions | Reductions | Ending shares or principal amount | Dividend or interest income (000) | Value of affiliates at 1/31/2017 (000) | |||||||||||||||||||
| WestRock Co. | 7,394,832 | 5,790,000 | — | 13,184,832 | $ | 6,769 | $ | 703,543 | ||||||||||||||||
| Iron Mountain Inc. REIT | 13,724,780 | 86,900 | — | 13,811,680 | 14,205 | 494,458 | ||||||||||||||||||
| Iron Mountain Inc. 6.00% 20209 | $ | 31,925,000 | — | $ | 1,000,000 | $ | 30,925,000 | 958 | 32,471 | |||||||||||||||
| Iron Mountain Inc. 5.75% 2024 | $ | 4,325,000 | — | — | $ | 4,325,000 | 133 | 4,412 | ||||||||||||||||
| Iron Mountain Inc. 6.00% 2023 | $ | 950,000 | — | — | $ | 950,000 | 28 | 1,012 | ||||||||||||||||
| Hubbell Inc. | 3,430,000 | — | — | 3,430,000 | 4,562 | 418,734 | ||||||||||||||||||
| Boral Ltd. | — | 72,364,400 | — | 72,364,400 | — | 319,408 | ||||||||||||||||||
| OUTFRONT Media Inc. REIT | 9,064,824 | — | — | 9,064,824 | 6,164 | 248,648 | ||||||||||||||||||
| CBS Outdoor Americas Inc. 5.25% 2022 | $ | 29,500,000 | — | $ | 750,000 | $ | 28,750,000 | 774 | 29,864 | |||||||||||||||
| CBS Outdoor Americas Inc. 5.625% 2024 | $ | 3,396,000 | — | — | $ | 3,396,000 | 88 | 3,557 | ||||||||||||||||
| Nokian Renkaat Oyj | 4,200,161 | 3,040,000 | — | 7,240,161 | — | 271,363 | ||||||||||||||||||
| TalkTalk Telecom Group PLC | 58,421,891 | — | — | 58,421,891 | 3,847 | 115,019 | ||||||||||||||||||
| R.R. Donnelley & Sons Co. | 13,345,400 | 1,005,221 | 10,456,694 | 3,893,927 | 3,888 | 66,781 | ||||||||||||||||||
| R.R. Donnelley & Sons Co. 7.875% 2021 | $ | 23,445,000 | — | — | $ | 23,445,000 | 821 | 25,262 | ||||||||||||||||
| 12 | The Income Fund of America |
| Beginning shares or principal amount | Additions | Reductions | Ending shares or principal amount | Dividend or interest income (000) | Value of affiliates at 1/31/2017 (000) | |||||||||||||||||||
| R.R. Donnelley & Sons Co. 6.50% 2023 | $ | 14,280,000 | — | — | $ | 14,280,000 | $ | 499 | $ | 14,032 | ||||||||||||||
| R.R. Donnelley & Sons Co. 7.625% 2020 | $ | 3,700,000 | — | — | $ | 3,700,000 | 133 | 3,941 | ||||||||||||||||
| R.R. Donnelley & Sons Co. 7.00% 2022 | $ | 19,500,000 | — | $ | 18,023,000 | $ | 1,477,000 | 260 | 1,473 | |||||||||||||||
| R.R. Donnelley & Sons Co. 7.25% 2018 | $ | 2,000,000 | — | $ | 2,000,000 | — | 20 | — | ||||||||||||||||
| R.R. Donnelley & Sons Co. 8.25% 2019 | $ | 2,475,000 | — | $ | 2,475,000 | — | 30 | — | ||||||||||||||||
| Corporate Risk Holdings LLC 9.50% 20199 | $ | 45,000,000 | — | — | $ | 45,000,000 | 2,143 | 47,250 | ||||||||||||||||
| Corporate Risk Holdings I, Inc.1,2 | 2,205,215 | — | — | 2,205,215 | — | 25,140 | ||||||||||||||||||
| Corporate Risk Holdings LLC 13.50% 20202,9,10 | $ | 14,211,162 | $ | 959,253 | — | $ | 15,170,415 | 1,100 | 16,739 | |||||||||||||||
| Corporate Risk Holdings Corp.1,2 | 11,149 | — | — | 11,149 | — | — | ||||||||||||||||||
| Redwood Trust, Inc. | 5,444,717 | — | — | 5,444,717 | 3,049 | 84,393 | ||||||||||||||||||
| Rotech Healthcare Inc., Term Loan, 13.00% 20202,6,7,10,11 | $ | 23,162,785 | $ | 1,313,291 | — | $ | 24,476,076 | 1,481 | 24,281 | |||||||||||||||
| Rotech Healthcare Inc., Term Loan A, 5.50% 20182,6,7,11 | $ | 11,767,250 | — | $ | 60,500 | $ | 11,706,750 | 330 | 11,648 | |||||||||||||||
| Rotech Healthcare Inc., Term Loan B, 10.00% 20192,6,7,11 | $ | 9,200,000 | — | — | $ | 9,200,000 | 470 | 9,154 | ||||||||||||||||
| Rotech Healthcare Inc.1,2 | 543,172 | — | — | 543,172 | — | 4,378 | ||||||||||||||||||
| Douglas Dynamics, Inc. | 1,444,000 | — | — | 1,444,000 | 679 | 48,807 | ||||||||||||||||||
| CEVA Group PLC, Series A-1, 4.022% convertible preferred1,2,7,12 | 29,937 | — | — | 29,937 | — | 10,478 | ||||||||||||||||||
| CEVA Group PLC1,2,12 | 35,229 | — | — | 35,229 | — | 6,165 | ||||||||||||||||||
| CEVA Logistics U.S. Holdings Inc., Term Loan B, 6.539% 20216,7,11 | $ | 6,924,360 | — | $ | 3,350,542 | $ | 3,573,818 | 132 | 3,158 | |||||||||||||||
| CEVA Group PLC, Series A-2, 3.022% convertible preferred1,2,7,12 | 13,633 | — | — | 13,633 | — | 3,067 | ||||||||||||||||||
| CEVA Logistics Holdings BV, Term Loan, 6.539% 20216,7,11 | $ | 5,020,161 | — | $ | 2,429,143 | $ | 2,591,018 | 96 | 2,290 | |||||||||||||||
| CEVA Group PLC, Apollo Global Securities LLC LOC, 5.602% 20216,7,11 | $ | 4,870,074 | — | $ | 2,343,596 | $ | 2,526,478 | 87 | 2,233 | |||||||||||||||
| CEVA Group PLC 7.00% 20219 | $ | 2,250,000 | — | — | $ | 2,250,000 | 80 | 1,958 | ||||||||||||||||
| CEVA Group PLC 9.00% 20219 | $ | 1,050,000 | — | — | $ | 1,050,000 | 48 | 709 | ||||||||||||||||
| The Income Fund of America | 13 |
Investments in affiliates (continued)
| Beginning shares or principal amount | Additions | Reductions | Ending shares or principal amount | Dividend or interest income (000) | Value of affiliates at 1/31/2017 (000) | |||||||||||||||||||
| CEVA Logistics Canada, ULC, Term Loan, 6.539% 20216,7,11 | $ | 865,544 | — | $ | 418,817 | $ | 446,727 | $ | 16 | $ | 395 | |||||||||||||
| NII Holdings, Inc.1 | 7,694,703 | — | 2,500,614 | 5,194,089 | — | 14,673 | ||||||||||||||||||
| $ | 52,890 | $ | 3,070,894 | |||||||||||||||||||||
The following footnotes apply to either the individual securities noted or one or more of the securities aggregated and listed as a single line item.
| 1 | Security did not produce income during the last 12 months. |
| 2 | Valued under fair value procedures adopted by authority of the board of trustees. The total value of all such securities, including those in “Miscellaneous” and “Other securities,” was $1,491,625,000, which represented 1.45% of the net assets of the fund. This amount includes $1,288,444,000 related to certain securities trading outside the U.S. whose values were adjusted as a result of significant market movements following the close of local trading. |
| 3 | Represents an affiliated company as defined under the Investment Company Act of 1940. |
| 4 | A portion of this security was pledged as collateral. The total value of pledged collateral was $24,206,000, which represented .02% of the net assets of the fund. |
| 5 | Index-linked bond whose principal amount moves with a government price index. |
| 6 | Principal payments may be made periodically. Therefore, the effective maturity date may be earlier than the stated maturity date. |
| 7 | Coupon rate may change periodically. |
| 8 | Purchased on a TBA basis. |
| 9 | Acquired in a transaction exempt from registration under Rule 144A or Section 4(2) of the Securities Act of 1933. May be resold in the U.S. in transactions exempt from registration, normally to qualified institutional buyers. The total value of all such securities, including those in “Other securities,” was $6,656,071,000, which represented 6.46% of the net assets of the fund. |
| 10 | Payment in kind; the issuer has the option of paying additional securities in lieu of cash. |
| 11 | Loan participations and assignments; may be subject to legal or contractual restrictions on resale. The total value of all such loans, including those in “Other securities,” was $472,426,000, which represented .46% of the net assets of the fund. |
| 12 | Acquired through a private placement transaction exempt from registration under the Securities Act of 1933. May be subject to legal or contractual restrictions on resale. Further details on these holdings appear below. |
| Private placement securities | Acquisition date | Cost (000) | Value (000) | Percent of net assets | ||||||||||
| CEVA Group PLC, Series A-1, 4.022% convertible preferred | 4/3/2013 | $ | 29,938 | $ | 10,478 | .01 | % | |||||||
| CEVA Group PLC | 5/2/2013 | 34,036 | 6,165 | .01 | ||||||||||
| CEVA Group PLC, Series A-2, 3.022% convertible preferred | 5/2/2013 | 13,172 | 3,067 | .00 | ||||||||||
| Total private placement securities | $ | 77,146 | $ | 19,710 | .02 | % | ||||||||
Key to abbreviations and symbols
A$ = Australian dollars
ADR = American Depositary Receipts
£ = British pounds
LOC = Letter of Credit
TBA = To-be-announced
See Notes to Financial Statements
| 14 | The Income Fund of America |
Financial statements
| Statement of assets and liabilities | unaudited |
| at January 31, 2017 | (dollars in thousands) |
| Assets: | ||||||||
| Investment securities, at value: | ||||||||
| Unaffiliated issuers (cost: $81,649,903) | $ | 99,939,738 | ||||||
| Affiliated issuers (cost: $2,665,400) | 3,070,894 | $ | 103,010,632 | |||||
| Cash | 103,852 | |||||||
| Cash denominated in currencies other than U.S. dollars (cost: $3,263) | 3,263 | |||||||
| Receivables for: | ||||||||
| Sales of investments | 442,608 | |||||||
| Sales of fund’s shares | 145,045 | |||||||
| Dividends and interest | 354,065 | |||||||
| Other | 3,238 | 944,956 | ||||||
| 104,062,703 | ||||||||
| Liabilities: | ||||||||
| Unrealized depreciation on open forward currency contracts | 23,563 | |||||||
| Payables for: | ||||||||
| Purchases of investments | 827,681 | |||||||
| Repurchases of fund’s shares | 132,572 | |||||||
| Closed forward currency contracts | 1,169 | |||||||
| Investment advisory services | 15,680 | |||||||
| Services provided by related parties | 31,513 | |||||||
| Trustees’ deferred compensation | 4,295 | |||||||
| Other | 5,693 | 1,018,603 | ||||||
| Net assets at January 31, 2017 | $ | 103,020,537 | ||||||
| Net assets consist of: | ||||||||
| Capital paid in on shares of beneficial interest | $ | 83,723,124 | ||||||
| Undistributed net investment income | 372,615 | |||||||
| Undistributed net realized gain | 253,378 | |||||||
| Net unrealized appreciation | 18,671,420 | |||||||
| Net assets at January 31, 2017 | $ | 103,020,537 | ||||||
See Notes to Financial Statements
| The Income Fund of America | 15 |
(dollars and shares in thousands, except per-share amounts)
Shares of beneficial interest issued and outstanding (no stated
par value) —
unlimited shares authorized (4,698,181 total shares outstanding)
| Shares | Net asset value | |||||||||||
| Net assets | outstanding | per share | ||||||||||
| Class A | $ | 74,710,174 | 3,403,556 | $ | 21.95 | |||||||
| Class B | 35,747 | 1,635 | 21.86 | |||||||||
| Class C | 5,839,689 | 269,393 | 21.68 | |||||||||
| Class F-1 | 4,588,532 | 209,553 | 21.90 | |||||||||
| Class F-2 | 6,734,950 | 307,034 | 21.94 | |||||||||
| Class F-3 | 107 | 5 | 21.95 | |||||||||
| Class 529-A | 1,536,465 | 70,135 | 21.91 | |||||||||
| Class 529-B | 2,199 | 100 | 21.93 | |||||||||
| Class 529-C | 454,029 | 20,813 | 21.82 | |||||||||
| Class 529-E | 66,284 | 3,035 | 21.84 | |||||||||
| Class 529-F-1 | 63,655 | 2,906 | 21.91 | |||||||||
| Class R-1 | 127,530 | 5,847 | 21.81 | |||||||||
| Class R-2 | 555,153 | 25,574 | 21.71 | |||||||||
| Class R-2E | 13,491 | 616 | 21.90 | |||||||||
| Class R-3 | 1,189,165 | 54,389 | 21.86 | |||||||||
| Class R-4 | 1,215,409 | 55,467 | 21.91 | |||||||||
| Class R-5E | 36 | 2 | 21.94 | |||||||||
| Class R-5 | 556,998 | 25,375 | 21.95 | |||||||||
| Class R-6 | 5,330,924 | 242,746 | 21.96 | |||||||||
See Notes to Financial Statements
| 16 | The Income Fund of America |
Statement of operations |
unaudited |
| for the six months ended January 31, 2017 | (dollars in thousands) |
| Investment income: | ||||||||
| Income: | ||||||||
| Dividends (net of non-U.S. taxes of $5,817; also includes $43,163 from affiliates) | $ | 1,203,493 | ||||||
| Interest (includes $9,727 from affiliates) | 533,481 | $ | 1,736,974 | |||||
| Fees and expenses*: | ||||||||
| Investment advisory services | 107,196 | |||||||
| Distribution services | 140,371 | |||||||
| Transfer agent services | 38,686 | |||||||
| Administrative services | 10,504 | |||||||
| Reports to shareholders | 1,768 | |||||||
| Registration statement and prospectus | 1,289 | |||||||
| Trustees’ compensation | 327 | |||||||
| Auditing and legal | 53 | |||||||
| Custodian | 1,520 | |||||||
| Other | 829 | 302,543 | ||||||
| Net investment income | 1,434,431 | |||||||
| Net realized gain and unrealized appreciation: | ||||||||
| Net realized gain (loss) on: | ||||||||
| Investments (includes $76,388 net loss from affiliates) | 287,781 | |||||||
| Forward currency contracts | 67,154 | |||||||
| Currency transactions | (4,565 | ) | 350,370 | |||||
| Net unrealized appreciation (depreciation) on: | ||||||||
| Investments (net of non-U.S. taxes of $118) | 962,447 | |||||||
| Forward currency contracts | (16,029 | ) | ||||||
| Currency translations | 1,480 | 947,898 | ||||||
| Net realized gain and unrealized appreciation | 1,298,268 | |||||||
| Net increase in net assets resulting from operations | $ | 2,732,699 |
| *Additional information related to class-specific fees and expenses is included in the Notes to Financial Statements. |
See Notes to Financial Statements
| The Income Fund of America | 17 |
Statements of changes in net assets
(dollars in thousands)
| Six months ended | Year ended | |||||||
| January 31, | July 31, | |||||||
| 2017* | 2016 | |||||||
| Operations: | ||||||||
| Net investment income | $ | 1,434,431 | $ | 2,999,936 | ||||
| Net realized gain (loss) | 350,370 | (78,232 | ) | |||||
| Net unrealized appreciation | 947,898 | 3,738,304 | ||||||
| Net increase in net assets resulting from operations | 2,732,699 | 6,660,008 | ||||||
| Dividends and distributions paid to shareholders: | ||||||||
| Dividends from net investment income | (1,569,894 | ) | (2,980,153 | ) | ||||
| Distributions from net realized gain on investments | — | (1,680,493 | ) | |||||
| Total dividends and distributions paid to shareholders | (1,569,894 | ) | (4,660,646 | ) | ||||
| Net capital share transactions | 247,709 | 2,618,650 | ||||||
| Total increase in net assets | 1,410,514 | 4,618,012 | ||||||
| Net assets: | ||||||||
| Beginning of period | 101,610,023 | 96,992,011 | ||||||
| End of period (including undistributed net investment income: $372,615 and $508,078, respectively) | $ | 103,020,537 | $ | 101,610,023 | ||||
*Unaudited.
See Notes to Financial Statements
| 18 | The Income Fund of America |
| Notes to financial statements | unaudited |
1. Organization
The Income Fund of America (the “fund”) is registered under the Investment Company Act of 1940 as an open-end, diversified management investment company. The fund seeks current income while secondarily striving for capital growth.
The fund has 19 share classes consisting of six retail share classes (Classes A, B and C, as well as three F share classes, F-1, F-2 and F-3), five 529 college savings plan share classes (Classes 529-A, 529-B, 529-C, 529-E and 529-F-1) and eight retirement plan share classes (Classes R-1, R-2, R-2E, R-3, R-4, R-5E, R-5 and R-6). The 529 college savings plan share classes can be used to save for college education. The retirement plan share classes are generally offered only through eligible employer-sponsored retirement plans. The fund’s share classes are described further in the following table:
| Share class | Initial sales charge | Contingent deferred sales charge upon redemption |
Conversion feature | |||
| Classes A and 529-A | Up to 5.75% | None (except 1% for certain redemptions within one year of purchase without an initial sales charge) | None | |||
| Classes B and 529-B* | None | Declines from 5% to 0% for redemptions within six years of purchase | Classes B and 529-B convert to Classes A and 529-A, respectively, after eight years | |||
| Class C | None | 1% for redemptions within one year of purchase | Class C converts to Class F-1 after 10 years | |||
| Class 529-C | None | 1% for redemptions within one year of purchase | None | |||
| Class 529-E | None | None | None | |||
| Classes F-1, F-2, F-3 and 529-F-1 | None | None | None | |||
| Classes R-1, R-2, R-2E, R-3, R-4, R-5E, R-5 and R-6 | None | None | None |
*Class B and 529-B shares of the fund are not available for purchase.
On January 27, 2017, the fund made an additional retail share class (Class F-3) available for sale pursuant to an amendment to its registration statement filed with the U.S. Securities and Exchange Commission. Refer to the fund’s prospectus for more details.
| The Income Fund of America | 19 |
Holders of all share classes have equal pro rata rights to the assets, dividends and liquidation proceeds of the fund. Each share class has identical voting rights, except for the exclusive right to vote on matters affecting only its class. Share classes have different fees and expenses (“class-specific fees and expenses”), primarily due to different arrangements for distribution, transfer agent and administrative services. Differences in class-specific fees and expenses will result in differences in net investment income and, therefore, the payment of different per-share dividends by each share class.
2. Significant accounting policies
The fund is an investment company that applies the accounting and reporting guidance issued in Topic 946 by the U.S. Financial Accounting Standards Board. The fund’s financial statements have been prepared to comply with U.S. generally accepted accounting principles (“U.S. GAAP”). These principles require the fund’s investment adviser to make estimates and assumptions that affect reported amounts and disclosures. Actual results could differ from those estimates. Subsequent events, if any, have been evaluated through the date of issuance in the preparation of the financial statements. The fund follows the significant accounting policies described in this section, as well as the valuation policies described in the next section on valuation.
Cash — Cash includes amounts held in an interest bearing deposit facility.
Security transactions and related investment income — Security transactions are recorded by the fund as of the date the trades are executed with brokers. Realized gains and losses from security transactions are determined based on the specific identified cost of the securities. In the event a security is purchased with a delayed payment date, the fund will segregate liquid assets sufficient to meet its payment obligations. Dividend income is recognized on the ex-dividend date and interest income is recognized on an accrual basis. Market discounts, premiums and original issue discounts on fixed-income securities are amortized daily over the expected life of the security.
Class allocations — Income, fees and expenses (other than class-specific fees and expenses) and realized and unrealized gains and losses are allocated daily among the various share classes based on their relative net assets. Class-specific fees and expenses, such as distribution, transfer agent and administrative services, are charged directly to the respective share class.
Dividends and distributions to shareholders — Dividends and distributions to shareholders are recorded on the ex-dividend date.
Currency translation — Assets and liabilities, including investment securities, denominated in currencies other than U.S. dollars are translated into U.S. dollars at the exchange rates supplied by one or more pricing vendors on the valuation date. Purchases and sales of investment securities and income and expenses are translated into U.S. dollars at the exchange rates on the dates of such transactions. The effects of changes in exchange rates on investment securities are included with the net realized gain or loss and net unrealized appreciation or depreciation on investments in the fund’s
| 20 | The Income Fund of America |
statement of operations. The realized gain or loss and unrealized appreciation or depreciation resulting from all other transactions denominated in currencies other than U.S. dollars are disclosed separately.
3. Valuation
Capital Research and Management Company (“CRMC”), the fund’s investment adviser, values the fund’s investments at fair value as defined by U.S. GAAP. The net asset value of each share class of the fund is generally determined as of approximately 4:00 p.m. New York time each day the New York Stock Exchange is open.
Methods and inputs — The fund’s investment adviser uses the following methods and inputs to establish the fair value of the fund’s assets and liabilities. Use of particular methods and inputs may vary over time based on availability and relevance as market and economic conditions evolve.
Equity securities are generally valued at the official closing price of, or the last reported sale price on, the exchange or market on which such securities are traded, as of the close of business on the day the securities are being valued or, lacking any sales, at the last available bid price. Prices for each security are taken from the principal exchange or market on which the security trades.
Fixed-income securities, including short-term securities, are generally valued at prices obtained from one or more pricing vendors. Vendors value such securities based on one or more of the inputs described in the following table. The table provides examples of inputs that are commonly relevant for valuing particular classes of fixed-income securities in which the fund is authorized to invest. However, these classifications are not exclusive, and any of the inputs may be used to value any other class of fixed-income security.
| The Income Fund of America | 21 |
| Fixed-income class | Examples of standard inputs |
| All | Benchmark yields, transactions, bids, offers, quotations from dealers and trading systems, new issues, spreads and other relationships observed in the markets among comparable securities; and proprietary pricing models such as yield measures calculated using factors such as cash flows, financial or collateral performance and other reference data (collectively referred to as “standard inputs”) |
| Corporate bonds & notes; convertible securities | Standard inputs and underlying equity of the issuer |
| Bonds & notes of governments & government agencies | Standard inputs and interest rate volatilities |
| Mortgage-backed; asset-backed obligations | Standard inputs and cash flows, prepayment information, default rates, delinquency and loss assumptions, collateral characteristics, credit enhancements and specific deal information |
| Municipal securities | Standard inputs and, for certain distressed securities, cash flows or liquidation values using a net present value calculation based on inputs that include, but are not limited to, financial statements and debt contracts |
When the fund’s investment adviser deems it appropriate to do so (such as when vendor prices are unavailable or deemed to be not representative), fixed-income securities will be valued in good faith at the mean quoted bid and ask prices that are reasonably and timely available (or bid prices, if ask prices are not available) or at prices for securities of comparable maturity, quality and type.
Securities with both fixed-income and equity characteristics, or equity securities traded principally among fixed-income dealers, are generally valued in the manner described for either equity or fixed-income securities, depending on which method is deemed most appropriate by the fund’s investment adviser. Forward currency contracts are valued at the mean of representative quoted bid and ask prices, generally based on prices supplied by one or more pricing vendors.
Securities and other assets for which representative market quotations are not readily available or are considered unreliable by the fund’s investment adviser are fair valued as determined in good faith under fair valuation guidelines adopted by authority of the fund’s board of trustees as further described. The investment adviser follows fair valuation guidelines, consistent with U.S. Securities and Exchange Commission rules and guidance, to consider relevant principles and factors when making fair value determinations. The investment adviser considers relevant indications of value that are reasonably and timely available to it in determining the fair value to be assigned to a particular security, such as the type and cost of the security; contractual or legal restrictions on resale of the security; relevant financial or business developments of the issuer; actively traded similar or related securities; conversion or exchange rights on the security; related corporate actions; significant events occurring after the close of trading in the security; and changes in overall market conditions. In addition, the closing prices of equity securities that trade
| 22 | The Income Fund of America |
in markets outside U.S. time zones may be adjusted to reflect significant events that occur after the close of local trading but before the net asset value of each share class of the fund is determined. Fair valuations and valuations of investments that are not actively trading involve judgment and may differ materially from valuations that would have been used had greater market activity occurred.
Processes and structure — The fund’s board of trustees has delegated authority to the fund’s investment adviser to make fair value determinations, subject to board oversight. The investment adviser has established a Joint Fair Valuation Committee (the “Fair Valuation Committee”) to administer, implement and oversee the fair valuation process, and to make fair value decisions. The Fair Valuation Committee regularly reviews its own fair value decisions, as well as decisions made under its standing instructions to the investment adviser’s valuation teams. The Fair Valuation Committee reviews changes in fair value measurements from period to period and may, as deemed appropriate, update the fair valuation guidelines to better reflect the results of back testing and address new or evolving issues. The Fair Valuation Committee reports any changes to the fair valuation guidelines to the board of trustees with supplemental information to support the changes. The fund’s board and audit committee also regularly review reports that describe fair value determinations and methods.
The fund’s investment adviser has also established a Fixed-Income Pricing Review Group to administer and oversee the fixed-income valuation process, including the use of fixed-income pricing vendors. This group regularly reviews pricing vendor information and market data. Pricing decisions, processes and controls over security valuation are also subject to additional internal reviews, including an annual control self-evaluation program facilitated by the investment adviser’s compliance group.
Classifications — The fund’s investment adviser classifies the fund’s assets and liabilities into three levels based on the inputs used to value the assets or liabilities. Level 1 values are based on quoted prices in active markets for identical securities. Level 2 values are based on significant observable market inputs, such as quoted prices for similar securities and quoted prices in inactive markets. Certain securities trading outside the U.S. may transfer between Level 1 and Level 2 due to valuation adjustments resulting from significant market movements following the close of local trading. Level 3 values are based on significant unobservable inputs that reflect the investment adviser’s determination of assumptions that market participants might reasonably use in valuing the securities. The valuation levels are not necessarily an indication of the risk or liquidity associated with the underlying investment. For example, U.S. government securities are reflected as Level 2 because the inputs used to determine fair value may not always be quoted prices in an active market. The following tables present the fund’s valuation levels as of January 31, 2017 (dollars in thousands):
| The Income Fund of America | 23 |
| Investment securities | ||||||||||||||||
| Level 1 | Level 2* | Level 3 | Total | |||||||||||||
| Assets: | ||||||||||||||||
| Common stocks: | ||||||||||||||||
| Industrials | $ | 10,925,405 | $ | 6,165 | $ | 2 | $ | 10,931,572 | ||||||||
| Information technology | 8,395,842 | 1,288,444 | 25,140 | 9,709,426 | ||||||||||||
| Consumer staples | 8,159,201 | — | — | 8,159,201 | ||||||||||||
| Financials | 7,351,226 | — | — | 7,351,226 | ||||||||||||
| Energy | 7,055,300 | — | 24,688 | 7,079,988 | ||||||||||||
| Health care | 6,258,257 | — | 4,378 | 6,262,635 | ||||||||||||
| Consumer discretionary | 5,323,202 | — | 8 | 5,323,210 | ||||||||||||
| Materials | 4,703,398 | 12,224 | — | 4,715,622 | ||||||||||||
| Real estate | 3,840,557 | — | — | 3,840,557 | ||||||||||||
| Telecommunication services | 3,443,078 | — | — | 3,443,078 | ||||||||||||
| Utilities | 2,635,596 | — | — | 2,635,596 | ||||||||||||
| Miscellaneous | 3,971,918 | — | 5,535 | 3,977,453 | ||||||||||||
| Preferred securities | 427,179 | — | — | 427,179 | ||||||||||||
| Rights & warrants | — | 607 | — | 607 | ||||||||||||
| Convertible stocks | 654,417 | 13,545 | 22,224 | 690,186 | ||||||||||||
| Convertible bonds | — | 792,337 | — | 792,337 | ||||||||||||
| Bonds, notes & other debt instruments: | ||||||||||||||||
| Corporate bonds & notes | — | 14,684,104 | 61,822 | 14,745,926 | ||||||||||||
| U.S. Treasury bonds & notes | — | 5,349,141 | — | 5,349,141 | ||||||||||||
| Mortgage-backed obligations | — | 1,822,790 | — | 1,822,790 | ||||||||||||
| Federal agency bonds & notes | — | 59,090 | — | 59,090 | ||||||||||||
| Other | — | 473,363 | — | 473,363 | ||||||||||||
| Short-term securities | — | 5,220,449 | — | 5,220,449 | ||||||||||||
| Total | $ | 73,144,576 | $ | 29,722,259 | $ | 143,797 | $ | 103,010,632 | ||||||||
| Other investments† | ||||||||||||||||
| Level 1 | Level 2 | Level 3 | Total | |||||||||||||
| Liabilities: | ||||||||||||||||
| Unrealized depreciation on open forward currency contracts | $ | — | $ | (23,563 | ) | $ | — | $ | (23,563 | ) | ||||||
| * | Securities with a value of $1,288,444,000, which represented 1.25% of the net assets of the fund, were classified as Level 2 due to significant market movements following the close of local trading. |
| † | Forward currency contracts are not included in the investment portfolio. |
| 24 | The Income Fund of America |
4. Risk factors
Investing in the fund may involve certain risks including, but not limited to, those described below.
Market conditions — The prices of, and the income generated by, the common stocks and other securities held by the fund may decline — sometimes rapidly or unpredictably — due to various factors, including events or conditions affecting the general economy or particular industries; overall market changes; local, regional or global political, social or economic instability; governmental or governmental agency responses to economic conditions; and currency exchange rate, interest rate and commodity price fluctuations.
Issuer risks — The prices of, and the income generated by, securities held by the fund may decline in response to various factors directly related to the issuers of such securities, including reduced demand for an issuer’s goods or services, poor management performance and strategic initiatives such as mergers, acquisitions or dispositions and the market response to any such initiatives.
Investing in income-oriented stocks — Income provided by the fund may be reduced by changes in the dividend policies of, and the capital resources available for dividend payments at, the companies in which the fund invests.
Investing in debt instruments — The prices of, and the income generated by, bonds and other debt securities held by the fund may be affected by changing interest rates and by changes in the effective maturities and credit ratings of these securities.
Rising interest rates will generally cause the prices of bonds and other debt securities to fall. Falling interest rates may cause an issuer to redeem, call or refinance a debt security before its stated maturity, which may result in the fund having to reinvest the proceeds in lower yielding securities. Longer maturity debt securities generally have greater sensitivity to changes in interest rates and may be subject to greater price fluctuations than shorter maturity debt securities.
Bonds and other debt securities are also subject to credit risk, which is the possibility that the credit strength of an issuer will weaken and/or an issuer of a debt security will fail to make timely payments of principal or interest and the security will go into default. Lower quality debt securities generally have higher rates of interest and may be subject to greater price fluctuations than higher quality debt securities. Credit risk is gauged, in part, by the credit ratings of the debt securities in which the fund invests. However, ratings are only the opinions of the rating agencies issuing them and are not guarantees as to credit quality or an evaluation of market risk. The fund’s investment adviser relies on its own credit analysts to research issuers and issues in seeking to mitigate various credit and default risks.
| The Income Fund of America | 25 |
Investing in lower rated debt instruments — Lower rated bonds and other lower rated debt securities generally have higher rates of interest and involve greater risk of default or price declines due to changes in the issuer’s creditworthiness than those of higher quality debt securities. The market prices of these securities may fluctuate more than the prices of higher quality debt securities and may decline significantly in periods of general economic difficulty. These risks may be increased with respect to investments in junk bonds.
Investing outside the U.S. — Securities of issuers domiciled outside the U.S., or with significant operations or revenues outside the U.S., may lose value because of adverse political, social, economic or market developments (including social instability, regional conflicts, terrorism and war) in the countries or regions in which the issuers operate or generate revenue. These securities may also lose value due to changes in foreign currency exchange rates against the U.S. dollar and/or currencies of other countries. Issuers of these securities may be more susceptible to actions of foreign governments, such as the imposition of price controls or punitive taxes, that could adversely impact the value of these securities. Securities markets in certain countries may be more volatile and/or less liquid than those in the U.S. Investments outside the U.S. may also be subject to different accounting practices and different regulatory, legal and reporting standards and practices, and may be more difficult to value, than those in the U.S. In addition, the value of investments outside the U.S. may be reduced by foreign taxes, including foreign withholding taxes on interest and dividends. Further, there may be increased risks of delayed settlement of securities purchased or sold by the fund. The risks of investing outside the U.S. may be heightened in connection with investments in emerging markets.
Management — The investment adviser to the fund actively manages the fund’s investments. Consequently, the fund is subject to the risk that the methods and analyses employed by the investment adviser in this process may not produce the desired results. This could cause the fund to lose value or its investment results to lag relevant benchmarks or other funds with similar objectives.
5. Certain investment techniques
Index-linked bonds — The fund has invested in index-linked bonds, which are fixed-income securities whose principal value is periodically adjusted to a government price index. Over the life of an index-linked bond, interest is paid on the adjusted principal value. Increases or decreases in the principal value of index-linked bonds are recorded as interest income in the fund’s statement of operations.
Mortgage dollar rolls — The fund has entered into mortgage dollar roll transactions in which the fund sells a mortgage-backed security to a counterparty and simultaneously enters into an agreement with the same counterparty to buy back a similar security on a specific future date at a predetermined price. Mortgage dollar rolls are accounted for as purchase and sale transactions, which may increase the fund’s portfolio turnover rate.
| 26 | The Income Fund of America |
Loan transactions — The fund has entered into loan transactions in which the fund acquires a loan either through an agent, by assignment from another holder, or as a participation interest in another holder’s portion of a loan. The loan is often administered by a financial institution that acts as agent for the holders of the loan, and the fund may be required to receive approval from the agent and/or borrower prior to the sale of the investment. The loan’s interest rate and maturity date may change based on the terms of the loan, including potential early payments of principal.
Unfunded commitments — The fund has participated in a transaction that involves unfunded commitments, which may obligate the fund to purchase additional shares of the applicable issuer. Under the terms of the commitments, which will expire no later than April 1, 2021, the maximum potential exposure as of January 31, 2017, was $1,819,000. Should such commitments become due in full, these amounts would represent less than .01% of the net assets of the fund as of January 31, 2017.
Forward currency contracts — The fund has entered into forward currency contracts, which represent agreements to exchange currencies on specific future dates at predetermined rates. The fund’s investment adviser uses forward currency contracts to manage the fund’s exposure to changes in exchange rates. Upon entering into these contracts, risks may arise from the potential inability of counterparties to meet the terms of their contracts and from possible movements in exchange rates.
On a daily basis, the fund’s investment adviser values forward currency contracts and records unrealized appreciation or depreciation for open forward currency contracts in the fund’s statement of assets and liabilities. Realized gains or losses are recorded at the time the forward currency contract is closed or offset by another contract with the same broker for the same settlement date and currency.
Closed forward currency contracts that have not reached their settlement date are included in the respective receivables or payables for closed forward currency contracts in the fund’s statement of assets and liabilities. Net realized gains or losses from closed forward currency contracts and net unrealized appreciation or depreciation from open forward currency contracts are recorded in the fund’s statement of operations.
The following tables present the financial statement impacts resulting from the fund’s use of forward currency contracts as of, or for the six months ended, January 31, 2017 (dollars in thousands):
| The Income Fund of America | 27 |
| Assets | Liabilities | |||||||||||||
| Contract | Risk type | Location on statement of assets and liabilities | Value | Location on statement of assets and liabilities | Value | |||||||||
| Forward currency | Currency | Unrealized appreciation on open forward currency contracts | $ | — | Unrealized depreciation on open forward currency contracts | $ | 23,563 | |||||||
| Forward currency | Currency | Receivables for closed forward currency contracts | — | Payables for closed forward currency contracts | 1,169 | |||||||||
| $ | — | $ | 24,732 | |||||||||||
| Net realized gain | Net unrealized depreciation | |||||||||||||
| Contract | Risk type | Location on statement of operations | Value | Location on statement of operations | Value | |||||||||
| Forward currency | Currency | Net realized gain on forward currency contracts | $ | 67,154 | Net unrealized depreciation on forward currency contracts | $ | (16,029 | ) | ||||||
Collateral — The fund participates in a collateral program due to its use of forward currency contracts and future delivery contracts. For forward currency contracts, the program calls for the fund to either receive or pledge collateral based on the net gain or loss on unsettled forward currency contracts by counterparty. For future delivery contracts, the program calls for the fund to either receive or pledge collateral based on the net gain or loss on unsettled contracts by certain counterparties. The purpose of the collateral is to cover potential losses that could occur in the event that either party cannot meet its contractual obligations.
Rights of offset — The fund has entered into enforceable master netting agreements with certain counterparties for forward currency contracts, where on any date amounts payable by each party to the other (in the same currency with respect to the same transaction) may be closed or offset by each party’s payment obligation. If an early termination date occurs under these agreements following an event of default or termination event, all obligations of each party to its counterparty are settled net through a single payment in a single currency (“close-out netting”). For financial reporting purposes, the fund does not offset financial assets and financial liabilities that are subject to these master netting arrangements in the statement of assets and liabilities.
| 28 | The Income Fund of America |
The following table presents the fund’s forward currency contracts by counterparty that are subject to master netting agreements but that are not offset in the fund’s statement of assets and liabilities. The net amount column shows the impact of offsetting on the fund’s statement of assets and liabilities as of January 31, 2017, if close-out netting was exercised (dollars in thousands):
| Gross amounts recognized in the statement of assets and liabilities | Gross amounts not offset in the statement of assets and liabilities and subject to a master netting agreement | |||||||||||||||||||
| Counterparty | Available to offset | Non-cash collateral* | Cash collateral | Net amount | ||||||||||||||||
| Liabilities: | ||||||||||||||||||||
| Bank of America, N.A. | $ | 256 | $ | — | $ | (256 | ) | $ | — | $ | — | |||||||||
| Barclays Bank PLC | 8,011 | — | (7,508 | ) | — | 503 | ||||||||||||||
| Citibank | 749 | — | (749 | ) | — | — | ||||||||||||||
| HSBC Bank | 10,597 | — | (10,004 | ) | — | 593 | ||||||||||||||
| JPMorgan Chase | 5,119 | — | (4,500 | ) | — | 619 | ||||||||||||||
| Total | $ | 24,732 | $ | — | $ | (23,017 | ) | $ | — | $ | 1,715 | |||||||||
| *Non-cash collateral is shown on a settlement basis. |
6. Taxation and distributions
Federal income taxation — The fund complies with the requirements under Subchapter M of the Internal Revenue Code applicable to mutual funds and intends to distribute substantially all of its net taxable income and net capital gains each year. The fund is not subject to income taxes to the extent such distributions are made. Therefore, no federal income tax provision is required.
As of and during the period ended January 31, 2017, the fund did not have a liability for any unrecognized tax benefits. The fund recognizes interest and penalties, if any, related to unrecognized tax benefits as income tax expense in the statement of operations. During the period, the fund did not incur any interest or penalties.
The fund is not subject to examination by U.S. federal tax authorities for tax years before 2012, by state tax authorities for tax years before 2011 and by tax authorities outside the U.S. for tax years before 2014.
Non-U.S. taxation — Dividend and interest income are recorded net of non-U.S. taxes paid. The fund may file withholding tax reclaims in certain jurisdictions to recover a portion of amounts previously withheld. As a result of rulings from European courts, the fund filed for additional reclaims related to prior years. These reclaims are recorded when the amount is known and there are no significant uncertainties on collectability. Gains realized by the fund on the sale of securities in certain countries are subject to non-U.S. taxes. The fund records an estimated deferred tax liability based on unrealized gains to provide for potential non-U.S. taxes payable upon the sale of these securities.
| The Income Fund of America | 29 |
Distributions — Distributions paid to shareholders are based on net investment income and net realized gains determined on a tax basis, which may differ from net investment income and net realized gains for financial reporting purposes. These differences are due primarily to different treatment for items such as currency gains and losses; short-term capital gains and losses; capital losses related to sales of certain securities within 30 days of purchase; unrealized appreciation of certain investments in securities outside the U.S.; cost of investments sold and income on certain investments. The fiscal year in which amounts are distributed may differ from the year in which the net investment income and net realized gains are recorded by the fund for financial reporting purposes.
The components of distributable earnings on a tax basis are reported as of the fund’s most recent year-end. As of July 31, 2016, the components of distributable earnings on a tax basis were as follows (dollars in thousands):
| Undistributed ordinary income | $ | 523,312 | ||
| Post-October capital loss deferral* | (88,896 | ) |
| *This deferral is considered incurred in the subsequent year. |
As of January 31, 2017, the tax basis unrealized appreciation (depreciation) and cost of investment securities were as follows (dollars in thousands):
| Gross unrealized appreciation on investment securities | $ | 20,403,813 | ||
| Gross unrealized depreciation on investment securities | (1,828,246 | ) | ||
| Net unrealized appreciation on investment securities | 18,575,567 | |||
| Cost of investment securities | 84,435,065 |
| 30 | The Income Fund of America |
The tax character of distributions paid to shareholders was as follows (dollars in thousands):
| Six months ended January 31, 2017 | Year ended July 31, 2016 | |||||||||||||||||||||||
| Total | ||||||||||||||||||||||||
| Total | dividends and | |||||||||||||||||||||||
| Ordinary | Long-term | dividends | Ordinary | Long-term | distributions | |||||||||||||||||||
| Share class | income | capital gains | paid | income | capital gains | paid | ||||||||||||||||||
| Class A | $ | 1,165,204 | $ | — | $ | 1,165,204 | $ | 2,268,689 | $ | 1,259,675 | $ | 3,528,364 | ||||||||||||
| Class B | 744 | — | 744 | 4,390 | 3,780 | 8,170 | ||||||||||||||||||
| Class C | 70,737 | — | 70,737 | 145,393 | 108,381 | 253,774 | ||||||||||||||||||
| Class F-1 | 68,727 | — | 68,727 | 128,057 | 72,956 | 201,013 | ||||||||||||||||||
| Class F-2 | 97,587 | — | 97,587 | 142,468 | 73,652 | 216,120 | ||||||||||||||||||
| Class F-31 | — | — | — | |||||||||||||||||||||
| Class 529-A | 23,153 | — | 23,153 | 44,586 | 25,554 | 70,140 | ||||||||||||||||||
| Class 529-B | 47 | — | 47 | 272 | 247 | 519 | ||||||||||||||||||
| Class 529-C | 5,238 | — | 5,238 | 10,332 | 7,919 | 18,251 | ||||||||||||||||||
| Class 529-E | 929 | — | 929 | 1,779 | 1,101 | 2,880 | ||||||||||||||||||
| Class 529-F-1 | 1,020 | — | 1,020 | 1,868 | 989 | 2,857 | ||||||||||||||||||
| Class R-1 | 1,520 | — | 1,520 | 3,096 | 2,291 | 5,387 | ||||||||||||||||||
| Class R-2 | 6,676 | — | 6,676 | 13,455 | 10,059 | 23,514 | ||||||||||||||||||
| Class R-2E | 120 | — | 120 | 79 | 6 | 85 | ||||||||||||||||||
| Class R-3 | 16,766 | — | 16,766 | 33,659 | 21,237 | 54,896 | ||||||||||||||||||
| Class R-4 | 18,403 | — | 18,403 | 35,211 | 20,359 | 55,570 | ||||||||||||||||||
| Class R-5E2 | — | 3 | — | — | 3 | — | 3 | — | 3 | — | 3 | |||||||||||||
| Class R-5 | 8,970 | — | 8,970 | 20,792 | 11,143 | 31,935 | ||||||||||||||||||
| Class R-6 | 84,053 | — | 84,053 | 126,027 | 61,144 | 187,171 | ||||||||||||||||||
| Total | $ | 1,569,894 | $ | — | $ | 1,569,894 | $ | 2,980,153 | $ | 1,680,493 | $ | 4,660,646 | ||||||||||||
| 1 | Class F-3 shares were offered beginning January 27, 2017. |
| 2 | Class R-5E shares were offered beginning November 20, 2015. |
| 3 | Amount less than one thousand. |
7. Fees and transactions with related parties
CRMC, the fund’s investment adviser, is the parent company of American Funds Distributors,® Inc. (“AFD”), the principal underwriter of the fund’s shares, and American Funds Service Company® (“AFS”), the fund’s transfer agent. CRMC, AFD and AFS are considered related parties to the fund.
Investment advisory services — The fund has an investment advisory and service agreement with CRMC that provides for monthly fees accrued daily. These fees are based on a series of decreasing annual rates beginning with 0.250% on the first $500 million of daily net assets and decreasing to 0.121% on such assets in excess of $115 billion. The agreement also provides for monthly fees, accrued daily, of 2.25% of the fund’s monthly gross income. For the six months ended January 31, 2017, the investment advisory services fee was $107,196,000, which was equivalent to an annualized rate of 0.210% of average daily net assets.
| The Income Fund of America | 31 |
Class-specific fees and expenses — Expenses that are specific to individual share classes are accrued directly to the respective share class. The principal class-specific fees and expenses are further described below:
Distribution services — The fund has plans of distribution for all share classes, except Class F-2, F-3, R-5E, R-5 and R-6 shares. Under the plans, the board of trustees approves certain categories of expenses that are used to finance activities primarily intended to sell fund shares and service existing accounts. The plans provide for payments, based on an annualized percentage of average daily net assets, ranging from 0.25% to 1.00% as noted in this section. In some cases, the board of trustees has limited the amounts that may be paid to less than the maximum allowed by the plans. All share classes with a plan may use up to 0.25% of average daily net assets to pay service fees, or to compensate AFD for paying service fees, to firms that have entered into agreements with AFD to provide certain shareholder services. The remaining amounts available to be paid under each plan are paid to dealers to compensate them for their sales activities.
For Class A and 529-A shares, distribution-related expenses include the reimbursement of dealer and wholesaler commissions paid by AFD for certain shares sold without a sales charge. These share classes reimburse AFD for amounts billed within the prior 15 months but only to the extent that the overall annual expense limit of 0.25% is not exceeded. As of January 31, 2017, there were no unreimbursed expenses subject to reimbursement for Class A or 529-A shares.
| Share class | Currently approved limits | Plan limits | ||||||||
| Class A | 0.25 | % | 0.25 | % | ||||||
| Class 529-A | 0.25 | 0.50 | ||||||||
| Classes B and 529-B | 1.00 | 1.00 | ||||||||
| Classes C, 529-C and R-1 | 1.00 | 1.00 | ||||||||
| Class R-2 | 0.75 | 1.00 | ||||||||
| Class R-2E | 0.60 | 0.85 | ||||||||
| Classes 529-E and R-3 | 0.50 | 0.75 | ||||||||
| Classes F-1, 529-F-1 and R-4 | 0.25 | 0.50 | ||||||||
Transfer agent services — The fund has a shareholder services agreement with AFS under which the fund compensates AFS for providing transfer agent services to each of the fund’s share classes. These services include recordkeeping, shareholder communications and transaction processing. In addition, the fund reimburses AFS for amounts paid to third parties for performing transfer agent services on behalf of fund shareholders.
Administrative services — The fund has an administrative services agreement with CRMC under which the fund compensates CRMC for providing administrative services to Class A, C, F, 529 and R shares. These services include, but are not limited to, coordinating, monitoring, assisting and overseeing third parties that provide
| 32 | The Income Fund of America |
services to fund shareholders. Under the agreement, Class A shares pay an annual fee of 0.01% and Class C, F, 529 and R shares pay an annual fee of 0.05% of their respective average daily net assets.
529 plan services — Each 529 share class is subject to service fees to compensate the Virginia College Savings Plan (“Virginia529”) for its oversight and administration of the 529 college savings plan. The quarterly fee is based on a series of decreasing annual rates beginning with 0.10% on the first $20 billion of the net assets invested in the Class 529 shares of the American Funds and decreasing to 0.03% on such assets in excess of $100 billion. The fee for any given calendar quarter is accrued and calculated on the basis of the average net assets of Class 529 shares of the American Funds for the last month of the prior calendar quarter. The fee is included in other expenses in the fund’s statement of operations. Virginia529 is not considered a related party to the fund.
For the six months ended January 31, 2017, class-specific expenses under the agreements were as follows (dollars in thousands):
| Share class | Distribution services | Transfer agent services | Administrative services | 529 plan services | |||||||||||
| Class A | $93,010 | $26,747 | $3,736 | Not applicable | |||||||||||
| Class B | 367 | 34 | Not applicable | Not applicable | |||||||||||
| Class C | 29,921 | 2,177 | 1,499 | Not applicable | |||||||||||
| Class F-1 | 5,602 | 2,697 | 1,123 | Not applicable | |||||||||||
| Class F-2 | Not applicable | 3,094 | 1,470 | Not applicable | |||||||||||
| Class F-3* | Not applicable | — | — | † | Not applicable | ||||||||||
| Class 529-A | 1,734 | 457 | 380 | $528 | |||||||||||
| Class 529-B | 25 | 3 | 1 | 2 | |||||||||||
| Class 529-C | 2,263 | 149 | 114 | 159 | |||||||||||
| Class 529-E | 163 | 9 | 16 | 23 | |||||||||||
| Class 529-F-1 | — | 18 | 16 | 21 | |||||||||||
| Class R-1 | 652 | 80 | 33 | Not applicable | |||||||||||
| Class R-2 | 2,108 | 1,129 | 142 | Not applicable | |||||||||||
| Class R-2E | 28 | 11 | 2 | Not applicable | |||||||||||
| Class R-3 | 3,001 | 1,132 | 301 | Not applicable | |||||||||||
| Class R-4 | 1,497 | 740 | 300 | Not applicable | |||||||||||
| Class R-5E | Not applicable | — | † | — | † | Not applicable | |||||||||
| Class R-5 | Not applicable | 171 | 134 | Not applicable | |||||||||||
| Class R-6 | Not applicable | 38 | 1,237 | Not applicable | |||||||||||
| Total class-specific expenses | $140,371 | $38,686 | $10,504 | $733 | |||||||||||
| * | Class F-3 shares were offered beginning January 27, 2017. | |
| † | Amount less than one thousand. |
Trustees’ deferred compensation — Trustees who are unaffiliated with CRMC may elect to defer the cash payment of part or all of their compensation. These deferred amounts, which remain as liabilities of the fund, are treated as if invested in shares of the fund or other American Funds. These amounts represent general, unsecured liabilities of the fund and vary according to the total returns of the selected funds. Trustees’ compensation of
| The Income Fund of America | 33 |
$327,000 in the fund’s statement of operations reflects $175,000 in current fees (either paid in cash or deferred) and a net increase of $152,000 in the value of the deferred amounts.
Affiliated officers and trustees — Officers and certain trustees of the fund are or may be considered to be affiliated with CRMC, AFD and AFS. No affiliated officers or trustees received any compensation directly from the fund.
Security transactions with related funds — The fund may purchase from, or sell securities to, other CRMC-managed funds (or funds managed by certain affiliates of CRMC) under procedures adopted by the fund’s board of trustees. The funds involved in such transactions are considered related by virtue of having a common investment adviser (or affiliated investment advisers), common trustees and/or common officers. When such transactions occur, each transaction is executed at the current market price of the security and no brokerage commissions or fees are paid in accordance with Rule 17a-7 of the 1940 Act.
8. Capital share transactions
Capital share transactions in the fund were as follows (dollars and shares in thousands):
| Sales1 | Reinvestments of dividends | Repurchases1 | Net (decrease) increase | |||||||||||||||||||||||||||||
| Share class | Amount | Shares | Amount | Shares | Amount | Shares | Amount | Shares | ||||||||||||||||||||||||
| Six months ended January 31, 2017 | ||||||||||||||||||||||||||||||||
| Class A | $ | 3,133,156 | 145,150 | $ | 1,127,680 | 52,592 | $ | (5,820,169 | ) | (270,136 | ) | $ | (1,559,333 | ) | (72,394 | ) | ||||||||||||||||
| Class B | 481 | 22 | 734 | 35 | (78,091 | ) | (3,632 | ) | (76,876 | ) | (3,575 | ) | ||||||||||||||||||||
| Class C | 401,696 | 18,840 | 68,191 | 3,217 | (888,487 | ) | (41,706 | ) | (418,600 | ) | (19,649 | ) | ||||||||||||||||||||
| Class F-1 | 567,388 | 26,330 | 65,625 | 3,066 | (516,476 | ) | (24,021 | ) | 116,537 | 5,375 | ||||||||||||||||||||||
| Class F-2 | 2,368,773 | 110,018 | 91,594 | 4,270 | (887,804 | ) | (41,288 | ) | 1,572,563 | 73,000 | ||||||||||||||||||||||
| Class F-32 | 108 | 5 | — | — | — | — | 108 | 5 | ||||||||||||||||||||||||
| Class 529-A | 97,778 | 4,535 | 23,144 | 1,081 | (127,122 | ) | (5,889 | ) | (6,200 | ) | (273 | ) | ||||||||||||||||||||
| Class 529-B | 100 | 4 | 47 | 2 | (5,898 | ) | (273 | ) | (5,751 | ) | (267 | ) | ||||||||||||||||||||
| Class 529-C | 30,668 | 1,428 | 5,237 | 245 | (49,935 | ) | (2,322 | ) | (14,030 | ) | (649 | ) | ||||||||||||||||||||
| Class 529-E | 4,625 | 215 | 928 | 44 | (5,750 | ) | (267 | ) | (197 | ) | (8 | ) | ||||||||||||||||||||
| Class 529-F-1 | 8,682 | 403 | 1,019 | 47 | (7,382 | ) | (342 | ) | 2,319 | 108 | ||||||||||||||||||||||
| Class R-1 | 10,602 | 495 | 1,518 | 71 | (18,891 | ) | (882 | ) | (6,771 | ) | (316 | ) | ||||||||||||||||||||
| Class R-2 | 59,836 | 2,800 | 6,666 | 314 | (94,763 | ) | (4,438 | ) | (28,261 | ) | (1,324 | ) | ||||||||||||||||||||
| Class R-2E | 6,867 | 317 | 120 | 6 | (889 | ) | (42 | ) | 6,098 | 281 | ||||||||||||||||||||||
| Class R-3 | 123,334 | 5,738 | 16,718 | 782 | (181,155 | ) | (8,413 | ) | (41,103 | ) | (1,893 | ) | ||||||||||||||||||||
| Class R-4 | 144,951 | 6,716 | 18,398 | 859 | (150,253 | ) | (6,971 | ) | 13,096 | 604 | ||||||||||||||||||||||
| Class R-5E | 25 | 1 | — | 3 | — | 3 | — | 3 | — | 3 | 25 | 1 | ||||||||||||||||||||
| Class R-5 | 77,184 | 3,578 | 8,954 | 417 | (51,593 | ) | (2,392 | ) | 34,545 | 1,603 | ||||||||||||||||||||||
| Class R-6 | 785,171 | 36,399 | 84,002 | 3,913 | (209,633 | ) | (9,705 | ) | 659,540 | 30,607 | ||||||||||||||||||||||
| Total net increase (decrease) | $ | 7,821,425 | 362,994 | $ | 1,520,575 | 70,961 | $ | (9,094,291 | ) | (422,719 | ) | $ | 247,709 | 11,236 | ||||||||||||||||||
| 34 | The Income Fund of America |
| Sales1 | Reinvestments of dividends and distributions | Repurchases1 | Net increase (decrease) | |||||||||||||||||||||||||||||
| Share class | Amount | Shares | Amount | Shares | Amount | Shares | Amount | Shares | ||||||||||||||||||||||||
| Year ended July 31, 2016 | ||||||||||||||||||||||||||||||||
| Class A | $ | 5,724,803 | 278,796 | $ | 3,431,843 | 169,512 | $ | (8,133,956 | ) | (396,067 | ) | $ | 1,022,690 | 52,241 | ||||||||||||||||||
| Class B | 2,255 | 111 | 8,057 | 401 | (194,331 | ) | (9,516 | ) | (184,019 | ) | (9,004 | ) | ||||||||||||||||||||
| Class C | 800,596 | 39,422 | 245,379 | 12,275 | (1,341,731 | ) | (66,129 | ) | (295,756 | ) | (14,432 | ) | ||||||||||||||||||||
| Class F-1 | 821,628 | 40,041 | 193,056 | 9,559 | (840,785 | ) | (41,089 | ) | 173,899 | 8,511 | ||||||||||||||||||||||
| Class F-2 | 1,606,112 | 77,658 | 201,943 | 9,979 | (889,128 | ) | (43,422 | ) | 918,927 | 44,215 | ||||||||||||||||||||||
| Class 529-A | 151,646 | 7,395 | 70,119 | 3,470 | (214,848 | ) | (10,442 | ) | 6,917 | 423 | ||||||||||||||||||||||
| Class 529-B | 258 | 13 | 518 | 26 | (12,186 | ) | (595 | ) | (11,410 | ) | (556 | ) | ||||||||||||||||||||
| Class 529-C | 52,710 | 2,579 | 18,243 | 907 | (82,435 | ) | (4,020 | ) | (11,482 | ) | (534 | ) | ||||||||||||||||||||
| Class 529-E | 7,224 | 354 | 2,880 | 143 | (10,002 | ) | (486 | ) | 102 | 11 | ||||||||||||||||||||||
| Class 529-F-1 | 11,150 | 543 | 2,854 | 141 | (12,409 | ) | (602 | ) | 1,595 | 82 | ||||||||||||||||||||||
| Class R-1 | 20,908 | 1,025 | 5,378 | 267 | (34,450 | ) | (1,680 | ) | (8,164 | ) | (388 | ) | ||||||||||||||||||||
| Class R-2 | 118,475 | 5,829 | 23,486 | 1,173 | (172,413 | ) | (8,491 | ) | (30,452 | ) | (1,489 | ) | ||||||||||||||||||||
| Class R-2E | 7,179 | 360 | 85 | 4 | (684 | ) | (33 | ) | 6,580 | 331 | ||||||||||||||||||||||
| Class R-3 | 222,663 | 10,882 | 54,725 | 2,714 | (356,500 | ) | (17,385 | ) | (79,112 | ) | (3,789 | ) | ||||||||||||||||||||
| Class R-4 | 228,593 | 11,123 | 55,548 | 2,749 | (318,178 | ) | (15,568 | ) | (34,037 | ) | (1,696 | ) | ||||||||||||||||||||
| Class R-5E4 | 10 | 1 | — | 3 | — | 3 | — | 3 | — | 3 | 10 | 1 | ||||||||||||||||||||
| Class R-5 | 116,052 | 5,661 | 31,927 | 1,578 | (294,802 | ) | (14,350 | ) | (146,823 | ) | (7,111 | ) | ||||||||||||||||||||
| Class R-6 | 1,464,284 | 71,448 | 187,031 | 9,227 | (362,130 | ) | (17,515 | ) | 1,289,185 | 63,160 | ||||||||||||||||||||||
| Total net increase (decrease) | $ | 11,356,546 | 553,241 | $ | 4,533,072 | 224,125 | $ | (13,270,968 | ) | (647,390 | ) | $ | 2,618,650 | 129,976 | ||||||||||||||||||
| 1 | Includes exchanges between share classes of the fund. |
| 2 | Class F-3 shares were offered beginning January 27, 2017. |
| 3 | Amount less than one thousand. |
| 4 | Class R-5E shares were offered beginning November 20, 2015. |
9. Investment transactions
The fund made purchases and sales of investment securities, excluding short-term securities and U.S. government obligations, if any, of $18,038,166,000 and $16,206,983,000, respectively, during the six months ended January 31, 2017.
| The Income Fund of America | 35 |
Financial highlights
| Income (loss) from investment operations1 | ||||||||||||||||
| Net asset | Net gains (losses) | |||||||||||||||
| value, | Net | on securities (both | Total from | |||||||||||||
| beginning | investment | realized and | investment | |||||||||||||
| of period | income2 | unrealized) | operations | |||||||||||||
| Class A: | ||||||||||||||||
| Six months ended 1/31/20174,5 | $ | 21.70 | $ | .31 | $ | .28 | $ | .59 | ||||||||
| Year ended 7/31/2016 | 21.31 | .66 | .76 | 1.42 | ||||||||||||
| Year ended 7/31/2015 | 21.45 | .69 | (.04 | ) | .65 | |||||||||||
| Year ended 7/31/2014 | 19.64 | .78 | 1.69 | 2.47 | ||||||||||||
| Year ended 7/31/2013 | 17.66 | .67 | 1.99 | 2.66 | ||||||||||||
| Year ended 7/31/2012 | 16.97 | .66 | .73 | 1.39 | ||||||||||||
| Class B: | ||||||||||||||||
| Six months ended 1/31/20174,5 | 21.59 | .25 | .25 | .50 | ||||||||||||
| Year ended 7/31/2016 | 21.17 | .50 | .77 | 1.27 | ||||||||||||
| Year ended 7/31/2015 | 21.30 | .53 | (.05 | ) | .48 | |||||||||||
| Year ended 7/31/2014 | 19.50 | .61 | 1.69 | 2.30 | ||||||||||||
| Year ended 7/31/2013 | 17.53 | .53 | 1.97 | 2.50 | ||||||||||||
| Year ended 7/31/2012 | 16.85 | .53 | .71 | 1.24 | ||||||||||||
| Class C: | ||||||||||||||||
| Six months ended 1/31/20174,5 | 21.44 | .22 | .27 | .49 | ||||||||||||
| Year ended 7/31/2016 | 21.06 | .49 | .76 | 1.25 | ||||||||||||
| Year ended 7/31/2015 | 21.21 | .51 | (.04 | ) | .47 | |||||||||||
| Year ended 7/31/2014 | 19.42 | .60 | 1.69 | 2.29 | ||||||||||||
| Year ended 7/31/2013 | 17.47 | .51 | 1.97 | 2.48 | ||||||||||||
| Year ended 7/31/2012 | 16.80 | .52 | .71 | 1.23 | ||||||||||||
| Class F-1: | ||||||||||||||||
| Six months ended 1/31/20174,5 | 21.65 | .30 | .28 | .58 | ||||||||||||
| Year ended 7/31/2016 | 21.26 | .64 | .76 | 1.40 | ||||||||||||
| Year ended 7/31/2015 | 21.40 | .67 | (.04 | ) | .63 | |||||||||||
| Year ended 7/31/2014 | 19.60 | .76 | 1.68 | 2.44 | ||||||||||||
| Year ended 7/31/2013 | 17.62 | .65 | 2.00 | 2.65 | ||||||||||||
| Year ended 7/31/2012 | 16.94 | .65 | .72 | 1.37 | ||||||||||||
| Class F-2: | ||||||||||||||||
| Six months ended 1/31/20174,5 | 21.69 | .33 | .28 | .61 | ||||||||||||
| Year ended 7/31/2016 | 21.30 | .70 | .75 | 1.45 | ||||||||||||
| Year ended 7/31/2015 | 21.44 | .73 | (.04 | ) | .69 | |||||||||||
| Year ended 7/31/2014 | 19.63 | .80 | 1.71 | 2.51 | ||||||||||||
| Year ended 7/31/2013 | 17.65 | .70 | 1.99 | 2.69 | ||||||||||||
| Year ended 7/31/2012 | 16.97 | .69 | .72 | 1.41 | ||||||||||||
| Class F-3: | ||||||||||||||||
| Period from 1/27/2017 to 1/31/20174,5,8 | 22.07 | — | 9 | (.12 | ) | (.12 | ) | |||||||||
| 36 | The Income Fund of America |
| Dividends and distributions | ||||||||||||||||||||||||||||||
| Dividends (from net investment income) | Distributions (from capital gains) | Total dividends and distributions | Net asset value, end of period | Total return3 | Net assets, end of period (in millions) | Ratio of expenses to average net assets2 | Ratio of net income to average net assets2 | |||||||||||||||||||||||
| $ | (.34 | ) | $ | — | $ | (.34 | ) | $ | 21.95 | 2.76 | %6 | $ | 74,710 | .55 | %7 | 2.86 | %7 | |||||||||||||
| (.66 | ) | (.37 | ) | (1.03 | ) | 21.70 | 7.10 | 75,437 | .56 | 3.22 | ||||||||||||||||||||
| (.79 | ) | — | (.79 | ) | 21.31 | 3.01 | 72,952 | .55 | 3.19 | |||||||||||||||||||||
| (.66 | ) | — | (.66 | ) | 21.45 | 12.78 | 71,290 | .57 | 3.76 | |||||||||||||||||||||
| (.68 | ) | — | (.68 | ) | 19.64 | 15.33 | 63,968 | .58 | 3.58 | |||||||||||||||||||||
| (.70 | ) | — | (.70 | ) | 17.66 | 8.45 | 56,153 | .59 | 3.92 | |||||||||||||||||||||
| (.23 | ) | — | (.23 | ) | 21.86 | 2.34 | 6 | 36 | 1.30 | 7 | 2.26 | 7 | ||||||||||||||||||
| (.48 | ) | (.37 | ) | (.85 | ) | 21.59 | 6.35 | 112 | 1.31 | 2.45 | ||||||||||||||||||||
| (.61 | ) | — | (.61 | ) | 21.17 | 2.23 | 301 | 1.30 | 2.45 | |||||||||||||||||||||
| (.50 | ) | — | (.50 | ) | 21.30 | 11.92 | 601 | 1.32 | 2.99 | |||||||||||||||||||||
| (.53 | ) | — | (.53 | ) | 19.50 | 14.48 | 818 | 1.33 | 2.86 | |||||||||||||||||||||
| (.56 | ) | — | (.56 | ) | 17.53 | 7.56 | 1,161 | 1.34 | 3.19 | |||||||||||||||||||||
| (.25 | ) | — | (.25 | ) | 21.68 | 2.34 | 6 | 5,840 | 1.34 | 7 | 2.08 | 7 | ||||||||||||||||||
| (.50 | ) | (.37 | ) | (.87 | ) | 21.44 | 6.27 | 6,196 | 1.36 | 2.41 | ||||||||||||||||||||
| (.62 | ) | — | (.62 | ) | 21.06 | 2.19 | 6,390 | 1.35 | 2.39 | |||||||||||||||||||||
| (.50 | ) | — | (.50 | ) | 21.21 | 11.91 | 6,597 | 1.37 | 2.95 | |||||||||||||||||||||
| (.53 | ) | — | (.53 | ) | 19.42 | 14.41 | 6,389 | 1.38 | 2.79 | |||||||||||||||||||||
| (.56 | ) | — | (.56 | ) | 17.47 | 7.55 | 6,096 | 1.38 | 3.13 | |||||||||||||||||||||
| (.33 | ) | — | (.33 | ) | 21.90 | 2.73 | 6 | 4,589 | .64 | 7 | 2.77 | 7 | ||||||||||||||||||
| (.64 | ) | (.37 | ) | (1.01 | ) | 21.65 | 7.02 | 4,421 | .65 | 3.12 | ||||||||||||||||||||
| (.77 | ) | — | (.77 | ) | 21.26 | 2.94 | 4,160 | .64 | 3.10 | |||||||||||||||||||||
| (.64 | ) | — | (.64 | ) | 21.40 | 12.66 | 3,841 | .65 | 3.71 | |||||||||||||||||||||
| (.67 | ) | — | (.67 | ) | 19.60 | 15.30 | 3,554 | .65 | 3.50 | |||||||||||||||||||||
| (.69 | ) | — | (.69 | ) | 17.62 | 8.35 | 2,563 | .64 | 3.87 | |||||||||||||||||||||
| (.36 | ) | — | (.36 | ) | 21.94 | 2.86 | 6 | 6,735 | .38 | 7 | 2.99 | 7 | ||||||||||||||||||
| (.69 | ) | (.37 | ) | (1.06 | ) | 21.69 | 7.28 | 5,076 | .39 | 3.38 | ||||||||||||||||||||
| (.83 | ) | — | (.83 | ) | 21.30 | 3.20 | 4,042 | .38 | 3.35 | |||||||||||||||||||||
| (.70 | ) | — | (.70 | ) | 21.44 | 12.97 | 2,975 | .40 | 3.89 | |||||||||||||||||||||
| (.71 | ) | — | (.71 | ) | 19.63 | 15.53 | 1,434 | .41 | 3.74 | |||||||||||||||||||||
| (.73 | ) | — | (.73 | ) | 17.65 | 8.59 | 1,020 | .40 | 4.09 | |||||||||||||||||||||
| — | — | — | 21.95 | (.54 | )6 | — | 10 | — | 6,11 | .02 | 6 | |||||||||||||||||||
See page 43 for footnotes.
| The Income Fund of America | 37 |
Financial highlights (continued)
| Income (loss) from investment operations1 | ||||||||||||||||
| Net asset | Net gains (losses) | |||||||||||||||
| value, | Net | on securities (both | Total from | |||||||||||||
| beginning | investment | realized and | investment | |||||||||||||
| of period | income2 | unrealized) | operations | |||||||||||||
| Class 529-A: | ||||||||||||||||
| Six months ended 1/31/20174,5 | $ | 21.66 | $ | .30 | $ | .28 | $ | .58 | ||||||||
| Year ended 7/31/2016 | 21.27 | .64 | .76 | 1.40 | ||||||||||||
| Year ended 7/31/2015 | 21.41 | .67 | (.04 | ) | .63 | |||||||||||
| Year ended 7/31/2014 | 19.60 | .75 | 1.70 | 2.45 | ||||||||||||
| Year ended 7/31/2013 | 17.63 | .65 | 1.98 | 2.63 | ||||||||||||
| Year ended 7/31/2012 | 16.95 | .64 | .72 | 1.36 | ||||||||||||
| Class 529-B: | ||||||||||||||||
| Six months ended 1/31/20174,5 | 21.65 | .23 | .26 | .49 | ||||||||||||
| Year ended 7/31/2016 | 21.23 | .48 | .76 | 1.24 | ||||||||||||
| Year ended 7/31/2015 | 21.36 | .50 | (.05 | ) | .45 | |||||||||||
| Year ended 7/31/2014 | 19.55 | .58 | 1.70 | 2.28 | ||||||||||||
| Year ended 7/31/2013 | 17.57 | .50 | 1.99 | 2.49 | ||||||||||||
| Year ended 7/31/2012 | 16.89 | .51 | .71 | 1.22 | ||||||||||||
| Class 529-C: | ||||||||||||||||
| Six months ended 1/31/20174,5 | 21.57 | .22 | .28 | .50 | ||||||||||||
| Year ended 7/31/2016 | 21.18 | .48 | .76 | 1.24 | ||||||||||||
| Year ended 7/31/2015 | 21.33 | .50 | (.05 | ) | .45 | |||||||||||
| Year ended 7/31/2014 | 19.53 | .59 | 1.69 | 2.28 | ||||||||||||
| Year ended 7/31/2013 | 17.56 | .50 | 1.99 | 2.49 | ||||||||||||
| Year ended 7/31/2012 | 16.89 | .51 | .71 | 1.22 | ||||||||||||
| Class 529-E: | ||||||||||||||||
| Six months ended 1/31/20174,5 | 21.60 | .28 | .27 | .55 | ||||||||||||
| Year ended 7/31/2016 | 21.21 | .59 | .76 | 1.35 | ||||||||||||
| Year ended 7/31/2015 | 21.35 | .62 | (.04 | ) | .58 | |||||||||||
| Year ended 7/31/2014 | 19.55 | .70 | 1.69 | 2.39 | ||||||||||||
| Year ended 7/31/2013 | 17.58 | .60 | 1.99 | 2.59 | ||||||||||||
| Year ended 7/31/2012 | 16.91 | .60 | .71 | 1.31 | ||||||||||||
| Class 529-F-1: | ||||||||||||||||
| Six months ended 1/31/20174,5 | 21.66 | .33 | .28 | .61 | ||||||||||||
| Year ended 7/31/2016 | 21.27 | .69 | .76 | 1.45 | ||||||||||||
| Year ended 7/31/2015 | 21.41 | .72 | (.04 | ) | .68 | |||||||||||
| Year ended 7/31/2014 | 19.60 | .80 | 1.70 | 2.50 | ||||||||||||
| Year ended 7/31/2013 | 17.63 | .69 | 1.98 | 2.67 | ||||||||||||
| Year ended 7/31/2012 | 16.95 | .68 | .72 | 1.40 | ||||||||||||
| Class R-1: | ||||||||||||||||
| Six months ended 1/31/20174,5 | 21.57 | .22 | .27 | .49 | ||||||||||||
| Year ended 7/31/2016 | 21.18 | .49 | .76 | 1.25 | ||||||||||||
| Year ended 7/31/2015 | 21.33 | .51 | (.05 | ) | .46 | |||||||||||
| Year ended 7/31/2014 | 19.53 | .60 | 1.69 | 2.29 | ||||||||||||
| Year ended 7/31/2013 | 17.56 | .52 | 1.98 | 2.50 | ||||||||||||
| Year ended 7/31/2012 | 16.89 | .52 | .71 | 1.23 | ||||||||||||
| 38 | The Income Fund of America |
| Dividends and distributions | ||||||||||||||||||||||||||||||
| Dividends (from net investment income) | Distributions (from capital gains) | Total dividends and distributions | Net asset value, end of period | Total return3 | Net assets, end of period (in millions) | Ratio of expenses to average net assets2 | Ratio of net income to average net assets2 | |||||||||||||||||||||||
| $ | (.33 | ) | $ | — | $ | (.33 | ) | $ | 21.91 | 2.73 | %6 | $ | 1,536 | .63 | %7 | 2.78 | %7 | |||||||||||||
| (.64 | ) | (.37 | ) | (1.01 | ) | 21.66 | 7.00 | 1,525 | .66 | 3.11 | ||||||||||||||||||||
| (.77 | ) | — | (.77 | ) | 21.27 | 2.92 | 1,489 | .65 | 3.09 | |||||||||||||||||||||
| (.64 | ) | — | (.64 | ) | 21.41 | 12.69 | 1,463 | .67 | 3.66 | |||||||||||||||||||||
| (.66 | ) | — | (.66 | ) | 19.60 | 15.19 | 1,298 | .68 | 3.48 | |||||||||||||||||||||
| (.68 | ) | — | (.68 | ) | 17.63 | 8.30 | 1,102 | .68 | 3.82 | |||||||||||||||||||||
| (.21 | ) | — | (.21 | ) | 21.93 | 2.28 | 6 | 2 | 1.43 | 7 | 2.16 | 7 | ||||||||||||||||||
| (.45 | ) | (.37 | ) | (.82 | ) | 21.65 | 6.18 | 8 | 1.45 | 2.32 | ||||||||||||||||||||
| (.58 | ) | — | (.58 | ) | 21.23 | 2.10 | 20 | 1.43 | 2.33 | |||||||||||||||||||||
| (.47 | ) | — | (.47 | ) | 21.36 | 11.79 | 34 | 1.45 | 2.85 | |||||||||||||||||||||
| (.51 | ) | — | (.51 | ) | 19.55 | 14.35 | 45 | 1.46 | 2.73 | |||||||||||||||||||||
| (.54 | ) | — | (.54 | ) | 17.57 | 7.41 | 58 | 1.47 | 3.06 | |||||||||||||||||||||
| (.25 | ) | — | (.25 | ) | 21.82 | 2.30 | 6 | 454 | 1.40 | 7 | 2.02 | 7 | ||||||||||||||||||
| (.48 | ) | (.37 | ) | (.85 | ) | 21.57 | 6.20 | 463 | 1.43 | 2.34 | ||||||||||||||||||||
| (.60 | ) | — | (.60 | ) | 21.18 | 2.09 | 466 | 1.42 | 2.32 | |||||||||||||||||||||
| (.48 | ) | — | (.48 | ) | 21.33 | 11.82 | 470 | 1.44 | 2.88 | |||||||||||||||||||||
| (.52 | ) | — | (.52 | ) | 19.53 | 14.36 | 420 | 1.45 | 2.71 | |||||||||||||||||||||
| (.55 | ) | — | (.55 | ) | 17.56 | 7.43 | 370 | 1.47 | 3.04 | |||||||||||||||||||||
| (.31 | ) | — | (.31 | ) | 21.84 | 2.57 | 6 | 66 | .86 | 7 | 2.55 | 7 | ||||||||||||||||||
| (.59 | ) | (.37 | ) | (.96 | ) | 21.60 | 6.76 | 66 | .89 | 2.88 | ||||||||||||||||||||
| (.72 | ) | — | (.72 | ) | 21.21 | 2.68 | 64 | .89 | 2.85 | |||||||||||||||||||||
| (.59 | ) | — | (.59 | ) | 21.35 | 12.39 | 65 | .91 | 3.41 | |||||||||||||||||||||
| (.62 | ) | — | (.62 | ) | 19.55 | 14.95 | 59 | .92 | 3.24 | |||||||||||||||||||||
| (.64 | ) | — | (.64 | ) | 17.58 | 7.99 | 52 | .93 | 3.57 | |||||||||||||||||||||
| (.36 | ) | — | (.36 | ) | 21.91 | 2.85 | 6 | 64 | .40 | 7 | 3.01 | 7 | ||||||||||||||||||
| (.69 | ) | (.37 | ) | (1.06 | ) | 21.66 | 7.25 | 61 | .43 | 3.34 | ||||||||||||||||||||
| (.82 | ) | — | (.82 | ) | 21.27 | 3.16 | 58 | .42 | 3.31 | |||||||||||||||||||||
| (.69 | ) | — | (.69 | ) | 21.41 | 12.94 | 52 | .44 | 3.89 | |||||||||||||||||||||
| (.70 | ) | — | (.70 | ) | 19.60 | 15.44 | 44 | .45 | 3.70 | |||||||||||||||||||||
| (.72 | ) | — | (.72 | ) | 17.63 | 8.53 | 36 | .46 | 4.04 | |||||||||||||||||||||
| (.25 | ) | — | (.25 | ) | 21.81 | 2.31 | 6 | 128 | 1.39 | 7 | 2.03 | 7 | ||||||||||||||||||
| (.49 | ) | (.37 | ) | (.86 | ) | 21.57 | 6.25 | 133 | 1.37 | 2.40 | ||||||||||||||||||||
| (.61 | ) | — | (.61 | ) | 21.18 | 2.16 | 139 | 1.36 | 2.38 | |||||||||||||||||||||
| (.49 | ) | — | (.49 | ) | 21.33 | 11.88 | 133 | 1.39 | 2.93 | |||||||||||||||||||||
| (.53 | ) | — | (.53 | ) | 19.53 | 14.43 | 120 | 1.39 | 2.78 | |||||||||||||||||||||
| (.56 | ) | — | (.56 | ) | 17.56 | 7.50 | 122 | 1.40 | 3.11 | |||||||||||||||||||||
See page 43 for footnotes.
| The Income Fund of America | 39 |
Financial highlights (continued)
| Income (loss) from investment operations1 | ||||||||||||||||
| Net asset | Net gains (losses) | |||||||||||||||
| value, | Net | on securities (both | Total from | |||||||||||||
| beginning | investment | realized and | investment | |||||||||||||
| of period | income2 | unrealized) | operations | |||||||||||||
| Class R-2: | ||||||||||||||||
| Six months ended 1/31/20174,5 | $ | 21.47 | $ | .22 | $ | .27 | $ | .49 | ||||||||
| Year ended 7/31/2016 | 21.09 | .49 | .75 | 1.24 | ||||||||||||
| Year ended 7/31/2015 | 21.23 | .52 | (.04 | ) | .48 | |||||||||||
| Year ended 7/31/2014 | 19.45 | .60 | 1.68 | 2.28 | ||||||||||||
| Year ended 7/31/2013 | 17.49 | .52 | 1.98 | 2.50 | ||||||||||||
| Year ended 7/31/2012 | 16.82 | .52 | .71 | 1.23 | ||||||||||||
| Class R-2E: | ||||||||||||||||
| Six months ended 1/31/20174,5 | 21.66 | .24 | .29 | .53 | ||||||||||||
| Year ended 7/31/2016 | 21.29 | .58 | .75 | 1.33 | ||||||||||||
| Period from 8/29/2014 to 7/31/20154,12 | 21.98 | .54 | (.47 | ) | .07 | |||||||||||
| Class R-3: | ||||||||||||||||
| Six months ended 1/31/20174,5 | 21.62 | .27 | .27 | .54 | ||||||||||||
| Year ended 7/31/2016 | 21.23 | .59 | .75 | 1.34 | ||||||||||||
| Year ended 7/31/2015 | 21.37 | .61 | (.04 | ) | .57 | |||||||||||
| Year ended 7/31/2014 | 19.57 | .69 | 1.69 | 2.38 | ||||||||||||
| Year ended 7/31/2013 | 17.60 | .60 | 1.98 | 2.58 | ||||||||||||
| Year ended 7/31/2012 | 16.92 | .60 | .72 | 1.32 | ||||||||||||
| Class R-4: | ||||||||||||||||
| Six months ended 1/31/20174,5 | 21.67 | .30 | .27 | .57 | ||||||||||||
| Year ended 7/31/2016 | 21.27 | .65 | .76 | 1.41 | ||||||||||||
| Year ended 7/31/2015 | 21.42 | .68 | (.06 | ) | .62 | |||||||||||
| Year ended 7/31/2014 | 19.61 | .76 | 1.70 | 2.46 | ||||||||||||
| Year ended 7/31/2013 | 17.63 | .66 | 1.99 | 2.65 | ||||||||||||
| Year ended 7/31/2012 | 16.95 | .65 | .72 | 1.37 | ||||||||||||
| Class R-5E: | ||||||||||||||||
| Six months ended 1/31/20174,5 | 21.69 | .29 | .30 | .59 | ||||||||||||
| Period from 11/20/2015 to 7/31/20164,14 | 21.03 | .47 | 1.07 | 1.54 | ||||||||||||
| Class R-5: | ||||||||||||||||
| Six months ended 1/31/20174,5 | 21.70 | .33 | .29 | .62 | ||||||||||||
| Year ended 7/31/2016 | 21.31 | .71 | .76 | 1.47 | ||||||||||||
| Year ended 7/31/2015 | 21.45 | .74 | (.04 | ) | .70 | |||||||||||
| Year ended 7/31/2014 | 19.64 | .82 | 1.70 | 2.52 | ||||||||||||
| Year ended 7/31/2013 | 17.66 | .71 | 1.99 | 2.70 | ||||||||||||
| Year ended 7/31/2012 | 16.97 | .70 | .73 | 1.43 | ||||||||||||
| 40 | The Income Fund of America |
| Dividends and distributions | ||||||||||||||||||||||||||||||
| Dividends (from net investment income) | Distributions (from capital gains) | Total dividends and distributions | Net asset value, end of period | Total return3 | Net assets, end of period (in millions) | Ratio of expenses to average net assets2 | Ratio of net income to average net assets2 | |||||||||||||||||||||||
| $ | (.25 | ) | $ | — | $ | (.25 | ) | $ | 21.71 | 2.33 | %6 | $ | 555 | 1.41 | %7 | 2.01 | %7 | |||||||||||||
| (.49 | ) | (.37 | ) | (.86 | ) | 21.47 | 6.25 | 577 | 1.36 | 2.41 | ||||||||||||||||||||
| (.62 | ) | — | (.62 | ) | 21.09 | 2.24 | 599 | 1.32 | 2.42 | |||||||||||||||||||||
| (.50 | ) | — | (.50 | ) | 21.23 | 11.85 | 635 | 1.37 | 2.95 | |||||||||||||||||||||
| (.54 | ) | — | (.54 | ) | 19.45 | 14.47 | 609 | 1.36 | 2.80 | |||||||||||||||||||||
| (.56 | ) | — | (.56 | ) | 17.49 | 7.52 | 567 | 1.40 | 3.11 | |||||||||||||||||||||
| (.29 | ) | — | (.29 | ) | 21.90 | 2.48 | 6 | 14 | 1.11 | 7 | 2.20 | 7 | ||||||||||||||||||
| (.59 | ) | (.37 | ) | (.96 | ) | 21.66 | 6.64 | 7 | 1.03 | 2.86 | ||||||||||||||||||||
| (.76 | ) | — | (.76 | ) | 21.29 | .28 | 6,13 | — | 10 | .96 | 7,13 | 2.73 | 7,13 | |||||||||||||||||
| (.30 | ) | — | (.30 | ) | 21.86 | 2.54 | 6 | 1,189 | .96 | 7 | 2.46 | 7 | ||||||||||||||||||
| (.58 | ) | (.37 | ) | (.95 | ) | 21.62 | 6.71 | 1,217 | .92 | 2.85 | ||||||||||||||||||||
| (.71 | ) | — | (.71 | ) | 21.23 | 2.65 | 1,275 | .92 | 2.83 | |||||||||||||||||||||
| (.58 | ) | — | (.58 | ) | 21.37 | 12.35 | 1,357 | .94 | 3.38 | |||||||||||||||||||||
| (.61 | ) | — | (.61 | ) | 19.57 | 14.91 | 1,323 | .94 | 3.22 | |||||||||||||||||||||
| (.64 | ) | — | (.64 | ) | 17.60 | 8.01 | 1,204 | .96 | 3.55 | |||||||||||||||||||||
| (.33 | ) | — | (.33 | ) | 21.91 | 2.69 | 6 | 1,215 | .64 | 7 | 2.77 | 7 | ||||||||||||||||||
| (.64 | ) | (.37 | ) | (1.01 | ) | 21.67 | 7.07 | 1,189 | .62 | 3.15 | ||||||||||||||||||||
| (.77 | ) | — | (.77 | ) | 21.27 | 2.90 | 1,203 | .62 | 3.12 | |||||||||||||||||||||
| (.65 | ) | — | (.65 | ) | 21.42 | 12.71 | 1,192 | .64 | 3.67 | |||||||||||||||||||||
| (.67 | ) | — | (.67 | ) | 19.61 | 15.29 | 1,045 | .64 | 3.52 | |||||||||||||||||||||
| (.69 | ) | — | (.69 | ) | 17.63 | 8.33 | 880 | .65 | 3.86 | |||||||||||||||||||||
| (.34 | ) | — | (.34 | ) | 21.94 | 2.78 | 6 | — | 10 | .56 | 7 | 2.70 | 7 | |||||||||||||||||
| (.51 | ) | (.37 | ) | (.88 | ) | 21.69 | 7.70 | 6 | — | 10 | .48 | 7 | 3.30 | 7 | ||||||||||||||||
| (.37 | ) | — | (.37 | ) | 21.95 | 2.89 | 6 | 557 | .33 | 7 | 3.07 | 7 | ||||||||||||||||||
| (.71 | ) | (.37 | ) | (1.08 | ) | 21.70 | 7.34 | 516 | .33 | 3.46 | ||||||||||||||||||||
| (.84 | ) | — | (.84 | ) | 21.31 | 3.25 | 658 | .32 | 3.41 | |||||||||||||||||||||
| (.71 | ) | — | (.71 | ) | 21.45 | 13.03 | 567 | .34 | 3.98 | |||||||||||||||||||||
| (.72 | ) | — | (.72 | ) | 19.64 | 15.60 | 525 | .34 | 3.83 | |||||||||||||||||||||
| (.74 | ) | — | (.74 | ) | 17.66 | 8.70 | 462 | .35 | 4.17 | |||||||||||||||||||||
See page 43 for footnotes.
| The Income Fund of America | 41 |
Financial highlights (continued)
| Income (loss) from investment operations1 | ||||||||||||||||
| Net asset | Net gains (losses) | |||||||||||||||
| value, | Net | on securities (both | Total from | |||||||||||||
| beginning | investment | realized and | investment | |||||||||||||
| of period | income2 | unrealized) | operations | |||||||||||||
| Class R-6: | ||||||||||||||||
| Six months ended 1/31/20174,5 | $ | 21.71 | $ | .34 | $ | .28 | $ | .62 | ||||||||
| Year ended 7/31/2016 | 21.32 | .72 | .76 | 1.48 | ||||||||||||
| Year ended 7/31/2015 | 21.46 | .75 | (.04 | ) | .71 | |||||||||||
| Year ended 7/31/2014 | 19.65 | .83 | 1.70 | 2.53 | ||||||||||||
| Year ended 7/31/2013 | 17.66 | .72 | 2.00 | 2.72 | ||||||||||||
| Year ended 7/31/2012 | 16.98 | .71 | .72 | 1.43 | ||||||||||||
| Six months | ||||||||||||
| ended | ||||||||||||
| January 31, | Year ended July 31 | |||||||||||
| Portfolio turnover rate for all share classes15 | 20174,5,6 | 2016 | 2015 | 2014 | 2013 | 2012 | ||||||
| Including mortgage dollar roll transactions | 19% | 52% | 45% | 39% | 47% | 41% | ||||||
| Excluding mortgage dollar roll transactions | 15% | 39% | 32% | Not available | ||||||||
See Notes to Financial Statements
| 42 | The Income Fund of America |
| Dividends and distributions | ||||||||||||||||||||||||||||||
| Dividends (from net investment income) | Distributions (from capital gains) | Total dividends and distributions | Net asset value, end of period | Total return3 | Net assets, end of period (in millions) | Ratio of expenses to average net assets2 | Ratio of net income to average net assets2 | |||||||||||||||||||||||
| $ | (.37 | ) | $ | — | $ | (.37 | ) | $ | 21.96 | 2.91 | %6 | $ | 5,331 | .27 | %7 | 3.12 | %7 | |||||||||||||
| (.72 | ) | (.37 | ) | (1.09 | ) | 21.71 | 7.39 | 4,606 | .28 | 3.49 | ||||||||||||||||||||
| (.85 | ) | — | (.85 | ) | 21.32 | 3.30 | 3,176 | .28 | 3.45 | |||||||||||||||||||||
| (.72 | ) | — | (.72 | ) | 21.46 | 13.08 | 2,566 | .29 | 4.03 | |||||||||||||||||||||
| (.73 | ) | — | (.73 | ) | 19.65 | 15.72 | 1,631 | .29 | 3.85 | |||||||||||||||||||||
| (.75 | ) | — | (.75 | ) | 17.66 | 8.69 | 1,025 | .30 | 4.21 | |||||||||||||||||||||
| 1 | Based on average shares outstanding. |
| 2 | For the year ended July 31, 2014, this column reflects the impact of a corporate action event that resulted in a one-time increase to net investment income. If the corporate action event had not occurred, the Class A net investment income per share would have been lower by $.11; the Class A ratio of expenses to average net assets would have been lower by .01 percentage points; and the Class A ratio of net income to average net assets would have been lower by .51 percentage points. The impact to the other share classes would have been similar. |
| 3 | Total returns exclude any applicable sales charges, including contingent deferred sales charges. |
| 4 | Based on operations for the period shown and, accordingly, is not representative of a full year. |
| 5 | Unaudited. |
| 6 | Not annualized. |
| 7 | Annualized. |
| 8 | Class F-3 shares were offered beginning January 27, 2017. |
| 9 | Amount less than $.01. |
| 10 | Amount less than $1 million. |
| 11 | Amount less than .01%. |
| 12 | Class R-2E shares were offered beginning August 29, 2014. |
| 13 | All or a significant portion of assets in this class consisted of seed capital invested by CRMC and/or its affiliates. Fees for distribution services are not charged or accrued on these seed capital assets. If such fees were paid by the fund on seed capital assets, fund expenses would have been higher and net income and total return would have been lower. |
| 14 | Class R-5E shares were offered beginning November 20, 2015. |
| 15 | Refer to Note 5 for more information on mortgage dollar rolls. |
| The Income Fund of America | 43 |

| Common stocks 68.98% Industrials 9.69% |
Shares | Value (000) |
| General Electric Co. | 69,491,053 | $2,163,951 |
| Lockheed Martin Corp. | 8,119,400 | 2,052,016 |
| BAE Systems PLC | 126,401,776 | 893,310 |
| Boeing Co. | 5,965,000 | 797,282 |
| Waste Management, Inc. | 9,986,128 | 660,283 |
| Ryanair Holdings PLC (ADR) | 6,452,401 | 456,636 |
| Norfolk Southern Corp. | 5,000,000 | 448,900 |
| KONE Oyj, Class B | 7,723,000 | 391,048 |
| Hubbell Inc.1 | 3,430,000 | 369,857 |
| PACCAR Inc | 6,220,500 | 366,823 |
| Caterpillar Inc. | 4,287,000 | 354,792 |
| Edenred SA | 11,360,000 | 257,629 |
| R.R. Donnelley & Sons Co.1 | 13,345,400 | 239,150 |
| Macquarie Infrastructure Corp. | 2,490,000 | 190,858 |
| Abertis Infraestructuras, SA, Class A | 6,901,362 | 108,560 |
| Geberit AG | 127,000 | 49,007 |
| Douglas Dynamics, Inc.1 | 1,444,000 | 38,699 |
| CEVA Group PLC1,2,3,4 | 35,229 | 11,802 |
| Atrium Corp.3,4,5 | 1,807 | 2 |
| 9,850,605 | ||
| Financials 9.36% | ||
| JPMorgan Chase & Co. | 21,515,056 | 1,376,318 |
| CME Group Inc., Class A | 10,140,400 | 1,036,755 |
| Crown Castle International Corp. | 10,449,000 | 1,013,867 |
| Wells Fargo & Co. | 18,127,915 | 869,596 |
| Digital Realty Trust, Inc. | 7,635,000 | 797,552 |
| Iron Mountain Inc.1 | 13,724,780 | 565,598 |
| Public Storage | 1,935,000 | 462,310 |
| Prologis, Inc. | 8,390,000 | 457,171 |
| BM&FBOVESPA SA - Bolsa de Valores, Mercadorias e Futuros, ordinary nominative | 64,673,012 | 380,770 |
| Lamar Advertising Co., Class A | 5,253,322 | 356,490 |
| Toronto-Dominion Bank (CAD denominated) | 7,805,000 | 340,081 |
| PacWest Bancorp | 5,868,000 | 242,642 |
| BlackRock, Inc. | 600,000 | 219,750 |
| Outfront Media Inc.1 | 9,064,824 | 210,939 |
| Link Real Estate Investment Trust | 19,651,812 | 146,659 |
| Camden Property Trust | 1,270,300 | 113,806 |
| Equity Residential | 1,575,000 | 107,084 |
| Simon Property Group, Inc. | 470,100 | 106,732 |
| Apollo Global Management, LLC, Class A | 5,479,700 | 93,977 |
| Umpqua Holdings Corp. | 5,541,365 | 84,395 |
| Sun Hung Kai Properties Ltd. | 5,660,234 | 80,981 |
| Redwood Trust, Inc.1 | 5,444,717 | 77,696 |
| Fibra Uno Administración, SA de CV | 34,021,600 | 69,386 |
| National Australia Bank Ltd. | 3,360,000 | 67,768 |
| New York Community Bancorp, Inc. | 4,478,000 | 64,707 |
| Common stocks Financials (continued) |
Shares | Value (000) |
| Svenska Handelsbanken AB, Class A | 5,236,729 | $63,034 |
| AXA SA | 2,685,000 | 54,723 |
| Prudential PLC | 2,970,000 | 52,474 |
| 9,513,261 | ||
| Information technology 8.73% | ||
| Microsoft Corp. | 51,193,209 | 2,901,631 |
| Intel Corp. | 55,176,100 | 1,923,439 |
| Texas Instruments Inc. | 15,550,000 | 1,084,613 |
| Taiwan Semiconductor Manufacturing Co., Ltd. | 170,719,000 | 922,502 |
| Taiwan Semiconductor Manufacturing Co., Ltd. (ADR) | 2,166,470 | 60,184 |
| Analog Devices, Inc. | 14,616,091 | 932,945 |
| International Business Machines Corp. | 2,200,000 | 353,364 |
| Maxim Integrated Products, Inc. | 7,046,000 | 287,336 |
| Paychex, Inc. | 2,285,500 | 135,484 |
| Vanguard International Semiconductor Corp. | 67,990,000 | 123,103 |
| Quanta Computer Inc.4 | 33,916,655 | 68,953 |
| Cisco Systems, Inc. | 1,750,000 | 53,428 |
| Corporate Risk Holdings I, Inc.1,3,4 | 2,205,215 | 20,575 |
| Corporate Risk Holdings Corp.1,3,4 | 11,149 | — |
| 8,867,557 | ||
| Consumer staples 8.20% | ||
| Procter & Gamble Co. | 17,386,700 | 1,488,128 |
| Coca-Cola Co. | 26,901,000 | 1,173,691 |
| Philip Morris International Inc. | 10,668,607 | 1,069,635 |
| Reynolds American Inc. | 20,846,668 | 1,043,584 |
| Altria Group, Inc. | 12,191,000 | 825,331 |
| British American Tobacco PLC | 11,743,200 | 749,801 |
| Kellogg Co. | 5,550,000 | 459,040 |
| Nestlé SA | 4,395,000 | 352,344 |
| Hershey Co. | 3,000,000 | 332,280 |
| Kimberly-Clark Corp. | 1,575,000 | 204,041 |
| General Mills, Inc. | 2,835,000 | 203,808 |
| Kraft Heinz Co. | 2,278,000 | 196,796 |
| Campbell Soup Co. | 2,000,000 | 124,540 |
| Costco Wholesale Corp. | 630,000 | 105,349 |
| 8,328,368 | ||
| Health care 7.90% | ||
| Merck & Co., Inc. | 45,448,227 | 2,665,993 |
| Pfizer Inc. | 43,114,280 | 1,590,486 |
| GlaxoSmithKline PLC | 64,296,000 | 1,436,362 |
| AstraZeneca PLC | 10,916,583 | 729,312 |
| Bristol-Myers Squibb Co. | 7,670,738 | 573,848 |
| Eli Lilly and Co. | 6,174,000 | 511,763 |
| AbbVie Inc. | 4,200,000 | 278,166 |
| Novartis AG | 2,355,000 | 195,116 |
| Novartis AG (ADR) | 500,000 | 41,630 |
| Rotech Healthcare Inc.1,3,4 | 543,172 | 543 |
| 8,023,219 |
| Common stocks Consumer discretionary 5.70% |
Shares | Value (000) |
| McDonald’s Corp. | 16,029,280 | $1,885,845 |
| Home Depot, Inc. | 5,295,000 | 731,981 |
| Target Corp. | 9,450,000 | 711,868 |
| General Motors Co. | 15,248,112 | 480,925 |
| ProSiebenSat.1 Media SE | 6,645,000 | 303,776 |
| Hasbro, Inc. | 3,516,373 | 285,635 |
| Las Vegas Sands Corp. | 5,350,000 | 270,977 |
| Starwood Hotels & Resorts Worldwide, Inc. | 2,650,000 | 206,859 |
| Marks and Spencer Group PLC | 40,000,000 | 169,031 |
| Nokian Renkaat Oyj | 4,200,161 | 156,041 |
| Compass Group PLC | 7,411,761 | 140,859 |
| Pearson PLC | 9,850,000 | 114,977 |
| Charter Communications, Inc., Class A4 | 433,120 | 101,727 |
| Taylor Wimpey plc | 42,915,000 | 87,863 |
| Sands China Ltd. | 16,678,600 | 63,633 |
| SES SA, Class A (FDR) | 2,870,000 | 62,874 |
| TopBuild Corp.4 | 360,000 | 13,594 |
| Adelphia Recovery Trust, Series ACC-13,4 | 9,913,675 | 16 |
| 5,788,481 | ||
| Energy 4.58% | ||
| Chevron Corp. | 9,800,000 | 1,004,304 |
| Spectra Energy Corp | 27,235,500 | 979,661 |
| Royal Dutch Shell PLC, Class B | 21,362,147 | 566,000 |
| Royal Dutch Shell PLC, Class B (ADR) | 7,111,000 | 385,487 |
| BP PLC | 147,950,000 | 835,791 |
| ConocoPhillips | 9,450,000 | 385,749 |
| Coal India Ltd. | 38,878,615 | 190,374 |
| Helmerich & Payne, Inc. | 2,879,000 | 178,412 |
| Keyera Corp. | 4,235,000 | 121,570 |
| Southwestern Energy Co.4 | 287,764 | 4,196 |
| Denbury Resources Inc. | 270,000 | 783 |
| Ascent Resources - Utica, LLC, Class A3,4 | 86,629,567 | — |
| 4,652,327 | ||
| Telecommunication services 4.06% | ||
| Verizon Communications Inc. | 35,285,921 | 1,955,193 |
| Telstra Corp. Ltd. | 171,521,533 | 752,107 |
| Vodafone Group PLC | 135,700,000 | 412,254 |
| Vodafone Group PLC (ADR) | 1,000,000 | 30,900 |
| AT&T Inc. | 10,170,000 | 440,259 |
| NTT DoCoMo, Inc. | 8,090,000 | 217,998 |
| TalkTalk Telecom Group PLC1 | 58,421,891 | 177,059 |
| Deutsche Telekom AG | 6,000,000 | 102,130 |
| NII Holdings, Inc.1,4 | 7,694,703 | 23,392 |
| Mobile TeleSystems OJSC (ADR) | 2,270,000 | 20,180 |
| 4,131,472 | ||
| Materials 3.55% | ||
| E.I. du Pont de Nemours and Co. | 14,953,953 | 1,034,365 |
| Dow Chemical Co. | 14,804,900 | 794,579 |
| LyondellBasell Industries NV | 6,190,000 | 465,859 |
| BASF SE | 4,500,000 | 353,478 |
| WestRock Co. | 7,394,832 | 317,312 |
| Air Products and Chemicals, Inc. | 2,048,886 | 306,145 |
| Common stocks Materials (continued) |
Shares | Value (000) |
| Potash Corp. of Saskatchewan Inc. | 10,400,000 | $162,240 |
| Amcor Ltd. | 7,785,000 | 88,861 |
| Rio Tinto PLC | 2,500,000 | 81,442 |
| Warrior Met Coal, LLC, Class B3,4,5 | 45,477 | 5,548 |
| Warrior Met Coal, LLC, Class A3,4,5 | 17,859 | 2,179 |
| 3,612,008 | ||
| Utilities 3.34% | ||
| Power Assets Holdings Ltd. | 78,458,500 | 768,061 |
| Duke Energy Corp. | 7,854,999 | 672,309 |
| Dominion Resources, Inc. | 7,335,000 | 572,277 |
| EDP - Energias de Portugal, SA | 91,826,149 | 314,966 |
| Enel SPA | 68,062,000 | 313,352 |
| DTE Energy Co. | 2,500,000 | 243,800 |
| HK Electric Investments and HK Electric Investments Ltd., units | 230,870,000 | 221,098 |
| SSE PLC | 7,975,487 | 160,016 |
| PG&E Corp. | 1,492,607 | 95,437 |
| Ratchaburi Electricity Generating Holding PCL | 11,646,844 | 17,305 |
| National Grid PLC | 1,100,000 | 15,766 |
| 3,394,387 | ||
| Miscellaneous 3.87% | ||
| Other common stocks in initial period of acquisition | 3,931,005 | |
| Total common stocks (cost: $53,173,564,000) | 70,092,690 | |
| Preferred securities 0.46% Financials 0.46% |
||
| Citigroup Inc., Series K, depositary shares | 2,463,848 | 73,349 |
| Citigroup Inc. 7.875% preferred | 2,637,610 | 69,079 |
| Vornado Realty Trust, Series I, 6.625% | 3,380,000 | 87,035 |
| PNC Financial Services Group, Inc., Series P, noncumulative depositary shares | 2,000,000 | 60,640 |
| U.S. Bancorp, Series G, noncumulative convertible preferred | 2,270,400 | 59,098 |
| Wells Fargo & Co., Class A, Series Q, 5.85% depositary shares preferred noncumulative | 1,600,000 | 44,672 |
| HSBC Holdings PLC, Series 2, 8.00% | 1,505,000 | 40,379 |
| Goldman Sachs Group, Inc., Series J, 5.50% depositary shares | 1,200,000 | 32,484 |
| Total preferred securities (cost: $429,622,000) | 466,736 | |
| Rights & warrants 0.00% Energy 0.00% |
||
| Gener8 Maritime, Inc., warrants, expire 20173,4,5 | 8,514 | — |
| Total rights & warrants (cost: $2,171,000) | — | |
| Convertible stocks 0.61% Financials 0.21% |
||
| American Tower Corp., Series B, 5.50% depository share, convertible preferred 2018 | 1,375,000 | 152,144 |
| American Tower Corp., Series A, convertible preferred | 600,000 | 67,578 |
| 219,722 |
| Convertible stocks Telecommunication services 0.19% |
Shares | Value (000) |
| Frontier Communications Corp., Series A, convertible preferred | 1,925,000 | $190,344 |
| Materials 0.09% | ||
| Alcoa Inc., Class B, Series 1, cummulative convertible preferred 2017 | 2,500,000 | 90,500 |
| Energy 0.07% | ||
| Southwestern Energy Co., Series B, 6.25% convertible preferred 2018 | 2,060,000 | 68,701 |
| Consumer staples 0.03% | ||
| Bunge Ltd. 4.875% convertible preferred | 322,700 | 32,238 |
| Industrials 0.02% | ||
| CEVA Group PLC, Series A-1, 3.68% convertible preferred1,2,3,4 | 29,937 | 13,621 |
| CEVA Group PLC, Series A-2, 2.68% convertible preferred1,2,3,4 | 13,633 | 4,567 |
| 18,188 | ||
| Total convertible stocks (cost: $693,340,000) | 619,693 | |
| Convertible bonds 0.78% Financials 0.55% |
Principal amount (000) |
|
| Barclays PLC, Equity Linked Notes (Weyerhaeuser Co.), 4.52% 2016 | $ 4,206 | 135,309 |
| Barclays PLC, Equity Linked Notes (Weyerhaeuser Co.), 5.12% 2017 | 7,159 | 228,033 |
| Goldman Sachs, Equity Linked Notes (Costco Wholesale Corp.), 3.64% 2017 | 1,112 | 173,962 |
| Lloyds Banking Group PLC, convertible notes, 7.50% 2049 | 21,200 | 21,200 |
| 558,504 | ||
| Energy 0.00% | ||
| American Energy (Permian Basin), convertible notes, 8.00% 20223,5,6 | 24,453 | 2,935 |
| Miscellaneous 0.23% | ||
| Other convertible bonds in initial period of acquisition | 231,814 | |
| Total convertible bonds (cost: $773,704,000) | 793,253 | |
| Bonds, notes & other debt instruments 22.27% Corporate bonds & notes 14.16% Financials 2.36% |
||
| ACE INA Holdings Inc. 2.30% 2020 | 4,485 | 4,635 |
| ACE INA Holdings Inc. 2.875% 2022 | 9,345 | 9,866 |
| ACE INA Holdings Inc. 3.15% 2025 | 9,885 | 10,540 |
| ACE INA Holdings Inc. 3.35% 2026 | 9,345 | 10,097 |
| ACE INA Holdings Inc. 4.35% 2045 | 1,395 | 1,657 |
| Alexandria Real Estate Equities, Inc. 2.75% 2020 | 795 | 803 |
| Alexandria Real Estate Equities, Inc. 3.90% 2023 | 1,600 | 1,671 |
| Alexandria Real Estate Equities, Inc. 4.30% 2026 | 2,200 | 2,359 |
| Alexandria Real Estate Equities, Inc. 4.50% 2029 | 1,355 | 1,432 |
| American Campus Communities, Inc. 3.35% 2020 | 3,380 | 3,520 |
| American Campus Communities, Inc. 3.75% 2023 | 3,985 | 4,178 |
| Bonds, notes & other debt instruments Corporate bonds & notes (continued) Financials (continued) |
Principal amount (000) |
Value (000) |
| American Campus Communities, Inc. 4.125% 2024 | $19,700 | $20,998 |
| American Express Co. 6.15% 2017 | 12,610 | 13,279 |
| American Express Credit Co. 1.55% 2017 | 4,525 | 4,547 |
| American International Group, Inc. 3.875% 2035 | 3,000 | 2,938 |
| American Tower Corp. 3.40% 2019 | 6,400 | 6,707 |
| American Tower Corp. 7.25% 2019 | 15,025 | 17,038 |
| Bank of America Corp. 5.75% 2017 | 8,100 | 8,553 |
| Bank of America Corp. 5.625% 2020 | 9,000 | 10,219 |
| Bank of America Corp. 2.625% 2021 | 27,353 | 27,900 |
| Bank of America Corp. 5.00% 2021 | 3,500 | 3,942 |
| Bank of America Corp. 3.50% 2026 | 9,847 | 10,304 |
| Bank of America Corp., Series AA, 6.10% (undated) | 11,175 | 11,698 |
| Bank of America Corp., Series DD, 6.30% (undated) | 6,560 | 7,165 |
| Bank of America Corp. junior subordinated 6.25% noncumulative (undated) | 5,525 | 5,794 |
| Bank of America Corp., Series M, junior subordinated 8.125% noncumulative (undated) | 30,924 | 31,658 |
| Barclays Bank PLC 3.25% 2021 | 8,600 | 8,735 |
| Barclays Bank PLC 3.65% 2025 | 10,000 | 9,896 |
| BB&T Corp. 1.45% 2019 | 8,780 | 8,818 |
| BB&T Corp. 2.45% 2020 | 19,000 | 19,599 |
| Berkshire Hathaway Inc. 2.90% 2020 | 6,000 | 6,361 |
| Berkshire Hathaway Inc. 2.20% 2021 | 1,790 | 1,854 |
| Berkshire Hathaway Inc. 3.125% 2026 | 2,355 | 2,511 |
| BNP Paribas 4.375% 20265 | 18,125 | 18,702 |
| BPCE SA group 2.65% 2021 | 4,000 | 4,125 |
| BPCE SA group 5.70% 20235 | 20,500 | 22,399 |
| BPCE SA group 5.15% 20245 | 10,060 | 10,654 |
| Brandywine Operating Partnership, LP 5.70% 2017 | 20 | 21 |
| Brandywine Operating Partnership, LP 3.95% 2023 | 1,729 | 1,773 |
| CIT Group Inc. 4.25% 2017 | 9,000 | 9,196 |
| CIT Group Inc. 5.00% 2017 | 11,000 | 11,250 |
| CIT Group Inc. 3.875% 2019 | 71,030 | 72,628 |
| CIT Group Inc., Series C, 5.50% 20195 | 13,650 | 14,503 |
| Citigroup Inc. 2.05% 2019 | 10,500 | 10,619 |
| Citigroup Inc. 8.50% 2019 | 4,894 | 5,784 |
| Citigroup Inc. 2.35% 2021 | 13,000 | 13,075 |
| Citigroup Inc. 2.70% 2021 | 10,500 | 10,722 |
| Citigroup Inc. 3.70% 2026 | 5,000 | 5,317 |
| Citigroup Inc. 4.125% 2028 | 19,890 | 20,339 |
| Citigroup Inc., Series P, 5.95% (undated) | 18,390 | 18,959 |
| Citigroup Inc., Series T, 6.25% (undated) | 4,650 | 5,016 |
| Citigroup Inc., Series A, junior subordinated 5.95% (undated) | 13,295 | 13,649 |
| Citigroup Inc., Series Q, junior subordinated 5.95% (undated) | 10,675 | 10,722 |
| CNA Financial Corp. 3.95% 2024 | 5,000 | 5,329 |
| Communications Sales & Leasing, Inc. 6.00% 20235 | 16,450 | 17,016 |
| Communications Sales & Leasing, Inc. 8.25% 2023 | 17,213 | 17,665 |
| Corporate Office Properties LP 5.25% 2024 | 9,630 | 10,460 |
| Corporate Office Properties LP 5.00% 2025 | 4,145 | 4,452 |
| Corporate Office Properties Trust 3.60% 2023 | 320 | 319 |
| Credit Agricole SA 4.375% 20255 | 21,920 | 22,446 |
| Credit Suisse Group AG 3.45% 20215 | 8,750 | 8,895 |
| Credit Suisse Group AG 3.80% 20235 | 14,925 | 15,171 |
| Crescent Resources 10.25% 20175 | 42,046 | 42,072 |
| Crown Castle International Corp. 4.875% 2022 | 9,800 | 10,877 |
| DCT Industrial Trust Inc. 4.50% 2023 | 5,570 | 5,932 |
| Bonds, notes & other debt instruments Corporate bonds & notes (continued) Financials (continued) |
Principal amount (000) |
Value (000) |
| DDR Corp. 3.625% 2025 | $5,000 | $5,080 |
| Developers Diversified Realty Corp. 7.50% 2017 | 38,892 | 40,359 |
| Developers Diversified Realty Corp. 4.75% 2018 | 5,000 | 5,229 |
| Developers Diversified Realty Corp. 7.875% 2020 | 6,505 | 7,883 |
| Discover Financial Services 3.45% 2026 | 4,318 | 4,361 |
| DNB ASA 2.375% 20215 | 11,400 | 11,682 |
| EPR Properties 4.50% 2025 | 7,945 | 8,094 |
| ERP Operating LP 7.125% 2017 | 10,000 | 10,689 |
| Essex Portfolio L.P. 3.625% 2022 | 9,550 | 10,115 |
| Essex Portfolio L.P. 3.25% 2023 | 4,400 | 4,548 |
| Essex Portfolio L.P. 3.875% 2024 | 5,900 | 6,334 |
| Essex Portfolio L.P. 3.375% 2026 | 1,005 | 1,042 |
| Gaming and Leisure Properties, Inc. 4.375% 2021 | 1,700 | 1,774 |
| Gaming and Leisure Properties, Inc. 5.375% 2026 | 11,400 | 12,184 |
| Goldman Sachs Group, Inc. 2.55% 2019 | 16,200 | 16,613 |
| Goldman Sachs Group, Inc. 2.60% 2020 | 7,900 | 8,093 |
| Goldman Sachs Group, Inc. 5.25% 2021 | 3,000 | 3,407 |
| Goldman Sachs Group, Inc. 5.75% 2022 | 20,000 | 23,310 |
| Goldman Sachs Group, Inc. 4.75% 2045 | 4,455 | 5,098 |
| Goldman Sachs Group, Inc. 5.15% 2045 | 900 | 992 |
| Goldman Sachs Group, Inc. 5.30% (undated) | 14,825 | 15,103 |
| HBOS PLC 6.75% 20185 | 17,300 | 18,675 |
| Hospitality Properties Trust 5.625% 2017 | 8,684 | 8,884 |
| Hospitality Properties Trust 6.70% 2018 | 12,625 | 13,179 |
| Hospitality Properties Trust 4.25% 2021 | 20,500 | 21,484 |
| Hospitality Properties Trust 5.00% 2022 | 6,500 | 7,051 |
| Hospitality Properties Trust 4.50% 2023 | 11,060 | 11,413 |
| Hospitality Properties Trust 4.50% 2025 | 5,940 | 6,049 |
| Host Hotels & Resorts LP 4.50% 2026 | 5,675 | 6,069 |
| HSBC Holdings PLC 2.95% 2021 | 14,000 | 14,263 |
| HSBC Holdings PLC 4.25% 2024 | 9,000 | 9,394 |
| HSBC Holdings PLC 4.30% 2026 | 6,755 | 7,255 |
| HSBK (Europe) BV 7.25% 20175 | 8,790 | 9,075 |
| Icahn Enterprises Finance Corp. 3.50% 2017 | 23,075 | 23,075 |
| Intercontinentalexchange, Inc. 2.50% 2018 | 12,000 | 12,336 |
| Intesa Sanpaolo SpA 5.017% 20245 | 41,610 | 39,883 |
| Iron Mountain Inc. 6.00% 20201,5 | 31,925 | 33,761 |
| Iron Mountain Inc. 6.00% 20231 | 950 | 1,014 |
| Iron Mountain Inc. 5.75% 20241 | 4,325 | 4,464 |
| iStar Financial Inc. 4.00% 2017 | 28,625 | 28,518 |
| iStar Financial Inc. 4.875% 2018 | 11,575 | 11,503 |
| iStar Financial Inc. 5.00% 2019 | 14,275 | 14,132 |
| iStar Financial Inc., Series B, 9.00% 2017 | 37,360 | 38,948 |
| JPMorgan Chase & Co. 1.35% 2017 | 4,240 | 4,250 |
| JPMorgan Chase & Co. 2.25% 2020 | 10,000 | 10,204 |
| JPMorgan Chase & Co. 2.55% 2020 | 11,150 | 11,450 |
| JPMorgan Chase & Co. 2.40% 2021 | 14,000 | 14,266 |
| JPMorgan Chase & Co. 2.95% 2026 | 10,000 | 10,114 |
| JPMorgan Chase & Co., Series Z, junior subordinated 5.30% (undated) | 36,425 | 37,591 |
| JPMorgan Chase & Co., Series S, junior subordinated 6.75% (undated) | 36,535 | 41,190 |
| JPMorgan Chase & Co., Series I, junior subordinated 7.90% (undated) | 74,825 | 77,912 |
| Keybank National Association 2.50% 2019 | 9,000 | 9,268 |
| Kimco Realty Corp. 5.70% 2017 | 17,250 | 17,826 |
| Kimco Realty Corp. 6.875% 2019 | 10,000 | 11,516 |
| Bonds, notes & other debt instruments Corporate bonds & notes (continued) Financials (continued) |
Principal amount (000) |
Value (000) |
| Kimco Realty Corp. 3.40% 2022 | $5,460 | $5,758 |
| Leucadia National Corp. 5.50% 2023 | 13,255 | 13,847 |
| Liberty Mutual Group Inc. 4.25% 20235 | 4,400 | 4,716 |
| Liberty Mutual Group Inc., Series A, 7.80% 20875 | 19,415 | 21,648 |
| Lloyds Banking Group PLC 2.30% 2018 | 3,625 | 3,674 |
| Lloyds Banking Group PLC 4.50% 2024 | 9,000 | 9,355 |
| Lloyds Banking Group PLC 4.582% 20255 | 7,000 | 7,161 |
| MetLife Capital Trust IV, junior subordinated 7.875% 20675 | 14,430 | 17,958 |
| MetLife Capital Trust X, junior subordinated 9.25% 20685 | 500 | 716 |
| MetLife Global Funding I 2.30% 20195 | 8,435 | 8,631 |
| MetLife Global Funding I 2.00% 20205 | 5,135 | 5,205 |
| MetLife Global Funding I 2.50% 20205 | 4,000 | 4,147 |
| MetLife, Inc. 5.25% 2049 | 10,000 | 10,033 |
| Morgan Stanley 2.50% 2021 | 13,625 | 13,801 |
| Morgan Stanley 3.875% 2026 | 11,000 | 11,769 |
| Morgan Stanley 3.125% 2026 | 19,156 | 19,398 |
| Nationwide Mutual Insurance Co. 2.923% 20245,7 | 8,150 | 8,089 |
| Navient Corp. 4.875% 2019 | 2,240 | 2,257 |
| Navient Corp. 6.625% 2021 | 2,845 | 2,886 |
| New York Life Global Funding 2.10% 20195 | 11,000 | 11,222 |
| New York Life Global Funding 1.95% 20205 | 1,820 | 1,847 |
| PNC Bank 2.40% 2019 | 7,825 | 8,065 |
| PNC Financial Services Group, Inc. 2.854% 2022 | 8,395 | 8,649 |
| PNC Financial Services Group, Inc. 3.90% 2024 | 3,000 | 3,269 |
| PNC Financial Services Group, Inc., Series O, junior subordinated 6.75% (undated) | 10,250 | 11,531 |
| PNC Preferred Funding Trust I, junior subordinated 2.303% (undated)5,7 | 23,800 | 22,223 |
| Prologis, Inc. 3.35% 2021 | 1,950 | 2,071 |
| Prologis, Inc. 4.25% 2023 | 25,000 | 27,929 |
| Prologis, Inc. 3.75% 2025 | 1,520 | 1,650 |
| Prudential Financial, Inc. 3.50% 2024 | 9,000 | 9,467 |
| QBE Insurance Group Ltd. 2.40% 20185 | 16,910 | 17,050 |
| Rabobank Nederland 2.25% 2019 | 8,000 | 8,164 |
| Rabobank Nederland 2.50% 2021 | 6,525 | 6,740 |
| Rabobank Nederland 4.625% 2023 | 8,000 | 8,598 |
| Rabobank Nederland 4.375% 2025 | 9,000 | 9,517 |
| RBS Capital Trust II 6.425% noncumulative trust (undated) | 6,005 | 6,275 |
| Realogy Corp. 4.50% 20195 | 32,550 | 33,893 |
| Realogy Corp. 5.25% 20215 | 27,600 | 28,980 |
| Realogy Corp. 4.875% 20235 | 7,825 | 7,981 |
| Royal Bank of Scotland Group PLC, junior subordinated 6.99% (undated)5 | 12,735 | 14,123 |
| Scentre Group 2.375% 20215 | 4,575 | 4,646 |
| Scentre Group 3.25% 20255 | 3,140 | 3,224 |
| Scentre Group 3.50% 20255 | 10,455 | 10,945 |
| Select Income REIT 3.60% 2020 | 5,775 | 5,886 |
| Select Income REIT 4.15% 2022 | 3,300 | 3,328 |
| Select Income REIT 4.50% 2025 | 2,540 | 2,526 |
| Skandinaviska Enskilda 2.625% 2021 | 10,500 | 10,903 |
| SMFG Preferred Capital USD 3 Ltd., junior subordinated 9.50% 20495 | 67,890 | 77,819 |
| Société Générale, junior subordinated 5.922% (undated)5 | 45,073 | 46,087 |
| Synovus Financial Corp. 7.875% 2019 | 23,506 | 26,297 |
| Travelers Companies, Inc. 3.75% 2046 | 700 | 758 |
| UBS Group AG 2.95% 20205 | 10,000 | 10,303 |
| UBS Group AG 4.125% 20255 | 4,425 | 4,675 |
| Unum Group 7.125% 2016 | 6,740 | 6,804 |
| Bonds, notes & other debt instruments Corporate bonds & notes (continued) Financials (continued) |
Principal amount (000) |
Value (000) |
| US Bancorp. 3.70% 2024 | $10,000 | $11,095 |
| US Bancorp. 2.375% 2026 | 6,000 | 6,019 |
| WEA Finance LLC 2.70% 20195 | 8,525 | 8,736 |
| WEA Finance LLC 3.25% 20205 | 10,195 | 10,640 |
| WEA Finance LLC 3.75% 20245 | 4,400 | 4,653 |
| Wells Fargo & Co. 1.286% 20197 | 9,311 | 9,346 |
| Wells Fargo & Co. 2.55% 2020 | 4,350 | 4,484 |
| Wells Fargo & Co. 2.10% 2021 | 19,900 | 20,016 |
| Wells Fargo & Co. 2.50% 2021 | 15,000 | 15,406 |
| Wells Fargo & Co. 4.60% 2021 | 45,000 | 50,326 |
| Wells Fargo & Co. 4.90% 2045 | 10,000 | 11,369 |
| Wells Fargo & Co., Series K, junior subordinated 7.98% (undated) | 86,566 | 92,175 |
| 2,398,120 | ||
| Consumer discretionary 2.20% | ||
| 21st Century Fox America, Inc. 4.95% 2045 | 415 | 495 |
| Amazon.com, Inc. 4.80% 2034 | 12,000 | 14,399 |
| American Honda Finance Corp. 2.25% 2019 | 8,500 | 8,768 |
| American Honda Finance Corp. 1.20% 2019 | 11,000 | 11,014 |
| American Honda Finance Corp. 1.65% 2021 | 8,850 | 8,890 |
| Bayerische Motoren Werke AG 2.00% 20215 | 2,000 | 2,036 |
| Boyd Gaming Corp. 9.00% 2020 | 33,000 | 34,768 |
| Boyd Gaming Corp. 6.875% 2023 | 16,125 | 17,334 |
| Burger King Corp. 4.625% 20225 | 9,000 | 9,293 |
| Burger King Corp. 6.00% 20225 | 26,025 | 27,359 |
| Cablevision Systems Corp. 7.75% 2018 | 20,800 | 22,334 |
| Cablevision Systems Corp. 8.00% 2020 | 20,000 | 20,900 |
| Cablevision Systems Corp. 6.75% 2021 | 21,499 | 22,896 |
| Carnival Corp. 3.95% 2020 | 11,290 | 12,232 |
| CBS Corp. 1.95% 2017 | 5,000 | 5,035 |
| CBS Outdoor Americas Inc. 5.25% 20221 | 29,500 | 30,569 |
| CBS Outdoor Americas Inc. 5.625% 20241 | 3,396 | 3,596 |
| CCO Holdings LLC and CCO Holdings Capital Corp. 3.579% 20205 | 11,045 | 11,636 |
| CCO Holdings LLC and CCO Holdings Capital Corp. 4.464% 20225 | 9,715 | 10,565 |
| CCO Holdings LLC and CCO Holdings Capital Corp. 6.625% 2022 | 1,400 | 1,482 |
| CCO Holdings LLC and CCO Holdings Capital Corp. 4.908% 20255 | 40,510 | 44,825 |
| CCO Holdings LLC and CCO Holdings Capital Corp. 5.50% 20265 | 14,350 | 15,014 |
| CCO Holdings LLC and CCO Holdings Capital Corp. 5.75% 20265 | 68,675 | 72,624 |
| CCO Holdings LLC and CCO Holdings Capital Corp. 6.384% 20355 | 5,750 | 6,790 |
| CCO Holdings LLC and CCO Holdings Capital Corp. 6.484% 20455 | 4,475 | 5,392 |
| Cengage Learning Acquisitions, Inc., Term Loan B, 5.25% 20237,8,9 | 4,949 | 4,946 |
| Cengage Learning Acquisitions, Inc. 9.50% 20245 | 3,375 | 3,548 |
| Clear Channel Worldwide Holdings, Inc. 7.625% 2020 | 51,735 | 51,735 |
| Comcast Corp. 2.35% 2027 | 5,220 | 5,243 |
| Comcast Corp. 6.45% 2037 | 25,000 | 35,303 |
| Comcast Corp. 4.75% 2044 | 4,855 | 5,893 |
| Cox Communications, Inc. 5.875% 20165 | 25,000 | 25,370 |
| Cumulus Media Holdings Inc. 7.75% 2019 | 34,160 | 14,518 |
| Cumulus Media Inc., Term Loan B, 4.25% 20207,8,9 | 10,624 | 7,550 |
| DaimlerChrysler North America Holding Corp. 2.625% 20165 | 2,000 | 2,004 |
| DaimlerChrysler North America Holding Corp. 1.375% 20175 | 8,585 | 8,578 |
| DaimlerChrysler North America Holding Corp. 1.50% 20195 | 11,000 | 11,004 |
| DaimlerChrysler North America Holding Corp. 2.25% 20195 | 14,000 | 14,317 |
| DaimlerChrysler North America Holding Corp. 2.25% 20205 | 10,660 | 10,904 |
| Bonds, notes & other debt instruments Corporate bonds & notes (continued) Consumer discretionary (continued) |
Principal amount (000) |
Value (000) |
| DaimlerChrysler North America Holding Corp. 2.00% 20215 | $10,600 | $10,671 |
| DaimlerChrysler North America Holding Corp. 3.25% 20245 | 770 | 815 |
| DaimlerChrysler North America Holding Corp. 3.30% 20255 | 2,000 | 2,127 |
| DaimlerChrysler North America Holding Corp. 8.50% 2031 | 2,000 | 3,338 |
| Delta 2 (Formula One), Term Loan B, 7.75% 20227,8,9 | 18,825 | 18,558 |
| DISH DBS Corp. 4.625% 2017 | 23,825 | 24,421 |
| DISH DBS Corp. 4.25% 2018 | 15,450 | 15,894 |
| DISH DBS Corp. 7.875% 2019 | 1,425 | 1,578 |
| Family Tree Escrow LLC 5.25% 20205 | 4,025 | 4,206 |
| Family Tree Escrow LLC 5.75% 20235 | 16,550 | 17,957 |
| Federated Department Stores, Inc. 6.90% 2029 | 7,925 | 8,924 |
| Ford Motor Credit Co. 8.00% 2016 | 1,500 | 1,538 |
| Ford Motor Credit Co. 2.145% 2018 | 8,170 | 8,240 |
| Ford Motor Credit Co. 2.375% 2018 | 10,905 | 11,038 |
| Ford Motor Credit Co. 2.597% 2019 | 7,270 | 7,435 |
| Ford Motor Credit Co. 2.943% 2019 | 9,000 | 9,255 |
| Ford Motor Credit Co. 3.157% 2020 | 10,000 | 10,336 |
| Ford Motor Credit Co. 3.219% 2022 | 16,000 | 16,624 |
| Ford Motor Credit Co. 4.375% 2023 | 8,850 | 9,674 |
| Ford Motor Credit Co. 3.664% 2024 | 7,000 | 7,317 |
| Ford Motor Credit Co. 4.134% 2025 | 5,000 | 5,361 |
| Ford Motor Credit Co. 4.389% 2026 | 2,000 | 2,204 |
| GameStop Corp. 6.75% 20215 | 5,625 | 5,695 |
| Gannett Co., Inc. 5.125% 2019 | 7,925 | 8,202 |
| Gannett Co., Inc. 4.875% 20215 | 9,235 | 9,604 |
| Gannett Co., Inc. 5.50% 20245 | 6,500 | 6,833 |
| General Motors Co. 4.00% 2025 | 5,740 | 5,940 |
| General Motors Co. 6.60% 2036 | 13,260 | 16,458 |
| General Motors Co. 5.20% 2045 | 8,000 | 8,618 |
| General Motors Co. 6.75% 2046 | 14,185 | 18,511 |
| General Motors Financial Co. 6.75% 2018 | 2,760 | 3,001 |
| General Motors Financial Co. 3.50% 2019 | 8,795 | 9,104 |
| General Motors Financial Co. 3.70% 2020 | 2,725 | 2,828 |
| General Motors Financial Co. 3.20% 2021 | 10,250 | 10,420 |
| General Motors Financial Co. 4.375% 2021 | 21,275 | 22,826 |
| General Motors Financial Co. 3.45% 2022 | 33,990 | 34,736 |
| General Motors Financial Co. 5.25% 2026 | 5,295 | 5,925 |
| Goodyear Tire & Rubber Co. 5.00% 2026 | 9,625 | 10,166 |
| Hilton Worldwide Finance LLC 5.625% 2021 | 9,565 | 9,917 |
| Hilton Worldwide, Term Loan B, 3.50% 20207,8,9 | 14,579 | 14,634 |
| Home Depot, Inc. 5.95% 2041 | 12,500 | 17,756 |
| Hyundai Capital America 2.00% 20195 | 5,070 | 5,107 |
| Hyundai Capital America 2.60% 20205 | 3,250 | 3,323 |
| Hyundai Capital America 3.00% 20205 | 2,000 | 2,080 |
| Hyundai Capital America 2.45% 20215 | 14,000 | 14,238 |
| iHeartCommunications, Inc. 10.625% 2023 | 10,020 | 7,690 |
| International Game Technology 6.25% 20225 | 14,000 | 14,735 |
| Limited Brands, Inc. 8.50% 2019 | 16,105 | 18,883 |
| Limited Brands, Inc. 7.00% 2020 | 21,271 | 24,568 |
| Limited Brands, Inc. 6.625% 2021 | 23,754 | 27,377 |
| Limited Brands, Inc. 6.875% 2035 | 19,625 | 20,910 |
| Lowe’s Companies, Inc. 2.50% 2026 | 3,115 | 3,199 |
| McClatchy Co. 9.00% 2022 | 9,850 | 10,121 |
| McDonald’s Corp. 2.75% 2020 | 625 | 655 |
| Bonds, notes & other debt instruments Corporate bonds & notes (continued) Consumer discretionary (continued) |
Principal amount (000) |
Value (000) |
| McDonald’s Corp. 3.70% 2026 | $1,355 | $1,489 |
| McDonald’s Corp. 4.875% 2045 | 2,165 | 2,600 |
| McGraw-Hill Global Education Holdings, LLC, Term Loan B, 5.00% 20227,8,9 | 14,940 | 15,037 |
| McGraw-Hill Global Education Holdings, LLC 7.875% 20245 | 2,825 | 2,973 |
| Mediacom Broadband LLC and Mediacom Broadband Corp. 5.50% 2021 | 17,225 | 17,806 |
| Mediacom LLC and Mediacom Capital Corp. 7.25% 2022 | 7,775 | 8,193 |
| MGM Growth Properties LLC 5.625% 20245 | 7,350 | 7,890 |
| MGM Resorts International 8.625% 2019 | 10,000 | 11,375 |
| MGM Resorts International 6.75% 2020 | 7,350 | 8,159 |
| MGM Resorts International 7.75% 2022 | 17,000 | 19,642 |
| Michaels Stores, Inc. 5.875% 20205 | 14,125 | 14,708 |
| Mohegan Tribal Gaming Authority 11.00% 20185,6 | 4,318 | 4,330 |
| Myriad International Holdings 6.375% 20175 | 12,500 | 12,985 |
| Myriad International Holdings 6.375% 2017 | 2,500 | 2,597 |
| Myriad International Holdings 6.00% 20205 | 45,655 | 50,332 |
| Myriad International Holdings 6.00% 2020 | 25,705 | 28,338 |
| Myriad International Holdings 5.50% 2025 | 6,140 | 6,574 |
| NBC Universal Enterprise, Inc. 1.365% 20185,7 | 8,625 | 8,678 |
| NBC Universal Enterprise, Inc. 5.25% 20495 | 37,105 | 39,072 |
| NCL Corp. Ltd. 5.25% 20195 | 8,050 | 8,271 |
| Needle Merger Sub Corp. 8.125% 20195 | 33,920 | 33,284 |
| Neiman Marcus Group LTD Inc. 8.00% 20215 | 49,730 | 42,400 |
| Neiman Marcus Group LTD Inc. 8.75% 20215,6 | 14,555 | 11,571 |
| Neiman Marcus, Term Loan B, 4.25% 20207,8,9 | 36,520 | 34,463 |
| Newell Rubbermaid Inc. 2.60% 2019 | 6,450 | 6,638 |
| Newell Rubbermaid Inc. 3.15% 2021 | 22,180 | 23,299 |
| Newell Rubbermaid Inc. 3.85% 2023 | 11,335 | 12,135 |
| Newell Rubbermaid Inc. 4.20% 2026 | 23,990 | 26,257 |
| Newell Rubbermaid Inc. 5.50% 2046 | 50,690 | 63,150 |
| PETCO Animal Supplies, Inc., Term Loan B-1, 5.00% 20237,8,9 | 6,666 | 6,705 |
| PETsMART, Inc. 7.125% 20235 | 29,025 | 30,440 |
| Playa Resorts Holding BV 8.00% 20205 | 24,490 | 25,010 |
| Playa Resorts Holding BV, Term Loan B, 4.00% 20197,8,9 | 5,346 | 5,324 |
| President & Fellows of Harvard College 3.619% 2037 | 10,000 | 11,183 |
| RCI Banque 3.50% 20185 | 13,150 | 13,544 |
| Sally Holdings LLC and Sally Capital Inc. 5.625% 2025 | 11,325 | 12,231 |
| Schaeffler Finance BV 4.75% 20215 | 2,626 | 2,728 |
| Schaeffler Finance BV 4.25% 20215 | 7,070 | 7,282 |
| Schaeffler Holding Finance BV 7.625% 20185,6 | 2,186 | 2,238 |
| Schaeffler Holding Finance BV 6.25% 20195,6 | 11,735 | 12,234 |
| Seminole Tribe of Florida 6.535% 20205,9 | 7,580 | 7,618 |
| Sotheby’s Holdings, Inc. 5.25% 20225 | 7,775 | 7,425 |
| Standard Pacific Corp. 8.375% 2021 | 2,475 | 2,937 |
| Starbucks Corp. 2.10% 2021 | 1,100 | 1,134 |
| Starbucks Corp. 2.70% 2022 | 2,140 | 2,262 |
| Starbucks Corp. 4.30% 2045 | 3,120 | 3,790 |
| TEGNA Inc. 5.125% 2020 | 1,936 | 2,014 |
| Tenneco Inc. 5.00% 2026 | 5,050 | 5,176 |
| Thomson Reuters Corp. 1.30% 2017 | 1,510 | 1,511 |
| Thomson Reuters Corp. 1.65% 2017 | 4,350 | 4,368 |
| Thomson Reuters Corp. 4.30% 2023 | 1,285 | 1,416 |
| Thomson Reuters Corp. 5.65% 2043 | 1,425 | 1,726 |
| TI Automotive Ltd. 8.75% 20235 | 9,785 | 10,103 |
| Time Warner Cable Inc. 6.75% 2018 | 18,630 | 20,438 |
| Bonds, notes & other debt instruments Corporate bonds & notes (continued) Consumer discretionary (continued) |
Principal amount (000) |
Value (000) |
| Time Warner Cable Inc. 5.00% 2020 | $35,000 | $38,308 |
| Time Warner Inc. 4.75% 2021 | 15,000 | 16,916 |
| Time Warner Inc. 3.60% 2025 | 14,500 | 15,669 |
| Toyota Motor Credit Corp. 1.45% 2018 | 2,000 | 2,011 |
| Toyota Motor Credit Corp. 1.70% 2019 | 2,000 | 2,029 |
| Toyota Motor Credit Corp. 2.15% 2020 | 15,000 | 15,404 |
| Univision Communications Inc. 8.50% 20215 | 7,190 | 7,548 |
| Univision Communications Inc. 6.75% 20225 | 6,530 | 7,003 |
| Univision Communications Inc. 5.125% 20235 | 1,250 | 1,291 |
| Univision Communications Inc. 5.125% 20255 | 1,305 | 1,347 |
| Univision Communications Inc., Term Loan C3, 4.00% 20207,8,9 | 16,872 | 16,887 |
| Virgin Media Secured Finance PLC 5.375% 20215,9 | 15,840 | 16,533 |
| Volkswagen International Finance NV 2.375% 20175 | 14,500 | 14,597 |
| Warner Music Group 6.00% 20215 | 15,146 | 15,809 |
| Warner Music Group 5.625% 20225 | 11,887 | 12,348 |
| Warner Music Group 6.75% 20225 | 8,000 | 8,440 |
| Warner Music Group 5.00% 20235 | 3,250 | 3,307 |
| WPP Finance 2010 3.75% 2024 | 2,000 | 2,144 |
| Wynn Las Vegas, LLC and Wynn Capital Corp. 5.375% 2022 | 6,725 | 6,923 |
| Wynn Las Vegas, LLC and Wynn Capital Corp. 4.25% 20235 | 8,225 | 7,886 |
| Wynn Las Vegas, LLC and Wynn Capital Corp. 5.50% 20255 | 5,000 | 5,044 |
| Wynn Macau, Ltd. 5.25% 20215 | 35,025 | 35,375 |
| YUM! Brands, Inc. 5.00% 20245 | 9,945 | 10,417 |
| YUM! Brands, Inc. 5.25% 20265 | 4,975 | 5,277 |
| ZF Friedrichshafen AG 4.00% 20205 | 5,065 | 5,293 |
| ZF Friedrichshafen AG 4.50% 20225 | 16,795 | 17,488 |
| ZF Friedrichshafen AG 4.75% 20255 | 21,530 | 22,580 |
| 2,231,687 | ||
| Energy 2.11% | ||
| American Energy (Marcellus), Term Loan B, 5.25% 20207,8,9 | 30,600 | 15,491 |
| American Energy (Marcellus), Term Loan A, 8.50% 20217,8,9 | 29,602 | 3,478 |
| American Energy (Permian Basin), 7.119% 20195,7 | 10,000 | 5,925 |
| American Energy (Permian Basin) 7.125% 20205 | 33,860 | 20,062 |
| American Energy (Permian Basin) 7.375% 20215 | 11,835 | 7,012 |
| Anadarko Petroleum Corp. 6.375% 2017 | 1,264 | 1,326 |
| Anadarko Petroleum Corp. 5.55% 2026 | 15,605 | 17,073 |
| Anadarko Petroleum Corp. 6.45% 2036 | 1,095 | 1,228 |
| Anadarko Petroleum Corp. 6.60% 2046 | 4,320 | 4,998 |
| APT Pipelines Ltd. 4.20% 20255 | 11,000 | 11,347 |
| Ascent Resources Utica, LLC, 15.00% 20193,6,7,8,9 | 14,537 | 5,597 |
| Baytex Energy Corp. 5.125% 20215 | 10,050 | 8,191 |
| Baytex Energy Corp. 5.625% 20245 | 3,450 | 2,743 |
| BG Energy Capital PLC 2.875% 20165 | 7,395 | 7,421 |
| Blue Racer Midstream LLC / Blue Racer Finance Corp. 6.125% 20225 | 9,810 | 9,270 |
| Boardwalk Pipeline Partners 3.375% 2023 | 3,000 | 2,796 |
| Boardwalk Pipelines, LP 4.95% 2024 | 6,705 | 6,646 |
| Canadian Natural Resources Ltd. 5.70% 2017 | 7,350 | 7,563 |
| Canadian Natural Resources Ltd. 3.80% 2024 | 1,440 | 1,423 |
| Canadian Natural Resources Ltd. 6.50% 2037 | 1,000 | 1,084 |
| Cenovus Energy Inc. 3.00% 2022 | 5,970 | 5,614 |
| Cenovus Energy Inc. 3.80% 2023 | 19,005 | 18,324 |
| Cheniere Energy, Inc. 7.00% 20245 | 16,400 | 17,200 |
| Chesapeake Energy Corp. 3.878% 20197 | 10,075 | 8,463 |
| Bonds, notes & other debt instruments Corporate bonds & notes (continued) Energy (continued) |
Principal amount (000) |
Value (000) |
| Chesapeake Energy Corp. 4.875% 2022 | $13,025 | $8,531 |
| Chevron Corp. 2.954% 2026 | 10,215 | 10,548 |
| Concho Resources Inc. 5.50% 2023 | 7,000 | 6,948 |
| ConocoPhillips 4.20% 2021 | 6,520 | 6,962 |
| ConocoPhillips 4.95% 2026 | 4,025 | 4,490 |
| ConocoPhillips 5.95% 2046 | 10,035 | 12,157 |
| CONSOL Energy Inc. 5.875% 2022 | 42,650 | 39,131 |
| DCP Midstream Operating LP 4.95% 2022 | 13,815 | 13,815 |
| Denbury Resources Inc. 9.00% 20215 | 7,713 | 7,752 |
| Devon Energy Corp. 2.25% 2018 | 3,600 | 3,602 |
| Devon Energy Corp. 5.00% 2045 | 7,815 | 7,237 |
| Diamond Offshore Drilling, Inc. 4.875% 2043 | 42,920 | 30,902 |
| Ecopetrol SA 5.875% 2023 | 2,820 | 2,954 |
| Ecopetrol SA 5.375% 2026 | 10,935 | 10,822 |
| Ecopetrol SA 5.875% 2045 | 2,115 | 1,880 |
| El Paso Pipeline Partners Operating Co., LLC 5.00% 2021 | 5,000 | 5,390 |
| El Paso Pipeline Partners Operating Co., LLC 4.70% 2042 | 33,265 | 30,044 |
| Enbridge Energy Partners, LP 9.875% 2019 | 10,500 | 12,258 |
| Enbridge Energy Partners, LP 4.375% 2020 | 16,770 | 17,510 |
| Enbridge Energy Partners, LP 5.875% 2025 | 23,370 | 25,762 |
| Enbridge Energy Partners, LP 5.50% 2040 | 1,200 | 1,214 |
| Enbridge Energy Partners, LP 7.375% 2045 | 36,315 | 44,286 |
| Enbridge Energy Partners, LP, Series B, 6.50% 2018 | 5,225 | 5,541 |
| Enbridge Energy Partners, LP, Series B, 7.50% 2038 | 6,000 | 7,340 |
| Enbridge Inc. 5.60% 2017 | 20,067 | 20,565 |
| Enbridge Inc. 4.00% 2023 | 25,525 | 25,650 |
| Enbridge Inc. 3.50% 2024 | 515 | 496 |
| Energy Transfer Partners, LP 4.15% 2020 | 5,000 | 5,196 |
| Energy Transfer Partners, LP 7.50% 2020 | 9,250 | 10,013 |
| Energy Transfer Partners, LP 5.875% 2024 | 11,800 | 11,895 |
| Energy Transfer Partners, LP 4.75% 2026 | 9,350 | 9,539 |
| Energy Transfer Partners, LP 5.50% 2027 | 15,480 | 15,122 |
| Energy Transfer Partners, LP 6.125% 2045 | 7,325 | 7,672 |
| EnLink Midstream Partners, LP 2.70% 2019 | 1,660 | 1,627 |
| EnLink Midstream Partners, LP 4.40% 2024 | 7,310 | 7,134 |
| EnLink Midstream Partners, LP 4.15% 2025 | 11,760 | 11,059 |
| EnLink Midstream Partners, LP 5.05% 2045 | 9,810 | 7,922 |
| Ensco PLC 5.20% 2025 | 11,300 | 7,698 |
| Ensco PLC 5.75% 2044 | 20,970 | 12,294 |
| Enterprise Products Operating LLC 5.20% 2020 | 3,910 | 4,422 |
| Enterprise Products Operating LLC 2.85% 2021 | 4,805 | 4,974 |
| Enterprise Products Operating LLC 3.95% 2027 | 2,255 | 2,382 |
| Enterprise Products Operating LLC 4.90% 2046 | 1,040 | 1,108 |
| EOG Resources, Inc. 4.15% 2026 | 3,830 | 4,204 |
| EP Energy Corp. 9.375% 2020 | 5,750 | 3,306 |
| EP Energy Corp. 6.375% 2023 | 8,200 | 4,141 |
| Extraction Oil & Gas Holdings LLC 7.875% 20215 | 2,900 | 2,907 |
| Genesis Energy, LP 6.75% 2022 | 13,050 | 13,213 |
| Halliburton Co. 3.80% 2025 | 10,395 | 10,754 |
| Halliburton Co. 4.85% 2035 | 1,115 | 1,219 |
| Halliburton Co. 5.00% 2045 | 1,860 | 2,038 |
| Jupiter Resources Inc. 8.50% 20225 | 37,250 | 28,124 |
| Kinder Morgan Energy Partners, LP 2.65% 2019 | 1,890 | 1,912 |
| Kinder Morgan Energy Partners, LP 9.00% 2019 | 1,660 | 1,904 |
| Bonds, notes & other debt instruments Corporate bonds & notes (continued) Energy (continued) |
Principal amount (000) |
Value (000) |
| Kinder Morgan Energy Partners, LP 4.15% 2022 | $12,145 | $12,687 |
| Kinder Morgan Energy Partners, LP 3.45% 2023 | 7,500 | 7,445 |
| Kinder Morgan Energy Partners, LP 3.50% 2023 | 4,850 | 4,835 |
| Kinder Morgan Energy Partners, LP 4.25% 2024 | 8,265 | 8,474 |
| Kinder Morgan Energy Partners, LP 6.95% 2038 | 460 | 525 |
| Kinder Morgan Energy Partners, LP 5.00% 2043 | 20,000 | 19,086 |
| Kinder Morgan Energy Partners, LP 5.40% 2044 | 9,660 | 9,312 |
| Kinder Morgan Energy Partners, LP 5.50% 2044 | 7,206 | 7,403 |
| Kinder Morgan, Inc. 3.05% 2019 | 8,070 | 8,282 |
| Kinder Morgan, Inc. 4.30% 2025 | 23,890 | 24,788 |
| Kinder Morgan, Inc. 5.55% 2045 | 6,160 | 6,202 |
| Matador Resources Co. 6.875% 2023 | 1,400 | 1,446 |
| NGL Energy Partners LP 5.125% 2019 | 8,390 | 7,782 |
| NGL Energy Partners LP 6.875% 2021 | 20,105 | 18,220 |
| NGPL PipeCo LLC 7.119% 20175 | 58,790 | 61,730 |
| NGPL PipeCo LLC 9.625% 20195 | 66,700 | 70,035 |
| NGPL PipeCo LLC, Term Loan B, 6.75% 20177,8,9 | 126 | 126 |
| Noble Corp. PLC 5.00% 2018 | 7,555 | 7,297 |
| Noble Corp. PLC 6.95% 2025 | 23,605 | 19,297 |
| Noble Corp. PLC 7.95% 2045 | 25,605 | 18,820 |
| Oasis Petroleum Inc. 6.875% 2022 | 3,650 | 3,203 |
| Odebrecht Drilling Norbe VIII/IX Ltd 6.35% 20215,9 | 1,395 | 382 |
| Odebrecht Offshore Drilling Finance Ltd. 6.75% 20225,9 | 4,220 | 717 |
| PDC Energy Inc. 7.75% 2022 | 44,830 | 46,511 |
| Peabody Energy Corp., Term Loan, 10.00% 20177,8,9 | 7,000 | 7,254 |
| Peabody Energy Corp. 6.00% 201810 | 123,645 | 19,783 |
| Peabody Energy Corp. 6.50% 202010 | 4,500 | 720 |
| Peabody Energy Corp. 6.25% 202110 | 32,150 | 5,144 |
| Petrobras Global Finance Co. 6.85% 2115 | 2,775 | 2,133 |
| Petrobras International Finance Co. 5.75% 2020 | 6,535 | 6,539 |
| Petrobras International Finance Co. 5.375% 2021 | 28,655 | 27,258 |
| Petróleos Mexicanos 3.50% 2018 | 14,280 | 14,537 |
| Petróleos Mexicanos 5.50% 20195 | 13,925 | 14,761 |
| Petróleos Mexicanos 6.375% 20215 | 5,935 | 6,527 |
| Petróleos Mexicanos 3.50% 2023 | 11,000 | 10,450 |
| Petróleos Mexicanos 4.50% 2026 | 8,775 | 8,507 |
| Petróleos Mexicanos 6.875% 20265 | 8,550 | 9,619 |
| Petróleos Mexicanos 5.625% 2046 | 7,290 | 6,706 |
| Phillips 66 Partners LP 3.605% 2025 | 1,640 | 1,609 |
| Phillips 66 Partners LP 4.68% 2045 | 245 | 235 |
| Pioneer Natural Resources Co. 3.45% 2021 | 7,015 | 7,247 |
| QGOG Atlantic/Alaskan Rigs Ltd. 5.25% 20195,9 | 8,562 | 6,978 |
| Range Resources Corp. 4.875% 2025 | 20,650 | 19,721 |
| Ras Laffan Liquefied Natural Gas II 5.298% 20205,9 | 14,858 | 16,062 |
| Ras Laffan Liquefied Natural Gas III 6.75% 2019 | 4,000 | 4,593 |
| Ras Laffan Liquefied Natural Gas III 6.75% 20195 | 1,000 | 1,148 |
| Ras Laffan Liquefied Natural Gas III 5.838% 20275,9 | 10,325 | 11,680 |
| Regency Energy Partners LP and Regency Energy Finance Corp. 6.50% 2021 | 14,855 | 15,353 |
| Regency Energy Partners LP and Regency Energy Finance Corp. 5.00% 2022 | 35 | 37 |
| Regency Energy Partners LP and Regency Energy Finance Corp. 5.50% 2023 | 10,875 | 11,281 |
| Rice Energy Inc. 6.25% 2022 | 16,125 | 15,803 |
| Rice Energy Inc. 7.25% 2023 | 1,350 | 1,360 |
| Sabine Pass Liquefaction, LLC 5.625% 2021 | 40,425 | 41,941 |
| Sabine Pass Liquefaction, LLC 6.25% 2022 | 7,000 | 7,359 |
| Bonds, notes & other debt instruments Corporate bonds & notes (continued) Energy (continued) |
Principal amount (000) |
Value (000) |
| Sabine Pass Liquefaction, LLC 5.625% 2023 | $5,000 | $5,125 |
| Sabine Pass Liquefaction, LLC 5.75% 2024 | 8,860 | 9,126 |
| Sabine Pass Liquefaction, LLC 5.625% 2025 | 23,905 | 24,495 |
| Schlumberger BV 3.00% 20205 | 6,645 | 6,978 |
| Schlumberger BV 3.625% 20225 | 7,065 | 7,571 |
| Schlumberger BV 4.00% 20255 | 11,385 | 12,414 |
| Seven Generations Energy Ltd. 6.75% 20235 | 15,485 | 15,717 |
| Shell International Finance BV 1.875% 2021 | 20,205 | 20,337 |
| Shell International Finance BV 2.875% 2026 | 4,635 | 4,734 |
| Shell International Finance BV 4.00% 2046 | 2,900 | 2,993 |
| SM Energy Co. 5.625% 2025 | 21,975 | 18,349 |
| Southwestern Energy Co. 4.10% 2022 | 25,305 | 22,521 |
| Southwestern Energy Co. 6.70% 2025 | 44,150 | 43,046 |
| Spectra Energy Partners, LP 4.75% 2024 | 3,250 | 3,640 |
| Statoil ASA 3.125% 2017 | 10,000 | 10,211 |
| Statoil ASA 2.75% 2021 | 3,085 | 3,214 |
| Statoil ASA 3.25% 2024 | 850 | 914 |
| Statoil ASA 4.25% 2041 | 3,000 | 3,300 |
| StatoilHydro ASA 1.80% 2016 | 10,000 | 10,029 |
| Sunoco LP 6.25% 20215 | 33,230 | 33,978 |
| Targa Resources Corp. 4.125% 2019 | 14,955 | 14,974 |
| Targa Resources Partners LP 6.75% 20245 | 10,705 | 11,214 |
| TC PipeLines, LP 4.375% 2025 | 11,815 | 11,850 |
| Teekay Corp. 8.50% 20205 | 38,825 | 33,584 |
| Teekay Corp. 8.50% 2020 | 32,741 | 28,321 |
| Tesoro Logistics LP 5.50% 2019 | 15,700 | 16,760 |
| Tesoro Logistics LP 6.125% 2021 | 1,080 | 1,127 |
| Tesoro Logistics LP 6.25% 2022 | 7,900 | 8,256 |
| Tesoro Logistics LP 6.375% 2024 | 1,220 | 1,292 |
| TransCanada PipeLines Ltd. 7.625% 2039 | 10,750 | 15,700 |
| TransCanada PipeLines Ltd., junior subordinated 6.35% 2067 | 46,150 | 34,849 |
| TransCanada PipeLines Ltd., junior subordinated 5.625% 2075 | 2,820 | 2,735 |
| Transocean Inc. 6.80% 2016 | 18,395 | 18,510 |
| Transocean Inc. 8.125% 2021 | 20,000 | 16,800 |
| Transocean Inc. 9.00% 20235 | 7,050 | 6,627 |
| Weatherford International PLC 7.75% 2021 | 9,700 | 9,200 |
| Weatherford International PLC 4.50% 2022 | 32,155 | 26,689 |
| Weatherford International PLC 8.25% 2023 | 33,250 | 31,089 |
| Weatherford International PLC 7.00% 2038 | 39,545 | 29,461 |
| Weatherford International PLC 6.75% 2040 | 69,655 | 50,500 |
| Weatherford International PLC 5.95% 2042 | 5,000 | 3,475 |
| Western Gas Partners LP 2.60% 2018 | 1,150 | 1,148 |
| Western Gas Partners LP 3.95% 2025 | 3,045 | 2,993 |
| Western Gas Partners LP 4.65% 2026 | 2,275 | 2,296 |
| Williams Companies, Inc. 3.70% 2023 | 19,130 | 17,552 |
| Williams Partners LP 5.25% 2020 | 1,960 | 2,067 |
| Williams Partners LP 4.00% 2021 | 2,900 | 2,945 |
| Williams Partners LP 3.60% 2022 | 4,920 | 4,798 |
| Williams Partners LP 4.50% 2023 | 2,000 | 1,997 |
| Williams Partners LP 4.30% 2024 | 7,670 | 7,581 |
| Williams Partners LP 3.90% 2025 | 14,300 | 13,574 |
| Williams Partners LP 4.00% 2025 | 14,725 | 14,072 |
| Williams Partners LP 4.90% 2045 | 3,260 | 2,851 |
| Bonds, notes & other debt instruments Corporate bonds & notes (continued) Energy (continued) |
Principal amount (000) |
Value (000) |
| Williams Partners LP 5.10% 2045 | $6,965 | $6,286 |
| Woodside Finance Ltd. 4.60% 20215 | 18,935 | 20,307 |
| 2,146,963 | ||
| Health care 1.95% | ||
| AbbVie Inc. 2.30% 2021 | 14,335 | 14,613 |
| AbbVie Inc. 2.90% 2022 | 7,200 | 7,460 |
| AbbVie Inc. 3.20% 2022 | 2,675 | 2,813 |
| AbbVie Inc. 2.85% 2023 | 4,700 | 4,807 |
| AbbVie Inc. 3.60% 2025 | 10,000 | 10,628 |
| AbbVie Inc. 3.20% 2026 | 15,275 | 15,705 |
| AbbVie Inc. 4.50% 2035 | 5,705 | 6,220 |
| AbbVie Inc. 4.30% 2036 | 1,080 | 1,135 |
| AbbVie Inc. 4.45% 2046 | 18,440 | 19,712 |
| Actavis Funding SCS 2.35% 2018 | 11,135 | 11,303 |
| Actavis Funding SCS 3.00% 2020 | 16,590 | 17,279 |
| Actavis Funding SCS 3.45% 2022 | 20,180 | 21,261 |
| Actavis Funding SCS 3.80% 2025 | 35,940 | 38,276 |
| Actavis Funding SCS 4.55% 2035 | 18,570 | 20,067 |
| Actavis Funding SCS 4.75% 2045 | 20,990 | 23,366 |
| Aetna Inc. 1.70% 2018 | 18,275 | 18,442 |
| Aetna Inc. 1.90% 2019 | 21,000 | 21,293 |
| Aetna Inc. 2.40% 2021 | 31,295 | 31,951 |
| Aetna Inc. 2.80% 2023 | 1,575 | 1,624 |
| Aetna Inc. 3.20% 2026 | 12,415 | 12,759 |
| Aetna Inc. 4.25% 2036 | 7,000 | 7,277 |
| Aetna Inc. 4.375% 2046 | 3,095 | 3,221 |
| Amgen Inc. 2.70% 2022 | 5,100 | 5,292 |
| AstraZeneca PLC 3.375% 2025 | 28,505 | 30,620 |
| Baxalta Inc. 2.875% 2020 | 14,410 | 14,622 |
| Baxalta Inc. 4.00% 2025 | 10,140 | 10,813 |
| Bayer AG 2.375% 20195 | 4,810 | 4,917 |
| Becton, Dickinson and Co. 2.675% 2019 | 3,600 | 3,737 |
| Becton, Dickinson and Co. 4.685% 2044 | 3,800 | 4,421 |
| Boston Scientific Corp. 2.85% 2020 | 7,875 | 8,154 |
| Boston Scientific Corp. 6.00% 2020 | 5,375 | 6,120 |
| Boston Scientific Corp. 3.375% 2022 | 14,300 | 14,979 |
| Boston Scientific Corp. 3.85% 2025 | 11,200 | 12,062 |
| Catholic Health Initiatives, Series 2012, 1.60% 2017 | 1,000 | 1,001 |
| Celgene Corp. 3.625% 2024 | 7,000 | 7,450 |
| Celgene Corp. 4.625% 2044 | 2,595 | 2,813 |
| Celgene Corp. 5.00% 2045 | 9,185 | 10,740 |
| Centene Corp. 5.75% 2017 | 10,060 | 10,400 |
| Centene Corp. 5.625% 2021 | 31,317 | 33,157 |
| Centene Corp. 4.75% 2022 | 47,963 | 49,642 |
| Centene Corp. 6.125% 2024 | 8,012 | 8,628 |
| Concordia Healthcare Corp. 9.50% 20225 | 12,485 | 11,455 |
| Concordia Healthcare Corp. 7.00% 20235 | 4,030 | 3,345 |
| ConvaTec Finance International SA 8.25% 20195,6 | 14,795 | 14,873 |
| DaVita HealthCare Partners Inc. 5.125% 2024 | 1,775 | 1,836 |
| DaVita HealthCare Partners Inc. 5.00% 2025 | 10,900 | 11,050 |
| DENTSPLY International Inc. 2.75% 2016 | 5,620 | 5,623 |
| DJO Finance LLC 10.75% 20205 | 13,253 | 11,066 |
| DJO Finco Inc. 8.125% 20215 | 48,860 | 44,707 |
| Bonds, notes & other debt instruments Corporate bonds & notes (continued) Health care (continued) |
Principal amount (000) |
Value (000) |
| EMD Finance LLC 1.70% 20185 | $18,900 | $18,974 |
| EMD Finance LLC 2.40% 20205 | 22,050 | 22,426 |
| EMD Finance LLC 2.95% 20225 | 18,600 | 19,216 |
| EMD Finance LLC 3.25% 20255 | 29,900 | 31,119 |
| Endo Finance LLC & Endo Finco Inc. 6.00% 20235 | 17,135 | 15,025 |
| Endo Pharmaceuticals Holdings Inc. 5.75% 20225 | 6,700 | 6,064 |
| Gilead Sciences, Inc. 3.05% 2016 | 10,265 | 10,344 |
| HCA Inc. 3.75% 2019 | 16,657 | 17,323 |
| HCA Inc. 6.50% 2020 | 24,800 | 27,373 |
| HCA Inc. 4.75% 2023 | 580 | 606 |
| HCA Inc. 5.00% 2024 | 2,080 | 2,189 |
| HCA Inc. 5.375% 2025 | 50,000 | 52,156 |
| HCA Inc. 5.25% 2026 | 13,750 | 14,609 |
| Healthsouth Corp. 5.75% 2024 | 4,575 | 4,769 |
| Healthsouth Corp. 5.75% 2025 | 11,892 | 12,339 |
| Hologic, Inc. 5.25% 20225 | 5,920 | 6,297 |
| Humana Inc. 3.85% 2024 | 4,400 | 4,735 |
| Humana Inc. 4.95% 2044 | 12,800 | 14,540 |
| inVentiv Health Inc. 9.00% 20185 | 39,285 | 40,660 |
| inVentiv Health Inc. 10.00% 20185,6 | 71,002 | 72,467 |
| inVentiv Health Inc. 10.00% 2018 | 22,533 | 22,420 |
| inVentiv Health Inc. 10.00% 2018 | 13,010 | 12,961 |
| inVentiv Health Inc., Term Loan B4, 7.75% 20187,8,9 | 18,315 | 18,389 |
| Kindred Healthcare, Inc. 8.00% 2020 | 10,825 | 11,123 |
| Kindred Healthcare, Inc. 8.75% 2023 | 8,865 | 8,965 |
| Kinetic Concepts, Inc. 10.50% 2018 | 124,387 | 127,652 |
| Kinetic Concepts, Inc. 12.50% 2019 | 40,540 | 39,831 |
| Kinetic Concepts, Inc. 7.875% 20215 | 2,925 | 3,161 |
| Laboratory Corporation of America Holdings 3.20% 2022 | 5,335 | 5,533 |
| Laboratory Corporation of America Holdings 4.70% 2045 | 885 | 976 |
| Mallinckrodt PLC 4.875% 20205 | 19,140 | 19,284 |
| Mallinckrodt PLC 5.75% 20225 | 9,843 | 9,671 |
| Mallinckrodt PLC 5.625% 20235 | 17,415 | 16,805 |
| McKesson Corp. 2.284% 2019 | 5,875 | 6,008 |
| McKesson Corp. 3.796% 2024 | 1,505 | 1,643 |
| MEDNAX, Inc. 5.25% 20235 | 2,110 | 2,205 |
| Medtronic, Inc. 2.50% 2020 | 9,480 | 9,877 |
| Medtronic, Inc. 4.375% 2035 | 3,903 | 4,507 |
| Medtronic, Inc. 4.625% 2045 | 11,035 | 13,546 |
| Merck & Co., Inc. 1.10% 2018 | 6,710 | 6,739 |
| Molina Healthcare, Inc. 5.375% 20225 | 43,428 | 44,514 |
| Ortho-Clinical Diagnostics Inc. 6.625% 20225 | 7,345 | 6,280 |
| Ortho-Clinical Diagnostics Inc., Term Loan B, 4.75% 20217,8,9 | 9,975 | 9,688 |
| Pfizer Inc. 7.20% 2039 | 1,353 | 2,098 |
| Quintiles Transnational Corp. 4.875% 20235 | 32,825 | 33,732 |
| Roche Holdings, Inc. 2.875% 20215 | 15,000 | 15,959 |
| Rotech Healthcare Inc., Term Loan, 13.00% 20201,3,6,7,8,9 | 23,163 | 20,378 |
| Rotech Healthcare Inc., Term Loan A, 5.50% 20181,3,7,8,9 | 11,767 | 11,708 |
| Rotech Healthcare Inc., Term Loan B, 10.00% 20191,3,7,8,9 | 9,200 | 9,154 |
| St. Jude Medical, Inc. 2.80% 2020 | 9,100 | 9,448 |
| Tenet Healthcare Corp. 4.375% 2021 | 10,720 | 10,747 |
| Tenet Healthcare Corp. 8.125% 2022 | 1,684 | 1,747 |
| Tenet Healthcare Corp. 6.75% 2023 | 11,236 | 10,857 |
| Tenet Healthcare Corp., First Lien, 6.25% 2018 | 2,500 | 2,666 |
| Bonds, notes & other debt instruments Corporate bonds & notes (continued) Health care (continued) |
Principal amount (000) |
Value (000) |
| Tenet Healthcare Corp., First Lien, 4.75% 2020 | $12,190 | $12,449 |
| Tenet Healthcare Corp., First Lien, 6.00% 2020 | 33,055 | 35,121 |
| Tenet Healthcare Corp., First Lien, 4.50% 2021 | 20,140 | 20,341 |
| Teva Pharmaceutical Finance Company BV 1.40% 2018 | 15,425 | 15,477 |
| Teva Pharmaceutical Finance Company BV 1.70% 2019 | 15,730 | 15,838 |
| Teva Pharmaceutical Finance Company BV 2.20% 2021 | 18,990 | 19,123 |
| Teva Pharmaceutical Finance Company BV 2.80% 2023 | 9,460 | 9,643 |
| Teva Pharmaceutical Finance Company BV 3.15% 2026 | 15,400 | 15,771 |
| Teva Pharmaceutical Finance Company BV 4.10% 2046 | 8,195 | 8,495 |
| Thermo Fisher Scientific Inc. 2.40% 2019 | 6,000 | 6,139 |
| Thermo Fisher Scientific Inc. 4.15% 2024 | 4,000 | 4,404 |
| Thermo Fisher Scientific Inc. 5.30% 2044 | 365 | 447 |
| UnitedHealth Group Inc. 1.40% 2017 | 6,500 | 6,544 |
| UnitedHealth Group Inc. 6.00% 2017 | 12,430 | 12,963 |
| UnitedHealth Group Inc. 3.35% 2022 | 7,030 | 7,569 |
| UnitedHealth Group Inc. 3.75% 2025 | 10,710 | 11,934 |
| UnitedHealth Group Inc. 4.625% 2035 | 1,080 | 1,287 |
| UnitedHealth Group Inc. 4.75% 2045 | 1,800 | 2,252 |
| VPI Escrow Corp. 6.75% 20185 | 38,060 | 37,489 |
| VPI Escrow Corp. 6.375% 20205 | 49,563 | 44,978 |
| VPI Escrow Corp. 7.50% 20215 | 3,575 | 3,343 |
| VRX Escrow Corp. 5.375% 20205 | 33,820 | 30,332 |
| VRX Escrow Corp. 5.875% 20235 | 14,545 | 12,181 |
| VRX Escrow Corp. 6.125% 20255 | 17,320 | 14,419 |
| WellPoint, Inc. 2.30% 2018 | 1,370 | 1,391 |
| WellPoint, Inc. 2.25% 2019 | 12,500 | 12,746 |
| Zimmer Holdings, Inc. 2.00% 2018 | 4,640 | 4,670 |
| Zimmer Holdings, Inc. 2.70% 2020 | 13,770 | 14,078 |
| Zimmer Holdings, Inc. 3.15% 2022 | 18,860 | 19,617 |
| 1,979,279 | ||
| Telecommunication services 1.54% | ||
| Altice Financing SA 6.625% 20235 | 22,550 | 22,677 |
| Altice Finco SA 6.50% 20225 | 5,500 | 5,686 |
| Altice Finco SA, First Lien, 7.75% 20225 | 12,550 | 12,778 |
| Altice NV 5.50% 20265 | 3,775 | 3,917 |
| AT&T Inc. 2.40% 2016 | 9,000 | 9,005 |
| AT&T Inc. 2.80% 2021 | 8,685 | 8,993 |
| AT&T Inc. 4.125% 2026 | 8,560 | 9,343 |
| AT&T Inc. 8.25% 2031 | 3,804 | 5,648 |
| AT&T Inc. 4.50% 2035 | 8,150 | 8,636 |
| AT&T Inc. 4.75% 2046 | 6,250 | 6,650 |
| CenturyLink, Inc. 7.50% 2024 | 13,425 | 14,365 |
| CenturyLink, Inc., Series T, 5.80% 2022 | 1,524 | 1,564 |
| Cequel Communications Holdings I, LLC and Cequel Capital Corp. 6.375% 20205 | 50,899 | 52,680 |
| Clearwire Communications and Clearwire Finance, Inc. 14.75% 20165 | 6,125 | 6,393 |
| Deutsche Telekom International Finance BV 9.25% 2032 | 8,420 | 13,780 |
| France Télécom 2.75% 2016 | 9,000 | 9,019 |
| France Télécom 4.125% 2021 | 15,000 | 16,635 |
| France Télécom 9.00% 2031 | 5,000 | 7,959 |
| Frontier Communications Corp. 8.125% 2018 | 1,217 | 1,343 |
| Frontier Communications Corp. 8.875% 2020 | 6,450 | 6,956 |
| Frontier Communications Corp. 9.25% 2021 | 22,395 | 24,455 |
| Frontier Communications Corp. 8.75% 2022 | 1,000 | 1,040 |
| Bonds, notes & other debt instruments Corporate bonds & notes (continued) Telecommunication services (continued) |
Principal amount (000) |
Value (000) |
| Frontier Communications Corp. 10.50% 2022 | $29,450 | $31,843 |
| Frontier Communications Corp. 7.125% 2023 | 6,225 | 5,805 |
| Frontier Communications Corp. 7.625% 2024 | 20,000 | 18,550 |
| Frontier Communications Corp. 11.00% 2025 | 96,301 | 103,283 |
| Inmarsat PLC 4.875% 20225 | 16,775 | 15,681 |
| Intelsat Jackson Holding Co. 7.25% 2019 | 27,750 | 20,882 |
| Intelsat Jackson Holding Co. 7.25% 2020 | 23,004 | 16,850 |
| Ligado Networks, Term Loan, 9.75% 20206,7,8,9 | 140,809 | 125,124 |
| MetroPCS Wireless, Inc. 6.25% 2021 | 52,775 | 55,414 |
| MetroPCS Wireless, Inc. 6.625% 2023 | 46,600 | 50,191 |
| Numericable Group SA 6.00% 20225 | 12,850 | 12,609 |
| Numericable Group SA 7.375% 20265 | 4,375 | 4,375 |
| Orange SA 5.50% 2044 | 3,000 | 3,879 |
| Qwest Capital Funding, Inc. 7.625% 2021 | 3,900 | 4,089 |
| SoftBank Corp. 4.50% 20205 | 53,420 | 55,557 |
| Sprint Capital Corp. 6.90% 2019 | 5,025 | 4,994 |
| Sprint Nextel Corp. 9.00% 20185 | 5,000 | 5,438 |
| Sprint Nextel Corp. 7.00% 2020 | 43,350 | 41,391 |
| Sprint Nextel Corp. 7.25% 2021 | 36,155 | 33,918 |
| Sprint Nextel Corp. 11.50% 2021 | 11,130 | 12,299 |
| Sprint Nextel Corp. 7.875% 2023 | 33,475 | 30,734 |
| Sprint Nextel Corp. 7.125% 2024 | 14,000 | 12,530 |
| Telefónica Emisiones, SAU 3.192% 2018 | 8,500 | 8,726 |
| Telefónica Emisiones, SAU 5.134% 2020 | 7,950 | 8,833 |
| T-Mobile US, Inc. 6.542% 2020 | 36,700 | 37,939 |
| T-Mobile US, Inc. 6.731% 2022 | 3,695 | 3,884 |
| T-Mobile US, Inc. 6.375% 2025 | 6,650 | 7,140 |
| T-Mobile US, Inc. 6.50% 2026 | 61,150 | 66,455 |
| Trilogy International Partners, LLC 13.375% 20195 | 61,800 | 62,418 |
| Verizon Communications Inc. 2.183% 20167 | 34,729 | 34,797 |
| Verizon Communications Inc. 1.375% 2019 | 7,000 | 7,009 |
| Verizon Communications Inc. 1.75% 2021 | 4,280 | 4,286 |
| Verizon Communications Inc. 3.00% 2021 | 2,516 | 2,664 |
| Verizon Communications Inc. 2.625% 2026 | 8,320 | 8,336 |
| Verizon Communications Inc. 4.272% 2036 | 62,006 | 65,078 |
| Verizon Communications Inc. 6.00% 2041 | 28,000 | 35,724 |
| Verizon Communications Inc. 4.125% 2046 | 35,646 | 36,192 |
| Verizon Communications Inc. 4.522% 2048 | 78,900 | 84,442 |
| Wind Acquisition SA 4.75% 20205 | 71,435 | 71,480 |
| Wind Acquisition SA 7.375% 20215 | 67,200 | 67,032 |
| Windstream Holdings, Inc. 7.75% 2021 | 28,150 | 26,883 |
| Zayo Group Holdings, Inc. 6.00% 2023 | 5,050 | 5,277 |
| Zayo Group Holdings, Inc. 6.375% 2025 | 575 | 604 |
| 1,560,157 | ||
| Industrials 1.26% | ||
| ABB Finance (USA) Inc. 1.625% 2017 | 1,000 | 1,005 |
| ABB Finance (USA) Inc. 2.875% 2022 | 1,000 | 1,050 |
| ABC Supply Co., Inc. 5.625% 20215 | 325 | 337 |
| ADS Waste Escrow 8.25% 2020 | 4,675 | 4,862 |
| AECOM Technology Corp. 5.875% 2024 | 7,400 | 7,973 |
| AerCap Holdings NV 2.75% 2017 | 150 | 151 |
| AerCap Holdings NV 3.75% 2019 | 3,400 | 3,528 |
| American Airlines, Inc., 5.50% 20195 | 2,250 | 2,306 |
| Bonds, notes & other debt instruments Corporate bonds & notes (continued) Industrials (continued) |
Principal amount (000) |
Value (000) |
| American Airlines, Inc., Series 2013-2, Class A, 4.95% 20249 | $7,472 | $8,200 |
| American Builders & Contractors Supply Co. Inc. 5.75% 20235 | 1,400 | 1,477 |
| ARAMARK Corp. 5.125% 2024 | 14,525 | 15,033 |
| ARAMARK Corp. 5.125% 20245 | 5,000 | 5,175 |
| Associated Materials, LLC and AMH New Finance, Inc. 9.125% 2017 | 77,855 | 73,184 |
| Atlas Copco AB 5.60% 20175 | 5,500 | 5,626 |
| Builders Firstsource 7.625% 20215 | 32,522 | 34,490 |
| Builders Firstsource 10.75% 20235 | 5,135 | 5,726 |
| Canadian National Railway Co. 3.20% 2046 | 2,305 | 2,306 |
| CEVA Group PLC 7.00% 20211,5 | 2,250 | 1,896 |
| CEVA Group PLC 9.00% 20211,5 | 1,050 | 830 |
| CEVA Group PLC, Apollo Global Securities LLC LOC, 5.969% 20211,7,8,9 | 4,870 | 4,060 |
| CEVA Logistics U.S. Holdings Inc., Term Loan B, 6.50% 20211,7,8,9 | 6,924 | 5,773 |
| CEVA Logistics Holdings BV, Term Loan, 6.50% 20211,7,8,9 | 5,020 | 4,186 |
| CEVA Logistics Canada, ULC, Term Loan, 6.50% 20211,7,8,9 | 866 | 722 |
| Continental Airlines, Inc., Series 1998-1, Class B, 6.748% 20189 | 429 | 443 |
| Continental Airlines, Inc., Series 1997-4B, Class B, 6.90% 20189 | 15 | 15 |
| Continental Airlines, Inc., Series 1998-1, Class A, 6.648% 20199 | 1,268 | 1,307 |
| Continental Airlines, Inc., Series 1997-4, Class A, 6.90% 20199 | 478 | 488 |
| Continental Airlines, Inc., Series 2000-2, Class B, 8.307% 20199 | 65 | 70 |
| Continental Airlines, Inc., Series 1999-1, Class A, 6.545% 20209 | 8,890 | 9,441 |
| Continental Airlines, Inc., Series 1999-1, Class B, 6.795% 20209 | 50 | 51 |
| Continental Airlines, Inc., Series 1999-2, Class A-1, 7.256% 20219 | 289 | 310 |
| Continental Airlines, Inc., Series 1999-2, Class B, 7.566% 20219 | 60 | 60 |
| Continental Airlines, Inc., Series 2001-1, Class A-1, 6.703% 20229 | 1,240 | 1,320 |
| Continental Airlines, Inc., Series 2007-1, Class B, 6.903% 20229 | 6,831 | 7,194 |
| Continental Airlines, Inc., Series 2000-2, Class A-1, 7.707% 20229 | 1,627 | 1,777 |
| Continental Airlines, Inc., Series 2000-1, Class A-1, 8.048% 20229 | 2,749 | 3,078 |
| Continental Airlines, Inc., Series 2000-1, Class B, 8.388% 20229 | 6 | 6 |
| Corporate Risk Holdings LLC 9.50% 20191,5 | 45,000 | 42,637 |
| Corporate Risk Holdings LLC 13.50% 20201,3,5,6 | 14,211 | 14,629 |
| DAE Aviation Holdings, Inc. 10.00% 20235 | 39,390 | 40,966 |
| Deck Chassis Acquisition Inc. 10.00% 20235 | 24,975 | 26,286 |
| Delta Air Lines, Inc., Series 2002-1, Class G-1, MBIA insured, 6.718% 20249 | 4,413 | 5,053 |
| ERAC USA Finance Co. 5.25% 20205 | 5,000 | 5,651 |
| Euramax International, Inc. 12.00% 20205 | 23,375 | 23,726 |
| European Aeronautic Defence and Space Company 2.70% 20235 | 885 | 923 |
| Fortive Corp. 2.35% 20215 | 2,825 | 2,889 |
| Gardner Denver, Inc. 6.875% 20215 | 9,425 | 8,789 |
| Gardner Denver, Inc., Term Loan B, 4.25% 20207,8,9 | 25,660 | 24,465 |
| Gates Global LLC 6.00% 20225 | 32,125 | 29,394 |
| Gates Global LLC, Term Loan B, 4.25% 20217,8,9 | 6,180 | 6,069 |
| General Electric Capital Corp. 2.342% 2020 | 13,195 | 13,696 |
| General Electric Capital Corp., Series A, 6.00% 2019 | 2,577 | 2,945 |
| General Electric Co. 2.70% 2022 | 7,750 | 8,174 |
| General Electric Co. 4.125% 2042 | 11,000 | 12,427 |
| General Electric Co. 5.00% (undated) | 197,849 | 213,059 |
| Hardwoods Acquisition Inc 7.50% 20215 | 16,935 | 12,955 |
| HD Supply, Inc. 7.50% 2020 | 8,475 | 8,867 |
| HD Supply, Inc. 5.25% 20215 | 14,350 | 15,247 |
| HDTFS Inc. 6.75% 2019 | 15,725 | 16,039 |
| HDTFS Inc. 5.875% 2020 | 15,250 | 15,784 |
| KLX Inc. 5.875% 20225 | 11,075 | 11,269 |
| LMI Aerospace Inc. 7.375% 2019 | 15,600 | 15,951 |
| Bonds, notes & other debt instruments Corporate bonds & notes (continued) Industrials (continued) |
Principal amount (000) |
Value (000) |
| Lockheed Martin Corp. 1.85% 2018 | $2,535 | $2,577 |
| Lockheed Martin Corp. 2.50% 2020 | 6,250 | 6,502 |
| Lockheed Martin Corp. 3.10% 2023 | 695 | 740 |
| Lockheed Martin Corp. 3.55% 2026 | 3,480 | 3,833 |
| Lockheed Martin Corp. 4.50% 2036 | 560 | 656 |
| Lockheed Martin Corp. 4.70% 2046 | 9,560 | 11,673 |
| Navios Maritime Acquisition Corp. and Navios Acquisition Finance (US) Inc. 8.125% 20215 | 29,500 | 22,862 |
| Navios Maritime Holdings Inc. 7.375% 20225 | 27,165 | 13,345 |
| Navios Maritime Holdings Inc. and Navios Maritime Finance II (US) Inc. 8.125% 2019 | 10,510 | 5,097 |
| Nielsen Finance LLC and Nielsen Finance Co. 4.50% 2020 | 11,250 | 11,573 |
| Nielsen Finance LLC and Nielsen Finance Co. 5.50% 20215 | 13,000 | 13,536 |
| Nielsen Finance LLC and Nielsen Finance Co. 5.00% 20225 | 9,950 | 10,298 |
| Nortek Inc. 8.50% 2021 | 35,772 | 37,570 |
| Ply Gem Industries, Inc. 6.50% 2022 | 18,150 | 18,518 |
| Ply Gem Industries, Inc. 6.50% 2022 | 13,400 | 13,420 |
| PrimeSource Building Products Inc 9.00% 20235 | 1,645 | 1,641 |
| R.R. Donnelley & Sons Co. 7.25% 20181 | 2,000 | 2,148 |
| R.R. Donnelley & Sons Co. 8.25% 20191 | 2,475 | 2,732 |
| R.R. Donnelley & Sons Co. 7.625% 20201 | 3,700 | 4,015 |
| R.R. Donnelley & Sons Co. 7.875% 20211 | 23,445 | 25,555 |
| R.R. Donnelley & Sons Co. 7.00% 20221 | 19,500 | 19,890 |
| R.R. Donnelley & Sons Co. 6.50% 20231 | 14,280 | 14,137 |
| Siemens AG 4.40% 20455 | 2,000 | 2,447 |
| Silver II Borrower S.C.A./Silver II U.S. Holdings, LLC 7.75% 20205 | 59,515 | 50,290 |
| TRAC Intermodal 11.00% 2019 | 8,475 | 8,952 |
| TransDigm Inc. 5.50% 2020 | 27,125 | 27,939 |
| TransDigm Inc. 6.00% 2022 | 5,000 | 5,200 |
| TransDigm Inc. 6.50% 2024 | 49,700 | 51,871 |
| TransDigm Inc. 6.50% 2025 | 16,650 | 17,462 |
| United Air Lines, Inc., Series 2007-1, Class B, 7.336% 20215,9 | 3,377 | 3,546 |
| United Air Lines, Inc., Series 2007-1, Class A, 6.636% 20249 | 5,551 | 5,961 |
| United Rentals, Inc. 5.50% 2025 | 10,850 | 11,195 |
| United Rentals, Inc. 5.875% 2026 | 7,400 | 7,724 |
| Virgin Australia Holdings Ltd. 8.50% 20195 | 41,650 | 43,680 |
| Watco Companies 6.375% 20235 | 10,670 | 10,723 |
| 1,282,654 | ||
| Utilities 0.92% | ||
| Abu Dhabi National Energy Co. PJSC (TAQA) 6.165% 20175 | 2,000 | 2,112 |
| Abu Dhabi National Energy Co. PJSC (TAQA) 3.625% 20235 | 2,000 | 2,055 |
| AES Corp. 8.00% 2020 | 14,275 | 16,845 |
| AES Corp. 7.375% 2021 | 26,500 | 30,210 |
| AES Corp. 4.875% 2023 | 2,000 | 2,030 |
| AES Corp. 5.50% 2024 | 8,500 | 8,829 |
| AES Corp. 5.50% 2025 | 21,750 | 22,375 |
| AES Corp. 6.00% 2026 | 7,725 | 8,150 |
| American Electric Power Co. 2.95% 2022 | 12,065 | 12,615 |
| Berkshire Hathaway Energy Co. 2.40% 2020 | 7,749 | 7,980 |
| Calpine Corp. 6.00% 20225 | 8,475 | 8,878 |
| Calpine Corp. 5.375% 2023 | 11,810 | 11,840 |
| Calpine Corp. 7.875% 20235 | 5,712 | 6,069 |
| Calpine Corp. 5.875% 20245 | 3,000 | 3,173 |
| Calpine Corp. 5.25% 20265 | 1,970 | 2,004 |
| CMS Energy Corp. 8.75% 2019 | 6,000 | 7,208 |
| Bonds, notes & other debt instruments Corporate bonds & notes (continued) Utilities (continued) |
Principal amount (000) |
Value (000) |
| CMS Energy Corp. 6.25% 2020 | $13,480 | $15,473 |
| CMS Energy Corp. 5.05% 2022 | 2,072 | 2,360 |
| CMS Energy Corp. 3.875% 2024 | 7,500 | 8,262 |
| CMS Energy Corp. 3.60% 2025 | 8,840 | 9,516 |
| CMS Energy Corp. 3.00% 2026 | 8,498 | 8,814 |
| CMS Energy Corp. 4.70% 2043 | 3,933 | 4,582 |
| Colbun SA 6.00% 20205 | 2,000 | 2,233 |
| Colbun SA 4.50% 20245 | 1,500 | 1,589 |
| Comision Federal de Electricidad 4.875% 20245 | 2,000 | 2,150 |
| Commonwealth Edison Company 3.65% 2046 | 7,425 | 7,836 |
| Consumers Energy Co., First Mortgage Bonds, 6.70% 2019 | 13,400 | 15,614 |
| Consumers Energy Co. 5.65% 2020 | 4,058 | 4,675 |
| Consumers Energy Co. 3.375% 2023 | 360 | 390 |
| Consumers Energy Co., First Mortgage Bonds, 3.125% 2024 | 2,520 | 2,679 |
| Dominion Gas Holdings LLC 2.50% 2019 | 4,865 | 4,986 |
| Dominion Resources, Inc. 2.962% 2019 | 3,000 | 3,083 |
| Dominion Resources, Inc. 4.104% 2021 | 7,209 | 7,719 |
| Duke Energy Corp. 0.613% 20177 | 1,000 | 1,000 |
| Duke Energy Indiana, Inc. 4.90% 2043 | 14,785 | 18,336 |
| Duke Energy Progress Inc. 4.15% 2044 | 3,935 | 4,451 |
| Dynegy Finance Inc. 6.75% 2019 | 6,795 | 6,956 |
| Dynegy Finance Inc. 7.375% 2022 | 15,980 | 15,780 |
| Dynegy Finance Inc. 7.625% 2024 | 7,515 | 7,383 |
| E.ON International Finance BV 5.80% 20185 | 15,000 | 16,049 |
| EDP Finance BV 4.125% 20205 | 6,000 | 6,296 |
| EDP Finance BV 5.25% 20215 | 22,500 | 24,576 |
| Electricité de France SA 1.15% 20175 | 2,000 | 2,000 |
| Electricité de France SA 3.625% 20255 | 780 | 816 |
| Electricité de France SA 6.95% 20395 | 8,000 | 10,959 |
| Electricité de France SA 4.875% 20445 | 3,850 | 4,255 |
| Electricité de France SA 5.25% 20495 | 29,005 | 28,389 |
| Emera Inc. 6.75% 2076 | 45,000 | 48,589 |
| Emera US Finance LP 2.15% 20195 | 5,975 | 6,064 |
| Emera US Finance LP 2.70% 20215 | 10,505 | 10,770 |
| Emera US Finance LP 3.55% 20265 | 3,300 | 3,473 |
| Empresa Nacional de Electricidad SA 4.25% 2024 | 900 | 967 |
| Enel Finance International SA 6.00% 20395 | 3,000 | 3,649 |
| Enel Società per Azioni 8.75% 20735 | 12,000 | 13,995 |
| Entergy Corp. 4.70% 2017 | 8,000 | 8,101 |
| Eversource Energy 2.375% 2022 | 2,014 | 2,058 |
| Eversource Energy 2.70% 2026 | 7,898 | 8,133 |
| Exelon Corp. 2.45% 2021 | 2,919 | 2,983 |
| Exelon Corp. 3.95% 2025 | 9,536 | 10,400 |
| Exelon Corp. 3.40% 2026 | 8,490 | 8,953 |
| Exelon Corp. 4.95% 2035 | 1,124 | 1,309 |
| Exelon Corp. 4.45% 2046 | 2,590 | 2,864 |
| FirstEnergy Corp. 7.375% 2031 | 684 | 885 |
| FirstEnergy Corp., Series B, 4.25% 2023 | 36,953 | 39,324 |
| Iberdrola Finance Ireland 5.00% 20195 | 1,060 | 1,170 |
| Israel Electric Corp. Ltd. 8.10% 20965 | 4,905 | 5,776 |
| MidAmerican Energy Co. 5.95% 2017 | 10,625 | 11,129 |
| MidAmerican Energy Co. 2.40% 2019 | 9,000 | 9,288 |
| MidAmerican Energy Holdings Co. 5.75% 2018 | 10,000 | 10,732 |
| Mississippi Power Co. 4.25% 2042 | 1,853 | 1,744 |
| Bonds, notes & other debt instruments Corporate bonds & notes (continued) Utilities (continued) |
Principal amount (000) |
Value (000) |
| Nevada Power Co., General and Refunding Mortgage Notes, Series V, 7.125% 2019 | $642 | $738 |
| Niagara Mohawk Power Corp. 3.508% 20245 | 4,150 | 4,480 |
| Niagara Mohawk Power Corp. 4.278% 20345 | 3,000 | 3,307 |
| Northern States Power Co. 4.125% 2044 | 11,000 | 12,671 |
| NRG Energy, Inc. 6.25% 2022 | 17,425 | 17,599 |
| NRG Energy, Inc. 6.625% 2023 | 2,000 | 2,020 |
| NRG Energy, Inc. 7.25% 20265 | 17,575 | 18,124 |
| NRG Energy, Inc. 6.625% 20275 | 22,060 | 21,839 |
| NV Energy, Inc 6.25% 2020 | 5,214 | 6,195 |
| Ohio Power Co., Series G, 6.60% 2033 | 2,090 | 2,733 |
| Ohio Power Co., Series D, 6.60% 2033 | 353 | 458 |
| Pacific Gas and Electric Co. 3.25% 2021 | 2,000 | 2,144 |
| Pacific Gas and Electric Co. 2.45% 2022 | 1,572 | 1,616 |
| Pacific Gas and Electric Co. 3.25% 2023 | 2,695 | 2,887 |
| Pacific Gas and Electric Co. 3.85% 2023 | 13,256 | 14,708 |
| Pacific Gas and Electric Co. 3.40% 2024 | 8,106 | 8,810 |
| Pacific Gas and Electric Co. 3.75% 2024 | 602 | 667 |
| Pacific Gas and Electric Co. 2.95% 2026 | 640 | 673 |
| Pacific Gas and Electric Co. 3.75% 2042 | 1,061 | 1,116 |
| Pacific Gas and Electric Co. 4.30% 2045 | 1,900 | 2,204 |
| Pacific Gas and Electric Co. 4.25% 2046 | 3,000 | 3,452 |
| PacifiCorp., First Mortgage Bonds, 5.65% 2018 | 5,500 | 5,996 |
| PPL Capital Funding, Inc. 3.10% 2026 | 10,000 | 10,229 |
| Progress Energy, Inc. 7.05% 2019 | 250 | 284 |
| Progress Energy, Inc. 7.00% 2031 | 5,148 | 7,018 |
| Progress Energy, Inc. 7.75% 2031 | 9,026 | 12,823 |
| Public Service Co. of Colorado 5.125% 2019 | 1,490 | 1,653 |
| Puget Sound Energy, Inc., First Lien, 6.50% 2020 | 6,317 | 7,356 |
| Puget Sound Energy, Inc., First Lien, 6.00% 2021 | 3,945 | 4,600 |
| Puget Sound Energy, Inc., First Lien, 5.625% 2022 | 7,652 | 8,784 |
| Puget Sound Energy Inc. 3.65% 2025 | 884 | 929 |
| Sierra Pacific Power Co. 2.60% 20265 | 15,750 | 16,159 |
| Southern California Edison Co. 1.845% 20229 | 7,136 | 7,131 |
| Talen Energy Corp. 4.625% 20195 | 4,495 | 4,281 |
| Tampa Electric Co. 2.60% 2022 | 911 | 943 |
| Tampa Electric Co. 4.35% 2044 | 8,330 | 9,443 |
| Teco Finance, Inc. 5.15% 2020 | 9,784 | 10,857 |
| Texas Competitive Electric Holdings, Term Loan B, 5.00% 20237,8,9 | 29,090 | 29,227 |
| Texas Competitive Electric Holdings, Term Loan C, 5.00% 20237,8,9 | 6,635 | 6,666 |
| TXU, Term Loan, 4.65% 20177,8,9,10 | 26,204 | 8,818 |
| TXU, Term Loan, 3.737% 20247,8,9,10 | 3,000 | 998 |
| Veolia Environnement 6.75% 2038 | 500 | 680 |
| Virginia Electric and Power Co. 3.45% 2024 | 560 | 609 |
| Virginia Electric and Power Co. 3.10% 2025 | 2,625 | 2,802 |
| Virginia Electric and Power Co., Series B, 5.95% 2017 | 4,500 | 4,745 |
| Xcel Energy Inc 2.40% 2021 | 7,399 | 7,619 |
| Xcel Energy Inc. 3.30% 2025 | 4,000 | 4,277 |
| Xcel Energy Inc. 6.50% 2036 | 9,680 | 13,448 |
| 930,752 | ||
| Materials 0.84% | ||
| AK Steel Holding Corp. 7.50% 2023 | 1,825 | 1,930 |
| Aleris International, Inc. 9.50% 20215 | 1,175 | 1,254 |
| Anglo American Capital PLC 4.125% 20215 | 4,800 | 4,692 |
| Bonds, notes & other debt instruments Corporate bonds & notes (continued) Materials (continued) |
Principal amount (000) |
Value (000) |
| ArcelorMittal 6.25% 2020 | $1,475 | $1,549 |
| ArcelorMittal 7.25% 2022 | 22,385 | 24,623 |
| ArcelorMittal 6.125% 2025 | 3,825 | 4,072 |
| ArcelorMittal 7.75% 2041 | 46,355 | 47,718 |
| Ashland Inc. 4.75% 2022 | 5,565 | 5,795 |
| Ball Corp. 4.375% 2020 | 15,225 | 16,329 |
| BHP Billiton Finance Ltd. 6.75% 20755 | 5,000 | 5,575 |
| BlueScope Steel Ltd. 6.50% 20215 | 4,600 | 4,853 |
| Chemours Co. 6.625% 2023 | 35,285 | 30,610 |
| Chemours Co. 7.00% 2025 | 36,940 | 31,584 |
| Cliffs Natural Resources Inc. 8.25% 20205 | 13,800 | 14,283 |
| Cliffs Natural Resources Inc. 4.875% 2021 | 4,945 | 3,829 |
| CRH America, Inc. 3.875% 20255 | 2,000 | 2,165 |
| CRH America, Inc. 5.125% 20455 | 2,000 | 2,264 |
| Dow Chemical Co. 5.25% 2041 | 4,000 | 4,547 |
| Eastman Chemical Co. 2.70% 2020 | 12,000 | 12,409 |
| Ecolab Inc. 3.00% 2016 | 7,455 | 7,510 |
| First Quantum Minerals Ltd. 6.75% 20205 | 75,688 | 70,049 |
| First Quantum Minerals Ltd. 7.00% 20215 | 78,287 | 70,247 |
| First Quantum Minerals Ltd. 7.25% 20225 | 14,125 | 12,536 |
| FMG Resources 4.25% 20197,8,9 | 6,132 | 6,018 |
| FMG Resources 9.75% 20225 | 67,695 | 76,157 |
| Freeport-McMoRan Copper & Gold Inc. 3.55% 2022 | 22,340 | 19,212 |
| Georgia Gulf Corp. 4.625% 2021 | 24,475 | 25,301 |
| Georgia-Pacific Corp. 2.539% 20195 | 12,000 | 12,309 |
| Glencore Funding LLC 4.00% 20255 | 5,000 | 4,692 |
| Glencore Xstrata LLC 4.625% 20245 | 7,000 | 6,851 |
| Holcim Ltd. 6.00% 20195 | 1,607 | 1,801 |
| Holcim Ltd. 5.15% 20235 | 12,595 | 14,163 |
| Huntsman International LLC 4.875% 2020 | 17,950 | 18,309 |
| INEOS Group Holdings SA 5.625% 20245 | 3,325 | 3,292 |
| International Paper Co. 7.30% 2039 | 5,615 | 7,635 |
| LSB Industries, Inc. 7.75% 2019 | 780 | 807 |
| Monsanto Co. 4.40% 2044 | 13,090 | 13,501 |
| Owens-Illinois, Inc. 5.00% 20225 | 3,360 | 3,520 |
| Owens-Illinois, Inc. 5.875% 20235 | 12,780 | 13,762 |
| Owens-Illinois, Inc. 5.375% 20255 | 2,515 | 2,622 |
| Owens-Illinois, Inc. 6.375% 20255 | 5,225 | 5,741 |
| Paperworks Industries Inc. 9.50% 20195 | 2,458 | 2,341 |
| Platform Specialty Products Corp. 10.375% 20215 | 21,926 | 22,090 |
| Platform Specialty Products Corp. 6.50% 20225 | 1,010 | 881 |
| Praxair, Inc. 2.25% 2020 | 6,287 | 6,505 |
| Rayonier Advanced Materials Inc. 5.50% 20245 | 30,565 | 26,649 |
| Reynolds Group Inc. 5.75% 2020 | 38,460 | 39,806 |
| Reynolds Group Inc. 6.875% 2021 | 5,000 | 5,200 |
| Reynolds Group Inc. 5.125% 20235 | 3,300 | 3,407 |
| Ryerson Inc. 11.25% 2018 | 5,863 | 5,716 |
| Ryerson Inc. 11.00% 20225 | 59,827 | 65,361 |
| Smurfit Capital Funding PLC 7.50% 2025 | 2,425 | 2,862 |
| Summit Materials, Inc. 6.125% 2023 | 9,325 | 9,442 |
| Teck Resources Ltd. 4.50% 2021 | 7,875 | 7,206 |
| Teck Resources Ltd. 8.00% 20215 | 11,350 | 12,144 |
| Tembec Industries Inc. 9.00% 20195 | 7,520 | 5,922 |
| U.S. Coatings Acquisition Inc. (Flash Dutch 2 BV) 7.375% 20215 | 5,060 | 5,364 |
| Bonds, notes & other debt instruments Corporate bonds & notes (continued) Materials (continued) |
Principal amount (000) |
Value (000) |
| United States Steel Corp. 8.375% 20215 | $6,850 | $7,492 |
| Walter Energy, Inc. 9.50% 20193,5,10 | 15,913 | 40 |
| Zekelman Industries Inc. 9.875% 20235 | 6,340 | 6,673 |
| Zekelman Industries Inc., Term Loan B, 6.00% 20217,8,9 | 4,000 | 4,025 |
| 855,242 | ||
| Information technology 0.51% | ||
| Apple Inc. 1.55% 2021 | 13,040 | 13,066 |
| Apple Inc. 2.25% 2021 | 10,250 | 10,605 |
| Apple Inc. 2.45% 2026 | 9,000 | 8,996 |
| Apple Inc. 3.85% 2046 | 9,950 | 10,090 |
| Blackboard Inc., Term Loan B, 4.75% 20187,8,9 | 1,250 | 1,228 |
| Dell Inc. 4.42% 20215 | 6,540 | 6,844 |
| Dell Inc. 5.45% 20235 | 25,000 | 26,520 |
| Dell Inc. 7.125% 20245 | 6,175 | 6,654 |
| Dell Inc. 8.35% 20465 | 9,895 | 11,382 |
| EchoStar Corp. 6.625% 20265 | 16,800 | 16,716 |
| First Data Corp. 6.75% 20205 | 8,699 | 9,074 |
| First Data Corp. 5.375% 20235 | 10,950 | 11,279 |
| First Data Corp. 7.00% 20235 | 113,375 | 117,201 |
| First Data Corp. 5.00% 20245 | 10,700 | 10,820 |
| First Data Corp. 5.75% 20245 | 7,650 | 7,746 |
| Gogo Inc. 12.50% 20225 | 39,325 | 39,079 |
| Harris Corp. 2.70% 2020 | 1,315 | 1,348 |
| Harris Corp. 3.832% 2025 | 740 | 799 |
| Harris Corp. 4.854% 2035 | 2,775 | 3,112 |
| Harris Corp. 5.054% 2045 | 5,735 | 6,828 |
| Infor (US), Inc. 6.50% 2022 | 500 | 499 |
| Infor Inc. 5.75% 20205 | 5,375 | 5,691 |
| Jabil Circuit, Inc. 8.25% 2018 | 20,925 | 22,834 |
| Jabil Circuit, Inc. 5.625% 2020 | 10,650 | 11,459 |
| KLA-Tencor Corp. 4.65% 2024 | 5,000 | 5,526 |
| Micron Technology, Inc. 7.50% 20235 | 5,050 | 5,534 |
| Microsoft Corp. 2.65% 2022 | 6,000 | 6,292 |
| Microsoft Corp. 4.20% 2035 | 6,000 | 6,846 |
| NXP BV and NXP Funding LLC 4.125% 20205 | 21,000 | 21,683 |
| NXP BV and NXP Funding LLC 4.125% 20215 | 15,300 | 15,874 |
| Oracle Corp. 2.50% 2022 | 19,000 | 19,567 |
| Qorvo, Inc. 7.00% 20255 | 16,650 | 18,128 |
| Seagate Technology LLC 4.75% 2023 | 20,700 | 19,320 |
| Visa Inc. 3.15% 2025 | 8,000 | 8,606 |
| Western Digital Corp. 7.375% 20235 | 22,725 | 24,799 |
| Western Digital Corp. 10.50% 20245 | 3,500 | 3,955 |
| Western Digital Corp., Term Loan B, 6.25% 20237,8,9 | 5,000 | 5,059 |
| 521,059 | ||
| Consumer staples 0.47% | ||
| Altria Group, Inc. 9.25% 2019 | 18,542 | 22,811 |
| Altria Group, Inc. 2.625% 2020 | 10,420 | 10,880 |
| Altria Group, Inc. 4.00% 2024 | 1,500 | 1,696 |
| Altria Group, Inc. 9.95% 2038 | 23,500 | 43,103 |
| Altria Group, Inc. 4.25% 2042 | 20,000 | 22,946 |
| Altria Group, Inc. 4.50% 2043 | 4,000 | 4,726 |
| Altria Group, Inc. 5.375% 2044 | 2,595 | 3,433 |
| Bonds, notes & other debt instruments Corporate bonds & notes (continued) Consumer staples (continued) |
Principal amount (000) |
Value (000) |
| Anheuser-Busch InBev NV 7.75% 2019 | $25,000 | $28,828 |
| Anheuser-Busch InBev NV 2.65% 2021 | 2,875 | 2,983 |
| Anheuser-Busch InBev NV 4.90% 2046 | 3,315 | 4,078 |
| British American Tobacco International Finance PLC 9.50% 20185 | 8,705 | 10,247 |
| British American Tobacco International Finance PLC 3.95% 20255 | 8,000 | 9,061 |
| Coca-Cola Co. 1.80% 2016 | 10,000 | 10,011 |
| Constellation Brands, Inc. 3.875% 2019 | 6,000 | 6,362 |
| Constellation Brands, Inc. 6.00% 2022 | 2,825 | 3,294 |
| Constellation Brands, Inc. 4.25% 2023 | 6,000 | 6,390 |
| CVS Health Corp. 2.125% 2021 | 4,010 | 4,094 |
| CVS Health Corp. 2.875% 2026 | 3,795 | 3,916 |
| Imperial Tobacco Finance PLC 3.50% 20235 | 10,000 | 10,500 |
| Kimberly-Clark Corp. 7.50% 2018 | 9,000 | 10,263 |
| Kraft Foods Inc. 5.00% 2042 | 30,000 | 35,294 |
| Kraft Heinz Co. 4.375% 20465 | 5,420 | 5,926 |
| Molson Coors Brewing Co. 1.45% 2019 | 4,245 | 4,273 |
| Molson Coors Brewing Co. 2.10% 2021 | 5,475 | 5,558 |
| Molson Coors Brewing Co. 3.00% 2026 | 4,755 | 4,867 |
| Molson Coors Brewing Co. 4.20% 2046 | 4,200 | 4,438 |
| Pernod Ricard SA 2.95% 20175 | 20,000 | 20,139 |
| Pernod Ricard SA 4.45% 20225 | 9,500 | 10,520 |
| Philip Morris International Inc. 1.875% 2021 | 1,830 | 1,860 |
| Philip Morris International Inc. 3.60% 2023 | 7,245 | 8,063 |
| Philip Morris International Inc. 2.75% 2026 | 1,505 | 1,572 |
| Philip Morris International Inc. 4.25% 2044 | 2,000 | 2,273 |
| Post Holdings, Inc. 5.00% 20265 | 7,670 | 7,665 |
| Reynolds American Inc. 2.30% 2018 | 1,990 | 2,026 |
| Reynolds American Inc. 3.25% 2020 | 5,510 | 5,833 |
| Reynolds American Inc. 3.25% 2022 | 6,150 | 6,415 |
| Reynolds American Inc. 4.00% 2022 | 890 | 978 |
| Reynolds American Inc. 4.45% 2025 | 22,110 | 25,008 |
| Reynolds American Inc. 5.70% 2035 | 3,760 | 4,754 |
| Reynolds American Inc. 6.15% 2043 | 1,820 | 2,457 |
| Reynolds American Inc. 5.85% 2045 | 10,200 | 13,527 |
| SABMiller Holdings Inc. 4.95% 20425 | 7,000 | 8,407 |
| The JM Smucker Co. 3.00% 2022 | 2,850 | 3,011 |
| Walgreens Boots Alliance, Inc. 2.60% 2021 | 16,805 | 17,254 |
| Walgreens Boots Alliance, Inc. 3.30% 2021 | 13,000 | 13,816 |
| Walgreens Boots Alliance, Inc. 3.10% 2023 | 900 | 931 |
| Walgreens Boots Alliance, Inc. 3.45% 2026 | 1,770 | 1,858 |
| Walgreens Boots Alliance, Inc. 4.65% 2046 | 1,045 | 1,181 |
| Wal-Mart Stores, Inc. 3.30% 2024 | 10,755 | 11,905 |
| WM. Wrigley Jr. Co 2.40% 20185 | 1,200 | 1,225 |
| WM. Wrigley Jr. Co 2.90% 20195 | 1,200 | 1,247 |
| WM. Wrigley Jr. Co 3.375% 20205 | 22,500 | 24,051 |
| 477,954 | ||
| Total corporate bonds & notes | 14,383,867 | |
| U.S. Treasury bonds & notes 5.81% U.S. Treasury 5.37% |
||
| U.S. Treasury 0.50% 2017 | 10,000 | 10,005 |
| U.S. Treasury 0.875% 2017 | 40,000 | 40,105 |
| U.S. Treasury 0.875% 2017 | 20,000 | 20,056 |
| Bonds, notes & other debt instruments U.S. Treasury bonds & notes (continued) U.S. Treasury (continued) |
Principal amount (000) |
Value (000) |
| U.S. Treasury 1.00% 201711 | $10,000 | $10,052 |
| U.S. Treasury 0.625% 2018 | 120,000 | 119,948 |
| U.S. Treasury 0.75% 201811 | 170,000 | 170,286 |
| U.S. Treasury 0.75% 2018 | 18,000 | 18,029 |
| U.S. Treasury 1.125% 2018 | 16,000 | 16,138 |
| U.S. Treasury 1.25% 2018 | 86,000 | 87,082 |
| U.S. Treasury 0.875% 2019 | 93,000 | 93,338 |
| U.S. Treasury 1.00% 2019 | 25,000 | 25,180 |
| U.S. Treasury 1.75% 2019 | 56,000 | 57,652 |
| U.S. Treasury 3.625% 2019 | 90,000 | 97,710 |
| U.S. Treasury 1.25% 2020 | 180,000 | 182,457 |
| U.S. Treasury 1.375% 2020 | 85,000 | 86,448 |
| U.S. Treasury 1.375% 2020 | 43,000 | 43,769 |
| U.S. Treasury 1.375% 2020 | 40,000 | 40,691 |
| U.S. Treasury 1.50% 2020 | 22,000 | 22,495 |
| U.S. Treasury 1.625% 2020 | 121,800 | 125,190 |
| U.S. Treasury 1.625% 2020 | 9,960 | 10,232 |
| U.S. Treasury 1.125% 2021 | 51,990 | 52,246 |
| U.S. Treasury 1.375% 2021 | 144,000 | 146,382 |
| U.S. Treasury 1.375% 2021 | 75,835 | 77,117 |
| U.S. Treasury 1.75% 2022 | 159,235 | 164,361 |
| U.S. Treasury 2.00% 2022 | 104,000 | 108,855 |
| U.S. Treasury 6.25% 2023 | 69,000 | 92,272 |
| U.S. Treasury 2.25% 2024 | 29,450 | 31,461 |
| U.S. Treasury 2.00% 2025 | 513,475 | 538,106 |
| U.S. Treasury 1.625% 2026 | 167,066 | 169,592 |
| U.S. Treasury 1.625% 2026 | 136,236 | 138,354 |
| U.S. Treasury 5.50% 2028 | 52,000 | 74,531 |
| U.S. Treasury 4.50% 2036 | 36,186 | 52,638 |
| U.S. Treasury 4.625% 2040 | 15,150 | 22,609 |
| U.S. Treasury 4.375% 2041 | 20,800 | 30,196 |
| U.S. Treasury 4.75% 2041 | 30,900 | 47,113 |
| U.S. Treasury 2.75% 2042 | 16,275 | 18,293 |
| U.S. Treasury 2.75% 2042 | 10,900 | 12,268 |
| U.S. Treasury 3.125% 2043 | 33,675 | 40,549 |
| U.S. Treasury 3.00% 2044 | 161,350 | 189,657 |
| U.S. Treasury 3.125% 2044 | 131,950 | 158,748 |
| U.S. Treasury 3.375% 2044 | 148,415 | 186,846 |
| U.S. Treasury 2.50% 2045 | 49,975 | 53,248 |
| U.S. Treasury 2.875% 2045 | 929,150 | 1,066,608 |
| U.S. Treasury 3.00% 2045 | 213,249 | 250,858 |
| U.S. Treasury 3.00% 2045 | 51,200 | 60,166 |
| U.S. Treasury 2.50% 2046 | 291,995 | 311,480 |
| U.S. Treasury 2.50% 2046 | 84,650 | 90,470 |
| 5,461,887 | ||
| U.S. Treasury inflation-protected securities 0.44% | ||
| U.S. Treasury Inflation-Protected Security 0.625% 202412 | 61,768 | 64,775 |
| U.S. Treasury Inflation-Protected Security 0.375% 202512 | 89,318 | 92,373 |
| U.S. Treasury Inflation-Protected Security 0.625% 202612 | 46,461 | 49,040 |
| U.S. Treasury Inflation-Protected Security 0.75% 204212 | 29,070 | 30,171 |
| U.S. Treasury Inflation-Protected Security 1.375% 204412 | 101,340 | 121,179 |
| Bonds, notes & other debt instruments U.S. Treasury bonds & notes (continued) U.S. Treasury inflation-protected securities (continued) |
Principal amount (000) |
Value (000) |
| U.S. Treasury Inflation-Protected Security 0.75% 204512 | $8,517 | $8,878 |
| U.S. Treasury Inflation-Protected Security 1.00% 204612 | 67,988 | 76,103 |
| 442,519 | ||
| Total U.S. Treasury bonds & notes | 5,904,406 | |
| Mortgage-backed obligations 1.81% | ||
| Aventura Mall Trust, Series A, 3.867% 20325,7,9 | 4,900 | 5,299 |
| Banc of America Commercial Mortgage Inc., Series 2007-3, Class A-4, 5.543% 20497,9 | 3,525 | 3,587 |
| Bank of America Merrill Lynch Large Loan Inc., Series 2015-200P, Class A, 3.218% 20335,9 | 5,575 | 5,987 |
| Bellemeade Re Ltd., Series 2015-1-A, Class M-1, 2.946% 20253,5,7,9 | 3,270 | 3,262 |
| Citigroup-Deutsche Bank Commercial Mortgage Trust, Series 2006-CD3, Class A-5, 5.617% 20489 | 2,482 | 2,480 |
| COMM Mortgage Trust, Series 2014-277P, Class A, 3.732% 20495,7,9 | 6,500 | 7,201 |
| Connecticut Avenue Securities, Series 2015-C01, Class 1-M-1, 1.953% 20257,9 | 1,225 | 1,229 |
| Core Industrial Trust, Series 2015-CALW, Class A, 3.04% 20345,9 | 10,675 | 11,300 |
| Countrywide Alternative Loan Trust, Series 2005-54CB, Class 2-A-5, 5.50% 20359 | 4,924 | 4,301 |
| Countrywide Alternative Loan Trust, Series 2007-HY4, Class 3-A-1, 2.985% 20477,9 | 3,425 | 2,476 |
| CS First Boston Mortgage Securities Corp., Series 2004-5, Class IV-A-1, 6.00% 20349 | 1,054 | 1,076 |
| CS First Boston Mortgage Securities Corp., Series 2006-C5, Class A-M, 5.343% 20399 | 8,000 | 8,051 |
| CS First Boston Mortgage Securities Corp., Series 2007-C5, Class A4, 5.695% 20407,9 | 9,586 | 9,868 |
| CS First Boston Mortgage Securities Corp., Series 2007-C2, Class A-M, 5.603% 20497,9 | 10,000 | 10,158 |
| DBUBS Mortgage Trust, Series 2011-LC1A, Class A1, 3.742% 20465,9 | 117 | 118 |
| EQTY 2014-INNS Mortgage Trust Commercial Mortgage Pass-Through Certificates, Series 2014-A, 1.298% 20315,7,9 |
5,114 | 5,091 |
| Fannie Mae 5.50% 20189 | 12 | 12 |
| Fannie Mae 6.00% 20219 | 116 | 126 |
| Fannie Mae 4.50% 20249 | 1,543 | 1,646 |
| Fannie Mae 5.50% 20249 | 147 | 160 |
| Fannie Mae 4.50% 20259 | 1,432 | 1,525 |
| Fannie Mae 4.50% 20259 | 943 | 1,017 |
| Fannie Mae 4.50% 20259 | 861 | 929 |
| Fannie Mae 4.50% 20259 | 767 | 815 |
| Fannie Mae 6.00% 20269 | 2,623 | 2,993 |
| Fannie Mae 7.00% 20269 | 404 | 470 |
| Fannie Mae 2.50% 20279 | 1,197 | 1,244 |
| Fannie Mae 2.50% 20279 | 926 | 962 |
| Fannie Mae 2.50% 20279 | 903 | 938 |
| Fannie Mae 2.50% 20279 | 694 | 720 |
| Fannie Mae 2.50% 20279 | 512 | 531 |
| Fannie Mae 2.50% 20279 | 429 | 446 |
| Fannie Mae 2.50% 20279 | 397 | 412 |
| Fannie Mae 2.50% 20289 | 31,201 | 32,401 |
| Fannie Mae 2.50% 20289 | 10,806 | 11,222 |
| Fannie Mae 2.50% 20289 | 1,552 | 1,611 |
| Fannie Mae 2.50% 20289 | 1,394 | 1,447 |
| Fannie Mae 2.50% 20289 | 1,349 | 1,400 |
| Fannie Mae 2.50% 20289 | 1,182 | 1,227 |
| Fannie Mae 2.50% 20289 | 1,156 | 1,200 |
| Fannie Mae 2.50% 20289 | 1,004 | 1,043 |
| Fannie Mae 2.50% 20289 | 1,000 | 1,038 |
| Fannie Mae 2.50% 20289 | 738 | 766 |
| Fannie Mae 2.50% 20289 | 722 | 749 |
| Fannie Mae 2.50% 20289 | 712 | 739 |
| Fannie Mae 2.50% 20289 | 554 | 575 |
| Bonds, notes & other debt instruments Mortgage-backed obligations (continued) |
Principal amount (000) |
Value (000) |
| Fannie Mae 2.50% 20289 | $455 | $472 |
| Fannie Mae 2.50% 20289 | 447 | 464 |
| Fannie Mae 2.50% 20289 | 419 | 434 |
| Fannie Mae 2.50% 20289 | 418 | 434 |
| Fannie Mae 2.50% 20289 | 395 | 411 |
| Fannie Mae 2.50% 20289 | 393 | 408 |
| Fannie Mae 2.50% 20289 | 383 | 398 |
| Fannie Mae 2.50% 20289 | 370 | 384 |
| Fannie Mae 2.50% 20289 | 367 | 381 |
| Fannie Mae 2.50% 20289 | 352 | 365 |
| Fannie Mae 2.50% 20289 | 259 | 269 |
| Fannie Mae 2.50% 20289 | 87 | 90 |
| Fannie Mae 2.50% 20289 | 46 | 47 |
| Fannie Mae 6.00% 20289 | 2,775 | 3,179 |
| Fannie Mae 7.00% 20289 | 927 | 1,088 |
| Fannie Mae 7.00% 20289 | 211 | 248 |
| Fannie Mae 2.50% 20319,13 | 124,500 | 128,984 |
| Fannie Mae 5.50% 20339 | 409 | 463 |
| Fannie Mae 3.00% 20359 | 3,463 | 3,641 |
| Fannie Mae 3.50% 20359 | 2,917 | 3,103 |
| Fannie Mae 5.50% 20359 | 381 | 433 |
| Fannie Mae 5.50% 20369 | 2,544 | 2,892 |
| Fannie Mae 6.00% 20369 | 977 | 1,114 |
| Fannie Mae 6.00% 20369 | 694 | 790 |
| Fannie Mae 6.00% 20369 | 320 | 368 |
| Fannie Mae 6.00% 20379 | 11,449 | 13,141 |
| Fannie Mae 6.00% 20379 | 1,964 | 2,262 |
| Fannie Mae 6.00% 20379 | 1,468 | 1,686 |
| Fannie Mae 6.00% 20379 | 99 | 114 |
| Fannie Mae 6.50% 20379 | 680 | 789 |
| Fannie Mae 6.50% 20379 | 600 | 702 |
| Fannie Mae 6.50% 20379 | 428 | 482 |
| Fannie Mae 6.50% 20379 | 113 | 131 |
| Fannie Mae 7.00% 20379 | 435 | 485 |
| Fannie Mae 7.00% 20379 | 138 | 154 |
| Fannie Mae 7.50% 20379 | 183 | 208 |
| Fannie Mae 7.50% 20379 | 112 | 122 |
| Fannie Mae 7.50% 20379 | 86 | 94 |
| Fannie Mae 5.50% 20389 | 552 | 621 |
| Fannie Mae 6.00% 20389 | 2,567 | 2,933 |
| Fannie Mae 6.00% 20389 | 1,466 | 1,684 |
| Fannie Mae 6.00% 20389 | 1,307 | 1,494 |
| Fannie Mae 4.50% 20399 | 20,756 | 22,877 |
| Fannie Mae 6.00% 20399 | 1,450 | 1,652 |
| Fannie Mae 6.50% 20399 | 503 | 585 |
| Fannie Mae 4.00% 20409 | 10,675 | 11,565 |
| Fannie Mae 4.00% 20409 | 6,219 | 6,692 |
| Fannie Mae 4.00% 20409 | 425 | 463 |
| Fannie Mae 4.50% 20409 | 65 | 71 |
| Fannie Mae 4.50% 20409 | 38 | 41 |
| Fannie Mae 5.00% 20409 | 6,807 | 7,540 |
| Fannie Mae 4.00% 20419 | 8,897 | 9,688 |
| Fannie Mae 4.00% 20419 | 6,880 | 7,489 |
| Fannie Mae 4.00% 20419 | 692 | 755 |
| Fannie Mae 4.00% 20419 | 425 | 464 |
| Bonds, notes & other debt instruments Mortgage-backed obligations (continued) |
Principal amount (000) |
Value (000) |
| Fannie Mae 4.00% 20419 | $320 | $349 |
| Fannie Mae 4.00% 20419 | 219 | 240 |
| Fannie Mae 4.50% 20419 | 217 | 238 |
| Fannie Mae 5.00% 20419 | 416 | 462 |
| Fannie Mae 5.00% 20419 | 388 | 431 |
| Fannie Mae 5.00% 20419 | 317 | 352 |
| Fannie Mae 5.00% 20419 | 279 | 311 |
| Fannie Mae 3.50% 20429 | 16,422 | 17,393 |
| Fannie Mae 4.00% 20429 | 7,968 | 8,680 |
| Fannie Mae 4.00% 20429 | 3,351 | 3,656 |
| Fannie Mae 4.00% 20429 | 1,139 | 1,241 |
| Fannie Mae 4.00% 20439 | 8,836 | 9,670 |
| Fannie Mae 4.00% 20439 | 8,394 | 9,192 |
| Fannie Mae 4.00% 20439 | 3,381 | 3,701 |
| Fannie Mae 4.00% 20439 | 3,359 | 3,687 |
| Fannie Mae 4.00% 20439 | 3,060 | 3,351 |
| Fannie Mae 4.00% 20439 | 3,041 | 3,330 |
| Fannie Mae 4.00% 20439 | 2,669 | 2,931 |
| Fannie Mae 4.00% 20439 | 2,241 | 2,442 |
| Fannie Mae 3.50% 20459 | 17,867 | 19,100 |
| Fannie Mae 4.00% 20459 | 73,611 | 78,967 |
| Fannie Mae 4.00% 20459 | 55,347 | 60,315 |
| Fannie Mae 4.00% 20459 | 8,931 | 9,735 |
| Fannie Mae 3.00% 20469,13 | 2,655 | 2,763 |
| Fannie Mae 3.50% 20469,13 | 50,000 | 52,813 |
| Fannie Mae 3.50% 20469 | 31,399 | 33,566 |
| Fannie Mae 4.00% 20469 | 27,176 | 29,148 |
| Fannie Mae 4.00% 20469,13 | 7,712 | 8,267 |
| Fannie Mae 4.50% 20469 | 45,821 | 50,327 |
| Fannie Mae 4.50% 20469 | 40,917 | 44,940 |
| Fannie Mae 4.50% 20469 | 22,158 | 24,337 |
| Fannie Mae 4.50% 20469 | 7,017 | 7,693 |
| Fannie Mae 6.50% 20479 | 468 | 533 |
| Fannie Mae 6.50% 20479 | 331 | 377 |
| Fannie Mae 6.50% 20479 | 290 | 330 |
| Fannie Mae 6.50% 20479 | 183 | 209 |
| Fannie Mae 6.50% 20479 | 123 | 139 |
| Fannie Mae 6.50% 20479 | 78 | 89 |
| Fannie Mae 7.00% 20479 | 520 | 600 |
| Fannie Mae 7.00% 20479 | 288 | 332 |
| Fannie Mae 7.00% 20479 | 192 | 221 |
| Fannie Mae 7.00% 20479 | 100 | 116 |
| Fannie Mae, Series 2012-M14, Class A2, multifamily 2.301% 20227,9 | 4,285 | 4,400 |
| Fannie Mae, Series 2012-M9, Class A2, multifamily 2.482% 20229 | 12,231 | 12,685 |
| Fannie Mae, Series 2012-M5, Class A2, multifamily 2.715% 20229 | 7,000 | 7,341 |
| Fannie Mae, Series 2013-M14, Class A2, multifamily 3.329% 20237,9 | 8,367 | 9,145 |
| Fannie Mae, Series 2014-M2, Class A2, multifamily 3.513% 20237,9 | 9,215 | 10,274 |
| Fannie Mae, Series 2014-M9, multifamily 3.103% 20247,9 | 7,990 | 8,608 |
| Fannie Mae, Series 2014-M3, Class A2, multifamily 3.501% 20247,9 | 10,000 | 10,993 |
| Fannie Mae, Series 2001-4, Class GA, 9.363% 20257,9 | 60 | 67 |
| Fannie Mae, Series 2001-4, Class NA, 9.696% 20257,9 | 1 | 1 |
| Fannie Mae, Series 2001-20, Class E, 9.584% 20317,9 | 64 | 69 |
| Fannie Mae, Series 2007-33, Class HE, 5.50% 20379 | 4,003 | 4,528 |
| Fannie Mae, Series 2007-24, Class P, 6.00% 20379 | 2,200 | 2,459 |
| Fannie Mae, Series 2001-50, Class BA, 7.00% 20419 | 353 | 410 |
| Bonds, notes & other debt instruments Mortgage-backed obligations (continued) |
Principal amount (000) |
Value (000) |
| Fannie Mae, Series 2001-T10, Class A1, 7.00% 20419 | $335 | $397 |
| Fannie Mae, Series 2002-W3, Class A-5, 7.50% 20419 | 220 | 259 |
| Fannie Mae, Series 2002-W1, Class 2A, 6.233% 20427,9 | 582 | 692 |
| Financial Asset Securitization, Inc., Series 1997-NAM1, Class B-1, 7.75% 20279 | 7 | 7 |
| Freddie Mac 5.00% 20239 | 1,746 | 1,887 |
| Freddie Mac 5.00% 20239 | 1,693 | 1,829 |
| Freddie Mac 5.00% 20239 | 1,604 | 1,736 |
| Freddie Mac 5.00% 20239 | 594 | 646 |
| Freddie Mac 3.50% 20349 | 30,381 | 32,346 |
| Freddie Mac 3.00% 20359 | 13,506 | 14,200 |
| Freddie Mac 3.50% 20359 | 30,693 | 32,684 |
| Freddie Mac 3.50% 20359 | 28,115 | 29,939 |
| Freddie Mac 3.50% 20359 | 3,724 | 3,967 |
| Freddie Mac 4.50% 20359 | 11,853 | 12,949 |
| Freddie Mac 5.50% 20379 | 438 | 489 |
| Freddie Mac 5.50% 20389 | 1,444 | 1,626 |
| Freddie Mac 6.50% 20389 | 1,558 | 1,788 |
| Freddie Mac 4.50% 20399 | 1,081 | 1,183 |
| Freddie Mac 5.00% 20399 | 2,759 | 3,088 |
| Freddie Mac 5.00% 20399 | 1,710 | 1,882 |
| Freddie Mac 5.00% 20399 | 1,074 | 1,183 |
| Freddie Mac 5.50% 20399 | 699 | 782 |
| Freddie Mac 4.50% 20409 | 25,799 | 28,190 |
| Freddie Mac 4.00% 20419 | 1,915 | 2,061 |
| Freddie Mac 4.50% 20419 | 2,370 | 2,583 |
| Freddie Mac 4.50% 20419 | 1,940 | 2,123 |
| Freddie Mac 4.50% 20419 | 1,881 | 2,061 |
| Freddie Mac 5.00% 20419 | 174 | 193 |
| Freddie Mac 4.50% 20429 | 4,126 | 4,516 |
| Freddie Mac 4.50% 20429 | 2,445 | 2,670 |
| Freddie Mac 4.00% 20439 | 6,020 | 6,580 |
| Freddie Mac 4.00% 20439 | 5,988 | 6,524 |
| Freddie Mac 4.00% 20439 | 4,699 | 5,146 |
| Freddie Mac 4.00% 20439 | 3,394 | 3,710 |
| Freddie Mac 4.00% 20439 | 2,987 | 3,289 |
| Freddie Mac 4.00% 20439 | 2,697 | 2,938 |
| Freddie Mac 3.50% 20459 | 33,721 | 36,163 |
| Freddie Mac 4.00% 20459 | 33,898 | 36,912 |
| Freddie Mac 3.50% 20469 | 46,577 | 49,313 |
| Freddie Mac 3.50% 20469 | 14,961 | 15,801 |
| Freddie Mac 4.00% 20469 | 59,505 | 63,973 |
| Freddie Mac 4.00% 20469 | 15,000 | 16,064 |
| Freddie Mac 4.50% 20469 | 16,080 | 17,610 |
| Freddie Mac 4.50% 20469 | 6,403 | 7,012 |
| Freddie Mac, Series 2890, Class KT, 4.50% 20199 | 8,504 | 8,779 |
| Freddie Mac, Series K019, Class A2, multifamily 2.272% 20229 | 8,000 | 8,272 |
| Freddie Mac, Series K021, Class A2, multifamily 2.396% 20229 | 8,280 | 8,620 |
| Freddie Mac, Series K025, Class A2, multifamily 2.682% 20229 | 7,000 | 7,406 |
| Freddie Mac, Series 2289, Class NB, 9.00% 20227,9 | 6 | 7 |
| Freddie Mac, Series 2013-DN2, Class M-1, 1.903% 20237,9 | 1,700 | 1,711 |
| Freddie Mac, Series K036, Class A1, multifamily 2.777% 20239 | 10,579 | 11,077 |
| Freddie Mac, Series K028, Class A2, multifamily 3.111% 20239 | 9,800 | 10,629 |
| Freddie Mac, Series K035, Class A2, multifamily 3.458% 20237,9 | 3,000 | 3,328 |
| Freddie Mac, Series K036, Class A2, multifamily 3.527% 20237,9 | 9,150 | 10,196 |
| Freddie Mac, Series 2013-DN1, Class M-1, 3.853% 20237,9 | 2,140 | 2,188 |
| Bonds, notes & other debt instruments Mortgage-backed obligations (continued) |
Principal amount (000) |
Value (000) |
| Freddie Mac, Series 2014-HQ2, Class M-1, 1.903% 20247,9 | $2,994 | $3,013 |
| Freddie Mac, Series 2014-HQ2, Class M-2, 2.653% 20247,9 | 5,815 | 5,901 |
| Freddie Mac, Series 2014-DN4, Class M-2, 2.853% 20247,9 | 3,626 | 3,661 |
| Freddie Mac, Series K043, Class A2, multifamily 3.062% 20249 | 26,000 | 28,345 |
| Freddie Mac, Series K041, Class A2, multifamily 3.171% 20249 | 1,300 | 1,426 |
| Freddie Mac, Series 2015-HQ2, Class M-2, 2.403% 20257,9 | 3,600 | 3,636 |
| Freddie Mac, Series 3257, Class PA, 5.50% 20369 | 4,506 | 5,137 |
| Freddie Mac, Series 3286, Class JN, 5.50% 20379 | 3,631 | 4,110 |
| Freddie Mac, Series 3318, Class JT, 5.50% 20379 | 1,973 | 2,235 |
| Government National Mortgage Assn. 10.00% 20219 | 145 | 158 |
| Government National Mortgage Assn. 10.00% 20259 | 117 | 126 |
| Government National Mortgage Assn. 4.50% 20419 | 1,285 | 1,381 |
| Government National Mortgage Assn. 4.00% 20459 | 7,078 | 7,559 |
| Government National Mortgage Assn. 4.50% 20459 | 7,678 | 8,273 |
| Government National Mortgage Assn. 3.50% 20469,13 | 6,000 | 6,377 |
| Greenwich Capital Commercial Funding Corp., Series 2007-GG9, Class A-4, 5.444% 20399 | 8,327 | 8,402 |
| Greenwich Capital Commercial Funding Corp., Series 2007-GG11, Class A-M, 5.867% 20497,9 | 7,879 | 8,123 |
| GS Mortgage Securities Corp. II, Series 2015-GS-1, Class AAB, 3.553% 20489 | 4,000 | 4,365 |
| GSR Mortgage Loan Trust, Series 2004-2F, Class VIIA-1, 4.50% 20199 | 332 | 331 |
| Hilton USA Trust, Series 2013-HLF, Class AFX, 2.662% 20305,9 | 6,555 | 6,630 |
| IndyMac INDX Mortgage Loan Trust, Series 2006-AR5, Class 2-A-1, 3.098% 20367,9 | 5,219 | 4,474 |
| J.P. Morgan Chase Commercial Mortgage Securities Corp., Series 2011-C3A, Class A-2, 3.673% 20465,9 | 153 | 154 |
| J.P. Morgan Chase Commercial Mortgage Securities Corp., Series 2007-CB19, Class A-1-A, 5.887% 20497,9 | 10,306 | 10,539 |
| J.P. Morgan Chase Commercial Mortgage Securities Corp., Series 2007-C1, Class A-4, 5.716% 20519 | 4,376 | 4,518 |
| J.P. Morgan Chase Commercial Mortgage Securities Corp., Series 2007-LD12, Class A-M, 6.207% 20517,9 | 20,950 | 21,636 |
| J.P. Morgan Chase Commercial Mortgage Securities Trust, Series 2006-LDP9, Class A-M, 5.372% 20479 | 17,000 | 17,107 |
| J.P. Morgan Chase Commercial Mortgage Securities Trust, Series 2007-CB19, Class A-4, 5.699% 20497,9 | 14,985 | 15,289 |
| L.A. Arena Funding, LLC, Series 1, Class A, 7.656% 20265,9 | 4,498 | 4,889 |
| LB-UBS Commercial Mortgage Trust, Series 2007-C2, Class A-1-A, 5.387% 20409 | 8,776 | 8,907 |
| LB-UBS Commercial Mortgage Trust, Series 2007-C2, Class A-3, 5.43% 20409 | 9,708 | 9,830 |
| LB-UBS Commercial Mortgage Trust, Series 2007-C2, Class A-M, 5.493% 20407,9 | 18,000 | 18,372 |
| LB-UBS Commercial Mortgage Trust, Series 2007-C6, Class A-M, 6.114% 20407,9 | 10,035 | 10,348 |
| Merrill Lynch Mortgage Trust, Series 2007-C1, Class A-4, 6.021% 20507,9 | 3,460 | 3,557 |
| ML-CFC Commercial Mortgage Trust, Series 2006-4, Class A-3, 5.172% 20499 | 15,218 | 15,269 |
| ML-CFC Commercial Mortgage Trust, Series 2007-8, Class A-3, 6.071% 20497,9 | 11,096 | 11,410 |
| Morgan Stanley Capital I Trust, Series 2014-CPT, Class A, 3.35% 20295,9 | 8,745 | 9,339 |
| Morgan Stanley Capital I Trust, Series 2011-C3, Class A-2, 3.224% 20499 | 297 | 297 |
| National Australia Bank 1.25% 20185,9 | 5,000 | 5,003 |
| Station Place Securitization Trust, Series 2016-3, Class A, 1.546% 20483,5,7,9 | 10,500 | 10,500 |
| Structured Adjustable Rate Mortgage Loan Trust, Series 2006-4, Class 6-A, 4.482% 20367,9 | 3,419 | 2,784 |
| Wachovia Bank Commercial Mortgage Trust, Series 2007-C30, Class A-5, 5.342% 20439 | 8,000 | 8,105 |
| Wachovia Bank Commercial Mortgage Trust, Series 2007-C31, Class A-M, 5.591% 20477,9 | 19,050 | 19,410 |
| Wachovia Bank Commercial Mortgage Trust, Series 2007-C32, Class A-3, 5.889% 20497,9 | 8,500 | 8,708 |
| Wachovia Bank Commercial Mortgage Trust, Series 2007-C33, Class A-M, 6.147% 20517,9 | 8,500 | 8,725 |
| 1,838,809 | ||
| Asset-backed obligations 0.32% | ||
| Aesop Funding LLC, Series 2014-2A, Class A, 2.50% 20215,9 | 10,500 | 10,600 |
| Aesop Funding LLC, Series 2015-1, Class A, 2.50% 20215,9 | 10,000 | 10,112 |
| Aesop Funding LLC, Series 2015-2-A, Class A, 2.63% 20215,9 | 5,680 | 5,766 |
| American Express Credit Account Master Trust, Series 2014-4, Class A, 1.43% 20209 | 7,155 | 7,192 |
| AmeriCredit Automobile Receivables Trust, Series 2015-1, Class A-3, 1.26% 20199 | 6,130 | 6,131 |
| AmeriCredit Automobile Receivables Trust, Series 2014-4, Class A-3, 1.27% 20199 | 4,810 | 4,812 |
| AmeriCredit Automobile Receivables Trust, Series 2015-2, Class C, 2.40% 20219 | 6,000 | 6,090 |
| Avant Loans Funding Trust, Series 2016-A, Class A, 4.11% 20195,9 | 4,313 | 4,312 |
| Bonds, notes & other debt instruments Asset-backed obligations (continued) |
Principal amount (000) |
Value (000) |
| Avant Loans Funding Trust, Series 2015-A, Class A, 4.00% 20215,9 | $1,380 | $1,391 |
| Bank of the West Auto Trust, Series 2014-1, Class A-3, 1.09% 20195,9 | 2,243 | 2,243 |
| Cabela’s Master Credit Card Trust, Series 2016-1, Class A1, 1.78% 20229 | 8,230 | 8,255 |
| Capital One Multi-asset Execution Trust, Series 2014-A5, Class A, 1.48% 20209 | 8,000 | 8,038 |
| CarMaxAuto Owner Trust, Series 2014-4, Class A-3, 1.25% 20199 | 6,600 | 6,601 |
| Chesapeake Funding LLC, Series 2014-1-A, Class A, 0.885% 20265,7,9 | 2,916 | 2,907 |
| Citibank Credit Card Issuance Trust, Series 2008-A-2, Class A2, 1.601% 20207,9 | 14,000 | 14,188 |
| Conseco Finance Home Loan Trust, Series 1999-G, Class B-2, 10.96% 20299 | 13,630 | 958 |
| Countryplace Manufactured Housing Contract, Series 2005-1, Class A-3, AMBAC insured, 4.80% 20355,9 | 179 | 179 |
| Countryplace Manufactured Housing Contract, Series 2005-1, Class A-4, AMBAC insured, 5.20% 20355,7,9 | 1,145 | 1,181 |
| CWHEQ Revolving Home Equity Loan Trust, Series 2006-I, Class 2-A, FSA insured, 0.621% 20377,9 | 1,496 | 1,325 |
| CWHEQ Revolving Home Equity Loan Trust, Series 2007-B, Class A, FSA insured, 0.631% 20377,9 | 2,647 | 2,444 |
| Drive Auto Receivables Trust, Series 2015-BA, Class C, 2.76% 20215,9 | 7,970 | 8,024 |
| Drive Auto Receivables Trust, Series 2015-AA, Class C, 3.06% 20215,9 | 8,900 | 8,990 |
| Drive Auto Receivables Trust, Series 2015-DA, Class C, 3.38% 20215,9 | 7,225 | 7,358 |
| Drive Auto Receivables Trust, Series 2016-AA, Class C, 3.91% 20215,9 | 10,000 | 10,289 |
| Enterprise Fleet Financing LLC, Series 2014-1, Class A2, 0.87% 20195,9 | 661 | 660 |
| Fifth Third Auto Trust, Series 2014-3, Class A3, 0.96% 20199 | 3,226 | 3,225 |
| Ford Credit Auto Owner Trust, Series 2014-1-A, 2.26% 20255,9 | 2,405 | 2,453 |
| Ford Credit Auto Owner Trust, Series 2015-1 Class A, 2.12% 20265,9 | 6,300 | 6,395 |
| Ford Credit Auto Owner Trust, Series 2014-2-A, 2.31% 20265,9 | 10,110 | 10,291 |
| Ford Credit Auto Owner Trust, Series 2016-2, Class A, 2.03% 20275,9 | 10,500 | 10,606 |
| Ford Credit Auto Owner Trust, Series 2016-1, Class A, 2.31% 20275,9 | 16,000 | 16,395 |
| Ford Credit Auto Owner Trust, Series 2015-2, Class A, 2.44% 20275,9 | 17,160 | 17,659 |
| Ford Credit Floorplan Master Owner Trust, Series 2015-2, Class A-1, 1.98% 20229 | 7,780 | 7,880 |
| Hertz Fleet Lease Funding LP, Series 2014-1-A, 0.845% 20285,7,9 | 1,306 | 1,306 |
| Hertz Vehicle Financing LLC, Rental Car Asset-backed Notes, Series 2013-1A, Class A-1, 1.12% 20175,9 | 1,417 | 1,416 |
| Hertz Vehicle Financing LLC, Rental Car Asset-backed Notes, Series 2013-1A, Class A-2, 1.83% 20195,9 | 8,500 | 8,476 |
| Hertz Vehicle Financing LLC, Rental Car Asset-backed Notes, Series 2015-3A, Class A, 2.67% 20215,9 | 6,290 | 6,365 |
| Hertz Vehicle Financing LLC, Rental Car Asset-backed Notes, Series 2015-1, Class A, 2.73% 20215,9 | 7,518 | 7,671 |
| Hertz Vehicle Financing LLC, Rental Car Asset-backed Notes, Series 2015-1, Class A, 3.52% 20215,9 | 2,210 | 2,236 |
| Home Equity Mortgage Trust, Series 2006-6, Class 2A-1, 0.653% 20377,9 | 12,944 | 1,312 |
| Honda Auto Receivables Owner Trust, Series 2014-3, Class A-3, 0.88% 20189 | 5,215 | 5,214 |
| IndyMac Home Equity Mortgage Loan Asset-backed Trust, Series 2007-H1, Class A-1, FSA insured, 0.648% 20377,9 |
1,529 | 1,345 |
| RAMP Trust, Series 2003-RZ4, Class A-7, 5.29% 20337,9 | 108 | 112 |
| Santander Drive Auto Receivables Trust, Series 2014-4, Class A3, 1.08% 20189 | 1,798 | 1,798 |
| Santander Drive Auto Receivables Trust, Series 2012-6, Class C, 1.94% 20189 | 1,730 | 1,732 |
| Santander Drive Auto Receivables Trust, Series 2014-5, Class A-3, 1.15% 20199 | 1,423 | 1,424 |
| Santander Drive Auto Receivables Trust, Series 2014-4, Class B, 1.82% 20199 | 6,000 | 6,015 |
| Santander Drive Auto Receivables Trust, Series 2014-2, Class C, 2.33% 20199 | 5,000 | 5,042 |
| Santander Drive Auto Receivables Trust, Series 2015-2, Class C, 2.44% 20219 | 16,550 | 16,666 |
| Santander Drive Auto Receivables Trust, Series 2015-1, Class C, 2.57% 20219 | 5,340 | 5,412 |
| Santander Drive Auto Receivables Trust, Series 2016-2, Class C, 2.66% 20219 | 2,430 | 2,456 |
| Santander Drive Auto Receivables Trust, Series 2015-5, Class C, 2.74% 20219 | 6,915 | 7,021 |
| Social Professional Loan Program LLC, Series 2015-D, Class A-2, 2.72% 20365,9 | 7,926 | 8,078 |
| Verizon Owner Trust, Series 2016-1A, Class A, 1.42% 20215,9 | 6,075 | 6,084 |
| Volkswagen Auto Loan Enhanced Trust, Series 2014-2, Class A-3 0.95% 20199 | 8,656 | 8,651 |
| World Omni Auto Receivables Trust, Series 2014-B, Class A-3, 1.14% 20209 | 4,365 | 4,370 |
| 325,152 | ||
| Federal agency bonds & notes 0.07% | ||
| CoBank, ACB 1.253% 20225,7 | 3,700 | 3,552 |
| Fannie Mae 6.25% 2029 | 32,000 | 46,881 |
| Fannie Mae 7.125% 2030 | 1,500 | 2,381 |
| Bonds, notes & other debt instruments Federal agency bonds & notes (continued) |
Principal amount (000) |
Value (000) |
| Federal Home Loan Bank 0.875% 2018 | $12,860 | $12,894 |
| Tennessee Valley Authority, Series B, 3.50% 2042 | 500 | 565 |
| 66,273 | ||
| Bonds & notes of governments & government agencies outside the U.S. 0.06% | ||
| Hungary 6.25% 2020 | 3,410 | 3,805 |
| Slovenia (Republic of) 5.50% 2022 | 9,000 | 10,298 |
| Spain (Kingdom of) 4.00% 20185 | 31,765 | 33,058 |
| United Mexican States 3.60% 2025 | 6,000 | 6,293 |
| United Mexican States 4.125% 2026 | 6,900 | 7,511 |
| United Mexican States 5.55% 2045 | 3,500 | 4,213 |
| 65,178 | ||
| Municipals 0.04% | ||
| State of California, Various Purpose G.O. Bonds, 6.20% 2019 | 24,675 | 27,750 |
| State of New Jersey, Econ. Dev. Auth., School Facs. Construction Rev. Ref. Bonds, Series 2015-YY, 4.447% 2020 |
6,000 | 6,269 |
| State of New Jersey, Transportation Trust Fund Auth., Transportation System Rev. Ref. Bonds, Series 2013-B, 1.758% 2018 |
8,500 | 8,376 |
| 42,395 | ||
| Total bonds, notes & other debt instruments (cost: $21,794,167,000) | 22,626,080 | |
| Short-term securities 6.85% | ||
| 3M Co. 0.42%–0.45% due 9/19/2016–9/26/20165 | 75,000 | 74,953 |
| Air Products and Chemicals, Inc. 0.40% due 8/5/20165 | 37,000 | 36,997 |
| Apple Inc. 0.43%–0.44% due 10/11/2016–10/20/20165 | 121,475 | 121,370 |
| BNP Paribas Finance Inc. 0.30% due 8/1/2016 | 24,100 | 24,099 |
| CAFCO, LLC 0.60%–0.88% due 8/22/2016–11/21/2016 | 140,000 | 139,822 |
| Caterpillar Financial Services Corp. 0.45%–0.46% due 8/25/2016–9/6/2016 | 132,000 | 131,954 |
| Caterpillar Inc. 0.50% due 8/26/20165 | 13,000 | 12,996 |
| Chariot Funding, LLC 1.00% due 1/17/20175 | 25,000 | 24,875 |
| Chevron Corp. 0.52% due 8/2/2016–8/16/20165 | 117,600 | 117,590 |
| Ciesco LLC 0.57% due 8/1/2016 | 50,000 | 49,998 |
| Coca-Cola Co. 0.56%–0.69% due 8/9/2016–1/12/20175 | 214,800 | 214,447 |
| ExxonMobil Corp. 0.34%–0.44% due 8/16/2016–10/3/2016 | 157,000 | 156,925 |
| Fannie Mae 0.38%–0.53% due 9/8/2016–1/5/2017 | 200,000 | 199,756 |
| Federal Farm Credit Banks 0.44%–0.57% due 10/24/2016–5/25/2017 | 350,000 | 349,112 |
| Federal Home Loan Bank 0.25%–0.63% due 8/9/2016–5/15/2017 | 2,950,792 | 2,947,750 |
| Freddie Mac 0.33%–0.49% due 8/16/2016–2/2/2017 | 823,958 | 823,053 |
| GE Capital Treasury Services (U.S.) LLC 0.40% due 8/31/2016 | 50,000 | 49,984 |
| General Electric Co. 0.34% due 8/1/2016 | 40,700 | 40,699 |
| Honeywell International Inc. 0.49% due 10/19/20165 | 50,000 | 49,939 |
| IBM Corp. 0.45% due 9/26/20165 | 50,000 | 49,969 |
| Intel Corp. 0.41% due 8/30/2016 | 18,800 | 18,794 |
| Jupiter Securitization Co., LLC 0.45% due 8/25/20165 | 50,000 | 49,982 |
| Kimberly-Clark Corp. 0.42% due 8/22/20165 | 50,000 | 49,987 |
| Microsoft Corp. 0.42%–0.46% due 8/3/2016–9/14/20165 | 218,600 | 218,546 |
| Paccar Financial Corp. 0.53% due 9/16/2016 | 20,100 | 20,088 |
| PepsiCo Inc. 0.42% due 8/25/20165 | 85,000 | 84,977 |
| Pfizer Inc. 0.47%–0.67% due 9/12/2016–10/18/20165 | 227,200 | 227,036 |
| Private Export Funding Corp. 0.59% due 10/24/20165 | 40,000 | 39,950 |
| Qualcomm Inc. 0.48%–0.49% due 8/2/2016–9/7/20165 | 88,500 | 88,481 |
| Société Générale 0.29% due 8/1/20165 | 25,000 | 24,999 |
| Short-term securities | Principal amount (000) |
Value (000) |
| U.S. Treasury Bills 0.36%–0.46% due 8/18/2016–12/8/2016 | $232,900 | $232,835 |
| United Parcel Service Inc. 0.60% due 12/1/20165 | 50,000 | 49,909 |
| Walt Disney Co. 0.45% due 8/10/20165 | 50,000 | 49,994 |
| Wells Fargo Bank, N.A. 0.86%–1.05% due 11/3/2016–1/20/2017 | 190,000 | 190,000 |
| Total short-term securities (cost: $6,960,868,000) | 6,961,866 | |
| Total investment securities 99.95% (cost: $83,827,436,000) | 101,560,318 | |
| Other assets less liabilities 0.05% | 49,705 | |
| Net assets 100.00% | $101,610,023 |
| Settlement date |
Counterparty | Contract amount | Unrealized (depreciation) appreciation at 7/31/2016 (000) | ||
| Receive (000) |
Deliver (000) | ||||
| Sales: | |||||
| Australian dollars | 8/15/2016 | HSBC Bank | $134,377 | A$182,300 | $(4,079) |
| Australian dollars | 9/9/2016 | JPMorgan Chase | $96,752 | A$130,000 | (1,899) |
| British pounds | 8/19/2016 | Bank of America, N.A. | $37,778 | £26,550 | 2,629 |
| British pounds | 8/19/2016 | JPMorgan Chase | $163,054 | £122,500 | 878 |
| British pounds | 8/19/2016 | Barclays Bank PLC | $256,477 | £195,043 | (1,737) |
| British pounds | 8/19/2016 | HSBC Bank | $256,403 | £195,043 | (1,812) |
| British pounds | 8/22/2016 | HSBC Bank | $35,092 | £26,450 | 74 |
| British pounds | 9/8/2016 | HSBC Bank | $30,100 | £22,900 | (228) |
| Euros | 9/23/2016 | UBS AG | $84,824 | €76,900 | (1,360) |
| $(7,534) | |||||
| 1 | Represents an affiliated company as defined under the Investment Company Act of 1940. |
| 2 | Acquired through a private placement transaction exempt from registration under the Securities Act of 1933. May be subject to legal or contractual restrictions on resale. Further details on these holdings appear below. |
| 3 | Valued under fair value procedures adopted by authority of the board of trustees. The total value of all such securities, including those in “Miscellaneous,“ was $141,409,000, which represented .14% of the net assets of the fund. |
| 4 | Security did not produce income during the last 12 months. |
| 5 | Acquired in a transaction exempt from registration under Rule 144A or Section 4(2) of the Securities Act of 1933. May be resold in the U.S. in transactions exempt from registration, normally to qualified institutional buyers. The total value of all such securities was $6,655,197,000, which represented 6.55% of the net assets of the fund. |
| 6 | Payment in kind; the issuer has the option of paying additional securities in lieu of cash. |
| 7 | Coupon rate may change periodically. |
| 8 | Loan participations and assignments; may be subject to legal or contractual restrictions on resale. The total value of all such loans was $457,805,000, which represented .45% of the net assets of the fund. |
| 9 | Principal payments may be made periodically. Therefore, the effective maturity date may be earlier than the stated maturity date. |
| 10 | Scheduled interest and/or principal payment was not received. |
| 11 | A portion of this security was pledged as collateral. The total value of pledged collateral was $2,963,000, which represented less than .01% of the net assets of the fund. |
| 12 | Index-linked bond whose principal amount moves with a government price index. |
| 13 | Purchased on a TBA basis. |
| Private placement securities | Acquisition date |
Cost (000) |
Value (000) |
Percent of net assets |
| CEVA Group PLC, Series A-1, 3.68% convertible preferred | 4/3/2013 | $29,938 | $13,621 | .01% |
| CEVA Group PLC | 11/24/2015 | 34,036 | 11,802 | .01 |
| CEVA Group PLC, Series A-2, 2.68% convertible preferred | 5/2/2013 | 13,172 | 4,567 | — |
| Total private placement securities | $ 77,146 | $ 29,990 | .02 % |
| Key to abbreviations and symbols |
| Auth. = Authority |
| ADR = American Depositary Receipts |
| A$ = Australian dollars |
| £ = British pounds |
| CAD = Canadian dollars |
| Dev. = Development |
| Econ. = Economic |
| € = Euros |
| Facs. = Facilities |
| FDR = Fiduciary Depositary Receipts |
| G.O. = General Obligation |
| LOC = Letter of Credit |
| Ref. = Refunding |
| Rev. = Revenue |
| TBA = To be announced |
| MFGEFPX-006-0916O-S54087 | The Income Fund of America — Page 36 of 36 |
The portfolio at a glance
July 31, 2016
Investment mix by security type
Percent of net assets

Five largest sectors in common stock holdings
| Percent of net assets | ||||
| Industrials | 9.69 | % | ||
| Financials | 9.36 | |||
| Information technology | 8.73 | |||
| Consumer staples | 8.20 | |||
| Health care | 7.90 | |||
| Ten largest common stock holdings | ||||
| Percent of net assets | ||||
| Microsoft | 2.86 | % | ||
| Merck | 2.62 | |||
| General Electric | 2.13 | |||
| Lockheed Martin | 2.02 | |||
| Verizon Communications | 1.92 | |||
| Intel | 1.89 | |||
| McDonald’s | 1.86 | |||
| Pfizer | 1.57 | |||
| Procter & Gamble | 1.47 | |||
| GlaxoSmithKline | 1.41 | |||
| Country diversification by domicile | ||||
| Percent of net assets | ||||
| United States | 73.28 | % | ||
| United Kingdom | 7.50 | |||
| Euro zone* | 4.47 | |||
| Canada | 1.50 | |||
| Hong Kong | 1.37 | |||
| Australia | 1.20 | |||
| Taiwan | 1.16 | |||
| Other countries | 2.62 | |||
| Short-term securities & other assets less liabilities | 6.90 | |||
| * | Countries using the euro as a common currency; those represented in the fund’s portfolio are Belgium, Finland, France, Germany, Ireland, Italy, Luxembourg, the Netherlands, Portugal, Slovenia and Spain. |
July 31, 2015
Investment mix by security type
Percent of net assets

Five largest sectors in common stock holdings
| Percent of net assets | ||||
| Industrials | 10.47 | % | ||
| Health care | 9.85 | |||
| Financials | 9.64 | |||
| Information technology | 8.20 | |||
| Consumer staples | 6.89 | |||
| Ten largest common stock holdings | ||||
| Percent of net assets | ||||
| Merck | 3.05 | % | ||
| Microsoft | 2.96 | |||
| Pfizer | 2.28 | |||
| General Electric | 2.07 | |||
| Bristol-Myers Squibb | 1.64 | |||
| Lockheed Martin | 1.56 | |||
| Verizon Communications | 1.55 | |||
| JPMorgan Chase | 1.37 | |||
| Wells Fargo | 1.23 | |||
| Procter & Gamble | 1.22 | |||
| Country diversification by domicile | ||||
| Percent of net assets | ||||
| United States | 70.54 | % | ||
| United Kingdom | 7.62 | |||
| Euro zone† | 5.65 | |||
| Australia | 2.08 | |||
| Hong Kong | 1.83 | |||
| Canada | 1.50 | |||
| Switzerland | 1.13 | |||
| Other countries | 2.72 | |||
| Short-term securities & other assets less liabilities | 6.93 | |||
| † | Countries using the euro as a common currency; those represented in the fund’s portfolio are Belgium, Finland, France, Germany, Ireland, Italy, Luxembourg, the Netherlands, Portugal, Slovenia and Spain. |
| The Income Fund of America | 13 |
Summary investment portfolio July 31, 2016
| Common stocks 68.98% | Shares | Value (000) |
||||||
| Industrials 9.69% | ||||||||
| General Electric Co. | 69,491,053 | $ | 2,163,951 | |||||
| Lockheed Martin Corp. | 8,119,400 | 2,052,016 | ||||||
| BAE Systems PLC | 126,401,776 | 893,310 | ||||||
| Boeing Co. | 5,965,000 | 797,282 | ||||||
| Waste Management, Inc. | 9,986,128 | 660,283 | ||||||
| Other securities | 3,283,763 | |||||||
| 9,850,605 | ||||||||
| Financials 9.36% | ||||||||
| JPMorgan Chase & Co. | 21,515,056 | 1,376,318 | ||||||
| CME Group Inc., Class A | 10,140,400 | 1,036,755 | ||||||
| Crown Castle International Corp. | 10,449,000 | 1,013,867 | ||||||
| Wells Fargo & Co. | 18,127,915 | 869,596 | ||||||
| Digital Realty Trust, Inc. | 7,635,000 | 797,552 | ||||||
| Iron Mountain Inc.1 | 13,724,780 | 565,598 | ||||||
| Public Storage | 1,935,000 | 462,310 | ||||||
| Prologis, Inc. | 8,390,000 | 457,171 | ||||||
| Other securities | 2,934,094 | |||||||
| 9,513,261 | ||||||||
| Information technology 8.73% | ||||||||
| Microsoft Corp. | 51,193,209 | 2,901,631 | ||||||
| Intel Corp. | 55,176,100 | 1,923,439 | ||||||
| Texas Instruments Inc. | 15,550,000 | 1,084,613 | ||||||
| Taiwan Semiconductor Manufacturing Co., Ltd. | 170,719,000 | 922,502 | ||||||
| Taiwan Semiconductor Manufacturing Co., Ltd. (ADR) | 2,166,470 | 60,184 | ||||||
| Analog Devices, Inc. | 14,616,091 | 932,945 | ||||||
| Other securities | 1,042,243 | |||||||
| 8,867,557 | ||||||||
| Consumer staples 8.20% | ||||||||
| Procter & Gamble Co. | 17,386,700 | 1,488,128 | ||||||
| Coca-Cola Co. | 26,901,000 | 1,173,691 | ||||||
| Philip Morris International Inc. | 10,668,607 | 1,069,635 | ||||||
| Reynolds American Inc. | 20,846,668 | 1,043,584 | ||||||
| Altria Group, Inc. | 12,191,000 | 825,331 | ||||||
| British American Tobacco PLC | 11,743,200 | 749,801 | ||||||
| Kellogg Co. | 5,550,000 | 459,040 | ||||||
| Other securities | 1,519,158 | |||||||
| 8,328,368 | ||||||||
| Health care 7.90% | ||||||||
| Merck & Co., Inc. | 45,448,227 | 2,665,993 | ||||||
| Pfizer Inc. | 43,114,280 | 1,590,486 | ||||||
| GlaxoSmithKline PLC | 64,296,000 | 1,436,362 | ||||||
| AstraZeneca PLC | 10,916,583 | 729,312 | ||||||
| Bristol-Myers Squibb Co. | 7,670,738 | 573,848 | ||||||
| Eli Lilly and Co. | 6,174,000 | 511,763 | ||||||
| Other securities | 515,455 | |||||||
| 8,023,219 | ||||||||
| Consumer discretionary 5.70% | ||||||||
| McDonald’s Corp. | 16,029,280 | 1,885,845 | ||||||
| Home Depot, Inc. | 5,295,000 | 731,981 | ||||||
| Target Corp. | 9,450,000 | 711,868 | ||||||
| General Motors Co. | 15,248,112 | 480,925 | ||||||
| Other securities | 1,977,862 | |||||||
| 5,788,481 | ||||||||
| 14 | The Income Fund of America |
| Shares | Value (000) |
|||||||
| Energy 4.58% | ||||||||
| Chevron Corp. | 9,800,000 | $ | 1,004,304 | |||||
| Spectra Energy Corp | 27,235,500 | 979,661 | ||||||
| BP PLC | 147,950,000 | 835,791 | ||||||
| Royal Dutch Shell PLC, Class B | 21,362,147 | 566,000 | ||||||
| Other securities | 1,266,571 | |||||||
| 4,652,327 | ||||||||
| Telecommunication services 4.06% | ||||||||
| Verizon Communications Inc. | 35,285,921 | 1,955,193 | ||||||
| Telstra Corp. Ltd. | 171,521,533 | 752,107 | ||||||
| Other securities | 1,424,172 | |||||||
| 4,131,472 | ||||||||
| Materials 3.55% | ||||||||
| E.I. du Pont de Nemours and Co. | 14,953,953 | 1,034,365 | ||||||
| Dow Chemical Co. | 14,804,900 | 794,579 | ||||||
| LyondellBasell Industries NV | 6,190,000 | 465,859 | ||||||
| Other securities | 1,317,205 | |||||||
| 3,612,008 | ||||||||
| Utilities 3.34% | ||||||||
| Power Assets Holdings Ltd. | 78,458,500 | 768,061 | ||||||
| Duke Energy Corp. | 7,854,999 | 672,309 | ||||||
| Dominion Resources, Inc. | 7,335,000 | 572,277 | ||||||
| Other securities | 1,381,740 | |||||||
| 3,394,387 | ||||||||
| Miscellaneous 3.87% | ||||||||
| Other common stocks in initial period of acquisition | 3,931,005 | |||||||
| Total common stocks (cost: $53,173,564,000) | 70,092,690 | |||||||
| Preferred securities 0.46% | ||||||||
| Financials 0.46% | ||||||||
| Wells Fargo & Co., Class A, Series Q, 5.85% depositary shares preferred noncumulative | 1,600,000 | 44,672 | ||||||
| Other securities | 422,064 | |||||||
| Total preferred securities (cost: $429,622,000) | 466,736 | |||||||
| Rights & warrants 0.00% | ||||||||
| Energy 0.00% | ||||||||
| Other securities | — | |||||||
| Total rights & warrants (cost: $2,171,000) | — | |||||||
| Convertible stocks 0.61% | ||||||||
| Other 0.61% | ||||||||
| Other securities | 619,693 | |||||||
| Total convertible stocks (cost: $693,340,000) | 619,693 | |||||||
| Convertible bonds 0.78% | Principal amount (000) |
|||||||
| Other 0.55% | ||||||||
| Other securities | 561,439 | |||||||
| Miscellaneous 0.23% | ||||||||
| Other convertible bonds in initial period of acquisition | 231,814 | |||||||
| Total convertible bonds (cost: $773,704,000) | 793,253 | |||||||
| The Income Fund of America | 15 |
| Bonds, notes & other debt instruments 22.27% | Principal amount (000) |
Value (000) |
||||||
| Corporate bonds & notes 14.16% | ||||||||
| Financials 2.36% | ||||||||
| Crown Castle International Corp. 4.875% 2022 | $ | 9,800 | $ | 10,877 | ||||
| JPMorgan Chase & Co. 1.35%–2.95% 2017–2026 | 49,390 | 50,284 | ||||||
| JPMorgan Chase & Co., junior subordinated 5.30%–7.90% 2049 | 147,785 | 156,693 | ||||||
| Wells Fargo & Co. 1.29%–4.90% 2019–20452 | 103,561 | 110,947 | ||||||
| Wells Fargo & Co., Series K, junior subordinated 7.98% (undated) | 86,566 | 92,175 | ||||||
| Other securities | 1,977,144 | |||||||
| 2,398,120 | ||||||||
| Consumer discretionary 2.20% | ||||||||
| McDonald’s Corp. 2.75%–4.88% 2020–2045 | 4,145 | 4,744 | ||||||
| Other securities | 2,226,943 | |||||||
| 2,231,687 | ||||||||
| Energy 2.11% | ||||||||
| Chevron Corp. 2.954% 2026 | 10,215 | 10,548 | ||||||
| Other securities | 2,136,415 | |||||||
| 2,146,963 | ||||||||
| Health care 1.95% | ||||||||
| Merck & Co., Inc. 1.10% 2018 | 6,710 | 6,739 | ||||||
| Pfizer Inc. 7.20% 2039 | 1,353 | 2,098 | ||||||
| Other securities | 1,970,442 | |||||||
| 1,979,279 | ||||||||
| Telecommunication services 1.54% | ||||||||
| Verizon Communications Inc. 1.38%–6.00% 2016–20482 | 261,397 | 278,528 | ||||||
| Other securities | 1,281,629 | |||||||
| 1,560,157 | ||||||||
| Industrials 1.26% | ||||||||
| General Electric Capital Corp. 2.34%–6.00% 2019–2020 | 15,772 | 16,641 | ||||||
| General Electric Co. 2.70%–5.00% 2022–2049 | 216,599 | 233,660 | ||||||
| Lockheed Martin Corp. 1.85%–4.70% 2018–2046 | 23,080 | 25,981 | ||||||
| Other securities | 1,006,372 | |||||||
| 1,282,654 | ||||||||
| Information technology 0.51% | ||||||||
| Microsoft Corp. 2.65%–4.20% 2022–2035 | 12,000 | 13,138 | ||||||
| Other securities | 507,921 | |||||||
| 521,059 | ||||||||
| Consumer staples 0.47% | ||||||||
| Coca-Cola Co. 1.80% 2016 | 10,000 | 10,011 | ||||||
| Philip Morris International Inc. 1.88%–4.25% 2021–2044 | 12,580 | 13,768 | ||||||
| Reynolds American Inc. 2.30%–6.15% 2018–2045 | 52,430 | 60,998 | ||||||
| Other securities | 393,177 | |||||||
| 477,954 | ||||||||
| Other corporate bonds & notes 1.76% | ||||||||
| Other securities | 1,785,994 | |||||||
| Total corporate bonds & notes | 14,383,867 | |||||||
| U.S. Treasury bonds & notes 5.81% | ||||||||
| U.S. Treasury 5.37% | ||||||||
| U.S. Treasury 2.00% 2025 | 513,475 | 538,106 | ||||||
| U.S. Treasury 2.875% 2045 | 929,150 | 1,066,608 | ||||||
| U.S. Treasury 0.50%–6.25% 2017–20463 | 3,541,242 | 3,857,173 | ||||||
| 5,461,887 | ||||||||
| 16 | The Income Fund of America |
| Principal amount (000) |
Value (000) |
|||||||
| U.S. Treasury inflation-protected securities 0.44% | ||||||||
| U.S. Treasury Inflation-Protected Securities 0.38%–1.38% 2024–20464 | $ | 404,462 | $ | 442,519 | ||||
| Total U.S. Treasury bonds & notes | 5,904,406 | |||||||
| Mortgage-backed obligations 1.81% | ||||||||
| Fannie Mae 2.30%–9.69% 2018–20472,5,6 | 825,371 | 887,110 | ||||||
| Freddie Mac 2.27%–9.00% 2019–20462,5 | 528,981 | 569,203 | ||||||
| Other securities | 382,496 | |||||||
| 1,838,809 | ||||||||
| Federal agency bonds & notes 0.07% | ||||||||
| Fannie Mae 6.25%–7.13% 2029–2030 | 33,500 | 49,262 | ||||||
| Federal Home Loan Bank 0.875% 2018 | 12,860 | 12,894 | ||||||
| Other securities | 4,117 | |||||||
| 66,273 | ||||||||
| Other bonds & notes 0.42% | ||||||||
| Other securities | 432,725 | |||||||
| Total bonds, notes & other debt instruments (cost: $21,794,167,000) | 22,626,080 | |||||||
| Short-term securities 6.85% | ||||||||
| Chariot Funding, LLC 1.00% due 1/17/20177 | 25,000 | 24,875 | ||||||
| Chevron Corp. 0.52% due 8/2/2016–8/16/20167 | 117,600 | 117,590 | ||||||
| Coca-Cola Co. 0.56%–0.69% due 8/9/2016–1/12/20177 | 214,800 | 214,447 | ||||||
| Fannie Mae 0.38%–0.53% due 9/8/2016–1/5/2017 | 200,000 | 199,756 | ||||||
| Federal Home Loan Bank 0.25%–0.63% due 8/9/2016–5/15/2017 | 2,950,792 | 2,947,750 | ||||||
| Freddie Mac 0.33%–0.49% due 8/16/2016–2/2/2017 | 823,958 | 823,053 | ||||||
| GE Capital Treasury Services (U.S.) LLC 0.40% due 8/31/2016 | 50,000 | 49,984 | ||||||
| General Electric Co. 0.34% due 8/1/2016 | 40,700 | 40,699 | ||||||
| Intel Corp. 0.41% due 8/30/2016 | 18,800 | 18,794 | ||||||
| Jupiter Securitization Co., LLC 0.45% due 8/25/20167 | 50,000 | 49,982 | ||||||
| Microsoft Corp. 0.42%–0.46% due 8/3/2016–9/14/20167 | 218,600 | 218,546 | ||||||
| Pfizer Inc. 0.47%–0.67% due 9/12/2016–10/18/20167 | 227,200 | 227,036 | ||||||
| U.S. Treasury Bills 0.36%–0.46% due 8/18/2016–12/8/2016 | 232,900 | 232,835 | ||||||
| Wells Fargo Bank, N.A. 0.86%–1.05% due 11/3/2016–1/20/2017 | 190,000 | 190,000 | ||||||
| Other securities | 1,606,519 | |||||||
| Total short-term securities (cost: $6,960,868,000) | 6,961,866 | |||||||
| Total investment securities 99.95% (cost: $83,827,436,000) | 101,560,318 | |||||||
| Other assets less liabilities 0.05% | 49,705 | |||||||
| Net assets 100.00% | $ | 101,610,023 | ||||||
This summary investment portfolio is designed to streamline the report and help investors better focus on the fund’s principal holdings. See the inside back cover for details on how to obtain a complete schedule of portfolio holdings.
As permitted by U.S. Securities and Exchange Commission regulations, “Miscellaneous” securities include holdings in their first year of acquisition that have not previously been publicly disclosed.
“Other securities” includes all issues that are not disclosed separately in the summary investment portfolio.
| The Income Fund of America | 17 |
Forward currency contracts
The fund has entered into forward currency contracts as shown in the following table. The average month-end notional amount of open forward currency contracts while held was $661,445,000.
| Contract amount | Unrealized (depreciation) appreciation |
|||||||||||
| Settlement date | Counterparty | Receive (000) |
Deliver (000) |
at 7/31/2016 (000) |
||||||||
| Sales: | ||||||||||||
| Australian dollars | 8/15/2016 | HSBC Bank | $134,377 | A$182,300 | $(4,079 | ) | ||||||
| Australian dollars | 9/9/2016 | JPMorgan Chase | $96,752 | A$130,000 | (1,899 | ) | ||||||
| British pounds | 8/19/2016 | Bank of America, N.A. | $37,778 | £26,550 | 2,629 | |||||||
| British pounds | 8/19/2016 | JPMorgan Chase | $163,054 | £122,500 | 878 | |||||||
| British pounds | 8/19/2016 | Barclays Bank PLC | $256,477 | £195,043 | (1,737 | ) | ||||||
| British pounds | 8/19/2016 | HSBC Bank | $256,403 | £195,043 | (1,812 | ) | ||||||
| British pounds | 8/22/2016 | HSBC Bank | $35,092 | £26,450 | 74 | |||||||
| British pounds | 9/8/2016 | HSBC Bank | $30,100 | £22,900 | (228 | ) | ||||||
| Euros | 9/23/2016 | UBS AG | $84,824 | €76,900 | (1,360 | ) | ||||||
| $(7,534 | ) | |||||||||||
Investments in affiliates
A company is an affiliate of the fund under the Investment Company Act of 1940 if the fund’s holdings in that company represent 5% or more of the outstanding voting shares. The value of the fund’s affiliated-company holdings is either shown in the summary investment portfolio or included in the value of “Other securities” under the respective industry sectors. Further details on such holdings and related transactions during the year ended July 31, 2016, appear below.
| Beginning shares or principal amount |
Additions | Reductions | Ending shares or principal amount |
Dividend or interest income (000) |
Value of affiliates at 7/31/2016 (000) |
|||||||||||||||||||
| Iron Mountain Inc. | 13,644,780 | 80,000 | — | 13,724,780 | $ | 23,385 | $ | 565,598 | ||||||||||||||||
| Iron Mountain Inc. 6.00% 20207 | — | $ | 31,925,000 | — | $ | 31,925,000 | 1,607 | 33,761 | ||||||||||||||||
| Iron Mountain Inc. 5.75% 2024 | $ | 4,325,000 | — | — | $ | 4,325,000 | 265 | 4,464 | ||||||||||||||||
| Iron Mountain Inc. 6.00% 2023 | $ | 950,000 | — | — | $ | 950,000 | 57 | 1,014 | ||||||||||||||||
| Hubbell Inc. | 3,430,000 | — | — | 3,430,000 | 8,404 | 369,857 | ||||||||||||||||||
| R.R. Donnelley & Sons Co. | 13,345,400 | — | — | 13,345,400 | 13,879 | 239,150 | ||||||||||||||||||
| R.R. Donnelley & Sons Co. 7.875% 2021 | $ | 3,050,000 | $ | 21,395,000 | $ | 1,000,000 | $ | 23,445,000 | 936 | 25,555 | ||||||||||||||
| R.R. Donnelley & Sons Co. 7.00% 2022 | $ | 17,500,000 | $ | 2,000,000 | — | $ | 19,500,000 | 1,242 | 19,890 | |||||||||||||||
| R.R. Donnelley & Sons Co. 6.50% 2023 | $ | 11,580,000 | $ | 8,300,000 | $ | 5,600,000 | $ | 14,280,000 | 1,010 | 14,137 | ||||||||||||||
| R.R. Donnelley & Sons Co. 7.625% 2020 | — | $ | 8,750,000 | $ | 5,050,000 | $ | 3,700,000 | 398 | 4,015 | |||||||||||||||
| R.R. Donnelley & Sons Co. 8.25% 2019 | — | $ | 2,475,000 | — | $ | 2,475,000 | 84 | 2,732 | ||||||||||||||||
| R.R. Donnelley & Sons Co. 7.25% 2018 | $ | 7,234,000 | $ | 2,000,000 | $ | 7,234,000 | $ | 2,000,000 | 461 | 2,148 | ||||||||||||||
| Outfront Media Inc. | 9,064,824 | — | — | 9,064,824 | 11,641 | 210,939 | ||||||||||||||||||
| CBS Outdoor Americas Inc. 5.25% 2022 | $ | 25,000,000 | $ | 4,500,000 | — | $ | 29,500,000 | 1,535 | 30,569 | |||||||||||||||
| CBS Outdoor Americas Inc. 5.625% 202413 | $ | 7,650,000 | $ | 2,496,000 | $ | 6,750,000 | $ | 3,396,000 | 298 | 3,596 | ||||||||||||||
| TalkTalk Telecom Group PLC | 58,313,942 | 107,949 | — | 58,421,891 | 12,701 | 177,059 | ||||||||||||||||||
| Corporate Risk Holdings LLC 9.50% 20197,13 | $ | 49,900,000 | — | $ | 4,900,000 | $ | 45,000,000 | 4,334 | 42,637 | |||||||||||||||
| Corporate Risk Holdings I, Inc.8,9 | — | 2,205,215 | — | 2,205,215 | — | 20,575 | ||||||||||||||||||
| Corporate Risk Holdings LLC 13.50% 20207,8,10 | — | $ | 14,211,162 | — | $ | 14,211,162 | 1,599 | 14,629 | ||||||||||||||||
| Corporate Risk Holdings Corp.8,9 | — | 11,149 | — | 11,149 | — | — | ||||||||||||||||||
| Redwood Trust, Inc. | 5,079,717 | 365,000 | — | 5,444,717 | 5,996 | 77,696 | ||||||||||||||||||
| CEVA Group PLC, Series A-1, 3.68% convertible preferred8,9,11 | 29,937 | — | — | 29,937 | — | 13,621 | ||||||||||||||||||
| CEVA Group PLC8,9,11 | 35,229 | — | — | 35,229 | — | 11,802 | ||||||||||||||||||
| CEVA Logistics U.S. Holdings Inc., Term Loan B, 6.50%2,5,12,13 | $ | 6,995,197 | — | $ | 70,837 | $ | 6,924,360 | 474 | 5,773 | |||||||||||||||
| CEVA Group PLC, Series A-2, 2.68% convertible preferred8,9,11 | 13,633 | — | — | 13,633 | — | 4,567 | ||||||||||||||||||
| CEVA Logistics Holdings BV, Term Loan, 6.50% 20212,5,12,13 | $ | 5,071,518 | — | $ | 51,357 | $ | 5,020,161 | 349 | 4,186 | |||||||||||||||
| CEVA Group PLC, Apollo Global Securities LLC LOC, 6.50% 20212,5,12 | $ | 4,870,074 | — | — | $ | 4,870,074 | 253 | 4,060 | ||||||||||||||||
| CEVA Group PLC 7.00% 20217 | $ | 2,250,000 | — | — | $ | 2,250,000 | 158 | 1,896 | ||||||||||||||||
| 18 | The Income Fund of America |
| Beginning shares or principal amount |
Additions | Reductions | Ending shares or principal amount |
Dividend or interest income (000) |
Value of affiliates at 7/31/2016 (000) |
|||||||||||||||||||
| CEVA Group PLC 9.00% 20217 | $ | 1,050,000 | — | — | $ | 1,050,000 | $ | 95 | $ | 830 | ||||||||||||||
| CEVA Logistics Canada, ULC, Term Loan, 6.50% 20212,5,12,13 | $ | 874,399 | — | $ | 8,855 | $ | 865,544 | 60 | 722 | |||||||||||||||
| Rotech Healthcare Inc., Term Loan, 13.00% 20202,5,8,10,12 | $ | 20,743,820 | $ | 2,418,965 | — | $ | 23,162,785 | 2,692 | 20,378 | |||||||||||||||
| Rotech Healthcare Inc., Term Loan A, 5.50% 20182,5,8,12 | $ | 11,888,250 | — | $ | 121,000 | $ | 11,767,250 | 662 | 11,708 | |||||||||||||||
| Rotech Healthcare Inc., Term Loan B, 10.00% 20192,5,8,12 | $ | 9,200,000 | — | — | $ | 9,200,000 | 935 | 9,154 | ||||||||||||||||
| Rotech Healthcare Inc.8,9 | 543,172 | — | — | 543,172 | — | 543 | ||||||||||||||||||
| Douglas Dynamics, Inc. | 1,444,000 | — | — | 1,444,000 | 1,321 | 38,699 | ||||||||||||||||||
| NII Holdings, Inc.9 | 7,992,669 | — | 297,966 | 7,694,703 | — | 23,392 | ||||||||||||||||||
| Baytex Energy Corp.14 | 12,060,956 | 299,802 | 12,360,758 | — | 932 | — | ||||||||||||||||||
| Baytex Energy Corp. 5.125% 20217,14 | $ | 10,050,000 | — | — | $ | 10,050,000 | 557 | — | ||||||||||||||||
| Baytex Energy Corp. 5.625% 20247,14 | $ | 3,450,000 | — | — | $ | 3,450,000 | 201 | — | ||||||||||||||||
| Cliffs Natural Resources Inc. 4.875% 202114 | $ | 4,945,000 | — | — | $ | 4,945,000 | 257 | — | ||||||||||||||||
| Cliffs Natural Resources Inc. 8.25% 20207,14 | $ | 7,475,000 | $ | 16,625,000 | $ | 10,300,000 | $ | 13,800,000 | 716 | — | ||||||||||||||
| Cliffs Natural Resources Inc., Series A, 7.00% convertible preferred 201614 | 2,925,000 | — | 2,925,000 | — | 1,181 | — | ||||||||||||||||||
| Diebold, Inc.14 | 3,925,000 | 297,000 | 4,222,000 | — | 3,937 | — | ||||||||||||||||||
| Digital Realty Trust, Inc.14 | 7,115,000 | 3,360,000 | 2,840,000 | 7,635,000 | 22,812 | — | ||||||||||||||||||
| $ | 127,424 | $ | 2,011,352 | |||||||||||||||||||||
The following footnotes apply to either the individual securities noted or one or more of the securities aggregated and listed as a single line item.
| 1 | Represents an affiliated company as defined under the Investment Company Act of 1940. |
| 2 | Coupon rate may change periodically. |
| 3 | A portion of this security was pledged as collateral. The total value of pledged collateral was $2,963,000, which represented less than .01% of the net assets of the fund. |
| 4 | Index-linked bond whose principal amount moves with a government price index. |
| 5 | Principal payments may be made periodically. Therefore, the effective maturity date may be earlier than the stated maturity date. |
| 6 | Purchased on a TBA basis. |
| 7 | Acquired in a transaction exempt from registration under Rule 144A or Section 4(2) of the Securities Act of 1933. May be resold in the U.S. in transactions exempt from registration, normally to qualified institutional buyers. The total value of all such securities, including those in “Other securities,” was $6,655,197,000, which represented 6.55% of the net assets of the fund. |
| 8 | Valued under fair value procedures adopted by authority of the board of trustees. The total value of all such securities, including those in “Miscellaneous” and “Other securities,” was $141,409,000, which represented .14% of the net assets of the fund. |
| 9 | Security did not produce income during the last 12 months. |
| 10 | Payment in kind; the issuer has the option of paying additional securities in lieu of cash. |
| 11 | Acquired through a private placement transaction exempt from registration under the Securities Act of 1933. May be subject to legal or contractual restrictions on resale. Further details on these holdings appear below. |
| 12 | Loan participations and assignments; may be subject to legal or contractual restrictions on resale. The total value of all such loans was $457,805,000, which represented .45% of the net assets of the fund. |
| 13 | This security changed its name due to a corporate action during the reporting period. |
| 14 | Unaffiliated issuer at 7/31/2016. |
| Private placement securities | Acquisition date |
Cost (000) |
Value (000) |
Percent of net assets |
||||||||||
| CEVA Group PLC, Series A-1, 3.68% convertible preferred | 4/3/2013 | $ | 29,938 | $ | 13,621 | .01 | % | |||||||
| CEVA Group PLC | 11/24/2015 | 34,036 | 11,802 | .01 | ||||||||||
| CEVA Group PLC, Series A-2, 2.68% convertible preferred | 5/2/2013 | 13,172 | 4,567 | — | ||||||||||
| Total private placement securities | $ | 77,146 | $ | 29,990 | .02 | % | ||||||||
Key to abbreviations and symbols
A$ = Australian dollars
ADR = American Depositary Receipts
£ = British pounds
€ = Euros
LOC = Letter of Credit
TBA = To be announced
See Notes to Financial Statements
| The Income Fund of America | 19 |
Financial statements
| Statement of assets and liabilities | |||||||||
| at July 31, 2016 | (dollars in thousands) | ||||||||
| Assets: | |||||||||
| Investment securities, at value: | |||||||||
| Unaffiliated issuers (cost: $81,964,654) | $ | 99,548,966 | |||||||
| Affiliated issuers (cost: $1,862,782) | 2,011,352 | $ | 101,560,318 | ||||||
| Cash | 4,252 | ||||||||
| Cash denominated in currencies other than U.S. dollars (cost: $224) | 224 | ||||||||
| Unrealized appreciation on open forward currency contracts | 3,581 | ||||||||
| Receivables for: | |||||||||
| Sales of investments | 618,478 | ||||||||
| Sales of fund’s shares | 116,073 | ||||||||
| Closed forward currency contracts | 662 | ||||||||
| Dividends and interest | 406,458 | ||||||||
| Other | 400 | 1,142,071 | |||||||
| 102,710,446 | |||||||||
| Liabilities: | |||||||||
| Unrealized depreciation on open forward currency contracts | 11,115 | ||||||||
| Payables for: | |||||||||
| Purchases of investments | 949,668 | ||||||||
| Repurchases of fund’s shares | 85,160 | ||||||||
| Closed forward currency contracts | 12 | ||||||||
| Investment advisory services | 15,707 | ||||||||
| Services provided by related parties | 29,809 | ||||||||
| Trustees’ deferred compensation | 4,151 | ||||||||
| Other | 4,801 | 1,089,308 | |||||||
| Net assets at July 31, 2016 | $ | 101,610,023 | |||||||
| Net assets consist of: | |||||||||
| Capital paid in on shares of beneficial interest | $ | 83,475,415 | |||||||
| Undistributed net investment income | 508,078 | ||||||||
| Accumulated net realized loss | (96,992 | ) | |||||||
| Net unrealized appreciation | 17,723,522 | ||||||||
| Net assets at July 31, 2016 | $ | 101,610,023 | |||||||
| (dollars and shares in thousands, except per-share amounts) | ||||||||||||
| Shares of beneficial interest issued and outstanding (no stated par value) — unlimited shares authorized (4,686,945 total shares outstanding) |
||||||||||||
| Net assets | Shares outstanding |
Net asset value per share |
||||||||||
| Class A | $ | 75,436,707 | 3,475,950 | $ | 21.70 | |||||||
| Class B | 112,456 | 5,210 | 21.59 | |||||||||
| Class C | 6,195,905 | 289,042 | 21.44 | |||||||||
| Class F-1 | 4,420,722 | 204,178 | 21.65 | |||||||||
| Class F-2 | 5,076,047 | 234,034 | 21.69 | |||||||||
| Class 529-A | 1,525,072 | 70,408 | 21.66 | |||||||||
| Class 529-B | 7,935 | 367 | 21.65 | |||||||||
| Class 529-C | 462,942 | 21,462 | 21.57 | |||||||||
| Class 529-E | 65,721 | 3,043 | 21.60 | |||||||||
| Class 529-F-1 | 60,591 | 2,798 | 21.66 | |||||||||
| Class R-1 | 132,940 | 6,163 | 21.57 | |||||||||
| Class R-2 | 577,533 | 26,898 | 21.47 | |||||||||
| Class R-2E | 7,246 | 335 | 21.66 | |||||||||
| Class R-3 | 1,217,026 | 56,282 | 21.62 | |||||||||
| Class R-4 | 1,188,825 | 54,863 | 21.67 | |||||||||
| Class R-5E | 10 | 1 | 21.69 | |||||||||
| Class R-5 | 515,980 | 23,772 | 21.70 | |||||||||
| Class R-6 | 4,606,365 | 212,139 | 21.71 | |||||||||
See Notes to Financial Statements
| 20 | The Income Fund of America |
| Statement of operations | ||||||||
| for the year ended July 31, 2016 | (dollars in thousands) | |||||||
| Investment income: | ||||||||
| Income: | ||||||||
| Dividends (net of non-U.S. taxes of $30,420; also includes $106,188 from affiliates) | $ | 2,552,053 | ||||||
| Interest (includes $21,236 from affiliates) | 1,025,697 | $ | 3,577,750 | |||||
| Fees and expenses*: | ||||||||
| Investment advisory services | 207,936 | |||||||
| Distribution services | 264,189 | |||||||
| Transfer agent services | 74,958 | |||||||
| Administrative services | 18,918 | |||||||
| Reports to shareholders | 2,928 | |||||||
| Registration statement and prospectus | 1,965 | |||||||
| Trustees’ compensation | 347 | |||||||
| Auditing and legal | 1,909 | |||||||
| Custodian | 2,667 | |||||||
| Other | 1,997 | 577,814 | ||||||
| Net investment income | 2,999,936 | |||||||
| Net realized loss and unrealized appreciation: | ||||||||
| Net realized (loss) gain on: | ||||||||
| Investments (includes $365,039 net loss from affiliates) | (171,008 | ) | ||||||
| Forward currency contracts | 103,668 | |||||||
| Currency transactions | (10,892 | ) | (78,232 | ) | ||||
| Net unrealized appreciation (depreciation) on: | ||||||||
| Investments (net of non-U.S. taxes of $118) | 3,752,882 | |||||||
| Forward currency contracts | (13,488 | ) | ||||||
| Currency translations | (1,090 | ) | 3,738,304 | |||||
| Net realized loss and unrealized appreciation | 3,660,072 | |||||||
| Net increase in net assets resulting from operations | $ | 6,660,008 | ||||||
*Additional information related to class-specific fees and expenses is included in the Notes to Financial Statements.
| Statements of changes in net assets | ||||||||
| (dollars in thousands) | ||||||||
| Year ended July 31 | ||||||||
| 2016 | 2015 | |||||||
| Operations: | ||||||||
| Net investment income | $ | 2,999,936 | $ | 3,032,727 | ||||
| Net realized (loss) gain | (78,232 | ) | 3,852,401 | |||||
| Net unrealized appreciation (depreciation) | 3,738,304 | (4,115,199 | ) | |||||
| Net increase in net assets resulting from operations | 6,660,008 | 2,769,929 | ||||||
| Dividends and distributions paid to shareholders: | ||||||||
| Dividends from net investment income | (2,980,153 | ) | (3,456,253 | ) | ||||
| Distributions from net realized gain on investments | (1,680,493 | ) | — | |||||
| Total dividends and distributions paid to shareholders | (4,660,646 | ) | (3,456,253 | ) | ||||
| Net capital share transactions | 2,618,650 | 3,840,273 | ||||||
| Total increase in net assets | 4,618,012 | 3,153,949 | ||||||
| Net assets: | ||||||||
| Beginning of year | 96,992,011 | 93,838,062 | ||||||
| End of year (including undistributed net investment income: $508,078 and $492,116, respectively) |
$ | 101,610,023 | $ | 96,992,011 | ||||
See Notes to Financial Statements
| The Income Fund of America | 21 |
Notes to financial statements
1. Organization
The Income Fund of America (the “fund”) is registered under the Investment Company Act of 1940 as an open-end, diversified management investment company. The fund seeks current income while secondarily striving for capital growth.
The fund has 18 share classes consisting of five retail share classes (Classes A, B and C, as well as two F share classes, F-1 and F-2), five 529 college savings plan share classes (Classes 529-A, 529-B, 529-C, 529-E and 529-F-1) and eight retirement plan share classes (Classes R-1, R-2, R-2E, R-3, R-4, R-5E, R-5 and R-6). The 529 college savings plan share classes can be used to save for college education. The retirement plan share classes are generally offered only through eligible employer-sponsored retirement plans. The fund’s share classes are described further in the following table:
| Share class | Initial sales charge | Contingent deferred sales charge upon redemption |
Conversion feature | |||
| Classes A and 529-A | Up to 5.75% | None (except 1% for certain redemptions within one year of purchase without an initial sales charge) | None | |||
| Classes B and 529-B* | None | Declines from 5% to 0% for redemptions within six years of purchase | Classes B and 529-B convert to Classes A and 529-A, respectively, after eight years | |||
| Class C | None | 1% for redemptions within one year of purchase | Class C converts to Class F-1 after 10 years | |||
| Class 529-C | None | 1% for redemptions within one year of purchase | None | |||
| Class 529-E | None | None | None | |||
| Classes F-1, F-2 and 529-F-1 | None | None | None | |||
| Classes R-1, R-2, R-2E, R-3, R-4, R-5E, R-5 and R-6 | None | None | None |
*Class B and 529-B shares of the fund are not available for purchase.
On November 20, 2015, the fund made an additional retirement plan share class (Class R-5E) available for sale pursuant to an amendment to its registration statement filed with the U.S. Securities and Exchange Commission. Refer to the fund’s prospectus for more details.
Holders of all share classes have equal pro rata rights to the assets, dividends and liquidation proceeds of the fund. Each share class has identical voting rights, except for the exclusive right to vote on matters affecting only its class. Share classes have different fees and expenses (“class-specific fees and expenses”), primarily due to different arrangements for distribution, transfer agent and administrative services. Differences in class-specific fees and expenses will result in differences in net investment income and, therefore, the payment of different per-share dividends by each share class.
2. Significant accounting policies
The fund is an investment company that applies the accounting and reporting guidance issued in Topic 946 by the U.S. Financial Accounting Standards Board. The fund’s financial statements have been prepared to comply with U.S. generally accepted accounting principles (“U.S. GAAP”). These principles require the fund’s investment adviser to make estimates and assumptions that affect reported amounts and disclosures. Actual results could differ from those estimates. Subsequent events, if any, have been evaluated through the date of issuance in the preparation of the financial statements. The fund follows the significant accounting policies described in this section, as well as the valuation policies described in the next section on valuation.
Security transactions and related investment income — Security transactions are recorded by the fund as of the date the trades are executed with brokers. Realized gains and losses from security transactions are determined based on the specific identified cost of the securities. In the event a security is purchased with a delayed payment date, the fund will segregate liquid assets sufficient to meet its payment obligations. Dividend income is recognized on the ex-dividend date and interest income is recognized on an accrual basis. Market discounts, premiums and original issue discounts on fixed-income securities are amortized daily over the expected life of the security.
| 22 | The Income Fund of America |
Class allocations — Income, fees and expenses (other than class-specific fees and expenses) and realized and unrealized gains and losses are allocated daily among the various share classes based on their relative net assets. Class-specific fees and expenses, such as distribution, transfer agent and administrative services, are charged directly to the respective share class.
Dividends and distributions to shareholders — Dividends and distributions to shareholders are recorded on the ex-dividend date.
Currency translation — Assets and liabilities, including investment securities, denominated in currencies other than U.S. dollars are translated into U.S. dollars at the exchange rates supplied by one or more pricing vendors on the valuation date. Purchases and sales of investment securities and income and expenses are translated into U.S. dollars at the exchange rates on the dates of such transactions. The effects of changes in exchange rates on investment securities are included with the net realized gain or loss and net unrealized appreciation or depreciation on investments in the fund’s statement of operations. The realized gain or loss and unrealized appreciation or depreciation resulting from all other transactions denominated in currencies other than U.S. dollars are disclosed separately.
3. Valuation
Capital Research and Management Company (“CRMC”), the fund’s investment adviser, values the fund’s investments at fair value as defined by U.S. GAAP. The net asset value of each share class of the fund is generally determined as of approximately 4:00 p.m. New York time each day the New York Stock Exchange is open.
Methods and inputs — The fund’s investment adviser uses the following methods and inputs to establish the fair value of the fund’s assets and liabilities. Use of particular methods and inputs may vary over time based on availability and relevance as market and economic conditions evolve.
Equity securities are generally valued at the official closing price of, or the last reported sale price on, the exchange or market on which such securities are traded, as of the close of business on the day the securities are being valued or, lacking any sales, at the last available bid price. Prices for each security are taken from the principal exchange or market on which the security trades.
Fixed-income securities, including short-term securities, are generally valued at prices obtained from one or more pricing vendors. Vendors value such securities based on one or more of the inputs described in the following table. The table provides examples of inputs that are commonly relevant for valuing particular classes of fixed-income securities in which the fund is authorized to invest. However, these classifications are not exclusive, and any of the inputs may be used to value any other class of fixed-income security.
| Fixed-income class | Examples of standard inputs |
| All | Benchmark yields, transactions, bids, offers, quotations from dealers and trading systems, new issues, spreads and other relationships observed in the markets among comparable securities; and proprietary pricing models such as yield measures calculated using factors such as cash flows, financial or collateral performance and other reference data (collectively referred to as “standard inputs”) |
| Corporate bonds & notes; convertible securities | Standard inputs and underlying equity of the issuer |
| Bonds & notes of governments & government agencies | Standard inputs and interest rate volatilities |
| Mortgage-backed; asset-backed obligations | Standard inputs and cash flows, prepayment information, default rates, delinquency and loss assumptions, collateral characteristics, credit enhancements and specific deal information |
| Municipal securities | Standard inputs and, for certain distressed securities, cash flows or liquidation values using a net present value calculation based on inputs that include, but are not limited to, financial statements and debt contracts |
When the fund’s investment adviser deems it appropriate to do so (such as when vendor prices are unavailable or deemed to be not representative), fixed-income securities will be valued in good faith at the mean quoted bid and ask prices that are reasonably and timely available (or bid prices, if ask prices are not available) or at prices for securities of comparable maturity, quality and type.
Securities with both fixed-income and equity characteristics, or equity securities traded principally among fixed-income dealers, are generally valued in the manner described for either equity or fixed-income securities, depending on which method is deemed most appropriate by the fund’s investment adviser. Forward currency contracts are valued at the mean of representative quoted bid and ask prices, generally based on prices supplied by one or more pricing vendors.
| The Income Fund of America | 23 |
Securities and other assets for which representative market quotations are not readily available or are considered unreliable by the fund’s investment adviser are fair valued as determined in good faith under fair valuation guidelines adopted by authority of the fund’s board of trustees as further described. The investment adviser follows fair valuation guidelines, consistent with U.S. Securities and Exchange Commission rules and guidance, to consider relevant principles and factors when making fair value determinations. The investment adviser considers relevant indications of value that are reasonably and timely available to it in determining the fair value to be assigned to a particular security, such as the type and cost of the security; contractual or legal restrictions on resale of the security; relevant financial or business developments of the issuer; actively traded similar or related securities; conversion or exchange rights on the security; related corporate actions; significant events occurring after the close of trading in the security; and changes in overall market conditions. In addition, the closing prices of equity securities that trade in markets outside U.S. time zones may be adjusted to reflect significant events that occur after the close of local trading but before the net asset value of each share class of the fund is determined. Fair valuations and valuations of investments that are not actively trading involve judgment and may differ materially from valuations that would have been used had greater market activity occurred.
Processes and structure — The fund’s board of trustees has delegated authority to the fund’s investment adviser to make fair value determinations, subject to board oversight. The investment adviser has established a Joint Fair Valuation Committee (the “Fair Valuation Committee”) to administer, implement and oversee the fair valuation process, and to make fair value decisions. The Fair Valuation Committee regularly reviews its own fair value decisions, as well as decisions made under its standing instructions to the investment adviser’s valuation teams. The Fair Valuation Committee reviews changes in fair value measurements from period to period and may, as deemed appropriate, update the fair valuation guidelines to better reflect the results of back testing and address new or evolving issues. The Fair Valuation Committee reports any changes to the fair valuation guidelines to the board of trustees with supplemental information to support the changes. The fund’s board and audit committee also regularly review reports that describe fair value determinations and methods.
The fund’s investment adviser has also established a Fixed-Income Pricing Review Group to administer and oversee the fixed-income valuation process, including the use of fixed-income pricing vendors. This group regularly reviews pricing vendor information and market data. Pricing decisions, processes and controls over security valuation are also subject to additional internal reviews, including an annual control self-evaluation program facilitated by the investment adviser’s compliance group.
Classifications — The fund’s investment adviser classifies the fund’s assets and liabilities into three levels based on the inputs used to value the assets or liabilities. Level 1 values are based on quoted prices in active markets for identical securities. Level 2 values are based on significant observable market inputs, such as quoted prices for similar securities and quoted prices in inactive markets. Certain securities trading outside the U.S. may transfer between Level 1 and Level 2 due to valuation adjustments resulting from significant market movements following the close of local trading. Level 3 values are based on significant unobservable inputs that reflect the investment adviser’s determination of assumptions that market participants might reasonably use in valuing the securities. The valuation levels are not necessarily an indication of the risk or liquidity associated with the underlying investment. For example, U.S. government securities are
| 24 | The Income Fund of America |
reflected as Level 2 because the inputs used to determine fair value may not always be quoted prices in an active market. The following tables present the fund’s valuation levels as of July 31, 2016 (dollars in thousands):
| Investment securities | ||||||||||||||||
| Level 1 | Level 2 | Level 3 | Total | |||||||||||||
| Assets: | ||||||||||||||||
| Common stocks: | ||||||||||||||||
| Industrials | $ | 9,838,801 | $ | 11,802 | $ | 2 | $ | 9,850,605 | ||||||||
| Financials | 9,513,261 | — | — | 9,513,261 | ||||||||||||
| Information technology | 8,846,982 | — | 20,575 | 8,867,557 | ||||||||||||
| Consumer staples | 8,328,368 | — | — | 8,328,368 | ||||||||||||
| Health care | 8,022,676 | — | 543 | 8,023,219 | ||||||||||||
| Consumer discretionary | 5,788,465 | — | 16 | 5,788,481 | ||||||||||||
| Energy | 4,652,327 | — | — | 4,652,327 | ||||||||||||
| Telecommunication services | 4,131,472 | — | — | 4,131,472 | ||||||||||||
| Materials | 3,604,281 | — | 7,727 | 3,612,008 | ||||||||||||
| Utilities | 3,394,387 | — | — | 3,394,387 | ||||||||||||
| Miscellaneous | 3,926,652 | — | 4,353 | 3,931,005 | ||||||||||||
| Preferred securities | 466,736 | — | — | 466,736 | ||||||||||||
| Convertible stocks | 601,505 | 18,188 | — | 619,693 | ||||||||||||
| Convertible bonds | — | 793,253 | — | 793,253 | ||||||||||||
| Bonds, notes & other debt instruments: | ||||||||||||||||
| Corporate bonds & notes | — | 14,327,958 | 55,909 | 14,383,867 | ||||||||||||
| U.S. Treasury bonds & notes | — | 5,904,406 | — | 5,904,406 | ||||||||||||
| Mortgage-backed obligations | — | 1,838,809 | — | 1,838,809 | ||||||||||||
| Federal agency bonds & notes | — | 66,273 | — | 66,273 | ||||||||||||
| Other | — | 432,725 | — | 432,725 | ||||||||||||
| Short-term securities | — | 6,961,866 | — | 6,961,866 | ||||||||||||
| Total | $ | 71,115,913 | $ | 30,355,280 | $ | 89,125 | $ | 101,560,318 | ||||||||
| Other investments* | ||||||||||||||||
| Level 1 | Level 2 | Level 3 | Total | |||||||||||||
| Assets: | ||||||||||||||||
| Unrealized appreciation on open forward currency contracts | $ | — | $ | 3,581 | $ | — | $ | 3,581 | ||||||||
| Liabilities: | ||||||||||||||||
| Unrealized depreciation on open forward currency contracts | — | (11,115 | ) | — | (11,115 | ) | ||||||||||
| Total | $ | — | $ | (7,534 | ) | $ | — | $ | (7,534 | ) | ||||||
*Forward currency contracts are not included in the investment portfolio.
4. Risk factors
Investing in the fund may involve certain risks including, but not limited to, those described below.
Market conditions — The prices of, and the income generated by, the common stocks and other securities held by the fund may decline — sometimes rapidly or unpredictably — due to various factors, including events or conditions affecting the general economy or particular industries; overall market changes; local, regional or global political, social or economic instability; governmental or governmental agency responses to economic conditions; and currency exchange rate, interest rate and commodity price fluctuations.
Issuer risks — The prices of, and the income generated by, securities held by the fund may decline in response to various factors directly related to the issuers of such securities, including reduced demand for an issuer’s goods or services, poor management performance and strategic initiatives such as mergers, acquisitions or dispositions and the market response to any such initiatives.
Investing in income-oriented stocks — Income provided by the fund may be reduced by changes in the dividend policies of, and the capital resources available for dividend payments at, the companies in which the fund invests.
Investing in debt instruments — The prices of, and the income generated by, bonds and other debt securities held by the fund may be affected by changing interest rates and by changes in the effective maturities and credit ratings of these securities.
| The Income Fund of America | 25 |
Rising interest rates will generally cause the prices of bonds and other debt securities to fall. Falling interest rates may cause an issuer to redeem, call or refinance a debt security before its stated maturity, which may result in the fund having to reinvest the proceeds in lower yielding securities. Longer maturity debt securities generally have greater sensitivity to changes in interest rates and may be subject to greater price fluctuations than shorter maturity debt securities.
Bonds and other debt securities are also subject to credit risk, which is the possibility that the credit strength of an issuer will weaken and/or an issuer of a debt security will fail to make timely payments of principal or interest and the security will go into default. Lower quality debt securities generally have higher rates of interest and may be subject to greater price fluctuations than higher quality debt securities. Credit risk is gauged, in part, by the credit ratings of the debt securities in which the fund invests. However, ratings are only the opinions of the rating agencies issuing them and are not guarantees as to credit quality or an evaluation of market risk. The fund’s investment adviser relies on its own credit analysts to research issuers and issues in seeking to mitigate various credit and default risks.
Investing in lower rated debt instruments — Lower rated bonds and other lower rated debt securities generally have higher rates of interest and involve greater risk of default or price declines due to changes in the issuer’s creditworthiness than those of higher quality debt securities. The market prices of these securities may fluctuate more than the prices of higher quality debt securities and may decline significantly in periods of general economic difficulty. These risks may be increased with respect to investments in junk bonds.
Investing outside the U.S. — Securities of issuers domiciled outside the U.S., or with significant operations or revenues outside the U.S., may lose value because of adverse political, social, economic or market developments (including social instability, regional conflicts, terrorism and war) in the countries or regions in which the issuers operate or generate revenue. These securities may also lose value due to changes in foreign currency exchange rates against the U.S. dollar and/or currencies of other countries. Issuers of these securities may be more susceptible to actions of foreign governments, such as the imposition of price controls or punitive taxes, that could adversely impact the value of these securities. Securities markets in certain countries may be more volatile and/or less liquid than those in the U.S. Investments outside the U.S. may also be subject to different accounting practices and different regulatory, legal and reporting standards and practices, and may be more difficult to value, than those in the U.S. In addition, the value of investments outside the U.S. may be reduced by foreign taxes, including foreign withholding taxes on interest and dividends. Further, there may be increased risks of delayed settlement of securities purchased or sold by the fund. The risks of investing outside the U.S. may be heightened in connection with investments in emerging markets.
Management — The investment adviser to the fund actively manages the fund’s investments. Consequently, the fund is subject to the risk that the methods and analyses employed by the investment adviser in this process may not produce the desired results. This could cause the fund to lose value or its investment results to lag relevant benchmarks or other funds with similar objectives.
5. Certain investment techniques
Mortgage dollar rolls — The fund has entered into mortgage dollar roll transactions in which the fund sells a mortgage-backed security to a counterparty and simultaneously enters into an agreement with the same counterparty to buy back a similar security on a specific future date at a predetermined price. Mortgage dollar rolls are accounted for as purchase and sale transactions, which may increase the fund’s portfolio turnover rate.
Loan transactions — The fund has entered into loan transactions in which the fund acquires a loan either through an agent, by assignment from another holder, or as a participation interest in another holder’s portion of a loan. The loan is often administered by a financial institution that acts as agent for the holders of the loan, and the fund may be required to receive approval from the agent and/or borrower prior to the sale of the investment. The loan’s interest rate and maturity date may change based on the terms of the loan, including potential early payments of principal.
Unfunded commitments — The fund has participated in a transaction that involves unfunded commitments, which may obligate the fund to purchase additional shares of the applicable issuer. Under the terms of the commitments, which will expire no later than April 1, 2021, the maximum potential exposure as of July 31, 2016, was $1,819,000. Should such commitments become due in full, these amounts would represent less than .01% of the net assets of the fund as of July 31, 2016.
Forward currency contracts — The fund has entered into forward currency contracts, which represent agreements to exchange currencies on specific future dates at predetermined rates. The fund’s investment adviser uses forward currency contracts to manage the fund’s exposure to changes in exchange rates. Upon entering into these contracts, risks may arise from the potential inability of counterparties to meet the terms of their contracts and from possible movements in exchange rates.
| 26 | The Income Fund of America |
On a daily basis, the fund’s investment adviser values forward currency contracts and records unrealized appreciation or depreciation for open forward currency contracts in the fund’s statement of assets and liabilities. Realized gains or losses are recorded at the time the forward currency contract is closed or offset by another contract with the same broker for the same settlement date and currency.
Closed forward currency contracts that have not reached their settlement date are included in the respective receivables or payables for closed forward currency contracts in the fund’s statement of assets and liabilities. Net realized gains or losses from closed forward currency contracts and net unrealized appreciation or depreciation from open forward currency contracts are recorded in the fund’s statement of operations.
The following tables present the financial statement impacts resulting from the fund’s use of forward currency contracts as of, or for the year ended, July 31, 2016 (dollars in thousands):
| Assets | Liabilities | |||||||||||||
| Contract | Risk type | Location on statement of assets and liabilities |
Value | Location on statement of assets and liabilities |
Value | |||||||||
| Forward currency | Currency | Unrealized appreciation on open forward currency contracts | $ | 3,581 | Unrealized depreciation on open forward currency contracts | $ | 11,115 | |||||||
| Forward currency | Currency | Receivables for closed forward currency contracts | 662 | Payables for closed forward currency contracts | 12 | |||||||||
| $ | 4,243 | $ | 11,127 | |||||||||||
| Net realized gain | Net unrealized depreciation | |||||||||||||
| Contract | Risk type | Location on statement of operations |
Value | Location on statement of operations |
Value | |||||||||
| Forward currency | Currency | Net realized gain on forward currency contracts | $ | 103,668 | Net unrealized depreciation on forward currency contracts | $ | (13,488 | ) | ||||||
Collateral — The fund participates in a collateral program due to its use of forward currency contracts and future delivery contracts. For forward currency contracts, the program calls for the fund to either receive or pledge collateral based on the net gain or loss on unsettled forward currency contracts by counterparty. The purpose of the collateral is to cover potential losses that could occur in the event that either party cannot meet its contractual obligations.
Rights of offset — The fund has entered into enforceable master netting agreements with certain counterparties for forward currency contracts, where on any date amounts payable by each party to the other (in the same currency with respect to the same transaction) may be closed or offset by each party’s payment obligation. If an early termination date occurs under these agreements following an event of default or termination event, all obligations of each party to its counterparty are settled net through a single payment in a single currency (“close-out netting”). For financial reporting purposes, the fund does not offset financial assets and financial liabilities that are subject to these master netting arrangements in the statement of assets and liabilities.
The following table presents the fund’s forward currency contracts by counterparty that are subject to master netting agreements but that are not offset in the fund’s statement of assets and liabilities. The net amount column shows the impact of offsetting on the fund’s statement of assets and liabilities as of July 31, 2016 if close-out netting was exercised (dollars in thousands):
| Gross amounts recognized in the |
Gross amounts not offset in the statement of assets and liabilities and subject to a master netting agreement |
|||||||||||||||||||
| Counterparty | statement of assets and liabilities |
Available to offset |
Non-cash collateral* |
Cash collateral |
Net amount |
|||||||||||||||
| Assets: | ||||||||||||||||||||
| Bank of America, N.A. | $ | 2,723 | $ | (12 | ) | $ | (2,711 | ) | $ | — | $ | — | ||||||||
| Citibank | 161 | — | (161 | ) | — | — | ||||||||||||||
| HSBC Bank | 74 | (74 | ) | — | — | — | ||||||||||||||
| JPMorgan Chase | 1,285 | (1,285 | ) | — | — | — | ||||||||||||||
| Total | $ | 4,243 | $ | (1,371 | ) | $ | (2,872 | ) | $ | — | $ | — | ||||||||
| The Income Fund of America | 27 |
| Gross amounts recognized in the |
Gross amounts not offset in the statement of assets and liabilities and subject to a master netting agreement |
|||||||||||||||||||
| Counterparty | statement of assets and liabilities |
Available to offset |
Non-cash collateral* |
Cash collateral |
Net amount |
|||||||||||||||
| Liabilities: | ||||||||||||||||||||
| Bank of America, N.A. | $ | 12 | $ | (12 | ) | $ | — | $ | — | $ | — | |||||||||
| Barclays Bank PLC | 1,737 | — | — | — | 1,737 | |||||||||||||||
| HSBC Bank | 6,119 | (74 | ) | (2,495 | ) | — | 3,550 | |||||||||||||
| JPMorgan Chase | 1,899 | (1,285 | ) | — | — | 614 | ||||||||||||||
| UBS AG | 1,360 | — | (380 | ) | — | 980 | ||||||||||||||
| Total | $ | 11,127 | $ | (1,371 | ) | $ | (2,875 | ) | $ | — | $ | 6,881 | ||||||||
*Non-cash collateral is shown on a settlement basis.
6. Taxation and distributions
Federal income taxation — The fund complies with the requirements under Subchapter M of the Internal Revenue Code applicable to mutual funds and intends to distribute substantially all of its net taxable income and net capital gains each year. The fund is not subject to income taxes to the extent such distributions are made. Therefore, no federal income tax provision is required.
As of and during the period ended July 31, 2016, the fund did not have a liability for any unrecognized tax benefits. The fund recognizes interest and penalties, if any, related to unrecognized tax benefits as income tax expense in the statement of operations. During the period, the fund did not incur any interest or penalties.
The fund is not subject to examination by U.S. federal tax authorities for tax years before 2012, by state tax authorities for tax years before 2011 and by tax authorities outside the U.S. for tax years before 2014.
Non-U.S. taxation — Dividend and interest income are recorded net of non-U.S. taxes paid. The fund may file withholding tax reclaims in certain jurisdictions to recover a portion of amounts previously withheld. As a result of rulings from European courts, the fund filed for additional reclaims related to prior years. These reclaims are recorded when the amount is known and there are no significant uncertainties on collectability. Gains realized by the fund on the sale of securities in certain countries are subject to non-U.S. taxes. The fund records an estimated deferred tax liability based on unrealized gains to provide for potential non-U.S. taxes payable upon the sale of these securities.
Distributions — Distributions paid to shareholders are based on net investment income and net realized gains determined on a tax basis, which may differ from net investment income and net realized gains for financial reporting purposes. These differences are due primarily to different treatment for items such as currency gains and losses; short-term capital gains and losses; capital losses related to sales of certain securities within 30 days of purchase; unrealized appreciation of certain investments in securities outside the U.S.; and income on certain investments. The fiscal year in which amounts are distributed may differ from the year in which the net investment income and net realized gains are recorded by the fund for financial reporting purposes.
During the year ended July 31, 2016, the fund reclassified $3,774,000 from undistributed net investment income to accumulated net realized loss and $47,000 from undistributed net investment income to capital paid in on shares of beneficial interest to align financial reporting with tax reporting.
As of July 31, 2016, the tax basis components of distributable earnings, unrealized appreciation (depreciation) and cost of investment securities were as follows (dollars in thousands):
| Undistributed ordinary income | $ | 523,312 | ||
| Post-October capital loss deferral* | (88,896 | ) | ||
| Gross unrealized appreciation on investment securities | 19,804,516 | |||
| Gross unrealized depreciation on investment securities | (2,105,237 | ) | ||
| Net unrealized appreciation on investment securities | 17,699,279 | |||
| Cost of investment securities | 83,861,039 |
*This deferral is considered incurred in the subsequent year.
| 28 | The Income Fund of America |
The tax character of distributions paid to shareholders was as follows (dollars in thousands):
| Year ended July 31, 2016 | Year ended July 31, 2015 | |||||||||||||||||||||||
| Total | Total | |||||||||||||||||||||||
| dividends and | dividends and | |||||||||||||||||||||||
| Ordinary | Long-term | distributions | Ordinary | Long-term | distributions | |||||||||||||||||||
| Share class | income | capital gains | paid | income | capital gains | paid | ||||||||||||||||||
| Class A | $ | 2,268,689 | $ | 1,259,675 | $ | 3,528,364 | $ | 2,652,016 | $ | — | $ | 2,652,016 | ||||||||||||
| Class B | 4,390 | 3,780 | 8,170 | 12,848 | — | 12,848 | ||||||||||||||||||
| Class C | 145,393 | 108,381 | 253,774 | 188,824 | — | 188,824 | ||||||||||||||||||
| Class F-1 | 128,057 | 72,956 | 201,013 | 140,923 | — | 140,923 | ||||||||||||||||||
| Class F-2 | 142,468 | 73,652 | 216,120 | 142,230 | — | 142,230 | ||||||||||||||||||
| Class 529-A | 44,586 | 25,554 | 70,140 | 53,022 | — | 53,022 | ||||||||||||||||||
| Class 529-B | 272 | 247 | 519 | 730 | — | 730 | ||||||||||||||||||
| Class 529-C | 10,332 | 7,919 | 18,251 | 13,212 | — | 13,212 | ||||||||||||||||||
| Class 529-E | 1,779 | 1,101 | 2,880 | 2,176 | — | 2,176 | ||||||||||||||||||
| Class 529-F-1 | 1,868 | 989 | 2,857 | 2,101 | — | 2,101 | ||||||||||||||||||
| Class R-1 | 3,096 | 2,291 | 5,387 | 3,933 | — | 3,933 | ||||||||||||||||||
| Class R-2 | 13,455 | 10,059 | 23,514 | 18,272 | — | 18,272 | ||||||||||||||||||
| Class R-2E1 | 79 | 6 | 85 | 1 | — | 1 | ||||||||||||||||||
| Class R-3 | 33,659 | 21,237 | 54,896 | 44,001 | — | 44,001 | ||||||||||||||||||
| Class R-4 | 35,211 | 20,359 | 55,570 | 43,909 | — | 43,909 | ||||||||||||||||||
| Class R-5E2 | — | 3 | — | 3 | — | 3 | ||||||||||||||||||
| Class R-5 | 20,792 | 11,143 | 31,935 | 24,087 | — | 24,087 | ||||||||||||||||||
| Class R-6 | 126,027 | 61,144 | 187,171 | 113,968 | — | 113,968 | ||||||||||||||||||
| Total | $ | 2,980,153 | $ | 1,680,493 | $ | 4,660,646 | $ | 3,456,253 | $ | — | $ | 3,456,253 | ||||||||||||
| 1 | Class R-2E shares were offered beginning August 29, 2014. |
| 2 | Class R-5E shares were offered beginning November 20, 2015. |
| 3 | Amount less than one thousand. |
7. Fees and transactions with related parties
CRMC, the fund’s investment adviser, is the parent company of American Funds Distributors,® Inc. (“AFD”), the principal underwriter of the fund’s shares, and American Funds Service Company® (“AFS”), the fund’s transfer agent. CRMC, AFD and AFS are considered related parties to the fund.
Investment advisory services — The fund has an investment advisory and service agreement with CRMC that provides for monthly fees accrued daily. These fees are based on a series of decreasing annual rates beginning with 0.250% on the first $500 million of daily net assets and decreasing to 0.123% on such assets in excess of $89 billion. The agreement also provides for monthly fees, accrued daily, of 2.25% of the fund’s monthly gross income. On December 3, 2015, the fund’s board of trustees approved an amended investment advisory and service agreement effective February 1, 2016, decreasing the annual rates on daily net assets in excess of $115 billion to 0.121%. For the year ended July 31, 2016, the investment advisory services fee was $207,936,000, which was equivalent to an annualized rate of 0.219% of average daily net assets.
Class-specific fees and expenses — Expenses that are specific to individual share classes are accrued directly to the respective share class. The principal class-specific fees and expenses are further described below:
Distribution services — The fund has plans of distribution for all share classes, except Class F-2, R-5E, R-5 and R-6 shares. Under the plans, the board of trustees approves certain categories of expenses that are used to finance activities primarily intended to sell fund shares and service existing accounts. The plans provide for payments, based on an annualized percentage of average daily net assets, ranging from 0.25% to 1.00% as noted in this section. In some cases, the board of trustees has limited the amounts that may be paid to less than the maximum allowed by the plans. All share classes with a plan may use up to 0.25% of average daily net assets to pay service fees, or to compensate AFD for paying service fees, to firms that have entered into agreements with AFD to provide certain shareholder services. The remaining amounts available to be paid under each plan are paid to dealers to compensate them for their sales activities.
For Class A and 529-A shares, distribution-related expenses include the reimbursement of dealer and wholesaler commissions paid by AFD for certain shares sold without a sales charge. These share classes reimburse AFD for amounts billed within the prior
| The Income Fund of America | 29 |
15 months but only to the extent that the overall annual expense limit of 0.25% is not exceeded. As of July 31, 2016, there were no unreimbursed expenses subject to reimbursement for Class A or 529-A shares.
| Share class | Currently approved limits | Plan limits | ||||||||
| Class A | 0.25 | % | 0.25 | % | ||||||
| Class 529-A | 0.25 | 0.50 | ||||||||
| Classes B and 529-B | 1.00 | 1.00 | ||||||||
| Classes C, 529-C and R-1 | 1.00 | 1.00 | ||||||||
| Class R-2 | 0.75 | 1.00 | ||||||||
| Class R-2E | 0.60 | 0.85 | ||||||||
| Classes 529-E and R-3 | 0.50 | 0.75 | ||||||||
| Classes F-1, 529-F-1 and R-4 | 0.25 | 0.50 | ||||||||
Transfer agent services — The fund has a shareholder services agreement with AFS under which the fund compensates AFS for providing transfer agent services to each of the fund’s share classes. These services include recordkeeping, shareholder communications and transaction processing. In addition, the fund reimburses AFS for amounts paid to third parties for performing transfer agent services on behalf of fund shareholders.
Administrative services — The fund has an administrative services agreement with CRMC under which the fund compensates CRMC for providing administrative services to Class A, C, F, 529 and R shares. These services include, but are not limited to, coordinating, monitoring, assisting and overseeing third parties that provide services to fund shareholders. Under the agreement, Class A shares pay an annual fee of 0.01% and Class C, F, 529 and R shares pay an annual fee of 0.05% of their respective average daily net assets.
529 plan services — Each 529 share class is subject to service fees to compensate the Virginia College Savings Plan (“Virginia529”) for its oversight and administration of the 529 college savings plan. The quarterly fee is based on a series of decreasing annual rates beginning with 0.10% on the first $30 billion of the net assets invested in Class 529 shares of the American Funds and decreasing to 0.05% on such assets in excess of $70 billion. Effective July 1, 2016, the quarterly fee will be amended to annual rates of 0.10% on the first $20 billion of the net assets invested in the Class 529 shares of the American Funds, 0.05% on net assets between $20 billion and $100 billion, and 0.03% on net assets over $100 billion. The fee for any given calendar quarter is accrued and calculated on the basis of the average net assets of Class 529 shares of the American Funds for the last month of the prior calendar quarter. The fee is included in other expenses in the fund’s statement of operations. Virginia529 is not considered a related party to the fund.
For the year ended July 31, 2016, class-specific expenses under the agreements were as follows (dollars in thousands):
| Share class | Distribution services |
Transfer agent services |
Administrative services |
529 plan services | |||||||||||
| Class A | $169,801 | $54,344 | $7,106 | Not applicable | |||||||||||
| Class B | 1,910 | 166 | Not applicable | Not applicable | |||||||||||
| Class C | 59,929 | 4,638 | 3,001 | Not applicable | |||||||||||
| Class F-1 | 10,268 | 4,992 | 2,056 | Not applicable | |||||||||||
| Class F-2 | Not applicable | 4,545 | 2,118 | Not applicable | |||||||||||
| Class 529-A | 3,244 | 931 | 720 | $1,252 | |||||||||||
| Class 529-B | 126 | 12 | 6 | 11 | |||||||||||
| Class 529-C | 4,394 | 311 | 222 | 385 | |||||||||||
| Class 529-E | 310 | 18 | 31 | 54 | |||||||||||
| Class 529-F-1 | — | 36 | 28 | 49 | |||||||||||
| Class R-1 | 1,294 | 114 | 65 | Not applicable | |||||||||||
| Class R-2 | 4,145 | 1,854 | 279 | Not applicable | |||||||||||
| Class R-2E | 19 | 5 | 2 | Not applicable | |||||||||||
| Class R-3 | 5,925 | 1,663 | 595 | Not applicable | |||||||||||
| Class R-4 | 2,824 | 1,040 | 566 | Not applicable | |||||||||||
| Class R-5E* | Not applicable | — | † | — | † | Not applicable | |||||||||
| Class R-5 | Not applicable | 273 | 298 | Not applicable | |||||||||||
| Class R-6 | Not applicable | 16 | 1,825 | Not applicable | |||||||||||
| Total class-specific expenses | $264,189 | $74,958 | $18,918 | $1,751 | |||||||||||
| * | Class R-5E shares were offered beginning November 20, 2015. | |
| † | Amount less than one thousand. |
Trustees’ deferred compensation — Trustees who are unaffiliated with CRMC may elect to defer the cash payment of part or all of their compensation. These deferred amounts, which remain as liabilities of the fund, are treated as if invested in shares of the fund or other American Funds. These amounts represent general, unsecured liabilities of the fund and vary according to the total returns of the
| 30 | The Income Fund of America |
selected funds. Trustees’ compensation of $347,000 in the fund’s statement of operations reflects $372,000 in current fees (either paid in cash or deferred) and a net decrease of $25,000 in the value of the deferred amounts.
Affiliated officers and trustees — Officers and certain trustees of the fund are or may be considered to be affiliated with CRMC, AFD and AFS. No affiliated officers or trustees received any compensation directly from the fund.
Security transactions with related funds — The fund may purchase from, or sell securities to, other CRMC-managed funds (or funds managed by certain affiliates of CRMC) under procedures adopted by the fund’s board of trustees. The funds involved in such transactions are considered related by virtue of having a common investment adviser (or affiliated investment advisers), common trustees and/or common officers. When such transactions occur, each transaction is executed at the current market price of the security and no brokerage commissions or fees are paid in accordance with Rule 17a-7 of the 1940 Act.
8. Capital share transactions
Capital share transactions in the fund were as follows (dollars and shares in thousands):
| Sales1 | Reinvestments of dividends |
Repurchases1 | Net increase (decrease) |
|||||||||||||||||||||||||||||
| Share class | Amount | Shares | Amount | Shares | Amount | Shares | Amount | Shares | ||||||||||||||||||||||||
| Year ended July 31, 2016 | ||||||||||||||||||||||||||||||||
| Class A | $ | 5,724,803 | 278,796 | $ | 3,431,843 | 169,512 | $ | (8,133,956 | ) | (396,067 | ) | $ | 1,022,690 | 52,241 | ||||||||||||||||||
| Class B | 2,255 | 111 | 8,057 | 401 | (194,331 | ) | (9,516 | ) | (184,019 | ) | (9,004 | ) | ||||||||||||||||||||
| Class C | 800,596 | 39,422 | 245,379 | 12,275 | (1,341,731 | ) | (66,129 | ) | (295,756 | ) | (14,432 | ) | ||||||||||||||||||||
| Class F-1 | 821,628 | 40,041 | 193,056 | 9,559 | (840,785 | ) | (41,089 | ) | 173,899 | 8,511 | ||||||||||||||||||||||
| Class F-2 | 1,606,112 | 77,658 | 201,943 | 9,979 | (889,128 | ) | (43,422 | ) | 918,927 | 44,215 | ||||||||||||||||||||||
| Class 529-A | 151,646 | 7,395 | 70,119 | 3,470 | (214,848 | ) | (10,442 | ) | 6,917 | 423 | ||||||||||||||||||||||
| Class 529-B | 258 | 13 | 518 | 26 | (12,186 | ) | (595 | ) | (11,410 | ) | (556 | ) | ||||||||||||||||||||
| Class 529-C | 52,710 | 2,579 | 18,243 | 907 | (82,435 | ) | (4,020 | ) | (11,482 | ) | (534 | ) | ||||||||||||||||||||
| Class 529-E | 7,224 | 354 | 2,880 | 143 | (10,002 | ) | (486 | ) | 102 | 11 | ||||||||||||||||||||||
| Class 529-F-1 | 11,150 | 543 | 2,854 | 141 | (12,409 | ) | (602 | ) | 1,595 | 82 | ||||||||||||||||||||||
| Class R-1 | 20,908 | 1,025 | 5,378 | 267 | (34,450 | ) | (1,680 | ) | (8,164 | ) | (388 | ) | ||||||||||||||||||||
| Class R-2 | 118,475 | 5,829 | 23,486 | 1,173 | (172,413 | ) | (8,491 | ) | (30,452 | ) | (1,489 | ) | ||||||||||||||||||||
| Class R-2E | 7,179 | 360 | 85 | 4 | (684 | ) | (33 | ) | 6,580 | 331 | ||||||||||||||||||||||
| Class R-3 | 222,663 | 10,882 | 54,725 | 2,714 | (356,500 | ) | (17,385 | ) | (79,112 | ) | (3,789 | ) | ||||||||||||||||||||
| Class R-4 | 228,593 | 11,123 | 55,548 | 2,749 | (318,178 | ) | (15,568 | ) | (34,037 | ) | (1,696 | ) | ||||||||||||||||||||
| Class R-5E2 | 10 | 1 | — | 3 | — | 3 | — | 3 | — | 3 | 10 | 1 | ||||||||||||||||||||
| Class R-5 | 116,052 | 5,661 | 31,927 | 1,578 | (294,802 | ) | (14,350 | ) | (146,823 | ) | (7,111 | ) | ||||||||||||||||||||
| Class R-6 | 1,464,284 | 71,448 | 187,031 | 9,227 | (362,130 | ) | (17,515 | ) | 1,289,185 | 63,160 | ||||||||||||||||||||||
| Total net increase (decrease) | $ | 11,356,546 | 553,241 | $ | 4,533,072 | 224,125 | $ | (13,270,968 | ) | (647,390 | ) | $ | 2,618,650 | 129,976 | ||||||||||||||||||
| The Income Fund of America | 31 |
| Sales1 | Reinvestments of dividends |
Repurchases1 | Net increase (decrease) |
|||||||||||||||||||||||||||||
| Share class | Amount | Shares | Amount | Shares | Amount | Shares | Amount | Shares | ||||||||||||||||||||||||
| Year ended July 31, 2015 | ||||||||||||||||||||||||||||||||
| Class A | $ | 6,799,575 | 313,392 | $ | 2,564,923 | 118,409 | $ | (7,191,840 | ) | (331,631 | ) | $ | 2,172,658 | 100,170 | ||||||||||||||||||
| Class B | 6,142 | 286 | 12,632 | 586 | (319,960 | ) | (14,873 | ) | (301,186 | ) | (14,001 | ) | ||||||||||||||||||||
| Class C | 1,134,135 | 52,855 | 180,877 | 8,438 | (1,476,126 | ) | (68,920 | ) | (161,114 | ) | (7,627 | ) | ||||||||||||||||||||
| Class F-1 | 1,142,485 | 52,837 | 134,607 | 6,228 | (928,887 | ) | (42,846 | ) | 348,205 | 16,219 | ||||||||||||||||||||||
| Class F-2 | 1,557,560 | 71,770 | 131,617 | 6,083 | (580,458 | ) | (26,780 | ) | 1,108,719 | 51,073 | ||||||||||||||||||||||
| Class 529-A | 181,865 | 8,403 | 53,006 | 2,452 | (198,921 | ) | (9,201 | ) | 35,950 | 1,654 | ||||||||||||||||||||||
| Class 529-B | 915 | 42 | 729 | 34 | (16,095 | ) | (746 | ) | (14,451 | ) | (670 | ) | ||||||||||||||||||||
| Class 529-C | 61,911 | 2,870 | 13,208 | 612 | (75,581 | ) | (3,512 | ) | (462 | ) | (30 | ) | ||||||||||||||||||||
| Class 529-E | 8,791 | 407 | 2,176 | 101 | (10,867 | ) | (504 | ) | 100 | 4 | ||||||||||||||||||||||
| Class 529-F-1 | 13,159 | 608 | 2,099 | 97 | (9,349 | ) | (432 | ) | 5,909 | 273 | ||||||||||||||||||||||
| Class R-1 | 31,622 | 1,464 | 3,913 | 181 | (28,794 | ) | (1,338 | ) | 6,741 | 307 | ||||||||||||||||||||||
| Class R-2 | 126,784 | 5,904 | 18,246 | 850 | (177,349 | ) | (8,260 | ) | (32,319 | ) | (1,506 | ) | ||||||||||||||||||||
| Class R-2E4 | 94 | 4 | 1 | — | 3 | — | 3 | — | 3 | 95 | 4 | |||||||||||||||||||||
| Class R-3 | 248,510 | 11,496 | 43,878 | 2,032 | (365,620 | ) | (16,941 | ) | (73,232 | ) | (3,413 | ) | ||||||||||||||||||||
| Class R-4 | 306,349 | 14,154 | 43,888 | 2,029 | (330,284 | ) | (15,265 | ) | 19,953 | 918 | ||||||||||||||||||||||
| Class R-5 | 195,218 | 8,999 | 24,077 | 1,112 | (123,241 | ) | (5,683 | ) | 96,054 | 4,428 | ||||||||||||||||||||||
| Class R-6 | 1,252,456 | 57,974 | 113,878 | 5,257 | (737,681 | ) | (33,850 | ) | 628,653 | 29,381 | ||||||||||||||||||||||
| Total net increase (decrease) | $ | 13,067,571 | 603,465 | $ | 3,343,755 | 154,501 | $ | (12,571,053 | ) | (580,782 | ) | $ | 3,840,273 | 177,184 | ||||||||||||||||||
| 1 | Includes exchanges between share classes of the fund. |
| 2 | Class R-5E shares were offered beginning November 20, 2015. |
| 3 | Amount less than one thousand. |
| 4 | Class R-2E shares were offered beginning August 29, 2014. |
9. Investment transactions
The fund made purchases and sales of investment securities, excluding short-term securities and U.S. government obligations, if any, of $40,435,109,000 and $42,240,126,000, respectively, during the year ended July 31, 2016.
| 32 | The Income Fund of America |
Financial highlights
| Income from investment operations1 |
Dividends and distributions | |||||||||||||||||||||||||||||||||||||||||||||||
| Net asset value, beginning of period |
Net investment income2 |
Net gains (losses) on securities (both realized and unrealized) |
Total from investment operations |
Dividends (from net investment income) |
Distributions (from capital gains) |
Total dividends and distributions |
Net asset value, end of period |
Total return3 |
Net assets, end of period (in millions) |
Ratio of expenses to average net assets2 |
Ratio of net income to average net assets2 |
|||||||||||||||||||||||||||||||||||||
| Class A: | ||||||||||||||||||||||||||||||||||||||||||||||||
| Year ended 7/31/2016 | $ | 21.31 | $ | .66 | $ | .76 | $ | 1.42 | $ | (.66 | ) | $ | (.37 | ) | $ | (1.03 | ) | $ | 21.70 | 7.10 | % | $ | 75,437 | .56 | % | 3.22 | % | |||||||||||||||||||||
| Year ended 7/31/2015 | 21.45 | .69 | (.04 | ) | .65 | (.79 | ) | — | (.79 | ) | 21.31 | 3.01 | 72,952 | .55 | 3.19 | |||||||||||||||||||||||||||||||||
| Year ended 7/31/2014 | 19.64 | .78 | 1.69 | 2.47 | (.66 | ) | — | (.66 | ) | 21.45 | 12.78 | 71,290 | .57 | 3.76 | ||||||||||||||||||||||||||||||||||
| Year ended 7/31/2013 | 17.66 | .67 | 1.99 | 2.66 | (.68 | ) | — | (.68 | ) | 19.64 | 15.33 | 63,968 | .58 | 3.58 | ||||||||||||||||||||||||||||||||||
| Year ended 7/31/2012 | 16.97 | .66 | .73 | 1.39 | (.70 | ) | — | (.70 | ) | 17.66 | 8.45 | 56,153 | .59 | 3.92 | ||||||||||||||||||||||||||||||||||
| Class B: | ||||||||||||||||||||||||||||||||||||||||||||||||
| Year ended 7/31/2016 | 21.17 | .50 | .77 | 1.27 | (.48 | ) | (.37 | ) | (.85 | ) | 21.59 | 6.35 | 112 | 1.31 | 2.45 | |||||||||||||||||||||||||||||||||
| Year ended 7/31/2015 | 21.30 | .53 | (.05 | ) | .48 | (.61 | ) | — | (.61 | ) | 21.17 | 2.23 | 301 | 1.30 | 2.45 | |||||||||||||||||||||||||||||||||
| Year ended 7/31/2014 | 19.50 | .61 | 1.69 | 2.30 | (.50 | ) | — | (.50 | ) | 21.30 | 11.92 | 601 | 1.32 | 2.99 | ||||||||||||||||||||||||||||||||||
| Year ended 7/31/2013 | 17.53 | .53 | 1.97 | 2.50 | (.53 | ) | — | (.53 | ) | 19.50 | 14.48 | 818 | 1.33 | 2.86 | ||||||||||||||||||||||||||||||||||
| Year ended 7/31/2012 | 16.85 | .53 | .71 | 1.24 | (.56 | ) | — | (.56 | ) | 17.53 | 7.56 | 1,161 | 1.34 | 3.19 | ||||||||||||||||||||||||||||||||||
| Class C: | ||||||||||||||||||||||||||||||||||||||||||||||||
| Year ended 7/31/2016 | 21.06 | .49 | .76 | 1.25 | (.50 | ) | (.37 | ) | (.87 | ) | 21.44 | 6.27 | 6,196 | 1.36 | 2.41 | |||||||||||||||||||||||||||||||||
| Year ended 7/31/2015 | 21.21 | .51 | (.04 | ) | .47 | (.62 | ) | — | (.62 | ) | 21.06 | 2.19 | 6,390 | 1.35 | 2.39 | |||||||||||||||||||||||||||||||||
| Year ended 7/31/2014 | 19.42 | .60 | 1.69 | 2.29 | (.50 | ) | — | (.50 | ) | 21.21 | 11.91 | 6,597 | 1.37 | 2.95 | ||||||||||||||||||||||||||||||||||
| Year ended 7/31/2013 | 17.47 | .51 | 1.97 | 2.48 | (.53 | ) | — | (.53 | ) | 19.42 | 14.41 | 6,389 | 1.38 | 2.79 | ||||||||||||||||||||||||||||||||||
| Year ended 7/31/2012 | 16.80 | .52 | .71 | 1.23 | (.56 | ) | — | (.56 | ) | 17.47 | 7.55 | 6,096 | 1.38 | 3.13 | ||||||||||||||||||||||||||||||||||
| Class F-1: | ||||||||||||||||||||||||||||||||||||||||||||||||
| Year ended 7/31/2016 | 21.26 | .64 | .76 | 1.40 | (.64 | ) | (.37 | ) | (1.01 | ) | 21.65 | 7.02 | 4,421 | .65 | 3.12 | |||||||||||||||||||||||||||||||||
| Year ended 7/31/2015 | 21.40 | .67 | (.04 | ) | .63 | (.77 | ) | — | (.77 | ) | 21.26 | 2.94 | 4,160 | .64 | 3.10 | |||||||||||||||||||||||||||||||||
| Year ended 7/31/2014 | 19.60 | .76 | 1.68 | 2.44 | (.64 | ) | — | (.64 | ) | 21.40 | 12.66 | 3,841 | .65 | 3.71 | ||||||||||||||||||||||||||||||||||
| Year ended 7/31/2013 | 17.62 | .65 | 2.00 | 2.65 | (.67 | ) | — | (.67 | ) | 19.60 | 15.30 | 3,554 | .65 | 3.50 | ||||||||||||||||||||||||||||||||||
| Year ended 7/31/2012 | 16.94 | .65 | .72 | 1.37 | (.69 | ) | — | (.69 | ) | 17.62 | 8.35 | 2,563 | .64 | 3.87 | ||||||||||||||||||||||||||||||||||
| Class F-2: | ||||||||||||||||||||||||||||||||||||||||||||||||
| Year ended 7/31/2016 | 21.30 | .70 | .75 | 1.45 | (.69 | ) | (.37 | ) | (1.06 | ) | 21.69 | 7.28 | 5,076 | .39 | 3.38 | |||||||||||||||||||||||||||||||||
| Year ended 7/31/2015 | 21.44 | .73 | (.04 | ) | .69 | (.83 | ) | — | (.83 | ) | 21.30 | 3.20 | 4,042 | .38 | 3.35 | |||||||||||||||||||||||||||||||||
| Year ended 7/31/2014 | 19.63 | .80 | 1.71 | 2.51 | (.70 | ) | — | (.70 | ) | 21.44 | 12.97 | 2,975 | .40 | 3.89 | ||||||||||||||||||||||||||||||||||
| Year ended 7/31/2013 | 17.65 | .70 | 1.99 | 2.69 | (.71 | ) | — | (.71 | ) | 19.63 | 15.53 | 1,434 | .41 | 3.74 | ||||||||||||||||||||||||||||||||||
| Year ended 7/31/2012 | 16.97 | .69 | .72 | 1.41 | (.73 | ) | — | (.73 | ) | 17.65 | 8.59 | 1,020 | .40 | 4.09 | ||||||||||||||||||||||||||||||||||
| Class 529-A: | ||||||||||||||||||||||||||||||||||||||||||||||||
| Year ended 7/31/2016 | 21.27 | .64 | .76 | 1.40 | (.64 | ) | (.37 | ) | (1.01 | ) | 21.66 | 7.00 | 1,525 | .66 | 3.11 | |||||||||||||||||||||||||||||||||
| Year ended 7/31/2015 | 21.41 | .67 | (.04 | ) | .63 | (.77 | ) | — | (.77 | ) | 21.27 | 2.92 | 1,489 | .65 | 3.09 | |||||||||||||||||||||||||||||||||
| Year ended 7/31/2014 | 19.60 | .75 | 1.70 | 2.45 | (.64 | ) | — | (.64 | ) | 21.41 | 12.69 | 1,463 | .67 | 3.66 | ||||||||||||||||||||||||||||||||||
| Year ended 7/31/2013 | 17.63 | .65 | 1.98 | 2.63 | (.66 | ) | — | (.66 | ) | 19.60 | 15.19 | 1,298 | .68 | 3.48 | ||||||||||||||||||||||||||||||||||
| Year ended 7/31/2012 | 16.95 | .64 | .72 | 1.36 | (.68 | ) | — | (.68 | ) | 17.63 | 8.30 | 1,102 | .68 | 3.82 | ||||||||||||||||||||||||||||||||||
| Class 529-B: | ||||||||||||||||||||||||||||||||||||||||||||||||
| Year ended 7/31/2016 | 21.23 | .48 | .76 | 1.24 | (.45 | ) | (.37 | ) | (.82 | ) | 21.65 | 6.18 | 8 | 1.45 | 2.32 | |||||||||||||||||||||||||||||||||
| Year ended 7/31/2015 | 21.36 | .50 | (.05 | ) | .45 | (.58 | ) | — | (.58 | ) | 21.23 | 2.10 | 20 | 1.43 | 2.33 | |||||||||||||||||||||||||||||||||
| Year ended 7/31/2014 | 19.55 | .58 | 1.70 | 2.28 | (.47 | ) | — | (.47 | ) | 21.36 | 11.79 | 34 | 1.45 | 2.85 | ||||||||||||||||||||||||||||||||||
| Year ended 7/31/2013 | 17.57 | .50 | 1.99 | 2.49 | (.51 | ) | — | (.51 | ) | 19.55 | 14.35 | 45 | 1.46 | 2.73 | ||||||||||||||||||||||||||||||||||
| Year ended 7/31/2012 | 16.89 | .51 | .71 | 1.22 | (.54 | ) | — | (.54 | ) | 17.57 | 7.41 | 58 | 1.47 | 3.06 | ||||||||||||||||||||||||||||||||||
See page 35 for footnotes.
| The Income Fund of America | 33 |
Financial highlights (continued)
| Income from investment operations1 |
Dividends and distributions | |||||||||||||||||||||||||||||||||||||||||||||||
| Net asset value, beginning of period |
Net investment income2 |
Net gains (losses) on securities (both realized and unrealized) |
Total from investment operations |
Dividends (from net investment income) |
Distributions (from capital gains) |
Total dividends and distributions |
Net asset value, end of period |
Total return3 |
Net assets, end of period (in millions) |
Ratio of expenses to average net assets2 |
Ratio of net income to average net assets2 |
|||||||||||||||||||||||||||||||||||||
| Class 529-C: | ||||||||||||||||||||||||||||||||||||||||||||||||
| Year ended 7/31/2016 | $ | 21.18 | $ | .48 | $ | .76 | $ | 1.24 | $ | (.48 | ) | $ | (.37 | ) | $ | (.85 | ) | $ | 21.57 | 6.20 | % | $ | 463 | 1.43 | % | 2.34 | % | |||||||||||||||||||||
| Year ended 7/31/2015 | 21.33 | .50 | (.05 | ) | .45 | (.60 | ) | — | (.60 | ) | 21.18 | 2.09 | 466 | 1.42 | 2.32 | |||||||||||||||||||||||||||||||||
| Year ended 7/31/2014 | 19.53 | .59 | 1.69 | 2.28 | (.48 | ) | — | (.48 | ) | 21.33 | 11.82 | 470 | 1.44 | 2.88 | ||||||||||||||||||||||||||||||||||
| Year ended 7/31/2013 | 17.56 | .50 | 1.99 | 2.49 | (.52 | ) | — | (.52 | ) | 19.53 | 14.36 | 420 | 1.45 | 2.71 | ||||||||||||||||||||||||||||||||||
| Year ended 7/31/2012 | 16.89 | .51 | .71 | 1.22 | (.55 | ) | — | (.55 | ) | 17.56 | 7.43 | 370 | 1.47 | 3.04 | ||||||||||||||||||||||||||||||||||
| Class 529-E: | ||||||||||||||||||||||||||||||||||||||||||||||||
| Year ended 7/31/2016 | 21.21 | .59 | .76 | 1.35 | (.59 | ) | (.37 | ) | (.96 | ) | 21.60 | 6.76 | 66 | .89 | 2.88 | |||||||||||||||||||||||||||||||||
| Year ended 7/31/2015 | 21.35 | .62 | (.04 | ) | .58 | (.72 | ) | — | (.72 | ) | 21.21 | 2.68 | 64 | .89 | 2.85 | |||||||||||||||||||||||||||||||||
| Year ended 7/31/2014 | 19.55 | .70 | 1.69 | 2.39 | (.59 | ) | — | (.59 | ) | 21.35 | 12.39 | 65 | .91 | 3.41 | ||||||||||||||||||||||||||||||||||
| Year ended 7/31/2013 | 17.58 | .60 | 1.99 | 2.59 | (.62 | ) | — | (.62 | ) | 19.55 | 14.95 | 59 | .92 | 3.24 | ||||||||||||||||||||||||||||||||||
| Year ended 7/31/2012 | 16.91 | .60 | .71 | 1.31 | (.64 | ) | — | (.64 | ) | 17.58 | 7.99 | 52 | .93 | 3.57 | ||||||||||||||||||||||||||||||||||
| Class 529-F-1: | ||||||||||||||||||||||||||||||||||||||||||||||||
| Year ended 7/31/2016 | 21.27 | .69 | .76 | 1.45 | (.69 | ) | (.37 | ) | (1.06 | ) | 21.66 | 7.25 | 61 | .43 | 3.34 | |||||||||||||||||||||||||||||||||
| Year ended 7/31/2015 | 21.41 | .72 | (.04 | ) | .68 | (.82 | ) | — | (.82 | ) | 21.27 | 3.16 | 58 | .42 | 3.31 | |||||||||||||||||||||||||||||||||
| Year ended 7/31/2014 | 19.60 | .80 | 1.70 | 2.50 | (.69 | ) | — | (.69 | ) | 21.41 | 12.94 | 52 | .44 | 3.89 | ||||||||||||||||||||||||||||||||||
| Year ended 7/31/2013 | 17.63 | .69 | 1.98 | 2.67 | (.70 | ) | — | (.70 | ) | 19.60 | 15.44 | 44 | .45 | 3.70 | ||||||||||||||||||||||||||||||||||
| Year ended 7/31/2012 | 16.95 | .68 | .72 | 1.40 | (.72 | ) | — | (.72 | ) | 17.63 | 8.53 | 36 | .46 | 4.04 | ||||||||||||||||||||||||||||||||||
| Class R-1: | ||||||||||||||||||||||||||||||||||||||||||||||||
| Year ended 7/31/2016 | 21.18 | .49 | .76 | 1.25 | (.49 | ) | (.37 | ) | (.86 | ) | 21.57 | 6.25 | 133 | 1.37 | 2.40 | |||||||||||||||||||||||||||||||||
| Year ended 7/31/2015 | 21.33 | .51 | (.05 | ) | .46 | (.61 | ) | — | (.61 | ) | 21.18 | 2.16 | 139 | 1.36 | 2.38 | |||||||||||||||||||||||||||||||||
| Year ended 7/31/2014 | 19.53 | .60 | 1.69 | 2.29 | (.49 | ) | — | (.49 | ) | 21.33 | 11.88 | 133 | 1.39 | 2.93 | ||||||||||||||||||||||||||||||||||
| Year ended 7/31/2013 | 17.56 | .52 | 1.98 | 2.50 | (.53 | ) | — | (.53 | ) | 19.53 | 14.43 | 120 | 1.39 | 2.78 | ||||||||||||||||||||||||||||||||||
| Year ended 7/31/2012 | 16.89 | .52 | .71 | 1.23 | (.56 | ) | — | (.56 | ) | 17.56 | 7.50 | 122 | 1.40 | 3.11 | ||||||||||||||||||||||||||||||||||
| Class R-2: | ||||||||||||||||||||||||||||||||||||||||||||||||
| Year ended 7/31/2016 | 21.09 | .49 | .75 | 1.24 | (.49 | ) | (.37 | ) | (.86 | ) | 21.47 | 6.25 | 577 | 1.36 | 2.41 | |||||||||||||||||||||||||||||||||
| Year ended 7/31/2015 | 21.23 | .52 | (.04 | ) | .48 | (.62 | ) | — | (.62 | ) | 21.09 | 2.24 | 599 | 1.32 | 2.42 | |||||||||||||||||||||||||||||||||
| Year ended 7/31/2014 | 19.45 | .60 | 1.68 | 2.28 | (.50 | ) | — | (.50 | ) | 21.23 | 11.85 | 635 | 1.37 | 2.95 | ||||||||||||||||||||||||||||||||||
| Year ended 7/31/2013 | 17.49 | .52 | 1.98 | 2.50 | (.54 | ) | — | (.54 | ) | 19.45 | 14.47 | 609 | 1.36 | 2.80 | ||||||||||||||||||||||||||||||||||
| Year ended 7/31/2012 | 16.82 | .52 | .71 | 1.23 | (.56 | ) | — | (.56 | ) | 17.49 | 7.52 | 567 | 1.40 | 3.11 | ||||||||||||||||||||||||||||||||||
| Class R-2E: | ||||||||||||||||||||||||||||||||||||||||||||||||
| Year ended 7/31/2016 | 21.29 | .58 | .75 | 1.33 | (.59 | ) | (.37 | ) | (.96 | ) | 21.66 | 6.64 | 7 | 1.03 | 2.86 | |||||||||||||||||||||||||||||||||
| Period from 8/29/2014 to 7/31/20154,5 | 21.98 | .54 | (.47 | ) | .07 | (.76 | ) | — | (.76 | ) | 21.29 | .28 | 6,7 | — | 8 | .96 | 6,9 | 2.73 | 6,9 | |||||||||||||||||||||||||||||
| Class R-3: | ||||||||||||||||||||||||||||||||||||||||||||||||
| Year ended 7/31/2016 | 21.23 | .59 | .75 | 1.34 | (.58 | ) | (.37 | ) | (.95 | ) | 21.62 | 6.71 | 1,217 | .92 | 2.85 | |||||||||||||||||||||||||||||||||
| Year ended 7/31/2015 | 21.37 | .61 | (.04 | ) | .57 | (.71 | ) | — | (.71 | ) | 21.23 | 2.65 | 1,275 | .92 | 2.83 | |||||||||||||||||||||||||||||||||
| Year ended 7/31/2014 | 19.57 | .69 | 1.69 | 2.38 | (.58 | ) | — | (.58 | ) | 21.37 | 12.35 | 1,357 | .94 | 3.38 | ||||||||||||||||||||||||||||||||||
| Year ended 7/31/2013 | 17.60 | .60 | 1.98 | 2.58 | (.61 | ) | — | (.61 | ) | 19.57 | 14.91 | 1,323 | .94 | 3.22 | ||||||||||||||||||||||||||||||||||
| Year ended 7/31/2012 | 16.92 | .60 | .72 | 1.32 | (.64 | ) | — | (.64 | ) | 17.60 | 8.01 | 1,204 | .96 | 3.55 | ||||||||||||||||||||||||||||||||||
| 34 | The Income Fund of America |
| Income from investment operations1 |
Dividends and distributions | |||||||||||||||||||||||||||||||||||||||||||||||
| Net asset value, beginning of period |
Net investment income2 |
Net gains (losses) on securities (both realized and unrealized) |
Total from investment operations |
Dividends (from net investment income) |
Distributions (from capital gains) |
Total dividends and distributions |
Net asset value, end of period |
Total return3 |
Net assets, end of period (in millions) |
Ratio of expenses to average net assets2 |
Ratio of net income to average net assets2 |
|||||||||||||||||||||||||||||||||||||
| Class R-4: | ||||||||||||||||||||||||||||||||||||||||||||||||
| Year ended 7/31/2016 | $ | 21.27 | $ | .65 | $ | .76 | $ | 1.41 | $ | (.64 | ) | $ | (.37 | ) | $ | (1.01 | ) | $ | 21.67 | 7.07 | % | $ | 1,189 | .62 | % | 3.15 | % | |||||||||||||||||||||
| Year ended 7/31/2015 | 21.42 | .68 | (.06 | ) | .62 | (.77 | ) | — | (.77 | ) | 21.27 | 2.90 | 1,203 | .62 | 3.12 | |||||||||||||||||||||||||||||||||
| Year ended 7/31/2014 | 19.61 | .76 | 1.70 | 2.46 | (.65 | ) | — | (.65 | ) | 21.42 | 12.71 | 1,192 | .64 | 3.67 | ||||||||||||||||||||||||||||||||||
| Year ended 7/31/2013 | 17.63 | .66 | 1.99 | 2.65 | (.67 | ) | — | (.67 | ) | 19.61 | 15.29 | 1,045 | .64 | 3.52 | ||||||||||||||||||||||||||||||||||
| Year ended 7/31/2012 | 16.95 | .65 | .72 | 1.37 | (.69 | ) | — | (.69 | ) | 17.63 | 8.33 | 880 | .65 | 3.86 | ||||||||||||||||||||||||||||||||||
| Class R-5E: | ||||||||||||||||||||||||||||||||||||||||||||||||
| Period from 11/20/2015 to 7/31/20165,10 | 21.03 | .47 | 1.07 | 1.54 | (.51 | ) | (.37 | ) | (.88 | ) | 21.69 | 7.70 | 7 | — | 8 | .48 | 9 | 3.30 | 9 | |||||||||||||||||||||||||||||
| Class R-5: | ||||||||||||||||||||||||||||||||||||||||||||||||
| Year ended 7/31/2016 | 21.31 | .71 | .76 | 1.47 | (.71 | ) | (.37 | ) | (1.08 | ) | 21.70 | 7.34 | 516 | .33 | 3.46 | |||||||||||||||||||||||||||||||||
| Year ended 7/31/2015 | 21.45 | .74 | (.04 | ) | .70 | (.84 | ) | — | (.84 | ) | 21.31 | 3.25 | 658 | .32 | 3.41 | |||||||||||||||||||||||||||||||||
| Year ended 7/31/2014 | 19.64 | .82 | 1.70 | 2.52 | (.71 | ) | — | (.71 | ) | 21.45 | 13.03 | 567 | .34 | 3.98 | ||||||||||||||||||||||||||||||||||
| Year ended 7/31/2013 | 17.66 | .71 | 1.99 | 2.70 | (.72 | ) | — | (.72 | ) | 19.64 | 15.60 | 525 | .34 | 3.83 | ||||||||||||||||||||||||||||||||||
| Year ended 7/31/2012 | 16.97 | .70 | .73 | 1.43 | (.74 | ) | — | (.74 | ) | 17.66 | 8.70 | 462 | .35 | 4.17 | ||||||||||||||||||||||||||||||||||
| Class R-6: | ||||||||||||||||||||||||||||||||||||||||||||||||
| Year ended 7/31/2016 | 21.32 | .72 | .76 | 1.48 | (.72 | ) | (.37 | ) | (1.09 | ) | 21.71 | 7.39 | 4,606 | .28 | 3.49 | |||||||||||||||||||||||||||||||||
| Year ended 7/31/2015 | 21.46 | .75 | (.04 | ) | .71 | (.85 | ) | — | (.85 | ) | 21.32 | 3.30 | 3,176 | .28 | 3.45 | |||||||||||||||||||||||||||||||||
| Year ended 7/31/2014 | 19.65 | .83 | 1.70 | 2.53 | (.72 | ) | — | (.72 | ) | 21.46 | 13.08 | 2,566 | .29 | 4.03 | ||||||||||||||||||||||||||||||||||
| Year ended 7/31/2013 | 17.66 | .72 | 2.00 | 2.72 | (.73 | ) | — | (.73 | ) | 19.65 | 15.72 | 1,631 | .29 | 3.85 | ||||||||||||||||||||||||||||||||||
| Year ended 7/31/2012 | 16.98 | .71 | .72 | 1.43 | (.75 | ) | — | (.75 | ) | 17.66 | 8.69 | 1,025 | .30 | 4.21 | ||||||||||||||||||||||||||||||||||
| Year ended July 31 | ||||||||||||||||||||
| Portfolio turnover rate for all share classes11 | 2016 | 2015 | 2014 | 2013 | 2012 | |||||||||||||||
| Including mortgage dollar roll transactions | 52 | % | 45 | % | 39 | % | 47 | % | 41 | % | ||||||||||
| Excluding mortgage dollar roll transactions | 39 | % | 32 | % | Not available | |||||||||||||||
| 1 | Based on average shares outstanding. |
| 2 | For the year ended July 31, 2014, this column reflects the impact of a corporate action event that resulted in a one-time increase to net investment income. If the corporate action event had not occurred, the Class A net investment income per share would have been lower by $.11; the Class A ratio of expenses to average net assets would have been lower by .01 percentage points; and the Class A ratio of net income to average net assets would have been lower by .51 percentage points. The impact to the other share classes would have been similar. |
| 3 | Total returns exclude any applicable sales charges, including contingent deferred sales charges. |
| 4 | Class R-2E shares were offered beginning August 29, 2014. |
| 5 | Based on operations for the period shown and, accordingly, is not representative of a full year. |
| 6 | All or a significant portion of assets in this class consisted of seed capital invested by CRMC and/or its affiliates. Fees for distribution services are not charged or accrued on these seed capital assets. If such fees were paid by the fund on seed capital assets, fund expenses would have been higher and net income and total return would have been lower. |
| 7 | Not annualized. |
| 8 | Amount less than $1 million. |
| 9 | Annualized. |
| 10 | Class R-5E shares were offered beginning November 20, 2015. |
| 11 | Refer to Note 5 for more information on mortgage dollar rolls. |
See Notes to Financial Statements
| The Income Fund of America | 35 |
Report of Independent Registered Public Accounting Firm
To the Shareholders and Board of Trustees of The Income Fund of America:
We have audited the accompanying statement of assets and liabilities of The Income Fund of America (the “Fund”), including the summary investment portfolio, as of July 31, 2016, and the related statement of operations for the year then ended, the statements of changes in net assets for each of the two years in the period then ended, and the financial highlights for each of the periods presented. These financial statements and financial highlights are the responsibility of the Fund’s management. Our responsibility is to express an opinion on these financial statements and financial highlights based on our audits.
We conducted our audits in accordance with the standards of the Public Company Accounting Oversight Board (United States). Those standards require that we plan and perform the audit to obtain reasonable assurance about whether the financial statements and financial highlights are free of material misstatement. The Fund is not required to have, nor were we engaged to perform, an audit of its internal control over financial reporting. Our audits included consideration of internal control over financial reporting as a basis for designing audit procedures that are appropriate in the circumstances, but not for the purpose of expressing an opinion on the effectiveness of the Fund’s internal control over financial reporting. Accordingly, we express no such opinion. An audit also includes examining, on a test basis, evidence supporting the amounts and disclosures in the financial statements, assessing the accounting principles used and significant estimates made by management, as well as evaluating the overall financial statement presentation. Our procedures included confirmation of securities owned as of July 31, 2016, by correspondence with the custodian, brokers, and agent banks; where replies were not received from brokers and agent banks, we performed other auditing procedures. We believe that our audits provide a reasonable basis for our opinion.
In our opinion, such financial statements and financial highlights referred to above present fairly, in all material respects, the financial position of The Income Fund of America as of July 31, 2016, the results of its operations for the year then ended, the changes in its net assets for each of the two years in the period then ended, and the financial highlights for each of the periods presented, in conformity with accounting principles generally accepted in the United States of America.
Deloitte & Touche LLP
Costa Mesa, California
September 8, 2016
The Income Fund of America
Part C
Other Information
| Item 28. | Exhibits for Registration Statement (1940 Act No. 811-01880 and 1933 Act. No. 002-33371) |
| (a-1) | Articles of Incorporation – Certificate of Trust dated 8/20/09 – previously filed (see P/E Amendment No. 70 filed 9/30/10); Amended and Restated Agreement and Declaration of Trust dated 12/6/12 – previously filed (see P/E Amendment No. 75 filed 9/30/13); Certificate of Establishment and Designation of Class R-2E Shares – previously filed (see P/E Amendment No. 77 filed 8/28/14); Certificate of Establishment and Designation of Class R-5E Shares dated 8/31/15 – previously filed (see P/E Amendment No. 83 filed 10/29/15); and Certificate of Establishment and Designation of Class F-3 Shares dated 9/12/16 – previously filed (see P/E Amendment No. 87 filed 12/29/16) |
| (a-2) | Certificate of Establishment and Designation of Class T Shares and Class 529-T Shares dated 12/8/16 |
| (b) | By-laws – By-laws – previously filed (see P/E Amendment No. 70 filed 9/30/10) |
| (c) | Instruments Defining Rights of Security Holders – Form of Share Certificate – previously filed (see P/E Amendment No. 55 filed 3/8/01) |
| (d) | Investment Advisory Contracts – Amended and Restated Investment Advisory and Service Agreement dated 2/1/16 – previously filed (see P/E Amendment No. 85 filed 9/30/16) |
| (e-1) | Underwriting Contracts – Form of Selling Group Agreement – previously filed (see P/E Amendment No. 85 filed 9/30/16); Form of Bank/Trust Company Selling Group Agreement – previously filed (see P/E Amendment No. 85 filed 9/30/16); Form of Class F Share Participation Agreement – previously filed (see P/E Amendment No. 77 filed 8/28/14); and Form of Bank/Trust Company Participation Agreement for Class F Shares – previously filed (see P/E Amendment No. 77 filed 8/28/14) |
| (e-2) | Form of Amended and Restated Principal Underwriting Agreement effective 4/7/17 |
| (f) | Bonus or Profit Sharing Contracts – Deferred Compensation Plan effective 1/1/14 – previously filed (see P/E Amendment No. 85 filed 9/30/16) |
| (g) | Custodian Agreements – Form of Global Custody Agreement dated 12/21/06 – previously filed (see P/E Amendment No. 64 filed 9/28/07); and Form of Amendment to Global Custody Agreement effective 7/1/15 – previously filed (see P/E Amendment No. 81 filed 10/1/15) |
| (h-1) | Other Material Contracts – Form of Indemnification Agreement – previously filed (see P/E Amendment No. 70 filed 9/30/10); and Form of Agreement and Plan of Reorganization dated 8/24/09 – previously filed (see P/E Amendment No. 70 filed 9/30/10) |
| (h-2) | Form of Amended and Restated Shareholder Services Agreement effective 4/7/17; and Form of Amended and Restated Administrative Services Agreement effective 4/7/17 |
| (i-1) | Legal Opinion – Legal Opinion – previously filed (see P/E Amendment No. 70 filed 9/30/10; P/E Amendment No. 77 filed 8/28/14; P/E Amendment No. 83 filed 10/29/15; and P/E Amendment No. 87 filed 12/29/16) |
| (i-2) | Legal Opinion |
| (j) | Other Opinions – Consent of Independent Registered Public Accounting Firm |
(k) Omitted financial statements - none
| (l) | Initial capital agreements - not applicable to this filing |
| (m-1) | Rule 12b-1 Plan – Forms of Plans of Distribution for Class A, B, C, F-1, 529-A, 529-B, 529-C, 529-E, 529-F-1, R-1, R-2, R-3 and R-4 shares dated 10/1/10 – previously filed (see P/E Amendment No. 70 filed 9/30/10); and Form of Plan of Distribution for Class shares R-2E dated 8/29/14 – previously filed (see P/E Amendment No. 77 filed 8/28/14) |
| (m-2) | Forms of Plans of Distribution for Class T Shares and Class 529-T Shares dated 4/7/17 |
| (n) | Rule 18f-3 Plan – Form of Amended and Restated Multiple Class plan effective 4/7/17 |
(o) Reserved
| (p) | Code of Ethics – Code of Ethics for The Capital Group Companies dated October 2016; and Code of Ethics for Registrant |
| Item 29. | Persons Controlled by or under Common Control with the Fund |
None
| Item 30. | Indemnification |
The Registrant is a joint-insured under Investment Adviser/Mutual Fund Errors and Omissions Policies, which insure its officers and trustees against certain liabilities. However, in no event will Registrant maintain insurance to indemnify any such person for any act for which Registrant itself is not permitted to indemnify the individual.
Article 8 of the Registrant’s Declaration of Trust as well as the indemnification agreements that the Registrant has entered into with each of its trustees who is not an “interested person” of the Registrant (as defined under the Investment Company Act of 1940, as amended), provide in effect that the Registrant will indemnify its officers and trustees against any liability or expenses actually and reasonably incurred by such person in any proceeding arising out of or in connection with his or her service to the Registrant, to the fullest extent permitted by applicable law, subject to certain conditions. In accordance with Section 17(h) and 17(i) of the Investment Company Act of 1940, as amended, and their respective terms, these
provisions do not protect any person against any liability to the Registrant or its shareholders to which such person would otherwise be subject by reason of willful misfeasance, bad faith, gross negligence, or reckless disregard of the duties involved in the conduct of his or her office.
Insofar as indemnification for liability arising under the Securities Act of 1933 may be permitted to trustees, officers and controlling persons of the Registrant pursuant to the foregoing provisions, or otherwise, the Registrant has been advised that in the opinion of the U.S. Securities and Exchange Commission such indemnification is against public policy as expressed in the Act and is, therefore, unenforceable. In the event that a claim for indemnification against such liabilities (other than the payment by the Registrant of expenses incurred or paid by a trustee, officer or controlling person of the Registrant in the successful defense of any action, suit or proceeding) is asserted by such trustee, officer or controlling person in connection with the securities being registered, the Registrant will, unless in the opinion of its counsel the matter has been settled by controlling precedent, submit to a court of appropriate jurisdiction the question whether such indemnification by it is against public policy as expressed in the Act and will be governed by the final adjudication of such issue.
Registrant will comply with the indemnification requirements contained in the Investment Company Act of 1940, as amended, and Release Nos. 7221 (June 9, 1972) and 11330 (September 4, 1980).
| Item 31. | Business and Other Connections of the Investment Adviser |
None
| Item 32. | Principal Underwriters |
(a) American Funds Distributors, Inc. is the Principal Underwriter of shares of: AMCAP Fund, American Balanced Fund, American Funds College Target Date Series, American Funds Corporate Bond Fund, American Funds Developing World Growth and Income Fund, American Funds Emerging Markets Bond Fund, American Funds Fundamental Investors, American Funds Global Balanced Fund, The American Funds Income Series, American Funds Inflation Linked Bond Fund, American Funds Mortgage Fund, American Funds Portfolio Series, American Funds Retirement Income Portfolio Series, American Funds Short-Term Tax-Exempt Bond Fund, American Funds Strategic Bond Fund, American Funds Target Date Retirement Series, American Funds Tax-Exempt Fund of New York, The American Funds Tax-Exempt Series II, American Funds U.S. Government Money Market Fund, American High-Income Municipal Bond Fund, American High-Income Trust, American Mutual Fund, The Bond Fund of America, Capital Group Emerging Markets Total Opportunities Fund, Capital Income Builder, Capital Group Private Client Services Funds, Capital World Bond Fund, Capital World Growth and Income Fund, Emerging Markets Growth Fund, Inc., EuroPacific Growth Fund, The Growth Fund of America, The Income Fund of America, Intermediate Bond Fund of America, International Growth and Income Fund, The Investment Company of America, Limited Term Tax-Exempt Bond Fund of America, The New Economy Fund, New Perspective Fund, New World Fund, Inc., Short-Term Bond Fund of America, SMALLCAP World Fund, Inc., The Tax-Exempt Bond Fund of America and Washington Mutual Investors Fund
(b)
|
(1) Name and Principal Business Address
|
(2) Positions and Offices with Underwriter |
(3) Positions and Offices with Registrant | |
| LAO |
Raymond Ahn
|
Vice President | None |
| LAO |
C. Thomas Akin II
|
Regional Vice President | None |
| IRV |
Laurie M. Allen
|
Senior Vice President | None |
| LAO |
William C. Anderson
|
Senior Vice President | None |
| LAO |
Dion T. Angelopoulos
|
Assistant Vice President | None |
| LAO |
Curtis A. Baker
|
Senior Vice President, Capital Group Institutional Investment Services Division | None |
| LAO |
T. Patrick Bardsley
|
Vice President | None |
| SNO |
Mark C. Barile
|
Assistant Vice President | None |
| LAO |
Shakeel A. Barkat
|
Senior Vice President | None |
| LAO |
Brett A. Beach
|
Assistant Vice President | None |
| LAO |
Jerry R. Berg
|
Regional Vice President | None |
| LAO |
Michel L. Bergesen
|
Vice President | None |
| LAO |
Joseph W. Best, Jr.
|
Senior Vice President, Capital Group Institutional Investment Services Division | None |
| LAO |
Roger J. Bianco, Jr.
|
Vice President | None |
| LAO |
Ryan M. Bickle
|
Vice President, Capital Group Institutional Investment Services Division | None |
| LAO |
John A. Blanchard
|
Senior Vice President | None |
| LAO |
Marek Blaskovic
|
Regional Vice President | None |
| LAO |
Gerard M. Bockstie, Jr.
|
Senior Vice President | None |
| LAO |
Jill M. Boudreau
|
Vice President, Capital Group Institutional Investment Services Division | None |
| LAO |
Andre W. Bouvier
|
Vice President, Capital Group Institutional Investment Services Division | None |
| LAO |
Michael A. Bowman
|
Senior Vice President, Capital Group Institutional Investment Services Division | None |
| LAO |
William P. Brady
|
Senior Vice President | None |
| IRV |
Jason E. Brady
|
Regional Vice President | None |
| IND |
Robert W. Brinkman
|
Assistant Vice President | None |
| LAO |
Kevin G. Broulette
|
Assistant Vice President | None |
| LAO |
C. Alan Brown
|
Vice President | None |
| LAO |
E. Chapman Brown, Jr.
|
Regional Vice President | None |
| LAO |
Toni L. Brown
|
Senior Vice President, Capital Group Institutional Investment Services Division | None |
| IND |
Jennifer A. Bruce
|
Assistant Vice President | None |
| LAO |
Gary D. Bryce
|
Vice President | None |
| IRV |
Eileen K. Buckner
|
Assistant Vice President | None |
| LAO |
Sheryl M. Burford
|
Assistant Vice President | None |
| LAO |
Ronan J. Burke
|
Senior Vice President, Capital Group Institutional Investment Services Division | None |
| LAO |
Steven Calabria
|
Senior Vice President | None |
| LAO |
Thomas E. Callahan
|
Vice President | None |
| LAO |
Anthony J. Camilleri
|
Regional Vice President | None |
| LAO |
Kelly V. Campbell
|
Vice President | None |
| LAO |
Anthon S. Cannon III
|
Assistant Vice President | None |
| LAO |
Jason S. Carlough
|
Regional Vice President | None |
| LAO |
Damian F. Carroll
|
Senior Vice President, Capital Group Institutional Investment Services Division | None |
| LAO |
James D. Carter
|
Vice President | None |
| LAO |
Stephen L. Caruthers
|
Vice President, Capital Group Institutional Investment Services Division | None |
| SFO |
James G. Carville
|
Senior Vice President, Capital Group Institutional Investment Services Division
|
None |
| LAO |
Philip L. Casciano
|
Regional Vice President | None |
| LAO |
Brian C. Casey
|
Senior Vice President | None |
| LAO |
Craig L. Castner
|
Regional Vice President | None |
| LAO |
Christopher M. Cefalo
|
Regional Vice President
|
None |
| LAO |
Kent W. Chan
|
Vice President | None |
| LAO |
Becky C. Chao
|
Vice President | None |
| LAO |
David D. Charlton
|
Senior Vice President | None |
| LAO |
Thomas M. Charon
|
Senior Vice President | None |
| LAO |
Daniel A. Chodosch
|
Regional Vice President | None |
| LAO |
Wellington Choi
|
Senior Vice President, Capital Group Institutional Investment Services Division | None |
| LAO |
Paul A. Cieslik
|
Senior Vice President | None |
| IND |
G. Michael Cisternino
|
Assistant Vice President | None |
| LAO |
Andrew R. Claeson
|
Regional Vice President | None |
| LAO |
Kevin G. Clifford
|
Director, Chairman and Chief Executive Officer; President, Capital Group Institutional Investment Services Division | None |
| LAO |
Hannah L. Coan
|
Vice President | None |
| LAO |
Ruth M. Collier
|
Senior Vice President | None |
| IND |
Timothy J. Colvin
|
Regional Vice President | None |
| LAO |
Christopher M. Conwell
|
Vice President | None |
| LAO |
C. Jeffrey Cook
|
Senior Vice President, Capital Group Institutional Investment Services Division | None |
| LAO |
Joseph G. Cronin
|
Senior Vice President | None |
| LAO |
D. Erick Crowdus
|
Vice President | None |
| LAO |
Brian M. Daniels
|
Vice President | None |
| LAO |
Hanh M. Dao
|
Vice President | None |
| LAO |
William F. Daugherty
|
Senior Vice President | None |
| LAO |
Scott T. Davis
|
Vice President | None |
| LAO |
Shane L. Davis
|
Vice President | None |
| LAO |
Peter J. Deavan
|
Vice President | None |
| LAO |
Guy E. Decker
|
Senior Vice President | None |
| LAO |
Renee A. Degner
|
Regional Vice President | None |
| LAO |
Daniel Delianedis
|
Senior Vice President | None |
| LAO |
Mark A. Dence
|
Vice President | None |
| LAO |
Stephen Deschenes
|
Senior Vice President | None |
| LAO |
Mario P. DiVito
|
Vice President, Capital Group Institutional Investment Services Division | None |
| LAO |
Joanne H. Dodd
|
Senior Vice President, Capital Group Institutional Investment Services Division | None |
| LAO |
Kevin F. Dolan
|
Vice President | None |
| LAO |
Thomas L. Donham
|
Vice President | None |
| LAO |
John H. Donovan IV
|
Assistant Vice President | None |
| LAO |
John J. Doyle
|
Senior Vice President, Capital Group Institutional Investment Services Division | None |
| LAO |
Ryan T. Doyle
|
Vice President | None |
| LAO |
Craig Duglin
|
Senior Vice President | None |
| LAO |
Alan J. Dumas
|
Regional Vice President | None |
| SNO |
Bryan K. Dunham
|
Assistant Vice President | None |
| LAO |
John E. Dwyer IV
|
Senior Vice President, Capital Group Institutional Investment Services Division | None |
| IND |
Karyn B. Dzurisin
|
Regional Vice President | None |
| LAO |
Kevin C. Easley
|
Regional Vice President | None |
| LAO |
Damian Eckstein
|
Regional Vice President | None |
| LAO |
Matthew J. Eisenhardt
|
Senior Vice President | None |
| LAO |
Timothy L. Ellis
|
Senior Vice President | None |
| LAO |
John M. Fabiano
|
Regional Vice President | None |
| LAO |
E. Luke Farrell
|
Senior Vice President, Capital Group Institutional Investment Services Division | None |
| LAO |
Bryan R. Favilla
|
Regional Vice President | None |
| LAO |
Mark A. Ferraro
|
Regional Vice President | None |
| LAO |
James M. Ferrauilo
|
Vice President | None |
| LAO |
Lorna Fitzgerald
|
Vice President | None |
| LAO |
William F. Flannery
|
Senior Vice President | None |
| LAO |
Kevin H. Folks
|
Regional Vice President | None |
| LAO |
David R. Ford
|
Regional Vice President | None |
| LAO |
Steven M. Fox
|
Vice President | None |
| LAO |
Vanda S. Freesman
|
Vice President | None |
| LAO |
Daniel Frick
|
Senior Vice President | None |
| SNO |
Arturo V. Garcia, Jr.
|
Vice President | None |
| LAO |
J. Gregory Garrett
|
Senior Vice President, Capital Group Institutional Investment Services Division | None |
| LAO |
Brian K. Geiger
|
Vice President | None |
| LAO |
Jacob M. Gerber
|
Vice President, Capital Group Institutional Investment Services Division | None |
| LAO |
J. Christopher Gies
|
Senior Vice President | None |
| LAO |
Pamela A. Gillett
|
Regional Vice President
|
None |
| LAO |
William F. Gilmartin
|
Regional Vice President | None |
| SNO |
Craig B. Gray
|
Assistant Vice President | None |
| LAO |
Robert E. Greeley, Jr.
|
Vice President | None |
| LAO |
Jameson R. Greenstone
|
Regional Vice President | None |
| LAO |
Jeffrey J. Greiner
|
Senior Vice President | None |
| LAO |
Eric M. Grey
|
Senior Vice President | None |
| LAO |
E. Renee Grimm
|
Regional Vice President
|
None |
| SNO |
Virginia Guevara
|
Assistant Vice President | None |
| IRV |
Steven Guida
|
Senior Vice President | None |
| LAO |
Sam S. Gumma
|
Regional Vice President | None |
| LAO |
Jan S. Gunderson
|
Senior Vice President | None |
| LAO |
Ralph E. Haberli
|
Senior Vice President; Senior Vice President, Capital Group Institutional Investment Services Division
|
None |
| IRV |
DeAnn C. Haley
|
Vice President | None |
| LAO |
Paul B. Hammond
|
Senior Vice President | None |
| LAO |
Philip E. Haning
|
Regional Vice President | None |
| LAO |
Dale K. Hanks
|
Vice President, Capital Group Institutional Investment Services Division | None |
| LAO |
David R. Hanna
|
Regional Vice President | None |
| LAO |
Brandon S. Hansen
|
Regional Vice President | None |
| LAO |
Derek S. Hansen
|
Senior Vice President | None |
| LAO |
Julie O. Hansen
|
Vice President | None |
| LAO |
John R. Harley
|
Senior Vice President | None |
| LAO |
Calvin L. Harrelson III
|
Senior Vice President, Capital Group Institutional Investment Services Division | None |
| LAO |
Robert J. Hartig, Jr.
|
Senior Vice President | None |
| LAO |
Craig W. Hartigan
|
Senior Vice President | None |
| LAO |
Alan M. Heaton
|
Vice President | None |
| LAO |
Clifford W. “Webb” Heidinger
|
Regional Vice President | None |
| LAO |
Brock A. Hillman
|
Vice President, Capital Group Institutional Investment Services Division
|
None |
| LAO |
Jennifer M. Hoang
|
Vice President | None |
| LAO |
Heidi B. Horwitz-Marcus
|
Senior Vice President | None |
| LAO |
David R. Hreha
|
Regional Vice President | None |
| LAO |
Frederic J. Huber
|
Vice President, Capital Group Institutional Investment Services Division | None |
| LAO |
David K. Hummelberg
|
Director, Senior Vice President, Treasurer and Controller | None |
| LAO |
James A. Humpherson Mollett
|
Regional Vice President | None |
| LAO |
Jeffrey K. Hunkins
|
Vice President | None |
| LAO |
Marc G. Ialeggio
|
Senior Vice President | None |
| IND |
David K. Jacocks
|
Assistant Vice President | None |
| LAO |
W. Chris Jenkins
|
Vice President | None |
| LAO |
Daniel J. Jess II
|
Regional Vice President | None |
| IND |
Jameel S. Jiwani
|
Regional Vice President | None |
| LAO |
Sarah C. Johnson
|
Vice President | None |
| LAO |
Brendan M. Jonland
|
Vice President | None |
| LAO |
David G. Jordt
|
Regional Vice President
|
None |
| LAO |
Stephen T. Joyce
|
Senior Vice President, Capital Group Institutional Investment Services Division | None |
| LAO |
Thomas J. Joyce
|
Vice President | None |
| LAO |
Maria Karahalis
|
Senior Vice President, Capital Group Institutional Investment Services Division | |
| LAO |
John P. Keating
|
Senior Vice President | None |
| LAO |
David B. Keib
|
Regional Vice President | None |
| LAO |
Brian G. Kelly
|
Senior Vice President | None |
| LAO |
Christopher J. Kennedy
|
Regional Vice President | None |
| LAO |
Jason A. Kerr
|
Vice President | None |
| LAO |
Ryan C. Kidwell
|
Vice President | None |
| LAO |
Layla S. Kim
|
Vice President | None |
| IRV |
Michael C. Kim
|
Vice President | None |
| LAO |
Charles A. King
|
Senior Vice President, Capital Group Institutional Investment Services Division | None |
| LAO |
Mark Kistler
|
Senior Vice President | None |
| LAO |
Stephen J. Knutson
|
Assistant Vice President | None |
| LAO |
James M. Kreider
|
Vice President | None |
| IRV |
Theresa A. Kristiansen
|
Vice President | None |
| SNO |
David D. Kuncho
|
Vice President | None |
| LAO |
Richard M. Lang
|
Vice President, Capital Group Institutional Investment Services Division | None |
| LAO |
Christopher F. Lanzafame
|
Senior Vice President | None |
| LAO |
Andrew P. Laskowski
|
Regional Vice President | None |
| SNO |
Sandra A. Lass
|
Assistant Vice President | None |
| LAO |
Andrew Le Blanc
|
Senior Vice President | None |
| LAO |
Matthew N. Leeper
|
Vice President | None |
| LAO |
Clay M. Leveritt
|
Vice President | None |
| LAO |
Louis K. Linquata
|
Senior Vice President | None |
| LAO |
Heather M. Lord
|
Senior Vice President | None |
| LAO |
James M. Maher
|
Regional Vice President | None |
| LAO |
Brendan T. Mahoney
|
Senior Vice President | None |
| LAO |
Nathan G. Mains
|
Vice President | None |
| LAO |
Sirish S. Mani
|
Vice President | None |
| LAO |
Brooke M. Marrujo
|
Vice President | None |
| LAO |
Stephen B. May
|
Regional Vice President | None |
| LAO |
Joseph A. McCreesh, III
|
Senior Vice President | None |
| LAO |
Ross M. McDonald
|
Vice President | None |
| LAO |
Timothy W. McHale
|
Secretary | None |
| LAO |
Max J. McQuiston
|
Regional Vice President | None |
| LAO |
Scott M. Meade
|
Senior Vice President | None |
| LAO |
Simon Mendelson
|
Senior Vice President | None |
| LAO |
David A. Merrill
|
Assistant Vice President | None |
| LAO |
Jennifer M. Miller
|
Regional Vice President | None |
| LAO |
William T. Mills
|
Senior Vice President | None |
| LAO |
Sean C. Minor
|
Vice President | None |
| LAO |
James R. Mitchell III
|
Vice President | None |
| LAO |
Charles L. Mitsakos
|
Senior Vice President | None |
| LAO |
Ryan D. Moore
|
Vice President, Capital Group Institutional Investment Services Division | None |
| LAO |
David H. Morrison
|
Vice President, Capital Group Institutional Investment Services Division | None |
| LAO |
Andrew J. Moscardini
|
Senior Vice President, Capital Group Institutional Investment Services Division | None |
| NYO |
Timothy J. Murphy
|
Vice President | None |
| LAO |
Jon C. Nicolazzo
|
Vice President | None |
| LAO |
Earnest M. Niemi
|
Vice President | None |
| LAO |
William E. Noe
|
Senior Vice President | None |
| LAO |
Matthew P. O’Connor
|
Director and President; Senior Vice President, Capital Group Institutional Investment Services Division | None |
| IND |
Jody L. O’Dell
|
Assistant Vice President | None |
| LAO |
Jonathan H. O’Flynn
|
Vice President | None |
| LAO |
Peter A. Olsen
|
Regional Vice President | None |
| LAO |
Jeffrey A. Olson
|
Vice President | None |
| LAO |
Thomas A. O’Neil
|
Vice President | None |
| IRV |
Paula A. Orologas
|
Vice President | None |
| LAO |
Gregory H. Ortman
|
Vice President, Capital Group Institutional Investment Services Division | None |
| LAO |
Shawn M. O’Sullivan
|
Vice President | None |
| IND |
Lance T. Owens
|
Vice President | None |
| LAO |
Kristina E. Page
|
Regional Vice President | None |
| LAO |
Rodney Dean Parker II
|
Vice President | None |
| LAO |
Lynn M. Patrick
|
Vice President, Capital Group Institutional Investment Services Division | None |
| LAO |
Timothy C. Patterson
|
Assistant Vice President | None |
| LAO |
W. Burke Patterson, Jr.
|
Senior Vice President | None |
| LAO |
Gary A. Peace
|
Senior Vice President | None |
| LAO |
Robert J. Peche
|
Vice President, Capital Group Institutional Investment Services Division | None |
| LAO |
David K. Petzke
|
Senior Vice President | None |
| LAO |
Adam W. Phillips
|
Vice President | None |
| LAO |
Joseph M. Piccolo
|
Vice President | None |
| LAO |
Keith A. Piken
|
Senior Vice President | None |
| LAO |
John Pinto
|
Senior Vice President, Capital Group Institutional Investment Services Division | None |
| LAO |
Carl S. Platou
|
Senior Vice President | None |
| SNO |
Andrew H. Plummer
|
Assistant Vice President | None |
| LAO |
David T. Polak
|
Senior Vice President, Capital Group Institutional Investment Services Division | None |
| LAO |
Charles R. Porcher
|
Vice President | None |
| LAO |
Leah K. Porter
|
Vice President | None |
| SNO |
Robert B. Potter III
|
Assistant Vice President | None |
| LAO |
Abbas Qasim
|
Vice President | None |
| LAO |
Steven J. Quagrello
|
Senior Vice President | None |
| IND |
Kelly S. Quick
|
Assistant Vice President | None |
| LAO |
Michael R. Quinn
|
Senior Vice President | None |
| LAO |
James R. Raker
|
Vice President, Capital Group Institutional Investment Services Division | None |
| LAO |
Sunder R. Ramkumar
|
Senior Vice President | None |
| LAO |
Rachel M. Ramos
|
Assistant Vice President | None |
| SNO |
John P. Raney
|
Vice President | None |
| LAO |
James P. Rayburn
|
Vice President | None |
| LAO |
Rene M. Reincke
|
Vice President | None |
| LAO |
Christopher J. Richardson
|
Regional Vice President | None |
| SNO |
Stephanie A. Robichaud
|
Assistant Vice President | None |
| LAO |
Jeffrey J. Robinson
|
Vice President | None |
| LAO |
Matthew M. Robinson
|
Regional Vice President | None |
| LAO |
Thomas W. Rose
|
Vice President, Capital Group Institutional Investment Services Division | None |
| SNO |
Tracy M. Roth
|
Assistant Vice President | None |
| LAO |
Rome D. Rottura
|
Senior Vice President | None |
| LAO |
Shane A. Russell
|
Vice President | None |
| LAO |
William M. Ryan
|
Senior Vice President | None |
| LAO |
Dean B. Rydquist
|
Director, Senior Vice President and Chief Compliance Officer | None |
| IND |
Brenda S. Rynski
|
Regional Vice President | None |
| LAO |
Richard A. Sabec, Jr.
|
Senior Vice President | None |
| SNO |
Richard R. Salinas
|
Assistant Vice President | None |
| LAO |
Paul V. Santoro
|
Senior Vice President | None |
| LAO |
Keith A. Saunders
|
Regional Vice President | None |
| LAO |
Joe D. Scarpitti
|
Senior Vice President | None |
| LAO |
Joe D. Scarpitti
|
Senior Vice President | None |
| LAO |
Michael A. Schweitzer
|
Senior Vice President | None |
| LAO |
Mark A. Seaman
|
Senior Vice President, Capital Group Institutional Investment Services Division | None |
| LAO |
James J. Sewell III
|
Senior Vice President | None |
| LAO |
Arthur M. Sgroi
|
Senior Vice President | None |
| LAO |
Brad W. Short
|
Vice President | None |
| LAO |
Nathan W. Simmons
|
Vice President | None |
| LAO |
Connie F. Sjursen
|
Vice President | None |
| LAO |
Melissa A. Sloane
|
Regional Vice President | None |
| LAO |
Matthew T. Smith
|
Vice President | None |
| SNO |
Stacy D. Smolka
|
Vice President | None |
| LAO |
J. Eric Snively
|
Vice President | None |
| LAO |
Jason M. Snow
|
Regional Vice President | None |
| LAO |
Kristen J. Spazafumo
|
Vice President | None |
| LAO |
Margaret V. Steinbach
|
Vice President | None |
| LAO |
Michael P. Stern
|
Senior Vice President | None |
| LAO |
Andrew J. Strandquist
|
Regional Vice President
|
None |
| IRV |
Todd O. Stucke
|
Assistant Vice President | None |
| LAO |
Peter D. Thatch
|
Senior Vice President | None |
| LAO |
John B. Thomas
|
Vice President | None |
| LAO |
Cynthia M. Thompson
|
Senior Vice President, Capital Group Institutional Investment Services Division | None |
| IND |
Scott E. Thompson
|
Assistant Vice President | None |
| HRO |
Stephen B. Thompson
|
Regional Vice President | None |
| LAO |
Mark R. Threlfall
|
Vice President | None |
| LAO |
Russell W. Tipper
|
Senior Vice President | None |
| LAO |
Luke N. Trammell
|
Senior Vice President | None |
| LAO |
Jordan A. Trevino
|
Regional Vice President | None |
| LAO |
Shaun C. Tucker
|
Senior Vice President | None |
| LAO |
David E. Unanue
|
Senior Vice President | None |
| LAO |
Idoya Urrutia
|
Assistant Vice President | None |
| LAO |
Scott W. Ursin-Smith
|
Senior Vice President | None |
| LAO |
Patrick D. Vance
|
Regional Vice President | None |
| LAO |
Michael R. Van Wyk
|
Vice President | None |
| LAO |
Srinkanth Vemuri
|
Vice President | None |
| LAO |
Spilios Venetsanopoulos
|
Regional Vice President | None |
| LAO |
J. David Viale
|
Senior Vice President | None |
| LAO |
Robert D. Vigneaux III
|
Vice President, Capital Group Institutional Investment Services Division | None |
| LAO |
Jayakumar Vijayanathan
|
Senior Vice President | None |
| LAO |
Todd R. Wagner
|
Senior Vice President, Capital Group Institutional Investment Services Division | None |
| LAO |
Jon N. Wainman
|
Regional Vice President | None |
| LAO |
Sherrie S. Walling
|
Assistant Vice President | None |
| LAO |
Brian M. Walsh
|
Vice President | None |
| LAO |
Susan O. Walton
|
Senior Vice President, Capital Group Institutional Investment Services Division | None |
| SNO |
Chris L. Wammack
|
Vice President | None |
| LAO |
Matthew W. Ward
|
Regional Vice President | None |
| LAO |
Thomas E. Warren
|
Senior Vice President | None |
| IND |
Kristen M. Weaver
|
Assistant Vice President | None |
| LAO |
George J. Wenzel
|
Senior Vice President | None |
| LAO |
Jason M. Weybrecht
|
Senior Vice President, Capital Group Institutional Investment Services Division | None |
| LAO |
Adam B. Whitehead
|
Vice President | None |
| LAO |
N. Dexter Williams
|
Senior Vice President | None |
| LAO |
Steven Wilson
|
Vice President | None |
| LAO |
Steven C. Wilson
|
Vice President | None |
| LAO |
Kurt A. Wuestenberg
|
Senior Vice President | None |
| LAO |
Jonathan A. Young
|
Senior Vice President | None |
| LAO |
Jason P. Young
|
Senior Vice President | None |
| LAO |
Raul Zarco, Jr.
|
Vice President, Capital Group Institutional Investment Services Division | None |
| IND |
Ellen M. Zawacki
|
Vice President | None |
__________
| DCO | Business Address, 3000 K Street N.W., Suite 230, Washington, DC 20007-5140 |
| GVO-1 | Business Address, 3 Place des Bergues, 1201 Geneva, Switzerland |
| HRO | Business Address, 5300 Robin Hood Road, Norfolk, VA 23513 |
| IND | Business Address, 12811 North Meridian Street, Carmel, IN 46032 |
| IRV | Business Address, 6455 Irvine Center Drive, Irvine, CA 92618 |
| LAO | Business Address, 333 South Hope Street, Los Angeles, CA 90071 |
| LAO-W | Business Address, 11100 Santa Monica Blvd., 15th Floor, Los Angeles, CA 90025 |
| NYO | Business Address, 630 Fifth Avenue, 36th Floor, New York, NY 10111 |
| SFO | Business Address, One Market, Steuart Tower, Suite 2000, San Francisco, CA 94105 |
| SNO | Business Address, 3500 Wiseman Boulevard, San Antonio, TX 78251 |
(c) None
| Item 33. | Location of Accounts and Records |
Accounts, books and other records required by Rules 31a-1 and 31a-2 under the Investment Company Act of 1940, as amended, are maintained and kept in the offices of the Registrant’s investment adviser, Capital Research and Management Company, 333 South Hope Street, Los Angeles, California 90071; 6455 Irvine Center Drive, Irvine, California 92618; and/or 5300 Robin Hood Road, Norfolk, Virginia 23513.
Registrant’s records covering shareholder accounts are maintained and kept by its transfer agent, American Funds Service Company, 6455 Irvine Center Drive, Irvine, California 92618; 12811 North Meridian Street, Carmel, Indiana 46032; 3500 Wiseman Boulevard, San Antonio, Texas 78251; and 5300 Robin Hood Road, Norfolk, VA 23513.
Registrant’s records covering portfolio transactions are maintained and kept by its custodian, JPMorgan Chase Bank, N.A., 270 Park Avenue, New York, New York 10017-2070.
| Item 34. | Management Services |
None
| Item 35. | Undertakings |
None
SIGNATURES
Pursuant to the requirements of the Securities Act of 1933 and the Investment Company Act of 1940 the Registrant certifies that it meets all of the requirements for effectiveness of this Registration Statement under Rule 485(b) under the Securities Act of 1933 and has duly caused this Registration Statement to be signed on its behalf by the undersigned, duly authorized, in the City of Los Angeles, and State of California on the 6th day of April, 2017.
THE INCOME FUND OF AMERICA
By: /s/ Hilda L. Applbaum
(Hilda L. Applbaum, Vice Chairman of the Board)
Pursuant to the requirements of the Securities Act of 1933, this Registration Statement has been signed below on April 6, 2017, by the following persons in the capacities indicated.
| Signature | Title | |
| (1) | Principal Executive Officer: | |
| /s/ Hilda L. Applbaum | Vice Chairman of the Board | |
| (Hilda L. Applbaum) | ||
| (2) | Principal Financial Officer and Principal Accounting Officer: | |
| /s/ Brian C. Janssen | Treasurer | |
| (Brian C. Janssen) | ||
| (3) | Trustees: | |
| /s/ Hilda L. Applbaum | Vice Chairman of the Board | |
| (Hilda L. Applbaum) | ||
| William H. Baribault* | Trustee | |
| Vanessa C. L. Chang* | Trustee | |
| Linda Griego* | Trustee | |
| Leonade D. Jones* | Trustee | |
| William D. Jones* | Trustee | |
| James J. Postl* | Trustee | |
| Margaret Spellings* | Trustee | |
| Isaac Stein* | Chairman of the Board (Independent and Non-Executive) | |
| *By: /s/ Michael W. Stockton | ||
| (Michael W. Stockton, pursuant to a power of attorney filed herewith) | ||
Counsel represents that the amendment does not contain disclosures that would make the amendment ineligible for effectiveness under the provisions of Rule 485(b).
/s/ Rachel V. Nass
(Rachel V. Nass, Counsel)
POWER OF ATTORNEY
I, William H. Baribault, the undersigned Board member of the following registered investment companies (collectively, the “Funds”):
| - | American Balanced Fund (File No. 002-10758, File No. 811-00066) |
| - | American Funds College Target Date Series (File No. 333-180729, File No. 811-22692) |
| - | American Funds Corporate Bond Fund (File No. 333-183929, File No. 811-22744) |
| - | American Funds Developing World Growth and Income Fund (File No. 333-190913, File No. 811-22881) |
| - | American Funds Emerging Markets Bond Fund (File No. 333-208636; File No. 811-23122) |
| - | The American Funds Income Series – U.S. Government Securities Fund (File No. 002-98199, File No. 811-04318) |
| - | American Funds Inflation Linked Bond Fund (File No. 333-183931, File No. 811-22746) |
| - | American Funds Insurance Series (File No. 002-86838, File No. 811-03857) |
| - | American Funds Insurance Series |
| - | American Funds Mortgage Fund (File No. 333-168595, File No. 811-22449) |
| - | American Funds Portfolio Series (File No. 333-178936, File No. 811-22656) |
| - | American Funds Retirement Income Portfolio Series (File No. 333-203797, File No. 811-23053) |
| - | American Funds Short-Term Tax-Exempt Bond Fund (File No. 033-26431, File No. 811-05750) |
| - | American Funds Strategic Bond Fund (File No. 333-207474, File No. 811-23101) |
| - | American Funds Target Date Retirement Series (File No. 333-138648, File No. 811-21981) |
| - | American Funds Tax-Exempt Fund of New York (File No. 333-168594, File No. 811-22448) |
| - | The American Funds Tax-Exempt Series II – The Tax-Exempt Fund of California (File No. 033-06180, File No. 811-04694) |
| - | American Funds U.S. Government Money Market Fund (File No. 333-157162, File No. 811-22277) |
| - | American High-Income Municipal Bond Fund (File No. 033-80630, File No. 811-08576) |
| - | American High-Income Trust (File No. 033-17917, File No. 811-05364) |
| - | The Bond Fund of America (File No. 002-50700, File No. 811-02444) |
| - | Capital World Bond Fund (File No. 033-12447, File No. 811-05104) |
| - | The Income Fund of America (File No. 002-33371, File No. 811-01880) |
| - | Intermediate Bond Fund of America (File No. 033-19514, File No. 811-05446) |
| - | International Growth and Income Fund (File No. 333-152323, File No. 811-22215) |
| - | Limited Term Tax-Exempt Bond Fund of America (File No. 033-66214, File No. 811-07888) |
| - | Short-Term Bond Fund of America (File No. 333-135770, File No. 811-21928) |
| - | The Tax-Exempt Bond Fund of America (File No. 002-49291, File No. 811-02421) |
hereby revoke all previous powers of attorney I have signed and otherwise act in my name and behalf in matters involving the Funds and do hereby constitute and appoint
|
Jennifer L. Butler Steven I. Koszalka Michael W. Stockton Jane Y. Chung Susan K. Countess Julie E. Lawton Laurie D. Neat Viviane T. Russo Raymond F. Sullivan, Jr. |
Brian C. Janssen Dori Laskin Hong Le Gregory F. Niland |
each of them singularly, my true and lawful attorneys-in-fact, with full power of substitution, and with full power to each of them, to sign for me and in my name in the appropriate capacities, all Registration Statements of the Funds on Form N-1A, any and all subsequent Amendments, or Post-Effective Amendments to said Registration Statement on Form N-1A or any successor thereto, and any supplements or other instruments in connection therewith, and generally to do all such things in my name and behalf in connection therewith as said attorneys-in-fact deem necessary or appropriate, to comply with the provisions of the Securities Act of 1933 and the Investment Company Act of 1940 as amended, and all related requirements of the U. S. Securities and Exchange Commission. I hereby ratify and confirm all that said attorneys-in-fact or their substitutes may do or cause to be done by virtue hereof.
EXECUTED at Los Angeles, CA, this 6th day of March, 2017.
(City, State)
/s/ William H. Baribault
William H. Baribault, Board member
POWER OF ATTORNEY
I, Vanessa C. L. Chang, the undersigned Board member of the following registered investment companies (collectively, the “Funds”):
| - | American Balanced Fund (File No. 002-10758, File No. 811-00066) |
| - | American Funds Developing World Growth and Income Fund (File No. 333-190913, File No. 811-22881) |
| - | EuroPacific Growth Fund (File No. 002-83847, File No. 811-03734) |
| - | EuroPacific Growth Fund |
| - | The Income Fund of America (File No. 002-33371, File No. 811-01880) |
| - | International Growth and Income Fund (File No. 333-152323, File No. 811-22215) |
| - | New Perspective Fund (File No. 002-47749, File No. 811-02333) |
| - | New World Fund, Inc. (File No. 333-67455, File No. 811-09105) |
| - | American Funds New World Fund |
hereby revoke all previous powers of attorney I have signed and otherwise act in my name and behalf in matters involving the Funds and do hereby constitute and appoint
|
Jennifer L. Butler Steven I. Koszalka Michael W. Stockton Jane Y. Chung Susan K. Countess Julie E. Lawton Viviane T. Russo Raymond F. Sullivan, Jr. |
Brian C. Janssen Dori Laskin Kimberley H. Monasterio |
each of them singularly, my true and lawful attorneys-in-fact, with full power of substitution, and with full power to each of them, to sign for me and in my name in the appropriate capacities, all Registration Statements of the Funds on Form N-1A, any and all subsequent Amendments, or Post-Effective Amendments to said Registration Statement on Form N-1A or any successor thereto, and any supplements or other instruments in connection therewith, and generally to do all such things in my name and behalf in connection therewith as said attorneys-in-fact deem necessary or appropriate, to comply with the provisions of the Securities Act of 1933 and the Investment Company Act of 1940 as amended, and all related requirements of the U. S. Securities and Exchange Commission. I hereby ratify and confirm all that said attorneys-in-fact or their substitutes may do or cause to be done by virtue hereof.
EXECUTED at North Berwick, Scotland, this 28th day of July, 2016.
(City, State)
/s/ Vanessa C. L. Chang
Vanessa C. L. Chang, Board member
POWER OF ATTORNEY
I, Linda Griego, the undersigned Board member of the following registered investment companies (collectively, the “Funds”):
| - | American Balanced Fund (File No. 002-10758, File No. 811-00066) |
| - | American Funds Developing World Growth and Income Fund (File No. 333-190913, File No. 811-22881) |
| - | American Funds Fundamental Investors (File No. 002-10760, File No. 811-00032) |
| - | The Growth Fund of America (File No. 002-14728, File No. 811-00862) |
| - | The Income Fund of America (File No. 002-33371, File No. 811-01880) |
| - | International Growth and Income Fund (File No. 333-152323, File No. 811-22215) |
| - | SMALLCAP World Fund, Inc. (File No. 033-32785, File No. 811-05888) |
| - | SMALLCAP World Fund |
hereby revoke all previous powers of attorney I have signed and otherwise act in my name and behalf in matters involving the Funds and do hereby constitute and appoint
|
Jennifer L. Butler Steven I. Koszalka Michael W. Stockton Jane Y. Chung Susan K. Countess Julie E. Lawton Viviane T. Russo Raymond F. Sullivan, Jr. |
Brian C. Janssen Dori Laskin Kimberley H. Monasterio |
each of them singularly, my true and lawful attorneys-in-fact, with full power of substitution, and with full power to each of them, to sign for me and in my name in the appropriate capacities, all Registration Statements of the Funds on Form N-1A, any and all subsequent Amendments, or Post-Effective Amendments to said Registration Statement on Form N-1A or any successor thereto, and any supplements or other instruments in connection therewith, and generally to do all such things in my name and behalf in connection therewith as said attorneys-in-fact deem necessary or appropriate, to comply with the provisions of the Securities Act of 1933 and the Investment Company Act of 1940 as amended, and all related requirements of the U. S. Securities and Exchange Commission. I hereby ratify and confirm all that said attorneys-in-fact or their substitutes may do or cause to be done by virtue hereof.
EXECUTED at Los Angeles, CA, this 18th day of July, 2016.
(City, State)
/s/ Linda Griego
Linda Griego, Board member
POWER OF ATTORNEY
I, Leonade D. Jones, the undersigned Board member of the following registered investment companies (collectively, the “Funds”):
| - | American Balanced Fund (File No. 002-10758, File No. 811-00066) |
| - | American Funds Developing World Growth and Income Fund (File No. 333-190913, File No. 811-22881) |
| - | American Funds Fundamental Investors (File No. 002-10760, File No. 811-00032) |
| - | Capital Income Builder (File No. 033-12967, File No. 811-05085) |
| - | Capital World Growth and Income Fund (File No. 033-54444, File No. 811-07338) |
| - | The Growth Fund of America (File No. 002-14728, File No. 811-00862) |
| - | The Income Fund of America (File No. 002-33371, File No. 811-01880) |
| - | International Growth and Income Fund (File No. 333-152323, File No. 811-22215) |
| - | The New Economy Fund (File No. 002-83848, File No. 811-03735) |
| - | SMALLCAP World Fund, Inc. (File No. 033-32785, File No. 811-05888) |
| - | SMALLCAP World Fund |
hereby revoke all previous powers of attorney I have signed and otherwise act in my name and behalf in matters involving the Funds and do hereby constitute and appoint
|
Jennifer L. Butler Steven I. Koszalka Michael W. Stockton Jane Y. Chung Susan K. Countess Julie E. Lawton Viviane T. Russo Raymond F. Sullivan, Jr. |
Brian C. Janssen Dori Laskin Kimberley H. Monasterio |
each of them singularly, my true and lawful attorneys-in-fact, with full power of substitution, and with full power to each of them, to sign for me and in my name in the appropriate capacities, all Registration Statements of the Funds on Form N-1A, any and all subsequent Amendments, or Post-Effective Amendments to said Registration Statement on Form N-1A or any successor thereto, and any supplements or other instruments in connection therewith, and generally to do all such things in my name and behalf in connection therewith as said attorneys-in-fact deem necessary or appropriate, to comply with the provisions of the Securities Act of 1933 and the Investment Company Act of 1940 as amended, and all related requirements of the U. S. Securities and Exchange Commission. I hereby ratify and confirm all that said attorneys-in-fact or their substitutes may do or cause to be done by virtue hereof.
EXECUTED at Washington, DC, this 28th day of July, 2016.
(City, State)
/s/ Leonade D. Jones
Leonade D. Jones, Board member
POWER OF ATTORNEY
I, William D. Jones, the undersigned Board member of the following registered investment companies (collectively, the “Funds”):
| - | AMCAP Fund (File No. 002-26516, File No. 811-01435) |
| - | American Balanced Fund (File No. 002-10758, File No. 811-00066) |
| - | American Funds Developing World Growth and Income Fund (File No. 333-190913, File No. 811-22881) |
| - | American Funds Global Balanced Fund (File No. 333-170605, File No. 811-22496) |
| - | American Mutual Fund (File No. 002-10607, File No. 811-00572) |
| - | The Income Fund of America (File No. 002-33371, File No. 811-01880) |
| - | International Growth and Income Fund (File No. 333-152323, File No. 811-22215) |
| - | The Investment Company of America (File No. 002-10811, File No. 811-00116) |
hereby revoke all previous powers of attorney I have signed and otherwise act in my name and behalf in matters involving the Funds and do hereby constitute and appoint
|
Jennifer L. Butler Steven I. Koszalka Michael W. Stockton Jane Y. Chung Susan K. Countess Julie E. Lawton Viviane T. Russo Raymond F. Sullivan, Jr. |
Brian C. Janssen Dori Laskin Kimberley H. Monasterio |
each of them singularly, my true and lawful attorneys-in-fact, with full power of substitution, and with full power to each of them, to sign for me and in my name in the appropriate capacities, all Registration Statements of the Funds on Form N-1A, any and all subsequent Amendments, or Post-Effective Amendments to said Registration Statement on Form N-1A or any successor thereto, and any supplements or other instruments in connection therewith, and generally to do all such things in my name and behalf in connection therewith as said attorneys-in-fact deem necessary or appropriate, to comply with the provisions of the Securities Act of 1933 and the Investment Company Act of 1940 as amended, and all related requirements of the U. S. Securities and Exchange Commission. I hereby ratify and confirm all that said attorneys-in-fact or their substitutes may do or cause to be done by virtue hereof.
EXECUTED at San Diego, CA, this 14th day of July, 2016.
(City, State)
/s/ William D. Jones
William D. Jones, Board member
POWER OF ATTORNEY
I, James J. Postl, the undersigned Board member of the following registered investment companies (collectively, the “Funds”):
| - | American Balanced Fund (File No. 002-10758, File No. 811-00066) |
| - | American Funds Developing World Growth and Income Fund (File No. 333-190913, File No. 811-22881) |
| - | The Income Fund of America (File No. 002-33371, File No. 811-01880) |
| - | International Growth and Income Fund (File No. 333-152323, File No. 811-22215) |
hereby revoke all previous powers of attorney I have signed and otherwise act in my name and behalf in matters involving the Funds and do hereby constitute and appoint
|
Jennifer L. Butler Steven I. Koszalka Michael W. Stockton Jane Y. Chung Susan K. Countess Julie E. Lawton Viviane T. Russo Raymond F. Sullivan, Jr. |
Brian C. Janssen Dori Laskin Kimberley H. Monasterio |
each of them singularly, my true and lawful attorneys-in-fact, with full power of substitution, and with full power to each of them, to sign for me and in my name in the appropriate capacities, all Registration Statements of the Funds on Form N-1A, any and all subsequent Amendments, or Post-Effective Amendments to said Registration Statement on Form N-1A or any successor thereto, and any supplements or other instruments in connection therewith, and generally to do all such things in my name and behalf in connection therewith as said attorneys-in-fact deem necessary or appropriate, to comply with the provisions of the Securities Act of 1933 and the Investment Company Act of 1940 as amended, and all related requirements of the U. S. Securities and Exchange Commission. I hereby ratify and confirm all that said attorneys-in-fact or their substitutes may do or cause to be done by virtue hereof.
EXECUTED at Houston, TX, this 14th day of July, 2016.
(City, State)
/s/ James J. Postl
James J. Postl, Board member
POWER OF ATTORNEY
I, Margaret Spellings, the undersigned Board member of the following registered investment companies (collectively, the “Funds”):
| - | American Balanced Fund (File No. 002-10758, File No. 811-00066) |
| - | American Funds College Target Date Series (File No. 333-180729, File No. 811-22692) |
| - | American Funds Corporate Bond Fund (File No. 333-183929, File No. 811-22744) |
| - | American Funds Developing World Growth and Income Fund (File No. 333-190913, File No. 811-22881) |
| - | American Funds Emerging Markets Bond Fund (File No. 333-208636; File No. 811-23122) |
| - | The American Funds Income Series – U.S. Government Securities Fund (File No. 002-98199, File No. 811-04318) |
| - | American Funds Inflation Linked Bond Fund (File No. 333-183931, File No. 811-22746) |
| - | American Funds Insurance Series (File No. 002-86838, File No. 811-03857) |
| - | American Funds Insurance Series |
| - | American Funds Mortgage Fund (File No. 333-168595, File No. 811-22449) |
| - | American Funds Portfolio Series (File No. 333-178936, File No. 811-22656) |
| - | American Funds Retirement Income Portfolio Series (File No. 333-203797, File No. 811-23053) |
| - | American Funds Short-Term Tax-Exempt Bond Fund (File No. 033-26431, File No. 811-05750) |
| - | American Funds Strategic Bond Fund (File No. 333-207474, File No. 811-23101) |
| - | American Funds Target Date Retirement Series (File No. 333-138648, File No. 811-21981) |
| - | American Funds Tax-Exempt Fund of New York (File No. 333-168594, File No. 811-22448) |
| - | The American Funds Tax-Exempt Series II – The Tax-Exempt Fund of California (File No. 033-06180, File No. 811-04694) |
| - | American Funds U.S. Government Money Market Fund (File No. 333-157162, File No. 811-22277) |
| - | American High-Income Municipal Bond Fund (File No. 033-80630, File No. 811-08576) |
| - | American High-Income Trust (File No. 033-17917, File No. 811-05364) |
| - | The Bond Fund of America (File No. 002-50700, File No. 811-02444) |
| - | Capital World Bond Fund (File No. 033-12447, File No. 811-05104) |
| - | The Income Fund of America (File No. 002-33371, File No. 811-01880) |
| - | Intermediate Bond Fund of America (File No. 033-19514, File No. 811-05446) |
| - | International Growth and Income Fund (File No. 333-152323, File No. 811-22215) |
| - | Limited Term Tax-Exempt Bond Fund of America (File No. 033-66214, File No. 811-07888) |
| - | Short-Term Bond Fund of America (File No. 333-135770, File No. 811-21928) |
| - | The Tax-Exempt Bond Fund of America (File No. 002-49291, File No. 811-02421) |
| - | Washington Mutual Investors Fund (File No. 002-11051, File No. 811-00604) |
hereby revoke all previous powers of attorney I have signed and otherwise act in my name and behalf in matters involving the Funds and do hereby constitute and appoint
|
Jennifer L. Butler Steven I. Koszalka Michael W. Stockton Jane Y. Chung Susan K. Countess Julie E. Lawton Laurie D. Neat Viviane T. Russo Raymond F. Sullivan, Jr. |
Brian C. Janssen Dori Laskin Hong Le Gregory F. Niland |
each of them singularly, my true and lawful attorneys-in-fact, with full power of substitution, and with full power to each of them, to sign for me and in my name in the appropriate capacities, all Registration Statements of the Funds on Form N-1A, any and all subsequent Amendments, or Post-Effective Amendments to said Registration Statement on Form N-1A or any successor thereto, and any supplements or other instruments in connection therewith, and generally to do all such things in my name and behalf in connection therewith as said attorneys-in-fact deem necessary or appropriate, to comply with the provisions of the Securities Act of 1933 and the Investment Company Act of 1940 as amended, and all related requirements of the U. S. Securities and Exchange Commission. I hereby ratify and confirm all that said attorneys-in-fact or their substitutes may do or cause to be done by virtue hereof.
EXECUTED at Los Angeles, CA, this 6th day of March, 2017.
(City, State)
/s/ Margaret Spellings
Margaret Spellings, Board member
POWER OF ATTORNEY
I, Isaac Stein, the undersigned Board member of the following registered investment companies (collectively, the “Funds”):
| - | American Balanced Fund (File No. 002-10758, File No. 811-00066) |
| - | American Funds Developing World Growth and Income Fund (File No. 333-190913, File No. 811-22881) |
| - | The Income Fund of America (File No. 002-33371, File No. 811-01880) |
| - | International Growth and Income Fund (File No. 333-152323, File No. 811-22215) |
hereby revoke all previous powers of attorney I have signed and otherwise act in my name and behalf in matters involving the Funds and do hereby constitute and appoint
|
Jennifer L. Butler Steven I. Koszalka Michael W. Stockton Jane Y. Chung Susan K. Countess Julie E. Lawton Viviane T. Russo Raymond F. Sullivan, Jr. |
Brian C. Janssen Dori Laskin Kimberley H. Monasterio |
each of them singularly, my true and lawful attorneys-in-fact, with full power of substitution, and with full power to each of them, to sign for me and in my name in the appropriate capacities, all Registration Statements of the Funds on Form N-1A, any and all subsequent Amendments, or Post-Effective Amendments to said Registration Statement on Form N-1A or any successor thereto, and any supplements or other instruments in connection therewith, and generally to do all such things in my name and behalf in connection therewith as said attorneys-in-fact deem necessary or appropriate, to comply with the provisions of the Securities Act of 1933 and the Investment Company Act of 1940 as amended, and all related requirements of the U. S. Securities and Exchange Commission. I hereby ratify and confirm all that said attorneys-in-fact or their substitutes may do or cause to be done by virtue hereof.
EXECUTED at Atherton, CA, this 14th day of July, 2016.
(City, State)
/s/ Isaac Stein
Isaac Stein, Board member