0000046250false2024FYiso4217:USDxbrli:sharesiso4217:USDxbrli:shareshwkn:Segmentutr:Ratexbrli:purehwkn:lease00000462502023-04-032024-03-3100000462502023-10-0100000462502024-05-1000000462502024-03-3100000462502023-04-0200000462502022-04-042023-04-0200000462502021-03-292022-04-030000046250us-gaap:AccumulatedOtherComprehensiveIncomeMember2023-04-032024-03-310000046250us-gaap:AccumulatedOtherComprehensiveIncomeMember2022-04-042023-04-020000046250us-gaap:AccumulatedOtherComprehensiveIncomeMember2021-03-292022-04-030000046250us-gaap:CommonStockMember2021-03-280000046250us-gaap:AdditionalPaidInCapitalMember2021-03-280000046250us-gaap:RetainedEarningsMember2021-03-280000046250us-gaap:AccumulatedOtherComprehensiveIncomeMember2021-03-2800000462502021-03-280000046250us-gaap:CommonStockMember2021-03-292022-04-030000046250us-gaap:AdditionalPaidInCapitalMember2021-03-292022-04-030000046250us-gaap:RetainedEarningsMember2021-03-292022-04-030000046250us-gaap:CommonStockMember2022-04-030000046250us-gaap:AdditionalPaidInCapitalMember2022-04-030000046250us-gaap:RetainedEarningsMember2022-04-030000046250us-gaap:AccumulatedOtherComprehensiveIncomeMember2022-04-0300000462502022-04-030000046250us-gaap:CommonStockMember2022-04-042023-04-020000046250us-gaap:AdditionalPaidInCapitalMember2022-04-042023-04-020000046250us-gaap:RetainedEarningsMember2022-04-042023-04-020000046250us-gaap:CommonStockMember2023-04-020000046250us-gaap:AdditionalPaidInCapitalMember2023-04-020000046250us-gaap:RetainedEarningsMember2023-04-020000046250us-gaap:AccumulatedOtherComprehensiveIncomeMember2023-04-020000046250us-gaap:CommonStockMember2023-04-032024-03-310000046250us-gaap:AdditionalPaidInCapitalMember2023-04-032024-03-310000046250us-gaap:RetainedEarningsMember2023-04-032024-03-310000046250us-gaap:CommonStockMember2024-03-310000046250us-gaap:AdditionalPaidInCapitalMember2024-03-310000046250us-gaap:RetainedEarningsMember2024-03-310000046250us-gaap:AccumulatedOtherComprehensiveIncomeMember2024-03-310000046250us-gaap:CustomerConcentrationRiskMemberus-gaap:AccountsReceivableMemberus-gaap:TradeAccountsReceivableMember2023-04-032024-03-310000046250us-gaap:BuildingAndBuildingImprovementsMembersrt:MinimumMember2024-03-310000046250srt:MaximumMemberus-gaap:BuildingAndBuildingImprovementsMember2024-03-310000046250us-gaap:MachineryAndEquipmentMembersrt:MinimumMember2024-03-310000046250srt:MaximumMemberus-gaap:MachineryAndEquipmentMember2024-03-310000046250srt:MinimumMemberus-gaap:OfficeEquipmentMember2024-03-310000046250us-gaap:TransportationEquipmentMembersrt:MinimumMember2024-03-310000046250srt:MaximumMemberus-gaap:TransportationEquipmentMember2024-03-310000046250srt:MaximumMemberus-gaap:OfficeEquipmentMember2024-03-310000046250srt:WeightedAverageMember2024-03-310000046250hwkn:IndustrialResearchCorporationMember2024-03-082024-03-080000046250us-gaap:CustomerListsMemberhwkn:IndustrialResearchCorporationMember2024-03-080000046250hwkn:TheMiamiProductsChemicalCompanyMember2023-10-312023-10-310000046250hwkn:TheMiamiProductsChemicalCompanyMemberus-gaap:CustomerListsMember2023-10-310000046250us-gaap:TradeNamesMemberhwkn:TheMiamiProductsChemicalCompanyMember2023-10-310000046250hwkn:WaterSolutionsUnlimitedInc.Member2023-10-272023-10-270000046250us-gaap:CustomerListsMemberhwkn:WaterSolutionsUnlimitedInc.Member2023-10-270000046250us-gaap:TradeNamesMemberhwkn:WaterSolutionsUnlimitedInc.Member2023-10-270000046250hwkn:WaterSolutionsUnlimitedInc.Memberus-gaap:NoncompeteAgreementsMember2023-10-270000046250hwkn:EcoTechEnterprisesInc.Member2023-07-142023-07-1400000462502023-03-302023-03-300000046250hwkn:IndustrialMemberhwkn:ManufacturedblendedorrepackagedproductsMember2023-04-032024-03-310000046250hwkn:ManufacturedblendedorrepackagedproductsMemberhwkn:WaterTreatmentMember2023-04-032024-03-310000046250hwkn:ManufacturedblendedorrepackagedproductsMemberhwkn:HealthandNutritionMember2023-04-032024-03-310000046250hwkn:ManufacturedblendedorrepackagedproductsMember2023-04-032024-03-310000046250hwkn:IndustrialMemberhwkn:DistributedSpecialtyProductsMember2023-04-032024-03-310000046250hwkn:WaterTreatmentMemberhwkn:DistributedSpecialtyProductsMember2023-04-032024-03-310000046250hwkn:DistributedSpecialtyProductsMemberhwkn:HealthandNutritionMember2023-04-032024-03-310000046250hwkn:DistributedSpecialtyProductsMember2023-04-032024-03-310000046250hwkn:IndustrialMemberhwkn:BulkMember2023-04-032024-03-310000046250hwkn:BulkMemberhwkn:WaterTreatmentMember2023-04-032024-03-310000046250hwkn:BulkMemberhwkn:HealthandNutritionMember2023-04-032024-03-310000046250hwkn:BulkMember2023-04-032024-03-310000046250hwkn:OtherMemberhwkn:IndustrialMember2023-04-032024-03-310000046250hwkn:OtherMemberhwkn:WaterTreatmentMember2023-04-032024-03-310000046250hwkn:OtherMemberhwkn:HealthandNutritionMember2023-04-032024-03-310000046250hwkn:OtherMember2023-04-032024-03-310000046250hwkn:IndustrialMember2023-04-032024-03-310000046250hwkn:WaterTreatmentMember2023-04-032024-03-310000046250hwkn:HealthandNutritionMember2023-04-032024-03-310000046250hwkn:IndustrialMemberhwkn:ManufacturedblendedorrepackagedproductsMember2022-04-042023-04-020000046250hwkn:ManufacturedblendedorrepackagedproductsMemberhwkn:WaterTreatmentMember2022-04-042023-04-020000046250hwkn:ManufacturedblendedorrepackagedproductsMemberhwkn:HealthandNutritionMember2022-04-042023-04-020000046250hwkn:ManufacturedblendedorrepackagedproductsMember2022-04-042023-04-020000046250hwkn:IndustrialMemberhwkn:DistributedSpecialtyProductsMember2022-04-042023-04-020000046250hwkn:WaterTreatmentMemberhwkn:DistributedSpecialtyProductsMember2022-04-042023-04-020000046250hwkn:DistributedSpecialtyProductsMemberhwkn:HealthandNutritionMember2022-04-042023-04-020000046250hwkn:DistributedSpecialtyProductsMember2022-04-042023-04-020000046250hwkn:IndustrialMemberhwkn:BulkMember2022-04-042023-04-020000046250hwkn:BulkMemberhwkn:WaterTreatmentMember2022-04-042023-04-020000046250hwkn:BulkMemberhwkn:HealthandNutritionMember2022-04-042023-04-020000046250hwkn:BulkMember2022-04-042023-04-020000046250hwkn:OtherMemberhwkn:IndustrialMember2022-04-042023-04-020000046250hwkn:OtherMemberhwkn:WaterTreatmentMember2022-04-042023-04-020000046250hwkn:OtherMemberhwkn:HealthandNutritionMember2022-04-042023-04-020000046250hwkn:OtherMember2022-04-042023-04-020000046250hwkn:IndustrialMember2022-04-042023-04-020000046250hwkn:WaterTreatmentMember2022-04-042023-04-020000046250hwkn:HealthandNutritionMember2022-04-042023-04-020000046250hwkn:IndustrialMemberhwkn:ManufacturedblendedorrepackagedproductsMember2021-03-292022-04-030000046250hwkn:ManufacturedblendedorrepackagedproductsMemberhwkn:WaterTreatmentMember2021-03-292022-04-030000046250hwkn:ManufacturedblendedorrepackagedproductsMemberhwkn:HealthandNutritionMember2021-03-292022-04-030000046250hwkn:ManufacturedblendedorrepackagedproductsMember2021-03-292022-04-030000046250hwkn:IndustrialMemberhwkn:DistributedSpecialtyProductsMember2021-03-292022-04-030000046250hwkn:WaterTreatmentMemberhwkn:DistributedSpecialtyProductsMember2021-03-292022-04-030000046250hwkn:DistributedSpecialtyProductsMemberhwkn:HealthandNutritionMember2021-03-292022-04-030000046250hwkn:DistributedSpecialtyProductsMember2021-03-292022-04-030000046250hwkn:IndustrialMemberhwkn:BulkMember2021-03-292022-04-030000046250hwkn:BulkMemberhwkn:WaterTreatmentMember2021-03-292022-04-030000046250hwkn:BulkMemberhwkn:HealthandNutritionMember2021-03-292022-04-030000046250hwkn:BulkMember2021-03-292022-04-030000046250hwkn:OtherMemberhwkn:IndustrialMember2021-03-292022-04-030000046250hwkn:OtherMemberhwkn:WaterTreatmentMember2021-03-292022-04-030000046250hwkn:OtherMemberhwkn:HealthandNutritionMember2021-03-292022-04-030000046250hwkn:OtherMember2021-03-292022-04-030000046250hwkn:IndustrialMember2021-03-292022-04-030000046250hwkn:WaterTreatmentMember2021-03-292022-04-030000046250hwkn:HealthandNutritionMember2021-03-292022-04-030000046250us-gaap:FairValueInputsLevel1Member2024-03-310000046250us-gaap:FairValueInputsLevel1Member2023-04-020000046250us-gaap:FairValueInputsLevel2Member2024-03-310000046250us-gaap:FairValueInputsLevel2Member2023-04-020000046250us-gaap:FairValueInputsLevel3Member2024-03-310000046250us-gaap:FairValueInputsLevel3Member2023-04-020000046250hwkn:IndustrialMember2023-04-020000046250hwkn:WaterTreatmentMember2023-04-020000046250hwkn:HealthandNutritionMember2023-04-020000046250hwkn:IndustrialMember2024-03-310000046250hwkn:WaterTreatmentMember2024-03-310000046250hwkn:HealthandNutritionMember2024-03-310000046250us-gaap:CustomerRelationshipsMember2024-03-310000046250us-gaap:TrademarksMember2024-03-310000046250us-gaap:OtherIntangibleAssetsMember2024-03-310000046250us-gaap:CustomerRelationshipsMember2023-04-020000046250us-gaap:TrademarksMember2023-04-020000046250us-gaap:OtherIntangibleAssetsMember2023-04-020000046250srt:MinimumMember2023-04-032024-03-310000046250srt:MaximumMember2023-04-032024-03-310000046250hwkn:PreviousCreditFacilityMember2024-03-310000046250srt:MaximumMember2024-03-310000046250srt:MinimumMember2024-03-310000046250us-gaap:RevolvingCreditFacilityMember2024-03-310000046250us-gaap:RevolvingCreditFacilityMember2023-04-020000046250us-gaap:PerformanceSharesMember2023-04-032024-03-310000046250us-gaap:PerformanceSharesMember2021-03-280000046250us-gaap:PerformanceSharesMember2021-03-292022-04-030000046250us-gaap:PerformanceSharesMember2022-04-030000046250us-gaap:PerformanceSharesMember2022-04-042023-04-020000046250us-gaap:PerformanceSharesMember2023-04-020000046250us-gaap:PerformanceSharesMember2024-03-310000046250srt:WeightedAverageMemberus-gaap:PerformanceSharesMember2023-04-032024-03-310000046250us-gaap:RestrictedStockMember2023-04-032024-03-310000046250us-gaap:RestrictedStockMember2021-03-280000046250us-gaap:RestrictedStockMember2021-03-292022-04-030000046250us-gaap:RestrictedStockMember2022-04-030000046250us-gaap:RestrictedStockMember2022-04-042023-04-020000046250us-gaap:RestrictedStockMember2023-04-020000046250us-gaap:RestrictedStockMember2024-03-310000046250srt:WeightedAverageMemberus-gaap:RestrictedStockMember2023-04-032024-03-310000046250us-gaap:DeferredProfitSharingMemberus-gaap:QualifiedPlanMembersrt:MinimumMember2023-04-032024-03-310000046250us-gaap:DeferredProfitSharingMemberus-gaap:QualifiedPlanMembersrt:MinimumMember2022-04-042023-04-020000046250srt:MaximumMemberus-gaap:DeferredProfitSharingMemberus-gaap:QualifiedPlanMember2023-04-032024-03-310000046250srt:MaximumMemberus-gaap:DeferredProfitSharingMemberus-gaap:QualifiedPlanMember2022-04-042023-04-020000046250hwkn:BargainingUnitEmployeePlansMemberus-gaap:DeferredProfitSharingMemberus-gaap:QualifiedPlanMembersrt:MinimumMember2023-04-032024-03-310000046250hwkn:BargainingUnitEmployeePlansMembersrt:MaximumMemberus-gaap:DeferredProfitSharingMemberus-gaap:QualifiedPlanMember2023-04-032024-03-310000046250hwkn:A401kplanMembersrt:MaximumMemberus-gaap:QualifiedPlanMember2023-04-032024-03-310000046250us-gaap:QualifiedPlanMembersrt:MinimumMemberus-gaap:EmployeeStockOwnershipPlanESOPPlanDomain2022-04-042023-04-020000046250us-gaap:QualifiedPlanMembersrt:MinimumMemberus-gaap:EmployeeStockOwnershipPlanESOPPlanDomain2023-04-032024-03-310000046250srt:MaximumMemberus-gaap:QualifiedPlanMemberus-gaap:EmployeeStockOwnershipPlanESOPPlanDomain2023-04-032024-03-310000046250srt:MaximumMemberus-gaap:QualifiedPlanMemberus-gaap:EmployeeStockOwnershipPlanESOPPlanDomain2022-04-042023-04-020000046250srt:MaximumMemberus-gaap:DeferredProfitSharingMemberus-gaap:NonqualifiedPlanMember2023-04-032024-03-310000046250srt:MaximumMemberus-gaap:DeferredProfitSharingMemberus-gaap:NonqualifiedPlanMember2022-04-042023-04-020000046250hwkn:BargainingUnitEmployeePlansMember2023-04-032024-03-310000046250hwkn:BargainingUnitEmployeePlansMember2022-04-042023-04-020000046250hwkn:BargainingUnitEmployeePlansMember2021-03-292022-04-030000046250hwkn:IdentifiableMember2024-03-310000046250hwkn:IdentifiableMember2023-04-020000046250hwkn:IndustrialMember2022-04-030000046250hwkn:WaterTreatmentMember2022-04-030000046250hwkn:HealthandNutritionMember2022-04-030000046250hwkn:IdentifiableMember2022-04-030000046250hwkn:UnallocatedMember2024-03-310000046250hwkn:UnallocatedMember2023-04-020000046250hwkn:UnallocatedMember2022-04-03
UNITED STATES
SECURITIES AND EXCHANGE COMMISSION
Washington, D.C. 20549 | | | | | | | | | | | |
| Form 10-K |
| ☑ | ANNUAL REPORT PURSUANT TO SECTION 13 OR 15(d) OF THE |
| SECURITIES EXCHANGE ACT OF 1934 |
| For the Fiscal Year Ended | March 31, 2024 |
| ☐ | TRANSITION REPORT PURSUANT TO SECTION 13 OR 15(d) OF THE |
| SECURITIES EXCHANGE ACT OF 1934 |
| Commission File No. 0-7647 |
HAWKINS, INC.
(Exact Name of Registrant as Specified in its Charter) | | | | | | | | |
| Minnesota | | 41-0771293 |
| (State of Incorporation) | | (I.R.S. Employer Identification No.) |
2381 Rosegate, Roseville, Minnesota | | 55113 |
| (Address of Principal Executive Offices) | | (Zip Code) |
(612) 331-6910
(Registrant’s Telephone Number, Including Area Code) | | | | | | | | | | | | | | |
| Securities registered pursuant to Section 12(b) of the Act: |
| Title of each class | Trading Symbol: | Name of exchange on which registered: |
| Common Shares, par value $.01 per share | HWKN | Nasdaq Stock Market LLC |
| Securities registered pursuant to Section 12(g) of the Act: None |
Indicate by check mark if the registrant is a well-known seasoned issuer, as defined in Rule 405 of the Securities Act. Yes ☑ No ☐
Indicate by check mark if the registrant is not required to file reports pursuant to Section 13 or Section 15(d) of the Act. Yes ☐ No ☑
Indicate by check mark whether the Registrant (1) has filed all reports required to be filed by Section 13 or 15(d) of the Securities Exchange Act of 1934 during the preceding twelve months (or for such shorter period that the Registrant was required to file such reports) and (2) has been subject to such filing requirements for the past 90 days. Yes ☑ No ☐
Indicate by check mark whether the registrant has submitted electronically every Interactive Data File required to be submitted pursuant to Rule 405 of Regulation S-T during the preceding 12 months (or for such shorter period that the Registrant was required to submit such files). Yes ☑ No ☐
Indicate by check mark whether the registrant is a large accelerated filer, an accelerated filer, a non-accelerated filer, a smaller reporting company, or an emerging growth company. See the definitions of “large accelerated filer,” “accelerated filer,” “smaller reporting company,” and “emerging growth company” in Rule 12b-2 of the Exchange Act. | | | | | | | | | | | | | | | | | | | | | | | | | | | | | | | | |
| Large accelerated filer | ☑ | | | | | | | | Accelerated filer | ☐ |
| Non-accelerated filer | ☐ | | | | | | | | Smaller reporting company | ☐ |
| | | | | | | | | Emerging growth company | ☐ |
If an emerging growth company, indicate by check mark if the registrant has elected not to use the extended transition period for complying with any new or revised financial accounting standards provided pursuant to Section 13(a) of the Exchange Act. ☐
Indicate by check mark whether the registrant has filed a report on and attestation to its management’s assessment of the effectiveness of its internal control over financial reporting under Section 404(b) of the Sarbanes-Oxley Act (15 U.S.C. 7262(b)) by the registered public accounting firm that prepared or issued its audit report. ☑
Indicate by check mark whether the registrant is a shell company (as defined in Rule 12b-2 of the Exchange Act). Yes ☐ No ☑
If securities are registered pursuant to Section 12(b) of the Act, indicate by check mark whether the financial statements of the registrant included in the filing reflect the correction of an error to previously issued financial statements. ☐
Indicate by check mark whether any of those error corrections are restatements that required a recovery analysis of incentive-based compensation received by any of the registrant’s executive officers during the relevant recovery period pursuant to §240.10D-1(b). ☐
The aggregate market value of voting stock held by non-affiliates of the Registrant on October 1, 2023 (the last business day of the Registrant’s most recently completed second fiscal quarter) was approximately $1,187.5 million based upon the closing sale price for the Registrant’s common shares on that date as reported by The Nasdaq Stock Market LLC, excluding all shares held by officers and directors of the Registrant and by the Trustees of the Registrant’s Employee Stock Ownership Plan and Trust.
As of May 10, 2024, the Registrant had 20,912,338 shares of common shares outstanding. DOCUMENTS INCORPORATED BY REFERENCE
Portions of our definitive Proxy Statement for the annual meeting of shareholders to be held July 31, 2024, are incorporated by reference in Part III of this Annual Report on Form 10-K
FORWARD-LOOKING STATEMENTS
The information presented in this Annual Report on Form 10-K contains forward-looking statements within the meaning of Section 21E of the Securities Exchange Act of 1934, as amended (the “Exchange Act”). These forward-looking statements have been made pursuant to the provisions of the Private Securities Litigation Reform Act of 1995. These statements are not historical facts, but rather are based on our current expectations, estimates and projections, and our beliefs and assumptions. Words such as “anticipate,” “expect,” “intend,” “plan,” “believe,” “seek,” “estimate,” “will” and similar expressions may identify forward-looking statements. These statements are not guarantees of future performance and are subject to certain risks, uncertainties and other factors, some of which are beyond our control and are difficult to predict. These factors could cause actual results to differ materially from those expressed or forecasted in the forward-looking statements. These risks and uncertainties are described in the risk factors and elsewhere in this Annual Report on Form 10-K. We caution you not to place undue reliance on these forward-looking statements, which reflect our management’s view only as of the date of this Annual Report on Form 10-K. We are not obligated to update these statements or publicly release the result of any revisions to them to reflect events or circumstances after the date of this Annual Report on Form 10-K or to reflect the occurrence of unanticipated events.
As used in this Annual Report on Form 10-K, except where otherwise stated or indicated by the context, “Hawkins,” “we,” “us,” “the Company,” “our,” or “the Registrant” means Hawkins, Inc. References to "fiscal 2025" means our fiscal year ending March 30, 2025, “fiscal 2024” means our fiscal year ended March 31, 2024, “fiscal 2023” means our fiscal year ended April 2, 2023, and “fiscal 2022” means our fiscal year ended April 3, 2022.
Hawkins, Inc.
Annual Report on Form 10-K
For the Fiscal Year Ended March 31, 2024
| | | | | | | | |
| | |
| | | Page |
| PART I |
| ITEM 1. | | |
| ITEM 1A. | | |
| ITEM 1B. | | |
| ITEM 1C. | | |
| ITEM 2. | | |
| ITEM 3. | | |
| ITEM 4. | | |
| PART II |
| ITEM 5. | | |
| ITEM 6. | | |
| ITEM 7. | | |
| ITEM 7A. | | |
| ITEM 8. | | |
| ITEM 9. | | |
| ITEM 9A. | | |
| ITEM 9B. | | |
| ITEM 9C. | | |
| PART III |
| ITEM 10. | | |
| ITEM 11. | | |
| ITEM 12. | | |
| ITEM 13. | | |
| ITEM 14. | | |
| PART IV |
| ITEM 15. | | |
| ITEM 16. | | |
PART I
ITEM 1. BUSINESS
We are a leading specialty chemical and ingredients company that formulates, distributes, blends and manufactures products for our Industrial, Water Treatment and Health and Nutrition customers. We believe that we create value for our customers through superb service and support, quality products, personalized applications and trustworthy, creative employees.
We conduct our business in three segments: Industrial, Water Treatment, and Health and Nutrition.
Industrial Segment. Our Industrial Group specializes in providing industrial chemicals, products and services to industries such as agriculture, chemical processing, electronics, energy, food, pharmaceutical and plating. This group’s principal products are acids, alkalis and food-grade and pharmaceutical salts and ingredients.
The Industrial Group:
•Manufactures sodium hypochlorite (bleach), certain food-grade and pharmaceutical products, including liquid phosphates, lactates and other blended products, and agricultural products;
•Receives, stores and distributes various chemicals in bulk quantities, including liquid caustic soda, sulfuric acid, hydrochloric acid, urea, phosphoric acid, aqua ammonia and potassium hydroxide;
•Repackages water treatment chemicals for our Water Treatment Group and bulk industrial chemicals to sell in smaller quantities to our customers; and
•Performs custom blending of chemicals according to customer formulas and specifications.
The group’s sales are concentrated primarily in the central United States, while the group sells food and pharmaceutical products, as well as some agricultural products, nationally. The Industrial Group relies on a specially trained sales staff that works directly with customers on their specific needs. The group conducts its business primarily through manufacturing locations and terminal operations. Agricultural sales within this group tend to be seasonal, with higher sales during the typical planting season of March through June given the regions of the country we serve.
Water Treatment Segment. Our Water Treatment Group specializes in providing chemicals, products, equipment, services and solutions for potable water, municipal and industrial wastewater, industrial process water, non-residential swimming pool water and agricultural water. This group has the resources and flexibility to treat systems ranging in size from a single small well to a multi-million-gallon-per-day facility.
The group utilizes delivery routes operated by our employees who typically serve as route driver, salesperson and trained technician to deliver our products and diagnose our customers’ water treatment needs. We believe that the high level of service provided by these individuals allows us to serve as the trusted water treatment expert for many of the municipalities and other customers that we serve. We also believe that there are significant synergies between our Water Treatment and Industrial Groups that allow us to obtain a competitive cost position on many of the chemicals sold by the Water Treatment Group due to the volumes of these chemicals purchased by our Industrial Group. In addition, our Industrial and Water Treatment groups share certain resources, which leverage fixed costs across both groups.
The Water Treatment group operates out of 47 warehouses supplying products and services to customers in 46 states. We expect to continue to invest in existing and new branches to expand the group’s geographic coverage. Our Water Treatment Group has historically experienced higher sales during April to September, primarily due to a seasonal increase in chemicals used by municipal water treatment facilities.
Health and Nutrition Segment. Our Health and Nutrition Group specializes in providing ingredient distribution, processing and formulation solutions to manufacturers of nutraceutical, functional food and beverage, personal care, dietary supplement and other nutritional food, health and wellness products. This group offers a diverse product portfolio including minerals, vitamins and amino acids, excipients, joint products, botanicals and herbs, sweeteners and enzymes.
The Health and Nutrition Group relies on a specially trained sales staff that works directly with customers on their specific needs. The group’s extensive product portfolio combined with value-added services, including product formulation, sourcing and distribution, and processing and blending, positions this group as a one-stop ingredient solutions provider to its customers. The group also follows rigorous quality control and compliance processes to provide reliable, high-quality products to its customers. The group operates out of facilities in California and New York and its products are sold nationally and, in certain cases, internationally.
Raw Materials. We have numerous suppliers, including many of the major chemical producers in the United States. We source our health and nutrition ingredients from a wide array of domestic and international vendors. We typically have distributorship agreements or supply contracts with our suppliers that are periodically renewed. We believe that most of the products we purchase can be obtained from alternative sources should existing relationships be terminated. We are dependent upon the availability of our raw materials. While we believe that we have adequate sources of supply for our raw material and product requirements, we cannot be sure that supplies will be consistently available in the future. In the event that certain raw materials become generally unavailable, suppliers may extend lead times or limit or cut off the supply of materials to us. As a result, we may not be able to supply or manufacture products for our customers.
Intellectual Property. Our intellectual property portfolio is of economic importance to our business. When appropriate, we have pursued, and we will continue to pursue, patents covering our products. We have also obtained certain trademarks for our products to distinguish them from our competitors’ products. We regard many of the formulas, information and processes that we generate and use in the conduct of our business as proprietary and protectable under applicable copyright, patent, trademark, trade secret and unfair competition laws.
Customer Concentration. In fiscal 2024, none of our customers accounted for 10% or more of our total sales.
Competition. We operate in a competitive industry and compete with many producers, distributors and sales agents offering products equivalent to substantially all of the products we offer. Many of our competitors are larger than we are and may have greater financial resources, although no one competitor is dominant in all of the markets we serve. We compete by offering quality products with outstanding customer service at competitive prices coupled with value-added services or product formulation where needed. Because of our long-standing relationships with many of our suppliers, we are often able to leverage those relationships to obtain products when supplies are limited or to obtain competitive pricing.
Working Capital. Due to the nature of our operations, which includes purchases of large quantities of bulk chemicals, the timing of purchases can result in significant changes in working capital and the resulting operating cash flow. Historically, our cash requirements for working capital increase during the period from March through November as caustic soda inventory levels increase with most of our barges received during this period.
Regulatory Matters. We are subject to numerous federal, state and local environmental, health and safety laws and regulations in the jurisdictions in which we operate, including laws and regulations relating to the management, storage, transportation and disposal of chemicals and wastes; product regulation; air, water and soil contamination; and the investigation and cleanup of any spills or releases that may result from our management, handling, storage, sale, or transportation of chemicals and other products. In addition, societal concerns regarding the safety of chemicals in commerce and their potential impact on the environment have resulted in a growing trend towards increasing levels of product safety and environmental protection regulations. These concerns have led to, and could continue to result in, more stringent regulatory intervention by governmental authorities.
In addition, we operate a fleet of more than 350 commercial vehicles, primarily in our Water Treatment Group, which are highly regulated, including by the U.S. Department of Transportation (“DOT”). The DOT governs transportation matters including authorization to engage in motor carrier service, including the necessary permits to conduct our businesses, equipment operation, and safety.
The manufacture, packaging, labeling, advertising, promotion, distribution and sale of our agricultural, food, pharmaceutical, pesticide and health and nutrition products are subject to regulation by numerous national and local governmental agencies in the United States and other countries. The primary regulatory bodies in the United States are the Food and Drug Administration (the “FDA”), the Environmental Protection Agency, the United States Department of Agriculture and the Federal Trade Commission, and we are also subject to similar regulators in other countries. In particular, the FDA’s current good manufacturing practices (“GMPs”) describe policies and procedures designed to ensure that nutraceuticals, pharmaceuticals and dietary supplements are produced in a quality manner, do not contain contaminants or impurities, and are accurately labeled and cover the manufacturing, packaging, labeling and storing of products, with requirements for quality control, design and construction of manufacturing plants, testing of ingredients and final products, record keeping, and complaints processes.
Further information related to government regulation applicable to our business is included in this Annual Report on Form 10-K, in Part I, Item 1A - Risk Factors.
Human Capital. Our team is a key to our success and we are committed to creating a workplace that attracts top talent, develops leaders and drives performance on behalf of our customers and shareholders.
We strive to recruit the best people for the job regardless of race, color, nationality, gender, age, disability, sexual orientation or any other status protected by law. It is our policy to comply fully with all applicable laws relating to discrimination in the workplace and are committed to advancing an inclusive, collaborative and respectful culture.
The health and safety of our employees is our highest priority. We work to ensure our employees have a thorough understanding of health and safety precautions that need to be taken in all business functions. Specific safety initiatives include accident prevention work, improving process controls, safety training, safety committees, safety audits, incident investigation and improvement measures.
We strive to provide employees with competitive wages commensurate with their skill levels, experience, knowledge and the regional market. Full-time employees are eligible for health, dental and vision insurance, paid and unpaid leaves, 401(K) plan, retirement plans, life and disability/accident coverage and our employee assistance program.
As of March 31, 2024, we had 934 employees across the United States, of which 928 were full-time employees. Approximately 41% of our employees were female or racially and ethnically diverse, and approximately 10% were covered by a collective bargaining agreement. Of the eight members of our Board of Directors, two are female, six are male, one is Asian American and seven are white.
Available Information. Our Internet address is www.hawkinsinc.com. We have made available, free of charge, our Annual Reports on Form 10-K, Quarterly Reports on Form 10-Q, Current Reports on Form 8-K, and, if applicable, amendments to those reports, as soon as reasonably practicable after we electronically file these materials with, or furnish them to, the Securities and Exchange Commission ("SEC"). Reports of beneficial ownership filed by our directors and executive officers pursuant to Section 16(a) of the Exchange Act are also available on our website. We are not including the information contained on our website as part of, or incorporating it by reference into, this Annual Report on Form 10-K. The SEC also maintains an internet site that contains reports, proxy and information statements, and other information regarding our company at http://www.sec.gov.
ITEM 1A. RISK FACTORS
You should carefully consider the following material factors regarding risks relating to an investment in our securities and when reading the information, including the financial information, contained in this Annual Report on Form 10-K. Shareholders are cautioned that these and other factors may affect future performance and cause actual results to differ materially from those that may be anticipated.
COMPETITIVE AND REPUTATIONAL RISKS
We operate in a highly competitive environment and face significant competition and price pressure.
We operate in a highly competitive industry and compete with producers, manufacturers, distributors and sales agents offering products equivalent to substantially all of the products we offer. Competition is based on several key criteria, including product price, product performance, product quality, product availability and security of supply, breadth of product offerings, geographic reach, responsiveness of product development in cooperation with customers, technical expertise and customer service. Many of our competitors are larger than we are and may have greater financial resources, more product offerings and a broader geographic reach. As a result, these competitors may be able to offer a broader array of products to a larger geographic area and may be better able than us to withstand changes in conditions within our industry, changes in the prices and availability of raw materials and changes in general economic conditions as well as be able to introduce innovative products that reduce demand for or the profit from our products. Additionally, competitors’ pricing decisions could compel us to decrease our prices, which could adversely affect our margins and profitability. Our ability to maintain or increase our profitability would be dependent upon our ability to offset competitive decreases in the prices and margins of our products by improving production efficiency, investing in infrastructure to reduce freight costs, identifying and selling higher margin products, providing higher levels of technical expertise and customer service, and improving existing products through innovation and research and development. If we are unable to maintain our profitability or competitive position, we could lose market share to our competitors and experience reduced profitability.
Our businesses expose us to potential product liability claims and recalls, which could adversely affect our financial condition and performance.
The repackaging, blending, mixing and distribution of products by us, including chemical products and products used in food or food ingredients or with medical, pharmaceutical or dietary supplement applications, involve an inherent risk of exposure to product liability claims, product recalls, product seizures and related adverse publicity, including, without limitation, claims for exposure to our products, spills or release of our products, personal injuries, food-related claims and property damage or environmental claims. A product liability claim, judgment or recall against our customers could also result in substantial and unexpected expenditures for us, affect consumer confidence in our products and divert management’s attention from other responsibilities. Although we maintain product liability insurance, there can be no assurance that the type or level of coverage is adequate or that we will be able to continue to maintain our existing insurance or obtain comparable insurance at a reasonable cost, if at all. A product recall or a partially or completely uninsured judgment against us could have a material adverse effect on our business, financial condition and results of operations.
Changes in our customers’ needs or failure of our products to meet customers’ requirements could adversely affect our sales and profitability.
Our products are used for a broad range of applications by our customers. Changes in our customers’ product needs or processes, or reductions in demand for their end products, may enable or require our customers to reduce or eliminate consumption of the products that we provide. Customers may also find alternative materials or processes that no longer require our products. Consequently, it is important that we develop new products to replace the sales of products that mature and decline in use.
Our products provide important performance attributes to our customers’ products. If our products fail to meet the customers’ requirements or comply with applicable laws or regulations, perform in a manner inconsistent with the customers’ expectations or have a shorter useful life than required, a customer could seek replacement of the product or damages for costs incurred as a result of the product failure. A successful claim or series of claims against us could have a material adverse effect on our financial condition and results of operations and could result in a loss of one or more customers. Reductions in demand for our products could adversely affect our sales and financial results and result in facility closures.
Adverse publicity or negative public perception regarding particular ingredients or products or the dietary supplement industry in general could adversely affect the financial performance of those portions of our business.
Purchasing decisions made by consumers of products that contain our ingredients may be affected by adverse publicity or negative public perception regarding particular ingredients or products or the dietary supplement industry in general. This negative public perception may include publicity regarding the risks, efficacy, legality or quality of particular ingredients or products in general or of other companies or our products or ingredients specifically. Negative public perception may also arise from regulatory investigations, regardless of whether those investigations involve us. We are highly dependent upon consumers’ perception of the safety and quality of products that contain our ingredients as well as similar products distributed by other companies. Thus, the mere publication of reports asserting that such products may be harmful could have a material adverse effect on us, regardless of whether these reports are scientifically supported. Publicity related to dietary supplements or food ingredients may also result in increased regulatory scrutiny of our industry. Adverse publicity may have a material adverse effect on our business, financial condition, results of operations and cash flows.
Failure to adequately protect critical data and technology systems could materially affect our operations.
Information technology system failures, network disruptions and breaches of data security due to internal or external factors including phishing or cyber-attacks could disrupt our operations by causing delays or cancellation of customer orders, impede the manufacture or shipment of products or cause standard business processes to become ineffective, resulting in the unintentional disclosure of information or damage to our reputation. While we have taken steps to address these concerns by implementing network security and internal control measures, including employee training, comprehensive monitoring of our networks and systems, maintenance of backup and protective systems and disaster recovery and incident response plans, our employees, systems, networks, products, facilities and services remain vulnerable to phishing attacks and cyber-assault, and, as such, there can be no assurance that a system failure, network disruption or data security breach will not have a material adverse effect on our business, financial condition, operating results or cash flows.
RISKS RELATED TO OUR INDUSTRY
Fluctuations in the prices and availability of our raw materials, which may be cyclical in nature, could have a material adverse effect on our operations and the margins we receive on sales of our products.
We experience regular and recurring fluctuations in the pricing of our raw materials. Those fluctuations can be significant and occur rapidly. The cyclicality of commodity markets, such as the market for caustic soda, primarily results from changes in the balance between supply and demand and the level of general economic activity. We cannot predict whether the markets for our raw materials will favorably impact or negatively impact the margins we can realize.
The prices we pay for our principal chemical raw materials generally lag the market prices of the underlying raw material. The cost of inventory we have on hand, particularly inventories of our bulk commodity chemicals where we have significant volumes stored at our facilities, generally will lag the current market pricing of such inventory. The pricing within our supply contracts generally adjusts quarterly or monthly. While we attempt to maintain competitive pricing and stable margin dollars, the potential variance in our cost of inventory from the current market pricing can cause significant volatility in our margins realized. We do not engage in futures or other derivatives contracts to hedge against fluctuations in future prices. We may enter into sales contracts where the selling prices for our products are fixed for a period of time, exposing us to volatility in raw materials prices that we acquire on a spot market or short-term contractual basis. We attempt to pass commodity pricing changes to our customers, but we may be unable to or be delayed in doing so. Our inability to pass through price increases or any limitation or delay in our passing through price increases could adversely affect our profit margins.
We are also dependent upon the availability of our raw materials. In the event that raw materials are in short supply or unavailable, raw material suppliers may extend lead times or limit or cut off supplies. As a result, we may not be able to supply or manufacture products for some or all of our customers. Constraints on the supply or delivery of critical raw materials could disrupt our operations and adversely affect the performance of our businesses.
Demand for our products is affected by general economic conditions and by the cyclical nature of many of the industries we serve, which could cause significant fluctuations in our sales volumes and results.
Demand for our products is affected by general economic conditions. A decline in general economic or business conditions in the industries served by our customers could have a material adverse effect on our businesses. Although we sell to areas traditionally considered non-cyclical, such as water treatment, food products and health and nutritional ingredients, many of our customers are in businesses that are cyclical in nature, such as the industrial manufacturing and energy industries which include the ethanol and agriculture industries. Downturns in these industries could adversely affect our sales and our financial results by affecting demand for and pricing of our products.
Our business is subject to hazards common to chemical businesses, any of which could interrupt our production and adversely affect our results of operations.
Our business is subject to hazards common to chemical manufacturing, blending, storage, handling and transportation, including explosions, fires, severe weather, natural disasters, mechanical failure, unscheduled downtime, transportation interruptions, traffic accidents involving our delivery vehicles, derailments, chemical spills, discharges or releases of toxic or hazardous substances or gases and other risks. These hazards could cause personal injury and loss of life, severe damage to or destruction of property and equipment, and environmental contamination. In addition, the occurrence of material operating problems or the absence of personnel due to pandemics or other disasters at any of our facilities due to any of these hazards may make it impossible for us to make sales to our customers and may result in a negative public or political reaction. Many of our facilities are near significant residential populations which increases the risk of negative public or political reaction should an environmental issue occur and could lead to adverse zoning or other regulatory actions that could limit our ability to operate our business in those locations. Accordingly, these hazards and their consequences could have a material adverse effect on our operations as a whole, including our results of operations and cash flows, both during and after the period of operational difficulties.
Environmental problems at any of our facilities could result in significant unexpected costs.
We are subject to federal, state and local environmental regulations regarding the ownership of real property and the operations conducted on real property. Under various federal, state and local laws, ordinances and regulations, we may own or operate real property or may have arranged for the disposal or treatment of hazardous or toxic substances at a property and, therefore, may become liable for the costs of removal or remediation of certain hazardous substances released on or in our property or disposed of by us, as well as certain other potential costs which could relate to hazardous or toxic substances (including governmental fines and injuries to persons and property). Such liability may be imposed whether or not we knew of, or were responsible for, the presence of these hazardous or toxic substances. Further, future changes in environmental laws or regulations may require additional investment in capital equipment or the implementation of additional compliance programs in the future. The cost of investigation, remediation or removal of such substances may be substantial.
In the conduct of our operations, we have handled and do handle materials that are considered hazardous, toxic or volatile under federal, state and local laws. The potential for the accidental release of such products cannot be completely eliminated. In addition, we operate or own facilities located on or near real property that was formerly owned and operated by others. These properties may have been used in ways that involved hazardous materials. Contaminates may migrate from, within or through any such property, which may give rise to claims against us. Third parties who are responsible for contamination may not have funds, or may not make funds available when needed, to pay remediation costs imposed upon us jointly with them under environmental laws and regulations.
Our Water Treatment Group and our agricultural product sales within our Industrial Group are subject to seasonality and weather conditions, which could adversely affect our results of operations.
Our Water Treatment Group has historically experienced higher sales during April to September, primarily due to a seasonal increase in chemicals used by municipal water treatment facilities. Our agricultural product sales within our Industrial Group are also seasonal, primarily corresponding with the planting season. Demand in both of these areas is also affected by weather conditions, as either higher or lower than normal precipitation or temperatures may affect water usage and the timing and the amount of consumption of our products. We cannot assure you that seasonality or fluctuating weather conditions will not have a material adverse effect on our results of operations.
OPERATIONAL RISKS
Disruptions within our supply chain have negatively impacted, and could continue to negatively impact, our production, financial condition and results of operations.
We have been, and could continue to be, adversely affected by disruptions within our supply chain and transportation network. The raw materials we need are transported by truck, rail, barge or ship by third-party providers. The costs of transporting our products or necessary raw materials could be negatively affected by factors outside of our control, including rail service interruptions or rate increases, extreme weather events, tariffs, rising fuel costs and capacity constraints. In recent years, unprecedented congestion in ocean shipping adversely impacted the reliability of our imported raw materials, and transport driver shortages caused extended lead times for domestic shipments. In addition, rail shipments can be unreliable, with significant delays in service and increased costs. The impacts of high-profile derailments could further degrade service levels and cause railroads to increase costs. Significant delays or increased costs relating to transportation could materially affect our financial condition and results of operations.
Similar supply chain issues have impacted and could continue to impact both our suppliers and our customers. The supply of our necessary raw materials could be interrupted due to shortages of raw materials, effects of economic, political or financial market conditions on a supplier's operations, labor disputes or weather conditions affecting products or shipments, transportation disruptions, natural disasters, outbreaks of disease, information system disruptions or other reasons beyond our control. Similar disruptions at our customers could reduce demand for our products, reducing our sales and profitability. Product shortages or delays in deliveries, along with other factors such as price inflation and higher transportation costs, have also resulted in price increases from our suppliers. We may be unable to pass these price increases on to our customers, which could erode our profit margins. These supply chain constraints, increased product costs and inflationary pressures could continue or escalate in the future, which would have an adverse impact on our business and results of operations.
We are highly dependent upon transportation infrastructure to ship and receive our products and delays in these shipments could adversely affect our results of operations.
Although we maintain a number of owned trucks and trailers, we rely heavily upon transportation provided by third parties (including common carriers, barge companies, rail companies and trans-ocean cargo companies) to deliver products to us and to our customers. Our access to third-party transportation is not guaranteed, and we may be unable to transport our products in a timely manner, or at all, in certain circumstances, or at economically attractive rates. Disruptions in transportation are common, are often out of our control, and can happen suddenly and without warning. Rail limitations, such as limitations in rail capacity, availability of railcars, workforce shortages, threats of strikes, derailments, embargoes and adverse weather conditions have disrupted or delayed rail shipments in the past and could do so in the future. Barge shipments are delayed or impossible under certain circumstances, including during times of high or low water levels, when waterways are frozen and when locks and dams are inoperable. The availability and reliability of truck transportation has been negatively impacted by a number of factors, including limited availability of qualified drivers and equipment, limitations on drivers’ hours of service and failures of critical infrastructure, such as bridges. The volumes handled by, and operating challenges at, ocean ports have at times been volatile and can delay the receipt of goods, or cause the cost of shipping goods to be more expensive. Our failure to ship or receive products in a timely and efficient manner could have a material adverse effect on our financial condition and results of operations.
If we are unable to retain key personnel or attract new skilled personnel, it could have an adverse impact on our businesses.
Because of the specialized and technical nature of our businesses, our future performance is dependent on the continued service of, and on our ability to attract and retain, qualified management, scientific, technical and support personnel. The unanticipated departure of key members of our management team could have an adverse impact on our business.
We may not be able to successfully consummate future acquisitions or dispositions or integrate acquisitions into our business, which could result in unanticipated expenses and losses.
As part of our business growth strategy, we have acquired businesses and may pursue acquisitions in the future. Our ability to pursue this strategy will be limited by our ability to identify appropriate acquisition candidates and our financial resources, including available cash and borrowing capacity. In addition, we may seek to divest of businesses that are underperforming or not core to our future business. The expense incurred in consummating transactions, the time it takes to integrate an acquisition or our failure to integrate businesses successfully could result in unanticipated expenses and losses. Furthermore, we may not be able to realize the anticipated benefits from acquisitions.
The process of integrating acquired operations into our existing operations may result in unforeseen operating difficulties and may require significant financial resources that would otherwise be available for the ongoing development or expansion of existing operations. The risks associated with the integration of acquisitions include potential disruption of our ongoing businesses and distraction of management, unforeseen claims, liabilities, adjustments, charges and write-offs, difficulty in conforming the acquired business’ standards, processes, procedures and controls with our operations, and challenges arising from the increased scope, geographic diversity and complexity of the expanded operations.
Our businesses are subject to risks stemming from natural disasters or other extraordinary events outside of our control, which could interrupt our production and adversely affect our results of operations.
Natural disasters have the potential of interrupting our operations and damaging our properties, which could adversely affect our businesses. Flooding of the Mississippi River has temporarily shifted the Company’s terminal operations out of its buildings four times since the spring of 2010, including most recently the spring of 2019. We can give no assurance that flooding or other natural disasters will not recur or that there will not be material damage or interruption to our operations in the future from such disasters.
Chemical-related assets may be at greater risk of future terrorist attacks than other possible targets in the United States. Federal law imposes site security requirements, specifically on chemical facilities, which have increased our overhead expenses. Federal regulations have also been adopted to increase the security of the transportation of hazardous chemicals in the United States. We ship and receive materials that are classified as hazardous and we believe we have met these requirements, but additional federal and local regulations that limit the distribution of hazardous materials are being considered. Bans on movement of hazardous materials through certain cities or via certain modes of transportation could adversely affect the efficiency of our logistical operations. Broader restrictions on hazardous material movements could lead to additional investment and could change where and what products we provide.
The occurrence of extraordinary events, including future terrorist attacks, wars, global health developments and pandemics, or escalation of hostilities, cannot be predicted, but their occurrence can be expected to negatively affect the economy in general, and specifically the markets for our products. The resulting damage from a direct attack on our assets, or assets used by us, could include loss of life and property damage. In addition, available insurance coverage may not be sufficient to cover all of the damage incurred or, if available, may be prohibitively expensive.
We may not be able to renew our leases of land where four of our operations facilities reside.
We lease the land where our three main terminals are located and where another significant manufacturing plant is located. These leases, including all renewal periods, have expiration dates from 2024 to 2044. The failure to secure extended lease terms on any one of these facilities may have a material adverse impact on our business, as they are where a portion of our chemicals are manufactured and where the majority of our bulk chemicals are stored. While we can make no assurances, based on historical experience and anticipated future needs, we intend to extend these leases and believe that we will be able to renew our leases as the renewal periods expire. If we are unable to renew three of our leases (two relate to terminals and one to manufacturing) any property remaining on the land becomes the property of the lessor, and the lessor has the option to either maintain the property or remove the property at our expense. The fourth lease provides that we turn any property remaining on the land over to the lessor for them to maintain or remove at their expense. The cost to relocate our operations could have a material adverse effect on our results of operations and financial condition.
LEGAL AND REGULATORY RISKS
Environmental, health and safety, transportation and storage laws and regulations cause us to incur substantial costs and may subject us to future liabilities and risks.
We are subject to numerous federal, state and local environmental, health, safety and land use laws and regulations in the jurisdictions in which we operate, including the management, storage, transportation and disposal of chemicals and wastes; product regulation; air water and soil contamination; land use, fire code and zoning; and the investigation and cleanup of any spills or releases that may result from our management, handling, storage, sale, or transportation of chemicals and other products. The nature of our business exposes us to risks of liability under these laws and regulations. Ongoing compliance with such laws and regulations is an important consideration for us and we invest substantial capital and incur significant operating costs in our compliance efforts. In addition, societal concerns regarding the safety of chemicals in commerce and their potential impact on the environment have resulted in a growing trend towards increasing levels of product safety and environmental protection regulations and restrictions on the locations and operations of chemical facilities. These concerns have led to, and could continue to result in, more stringent regulatory intervention by governmental authorities. In addition, these concerns could influence public perceptions, impact the commercial viability of the products we sell and increase the costs to comply with increasingly complex regulations, which could have a negative impact on our business, financial condition and results of operations.
In addition, we operate a fleet of more than 350 commercial vehicles, primarily in our Water Treatment Group, which are highly regulated, including by the DOT. The DOT governs transportation matters including authorization to engage in motor carrier service, including the necessary permits to conduct our businesses, equipment operation, and safety. We are audited periodically by the DOT to ensure that we are in compliance with various safety, hours-of-service, and other rules and regulations. If we were found to be out of compliance, the DOT could severely restrict or otherwise impact our operations, which could have a material adverse effect on our operations as a whole, including our results of operations and cash flows.
If we violate applicable laws or regulations, in addition to being required to correct such violations, we could be held liable in administrative, civil or criminal proceedings for substantial fines and other sanctions that could disrupt, limit or halt our operations, which could have a material adverse effect on our operations as a whole, including our results of operations and cash flows. Liabilities associated with the investigation and cleanup of releases of hazardous substances, as well as personal injury, property damages or natural resource damages arising out of such releases of hazardous substances, may be imposed in many situations without regard to violations of laws or regulations or other fault, and may also be imposed jointly and severally (so that a responsible party may be held liable for more than its share of the losses involved, or even the entire loss). Such liabilities can be difficult to identify and the extent of any such liabilities can be difficult to predict. We use, and in the past have used, hazardous substances at many of our facilities, and have generated, and continue to generate, hazardous wastes at a number of our facilities. We have in the past been, and may in the future be, subject to claims relating to exposure to hazardous materials and the associated liabilities may be material.
Many of our products, particularly our food, pharmaceutical and health and nutrition products are subject to government regulation, both in the United States and abroad, which could increase our costs significantly and limit or prevent the sale of such products.
The manufacture, packaging, labeling, advertising, promotion, distribution and sale of many of our products, but our food, pharmaceutical, pesticide and health and nutrition products in particular, are subject to regulation by numerous national and local governmental agencies in the United States and other countries. The primary regulatory bodies in the United States are the Food and Drug Administration (the “FDA”), the Environmental Protection Agency, the United States Department of Agriculture and the Federal Trade Commission, and we are also subject to similar regulators in other countries. Failure to comply with these regulatory requirements may result in various types of penalties or fines. These include injunctions, product withdrawals, recalls, product seizures, fines and criminal prosecutions. Individual states also regulate our products. A state may interpret claims or products presumptively valid under federal law as illegal under that state’s regulations. Approvals or licensing may be conditioned on reformulation of products or may be unavailable with respect to certain products or product ingredients. Any of these government agencies, as well as legislative bodies, can change existing regulations, or impose new ones, or could take aggressive measures, causing or contributing to a variety of negative consequences, which may include one or more of the following:
• stopping the sale of products,
• requirements for the reformulation of certain or all products to meet new standards,
• the recall or discontinuance of certain or all products,
• additional record-keeping requirements,
• expanded documentation of the properties of certain or all products,
• expanded or different labeling,
• adverse event tracking and reporting, and
• additional scientific substantiation.
In particular, the FDA’s current GMPs describe policies and procedures designed to ensure that nutraceuticals, pharmaceuticals and dietary supplements are produced in a quality manner, do not contain contaminants or impurities, and are accurately labeled and cover the manufacturing, packaging, labeling and storing of products, with requirements for quality control, design and construction of manufacturing plants, testing of ingredients and final products, record keeping, and complaints processes. Those who manufacture, package or store dietary supplements must comply with current GMPs. If we or our suppliers fail to comply with current GMPs, the FDA may take enforcement action against us or our suppliers.
Any or all of the potential negative consequences described above could have a material adverse effect on us or substantially increase the cost of doing business in these areas. There can be no assurance that the regulatory environment in which we operate will not change or that such regulatory environment, or any specific action taken against us, will not result in a material adverse effect on us.
FINANCIAL RISKS
The insurance that we maintain may not fully cover all potential exposures.
We maintain lines of commercial insurance, such as property, general liability and casualty insurance, but such insurance may not cover all risks associated with the hazards of our businesses and is subject to limitations, including deductibles and limits on the liabilities covered. We may incur losses beyond the limits or outside the coverage of our insurance policies, including liabilities for environmental remediation and product liability. In addition, from time to time, various types of insurance for companies in the chemical, food or health and nutrition products industries have not been available on commercially acceptable terms or, in some cases, have not been available at all. In the future, we may not be able to obtain coverage at current levels, and our premiums may increase significantly on coverage that we maintain.
Failure to comply with the covenants under our credit facility may have a material adverse effect.
We are party to a credit agreement (the “Credit Agreement”) with U.S. Bank National Association ("U.S. Bank") and other lenders (collectively, the “Lenders”), which includes secured revolving credit facilities (the “Revolving Loan Facility”) totaling $250.0 million. The Revolving Loan Facility includes a $10.0 million letter of credit subfacility and $25.0 million swingline subfacility. At March 31, 2024, we had $99.0 million outstanding under the Revolving Loan Facility.
We may make payments on the Revolving Loan Facility from time to time. If we are unable to generate sufficient cash flow or otherwise obtain funds necessary to make payments on our credit facilities, we could be in default when the facilities become due in 2027. We are also required to comply with several financial covenants under the Credit Agreement. Our ability to comply with these financial covenants may be affected by events beyond our control, which could result in a default under the Credit Agreement; such default may have a material adverse effect on our business, financial condition, operating results or cash flows.
The Credit Agreement also contains other customary affirmative and negative covenants, including covenants that restrict our ability to incur additional indebtedness, dispose of significant assets, make certain investments, including any acquisitions other than permitted acquisitions, make certain payments, enter into sale and leaseback transactions, grant liens on its assets or rate management transactions, subject to certain limitations. These restrictions may adversely affect our business.
Impairment to the carrying value of our goodwill or other intangible assets could adversely affect our financial condition and consolidated results of operations.
Goodwill represents the excess of the cost of acquired businesses over the fair value of identifiable tangible net assets and identifiable intangible assets purchased. Goodwill is tested at least annually for impairment and is tested for impairment more frequently if events or changes in circumstances indicate that the asset might be impaired. A significant amount of judgment is involved in determining if an indication of impairment exists. Factors may include, among others: a significant decline in our expected future cash flows; a sustained, significant decline in our stock price and market capitalization; a significant adverse change in the business climate; unanticipated competition; and slower growth rates. An adverse change in these factors may have a significant impact on the recoverability of the net assets recorded, and any resulting impairment charge in the future could have a material adverse effect on our financial condition and consolidated results of operations.
We evaluate the useful lives of our intangible assets to determine if they are definite- or indefinite-lived. Reaching a determination on useful life requires significant judgments and assumptions regarding the future effects of obsolescence, demand, competition, other economic factors (such as the stability of the industry, legislative action that results in an uncertain or changing regulatory environment, and expected changes in distribution channels), and the expected lives of other related groups of assets.
We cannot accurately predict the amount and timing of any impairment of goodwill and other intangible assets. Should the value of these assets become impaired, there could be a material adverse effect on our financial condition and consolidated results of operations.
ITEM 1B. UNRESOLVED STAFF COMMENTS
None.
ITEM 1C. CYBERSECURITY
Hawkins is committed to maintaining robust cybersecurity practices to safeguard our operations, data, and stakeholders' interests. We monitor our cybersecurity landscape and adapt our strategies and governance practices to mitigate risks in this rapidly evolving area.
The Company acknowledges that cybersecurity threats present a risk of material adverse impacts on our operations, reputation, and financial condition. Cybersecurity threats are continuously evolving, becoming more sophisticated, and increasing in frequency. For Hawkins, these threats can potentially lead to data breaches, theft of intellectual property, operational disruptions, damage to persons and property, and financial losses. We have a comprehensive cybersecurity risk management strategy designed to promptly identify, assess, and mitigate the risk of occurrence and impact from cybersecurity threats. Despite our efforts, it is not possible to completely identify, prevent or mitigate the impacts of cybersecurity threats.
Cybersecurity Governance
Our Board of Directors is primarily responsible for oversight of risks from cybersecurity threats. Our audit committee is specifically responsible for oversight of cybersecurity risks within the Board of Directors. The audit committee is informed of our cybersecurity risk management practices at regularly scheduled meetings, including:
•Our cybersecurity policies and strategies.
•Incident response and recovery plans.
•Employee training and awareness programs.
•Cybersecurity audits and engagement with external cybersecurity experts and advisors on an as-needed basis.
Our Chief Information Officer ("CIO") is responsible for implementing our cybersecurity strategy, developing policies and procedures, and ensuring that appropriate resources are allocated to cybersecurity initiatives. The CIO and senior network and security resources at Hawkins have decades of experience in cybersecurity practices and compliance. The CIO is continually informed about the latest threats and developments in cybersecurity, including potential threats and innovative risk management techniques. This ongoing knowledge acquisition is important for the effective prevention, detection, mitigation, and remediation of cybersecurity incidents. The CIO implements and oversees processes based on the National Institute of Standards and Technology ("NIST") cybersecurity framework and is responsible for the regular monitoring of our information systems. This includes the deployment of advanced security measures and regular system audits to identify potential vulnerabilities. Management reports at least twice yearly to the audit committee on the status of our cybersecurity efforts, including assessments of significant risks identified and actions designed to mitigate such risks.
Cybersecurity Risk Management and Strategy
Our cybersecurity risk management strategy is a separate component of our overall risk management process and is designed to protect our assets, including information technology systems, data, and operations, from cybersecurity threats. This involves:
•Continuous monitoring and assessment of our cybersecurity posture.
•Implementation of security measures such as firewalls, intrusion detection systems, and encryption.
•Ongoing cybersecurity training and testing of our employees.
•Regular cybersecurity assessments and penetration testing.
•Vendor risk management to ensure third-party compliance with our cybersecurity standards.
We also maintain an incident response plan ("IRP") that outlines procedures for responding to cybersecurity incidents, minimizing their impact, and communicating with relevant stakeholders, including regulators, customers, and employees. During a cyber incident, our CIO and network security team assess the severity of the incident and notify key management and (if deemed necessary) our audit committee as promptly as practicable. Our incident plan is reviewed annually and updated as appropriate to address evolving threats and our business conditions.
In the normal course of business, we experience cybersecurity threats and attempted breaches of our systems and network. We classify and track these events based on significance and implement remediation actions that we consider appropriate to address the risks relating to such incidents. We have not experienced any cybersecurity incident and the risks presented by cybersecurity threats have not materially impacted our business strategy, results of operations or financial condition. However, even well-designed and implemented cybersecurity programs cannot completely eliminate cybersecurity threats, and we cannot guarantee that such events or material impacts will not occur in the future.
ITEM 2. PROPERTIES
Our facilities material to our operations consist of our locations described below. In addition to the facilities listed below, our Water Treatment group operates out of several additional warehouse locations, the majority of which are owned by us. We believe that our facilities are adequate and suitable for the purposes they serve. Unless noted, each facility listed below is owned by us and is primarily used as office and warehouse space. We believe that we carry customary levels of insurance covering the replacement of damaged property.
| | | | | | | | | | | | | | | | | | | | |
| Group | Location | | Rail/Barge Access | | Approx.
Square Feet |
| Corporate headquarters | Roseville, MN | | | | 50,000 |
| Health and Nutrition | Fullerton, CA (1) | | | | 56,000 |
| | Florida, NY (2) | | | | 107,000 |
| Industrial | Minneapolis, MN (3) | | Rail | | 177,000 |
| | Centralia, IL (3) | | Rail | | 121,000 |
| | Dupo, IL (3) (4) | | Rail | | 64,000 |
| | St. Paul, MN (3) (5) | | Rail/Barge | | 32,000 |
| | Rosemount, MN (3) | | Rail | | 153,000 |
| Industrial and Water Treatment | St. Paul, MN (3) (5) | | Rail/Barge | | 59,000 |
| | Camanche, IA (3) | | Rail/Barge | | 95,000 |
| | Memphis, TN (3) | | Rail/Barge | | 41,000 |
| Water Treatment | Apopka, FL (3) | | Rail | | 32,000 |
| | Camby, IN (3) | | | | 41,000 |
| | Fairborn, OH (6) | | Rail | | 7,000 |
| | Fayetteville, TN (3) | | | | 54,000 |
| | Sulphur, LA (3) | | | | 30,000 |
(1)This is a leased facility comprising administrative offices and a distribution facility. The lease runs through January 2026.
(2)This is comprised of (i) a 79,000 square foot manufacturing plant which sits on approximately 16 acres and (ii) a leased 28,000 square foot warehouse located in close proximity that is leased until December 2025.
(3)This is a manufacturing and/or distribution facility owned by the Company. This facility includes outside storage tanks for the storage of liquid bulk chemicals, as well as smaller tanks for storing and mixing chemicals.
(4)The land for this facility is leased from a third party. The lease expires in May 2024, with automatic one-year renewal periods.
(5)The land for these facilities is leased from the Port Authority of the City of St. Paul, Minnesota. One of the applicable leases runs through July 2024 with a letter of intent in place to extend the term, one runs through 2028, and one runs through 2044 including all available lease extensions.
(6)This is a bleach manufacturing facility owned by the Company.
ITEM 3. LEGAL PROCEEDINGS
There are no material pending legal proceedings, other than ordinary routine litigation incidental to the business, to which we or any of our subsidiaries are a party or of which any of our property is the subject.
ITEM 4. MINE SAFETY DISCLOSURES
Not applicable.
PART II
ITEM 5. MARKET FOR THE COMPANY’S COMMON EQUITY, RELATED SHAREHOLDER MATTERS AND ISSUER PURCHASES OF EQUITY SECURITIES
Our common shares are listed on the Nasdaq Global Select Market under the symbol “HWKN.” As of May 10, 2024, shares of our common shares were held by approximately 353 shareholders of record.
Our Board of Directors authorized the repurchase of up to 2.6 million shares of our outstanding common stock. The shares may be purchased on the open market or in privately negotiated transactions subject to applicable securities laws and regulations. We did not purchase any shares of our common stock during the three months ended March 31, 2024. As of March 31, 2024, the number of shares available to be purchased under the share repurchase program was 937,487.
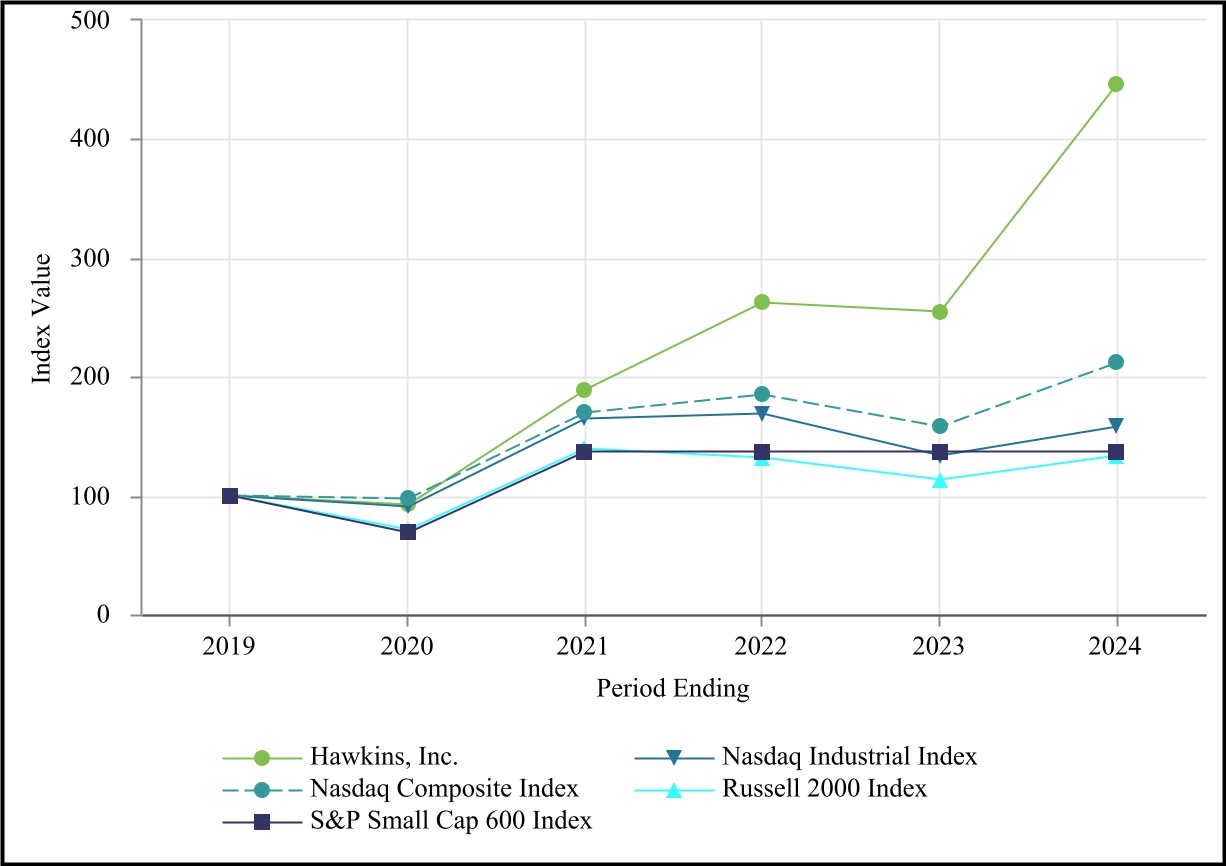
The following graph compares the cumulative total shareholder return on our common shares with the cumulative total returns of the Nasdaq Industrial Index, the Nasdaq Composite Index, the Russell 2000 Index and the Standard & Poor’s (“S&P”) Small Cap 600 Index for our last five completed fiscal years. The graph assumes the investment of $100 in our stock and each of those indices on March 31, 2019, and reinvestment of all dividends.
ITEM 6. RESERVED
ITEM 7. MANAGEMENT’S DISCUSSION AND ANALYSIS OF FINANCIAL CONDITION AND RESULTS OF OPERATIONS
The following is a discussion and analysis of our financial condition and results of operations for fiscal 2024 and 2023. This discussion should be read in conjunction with the Consolidated Financial Statements and Notes to Consolidated Financial Statements included in Item 8 of this Annual Report on Form 10-K.
We have omitted discussion of the earliest of the three years covered by our consolidated financial statements presented in this report because that disclosure was already included in our Annual Report on Form 10-K for fiscal 2023, filed with the SEC on May 17, 2023. You are encouraged to reference Part II, Item 7, within that report, for a discussion of our financial condition and results of operations for fiscal 2023 compared to fiscal 2022.
Overview
We derive substantially all of our revenues from the sale of specialty chemicals and ingredients that we formulate, distribute, blend and manufacture for our Industrial, Water Treatment and Health and Nutrition customers.
Financial Overview
Highlights of fiscal 2024 include:
•Sales of $919.2 million, a 2% decrease from fiscal 2023;
•Gross profit of $193.6 million, an increase of $28.5 million, or 17% from fiscal 2023; and
•Diluted earnings per share (EPS) of $3.59, an increase of $0.73, or 26%, from fiscal 2023.
We focus on total profitability dollars when evaluating our financial results as opposed to profitability as a percentage of sales, as sales dollars tend to fluctuate as raw material prices rise and fall, particularly in our Industrial and Water Treatment segments. The costs for certain of our raw materials can rise or fall rapidly, causing fluctuations in gross profit as a percentage of sales.
We use the last in, first out (“LIFO”) method of valuing the majority of our inventory in our Industrial and Water Treatment segments, which causes the most recent product costs to be recognized in our income statement. The LIFO inventory valuation method and the resulting cost of sales are consistent with our business practices of pricing to current chemical raw material prices. Inventories in our Health and Nutrition segment are valued using the first-in, first-out (“FIFO”) method.
We disclose the sales of our bulk commodity products as a percentage of total sales dollars for our Industrial and Water Treatment segments. Our definition of bulk commodity products includes products that we do not modify in any way, but receive, store, and ship from our facilities, or direct ship to our customers in large quantities. We disclose the percentage of our overall sales that consist of sales of bulk commodity products as these products are generally distributed and we do not add significant value to these products in comparison to our non-bulk products. Sales of these products are generally highly competitive and price sensitive. As a result, bulk commodity products generally have our lowest margins.
Factors Affecting Comparability of Results
Business Acquisitions and Asset Sales
On March 8, 2024, we acquired substantially all the assets of Industrial Research Corporation ("Industrial Research") under the terms of a purchase agreement with Industrial Research and its shareholders. Industrial Research was a distributor of water treatment chemicals and equipment for its customers in central to northern Louisiana, eastern Texas and southern Arkansas. The results of operations since the acquisition and the assets are included in our Water Treatment segment.
On October 31, 2023, we acquired substantially all the assets of The Miami Products & Chemical Company ("Miami Products") under the terms of a purchase agreement with Miami Products and its shareholders. Miami Products was a bleach manufacturer and distributor serving customers primarily throughout Ohio and the surrounding region. The results of operations since the acquisition date and the assets are included in our Water Treatment segment.
On October 27, 2023, we acquired substantially all the assets of Water Solutions Unlimited, Inc. ("Water Solutions") under the terms of a purchase agreement with Water Solutions and its shareholders. Water Solutions was a manufacturer and distributor of water treatment chemicals serving customers primarily throughout Indiana, Illinois and Michigan. The results of operations since the acquisition date and the assets are included in our Water Treatment segment.
On July 14, 2023, we acquired substantially all the assets of EcoTech Enterprises, Inc. ("EcoTech") under the terms of a purchase agreement with EcoTech and its shareholders. EcoTech was a water treatment chemical distribution company operating primarily in Arkansas. The results of operations since the acquisition date and the assets are included in our Water Treatment segment.
The aggregate annual revenue of these four businesses acquired in fiscal 2024 totaled approximately $70 million, as determined using the applicable twelve-month period preceding each respective acquisition date.
In the fourth quarter of fiscal 2023, we sold certain assets in our Industrial segment related to our consumer bleach packaging business for $7 million. These assets were not deemed core to our Industrial segment operations. The assets sold included plant equipment, inventory, and intangible assets, all related to the packaging of bleach. We realized a gain of $3 million on this sale, which has been recorded as a reduction to selling, general and administrative expenses.
Results of Operations
The following table sets forth certain items from our statement of income as a percentage of sales for fiscal 2024 and 2023: | | | | | | | | | | | | | | |
| | Fiscal 2024 | | Fiscal 2023 |
| Sales | | 100.0 | % | | 100.0 | % |
| Cost of sales | | (78.9) | % | | (82.3) | % |
| Gross profit | | 21.1 | % | | 17.7 | % |
| Selling, general and administrative expenses | | (9.8) | % | | (8.3) | % |
| | | | |
| Operating income | | 11.3 | % | | 9.4 | % |
| Interest expense, net | | (0.5) | % | | (0.6) | % |
| Other income | | 0.2 | % | | — | % |
| Income before income taxes | | 11.0 | % | | 8.8 | % |
| Income tax provision | | (2.8) | % | | (2.4) | % |
| Net income | | 8.2 | % | | 6.4 | % |
Fiscal 2024 Compared to Fiscal 2023
Sales
Sales were $919.2 million for fiscal 2024, a decrease of $15.9 million, or 2%, from sales of $935.1 million for fiscal 2023. Increased sales in our Water Treatment segment were more than offset by decreased sales in our Industrial and Health & Nutrition segments.
Industrial Segment. Industrial segment sales decreased $61.3 million, or 13%, to $409.5 million for fiscal 2024, as compared to $470.8 million for fiscal 2023. Sales of bulk commodity products in the Industrial segment were approximately 14% of sales dollars in fiscal 2024 and 16% of sales dollars in fiscal 2023. The sale of our consumer bleach packaging business at the end of fiscal 2023 resulted in $14.5 million lower sales in the current year. In addition, sales declined due to overall lower volumes.
Water Treatment Segment. Water Treatment segment sales increased $58.4 million, or 19%, to $363.3 million for fiscal 2024, as compared to $304.9 million for fiscal 2023. Sales of bulk commodity products in the Water Treatment segment were approximately 9% of sales dollars in both fiscal 2024 and fiscal 2023. In addition to $23.9 million in sales from acquired businesses, sales increased as a result of increased selling prices on many of our products as well as increased sales volumes of certain of our products.
Health and Nutrition Segment. Health and Nutrition segment sales decreased $13.0 million, or 8%, to $146.4 million for fiscal 2024, as compared to $159.4 million for fiscal 2023. Sales decreased primarily due to decreased sales of our manufactured products, which we believe was driven by customers destocking inventory in the first half of the current fiscal year.
Gross Profit
Gross profit increased $28.5 million, or 17%, to $193.6 million, or 21% of sales, for fiscal 2024, from $165.1 million, or 18% of sales, for fiscal 2023. During fiscal 2024, the LIFO reserve decreased, and gross profits increased, by $15.4 million, primarily due to decreased raw material costs. In fiscal 2023, the LIFO reserve increased, and gross profits decreased, by $18.5 million, primarily due to rising raw material costs. Included as a reduction to gross profit in the current year was a $7.7 million charge to operating expense for an environmental liability related to perchlorinated biphenyls (PCBs) discovered in the soil at our Rosemount, MN facility.
Industrial Segment. Gross profit for the Industrial segment decreased $0.6 million, or 1%, to $67.5 million, or 16% of sales, for fiscal 2024, from $68.1 million, or 14% of sales, for fiscal 2023. During fiscal 2024, the LIFO reserve decreased, and gross profits increased, by $12.1 million, primarily due to decreased raw material costs. In fiscal 2023, the LIFO reserve increased, and gross profits decreased, by $12.3 million, primarily due to rising raw material costs. Offsetting the impact of the favorable year-over-year LIFO change, gross profit decreased as a result of the $7.7 million charge to operating expense for an environmental liability related to PCBs discovered in the soil at our Rosemount, MN facility as well as lower sales.
Water Treatment Segment. Gross profit for the Water Treatment segment increased $31.3 million, or 47%, to $98.5 million, or 27% of sales, for fiscal 2024, from $67.2 million, or 22% of sales, for fiscal 2023. During fiscal 2024, the LIFO reserve decreased, and gross profits increased, by $3.3 million, primarily due to decreased raw material costs. During fiscal 2023, the LIFO reserve increased, and gross profit decreased, by $6.2 million, primarily due to rising raw material costs. Gross profit increased as a result of improved per-unit margins on many of our products as well as increased sales, including the added sales from acquired businesses.
Health and Nutrition Segment. Gross profit for our Health and Nutrition segment decreased $2.2 million, or 7%, to $27.6 million, or 19% of sales, for fiscal 2024, from $29.8 million, or 19% of sales, for fiscal 2023. Gross profit decreased due to lower sales.
Selling, General and Administrative Expenses
SG&A expenses increased $12.6 million, or 16% to $89.6 million, or 10% of sales, for fiscal 2024, from $77.0 million, or 8% of sales, for fiscal 2023. Included in SG&A expenses for the prior year was a gain of approximately $3.0 million related to the sale of certain assets related to our consumer bleach packaging business. In addition, a year-over-year increase in compensation expense of $1.4 million related to our non-qualified deferred compensation plan reduced SG&A expenses, with the offset in Other Expense. Additionally, expenses increased due to the added costs from the acquired businesses in our Water Treatment segment of $5.8 million, including $1.8 million of amortization of intangibles, as well as increased variable expenses, most notably variable pay.
Operating Income
Operating income increased $15.8 million, or 18%, to $104.0 million, or 11% of sales, for fiscal 2024, as compared to $88.2 million, or 9% of sales, for fiscal 2023 due to the combined impact of the factors discussed above.
Interest Expense, Net
Interest expense was $4.3 million for fiscal 2024, a decrease of $0.9 million from interest expense of $5.2 million for fiscal 2023. Interest expense decreased due to lower outstanding borrowings in the current year as compared to the prior year, offset slightly by higher borrowing rates.
Income Tax Provision
Our effective tax rate was approximately 26% for fiscal 2024 and 27% for fiscal 2023. The current year decrease in the effective tax rate was primarily driven by favorable tax provision adjustments recorded. The effective tax rate is impacted by projected levels of annual taxable income, permanent items, and state taxes.
Selected Quarterly Financial Data
Selected financial data for our fiscal quarters is shown below. No changes have been made to previously reported information.
| | | | | | | | | | | | | | | | | | | | | | | | | | | | | | | | |
| (In thousands, except per share data) | | Fiscal 2024 |
| | | First | | Second | | Third | | Fourth | | Total |
| Sales | | $ | 251,120 | | | $ | 236,526 | | | $ | 208,496 | | | $ | 223,020 | | | $ | 919,162 | |
| Gross profit | | 51,991 | | | 53,886 | | | 42,248 | | | 45,511 | | | 193,636 | |
| Selling, general, and administrative expenses | | 19,504 | | | 20,895 | | | 23,774 | | | 25,427 | | | 89,600 | |
| Operating income | | 32,487 | | | 32,991 | | | 18,474 | | | 20,084 | | | 104,036 | |
| Net income | | 23,430 | | | 23,216 | | | 14,885 | | | 13,832 | | | 75,363 | |
| Basic earnings per share | | $ | 1.12 | | | $ | 1.11 | | | $ | 0.72 | | | $ | 0.67 | | | $ | 3.61 | |
| Diluted earnings per share | | $ | 1.12 | | | $ | 1.10 | | | $ | 0.71 | | | $ | 0.66 | | | $ | 3.59 | |
| | | | | | | | | | |
| | | Fiscal 2023 |
| | | First | | Second | | Third | | Fourth | | Total |
| Sales | | $ | 246,543 | | | $ | 241,192 | | | $ | 219,218 | | | $ | 228,145 | | | $ | 935,098 | |
| Gross profit | | 46,749 | | | 46,374 | | | 36,271 | | | 35,725 | | | 165,119 | |
| Selling, general, and administrative expenses | | 18,885 | | | 19,838 | | | 21,004 | | | 17,242 | | | 76,969 | |
| Operating income | | 27,864 | | | 26,536 | | | 15,267 | | | 18,483 | | | 88,150 | |
| Net income | | 19,695 | | | 18,000 | | | 10,733 | | | 11,613 | | | 60,041 | |
| Basic earnings per share | | $ | 0.94 | | | $ | 0.86 | | | $ | 0.52 | | | $ | 0.56 | | | $ | 2.88 | |
| Diluted earnings per share | | $ | 0.94 | | | $ | 0.86 | | | $ | 0.51 | | | $ | 0.55 | | | $ | 2.86 | |
Earnings per share may not equal the face of the Consolidated Statements of Income due to rounding.
Liquidity and Capital Resources
Cash provided by operating activities in fiscal 2024 was $159.5 million compared to $77.4 million in fiscal 2023. Our net cash provided by operating activities increased $82.1 million compared to fiscal 2023. In fiscal 2024, our operating cash flow was improved by $47 million in the aggregate due primarily to favorable year-over-year changes in trade receivables and inventory. In the prior fiscal year, we expended a net of $13 million in the aggregate for working capital primarily as a result of lower year-over-year payables. This, combined with improved net income, resulted in the year-over-year increase in net cash provided by operating activities. Due to the nature of our operations, which includes purchases of large quantities of bulk chemicals, the timing of purchases can result in significant changes in working capital and the resulting operating cash flow. Historically, our cash requirements for working capital increase during the period from March through November as caustic soda inventory levels increase as most of our barges are received during this period.
Cash used in investing activities was $122.5 million in fiscal 2024 compared to $41.2 million in fiscal 2023. Capital expenditures for property, plant and equipment were $40.2 million in fiscal 2024 and $48.3 million in fiscal 2023. The current year decrease in capital expenditures was primarily driven by decreased expenditures for facility improvements and expansions. Cash used in investing activities included Water Treatment group acquisition spending of $83.5 in fiscal 2024 compared to no acquisition spending for acquisitions in fiscal 2023. Cash used in investing activities also included proceeds from asset disposals of $1.1 million in fiscal 2024 compared to $7.1 million in fiscal 2023. The proceeds received in fiscal 2023 related primarily to our sale of certain assets related to our consumer bleach packaging business.
Cash used in financing activities was $37.4 million in fiscal 2024 compared to $32.1 million in fiscal 2023. Cash used in financing activities included net debt repayments of $13.0 million in fiscal 2024 and $14.0 million in fiscal 2023. We paid out cash dividends of $13.2 million in fiscal 2024 and $12.0 million in fiscal 2023. In fiscal 2024, we used $11.3 million to repurchase shares under our board-authorized share repurchase program, and in fiscal 2023, we used $6.6 million to repurchase shares under the program.
Our cash balance was $7.2 million at March 31, 2024, a decrease of $0.4 million as compared with April 2, 2023. Cash flows generated by operations during fiscal 2024 were offset by the cash expended for acquisitions, capital expenditures, repayments of debt, dividend payments and share repurchases in fiscal 2024.
We are party to a Credit Agreement with U.S. Bank as Sole Lead Arranger and Sole Book Runner, and other lenders from time to time party thereto, whereby U.S. Bank is also serving as Administrative Agent. The Credit Agreement provides us with a Revolving Loan Facility totaling $250.0 million. The Revolving Loan Facility includes a $10 million letter of credit subfacility and $25 million swingline subfacility. The Revolving Loan Facility has a five-year maturity date, maturing on April 30, 2027. The Revolving Loan Facility is secured by substantially all of our personal property assets and those of our subsidiaries.
Borrowings under the Revolving Loan Facility bear interest at a rate per annum equal to one of the following, plus, in both cases, an applicable margin based upon our leverage ratio: (a) Term SOFR, which includes a credit spread adjustment of 0.10%, for an interest period of one, three or six months as selected by us, reset at the end of the selected interest period, or (b) a base rate determined by reference to the highest of (1) U. S. Bank’s prime rate, (2) the Federal Funds Effective Rate plus 0.5%, or (3) one-month Term SOFR for U.S. dollars plus 1.0%. The Term SOFR margin is between 0.85% and 1.35%, depending on our leverage ratio. The base rate margin is between 0.00% and 0.35%, depending on our leverage ratio. At March 31, 2024, the effective interest rate on our borrowings was 4.3%.
In addition to paying interest on the outstanding principal under the Revolving Loan Facility, we are required to pay a commitment fee on the unutilized commitments thereunder. The commitment fee is between 0.15% and 0.25%, depending on our leverage ratio.
Debt issuance costs paid to the Lenders are being amortized as interest expense over the term of the Credit Agreement. As of March 31, 2024, the unamortized balance of these costs was $0.3 million, and is reflected as a reduction of debt on our balance sheet.
The Credit Agreement requires us to maintain (a) a minimum fixed charge coverage ratio of 1.15 to 1.00 and (b) a maximum total cash flow leverage ratio of 3.0 to 1.0. The Credit Agreement also contains other customary affirmative and negative covenants, including covenants that restrict our ability to incur additional indebtedness, dispose of significant assets, make certain investments, including any acquisitions other than permitted acquisitions, make certain payments, enter into sale and leaseback transactions, grant liens on our assets or enter into rate management transactions, subject to certain limitations. We are permitted to make distributions, pay dividends and repurchase shares so long as no default or event of default exists or would exist as a result thereof. We were in compliance with all covenants of the Credit Agreement as of March 31, 2024 and expect to remain in compliance with all covenants for the next 12 months.
The Credit Agreement contains customary events of default, including failure to comply with covenants in the Credit Agreement and other loan documents, cross default to other material indebtedness, failure by us to pay or discharge material judgments, bankruptcy, and change of control. The occurrence of an event of default would permit the lenders to terminate their commitments and accelerate loans under the Credit Facility.
We have in place an interest rate swap agreement to manage the risk associated with a portion of our variable-rate long-term debt. We do not utilize derivative instruments for speculative purposes. The interest rate swap involves the exchange of fixed-rate and variable-rate payments without the exchange of the underlying notional amount on which the interest payments are calculated. The notional amount of the swap agreement is $60 million and it will terminate on May 1, 2027.
As part of our growth strategy, we have acquired businesses and may pursue acquisitions or other strategic relationships in the future that we believe will complement or expand our existing businesses or increase our customer base. We believe we could borrow additional funds under our current or new credit facilities or sell equity for strategic reasons or to further strengthen our financial position.
Material Cash Requirements
The following table provides aggregate information about our contractual payment obligations and the periods in which payments are due:
| | | | | | | | | | | | | | | | | | | | | | | | | | | | | | | | | | | | | | | | | | | | |
| | | Payments Due by Fiscal Period |
| Contractual Obligation | | 2025 | | 2026 | | 2027 | | 2028 | | 2029 | | More than
5 Years | | Total |
| | | (In thousands) |
| Senior secured revolver (1) | | $ | — | | | $ | — | | | $ | — | | | $ | 99,000 | | | $ | — | | | $ | — | | | $ | 99,000 | |
| Interest payments (2) | | $ | 4,353 | | | $ | 4,353 | | | $ | 4,353 | | | $ | 363 | | | $ | — | | | $ | — | | | $ | 13,422 | |
| Operating lease obligations (3) | | $ | 2,870 | | | $ | 2,548 | | | $ | 2,079 | | | $ | 1,819 | | | $ | 1,475 | | | $ | 2,819 | | | $ | 13,610 | |
| Pension withdrawal liability (4) | | $ | 467 | | | $ | 467 | | | $ | 467 | | | $ | 467 | | | $ | 467 | | | $ | 2,103 | | | $ | 4,438 | |
(1) Represents balance outstanding as of March 31, 2024, and assumes such amount remains outstanding until its maturity date, as periodic payments are not required under the terms of our Credit Agreement. However, it is our intention to pay down our debt with available excess cash flow. See Note 8 of our consolidated Financial Statements for further information.
(2) Represents interest payments and commitment fees payable on outstanding balances under our revolver, net of the expected receivable from our interest rate swap agreement, and assumes interest rates remain unchanged from the rate as of March 31, 2024.
(3) As reported under ASC Topic 842.
(4) This relates to our withdrawal from a multiemployer pension plan. Payments on this obligation will continue through 2034.
In addition to the above contractual obligations, in the ordinary course of business we have routine cash requirements related to capital expenditures for new trucks, facility improvements and expansions, safety equipment and other additions of property, plant and equipment. Our capital expenditures in fiscal 2024 were $40.2 million and in fiscal 2023 were $48.3 million. We anticipate total capital expenditures to be in the range of $40 to $45 million for fiscal 2025.
Critical Accounting Estimates
In preparing the financial statements, we follow U.S. generally accepted accounting principles (“GAAP”). The preparation of these financial statements requires us to make estimates and judgments that affect the reported amounts of assets, liabilities, sales and expenses, and related disclosure of contingent assets and liabilities. We re-evaluate our estimates on an ongoing basis. Our estimates are based on historical experience and on various other assumptions that are believed to be reasonable under the circumstances. Actual results may differ from these estimates under different assumptions and conditions. We have determined the following is a critical accounting estimate material to our consolidated financial position, results of operations or cash flow.
Acquisition accounting. The fair value of the consideration we pay for each new acquisition is allocated to tangible assets and identifiable intangible assets and liabilities assumed. The accounting for acquisitions involves a considerable amount of judgment and estimate, including the fair value of certain forms of consideration; fair value of acquired intangible assets involving projections of future revenues and cash flows that are then either discounted at an estimated discount rate or measured at an estimated royalty rate; fair value of other acquired assets and assumed liabilities, including potential contingencies; and the useful lives of the acquired assets. The assumptions used are determined at the time of the acquisition in accordance with accepted valuation models. Projections are developed using internal forecasts, available industry and market data and estimates of long-term rates of growth for the business. The impact of prior or future acquisitions on our financial position or results of operations may be materially impacted by the change in or initial selection of assumptions and estimates. See Note 2, Acquisitions included in Part II, Item 8 of this Form 10-K for further discussion of business combination accounting valuation methodology and assumptions.
ITEM 7A. QUANTITATIVE AND QUALITATIVE DISCLOSURE ABOUT MARKET RISK
We are subject to the risk inherent in the cyclical nature of commodity chemical prices. However, we do not currently purchase forward contracts or otherwise engage in hedging activities with respect to the purchase of commodity chemicals. We attempt to pass changes in the cost of our materials on to our customers; however, there are no assurances that we will be able to pass on the increases in the future.
We are exposed to market risks related to interest rates. Our exposure to changes in interest rates is limited to borrowings under our credit facility. A 25-basis point change in interest rates on the variable-rate portion of debt not covered by the interest rate swap would potentially increase or decrease annual interest expense by approximately $0.1 million. Other types of market risk, such as foreign currency risk, do not arise in the normal course of our business activities.
ITEM 8. FINANCIAL STATEMENTS AND SUPPLEMENTARY DATA
| | | | | |
| Index to Consolidated Financial Statements |
| |
| |
| |
| |
| |
| |
| |
| |
| |
| |
| |
| |
| |
Report of Independent Registered Public Accounting Firm
Board of Directors and Shareholders
Hawkins, Inc.
Opinion on internal control over financial reporting
We have audited the internal control over financial reporting of Hawkins, Inc. (a Minnesota corporation) and subsidiaries (the “Company”) as of March 31, 2024, based on criteria established in the 2013 Internal Control—Integrated Framework issued by the Committee of Sponsoring Organizations of the Treadway Commission (“COSO”). In our opinion, the Company maintained, in all material respects, effective internal control over financial reporting as of March 31, 2024, based on criteria established in the 2013 Internal Control—Integrated Framework issued by COSO.
We also have audited, in accordance with the standards of the Public Company Accounting Oversight Board (United States) (“PCAOB”), the consolidated financial statements of the Company as of and for the year ended March 31, 2024, and our report dated May 15, 2024 expressed an unqualified opinion on those financial statements.
Basis for opinion
The Company’s management is responsible for maintaining effective internal control over financial reporting and for its assessment of the effectiveness of internal control over financial reporting, included in the accompanying Management’s Report on Internal Control Over Financial Reporting (“Management’s Report”). Our responsibility is to express an opinion on the Company’s internal control over financial reporting based on our audit. We are a public accounting firm registered with the PCAOB and are required to be independent with respect to the Company in accordance with the U.S. federal securities laws and the applicable rules and regulations of the Securities and Exchange Commission and the PCAOB.
We conducted our audit in accordance with the standards of the PCAOB. Those standards require that we plan and perform the audit to obtain reasonable assurance about whether effective internal control over financial reporting was maintained in all material respects. Our audit included obtaining an understanding of internal control over financial reporting, assessing the risk that a material weakness exists, testing and evaluating the design and operating effectiveness of internal control based on the assessed risk, and performing such other procedures as we considered necessary in the circumstances. We believe that our audit provides a reasonable basis for our opinion.
Our audit of, and opinion on, the Company’s internal control over financial reporting does not include the internal control over financial reporting of Water Solutions, Miami Products, or Industrial Research, wholly-owned subsidiaries, whose financial statements reflect total assets and revenues constituting 15 and 2 percent, respectively, of the related consolidated financial statement amounts as of and for the year ended March 31, 2024. As indicated in Management’s Report, Water Solutions, Miami Products, and Industrial Research were acquired during fiscal 2024. Management’s assertion on the effectiveness of the Company’s internal control over financial reporting excluded internal control over financial reporting of Water Solutions, Miami Products, and Industrial Research.
Definition and limitations of internal control over financial reporting
A company’s internal control over financial reporting is a process designed to provide reasonable assurance regarding the reliability of financial reporting and the preparation of financial statements for external purposes in accordance with generally accepted accounting principles. A company’s internal control over financial reporting includes those policies and procedures that (1) pertain to the maintenance of records that, in reasonable detail, accurately and fairly reflect the transactions and dispositions of the assets of the company; (2) provide reasonable assurance that transactions are recorded as necessary to permit preparation of financial statements in accordance with generally accepted accounting principles, and that receipts and expenditures of the company are being made only in accordance with authorizations of management and directors of the company; and (3) provide reasonable assurance regarding prevention or timely detection of unauthorized acquisition, use, or disposition of the company’s assets that could have a material effect on the financial statements.
Because of its inherent limitations, internal control over financial reporting may not prevent or detect misstatements. Also, projections of any evaluation of effectiveness to future periods are subject to the risk that controls may become inadequate because of changes in conditions, or that the degree of compliance with the policies or procedures may deteriorate.
/s/ GRANT THORNTON LLP
Minneapolis, Minnesota
May 15, 2024
Report of Independent Registered Public Accounting Firm
Board of Directors and Shareholders
Hawkins, Inc.
Opinion on the financial statements
We have audited the accompanying consolidated balance sheets of Hawkins, Inc. (a Minnesota corporation) and subsidiaries (the “Company”) as of March 31, 2024 and April 2, 2023 and the related consolidated statements of income, comprehensive income, shareholders’ equity, and cash flows for each of the three years in the period ended March 31, 2024, and the related notes and financial statement schedule included under Item 15(a) (collectively referred to as the “financial statements”). In our opinion, the financial statements present fairly, in all material respects, the financial position of the Company as of March 31, 2024 and April 2, 2023, and the results of its operations and its cash flows for each of the three years in the period ended March 31, 2024, in conformity with accounting principles generally accepted in the United States of America.
We also have audited, in accordance with the standards of the Public Company Accounting Oversight Board (United States) (“PCAOB”), the Company’s internal control over financial reporting as of March 31, 2024, based on criteria established in the 2013 Internal Control—Integrated Framework issued by the Committee of Sponsoring Organizations of the Treadway Commission (“COSO”), and our report dated May 15, 2024 expressed an unqualified opinion.
Basis for opinion
These financial statements are the responsibility of the Company’s management. Our responsibility is to express an opinion on the Company’s financial statements based on our audits. We are a public accounting firm registered with the PCAOB and are required to be independent with respect to the Company in accordance with the U.S. federal securities laws and the applicable rules and regulations of the Securities and Exchange Commission and the PCAOB.
We conducted our audits in accordance with the standards of the PCAOB. Those standards require that we plan and perform the audit to obtain reasonable assurance about whether the financial statements are free of material misstatement, whether due to error or fraud. Our audits included performing procedures to assess the risks of material misstatement of the financial statements, whether due to error or fraud, and performing procedures that respond to those risks. Such procedures included examining, on a test basis, evidence regarding the amounts and disclosures in the financial statements. Our audits also included evaluating the accounting principles used and significant estimates made by management, as well as evaluating the overall presentation of the financial statements. We believe that our audits provide a reasonable basis for our opinion.
Critical audit matters
The critical audit matter communicated below is a matter arising from the current period audit of the financial statements that was communicated or required to be communicated to the audit committee and that: (1) relates to accounts or disclosures that are material to the financial statements and (2) involved our especially challenging, subjective, or complex judgments. The communication of critical audit matters does not alter in any way our opinion on the financial statements, taken as a whole, and we are not, by communicating the critical audit matter below, providing a separate opinion on the critical audit matter or on the accounts or disclosures to which it relates.
Customer relationships acquired with the Water Solutions Unlimited acquisition
As described further in Note 2 to the financial statements, on October 27, 2023 the Company acquired substantially all of the assets of Water Solutions Unlimited, Inc. The total purchase price consideration was $70.7 million, which allocated $39.0 million to separately identified intangible assets, including customer relationships of $32.4 million. The determination of the fair value of the customer relationships requires management to make significant estimates and assumptions related to forecasts of future revenues, expenses, and the discount rate applied. Changes to these assumptions could materially affect the determination of the fair value of the customer relationships. We identified the fair value assigned to the customer relationships included on the opening balance sheet as a critical audit matter.
The principal considerations for our determination that the valuation of the acquired customer relationships is a critical audit matter is that management utilized significant judgement when estimating the fair value assigned to the customer relationships. In turn, auditing management’s judgements regarding the assigned fair value involved a high degree of subjectivity due to the estimation uncertainty of management’s significant judgements.
Our audit procedures related to the estimated fair value assigned to the acquired customer relationships included the following, among others.
•We obtained an understanding and tested the design of relevant controls within the Company’s process to value acquired customer relationship assets, including the Company’s control over the selection and review of the reasonableness of assumptions used in determining fair value.
•We evaluated the reasonableness of management’s significant assumptions, which included forecasted revenues and operating expenses. We tested whether these forecasts were reasonable and consistent with historical performance.
•We involved our valuation professionals with specialized skills and knowledge, to evaluate key inputs and assumptions used to determine fair value. Our valuation professionals compared the discount rate used to value the customer relationships to independently developed discount rates derived from publicly available data for comparable companies.
/s/ GRANT THORNTON LLP
We have served as the Company’s auditor since 2020.
Minneapolis, Minnesota
May 15, 2024
HAWKINS, INC.
CONSOLIDATED BALANCE SHEETS
(In thousands, except share and per-share data) | | | | | | | | | | | | | | |
| | March 31, 2024 | | April 2, 2023 |
| ASSETS | | | | |
| CURRENT ASSETS: | | | | |
| Cash and cash equivalents | | $ | 7,153 | | | $ | 7,566 | |
| | | | |
| Trade accounts receivables, net | | 114,477 | | | 129,252 | |
| Inventories | | 74,600 | | | 88,777 | |
| | | | |
| Prepaid expenses and other current assets | | 6,596 | | | 6,449 | |
| Total current assets | | 202,826 | | | 232,044 | |
| PROPERTY, PLANT, AND EQUIPMENT: | | | | |
| Land | | 17,916 | | | 16,344 | |
| Buildings and improvements | | 147,701 | | | 134,901 | |
| Machinery and equipment | | 141,262 | | | 125,970 | |
| Transportation equipment | | 67,868 | | | 56,328 | |
| Office furniture and equipment | | 11,901 | | | 11,210 | |
| | 386,648 | | | 344,753 | |
| Less accumulated depreciation | | 177,774 | | | 158,950 | |
| Net property, plant, and equipment | | 208,874 | | | 185,803 | |
| OTHER ASSETS: | | | | |
| Right-of-use assets | | 11,713 | | | 10,199 | |
| Goodwill | | 103,399 | | | 77,401 | |
| Intangible assets, net | | 116,626 | | | 73,060 | |
| Deferred compensation plan asset | | 9,584 | | | 7,367 | |
| Other | | 4,912 | | | 4,661 | |
| Total other assets | | 246,234 | | | 172,688 | |
| Total assets | | $ | 657,934 | | | $ | 590,535 | |
| LIABILITIES AND SHAREHOLDERS’ EQUITY | | | | |
| CURRENT LIABILITIES: | | | | |
| Accounts payable — trade | | $ | 56,387 | | | $ | 53,705 | |
| Accrued payroll and employee benefits | | 19,532 | | | 17,279 | |
| Current portion of long-term debt | | 9,913 | | | 9,913 | |
| | | | |
| Income tax payable | | 1,943 | | | 3,329 | |
| Environmental remediation | | 7,700 | | | — | |
| Other current liabilities | | 7,832 | | | 6,645 | |
| Total current liabilities | | 103,307 | | | 90,871 | |
| LONG-TERM DEBT | | 88,818 | | | 101,731 | |
| LONG-TERM LEASE LIABILITY | | 9,530 | | | 8,687 | |
| PENSION WITHDRAWAL LIABILITY | | 3,538 | | | 3,912 | |
| DEFERRED INCOME TAXES | | 22,406 | | | 23,800 | |
| DEFERRED COMPENSATION LIABILITY | | 11,764 | | | 9,343 | |
| EARNOUT LIABILITY | | 11,235 | | | — | |
| OTHER LONG-TERM LIABILITIES | | 1,310 | | | 2,175 | |
| Total liabilities | | 251,908 | | | 240,519 | |
| COMMITMENTS AND CONTINGENCIES (Note 12) | | | | |
| SHAREHOLDERS’ EQUITY: | | | | |
Common shares; authorized: 60,000,000 shares of $0.01 par value; 20,790,261 and 20,850,454 shares issued and outstanding for 2024 and 2023, respectively | | 208 | | | 209 | |
| Additional paid-in capital | | 38,154 | | | 44,443 | |
| Retained earnings | | 364,549 | | | 302,424 | |
| Accumulated other comprehensive income | | 3,115 | | | 2,940 | |
| Total shareholders’ equity | | 406,026 | | | 350,016 | |
| Total liabilities and shareholders’ equity | | $ | 657,934 | | | $ | 590,535 | |
See accompanying notes to consolidated financial statements.
HAWKINS, INC.
CONSOLIDATED STATEMENTS OF INCOME
(In thousands, except share and per-share data) | | | | | | | | | | | | | | | | | | | | |
| | Fiscal Year Ended |
| | | March 31, 2024 | | April 02, 2023 | | April 03, 2022 |
| Sales | | $ | 919,162 | | | $ | 935,098 | | | $ | 774,541 | |
| Cost of sales | | (725,526) | | | (769,979) | | | (628,021) | |
| Gross profit | | 193,636 | | | 165,119 | | | 146,520 | |
| Selling, general and administrative expenses | | (89,600) | | | (76,969) | | | (75,326) | |
| Operating income | | 104,036 | | | 88,150 | | | 71,194 | |
| Interest expense, net | | (4,282) | | | (5,234) | | | (1,404) | |
| Other income (expense) | | 1,391 | | | (334) | | | 189 | |
| Income before income taxes | | 101,145 | | | 82,582 | | | 69,979 | |
| Income tax expense | | (25,782) | | | (22,541) | | | (18,437) | |
| Net income | | $ | 75,363 | | | $ | 60,041 | | | $ | 51,542 | |
| | | | | | |
| Weighted average number of shares outstanding-basic | | 20,864,348 | | | 20,848,077 | | | 20,947,234 | |
| Weighted average number of shares outstanding-diluted | | 21,014,326 | | | 21,014,905 | | | 21,135,258 | |
| | | | | | |
| Basic earnings per share | | $ | 3.61 | | | $ | 2.88 | | | $ | 2.46 | |
| Diluted earnings per share | | $ | 3.59 | | | $ | 2.86 | | | $ | 2.44 | |
| | | | | | |
| Cash dividends declared and paid per common share | | $ | 0.6300 | | | $ | 0.5700 | | | $ | 0.5225 | |
See accompanying notes to consolidated financial statements.
HAWKINS, INC.
CONSOLIDATED STATEMENTS OF COMPREHENSIVE INCOME
(In thousands)
| | | | | | | | | | | | | | | | | |
| Fiscal Year Ended |
| March 31, 2024 | | April 2, 2023 | | April 3, 2022 |
| | | | | |
| Net income | $ | 75,363 | | | $ | 60,041 | | | $ | 51,542 | |
| Other comprehensive income, net of tax: | | | | | |
| | | | | |
| Unrealized gain on interest rate swap | 175 | | | 1,649 | | | 1,291 | |
| | | | | |
| Total other comprehensive income | 175 | | | 1,649 | | | 1,291 | |
| Total comprehensive income | $ | 75,538 | | | $ | 61,690 | | | $ | 52,833 | |
See accompanying notes to consolidated financial statements.
HAWKINS, INC.
CONSOLIDATED STATEMENTS OF SHAREHOLDERS’ EQUITY
(In thousands, except share data) | | | | | | | | | | | | | | | | | | | | | | | | | | | | | | | | | | | | | | |
| | | Common Shares | | Additional
Paid-in
Capital | | Retained
Earnings | | Accumulated Other Comprehensive Income (Loss) | | Total
Shareholders’
Equity |
| Shares | | Amount | |
| BALANCE — March 28, 2021 | | 20,969,746 | | | $ | 210 | | | $ | 51,138 | | | $ | 213,898 | | | $ | — | | | $ | 265,246 | |
| Cash dividends declared and paid | | — | | | — | | | — | | | (11,056) | | | — | | | (11,056) | |
| Share-based compensation expense | | — | | | — | | | 3,818 | | | — | | | — | | | 3,818 | |
| Vesting of restricted stock | | 134,230 | | | 1 | | | (1) | | | — | | | — | | | — | |
| Shares surrendered for payroll taxes | | (45,390) | | | — | | | (1,467) | | | — | | | — | | | (1,467) | |
| ESPP shares issued | | 71,692 | | | — | | | 1,772 | | | — | | | — | | | 1,772 | |
| Shares repurchased | | (240,501) | | | (2) | | | (8,543) | | | — | | | — | | | (8,545) | |
| Other comprehensive loss, net of tax | | — | | | — | | | — | | | — | | | 1,291 | | | 1,291 | |
| Net income | | — | | | — | | | — | | | 51,542 | | | — | | | 51,542 | |
| BALANCE — April 3, 2022 | | 20,889,777 | | | $ | 209 | | | $ | 46,717 | | | $ | 254,384 | | | $ | 1,291 | | | $ | 302,601 | |
| Cash dividends declared and paid | | — | | | — | | | — | | | (12,001) | | | — | | | (12,001) | |
| Share-based compensation expense | | — | | | — | | | 3,825 | | | — | | | — | | | 3,825 | |
| Vesting of restricted stock | | 113,147 | | | 1 | | | (1) | | | — | | | — | | | — | |
| Shares surrendered for payroll taxes | | (36,410) | | | — | | | (1,550) | | | — | | | — | | | (1,550) | |
| ESPP shares issued | | 65,597 | | | 1 | | | 2,007 | | | — | | | — | | | 2,008 | |
| Shares repurchased | | (181,657) | | | (2) | | | (6,555) | | | — | | | — | | | (6,557) | |
| Other comprehensive income, net of tax | | — | | | — | | | — | | | — | | | 1,649 | | | 1,649 | |
| Net income | | — | | | — | | | — | | | 60,041 | | | — | | | 60,041 | |
| BALANCE — April 2, 2023 | | 20,850,454 | | | $ | 209 | | | $ | 44,443 | | | $ | 302,424 | | | $ | 2,940 | | | $ | 350,016 | |
| Cash dividends declared and paid | | — | | | — | | | — | | | (13,238) | | | — | | | (13,238) | |
| Share-based compensation expense | | — | | | — | | | 4,880 | | | — | | | — | | | 4,880 | |
| Vesting of restricted stock | | 118,165 | | | 1 | | | (1) | | | — | | | — | | | — | |
| Shares surrendered for payroll taxes | | (48,478) | | | (1) | | | (2,139) | | | — | | | — | | | (2,140) | |
| ESPP shares issued | | 61,981 | | | 1 | | | 2,241 | | | — | | | — | | | 2,242 | |
| Shares repurchased | | (191,861) | | | (2) | | | (11,270) | | | — | | | — | | | (11,272) | |
| Other comprehensive income, net of tax | | — | | | — | | | — | | | — | | | 175 | | | 175 | |
| Net income | | — | | | — | | | — | | | 75,363 | | | — | | | 75,363 | |
| BALANCE — March 31, 2024 | | 20,790,261 | | | $ | 208 | | | $ | 38,154 | | | $ | 364,549 | | | $ | 3,115 | | | $ | 406,026 | |
See accompanying notes to consolidated financial statements.
HAWKINS, INC.
CONSOLIDATED STATEMENTS OF CASH FLOWS
(In thousands) | | | | | | | | | | | | | | | | | | | | |
| | Fiscal Year Ended |
| | | March 31, 2024 | | April 2, 2023 | | April 3, 2022 |
| CASH FLOWS FROM OPERATING ACTIVITIES: | | | | | | |
| Net income | | $ | 75,363 | | | $ | 60,041 | | | $ | 51,542 | |
| Reconciliation to cash flows provided by operating activities: | | | | | | |
| Depreciation and amortization | | 31,803 | | | 27,440 | | | 24,129 | |
| Change in fair value of earnout liability | | 571 | | | — | | | — | |
| Operating leases | | 2,708 | | | 1,971 | | | 1,899 | |
| (Gain) loss on deferred compensation assets | | (1,391) | | | 334 | | | (189) | |
| Deferred income taxes | | (1,459) | | | (232) | | | (1,501) | |
| Stock compensation expense | | 4,880 | | | 3,825 | | | 3,818 | |
| (Gain) loss from asset disposals | | (85) | | | (2,950) | | | 452 | |
| Other | | 87 | | | 87 | | | 93 | |
| Changes in operating accounts (using) providing cash, net of acquisitions: | | | | | | |
| Trade receivables | | 21,399 | | | (6,389) | | | (30,526) | |
| Inventories | | 19,921 | | | 4,717 | | | (30,034) | |
| Accounts payable | | (828) | | | (11,596) | | | 25,138 | |
| Accrued liabilities | | 10,708 | | | (737) | | | 2,723 | |
| Lease liabilities | | (2,676) | | | (1,958) | | | (1,907) | |
| Income taxes | | (1,390) | | | 3,290 | | | 214 | |
| Other | | (112) | | | (443) | | | (3,014) | |
| Net cash provided by operating activities | | 159,499 | | | 77,400 | | | 42,837 | |
| CASH FLOWS FROM INVESTING ACTIVITIES: | | | | | | |
| Additions to property, plant, and equipment | | (40,151) | | | (48,321) | | | (28,512) | |
| Acquisitions | | (83,455) | | | — | | | (21,546) | |
| Proceeds from asset disposals | | 1,102 | | | 7,091 | | | 302 | |
| Net cash used in investing activities | | (122,504) | | | (41,230) | | | (49,756) | |
| CASH FLOWS FROM FINANCING ACTIVITIES: | | | | | | |
| Cash dividends paid | | (13,238) | | | (12,001) | | | (11,056) | |
| New shares issued | | 2,242 | | | 2,008 | | | 1,772 | |
| Shares surrendered for payroll taxes | | (2,140) | | | (1,550) | | | (1,467) | |
| Shares repurchased | | (11,272) | | | (6,557) | | | (8,545) | |
| Payments for debt issuance costs | | — | | | — | | | (287) | |
| | | | | | |
| Payments on senior secured revolving loan | | (98,000) | | | (59,000) | | | (15,000) | |
| Borrowings on senior secured revolving loan | | 85,000 | | | 45,000 | | | 42,000 | |
| Net cash (used in) provided by financing activities | | (37,408) | | | (32,100) | | | 7,417 | |
| NET (DECREASE) INCREASE IN CASH AND CASH EQUIVALENTS | | (413) | | | 4,070 | | | 498 | |
| CASH AND CASH EQUIVALENTS - beginning of year | | 7,566 | | | 3,496 | | | 2,998 | |
| CASH AND CASH EQUIVALENTS - end of year | | $ | 7,153 | | | $ | 7,566 | | | $ | 3,496 | |
| SUPPLEMENTAL DISCLOSURES OF CASH FLOW INFORMATION- | | | | | | |
| Cash paid during the year for income taxes | | $ | 28,631 | | | $ | 19,485 | | | $ | 19,726 | |
| Cash paid for interest | | 4,654 | | | 4,759 | | | 1,197 | |
| Noncash investing activities - Capital expenditures in accounts payable | | 2,697 | | | 2,340 | | | 3,733 | |
See accompanying notes to consolidated financial statements.
HAWKINS, INC.
NOTES TO CONSOLIDATED FINANCIAL STATEMENTS
Note 1 — Nature of Business and Significant Accounting Policies
Nature of Business - We have three reportable segments: Industrial, Water Treatment and Health and Nutrition. The Industrial Group specializes in providing industrial chemicals, products and services to industries such as agriculture, chemical processing, electronics, energy, food, pharmaceutical and plating. This group also manufactures and sells certain food-grade products, including liquid phosphates, lactates and other blended products. The Water Treatment Group specializes in providing chemicals, products, equipment, services and solutions for potable water, municipal and industrial wastewater, industrial process water, non-residential swimming pool water and agricultural water. This group has the resources and flexibility to treat systems ranging in size from a single small well to a multi-million-gallon-per-day facility. Our Health and Nutrition Group specializes in providing ingredient distribution, processing and formulation solutions to manufacturers of nutraceutical, functional food and beverage, personal care, dietary supplement and other nutritional food, health and wellness products. This group offers a diverse product portfolio including minerals, vitamins and amino acids, excipients, joint products, botanicals and herbs, sweeteners and enzymes.
Fiscal Year - Our fiscal year is a 52 or 53-week year ending on the Sunday closest to March 31. Our fiscal 2024 was 52 weeks, fiscal 2023 was 52 weeks, and fiscal 2022 was 53 weeks. Fiscal 2025 will be 52 weeks.
Principles of Consolidation - The consolidated financial statements include the accounts of Hawkins, Inc. and its wholly-owned subsidiaries. All intercompany transactions and accounts have been eliminated.
Estimates - The preparation of financial statements in conformity with U.S. generally accepted accounting principles (“GAAP”) requires management to make estimates and assumptions that affect the reported amounts of assets and liabilities, particularly receivables, inventories, property, plant and equipment, right-of-use assets, goodwill, intangibles, accrued expenses, short-term and long-term lease liabilities, income taxes and related accounts and the reported amounts of revenues and expenses during the reporting period. Actual results could differ from those estimates.
Revenue Recognition - Revenue is measured as the amount of consideration we expect to receive in exchange for transferring products. Revenue is recognized when we satisfy our performance obligations under the contract. We recognize revenue upon transfer of control of the promised products to the customer, with revenue recognized at the point in time the customer obtains control of the products. Net sales include products and shipping charges, net of estimates for product returns and any related sales rebates. We estimate product returns based on historical return rates. Using probability assessments, we estimate sales rebates expected to be paid over the term of the contract. The majority of our contracts have a single performance obligation and are short term in nature. Sales taxes that are collected from customers and remitted to governmental authorities are accounted for on a net basis and therefore are excluded from net sales. We offer certain customers cash discounts and volume rebates as sales incentives. The discounts and volume rebates are recorded as a reduction in sales at the time revenue is recognized in an amount estimated based on historical experience and contractual obligations.
Shipping and Handling - All shipping and handling amounts billed to customers are included in revenues. Costs incurred related to the shipping and the handling of products are included in cost of sales.
HAWKINS, INC.
NOTES TO CONSOLIDATED FINANCIAL STATEMENTS — (Continued)
Fair Value Measurements - The financial assets and liabilities that are re-measured and reported at fair value for each reporting period are an interest rate swap, marketable securities held in a deferred compensation retirement plan, and the earnout liability recorded in conjunction with the acquisition of Water Solutions. There are no fair value measurements with respect to nonfinancial assets or liabilities that are recognized or disclosed at fair value in our consolidated financial statements on a recurring basis.
Assets and liabilities measured at fair value are classified using the following hierarchy, which is based upon the transparency of inputs to the valuation as of the measurement date:
Level 1: Valuation is based on quoted prices in active markets for identical assets or liabilities.
Level 2: Valuation is based on quoted prices in active markets for similar assets or liabilities, or quoted prices for identical or similar assets or liabilities in markets that are not active, or inputs other than quoted prices that are observable or can be corroborated by observable market data for the asset or liability.
Level 3: Valuation is based upon unobservable inputs for the asset or liability that are supported by little or no market activity. These fair values are determined using pricing models for which the assumptions utilize management’s estimates or market participant assumptions.
In making fair value measurements, observable market data must be used when available. When inputs used to measure fair value fall within different levels of the hierarchy, the level within which the fair value measurement is categorized is based on the lowest level input that is significant to the fair value measurement.
Cash Equivalents - Cash equivalents include all liquid debt instruments (primarily cash funds and money market accounts) purchased with an original maturity of three months or less. The cash balances, maintained at large commercial banking institutions with strong credit ratings, typically exceed federally insured limits.
Trade Receivables and Concentrations of Credit Risk - Financial instruments, which potentially subject us to a concentration of credit risk, principally consist of trade receivables. We sell our principal products to a large number of customers in many different industries. As of March 31, 2024, no single customer represented more than 10% of our total trade receivables. There are no other concentrations of credit risk with other single customers from a particular service or geographic area that would significantly impact us in the near term.
To reduce credit risk, we routinely assess the financial strength of our customers. Receivables are reported net of an allowance for credit losses as determined by management at the end of each reporting period. Our receivable allowance is based on an estimate of expected credit losses, with the estimate based on a number of qualitative and quantitative factors that, based on collection experience, may have an impact on repayment risk and ability to collect.
Inventories - Inventories, consisting primarily of finished goods, are primarily valued at the lower of cost or net realizable value, with cost for approximately 82% of our inventory determined using the last-in, first-out (“LIFO”) method. Cost for the other 18% of our total inventory is determined using the first-in, first-out (“FIFO”) method.
Leases - We determine if an arrangement is a lease at inception. Right-of-use ("ROU") assets include operating leases. Lease liabilities for operating leases are classified in "short-term lease liabilities" and "long-term lease liabilities" in our consolidated balance sheet.
ROU assets and related liabilities are recognized at commencement date based on the present value of the lease payments over the lease term. As most of our leases do not provide an implicit rate, we use our incremental borrowing rate based on the information available at commencement date in determining the present value of lease payments. Lease terms may include options to extend or terminate the lease when it is reasonably certain that we will exercise that option. Lease expense for lease payments is recognized on a straight-line basis over the lease term.
Lease and non-lease components are generally accounted for separately for real estate leases. For non-real estate leases, we account for the lease and non-lease components as a single lease component.
HAWKINS, INC.
NOTES TO CONSOLIDATED FINANCIAL STATEMENTS — (Continued)
Property, Plant and Equipment - Property is stated at cost and depreciated or amortized over the lives of the assets, using the straight-line method. Property acquired in a business combination is recorded at the fair value of the assets on the date of acquisition. Estimated lives are generally: 10 to 40 years for buildings and improvements; 3 to 20 years for machinery and equipment; and 3 to 10 years for transportation equipment and office furniture and equipment including computer systems. Leasehold improvements are amortized over the lesser of their estimated useful lives or the remaining lease term. Depreciation and amortization expense is recorded in our Consolidated Statements of Income within cost of goods sold and selling, general and administrative expense, depending on the use of the underlying asset. We recorded depreciation expense of $23.3 million for fiscal 2024, $20.5 million for fiscal 2023 and $17.7 million for fiscal 2022.
Significant improvements that add to productive capacity or extend the lives of properties are capitalized. Costs for repairs and maintenance are charged to expense as incurred. When property is retired or otherwise disposed of, the cost and related accumulated depreciation or amortization are removed from the accounts and any related gains or losses are included in income.
We review the recoverability of long-lived assets to be held and used, such as property, plant and equipment, when events or changes in circumstances occur that indicate the carrying value of the asset group may not be recoverable, such as prolonged industry downturn or significant reductions in projected future cash flows. The assessment of possible impairment is based on our ability to recover the carrying value of the asset group from the expected future pre-tax cash flows (undiscounted) of the related asset group. If these cash flows are less than the carrying value of such asset group, an impairment loss would be measured by the amount the carrying value exceeds the fair value of the long-lived asset group. The measurement of impairment requires us to estimate future cash flows and the fair value of long-lived assets. We did not incur any asset write-off charges in fiscal 2024, fiscal 2023, or fiscal 2022 related to the impairment of long-lived assets.
Goodwill and Identifiable Intangible Assets - Goodwill represents the excess of the cost of acquired businesses over the fair value of identifiable tangible net assets and identifiable intangible assets purchased. Goodwill is tested at least annually for impairment and is tested for impairment more frequently if events or changes in circumstances indicate that the asset might be impaired. Our annual test for impairment is as of the first day of our fourth fiscal quarter. As of January 1, 2024, we performed an analysis of qualitative factors for our Industrial, Water Treatment and Health and Nutrition reporting units to determine whether it is more likely than not that the fair value of either of these reporting units was less than its carrying amount as a basis for determining whether it is necessary to perform a quantitative goodwill impairment test. Based on management’s analysis of qualitative factors, we determined that it was not necessary to perform a quantitative goodwill impairment test for any of these reporting units. Goodwill impairment assessments were also completed in the fourth quarters of fiscal 2023 and 2022 and, similarly, we did not record a goodwill impairment charge.
Our primary identifiable intangible assets include customer relationships, trademarks and tradenames acquired in previous business acquisitions. Identifiable intangible assets with finite lives are amortized whereas identifiable intangible assets with indefinite lives are not amortized. The values assigned to the intangible assets with finite lives are being amortized on average over a remaining useful life of approximately 10 years. Identifiable intangible assets that are subject to amortization are evaluated for impairment whenever events or changes in circumstances indicate that the carrying amount may not be recoverable. No such events or changes in circumstances occurred during fiscal 2024, 2023 or 2022. Identifiable intangible assets not subject to amortization are tested for impairment annually or more frequently if events warrant. The impairment test consists of a qualitative assessment to determine whether it is more likely than not that the asset is impaired. Based on management’s analysis of qualitative factors, we determined that it was not necessary to perform an annual quantitative impairment test for fiscal 2024, 2023 or 2022.
Business Combinations - We record business combinations using the acquisition method of accounting. Under the acquisition method of accounting, identifiable assets acquired and liabilities assumed are recorded at their acquisition date fair values. The excess of the purchase price over the estimated fair value is recorded as goodwill. Changes in the estimated fair values of net assets recorded for acquisitions prior to the finalization of more detailed analysis, but not to exceed one year from the date of acquisition, will adjust the amount of the purchase price allocable to goodwill. Measurement period adjustments are reflected in the period in which they occur.
HAWKINS, INC.
NOTES TO CONSOLIDATED FINANCIAL STATEMENTS — (Continued)
Income Taxes - Deferred taxes are provided for differences between the financial statement and tax basis of assets and liabilities using enacted tax rates in effect for the year in which the differences are expected to reverse. A valuation allowance is provided to offset deferred tax assets if, based on the available evidence, it is more likely than not that some or all of the value of the deferred tax assets will not be realized. We record any interest and penalties related to income taxes as income tax expense in the Consolidated Statements of Income.
Stock-Based Compensation - We account for stock-based compensation on a fair value basis. The estimated grant date fair value of each stock-based award is recognized in expense over the requisite service period (generally the vesting period). Non-vested share awards are recorded as expense over the requisite service periods based on the stock price on the date of grant.
Earnings Per Share - Basic earnings per share (“EPS”) are computed by dividing net income by the weighted-average number of common shares outstanding. Diluted EPS are computed by dividing net income by the weighted-average number of common shares outstanding including the incremental shares assumed to be issued as performance units and restricted stock.
Basic and diluted EPS were calculated using the following: | | | | | | | | | | | | | | | | | | | | |
| | March 31, 2024 | | April 02, 2023 | | April 3, 2022 |
| Weighted average common shares outstanding — basic | | 20,864,348 | | | 20,848,077 | | | 20,947,234 | |
| Dilutive impact of stock performance units and restricted stock | | 149,978 | | | 166,828 | | | 188,024 | |
| Weighted average common shares outstanding — diluted | | 21,014,326 | | | 21,014,905 | | | 21,135,258 | |
There were no shares or stock options excluded from the calculation of weighted average common shares for diluted EPS for fiscal 2024, 2023 or 2022.
Derivative Instruments and Hedging Activities - We are subject to interest rate risk associated with our variable rate debt. We have in place an interest rate swap agreement which has been designated as a cash flow hedge, the purpose of which is to eliminate the cash flow impact of interest rate changes on a portion of our variable-rate debt. The interest rate swap is measured at fair value on the contract date and is subsequently remeasured to fair value at each reporting date. Changes in the fair value of a derivative that is highly effective, and that is designated and qualifies as a cash flow hedge, are recorded in other comprehensive income, until the consolidated statement of income is affected by the variability in cash flows of the designated hedged item. To the extent that the hedge is ineffective, changes in the fair value are recognized in the Consolidated Statements of Income.
Recently Issued Accounting Pronouncements
Income Taxes (Topic 740): Improvements to Income Tax Disclosures (ASU No.2023-09)
In December 2023, the Financial Accounting Standards Board ("FASB") issued accounting standards update No. 2023-09 to enhance the transparency and decision-usefulness of income tax disclosures and to provide information to better assess how an entity's operations and related tax risks and tax planning and operational opportunities affect its tax rate and prospects for future cash flows. For public business entities, the amendments in this update are effective for annual periods beginning after December 15, 2024. We are in the process of evaluating the impact of this standard on the disclosures in our financial statements.
Segment Reporting (Topic 280): Improvements to Reportable Segment Disclosures (ASU 2023-07)
In November 2023, the FASB issued accounting standards update No. 2023-07 to improve reportable segment disclosure requirements, primarily through enhanced disclosures about significant segment expenses. The update requires public entities to disclose, on an annual and interim basis, significant segment expenses that are regularly provided to the chief operating decision maker ("CODM"), the title and position of the CODM and an explanation of how the CODM uses the reported measure(s) of segment profit or loss in assessing segment performance and deciding how to allocate resources. The amendments in this update are effective for public entities in fiscal years beginning after December 15, 2023, and interim periods within fiscal years beginning after December 15, 2024 and are to be applied retrospectively to all prior periods presented in the financial statements. Early adoption is permitted. We are in the process of evaluating the impact of this standard on the disclosures in our financial statements.
HAWKINS, INC.
NOTES TO CONSOLIDATED FINANCIAL STATEMENTS — (Continued)
Note 2 — Acquisitions and Asset Sales
Acquisition of Industrial Research Corporation: On March 8, 2024, we acquired substantially all the assets of Industrial Research Corporation ("Industrial Research") for $4.6 million under the terms of a purchase agreement with Industrial Research and its shareholders. Industrial Research distributed water treatment chemicals and equipment to customers primarily in central to northern Louisiana, eastern Texas and southern Arkansas. The results of operations since the acquisition date and the assets are included in our Water Treatment segment. Costs associated with this transaction were not material and were expensed as incurred.
The acquisition has been accounted for under the acquisition method of accounting, under which the total purchase price is allocated to the net tangible and intangible assets and liabilities of Industrial Research acquired in connection with the acquisition based on their estimated fair values. We estimated the fair values of the assets acquired and liabilities assumed using a discounted cash flow analysis (income approach). Of the $4.6 million purchase price, $2.2 million was allocated to customer relationships, to be amortized over 10 years. The remaining amount was allocated to net working capital and property, plant and equipment, with the residual amount of $1.7 million allocated to goodwill. The goodwill recognized as a result of this acquisition is primarily attributable to strategic and synergistic benefits, as well as the assembled workforce. Such goodwill is expected to be deductible for tax purposes.
Acquisition of The Miami Products & Chemical Company: On October 31, 2023, we acquired substantially all the assets of The Miami Products & Chemical Company ("Miami Products") for $15.5 million under the terms of a purchase agreement with Miami Products and its shareholders. Miami Products was a bleach manufacturer and distributor serving customers primarily throughout Ohio and the surrounding region. The results of operations since the acquisition date and the assets are included in our Water Treatment segment. Costs associated with this transaction were not material and were expensed as incurred.
The acquisition has been accounted for under the acquisition method of accounting, under which the total purchase price is allocated to the net tangible and intangible assets and liabilities of Miami Products acquired in connection with the acquisition based on their estimated fair values. We estimated the fair values of the assets acquired and liabilities assumed using a discounted cash flow analysis (income approach). Of the $15.5 million purchase price, $8.2 million was allocated to customer relationships, to be amortized over 11 years, and $0.8 million was allocated to trade names, to be amortized over 10 years. The remaining amount was allocated to net working capital and property, plant and equipment, with the residual amount of $3.2 million allocated to goodwill. The goodwill recognized as a result of this acquisition is primarily attributable to strategic and synergistic benefits, as well as the assembled workforce. Such goodwill is expected to be deductible for tax purposes.
Acquisition of Water Solutions Unlimited, Inc.: On October 27, 2023, we acquired substantially all the assets of Water Solutions Unlimited, Inc. ("Water Solutions") under the terms of a purchase agreement with Water Solutions and its shareholders. We paid $60 million at closing and may be obligated to pay an additional amount based on achieving a certain earnings target three years after the acquisition. Water Solutions was a manufacturer and distributor of water treatment chemicals serving customers primarily throughout Indiana, Illinois and Michigan. The results of operations since the acquisition date and the assets are included in our Water Treatment segment. Costs associated with this transaction were not material and were expensed as incurred.
The acquisition has been accounted for under the acquisition method of accounting, under which the total purchase price is allocated to the net tangible and intangible assets and liabilities of Water Solutions acquired in connection with the acquisition based on their estimated fair values. We estimated the fair values of the assets acquired and liabilities assumed using a discounted cash flow analysis (income approach). The total purchase price was estimated to be $70.7 million, including the estimated potential earnout to be paid of $10.7 million. Of the $70.7 million purchase price, $32.4 million was allocated to customer relationships, to be amortized over 13 years, $6.4 million was allocated to trade names, to be amortized over 10 years, and $0.2 million was allocated to non-compete agreements, to be amortized over five years. The remaining amount was allocated to net working capital and property, plant and equipment, with the residual amount of $21.0 million allocated to goodwill. The goodwill recognized as a result of this acquisition is primarily attributable to strategic and synergistic benefits, as well as the assembled workforce. Such goodwill is expected to be deductible for tax purposes.
Acquisition of EcoTech Enterprises, Inc.: On July 14, 2023, we acquired substantially all the assets of EcoTech Enterprises, Inc. ("EcoTech") for $3.4 million, under the terms of a purchase agreement with EcoTech and its shareholders. EcoTech was a water treatment chemical distribution company operating primarily in Arkansas. The $3.4 million purchase price was allocated primarily to customer relationships, to be amortized over 10 years, property, plant and equipment, and net working capital. The results of operations since the acquisition date and the assets are included in our Water Treatment segment. Costs associated with this transaction were not material and were expensed as incurred.
HAWKINS, INC.
NOTES TO CONSOLIDATED FINANCIAL STATEMENTS — (Continued)
Sale of bleach packaging assets: On March 30, 2023, we sold certain assets in our Industrial segment related to our consumer bleach packaging business for $7 million. These assets were not core to our Industrial segment operations, where we tend to focus our manufacturing operations on bulk products. The assets sold included plant equipment, inventory and intangible assets, all related to the packaging of bleach. We realized a gain of $3 million on this sale, which was recorded within selling, general and administrative expenses.
Note 3 — Revenue
Our revenue arrangements generally consist of a single performance obligation to transfer promised goods or services. We disaggregate revenues from contracts with customers by both operating segments and types of product sold. Reporting by operating segment is pertinent to understanding our revenues, as it aligns to how we review the financial performance of our operations. Types of products sold within each operating segment help us to further evaluate the financial performance of our segments.
The following table disaggregates external customer net sales by major revenue stream: | | | | | | | | | | | | | | | | | | | | | | | |
| Fiscal Year Ended March 31, 2024: |
| (In thousands) | Industrial | | Water
Treatment | | Health and
Nutrition | | Total |
Manufactured, blended or repackaged products (1) | $ | 345,837 | | | $ | 327,188 | | | $ | 36,375 | | | $ | 709,400 | |
Distributed specialty products (2) | — | | | — | | | 108,789 | | | 108,789 | |
Bulk products (3) | 55,720 | | | 32,349 | | | — | | | 88,069 | |
| Other | 7,908 | | | 3,752 | | | 1,244 | | | 12,904 | |
| Total external customer sales | $ | 409,465 | | | $ | 363,289 | | | $ | 146,408 | | | $ | 919,162 | |
| | | | | | | |
| Fiscal Year Ended April 2, 2023: |
| (In thousands) | Industrial | | Water
Treatment | | Health and
Nutrition | | Total |
Manufactured, blended or repackaged products (1) | $ | 383,612 | | | $ | 271,448 | | | $ | 48,575 | | | $ | 703,635 | |
Distributed specialty products (2) | — | | | — | | | 109,468 | | | 109,468 | |
Bulk products (3) | 77,479 | | | 27,996 | | | — | | | 105,475 | |
| Other | 9,669 | | | 5,481 | | | 1,370 | | | 16,520 | |
| Total external customer sales | $ | 470,760 | | | $ | 304,925 | | | $ | 159,413 | | | $ | 935,098 | |
| | | | | | | |
| Fiscal Year Ended April 3, 2022: |
| (In thousands) | Industrial | | Water
Treatment | | Health and
Nutrition | | Total |
Manufactured, blended or repackaged products (1) | $ | 318,514 | | | $ | 205,350 | | | $ | 34,690 | | | $ | 558,554 | |
Distributed specialty products (2) | — | | | — | | | 124,312 | | | 124,312 | |
Bulk products (3) | 61,443 | | | 20,211 | | | — | | | 81,654 | |
| Other | 6,981 | | | 2,572 | | | 468 | | | 10,021 | |
| Total external customer sales | $ | 386,938 | | | $ | 228,133 | | | $ | 159,470 | | | $ | 774,541 | |
| | | | | | | |
(1)For our Industrial and Water Treatment segments, this line includes our non-bulk specialty products that we either manufacture, blend, repackage, resell in their original form, or direct ship to our customers in smaller quantities, and services we provide for our customers. For our Health and Nutrition segment, this line includes products manufactured, processed or repackaged in our facility and/or with our equipment.
(2)This line includes non-manufactured distributed specialty products in our Health and Nutrition segment, which may be sold out of one of our facilities or direct shipped to our customers.
(3)This line includes bulk products in our Industrial and Water Treatment segments that we do not modify in any way, but receive, store, and ship from our facilities, or direct ship to our customers in large quantities.
HAWKINS, INC.
NOTES TO CONSOLIDATED FINANCIAL STATEMENTS — (Continued)
Note 4 — Derivative Instruments
We have in place an interest rate swap agreement to manage the risk associated with a portion of our variable-rate long-term debt. We do not utilize derivative instruments for speculative purposes. The interest rate swap involves the exchange of fixed-rate and variable-rate payments without the exchange of the underlying notional amount on which the interest payments are calculated. The notional amount of the swap agreement is $60 million and it will terminate on May 1, 2027. We have designated this swap as a cash flow hedge and have determined that it qualifies for hedge accounting treatment. For so long as the hedge is effective, changes in fair value of the cash flow hedge are recorded in other comprehensive income or loss (net of tax) until income or loss from the cash flows of the hedged item is realized.
For fiscal 2024, 2023 and 2022, we recorded $0.2 million, $1.6 million, and $1.3 million, respectively, in other comprehensive income related to unrealized gains (net of tax) on the cash flow hedge. Included in other long-term assets on our consolidated balance sheet was $4.3 million as of March 31, 2024 and $4.0 million as of April 2, 2023.
By their nature, derivative instruments are subject to market risk. Derivative instruments are also subject to credit risk associated with counterparties to the derivative contracts. Credit risk associated with derivatives is measured based on the replacement cost should the counterparty with a contract in a gain position to us fail to perform under the terms of the contract. While the current interest rate swap is in effect, we do not anticipate nonperformance by the counterparty.
Note 5 – Fair Value Measurements
Our financial assets and liabilities are measured at fair value as the price that would be received to sell an asset or paid to transfer a liability in an orderly transaction between market participants at the measurement date (exit price). The carrying value of cash equivalents, accounts receivable, accounts payable, and accrued expenses approximate fair value because of the short-term nature of these instruments. Because of the variable-rate nature of our debt under our credit facility, our debt also approximates fair value.
Assets and Liabilities Measured at Fair Value on a Recurring Basis. The fair value hierarchy requires the use of observable market data when available. In instances where inputs used to measure fair value fall into different levels of the fair value hierarchy, the fair value measurement has been determined based on the lowest level input that is significant to the fair value measurement in its entirety. Our assessment of the significance of a particular item to the fair value measurement in its entirety requires judgment, including the consideration of inputs specific to the asset or liability.
Our financial assets that are re-measured and reported at fair value for each reporting period are an interest rate swap, marketable securities held in a deferred compensation retirement plan, and the earnout liability recorded in conjunction with the acquisition of Water Solutions. The interest rate swap and assets held in a deferred compensation retirement plan are classified as other long-term assets on our balance sheet, with the portion of the deferred compensation retirement plan assets expected to be paid within twelve months classified as current assets. The earnout liability is classified as a long-term liability on our balance sheet. The fair value of the interest rate swap is determined by the respective counterparties based on interest rate changes. Interest rate swaps are valued based on observable interest rate yield curves for similar instruments. The deferred compensation plan assets relate to contributions made to a non-qualified compensation plan on behalf of certain employees who are classified as “highly compensated employees” as determined by IRS guidelines. The assets are part of a rabbi trust and the funds are held in mutual funds. The fair value of the deferred compensation is based on the quoted market prices for the mutual funds at the end of the period.
The earnout liability recorded in conjunction with the Water Solutions acquisition is based upon achieving certain targets. The earnout is based on a target of adjusted earnings before interest, taxes, depreciation and amortization (EBITDA) in year three of the acquisition. The earnout liability was valued based upon a risk-neutral pricing analysis within a Monte Carlo simulation framework, which is a Level 3 input. The Monte Carlo simulation assumptions used to estimate the fair value of the earnout included forecasted EBITDA, an estimated EBITDA-specific required rate of return, term period, risk-free rate, and an estimated EBITDA-specific volatility. Other key inputs included an estimate of our credit-adjusted discount rate and an appropriate risk-free rate over the term of the simulation period. The earnout liability is adjusted to fair value at each reporting date until settled. Changes in fair value are included in selling, general and administrative expenses in our Consolidated Statements of Income.
HAWKINS, INC.
NOTES TO CONSOLIDATED FINANCIAL STATEMENTS — (Continued)
The following table summarizes the balances of assets measured at fair value on a recurring basis as of March 31, 2024 and April 2, 2023.
| | | | | | | | | | | | | | |
| (In thousands) | | March 31, 2024 | | April 2, 2023 |
| Assets | | | | |
| Deferred compensation plan assets | Level 1 | $ | 10,042 | | | $ | 7,659 | |
| Interest rate swap | Level 2 | 4,268 | | | 4,028 | |
| Liabilities | | | | |
| Earnout liability | Level 3 | 11,235 | | | — | |
Changes in the earnout liability measured at fair value using Level 3 inputs were as follows:
| | | | | |
| (In thousands) | |
Earnout liability at April 2, 2023 | $ | — | |
| Addition for acquisition | 10,664 | |
| Fair value adjustments | 571 | |
Earnout liability at March 31, 2024 | $ | 11,235 | |
0
Note 6 — Inventories
Inventories at March 31, 2024 and April 2, 2023 consisted of the following: | | | | | | | | | | | | | | |
| | 2024 | | 2023 |
| (In thousands) | | | | |
| Inventory (FIFO basis) | | $ | 99,058 | | | $ | 128,589 | |
| LIFO reserve | | (24,458) | | | (39,812) | |
| Net inventory | | $ | 74,600 | | | $ | 88,777 | |
The FIFO value of inventories accounted for under the LIFO method was $76.2 million at March 31, 2024 and $101.4 million at April 2, 2023. The remainder of the inventory was valued and accounted for under the FIFO method.
Note 7 — Goodwill and Other Identifiable Intangible Assets
The carrying amount of goodwill for each of our three reportable segments were as follows: | | | | | | | | | | | | | | |
| (In thousands) | Industrial | Water Treatment | Health and Nutrition | Total |
| | | | |
| | | | |
Balance as of April 3, 2022 and April 2, 2023 | $ | 6,495 | | $ | 25,961 | | $ | 44,945 | | $ | 77,401 | |
| Addition due to acquisitions | — | | 25,998 | | — | | 25,998 | |
Balance as of March 31, 2024 | $ | 6,495 | | $ | 51,959 | | $ | 44,945 | | $ | 103,399 | |
| | | | |
HAWKINS, INC.
NOTES TO CONSOLIDATED FINANCIAL STATEMENTS — (Continued)
The following is a summary of our identifiable intangible assets as of March 31, 2024 and April 2, 2023: | | | | | | | | | | | | | | | | | | | | | | |
| | | 2024 |
| | | Gross Amount | | Accumulated
Amortization | | Net carrying value | | |
| (In thousands) | | | | | | | | |
| Finite-life intangible assets: | | | | | | | | |
| Customer relationships | | $ | 153,694 | | | $ | (46,146) | | | $ | 107,548 | | | |
| Trademarks and trade names | | 13,570 | | | (5,968) | | | 7,602 | | | |
| Other finite-life intangible assets | | 4,221 | | | (3,972) | | | 249 | | | |
| Total finite-life intangible assets | | 171,485 | | | (56,086) | | | 115,399 | | | |
| Indefinite-life intangible assets | | 1,227 | | | — | | | 1,227 | | | |
| Total intangible assets, net | | $ | 172,712 | | | $ | (56,086) | | | $ | 116,626 | | | |
| | | | | | | | | | | | | | | | | | | | |
| | | 2023 |
| | | Gross Amount | | Accumulated
Amortization | | Net carrying value |
| (In thousands) | | | | | | |
| Finite-life intangible assets: | | | | | | |
| Customer relationships | | $ | 109,107 | | | $ | (38,377) | | | $ | 70,730 | |
| Trademarks and trade names | | 6,370 | | | (5,267) | | | 1,103 | |
| Other finite-life intangible assets | | 3,904 | | | (3,904) | | | — | |
| Total finite-life intangible assets | | 119,381 | | | (47,548) | | | 71,833 | |
| Indefinite-life intangible assets | | 1,227 | | | — | | | 1,227 | |
| Total intangible assets, net | | $ | 120,608 | | | $ | (47,548) | | | $ | 73,060 | |
Intangible asset amortization expense was $8.5 million during fiscal 2024, $6.9 million during fiscal 2023, and $6.5 million during fiscal 2022.
The estimated future amortization expense for identifiable intangible assets is as follows:
| | | | | | | | |
| (In thousands) | | Intangible Assets |
| Fiscal 2025 | | $ | 11,156 | |
| Fiscal 2026 | | 10,972 | |
| Fiscal 2027 | | 10,671 | |
| Fiscal 2028 | | 10,577 | |
| Fiscal 2029 | | 10,553 | |
| Thereafter | | 61,470 | |
| Total | | $ | 115,399 | |
Note 8 – Debt
We have in place a Credit Agreement with U.S. Bank as Sole Lead Arranger and Sole Book Runner, and other lenders from time to time party thereto, whereby U.S. Bank is also serving as Administrative Agent. The Credit Agreement provides us with a “Revolving Loan Facility” totaling $250 million. The Revolving Loan Facility includes a $10 million letter of credit subfacility and $25 million swingline subfacility. The Revolving Loan Facility has a five-year maturity date, maturing on April 30, 2027. The Revolving Loan Facility is secured by substantially all of our personal property assets and those of our subsidiaries.
At March 31, 2024, the effective interest rate on our borrowings was 4.3%. In addition to paying interest on the outstanding principal under the Revolving Loan Facility, we are required to pay a commitment fee on the unutilized commitments thereunder. The commitment fee is between 0.15% and 0.25%, depending on our leverage ratio.
Unamortized debt issuance costs of $0.3 million paid in connection with the previous credit facility, are reflected as a reduction of debt and are being amortized as interest expense over the term of the Revolving Loan Facility.
HAWKINS, INC.
NOTES TO CONSOLIDATED FINANCIAL STATEMENTS — (Continued)
The Credit Agreement requires us to maintain (a) a minimum fixed charge coverage ratio of 1.15 to 1.00 and (b) a maximum total cash flow leverage ratio of 3.0 to 1.0. The Credit Agreement also contains other customary affirmative and negative covenants, including covenants that restrict our ability to incur additional indebtedness, dispose of significant assets, make certain investments, including any acquisitions other than permitted acquisitions, make certain payments, enter into sale and leaseback transactions, grant liens on our assets or enter into rate management transactions, subject to certain limitations. We are permitted to make distributions, pay dividends and repurchase shares so long as no default or event of default exists or would exist as a result thereof. As of March 31, 2024, we were in compliance with all required covenants.
Debt at March 31, 2024 and April 2, 2023 consisted of the following: | | | | | | | | | | | | | | |
| (In thousands) | | March 31, 2024 | | April 2, 2023 |
| Senior secured revolving loan | | $ | 99,000 | | | $ | 112,000 | |
| Less: unamortized debt issuance costs | | (269) | | | (356) | |
| Total debt, net of debt issuance costs | | 98,731 | | | 111,644 | |
| Less: current portion of long-term debt, net of current unamortized debt issuance costs | | (9,913) | | | (9,913) | |
| Total long-term debt | | $ | 88,818 | | | $ | 101,731 | |
HAWKINS, INC.
NOTES TO CONSOLIDATED FINANCIAL STATEMENTS — (Continued)
Note 9 — Share-Based Compensation
Performance-Based Restricted Stock Units. Our Board of Directors has approved a performance-based equity compensation arrangement for our executive officers. This performance-based arrangement provides for the grant of performance-based restricted stock units that represent a possible future issuance of restricted shares of our common shares based on our pre-tax income target for the applicable fiscal year. The actual number of restricted shares to be issued to each executive officer will be determined when our final financial information becomes available after the applicable fiscal year and will be between zero shares and 70,859 shares in the aggregate for fiscal 2024. The restricted shares issued, if any, will fully vest two years after the end of the fiscal year on which the performance is based. We record the compensation expense for the outstanding performance share units and then-converted restricted stock over the life of the awards.
The following table represents the restricted stock activity for fiscal 2022, 2023, and 2024: | | | | | | | | | | | | | | |
| | | Shares | | Weighted-
Average Grant
Date Fair Value |
Outstanding at beginning of fiscal 2022 | | 239,120 | | | $ | 17.94 | |
| Granted | | 111,618 | | | 31.74 | |
| Vested | | (123,002) | | | 17.25 | |
| Forfeited | | (13,258) | | | 18.69 | |
Outstanding at end of fiscal 2022 | | 214,478 | | | $ | 25.48 | |
| Granted | | 88,524 | | | 38.31 | |
| Vested | | (102,860) | | | 18.69 | |
| Forfeited | | (10,884) | | | 34.68 | |
Outstanding at end of fiscal 2023 | | 189,258 | | | $ | 34.64 | |
| Granted | | 61,819 | | | 43.06 | |
| Vested | | (105,600) | | | 31.74 | |
| | | | |
Outstanding at end of fiscal 2024 | | 145,477 | | | $ | 40.33 | |
We recorded compensation expense on performance-based restricted stock of approximately $3.7 million for fiscal 2024, $2.8 million for fiscal 2023 and $2.9 million for fiscal 2022, substantially all of which was recorded in SG&A expense in the Consolidated Statements of Income. The total fair value of performance-based restricted stock units vested was $3.4 million in fiscal 2024, $1.9 million in fiscal 2023 and $2.1 million in fiscal 2022.
Until the performance-based restricted stock units result in the issuance of restricted stock, the amount of expense recorded each period is dependent upon our estimate of the number of shares that will ultimately be issued and our then current common share price. Upon issuance of restricted stock, we record compensation expense over the remaining vesting period using the award date closing price. Unrecognized compensation expense related to non-vested restricted stock and non-vested restricted share units as of March 31, 2024 was $4.5 million and is expected to be recognized over a weighted average period of 1.2 years.
HAWKINS, INC.
NOTES TO CONSOLIDATED FINANCIAL STATEMENTS — (Continued)
Restricted Stock Awards. As part of their retainer, our directors, other than the Chief Executive Officer, receive restricted stock for their Board services. The restricted stock awards are expensed over a one-year vesting period, based on the market value on the date of grant.
The following table represents the Board’s restricted stock activity for fiscal 2022, 2023, and 2024:
| | | | | | | | | | | | | | |
| | | Shares | | Weighted-
Average Grant
Date Fair Value |
Outstanding at beginning of fiscal 2022 | | 11,228 | | | $ | 25.60 | |
| Granted | | 10,287 | | | 32.80 | |
| Vested | | (11,228) | | | 25.60 | |
| | | | |
Outstanding at end of fiscal 2022 | | 10,287 | | | $ | 32.80 | |
| Granted | | 12,565 | | | 38.98 | |
| Vested | | (10,287) | | | 32.80 | |
| | | | |
Outstanding at end of fiscal 2023 | | 12,565 | | | $ | 38.98 | |
| Granted | | 10,647 | | | 46.00 | |
| Vested | | (12,565) | | | 38.98 | |
| | | | |
Outstanding at end of fiscal 2024 | | 10,647 | | | $ | 46.00 | |
Annual expense related to the value of restricted stock was $0.5 million in fiscal 2024, $0.4 million in fiscal 2023, and $0.3 million in fiscal 2022, and was recorded in SG&A expense in the Consolidated Statements of Income. Unrecognized compensation expense related to non-vested restricted stock awards as of March 31, 2024 was $0.2 million and is expected to be recognized over a weighted average period of 0.3 years.
Note 10 — Share Repurchases
Our board of directors has authorized the repurchase of up to 2,600,000 shares of our outstanding common shares. The shares may be repurchased on the open market or in privately negotiated transactions subject to applicable securities laws and regulations. Upon repurchase of the shares, we reduce our common shares for the par value of the shares with the excess applied against additional paid-in capital. We repurchased 191,861 common shares at an aggregate purchase price of $11.3 million during fiscal 2024. We repurchased 181,657 common shares at an aggregate purchase price of $6.6 million during fiscal 2023. We repurchased 240,501 common shares at an aggregate purchase price of $8.5 million during fiscal 2022. As of March 31, 2024, the number of shares available to be purchased under the share repurchase program was 937,487.
Note 11 — Retirement Plans
Company Sponsored Plans. The majority of our non-bargaining unit employees are eligible to participate in a company-sponsored profit sharing plan. Contributions are made at our discretion subject to a maximum amount allowed under the Internal Revenue Code (“IRC”). The profit sharing plan contribution level for each employee depends upon date of hire, and was 2.5% or 5.0% of each employee’s eligible compensation for fiscal 2024, 2023 and 2022. We also have in place a retirement plan covering our collective bargaining unit employees. The retirement plan provides for a contribution of 2.5% or 5.0% of each employee’s eligible annual wages depending on their hire date. In addition to the employer contributions described above, both the profit sharing plan and the retirement plan include a 401(k) plan that allows employees to contribute pre-tax earnings up to the maximum amount allowed under the IRC, with an employer match of up to 5% of the employee’s eligible compensation.
We have two employee stock ownership plans (“ESOPs”), one covering the majority of our non-bargaining unit employees and the other covering our collective bargaining unit employees. Contributions to the plan covering our non-bargaining unit employees are made at our discretion. Contributions to both plans are subject to a maximum amount allowed under the IRC, and were 2.5% or 5.0% of each employee’s eligible wages, depending on each eligible employee’s hire date, for fiscal 2024, 2023 and 2022.
HAWKINS, INC.
NOTES TO CONSOLIDATED FINANCIAL STATEMENTS — (Continued)
We have a nonqualified deferred compensation plan covering employees who are classified as “highly compensated employees” as determined by IRS guidelines for the plan year and who were hired on or before April 1, 2012. Employees who are eligible for the nonqualified deferred compensation plan for any plan year are not eligible for the profit sharing plan contribution or the ESOP contributions described above for that plan year. Our contribution to the nonqualified deferred compensation plan for fiscal 2024, 2023 and 2022 was 10% of each employee’s eligible compensation, subject to the maximum amount allowed under the IRC.
We have an employee stock purchase plan (“ESPP”) covering substantially all of our employees. The ESPP allows employees to purchase newly-issued shares of the Company’s common shares at a discount from market. The number of new shares issued under the ESPP was 61,981 in fiscal 2024, 65,597 in fiscal 2023 and 71,692 in fiscal 2022.
The following represents the contribution expense for these company-sponsored plans for fiscal 2024, 2023 and 2022: | | | | | | | | | | | | | | | | | | | | | | | |
| (In thousands) | | 2024 | | 2023 | | 2022 | |
| | | | | | | |
| Non-bargaining unit employee plans: | | | | | | | |
| Profit sharing | | $ | 2,340 | | | $ | 1,067 | | | $ | 1,056 | | |
| 401(k) matching contributions | | 3,564 | | | 3,247 | | | 3,122 | | |
| ESOP | | 2,340 | | | 1,067 | | | 1,056 | | |
| Nonqualified deferred compensation plan | | 2,060 | | | 1,633 | | | 1,355 | | |
| Bargaining unit employee plans | | 652 | | | 618 | | | 589 | | |
| ESPP - all employees | | 689 | | | 619 | | | 549 | | |
| Total contribution expense | | $ | 11,645 | | | $ | 8,251 | | | $ | 7,727 | | |
In 2013, we withdrew from a collectively bargained multiemployer pension plan and recorded a liability for our share of the unfunded vested benefits. Payments of approximately $0.5 million per year are being made through 2034.
Note 12 — Commitments and Contingencies
Litigation. As of March 31, 2024, there were no material pending legal proceedings, other than ordinary routine litigation incidental to the business, to which we or any of our subsidiaries are a party or of which any of our property is the subject. Legal fees associated with such matters are expensed as incurred.
Environmental Remediation. In the fourth quarter of fiscal 2024, we recorded a liability of $7.7 million related to estimated remediation expenses associated with perchlorinated biphenyls ("PCBs") discovered in the soil at our Rosemount, MN facility during our expansion project. This expense was recorded as an operating expense within cost of goods sold in our Consolidated Statements of Income. We acquired the property, which had prior heavy industrial use, in fiscal 2012. While the source of the PCBs is unknown, we have never brought PCBs onto the property or used PCBs on the site. The liability is not discounted as management expects to incur these expenses within the next twelve months. Given the many uncertainties involved in assessing environmental claims, our reserves may prove to be insufficient. While it is possible that additional expense related to the remediation will be incurred in future periods if currently unknown issues arise, we are unable to estimate the extent of any further financial impact.
Asset Retirement Obligations. We have three leases of land which contain terms that state that at the end of the lease term, we have a specified amount of time to remove the property and buildings. Including available lease extensions, these leases expire in 2024, 2033 and 2044. At that time, anything that remains on the land becomes the property of the lessor, and the lessor has the option to either maintain the property or remove the property at our expense. We have not been able to reasonably estimate the fair value of the asset retirement obligations, primarily due to the combination of the following factors: certain of the leases do not expire in the near future; we have a history of extending the leases with the lessors and currently intend to do so at expiration of the lease periods; the lessors do not have a history of terminating leases with their tenants; and because it is more likely than not that the buildings will have value at the end of the lease life and therefore, may not be removed by either the lessee or the lessor. Therefore, in accordance with accounting guidance related to asset retirement and environmental obligations, we have not recorded an asset retirement obligation as of March 31, 2024. We will continue to monitor the factors surrounding the requirement to record an asset retirement obligation and will recognize the fair value of a liability in the period in which it is incurred and a reasonable estimate can be made.
HAWKINS, INC.
NOTES TO CONSOLIDATED FINANCIAL STATEMENTS — (Continued)
Note 13 — Income Taxes
The provisions for income taxes for fiscal 2024, 2023 and 2022 were as follows: | | | | | | | | | | | | | | | | | | | | |
| | 2024 | | 2023 | | 2022 |
| (In thousands) | | | | | | |
| Federal — current | | $ | 21,872 | | | $ | 15,072 | | | $ | 14,736 | |
| State — current | | 5,369 | | | 7,701 | | | 5,202 | |
| Total current | | 27,241 | | | 22,773 | | | 19,938 | |
| | | | | | |
| Federal — deferred | | (1,146) | | | 704 | | | (1,054) | |
| State — deferred | | (313) | | | (936) | | | (447) | |
| Total deferred | | (1,459) | | | (232) | | | (1,501) | |
| Total provision | | $ | 25,782 | | | $ | 22,541 | | | $ | 18,437 | |
Reconciliations of the provisions for income taxes to the applicable federal statutory income tax rate for fiscal 2024, 2023 and 2022 are listed below. | | | | | | | | | | | | | | | | | | | | |
| | 2024 | | 2023 | | 2022 |
| Statutory federal income tax | | 21.0 | % | | 21.0 | % | | 21.0 | % |
| State income taxes, net of federal deduction | | 5.4 | % | | 6.8 | % | | 5.6 | % |
| | | | | | |
| | | | | | |
| | | | | | |
| Other — net | | (0.9) | % | | (0.5) | % | | (0.3) | % |
| Total | | 25.5 | % | | 27.3 | % | | 26.3 | % |
The tax effects of items comprising our net deferred tax liability as of March 31, 2024 and April 2, 2023 are as follows: | | | | | | | | | | | | | | |
| (In thousands) | | 2024 | | 2023 |
| Deferred tax assets: | | | | |
| Trade receivables | | $ | 96 | | | $ | 51 | |
| Stock compensation accruals | | 2,224 | | | 2,027 | |
| Pension withdrawal liability | | 1,056 | | | 1,155 | |
| Lease liability | | 3,242 | | | 2,820 | |
| Inventories | | 2,645 | | | 2,437 | |
| Other | | 5,963 | | | 3,335 | |
| Total deferred tax assets | | $ | 15,226 | | | $ | 11,825 | |
| Deferred tax liabilities: | | | | |
| | | | |
| Prepaid expenses | | $ | (1,119) | | | $ | (1,089) | |
| Excess of tax over book depreciation | | (18,428) | | | (16,360) | |
| Intangible assets | | (13,771) | | | (14,334) | |
| ROU asset | | (3,162) | | | (2,754) | |
| Unrealized gain on interest rate swap | | (1,152) | | | (1,087) | |
| Total deferred tax liabilities | | $ | (37,632) | | | $ | (35,624) | |
| Net deferred tax liabilities | | $ | (22,406) | | | $ | (23,799) | |
As of March 31, 2024, the Company has determined that it is more likely than not that the deferred tax assets at March 31, 2024 will be realized either through future taxable income or reversals of taxable temporary differences.
We are subject to U.S. federal income tax as well as income tax of multiple state jurisdictions. The tax years prior to our fiscal year ended March 28, 2021 are closed to examination by the Internal Revenue Service, and with few exceptions, state and local income tax jurisdictions.
HAWKINS, INC.
NOTES TO CONSOLIDATED FINANCIAL STATEMENTS — (Continued)
Note 14 – Leases
Lease Obligations. As of March 31, 2024, we were obligated under operating lease agreements for certain manufacturing facilities, warehouse space, the land on which some of our facilities sit, vehicles and information technology equipment. Our leases have remaining lease terms of 1 year to 21 years, some of which include options to extend the lease for up to 15 years.
As of March 31, 2024 and April 2, 2023, our operating lease components with initial or remaining terms in excess of one year were classified on the consolidated balance sheet within right-of-use assets, short-term lease liability and long-term lease liability.
Total lease expense was $4.0 million for the twelve months ended March 31, 2024 and $3.1 million for the twelve months ended April 2, 2023, and includes leases less than 12 months in duration.
Other information related to our operating leases was as follows: | | | | | | | | | | | |
| March 31, 2024 | | April 2, 2023 |
| Lease Term and Discount Rate | | | |
| Weighted average remaining lease term (years) | 6.48 | | 7.84 |
| Weighted average discount rate | 4.0 | % | | 2.8 | % |
Maturities of lease liabilities as of March 31, 2024 were as follows: | | | | | | | | |
| (In thousands) | | Operating Leases |
| Fiscal 2025 | | $ | 2,870 | |
| Fiscal 2026 | | 2,548 | |
| Fiscal 2027 | | 2,079 | |
| Fiscal 2028 | | 1,819 | |
| Fiscal 2029 | | 1,475 | |
| Thereafter | | 2,819 | |
| Total | | $ | 13,610 | |
| Less: Interest | | (1,602) | |
| Present value of lease liabilities | | $ | 12,008 | |
HAWKINS, INC.
NOTES TO CONSOLIDATED FINANCIAL STATEMENTS — (Continued)
Note 15 — Segment Information
We have three reportable segments: Industrial, Water Treatment and Health and Nutrition. The accounting policies of the segments are the same as those described in the summary of significant accounting policies. Product costs and expenses for each segment are based on actual costs incurred along with cost allocations of shared and centralized functions.
We evaluate performance based on operating income. Reportable segments are defined primarily by product and type of customer. Segments are responsible for the sales, marketing and development of their products and services. Other than our Health and Nutrition segment, the segments do not have separate customer service or purchasing functions. There are no intersegment sales and no operating segments have been aggregated.
| | | | | | | | | | | | | | | | | | | | | | | | | | |
| Reportable Segments | | Industrial | | Water
Treatment | | Health and Nutrition | | Total |
| (In thousands) | | | | | | | | |
| Fiscal Year Ended March 31, 2024: | | | | | | | | |
| Sales | | $ | 409,465 | | | $ | 363,289 | | | $ | 146,408 | | | $ | 919,162 | |
| Gross profit | | 67,545 | | | 98,498 | | | 27,593 | | | 193,636 | |
| Selling, general, and administrative expenses | | 28,316 | | | 45,286 | | | 15,998 | | | 89,600 | |
| Operating income | | 39,229 | | | 53,212 | | | 11,595 | | | 104,036 | |
| Identifiable assets* | | $ | 239,586 | | | $ | 255,188 | | | $ | 134,915 | | | $ | 629,689 | |
| Capital expenditures | | $ | 24,280 | | | $ | 15,739 | | | $ | 132 | | | $ | 40,151 | |
| Fiscal Year Ended April 2, 2023: | | | | | | | | |
| Sales | | $ | 470,760 | | | $ | 304,925 | | | $ | 159,413 | | | $ | 935,098 | |
| Gross profit | | 68,115 | | | 67,208 | | | 29,796 | | | 165,119 | |
| Selling, general, and administrative expenses | | 25,703 | | | 35,734 | | | 15,532 | | | 76,969 | |
| Operating income | | 42,412 | | | 31,474 | | | 14,264 | | | 88,150 | |
| Identifiable assets* | | $ | 253,436 | | | $ | 155,430 | | | $ | 155,626 | | | $ | 564,492 | |
| Capital expenditures | | $ | 31,635 | | | $ | 16,311 | | | $ | 375 | | | $ | 48,321 | |
| Fiscal Year Ended April 3, 2022: | | | | | | | | |
| Sales | | $ | 386,938 | | | $ | 228,133 | | | $ | 159,470 | | | $ | 774,541 | |
| Gross profit | | 59,606 | | | 54,571 | | | 32,343 | | | 146,520 | |
| Selling, general, and administrative expenses | | 28,127 | | | 31,357 | | | 15,842 | | | 75,326 | |
| Operating income | | 31,479 | | | 23,214 | | | 16,501 | | | 71,194 | |
| Identifiable assets* | | $ | 236,934 | | | $ | 143,889 | | | $ | 167,034 | | | $ | 547,857 | |
| Capital expenditures | | $ | 18,812 | | | $ | 8,939 | | | $ | 761 | | | $ | 28,512 | |
* Unallocated assets not included, consisting primarily of cash and cash equivalents, prepaid expenses, and non-qualified deferred compensation plan assets of $28.2 million at March 31, 2024, $26.0 million at April 2, 2023 and $19.5 million at April 3, 2022
ITEM 9. CHANGES IN AND DISAGREEMENTS WITH ACCOUNTANTS ON ACCOUNTING AND FINANCIAL DISCLOSURE
None.
ITEM 9A. CONTROLS AND PROCEDURES
Evaluation of Disclosure Controls and Procedures
As of the end of the period covered by this Annual Report on Form 10-K, we conducted an evaluation, under supervision and with the participation of management, including the chief executive officer and chief financial officer, of the effectiveness of the design and operation of our disclosure controls and procedures pursuant to Rules 13a-15(f) and 15d-15(f) of the Exchange Act. Based upon that evaluation, our chief executive officer and chief financial officer concluded that our disclosure controls and procedures are effective. Disclosure controls and procedures are defined by Rules 13a-15(e) and 15d-15(e) of the Exchange Act as controls and other procedures that are designed to ensure that information required to be disclosed by us in reports filed with the SEC under the Exchange Act is recorded, processed, summarized and reported within the time periods specified in the SEC’s rules and forms. Disclosure controls and procedures include, without limitation, controls and procedures designed to ensure that information required to be disclosed by us in reports filed under the Exchange Act is accumulated and communicated to our management, including our principal executive and principal financial officers, or person performing similar functions, as appropriate to allow timely decisions regarding required disclosure.
Management’s Report on Internal Control Over Financial Reporting
Our management is responsible for establishing and maintaining adequate internal control over financial reporting as defined in Rules 13a-15(f) and 15d-15(f) of the Securities Exchange Act. Our internal control over financial reporting is designed to provide reasonable assurance regarding the reliability of financial reporting and the preparation of financial statements for external purposes in accordance with generally accepted accounting principles. Our internal control over financial reporting includes those policies and procedures that (1) pertain to maintenance of records that, in reasonable detail, accurately and fairly reflect the transactions and dispositions of our assets; (2) provide reasonable assurance that transactions are recorded as necessary to permit preparation of the financial statements in accordance with generally accepted accounting principles, and that our receipts and expenditures are being made only in accordance with authorizations of our management and directors; and (3) provide reasonable assurance regarding prevention or timely detection of unauthorized acquisition, use or disposition of our assets that could have a material effect on the financial statements.
Because of its inherent limitations, internal control over financial reporting may not prevent or detect misstatements. Projections of any evaluation of the effectiveness of internal control over financial reporting to future periods are subject to the risk that the controls may become inadequate because of changes in conditions, or that the degree of compliance with the policies or procedures may deteriorate.
Management assessed the effectiveness of our internal control over financial reporting as of March 31, 2024, based on the criteria described in Internal Control - Integrated Framework (2013) issued by the Committee of Sponsoring Organizations of the Treadway Commission. In making this assessment as of March 31, 2024, we have excluded the water treatment operations acquired from Water Solutions and Miami Products in October 2023 and Industrial Research acquired in March 2024. The financial statements of these businesses comprise less than 15% of total assets and less than 2% of total revenues in our consolidated financial amounts as of and for the year ended March 31, 2024. We have excluded these businesses because we have not had sufficient time to make an assessment of their internal controls using the COSO criteria in accordance with Section 404 of the Sarbanes-Oxley Act of 2002. In excluding these businesses from our assessment, we have considered the “Frequently Asked Questions” as set forth by the office of the Chief Accountant and the Division of Corporate Finance on June 24, 2004, as revised on September 24, 2007, which acknowledges that it may not be possible to conduct an assessment of an acquired business’s internal control over financial reporting in the period between the consummation date and the date of management’s assessment and contemplates that such business would be excluded from management’s assessment in the year of acquisition. Based on this assessment, management believes that our internal control over financial reporting was effective as of March 31, 2024.
Our independent registered public accounting firm has issued an attestation report on our internal control over financial reporting for March 31, 2024 which is included in the Report of Independent Registered Public Accounting Firm in Item 8 of this Annual Report on 10-K.
Changes in Internal Control Procedures
There was no change in our internal control over financial reporting during the fourth quarter of fiscal 2024 that has materially affected, or is reasonably likely to materially affect, our internal control over financial reporting.
ITEM 9B. OTHER INFORMATION
None of the Company’s directors or officers (as defined in Rule 16a-1(f) of the Exchange Act) adopted, modified or terminated any contract, instruction, or written plan for the purchase or sale of the Company’s securities that was intended to satisfy the affirmative defense conditions of Rule 10b5-1(c) of the Exchange Act or any non-Rule 10b5-1 trading arrangement (as defined in Item 408(c) of Regulation S-K) during the quarter ended March 31, 2024.
ITEM 9C. DISCLOSURE REGARDING FOREIGN JURISDICTIONS THAT PREVENT INSPECTIONS
Not Applicable.
PART III
Certain information required by Part III is incorporated by reference from Hawkins’ definitive Proxy Statement for the Annual Meeting of Shareholders to be held on July 31, 2024 (the “2024 Proxy Statement”). Except for those portions specifically incorporated in this Form 10-K by reference to the 2024 Proxy Statement, no other portions of the 2024 Proxy Statement are deemed to be filed as part of this Form 10-K.
ITEM 10. DIRECTORS, EXECUTIVE OFFICERS, AND CORPORATE GOVERNANCE
Information about our Executive Officers
Our current executive officers, their ages and offices held, are set forth below: | | | | | | | | | | | | | | |
| Name | | Age | | Office |
| Patrick H. Hawkins | | 53 | | Chief Executive Officer and President |
| Jeffrey P. Oldenkamp | | 51 | | Executive Vice President, Chief Financial Officer and Treasurer |
| Richard G. Erstad | | 60 | | Vice President, General Counsel and Secretary |
| Drew M. Grahek | | 54 | | Vice President — Operations |
| Douglas A. Lange | | 54 | | Vice President — Water Treatment Group |
| David J. Mangine | | 66 | | Vice President — Industrial Group |
| Shirley A. Rozeboom | | 62 | | Vice President — Health and Nutrition |
Patrick H. Hawkins has been our Chief Executive Officer and President and member of our board since 2011. Mr. Hawkins has held the position of President since 2010. He joined the Company in 1992 and served as the Business Director - Food and Pharmaceuticals, a position he held from 2009 to 2010. Previously he served as Business Manager - Food and Co-Extrusion Products from 2007 to 2009 and Sales Representative - Food Ingredients from 2002 to 2007. He previously served the Company in various other capacities, including Plant Manager, Quality Director and Technical Director.
Jeffrey P. Oldenkamp has been our Executive Vice President, Chief Financial Officer and Treasurer since October 2021. Mr. Oldenkamp joined Hawkins in May 2017 and assumed the role of Chief Financial Officer, Vice President and Treasurer in June 2017. Prior to joining Hawkins, Mr. Oldenkamp was with MTS Systems Corporation, a supplier of high-performance test systems and sensors, where he served as Chief Financial Officer from 2015 to May 2017 and as Vice President of Finance for the MTS Test business from 2014 to 2015, and with Nilfisk-Advance, Inc., a global manufacturer of professional cleaning equipment, where he served as Americas Operations Chief Financial Officer and Vice President from 2012 to 2014.
Richard G. Erstad has been our Vice President, General Counsel and Secretary since 2008. Mr. Erstad was General Counsel and Secretary of BUCA, Inc., a restaurant company, from 2005 to 2008. Mr. Erstad had previously been an attorney with the corporate group of Faegre & Benson LLP, a law firm, from 1996 to 2005, where his practice focused on securities law and mergers and acquisitions. He is a member of the Minnesota Bar.
Drew M. Grahek has been our Vice President - Operations since September 2018. Prior to joining Hawkins, Mr. Grahek was Adjunct Faculty at the University of Minnesota College of Continuing Education and a Business Administrator in the Archdiocese of St. Paul and Minneapolis from June 2017 to June 2018; Director of Service Operations and Supply Chain with Ulta Beauty, Inc. from April 2016 to June 2017; and Director of Stores with Field and Stream Outdoor Stores, a division of Dick’s Sporting Goods, Inc. from July 2015 to April 2016. Previously, he spent a total of 23 years at Target Corporation in a variety of operations, merchandising and property management positions.
Douglas A. Lange has been our Vice President - Water Treatment Group since June 2020. Prior to attaining this position, Mr. Lange served the Company as General Manager and Product Development Manager for the Water Treatment Group after joining the company in January 2019. Prior to joining the Company, Mr. Lange was with H.B. Fuller Company, a global supplier of special adhesives, where he served as Global Marketing Manager and Product Manager for specialty markets in electronics and wood products from 2011 to January 2019. Mr. Lange served in various roles in the specialty adhesives market for a total of 21 years prior to joining the Company.
David J. Mangine has been our Vice President - Industrial Group since 2021. Prior to attaining this position, Mr. Mangine served as the Industrial Sales Manager from 2011 to 2021, after joining Hawkins in 2000 as an Account Manager.
Shirley A. Rozeboom has been our Vice President - Health and Nutrition since 2019. Prior to attaining this position, Ms. Rozeboom held the position of Senior Vice President of Sales for Stauber from 2012 to 2019, Director of Sales from 2008 to 2012 and Account Executive from 2000 to 2008.
The disclosure under the headings “Election of Directors,” “Corporate Governance,” and, if applicable, “Delinquent Section 16(a) Reports” of the 2024 Proxy Statement is incorporated herein by reference.
We have adopted a Code of Business Conduct and Ethics that applies to all of our directors and employees, including our principal executive officer, principal financial officer, controller and other persons performing similar functions. We have posted the Code of Business Conduct and Ethics on our website located at www.hawkinsinc.com. Hawkins’ Code of Business Conduct and Ethics is also available in print to any shareholder who requests it in writing from our Corporate Secretary. We intend to post on our website any amendment to, or waiver from, a provision of our Code of Business Conduct and Ethics that applies to our principal executive officer, principal financial officer, controller and other persons performing similar functions within four business days following the date of such amendment or waiver. We are not including the information contained on our website as part of, or incorporating it by reference into, this report.
ITEM 11. EXECUTIVE COMPENSATION
The disclosure under the heading “Compensation of Executive Officers and Directors” in the 2024 Proxy Statement is incorporated herein by reference.
ITEM 12. SECURITY OWNERSHIP OF CERTAIN BENEFICIAL OWNERS AND MANAGEMENT AND RELATED STOCKHOLDER MATTERS
The disclosure under the headings “Security Ownership of Management and Beneficial Ownership” and “Equity Compensation Plan Information” in the 2024 Proxy Statement is incorporated herein by reference.
ITEM 13. CERTAIN RELATIONSHIPS AND RELATED TRANSACTIONS, AND DIRECTOR INDEPENDENCE
The disclosure under the headings “Election of Directors” and “Related Party Transactions” of the 2024 Proxy Statement is incorporated herein by reference.
ITEM 14. PRINCIPAL ACCOUNTANT FEES AND SERVICES
The disclosure under the heading “Independent Registered Public Accounting Firm’s Fees” of the 2024 Proxy Statement is incorporated herein by reference.
PART IV
ITEM 15. EXHIBITS AND FINANCIAL STATEMENT SCHEDULES | | | | | | | | |
| (a)(1) | | FINANCIAL STATEMENTS OF THE COMPANY |
| |
| | The following financial statements of Hawkins, Inc. are filed as part of this Annual Report on Form 10-K: |
| |
| | Reports of Independent Registered Public Accounting Firms. |
| |
| | Consolidated Balance Sheets at March 31, 2024 and April 2, 2023. |
| |
| | Consolidated Statements of Income for the fiscal years ended March 31, 2024, April 2, 2023 and April 3, 2022. |
| |
| | Consolidated Statements of Comprehensive Income for the fiscal years ended March 31, 2024, April 2, 2023 and April 3, 2022. |
| |
| | Consolidated Statements of Shareholders’ Equity for the fiscal years ended March 31, 2024, April 2, 2023, and April 3, 2022. |
| |
| | Consolidated Statements of Cash Flows for the fiscal years ended March 31, 2024, April 2, 2023, and April 3, 2022. |
| | |
| | Notes to Consolidated Financial Statements. |
| |
| (a)(2) | | FINANCIAL STATEMENT SCHEDULES OF THE COMPANY |
| |
| | The additional financial data listed below is included as a schedule to this Annual Report on Form 10-K and should be read in conjunction with the financial statements presented in Part II, Item 8. Schedules not included with this additional financial data have been omitted because they are not required, or the required information is included in the financial statements or the notes. |
| |
| | The following financial statement schedule for the fiscal years 2024, 2023 and 2022. |
| |
| | Schedule II — Valuation and Qualifying Accounts. |
| |
| (a)(3) | | EXHIBITS |
| |
Exhibit Index
| | | | | | | | | | | | | | |
| Exhibit | | Description | | Method of Filing |
| | |
| 3.1 | | | | | Incorporated by Reference |
| | |
| 3.2 | | | | | Incorporated by Reference |
| | |
| 4.1 | | | | | Incorporated by Reference |
| | |
| 10.1* | | | | Incorporated by Reference |
| | |
| 10.2* | | | | Incorporated by Reference |
| | |
| 10.3* | | | | Incorporated by Reference |
| | | | |
| 10.4 | | | | | Incorporated by Reference |
| | |
| 10.5 | | | | | Incorporated by Reference |
| | | | |
| 10.6* | | | | Incorporated by Reference |
| | | | |
| 10.7* | | | | Incorporated by Reference |
| | | | |
| 10.8* | | | | Incorporated by Reference |
| | | | |
| 21 | | | | | Filed Electronically |
| | | | |
| 23.1 | | | | | Filed Electronically |
| | |
| 24.1 | | | | | Filed Electronically |
| | | | |
| 31.1 | | | | | Filed Electronically |
| | |
| 31.2 | | | | | Filed Electronically |
| | |
| 32.1 | | | | | Filed Electronically |
| | |
| 32.2 | | | | | Filed Electronically |
| | |
| 97 | | | | | Filed Electronically |
| | | | |
| 101 | | | Financial statements from the Annual Report on Form 10-K of Hawkins, Inc. for the period ended March 31, 2024, filed with the SEC on May 15, 2024, formatted in Inline Extensible Business Reporting Language (iXBRL): (i) the Consolidated Balance Sheets at March 31, 2024 and April 2, 2023, (ii) the Consolidated Statements of Income for the fiscal years ended March 31, 2024, April 2, 2023, and April 3, 2022, (iii) the Consolidated Statements of Comprehensive Income for the fiscal years ended March 31, 2024, April 2, 2023, and April 3, 2022, (iv) the Consolidated Statements of Shareholders’ Equity for the fiscal years ended March 31, 2024, April 2, 2023, and April 3, 2022, (v) Consolidated Statements of Cash Flows for the fiscal years ended March 31, 2024, April 2, 2023, and April 3, 2022, and (iv) Notes to Consolidated Financial Statements. | | Filed Electronically |
| | | | |
| 104 | | | Cover Page Interactive Data File (embedded within the inline XBRL document) | | Filed Electronically |
| | | | | |
| * | Management contract or compensation plan or arrangement required to be filed as an exhibit to this Annual Report on Form 10-K. |
(1)Incorporated by reference to Exhibit 3.2 to the Company’s Current Report on Form 8-K dated February 26, 2021 and filed March 2, 2021.
(2)Incorporated by reference to Exhibit 3.1 to the Company’s Current Report on Form 8-K dated October 28, 2009 and filed November 3, 2009.
(3)Incorporated by reference to Exhibit 4.1 to the Company’s Annual Report on Form 10-K filed June 2,2021.
(4)Incorporated by reference to Exhibit 10.1 to the Company’s Registration Statement on Form S-8 filed June 6, 2011.
(5)Incorporated by reference to Exhibit 10.1 to the Company’s Quarterly Report on Form 10-Q for the quarterly period ended July 3, 2011.
(6)Incorporated by reference to Exhibit 99.1 to the Company’s Registration Statement on Form S-8 filed November 2, 2018.
(7)Incorporated by reference to Exhibit 10.4 to the Company’s Annual Report on Form 10-K filed May 17, 2023.
(8)Incorporated by reference to Exhibit 10.1 to the Company’s Registration Statement on Form 8-K filed December 3, 2018.
(9)Incorporated by reference to Exhibit 10.3 to the Company’s Quarterly Report on Form 10-Q for the quarterly period ended September 29, 2019.
(10)Incorporated by reference to Exhibit 10.10 to the Company’s Annual Report on Form 10-K filed May 20,2020.
(11)Incorporated by reference to Exhibit 10.7 to the Company’s Annual Report on Form 10-K filed June 2,2021.
ITEM 16. FORM 10-K SUMMARY
None
SIGNATURES
Pursuant to the requirements of Section 13 or 15(d) of the Securities Exchange Act of 1934, the registrant has duly caused this report to be signed on its behalf by the undersigned, thereunto duly authorized. | | | | | | | | | | | | | | | | | |
| | | HAWKINS, INC. |
| | | |
| | | By | | /s/ Patrick H. Hawkins |
| | | | | Patrick H. Hawkins
Chief Executive Officer and President |
| Dated: | May 15, 2024 | | | | |
Pursuant to the requirements of the Securities Exchange Act of 1934, this report has been signed by the following persons on behalf of the registrant in the capacities and on the dates indicated. | | | | | | | | | | | | | | |
| Signature | | Title | | Date |
| | | | |
| /s/ Patrick H. Hawkins | | | | May 15, 2024 |
| Patrick H. Hawkins | | Chief Executive Officer, President and Director | | |
| | (principal executive officer) | | |
| | | | |
| /s/ Jeffrey P. Oldenkamp | | | | May 15, 2024 |
| Jeffrey P. Oldenkamp | | Executive Vice President and Chief Financial Officer | | |
| | (principal financial officer and principal accounting officer) | | |
| | | | |
| * | | Director | | May 15, 2024 |
| James A. Faulconbridge | | | | |
| | | | |
| * | | Director | | May 15, 2024 |
| Mary J. Schumacher | | | | |
| | | | |
| * | | Director | | May 15, 2024 |
| Jeffrey E. Spethmann | | | | |
| | | | |
| * | | Director | | May 15, 2024 |
| Daniel J. Stauber | | | | |
| | | | |
| * | | Director | | May 15, 2024 |
| Yi "Faith" Tang | | | | |
| | | | |
| * | | Director | | May 15, 2024 |
| James T. Thompson | | | | |
| | | | |
| * | | Director | | May 15, 2024 |
| Jeffrey L. Wright | | | | |
* Patrick H. Hawkins, by signing his name hereto, does hereby sign this document on behalf of each of the above-named directors of the registrant pursuant to Powers of Attorney duly executed by such persons.
| | | | | | | | |
| By: | /s/ Patrick H. Hawkins |
| | Patrick H. Hawkins |
| | Attorney-in-fact |
SCHEDULE II
HAWKINS, INC.
VALUATION AND QUALIFYING ACCOUNTS
FOR THE FISCAL YEARS ENDED March 31, 2024, April 2, 2023 AND April 3, 2022
| | | | | | | | | | | | | | | | | | | | | | | | | | | | | | | | |
| | | | | Additions | | | | |
| Description | | Balance at
Beginning
of Year | | Charged to
Costs and
Expenses | | Charged to
Other
Accounts | | Deductions
Write-Offs | | Balance at
End of Year |
| | | (In thousands) |
| Reserve deducted from asset to which it applies: | | | | | | | | | | |
| Fiscal Year Ended March 31, 2024: | | | | | | | | | | |
| Allowance for credit losses | | $ | 190 | | | $ | 166 | | | $ | — | | | $ | — | | | $ | 356 | |
| Fiscal Year Ended April 2, 2023: | | | | | | | | | | |
| Allowance for credit losses | | $ | 367 | | | $ | — | | | $ | — | | | $ | (177) | | | $ | 190 | |
| Fiscal Year Ended April 3, 2022: | | | | | | | | | | |
| Allowance for credit losses | | $ | 497 | | | $ | — | | | $ | — | | | $ | (130) | | | $ | 367 | |