UNITED STATES
SECURITIES AND EXCHANGE COMMISSION
Washington, D.C. 20549
FORM N-CSR
CERTIFIED SHAREHOLDER REPORT OF REGISTERED
MANAGEMENT INVESTMENT COMPANIES
Investment Company Act file number 811- 2402
John Hancock Sovereign Bond Fund
(Exact name of registrant as specified in charter)
200 Berkeley Street, Boston, Massachusetts 02116
(Address of principal executive offices) (Zip code)
Salvatore Schiavone
Treasurer
200 Berkeley Street
Boston, Massachusetts 02116
(Name and address of agent for service)
Registrant's telephone number, including area code: 617-663-4497
| Date of fiscal year end: | May 31 | |
| Date of reporting period: | November 30, 2019 |
ITEM 1. REPORTS TO STOCKHOLDERS.
John Hancock
Bond Fund
Semiannual report
11/30/19
Beginning on January 1, 2021, as permitted by regulations adopted by the Securities and Exchange Commission, paper copies of the fund's shareholder reports like this one will no longer be sent by mail, unless you specifically request paper copies of the reports from the fund or from your financial intermediary. Instead, the reports will be made available on a website, and you will be notified by mail each time a report is posted and provided with a website link to access the report.
If you already elected to receive shareholder reports electronically, you will not be affected by this change, and you do not need to take any action. You may elect to receive shareholder reports and other communications electronically by calling John Hancock Investment Management at 800-225-5291 (Class A, Class B and Class C shares) or 888-972-8696 (Class I, Class R2, Class R4 and Class R6 shares) or by contacting your financial intermediary.
You may elect to receive all reports in paper, free of charge, at any time. You can inform John Hancock Investment Management or your financial intermediary that you wish to continue receiving paper copies of your shareholder reports by following the instructions listed above. Your election to receive reports in paper will apply to all funds held with John Hancock Investment Management or your financial intermediary.


A message to shareholders
Dear shareholder,
It was a volatile time for bond investors during the six months ended November 30, 2019, although most market segments delivered attractive absolute returns for the period. Uncertainty surrounding trade with China, the impeachment inquiry against President Trump, and the broader health of the global economy led to some dramatic swings in performance. The trend in longer-term yields was decidedly downward, leading to several periods where the U.S. Treasury yield curve was inverted. Three times in 2019—in July, September, and October—the U.S. Federal Reserve stepped in with reductions in short-term interest rates in an attempt to shore up the economy.
While the economic fundamentals in the United States appear fairly solid—with a strong labor market, low inflation and interest rates, and a confident consumer base—the outlook for the global economy is less certain. Subsequent to period end, President Trump was impeached by the House of Representatives; it remains to be seen how the Senate and financial markets will react. We feel confident in saying there are sure to be patches of market turbulence in the months ahead. As always, your best resource in unpredictable markets is your financial advisor, who can help position your portfolio so that it's sufficiently diversified to meet your long-term objectives and to withstand the inevitable bouts of market volatility along the way.
On behalf of everyone at John Hancock Investment Management, I'd like to take this opportunity to welcome new shareholders and thank existing shareholders for the continued trust you've placed in us.
Sincerely,

Andrew G. Arnott
President and CEO,
John Hancock Investment Management
Head of Wealth and Asset Management,
United States and Europe
This commentary reflects the CEO's views as of this report's period end and are subject to change at any time. Diversification does not guarantee investment returns and does not eliminate risk of loss. All investments entail risks, including the possible loss of principal. For more up-to-date information, you can visit our website at jhinvestments.com.
John Hancock
Bond Fund
INVESTMENT OBJECTIVE
The fund seeks a high level of current income consistent with prudent investment risk.
AVERAGE ANNUAL TOTAL RETURNS AS OF 11/30/19 (%)
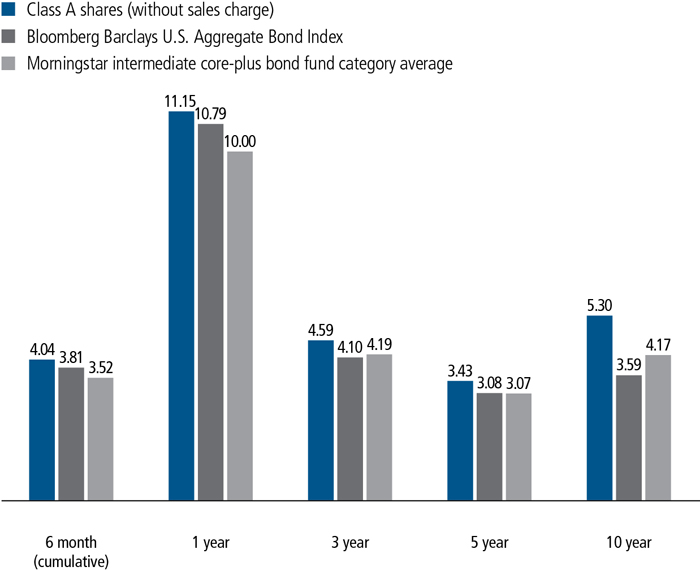
The Bloomberg Barclays U.S. Aggregate Bond Index is an unmanaged index of dollar-denominated and non-convertible investment-grade debt issues.
It is not possible to invest directly in an index. Index figures do not reflect expenses or sales charges, which would result in lower returns.
Figures from Morningstar, Inc. include reinvested distributions and do not take into account sales charges. Actual load-adjusted performance is lower.
The past performance shown here reflects reinvested distributions and the beneficial effect of any expense reductions, and does not guarantee future results. Returns for periods shorter than one year are cumulative. Performance of the other share classes will vary based on the difference in the fees and expenses of those classes. Shares will fluctuate in value and, when redeemed, may be worth more or less than their original cost. Current month-end performance may be lower or higher than the performance cited, and can be found at jhinvestments.com or by calling 800-225-5291. For further information on the fund's objectives, risks, and strategy, see the fund's prospectus.
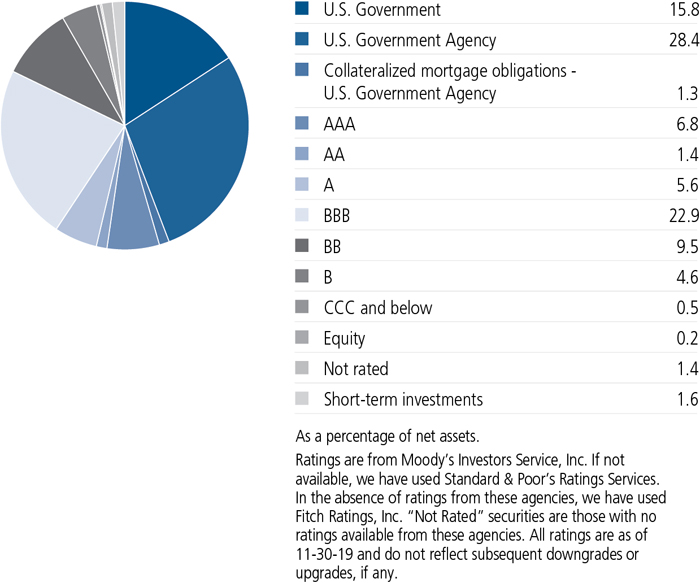
PORTFOLIO COMPOSITION AS OF 11/30/19 (%)

COUNTRY COMPOSITION AS OF 11/30/19 (%)
| United States | 89.8 |
| United Kingdom | 2.4 |
| Netherlands | 1.2 |
| Canada | 1.2 |
| Other countries | 5.4 |
| TOTAL | 100.0 |
| As a percentage of net assets. |
A note about risks
The fund is subject to various risks as described in the fund's prospectus. For more information, please refer to the "Principal risks" section of the prospectus.
QUALITY COMPOSITION AS OF
11/30/19 (%)
TOTAL RETURNS FOR THE PERIOD ENDED
NOVEMBER 30, 2019
| Average annual total returns (%) with maximum sales charge |
Cumulative total returns (%) with maximum sales charge |
SEC 30-day yield (%) subsidized |
SEC 30-day yield (%) unsubsidized1 |
||||||||
| 1-year | 5-year | 10-year | 6-month | 5-year | 10-year | as of 11-30-19 |
as of 11-30-19 |
||||
| Class A | 6.69 | 2.58 | 4.87 | -0.13 | 13.61 | 60.96 | 2.34 | 2.33 | |||
| Class B | 5.38 | 2.36 | 4.71 | -1.32 | 12.39 | 58.43 | 1.74 | 1.73 | |||
| Class C | 9.38 | 2.71 | 4.57 | 2.61 | 14.31 | 56.33 | 1.74 | 1.73 | |||
| Class I2 | 11.54 | 3.76 | 5.66 | 4.19 | 20.24 | 73.50 | 2.73 | 2.72 | |||
| Class R22,3 | 11.03 | 3.35 | 5.28 | 3.99 | 17.91 | 67.26 | 2.33 | 2.32 | |||
| Class R42,3 | 11.38 | 3.61 | 5.40 | 4.12 | 19.42 | 69.13 | 2.59 | 2.48 | |||
| Class R62,3 | 11.58 | 3.88 | 5.69 | 4.24 | 20.98 | 73.95 | 2.84 | 2.83 | |||
| Class NAV2,3 | 11.67 | 3.81 | 5.50 | 4.25 | 20.58 | 70.77 | 2.85 | 2.84 | |||
| Index† | 10.79 | 3.08 | 3.59 | 3.81 | 16.39 | 42.29 | — | — | |||
Performance figures assume all distributions have been reinvested. Figures reflect maximum sales charges on Class A shares of 4.0% and the applicable contingent deferred sales charge (CDSC) on Class B and Class C shares. The returns for Class A shares have been adjusted to reflect the reduction in the maximum sales charge from 4.5% to 4.0%, effective 2-3-14. The Class B shares' CDSC declines annually between years 1 to 6 according to the following schedule: 5%, 4%, 3%, 3%, 2%, 1%. No sales charge will be assessed after the sixth year. Class C shares sold within one year of purchase are subject to a 1% CDSC. Sales charges are not applicable to Class I, Class R2, Class R4, Class R6, and Class NAV shares.
The expense ratios of the fund, both net (including any fee waivers and/or expense limitations) and gross (excluding any fee waivers and/or expense limitations), are set forth according to the most recent publicly available prospectuses for the fund and may differ from those disclosed in the Financial highlights tables in this report. Net expenses reflect contractual expense limitations in effect until September 30, 2020 and are subject to change. Had the contractual fee waivers and expense limitations not been in place, gross expenses would apply. The expense ratios are as follows:
| Class A | Class B | Class C | Class I | Class R2 | Class R4 | Class R6 | Class NAV | |
| Gross (%) | 0.79 | 1.49 | 1.49 | 0.49 | 0.89 | 0.74 | 0.39 | 0.37 |
| Net (%) | 0.78 | 1.48 | 1.48 | 0.48 | 0.88 | 0.63 | 0.38 | 0.36 |
Please refer to the most recent prospectus and annual or semiannual report for more information on expenses and any expense limitation arrangements for each class.
The returns reflect past results and should not be considered indicative of future performance. The return and principal value of an investment will fluctuate so that shares, when redeemed, may be worth more or less than their original cost. Due to market volatility and other factors, the fund's current performance may be higher or lower than the performance shown. For current to the most recent month-end performance data, please call 800-225-5291 or visit the fund's website at jhinvestments.com.
The performance table above and the chart on the next page do not reflect the deduction of taxes that a shareholder would pay on fund distributions or the redemption of fund shares. The fund's performance results reflect any applicable fee waivers or expense reductions, without which the expenses would increase and results would have been less favorable.
| † | Index is the Bloomberg Barclays U.S. Aggregate Bond Index. |
See the following page for footnotes.
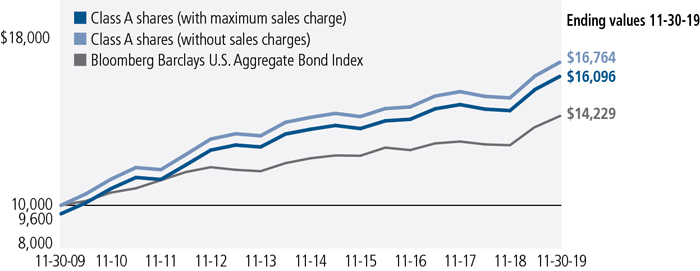
This chart and table show what happened to a hypothetical $10,000 investment in John Hancock Bond Fund for the share classes and periods indicated, assuming all distributions were reinvested. For comparison, we've shown the same investment in the Bloomberg Barclays U.S. Aggregate Bond Index.
| Start date | With maximum sales charge ($) |
Without sales charge ($) |
Index ($) | |
| Class B4 | 11-30-09 | 15,843 | 15,843 | 14,229 |
| Class C4 | 11-30-09 | 15,633 | 15,633 | 14,229 |
| Class I2,3 | 11-30-09 | 17,350 | 17,350 | 14,229 |
| Class R22,3 | 11-30-09 | 16,726 | 16,726 | 14,229 |
| Class R42,3 | 11-30-09 | 16,913 | 16,913 | 14,229 |
| Class R62,3 | 11-30-09 | 17,395 | 17,395 | 14,229 |
| Class NAV2,3 | 11-30-09 | 17,077 | 17,077 | 14,229 |
The values shown in the chart for Class A shares with maximum sales charge have been adjusted to reflect the reduction in the Class A shares' maximum sales charge from 4.5% to 4.0%, which became effective on 2-3-14.
The Bloomberg Barclays U.S. Aggregate Bond Index is an unmanaged index of dollar-denominated and non-convertible investment-grade debt issues.
It is not possible to invest directly in an index. Index figures do not reflect expenses or sales charges, which would result in lower returns.
Footnotes related to performance pages
| 1 | Unsubsidized yield reflects what the yield would have been without the effect of reimbursements and waivers. |
| 2 | For certain types of investors, as described in the fund's prospectuses. |
| 3 | Class R2 shares were first offered 3-1-12; Class R4 shares were first offered 3-27-15; Class R6 shares were first offered 9-1-11; Class NAV shares were first offered 8-31-15. Returns prior to these dates are those of Class A shares that have not been adjusted for class-specific expenses; otherwise, returns would vary. |
| 4 | The contingent deferred sales charge is not applicable. |
| Your expenses |
| SEMIANNUAL REPORT | JOHN HANCOCK BOND FUND | 7 |
| Account
value on 6-1-2019 |
Ending
value on 11-30-2019 |
Expenses
paid during period ended 11-30-20191 |
Annualized
expense ratio | ||
| Class A | Actual expenses/actual returns | $1,000.00 | $1,040.40 | $3.98 | 0.78% |
| Hypothetical example | 1,000.00 | 1,021.10 | 3.94 | 0.78% | |
| Class B | Actual expenses/actual returns | 1,000.00 | 1,036.80 | 7.54 | 1.48% |
| Hypothetical example | 1,000.00 | 1,017.60 | 7.47 | 1.48% | |
| Class C | Actual expenses/actual returns | 1,000.00 | 1,036.10 | 7.53 | 1.48% |
| Hypothetical example | 1,000.00 | 1,017.60 | 7.47 | 1.48% | |
| Class I | Actual expenses/actual returns | 1,000.00 | 1,041.90 | 2.45 | 0.48% |
| Hypothetical example | 1,000.00 | 1,022.60 | 2.43 | 0.48% | |
| Class R2 | Actual expenses/actual returns | 1,000.00 | 1,039.90 | 4.44 | 0.87% |
| Hypothetical example | 1,000.00 | 1,020.70 | 4.40 | 0.87% | |
| Class R4 | Actual expenses/actual returns | 1,000.00 | 1,041.20 | 3.16 | 0.62% |
| Hypothetical example | 1,000.00 | 1,021.90 | 3.13 | 0.62% | |
| Class R6 | Actual expenses/actual returns | 1,000.00 | 1,042.40 | 1.89 | 0.37% |
| Hypothetical example | 1,000.00 | 1,023.20 | 1.87 | 0.37% | |
| Class NAV | Actual expenses/actual returns | 1,000.00 | 1,042.50 | 1.84 | 0.36% |
| Hypothetical example | 1,000.00 | 1,023.20 | 1.82 | 0.36% |
| 1 | Expenses are equal to the annualized expense ratio, multiplied by the average account value over the period, multiplied by 183/366 (to reflect the one-half year period). |
| 8 | JOHN HANCOCK BOND FUND | SEMIANNUAL REPORT |
| Fund’s investments |
| Rate (%) | Maturity date | Par value^ | Value | ||
| U.S. Government and Agency obligations 44.2% | $7,933,986,343 | ||||
| (Cost $7,747,338,579) | |||||
| U.S. Government 15.8% | 2,832,659,434 | ||||
| U.S. Treasury | |||||
| Bond | 2.250 | 08-15-49 | 872,308,000 | 880,622,186 | |
| Bond | 2.750 | 11-15-42 | 317,145,000 | 349,367,427 | |
| Bond | 3.000 | 02-15-47 | 197,535,000 | 229,981,667 | |
| Note (A) | 1.500 | 10-31-24 | 410,905,000 | 408,336,844 | |
| Note | 1.625 | 09-30-26 | 225,430,000 | 223,941,810 | |
| Note (A) | 1.750 | 11-15-29 | 653,766,000 | 652,054,970 | |
| Treasury Inflation Protected Security | 0.250 | 07-15-29 | 87,682,581 | 88,354,530 | |
| U.S. Government Agency 28.4% | 5,101,326,909 | ||||
| Federal Home Loan Mortgage Corp. | |||||
| 15 Yr Pass Thru | 3.000 | 07-01-32 | 75,995,839 | 78,402,893 | |
| 30 Yr Pass Thru | 3.000 | 03-01-43 | 5,633,545 | 5,832,288 | |
| 30 Yr Pass Thru | 3.000 | 04-01-43 | 6,682,358 | 6,882,602 | |
| 30 Yr Pass Thru | 3.000 | 06-01-43 | 2,244,929 | 2,316,410 | |
| 30 Yr Pass Thru | 3.000 | 12-01-45 | 23,234,251 | 23,959,534 | |
| 30 Yr Pass Thru | 3.000 | 05-01-46 | 4,246,080 | 4,379,953 | |
| 30 Yr Pass Thru | 3.000 | 10-01-46 | 7,917,476 | 8,157,206 | |
| 30 Yr Pass Thru | 3.000 | 10-01-46 | 8,225,309 | 8,433,233 | |
| 30 Yr Pass Thru | 3.000 | 10-01-46 | 13,995,987 | 14,389,150 | |
| 30 Yr Pass Thru | 3.000 | 10-01-46 | 96,392,827 | 99,341,590 | |
| 30 Yr Pass Thru | 3.000 | 10-01-46 | 23,859,126 | 24,426,157 | |
| 30 Yr Pass Thru | 3.000 | 11-01-46 | 17,493,283 | 17,984,689 | |
| 30 Yr Pass Thru | 3.000 | 12-01-46 | 82,204,941 | 84,437,101 | |
| 30 Yr Pass Thru | 3.000 | 12-01-46 | 16,828,229 | 17,353,541 | |
| 30 Yr Pass Thru | 3.000 | 04-01-47 | 48,339,836 | 49,667,543 | |
| 30 Yr Pass Thru | 3.000 | 09-01-49 | 32,352,253 | 33,030,139 | |
| 30 Yr Pass Thru | 3.000 | 10-01-49 | 37,438,792 | 38,213,315 | |
| 30 Yr Pass Thru | 3.500 | 02-01-41 | 14,759,688 | 15,574,710 | |
| 30 Yr Pass Thru | 3.500 | 01-01-42 | 1,517,176 | 1,602,851 | |
| 30 Yr Pass Thru | 3.500 | 05-01-42 | 1,361,134 | 1,432,042 | |
| 30 Yr Pass Thru | 3.500 | 06-01-42 | 5,632,664 | 5,926,094 | |
| 30 Yr Pass Thru | 3.500 | 08-01-42 | 1,468,135 | 1,544,616 | |
| 30 Yr Pass Thru | 3.500 | 09-01-42 | 1,844,292 | 1,939,793 | |
| 30 Yr Pass Thru | 3.500 | 04-01-44 | 6,560,978 | 6,943,775 | |
| 30 Yr Pass Thru | 3.500 | 05-01-45 | 14,932,013 | 15,686,558 | |
| 30 Yr Pass Thru | 3.500 | 01-01-46 | 1,858,253 | 1,951,573 | |
| 30 Yr Pass Thru | 3.500 | 08-01-46 | 78,089,479 | 82,303,929 | |
| 30 Yr Pass Thru | 3.500 | 09-01-46 | 20,621,962 | 21,593,143 | |
| 30 Yr Pass Thru | 3.500 | 09-01-46 | 10,802,565 | 11,273,497 | |
| 30 Yr Pass Thru | 3.500 | 10-01-46 | 4,525,951 | 4,723,258 | |
| SEE NOTES TO FINANCIAL STATEMENTS | SEMIANNUAL REPORT | JOHN HANCOCK BOND FUND | 9 |
| Rate (%) | Maturity date | Par value^ | Value | ||
| U.S. Government Agency (continued) | |||||
| 30 Yr Pass Thru | 3.500 | 10-01-46 | 29,151,237 | $30,742,734 | |
| 30 Yr Pass Thru | 3.500 | 11-01-46 | 9,990,272 | 10,460,759 | |
| 30 Yr Pass Thru | 3.500 | 11-01-46 | 9,576,019 | 10,050,937 | |
| 30 Yr Pass Thru | 3.500 | 12-01-46 | 16,144,915 | 16,950,659 | |
| 30 Yr Pass Thru | 3.500 | 01-01-47 | 9,328,544 | 9,826,171 | |
| 30 Yr Pass Thru | 3.500 | 02-01-47 | 15,724,133 | 16,406,671 | |
| 30 Yr Pass Thru | 3.500 | 04-01-47 | 17,195,777 | 18,118,451 | |
| 30 Yr Pass Thru | 3.500 | 09-01-47 | 52,985,577 | 55,613,370 | |
| 30 Yr Pass Thru | 3.500 | 11-01-47 | 44,504,167 | 46,419,270 | |
| 30 Yr Pass Thru | 3.500 | 11-01-47 | 15,484,116 | 16,159,138 | |
| 30 Yr Pass Thru | 3.500 | 11-01-47 | 24,676,256 | 25,583,898 | |
| 30 Yr Pass Thru | 3.500 | 06-01-49 | 55,372,724 | 57,514,824 | |
| 30 Yr Pass Thru | 4.000 | 01-01-41 | 14,845,749 | 15,882,037 | |
| 30 Yr Pass Thru | 4.000 | 03-01-42 | 7,416,773 | 7,927,538 | |
| 30 Yr Pass Thru | 4.000 | 11-01-43 | 4,752,578 | 5,106,603 | |
| 30 Yr Pass Thru | 4.000 | 02-01-44 | 1,876,503 | 2,009,249 | |
| 30 Yr Pass Thru | 4.000 | 07-01-45 | 21,752,808 | 23,339,212 | |
| 30 Yr Pass Thru | 4.000 | 01-01-47 | 13,871,197 | 14,865,467 | |
| 30 Yr Pass Thru | 4.000 | 03-01-47 | 56,416,873 | 59,878,962 | |
| 30 Yr Pass Thru | 4.000 | 03-01-47 | 16,096,301 | 16,883,872 | |
| 30 Yr Pass Thru | 4.000 | 04-01-47 | 24,541,632 | 25,817,007 | |
| 30 Yr Pass Thru | 4.000 | 05-01-47 | 18,673,194 | 19,641,263 | |
| 30 Yr Pass Thru | 4.000 | 10-01-47 | 31,845,532 | 33,455,442 | |
| 30 Yr Pass Thru | 4.000 | 11-01-47 | 24,805,328 | 25,955,457 | |
| 30 Yr Pass Thru | 4.000 | 03-01-48 | 12,711,203 | 13,323,612 | |
| 30 Yr Pass Thru | 4.000 | 07-01-48 | 56,587,682 | 60,060,253 | |
| 30 Yr Pass Thru | 4.000 | 08-01-48 | 34,728,778 | 36,773,129 | |
| 30 Yr Pass Thru | 4.500 | 11-01-39 | 2,040,655 | 2,210,873 | |
| 30 Yr Pass Thru | 4.500 | 02-01-41 | 3,357,297 | 3,633,145 | |
| 30 Yr Pass Thru | 4.500 | 03-01-41 | 2,196,732 | 2,385,461 | |
| 30 Yr Pass Thru | 4.500 | 09-01-41 | 1,370,440 | 1,482,183 | |
| 30 Yr Pass Thru | 4.500 | 10-01-41 | 1,628,843 | 1,761,656 | |
| 30 Yr Pass Thru | 4.500 | 06-01-47 | 19,331,545 | 20,536,285 | |
| 30 Yr Pass Thru | 5.500 | 11-01-39 | 4,258,539 | 4,794,833 | |
| Federal National Mortgage Association | |||||
| 15 Yr Pass Thru | 3.000 | 09-01-27 | 3,617,188 | 3,708,329 | |
| 15 Yr Pass Thru | 3.000 | 09-01-32 | 50,333,431 | 51,869,059 | |
| 15 Yr Pass Thru | 3.500 | 06-01-34 | 4,780,623 | 4,987,042 | |
| 15 Yr Pass Thru | 4.000 | 12-01-24 | 1,426,217 | 1,486,793 | |
| 30 Yr Pass Thru (B) | 3.000 | TBA | 263,405,000 | 267,129,705 | |
| 30 Yr Pass Thru | 3.000 | 07-01-42 | 4,344,644 | 4,489,987 | |
| 30 Yr Pass Thru | 3.000 | 10-01-42 | 8,550,980 | 8,788,940 | |
| 30 Yr Pass Thru | 3.000 | 10-01-42 | 4,327,281 | 4,447,702 | |
| 30 Yr Pass Thru | 3.000 | 12-01-42 | 1,998,932 | 2,062,055 | |
| 10 | JOHN HANCOCK BOND FUND | SEMIANNUAL REPORT | SEE NOTES TO FINANCIAL STATEMENTS |
| Rate (%) | Maturity date | Par value^ | Value | ||
| U.S. Government Agency (continued) | |||||
| 30 Yr Pass Thru | 3.000 | 01-01-43 | 1,503,435 | $1,546,682 | |
| 30 Yr Pass Thru | 3.000 | 03-01-43 | 1,591,087 | 1,646,303 | |
| 30 Yr Pass Thru | 3.000 | 04-01-43 | 2,593,809 | 2,674,907 | |
| 30 Yr Pass Thru | 3.000 | 05-01-43 | 2,253,496 | 2,330,995 | |
| 30 Yr Pass Thru | 3.000 | 06-01-43 | 2,258,011 | 2,324,376 | |
| 30 Yr Pass Thru | 3.000 | 07-01-43 | 25,074,765 | 25,905,762 | |
| 30 Yr Pass Thru | 3.000 | 12-01-45 | 51,294,203 | 52,561,339 | |
| 30 Yr Pass Thru | 3.000 | 08-01-46 | 55,194,113 | 56,712,823 | |
| 30 Yr Pass Thru | 3.000 | 08-01-46 | 40,879,163 | 42,003,985 | |
| 30 Yr Pass Thru | 3.000 | 09-01-46 | 5,300,776 | 5,431,723 | |
| 30 Yr Pass Thru | 3.000 | 10-01-46 | 4,167,239 | 4,270,183 | |
| 30 Yr Pass Thru | 3.000 | 10-01-46 | 36,006,350 | 36,862,069 | |
| 30 Yr Pass Thru | 3.000 | 01-01-47 | 32,625,840 | 33,503,175 | |
| 30 Yr Pass Thru | 3.000 | 02-01-47 | 17,279,902 | 17,809,372 | |
| 30 Yr Pass Thru | 3.000 | 04-01-47 | 175,484,559 | 179,655,090 | |
| 30 Yr Pass Thru | 3.000 | 10-01-47 | 38,357,449 | 39,412,885 | |
| 30 Yr Pass Thru | 3.000 | 11-01-47 | 44,656,954 | 45,885,726 | |
| 30 Yr Pass Thru | 3.000 | 11-01-48 | 153,437,533 | 157,084,099 | |
| 30 Yr Pass Thru | 3.000 | 11-01-48 | 38,048,304 | 38,988,222 | |
| 30 Yr Pass Thru | 3.000 | 12-01-48 | 23,394,794 | 23,936,168 | |
| 30 Yr Pass Thru | 3.000 | 07-01-49 | 53,592,919 | 54,364,164 | |
| 30 Yr Pass Thru | 3.000 | 09-01-49 | 44,498,996 | 45,431,397 | |
| 30 Yr Pass Thru | 3.000 | 09-01-49 | 50,795,699 | 52,066,394 | |
| 30 Yr Pass Thru | 3.000 | 10-01-49 | 33,241,115 | 33,802,584 | |
| 30 Yr Pass Thru | 3.000 | 10-01-49 | 64,183,046 | 65,267,149 | |
| 30 Yr Pass Thru | 3.000 | 10-01-49 | 64,229,146 | 65,815,818 | |
| 30 Yr Pass Thru | 3.000 | 11-01-49 | 130,612,009 | 133,389,578 | |
| 30 Yr Pass Thru | 3.000 | 11-01-49 | 35,239,920 | 36,165,525 | |
| 30 Yr Pass Thru | 3.000 | 11-01-49 | 44,165,139 | 45,228,560 | |
| 30 Yr Pass Thru | 3.000 | 11-01-49 | 38,562,279 | 39,382,337 | |
| 30 Yr Pass Thru | 3.500 | 11-01-40 | 3,166,418 | 3,339,376 | |
| 30 Yr Pass Thru | 3.500 | 06-01-42 | 3,162,063 | 3,324,902 | |
| 30 Yr Pass Thru | 3.500 | 06-01-42 | 277,558 | 291,852 | |
| 30 Yr Pass Thru | 3.500 | 08-01-42 | 5,525,966 | 5,810,540 | |
| 30 Yr Pass Thru | 3.500 | 01-01-43 | 2,543,773 | 2,672,386 | |
| 30 Yr Pass Thru | 3.500 | 02-01-43 | 794,946 | 840,853 | |
| 30 Yr Pass Thru | 3.500 | 05-01-43 | 1,456,705 | 1,539,006 | |
| 30 Yr Pass Thru | 3.500 | 06-01-43 | 19,130,368 | 20,199,232 | |
| 30 Yr Pass Thru | 3.500 | 07-01-43 | 1,479,390 | 1,564,821 | |
| 30 Yr Pass Thru | 3.500 | 07-01-43 | 5,473,092 | 5,778,888 | |
| 30 Yr Pass Thru | 3.500 | 07-01-43 | 5,689,106 | 6,006,972 | |
| 30 Yr Pass Thru | 3.500 | 01-01-45 | 4,551,757 | 4,804,653 | |
| 30 Yr Pass Thru | 3.500 | 04-01-45 | 15,115,340 | 15,879,573 | |
| 30 Yr Pass Thru | 3.500 | 04-01-45 | 4,005,519 | 4,208,038 | |
| SEE NOTES TO FINANCIAL STATEMENTS | SEMIANNUAL REPORT | JOHN HANCOCK BOND FUND | 11 |
| Rate (%) | Maturity date | Par value^ | Value | ||
| U.S. Government Agency (continued) | |||||
| 30 Yr Pass Thru | 3.500 | 04-01-45 | 16,365,675 | $17,193,125 | |
| 30 Yr Pass Thru | 3.500 | 08-01-45 | 20,508,424 | 21,532,514 | |
| 30 Yr Pass Thru | 3.500 | 01-01-46 | 38,804,892 | 40,924,516 | |
| 30 Yr Pass Thru | 3.500 | 02-01-46 | 28,585,569 | 29,861,132 | |
| 30 Yr Pass Thru | 3.500 | 07-01-46 | 34,399,499 | 35,805,496 | |
| 30 Yr Pass Thru | 3.500 | 07-01-46 | 10,770,715 | 11,278,260 | |
| 30 Yr Pass Thru | 3.500 | 08-01-46 | 39,528,707 | 41,465,519 | |
| 30 Yr Pass Thru | 3.500 | 02-01-47 | 45,614,365 | 47,835,105 | |
| 30 Yr Pass Thru | 3.500 | 03-01-47 | 50,119,523 | 52,763,208 | |
| 30 Yr Pass Thru | 3.500 | 05-01-47 | 33,329,772 | 35,119,084 | |
| 30 Yr Pass Thru | 3.500 | 07-01-47 | 63,686,744 | 67,065,969 | |
| 30 Yr Pass Thru | 3.500 | 08-01-47 | 48,730,015 | 51,148,125 | |
| 30 Yr Pass Thru | 3.500 | 09-01-47 | 12,852,897 | 13,313,963 | |
| 30 Yr Pass Thru | 3.500 | 11-01-47 | 61,069,309 | 64,061,558 | |
| 30 Yr Pass Thru | 3.500 | 11-01-47 | 8,807,782 | 9,123,740 | |
| 30 Yr Pass Thru | 3.500 | 12-01-47 | 30,909,628 | 32,337,192 | |
| 30 Yr Pass Thru | 3.500 | 01-01-48 | 52,264,368 | 54,678,203 | |
| 30 Yr Pass Thru | 3.500 | 03-01-48 | 10,179,801 | 10,723,123 | |
| 30 Yr Pass Thru | 3.500 | 03-01-48 | 42,937,317 | 44,410,500 | |
| 30 Yr Pass Thru | 3.500 | 06-01-48 | 25,738,117 | 26,999,223 | |
| 30 Yr Pass Thru | 3.500 | 03-01-49 | 8,066,389 | 8,438,936 | |
| 30 Yr Pass Thru | 3.500 | 06-01-49 | 56,529,575 | 59,016,740 | |
| 30 Yr Pass Thru | 3.500 | 06-01-49 | 27,856,931 | 28,595,073 | |
| 30 Yr Pass Thru | 3.500 | 06-01-49 | 43,177,369 | 44,645,296 | |
| 30 Yr Pass Thru | 3.500 | 07-01-49 | 26,886,639 | 27,666,287 | |
| 30 Yr Pass Thru | 3.500 | 07-01-49 | 102,880,770 | 105,864,065 | |
| 30 Yr Pass Thru | 3.500 | 09-01-49 | 21,185,878 | 21,760,494 | |
| 30 Yr Pass Thru | 4.000 | 09-01-40 | 7,176,935 | 7,677,914 | |
| 30 Yr Pass Thru | 4.000 | 09-01-40 | 10,768,634 | 11,520,328 | |
| 30 Yr Pass Thru | 4.000 | 11-01-40 | 2,627,241 | 2,808,990 | |
| 30 Yr Pass Thru | 4.000 | 12-01-40 | 1,473,124 | 1,575,033 | |
| 30 Yr Pass Thru | 4.000 | 12-01-40 | 4,144,608 | 4,431,328 | |
| 30 Yr Pass Thru | 4.000 | 01-01-41 | 4,532,983 | 4,846,570 | |
| 30 Yr Pass Thru | 4.000 | 01-01-41 | 1,755,668 | 1,881,513 | |
| 30 Yr Pass Thru | 4.000 | 02-01-41 | 1,942,376 | 2,081,604 | |
| 30 Yr Pass Thru | 4.000 | 09-01-41 | 8,423,931 | 9,006,690 | |
| 30 Yr Pass Thru | 4.000 | 09-01-41 | 2,187,393 | 2,351,019 | |
| 30 Yr Pass Thru | 4.000 | 09-01-41 | 3,714,997 | 3,992,894 | |
| 30 Yr Pass Thru | 4.000 | 10-01-41 | 2,009,684 | 2,160,016 | |
| 30 Yr Pass Thru | 4.000 | 10-01-41 | 1,533,498 | 1,639,584 | |
| 30 Yr Pass Thru | 4.000 | 10-01-41 | 2,576,345 | 2,764,235 | |
| 30 Yr Pass Thru | 4.000 | 01-01-42 | 3,330,752 | 3,578,865 | |
| 30 Yr Pass Thru | 4.000 | 03-01-42 | 1,742,660 | 1,869,206 | |
| 30 Yr Pass Thru | 4.000 | 05-01-42 | 6,323,494 | 6,755,019 | |
| 12 | JOHN HANCOCK BOND FUND | SEMIANNUAL REPORT | SEE NOTES TO FINANCIAL STATEMENTS |
| Rate (%) | Maturity date | Par value^ | Value | ||
| U.S. Government Agency (continued) | |||||
| 30 Yr Pass Thru | 4.000 | 07-01-42 | 411,005 | $441,493 | |
| 30 Yr Pass Thru | 4.000 | 09-01-43 | 7,912,086 | 8,545,975 | |
| 30 Yr Pass Thru | 4.000 | 10-01-43 | 8,833,107 | 9,504,900 | |
| 30 Yr Pass Thru | 4.000 | 10-01-43 | 3,596,007 | 3,858,260 | |
| 30 Yr Pass Thru | 4.000 | 01-01-44 | 6,157,610 | 6,625,921 | |
| 30 Yr Pass Thru | 4.000 | 12-01-45 | 20,284,275 | 21,649,487 | |
| 30 Yr Pass Thru | 4.000 | 02-01-46 | 13,010,397 | 13,707,155 | |
| 30 Yr Pass Thru | 4.000 | 04-01-46 | 13,526,421 | 14,250,814 | |
| 30 Yr Pass Thru | 4.000 | 06-01-46 | 9,217,722 | 9,711,368 | |
| 30 Yr Pass Thru | 4.000 | 07-01-46 | 22,617,380 | 23,828,631 | |
| 30 Yr Pass Thru | 4.000 | 10-01-46 | 5,219,646 | 5,492,655 | |
| 30 Yr Pass Thru | 4.000 | 01-01-47 | 17,328,874 | 18,230,912 | |
| 30 Yr Pass Thru | 4.000 | 03-01-47 | 27,286,476 | 28,943,898 | |
| 30 Yr Pass Thru | 4.000 | 04-01-47 | 23,655,707 | 24,887,081 | |
| 30 Yr Pass Thru | 4.000 | 08-01-47 | 35,288,740 | 36,980,094 | |
| 30 Yr Pass Thru | 4.000 | 11-01-47 | 8,384,077 | 8,783,821 | |
| 30 Yr Pass Thru | 4.000 | 12-01-47 | 15,215,580 | 16,192,101 | |
| 30 Yr Pass Thru | 4.000 | 12-01-47 | 13,526,740 | 14,170,836 | |
| 30 Yr Pass Thru | 4.000 | 04-01-48 | 78,926,169 | 83,942,243 | |
| 30 Yr Pass Thru | 4.000 | 07-01-48 | 27,437,645 | 28,569,215 | |
| 30 Yr Pass Thru | 4.000 | 09-01-48 | 50,142,404 | 53,172,460 | |
| 30 Yr Pass Thru | 4.000 | 10-01-48 | 48,650,506 | 51,499,188 | |
| 30 Yr Pass Thru | 4.000 | 10-01-48 | 29,040,401 | 30,722,683 | |
| 30 Yr Pass Thru | 4.000 | 10-01-48 | 34,327,540 | 36,401,919 | |
| 30 Yr Pass Thru | 4.000 | 01-01-49 | 23,927,611 | 25,022,096 | |
| 30 Yr Pass Thru | 4.000 | 02-01-49 | 32,455,003 | 33,939,543 | |
| 30 Yr Pass Thru | 4.500 | 11-01-39 | 4,180,901 | 4,529,506 | |
| 30 Yr Pass Thru | 4.500 | 08-01-40 | 3,141,715 | 3,400,727 | |
| 30 Yr Pass Thru | 4.500 | 08-01-40 | 1,893,822 | 2,049,954 | |
| 30 Yr Pass Thru | 4.500 | 02-01-41 | 7,119,421 | 7,704,140 | |
| 30 Yr Pass Thru | 4.500 | 05-01-41 | 4,099,979 | 4,436,711 | |
| 30 Yr Pass Thru | 4.500 | 05-01-41 | 4,856,422 | 5,258,316 | |
| 30 Yr Pass Thru | 4.500 | 06-01-41 | 6,048,038 | 6,540,985 | |
| 30 Yr Pass Thru | 4.500 | 07-01-41 | 4,498,371 | 4,865,012 | |
| 30 Yr Pass Thru | 4.500 | 08-01-41 | 2,951,244 | 3,191,785 | |
| 30 Yr Pass Thru | 4.500 | 05-01-42 | 6,768,455 | 7,320,119 | |
| 30 Yr Pass Thru | 4.500 | 11-01-42 | 4,532,822 | 4,917,852 | |
| 30 Yr Pass Thru | 4.500 | 01-01-43 | 1,341,800 | 1,451,164 | |
| 30 Yr Pass Thru | 4.500 | 10-01-45 | 15,686,497 | 16,916,007 | |
| 30 Yr Pass Thru | 4.500 | 05-01-46 | 9,044,266 | 9,634,451 | |
| 30 Yr Pass Thru | 4.500 | 04-01-48 | 1,644,410 | 1,755,827 | |
| 30 Yr Pass Thru | 4.500 | 04-01-48 | 16,380,918 | 17,378,192 | |
| 30 Yr Pass Thru | 4.500 | 05-01-48 | 45,297,438 | 48,366,575 | |
| 30 Yr Pass Thru | 4.500 | 06-01-48 | 50,322,184 | 53,731,774 | |
| SEE NOTES TO FINANCIAL STATEMENTS | SEMIANNUAL REPORT | JOHN HANCOCK BOND FUND | 13 |
| Rate (%) | Maturity date | Par value^ | Value | ||
| U.S. Government Agency (continued) | |||||
| 30 Yr Pass Thru | 4.500 | 06-01-48 | 41,243,879 | $44,205,920 | |
| 30 Yr Pass Thru (6 month LIBOR + 2.122%) (C) | 4.747 | 07-01-33 | 389 | 406 | |
| 30 Yr Pass Thru | 7.000 | 09-01-31 | 130 | 151 | |
| 30 Yr Pass Thru | 7.000 | 09-01-31 | 130 | 150 | |
| 30 Yr Pass Thru | 7.000 | 09-01-31 | 2,241 | 2,592 | |
| 30 Yr Pass Thru | 7.000 | 01-01-32 | 84 | 98 | |
| 30 Yr Pass Thru | 7.000 | 05-01-32 | 118 | 138 | |
| 30 Yr Pass Thru | 7.000 | 06-01-32 | 105 | 121 | |
| 30 Yr Pass Thru | 7.500 | 09-01-29 | 59 | 68 | |
| 30 Yr Pass Thru | 7.500 | 12-01-29 | 67 | 77 | |
| 30 Yr Pass Thru | 7.500 | 12-01-30 | 15 | 17 | |
| 30 Yr Pass Thru | 7.500 | 01-01-31 | 29 | 33 | |
| 30 Yr Pass Thru | 7.500 | 05-01-31 | 336 | 390 | |
| 30 Yr Pass Thru | 7.500 | 08-01-31 | 120 | 136 | |
| Government National Mortgage Association | |||||
| 30 Yr Pass Thru | 4.000 | 02-15-41 | 1,909,322 | 2,044,987 | |
| 30 Yr Pass Thru | 5.000 | 04-15-35 | 3,810 | 4,180 | |
| 30 Yr Pass Thru | 5.000 | 04-15-35 | 1,700 | 1,862 | |
| 30 Yr Pass Thru | 5.500 | 03-15-35 | 4,409 | 4,913 | |
| 30 Yr Pass Thru | 6.000 | 03-15-33 | 2,419 | 2,729 | |
| 30 Yr Pass Thru | 6.000 | 06-15-33 | 905 | 1,016 | |
| 30 Yr Pass Thru | 6.500 | 09-15-28 | 351 | 391 | |
| 30 Yr Pass Thru | 6.500 | 09-15-29 | 165 | 184 | |
| 30 Yr Pass Thru | 6.500 | 08-15-31 | 291 | 329 | |
| 30 Yr Pass Thru | 7.000 | 04-15-29 | 727 | 822 | |
| 30 Yr Pass Thru | 8.000 | 10-15-26 | 360 | 401 | |
| Foreign government obligations 0.4% | $79,082,762 | ||||
| (Cost $71,988,633) | |||||
| Qatar 0.2% | 43,801,586 | ||||
| State of Qatar | |||||
| Bond (D) | 3.375 | 03-14-24 | 23,339,000 | 24,377,586 | |
| Bond (D) | 5.103 | 04-23-48 | 15,175,000 | 19,424,000 | |
| Saudi Arabia 0.2% | 35,281,176 | ||||
| Kingdom
of Saudi Arabia Bond (D) |
4.375 | 04-16-29 | 31,580,000 | 35,281,176 | |
| Corporate bonds 40.5% | $7,282,154,121 | ||||
| (Cost $6,993,539,540) | |||||
| Communication services 4.5% | 816,350,131 | ||||
| Diversified telecommunication services 1.7% | |||||
| AT&T, Inc. | 3.400 | 05-15-25 | 32,345,000 | 33,771,017 | |
| AT&T, Inc. | 3.800 | 02-15-27 | 17,626,000 | 18,739,758 | |
| 14 | JOHN HANCOCK BOND FUND | SEMIANNUAL REPORT | SEE NOTES TO FINANCIAL STATEMENTS |
| Rate (%) | Maturity date | Par value^ | Value | ||
| Communication services (continued) | |||||
| Diversified telecommunication services (continued) | |||||
| C&W Senior Financing DAC (A)(D) | 6.875 | 09-15-27 | 15,850,000 | $16,731,656 | |
| Cincinnati Bell, Inc. (A)(D) | 7.000 | 07-15-24 | 22,599,000 | 21,158,314 | |
| GCI LLC (D) | 6.625 | 06-15-24 | 7,997,000 | 8,656,753 | |
| GCI LLC | 6.875 | 04-15-25 | 10,150,000 | 10,594,063 | |
| Level 3 Financing, Inc. (D) | 3.400 | 03-01-27 | 21,423,000 | 21,441,210 | |
| Liquid Telecommunications Financing PLC (D) | 8.500 | 07-13-22 | 12,325,000 | 12,318,789 | |
| Radiate Holdco LLC (A)(D) | 6.625 | 02-15-25 | 13,365,000 | 13,498,650 | |
| Radiate Holdco LLC (D) | 6.875 | 02-15-23 | 4,594,000 | 4,685,880 | |
| Telecom Argentina SA (A)(D) | 6.500 | 06-15-21 | 9,120,000 | 8,641,200 | |
| Telecom Argentina SA (D) | 8.000 | 07-18-26 | 10,858,000 | 9,500,750 | |
| Telecom Italia Capital SA | 7.200 | 07-18-36 | 19,715,000 | 23,077,393 | |
| Telecom Italia SpA (D) | 5.303 | 05-30-24 | 14,870,000 | 15,989,265 | |
| UPCB Finance IV, Ltd. (D) | 5.375 | 01-15-25 | 11,781,000 | 12,104,978 | |
| Verizon Communications, Inc. | 4.400 | 11-01-34 | 16,224,000 | 18,828,779 | |
| Verizon Communications, Inc. | 4.862 | 08-21-46 | 39,929,000 | 49,938,814 | |
| Entertainment 0.4% | |||||
| Activision Blizzard, Inc. | 3.400 | 09-15-26 | 9,978,000 | 10,493,927 | |
| Lions Gate Capital Holdings LLC (A)(D) | 5.875 | 11-01-24 | 8,795,000 | 8,467,122 | |
| Netflix, Inc. | 4.875 | 04-15-28 | 14,130,000 | 14,473,076 | |
| Netflix, Inc. (A)(D) | 4.875 | 06-15-30 | 13,241,000 | 13,340,308 | |
| Netflix, Inc. (D) | 5.375 | 11-15-29 | 5,283,000 | 5,560,886 | |
| Netflix, Inc. | 5.875 | 11-15-28 | 23,170,000 | 25,313,225 | |
| Media 1.8% | |||||
| Altice Financing SA (D) | 6.625 | 02-15-23 | 11,370,000 | 11,625,825 | |
| Altice Luxembourg SA (D) | 10.500 | 05-15-27 | 4,417,000 | 5,008,878 | |
| Cablevision Systems Corp. | 5.875 | 09-15-22 | 11,420,000 | 12,305,050 | |
| CBS Corp. | 3.700 | 08-15-24 | 13,500,000 | 14,173,181 | |
| Charter Communications Operating LLC | 4.200 | 03-15-28 | 33,590,000 | 35,606,557 | |
| Charter Communications Operating LLC | 4.800 | 03-01-50 | 21,312,000 | 22,216,760 | |
| Charter Communications Operating LLC | 5.750 | 04-01-48 | 37,447,000 | 43,362,174 | |
| Charter Communications Operating LLC | 6.484 | 10-23-45 | 31,930,000 | 39,581,846 | |
| CSC Holdings LLC (D) | 5.375 | 02-01-28 | 7,545,000 | 7,978,838 | |
| CSC Holdings LLC (D) | 5.500 | 04-15-27 | 9,225,000 | 9,813,094 | |
| CSC Holdings LLC (D) | 5.750 | 01-15-30 | 11,119,000 | 11,716,646 | |
| CSC Holdings LLC (D) | 7.500 | 04-01-28 | 11,570,000 | 13,030,713 | |
| LCPR Senior Secured Financing DAC (D) | 6.750 | 10-15-27 | 9,115,000 | 9,399,844 | |
| MDC Partners, Inc. (D) | 6.500 | 05-01-24 | 22,212,000 | 20,212,920 | |
| National CineMedia LLC (D) | 5.875 | 04-15-28 | 8,680,000 | 9,048,900 | |
| Sirius XM Radio, Inc. (D) | 5.000 | 08-01-27 | 28,619,000 | 30,121,498 | |
| Sirius XM Radio, Inc. (D) | 5.375 | 07-15-26 | 15,345,000 | 16,208,156 | |
| WMG Acquisition Corp. (D) | 4.875 | 11-01-24 | 6,551,000 | 6,763,908 | |
| WMG Acquisition Corp. (D) | 5.500 | 04-15-26 | 9,627,000 | 10,156,485 | |
| SEE NOTES TO FINANCIAL STATEMENTS | SEMIANNUAL REPORT | JOHN HANCOCK BOND FUND | 15 |
| Rate (%) | Maturity date | Par value^ | Value | ||
| Communication services (continued) | |||||
| Wireless telecommunication services 0.6% | |||||
| CC Holdings GS V LLC | 3.849 | 04-15-23 | 15,526,000 | $16,291,805 | |
| Comunicaciones Celulares SA Via Comcel Trust (D) | 6.875 | 02-06-24 | 8,530,000 | 8,753,913 | |
| Millicom International Cellular SA (A)(D) | 5.125 | 01-15-28 | 4,100,000 | 4,187,125 | |
| MTN Mauritius Investments, Ltd. (D) | 4.755 | 11-11-24 | 12,421,000 | 12,722,997 | |
| Oztel Holdings SPC, Ltd. (D) | 6.625 | 04-24-28 | 12,515,000 | 13,081,036 | |
| Sprint Corp. | 7.875 | 09-15-23 | 15,206,000 | 16,717,096 | |
| Telefonica Celular del Paraguay SA (D) | 5.875 | 04-15-27 | 6,691,000 | 7,125,915 | |
| Vodafone Group PLC (7.000% to 1-4-29, then 5 Year U.S. Swap Rate + 4.873%) | 7.000 | 04-04-79 | 27,478,000 | 31,813,158 | |
| Consumer discretionary 4.0% | 723,935,227 | ||||
| Automobiles 1.6% | |||||
| Daimler Finance North America LLC (A)(D) | 2.700 | 06-14-24 | 13,695,000 | 13,824,118 | |
| Daimler Finance North America LLC (D) | 3.500 | 08-03-25 | 12,585,000 | 13,091,272 | |
| Ford Motor Credit Company LLC | 4.134 | 08-04-25 | 58,761,000 | 58,736,018 | |
| Ford Motor Credit Company LLC | 5.113 | 05-03-29 | 32,918,000 | 33,314,323 | |
| Ford Motor Credit Company LLC | 5.875 | 08-02-21 | 41,355,000 | 43,298,036 | |
| General Motors Company | 4.875 | 10-02-23 | 31,134,000 | 33,569,667 | |
| General Motors Financial Company, Inc. | 4.000 | 01-15-25 | 45,989,000 | 47,660,072 | |
| General Motors Financial Company, Inc. | 4.300 | 07-13-25 | 22,335,000 | 23,523,257 | |
| JB Poindexter & Company, Inc. (D) | 7.125 | 04-15-26 | 5,212,000 | 5,436,116 | |
| Mclaren Finance PLC (D) | 5.750 | 08-01-22 | 3,425,000 | 3,281,151 | |
| Nissan Motor Acceptance Corp. (D) | 3.450 | 03-15-23 | 13,440,000 | 13,810,182 | |
| Diversified consumer services 0.2% | |||||
| GEMS MENASA Cayman, Ltd. (D) | 7.125 | 07-31-26 | 6,680,000 | 7,030,700 | |
| Laureate Education, Inc. (D) | 8.250 | 05-01-25 | 8,575,000 | 9,261,000 | |
| Sotheby's (A)(D) | 7.375 | 10-15-27 | 15,799,000 | 15,423,774 | |
| Hotels, restaurants and leisure 0.7% | |||||
| CCM Merger, Inc. (D) | 6.000 | 03-15-22 | 10,710,000 | 10,924,200 | |
| Connect Finco Sarl (D) | 6.750 | 10-01-26 | 23,202,000 | 23,811,053 | |
| Eldorado Resorts, Inc. | 6.000 | 09-15-26 | 6,670,000 | 7,342,336 | |
| Eldorado Resorts, Inc. | 7.000 | 08-01-23 | 4,535,000 | 4,739,075 | |
| Hilton Domestic Operating Company, Inc. | 4.875 | 01-15-30 | 5,741,000 | 6,099,813 | |
| Hilton Domestic Operating Company, Inc. | 5.125 | 05-01-26 | 2,667,000 | 2,807,018 | |
| International Game Technology PLC (D) | 6.500 | 02-15-25 | 11,430,000 | 12,773,025 | |
| Jacobs Entertainment, Inc. (D) | 7.875 | 02-01-24 | 11,775,000 | 12,481,500 | |
| Resorts World Las Vegas LLC (D) | 4.625 | 04-16-29 | 16,090,000 | 16,762,769 | |
| Twin River Worldwide Holdings, Inc. (A)(D) | 6.750 | 06-01-27 | 13,773,000 | 14,186,190 | |
| Waterford Gaming LLC (D)(E)(F) | 8.625 | 09-15-14 | 440,015 | 0 | |
| Yum! Brands, Inc. (D) | 4.750 | 01-15-30 | 6,690,000 | 6,924,150 | |
| Internet and direct marketing retail 1.3% | |||||
| Amazon.com, Inc. | 3.150 | 08-22-27 | 38,826,000 | 41,255,383 | |
| 16 | JOHN HANCOCK BOND FUND | SEMIANNUAL REPORT | SEE NOTES TO FINANCIAL STATEMENTS |
| Rate (%) | Maturity date | Par value^ | Value | ||
| Consumer discretionary (continued) | |||||
| Internet and direct marketing retail (continued) | |||||
| Amazon.com, Inc. | 4.050 | 08-22-47 | 21,490,000 | $25,680,413 | |
| Expedia Group, Inc. (D) | 3.250 | 02-15-30 | 26,905,000 | 26,228,666 | |
| Expedia Group, Inc. | 3.800 | 02-15-28 | 38,185,000 | 39,503,023 | |
| Expedia Group, Inc. | 5.000 | 02-15-26 | 31,402,000 | 34,858,066 | |
| Prosus NV (D) | 4.850 | 07-06-27 | 4,575,000 | 4,989,037 | |
| Prosus NV (D) | 5.500 | 07-21-25 | 19,530,000 | 21,729,583 | |
| QVC, Inc. | 4.375 | 03-15-23 | 18,108,000 | 18,747,562 | |
| QVC, Inc. | 5.125 | 07-02-22 | 8,874,000 | 9,332,385 | |
| QVC, Inc. | 5.450 | 08-15-34 | 10,129,000 | 10,038,398 | |
| Leisure products 0.0% | |||||
| Diamond Sports Group LLC (A)(D) | 6.625 | 08-15-27 | 8,665,000 | 8,445,862 | |
| Multiline retail 0.2% | |||||
| Dollar Tree, Inc. | 4.200 | 05-15-28 | 40,219,000 | 43,016,034 | |
| Consumer staples 0.8% | 134,708,719 | ||||
| Beverages 0.2% | |||||
| Anheuser-Busch InBev Worldwide, Inc. | 4.600 | 04-15-48 | 21,469,000 | 24,909,500 | |
| Food and staples retailing 0.1% | |||||
| Alimentation Couche-Tard, Inc. (D) | 2.700 | 07-26-22 | 13,623,000 | 13,753,684 | |
| Simmons Foods, Inc. (A)(D) | 5.750 | 11-01-24 | 9,570,000 | 9,258,975 | |
| Food products 0.3% | |||||
| JBS Investments II GmbH (A)(D) | 5.750 | 01-15-28 | 25,669,000 | 27,016,623 | |
| Kraft Heinz Foods Company (D) | 4.875 | 02-15-25 | 13,957,000 | 14,352,336 | |
| NBM US Holdings, Inc. (D) | 6.625 | 08-06-29 | 8,240,000 | 8,675,072 | |
| Post Holdings, Inc. (D) | 5.500 | 12-15-29 | 8,311,000 | 8,705,773 | |
| Personal products 0.2% | |||||
| Natura Cosmeticos SA (A)(D) | 5.375 | 02-01-23 | 19,995,000 | 20,869,781 | |
| Walnut Bidco PLC (D) | 9.125 | 08-01-24 | 6,925,000 | 7,166,975 | |
| Energy 4.9% | 877,742,937 | ||||
| Energy equipment and services 0.4% | |||||
| Archrock Partners LP | 6.000 | 10-01-22 | 15,668,000 | 15,707,170 | |
| CSI Compressco LP (A) | 7.250 | 08-15-22 | 22,194,000 | 19,752,660 | |
| CSI Compressco LP (D) | 7.500 | 04-01-25 | 16,408,000 | 15,546,580 | |
| Inkia Energy, Ltd. (D) | 5.875 | 11-09-27 | 4,600,000 | 4,738,046 | |
| Tervita Corp. (D) | 7.625 | 12-01-21 | 11,842,000 | 11,840,697 | |
| Oil, gas and consumable fuels 4.5% | |||||
| Cheniere Corpus Christi Holdings LLC | 5.125 | 06-30-27 | 7,135,000 | 7,847,002 | |
| Cheniere Energy Partners LP (D) | 4.500 | 10-01-29 | 18,715,000 | 18,814,190 | |
| Cimarex Energy Company | 4.375 | 06-01-24 | 12,404,000 | 13,000,260 | |
| Colorado Interstate Gas Company LLC (D) | 4.150 | 08-15-26 | 9,460,000 | 9,871,488 | |
| Continental Resources, Inc. | 5.000 | 09-15-22 | 20,221,000 | 20,336,017 | |
| SEE NOTES TO FINANCIAL STATEMENTS | SEMIANNUAL REPORT | JOHN HANCOCK BOND FUND | 17 |
| Rate (%) | Maturity date | Par value^ | Value | ||
| Energy (continued) | |||||
| Oil, gas and consumable fuels (continued) | |||||
| DCP Midstream LP (7.375% to 12-15-22, then 3 month LIBOR + 5.148%) (A)(G) | 7.375 | 12-15-22 | 27,189,000 | $25,965,495 | |
| DCP Midstream Operating LP | 5.125 | 05-15-29 | 5,850,000 | 5,937,750 | |
| DCP Midstream Operating LP (5.850% to 5-21-23, then 3 month LIBOR + 3.850%) (D) | 5.850 | 05-21-43 | 27,700,000 | 25,484,000 | |
| Diamondback Energy, Inc. | 4.750 | 11-01-24 | 13,514,000 | 14,005,910 | |
| Enable Midstream Partners LP | 3.900 | 05-15-24 | 19,802,000 | 19,956,697 | |
| Enable Midstream Partners LP | 4.950 | 05-15-28 | 18,636,000 | 18,631,940 | |
| Enbridge, Inc. (5.500% to 7-15-27, then 3 month LIBOR + 3.418%) | 5.500 | 07-15-77 | 20,627,000 | 21,142,675 | |
| Enbridge, Inc. (6.250% to 3-1-28, then 3 month LIBOR + 3.641%) | 6.250 | 03-01-78 | 19,207,000 | 20,599,508 | |
| Energy Transfer Operating LP | 4.200 | 04-15-27 | 8,447,000 | 8,657,447 | |
| Energy Transfer Operating LP | 4.250 | 03-15-23 | 24,613,000 | 25,586,015 | |
| Energy Transfer Operating LP | 5.150 | 03-15-45 | 16,520,000 | 16,760,116 | |
| Energy Transfer Operating LP | 5.875 | 01-15-24 | 17,180,000 | 18,923,616 | |
| Enterprise Products Operating LLC (5.250% to 8-16-27, then 3 month LIBOR + 3.033%) | 5.250 | 08-16-77 | 34,782,000 | 34,955,910 | |
| Husky Energy, Inc. | 3.950 | 04-15-22 | 17,036,000 | 17,580,379 | |
| Kinder Morgan Energy Partners LP | 7.750 | 03-15-32 | 12,590,000 | 16,924,338 | |
| MPLX LP | 4.000 | 03-15-28 | 17,215,000 | 17,641,034 | |
| MPLX LP (D) | 4.250 | 12-01-27 | 7,928,000 | 8,312,827 | |
| MPLX LP (D) | 5.250 | 01-15-25 | 10,432,000 | 10,951,999 | |
| MPLX LP (D) | 6.375 | 05-01-24 | 13,574,000 | 14,199,109 | |
| MPLX LP (6.875% to 2-15-23, then 3 month LIBOR + 4.652%) (G) | 6.875 | 02-15-23 | 44,303,000 | 44,413,758 | |
| Murphy Oil Corp. | 5.750 | 08-15-25 | 9,531,000 | 9,757,171 | |
| Newfield Exploration Company | 5.625 | 07-01-24 | 16,774,000 | 18,296,859 | |
| ONEOK Partners LP | 4.900 | 03-15-25 | 8,673,000 | 9,478,597 | |
| Parsley Energy LLC (D) | 5.625 | 10-15-27 | 13,410,000 | 13,862,588 | |
| Petrobras Global Finance BV (D) | 5.093 | 01-15-30 | 27,279,000 | 28,561,113 | |
| Petrobras Global Finance BV | 6.900 | 03-19-49 | 10,625,000 | 12,151,813 | |
| Sabine Pass Liquefaction LLC | 4.200 | 03-15-28 | 13,415,000 | 14,123,302 | |
| Sabine Pass Liquefaction LLC | 5.000 | 03-15-27 | 15,534,000 | 17,005,417 | |
| Sabine Pass Liquefaction LLC | 5.875 | 06-30-26 | 26,740,000 | 30,587,027 | |
| Sunoco Logistics Partners Operations LP | 3.900 | 07-15-26 | 24,214,000 | 24,854,532 | |
| Sunoco Logistics Partners Operations LP | 5.400 | 10-01-47 | 15,951,000 | 16,796,699 | |
| Targa Resources Partners LP | 5.875 | 04-15-26 | 26,310,000 | 27,683,382 | |
| Teekay Offshore Partners LP (A)(D) | 8.500 | 07-15-23 | 17,445,000 | 17,445,000 | |
| The Williams Companies, Inc. | 3.750 | 06-15-27 | 21,304,000 | 21,811,274 | |
| The Williams Companies, Inc. | 4.550 | 06-24-24 | 43,752,000 | 46,836,229 | |
| The Williams Companies, Inc. | 5.750 | 06-24-44 | 7,401,000 | 8,482,580 | |
| TransCanada PipeLines, Ltd. | 4.250 | 05-15-28 | 13,565,000 | 14,929,075 | |
| 18 | JOHN HANCOCK BOND FUND | SEMIANNUAL REPORT | SEE NOTES TO FINANCIAL STATEMENTS |
| Rate (%) | Maturity date | Par value^ | Value | ||
| Energy (continued) | |||||
| Oil, gas and consumable fuels (continued) | |||||
| WPX Energy, Inc. | 5.250 | 09-15-24 | 5,040,000 | $5,150,729 | |
| WPX Energy, Inc. | 5.250 | 10-15-27 | 5,763,000 | 5,762,712 | |
| YPF SA (D) | 8.500 | 07-28-25 | 12,258,000 | 10,082,205 | |
| Financials 10.7% | 1,927,606,511 | ||||
| Banks 6.1% | |||||
| Australia & New Zealand Banking Group, Ltd. (6.750% to 6-15-26, then 5 Year U.S. ISDAFIX + 5.168%) (A)(D)(G) | 6.750 | 06-15-26 | 10,920,000 | 12,380,550 | |
| Banco Santander SA | 4.379 | 04-12-28 | 18,430,000 | 20,198,674 | |
| Bank of America Corp. | 3.950 | 04-21-25 | 23,346,000 | 24,820,794 | |
| Bank of America Corp. | 4.200 | 08-26-24 | 10,787,000 | 11,558,394 | |
| Bank of America Corp. | 4.450 | 03-03-26 | 29,257,000 | 32,118,930 | |
| Bank of America Corp. (6.300% to 3-10-26, then 3 month LIBOR + 4.553%) (G) | 6.300 | 03-10-26 | 32,565,000 | 37,286,925 | |
| Barclays Bank PLC (D) | 10.179 | 06-12-21 | 8,040,000 | 8,963,936 | |
| Barclays PLC | 4.375 | 01-12-26 | 15,935,000 | 17,087,016 | |
| BPCE SA (D) | 4.500 | 03-15-25 | 20,836,000 | 22,390,382 | |
| BPCE SA (D) | 5.700 | 10-22-23 | 23,245,000 | 25,639,154 | |
| Citigroup, Inc. | 3.200 | 10-21-26 | 29,535,000 | 30,646,998 | |
| Citigroup, Inc. | 4.600 | 03-09-26 | 34,598,000 | 38,079,616 | |
| Citigroup, Inc. | 5.500 | 09-13-25 | 10,611,000 | 12,130,962 | |
| Citigroup, Inc. (6.250% to 8-15-26, then 3 month LIBOR + 4.517%) (A)(G) | 6.250 | 08-15-26 | 24,848,000 | 28,202,480 | |
| Credit Agricole SA (7.875% to 1-23-24, then 5 Year U.S. Swap Rate + 4.898%) (D)(G) | 7.875 | 01-23-24 | 15,155,000 | 17,181,314 | |
| Danske Bank A/S (D) | 5.000 | 01-12-22 | 17,629,000 | 18,507,987 | |
| Discover Bank | 2.450 | 09-12-24 | 19,370,000 | 19,337,583 | |
| Fifth Third Bancorp (5.100% to 6-30-23, then 3 month LIBOR + 3.033%) (G) | 5.100 | 06-30-23 | 12,369,000 | 12,733,391 | |
| Freedom Mortgage Corp. (D) | 8.125 | 11-15-24 | 14,529,000 | 14,320,218 | |
| Freedom Mortgage Corp. (D) | 8.250 | 04-15-25 | 5,630,000 | 5,587,775 | |
| HSBC Holdings PLC (3.950% to 5-18-23, then 3 month LIBOR + 0.987%) | 3.950 | 05-18-24 | 30,775,000 | 32,219,976 | |
| HSBC Holdings PLC (6.375% to 9-17-24, then 5 Year U.S. ISDAFIX + 3.705%) (A)(G) | 6.375 | 09-17-24 | 6,870,000 | 7,307,963 | |
| HSBC Holdings PLC (6.875% to 6-1-21, then 5 Year U.S. ISDAFIX + 5.514%) (G) | 6.875 | 06-01-21 | 17,805,000 | 18,606,225 | |
| ING Bank NV (D) | 5.800 | 09-25-23 | 18,634,000 | 20,654,915 | |
| ING Groep NV | 3.550 | 04-09-24 | 17,692,000 | 18,445,628 | |
| ING Groep NV (6.500% to 4-16-25, then 5 Year U.S. Swap Rate + 4.446%) (G) | 6.500 | 04-16-25 | 7,245,000 | 7,752,150 | |
| JPMorgan Chase & Co. | 2.950 | 10-01-26 | 34,327,000 | 35,414,234 | |
| SEE NOTES TO FINANCIAL STATEMENTS | SEMIANNUAL REPORT | JOHN HANCOCK BOND FUND | 19 |
| Rate (%) | Maturity date | Par value^ | Value | ||
| Financials (continued) | |||||
| Banks (continued) | |||||
| JPMorgan Chase & Co. (3.960% to 1-29-26, then 3 month LIBOR + 1.245%) | 3.960 | 01-29-27 | 25,533,000 | $27,595,091 | |
| JPMorgan Chase & Co. (6.750% to 2-1-24, then 3 month LIBOR + 3.780%) (G) | 6.750 | 02-01-24 | 27,445,000 | 30,909,931 | |
| Lloyds Banking Group PLC | 4.450 | 05-08-25 | 47,565,000 | 51,784,152 | |
| Lloyds Banking Group PLC (7.500% to 6-27-24, then 5 Year U.S. Swap Rate + 4.760%) (G) | 7.500 | 06-27-24 | 18,190,000 | 20,077,213 | |
| M&T Bank Corp. (5.125% to 11-1-26, then 3 month LIBOR + 3.520%) (G) | 5.125 | 11-01-26 | 12,892,000 | 13,810,555 | |
| Manufacturers & Traders Trust Company (3 month LIBOR + 0.640%) (C) | 2.547 | 12-01-21 | 9,230,000 | 9,239,798 | |
| Santander Holdings USA, Inc. (D) | 3.244 | 10-05-26 | 39,550,000 | 39,726,800 | |
| Santander Holdings USA, Inc. | 3.400 | 01-18-23 | 18,107,000 | 18,555,915 | |
| Santander Holdings USA, Inc. | 3.500 | 06-07-24 | 38,050,000 | 39,068,060 | |
| Santander Holdings USA, Inc. | 4.400 | 07-13-27 | 9,667,000 | 10,382,242 | |
| Santander UK Group Holdings PLC (D) | 4.750 | 09-15-25 | 14,920,000 | 15,910,021 | |
| Societe Generale SA (7.375% to 9-13-21, then 5 Year U.S. Swap Rate + 6.238%) (A)(D)(G) | 7.375 | 09-13-21 | 17,145,000 | 18,127,409 | |
| The PNC Financial Services Group, Inc. | 2.200 | 11-01-24 | 30,950,000 | 30,870,024 | |
| The PNC Financial Services Group, Inc. | 3.500 | 01-23-24 | 14,603,000 | 15,375,885 | |
| The PNC Financial Services Group, Inc. (4.850% to 6-1-23, then 3 month LIBOR + 3.040%) (G) | 4.850 | 06-01-23 | 15,854,000 | 16,408,890 | |
| The PNC Financial Services Group, Inc. (6.750% to 8-1-21, then 3 month LIBOR + 3.678%) (G) | 6.750 | 08-01-21 | 29,319,000 | 30,922,749 | |
| The Royal Bank of Scotland Group PLC | 3.875 | 09-12-23 | 24,580,000 | 25,570,271 | |
| The Royal Bank of Scotland Group PLC (3.754% to 11-1-24, then 5 Year CMT + 2.100%) | 3.754 | 11-01-29 | 9,658,000 | 9,743,883 | |
| The Royal Bank of Scotland Group PLC (8.625% to 8-15-21, then 5 Year U.S. Swap Rate + 7.598%) (G) | 8.625 | 08-15-21 | 37,076,000 | 40,019,093 | |
| The Toronto-Dominion Bank | 3.250 | 03-11-24 | 22,739,000 | 23,723,352 | |
| Wells Fargo & Company (3 month LIBOR + 3.770%) (A)(C)(G) | 5.889 | 03-15-20 | 8,592,000 | 8,722,598 | |
| Wells Fargo & Company (5.875% to 6-15-25, then 3 month LIBOR + 3.990%) (G) | 5.875 | 06-15-25 | 54,681,000 | 60,739,096 | |
| Capital markets 1.2% | |||||
| Ares Capital Corp. | 3.625 | 01-19-22 | 18,302,000 | 18,588,525 | |
| Cantor Fitzgerald LP (D) | 4.875 | 05-01-24 | 25,325,000 | 26,943,794 | |
| 20 | JOHN HANCOCK BOND FUND | SEMIANNUAL REPORT | SEE NOTES TO FINANCIAL STATEMENTS |
| Rate (%) | Maturity date | Par value^ | Value | ||
| Financials (continued) | |||||
| Capital markets (continued) | |||||
| Credit Suisse Group AG (7.500% to 12-11-23, then 5 Year U.S. Swap Rate + 4.598%) (A)(D)(G) | 7.500 | 12-11-23 | 10,145,000 | $11,337,038 | |
| Credit Suisse Group AG (7.500% to 7-17-23, then 5 Year U.S. Swap Rate + 4.600%) (D)(G) | 7.500 | 07-17-23 | 17,955,000 | 19,554,791 | |
| Lazard Group LLC | 4.375 | 03-11-29 | 14,025,000 | 15,295,527 | |
| Macquarie Bank, Ltd. (D) | 4.875 | 06-10-25 | 20,345,000 | 21,924,307 | |
| Morgan Stanley | 3.875 | 01-27-26 | 19,031,000 | 20,508,251 | |
| Stearns Holdings LLC (D) | 5.000 | 11-05-24 | 63,051 | 43,505 | |
| Stifel Financial Corp. | 4.250 | 07-18-24 | 12,983,000 | 13,750,301 | |
| The Goldman Sachs Group, Inc. | 3.850 | 01-26-27 | 46,391,000 | 49,399,388 | |
| UBS Group AG (7.000% to 1-31-24, then 5 Year U.S. Swap Rate + 4.344%) (D)(G) | 7.000 | 01-31-24 | 16,288,000 | 17,652,120 | |
| Consumer finance 0.8% | |||||
| Ally Financial, Inc. | 5.125 | 09-30-24 | 27,788,000 | 30,532,065 | |
| Capital One Financial Corp. | 3.500 | 06-15-23 | 15,740,000 | 16,340,144 | |
| Capital One Financial Corp. | 3.900 | 01-29-24 | 15,290,000 | 16,146,516 | |
| Credit Acceptance Corp. | 6.125 | 02-15-21 | 11,504,000 | 11,561,520 | |
| Credito Real SAB de CV (9.125% to 11-29-22, then 5 Year CMT + 7.026%) (D)(G) | 9.125 | 11-29-22 | 9,375,000 | 9,808,594 | |
| Discover Financial Services | 3.950 | 11-06-24 | 28,628,000 | 30,390,405 | |
| Discover Financial Services | 4.100 | 02-09-27 | 6,489,000 | 6,956,898 | |
| Enova International, Inc. (D) | 8.500 | 09-01-24 | 3,051,000 | 2,837,430 | |
| Enova International, Inc. (D) | 8.500 | 09-15-25 | 15,597,000 | 14,466,218 | |
| Springleaf Finance Corp. | 6.875 | 03-15-25 | 5,750,000 | 6,566,673 | |
| Diversified financial services 0.9% | |||||
| Allied Universal Holdco LLC (D) | 6.625 | 07-15-26 | 3,713,000 | 3,926,498 | |
| GE Capital International Funding Company Unlimited Company | 4.418 | 11-15-35 | 33,592,000 | 36,158,208 | |
| Gogo Intermediate Holdings LLC (D) | 9.875 | 05-01-24 | 10,941,000 | 11,501,179 | |
| Jefferies Financial Group, Inc. | 5.500 | 10-18-23 | 15,716,000 | 17,151,973 | |
| Jefferies Group LLC | 4.150 | 01-23-30 | 21,760,000 | 22,421,025 | |
| Jefferies Group LLC | 4.850 | 01-15-27 | 22,235,000 | 24,139,944 | |
| Refinitiv US Holdings, Inc. (D) | 6.250 | 05-15-26 | 2,370,000 | 2,583,300 | |
| Refinitiv US Holdings, Inc. (D) | 8.250 | 11-15-26 | 3,750,000 | 4,195,313 | |
| Trident TPI Holdings, Inc. (D) | 6.625 | 11-01-25 | 4,032,000 | 3,608,640 | |
| Voya Financial, Inc. (5.650% to 5-15-23, then 3 month LIBOR + 3.580%) | 5.650 | 05-15-53 | 29,467,000 | 30,998,105 | |
| Insurance 1.2% | |||||
| AXA SA | 8.600 | 12-15-30 | 9,222,000 | 13,499,440 | |
| Brighthouse Financial, Inc. | 3.700 | 06-22-27 | 31,050,000 | 30,680,008 | |
| CNO Financial Group, Inc. | 5.250 | 05-30-25 | 17,855,000 | 19,777,269 | |
| SEE NOTES TO FINANCIAL STATEMENTS | SEMIANNUAL REPORT | JOHN HANCOCK BOND FUND | 21 |
| Rate (%) | Maturity date | Par value^ | Value | ||
| Financials (continued) | |||||
| Insurance (continued) | |||||
| CNO Financial Group, Inc. | 5.250 | 05-30-29 | 7,570,000 | $8,388,128 | |
| Liberty Mutual Group, Inc. (D) | 3.951 | 10-15-50 | 25,053,000 | 25,555,562 | |
| MetLife, Inc. (6.400% to 12-15-36, then 3 month LIBOR + 2.205%) | 6.400 | 12-15-66 | 12,368,000 | 15,148,326 | |
| MetLife, Inc. (9.250% to 4-8-33, then 3 month LIBOR + 5.540%) (D) | 9.250 | 04-08-68 | 5,570,000 | 8,187,900 | |
| Nippon Life Insurance Company (5.100% to 10-16-24, then 5 Year U.S. ISDAFIX + 3.650%) (D) | 5.100 | 10-16-44 | 18,215,000 | 19,990,963 | |
| Prudential Financial, Inc. (5.875% to 9-15-22, then 3 month LIBOR + 4.175%) | 5.875 | 09-15-42 | 39,321,000 | 42,418,315 | |
| Teachers Insurance & Annuity Association of America (D) | 4.270 | 05-15-47 | 21,655,000 | 25,141,495 | |
| Thrifts and mortgage finance 0.5% | |||||
| Ladder Capital Finance Holdings LLLP (D) | 5.250 | 03-15-22 | 3,415,000 | 3,543,063 | |
| Ladder Capital Finance Holdings LLLP (D) | 5.250 | 10-01-25 | 7,640,000 | 7,754,600 | |
| MGIC Investment Corp. | 5.750 | 08-15-23 | 7,286,000 | 8,051,030 | |
| Nationstar Mortgage Holdings, Inc. (D) | 8.125 | 07-15-23 | 8,821,000 | 9,438,470 | |
| Nationstar Mortgage Holdings, Inc. (D) | 9.125 | 07-15-26 | 7,037,000 | 7,775,885 | |
| Nationwide Building Society (3.622% to 4-26-22, then 3 month LIBOR + 1.181%) (D) | 3.622 | 04-26-23 | 18,230,000 | 18,702,617 | |
| Nationwide Building Society (3.960% to 7-18-29, then 3 month LIBOR + 1.855%) (A)(D) | 3.960 | 07-18-30 | 13,550,000 | 14,515,789 | |
| Quicken Loans, Inc. (D) | 5.750 | 05-01-25 | 15,960,000 | 16,576,455 | |
| Radian Group, Inc. | 4.500 | 10-01-24 | 7,901,000 | 8,315,803 | |
| Health care 2.4% | 426,808,625 | ||||
| Biotechnology 0.5% | |||||
| AbbVie, Inc. (D) | 3.200 | 11-21-29 | 44,511,000 | 45,163,219 | |
| AbbVie, Inc. (D) | 4.250 | 11-21-49 | 12,529,000 | 13,166,553 | |
| Shire Acquisitions Investments Ireland DAC | 3.200 | 09-23-26 | 30,074,000 | 31,101,565 | |
| Health care providers and services 1.3% | |||||
| Centene Corp. (D) | 4.250 | 12-15-27 | 5,858,000 | 6,026,418 | |
| Centene Corp. (D) | 4.625 | 12-15-29 | 6,105,000 | 6,402,619 | |
| Centene Corp. (D) | 5.375 | 06-01-26 | 14,365,000 | 15,244,856 | |
| CVS Health Corp. | 3.000 | 08-15-26 | 5,073,000 | 5,191,418 | |
| CVS Health Corp. | 4.100 | 03-25-25 | 24,300,000 | 26,094,251 | |
| CVS Health Corp. | 5.050 | 03-25-48 | 17,559,000 | 20,774,571 | |
| DaVita, Inc. (A) | 5.000 | 05-01-25 | 24,471,000 | 25,246,241 | |
| Encompass Health Corp. | 4.500 | 02-01-28 | 2,900,000 | 2,972,500 | |
| HCA, Inc. | 4.125 | 06-15-29 | 8,402,000 | 8,851,502 | |
| 22 | JOHN HANCOCK BOND FUND | SEMIANNUAL REPORT | SEE NOTES TO FINANCIAL STATEMENTS |
| Rate (%) | Maturity date | Par value^ | Value | ||
| Health care (continued) | |||||
| Health care providers and services (continued) | |||||
| HCA, Inc. | 5.250 | 04-15-25 | 15,959,000 | $17,768,139 | |
| HCA, Inc. | 5.250 | 06-15-26 | 18,243,000 | 20,383,614 | |
| MEDNAX, Inc. (D) | 5.250 | 12-01-23 | 13,806,000 | 14,116,635 | |
| MEDNAX, Inc. (A)(D) | 6.250 | 01-15-27 | 12,515,000 | 12,734,013 | |
| Select Medical Corp. (D) | 6.250 | 08-15-26 | 7,864,000 | 8,434,140 | |
| Team Health Holdings, Inc. (A)(D) | 6.375 | 02-01-25 | 3,197,000 | 1,694,410 | |
| Universal Health Services, Inc. (D) | 4.750 | 08-01-22 | 15,230,000 | 15,391,819 | |
| Universal Health Services, Inc. (D) | 5.000 | 06-01-26 | 13,991,000 | 14,760,505 | |
| Life sciences tools and services 0.0% | |||||
| Charles River Laboratories International, Inc. (D) | 4.250 | 05-01-28 | 3,981,000 | 4,010,858 | |
| Pharmaceuticals 0.6% | |||||
| Bausch Health Companies, Inc. (D) | 6.125 | 04-15-25 | 21,865,000 | 22,738,944 | |
| Bristol-Myers Squibb Company (D) | 2.900 | 07-26-24 | 40,990,000 | 42,273,426 | |
| Bristol-Myers Squibb Company (D) | 3.250 | 02-20-23 | 15,657,000 | 16,215,922 | |
| Catalent Pharma Solutions, Inc. (D) | 5.000 | 07-15-27 | 3,705,000 | 3,843,938 | |
| GlaxoSmithKline Capital PLC | 3.000 | 06-01-24 | 25,294,000 | 26,206,549 | |
| Industrials 4.9% | 880,195,389 | ||||
| Aerospace and defense 0.5% | |||||
| Arconic, Inc. (A) | 5.125 | 10-01-24 | 18,133,000 | 19,765,877 | |
| Huntington Ingalls Industries, Inc. (D) | 5.000 | 11-15-25 | 21,100,000 | 22,102,250 | |
| Kratos Defense & Security Solutions, Inc. (D) | 6.500 | 11-30-25 | 11,995,000 | 12,714,700 | |
| TransDigm, Inc. (D) | 5.500 | 11-15-27 | 34,786,000 | 34,786,000 | |
| Air freight and logistics 0.1% | |||||
| XPO Logistics, Inc. (D) | 6.500 | 06-15-22 | 11,266,000 | 11,529,174 | |
| Airlines 2.4% | |||||
| Air Canada 2013-1 Class A Pass Through Trust (D) | 4.125 | 11-15-26 | 10,711,079 | 11,306,793 | |
| Air Canada 2017-1 Class B Pass Through Trust (D) | 3.700 | 07-15-27 | 13,599,405 | 13,717,866 | |
| America West Airlines 2000-1 Pass Through Trust | 8.057 | 01-02-22 | 443,900 | 455,488 | |
| American Airlines 2001-01 Pass Through Trust | 6.977 | 11-23-22 | 2,000,882 | 2,025,750 | |
| American Airlines 2013-2 Class A Pass Through Trust | 4.950 | 07-15-24 | 19,804,277 | 20,725,562 | |
| American Airlines 2015-1 Class A Pass Through Trust | 3.375 | 11-01-28 | 20,216,862 | 20,924,962 | |
| American Airlines 2015-1 Class B Pass Through Trust | 3.700 | 11-01-24 | 6,701,616 | 6,759,093 | |
| American Airlines 2016-1 Class A Pass Through Trust (A) | 4.100 | 07-15-29 | 23,339,996 | 24,221,676 | |
| SEE NOTES TO FINANCIAL STATEMENTS | SEMIANNUAL REPORT | JOHN HANCOCK BOND FUND | 23 |
| Rate (%) | Maturity date | Par value^ | Value | ||
| Industrials (continued) | |||||
| Airlines (continued) | |||||
| American Airlines 2017-1 Class A Pass Through Trust | 4.000 | 08-15-30 | 7,811,769 | $8,310,099 | |
| American Airlines 2017-1 Class AA Pass Through Trust | 3.650 | 08-15-30 | 16,600,556 | 17,621,666 | |
| American Airlines 2017-2 Class A Pass Through Trust | 3.600 | 04-15-31 | 9,054,933 | 9,271,694 | |
| American Airlines 2019-1 Class A Pass Through Trust | 3.500 | 08-15-33 | 10,384,000 | 10,614,155 | |
| American Airlines 2019-1 Class AA Pass Through Trust | 3.150 | 08-15-33 | 15,568,000 | 16,341,524 | |
| Azul Investments LLP (A)(D) | 5.875 | 10-26-24 | 13,760,000 | 13,916,864 | |
| British Airways 2013-1 Class A Pass Through Trust (D) | 4.625 | 06-20-24 | 12,404,533 | 13,072,759 | |
| British Airways 2013-1 Class B Pass Through Trust (D) | 5.625 | 12-20-21 | 575,716 | 579,616 | |
| British Airways 2018-1 Class A Pass Through Trust (D) | 4.125 | 03-20-33 | 7,639,523 | 8,053,895 | |
| Continental Airlines 2007-1 Class A Pass Through Trust | 5.983 | 10-19-23 | 7,966,501 | 8,397,928 | |
| Continental Airlines 2012-1 Class B Pass Through Trust | 6.250 | 10-11-21 | 738,714 | 745,211 | |
| Delta Air Lines 2002-1 Class G-1 Pass Through Trust | 6.718 | 07-02-24 | 5,031,054 | 5,279,744 | |
| Delta Air Lines, Inc. | 2.900 | 10-28-24 | 32,491,000 | 32,119,949 | |
| Delta Air Lines, Inc. | 3.800 | 04-19-23 | 20,208,000 | 20,835,120 | |
| Delta Air Lines, Inc. | 4.375 | 04-19-28 | 22,850,000 | 23,689,709 | |
| JetBlue 2019-1 Class AA Pass Through Trust | 2.750 | 11-15-33 | 14,832,000 | 15,060,962 | |
| United Airlines 2014-2 Class A Pass Through Trust | 3.750 | 03-03-28 | 23,236,646 | 24,475,312 | |
| United Airlines 2014-2 Class B Pass Through Trust | 4.625 | 03-03-24 | 9,909,473 | 10,222,961 | |
| United Airlines 2016-1 Class A Pass Through Trust | 3.450 | 01-07-30 | 19,623,789 | 20,210,931 | |
| United Airlines 2016-1 Class B Pass Through Trust | 3.650 | 01-07-26 | 26,581,597 | 26,894,694 | |
| United Airlines 2018-1 Class B Pass Through Trust | 4.600 | 03-01-26 | 7,088,785 | 7,372,889 | |
| United Airlines 2019-1 Class A Pass Through Trust | 4.550 | 02-25-33 | 17,175,000 | 18,790,352 | |
| US Airways 2010-1 Class A Pass Through Trust | 6.250 | 10-22-24 | 4,198,855 | 4,554,398 | |
| US Airways 2012-1 Class A Pass Through Trust | 5.900 | 04-01-26 | 6,354,500 | 7,070,750 | |
| Building products 0.1% | |||||
| Owens Corning | 3.950 | 08-15-29 | 14,998,000 | 15,483,075 | |
| 24 | JOHN HANCOCK BOND FUND | SEMIANNUAL REPORT | SEE NOTES TO FINANCIAL STATEMENTS |
| Rate (%) | Maturity date | Par value^ | Value | ||
| Industrials (continued) | |||||
| Commercial services and supplies 0.1% | |||||
| Clean Harbors, Inc. (D) | 4.875 | 07-15-27 | 2,960,000 | $3,101,488 | |
| IAA, Inc. (D) | 5.500 | 06-15-27 | 835,000 | 878,090 | |
| LSC Communications, Inc. (D) | 8.750 | 10-15-23 | 19,591,000 | 9,893,455 | |
| Prime Security Services Borrower LLC (D) | 9.250 | 05-15-23 | 2,608,000 | 2,741,660 | |
| Construction and engineering 0.2% | |||||
| AECOM | 5.125 | 03-15-27 | 22,537,000 | 24,001,905 | |
| Tutor Perini Corp. (A)(D) | 6.875 | 05-01-25 | 3,182,000 | 3,106,428 | |
| Industrial conglomerates 0.3% | |||||
| 3M Company | 3.250 | 02-14-24 | 24,330,000 | 25,501,553 | |
| General Electric Company | 5.550 | 01-05-26 | 26,960,000 | 30,731,598 | |
| Machinery 0.0% | |||||
| Harsco Corp. (D) | 5.750 | 07-31-27 | 5,035,000 | 5,299,338 | |
| Professional services 0.2% | |||||
| IHS Markit, Ltd. (D) | 4.000 | 03-01-26 | 22,669,000 | 24,071,304 | |
| IHS Markit, Ltd. (A)(D) | 4.750 | 02-15-25 | 6,967,000 | 7,603,017 | |
| IHS Markit, Ltd. (A) | 4.750 | 08-01-28 | 11,465,000 | 12,758,997 | |
| Road and rail 0.1% | |||||
| Uber Technologies, Inc. (D) | 7.500 | 09-15-27 | 20,585,000 | 20,404,881 | |
| Trading companies and distributors 0.9% | |||||
| AerCap Ireland Capital DAC | 2.875 | 08-14-24 | 24,033,000 | 24,223,520 | |
| AerCap Ireland Capital DAC | 5.000 | 10-01-21 | 16,850,000 | 17,662,977 | |
| Ahern Rentals, Inc. (D) | 7.375 | 05-15-23 | 21,183,000 | 16,522,740 | |
| Air Lease Corp. | 3.625 | 12-01-27 | 10,511,000 | 10,880,056 | |
| Aircastle, Ltd. | 4.400 | 09-25-23 | 9,561,000 | 10,136,787 | |
| Aircastle, Ltd. | 5.500 | 02-15-22 | 13,545,000 | 14,408,898 | |
| Ashtead Capital, Inc. (D) | 4.250 | 11-01-29 | 8,614,000 | 8,700,140 | |
| Ashtead Capital, Inc. (D) | 4.375 | 08-15-27 | 14,640,000 | 15,097,500 | |
| Avolon Holdings Funding, Ltd. (D) | 5.125 | 10-01-23 | 12,797,000 | 13,755,495 | |
| H&E Equipment Services, Inc. | 5.625 | 09-01-25 | 7,015,000 | 7,374,519 | |
| United Rentals North America, Inc. | 3.875 | 11-15-27 | 10,861,000 | 10,956,034 | |
| United Rentals North America, Inc. | 4.875 | 01-15-28 | 19,515,000 | 20,361,561 | |
| Information technology 4.4% | 791,869,525 | ||||
| Communications equipment 0.5% | |||||
| CommScope, Inc. (D) | 8.250 | 03-01-27 | 22,112,000 | 22,221,454 | |
| Motorola Solutions, Inc. | 4.600 | 02-23-28 | 33,189,000 | 35,832,673 | |
| Telefonaktiebolaget LM Ericsson | 4.125 | 05-15-22 | 29,710,000 | 30,786,988 | |
| Electronic equipment, instruments and components 0.1% | |||||
| Tech Data Corp. | 3.700 | 02-15-22 | 10,760,000 | 10,959,087 | |
| IT services 0.8% | |||||
| Banff Merger Sub, Inc. (D) | 9.750 | 09-01-26 | 12,341,000 | 11,566,602 | |
| Fiserv, Inc. | 2.750 | 07-01-24 | 18,919,000 | 19,217,371 | |
| SEE NOTES TO FINANCIAL STATEMENTS | SEMIANNUAL REPORT | JOHN HANCOCK BOND FUND | 25 |
| Rate (%) | Maturity date | Par value^ | Value | ||
| Information technology (continued) | |||||
| IT services (continued) | |||||
| Fiserv, Inc. | 3.200 | 07-01-26 | 27,855,000 | $28,852,252 | |
| PayPal Holdings, Inc. | 2.400 | 10-01-24 | 25,619,000 | 25,678,814 | |
| PayPal Holdings, Inc. | 2.850 | 10-01-29 | 30,408,000 | 30,339,331 | |
| Tempo Acquisition LLC (D) | 6.750 | 06-01-25 | 6,270,000 | 6,458,100 | |
| VeriSign, Inc. | 4.750 | 07-15-27 | 7,792,000 | 8,282,896 | |
| VeriSign, Inc. | 5.250 | 04-01-25 | 9,210,000 | 10,133,763 | |
| Semiconductors and semiconductor equipment 2.2% | |||||
| Broadcom Corp. | 3.875 | 01-15-27 | 47,695,000 | 48,687,247 | |
| Broadcom, Inc. (D) | 4.750 | 04-15-29 | 19,150,000 | 20,477,612 | |
| KLA Corp. | 4.100 | 03-15-29 | 17,241,000 | 18,907,081 | |
| Lam Research Corp. | 3.750 | 03-15-26 | 19,502,000 | 20,919,758 | |
| Lam Research Corp. | 4.875 | 03-15-49 | 17,074,000 | 21,241,893 | |
| Marvell Technology Group, Ltd. | 4.875 | 06-22-28 | 23,499,000 | 26,359,447 | |
| Microchip Technology, Inc. | 4.333 | 06-01-23 | 47,401,000 | 49,875,307 | |
| Micron Technology, Inc. | 4.185 | 02-15-27 | 46,310,000 | 48,703,869 | |
| Micron Technology, Inc. | 4.975 | 02-06-26 | 11,033,000 | 12,121,644 | |
| Micron Technology, Inc. | 5.327 | 02-06-29 | 42,469,000 | 47,548,196 | |
| NXP BV (D) | 3.875 | 06-18-26 | 16,420,000 | 17,233,089 | |
| NXP BV (D) | 4.625 | 06-01-23 | 34,550,000 | 36,836,131 | |
| NXP BV (D) | 4.875 | 03-01-24 | 17,920,000 | 19,458,064 | |
| Qorvo, Inc. | 5.500 | 07-15-26 | 7,029,000 | 7,477,099 | |
| Software 0.1% | |||||
| Microsoft Corp. | 4.450 | 11-03-45 | 19,750,000 | 24,895,815 | |
| Technology hardware, storage and peripherals 0.7% | |||||
| Dell International LLC (D) | 4.900 | 10-01-26 | 29,030,000 | 31,569,888 | |
| Dell International LLC (A)(D) | 5.300 | 10-01-29 | 29,321,000 | 32,455,587 | |
| Dell International LLC (D) | 8.350 | 07-15-46 | 31,996,000 | 42,930,123 | |
| Seagate HDD Cayman (A) | 4.750 | 01-01-25 | 22,665,000 | 23,842,344 | |
| Materials 1.1% | 190,908,696 | ||||
| Chemicals 0.6% | |||||
| Braskem Netherlands Finance BV (D) | 4.500 | 01-10-28 | 13,909,000 | 13,639,896 | |
| Cydsa SAB de CV (A)(D) | 6.250 | 10-04-27 | 14,025,000 | 14,112,656 | |
| Methanex Corp. | 5.250 | 12-15-29 | 18,194,000 | 18,487,044 | |
| Orbia Advance Corp. SAB de CV (D) | 5.500 | 01-15-48 | 17,715,000 | 17,604,281 | |
| Syngenta Finance NV (D) | 4.441 | 04-24-23 | 25,935,000 | 27,037,686 | |
| Syngenta Finance NV (D) | 5.676 | 04-24-48 | 8,210,000 | 8,553,310 | |
| Construction materials 0.1% | |||||
| Cemex SAB de CV (D) | 6.125 | 05-05-25 | 15,185,000 | 15,716,475 | |
| Containers and packaging 0.1% | |||||
| Ardagh Packaging Finance PLC (D) | 6.000 | 02-15-25 | 14,410,000 | 15,130,500 | |
| Klabin Finance SA (D) | 4.875 | 09-19-27 | 1,453,000 | 1,494,774 | |
| 26 | JOHN HANCOCK BOND FUND | SEMIANNUAL REPORT | SEE NOTES TO FINANCIAL STATEMENTS |
| Rate (%) | Maturity date | Par value^ | Value | ||
| Materials (continued) | |||||
| Metals and mining 0.2% | |||||
| Anglo American Capital PLC (D) | 4.750 | 04-10-27 | 13,375,000 | $14,550,075 | |
| Commercial Metals Company | 5.375 | 07-15-27 | 5,017,000 | 5,192,595 | |
| First Quantum Minerals, Ltd. (D) | 6.875 | 03-01-26 | 9,625,000 | 9,360,313 | |
| First Quantum Minerals, Ltd. (A)(D) | 7.500 | 04-01-25 | 5,100,000 | 5,010,750 | |
| Newmont Goldcorp Corp. | 2.800 | 10-01-29 | 10,482,000 | 10,373,485 | |
| Paper and forest products 0.1% | |||||
| Norbord, Inc. (A)(D) | 6.250 | 04-15-23 | 7,025,000 | 7,490,406 | |
| Suzano Austria GmbH (A) | 6.000 | 01-15-29 | 6,460,000 | 7,154,450 | |
| Real estate 1.4% | 253,498,137 | ||||
| Equity real estate investment trusts 1.4% | |||||
| American Homes 4 Rent LP | 4.250 | 02-15-28 | 22,190,000 | 23,799,878 | |
| American Tower Corp. | 2.950 | 01-15-25 | 16,023,000 | 16,327,509 | |
| American Tower Corp. | 3.550 | 07-15-27 | 32,300,000 | 33,841,820 | |
| American Tower Corp. | 3.800 | 08-15-29 | 12,980,000 | 13,841,783 | |
| CyrusOne LP (B) | 3.450 | 11-15-29 | 14,081,000 | 14,108,317 | |
| Equinix, Inc. | 3.200 | 11-18-29 | 27,111,000 | 27,176,609 | |
| Equinix, Inc. | 5.375 | 05-15-27 | 12,381,000 | 13,417,909 | |
| GLP Capital LP | 5.375 | 04-15-26 | 16,732,000 | 18,437,530 | |
| SBA Tower Trust (D) | 2.836 | 01-15-25 | 22,481,000 | 22,739,023 | |
| SBA Tower Trust (D) | 3.722 | 04-09-48 | 26,799,000 | 27,527,952 | |
| The GEO Group, Inc. | 6.000 | 04-15-26 | 4,171,000 | 3,305,518 | |
| Ventas Realty LP | 3.500 | 02-01-25 | 16,239,000 | 16,912,989 | |
| VEREIT Operating Partnership LP | 4.600 | 02-06-24 | 17,864,000 | 19,241,105 | |
| VICI Properties LP (A)(D) | 4.625 | 12-01-29 | 2,735,000 | 2,820,195 | |
| Utilities 1.4% | 258,530,224 | ||||
| Electric utilities 0.7% | |||||
| ABY Transmision Sur SA (D) | 6.875 | 04-30-43 | 9,530,535 | 11,853,698 | |
| Electricite de France SA (5.250% to 1-29-23, then 10 Year U.S. Swap Rate + 3.709%) (D)(G) | 5.250 | 01-29-23 | 27,115,000 | 28,199,600 | |
| Emera US Finance LP | 3.550 | 06-15-26 | 11,506,000 | 11,999,100 | |
| Empresa Electrica Angamos SA (D) | 4.875 | 05-25-29 | 9,234,680 | 9,402,025 | |
| Instituto Costarricense de Electricidad (D) | 6.375 | 05-15-43 | 9,810,000 | 8,228,138 | |
| Israel Electric Corp., Ltd. (D) | 6.875 | 06-21-23 | 6,630,000 | 7,527,192 | |
| Vistra Operations Company LLC (D) | 3.700 | 01-30-27 | 27,272,000 | 26,973,120 | |
| Vistra Operations Company LLC (D) | 4.300 | 07-15-29 | 24,825,000 | 25,592,712 | |
| Gas utilities 0.1% | |||||
| AmeriGas Partners LP | 5.500 | 05-20-25 | 12,441,000 | 13,314,607 | |
| Independent power and renewable electricity producers 0.6% | |||||
| Clearway Energy Operating LLC | 5.375 | 08-15-24 | 13,749,000 | 14,092,725 | |
| Greenko Dutch BV (D) | 4.875 | 07-24-22 | 11,885,000 | 11,902,828 | |
| SEE NOTES TO FINANCIAL STATEMENTS | SEMIANNUAL REPORT | JOHN HANCOCK BOND FUND | 27 |
| Rate (%) | Maturity date | Par value^ | Value | ||
| Utilities (continued) | |||||
| Independent power and renewable electricity producers (continued) | |||||
| Greenko Dutch BV (D) | 5.250 | 07-24-24 | 7,105,000 | $7,190,971 | |
| LLPL Capital Pte, Ltd. (D) | 6.875 | 02-04-39 | 3,595,072 | 4,159,138 | |
| NextEra Energy Capital Holdings, Inc. | 3.550 | 05-01-27 | 32,227,000 | 34,418,088 | |
| NextEra Energy Operating Partners LP (D) | 3.875 | 10-15-26 | 15,359,000 | 15,267,614 | |
| NextEra Energy Operating Partners LP (A)(D) | 4.500 | 09-15-27 | 5,100,000 | 5,202,000 | |
| NRG Energy, Inc. (D) | 3.750 | 06-15-24 | 12,190,000 | 12,566,704 | |
| Multi-utilities 0.0% | |||||
| CenterPoint Energy, Inc. | 2.500 | 09-01-24 | 10,639,000 | 10,639,964 | |
| Term loans (H) 0.0% | $4,122,305 | ||||
| (Cost $4,463,017) | |||||
| Financials 0.0% | 4,122,305 | ||||
| Capital markets 0.0% | |||||
| LSF9 Atlantis Holdings LLC, 2017 Term Loan (1 month LIBOR + 6.000%) | 7.758 | 05-01-23 | 4,482,813 | 4,122,305 | |
| Collateralized mortgage obligations 6.4% | $1,152,968,720 | ||||
| (Cost $1,163,806,901) | |||||
| Commercial and residential 5.1% | 914,034,262 | ||||
| Americold LLC | |||||
| Series 2010-ARTA, Class C (D) | 6.811 | 01-14-29 | 2,150,000 | 2,211,380 | |
| Series 2010-ARTA, Class D (D) | 7.443 | 01-14-29 | 9,783,000 | 10,097,070 | |
| Angel Oak Mortgage Trust I LLC | |||||
| Series 2018-1, Class A1 (D)(I) | 3.258 | 04-27-48 | 2,469,323 | 2,477,299 | |
| Series 2018-3, Class A1 (D)(I) | 3.649 | 09-25-48 | 6,781,636 | 6,867,661 | |
| AOA
Mortgage Trust Series 2015-1177, Class C (D)(I) |
3.110 | 12-13-29 | 6,896,000 | 6,942,915 | |
| Arroyo Mortgage Trust | |||||
| Series 2018-1, Class A1 (D)(I) | 3.763 | 04-25-48 | 28,168,452 | 28,633,716 | |
| Series 2019-2, Class A1 (D)(I) | 3.347 | 04-25-49 | 25,812,044 | 26,116,350 | |
| Series 2019-3, Class A1 (D)(I) | 2.962 | 10-25-48 | 14,778,002 | 14,837,859 | |
| BAMLL
Commercial Mortgage Securities Trust Series 2019-BPR, Class ENM (D)(I) |
3.843 | 11-05-32 | 11,565,000 | 10,941,427 | |
| Barclays
Commercial Mortgage Trust Series 2019-C5, Class A2 |
3.043 | 11-15-52 | 15,448,000 | 15,961,221 | |
| BBCMS
Mortgage Trust Series 2018-TALL, Class E (1 month LIBOR + 2.437%) (C)(D) |
4.351 | 03-15-37 | 9,590,000 | 9,586,934 | |
| BBCMS Trust | |||||
| Series 2015-MSQ, Class D (D)(I) | 4.123 | 09-15-32 | 7,340,000 | 7,460,075 | |
| Series 2015-SRCH, Class D (D)(I) | 5.122 | 08-10-35 | 15,371,000 | 16,824,121 | |
| Bear
Stearns Commercial Mortgage Securities Trust Series 2005-PWR8, Class X1 IO (D) |
0.798 | 06-11-41 | 310,076 | 806 | |
| BENCHMARK Mortgage Trust | |||||
| 28 | JOHN HANCOCK BOND FUND | SEMIANNUAL REPORT | SEE NOTES TO FINANCIAL STATEMENTS |
| Rate (%) | Maturity date | Par value^ | Value | ||
| Commercial and residential (continued) | |||||
| Series 2019-B10, Class A2 | 3.614 | 03-15-62 | 20,454,000 | $21,553,732 | |
| Series 2019-B11, Class A2 | 3.410 | 05-15-52 | 16,845,000 | 17,660,414 | |
| Series 2019-B12, Class A2 | 3.001 | 08-15-52 | 21,935,000 | 22,641,618 | |
| Series 2019-B13, Class A2 | 2.889 | 08-15-57 | 19,985,000 | 20,535,261 | |
| Series 2019-B14, Class A2 | 2.915 | 12-15-61 | 19,098,000 | 19,669,998 | |
| BRAVO
Residential Funding Trust Series 2019-NQM1, Class A1 (D)(I) |
2.666 | 07-25-59 | 11,091,771 | 11,092,737 | |
| Bunker
Hill Loan Depositary Trust Series 2019-1, Class A1 (D) |
3.613 | 10-26-48 | 3,059,667 | 3,095,641 | |
| BWAY Mortgage Trust | |||||
| Series 2013-1515, Class XB IO (D) | 0.534 | 03-10-33 | 46,410,000 | 944,861 | |
| Series 2015-1740, Class XA IO (D) | 1.023 | 01-10-35 | 123,773,000 | 2,385,898 | |
| BX
Commercial Mortgage Trust Series 2018-BIOA, Class D (1 month LIBOR + 1.321%) (C)(D) |
3.235 | 03-15-37 | 12,620,000 | 12,627,884 | |
| CAMB
Commercial Mortgage Trust Series 2019-LIFE, Class D (1 month LIBOR + 1.750%) (C)(D) |
3.671 | 12-15-37 | 6,315,000 | 6,336,650 | |
| CGBAM
Commercial Mortgage Trust Series 2015-SMRT, Class F (D)(I) |
3.912 | 04-10-28 | 5,190,000 | 5,195,967 | |
| CGDBB
Commercial Mortgage Trust Series 2017-BIOC, Class E (1 month LIBOR + 2.150%) (C)(D) |
4.064 | 07-15-32 | 9,287,082 | 9,287,058 | |
| CHT
Mortgage Trust Series 2017-CSMO, Class D (1 month LIBOR + 2.250%) (C)(D) |
4.171 | 11-15-36 | 17,654,000 | 17,664,863 | |
| Citigroup Commercial Mortgage Trust | |||||
| Series 2017-1500, Class E (1 month LIBOR + 2.500%) (C)(D) | 4.414 | 07-15-32 | 4,667,000 | 4,686,744 | |
| Series 2019-PRM, Class A (D) | 3.341 | 05-10-36 | 8,060,000 | 8,396,527 | |
| Series 2019-SMRT, Class A (D) | 4.149 | 01-10-36 | 6,922,000 | 7,405,813 | |
| COLT Mortgage Loan Trust | |||||
| Series 2018-2, Class A1 (D)(I) | 3.470 | 07-27-48 | 1,782,323 | 1,788,597 | |
| Series 2019-2, Class A1 (D)(I) | 3.337 | 05-25-49 | 10,341,885 | 10,364,302 | |
| Commercial Mortgage Trust (Cantor Fitzgerald/Deutsche Bank AG) | |||||
| Series 2012-CR2, Class XA IO | 1.797 | 08-15-45 | 67,008,984 | 2,341,368 | |
| Series 2012-CR3 Class XA IO | 2.019 | 10-15-45 | 95,057,581 | 4,103,588 | |
| Series 2014-CR15, Class XA IO | 1.091 | 02-10-47 | 67,005,099 | 2,107,230 | |
| Series 2014-CR20, Class A3 | 3.326 | 11-10-47 | 34,710,000 | 36,322,516 | |
| Series 2016-CR28, Class A3 | 3.495 | 02-10-49 | 9,285,000 | 9,842,232 | |
| Commercial
Mortgage Trust (Citigroup/Deutsche Bank AG) Series 2018-COR3, Class XA IO |
0.587 | 05-10-51 | 225,229,115 | 7,660,898 | |
| Commercial Mortgage Trust (Deutsche Bank AG) | |||||
| Series 2012-LC4, Class B (I) | 4.934 | 12-10-44 | 3,986,000 | 4,150,570 | |
| Series 2013-300P, Class D (D)(I) | 4.540 | 08-10-30 | 18,343,000 | 19,137,949 | |
| Series 2013-LC13, Class B (D)(I) | 5.009 | 08-10-46 | 6,206,000 | 6,686,097 | |
| Series 2017-PANW, Class A (D) | 3.244 | 10-10-29 | 7,194,000 | 7,471,628 | |
| SEE NOTES TO FINANCIAL STATEMENTS | SEMIANNUAL REPORT | JOHN HANCOCK BOND FUND | 29 |
| Rate (%) | Maturity date | Par value^ | Value | ||
| Commercial and residential (continued) | |||||
| Credit
Suisse First Boston Mortgage Securities Corp. Series 2005-C1, Class AX IO (D) |
0.872 | 02-15-38 | 417,399 | $16 | |
| Credit
Suisse Mortgage Capital Certificates Series 2019-ICE4, Class D (1 month LIBOR + 1.600%) (C)(D) |
3.514 | 05-15-36 | 37,335,000 | 37,381,755 | |
| CSMC
Trust Series 2019-AFC1, Class A1 (D) |
2.573 | 07-25-49 | 25,125,750 | 25,077,287 | |
| Galton
Funding Mortgage Trust Series 2018-1, Class A43 (D)(I) |
3.500 | 11-25-57 | 4,621,710 | 4,671,559 | |
| GCAT
LLC Series 2019-NQM1, Class A1 (D) |
2.985 | 02-25-59 | 26,665,522 | 26,873,561 | |
| GE
Capital Commercial Mortgage Corp. Series 2005-C1, Class XC IO (D) |
0.011 | 06-10-48 | 70,375 | 0 | |
| GS Mortgage Securities Trust | |||||
| Series 2005-GG4, Class XC IO (D) | 1.590 | 07-10-39 | 10,319 | 1 | |
| Series 2011-GC5, Class XA IO (D) | 1.497 | 08-10-44 | 13,937,052 | 230,887 | |
| Series 2012-GC17, Class XA IO | 2.352 | 05-10-45 | 84,365,335 | 2,500,867 | |
| Series 2015-590M, Class C (D)(I) | 3.932 | 10-10-35 | 6,950,000 | 7,221,129 | |
| Series 2015-GC30, Class A3 | 3.119 | 05-10-50 | 20,640,000 | 21,467,245 | |
| Series 2015-GC34, Class A4 | 3.506 | 10-10-48 | 10,099,000 | 10,713,986 | |
| Series 2016-RENT, Class D (D)(I) | 4.202 | 02-10-29 | 13,051,000 | 13,189,827 | |
| Series 2017-485L, Class C (D)(I) | 4.115 | 02-10-37 | 6,600,000 | 6,879,215 | |
| Series 2019-GC39, Class A2 | 3.457 | 05-10-52 | 23,885,000 | 25,025,174 | |
| Series 2019-GC40, Class A2 | 2.971 | 07-10-52 | 20,410,000 | 21,095,660 | |
| HarborView Mortgage Loan Trust | |||||
| Series 2007-3, Class ES IO (D) | 0.350 | 05-19-47 | 32,725,399 | 556,878 | |
| Series 2007-4, Class ES IO | 0.350 | 07-19-47 | 32,782,608 | 477,829 | |
| Series 2007-6, Class ES IO (D) | 0.343 | 08-19-37 | 29,063,448 | 410,794 | |
| Hilton
Orlando Trust Series 2018-ORL, Class D (1 month LIBOR + 1.700%) (C)(D) |
3.614 | 12-15-34 | 6,995,000 | 6,994,816 | |
| Hudsons
Bay Simon JV Trust Series 2015-HBFL, Class DFL (1 month LIBOR + 3.900%) (C)(D) |
2.063 | 08-05-34 | 5,240,000 | 5,235,376 | |
| IMT Trust | |||||
| Series 2017-APTS, Class AFX (D) | 3.478 | 06-15-34 | 7,679,000 | 8,027,309 | |
| Series 2017-APTS, Class CFX (D)(I) | 3.613 | 06-15-34 | 6,867,000 | 7,021,557 | |
| Irvine Core Office Trust | |||||
| Series 2013-IRV, Class A2 (D)(I) | 3.279 | 05-15-48 | 15,265,000 | 15,793,525 | |
| Series 2013-IRV, Class XA IO (D) | 1.211 | 05-15-48 | 12,073,232 | 231,298 | |
| JPMBB Commercial Mortgage Securities Trust | |||||
| Series 2013-C14, Class XA IO | 0.730 | 08-15-46 | 10,531,006 | 193,239 | |
| Series 2015-C31, Class A3 | 3.801 | 08-15-48 | 10,725,000 | 11,521,775 | |
| Series 2016-C1, Class A4 | 3.311 | 03-15-49 | 7,425,000 | 7,783,809 | |
| JPMorgan Chase Commercial Mortgage Securities Trust | |||||
| Series 2011-C3A, Class XA IO (D) | 1.136 | 02-15-46 | 9,336,283 | 81,234 | |
| Series 2011-C4, Class XA IO (D) | 1.362 | 07-15-46 | 6,592,629 | 83,424 | |
| 30 | JOHN HANCOCK BOND FUND | SEMIANNUAL REPORT | SEE NOTES TO FINANCIAL STATEMENTS |
| Rate (%) | Maturity date | Par value^ | Value | ||
| Commercial and residential (continued) | |||||
| Series 2012-HSBC, Class XA IO (D) | 1.582 | 07-05-32 | 83,392,262 | $2,734,966 | |
| Series 2015-JP1, Class A4 | 3.650 | 01-15-49 | 12,190,000 | 13,011,048 | |
| KNDL
Mortgage Trust Series 2019-KNSQ, Class D (1 month LIBOR + 1.350%) (C)(D) |
3.271 | 05-15-36 | 9,440,000 | 9,434,069 | |
| Merrill
Lynch Mortgage Trust Series 2005-CIP1, Class XC IO (D) |
0.010 | 07-12-38 | 3,048,365 | 134 | |
| Morgan Stanley Bank of America Merrill Lynch Trust | |||||
| Series 2012-C5, Class XA IO (D) | 1.597 | 08-15-45 | 12,702,152 | 387,010 | |
| Series 2012-C6, Class XA IO (D) | 1.767 | 11-15-45 | 7,514,986 | 274,224 | |
| Morgan Stanley Capital I Trust | |||||
| Series 2011-C3, Class XA IO (D) | 0.727 | 07-15-49 | 6,763,252 | 49,374 | |
| Series 2017-CLS, Class D (1 month LIBOR + 1.400%) (C)(D) | 3.314 | 11-15-34 | 15,867,000 | 15,866,973 | |
| MSCG
Trust Series 2016-SNR, Class D (D) |
6.550 | 11-15-34 | 9,724,850 | 9,977,849 | |
| Natixis Commercial Mortgage Securities Trust | |||||
| Series 2018-285M, Class D (D)(I) | 3.917 | 11-15-32 | 4,795,000 | 4,894,725 | |
| Series 2018-ALXA, Class C (D)(I) | 4.460 | 01-15-43 | 7,332,000 | 8,031,722 | |
| One
Market Plaza Trust Series 2017-1MKT, Class D (D) |
4.146 | 02-10-32 | 5,035,000 | 5,165,229 | |
| Seasoned
Credit Risk Transfer Trust Series 2019-2, Class MA |
3.500 | 08-25-58 | 24,601,298 | 25,638,924 | |
| Starwood
Mortgage Residential Trust Series 2018-IMC1, Class A1 (D)(I) |
3.793 | 03-25-48 | 4,312,717 | 4,348,952 | |
| Towd
Point Mortgage Trust Series 2019-4, Class A1 (D)(I) |
2.900 | 10-25-59 | 17,658,000 | 17,857,776 | |
| UBS
Commercial Mortgage Trust Series 2012-C1, Class B |
4.822 | 05-10-45 | 3,520,000 | 3,684,678 | |
| Verus
Securitization Trust Series 2018-3, Class A1 (D)(I) |
4.108 | 10-25-58 | 16,693,314 | 16,883,070 | |
| VNDO
Mortgage Trust Series 2013-PENN, Class D (D)(I) |
4.079 | 12-13-29 | 16,804,000 | 16,930,902 | |
| Wells Fargo Commercial Mortgage Trust | |||||
| Series 2013-120B, Class C (D)(I) | 2.800 | 03-18-28 | 14,886,000 | 14,855,528 | |
| Series 2017-SMP, Class D (1 month LIBOR + 1.650%) (C)(D) | 3.571 | 12-15-34 | 5,170,000 | 5,152,595 | |
| WF-RBS Commercial Mortgage Trust | |||||
| Series 2011-C2, Class XA IO (D) | 0.970 | 02-15-44 | 34,830,057 | 225,128 | |
| Series 2011-C3, Class XA IO (D) | 1.490 | 03-15-44 | 21,550,410 | 337,044 | |
| Series 2012-C10, Class XA IO (D) | 1.694 | 12-15-45 | 8,625,641 | 344,256 | |
| Series 2012-C9, Class XA IO (D) | 2.058 | 11-15-45 | 56,828,671 | 2,522,602 | |
| Series 2013-C15, Class B (I) | 4.644 | 08-15-46 | 2,704,000 | 2,869,938 | |
| Series 2013-C16, Class B (I) | 5.192 | 09-15-46 | 3,216,000 | 3,478,845 | |
| Series 2013-C16, Class XA IO | 0.872 | 09-15-46 | 10,719,324 | 218,194 | |
| U.S. Government Agency 1.3% | 238,934,458 | ||||
| Federal Home Loan Mortgage Corp. | |||||
| Series K005, Class AX IO | 1.746 | 11-25-19 | 21,192,431 | 21 | |
| SEE NOTES TO FINANCIAL STATEMENTS | SEMIANNUAL REPORT | JOHN HANCOCK BOND FUND | 31 |
| Rate (%) | Maturity date | Par value^ | Value | ||
| U.S. Government Agency (continued) | |||||
| Series K006, Class BX1 IO | 5.550 | 02-25-20 | 4,444,655 | $44 | |
| Series K010, Class X1 IO | 0.288 | 10-25-20 | 27,892,789 | 23,026 | |
| Series K011, Class X1 IO | 0.323 | 11-25-20 | 45,480,093 | 64,850 | |
| Series K014, Class X1 IO | 1.324 | 04-25-21 | 37,300,904 | 489,627 | |
| Series K015, Class X1 IO | 1.739 | 07-25-21 | 37,844,694 | 795,851 | |
| Series K017, Class X1 IO | 1.445 | 12-25-21 | 163,246,494 | 3,368,624 | |
| Series K018, Class X1 IO | 1.449 | 01-25-22 | 100,514,440 | 2,214,263 | |
| Series K021, Class X1 IO | 1.560 | 06-25-22 | 33,557,550 | 1,046,029 | |
| Series K022, Class X1 IO | 1.341 | 07-25-22 | 137,087,598 | 3,626,954 | |
| Series K024, Class X1 IO | 0.945 | 09-25-22 | 10,024,319 | 200,986 | |
| Series K026, Class X1 IO | 1.103 | 11-25-22 | 15,378,364 | 370,549 | |
| Series K038, Class X1 IO | 1.289 | 03-25-24 | 4,535,713 | 185,326 | |
| Series K040, Class A2 | 3.241 | 09-25-24 | 13,165,000 | 13,895,600 | |
| Series K043, Class A2 | 3.062 | 12-25-24 | 22,020,000 | 23,095,477 | |
| Series K715, Class X1 IO | 1.232 | 01-25-21 | 14,144,206 | 112,644 | |
| Series K718, Class X1 IO | 0.729 | 01-25-22 | 13,119,755 | 136,550 | |
| Series KAIV, Class X1 IO | 1.244 | 06-25-21 | 22,907,400 | 304,064 | |
| Series KIR3, Class A1 | 3.038 | 08-25-27 | 34,200,000 | 35,724,742 | |
| Series KS01, Class X1 IO | 1.390 | 01-25-23 | 10,721,959 | 287,541 | |
| Series KS03, Class X IO | 0.415 | 08-25-25 | 37,730,794 | 333,823 | |
| Series T-41, Class 3A (I) | 5.415 | 07-25-32 | 1,130 | 1,247 | |
| Federal National Mortgage Association | |||||
| Series 2001-50, Class BA | 7.000 | 10-25-41 | 169 | 190 | |
| Series 2012-M5, Class X IO | 0.628 | 02-25-22 | 18,972,162 | 172,926 | |
| Government National Mortgage Association | |||||
| Series 2008-90, Class IO | 1.877 | 12-16-50 | 2,631,802 | 557,965 | |
| Series 2012-114, Class IO | 0.786 | 01-16-53 | 23,264,359 | 1,062,518 | |
| Series 2012-120, Class IO | 0.795 | 02-16-53 | 9,908,776 | 479,013 | |
| Series 2012-125, Class IO | 0.387 | 02-16-53 | 12,706,786 | 338,197 | |
| Series 2012-70, Class IO | 0.440 | 08-16-52 | 6,287,995 | 87,162 | |
| Series 2013-63, Class IO | 0.794 | 09-16-51 | 14,704,957 | 735,439 | |
| Series 2016-174, Class IO | 0.913 | 11-16-56 | 45,234,382 | 3,264,335 | |
| Series 2017-109, Class IO | 0.600 | 04-16-57 | 92,922,355 | 4,689,150 | |
| Series 2017-124, Class IO | 0.709 | 01-16-59 | 124,058,681 | 7,622,748 | |
| Series 2017-135, Class IO | 0.839 | 10-16-58 | 87,628,496 | 5,661,581 | |
| Series 2017-140, Class IO | 0.609 | 02-16-59 | 73,026,525 | 4,101,177 | |
| Series 2017-159, Class IO | 0.544 | 06-16-59 | 101,338,245 | 5,189,623 | |
| Series 2017-169, Class IO | 0.733 | 01-16-60 | 177,717,181 | 11,275,071 | |
| Series 2017-20, Class IO | 0.743 | 12-16-58 | 190,900,938 | 10,995,741 | |
| Series 2017-22, Class IO | 0.933 | 12-16-57 | 35,713,527 | 2,703,521 | |
| Series 2017-41, Class IO | 0.792 | 07-16-58 | 65,944,390 | 3,984,439 | |
| Series 2017-46, Class IO | 0.620 | 11-16-57 | 86,945,973 | 4,806,260 | |
| Series 2017-61, Class IO | 0.766 | 05-16-59 | 54,876,043 | 3,665,764 | |
| Series 2017-74, Class IO | 0.775 | 09-16-58 | 123,381,455 | 6,887,326 | |
| Series 2017-89, Class IO | 0.766 | 07-16-59 | 122,985,466 | 8,205,430 | |
| 32 | JOHN HANCOCK BOND FUND | SEMIANNUAL REPORT | SEE NOTES TO FINANCIAL STATEMENTS |
| Rate (%) | Maturity date | Par value^ | Value | ||
| U.S. Government Agency (continued) | |||||
| Series 2018-081, Class IO | 0.448 | 01-16-60 | 45,650,162 | $2,460,192 | |
| Series 2018-114, Class IO | 0.540 | 04-16-60 | 186,586,243 | 10,954,012 | |
| Series 2018-158, Class IO | 0.727 | 05-16-61 | 149,433,070 | 11,037,037 | |
| Series 2018-35, Class IO | 0.527 | 03-16-60 | 137,672,739 | 7,350,251 | |
| Series 2018-43, Class IO | 0.576 | 05-16-60 | 215,831,029 | 12,160,460 | |
| Series 2018-68, Class IO | 0.478 | 01-16-60 | 24,777,657 | 1,261,931 | |
| Series 2018-69, Class IO | 0.542 | 04-16-60 | 97,719,213 | 5,791,446 | |
| Series 2018-9, Class IO | 0.559 | 01-16-60 | 106,775,940 | 5,775,895 | |
| Series 2018-99, Class IO | 0.482 | 06-16-60 | 173,659,530 | 9,379,820 | |
| Asset backed securities 6.7% | $1,192,933,425 | ||||
| (Cost $1,176,581,130) | |||||
| Asset backed securities 6.7% | 1,192,933,425 | ||||
| AccessLex Institute | |||||
| Series 2005-1, Class A4 (3 month LIBOR + 0.210%) (C) | 2.369 | 06-22-37 | 8,006,240 | 7,630,190 | |
| Series 2006-1, Class A3 (3 month LIBOR + 0.200%) (C) | 2.332 | 08-25-37 | 30,759,793 | 29,393,403 | |
| Series 2007-A, Class A3 (3 month LIBOR + 0.300%) (C) | 2.432 | 05-25-36 | 10,322,628 | 10,111,747 | |
| Americredit Automobile Receivables Trust | |||||
| Series 2018-2, Class C | 3.590 | 06-18-24 | 9,055,000 | 9,345,646 | |
| Series 2018-3, Class C | 3.740 | 10-18-24 | 8,303,000 | 8,648,682 | |
| Amresco
Residential Securities Corp. Mortgage Loan Trust Series 1998-1, Class A6 (I) |
6.510 | 08-25-27 | 2 | 2 | |
| Applebee's
Funding LLC Series 2019-1A, Class A2I (D) |
4.194 | 06-07-49 | 26,903,000 | 27,227,988 | |
| Arby's
Funding LLC Series 2015-1A, Class A2 (D) |
4.969 | 10-30-45 | 21,052,800 | 21,558,488 | |
| Avis Budget Rental Car Funding AESOP LLC | |||||
| Series 2019-1A, Class A (D) | 3.450 | 03-20-23 | 17,091,000 | 17,513,836 | |
| Series 2019-3A, Class A (D) | 2.360 | 03-20-26 | 20,570,000 | 20,495,253 | |
| BRE
Grand Islander Timeshare Issuer LLC Series 2019-A, Class A (D) |
3.280 | 09-26-33 | 11,435,798 | 11,702,472 | |
| CLI
Funding LLC Series 2018-1A, Class A (D) |
4.030 | 04-18-43 | 19,179,993 | 19,318,315 | |
| CNH
Equipment Trust Series 2018-B, Class A3 |
3.190 | 11-15-23 | 20,219,000 | 20,565,370 | |
| Coinstar
Funding LLC Series 2017-1A, Class A2 (D) |
5.216 | 04-25-47 | 19,851,000 | 20,413,194 | |
| ContiMortgage
Home Equity Loan Trust Series 1995-2, Class A5 |
8.100 | 08-15-25 | 86,619 | 50,356 | |
| Corevest
American Finance Trust Series 2019-3, Class A (D) |
2.705 | 10-15-52 | 5,177,000 | 5,200,742 | |
| CWABS
Asset-Backed Certificates Trust Series 2004-10, Class AF5B |
4.561 | 02-25-35 | 1,067,350 | 1,068,436 | |
| DB Master Finance LLC | |||||
| SEE NOTES TO FINANCIAL STATEMENTS | SEMIANNUAL REPORT | JOHN HANCOCK BOND FUND | 33 |
| Rate (%) | Maturity date | Par value^ | Value | ||
| Asset backed securities (continued) | |||||
| Series 2017-1A, Class A2I (D) | 3.629 | 11-20-47 | 9,310,980 | $9,459,676 | |
| Series 2017-1A, Class A2II (D) | 4.030 | 11-20-47 | 8,687,700 | 8,981,605 | |
| Series 2019-1A, Class A2I (D) | 3.787 | 05-20-49 | 51,287,275 | 52,594,588 | |
| Domino's
Pizza Master Issuer LLC Series 2017-1A, Class A23 (D) |
4.118 | 07-25-47 | 32,638,900 | 33,924,873 | |
| Driven
Brands Funding LLC Series 2015-1A, Class A2 (D) |
5.216 | 07-20-45 | 27,984,000 | 28,742,926 | |
| FOCUS
Brands Funding LLC Series 2017-1A, Class A2I (D) |
3.857 | 04-30-47 | 7,634,250 | 7,660,512 | |
| Ford Credit Floorplan Master Owner Trust | |||||
| Series 2018-3, Class A1 | 3.520 | 10-15-23 | 39,255,000 | 40,327,549 | |
| Series 2019-2, Class A | 3.320 | 04-15-26 | 32,163,000 | 33,261,026 | |
| GMF
Floorplan Owner Revolving Trust Series 2019-2, Class A (D) |
2.900 | 04-15-26 | 28,785,000 | 29,525,733 | |
| Goal
Capital Funding Trust Series 2005-2, Class A4 (3 month LIBOR + 0.200%) (C) |
2.332 | 08-25-44 | 35,444,251 | 34,197,599 | |
| Golden
Credit Card Trust Series 2018-4A, Class A (D) |
3.440 | 10-15-25 | 22,572,000 | 23,692,291 | |
| Hilton Grand Vacations Trust | |||||
| Series 2017-AA, Class A (D) | 2.660 | 12-26-28 | 17,542,869 | 17,591,436 | |
| Series 2018-AA, Class A (D) | 3.540 | 02-25-32 | 6,182,764 | 6,377,504 | |
| Jack in the Box Funding LLC | |||||
| Series 2019-1A, Class A23 (D) | 4.970 | 08-25-49 | 10,650,000 | 10,822,637 | |
| Series 2019-1A, Class A2I (D) | 3.982 | 08-25-49 | 12,305,000 | 12,467,426 | |
| KeyCorp
Student Loan Trust Series 2004-A, Class 1A2 (3 month LIBOR + 0.240%) (C) |
2.496 | 10-27-42 | 8,713,373 | 8,413,865 | |
| Laurel
Road Prime Student Loan Trust Series 2019-A, Class A2FX (D) |
2.730 | 10-25-48 | 6,880,000 | 6,910,348 | |
| MelTel
Land Funding LLC Series 2019-1A, Class A (D) |
3.768 | 04-15-49 | 11,089,000 | 11,352,741 | |
| Mill
City Mortgage Loan Trust Series 2018-3, Class A1 (D)(I) |
3.500 | 08-25-58 | 7,930,004 | 8,136,168 | |
| MMAF Equipment Finance LLC | |||||
| Series 2017-B, Class A3 (D) | 2.210 | 10-17-22 | 13,988,201 | 13,999,684 | |
| Series 2019-A, Class A3 (D) | 3.270 | 11-13-23 | 14,642,000 | 14,861,870 | |
| MVW Owner Trust | |||||
| Series 2014-1A, Class A (D) | 2.250 | 09-22-31 | 482,242 | 481,765 | |
| Series 2015-1A, Class A (D) | 2.520 | 12-20-32 | 1,340,259 | 1,340,319 | |
| Series 2018-1A, Class A (D) | 3.450 | 01-21-36 | 14,642,591 | 15,055,713 | |
| Navient
Private Education Loan Trust Series 2016-AA, Class A2A (D) |
3.910 | 12-15-45 | 8,327,356 | 8,624,528 | |
| Navient
Private Education Refi Loan Trust Series 2019-FA, Class A2 (D) |
2.600 | 08-15-68 | 26,997,000 | 27,029,607 | |
| New Residential Mortgage LLC | |||||
| Series 2018-FNT1, Class A (D) | 3.610 | 05-25-23 | 10,419,325 | 10,552,319 | |
| Series 2018-FNT2, Class A (D) | 3.790 | 07-25-54 | 6,197,509 | 6,295,236 |
| 34 | JOHN HANCOCK BOND FUND | SEMIANNUAL REPORT | SEE NOTES TO FINANCIAL STATEMENTS |
| Rate (%) | Maturity date | Par value^ | Value | ||
| Asset backed securities (continued) | |||||
| NextGear
Floorplan Master Owner Trust Series 2018-2A, Class A2 (D) |
3.690 | 10-15-23 | 16,070,000 | $16,526,619 | |
| NRZ Excess Spread-Collateralized Notes | |||||
| Series 2018-PLS1, Class A (D) | 3.193 | 01-25-23 | 4,680,022 | 4,697,196 | |
| Series 2018-PLS2, Class A (D) | 3.265 | 02-25-23 | 16,794,240 | 16,812,225 | |
| Oxford
Finance Funding LLC Series 2019-1A, Class A2 (D) |
4.459 | 02-15-27 | 7,463,000 | 7,638,790 | |
| PFS
Financing Corp. Series 2018-B, Class A (D) |
2.890 | 02-15-23 | 16,720,000 | 16,870,866 | |
| Renaissance
Home Equity Loan Trust Series 2005-2, Class AF4 |
4.934 | 08-25-35 | 5,588,419 | 5,737,544 | |
| Santander
Revolving Auto Loan Trust Series 2019-A, Class A (D) |
2.510 | 01-26-32 | 21,072,000 | 21,040,278 | |
| SCF
Equipment Leasing LLC Series 2019-1A, Class A2 (D) |
3.230 | 10-20-24 | 8,135,000 | 8,200,564 | |
| Sesac
Finance LLC Series 2019-1, Class A2 (D) |
5.216 | 07-25-49 | 17,969,963 | 18,483,544 | |
| Sierra Timeshare Receivables Funding LLC | |||||
| Series 2018-2A, Class A (D) | 3.500 | 06-20-35 | 8,526,665 | 8,709,391 | |
| Series 2018-3A, Class D (D) | 5.200 | 09-20-35 | 3,926,986 | 4,011,708 | |
| Series 2019-1A, Class A (D) | 3.200 | 01-20-36 | 8,805,930 | 8,912,338 | |
| SMB Private Education Loan Trust | |||||
| Series 2015-C, Class A2A (D) | 2.750 | 07-15-27 | 6,460,230 | 6,497,457 | |
| Series 2019-B, Class A2A (D) | 2.840 | 06-15-37 | 26,747,000 | 27,141,376 | |
| Sonic
Capital LLC Series 2016-1A, Class A2 (D) |
4.472 | 05-20-46 | 3,532,815 | 3,562,879 | |
| Structured
Asset Securities Corp. Mortgage Loan Trust Series 2005-2XS, Class 2A2 (1 month LIBOR + 1.500%) (C) |
3.281 | 02-25-35 | 3,443 | 3,482 | |
| SunTrust
Student Loan Trust Series 2006-1A, Class A4 (3 month LIBOR + 0.190%) (C)(D) |
2.126 | 10-28-37 | 32,978,973 | 31,911,955 | |
| Taco Bell Funding LLC | |||||
| Series 2016-1A, Class A2II (D) | 4.377 | 05-25-46 | 2,681,250 | 2,719,002 | |
| Series 2018-1A, Class A2I (D) | 4.318 | 11-25-48 | 27,576,450 | 28,382,510 | |
| TAL
Advantage V LLC Series 2014-1A, Class A (D) |
3.510 | 02-22-39 | 2,059,125 | 2,057,175 | |
| Towd Point Mortgage Trust | |||||
| Series 2015-1, Class A5 (D)(I) | 3.955 | 10-25-53 | 4,950,000 | 5,142,244 | |
| Series 2015-2, Class 1M2 (D)(I) | 3.792 | 11-25-60 | 10,860,000 | 11,408,434 | |
| Series 2016-5, Class A1 (D)(I) | 2.500 | 10-25-56 | 7,746,132 | 7,763,445 | |
| Series 2017-1, Class A1 (D)(I) | 2.750 | 10-25-56 | 2,813,486 | 2,825,145 | |
| Series 2017-2, Class A1 (D)(I) | 2.750 | 04-25-57 | 2,933,545 | 2,957,641 | |
| Series 2018-1, Class A1 (D)(I) | 3.000 | 01-25-58 | 7,028,275 | 7,102,685 | |
| Series 2018-3, Class A1 (D)(I) | 3.750 | 05-25-58 | 10,986,990 | 11,427,916 | |
| Series 2018-4, Class A1 (D)(I) | 3.000 | 06-25-58 | 24,349,985 | 24,853,664 | |
| Series 2018-5, Class A1A (D)(I) | 3.250 | 07-25-58 | 4,500,132 | 4,587,901 | |
| Series 2018-6, Class A1A (D)(I) | 3.750 | 03-25-58 | 30,321,133 | 31,202,869 |
| SEE NOTES TO FINANCIAL STATEMENTS | SEMIANNUAL REPORT | JOHN HANCOCK BOND FUND | 35 |
| Rate (%) | Maturity date | Par value^ | Value | ||
| Asset backed securities (continued) | |||||
| Series 2019-1, Class A1 (D)(I) | 3.750 | 03-25-58 | 16,259,599 | $16,958,107 | |
| Toyota
Auto Loan Extended Note Trust Series 2019-1A, Class A (D) |
3.270 | 11-25-31 | 58,504,000 | 59,619,677 | |
| Triton
Container Finance V LLC Series 2018-1A, Class A (D) |
3.950 | 03-20-43 | 16,420,833 | 16,501,855 | |
| Vantage
Data Centers Issuer LLC Series 2018-1A, Class A2 (D) |
4.072 | 02-16-43 | 12,472,838 | 12,898,609 | |
| VSE
VOI Mortgage LLC Series 2017-A, Class A (D) |
2.330 | 03-20-35 | 9,337,744 | 9,325,260 | |
| Westgate Resorts LLC | |||||
| Series 2016-1A, Class A (D) | 3.500 | 12-20-28 | 1,101,788 | 1,105,744 | |
| Series 2017-1A, Class A (D) | 3.050 | 12-20-30 | 3,662,805 | 3,679,204 | |
| Westlake
Automobile Receivables Trust Series 2019-1A, Class C (D) |
4.050 | 03-15-24 | 10,588,000 | 10,730,462 | |
| Shares | Value | ||||
| Preferred securities 0.2% | $40,030,116 | ||||
| (Cost $37,129,655) | |||||
| Consumer staples 0.0% | 2,404,140 | ||||
| Food and staples retailing 0.0% | |||||
| Ocean Spray Cranberries, Inc., 6.250% (D) | 28,284 | 2,404,140 | |||
| Financials 0.1% | 12,924,013 | ||||
| Banks 0.1% | |||||
| GMAC Capital Trust I (3 month LIBOR + 5.785%), 7.695% (C) | 377,982 | 9,801,073 | |||
| Wells Fargo & Company, Series L, 7.500% | 2,139 | 3,122,940 | |||
| Information technology 0.1% | 18,387,044 | ||||
| Semiconductors and semiconductor equipment 0.1% | |||||
| Broadcom, Inc., 8.000% | 15,892 | 18,387,044 | |||
| Utilities 0.0% | 6,314,919 | ||||
| Electric utilities 0.0% | |||||
| The Southern Company, 6.750% | 38,814 | 2,044,722 | |||
| Multi-utilities 0.0% | |||||
| Dominion Energy, Inc., 7.250% | 24,838 | 2,621,651 | |||
| DTE Energy Company, 6.250% | 33,037 | 1,648,546 | |||
| Rate (%) | Maturity date | Par value^ | Value | ||
| Escrow certificates 0.0% | $279,948 | ||||
| (Cost $0) | |||||
| Stearns Holdings LLC (F)(J) | 9.375 | 08-15-20 | 2,428,000 | 279,948 | |
| 36 | JOHN HANCOCK BOND FUND | SEMIANNUAL REPORT | SEE NOTES TO FINANCIAL STATEMENTS |
| Yield* (%) | Maturity date | Par value^ | Value | ||
| Short-term investments 4.7% | $843,473,806 | ||||
| (Cost $843,458,438) | |||||
| U.S. Government Agency 0.9% | 155,755,000 | ||||
| Federal Home Loan Bank Discount Note | 1.530 | 12-02-19 | 123,871,000 | 123,871,000 | |
| Federal Home Loan Mortgage Corp. Discount Note | 1.530 | 12-02-19 | 31,884,000 | 31,884,000 |
| Yield (%) | Shares | Value | |||
| Short-term funds 2.2% | 400,776,806 | ||||
| John Hancock Collateral Trust (K) | 1.7887(L) | 40,052,448 | 400,776,806 | ||
| Par value^ | Value | ||||
| Repurchase agreement 1.6% | 286,942,000 | ||||
| Barclays Tri-Party Repurchase Agreement dated 11-29-19 at 1.600% to be repurchased at $277,094,941 on 12-2-19, collateralized by $281,919,300 U.S. Treasury Notes, 1.846% due 10-31-21 (maturity value of $282,636,861) | 277,058,000 | 277,058,000 | |||
| Repurchase Agreement with State Street Corp. dated 11-29-19 at 0.550% to be repurchased at $9,884,453 on 12-2-19, collateralized by $10,005,000 U.S. Treasury Notes, 2.000% due 10-31-21 (maturity value of $10,083,929) | 9,884,000 | 9,884,000 |
| Total investments (Cost $18,038,305,893) 103.1% | $18,529,031,546 | ||||
| Other assets and liabilities, net (3.1%) | (555,632,558) | ||||
| Total net assets 100.0% | $17,973,398,988 | ||||
| The percentage shown for each investment category is the total value of the category as a percentage of the net assets of the fund. | |
| ^All par values are denominated in U.S. dollars unless otherwise indicated. | |
| Security Abbreviations and Legend | |
| CMT | Constant Maturity Treasury |
| IO | Interest-Only Security - (Interest Tranche of Stripped Mortgage Pool). Rate shown is the annualized yield at the end of the period. |
| ISDAFIX | International Swaps and Derivatives Association Fixed Interest Rate Swap Rate |
| LIBOR | London Interbank Offered Rate |
| TBA | To Be Announced. A forward mortgage-backed securities trade issued by a U.S. Government Agency, to be delivered at an agreed-upon future settlement date. |
| (A) | All or a portion of this security is on loan as of 11-30-19. |
| (B) | Security purchased or sold on a when-issued or delayed delivery basis. |
| (C) | Variable rate obligation. The coupon rate shown represents the rate at period end. |
| (D) | These securities are exempt from registration under Rule 144A of the Securities Act of 1933. Such securities may be resold, normally to qualified institutional buyers, in transactions exempt from registration. Rule 144A securities amounted to $4,224,634,093 or 23.5% of the fund's net assets as of 11-30-19. |
| (E) | Non-income producing - Issuer is in default. |
| (F) | Security is valued using significant unobservable inputs and is classified as Level 3 in the fair value hierarchy. |
| SEE NOTES TO FINANCIAL STATEMENTS | SEMIANNUAL REPORT | JOHN HANCOCK BOND FUND | 37 |
| (G) | Perpetual bonds have no stated maturity date. Date shown as maturity date is next call date. |
| (H) | Term loans are variable rate obligations. The coupon rate shown represents the rate at period end. |
| (I) | Variable or floating rate security, the interest rate of which adjusts periodically based on a weighted average of interest rates and prepayments on the underlying pool of assets. The interest rate shown is the current rate as of period end. |
| (J) | Non-income producing security. |
| (K) | Investment is an affiliate of the fund, the advisor and/or subadvisor. This security represents the investment of cash collateral received for securities lending. |
| (L) | The rate shown is the annualized seven-day yield as of 11-30-19. |
| * | Yield represents either the annualized yield at the date of purchase, the stated coupon rate or, for floating rate securities, the rate at period end. |
| 38 | JOHN HANCOCK BOND FUND | SEMIANNUAL REPORT | SEE NOTES TO FINANCIAL STATEMENTS |
| Financial statements |
| Assets | |
| Unaffiliated investments, at value (Cost $17,637,537,839) including $392,455,313 of securities loaned | $18,128,254,740 |
| Affiliated investments, at value (Cost $400,768,054) | 400,776,806 |
| Total investments, at value (Cost $18,038,305,893) | 18,529,031,546 |
| Dividends and interest receivable | 119,960,836 |
| Receivable for fund shares sold | 39,189,514 |
| Receivable for investments sold | 4,370,103 |
| Receivable for delayed delivery securities sold | 461,164,423 |
| Receivable for securities lending income | 108,351 |
| Other assets | 813,259 |
| Total assets | 19,154,638,032 |
| Liabilities | |
| Due to custodian | 180,874 |
| Distributions payable | 892,748 |
| Payable for investments purchased | 24,912,875 |
| Payable for delayed delivery securities purchased | 740,057,518 |
| Payable for fund shares repurchased | 10,254,505 |
| Payable upon return of securities loaned | 400,768,957 |
| Payable to affiliates | |
| Accounting and legal services fees | 2,176,850 |
| Transfer agent fees | 673,853 |
| Distribution and service fees | 240,364 |
| Trustees' fees | 9,200 |
| Other liabilities and accrued expenses | 1,071,300 |
| Total liabilities | 1,181,239,044 |
| Net assets | $17,973,398,988 |
| Net assets consist of | |
| Paid-in capital | $17,447,566,490 |
| Total distributable earnings (loss) | 525,832,498 |
| Net assets | $17,973,398,988 |
| SEE NOTES TO FINANCIAL STATEMENTS | SEMIANNUAL REPORT | JOHN HANCOCK Bond Fund | 39 |
| Net asset value per share | |
| Based on net asset value and shares outstanding - the fund has an unlimited number of shares authorized with no par value | |
| Class A ($1,921,403,533 ÷ 118,433,733 shares)1 | $16.22 |
| Class B ($5,238,370 ÷ 322,929 shares)1 | $16.22 |
| Class C ($265,348,395 ÷ 16,354,772 shares)1 | $16.22 |
| Class I ($3,901,719,659 ÷ 240,467,220 shares) | $16.23 |
| Class R2 ($97,668,580 ÷ 6,013,238 shares) | $16.24 |
| Class R4 ($51,235,614 ÷ 3,153,472 shares) | $16.25 |
| Class R6 ($7,348,361,887 ÷ 452,128,135 shares) | $16.25 |
| Class NAV ($4,382,422,950 ÷ 269,733,834 shares) | $16.25 |
| Maximum offering price per share | |
| Class A (net asset value per share ÷ 96%)2 | $16.90 |
| 1 | Redemption price per share is equal to net asset value less any applicable contingent deferred sales charge. |
| 2 | On single retail sales of less than $100,000. On sales of $100,000 or more and on group sales the offering price is reduced. |
| 40 | JOHN HANCOCK Bond Fund | SEMIANNUAL REPORT | SEE NOTES TO FINANCIAL STATEMENTS |
| Investment income | |
| Interest | $312,326,708 |
| Dividends | 860,752 |
| Securities lending | 785,386 |
| Total investment income | 313,972,846 |
| Expenses | |
| Investment management fees | 26,766,900 |
| Distribution and service fees | 4,359,620 |
| Accounting and legal services fees | 1,876,130 |
| Transfer agent fees | 3,793,077 |
| Trustees' fees | 140,585 |
| Custodian fees | 909,646 |
| State registration fees | 204,582 |
| Printing and postage | 526,678 |
| Professional fees | 178,724 |
| Other | 410,389 |
| Total expenses | 39,166,331 |
| Less expense reductions | (652,437) |
| Net expenses | 38,513,894 |
| Net investment income | 275,458,952 |
| Realized and unrealized gain (loss) | |
| Net realized gain (loss) on | |
| Unaffiliated investments | 164,350,360 |
| Affiliated investments | 5,767 |
| 164,356,127 | |
| Change in net unrealized appreciation (depreciation) of | |
| Unaffiliated investments and translation of assets and liabilities in foreign currencies | 247,347,254 |
| Affiliated investments | (20,468) |
| 247,326,786 | |
| Net realized and unrealized gain | 411,682,913 |
| Increase in net assets from operations | $687,141,865 |
| SEE NOTES TO FINANCIAL STATEMENTS | SEMIANNUAL REPORT | JOHN HANCOCK Bond Fund | 41 |
| Six
months ended 11-30-19 (unaudited) |
Year
ended 5-31-19 | |
| Increase (decrease) in net assets | ||
| From operations | ||
| Net investment income | $275,458,952 | $472,691,700 |
| Net realized gain | 164,356,127 | 39,483,787 |
| Change in net unrealized appreciation (depreciation) | 247,326,786 | 442,582,432 |
| Increase in net assets resulting from operations | 687,141,865 | 954,757,919 |
| Distributions to shareholders | ||
| From earnings | ||
| Class A | (27,631,733) | (51,559,846) |
| Class B | (70,870) | (230,390) |
| Class C | (3,089,715) | (6,855,193) |
| Class I | (57,661,353) | (87,367,701) |
| Class R2 | (1,369,596) | (2,632,937) |
| Class R4 | (755,382) | (1,436,288) |
| Class R6 | (120,698,095) | (233,167,054) |
| Class NAV | (75,756,955) | (123,286,684) |
| Total distributions | (287,033,699) | (506,536,093) |
| From fund share transactions | 1,547,213,009 | 3,548,411,057 |
| Total increase | 1,947,321,175 | 3,996,632,883 |
| Net assets | ||
| Beginning of period | 16,026,077,813 | 12,029,444,930 |
| End of period | $17,973,398,988 | $16,026,077,813 |
| 42 | JOHN HANCOCK Bond Fund | SEMIANNUAL REPORT | SEE NOTES TO FINANCIAL STATEMENTS |
| Financial highlights |
| CLASS A SHARES Period ended | 11-30-19 1 | 5-31-19 | 5-31-18 | 5-31-17 | 5-31-16 | 5-31-15 |
| Per share operating performance | ||||||
| Net asset value, beginning of period | $15.83 | $15.41 | $15.93 | $15.79 | $16.06 | $16.26 |
| Net investment income2 | 0.24 | 0.49 | 0.46 | 0.45 | 0.47 | 0.53 |
| Net realized and unrealized gain (loss) on investments | 0.40 | 0.46 | (0.47) | 0.18 | (0.23) | (0.05) |
| Total from investment operations | 0.64 | 0.95 | (0.01) | 0.63 | 0.24 | 0.48 |
| Less distributions | ||||||
| From net investment income | (0.25) | (0.53) | (0.51) | (0.49) | (0.51) | (0.63) |
| From net realized gain | — | — | — | — | — | (0.05) |
| Total distributions | (0.25) | (0.53) | (0.51) | (0.49) | (0.51) | (0.68) |
| Net asset value, end of period | $16.22 | $15.83 | $15.41 | $15.93 | $15.79 | $16.06 |
| Total return (%)3,4 | 4.04 5 | 6.33 | (0.11) | 4.07 | 1.59 | 3.02 |
| Ratios and supplemental data | ||||||
| Net assets, end of period (in millions) | $1,921 | $1,688 | $1,488 | $1,492 | $1,904 | $1,740 |
| Ratios (as a percentage of average net assets): | ||||||
| Expenses before reductions | 0.79 6 | 0.78 | 0.81 | 0.89 | 0.93 | 0.94 |
| Expenses including reductions | 0.78 6 | 0.78 | 0.79 | 0.83 | 0.87 | 0.89 |
| Net investment income | 2.93 6 | 3.21 | 2.93 | 2.83 | 3.01 | 3.25 |
| Portfolio turnover (%) | 67 | 106 | 74 | 98 7 | 56 | 66 |
| 1 | Six months ended 11-30-19. Unaudited. |
| 2 | Based on average daily shares outstanding. |
| 3 | Total returns would have been lower had certain expenses not been reduced during the applicable periods. |
| 4 | Does not reflect the effect of sales charges, if any. |
| 5 | Not annualized. |
| 6 | Annualized. |
| 7 | Excludes merger activity. |
| SEE NOTES TO FINANCIAL STATEMENTS | SEMIANNUAL REPORT | JOHN HANCOCK Bond Fund | 43 |
| CLASS B SHARES Period ended | 11-30-19 1 | 5-31-19 | 5-31-18 | 5-31-17 | 5-31-16 | 5-31-15 |
| Per share operating performance | ||||||
| Net asset value, beginning of period | $15.83 | $15.40 | $15.93 | $15.79 | $16.06 | $16.26 |
| Net investment income2 | 0.18 | 0.39 | 0.35 | 0.34 | 0.36 | 0.42 |
| Net realized and unrealized gain (loss) on investments | 0.40 | 0.46 | (0.48) | 0.18 | (0.23) | (0.05) |
| Total from investment operations | 0.58 | 0.85 | (0.13) | 0.52 | 0.13 | 0.37 |
| Less distributions | ||||||
| From net investment income | (0.19) | (0.42) | (0.40) | (0.38) | (0.40) | (0.52) |
| From net realized gain | — | — | — | — | — | (0.05) |
| Total distributions | (0.19) | (0.42) | (0.40) | (0.38) | (0.40) | (0.57) |
| Net asset value, end of period | $16.22 | $15.83 | $15.40 | $15.93 | $15.79 | $16.06 |
| Total return (%)3,4 | 3.68 5 | 5.66 | (0.87) | 3.35 | 0.88 | 2.31 |
| Ratios and supplemental data | ||||||
| Net assets, end of period (in millions) | $5 | $7 | $11 | $16 | $23 | $28 |
| Ratios (as a percentage of average net assets): | ||||||
| Expenses before reductions | 1.49 6 | 1.48 | 1.51 | 1.59 | 1.63 | 1.64 |
| Expenses including reductions | 1.48 6 | 1.48 | 1.49 | 1.53 | 1.57 | 1.59 |
| Net investment income | 2.22 6 | 2.51 | 2.22 | 2.14 | 2.32 | 2.57 |
| Portfolio turnover (%) | 67 | 106 | 74 | 98 7 | 56 | 66 |
| 1 | Six months ended 11-30-19. Unaudited. |
| 2 | Based on average daily shares outstanding. |
| 3 | Total returns would have been lower had certain expenses not been reduced during the applicable periods. |
| 4 | Does not reflect the effect of sales charges, if any. |
| 5 | Not annualized. |
| 6 | Annualized. |
| 7 | Excludes merger activity. |
| 44 | JOHN HANCOCK Bond Fund | SEMIANNUAL REPORT | SEE NOTES TO FINANCIAL STATEMENTS |
| CLASS C SHARES Period ended | 11-30-19 1 | 5-31-19 | 5-31-18 | 5-31-17 | 5-31-16 | 5-31-15 |
| Per share operating performance | ||||||
| Net asset value, beginning of period | $15.84 | $15.41 | $15.93 | $15.79 | $16.06 | $16.26 |
| Net investment income2 | 0.18 | 0.39 | 0.35 | 0.34 | 0.36 | 0.41 |
| Net realized and unrealized gain (loss) on investments | 0.39 | 0.46 | (0.47) | 0.18 | (0.23) | (0.04) |
| Total from investment operations | 0.57 | 0.85 | (0.12) | 0.52 | 0.13 | 0.37 |
| Less distributions | ||||||
| From net investment income | (0.19) | (0.42) | (0.40) | (0.38) | (0.40) | (0.52) |
| From net realized gain | — | — | — | — | — | (0.05) |
| Total distributions | (0.19) | (0.42) | (0.40) | (0.38) | (0.40) | (0.57) |
| Net asset value, end of period | $16.22 | $15.84 | $15.41 | $15.93 | $15.79 | $16.06 |
| Total return (%)3,4 | 3.61 5 | 5.66 | (0.80) | 3.35 | 0.88 | 2.31 |
| Ratios and supplemental data | ||||||
| Net assets, end of period (in millions) | $265 | $252 | $269 | $299 | $310 | $250 |
| Ratios (as a percentage of average net assets): | ||||||
| Expenses before reductions | 1.49 6 | 1.48 | 1.51 | 1.59 | 1.63 | 1.64 |
| Expenses including reductions | 1.48 6 | 1.48 | 1.49 | 1.53 | 1.57 | 1.59 |
| Net investment income | 2.22 6 | 2.51 | 2.23 | 2.14 | 2.31 | 2.53 |
| Portfolio turnover (%) | 67 | 106 | 74 | 98 7 | 56 | 66 |
| 1 | Six months ended 11-30-19. Unaudited. |
| 2 | Based on average daily shares outstanding. |
| 3 | Total returns would have been lower had certain expenses not been reduced during the applicable periods. |
| 4 | Does not reflect the effect of sales charges, if any. |
| 5 | Not annualized. |
| 6 | Annualized. |
| 7 | Excludes merger activity. |
| SEE NOTES TO FINANCIAL STATEMENTS | SEMIANNUAL REPORT | JOHN HANCOCK Bond Fund | 45 |
| CLASS I SHARES Period ended | 11-30-19 1 | 5-31-19 | 5-31-18 | 5-31-17 | 5-31-16 | 5-31-15 |
| Per share operating performance | ||||||
| Net asset value, beginning of period | $15.84 | $15.41 | $15.93 | $15.80 | $16.06 | $16.26 |
| Net investment income2 | 0.26 | 0.53 | 0.50 | 0.50 | 0.52 | 0.57 |
| Net realized and unrealized gain (loss) on investments | 0.40 | 0.47 | (0.47) | 0.17 | (0.22) | (0.04) |
| Total from investment operations | 0.66 | 1.00 | 0.03 | 0.67 | 0.30 | 0.53 |
| Less distributions | ||||||
| From net investment income | (0.27) | (0.57) | (0.55) | (0.54) | (0.56) | (0.68) |
| From net realized gain | — | — | — | — | — | (0.05) |
| Total distributions | (0.27) | (0.57) | (0.55) | (0.54) | (0.56) | (0.73) |
| Net asset value, end of period | $16.23 | $15.84 | $15.41 | $15.93 | $15.80 | $16.06 |
| Total return (%)3 | 4.19 4 | 6.70 | 0.19 | 4.33 | 1.97 | 3.35 |
| Ratios and supplemental data | ||||||
| Net assets, end of period (in millions) | $3,902 | $2,928 | $2,236 | $5,385 | $1,367 | $793 |
| Ratios (as a percentage of average net assets): | ||||||
| Expenses before reductions | 0.49 5 | 0.50 | 0.51 | 0.57 | 0.61 | 0.63 |
| Expenses including reductions | 0.48 5 | 0.49 | 0.49 | 0.51 | 0.56 | 0.57 |
| Net investment income | 3.21 5 | 3.48 | 3.19 | 3.15 | 3.32 | 3.53 |
| Portfolio turnover (%) | 67 | 106 | 74 | 98 6 | 56 | 66 |
| 1 | Six months ended 11-30-19. Unaudited. |
| 2 | Based on average daily shares outstanding. |
| 3 | Total returns would have been lower had certain expenses not been reduced during the applicable periods. |
| 4 | Not annualized. |
| 5 | Annualized. |
| 6 | Excludes merger activity. |
| 46 | JOHN HANCOCK Bond Fund | SEMIANNUAL REPORT | SEE NOTES TO FINANCIAL STATEMENTS |
| CLASS R2 SHARES Period ended | 11-30-19 1 | 5-31-19 | 5-31-18 | 5-31-17 | 5-31-16 | 5-31-15 |
| Per share operating performance | ||||||
| Net asset value, beginning of period | $15.85 | $15.42 | $15.95 | $15.81 | $16.08 | $16.27 |
| Net investment income2 | 0.23 | 0.48 | 0.45 | 0.44 | 0.46 | 0.51 |
| Net realized and unrealized gain (loss) on investments | 0.40 | 0.47 | (0.49) | 0.18 | (0.23) | (0.02) |
| Total from investment operations | 0.63 | 0.95 | (0.04) | 0.62 | 0.23 | 0.49 |
| Less distributions | ||||||
| From net investment income | (0.24) | (0.52) | (0.49) | (0.48) | (0.50) | (0.63) |
| From net realized gain | — | — | — | — | — | (0.05) |
| Total distributions | (0.24) | (0.52) | (0.49) | (0.48) | (0.50) | (0.68) |
| Net asset value, end of period | $16.24 | $15.85 | $15.42 | $15.95 | $15.81 | $16.08 |
| Total return (%)3 | 3.99 4 | 6.29 | (0.27) | 3.97 | 1.55 | 2.97 |
| Ratios and supplemental data | ||||||
| Net assets, end of period (in millions) | $98 | $86 | $83 | $56 | $56 | $39 |
| Ratios (as a percentage of average net assets): | ||||||
| Expenses before reductions | 0.88 5 | 0.88 | 0.92 | 0.98 | 1.03 | 0.98 |
| Expenses including reductions | 0.87 5 | 0.88 | 0.89 | 0.92 | 0.97 | 0.93 |
| Net investment income | 2.84 5 | 3.11 | 2.84 | 2.75 | 2.92 | 3.16 |
| Portfolio turnover (%) | 67 | 106 | 74 | 98 6 | 56 | 66 |
| 1 | Six months ended 11-30-19. Unaudited. |
| 2 | Based on average daily shares outstanding. |
| 3 | Total returns would have been lower had certain expenses not been reduced during the applicable periods. |
| 4 | Not annualized. |
| 5 | Annualized. |
| 6 | Excludes merger activity. |
| SEE NOTES TO FINANCIAL STATEMENTS | SEMIANNUAL REPORT | JOHN HANCOCK Bond Fund | 47 |
| CLASS R4 SHARES Period ended | 11-30-19 1 | 5-31-19 | 5-31-18 | 5-31-17 | 5-31-16 | 5-31-15 2 |
| Per share operating performance | ||||||
| Net asset value, beginning of period | $15.86 | $15.43 | $15.95 | $15.81 | $16.08 | $16.15 |
| Net investment income3 | 0.25 | 0.52 | 0.49 | 0.49 | 0.51 | 0.06 |
| Net realized and unrealized gain (loss) on investments | 0.40 | 0.47 | (0.48) | 0.17 | (0.22) | (0.03) |
| Total from investment operations | 0.65 | 0.99 | 0.01 | 0.66 | 0.29 | 0.03 |
| Less distributions | ||||||
| From net investment income | (0.26) | (0.56) | (0.53) | (0.52) | (0.56) | (0.10) |
| Net asset value, end of period | $16.25 | $15.86 | $15.43 | $15.95 | $15.81 | $16.08 |
| Total return (%)4 | 4.12 5 | 6.55 | 0.05 | 4.25 | 1.86 | 0.18 5 |
| Ratios and supplemental data | ||||||
| Net assets, end of period (in millions) | $51 | $44 | $39 | $29 | $— 6 | $— 6 |
| Ratios (as a percentage of average net assets): | ||||||
| Expenses before reductions | 0.72 7 | 0.74 | 0.76 | 0.82 | 0.82 | 0.80 7 |
| Expenses including reductions | 0.62 7 | 0.63 | 0.64 | 0.66 | 0.66 | 0.64 7 |
| Net investment income | 3.10 7 | 3.36 | 3.09 | 3.09 | 3.24 | 2.21 7 |
| Portfolio turnover (%) | 67 | 106 | 74 | 98 8 | 56 | 66 9 |
| 1 | Six months ended 11-30-19. Unaudited. |
| 2 | The inception date for Class R4 shares is 3-27-15. |
| 3 | Based on average daily shares outstanding. |
| 4 | Total returns would have been lower had certain expenses not been reduced during the applicable periods. |
| 5 | Not annualized. |
| 6 | Less than $500,000. |
| 7 | Annualized. |
| 8 | Excludes merger activity. |
| 9 | Portfolio turnover is shown for the period from 6-1-14 to 5-31-15. |
| 48 | JOHN HANCOCK Bond Fund | SEMIANNUAL REPORT | SEE NOTES TO FINANCIAL STATEMENTS |
| CLASS R6 SHARES Period ended | 11-30-19 1 | 5-31-19 | 5-31-18 | 5-31-17 | 5-31-16 | 5-31-15 |
| Per share operating performance | ||||||
| Net asset value, beginning of period | $15.86 | $15.43 | $15.96 | $15.81 | $16.08 | $16.28 |
| Net investment income2 | 0.27 | 0.55 | 0.53 | 0.52 | 0.54 | 0.59 |
| Net realized and unrealized gain (loss) on investments | 0.40 | 0.47 | (0.49) | 0.19 | (0.23) | (0.04) |
| Total from investment operations | 0.67 | 1.02 | 0.04 | 0.71 | 0.31 | 0.55 |
| Less distributions | ||||||
| From net investment income | (0.28) | (0.59) | (0.57) | (0.56) | (0.58) | (0.70) |
| From net realized gain | — | — | — | — | — | (0.05) |
| Total distributions | (0.28) | (0.59) | (0.57) | (0.56) | (0.58) | (0.75) |
| Net asset value, end of period | $16.25 | $15.86 | $15.43 | $15.96 | $15.81 | $16.08 |
| Total return (%)3 | 4.24 4 | 6.81 | 0.23 | 4.58 | 2.02 | 3.45 |
| Ratios and supplemental data | ||||||
| Net assets, end of period (in millions) | $7,348 | $6,560 | $5,944 | $529 | $118 | $93 |
| Ratios (as a percentage of average net assets): | ||||||
| Expenses before reductions | 0.38 5 | 0.39 | 0.42 | 0.48 | 0.52 | 0.54 |
| Expenses including reductions | 0.37 5 | 0.38 | 0.39 | 0.41 | 0.44 | 0.46 |
| Net investment income | 3.33 5 | 3.61 | 3.37 | 3.27 | 3.45 | 3.66 |
| Portfolio turnover (%) | 67 | 106 | 74 | 98 6 | 56 | 66 |
| 1 | Six months ended 11-30-19. Unaudited. |
| 2 | Based on average daily shares outstanding. |
| 3 | Total returns would have been lower had certain expenses not been reduced during the applicable periods. |
| 4 | Not annualized. |
| 5 | Annualized. |
| 6 | Excludes merger activity. |
| SEE NOTES TO FINANCIAL STATEMENTS | SEMIANNUAL REPORT | JOHN HANCOCK Bond Fund | 49 |
| CLASS NAV SHARES Period ended | 11-30-19 1 | 5-31-19 | 5-31-18 | 5-31-17 | 5-31-16 2 |
| Per share operating performance | |||||
| Net asset value, beginning of period | $15.86 | $15.43 | $15.95 | $15.81 | $15.78 |
| Net investment income3 | 0.27 | 0.56 | 0.53 | 0.51 | 0.41 |
| Net realized and unrealized gain (loss) on investments | 0.40 | 0.47 | (0.48) | 0.19 | 0.06 |
| Total from investment operations | 0.67 | 1.03 | 0.05 | 0.70 | 0.47 |
| Less distributions | |||||
| From net investment income | (0.28) | (0.60) | (0.57) | (0.56) | (0.44) |
| Net asset value, end of period | $16.25 | $15.86 | $15.43 | $15.95 | $15.81 |
| Total return (%)4 | 4.25 5 | 6.83 | 0.30 | 4.51 | 3.03 5 |
| Ratios and supplemental data | |||||
| Net assets, end of period (in millions) | $4,382 | $4,461 | $1,959 | $1,862 | $2 |
| Ratios (as a percentage of average net assets): | |||||
| Expenses before reductions | 0.37 6 | 0.37 | 0.40 | 0.46 | 0.50 6 |
| Expenses including reductions | 0.36 6 | 0.37 | 0.38 | 0.41 | 0.44 6 |
| Net investment income | 3.35 6 | 3.63 | 3.34 | 3.28 | 3.44 6 |
| Portfolio turnover (%) | 67 | 106 | 74 | 98 7 | 56 8 |
| 1 | Six months ended 11-30-19. Unaudited. |
| 2 | The inception date for Class NAV shares is 8-31-15. |
| 3 | Based on average daily shares outstanding. |
| 4 | Total returns would have been lower had certain expenses not been reduced during the applicable periods. |
| 5 | Not annualized. |
| 6 | Annualized. |
| 7 | Excludes merger activity. |
| 8 | The portfolio turnover is shown for the period from 6-1-15 to 5-31-16. |
| 50 | JOHN HANCOCK Bond Fund | SEMIANNUAL REPORT | SEE NOTES TO FINANCIAL STATEMENTS |
| Notes to financial statements (unaudited) |
| SEMIANNUAL REPORT | JOHN HANCOCK Bond Fund | 51 |
| Total
value at 11-30-19 |
Level
1 quoted price |
Level
2 significant observable inputs |
Level
3 significant unobservable inputs | |
| Investments in securities: | ||||
| Assets | ||||
| U.S. Government and Agency obligations | $7,933,986,343 | — | $7,933,986,343 | — |
| Foreign government obligations | 79,082,762 | — | 79,082,762 | — |
| Corporate bonds | 7,282,154,121 | — | 7,282,154,121 | — |
| Term loans | 4,122,305 | — | 4,122,305 | — |
| Collateralized mortgage obligations | 1,152,968,720 | — | 1,152,968,720 | — |
| Asset backed securities | 1,192,933,425 | — | 1,192,933,425 | — |
| Preferred securities | 40,030,116 | $37,625,976 | 2,404,140 | — |
| Escrow certificates | 279,948 | — | — | $279,948 |
| Short-term investments | 843,473,806 | 400,776,806 | 442,697,000 | — |
| Total investments in securities | $18,529,031,546 | $438,402,782 | $18,090,348,816 | $279,948 |
| 52 | JOHN HANCOCK Bond Fund | SEMIANNUAL REPORT |
| SEMIANNUAL REPORT | JOHN HANCOCK Bond Fund | 53 |
| 54 | JOHN HANCOCK Bond Fund | SEMIANNUAL REPORT |
| SEMIANNUAL REPORT | JOHN HANCOCK Bond Fund | 55 |
| 56 | JOHN HANCOCK Bond Fund | SEMIANNUAL REPORT |
| Class | Rule 12b-1 Fee | Service fee |
| Class A | 0.30% | — |
| Class B | 1.00% | — |
| Class C | 1.00% | — |
| Class R2 | 0.25% | 0.25% |
| Class R4 | 0.25% | 0.10% |
| SEMIANNUAL REPORT | JOHN HANCOCK Bond Fund | 57 |
| Class | Distribution and service fees | Transfer agent fees |
| Class A | $2,708,949 | $1,092,492 |
| Class B | 29,968 | 3,625 |
| Class C | 1,309,577 | 158,458 |
| Class I | — | 2,084,140 |
| Class R2 | 230,174 | 5,905 |
| Class R4 | 80,952 | 2,999 |
| Class R6 | — | 445,458 |
| Total | $4,359,620 | $3,793,077 |
| Borrower
or Lender |
Weighted
Average Loan Balance |
Days
Outstanding |
Weighted
Average Interest Rate |
Interest
Income (Expense) |
| Lender | $2,984,445 | 1 | 1.850% | $153 |
| Six Months Ended 11-30-19 | Year Ended 5-31-19 | |||
| Shares | Amount | Shares | Amount | |
| Class A shares | ||||
| Sold | 18,348,818 | $296,325,919 | 26,954,829 | $416,858,752 |
| Distributions reinvested | 1,642,599 | 26,598,089 | 3,200,787 | 49,262,981 |
| Repurchased | (8,158,071) | (131,807,050) | (20,121,476) | (308,683,359) |
| Net increase | 11,833,346 | $191,116,958 | 10,034,140 | $157,438,374 |
| 58 | JOHN HANCOCK Bond Fund | SEMIANNUAL REPORT |
| Six Months Ended 11-30-19 | Year Ended 5-31-19 | |||
| Shares | Amount | Shares | Amount | |
| Class B shares | ||||
| Sold | 3,493 | $56,671 | 4,653 | $70,739 |
| Distributions reinvested | 4,160 | 67,308 | 14,133 | 217,216 |
| Repurchased | (107,924) | (1,740,224) | (281,557) | (4,322,775) |
| Net decrease | (100,271) | $(1,616,245) | (262,771) | $(4,034,820) |
| Class C shares | ||||
| Sold | 2,105,506 | $33,991,292 | 2,701,117 | $41,576,151 |
| Distributions reinvested | 181,200 | 2,933,663 | 426,403 | 6,560,181 |
| Repurchased | (1,872,927) | (30,245,800) | (4,654,352) | (71,339,295) |
| Net increase (decrease) | 413,779 | $6,679,155 | (1,526,832) | $(23,202,963) |
| Class I shares | ||||
| Sold | 80,528,864 | $1,300,198,584 | 96,960,267 | $1,496,504,211 |
| Distributions reinvested | 3,354,993 | 54,348,560 | 5,258,651 | 81,006,463 |
| Repurchased | (28,320,670) | (457,443,860) | (62,450,126) | (957,926,278) |
| Net increase | 55,563,187 | $897,103,284 | 39,768,792 | $619,584,396 |
| Class R2 shares | ||||
| Sold | 1,353,227 | $21,866,190 | 1,768,277 | $27,269,421 |
| Distributions reinvested | 73,191 | 1,186,511 | 151,590 | 2,335,814 |
| Repurchased | (822,189) | (13,280,825) | (1,912,822) | (29,407,872) |
| Net increase | 604,229 | $9,771,876 | 7,045 | $197,363 |
| Class R4 shares | ||||
| Sold | 591,062 | $9,621,676 | 622,397 | $9,616,684 |
| Distributions reinvested | 46,572 | 755,248 | 93,146 | 1,435,800 |
| Repurchased | (239,039) | (3,860,940) | (505,533) | (7,766,948) |
| Net increase | 398,595 | $6,515,984 | 210,010 | $3,285,536 |
| Class R6 shares | ||||
| Sold | 67,926,956 | $1,098,827,934 | 101,956,557 | $1,572,817,631 |
| Distributions reinvested | 7,419,013 | 120,345,483 | 15,084,491 | 232,593,564 |
| Repurchased | (36,767,936) | (595,401,007) | (88,632,863) | (1,360,912,144) |
| Net increase | 38,578,033 | $623,772,410 | 28,408,185 | $444,499,051 |
| Class NAV shares | ||||
| Sold | 11,589,400 | $187,875,456 | 190,488,426 | $2,904,904,253 |
| Distributions reinvested | 4,673,000 | 75,756,955 | 7,984,258 | 123,286,684 |
| Repurchased | (27,851,121) | (449,762,824) | (44,157,186) | (677,546,817) |
| Net increase (decrease) | (11,588,721) | $(186,130,413) | 154,315,498 | $2,350,644,120 |
| Total net increase | 95,702,177 | $1,547,213,009 | 230,954,067 | $3,548,411,057 |
| SEMIANNUAL REPORT | JOHN HANCOCK Bond Fund | 59 |
| Dividends and distributions | |||||||||
| Affiliate | Ending
share amount |
Beginning
value |
Cost
of purchases |
Proceeds
from shares sold |
Realized
gain (loss) |
Change
in unrealized appreciation (depreciation) |
Income
distributions received |
Capital
gain distributions received |
Ending
value |
| John Hancock Collateral Trust* | 40,052,448 | $163,520,202 | $2,550,630,264 | $(2,313,358,959) | $5,767 | $(20,468) | $785,386 | — | $400,776,806 |
| * | Refer to the Securities lending note within Note 2 for details regarding this investment. |
| 60 | JOHN HANCOCK Bond Fund | SEMIANNUAL REPORT |
CONTINUATION OF INVESTMENT ADVISORY AND SUBADVISORY AGREEMENTS
Evaluation of Advisory and Subadvisory Agreements by the Board of Trustees
This section describes the evaluation by the Board of Trustees (the Board) of John Hancock Sovereign Bond Fund (the Trust) of the Advisory Agreement (the Advisory Agreement) with John Hancock Investment Management, LLC (the Advisor, formerly John Hancock Advisers, LLC) and the Subadvisory Agreement (the Subadvisory Agreement) with Manulife Investment Management (US) LLC (the Subadvisor, formerly John Hancock Asset Management a division of Manulife Asset Management (US) LLC), for John Hancock Bond Fund (the fund). The Advisory Agreement and Subadvisory Agreement are collectively referred to as the Agreements. Prior to the June 23-26, 2019 in-person meeting at which the Agreements were approved, the Board also discussed and considered information regarding the proposed continuation of the Agreements at an in-person meeting held on May 28-30, 2019.
Approval of Advisory and Subadvisory Agreements
At in-person meetings held on June 23-26, 2019, the Board, including the Trustees who are not parties to any Agreement or considered to be interested persons of the Trust under the Investment Company Act of 1940, as amended (the 1940 Act) (the Independent Trustees), reapproved for an annual period the continuation of the Advisory Agreement between the Trust and the Advisor and the Subadvisory Agreement between the Advisor and the Subadvisor with respect to the fund.
In considering the Advisory Agreement and the Subadvisory Agreement, the Board received in advance of the meetings a variety of materials relating to the fund, the Advisor and the Subadvisor, including comparative performance, fee and expense information for a peer group of similar funds prepared by an independent third-party provider of fund data, performance information for an applicable benchmark index; and, with respect to the Subadvisor, comparative performance information for comparably managed accounts, as applicable, and other information provided by the Advisor and the Subadvisor regarding the nature, extent and quality of services provided by the Advisor and the Subadvisor under their respective Agreements, as well as information regarding the Advisor's revenues and costs of providing services to the fund and any compensation paid to affiliates of the Advisor. At the meetings at which the renewal of the Advisory Agreement and Subadvisory Agreement are considered, particular focus is given to information concerning fund performance, comparability of fees and total expenses, and profitability. However, the Board noted that the evaluation process with respect to the Advisor and the Subadvisor is an ongoing one. In this regard, the Board also took into account discussions with management and information provided to the Board (including its various committees) at prior meetings with respect to the services provided by the Advisor and the Subadvisor to the fund, including quarterly performance reports prepared by management containing reviews of investment results and prior presentations from the Subadvisor with respect to the fund. The information received and considered by the Board in connection with the May and June meetings and throughout the year was both written and oral. The Board noted the affiliation of the Subadvisor with the Advisor, noting any potential conflicts of interest. The Board also considered the nature, quality, and extent of non-advisory services, if any, to be provided to the fund by the Advisor's affiliates, including distribution services. The Board considered the Advisory Agreement and the Subadvisory Agreement separately in the course of its review. In doing so, the Board noted the respective roles of the Advisor and Subadvisor in providing services to the fund.
Throughout the process, the Board asked questions of and requested additional information from management. The Board is assisted by counsel for the Trust and the Independent Trustees are also separately assisted by independent legal counsel throughout the process. The Independent Trustees also received a memorandum from their independent legal counsel discussing the legal standards for their consideration of the proposed continuation of the Agreements
and discussed the proposed continuation of the Agreements in private sessions with their independent legal counsel at which no representatives of management were present.
Approval of Advisory Agreement
In approving the Advisory Agreement with respect to the fund, the Board, including the Independent Trustees, considered a variety of factors, including those discussed below. The Board also considered other factors (including conditions and trends prevailing generally in the economy, the securities markets, and the industry) and did not treat any single factor as determinative, and each Trustee may have attributed different weights to different factors. The Board's conclusions may be based in part on its consideration of the advisory and subadvisory arrangements in prior years and on the Board's ongoing regular review of fund performance and operations throughout the year.
Nature, extent, and quality of services. Among the information received by the Board from the Advisor relating to the nature, extent, and quality of services provided to the fund, the Board reviewed information provided by the Advisor relating to its operations and personnel, descriptions of its organizational and management structure, and information regarding the Advisor's compliance and regulatory history, including its Form ADV. The Board also noted that on a regular basis it receives and reviews information from the Trust's Chief Compliance Officer (CCO) regarding the fund's compliance policies and procedures established pursuant to Rule 38a-1 under the 1940 Act. The Board observed that the scope of services provided by the Advisor, and of the undertakings required of the Advisor in connection with those services, including maintaining and monitoring its own and the fund's compliance programs, risk management programs, liquidity management programs and cybersecurity programs, had expanded over time as a result of regulatory, market and other developments. The Board considered that the Advisor is responsible for the management of the day-to-day operations of the fund, including, but not limited to, general supervision of and coordination of the services provided by the Subadvisor, and is also responsible for monitoring and reviewing the activities of the Subadvisor and third-party service providers. The Board also considered the significant risks assumed by the Advisor in connection with the services provided to the fund including entrepreneurial risk in sponsoring new funds and ongoing risks including investment, operational, enterprise, litigation, regulatory and compliance risks with respect to all funds.
In considering the nature, extent, and quality of the services provided by the Advisor, the Trustees also took into account their knowledge of the Advisor's management and the quality of the performance of the Advisor's duties, through Board meetings, discussions and reports during the preceding year and through each Trustee's experience as a Trustee of the Trust and of the other trusts in the John Hancock group of funds complex (the John Hancock Fund Complex).
In the course of their deliberations regarding the Advisory Agreement, the Board considered, among other things:
| (a) | the skills and competency with which the Advisor has in the past managed the Trust's affairs and its subadvisory relationship, the Advisor's oversight and monitoring of the Subadvisor's investment performance and compliance programs, such as the Subadvisor's compliance with fund policies and objectives, review of brokerage matters, including with respect to trade allocation and best execution and the Advisor's timeliness in responding to performance issues; | |||||||
| (b) | the background, qualifications and skills of the Advisor's personnel; | |||||||
| (c) | the Advisor's compliance policies and procedures and its responsiveness to regulatory changes and fund industry developments; |
| (d) | the Advisor's administrative capabilities, including its ability to supervise the other service providers for the fund, as well as the Advisor's oversight of any securities lending activity, its monitoring of class action litigation and collection of class action settlements on behalf of the fund, and bringing loss recovery actions on behalf of the fund; | |||||||
| (e) | the financial condition of the Advisor and whether it has the financial wherewithal to provide a high level and quality of services to the fund; | |||||||
| (f) | the Advisor's initiatives intended to improve various aspects of the Trust's operations and investor experience with the fund; and | |||||||
| (g) | the Advisor's reputation and experience in serving as an investment advisor to the Trust and the benefit to shareholders of investing in funds that are part of a family of funds offering a variety of investments. |
The Board concluded that the Advisor may reasonably be expected to continue to provide a high quality of services under the Advisory Agreement with respect to the fund.
Investment performance. In considering the fund's performance, the Board noted that it reviews at its regularly scheduled meetings information about the fund's performance results. In connection with the consideration of the Advisory Agreement, the Board:
| (a) | reviewed information prepared by management regarding the fund's performance; | |
| (b) | considered the comparative performance of an applicable benchmark index; | |
| (c) | considered the performance of comparable funds, if any, as included in the report prepared by an independent third-party provider of fund data; and | |
| (d) | took into account the Advisor's analysis of the fund's performance and its plans and recommendations regarding the Trust's subadvisory arrangements generally. |
The Board noted that while it found the data provided by the independent third-party generally useful it recognized its limitations, including in particular that the data may vary depending on the end date selected and the results of the performance comparisons may vary depending on the selection of the peer group. The Board noted that the fund outperformed its benchmark index and peer group average for the three-, five- and since inception periods ended December 31, 2018 and underperformed its benchmark index and peer group average for the one-year period ended December 31, 2018. The Board took into account management's discussion of the fund's performance, including the favorable performance relative to the benchmark index and peer group average for the three-, five- and since-inception periods. The Board concluded that the fund's performance has generally been in line with or outperformed the historical performance of comparable funds and the fund's benchmark index over the longer-term.
Fees and expenses. The Board reviewed comparative information prepared by an independent third-party provider of fund data, including, among other data, the fund's contractual and net management fees (and subadvisory fees, to the extent available) and total expenses as compared to similarly situated investment companies deemed to be comparable to the fund in light of the nature, extent and quality of the management and advisory and subadvisory services provided by the Advisor and the Subadvisor. The Board considered the fund's ranking within a smaller group of peer funds chosen by the independent third-party provider, as well as the fund's ranking within a broader group of funds. In comparing the fund's contractual and net management fees to those of comparable funds, the Board noted that such fees include both advisory and administrative costs. The Board noted that net management fees are higher than the peer group median and net total expenses for the fund are lower than the peer group median.
The Board took into account management's discussion of the fund's expenses. The Board also took into account management's discussion with respect to the overall management fee and the fees of the Subadvisor, including the amount of the advisory fee retained by the Advisor after payment of the subadvisory fee, in each case in light of the services rendered for those amounts and the risks undertaken by the Advisor. The Board also noted that the Advisor pays the subadvisory fee. In addition, the Board took into account that management had agreed to implement an overall fee waiver across the complex, including the fund, which is discussed further below. The Board also noted actions taken over the past several years to reduce the fund's operating expenses. The Board also noted that, in addition, the Advisor is currently waiving fees and/or reimbursing expenses with respect to the fund and that the fund has breakpoints in its contractual management fee schedule that reduce management fees as assets increase. The Board also noted that the fund's distributor, an affiliate of the Advisor, has agreed to waive a portion of its Rule 12b-1 fee for a share class of the fund. The Board noted that the fund has a voluntary fee waiver and/or expense reimbursement, which reduces certain expenses of the fund. The Board reviewed information provided by the Advisor concerning the investment advisory fee charged by the Advisor or one of its advisory affiliates to other clients (including other funds in the John Hancock Fund Complex) having similar investment mandates, if any. The Board considered any differences between the Advisor's and Subadvisor's services to the fund and the services they provide to other comparable clients or funds. The Board concluded that the advisory fee paid with respect to the fund is reasonable in light of the nature, extent and quality of the services provided to the fund under the Advisory Agreement.
Profitability/Fall out benefits. In considering the costs of the services to be provided and the profits to be realized by the Advisor and its affiliates (including the Subadvisor) from the Advisor's relationship with the Trust, the Board:
| (a) | reviewed financial information of the Advisor; | |||||||
| (b) | reviewed and considered information presented by the Advisor regarding the net profitability to the Advisor and its affiliates with respect to the fund; | |||||||
| (c) | received and reviewed profitability information with respect to the John Hancock Fund Complex as a whole and with respect to the fund; | |||||||
| (d) | received information with respect to the Advisor's allocation methodologies used in preparing the profitability data and considered that the Advisor hired an independent third-party consultant to provide an analysis of the Advisor's allocation methodologies; | |||||||
| (e) | considered that the John Hancock insurance companies that are affiliates of the Advisor, as shareholders of the Trust directly or through their separate accounts, receive certain tax credits or deductions relating to foreign taxes paid and dividends received by certain funds of the Trust and noted that these tax benefits, which are not available to participants in qualified retirement plans under applicable income tax law, are reflected in the profitability information reviewed by the Board; | |||||||
| (f) | considered that the Advisor also provides administrative services to the fund on a cost basis pursuant to an administrative services agreement; | |||||||
| (g) | noted that affiliates of the Advisor provide transfer agency services and distribution services to the fund, and that the fund's distributor also receives Rule 12b-1 payments to support distribution of the fund; | |||||||
| (h) | noted that the fund's Subadvisor is an affiliate of the Advisor; | |||||||
| (i) | noted that the Advisor also derives reputational and other indirect benefits from providing advisory services to the fund; |
| (j) | noted that the subadvisory fee for the fund is paid by the Advisor; | |||||||
| (k) | considered the Advisor's ongoing costs and expenditures necessary to improve services, meet new regulatory and compliance requirements, and adapt to other challenges impacting the fund industry; and | |||||||
| (l) | considered that the Advisor should be entitled to earn a reasonable level of profits in exchange for the level of services it provides to the fund and the risks that it assumes as Advisor, including entrepreneurial, operational, reputational, litigation and regulatory risk. |
Based upon its review, the Board concluded that the level of profitability, if any, of the Advisor and its affiliates (including the Subadvisor) from their relationship with the fund was reasonable and not excessive.
Economies of scale. In considering the extent to which economies of scale would be realized as the fund grows and whether fee levels reflect these economies of scale for the benefit of fund shareholders, the Board:
| (a) | considered that the Advisor has contractually agreed to waive a portion of its management fee for certain funds of the John Hancock Fund Complex, including the fund (the participating portfolios) or otherwise reimburse the expenses of the participating portfolios (the reimbursement). This waiver is based upon aggregate net assets of all the participating portfolios. The amount of the reimbursement is calculated daily and allocated among all the participating portfolios in proportion to the daily net assets of each fund; | |
| (b) | reviewed the fund's advisory fee structure and concluded that: (i) the fund's fee structure contains breakpoints at the subadvisory fee level and that such breakpoints are reflected as breakpoints in the advisory fees for the fund; and (ii) although economies of scale cannot be measured with precision, these arrangements permit shareholders of the fund to benefit from economies of scale if the fund grows. The Board also took into account management's discussion of the fund's advisory fee structure; and | |
| (c) | the Board also considered the effect of the fund's growth in size on its performance and fees. The Board also noted that if the fund's assets increase over time, the fund may realize other economies of scale. |
Approval of Subadvisory Agreement
In making its determination with respect to approval of the Subadvisory Agreement, the Board reviewed:
| (1) | information relating to the Subadvisor's business, including current subadvisory services to the Trust (and other funds in the John Hancock Fund Complex); | |
| (2) | the historical and current performance of the fund and comparative performance information relating to an applicable benchmark index and comparable funds; and | |
| (3) | the subadvisory fee for the fund, including any breakpoints, and to the extent available, comparable fee information prepared by an independent third-party provider of fund data. |
Nature, extent, and quality of services. With respect to the services provided by the Subadvisor, the Board received information provided to the Board by the Subadvisor, including the Subadvisor's Form ADV, as well as took into account information presented throughout the past year. The Board considered the Subadvisor's current level of staffing and its overall resources, as well as received information relating to the Subadvisor's compensation program.
The Board reviewed the Subadvisor's history and investment experience, as well as information regarding the qualifications, background, and responsibilities of the Subadvisor's investment and compliance personnel who provide services to the fund. The Board also considered, among other things, the Subadvisor's compliance program and any disciplinary history. The Board also considered the Subadvisor's risk assessment and monitoring process. The Board reviewed the Subadvisor's regulatory history, including whether it was involved in any regulatory actions or investigations as well as material litigation, and any settlements and amelioratory actions undertaken, as appropriate. The Board noted that the Advisor conducts regular, periodic reviews of the Subadvisor and its operations, including regarding investment processes and organizational and staffing matters. The Board also noted that the Trust's CCO and his staff conduct regular, periodic compliance reviews with the Subadvisor and present reports to the Independent Trustees regarding the same, which includes evaluating the regulatory compliance systems of the Subadvisor and procedures reasonably designed to assure compliance with the federal securities laws. The Board also took into account the financial condition of the Subadvisor.
The Board considered the Subadvisor's investment process and philosophy. The Board took into account that the Subadvisor's responsibilities include the development and maintenance of an investment program for the fund that is consistent with the fund's investment objective, the selection of investment securities and the placement of orders for the purchase and sale of such securities, as well as the implementation of compliance controls related to performance of these services. The Board also received information with respect to the Subadvisor's brokerage policies and practices, including with respect to best execution and soft dollars.
Subadvisor compensation. In considering the cost of services to be provided by the Subadvisor and the profitability to the Subadvisor of its relationship with the fund, the Board noted that the fees under the Subadvisory Agreement are paid by the Advisor and not the fund. The Board also received information and took into account any other potential conflicts of interest the Advisor might have in connection with the Subadvisory Agreement.
In addition, the Board considered other potential indirect benefits that the Subadvisor and its affiliates may receive from the Subadvisor's relationship with the fund, such as the opportunity to provide advisory services to additional funds in the John Hancock Fund Complex and reputational benefits.
Subadvisory fees. The Board considered that the fund pays an advisory fee to the Advisor and that, in turn, the Advisor pays a subadvisory fee to the Subadvisor. As noted above, the Board also considered the fund's subadvisory fees as compared to similarly situated investment companies deemed to be comparable to the fund as included in the report prepared by the independent third-party provider of fund data, to the extent available. The Board also noted that the limited size of the Lipper peer group was not sufficient for comparative purposes. The Board also took into account the subadvisory fees paid by the Advisor to the Subadvisor with respect to the fund and compared them to fees charged by the Subadvisor to manage other subadvised portfolios and portfolios not subject to regulation under the 1940 Act, as applicable.
Subadvisor performance. As noted above, the Board considered the fund's performance as compared to the fund's peer group and the benchmark index and noted that the Board reviews information about the fund's performance results at its regularly scheduled meetings. The Board noted the Advisor's expertise and resources in monitoring the performance, investment style and risk-adjusted performance of the Subadvisor. The Board was mindful of the Advisor's focus on the Subadvisor's performance. The Board also noted the Subadvisor's long-term performance record for similar accounts, as applicable.
The Board's decision to approve the Subadvisory Agreement was based on a number of determinations, including the following:
| (1) | the Subadvisor has extensive experience and demonstrated skills as a manager; | |
| (2) | the performance of the fund has generally been in line with or outperformed the historical performance of comparable funds and the fund's benchmark index over the longer-term; | |
| (3) | the subadvisory fee is reasonable in relation to the level and quality of services being provided under the Subadvisory Agreement; and | |
| (4) | noted that the subadvisory fees are paid by the Advisor not the fund and that the subadvisory fee breakpoints are reflected as breakpoints in the advisory fees for the fund in order to permit shareholders to benefit from economies of scale if the fund grows. | |
| * * * | ||
Based on the Board's evaluation of all factors that the Board deemed to be material, including those factors described above, the Board, including the Independent Trustees, concluded that renewal of the Advisory Agreement and the Subadvisory Agreement would be in the best interest of the fund and its shareholders. Accordingly, the Board, and the Independent Trustees voting separately, approved the Advisory Agreement and Subadvisory Agreement for an additional one-year period.
|
Trustees Hassell H. McClellan, Chairperson Officers Andrew G. Arnott Francis V. Knox, Jr. Charles A. Rizzo Salvatore Schiavone Christopher (Kit) Sechler |
Investment advisor John Hancock Investment Management LLC Subadvisor Manulife Investment Management (US) LLC Portfolio Managers Jeffrey N. Given, CFA Principal distributor John Hancock Investment Management Distributors LLC Custodian State Street Bank and Trust Company Transfer agent John Hancock Signature Services, Inc. Legal counsel K&L Gates LLP |
* Member of the Audit Committee
† Non-Independent Trustee
The fund's proxy voting policies and procedures, as well as the fund proxy voting record for the most recent twelve-month period ended June 30, are available free of charge on the Securities and Exchange Commission (SEC) website at sec.gov or on our website.
All of the fund's holdings as of the end of the third month of every fiscal quarter are filed with the SEC on Form N-PORT within 60 days of the end of the fiscal quarter. The fund's Form N-PORT filings are available on our website and the SEC's website, sec.gov.
We make this information on your fund, as well as monthly portfolio holdings, and other fund details available on our website at jhinvestments.com or by calling 800-225-5291.
| You can also contact us: | |||
| 800-225-5291 jhinvestments.com |
Regular mail: John Hancock Signature Services, Inc. |
Express mail: John Hancock Signature Services, Inc. |
|
John Hancock family of funds
|
DOMESTIC EQUITY FUNDS Blue Chip Growth Classic Value Disciplined Value Disciplined Value Mid Cap Equity Income Financial Industries Fundamental All Cap Core Fundamental Large Cap Core New Opportunities Regional Bank Small Cap Core Small Cap Growth Small Cap Value U.S. Global Leaders Growth U.S. Quality Growth GLOBAL AND INTERNATIONAL EQUITY FUNDS Disciplined Value International Emerging Markets Emerging Markets Equity Fundamental Global Franchise Global Equity Global Shareholder Yield Global Thematic Opportunities International Dynamic Growth International Growth International Small Company |
INCOME FUNDS Bond California Tax-Free Income Emerging Markets Debt Floating Rate Income Government Income High Yield High Yield Municipal Bond Income Investment Grade Bond Money Market Short Duration Bond Short Duration Credit Opportunities Strategic Income Opportunities Tax-Free Bond ALTERNATIVE AND SPECIALTY FUNDS Absolute Return Currency Alternative Asset Allocation Alternative Risk Premia Disciplined Alternative Yield Diversified Macro Infrastructure Multi-Asset Absolute Return Seaport Long/Short |
A fund's investment objectives, risks, charges, and expenses should be considered carefully before investing. The prospectus contains this and other important information about the fund. To obtain a prospectus, contact your financial professional, call John Hancock Investment Management at 800-225-5291, or visit our website at jhinvestments.com. Please read the prospectus carefully before investing or sending money.
|
ASSET ALLOCATION Balanced Income Allocation Multi-Index Lifetime Portfolios Multi-Index Preservation Portfolios Multimanager Lifestyle Portfolios Multimanager Lifetime Portfolios Retirement Income 2040 EXCHANGE-TRADED FUNDS John Hancock Multifactor Consumer Discretionary ETF John Hancock Multifactor Consumer Staples ETF John Hancock Multifactor Developed International ETF John Hancock Multifactor Emerging Markets ETF John Hancock Multifactor Energy ETF John Hancock Multifactor Financials ETF John Hancock Multifactor Healthcare ETF John Hancock Multifactor Industrials ETF John Hancock Multifactor Large Cap ETF John Hancock Multifactor Materials ETF John Hancock Multifactor Media and John Hancock Multifactor Mid Cap ETF John Hancock Multifactor Small Cap ETF John Hancock Multifactor Technology ETF John Hancock Multifactor Utilities ETF |
ENVIRONMENTAL, SOCIAL, AND ESG All Cap Core ESG Core Bond ESG International Equity ESG Large Cap Core CLOSED-END FUNDS Financial Opportunities Hedged Equity & Income Income Securities Trust Investors Trust Preferred Income Preferred Income II Preferred Income III Premium Dividend Tax-Advantaged Dividend Income Tax-Advantaged Global Shareholder Yield |
John Hancock Multifactor ETF shares are bought and sold at market
price (not NAV), and are not individually redeemed
from the fund. Brokerage commissions will reduce returns.
John Hancock ETFs are distributed by Foreside Fund Services, LLC, and
are subadvised by Dimensional Fund Advisors LP.
Foreside is not affiliated with John Hancock Investment Management
Distributors LLC or Dimensional Fund Advisors LP.
Dimensional Fund Advisors LP receives compensation from John Hancock
in connection with licensing rights to the
John Hancock Dimensional indexes. Dimensional Fund Advisors LP does
not sponsor, endorse, or sell, and makes no
representation as to the advisability of investing in, John Hancock
Multifactor ETFs.
John Hancock Investment Management
A trusted brand
John Hancock Investment Management is a premier asset manager
representing one of America's most trusted brands, with a heritage of
financial stewardship dating back to 1862. Helping our shareholders
pursue their financial goals is at the core of everything we do. It's why
we support the role of professional financial advice and operate with
the highest standards of conduct and integrity.
A better way to invest
We serve investors globally through a unique multimanager approach:
We search the world to find proven portfolio teams with specialized
expertise for every strategy we offer, then we apply robust investment
oversight to ensure they continue to meet our uncompromising
standards and serve the best interests of our shareholders.
Results for investors
Our unique approach to asset management enables us to provide
a diverse set of investments backed by some of the world's best
managers, along with strong risk-adjusted returns across asset classes.
![]()
John Hancock Investment Management Distributors LLC
n Member FINRA, SIPC
200 Berkeley Street
n Boston, MA 02116-5010
n 800-225-5291
n jhinvestments.com
This report is for the information of the shareholders of John Hancock Bond Fund. It is not authorized for distribution to prospective investors unless preceded or accompanied by a prospectus.

| MF1028725 | 21SA 11/19 1/20 |
ITEM 2. CODE OF ETHICS.
Not applicable at this time.
ITEM 3. AUDIT COMMITTEE FINANCIAL EXPERT.
Not applicable at this time.
ITEM 4. PRINCIPAL ACCOUNTANT FEES AND SERVICES.
Not applicable at this time.
ITEM 5. AUDIT COMMITTEE OF LISTED REGISTRANTS.
Not applicable at this time.
ITEM 6. SCHEDULE OF INVESTMENTS.
Not applicable.
ITEM 7. DISCLOSURE OF PROXY VOTING POLICIES AND PROCEDURES FOR CLOSED-END MANAGEMENT INVESTMENT COMPANIES.
Not applicable.
ITEM 8. PORTFOLIO MANAGERS OF CLOSED-END MANAGEMENT INVESTMENT COMPANIES.
Not applicable.
ITEM 9. PURCHASES OF EQUITY SECURITIES BY CLOSED-END MANAGEMENT INVESTMENT COMPANY AND AFFILIATED PURCHASERS.
Not applicable.
ITEM 10. SUBMISSION OF MATTERS TO A VOTE OF SECURITY HOLDERS.
(a) The registrant has adopted procedures by which shareholders may recommend nominees to the registrant’s Board of Trustees. A copy of the procedures is filed as an exhibit to this Form NCSR. See attached “John Hancock Funds – Nominating and Governance Committee Charter”.
ITEM 11. CONTROLS AND PROCEDURES.
(a) EVALUATION OF DISCLOSURE CONTROLS AND PROCEDURES. The registrant maintains disclosure controls and procedures that are designed to ensure that information required to be disclosed in this Form N-CSR is recorded, processed, summarized and reported within the time periods specified in the rules and forms of the Securities and Exchange Commission. Such disclosure and procedures include controls and procedures designed to ensure that such information is accumulated and communicated to the registrant’s management, including its principal executive officer and principal financial officer, as appropriate, to allow timely decisions regarding required disclosure.
Within 90 days prior to the filing date of this Form N-CSR, the registrant had carried out an evaluation, under the supervision and with the participation of the registrant’s management, including the registrant’s principal executive officer and the registrant’s principal financial officer, of the effectiveness of the design and operation of the registrant’s disclosure controls and procedures relating to information required to be disclosed on Form N-CSR. Based on such evaluation, the registrant’s principal executive officer and principal financial officer concluded that the registrant’s disclosure controls and procedures are operating effectively to ensure that:
(i) information required to be disclosed in this Form N-CSR is recorded, processed, summarized
and reported within the periods specified in the rules and forms of the Securities and Exchange
Commission, and
(ii) information is accumulated and communicated to the registrant’s management, including its
principal executive officer and principal financial officer, as appropriate, to allow timely decisions
regarding required disclosure.
(b) CHANGE IN REGISTRANT’S INTERNAL CONTROL: Not applicable.
ITEM 12. DISCLOSURE OF SECURITIES LENDING ACTIVITIES FOR CLOSED-END MANAGEMENT INVESTMENT COMPANIES.
Not applicable.
ITEM 13. EXHIBITS.
(a)(1) Separate certifications for the registrant's principal executive officer and principal financial officer, as required by Section 302 of the Sarbanes-Oxley Act of 2002 and Rule 30a-2(a) under the Investment Company Act of 1940, are attached.
(b)(1) Separate certifications for the registrant's principal executive officer and principal financial officer, as required by 18 U.S.C. Section 1350, as adopted pursuant to Section 906 of the Sarbanes-Oxley Act of 2002, and Rule 30a-2(b) under the Investment Company Act of 1940, are attached. The certifications furnished pursuant to this paragraph are not deemed to be "filed" for purposes of Section 18 of the Securities Exchange Act of 1934, or otherwise subject to the liability of that section. Such certifications are not deemed to be incorporated by reference into any filing under the Securities Act of 1933 or the Securities Exchange Act of 1934, except to the extent that the Registrant specifically incorporates them by reference.
(c)(1) Submission of Matters to a Vote of Security Holders is attached. See attached “John Hancock Funds – Nominating and Governance Committee Charter”.
SIGNATURES
Pursuant to the requirements of the Securities Exchange Act of 1934 and the Investment Company Act of 1940, the registrant has duly caused this report to be signed on its behalf by the undersigned, thereunto duly authorized.
John Hancock Sovereign Bond Fund
| By: | /s/ Andrew Arnott | |
| Andrew Arnott | ||
| President | ||
| Date: | January 7, 2020 |
Pursuant to the requirements of the Securities Exchange Act of 1934 and the Investment Company Act of 1940, this report has been signed below by the following persons on behalf of the registrant and in the capacities and on the dates indicated.
| By: | /s/ Andrew Arnott | |
| Andrew Arnott | ||
| President | ||
| Date: | January 7, 2020 | |
| By: | /s/ Charles A. Rizzo | |
| Charles A. Rizzo | ||
| Chief Financial Officer | ||
| Date: | January 7, 2020 | |