UNITED STATES
SECURITIES AND EXCHANGE COMMISSION
Washington, DC 20549
FORM 10-K
(Mark One)
x | ANNUAL REPORT PURSUANT TO SECTION 13 OR 15(d) OF THE SECURITIES EXCHANGE ACT OF 1934 |
For the fiscal year ended December 31, 2015
¨ | TRANSITION REPORT PURSUANT TO SECTION 13 OR 15(d) OF THE SECURITIES EXCHANGE ACT OF 1934 |
For the transition period from to
Commission file number 1-6961
TEGNA INC.
(Exact name of registrant as specified in its charter)
Delaware | 16-0442930 | |
(State or Other Jurisdiction of Incorporation or Organization) | (I.R.S. Employer Identification No.) | |
7950 Jones Branch Drive, McLean, Virginia | 22107-0150 | |
(Address of principal executive offices) | (Zip Code) | |
Registrant’s telephone number, including area code: (703) 854-7000
Securities registered pursuant to Section 12(b) of the Act:
Title of Each Class | Name of Each Exchange on Which Registered | |
Common Stock, par value $1.00 per share | The New York Stock Exchange | |
Securities registered pursuant to Section 12(g) of the Act: None
Indicate by check mark if the registrant is a well-known seasoned issuer, as defined in Rule 405 of the Securities Act. Yes x No ¨
Indicate by check mark if the registrant is not required to file reports pursuant to Section 13 or Section 15(d) of the Act. Yes ¨ No x
Indicate by check mark whether the registrant (1) has filed all reports required to be filed by Section 13 or 15(d) of the Securities Exchange Act of 1934 during the preceding 12 months (or for such shorter period that the registrant was required to file such reports), and (2) has been subject to such filing requirements for the past 90 days.
Yes x No ¨
Indicate by check mark whether the registrant has submitted electronically and posted on its corporate Web site, if any, every Interactive Data File required to be submitted and posted pursuant to Rule 405 of Regulation S-T (§232.405 of this chapter) during the preceding 12 months (or for such shorter period that the registrant was required to submit and post such files). Yes x No ¨
Indicate by check mark if disclosure of delinquent filers pursuant to Item 405 of Regulation S-K is not contained herein, and will not be contained, to the best of registrant’s knowledge, in definitive proxy or information statements incorporated by reference in Part III of this Form 10-K or any amendment to this Form 10-K (Check box if no delinquent filers). x
Indicate by check mark whether the registrant is a large accelerated filer, an accelerated filer, a non-accelerated filer or a smaller reporting company. See the definitions of “large accelerated filer,” “accelerated filer” and “smaller reporting company” in Rule 12b-2 of the Exchange Act:
Large accelerated filer | x | Accelerated filer | ¨ | Non-accelerated filer | ¨ | Smaller reporting company | ¨ |
Indicate by check mark whether the registrant is a shell company (as defined in Rule 12b-2 of the Act). Yes ¨ No x
The aggregate market value of the voting common equity held by non-affiliates of the registrant based on the closing sales price of the registrant’s Common Stock as reported on The New York Stock Exchange on June 30, 2015, was $7,239,422,726. The registrant has no non-voting common equity.
As of Jan. 31, 2016, 219,720,167 shares of the registrant’s Common Stock were outstanding.
DOCUMENTS INCORPORATED BY REFERENCE
The definitive proxy statement relating to the registrant’s Annual Meeting of Shareholders to be held on May 5, 2016, is incorporated by reference in Part III to the extent described therein.
INDEX TO TEGNA INC.
2015 FORM 10-K
Item No. | Page | |
1 | ||
1A. | ||
1B. | ||
2 | ||
3 | ||
4 | ||
5 | ||
6 | ||
7 | ||
7A. | ||
8 | ||
9 | ||
9A. | ||
10 | ||
11 | ||
12 | ||
13 | ||
14 | ||
15 | ||
2
PART I
ITEM 1.BUSINESS
Overview
Our company is comprised of a dynamic portfolio of media and digital businesses that provide content that matters and brands that deliver. We deliver highly relevant, useful and smart content, when and how people need it, to make the best decisions possible. Our agile and forward-thinking portfolio is comprised of one of the largest, most geographically diverse broadcasters in the U.S. and two leading digital companies, Cars.com and CareerBuilder. Combined, TEGNA’s brands have tremendous reach. Each month, our company reaches more than 90 million people across our broadcast and digital media platforms.
Our high margin operations generate strong and dependable cash flow and we are very disciplined financially. In addition, our strong balance sheet provides us the flexibility to invest in our businesses and to capitalize on opportunities for organic and acquisition-related growth while returning value to shareholders through dividends and share repurchases.
Since 2011, we have followed an ambitious and focused business strategy to transform our company. In all our efforts, our decisions have focused on one goal: to increase shareholder value. Through 2014, we made great progress on this evolution, including through the strategic acquisitions of Cars.com and Belo Corp., which doubled the scale of our Digital and Media Segments.
Fiscal year 2015 was a terrific and historic year for our company. We negotiated several retransmission agreements with major carriers with favorable terms; reached new long-term affiliation agreements with two network broadcast partners; launched new, innovative and expanded products at Cars.com; and developed and deployed a more focused business strategy and direction at CareerBuilder.
During 2015, we also made a number of significant strategic changes to enhance shareholder returns and improve the company. On June 29, 2015, the first day of our fiscal third quarter, we completed the separation of our publishing businesses. Our company was renamed TEGNA Inc. and our stock trades on the New York Stock Exchange under the symbol TGNA. The new publishing company retained the name Gannett Co., Inc. (Gannett) and now trades on the New York Stock Exchange under the symbol GCI. In the fourth quarter of 2015, we also sold Clipper Magazine, Mobestream Media and PointRoll.
After these strategic changes, we now operate the following two reportable segments:
TEGNA Media (Media Segment) - which includes 46 television stations (including one station under service agreements) in 38 markets. We are the largest independent station group of major network affiliates in the top 25 markets, reaching approximately one-third of all television households nationwide (more than 35 million households). We represent the #1 NBC affiliate group, #1 CBS affiliate group and #4 ABC affiliate group (excluding owner-operators). In December, we completed our acquisition of three Sander Media LLC television stations - KGW in Portland, Oregon, WHAS in Louisville, Kentucky and KMSB in Tucson, Arizona - following approval from the Federal Communications Commission. We had serviced these stations under shared service and similar arrangements since December 2013. Each television station
also has a robust digital presence across online, mobile and social, reaching consumers whenever, wherever they are across platforms. About 42 million unique visitors access our Media Segment’s digital properties each month. Social media is now at the core of all we do. Our stations keep viewers informed and engaged throughout the day. In fact, KUSA in Denver had the number one Facebook post of any local news organization during the year, generating 4 million interactions. Along with the advantages associated with our scale, we are ratings leaders well-positioned to continue to take market share. We believe that content comes first, resulting in award-winning local programming and a unique bond with the communities we serve. We continue to make top-notch, innovative programming a priority and invest in local news and other special programming to ensure we stay connected to our audiences and empower them throughout the day.
TEGNA Digital (Digital Segment) - which primarily consists of the Cars.com (formerly Classified Ventures LLC) and CareerBuilder businesses. Cars.com operates a leading online destination for automotive consumers offering credible, objective information about car shopping, selling and servicing. Cars.com has approximately 30 million monthly visits to its web properties and was recently named by comScore as having the number one mobile app in the third party automotive resources category. Cars.com leverages its growing consumer audience to help automotive dealers and marketers more effectively reach car buyers and sellers, as well as those looking for trusted service providers.
In addition, we own a controlling 53% interest in CareerBuilder, a global leader in human capital solutions specializing in Human Resource (HR) software as a service to help companies with every step of the recruitment process. CareerBuilder operates one of the largest job sites in North America, measured both by traffic and revenue, and has a presence in more than 60 markets worldwide. Together, Cars.com and CareerBuilder provide our advertising partners with access to two very important categories - automotive and human capital solutions. Our Digital Segment also includes G/O Digital, a one-stop shop for digital marketing services for local businesses; and Cofactor (also operating as ShopLocal), a digital marketing company that is uniquely positioned to bridge the divide between the online and offline worlds and enable brands to intelligently deliver content everywhere, driving sales locally. As consumers conduct more of their daily lives and day-to-day business online, our digital assets position us well, driving tremendous national and international reach.
In addition to the above reportable segments, our corporate category includes activities that are not directly attributable or allocable to a specific reportable segment. This category primarily consists of broad corporate management functions including legal, human resources, and finance as well as activities and costs not directly attributable to a particular segment.
3
General Company Information
TEGNA (formerly Gannett Co., Inc.) was founded by Frank E. Gannett and associates in 1906 and was incorporated in 1923. We listed shares publicly for the first time in 1967 and reincorporated in Delaware in 1972. Our approximately 220 million outstanding shares of common stock are held by approximately 6,800 shareholders of record as of Dec. 31, 2015. Our headquarters is located at 7950 Jones Branch Drive, McLean, VA, 22107. Our telephone number is (703) 854-7000 and our website home page on the Internet is www.tegna.com. We make our website content available for information purposes only. It should not be relied upon for investment purposes, nor is it incorporated by reference into this Annual Report on Form 10-K (Form 10-K).
Our annual reports on Form 10-K, quarterly reports on Form 10-Q, current reports on Form 8-K, proxy statements for our annual stockholders’ meetings and amendments to those reports are available free of charge on our investor website, www.investors.tegna.com as soon as reasonably practical after we electronically file the material with, or furnish it to, the Securities and Exchange Commission (SEC). In addition, copies of our annual reports will be made available, free of charge, upon written request. The SEC also maintains a website at www.sec.gov that contains reports, proxy statements and other information regarding SEC registrants, including TEGNA Inc.
Business Segments
We operate two business segments: Media and Digital. We organize our business segments based on management and internal reporting structure, the nature of products and services offered by the segments, and the financial information that is evaluated regularly by our chief operating decision maker. Financial information for each of our reportable segments can be found under Item 7 “Management’s Discussion and Analysis of Financial Condition and Results of Operations” and Item 8 “Financial Statements and Supplementary Data” of this Form 10-K.
Media Segment
In 2015, our Media Segment generated net revenues of $1.7 billion, which represented 55% of our total consolidated net revenues. We have a presence in almost one-third of U.S. television households with a total market reach of more than 35 million households. Our station portfolio includes 46 full-power stations including one station we service through services arrangements. Today we are more diversified by region and network affiliation and are now a leading company in the industry. Other than the three major networks (ABC, CBS, and NBC) themselves, we are the largest owner of stations affiliated with each of these three major networks in the top 25 markets.
The primary sources of our Media Segment’s revenues are: 1) core advertising which includes local and national non-political advertising; 2) political advertising revenues which are driven by elections and peak in even years (e.g. 2016, 2014) and particularly in the second half of those years; 3) retransmission revenues representing fees paid by satellite and cable operators and telecommunications companies to carry our television signals on their systems; 4) digital revenues which encompass digital marketing services and advertising on the stations’ websites and tablet and mobile products; and 5) payments by advertisers to television stations for other services, such as production of programming from third parties and production of advertising material.
The advertising revenues generated by a station’s local news programs make up a significant part of its total revenues. Advertising rates are influenced by the demand for advertising time. This demand is influenced by a variety of factors, including the size and demographics of the local population, the concentration of businesses, local economic conditions in general, and the popularity of the station’s programming. As the market fluctuates with supply and demand, so does the station’s pricing. Almost all national advertising is placed through independent advertising representatives. Local advertising time is sold by each station’s own sales force.
Generally, a network provides programs to its affiliated television stations and sells on its own behalf commercial advertising for certain of the available advertising spots within the network programs. Our television stations also produce local programming such as news, sports, and entertainment.
Broadcast affiliates and their network partners continue to have the broadest appeal in terms of household viewership, viewing time, and audience reach. The overall reach of events such as the Olympics and NFL Football, along with our extensive local news and non-news programming, continues to surpass the reach in viewership of individual cable channels. Our ratings and reach are driven by the quality of programs we and our network partners produce and by the strong local connections we have to our communities, which give us a unique position among the numerous program choices viewers have, regardless of platform.
4
Strategy: Our Media Segment’s quality and scale drives its success. Our television stations empower the people we serve, delivering highly relevant, useful and smart content. We expect our wide geographic footprint to serve us well throughout the 2016 election cycle. Media has stations in key swing states, such as Colorado, Florida, Ohio, North Carolina and Virginia, and we anticipate record-breaking political advertising spending in 2016. We also anticipate record-setting Olympic advertising spending which benefits Media as the number one independent NBC affiliate group.
Media renegotiated several new retransmission agreements with major carriers such as DISH and DIRECTV/AT&T U-verse in 2015, and we expect our content and scale will allow us to grow market share and secure further retransmission fee revenue growth in the future. A gap remains between the value we provide and the fees that we are currently receiving from many carriers. We expect that we will continue to close that gap over the coming years.
Media has also recently executed long-term network affiliation agreements with CBS and NBC. Media’s entire portfolio of CBS, NBC and ABC stations is now under long-term agreements. Additionally, there are several initiatives underway that we expect to contribute to additional revenue and cash flow growth in the coming years to offset the impact of rising network affiliation fees.
The Media Segment continues to focus on increasing engagement on all platforms with local customers, including digital marketing services and advertising on the stations’ desktop, tablet and mobile products. In 2015, we modernized our technology infrastructure. By doing this, we gained the benefit of both lowering our digital technology costs while significantly improving our customer experiences. We introduced new customer-facing product platforms and improved our internal systems, which help our teams deliver outstanding customer experiences. We introduced a new mobile app platform to many of our stations on September 1 and launched a beta release of our new mobile web/web content management system. Customers can also consume our content on our recently launched Roku and NewsOn app channels. We introduced new on-air tools to weave social media into our broadcasts while our journalists created mobile video capturing more news in real-time. On the internal systems front, we built a portal called TegnaVision for our station groups to more easily share digital video. During the year, we built a new data warehouse and implemented-state-of-the-art social media analytics tools. These enhancements will give our local stations real time insight into what people are talking about in their communities.
Digital growth continues to accelerate for our television stations as content remains in high demand and product improvements continue to be favorably received by consumers. In 2015, total unique visitors and page views were up 13% and 14%, respectively, on a pro forma basis. Usage of our mobile and tablet apps, as well as mobile web, grew significantly in 2015 and now accounts for almost two-thirds of the total digital page views. Digital video plays in 2015 increased 25% as video continues to be highly desired on all platforms. Product enhancements to both the desktop and mobile digital products occur every year and are part of a continuous cycle of improving the customer experience and increasing consumer engagement.
The Media Segment is positioned to maximize engagement through social media. The synergistic relationship between social media and television is strong and we continue to explore ways to socially engage consumers on all screens for all types of programs, from major sporting events such as the Super Bowl and March Madness, to signature television events such as the Grammys or Academy Awards. Our social media reach grew over 40% in 2015 and now totals over 12 million followers on Twitter and Facebook. Within the Media Segment, social media consumers resulted in over 800 million referrals during 2015, a 125% increase over 2014.
Retransmission consent and affiliation agreements: Pursuant to Federal Communications Commission (FCC) rules, every three years a local television station must elect to either (1) require cable and/or direct broadcast satellite operators to carry the station’s signal or (2) require such cable and satellite operators to negotiate retransmission consent agreements to secure carriage. At present, we have retransmission consent agreements with the majority of cable operators and satellite providers for carriage of our television stations. We also have retransmission agreements with major telecommunications companies. Revenue from television retransmission fees has increased steadily in the last several years, better reflecting the value of the content that our Media Segment provides. While core advertising still represents a majority of Media Segment revenues (approximately 65% in 2015), the contribution from retransmission revenues continues to grow. In 2015, we completed retransmission negotiations with several significant operators. These are multi-year agreements that provide us with significant and steady revenue streams. Retransmission revenues are expected to grow significantly in 2016 and beyond.
Of our 46 stations, 40 have affiliation agreements with one of the four major networks. Programming fees are paid to our network partners who, in turn, provide us with prime time, sports and network news programming, which we then distribute in the local markets in which we operate. CBS and NBC affiliation agreements were just renewed with expiration dates in 2019 and 2021 respectively. The renewed affiliation agreements include our original TEGNA stations as well as our more recently acquired stations.
Programming and production: The costs of locally produced and purchased syndicated programming is a significant portion of television operating expenses. Syndicated programming costs are determined based on several market factors, including demand from the independent and affiliated stations within the market. In recent years, our television stations have expanded our locally produced news and entertainment programming in an effort to provide programs that distinguish the stations from the competition, to increase locally responsible programming, and to be more cost effective. Due to our scale, we provide stations additional resources from other markets to cover our major breaking news stories which give us a competitive advantage.
5
From our successful negotiations of renewed retransmission agreements and the creation of original, innovative programming to expanded coverage and increased focus on our communities, we had a very strong year in 2015. We kicked off significant efforts to transform our content and connect with audiences in new, powerful ways. With increased alignment between our digital and linear television properties as well as increased focus on station-to-station content sharing, we delivered more cross-platform reporting than ever before.
For example, in January 2015, in response to the Ferguson, Missouri riots, Media started a campaign to improve the dialogue between police and their respective communities. Using the hashtag #startswithtrust, Media stations combined special on-air reports with social media outreach to tell the story in their local community. The campaign was designed to open an honest dialogue about the issue. Stations aired special Town Halls, told impactful stories and conducted meaningful interviews in an effort to not just report on the issue but improve communities. When tragedy struck the AME Methodist Church in Charleston, South Carolina, our Columbia station, WLTX, dominated the story, benefiting from Media resources in Charlotte, Atlanta and Jacksonville. Our teams produced an hour-long dedication to the victims and encouraged South Carolinians to perform nine simple acts of kindness to honor the nine victims. The community rallied around the effort taking to social media to share their acts of kindness via the hashtag #lovenothate.
Our investigative reporting was also a big focus this year. Statewide investigations across our Texas stations became standard practice. We found success with multiple investigations that ran across our Media stations, including an investigation into our country’s 911 system and an investigation revealing the backlog of untested sexual assault kits. Both efforts generated a tremendous response. Our investigation hashtag #can911findme generated over 1.7M social media mentions and our untested sexual assault kits investigation led the Vice President, Attorney General and District Attorney for Manhattan to pledge $80 million to help clear the backlog.
Our Media Segment received substantial recognition and honors this year. We were the most recognized station group for excellence in local news. Our stations received 84 Edward R. Murrow awards including the national Murrow for overall excellence. In addition, our stations won the National Association of Broadcasters Service to America Award, six Investigative Reporters and Editors awards, three Alfred I. duPont-Columbia University awards, a Peabody Award, eight Salute to Excellence awards from the National Association of Black Journalists, 44 awards from the National Association of Press Photographers and many more. All of this recognizes the quality journalism and commitment to localism our stations deliver day-in and day-out.
Competition: Our Media Segment competes for audience share and advertising revenues primarily with other local television broadcasters (including network-affiliated and independent) and with other advertising media, such as radio broadcasters, multichannel video programming distributors (MVPDs), newspapers, magazines, direct mail and Internet media. Other sources of competition for our media stations include home video and audio recorders and players, direct broadcast satellite, low power television, Internet radio, video offerings (both wire line and wireless) of telephone companies as well as developing video services. Our stations compete for audience share and audience composition within their respective Designated Market Area (DMA) which is largely driven by program popularity. Our share of the DMA has a direct effect on the rates we are able to charge advertisers. MVPDs can also increase competition by bringing additional cable network channels and content into the DMA.
The advertising industry is dynamic and rapidly evolving. Our stations compete in the emerging local electronic media space, which includes the Internet or Internet-enabled devices, handheld wireless devices such as mobile phones and tablets, social media platforms, digital spectrum opportunities associated with digital television transmission (DTV) and Internet-enabled (“over-the-top” or “OTT”) television services. The technology that enables consumers to receive news and information continues to evolve.
Regulation: Our television stations are operated under the authority of the FCC, the Communications Act of 1934, as amended (Communications Act), and the rules and policies of the FCC (FCC Regulations).
Television broadcast licenses generally are granted for periods of eight years. They are renewable upon application to the FCC and usually are renewed except in rare cases in which a petition to deny, a complaint or an adverse finding as to the licensee’s qualifications results in loss of the license. We believe we are in substantial compliance with all applicable provisions of the Communications Act and FCC Regulations.
FCC Regulations also limit the concentration of broadcasting control and regulate network and local programming practices. FCC Regulations governing media ownership limit, or in some cases prohibit, the common ownership or control of most communications media serving common market areas (for example, television and radio; television and daily newspapers; or radio and daily newspapers). FCC Regulations permit common ownership of two television stations in the same market in certain defined circumstances, including situations where at least one of the commonly owned stations is outside the market’s top four rated stations at the time of acquisition and, at least, eight independent media “voices” remain after the acquisition. The Communications Act includes a national ownership cap for broadcast television stations which prohibits any one person or entity from having, in the aggregate, market reach of more than 39% of all U.S. television households. The market reach of stations that broadcast on UHF channels is discounted by 50% (the UHF discount). Our 45 television stations (excluding the station we currently service under a services arrangement) reach approximately 24% of U.S. television households, after applying the UHF discount. The FCC has proposed a repeal of the UHF discount and that proceeding remains pending. Without applying the UHF discount, our national reach would be approximately 32%.
6
The FCC commenced a new review of its ownership rules in 2014, as it is required to do every four years. The FCC has proposed to retain the local television ownership rule and proposed a modest relaxation of the newspaper/broadcast rule. Also in 2014, the FCC determined that certain joint sales agreements (JSAs) between television stations will be treated as attributable ownership interests. We are party to only one JSA which would have an insignificant impact on our overall attributable ownership interest. The FCC has proposed disclosure of shared services agreements and local news agreements. We are also party to a transition services agreement, which is similar to a shared services agreement though more limited, with a third party that owns a television station in Tucson, where we also own a television station. The current chair of the FCC has stated that he expects the ownership review commenced in 2014 to be completed by mid-2016. We are unable to predict whether or how the FCC’s rules in this area may change.
Congress has adopted legislation requiring the FCC to make changes to the rules concerning negotiation of retransmission consent agreements (which govern cable and satellite operators’ carriage of our signals). In 2015, the FCC adopted new rules required by the STELA Reauthorization Act of 2014 that prohibit same-market television broadcast stations from coordinating or jointly negotiating for retransmission consent unless they are under common ownership control. Congress also has directed the FCC to commence a rulemaking to “review its totality of the circumstances test for good faith [retransmission consent] negotiations.” The Commission has commenced the required proceeding to review the “totality of the circumstances” test for good faith retransmission consent negotiations, which proceeding is ongoing. We cannot predict what, if any, additional changes to the rules governing retransmission consent negotiations may be adopted. Separately, the FCC has sought comment on a proposal to eliminate the network non-duplication and syndicated exclusivity protection rules, which may permit cable operators, direct broadcast satellite systems, or other distributors classified by the FCC as MVPDs to import out-of-market television stations with duplicating programming during a retransmission consent dispute or otherwise. If these or other changes are adopted and favor MVPDs’ leverage against broadcasters in retransmission consent negotiations, such changes could adversely impact our revenue from retransmission and advertising.
Congress has authorized the FCC to conduct a voluntary incentive auction to reallocate certain spectrum currently occupied by television broadcast stations to mobile wireless broadband services, along with a related “repacking” of the television spectrum for remaining television stations. The repacking may entail television stations moving to different channels, having smaller service areas, and/or accepting additional interference. Congress has required that the FCC make “all reasonable efforts” to preserve the coverage area and population served of full-power and Class A television stations. The legislation authorizing the repacking establishes a $1.75 billion fund for reimbursement of costs incurred by stations which will be required to change channels in the repacking. Initial applications for stations that wish to remain eligible to bid to relinquish some or all of their current spectrum rights - either by going off the air, moving frequency bands, or sharing a channel - were due on January 12, 2016, at which point the “quiet period” under the FCC’s auction anti-collusion rules commenced. During the quiet period - which continues until the FCC publicly announces the auction results
- broadcast television licensees eligible to participate in the reverse-auction phase of the incentive auction are prohibited from directly or indirectly communicating with each other or with forward-auction applicants regarding licensees’ bids or bidding strategies in the incentive auction. The incentive auction is currently scheduled to commence in March 2016. We have performed a comprehensive review of our markets with respect to the opportunities presented by the auction. We have submitted initial applications for certain of our stations. However, we are unable to provide further details due to the above mentioned FCC rules. It is still too early to predict the likelihood, timing or outcome of any additional FCC regulatory action in this regard or the ultimate impact, if any, of the incentive auction and repacking upon our business.
In December 2014, the FCC proposed to expand the definition of MVPD to include certain “over-the-top” distributors of video programming that stream content to consumers over the Internet. If the FCC adopts this proposal, it could result in changes to how our stations’ signals are distributed, as well as how our video programming competitors reach viewers. We are unable to predict at this time whether the FCC will adopt this proposal or what the effect on our retransmission and advertising revenues will be, if any.
Digital Segment
Our Digital Segment is comprised of four business units including; Cars.com, CareerBuilder, G/O Digital and Cofactor. In 2015, our Digital Segment generated net revenues of $1.4 billion, which represented 45% of our total consolidated net revenues.
In October 2014, we acquired the remaining 73% interest we did not already own in Cars.com. Cars.com is a leading independent research site for car shoppers with approximately 30 million visits per month and nearly 900,000 visits per month across mobile devices. Independent automotive research sites have become an integral part of the car shopping process. Today, nearly all consumers visit a third-party site such as Cars.com to gather vehicle and dealership information and build confidence in the decision-making process. Recent research shows that approximately a third of all vehicles sold in the U.S. were both researched and found on Cars.com. Cars.com offers credible and easy-to-understand information from consumers and experts providing car buyers greater control over the shopping process. Leveraging its growing audience, Cars.com informs digital marketing strategies through consumer insights and innovative products, helping automotive dealers and manufacturers more effectively reach in-market car shoppers.
Cars.com generates revenues through online subscription advertising products targeting car dealerships and national advertisers through its own direct sales force as well as its affiliate sales channels. Cars.com hosts approximately 4.5 million vehicle listings at any given time and serves almost 21,000 customers that are primarily franchise and independent car dealers in all 50 states. In January 2015, Cars.com expanded into the area of service, introducing a solution that provides information about reputable certified repair shops and allows consumers to get estimates on potential vehicle repairs.
7
CareerBuilder offers a wide array of solutions that help employers around the world match the right candidate to the right opportunity. CareerBuilder built the world’s first and only pre-hire platform, providing everything from high-powered sourcing and mass job distribution to labor market analysis, workflow and automatic candidate relationship management - all in one place. Through its technology, constant innovation and customer care delivered at every touch point, CareerBuilder is helping employers hire the best talent, faster. Revenues are generated by both our own sales force, by providing recruitment solutions, workforce analytics, and human resource related consulting services, and through sales of employment advertising placed with CareerBuilder's owners' affiliated media organizations.
CareerBuilder serves both U.S. and international customers. Through its websites and partnerships, CareerBuilder has a presence in more than 60 countries worldwide, including Europe, Canada, Asia, Australia and South America. In 2015, U.S. customers accounted for 89% and international customers accounted for 11% of CareerBuilder’s net revenue.
G/O Digital is a one-stop-shop for local businesses looking to connect with media consumers through digital marketing, including via search, social and email advertising. During 2015, we continued to successfully scale and grow this business, by developing a central advertising sales force and offering cross-platform marketing campaigns to leading local advertisers in multiple markets.
Cofactor is a leader in turnkey local, at scale interactive marketing that enables brands and retailers to engage shoppers with personalized ad content on any device or channel to drive local store traffic and sales. Cofactor offers a complete suite of innovative digital advertising solutions to connect with shoppers along the path to purchase, driving measurable in-store sales and return on investment. Cofactor partners with the nation’s top retailers and brands, including CVS, Kohl’s, Lowe’s, Publix, Procter & Gamble, Staples, The Home Depot and Walgreens, to deliver localized ad content to shoppers at national scale through online circulars, display advertising, search, social media, video and mobile.
Strategy: The Digital Segment is driving significant growth as our businesses meet evolving consumer demand. For example, Cars.com has added to its offerings for car dealers, buyers, and sellers increasing Cars.com’s standing within the increasingly crucial advertising vertical. Cars.com continues to be a leader in products and service innovation. Beyond this, Cars.com launched RepairPal Certified, connecting car owners and dealership service departments, and Event Positions, which helps promote dealership events to an in-market audience during a specific timeframe. More recently, we launched Lot Insights, a first-of-its-kind tool in the industry which uses geo-fencing to measure the influence that Cars.com has in connecting customers and online shopping to dealerships and an in-store experience. These products are already contributing to revenue growth and more products will launch in the coming years that will continue to better serve our buyer and seller customers.
Also driving growth at Cars.com is an increase in digital automotive advertising, reflecting trends in consumer behavior, as car shoppers increasingly turn to digital to research vehicles before purchase. Cars.com is well-positioned to take advantage of shifting consumer and dealer trends. We offer industry-leading automotive advertising solutions as well as a user-friendly and innovative vehicle search platform. With approximately 17.5 million new cars sold across the U.S. in 2015, Cars.com is taking advantage of a healthy demand for automobiles, increased digital advertising spending, greater dealer penetration and continued innovation across its product offerings.
CareerBuilder is transforming into a global HR software-as-a-service (SaaS) leader, combining its advertising products with software and analytics to create a single unified solution for recruiters. The SaaS platform is in addition to CareerBuilder's existing product line, and not a departure from the core business. CareerBuilder has rapidly grown its SaaS product offering, achieving revenues of $149 million in 2015, up 30% from 2014.
Competition: Our Digital Segment faces significant competition from other websites offering integrated Internet products and services, networking websites and e-commerce websites. Several competitors offer online services and/or content in a manner similar to us that competes for the attention of the users of our offerings and advertisers. Specifically, Cars.com competes for a share of total digital advertising spend in the U.S. automotive market. The digital automotive industry is constantly evolving with new competitors entering the market as barriers to entry are relatively low. In recent years, dealers have shifted an increasing portion of their advertising budgets to new entrants with niche advertising products. Dealers also continue to invest in search engine marketing to drive traffic directly to their own websites, bypassing third-party sites while still investing in traditional media such as television, radio and newspapers. Cars.com has maintained its leadership position through its award-winning site and through innovative new products for its advertisers. In the current competitive climate, the need to innovate and to connect an advertiser’s investment to eventual sales at a local level will be of increasing importance.
For CareerBuilder, the market for online recruitment solutions is highly competitive with a multitude of online and offline competitors. Competitors include other employment related websites, general classified advertising websites, professional networking and social networking websites, traditional media companies, Internet portals, search engines and blogs. The barriers to entry into the online recruitment market are relatively low and new competitors continue to emerge. Recent trends include the rising popularity of professional and social media networking websites and job aggregation sites which have gained traction with employer advertisers. The number of niche job boards targeting specific industry verticals has also continued to increase. CareerBuilder’s ability to maintain its existing customer base while generating new customers depends, to a significant degree, on the quality of its services, pricing, product innovation and reputation among customers and potential customers.
8
For G/O Digital, the market for digital marketing services is highly competitive and fragmented. On a local level, we face increased competition from a wide range of companies offering similar tools and systems for managing and optimizing advertising campaigns.
For Cofactor, the market for digital store promotions is highly competitive and evolving as digital media transforms demand for marketing programs. Cofactor anticipates continued benefits from growth in online-influenced offline retail sales. The scale of Cofactor’s proprietary retail database and its established distribution partnerships is a source of advantage in this space. Cofactor enables delivery of all types of promotional content to any digitally connected device across all platforms, a key factor with the continued surge in mobile and social usage among consumers.
Regulation and legislation (impacting Digital Segment businesses and digital operations associated with Media businesses): The U.S. Congress has passed legislation which regulates certain aspects of the Internet, including content, copyright infringement, taxation, access charges, liability for third party activities and jurisdiction. Federal, state, local and foreign governmental organizations have enacted and also are considering other legislative and regulatory proposals that would regulate the Internet. Areas of potential regulation include, but are not limited to, user privacy, data security, and intellectual property ownership. With respect to user privacy, the legislative and regulatory proposals could regulate behavioral advertising, which specifically refers to the use of user behavioral data for the creation and delivery of more relevant, targeted Internet advertisements. With respect to our international operations, we are also closely monitoring developments regarding regulations relating to the transfer of personal data from Europe to the U.S. Some of our digital properties utilize certain aspects of user behavioral and personal data in their advertising solutions to customers.
Employees
At the end of 2015, TEGNA and its subsidiaries employed approximately 10,000 full-time and part-time people, including 2,800 at CareerBuilder.
2015 | 2014 | ||||
Media | 5,020 | 5,100 | |||
Digital | 4,785 | 6,080 | |||
Corporate | 215 | 285 | |||
Total company | 10,020 | 11,465 | |||
Approximately 7% of our employees (including subsidiaries) in the U.S. are represented by labor unions. They are represented by 23 local bargaining units, most of which are affiliated with one of four international unions under collective bargaining agreements. These agreements conform generally with the pattern of labor agreements in the broadcasting industry. We do not engage in industry-wide or company-wide bargaining.
Environmental and Sustainability Initiatives
We are committed to protecting the environment and managing our environmental impact responsibly. Environmental risk previously disclosed associated with the printing operations of our former publishing businesses transferred to Gannett in connection with the spin.
Our television stations regularly cover environmental and sustainability issues. Our station in Buffalo, WGRZ, investigated high concentrations of lead in homes. Both the city and the county blamed each other for a lack of testing, which would have identified the problem. As a result of a series of WGRZ stories, the city and county have begun working together to solve the problem, benefiting many Buffalo families. Another example is KPNX in Phoenix, which produced a series of reports on the accidental release by the U.S. Environmental Protection Agency of millions of gallons of toxic waste water from an abandoned mine and its impact on local farmers.
The TEGNA Foundation supports non-profit activities in communities where we do business and contributes to a variety of charitable causes through its Community Grant Program. One of the TEGNA Foundation’s community action grant priorities is environmental conservation.
9
MARKETS WE SERVE
TELEVISION STATIONS AND AFFILIATED DIGITAL PLATFORMS
State/District of Columbia | City | Station/web site | Channel/Network | Affiliation Agreement Expires in | Weekly Audience (5) | Founded | |
Arizona | Flagstaff | KNAZ-TV: 12news.com | Ch. 2/NBC | 2021 | (6 | ) | 1970 |
Phoenix | KPNX-TV: 12news.com | Ch. 12/NBC | 2021 | 1,237,000 | 1953 | ||
Tucson | KMSB-TV: tucsonnewsnow.com | Ch. 11/FOX | 2016 | 208,000 | 1967 | ||
KTTU-TV(1): tucsonnewsnow.com | Ch. 18/MNTV | 2016 | 61,000 | 1984 | |||
Arkansas | Little Rock | KTHV-TV: thv11.com | Ch. 11/CBS | 2019 | 387,000 | 1955 | |
California | Sacramento | KXTV-TV: abc10.com | Ch. 10/ABC | 2018 | 797,000 | 1955 | |
Colorado | Denver | KTVD-TV: my20denver.com | Ch. 20/MNTV | 2016 | 543,000 | 1988 | |
KUSA-TV: 9news.com | Ch. 9/NBC | 2021 | 1,162,000 | 1952 | |||
District of Columbia | Washington | WUSA-TV: wusa9.com | Ch. 9/CBS | 2019 | 1,459,000 | 1949 | |
Florida | Jacksonville | WJXX-TV: firstcoastnews.com | Ch. 25/ABC | 2018 | 391,000 | 1989 | |
WTLV-TV: firstcoastnews.com | Ch. 12/NBC | 2021 | 457,000 | 1957 | |||
Tampa-St. Petersburg | WTSP-TV: wtsp.com | Ch. 10/CBS | 2019 | 1,165,000 | 1965 | ||
Georgia | Atlanta | WATL-TV: myatltv.com | Ch. 36/MNTV | 2016 | 656,000 | 1954 | |
WXIA-TV: 11alive.com | Ch. 11/NBC | 2021 | 1,552,000 | 1948 | |||
Macon | WMAZ-TV: 13wmaz.com | Ch. 13/CBS | 2019 | 185,000 | 1953 | ||
Idaho | Boise | KTVB-TV(3): ktvb.com | Ch. 7/NBC | 2021 | 189,000 | 1953 | |
Kentucky | Louisville | WHAS-TV: whas11.com | Ch. 11/ABC | 2018 | 460,000 | 1950 | |
Louisiana | New Orleans | WWL-TV: wwltv.com | Ch. 4/CBS | 2019 | 516,000 | 1957 | |
WUPL-TV(4): wupltv.com | Ch. 54/MNTV | 2016 | 150,000 | 1955 | |||
Maine | Bangor | WLBZ-TV: wlbz2.com | Ch. 2/NBC | 2021 | 85,000 | 1954 | |
Portland | WCSH-TV: wcsh6.com | Ch. 6/NBC | 2021 | 253,000 | 1953 | ||
Michigan | Grand Rapids | WZZM-TV: wzzm13.com | Ch. 13/ABC | 2018 | 333,000 | 1962 | |
Minnesota | Minneapolis-St. Paul | KARE-TV: kare11.com | Ch. 11/NBC | 2021 | 1,210,000 | 1953 | |
Missouri | St. Louis | KSDK-TV: ksdk.com | Ch. 5/NBC | 2021 | 933,000 | 1947 | |
New York | Buffalo | WGRZ-TV: wgrz.com | Ch. 2/NBC | 2021 | 445,000 | 1954 | |
North Carolina | Charlotte | WCNC-TV: wcnc.com | Ch. 36/NBC | 2021 | 775,000 | 1967 | |
Greensboro | WFMY-TV: wfmynews2.com | Ch. 2/CBS | 2019 | 506,000 | 1949 | ||
Ohio | Cleveland | WKYC-TV: wkyc.com | Ch. 3/NBC | 2021 | 1,077,000 | 1948 | |
Oregon | Portland | KGW-TV(2): kgw.com | Ch. 8/NBC | 2021 | 792,000 | 1956 | |
South Carolina | Columbia | WLTX-TV: wltx.com | Ch. 19/CBS | 2019 | 271,000 | 1953 | |
Tennessee | Knoxville | WBIR-TV: wbir.com | Ch. 10/NBC | 2021 | 377,000 | 1956 | |
Texas | Abilene-Sweetwater | KXVA-TV: myfoxzone.com | Ch. 15/FOX | 2017 | N/A (7) | 2001 | |
Austin | KVUE-TV: kvue.com | Ch. 24/ABC | 2018 | 468,000 | 1971 | ||
Beaumont-Port Arthur | KBMT-TV: 12newsnow.com | Ch. 12/ABC | 2018 | 97,000 | 1961 | ||
Corpus Christi | KIII-TV: kiiitv.com | Ch. 3/ABC | 2018 | 151,000 | 1964 | ||
Dallas/Ft. Worth | WFAA-TV: wfaa.com | Ch. 8/ABC | 2018 | 1,587,000 | 1949 | ||
Houston | KHOU-TV: khou.com | Ch. 11/CBS | 2019 | 1,532,000 | 1953 | ||
San Angelo | KIDY-TV: myfoxzone.com | Ch. 6/FOX | 2017 | N/A (7) | 1984 | ||
San Antonio | KENS-TV: kens5.com | Ch. 5/CBS | 2019 | 615,000 | 1950 | ||
Tyler-Longview | KYTX-TV: cbs19.tv | Ch. 19/CBS | 2019 | 137,000 | 2008 | ||
Waco-Temple-College Station | KCEN-TV: kcentv.com | Ch. 9/NBC | 2021 | 183,000 | 1953 | ||
Virginia | Hampton/Norfolk | WVEC-TV: 13newsnow.com | Ch. 13/ABC | 2018 | 496,000 | 1953 | |
Washington | Seattle/Tacoma | KING-TV: king5.com | Ch. 5/NBC | 2021 | 1,285,000 | 1948 | |
KONG-TV: king5.com | Ch. 16/IND | N/A | 535,000 | 1997 | |||
Spokane | KREM-TV: krem.com | Ch. 2/CBS | 2019 | 258,000 | 1954 | ||
KSKN-TV: spokanescw22.com | Ch. 22/CW | 2016 | 88,000 | 1983 | |||
(1) | We service this station under service arrangements. |
(2) | We also own KGWZ-LD, a low power television station in Portland, OR. |
(3) | We also own KTFT-LD (NBC), a low power television station in Twin Falls, ID. |
(4) | We also own WBXN-CA, a Class A television station in New Orleans, LA. |
(5) | Weekly audience is number of television households reached, according to the November 2015 Nielsen book. |
(6) | KNAZ weekly audience is reported as part of KPNX. |
(7) | Audience numbers fall below minimum reporting standards. |
We also have one regional news channel, Northwest Cable News (NWCN) in Seattle/Tacoma, WA, and two local news channels, 24/7 NewsChannel in Boise, ID and NewsWatch on Channel 15 in New Orleans, LA. These operations provide news coverage and certain other programming in a comprehensive 24-hour a day format using the resources of our television stations in Texas, Washington, Oregon, Idaho, Louisiana and Arizona.
10
DIGITAL |
Cars.com: www.cars.com Headquarters: Chicago, IL |
CareerBuilder: www.careerbuilder.com Headquarters: Chicago, IL |
Cofactor (also operating as ShopLocal): www.cofactordigital.com; www.shoplocal.com; www.aboutshoplocal.com Headquarters: Chicago, IL |
G/O Digital: www.godigitalmarketing.com Headquarters: Phoenix, AZ |
INVESTMENTS We have non-controlling ownership interests in the following companies: |
4Info: www.4info.com |
Captivate: www.captivate.com |
Livestream: www.livestream.com |
Repair Pal: www.repairpal.com |
Topix: www.topix.com |
Video Call Center: www.thevideocallcenter.com |
Wanderful Media: www.wanderful.com |
Winners View: www.winnersview.com |
TEGNA ON THE NET: News and information about us is available on our web site, www.TEGNA.com. In addition to news and other information about us, we provide access through this site to our annual report on Form 10-K, our quarterly reports on Form 10-Q, our current reports on Form 8-K and all amendments to those reports as soon as reasonably practicable after we file or furnish them electronically to the Securities and Exchange Commission (SEC). Certifications by our Chief Executive Officer and Chief Financial Officer are included as exhibits to our SEC reports (including to this Form 10-K). We also provide access on this web site to our Principles of Corporate Governance, the charters of our Audit, Executive Compensation and Nominating and Public Responsibility Committees and other important governance documents and policies, including our Ethics and Inside Trading Policies. Copies of all of these corporate governance documents are available to any shareholder upon written request made to our Secretary at the headquarters address. We will disclose on this web site changes to, or waivers of, our corporate Ethics Policy. | |
11
Certain factors affecting forward-looking statements
Certain statements in this Annual Report on Form 10-K contain certain forward-looking statements regarding business strategies, market potential, future financial performance and other matters. The words “believe,” “expect,” “estimate,” “could,” “should,” “intend,” “may,” “plan,” “seek,” “anticipate,” “project” and similar expressions, among others, generally identify “forward-looking statements”. These forward-looking statements are subject to certain risks and uncertainties that could cause actual results and events to differ materially from those anticipated in the forward-looking statements.
Our actual financial results may be different from those projected due to the inherent nature of projections. Given these uncertainties, forward-looking statements should not be relied on in making investment decisions. The forward-looking statements contained in this Form 10-K speak only as of the date of its filing. Except where required by applicable law, we expressly disclaim a duty to provide updates to forward-looking statements after the date of this Form 10-K to reflect subsequent events, changed circumstances, changes in expectations, or the estimates and assumptions associated with them. The forward-looking statements in this Form 10-K are intended to be subject to the safe harbor protection provided by the federal securities laws.
ITEM 1A. RISK FACTORS
Following the spin-off of our publishing businesses in June 2015, the size and concentration of our business has changed. An investment in our common stock involves risks and uncertainties and prospective investors should consider carefully the following risk factors before investing in our securities. The risks described below may not be the only risks we face. Additional risks that we do not yet perceive or that we currently believe are immaterial may adversely affect our business and the trading price of our securities.
Changes in economic conditions in the U.S. markets we serve may depress demand for our products and services
We generate a significant portion of our revenues in our Media Segment from the sale of advertising at our television stations. Expenditures by advertisers tend to be cyclical, reflecting overall economic conditions, as well as budgeting and buying patterns. As a result, our operating results depend on the relative strength of the economy in our principal television and digital markets as well as the strength or weakness of regional and national economic factors. A decline in economic conditions in the U.S. could have a significant adverse impact on our businesses and could significantly impact all key advertising revenue categories. In addition, declining economic conditions could adversely affect employment conditions and consumer sentiment, reducing demand for the product offerings of CareerBuilder and Cars.com, which could impair our ability to grow our Digital revenues, which are increasingly important to our overall revenue mix since the separation was completed.
Competition from alternative forms of media may impair our ability to grow or maintain revenue levels in core and new businesses
Advertising produces the predominant share of our revenues from our Media Segment, with our stations’ affiliated desktop, mobile and tablet advertising revenues being an important component. Technology, particularly new video formats, streaming and downloading capabilities via the Internet, video-on-demand, personal video recorders and other devices and technologies used in the entertainment industry, continues to evolve rapidly, leading to alternative methods for the delivery and storage of digital content. These technological advancements have driven changes in consumer behavior and have empowered consumers to seek more control over when, where and how they consume news and entertainment, including through so-called “cutting the cord” and other consumption strategies. These innovations may affect our ability to generate television audience, which may make our television stations less attractive to both household audiences and advertisers. This competition may make it difficult for us to grow or maintain our media revenues, which we believe will challenge us to expand the contributions of our online and other digital businesses.
The value of our assets or operations may be diminished if our information technology systems fail to perform adequately or if we are the subject of a data breach or cyber attack
Our information technology systems are critically important to operating our business efficiently and effectively. We rely on our information technology systems to manage our business data, communications, news and advertising content, digital products, order entry, fulfillment and other business processes. The failure of our information technology systems to perform as we anticipate could disrupt our business and could result in transaction errors, processing inefficiencies, late or missed publications, and loss of sales and customers, causing our business and results to be impacted.
Furthermore, attempts to compromise information technology systems occur regularly across many industries and sectors, and we may be vulnerable to security breaches beyond our control. We invest in security resources and technology to protect our data and business processes against risk of data security breaches and cyber attack, but the techniques used to attempt attacks are constantly changing. A breach or successful attack could have a negative impact on our operations or business reputation. We maintain cyber risk insurance, but this insurance may be insufficient to cover all of our losses from any future breaches of our systems.
As has historically been the case in the broadcast sector, loss of or changes in affiliation agreements or retransmission consent agreements could adversely affect operating results for our Media Segment’s stations
Most of our stations have network affiliation agreements with the major broadcast television networks (ABC, CBS, NBC, and Fox). These television networks produce and distribute programming in exchange for each of our stations' commitment to air the programming at specified times and for commercial announcement time during the programming. In most cases, we also make cash payments to the networks.
12
Each of our affiliation agreements has a stated expiration date. If renewed, our network affiliation agreements may be renewed on terms that are less favorable to us. The non-renewal or termination of any of our network affiliation agreements would prevent us from being able to carry programming of the affiliate network. This loss of programming would require us to obtain replacement programming, which may involve higher costs and/or which may not be as attractive to our audiences, resulting in reduced revenues.
In recent years, the networks have streamed their programming on the Internet and other distribution platforms, in some cases within a short period of the original network programming broadcast on local television stations, including those we own. An increase in the availability of network programming on alternative platforms that either bypass or provide less favorable terms to local stations - such as cable channels, the Internet and other distribution vehicles - may dilute the exclusivity and value of network programming originally broadcast by the local stations and could adversely affect the business, financial condition and results of operations of our stations.
Our retransmission consent agreements with major cable, satellite and telecommunications service providers permit them to retransmit our stations’ signals to their subscribers in exchange for the payment of compensation to us. As is the case in the broadcast television industry generally, if we are unable to renegotiate these agreements on favorable terms, or at all, the failure to do so could have an adverse effect on our business, financial condition, and results of operations.
There could be significant liability if the spin-off of the publishing businesses is determined to be a taxable transaction
We received an opinion from outside tax counsel to the effect that the requirements for tax-free treatment under Section 355 of the Internal Revenue Code were satisfied. The opinion relies on certain facts, assumptions, representations and undertakings from TEGNA and Gannett regarding the past and future conduct of the companies’ respective businesses and other matters. If any of these facts, assumptions, representations or undertakings is incorrect or not satisfied, TEGNA and its stockholders may not be able to rely on the opinion of tax counsel and could be subject to significant tax liabilities.
Notwithstanding the opinion of tax counsel, the Internal Revenue Service could determine on audit that the separation is taxable if it determines that any of these facts, assumptions, representations or undertakings were incorrect or have been violated or if it disagrees with the conclusions in the opinion, or for other reasons, including as a result of certain significant changes in the share ownership of TEGNA or Gannett after the separation. If the separation is determined to be taxable for U.S. federal income tax purposes, TEGNA and its stockholders that are subject to U.S. federal income tax could incur significant U.S. federal income tax liabilities.
Gannett or we may fail to perform under various temporary transaction agreements that were executed as part of the separation or we may fail to have necessary systems and services in place when certain of the transaction agreements expire
In connection with the separation, we entered into a separation and distribution agreement and also entered into various other agreements, including a transition services agreement, a tax matters agreement and an employee matters agreement. The separation and distribution agreement, the tax matters agreement and the employee matters agreement determined the allocation of assets and liabilities between the companies following the separation for those respective areas and includes certain indemnifications related to liabilities and obligations. The transition services agreement provides for the performance of certain services by each company for the benefit of the other for a limited period of time after the separation. We will rely on Gannett to satisfy its performance obligations under these agreements. If Gannett is unable to satisfy its obligations under these agreements, we could incur operational difficulties or losses. If we do not have in place our own systems and services, or if we do not have agreements with other providers of these services once certain transaction agreements expire or terminate, we may not be able to operate our business effectively and our profitability may decline.
Volatility in the U.S. credit markets could significantly impact our ability to obtain new financing to fund our operations and strategic initiatives or to refinance our existing debt at reasonable rates as it matures
At December 31, 2015, we had approximately $4.2 billion in debt and approximately $658 million of undrawn additional borrowing capacity under our revolving credit facility that expires in 2020. This debt matures at various times during the years 2016-2027. While our cash flow is expected to be sufficient to pay amounts when due, if operating results deteriorate significantly, a portion of these maturities may need to be refinanced. Access to the capital markets for longer-term financing is unpredictable, and volatile credit markets could make it harder for us to obtain debt financings generally.
Changes in the regulatory environment could encumber or impede our efforts to improve operating results or the value of assets
Our media and digital operations are subject to government regulation. Changing regulations, particularly FCC Regulations which affect our television stations (including changes to our shared services and similar agreements), may result in increased costs, reduced valuations for certain broadcasting properties or other impacts, all of which may adversely impact our future profitability. All of our television stations are required to hold television broadcasting licenses from the FCC; when granted, these licenses are generally granted for a period of eight years. Under certain circumstances, the FCC is not required to renew any license and could decline to renew either our current license applications that are pending or those submitted in the future.
13
Our strategic acquisitions, investments and partnerships could pose various risks, increase our leverage and may significantly impact our ability to expand our overall profitability
Acquisitions involve inherent risks, such as increasing leverage and debt service requirements and combining company cultures and facilities, which could have a material adverse effect on our results of operations or cash flow and could strain our human resources. We may be unable to successfully implement effective cost controls, achieve expected synergies or increase revenues as a result of an acquisition. Acquisitions may result in us assuming unexpected liabilities and in management diverting its attention from the operation of our business. Disclosures we make regarding past operating results of acquired entities and our pro forma results are based on financial information provided to us by acquired entities, which has not been reviewed by our auditors or subject to our internal controls. Acquisitions may result in us having greater exposure to the industry risks of the businesses underlying the acquisition. Strategic investments and partnerships with other companies expose us to the risk that we may be unable to control the operations of our investee or partnership, which could decrease the amount of benefits we realize from a particular relationship. We are exposed to the risk that our partners in strategic investments and infrastructure may encounter financial difficulties which could disrupt investee or partnership activities, or impair assets acquired, which would adversely affect future reported results of operations and shareholders’ equity. In addition, we may be unable to obtain financing necessary to complete acquisitions on attractive terms or at all. The failure to obtain regulatory approvals may prevent us from completing or realizing the anticipated benefits of acquisitions. Furthermore, acquisitions may subject us to new or different regulations which could have an adverse effect on our operations.
The value of our existing intangible assets may become impaired, depending upon future operating results
Goodwill and other intangible assets were approximately $6.98 billion at December 31, 2015, representing approximately 82% of our total assets. These assets are subject to annual impairment testing and more frequent testing upon the occurrence of certain events or significant changes in circumstance that indicate all or a portion of their carrying values may no longer be recoverable. In which case a non-cash charge to earnings may be necessary, as occurred in 2013-2015 (see Notes 3 and 11 to the consolidated financial statements). We may subsequently experience market pressures which could cause future cash flows to decline below our current expectations, or volatile equity markets could negatively impact market factors used in the impairment analysis, including earnings multiples, discount rates, and long-term growth rates. Any future evaluations requiring an asset impairment charge for goodwill or other intangible assets would adversely affect future reported results of operations and shareholders’ equity, although such charges would not affect our cash flow.
ITEM 1B. UNRESOLVED STAFF COMMENTS
None.
ITEM 2. PROPERTIES
Media Segment
Our media facilities are adequately equipped with the necessary television digital broadcasting equipment. We own or lease transmitter facilities in 52 locations. All of our stations have converted to digital television operations in accordance with applicable FCC Regulations. Our broadcasting facilities are adequate for present purposes. A listing of television station locations can be found on page 10.
Digital Segment
Generally, our digital businesses lease their facilities. This includes facilities for executive offices, sales offices and data centers. Our facilities are adequate for present operations. We believe that suitable additional or alternative space, including those under lease options, will be available at commercially reasonable terms for future expansion. A listing of our significant Digital facilities can be found on pages 11.
Corporate facilities
In October 2015, we sold our corporate headquarters in McLean, VA for a purchase price of $270 million. Following the sale, we are leasing a portion of the facility back for a period of at least 18 months. Additional information regarding the corporate headquarters sale may be found in Note 12 of the Notes to Consolidated Financial Statements.
ITEM 3. LEGAL PROCEEDINGS AND ENVIRONMENTAL MATTERS
Information regarding legal proceedings may be found in Note 12 of the Notes to Consolidated Financial Statements.
ITEM 4. MINE SAFETY DISCLOSURES
Not applicable.
14
PART II
ITEM 5.MARKET FOR REGISTRANT’S COMMON EQUITY, RELATED STOCKHOLDER MATTERS AND ISSUER PURCHASES OF EQUITY SECURITIES
Our shares are traded on the New York Stock Exchange with the symbol TGNA. Information regarding outstanding shares, shareholders and dividends may be found on pages 1, 4 and 15 of this Form 10-K. Information about debt securities sold in private transactions may be found on pages 25-26 of this Form 10-K.
TEGNA Common Stock Prices
High-low range by fiscal quarters based on NYSE-composite prices. On June 29, 2015, the first day of the fiscal third quarter, we completed the separation of our publishing business through a spin-off transaction. TEGNA's common stock prices in and after the third quarter of 2015 reflect the price impact of the spin-off transaction.
Dividends Paid Per Share | Common Stock Prices | ||||||
Year | Quarter | Low | High | ||||
2015 | First | $0.20 | $29.62 | $36.56 | |||
Second | $0.20 | $34.27 | $38.01 | ||||
Third | $0.20 | $22.42 | $32.97 | ||||
Fourth | $0.14 | $21.85 | $28.68 | ||||
Total 2015 | $0.74 | $21.85 | $38.01 | ||||
2014 | First | $0.20 | $25.96 | $30.43 | |||
Second | $0.20 | $25.53 | $30.98 | ||||
Third | $0.20 | $29.88 | $35.70 | ||||
Fourth | $0.20 | $25.95 | $33.70 | ||||
Total 2014 | $0.80 | $25.53 | $35.70 | ||||
Following the spin-off of our publishing businesses, on June 29, 2015, we announced that we would begin paying a regular quarterly cash dividend of $0.14 per share. We paid dividends (excluding the special spin-off distribution of our publishing businesses) totaling $167.5 million in 2015 and $181 million in 2014. On Feb. 23, 2016, the Board of Directors declared a dividend of $0.14 per share, payable on April 1, 2016, to shareholders of record as of the close of business March 4, 2016. We expect to continue paying comparable regular cash dividends in the future. The rate and frequency of future dividends will depend on future earnings, capital requirements and financial condition and other factors considered relevant by our Board of Directors.
Purchases of Equity Securities
Period | Total Number of Shares Purchased | Average Price Paid per Share | Total Number of Shares Purchased as Part of Publicly Announced Program | Approximate Dollar Value of Shares that May Yet Be Repurchased Under the Program | |||||
9/28/15 - 11/1/15 | 264,743 | $25.81 | 264,743 | $692,688,712 | |||||
11/2/15 - 11/29/15 | 939,864 | $27.26 | 939,864 | $667,066,449 | |||||
11/30/15 - 12/31/15 | 1,426,500 | $26.64 | 1,426,500 | $629,060,180 | |||||
Total 4th Quarter 2015 | 2,631,107 | $26.78 | 2,631,107 | $629,060,180 | |||||
In June 2015, our Board of Directors approved a $750 million share repurchase program to be completed over a three-year period beginning June 29, 2015. On Oct. 20, 2015, our Board of Directors approved a $75 million increase to the share repurchase program, bringing the total authorized amount to $825 million. We spent $271 million in 2015 to repurchase 9.6 million of our shares, at an average price per share of $28.16. Under the program, management has discretion to determine the dollar amount of shares to be repurchased and the timing of any repurchases in compliance with applicable law and regulation.
As of December 31, 2015, 123,000 shares were repurchased as part of the publicly announced repurchase program, but were settled after the quarter ended. The effect of those repurchases decreased the maximum dollar value available under the program to $625,874,910.
15
Comparison of shareholder return – 2011 to 2015
The following graph compares the performance of our common stock during the period Dec. 26, 2010, to Dec. 31, 2015, with the S&P 500 Index, and two peer group indexes we selected.
Our 2015 peer group includes A.H. Belo Corp., Discovery Communications Inc., The E.W. Scripps Company, LinkedIn Corp., The McClatchy Company, Media General, Inc. (on an adjusted basis to reflect its merger with Young Broadcasting, LLC), Meredith Corp., Monster Worldwide Inc., The New York Times Company, News Corp. (on an adjusted basis to reflect the spin-off by News Corporation), Nexstar Broadcasting Group Inc., ReachLocal Inc., Sinclair Broadcast Group Inc., and Yahoo Inc. (collectively, the “2015 Peer Group”). Many of the 2015 Peer Group companies have a strong publishing/broadcasting orientation, but the peer group also includes companies in the digital media industry.
Our 2016 peer group includes Angie's List Inc., CBS Corp., Constant Contact Inc., Discovery Communications Inc., E.W. Scripps Company, Gray Television Inc., Groupon Inc., Harte Hanks Inc., IAC/InterActiveCorp, LinkinedIn Corp., Media General, Inc., Meredith Corp., Monster Worldwide Inc., Nexstar Broadcasting Group Inc., Sinclair Broadcast Group Inc., Tribune Media Company, Yahoo Inc., and Yelp Inc. (collectively, the "2016 Peer Group"). Our 2016 Peer Group reflects our post-spin business segments and includes broadcasting and digital companies.
The S&P 500 Index includes 500 U.S. companies in the industrial, utilities and financial sectors and is weighted by market capitalization. The total returns of the Peer Groups also are weighted by market capitalization.
The graph depicts representative results of investing $100 in our common stock, the S&P 500 Index, 2015 Peer Group, and 2016 Peer Group index at closing on Dec. 26, 2010. It assumes that dividends were reinvested monthly with respect to our common stock (including, as it relates to the spin-off, the aggregate value of the former publishing businesses as distributed to our shareholders), daily with respect to the S&P 500 Index and monthly with respect to each Peer Group company.
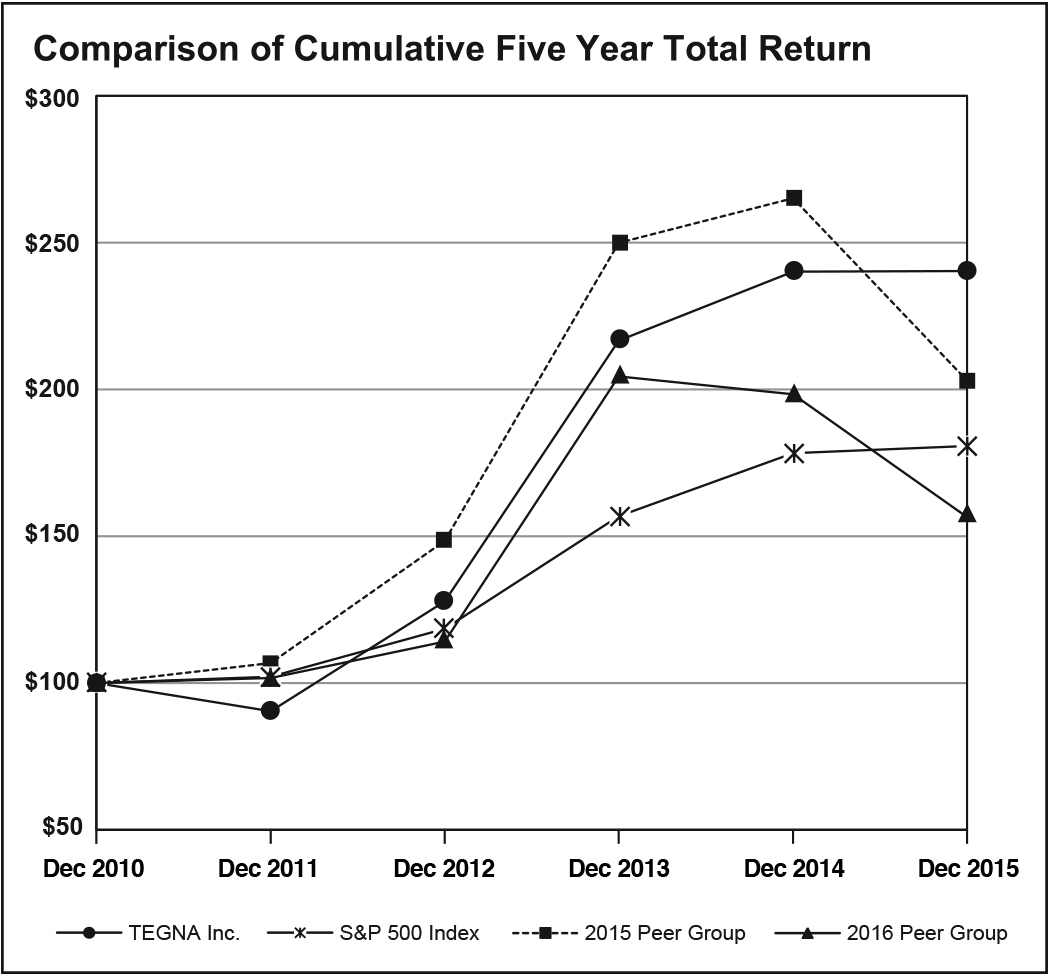
2010 | 2011 | 2012 | 2013 | 2014 | 2015 | |||||||||||||
TEGNA Inc. | $ | 100 | $ | 90.37 | $ | 127.80 | $ | 216.61 | $ | 240.11 | $ | 240.31 | ||||||
S&P 500 Index | $ | 100 | $ | 102.11 | $ | 118.45 | $ | 156.82 | $ | 178.29 | $ | 180.75 | ||||||
2015 Peer Group | $ | 100 | $ | 106.82 | $ | 148.38 | $ | 249.95 | $ | 265.12 | $ | 202.97 | ||||||
2016 Peer Group | $ | 100 | $ | 101.74 | $ | 114.08 | $ | 204.45 | $ | 198.34 | $ | 156.51 | ||||||
ITEM 6. SELECTED FINANCIAL DATA
Selected financial data for the years 2011 through 2015 is contained under the heading “Selected Financial Data” on page 64 and is derived from our audited financial statements for those years.
The information contained in the “Selected Financial Data” is not necessarily indicative of the results of operations to be expected for future years, and should be read in conjunction with “Management’s Discussion and Analysis of Financial Condition and Results of Operations” included in Item 7 and the consolidated financial statements and related notes thereto included in Item 8 of this Form 10-K.
16
ITEM 7. MANAGEMENT’S DISCUSSION AND ANALYSIS OF FINANCIAL CONDITION AND RESULTS OF OPERATIONS
Executive Summary
Our company is comprised of a dynamic portfolio of media and digital businesses that provide content that matters and brands that deliver. Our media business includes 46 television stations operating in 38 markets, offering high-quality television programming and digital content. Our digital business primarily consists of our Cars.com and CareerBuilder business units that operate in the automotive and human capital solutions industries. The Cars.com website provides credible and easy-to-understand information from consumers and experts to provide car buyers with greater control over the car buying and servicing process. CareerBuilder helps companies target, attract and retain workforce talent through an array product offerings including talent management software and other advertising and recruitment solutions.
On the first day of our fiscal third quarter, June 29, 2015, we completed the spin-off of our publishing businesses. Our company was renamed TEGNA Inc., and our stock trades on the New York Stock Exchange under the symbol TGNA. In addition, during the fourth quarter of 2015, we sold substantially all of the businesses within our Other Segment.
We have presented the financial condition and results of operations of the former publishing businesses and Other Segment as discontinued operations in the accompanying consolidated financial statements for all periods presented. For a summary of discontinued operations, see Note 13.
Fiscal year: Beginning in fiscal year 2015, we changed our financial reporting cycle to a calendar year-end. Accordingly, our 2015 fiscal year began on December 29, 2014 (the day after the end of the 2014 fiscal year) and ended on December 31, 2015. Historically, our fiscal year was a 52-53 week fiscal year that ended on the last Sunday of the calendar year. As a result, our 2015 fiscal year had four more days than the 2014 and 2013 fiscal years. The impact of the four extra days did not have a material impact on our financial statements, and therefore, we have not restated the historical results.
RESULTS OF OPERATIONS:
Consolidated summary
A consolidated summary of our results is presented below.
In millions of dollars | |||||||||||
2015 | Change | 2014 | Change | 2013 | |||||||
Operating revenue: | |||||||||||
Media | $ | 1,682 | (1%) | $ | 1,692 | *** | $ | 835 | |||
Digital | 1,369 | 47% | 934 | 22% | 768 | ||||||
Total operating revenues | $ | 3,051 | 16% | $ | 2,626 | 64% | $ | 1,603 | |||
Cost of sales | $ | 923 | (3%) | $ | 955 | 44% | $ | 663 | |||
Selling, general and admin. expenses | 1,068 | 39% | 767 | 44% | 532 | ||||||
Depreciation | 91 | 6% | 86 | 59% | 54 | ||||||
Amortization of intangible assets | 114 | 73% | 66 | *** | 21 | ||||||
Facility consolidation and asset impairment charges | (59 | ) | *** | 45 | 98% | 23 | |||||
Operating expenses | $ | 2,138 | 11% | $ | 1,919 | 48% | $ | 1,292 | |||
Operating income | $ | 913 | 29% | $ | 707 | *** | $ | 311 | |||
Note: Numbers may not sum due to rounding. | |||||||||||
Consolidated Operating Revenue and Expense
2015 compared to 2014: Operating revenues were $3.05 billion in 2015, an increase of 16% from $2.63 billion in 2014. Media Segment revenues for 2015 decreased 1% to $1.68 billion, as double-digit growth in retransmission revenue and online revenue and higher core revenue was offset by the record level of political advertising revenue of $159 million achieved in 2014. Digital Segment revenues totaled $1.37 billion for 2015, a record high and an increase of 47%. The increase reflects the acquisition and strong organic growth of Cars.com revenue.
Total reported operating expenses increased 11% to $2.14 billion in 2015, primarily due to the acquisition of Cars.com. Depreciation expense was 6% higher in 2015, reflecting the impact from the 2014 acquisitions of London Broadcasting television stations and Cars.com. Facility consolidation and non-cash asset impairment charges for all years are discussed in Notes 3 and 11 to the Consolidated Financial Statements.
We reported operating income for 2015 of $913 million compared to $707 million in 2014, a 29% increase primarily driven by the acquisition of Cars.com.
Our consolidated operating margins improved to 30% in 2015 compared to 27% in 2014 driven by improvement in margins from our Digital Segment, partially offset by the impact from the absence of Olympic and political spending in 2014.
2014 compared to 2013: Operating revenues for 2014 increased 64% to $2.62 billion, primarily due to increases from Media Segment as a result of the acquisitions of Belo and London Broadcasting Company television stations as well as substantially higher retransmission revenue, political and Olympic advertising. Digital Segment also increased as a result of increases at CareerBuilder driven by the strength of human capital software solutions and acquisition of Cars.com in October 2014.
Operating expenses increased by 48% to $1.92 billion for 2014, primarily due to the acquisitions of Belo, London Broadcasting Company and Cars.com.
17
Payroll expense trends: Payroll expense is the largest element of our normal operating expenses, and is summarized below, expressed as a percentage of total pre-tax operating expenses. Payroll expense as a percentage of total pre-tax operating expenses has remained consistent during 2013 through 2015.
2015 | 2014 | 2013 | |
Payroll costs | 41.1% | 41.0% | 44.2% |
Non-operating income and expense
Equity earnings: This income statement category reflects our share of earnings or losses from equity method investees. Our net equity income in unconsolidated investees for 2015 decreased from a gain of $151 million in 2014 to an equity loss of $5 million, reflecting primarily the absence of a $148 million gain on the sale of Apartments.com by Classified Ventures in 2014. Net equity income from unconsolidated investees for 2014 increased by $130 million compared to 2013 driven by the Apartments.com gain.
Interest expense: Interest expense in 2015 was $274 million and increased by $1 million primarily due to a higher average debt level of $4.37 billion compared to $3.85 billion in 2014. The higher average debt level is related to additional borrowings related to the October 2014 Cars.com acquisition. This increase was substantially offset by a lower average interest rate.
Interest expense in 2014 was higher compared to 2013, due to a higher average debt level of $3.85 billion in 2014 compared to $2.01 billion in 2013. The higher average debt level is related to additional borrowing related to both the Belo and Cars.com acquisitions in 2013 and 2014, respectively, partly offset by a lower average interest rate.
A further discussion of our borrowing and related interest cost is presented in the “Liquidity and capital resources” section of this report beginning on page 25 and in Note 6 to the Consolidated Financial Statements.
Other non-operating items: We reported a net loss of $12 million for other non-operating items in 2015. This loss is comprised of costs related to the spin-off of our publishing businesses partially offset by a gain of $44 million on the sale of a business.
Other non-operating items totaled a net gain of $404 million in 2014 with the majority related to the write-up of our prior 27% investment in Cars.com to fair value post acquisition and a gain related to required accounting for the pre-existing affiliate agreement between us and Cars.com. The net gain was partially offset by acquisition costs and expenses incurred for the spin-off of our publishing businesses.
We reported a net loss from non-operating items of $45 million in 2013 with the majority related to costs associated with the Belo transaction and a non-cash charge associated with the change in control and sale of interests related to our Captivate business. These costs were partially offset by interest income earned in 2013.
Provision for income taxes
We reported pre-tax income from continuing operations attributable to TEGNA of $560 million for 2015. The effective tax rate on pre-tax income was 36.1%.
We reported pre-tax income from continuing operations attributable to TEGNA of $922 million for 2014. The provision for income taxes reflects a special net tax benefit from the sale of a non-strategic subsidiary at a loss, for which a partial tax benefit was recognized. The effective tax rate in 2014 was 25.4%.
The higher tax rate for 2015 compared to 2014 is due to special items contributing a net tax benefit that related primarily to the 2014 sale of a non-strategic subsidiary at a loss, for which a partial tax benefit was recognized, partially offset by a reduction in audit resolutions.
We reported pre-tax income from continuing operations attributable to TEGNA of $55 million for 2013. The provision for income taxes reflects certain state audit settlements and a special net tax benefit from the release of certain tax reserves due to a multi-year federal audit settlement in 2013. The effective tax rate on pre-tax income was 24.5% which was comparable to the effective tax rate of 25.4% in 2014.
Further information concerning income tax matters is contained in Note 5 of the Consolidated Financial Statements.
Net income from continuing operations attributable to TEGNA Inc.
Net income from continuing operations attributable to TEGNA Inc. and related per share amounts are presented in the table below.
In millions of dollars, except per share amounts | |||||||||||
2015 | Change | 2014 | Change | 2013 | |||||||
Net income from continuing operations attributable to TEGNA Inc. | $ | 357 | (48%) | $ | 688 | *** | $ | 41 | |||
Per basic share | $ | 1.59 | (48%) | $ | 3.04 | *** | $ | 0.18 | |||
Per diluted share | $ | 1.56 | (47%) | $ | 2.97 | *** | $ | 0.18 | |||
Net income from continuing operations attributable to TEGNA Inc. consists of net income reduced by net income attributable to noncontrolling interests, primarily from CareerBuilder. We reported net income from continuing operations attributable to TEGNA of $357 million or $1.56 per diluted share for 2015 compared to $688 million or $2.97 per diluted share for 2014.
Net income attributable to noncontrolling interests was $63 million in 2015, $68 million in 2014 and $57 million in 2013.
18
Outlook for 2016: For 2016, we expect a record year for Media Segment revenues. Although we are still in the early stages of the campaign cycle, we are projecting Media segment revenues to increase in the high-teens to low 20% range with record political revenues in 2016 enhanced by our strong geographical footprint. We also anticipate significant summer Olympic revenue as television viewership of the Rio games has been projected to reach record highs.
Digital Segment revenues are expected to continue to increase driven by anticipated growth of 10%+ at Cars.com and mid-single digit revenue growth at CareerBuilder. These strong Media and Digital revenue drivers across the segments will all meaningfully contribute to total company revenue increases in the low to mid-teen range over 2015.
Total operating expenses are also expected to increase in the range of 8% to 10% in comparison to 2015 driven by higher revenues as we expand into richer content and broader product suites across all of our businesses. We also expect an increase in programming costs from the newly-negotiated affiliation agreements during the second half of 2015, as well as increases from digital sales growth initiatives within the Media Segment. In addition, we anticipate the following expenses and cash flow items in 2016:
• | Depreciation expense is expected to be in the range of $90 million to $95 million in 2016. |
• | Amortization expense is expected to be approximately $110 million in 2016. |
• | We project interest expense of nearly $235 million. |
• | Capital expenditures are expected to be approximately $85 million to $95 million. |
A discussion of operating results of our Media, and Digital Segments is as follows:
Media Segment
At the end of 2015, our Media operations included 46 television stations either owned or serviced through shared service agreements or other similar agreements. Media Segment revenues accounted for approximately 55% of our reported operating revenues for 2015.
Over the last three years, Media Segment revenues, expenses and operating income were as follows:
In millions of dollars | |||||||||||
2015 | Change | 2014 | Change | 2013 | |||||||
Operating revenues | $ | 1,682 | (1%) | $ | 1,692 | *** | $ | 835 | |||
Operating expenses | |||||||||||
Operating expenses exclusive of depreciation | 886 | 4% | 851 | 92% | 444 | ||||||
Depreciation | 51 | (1%) | 52 | 98% | 26 | ||||||
Amortization | 22 | (21%) | 29 | *** | 2 | ||||||
Transformation items | 8 | (41%) | 14 | *** | 1 | ||||||
Operating expenses | 968 | 2% | 945 | *** | 473 | ||||||
Operating income | $ | 714 | (4%) | $ | 747 | *** | $ | 362 | |||
Media Segment revenues are grouped into five categories: Core (Local and National), Political, Retransmission, Digital and Other. The following table summarizes the year-over-year changes in these select revenue categories.
In millions of dollars | ||||||||||||
2015 | Change | 2014 | Change | 2013 | ||||||||
Core (Local & National) | $ | 1,072 | 3% | $ | 1,046 | 74 | % | $ | 600 | |||
Political | 21 | (87%) | 159 | *** | 13 | |||||||
Retransmission (a) | 449 | 24% | 362 | 145 | % | 148 | ||||||
Digital | 113 | 16% | 98 | 156 | % | 38 | ||||||
Other | 27 | (2%) | 27 | (24 | )% | 36 | ||||||
Total | $ | 1,682 | (1%) | $ | 1,692 | 103 | % | $ | 835 | |||
(a) Reverse compensation to network affiliates is included as part of programming costs and therefore is excluded from this line. | ||||||||||||
Media Segment results 2015-2014: Media Segment revenues decreased $10 million to $1.68 billion or by 1% year-over-year for 2015, primarily due to record level of political advertising revenue of $159 million and $41 million in Olympic advertising revenue achieved during 2014. The change to a calendar year-end reporting cycle extended our fiscal year 2015 by four extra days which increased Media Segment revenues by $11 million. Core advertising revenues, which consist of Local and National non-political advertising, increased 3% to $1.07 billion in 2015. Political advertising revenue declined $138 million to $21 million in 2015. Political revenues are cyclical and higher in even years (e.g. 2014, 2016). Retransmission revenues increased 24% in 2015 resulting from newly negotiated agreements and annual rate increases. Within the Media Segment, digital revenue increased 16% compared to 2014 reflecting continued growth from digital marketing services products.
19
Media Segment operating expenses increased 2% to $968 million in 2015. The increase is driven primarily by higher reverse network compensation fees, increased costs from investment in digital initiatives, and incremental costs driven by the July 2014 acquisition of London Broadcasting Company.
As a result of all of these factors, Media Segment operating income decreased to $714 million in 2015 from $747 million in 2014.
Media Segment results 2014-2013: Revenues increased $857 million to $1.69 billion or 103% for 2014, a record high. The increase was primarily driven by the acquisition of Belo and London Broadcasting television stations, as well as substantially higher retransmission revenue and record non-presidential year political advertising.
Core advertising revenues increased 74% to $1.05 billion in 2014 mainly due to television station acquisitions and $41 million in advertising associated with the Winter Olympics that was partially offset by political advertising displacement. Political advertising reached $159 million compared to $13 million in 2013, driven by our strong political footprint. Retransmission revenues increased 145% in 2014 resulting from the expansion of our Media Segment portfolio and rate increases. Within the Media Segment, digital revenue increased 156% compared to 2013 reflecting continued growth from digital marketing services products.
Media Segment operating expenses doubled to $945 million in 2014. The increase is driven primarily by the impact from acquisitions, higher reverse network compensation fees, and higher investment in digital initiatives.
As a result of all of these factors, Media Segment operating income more than doubled to $747 million in 2014.
Digital Segment
The Digital Segment is comprised of our stand-alone digital business units including Cars.com, CareerBuilder, G/O Digital, and Cofactor (also operating as ShopLocal). On Nov. 12, 2015, we sold PointRoll which was part of Cofactor. Digital Segment revenues accounted for 45% of our total reported operating revenues for 2015.
Digital Segment revenues, expenses and operating income were as follows:
In millions of dollars | |||||||||||
2015 | Change | 2014 | Change | 2013 | |||||||
Operating revenues | $ | 1,369 | 47% | $ | 934 | 22% | $ | 768 | |||
Operating expenses | |||||||||||
Operating expenses exclusive of depreciation | 993 | 37% | 722 | 20% | 603 | ||||||
Depreciation | 33 | 42% | 23 | 33% | 18 | ||||||
Amortization | 92 | *** | 37 | *** | 18 | ||||||
Asset impairment | 9 | (72%) | 31 | 44% | 22 | ||||||
Transformation items | 13 | *** | — | *** | — | ||||||
Operating expenses | 1,139 | 40% | 814 | 23% | 661 | ||||||
Operating income | $ | 229 | 91% | $ | 120 | 12% | $ | 107 | |||
Digital Segment results 2015-2014: Digital Segment revenues increased $435 million or 47% over 2014 to a record high of $1.37 billion, primarily driven by the acquisition and strong organic growth of Cars.com and partially offset by slightly lower CareerBuilder revenues.
CareerBuilder revenues decreased 2% in 2015 driven by year-over-year declines in foreign exchange rates as well as the strategic shift in focus in its product offerings. During 2015 CareerBuilder continued its transition toward higher-margin software-as-a-service solutions, including its new pre-hire platform and new recruitment software products. Software-as-a-service revenues increased 30% in 2015 and represented approximately 21% of total revenues within CareerBuilder. Revenues under these arrangements are generally longer term and recognized over 2-3 year contracts. These revenue increases were offset by declines from lower-margin, transactional source and screen arrangements and other transactional offerings, as CareerBuilder moves away from these product offerings to focus on the platform solutions.
Digital Segment expenses in 2015 increased 40% to $1.14 billion, primarily due to the Cars.com acquisition partly offset by lower expenses reflecting lower revenue at CareerBuilder. As a result of these factors, Digital Segment operating income increased to $229 million in 2015.
Digital Segment results 2014-2013: Digital Segment revenues increased $166 million or 22% over 2013 to $934 million, primarily reflecting the impact of the Cars.com acquisition, and growth in revenues at CareerBuilder.
Digital Segment expenses in 2014 increased 23% to $814 million primarily due to the Cars.com acquisition and an increase in expenses at CareerBuilder associated with its revenue growth.
As a result of these factors, Digital Segment operating income increased to $120 million in 2014.
20
Operating results non-GAAP information
Presentation of non-GAAP information: We use non-GAAP financial performance and liquidity measures to supplement the financial information presented on a GAAP basis. These non-GAAP financial measures should not be considered in isolation from or as a substitute for the related GAAP measures, and should be read in conjunction with financial information presented on a GAAP basis.
We discuss in this report non-GAAP financial performance measures that exclude from our reported GAAP results the impact of special items consisting of:
• | Workforce restructuring charges; |
• | Transformation items; |
• | Non-cash asset impairment charges; |
• | Special gains and losses recorded in operating and non-operating; and |
• | Special tax gains and charges, as well as the tax effect of the above special items. |
We believe that such expenses, charges and credits are not indicative of normal, ongoing operations and their inclusion in results makes for more difficult comparisons between years and with peer group companies.
Workforce restructuring expenses primarily relate to incremental expenses we have incurred to centralize functions. Workforce restructuring expenses include payroll and related benefit costs.
Transformation items include incremental expenses incurred by us to execute on our transformation and growth plan and incremental expenses and gains associated with optimizing our real estate portfolio. Asset impairment charges reflect non-cash charges to reduce the book value of certain intangible assets to their respective fair value.
Non-operating items for 2015 included special gains and charges primarily related to the gain from the sale of a business offset by expenses related to the spin-off of our publishing businesses. In 2014, non-operating items included income related to the write-up of our investment in Classified Ventures to fair value, costs for acquiring six London Broadcasting Company television stations, costs related to acquire the remaining outstanding shares of Cars.com, expenses related to the planned spin-off of our publishing operation and non-cash donations to our charitable foundation. Both 2015 and 2014 included call premiums to early retire certain senior notes. The gain of $137 million recognized in equity income in unconsolidated investees, net in 2014 is principally related to a gain on the sale of Apartments.com by Classified Ventures.
The income tax provision for 2015 reflects a net tax benefit primarily due to the impact of a deferred tax rate adjustment related to the spin-off of our publishing businesses. The income tax provision for 2014 reflects a tax benefit related to our portfolio restructuring, the sale of a non-strategic investment, and a charge related to the sale of our interest in television station KMOV in St. Louis, MO, in February 2014.
We discuss Adjusted EBITDA, a non-GAAP financial performance measure that we believe offers a useful view of our overall business operations. Adjusted EBITDA is defined as net income from continuing operations attributable to TEGNA before (1) net income attributable to noncontrolling interests, (2) income taxes, (3) interest expense, (4) equity income, (5) other non-operating items, (6) workforce restructuring, (7) transformation costs, (8) asset impairment charges, (9) depreciation and (10) amortization. When Adjusted EBITDA is discussed in reference to performance on a consolidated basis, the most directly comparable GAAP financial measure is Net income from continuing operations attributable to TEGNA.
We use non-GAAP financial performance measures for purposes of evaluating business unit and consolidated company performance. Therefore, we believe that each of the non-GAAP measures presented provides useful information to investors by allowing them to view our businesses through the eyes of our management and Board of Directors, facilitating comparison of results across historical periods, and providing a focus on the underlying ongoing operating performance of our businesses. Many of our peer group companies present similar non-GAAP measures to better facilitate industry comparisons.
21
Reconciliations of certain line items impacted by special items to the most directly comparable financial measure calculated and presented in accordance with GAAP on our consolidated statements of income follow:
In millions of dollars (except per share amounts) | Special Items | |||||||||||||||||||||||
Fiscal Year Ended Dec. 31, 2015 | GAAP measure | Workforce restructuring | Facility consolidation, transformation and asset impairment | Non-operating items | Special tax credit | Non-GAAP measure | ||||||||||||||||||
Operating expenses | $ | 2,138 | $ | (8 | ) | $ | 72 | $ | — | $ | — | $ | 2,202 | |||||||||||
Operating income | 913 | 8 | (72 | ) | — | — | 849 | |||||||||||||||||
Other non-operating items | (12 | ) | — | — | 10 | — | (1 | ) | ||||||||||||||||
Total non-op (expense) income | (290 | ) | — | — | 10 | — | (280 | ) | ||||||||||||||||
Income before income taxes | 623 | 8 | (72 | ) | 10 | — | 569 | |||||||||||||||||
Provision for income taxes | 202 | 3 | (31 | ) | (2 | ) | 3 | 176 | ||||||||||||||||
Net income from continuing operations attributable to TEGNA | 357 | 5 | (41 | ) | 13 | (3 | ) | 330 | ||||||||||||||||
Net income from continuing operations per share - diluted | $ | 1.56 | $ | 0.02 | $ | (0.17 | ) | $ | 0.05 | $ | (0.01 | ) | $ | 1.44 | ||||||||||
Note: Totals may not sum due to rounding. | ||||||||||||||||||||||||
In millions of dollars (except per share amounts) | Special Items | |||||||||||||||||||||||
Fiscal Year Ended Dec. 28, 2014 | GAAP measure | Workforce restructuring | Facility consolidation, transformation and asset impairment | Non-operating items | Special tax credit | Non-GAAP measure | ||||||||||||||||||
Operating expenses | $ | 1,919 | $ | (7 | ) | $ | (49 | ) | $ | — | $ | — | $ | 1,862 | ||||||||||
Operating income | 707 | 7 | 49 | — | — | 764 | ||||||||||||||||||
Equity income in unconsolidated investees, net | 151 | — | — | (137 | ) | — | 14 | |||||||||||||||||
Other non-operating items | 404 | — | — | (405 | ) | — | — | |||||||||||||||||
Total non-op (expense) income | 283 | — | — | (542 | ) | — | (259 | ) | ||||||||||||||||
Income before income taxes | 991 | 7 | 49 | (542 | ) | — | 505 | |||||||||||||||||
Provision for income taxes | 234 | 3 | 9 | (203 | ) | 110 | 153 | |||||||||||||||||
Net income from continuing operations attributable to TEGNA | 688 | 4 | 40 | (339 | ) | (110 | ) | 284 | ||||||||||||||||
Net income from continuing operations per share - diluted | $ | 2.97 | $ | 0.02 | $ | 0.17 | $ | (1.46 | ) | $ | (0.47 | ) | $ | 1.22 | ||||||||||
Note: Totals may not sum due to rounding. | ||||||||||||||||||||||||
22
Non-GAAP consolidated results
The following is a discussion of our as adjusted non-GAAP financial results.
In millions of dollars, except per share amounts | |||||||
2015 | Change | 2014 | |||||
Adjusted operating expenses | $ | 2,202 | 18% | $ | 1,862 | ||
Adjusted operating income | 849 | 11% | 764 | ||||
Adjusted equity income in unconsolidated investees, net | — | *** | 14 | ||||
Adjusted other non-operating items | (1 | ) | *** | — | |||
Adjusted total non-operating (expense) income | (280 | ) | 8% | (259 | ) | ||
Adjusted income before income taxes | 569 | 13% | 505 | ||||
Adjusted provision for income taxes | 176 | 15% | 153 | ||||
Adjusted net income from continuing operations attributable to TEGNA Inc. | 330 | 16% | 284 | ||||
Adjusted net income from continuing operations per share - diluted | $ | 1.44 | 18% | $ | 1.22 | ||
Adjusted operating expenses increased 18% in 2015 over 2014 to $2.20 billion primarily due to the acquisitions of Cars.com.
Adjusted operating income increased 11% in 2015 over 2014 to $849 million. The increase reflects higher Digital Segment operating results primarily due to the impact of the Cars.com acquisition and strong results at Cars.com.
Adjusted non-operating item charges increased 8% in 2015 over 2014 to $280 million. This increase reflects higher interest expense due to higher average debt levels from additional borrowings related to the Cars.com acquisition in October 2014.
The adjusted effective tax rate for 2015 was 34.7% compared to 35.0% in 2014.
Adjusted net income attributable to TEGNA Inc. increased 16% in 2015 (18% on a diluted per share basis) as a result of higher as adjusted (non-GAAP basis) operating income in the Digital Segment.
Adjustments to reconcile Adjusted net income from continuing operations attributable to TEGNA Inc. to Adjusted EBITDA follow:
In millions of dollars | |||||||
2015 | Change | 2014 | |||||
Net income from continuing operations attributable to TEGNA Inc. (GAAP basis) | $ | 357 | (48)% | $ | 688 | ||
Net income attributable to noncontrolling interests | 63 | (7)% | 68 | ||||
Provision for income taxes | 202 | (14)% | 234 | ||||
Interest expense | 274 | —% | 273 | ||||
Equity loss (income) in unconsolidated investees, net | 5 | *** | (151 | ) | |||
Other non-operating items | 12 | *** | (404 | ) | |||
Operating income (GAAP basis) | $ | 913 | 29% | $ | 707 | ||
Workforce restructuring | 8 | 14% | 7 | ||||
Other transformation items | 9 | (50)% | 18 | ||||
Asset impairment charges | 9 | (71)% | 31 | ||||
Corporate HQ building sale gain | (90 | ) | *** | — | |||
Adjusted operating income (non-GAAP basis) | $ | 849 | 11% | $ | 764 | ||
Depreciation | 91 | 6% | 86 | ||||
Adjusted amortization (non-GAAP basis) | 114 | 87% | 61 | ||||
Non-cash rent | 2 | *** | — | ||||
Adjusted EBITDA (non-GAAP basis) | $ | 1,056 | 16% | $ | 911 | ||
Note: Numbers may not sum due to rounding. | |||||||
Adjusted EBITDA increased 16% to $1.06 billion in 2015 from $911 million in 2014. Adjusted EBITDA margins were relatively unchanged at 34.6% in 2015 reflecting the lower operating results in the Media Segment due to the anticipated absence of record non-presidential year political advertising revenues in 2014.
23
Segment results
The following is a discussion of our as adjusted non-GAAP financial results. All as adjusted (non-GAAP basis) measures are labeled as such or “adjusted”.
A summary of the impact of workforce restructuring charges and transformation costs on our Media Segment is presented below:
In millions of dollars | |||||||
2015 | Change | 2014 | |||||
Media Segment operating expenses (GAAP basis) | $ | 968 | 2% | $ | 945 | ||
Remove special items: | |||||||
Workforce restructuring | (4 | ) | 6% | (4 | ) | ||
Transformation gain (costs) | 5 | *** | (18 | ) | |||
As adjusted operating expenses (non-GAAP basis) | $ | 969 | 5% | $ | 923 | ||
Media Segment operating income (GAAP basis) | $ | 714 | (4%) | $ | 747 | ||
Remove special items: | |||||||
Workforce restructuring | 4 | 6% | 4 | ||||
Transformation (gain) costs | (5 | ) | *** | 18 | |||
As adjusted operating income (non-GAAP basis) | $ | 714 | (7%) | $ | 769 | ||
Note: Numbers may not sum due to rounding. | |||||||
Adjusted Media Segment operating expenses increased 5% in 2015 compared to 2014, driven primarily by higher investment in digital initiatives and reverse network compensation.
Adjusted Media Segment operating income decreased 7% to $714 million in 2015, driven by the absence of a record level of political advertising revenues and Olympic advertising that benefited 2014 results.
A summary of the impact of workforce restructuring charges and asset impairment charges on our Digital Segment is presented below:
In millions of dollars | |||||||
2015 | Change | 2014 | |||||
Digital Segment operating expenses (GAAP basis) | $ | 1,139 | 40% | $ | 814 | ||
Remove special items: | |||||||
Workforce restructuring | (4 | ) | 16% | (3 | ) | ||
Asset impairment charges | (22 | ) | (30%) | (31 | ) | ||
As adjusted operating expenses (non-GAAP basis) | $ | 1,114 | 43% | $ | 780 | ||
Digital Segment operating income (GAAP basis) | $ | 229 | 91% | $ | 120 | ||
Remove special items: | |||||||
Workforce restructuring | 4 | 16% | 3 | ||||
Asset impairment charges | 22 | (30%) | 31 | ||||
As adjusted operating income (non-GAAP basis) | $ | 255 | 65% | $ | 154 | ||
Note: Numbers may not sum due to rounding. | |||||||
Year-over-year adjusted operating expense comparisons for 2015 and 2014 reflect primarily the impact of the Cars.com acquisition. Adjusted operating income increased 65%, reflecting record revenues in our Digital Segment.
Presentation of Pro Forma Information
Pro forma information is presented as if the acquisition of Cars.com and the sale of PointRoll had occurred on the first day of 2014. The pro forma financial information is based on historical results of operations, adjusted for the allocation of the purchase price and other acquisition accounting adjustments, and is not necessarily indicative of what our results would have been had we operated the business since the beginning of 2014. Pro forma adjustments for Cars.com reflect depreciation expense and amortization of intangibles related to the fair value adjustments of the assets acquired and the alignment of accounting policies.
Reconciliations of Digital Segment revenues and expenses on a reported basis to a pro forma basis for 2015 and 2014 are below:
In millions of dollars | |||||||||
2015 | |||||||||
TEGNA (as reported) | Pro Forma Adjustments(a) | TEGNA Pro Forma Combined | |||||||
Digital operating revenue | $ | 1,369 | $ | (32 | ) | $ | 1,337 | ||
Digital operating expense | 1,139 | (61 | ) | 1,078 | |||||
Digital operating income | $ | 229 | $ | 31 | $ | 260 | |||
(a) The pro forma adjustments exclude revenues and expenses for the sale of PointRoll as if it had occurred on the first day of 2014. | |||||||||
In millions of dollars | |||||||||
2014 | |||||||||
TEGNA (as reported) | Pro Forma Adjustments(a) | TEGNA Pro Forma Combined | |||||||
Digital operating revenue | $ | 934 | $ | 324 | $ | 1,258 | |||
Digital operating expense | 814 | 260 | 1,074 | ||||||
Digital operating income | $ | 120 | $ | 64 | $ | 184 | |||
(a) The pro forma adjustments include additions to revenue and expenses for the acquisition of Cars.com and exclude revenues and expenses for the sale of PointRoll as if they had occurred on the first day of 2014. | |||||||||
Digital Segment revenue on a pro forma basis increased 6% in 2015 primarily due to growth in Cars.com revenues. Cars.com revenues on a pro forma basis reflect organic growth in the markets in which they sell direct as well as price increases for affiliates implemented October 1, 2014. Digital Segment expenses were relatively flat on a pro forma basis.
24
FINANCIAL POSITION
Liquidity and capital resources
Operating Activities: Our cash flow from operating activities was $613 million in 2015, versus $821 million in 2014. The decrease in net cash flow from operating activities was due to the relative absence of $200 million of political and Olympic revenue achieved last year, the absence of our publishing businesses in the third and fourth quarters of 2015, a $22.5 million increase in pension payments in 2015, the timing of certain reverse network compensation payments, payments related to previously accrued expenses for the shutdown of USA Weekend and routine changes in working capital. The increase in pension payments in 2015 was primarily due to a voluntary contribution we made of $100.0 million to our principal retirement plan prior to the spin-off. There were no required contributions to any of our principal pension plans for the remainder of 2015. Cash paid for income taxes were lower in 2015 by $101 million compared to 2014, primarily due to the tax benefit received on the voluntary pension payment and the decrease in net income compared to the prior year.
Investing Activities: Net cash provided by investing activities was $217.3 million for 2015 compared to cash used by investing activities of $1.66 billion in 2014. The difference between periods was primarily attributable to proceeds of $411 million related to sales of assets (primarily sales of corporate headquarters and Seattle broadcast buildings) and sale of businesses (primarily Gannett Healthcare, Clipper and PointRoll) in 2015. This compares to payments for acquisitions of approximately $1.99 billion (primarily Cars.com, London Broadcasting and Broadbean) in 2014. Capital expenditures amounted to $118.7 million in 2015 and $150 million in 2014.
Financing Activities: Net cash used for financing activities was $819.7 million in 2015 compared to net cash provided by financing activities of $490.5 million in 2014. The difference between periods is primarily due to receiving less proceeds from the issuance of debt, increased repurchases of our common stock, increased debt repayments, and a one-time cash transfer of $63 million to our former publishing businesses in connection with the spin-off.
In 2015, our debt balance decreased as a result of $587 million of debt repayments, partially offset by additional borrowings of $200 million under a new five-year term loan as discussed below within "Long-term Debt" section. In 2014, proceeds from long-term debt and term loans were $1.31 billion which was used to partially finance the acquisition of Cars.com and repay the unsecured notes that matured in November 2014.
In 2015, we repurchased approximately 9.6 million shares of our stock for $271 million, paid dividends (excluding the special spin-off distribution of our publishing businesses) totaling $167.5 million ($0.74 per share) and made dividend payments and distributions to noncontrolling membership shareholders of $25 million.
Our operations have historically generated strong positive cash flow which, along with our program of maintaining bank revolving credit availability, has provided adequate liquidity to meet our requirements, including those for acquisitions.
Long-term debt
As of Dec. 31, 2015, our outstanding debt, net of unamortized discounts amounted to $4.2 billion and mainly is in the form of private placement fixed rate notes and borrowings under a revolving credit facility. See "Note 6 Long-term debt" to our consolidated financial statements for a table summarizing the components of our long-term debt. As of Dec. 31, 2015, we were in compliance with all covenants contained in our debt and credit agreements.
Our debt balance as of Dec. 31, 2015 decreased by $287 million from Dec. 28, 2014, primarily reflecting debt payments of $587 million partially offset by additional borrowings, including the new $200 million term loan mentioned below.
On June 29, 2015, we entered into an agreement to amend and extend our existing revolving credit facility with one expiring on June 29, 2020 (the Amended and Restated Competitive Advance and Revolving Credit Agreement). As a result, the maximum total leverage ratio permitted by the new agreement is 5.0x through June 30, 2017, after which, as amended, it is reduced to 4.75x through June 30, 2018 and then to 4.50x thereafter. Commitment fees on the revolving credit agreement are equal to 0.25% - 0.40% of the undrawn commitments, depending upon our leverage ratio, and are computed on the average daily undrawn balance under the revolving credit agreement and paid each quarter. Under the Amended and Restated Competitive Advance and Revolving Credit Agreement, we may borrow at an applicable margin above the Eurodollar base rate (LIBOR loan) or the higher of the Prime Rate, the Federal Funds Effective Rate plus 0.50%, or the one month LIBOR rate plus 1.00% (ABR loan). The applicable margin is determined based on our leverage ratio but differs between LIBOR loans and ABR loans. For LIBOR-based borrowing, the margin varies from 1.75% to 2.50%. For ABR-based borrowing, the margin will vary from 0.75% to 1.50%. On September 23, 2015, we amended the Amended and Restated Competitive Advance and Revolving Credit Agreement to add an additional lender. Total commitments under the Amended and Restated Competitive Advance and Revolving Credit Agreement are $1.4 billion. As of Dec. 31, 2015, we had unused borrowing capacity of $658 million under our revolving credit agreement.
In June 2015, we also borrowed $200 million under a new five-year term loan due in 2020 which has a year-end 2015 principal balance of $180 million. The interest rate on the term loan is equal to the same interest rates as borrowings under the Amended and Restated Competitive Advance and Revolving Credit Agreement. Both the revolving credit agreement and the term loan are guaranteed by a majority of our wholly-owned material domestic subsidiaries.
We have an effective shelf registration statement under which an unspecified amount of securities may be issued, subject to a $7.0 billion limit established by the Board of Directors. Proceeds from the sale of such securities may be used for general corporate purposes, including capital expenditures, working capital, securities repurchase programs, repayment of debt and financing of acquisitions. We may also invest borrowed funds that are not required for other purposes in short-term marketable securities.
Our debt maturities may be repaid with cash flow from operating activities, by accessing capital markets or a combination of both. The following schedule of annual maturities of the principal amount of total debt assumes we use available capacity under our revolving credit agreement to refinance unsecured floating rate term loans and fixed rate notes due in 2016 through 2018. Based on this refinancing
25
assumption, all of the obligations other than the VIE unsecured floating rate term loan due prior to 2019 are reflected as maturities for 2019 and beyond.
In thousands of dollars | |||
2016 (1) | $ | 646 | |
2017 (1) | 646 | ||
2018 (1) | 646 | ||
2019 | 640,000 | ||
2020 (2) | 1,807,129 | ||
Thereafter | 1,765,000 | ||
Total | $ | 4,214,067 | |
(1) Maturities of principal amount of debt due in 2016 through 2018 (primarily the 10% fixed rate notes due in April 2016 and the 7.125% fixed rate notes due in September 2018) are assumed to be repaid with funds from the revolving credit agreement, which matures in 2020. Excluding our ability to repay funds with the revolving credit agreement, contractual debt maturities are $266 million, $72 million and $131 million in 2016, 2017 and 2018, respectively.
(2) Assumes current revolving credit agreement borrowings comes due in 2020 and credit facility is not extended.
Contractual obligations and commitments
The following table summarizes the expected cash outflows resulting from financial contracts and commitments as of the end of 2015.
Contractual obligations | Payments due by period | ||||||||||||||
In millions of dollars | Total | 2016 | 2017-18 | 2019-20 | Thereafter | ||||||||||
Long-term debt (1) | $ | 4,214 | $ | 1 | $ | 1 | $ | 2,447 | $ | 1,765 | |||||
Interest Payments (2) | 1,246 | 187 | 357 | 292 | 410 | ||||||||||
Operating leases (3) | 204 | 41 | 63 | 36 | 64 | ||||||||||
Purchase obligations (4) | 176 | 64 | 68 | 30 | 14 | ||||||||||
Programming contracts (5) | 699 | 149 | 419 | 131 | — | ||||||||||
Other noncurrent liabilities (6) | 80 | 8 | 20 | 17 | 35 | ||||||||||
Total | $ | 6,619 | $ | 450 | $ | 928 | $ | 2,953 | $ | 2,288 | |||||
(1) | Long-term debt includes scheduled principal payments only. See Note 6 to the Consolidated Financial Statements for further information. |
(2) | We have $720 million of outstanding borrowings under our revolving credit facility as of Dec. 31, 2015. We have not included estimated interest payments since payments into and out of the credit facility change daily. Interest on the senior notes is based on the stated cash coupon rate and excludes the amortization of debt issuance discount. The term loan interest rates are based on the actual rates as of Dec. 31, 2015. |
(3) | See Note 12 to the Consolidated Financial Statements. |
(4) | Includes purchase obligations related to capital projects, interactive marketing agreements and other legally binding commitments. Amounts which we are liable for under purchase orders outstanding at Dec. 31, 2015, are reflected in the Consolidated Balance Sheets as accounts payable and accrued liabilities and are excluded from the table above. |
(5) | Programming contracts include television station commitments to purchase programming to be produced in future years. This also includes amounts related to our network affiliation agreements. |
(6) | Other noncurrent liabilities consist of both unfunded and under-funded postretirement benefit plans. Unfunded plans include the TEGNA Supplemental Executive Retirement Plan and the TEGNA Retiree Welfare Plan. Employer contributions, which equal the expected benefit payments, are reflected in the table above over the next ten-year period. Our under-funded plans include the TEGNA Retirement Plan and the G.B. Dealey Retirement Plan (merged into the TEGNA Retirement Plan effective Dec. 31, 2015). We do not anticipate any contributions to the TEGNA Retirement Plan in 2016. Contributions beyond the next fiscal year are excluded due to uncertainties regarding significant assumptions involved in estimating these contributions, such as interest rate levels as well as the amount and timing of invested asset returns. |
Due to uncertainty with respect to the timing of future cash flows associated with unrecognized tax benefits at Dec. 31, 2015, we are unable to make reasonably reliable estimates of the period of cash settlement. Therefore, approximately $20 million of unrecognized tax benefits have been excluded from the contractual obligations table above. See Note 5 to the Consolidated Financial Statements for a further discussion of income taxes.
Capital stock
In June 2015, our Board of Directors approved a $750 million share repurchase program to be completed over a three-year period beginning June 29, 2015. On Oct. 20, 2015, our Board of Directors approved a $75 million increase to the share repurchase program, bringing the total authorized amount to $825 million.
Stock repurchases | Repurchases made in fiscal year | ||||||||
In millions | 2015 | 2014 | 2013 | ||||||
Number of shares purchased | 9.6 | 2.7 | 4.9 | ||||||
Dollar amount purchased | $ | 271 | $ | 76 | $ | 117 | |||
The shares may be repurchased at management’s discretion, either in the open market or in privately negotiated block transactions. Management’s decision to repurchase shares will depend on price and other corporate developments. Purchases may occur from time to time and no maximum purchase price has been set. Certain of the shares we previously acquired have been reissued in settlement of employee stock awards.
Our common stock outstanding at Dec. 31, 2015, totaled 219,754,180 shares, compared with 226,739,091 shares at Dec. 28, 2014.
Effects of inflation and changing prices and other matters
Our results of operations and financial condition have not been significantly affected by inflation. The effects of inflation and changing prices on our property and equipment and related depreciation expense have been reduced as a result of an ongoing capital expenditure program and the availability of replacement assets with improved technology and efficiency.
We are minimally exposed to foreign exchange rate risk primarily due to our majority ownership of CareerBuilder which uses several currencies but primarily the British pound and Euro as its functional currencies, which are then translated into U.S. dollars. Our foreign currency translation adjustment, related principally to CareerBuilder and reported as part of shareholders’ equity, totaled $20 million at Dec. 31, 2015.
26
Critical accounting policies and the use of estimates
The preparation of financial statements in conformity with generally accepted accounting principles requires management to make estimates and assumptions about future events that affect the amounts reported in the financial statements and accompanying notes. Actual results could differ significantly from those estimates. We believe the following discussion addresses our most critical accounting policies, which are those that are important to the presentation of our financial condition and results of operations and require management’s most subjective and complex judgments. This commentary should be read in conjunction with our financial statements, selected financial data and the remainder of this Form 10-K.
Revenue Recognition: We generate revenue from a diverse set of product and service offerings which include advertising, retransmission consent fees, and software and recruitment services. Revenue is recognized when persuasive evidence of an arrangement exists, performance under the contract has begun, the contract price is fixed or determinable and collectability of the related fee is reasonably assured. Revenue from sales agreements that contain multiple deliverable elements is allocated to each element based on the relative best estimate of selling price. Elements are treated as separate units of accounting if there is standalone value upon delivery. Amounts received from customers in advance of revenue recognition are deferred as liabilities. Below is a detail discussion of revenue by our two reportable segments.
Media Segment: The primary source of revenue for our Media Segment is through the sale of advertising time on its television stations. Advertising revenues are recognized, net of agency commissions, in the period when the advertisements are aired. Our Media Segment also earns revenue from retransmission consent arrangements. Under these agreements, we receive cash consideration from multichannel video programming distributors (e.g., cable and satellite providers) in return for our consent to permit the cable/satellite operator to retransmit our television signal. Retransmission consent fees are recognized over the contract period based on a negotiated fee per subscriber. Retransmission consent fees revenues have increased as a percentage of overall Media Segment revenue in recent years. In 2015, such revenues accounted for approximately 27% of overall Media Segment revenue compared to 18% in 2013. In addition, our Media Segment also generates online advertising revenue through the display of digital advertisements across its various digital platforms. Online advertising agreements typically take the form of an impression-based contract, fixed fee time-based contract or transaction based contract. The customers are billed for impressions delivered or click-throughs on their advertisements. An impression is the display of an advertisement to an end-user on the website and is a measure of volume. A click-through occurs when an end-user clicks on an impression. Revenue is recognized evenly over the contract term for fixed fee contracts where a minimum number of impressions or click-throughs is not guaranteed. Revenue is recognized as the service is delivered for transaction based contracts.
Digital Segment: The primary source of revenue for our Digital Segment is through the sale of online subscription advertising products. Cars.com sells subscription advertising products targeting car dealerships and national advertisers, and CareerBuilder earns revenue through placement of job postings on its network of websites. Revenue is recognized for our Digital Segment’s online advertising arrangements in the same manner as described above for Media Segments online advertising revenue.
CareerBuilder service offerings include human capital Software-as-a-Service (SaaS) and various other recruitment solutions (employment branding services and access to online resume databases). Generally, the human capital SaaS offering and access related to resume databases are subscription-based contracts for which revenue is recognized ratably over the subscription period. SaaS contracts are generally two to three year contracts. Recruitment solutions (which include sourcing and screening services) are more transactional based contracts, and therefore, revenue is recognized as delivery occurs.
In addition, through our G/O Digital business unit, we also provide digital marketing services and revenue is recognized for these offerings as advertising and services are delivered.
Goodwill: As of Dec. 31, 2015, our goodwill balance was $3.9 billion and represented approximately 46% of our total assets. Goodwill represents the excess of acquisition cost over the fair value of assets acquired, including identifiable intangible assets, net of liabilities assumed. Goodwill is tested for impairment on an annual basis (first day of our fourth quarter) or between annual tests if events or changes in circumstances occurred that indicate the fair value of a reporting unit below its carrying amount.
Our goodwill has been allocated to and is tested for impairment at a level referred to as the reporting unit. The level at which we test goodwill for impairment requires us to determine whether the operations below the business segment level constitute a business for which discrete financial information is available and segment management regularly reviews the operating results. For Media, goodwill is accounted for at the segment level. For Digital, the reporting units are the stand-alone digital businesses such as Cars.com, CareerBuilder, ShopLocal and PointRoll. The following table shows the aggregate goodwill for these units summarized at the segment level:
In millions of dollars | |||
Segment | Goodwill Balance | ||
Media | $ | 2,579 | |
Digital | $ | 1,340 | |
Before performing the annual two-step goodwill impairment test, we first have the option to perform a qualitative assessment to determine if the two-step quantitative test must be completed. The qualitative assessment considers events and circumstances such as macroeconomic conditions, industry and market conditions, cost factors and overall financial performance, as well as company and specific reporting unit specifications. If after performing this assessment, we conclude it is more likely than not that the fair value of a reporting unit is less than its carrying amount, then we are required to perform a two-step quantitative test. Otherwise, the two-step test is not required. In 2015, we elected to not perform the optional qualitative assessment of goodwill; and instead, we performed the quantitative impairment test.
27
When performing the first step of the quantitative test, we determine the fair value of each reporting unit and compare it to the carrying amount, including goodwill. If the carrying amount of the reporting unit exceeds the fair value of the reporting unit, we perform the second step of the impairment test, as this is an indication that the reporting unit goodwill may be impaired. In the second step of the impairment test, we determine the implied fair value of the reporting unit’s goodwill. If the carrying value of a reporting unit’s goodwill exceeds its implied fair value, then an impairment of goodwill has occurred and we must recognize an impairment loss for the difference between the carrying amount and the implied fair value of goodwill.
We estimate the fair value of each reporting unit using a combination of a market-based valuation methodology using comparable public company trading values, and income approach using the discounted cash flow (DCF) analysis. Determining fair value requires the exercise of significant judgments, including the amount and timing of expected future cash flows, long-term growth rates, discount rates and relevant comparable public company earnings multiples. The cash flows employed in the DCF analysis are based on our best estimate of future sales, earnings and cash flows after considering factors such as general market conditions and recent operating performance. The discount rates utilized in the DCF analysis are based on the respective reporting unit’s weighted average cost of capital, which takes into account the relative weights of each component of capital structure (equity and debt) and represents the expected cost of new capital, adjusted as appropriate to consider the risk inherent in future cash flows of the respective reporting unit.
In the fourth quarter of 2015, we completed our annual goodwill impairment test for each of our reporting units. The results of these tests indicated that the estimated fair values of our reporting units exceed their carrying values, with the exception of our PointRoll reporting unit within our Digital Segment. After performing step 2 of the impairment test, we recorded a non-cash impairment charge of $8 million.
For the Media Segment, which is considered a single reporting unit, the estimated value would need to decline by over 50% to fail step one of the quantitative goodwill impairment test. The Digital Segment balance represents primarily Cars.com and CareerBuilder. For both of these reporting units, the estimated value would need to decline by more than 20% to fail step one of the quantitative goodwill impairment test.
Impairment assessment inherently involves management judgments regarding a number of assumptions described above. Fair value of the reporting units also depends on the future strength of the economy in our principal media and digital markets. New and developing competition as well as technological change could also adversely affect future fair value estimates. Due to the many variables inherent in the estimation of a reporting unit's fair value and the relative size of our recorded goodwill, differences in assumptions could have a material effect on the estimated fair value of one or more of our reporting units and could result in a goodwill impairment charge in a future period.
Indefinite Lived Intangibles: This asset grouping consists of FCC broadcast licenses related to our acquisitions of television stations, and trade names from the Cars.com and CareerBuilder acquisitions. As of Dec. 31, 2015 indefinite lived intangible assets were $2.1 billion and represented approximately 25% of our total assets.
Indefinite lived assets are not subject to amortization and, as a result, they are tested for impairment annually (on the first day of our fourth quarter), or more frequently if events or changes in circumstances suggest that the asset might be impaired. We have the option to first perform a qualitative assessment to determine if it is more likely than not that the fair value of the indefinite lived asset is more than its carrying amount. If that is the case, then we would not have to perform the quantitative analysis. The qualitative assessment considers events and circumstances such as macroeconomic conditions, industry and market conditions, cost factors and overall financial performance of the indefinite lived asset. In 2015, we elected to not perform the optional qualitative assessment; and instead, we performed the quantitative impairment test.
The fair value for the FCC broadcast licenses were determined using an income approach referred to as the Greenfield method. This method requires multiple assumptions relating to the future prospects of each individual television station including, but not limited to: (i) expected long-term market growth characteristics, (ii) station revenue shares within a market for a new entrant, (iii) future expected operating expenses, (iv) costs of capital and (v) appropriate discount rates. We performed a quantitative analysis on all of our FCC licenses on the impairment testing date and concluded that no impairment existed.
We completed our acquisition of Belo in late 2013 and London Broadcasting in mid-2014 and as a result recorded FCC licenses for all stations acquired. As these FCC licenses were recorded at fair value on the date of acquisition, any future declines in the fair value of the FCC license could result in an impairment charge. Factors that could cause the fair value to decline would be negative changes in any of the assumptions described in the above Greenfield method. The discount rate used generally has a significant impact to the valuation. For our 2015 impairment testing date the discount rate had declined from when we completed our acquisition of Belo and London Broadcasting. Future increases in the discount rate assumptions could cause a decline in the fair value of our FCC licenses which may result in an impairment charge.
The estimates of fair value for the trade names are determined using the "relief from royalty" methodology, which is a variation of the income approach. Discount rate assumptions are based on an assessment of the risk inherent in the projected future cash flows generated by the intangible asset. Also subject to judgment are assumptions about royalty rates, which are based on the estimated rates at which similar trade names are being licensed in the marketplace. We completed our annual impairment testing of trade names and determined that no impairments existed based on the results of the impairment test. Although trade name assets are not currently impaired, changes in future market rates or decreases in future cash flows and growth rates could result in an impairment charge in a future period.
28
Other Long-Lived Assets (Property and Equipment and Amortizable Intangible Assets): Property and equipment are recorded at cost and depreciated on a straight-line method over the estimated useful lives of such assets. Changes in circumstances, such as technological advances or changes to our business model or capital strategy, could result in actual useful lives differing from our estimates. In cases where we determine the useful life of buildings and equipment should be shortened, we would, after evaluating for impairment, depreciate the asset over its revised remaining useful life thereby increasing depreciation expense.
If an indicator is present, we review our property and equipment assets for potential impairment at the asset group level (generally at the local business level) by comparing the carrying value of such assets with the expected undiscounted cash flows to be generated by those asset groups/local business units. Due to expected continued cash flow in excess of carrying value from its businesses, no property, plant or equipment assets were considered impaired.
Our amortizable intangible assets consist mainly of customer relationships, acquired technology and retransmission agreements. These asset values are amortized systematically over their estimated useful lives. An impairment test of these assets would be triggered if the undiscounted cash flows from the related asset group (business unit) were to be less than the asset carrying value.
We do not believe that any of our larger amortizable intangible assets (those with book values over $10 million) are at risk of requiring an impairment in the foreseeable future.
Income Taxes: Our annual tax rate is based on our income, statutory tax regulations and rates, and tax planning opportunities available in the various jurisdictions in which we operate. Significant judgment is required in determining our annual tax expense and in evaluating our tax positions.
Tax law requires certain items to be included in our tax returns at different times than when the items are reflected in the financial statements. The annual tax expense reflected in the Consolidated Statements of Income is different than that reported in our tax returns. Some of these differences are permanent, for example expenses recorded for accounting purposes that are not deductible in the returns such as non-deductible goodwill, and some differences are temporary and reverse over time, such as depreciation expense. Temporary differences create deferred tax assets and liabilities. Deferred tax liabilities generally represent tax expense recognized in the financial statements for which payment has been deferred, or expense for which a deduction has been taken already in the tax return but the expense has not yet been recognized in the financial statements. Deferred tax assets generally represent items that can be used as a tax deduction or credit in tax returns in future years for which a benefit has already been recorded in the financial statements. Valuation allowances are established when necessary to reduce deferred income tax assets to the amounts we believe are more likely than not to be recovered. In evaluating the amount of any such valuation allowance, we consider the existence of cumulative income or losses in recent years, the reversal of existing temporary differences, the existence of taxable income in prior carry back years, available tax planning strategies and estimates of future taxable income for each of our taxable jurisdictions. The latter two factors involve the exercise of significant judgment. As of Dec. 31, 2015, deferred tax asset valuation allowances totaled $184 million, primarily related to federal and state capital losses, and state net operating losses available for carry forward to future years.
Although realization is not assured, we believe it is more likely than not that all other deferred tax assets for which no valuation allowances have been established will be realized. This conclusion is based on our history of cumulative income in recent years and review of historical and projected future taxable income.
We determine whether it is more likely than not that a tax position will be sustained upon examination by the appropriate taxing authorities before any part of the benefit is recorded in our financial statements. A tax position is measured as the portion of the tax benefit that is greater than 50% likely to be realized upon settlement with a taxing authority (that has full knowledge of all relevant information). We may be required to change our provision for income taxes when the ultimate treatment of certain items is challenged or agreed to by taxing authorities, when estimates used in determining valuation allowances on deferred tax assets significantly change, or when receipt of new information indicates the need for adjustment in valuation allowances. Future events, such as changes in tax laws, tax regulations, or interpretations of such laws or regulations, could have an impact on the provision for income tax and the effective tax rate. Any such changes could significantly affect the amounts reported in the Consolidated Financial Statements in the year these changes occur.
The effect of a one percentage point change in the effective tax rate for 2015 would have resulted in a change of $6 million in the provision for income taxes and net income from continuing operations attributable to TEGNA Inc.
ITEM 7A. QUANTITATIVE AND QUALITATIVE DISCLOSURES ABOUT MARKET RISK
Market risk is the potential gain/loss arising from changes in market rates and prices, such as interest rates, foreign currency exchange rates and changes in the market value of financial instruments. Our main exposure to market risk relates to interest rates. We have $986 million in floating interest rate obligations outstanding at Dec. 31, 2015, and therefore are subject to changes in the amount of interest expense we might incur. A 50 basis point increase or decrease in the average interest rate for these obligations would result in an increase or decrease in annual interest expense of $5 million. Refer to Note 6 to the Consolidated Financial Statements for information regarding the fair value of our long-term debt.
We believe that our market risk from financial instruments, such as accounts receivable, accounts payable and debt, is not material. We also have limited exposure to foreign exchange rate risk related to CareerBuilder's international operations, primarily in the Eurozone, for which the EURO is the functional currency. Translation gains or losses affecting the Consolidated Statements of Income have not been significant in the past. If the price of the EURO against the U.S. dollar had been 10% more or less than the actual price, operating income would have increased or decreased less than 1% in 2015.
29
ITEM 8. | FINANCIAL STATEMENTS AND SUPPLEMENTARY DATA |
INDEX TO FINANCIAL STATEMENTS AND SUPPLEMENTARY DATA
Page | |
FINANCIAL STATEMENTS | |
OTHER INFORMATION | |
SUPPLEMENTARY DATA | |
* | All other schedules prescribed under Regulation S-X are omitted because they are not applicable or not required. |
30
Report of Independent Registered Public Accounting Firm
Board of Directors and Shareholders of TEGNA Inc.:
We have audited the accompanying consolidated balance sheets of TEGNA Inc. as of December 31, 2015 and December 28, 2014, and the related consolidated statements of income, comprehensive income, cash flows, and equity for each of the three fiscal years in the period ended December 31, 2015. These financial statements are the responsibility of the Company’s management. Our responsibility is to express an opinion on these financial statements based on our audits.
We conducted our audits in accordance with the standards of the Public Company Accounting Oversight Board (United States). Those standards require that we plan and perform the audit to obtain reasonable assurance about whether the financial statements are free of material misstatement. An audit includes examining, on a test basis, evidence supporting the amounts and disclosures in the financial statements. An audit also includes assessing the accounting principles used and significant estimates made by management, as well as evaluating the overall financial statement presentation. We believe that our audits provide a reasonable basis for our opinion.
In our opinion, the financial statements referred to above present fairly, in all material respects, the consolidated financial position of TEGNA Inc. at December 31, 2015 and December 28, 2014, and the consolidated results of its operations and its cash flows for each of the three fiscal years in the period ended December 31, 2015, in conformity with U.S. generally accepted accounting principles.
We also have audited, in accordance with the standards of the Public Company Accounting Oversight Board (United States), TEGNA Inc.’s internal control over financial reporting as of December 31, 2015, based on criteria established in Internal Control – Integrated Framework issued by the Committee of Sponsoring Organizations of the Treadway Commission (2013 framework) and our report dated February 29, 2016, included in Item 9A, expressed an unqualified opinion thereon.
/s/ Ernst & Young LLP
McLean, Virginia
February 29, 2016
31
TEGNA INC. CONSOLIDATED BALANCE SHEETS | ||||||
In thousands of dollars, except share amounts | ||||||
Assets | Dec. 31, 2015 | Dec. 28, 2014 | ||||
(recast) | ||||||
Current assets | ||||||
Cash and cash equivalents | $ | 129,200 | $ | 110,305 | ||
Trade receivables, net of allowances of $9,092 and $8,844, respectively | 556,351 | 537,457 | ||||
Other receivables | 18,738 | 55,040 | ||||
Assets held for sale | — | 36,774 | ||||
Prepaid expenses and other current assets | 94,262 | 82,956 | ||||
Current discontinued operations assets | 6,608 | 490,531 | ||||
Total current assets | 805,159 | 1,313,063 | ||||
Property and equipment | ||||||
Land | 76,089 | 97,892 | ||||
Buildings and improvements | 272,862 | 487,885 | ||||
Equipment, furniture and fixtures | 604,839 | 692,424 | ||||
Construction in progress | 30,395 | 17,511 | ||||
Total | 984,185 | 1,295,712 | ||||
Less accumulated depreciation | (525,866 | ) | (628,794 | ) | ||
Net property and equipment | 458,319 | 666,918 | ||||
Intangible and other assets | ||||||
Goodwill | 3,919,726 | 3,914,771 | ||||
Indefinite-lived and amortizable intangible assets, less accumulated amortization of $220,662 and $114,273, respectively | 3,065,107 | 3,177,578 | ||||
Investments and other assets | 288,790 | 249,450 | ||||
Noncurrent discontinued operation assets | 657 | 1,920,415 | ||||
Total intangible and other assets | 7,274,280 | 9,262,214 | ||||
Total assets(a) | $ | 8,537,758 | $ | 11,242,195 | ||
32
TEGNA INC. CONSOLIDATED BALANCE SHEETS | ||||||
In thousands of dollars, except share amounts | ||||||
Liabilities and equity | Dec. 31, 2015 | Dec. 28, 2014 | ||||
(recast) | ||||||
Current liabilities | ||||||
Accounts payable | ||||||
Trade | $ | 87,706 | $ | 114,362 | ||
Other | 36,948 | 34,924 | ||||
Accrued liabilities | ||||||
Compensation | 115,679 | 143,905 | ||||
Interest | 49,835 | 64,929 | ||||
Other | 131,301 | 154,370 | ||||
Dividends payable | 31,033 | 45,309 | ||||
Income taxes | 15,742 | 11,267 | ||||
Deferred income | 132,650 | 131,794 | ||||
Current portion of long-term debt | 646 | 7,854 | ||||
Current discontinued operations liabilities | 5,243 | 424,739 | ||||
Total current liabilities | 606,783 | 1,133,453 | ||||
Income taxes | 18,191 | 56,578 | ||||
Deferred income taxes | 883,141 | 681,595 | ||||
Long-term debt | 4,200,816 | 4,488,028 | ||||
Pension liabilities | 178,844 | 171,675 | ||||
Other noncurrent liabilities | 168,573 | 175,710 | ||||
Noncurrent discontinued operations liabilities | — | 1,025,413 | ||||
Total noncurrent liabilities | 5,449,565 | 6,598,999 | ||||
Total liabilities(a) | 6,056,348 | 7,732,452 | ||||
Redeemable noncontrolling interests | 24,666 | 20,470 | ||||
Commitments and contingent liabilities (see Note 12) | ||||||
Equity | ||||||
TEGNA Inc. shareholders’ equity | ||||||
Common stock, par value $1: Authorized, 800,000,000 shares: Issued, 324,418,632 shares | 324,419 | 324,419 | ||||
Additional paid-in capital | 539,505 | 546,406 | ||||
Retained earnings | 7,111,129 | 8,602,369 | ||||
Accumulated other comprehensive loss | (130,951 | ) | (778,769 | ) | ||
7,844,102 | 8,694,425 | |||||
Less treasury stock at cost, 104,664,452 shares and 97,679,541 shares, respectively | (5,652,131 | ) | (5,439,511 | ) | ||
Total TEGNA Inc. shareholders’ equity | 2,191,971 | 3,254,914 | ||||
Noncontrolling interests | 264,773 | 234,359 | ||||
Total equity | 2,456,744 | 3,489,273 | ||||
Total liabilities, redeemable noncontrolling interests and equity | $ | 8,537,758 | $ | 11,242,195 | ||
The accompanying notes are an integral part of these consolidated financial statements.
(a) Our consolidated assets as of Dec. 31, 2015 and Dec. 28, 2014, include total assets of $4.4 million and $60.0 million related to variable interest entities (VIEs). These assets can only be used to settle the obligations of the VIEs. Consolidated liabilities as of Dec. 31, 2015 include total liabilities of $1.2 million related to VIEs and our consolidated liabilities as of Dec. 28, 2014 include $4.3 million of such liabilities. The VIEs’ creditors have no recourse to us regarding these liabilities. See further description in Note 1 - Summary of significant accounting policies.
33
TEGNA INC. CONSOLIDATED STATEMENTS OF INCOME | ||||||||||
In thousands of dollars, except per share amounts | ||||||||||
Fiscal year ended | Dec. 31, 2015 | Dec. 28, 2014 | Dec. 29, 2013 | |||||||
(recast) | (recast) | |||||||||
Operating Revenues: | ||||||||||
Media | $ | 1,682,144 | $ | 1,691,866 | $ | 835,113 | ||||
Digital | 1,368,801 | 934,275 | 768,010 | |||||||
Total | 3,050,945 | 2,626,141 | 1,603,123 | |||||||
Operating expenses: | ||||||||||
Cost of sales and operating expenses, exclusive of depreciation | 923,336 | 954,990 | 662,769 | |||||||
Selling, general and administrative expenses, exclusive of depreciation | 1,068,221 | 766,854 | 531,932 | |||||||
Depreciation | 90,803 | 85,866 | 54,127 | |||||||
Amortization of intangible assets | 114,284 | 65,971 | 20,706 | |||||||
Facility consolidation and net asset (gains) impairment charges (see Note 11) | (58,857 | ) | 44,961 | 22,729 | ||||||
Total | 2,137,787 | 1,918,642 | 1,292,263 | |||||||
Operating income | 913,158 | 707,499 | 310,860 | |||||||
Non-operating (expense) income | ||||||||||
Equity (loss) income in unconsolidated investees, net (see Note 4) | (5,064 | ) | 151,462 | 21,055 | ||||||
Interest expense | (273,629 | ) | (272,668 | ) | (174,818 | ) | ||||
Other non-operating items | (11,529 | ) | 404,403 | (45,279 | ) | |||||
Total | (290,222 | ) | 283,197 | (199,042 | ) | |||||
Income before income taxes | 622,936 | 990,696 | 111,818 | |||||||
Provision for income taxes | 202,314 | 234,471 | 13,122 | |||||||
Income from continuing operations | 420,622 | 756,225 | 98,696 | |||||||
Income from discontinued operations, net of tax | 102,064 | 374,235 | 347,217 | |||||||
Net Income | 522,686 | 1,130,460 | 445,913 | |||||||
Net income attributable to noncontrolling interests | (63,164 | ) | (68,289 | ) | (57,233 | ) | ||||
Net income attributable to TEGNA Inc. | $ | 459,522 | $ | 1,062,171 | $ | 388,680 | ||||
Earnings from continuing operations per share - basic | $ | 1.59 | $ | 3.04 | $ | 0.18 | ||||
Earnings (loss) from discontinued operations per share - basic | 0.45 | 1.65 | 1.52 | |||||||
Net income per share - basic | $ | 2.04 | $ | 4.69 | $ | 1.70 | ||||
Earnings from continuing operations per share - diluted | $ | 1.56 | $ | 2.97 | $ | 0.18 | ||||
Earnings from discontinued operations per share - diluted | 0.44 | 1.61 | 1.48 | |||||||
Net income per share - diluted | $ | 2.00 | $ | 4.58 | $ | 1.66 | ||||
Weighted average number of common shares outstanding: | ||||||||||
Basic | 224,688 | 226,292 | 228,541 | |||||||
Diluted | 229,721 | 231,907 | 234,189 | |||||||
Dividends declared per share | $ | 0.68 | $ | 0.80 | $ | 0.80 | ||||
The accompanying notes are an integral part of these consolidated financial statements.
34
TEGNA INC. CONSOLIDATED STATEMENTS OF COMPREHENSIVE INCOME | ||||||||||
In thousands of dollars | ||||||||||
Fiscal year ended | Dec. 31, 2015 | Dec. 28, 2014 | Dec. 29, 2013 | |||||||
Net income | $ | 522,686 | $ | 1,130,460 | $ | 445,913 | ||||
Redeemable noncontrolling interest (income not available to shareholders) | (1,796 | ) | (3,420 | ) | (1,997 | ) | ||||
Other comprehensive income (loss), before tax: | ||||||||||
Foreign currency translation adjustments | (8,235 | ) | (43,766 | ) | 9,055 | |||||
Pension and other postretirement benefit items: | ||||||||||
Actuarial gain (loss): | ||||||||||
Actuarial gain (loss) arising during the period | 39,115 | (466,482 | ) | 286,778 | ||||||
Amortization of actuarial loss | 31,357 | 46,489 | 64,381 | |||||||
Prior service cost: | ||||||||||
Change in prior service credit | — | 37,986 | 319 | |||||||
Amortization of prior service cost (credit) | 1,176 | (4,082 | ) | (1,599 | ) | |||||
Settlement charge | — | — | 3,077 | |||||||
Other | (355 | ) | (10,279 | ) | (10,158 | ) | ||||
Pension and other postretirement benefit items | 71,293 | (396,368 | ) | 342,798 | ||||||
Unrealized gains on available for sale investments during the period | 3,311 | — | 2,363 | |||||||
Other comprehensive income (loss) before tax | 66,369 | (440,134 | ) | 354,216 | ||||||
Income tax effect related to components of other comprehensive income (loss) | (28,289 | ) | 147,718 | (145,478 | ) | |||||
Other comprehensive income (loss), net of tax | 38,080 | (292,416 | ) | 208,738 | ||||||
Comprehensive income | 558,970 | 834,624 | 652,654 | |||||||
Comprehensive income attributable to noncontrolling interests, net of tax | (55,099 | ) | (57,167 | ) | (56,888 | ) | ||||
Comprehensive income attributable to TEGNA Inc. | $ | 503,871 | $ | 777,457 | $ | 595,766 | ||||
The accompanying notes are an integral part of these consolidated financial statements.
35
TEGNA INC. CONSOLIDATED STATEMENTS OF CASH FLOWS | ||||||||||
In thousands of dollars | ||||||||||
Fiscal year ended | Dec. 31, 2015 | Dec. 28, 2014 | Dec. 29, 2013 | |||||||
Cash flows from operating activities | ||||||||||
Net income | $ | 522,686 | $ | 1,130,460 | $ | 445,913 | ||||
Adjustments to reconcile net income to operating cash flows: | ||||||||||
Gain on Cars.com acquisition, net of tax | — | (285,860 | ) | — | ||||||
Depreciation | 140,954 | 185,868 | 153,203 | |||||||
Amortization of intangible assets | 121,290 | 79,856 | 36,369 | |||||||
Stock-based compensation | 26,344 | 33,882 | 33,437 | |||||||
Provision for deferred income taxes | 100,202 | 1,200 | 53,900 | |||||||
Pension contributions, net of pension expense | (122,376 | ) | (111,194 | ) | (82,878 | ) | ||||
Equity income in unconsolidated investees, net | (5,743 | ) | (167,319 | ) | (43,824 | ) | ||||
Other, including gains/losses on sale of assets and impairments | (65,496 | ) | 100,159 | 56,341 | ||||||
Changes in operating assets and liabilities: | ||||||||||
Decrease (increase) in trade receivables | 32,787 | (1,514 | ) | (17,884 | ) | |||||
Decrease (increase) in inventories | 1,807 | 10,032 | 4,489 | |||||||
Increase (decrease) in accounts payable | (57,643 | ) | 66,740 | (29,310 | ) | |||||
Increase (decrease) in interest and taxes payable | (46,411 | ) | (193,274 | ) | (53,101 | ) | ||||
Increase (decrease) in deferred income | 4,822 | (5,353 | ) | (12,233 | ) | |||||
Changes in other assets and liabilities, net | (40,117 | ) | (22,484 | ) | (32,934 | ) | ||||
Net cash flows from operating activities | 613,106 | 821,199 | 511,488 | |||||||
Cash flows from investing activities | ||||||||||
Purchase of property and equipment | (118,767 | ) | (150,354 | ) | (110,407 | ) | ||||
Payments for acquisitions, net of cash acquired | (53,656 | ) | (1,990,877 | ) | (1,451,006 | ) | ||||
Payments for investments | (33,715 | ) | (7,026 | ) | (3,380 | ) | ||||
Proceeds from investments | 12,402 | 180,809 | 63,408 | |||||||
Proceeds from sale of assets | 411,012 | 305,347 | 113,895 | |||||||
Net cash provided by (used for) investing activities | 217,276 | (1,662,101 | ) | (1,387,490 | ) | |||||
Cash flows from financing activities | ||||||||||
Proceeds from (payments of) borrowings under revolving credit facilities, net | 80,000 | 640,000 | (205,000 | ) | ||||||
Proceeds from borrowings | 200,000 | 666,732 | 2,021,869 | |||||||
Debt repayments | (587,509 | ) | (537,490 | ) | (287,719 | ) | ||||
Payments of debt issuance and financing costs | (7,619 | ) | (10,548 | ) | (41,960 | ) | ||||
Dividends paid | (167,508 | ) | (181,328 | ) | (183,233 | ) | ||||
Repurchases of common stock | (271,030 | ) | (75,815 | ) | (116,639 | ) | ||||
Excess tax benefit from equity awards and proceeds from stock option exercises | 31,284 | 26,672 | 31,435 | |||||||
Distributions to noncontrolling membership interests | (24,783 | ) | (22,072 | ) | (42,608 | ) | ||||
Deferred payments for acquisitions | (9,136 | ) | (15,687 | ) | (6,132 | ) | ||||
Cash transferred to the Gannett Co., Inc. business | (63,365 | ) | — | — | ||||||
Net cash (used for) provided by financing activities | (819,666 | ) | 490,464 | 1,170,013 | ||||||
Effect of currency exchange rate change | — | (281 | ) | 162 | ||||||
Increase (decrease) in cash and cash equivalents | 10,716 | (350,719 | ) | 294,173 | ||||||
Cash and cash equivalents from continuing operations, beginning of year | 110,305 | 455,023 | 109,488 | |||||||
Cash and cash equivalents from discontinued operations, beginning of year | 8,179 | 14,180 | 65,542 | |||||||
Balance of cash and cash equivalents at beginning of year | 118,484 | 469,203 | 175,030 | |||||||
Cash and cash equivalents from continuing operations, end of year | 129,200 | 110,305 | 455,023 | |||||||
Cash and cash equivalents from discontinued operations, end of year | — | 8,179 | 14,180 | |||||||
Balance of cash and cash equivalents at end of year | $ | 129,200 | $ | 118,484 | $ | 469,203 | ||||
Supplemental cash flow information: | ||||||||||
Cash paid for taxes, net of refunds | $ | 105,581 | $ | 207,038 | $ | 124,378 | ||||
Cash paid for interest | $ | 265,174 | $ | 242,190 | $ | 126,180 | ||||
Non-cash investing and financing activities | ||||||||||
Non-monetary exchange of investment for acquisition | $ | (34,403 | ) | $ | — | $ | — | |||
Assets-held-for-sale proceeds | $ | — | $ | 146,428 | $ | — | ||||
Escrow deposit disbursement related to London Broadcasting Company television stations acquisition | $ | — | $ | (134,908 | ) | $ | — | |||
Capital expenditures | $ | — | $ | (11,520 | ) | $ | — | |||
The accompanying notes are an integral part of these consolidated financial statements.
36
TEGNA INC. CONSOLIDATED STATEMENTS OF EQUITY | ||||||||||||||||||||||
In thousands of dollars | TEGNA Inc. Shareholders’ Equity | |||||||||||||||||||||
Fiscal years ended Dec. 29, 2013, Dec. 28, 2014, and Dec. 31, 2015 | Common stock $1 par value | Additional paid-in capital | Retained earnings | Accumulated other comprehensive income (loss) | Treasury stock | Noncontrolling Interests | Total | |||||||||||||||
Balance: Dec. 30, 2012 | $ | 324,419 | $ | 567,515 | $ | 7,514,858 | $ | (701,141 | ) | $ | (5,355,037 | ) | $ | 189,298 | $ | 2,539,912 | ||||||
Net Income | 388,680 | 57,233 | 445,913 | |||||||||||||||||||
Redeemable noncontrolling interest | (1,997 | ) | (1,997 | ) | ||||||||||||||||||
Other comprehensive income (loss), net of tax | 207,086 | 1,652 | 208,738 | |||||||||||||||||||
Total comprehensive income | 652,654 | |||||||||||||||||||||
Dividends declared: $0.80 per share | (182,635 | ) | (182,635 | ) | ||||||||||||||||||
Distributions to noncontrolling membership shareholders | (42,390 | ) | (42,390 | ) | ||||||||||||||||||
Treasury stock acquired | (116,639 | ) | (116,639 | ) | ||||||||||||||||||
Stock-based awards activity | (58,571 | ) | 61,416 | 2,845 | ||||||||||||||||||
Stock-based compensation | 33,437 | 33,437 | ||||||||||||||||||||
Tax benefit from settlement of stock awards | 9,764 | 9,764 | ||||||||||||||||||||
Other activity | 223 | (277 | ) | (2,101 | ) | (2,155 | ) | |||||||||||||||
Balance: Dec. 29, 2013 | $ | 324,419 | $ | 552,368 | $ | 7,720,903 | $ | (494,055 | ) | $ | (5,410,537 | ) | $ | 201,695 | $ | 2,894,793 | ||||||
Net Income | 1,062,171 | 68,289 | 1,130,460 | |||||||||||||||||||
Redeemable noncontrolling interest | (3,420 | ) | (3,420 | ) | ||||||||||||||||||
Other comprehensive income, net of tax | (284,714 | ) | (7,702 | ) | (292,416 | ) | ||||||||||||||||
Total comprehensive income | 834,624 | |||||||||||||||||||||
Dividends declared: $0.80 per share | (180,705 | ) | (180,705 | ) | ||||||||||||||||||
Distributions to noncontrolling membership shareholders | (22,072 | ) | (22,072 | ) | ||||||||||||||||||
Treasury stock acquired | (75,815 | ) | (75,815 | ) | ||||||||||||||||||
Stock-based awards activity | (52,988 | ) | 47,127 | (5,861 | ) | |||||||||||||||||
Stock-based compensation | 33,882 | 33,882 | ||||||||||||||||||||
Tax benefit from settlement of stock awards | 12,437 | 12,437 | ||||||||||||||||||||
Other activity | 707 | (286 | ) | (2,431 | ) | (2,010 | ) | |||||||||||||||
Balance: Dec. 28, 2014 | $ | 324,419 | $ | 546,406 | $ | 8,602,369 | $ | (778,769 | ) | $ | (5,439,511 | ) | $ | 234,359 | $ | 3,489,273 | ||||||
Net Income | 459,522 | 63,164 | 522,686 | |||||||||||||||||||
Redeemable noncontrolling interests | (1,796 | ) | (1,796 | ) | ||||||||||||||||||
Other comprehensive loss, net of tax | 44,349 | (6,269 | ) | 38,080 | ||||||||||||||||||
Total comprehensive income | 558,970 | |||||||||||||||||||||
Dividends declared: $0.68 per share | (153,022 | ) | (153,022 | ) | ||||||||||||||||||
Distributions to noncontrolling membership shareholders | (23,550 | ) | (23,550 | ) | ||||||||||||||||||
Spin-off of Publishing businesses | (1,797,740 | ) | 603,469 | (1,194,271 | ) | |||||||||||||||||
Treasury stock acquired | (271,030 | ) | (271,030 | ) | ||||||||||||||||||
Stock-based awards activity | (52,436 | ) | 42,620 | (9,816 | ) | |||||||||||||||||
Stock-based compensation | 26,344 | 26,344 | ||||||||||||||||||||
Tax benefit from settlement of stock awards | 20,439 | 20,439 | ||||||||||||||||||||
Other activity | (1,248 | ) | 15,790 | (1,135 | ) | 13,407 | ||||||||||||||||
Balance: Dec. 31, 2015 | $ | 324,419 | $ | 539,505 | $ | 7,111,129 | $ | (130,951 | ) | $ | (5,652,131 | ) | $ | 264,773 | $ | 2,456,744 | ||||||
The accompanying notes are an integral part of these consolidated financial statements.
37
NOTES TO CONSOLIDATED FINANCIAL STATEMENTS
NOTE 1
Description of business, basis of presentation and summary of significant accounting policies
Description of business: Our Company is comprised of a dynamic portfolio of media and digital businesses that provide content that matters and brands that deliver. Our media business includes 46 television stations operating in 38 markets, offering high-quality television programming and digital content. Our digital business primarily consists of our Cars.com and CareerBuilder business units that operate in the automotive and human capital solutions industries. The Cars.com website provides credible and easy-to-understand information from consumers and experts to provide car buyers with greater control over the car buying and servicing process. CareerBuilder helps companies target, attract and retain workforce talent through an array of product offerings including talent management software and other advertising and recruitment solutions.
On the first day of our fiscal third quarter, June 29, 2015, we completed the spin-off of our publishing businesses. Our Company was renamed TEGNA Inc. and our stock trades on the New York Stock Exchange under the symbol TGNA. The new publishing company retained the name Gannett Co., Inc. and now trades on the New York Stock Exchange under the symbol GCI. In addition, during the fourth quarter of 2015, we sold substantially all of the businesses within our Other Segment.
With the completion of these separations, we disposed of the former Publishing and Other Segments in their entirety and ceased to consolidate its assets, liabilities and results of operations in our consolidated financial statements. Accordingly, we have presented the financial condition and results of operations of the former Publishing and Other Segments as discontinued operations in the accompanying consolidated financial statements for all periods presented. See Note 13, for a summary of discontinued operations.
Fiscal year: Beginning in fiscal year 2015, we changed our financial reporting cycle to a calendar year-end. Accordingly, our 2015 fiscal year began on December 29, 2014 (the day after the end of the 2014 fiscal year) and ended on December 31, 2015. Historically, our fiscal year was a 52-53 week fiscal year that ended on the last Sunday of the calendar year. As a result, our 2015 fiscal year had four more days than the 2014 and 2013 fiscal years. The impact of the four extra days did not have a material impact on our financial statements, and therefore, we have not restated the historical results.
Use of estimates: The financial statements have been prepared in accordance with U.S. generally accepted accounting principles (GAAP). In doing so, we are required to make estimates and assumptions that affect the amounts reported in the consolidated financial statements and accompanying notes. Actual results could differ from these estimates. Significant estimates include, but are not limited to, income taxes including deferred tax assets, pension and other postretirement benefits, evaluation of goodwill and other intangible assets for impairment, fair value measurements and contingencies.
Basis of Presentation: The Consolidated Financial Statements include the accounts of subsidiaries we control and variable interest entities if we are the primary beneficiary. We eliminate all intercompany balances, transactions, and profits in consolidation. Investments in entities for which have significant influence, but do not have control, are accounted for under the equity method. Our share of net earnings and losses from these ventures is included in “Equity income (loss) in unconsolidated investees, net” in the Consolidated Statements of Income.
Changes in Basis of Presentation: The 2014 and 2013 financial information has been recast so that the basis of presentation is consistent with that of the 2015 financial information. This recast reflects the financial position and results of operations of our former publishing businesses and Other Segment as discontinued operations for all periods presented. The consolidated statements of cash flows have not been recast and include the cash flows from both continuing and discontinuing operations. In addition, certain reclassifications have been made to prior years' consolidated financial statements to conform to the current year's presentation.
Variable Interest Entities (VIE): A variable interest entity is an entity that must be consolidated by its primary beneficiary, the party that holds a controlling financial interest. A VIE has one or both of the following characteristics: (1) its equity at risk is not sufficient to permit the entity to finance its activities without additional subordinated financial support from other parties, or (2) as a group, the equity investors lack one or more of the following characteristics: (a) the power to direct the activities that most significantly affect the economic performance of the entity, (b) obligation to absorb expected losses, or (c) right to receive expected residual returns.
We consolidate VIEs when we are the primary beneficiary. In determining whether we are the primary beneficiary of a VIE for financial reporting purposes, we consider whether we have the power to direct the activities of the VIE that most significantly impact the economic performance of the VIE and whether we have the obligation to absorb losses or the right to receive returns that would be significant to the VIE.
Since December 23, 2013, we had consolidated four VIE's that operate television stations in the Louisville, KY, Portland, OR, and Tucson, AZ markets. We serviced these stations under shared services and similar arrangements and concluded we were the primary beneficiary. On December 3, 2015, we acquired the remaining ownership interest in three of the four stations. As a result, we had one remaining consolidated VIE related to a station in Tucson, AZ as of December 31, 2015.
38
Below is a summary of the carrying amounts and classification of the assets and liabilities of the consolidated VIEs mentioned above:
In thousands of dollars | ||||||
Dec. 31, 2015 | Dec. 28, 2014 | |||||
Current assets | $ | 1,250 | $ | 20,541 | ||
Property and equipment, net | 309 | 10,084 | ||||
Intangible and other assets | 2,846 | 29,412 | ||||
Total assets | 4,405 | 60,037 | ||||
Current liabilities | 1,381 | 11,635 | ||||
Noncurrent liabilities | 1,719 | 26,028 | ||||
Total liabilities | $ | 3,100 | $ | 37,663 | ||
Segment presentation: The Digital Segment includes results from CareerBuilder, Cars.com, PointRoll and ShopLocal. Digital Segment revenues exclude online/digital revenues generated by digital platforms that are associated with our Media Segment's properties. Such amounts are reflected within our Media Segment and included within media revenues in the Consolidated Statements of Income.
Noncontrolling interests presentation: Noncontrolling interests are presented as a component of equity on the Consolidated Balance Sheet. This balance primarily relates to the noncontrolling owners of CareerBuilder for which our ownership percentage is at 52.9%. Net income in the Consolidated Statements of Income reflects 100% of CareerBuilder's results as we hold the controlling interest. Net income is subsequently adjusted to remove the noncontrolling interest to arrive at Net income attributable to TEGNA Inc.
In addition, CareerBuilder has made two strategic acquisitions in which they own a controlling financial interest. In July 2015, CareerBuilder acquired a majority ownership in Textkernal, a software company that provides semantic recruitment technology. Additionally, in 2012, CareerBuilder acquired a majority ownership in Economic Modeling Specialists Intl. (EMSI), a software firm that specializes in employment data and labor market analytics. The minority shareholders of these acquired businesses hold put rights that permit them to put their equity interest to CareerBuilder. Since redemption of the noncontrolling interest is outside of our control, the minority shareholders' equity interest is presented on the consolidated balance sheet in the caption “Redeemable noncontrolling interests”.
Cash and cash equivalents: Cash and cash equivalents consist of cash and highly liquid short-term investments with original maturities of three months or less. Cash and cash equivalents are carried at cost plus accrued interest, which approximates fair value.
Trade receivables and allowances for doubtful accounts: Trade receivables are recorded at invoiced amounts and generally do not bear interest. The allowance for doubtful accounts reflects our estimate of credit exposure, determined principally on the basis of our collection experience, aging of our receivables and any specific reserves needed for certain customers based on their credit risk. Bad debt expense, which is included in cost of sales and operating expenses on our consolidated statements of income, was $6.9 million in 2015, $4.1 million in 2014, and $4.4 million in 2013, which approximated write-offs of trade receivables during each respective year.
Property and depreciation: Property and equipment are recorded at cost, and depreciation is provided generally on a straight-line basis over the estimated useful lives of the assets. The estimated useful lives are generally: buildings and improvements, 10 to 40 years; and machinery, equipment and fixtures, 3 to 25 years. Changes in the estimated useful life of an asset, which, for example, could happen as a result of facility consolidations, can affect depreciation expense and net income. Major building and leasehold improvements and interest incurred during the construction period of major additions are capitalized. Expenditures for maintenance and repairs are expensed as incurred.
Valuation of long-lived assets: We review the carrying amount of long-lived assets (mostly property and equipment and definite-lived intangible assets) for impairment whenever events or changes in circumstances indicate that the carrying amount may not be recoverable. Once an indicator of potential impairment has occurred, the impairment test is based on whether the intent is to hold the asset for continued use or to hold the asset for sale. If the intent is to hold the asset for continued use, the impairment test first requires a comparison of projected undiscounted future cash flows against the carrying amount of the asset group. If the carrying value of the asset group exceeds the estimated undiscounted future cash flows, the asset group would be deemed to be potentially impaired. The impairment, if any, would be measured based on the amount by which the carrying amount exceeds the fair value. Fair value is determined primarily using the projected future cash flows, discounted at a rate commensurate with the risk involved. Losses on long-lived assets to be disposed of are determined in a similar manner, except that fair values are reduced for the cost to dispose. We recognized impairment charges each year from 2013-2015 related to long-lived assets. See Note 11 for further discussion.
Goodwill and indefinite-lived intangible assets: Goodwill represents the excess of acquisition cost over the fair value of assets acquired, including identifiable intangible assets, net of liabilities assumed. Goodwill is tested for impairment on an annual basis (first day of our fourth quarter) or between annual tests if events or changes in circumstances that indicate the fair value of a reporting unit below its carrying amount.
Before performing the annual two-step goodwill impairment test, we first have the option to perform a qualitative assessment to determine if the two-step quantitative test must be completed. The qualitative assessment considers events and circumstances such as macroeconomic conditions, industry and market conditions, cost factors and overall financial performance, as well as company and specific reporting unit specifications. If after performing this assessment, we conclude it is more likely than not that the fair value of a reporting unit is less than its carrying amount, then we are required to perform the two-step quantitative test. Otherwise, the two-step quantitative test is not required. In 2015, we elected to not perform the optional qualitative assessment of goodwill; instead, we performed the quantitative impairment test.
39
Our goodwill has been allocated to and is tested for impairment at a level referred to as the reporting unit. The level at which we test goodwill for impairment requires us to determine whether the operations below the business segment level constitute a business for which discrete financial information is available and segment management regularly reviews the operating results. For Media, goodwill is accounted for at the segment level. For Digital, the reporting units are the stand-alone digital businesses such as Cars.com, CareerBuilder, ShopLocal and PointRoll.
When performing the first step of the quantitative test, we determine the fair value of each reporting unit and compare it to the carrying amount, including goodwill. If the carrying amount of the reporting unit exceeds the fair value of the reporting unit, we perform the second step of the impairment test, as this is an indication that the reporting unit goodwill may be impaired. In the second step of the impairment test, we determine the implied fair value of the reporting unit’s goodwill. If the carrying value of a reporting unit’s goodwill exceeds its implied fair value, then an impairment of goodwill has occurred and we must recognize an impairment loss for the difference between the carrying amount and the implied fair value of goodwill.
We estimate the fair value of each reporting unit using a combination of a market-based valuation methodology using comparable public company trading values, and income approach using the discounted cash flow (DCF) analysis. Determining fair value requires the exercise of significant judgments, including the amount and timing of expected future cash flows, long-term growth rates, discount rates and relevant comparable public company earnings multiples. The cash flows employed in the DCF analysis are based on our best estimate of future sales, earnings and cash flows after considering factors such as general market conditions and recent operating performance. The discount rates utilized in the DCF analysis are based on the respective reporting unit’s weighted average cost of capital, which takes into account the relative weights of each component of capital structure (equity and debt) and represents the expected cost of new capital, adjusted as appropriate to consider the risk inherent in future cash flows of the respective reporting unit. In the fourth quarter of 2015, we completed our annual goodwill impairment test for each of our reporting units. The results of these tests indicated that the estimated fair values of our reporting units exceed their carrying values, with the exception of our PointRoll reporting unit within our Digital Segment. After performing step 2 of the impairment test, we recorded a non-cash impairment charge of $8 million in the fourth quarter of 2015 related to PointRoll. See Note 11 for further discussion.
We also have intangible assets with indefinite lives associated with FCC broadcast licenses related to our acquisitions of television stations, and trade names from the Cars.com and CareerBuilder acquisitions. Intangible assets with indefinite lives are tested annually, or more often if circumstances dictate, for impairment and written down to fair value as required. The estimates of fair value for the trade names are determined using the "relief from royalty" methodology, which is a variation of the income approach. Discount rate assumptions are based on an assessment of the risk inherent in the projected future cash flows generated by the intangible asset.
To estimate the fair values for the FCC broadcast licenses, we apply an income approach, using the Greenfield method. The Greenfield method involves a DCF model that incorporates several variables, including market revenues, long-term growth projections, estimated market share for a typical market participant, and estimated profit margins based on market size and station type.
The results of our 2015 annual impairment test of indefinite lived intangible assets indicated the fair values exceed their carrying amounts, and therefore, no impairment charge was recorded.
Investments and other assets: Investments where we have significant influence are recorded under the equity method of accounting. We recognized impairment charges in 2014 related to such investments. See Note 4 for additional information.
Investments in non-public businesses in which we do not have control or do not exert significant influence are carried at cost and losses resulting from periodic evaluations of the carrying value of these investments are included as a non-operating expense. At Dec. 31, 2015, such investments totaled approximately $8.6 million and at Dec. 28, 2014, they totaled approximately $8.3 million.
Our television stations are party to program broadcasting contracts which provide the Media Segment with rights to broadcast syndicated programs, original series and films. These contracts are recorded at the gross amount of the related liability when the programs are available for telecasting. The related assets are recorded at the lower of cost or estimated net realizable value. Program assets are classified as current (as a prepaid expense) or noncurrent (as an other asset) in the Consolidated Balance Sheets, based upon the expected use of the programs in succeeding years. The amount charged to expense appropriately matches the cost of the programs with the revenues associated with them. The liability for these contracts is classified as current or noncurrent in accordance with the payment terms of the contracts. The payment period generally coincides with the period of telecast for the programs, but may be shorter.
Revenue recognition: We generate revenue from a diverse set of product and service offerings which include advertising, retransmission consent fees, and software and recruitment services. Revenue is recognized when persuasive evidence of an arrangement exists, performance under the contract has begun, the contract price is fixed or determinable and collectability of the related fee is reasonably assured. Revenue from sales agreements that contain multiple deliverable elements is allocated to each element based on the relative best estimate of selling price. Elements are treated as separate units of accounting if there is standalone value upon delivery. Amounts received from customers in advance of revenue recognition are deferred as liabilities. Below is a detail discussion of revenue by our two reportable segments.
40
Media Segment: The primary source of revenue for our Media Segment is through the sale of advertising time on its television stations. Advertising revenues are recognized, net of agency commissions, in the period when the advertisements are aired. Our Media Segment also earns revenue from retransmission consent arrangements. Under these agreements, we receive cash consideration from multichannel video programming distributors (e.g., cable and satellite providers) in return for our consent to permit the cable/satellite operator to retransmit our television signal. Retransmission consent fees are recognized over the contract period based on a negotiated fee per subscriber. Retransmission consent fees revenues have increased as a percentage of overall Media Segment revenue in recent years. In 2015, such revenues accounted for approximately 27% of overall Media Segment revenue compared to 18% in 2013. In addition, our Media Segment also generates online advertising revenue through the display of digital advertisements across its various digital platforms. Online advertising agreements typically take the form of an impression-based contract, fixed fee time-based contract or transaction based contract. The customers are billed for impressions delivered or click-throughs on their advertisements. An impression is the display of an advertisement to an end-user on the website and is a measure of volume. A click-through occurs when an end-user clicks on an impression. Revenue is recognized evenly over the contract term for fixed fee contracts where a minimum number of impressions or click-throughs is not guaranteed. Revenue is recognized as the service is delivered for transaction based contracts.
Digital Segment: The primary source of revenue for our Digital Segment is through the sale of online subscription advertising products. Cars.com sells subscription advertising products targeting car dealerships and national advertisers, and CareerBuilder earns revenue through placement of job postings on its network of websites. Revenue is recognized for our Digital Segment’s online advertising arrangements in the same manner as described above for Media Segments online advertising revenue.
CareerBuilder service offerings include human capital Software-as-a-Service (SaaS) and various other recruitment solutions (employment branding services and access to online resume databases). Generally, the human capital SaaS offering and access related to resume databases are subscription-based contracts for which revenue is recognized ratably over the subscription period. SaaS contracts are generally two to three year contracts. Recruitment solutions (which include sourcing and screening services) are more transactional based contracts, and therefore, revenue is recognized as delivery occurs.
In addition, through our G/O Digital business unit, we also provide digital marketing services and revenue is recognized for these offerings as advertising and services are delivered.
Retirement plans: Pension and other post-retirement benefit costs under our defined benefit retirement plans are actuarially determined. We recognize the cost of post-retirement benefits including pension, medical and life insurance benefits on an accrual basis over the average life expectancy of employees expected to receive such benefits for plans that have had their benefits frozen. For active plans, costs are recognized over the estimated average future service period.
Stock-based employee compensation: We grant restricted stock or restricted stock units (RSU) as well as performance shares to employees as a form of compensation. The expense for such awards is based on the grant date fair value of the award and is generally recognized on a straight-line basis over the requisite service period, which is typically the four-year vesting period for restricted stock and the three-year vesting period for performance shares. Performance share expense for participants meeting certain retirement eligible criteria as defined in the plan is recognized using the accelerated attribution method. See Note 9 for further discussion.
Our stock option awards generally have graded vesting terms and we recognize compensation expense for these options on a straight-line basis over the requisite service period for the entire award (generally four years). Stock options are no longer issued to our employees and in 2015 all remaining outstanding options became fully vested.
Advertising Costs: We expense advertising costs as they are incurred. Advertising expense was $173.3 million 2015, $110.1 million in 2014, and $98.6 million in 2013, and is included in selling, general and administrative expenses on the Consolidated Statements of Income.
Income taxes: Income taxes are presented on the consolidated financial statements using the asset and liability method, under which deferred tax assets and liabilities are recognized based on the future tax consequences attributable to temporary differences that exist between the financial statement carrying amount of assets and liabilities and their respective tax basis, as well as from operating loss and tax credit carry-forwards. Deferred income taxes reflect expected future tax benefits (i.e., assets) and future tax costs (i.e., liabilities). The tax effect of net operating loss, capital loss and general business credit carryovers result in deferred tax assets. We measure deferred tax assets and liabilities using the enacted tax rate expected to apply to taxable income in the years in which those temporary differences are expected to be recoverable or settled. We recognize the effect on deferred taxes of a change in tax rates in income in the period that includes the enactment date. Valuation allowances are established if, based upon the weight of available evidence, management determines it is “more likely than not” that some portion or all of the deferred tax asset will not be realized.
We periodically assess our tax filing exposures related to periods that are open to examination. Based on the latest available information, we evaluate our tax positions to determine whether it is more-likely-than-not the position will be sustained upon examination by the relevant taxing authority. If we cannot reach a more-likely-than-not determination, no benefit is recorded. If we determine that the tax position is more-likely-than-not to be sustained, we record the largest amount of benefit that is more-likely-than-not to be realized when the tax position is settled. We record interest and penalties related to income taxes as a component of income tax expense on our Consolidated Statements of Income. Interest and penalties were not material in each year presented.
41
Foreign currency translation: The income statements of foreign operations have been translated to U.S. dollars using the average currency exchange rates in effect during the relevant period. The balance sheets have been translated using the currency exchange rate as of the end of the accounting period. The impact of currency exchange rate changes on the translation of the balance sheets are included in other comprehensive income (loss) in the Consolidated Statement of Comprehensive Income and are classified as accumulated other comprehensive income (loss) in the Consolidated Balance Sheet and Consolidated Statement of Equity.
Loss contingencies: We are subject to various legal proceedings, claims and regulatory matters, the outcomes of which are subject to significant uncertainty. We determine whether to disclose or accrue for loss contingencies based on an assessment of whether the risk of loss is remote, reasonably possible or probable, and whether it can be reasonably estimated. We accrue for loss contingencies when such amounts are probable and reasonably estimable. If a contingent liability is only reasonably possible, we will disclose the potential range of the loss, if material and estimable.
Discontinued operations: In determining whether a group of assets is disposed (or to be disposed) should be presented as a discontinued operation, we analyze whether the group of assets being disposed of represented a component of the entity; that is, whether it had historic operations and cash flows that were clearly distinguished (both operationally and for financial reporting purposes). In addition, we consider whether the disposal represents a strategic shift that has or will have a major effect on our operations and financial results.
We concluded that both the spin-off of our former publishing businesses on June 29, 2015, and the sale of our Other Segment during the fourth quarter of 2015 met all of the criteria to be presented as discontinued operations. As such, for all periods presented, we have recast our financial information to present the financial position and results of operations of the former publishing businesses and Other Segment as discontinued operations in the accompanying consolidated financial statements, with the exception of the consolidated statements of cash flows (which include the cash flows from both continuing and discontinuing operations). See Note 13 for more information.
Accounting guidance adopted in 2015: On Dec. 31, 2015 we early adopted guidance that requires the presentation of deferred tax assets and liabilities to be classified as non-current in the consolidated balance sheet. The Dec. 28, 2014 consolidated balance sheet has also been recast so that the classification of deferred taxes is consistent with the current year presentation.
New accounting pronouncements not yet adopted: In May 2014, the Financial Accounting Standards Board (FASB) issued guidance that establishes a new revenue recognition framework in U.S. GAAP for all companies and industries. The core principle of the guidance is that an entity should recognize revenue to depict the transfer of promised goods or services to customers in an amount that reflects the consideration to which the entity expects to be entitled in exchange for those goods or services. New disclosures about the nature, amount, timing and uncertainty of revenue and cash flows arising from contracts with customers are also required. In July 2015, the FASB approved a one-year deferral of the effective date of the standard to 2018 for public companies, with an option that would permit companies to early adopt the standard in 2017. Early adoption prior to 2017 is not permitted. The new standard may be adopted either retrospectively or on a modified retrospective basis, which recognizes a cumulative catch-up adjustment to the opening balance of retained earnings. In addition, the FASB is contemplating making additional changes to certain elements of the new standard. We are currently evaluating the methods of adoption allowed by the new standard and the effect the standard is expected to have on our consolidated financial statements and related disclosures.
In September 2015, the FASB issued guidance that requires an acquirer to recognize adjustments to provisional amounts recorded in a business combination in the reporting period in which the adjustment amounts are determined. Recognizing the entire impact of a measurement period adjustment in a single reporting period may introduce earnings volatility and reduces comparability between periods when the adjustments are material. Past measurement period adjustments for us have not been material.
In April 2015, the FASB issued guidance that will change the way an entity presents debt issuance costs on the balance sheet. Under the new guidance, debt issuance costs will be a direct deduction from the carrying amount of the debt liability, similar to debt discounts, rather than as an asset as has been done previously. Amortization of the cost will continue to be reported as interest expense. We will adopt the new guidance in the first quarter of 2016. We are required to apply the new guidance on a retrospective basis, wherein the balance sheet of each period presented is adjusted to reflect the effects of applying the new guidance. At Dec. 31, 2015, we had $49.0 million of debt issuance costs recorded as assets. The debt issuance costs amount to less than 1% of our total assets.
In February 2016, the FASB issued new guidance related to leases which will require lessees to recognize assets and liabilities for leases with lease terms of more than 12 months. Consistent with current GAAP, the recognition, measurement, and presentation of expenses and cash flows arising from a lease by a lessee primarily will depend on its classification as a finance or operating lease. However, unlike current GAAP-which requires only capital leases to be recognized on the balance sheet—the new guidance will require both types of leases to be recognized on the balance sheet. The new guidance is effective for us beginning in the first quarter of 2019 and we are currently evaluating the effect it is expected to have on our consolidated financial statements and related disclosures.
42
NOTE 2
Acquisitions, investments and dispositions
We made the following acquisitions, investments and dispositions during 2013 through 2015:
Acquisitions
2015: In July 2015, CareerBuilder acquired a majority stake in Textkernel, a leading-edge software company providing semantic recruitment technology to the global market. Textkernel is based in Amsterdam.
In March 2015, CareerBuilder increased its controlling interest in EMSI by 11% from 74% to 85%. EMSI is an economic software firm that specializes in employment data and labor market analysis. EMSI collects and interprets large amounts of labor data, which is used in workforce development and talent strategy.
On December 3, 2015, we acquired three television stations KGW in Portland, Oregon, WHAS in Louisville, Kentucky and KMSB in Tucson, Arizona, following approval from the Federal Communications Commission. Since 2013, we have consolidated these three television stations as they were VIEs and we were the primary beneficiary. See Note 1 for further discussion.
2014: On Oct. 1, 2014, we acquired the remaining 73% interest in Cars.com (formerly known as Classified Ventures, LLC) for $1.83 billion. We funded the acquisition with additional borrowings and cash on hand. As part of the acquisition, Cars.com entered into new five-year affiliation agreements with each of the former newspaper investors at economic terms much more favorable to Cars.com. Acquiring full ownership of Cars.com further accelerated our digital transformation and expanded our position in local media and marketing services in the automotive sector.
The purchase price was allocated to the tangible assets and identified intangible assets acquired based on their estimated fair values. The excess purchase price over those fair values was recorded as goodwill. At the acquisition date, the purchase price assigned to the acquired assets and assumed liabilities is summarized as follows:
In thousands of dollars | |||
Cash and cash equivalents | $ | 43,767 | |
Receivables and other current assets | 108,577 | ||
Property and equipment | 17,399 | ||
Indefinite-lived intangible assets | 872,320 | ||
Definite-lived intangible assets: | |||
Customer relationships | 789,540 | ||
Internally developed technology | 69,500 | ||
Other | 2,860 | ||
Investments and other noncurrent assets | 14,598 | ||
Goodwill | 715,970 | ||
Total assets acquired | 2,634,531 | ||
Current liabilities | 106,970 | ||
Other noncurrent liabilities | 132,606 | ||
Total liabilities assumed | 239,576 | ||
Net assets acquired | 2,394,955 | ||
Less: acquisition date fair value of 26.9% equity interest | 563,757 | ||
Acquisition purchase price | $ | 1,831,198 | |
We recognized a $476.7 million pre-tax non-cash gain ($285.9 million after-tax) on the acquisition of Cars.com, which is comprised of a $396.7 million gain on the write-up of our prior 27% investment in Cars.com to fair value and an $80.0 million gain related to the required accounting for the pre-existing affiliate agreement between us and Cars.com. The net gain is included in Other non-operating items on the Consolidated Statements of Income. The impact to our Consolidated Statements of Income, net of intersegment eliminations, from Oct. 1, 2014, the acquisition date to Dec. 28, 2014 was $129.0 million of revenue and $33.6 million of operating income.
Customer relationships are being amortized over a weighted average life of eleven years and internally developed technology is being amortized over a weighted average life of seven years. Acquired property and equipment will be depreciated on a straight-line basis over the respective estimated remaining useful lives. Goodwill is calculated as the excess of the consideration transferred over the fair value of the identifiable net assets acquired and represents the future economic benefits expected to arise from other intangible assets acquired that do not qualify for separate recognition, including assembled workforce and non-contractual relationships, as well as expected future synergies. We expect the purchase price allocated to goodwill and other indefinite-lived intangibles will be deductible for tax purposes.
Pro forma information. The following table sets forth unaudited pro forma results of operations, assuming that the Cars.com acquisition, along with transactions necessary to finance the acquisition, occurred at the beginning of 2013:
Unaudited | ||||||
In thousands of dollars | 2014 | 2013 | ||||
Total revenues | $ | 2,987,058 | $ | 2,039,854 | ||
Net income attributable to TEGNA Inc. | $ | 754,851 | $ | 356,353 | ||
This pro forma financial information is based on historical results of operations, adjusted for the allocation of the purchase price and other acquisition accounting adjustments, and is not necessarily indicative of what our results would have been had we operated the businesses since the beginning of the annual period presented. The pro forma adjustments reflect amortization of intangibles and unfavorable contracts related to the fair value adjustments of the assets and liabilities acquired, additional interest expense related to the financing of the transactions, alignment of accounting policies and the related tax effects of the adjustments. Changes in affiliation agreements between Cars.com and its former investors that went into effect on Oct. 1, 2014, were excluded from the pro forma adjustments dating back to the beginning of 2013. The pro forma table excludes adjustments for any other acquisitions in 2013 or 2014.
43
We incurred and expensed a total of $9.3 million of acquisition costs related to Cars.com for the year ended Dec. 28, 2014. Such costs were reflected in Other non-operating items in the Consolidated Statements of Income. These acquisition costs and the $285.9 million after-tax gain on the acquisition of Cars.com are not included in the pro forma amounts above as they are specifically related to the acquisition.
In April 2014, CareerBuilder acquired Broadbean. Broadbean is a leading international job distribution, candidate sourcing and big data analytics software company. Broadbean is headquartered in London, United Kingdom and has offices in the U.S., France, Germany, the Netherlands and Australia.
In July 2014, we acquired six London Broadcasting Company television stations in Texas for approximately $215.0 million in an all-cash transaction. We used proceeds of $134.9 million from the sale of the Phoenix and St. Louis stations to partially pay for the London Broadcasting Company stations via a tax-efficient exchange. The acquisition included KCEN (NBC) in Waco-Temple-Bryan, KYTX (CBS) in Tyler-Longview, KIII (ABC) in Corpus Christi, KBMT (ABC) and its digital sub-current KJAC (NBC) in Beaumont-Port Arthur, KXVA (FOX) in Abilene-Sweetwater and KIDY (FOX) in San Angelo.
2013: On Dec. 23, 2013, we completed the acquisition of Belo. The total cash consideration was $1.47 billion in addition to the assumption of $715 million in principal amount of outstanding Belo debt. The source of the aggregate purchase price that we paid in the acquisition consisted of additional borrowings and cash on hand. In connection with the acquisition, we recorded goodwill (which is not deductible for tax purposes) of $929 million, related to synergies of combining operations and value of the existing workforce. Additionally, we recorded other intangible assets of $186 million primarily related to retransmission and network affiliation agreements. The retransmission agreements intangible assets are being amortized over a weighted average life of eight years and network affiliate agreements intangible assets are being amortized over a weighted average life of nine years. Acquired property and equipment are being depreciated on a straight-line basis over the respective estimated remaining useful lives.
Under the acquisition method of accounting, the results of the acquired operations for the 17 consolidated television stations are included in our financial statements beginning Dec. 23, 2013. Net media revenues and operating income of these stations included in our Consolidated Statements of Income were immaterial for the year ended Dec. 29, 2013.
We incurred and expensed a total of $33.0 million of acquisition costs for the year ended Dec. 29, 2013, related to the Belo acquisition. Such costs were reflected in Other non-operating items in the Consolidated Statements of Income.
Dispositions
2015: On June 29, 2015, we completed the spin-off of our publishing businesses and began trading as TEGNA on the New York Stock Exchange under the symbol TGNA. See Note 13 for further details regarding the spin-off.
On Dec. 29, 2014, which was the first day of our 2015 fiscal year, we completed our sale of Gannett Healthcare Group (GHG), to OnCourse Learning. GHG provides continuing education, certification test preparation, online recruitment, digital media, publications and related services for nurses and other healthcare professionals in the U.S.
On November 5, 2015 we also sold our subsidiaries Clipper Magazine (Clipper), a direct mail advertising magazine business, and Mobestream Media (Mobestream), maker of a mobile rewards/coupon platform, to Valassis Direct Mail, Inc.
The Clipper and Mobestream business units represented substantially all of the operations of our former Other Segment. As a result, the operating results of our Other Segment have been included in discontinued operations in our consolidated financial statements (see Note 13 for more information).
On November 12, 2015, we sold PointRoll which was part of our Cofactor business unit within our Digital Segment, to Sizmek Technologies, Inc.
2014: In February 2014, we along with Sander Media, LLC, completed the sale of KMOV in St. Louis, MO, to Meredith Corporation, following regulatory approval. As a condition of the sale, Sander Media conveyed to Meredith Corporation substantially all of its assets used to operate KMOV, which Sander Media acquired when the Gannett-Belo transaction closed on December 23, 2013. We conveyed certain other assets needed to provide services to KMOV, which we also acquired from Belo.
In June 2014, we, along with Sander Media, LLC, completed the sale of KTVK and KASW in Phoenix, AZ, to Meredith Corporation. As part of the sale, Sander Media conveyed to Meredith substantially all of its assets used in the operation of both stations, which Sander Media acquired when the Belo transaction was completed in December 2013. We also conveyed certain other assets we used to provide services to both stations, which we acquired from the Belo transaction. At the closing, Meredith simultaneously conveyed KASW to SagamoreHill of Phoenix, LLC, which through its affiliates, owns and operates two television stations in two markets. The total sale price of the Phoenix and St. Louis stations was $407.5 million plus working capital.
In March 2014, Classified Ventures, in which we owned a 27% interest, agreed to sell Apartments.com to CoStar Group, Inc. for $585 million. This transaction closed on April 1, 2014. As a result of our ownership stake, we received a $154.6 million distribution from Classified Ventures after the close of the transaction.
44
NOTE 3
Goodwill and other intangible assets
The following table displays goodwill, indefinite-lived intangible assets, and amortizable intangible assets at Dec. 31, 2015, and Dec. 28, 2014.
In thousands of dollars | |||||||||
Gross | Accumulated Amortization | Net | |||||||
Dec. 31, 2015 | |||||||||
Goodwill | $ | 3,919,726 | $ | — | $ | 3,919,726 | |||
Indefinite-lived intangibles: | |||||||||
Television station FCC licenses | 1,191,950 | — | 1,191,950 | ||||||
Trade names | 925,019 | — | 925,019 | ||||||
Amortizable intangible assets: | |||||||||
Customer relationships | 903,652 | (145,398 | ) | 758,254 | |||||
Other | 265,148 | (75,264 | ) | 189,884 | |||||
Total | $ | 7,205,495 | $ | (220,662 | ) | $ | 6,984,833 | ||
Dec. 28, 2014 (recast) | |||||||||
Goodwill | $ | 3,914,771 | $ | — | $ | 3,914,771 | |||
Indefinite-lived intangibles: | |||||||||
Television station FCC licenses | 1,191,950 | — | 1,191,950 | ||||||
Trade names | 926,407 | — | 926,407 | ||||||
Amortizable intangible assets: | |||||||||
Customer relationships | 904,916 | (71,719 | ) | 833,197 | |||||
Other | 268,578 | (42,554 | ) | 226,024 | |||||
Total | $ | 7,206,622 | $ | (114,273 | ) | $ | 7,092,349 | ||
Amortization expense was $114.3 million in 2015, $66.0 million in 2014 and $20.7 million in 2013. The increase primarily reflects the impact of a full year of Cars.com amortization which was acquired in October 2014. Customer relationships, which include subscriber lists and advertiser relationships, are amortized on a straight-line basis over their useful lives. Other intangibles primarily include retransmission agreements, network affiliations, developed technology, and patents and are amortized on a straight-line basis over their useful lives.
The following table shows the projected annual amortization expense, as of Dec. 31, 2015, related to our existing amortizable intangible assets:
In thousands of dollars | |||
2016 | $ | 110,135 | |
2017 | $ | 105,989 | |
2018 | $ | 103,213 | |
2019 | $ | 97,018 | |
2020 | $ | 94,308 | |
The following table shows the changes from 2014 to 2015 in the carrying amount of goodwill by reportable segment.
In thousands of dollars | |||||||||
Media | Digital | Total | |||||||
Goodwill (recast) | |||||||||
Gross balance at Dec. 29, 2013 | 2,543,333 | 765,952 | 3,309,285 | ||||||
Accumulated impairment losses | — | (136,700 | ) | (136,700 | ) | ||||
Net balance at Dec. 29, 2013 | $ | 2,543,333 | $ | 629,252 | $ | 3,172,585 | |||
Acquisitions & adjustments | 35,268 | 753,828 | 789,096 | ||||||
Impairment | — | (30,271 | ) | (30,271 | ) | ||||
Foreign currency exchange rate changes | — | (16,639 | ) | (16,639 | ) | ||||
Balance at Dec. 28, 2014 | $ | 2,578,601 | $ | 1,336,170 | $ | 3,914,771 | |||
Gross balance at Dec. 28, 2014 | 2,578,601 | 1,503,141 | 4,081,742 | ||||||
Accumulated impairment losses | — | (166,971 | ) | (166,971 | ) | ||||
Net balance at Dec. 28, 2014 | $ | 2,578,601 | $ | 1,336,170 | $ | 3,914,771 | |||
Acquisitions & adjustments | 817 | 25,667 | 26,484 | ||||||
Dispositions | — | (252 | ) | (252 | ) | ||||
Impairment | — | (8,000 | ) | (8,000 | ) | ||||
Foreign currency exchange rate changes | — | (13,277 | ) | (13,277 | ) | ||||
Balance at Dec. 31, 2015 | $ | 2,579,418 | $ | 1,340,308 | $ | 3,919,726 | |||
Gross balance at Dec. 31, 2015 | 2,579,418 | 1,515,279 | 4,094,697 | ||||||
Accumulated impairment losses | — | (174,971 | ) | (174,971 | ) | ||||
Net balance at Dec. 31, 2015 | $ | 2,579,418 | $ | 1,340,308 | $ | 3,919,726 | |||
45
NOTE 4
Other assets and investments
Our investments and other assets consisted of the following as of Dec. 31, 2015 and Dec. 28, 2014:
In thousands of dollars | ||||||
Dec. 31, 2015 | Dec. 28, 2014 | |||||
(recast) | ||||||
Deferred compensation investments | $ | 77,199 | $ | 65,950 | ||
Cash value life insurance | 68,332 | 70,801 | ||||
Deferred debt issuance cost | 45,420 | 50,045 | ||||
Equity method investments | 27,824 | 21,750 | ||||
Available for sale investment | 28,090 | — | ||||
Other long term assets | 41,925 | 40,904 | ||||
Total | $ | 288,790 | $ | 249,450 | ||
Deferred compensation: Employee compensation related investments consist of debt and equity securities which are classified as trading securities and fund our deferred compensation plan liabilities (See Note 8 for further discussion on how fair value is determined). Net gains on trading securities in 2015, 2014, and 2013 were $0.5 million, $2.9 million and $3.2 million. Gains and losses on these investments are included in Other non-operating items within our consolidated statement of income.
Equity method investments: Investments where we have the ability to exercise significant influence, but do not control, are accounted for under the equity method of accounting. Significant influence typically exists if we have a 20% to 50% ownership interest in the investee. Under this method of accounting, our share of the net earnings or losses of the investee is included in non-operating income, on our consolidated statements of income. We evaluate our equity method investments for impairment whenever events or changes in circumstances indicate that the carrying amounts of such investments may be impaired. If a decline in the value of an equity method investment is determined to be other than temporary, a loss is recorded in earnings in the current period. Certain differences exist between our investment carrying value and the underlying equity of the investee companies principally due to fair value measurement at the date of investment acquisition and due to impairment charges we recorded for certain of the investments. Pre-tax impairments on equity method investments were $3 million in 2014 and were recorded in equity income in unconsolidated investees on our Consolidated Statements of Income. No material impairments were recorded in 2015 and 2013.
For the year ended Dec. 28, 2014, the net gain in Equity income in unconsolidated investees of $151.5 million was primarily related to a pre-tax gain of $148.4 million related to the sale of our investment in Apartments.com by Classified Ventures.
NOTE 5
Income taxes
The provision (benefit) for income taxes from continuing operations consists of the following:
In thousands of dollars | |||||||||
2015 | Current | Deferred | Total | ||||||
Federal | $ | 114,161 | $ | 76,816 | $ | 190,977 | |||
State and other | 12,795 | (2,247 | ) | 10,548 | |||||
Foreign | 1,849 | (1,060 | ) | 789 | |||||
Total | $ | 128,805 | $ | 73,509 | $ | 202,314 | |||
In thousands of dollars | |||||||||
2014 - recast | Current | Deferred | Total | ||||||
Federal | $ | 139,710 | $ | 51,245 | $ | 190,955 | |||
State and other | 23,114 | 20,232 | 43,346 | ||||||
Foreign | 1,100 | (930 | ) | 170 | |||||
Total | $ | 163,924 | $ | 70,547 | $ | 234,471 | |||
In thousands of dollars | |||||||||
2013 - recast | Current | Deferred | Total | ||||||
Federal | $ | 50,564 | $ | (28,151 | ) | $ | 22,413 | ||
State and other | (22,105 | ) | 10,562 | (11,543 | ) | ||||
Foreign | 1,000 | 1,252 | 2,252 | ||||||
Total | $ | 29,459 | $ | (16,337 | ) | $ | 13,122 | ||
The components of income from continuing operations attributable to TEGNA Inc. before income taxes consist of the following:
In thousands of dollars | |||||||||
2015 | 2014 | 2013 | |||||||
(recast) | (recast) | ||||||||
Domestic | $ | 568,534 | $ | 927,453 | $ | 63,693 | |||
Foreign | (8,762 | ) | (5,046 | ) | (9,108 | ) | |||
Total | $ | 559,772 | $ | 922,407 | $ | 54,585 | |||
46
The provision for income taxes varies from the U.S. federal statutory tax rate as a result of the following differences:
2015 | 2014 | 2013 | ||||
(recast) | (recast) | |||||
U.S. statutory tax rate | 35.0 | % | 35.0 | % | 35.0 | % |
Increase (decrease) in taxes resulting from: | ||||||
State taxes (net of federal income tax benefit) | 3.2 | 2.4 | 10.8 | |||
Effect of foreign operations | 0.5 | 0.1 | 1.5 | |||
Domestic Manufacturing Deduction | (2.0 | ) | (1.6 | ) | (3.3 | ) |
Uncertain tax positions, settlements and lapse of statutes of limitations | (0.2 | ) | (0.3 | ) | (40.3 | ) |
Net deferred tax write offs and deferred tax rate adjustments | (1.6 | ) | (0.3 | ) | (4.3 | ) |
Non-deductible transactions costs | 0.5 | 0.7 | 13.5 | |||
Loss on sale of subsidiary | — | (12.6 | ) | — | ||
Non-deductible goodwill | 0.4 | 3.0 | — | |||
Tax provision and state refund adjustments | — | — | 12.5 | |||
Other, net | 0.3 | (1.0 | ) | (0.9 | ) | |
Effective tax rate | 36.1 | % | 25.4 | % | 24.5 | % |
Deferred income taxes reflect temporary differences in the recognition of revenue and expense for tax reporting and financial statement purposes. Deferred tax liabilities and assets are adjusted for changes in tax laws or tax rates of the various tax jurisdictions as of the enacted date.
Deferred tax liabilities and assets were composed of the following at the end of Dec. 31, 2015 and Dec. 28, 2014:
In thousands of dollars | ||||||
Dec. 31, 2015 | Dec. 28, 2014 | |||||
(recast) | ||||||
Liabilities | ||||||
Accelerated depreciation | $ | 55,783 | $ | 76,435 | ||
Accelerated amortization of deductible intangibles | 663,545 | 645,096 | ||||
Partnership investments including impairments | 282,784 | 254,476 | ||||
Other | 9,057 | 18,961 | ||||
Total deferred tax liabilities | 1,011,169 | 994,968 | ||||
Assets | ||||||
Accrued compensation costs | 28,119 | 43,668 | ||||
Pension and postretirement medical and life | 73,470 | 34,568 | ||||
Loss carryforwards | 184,117 | 308,374 | ||||
Other | 26,735 | 67,494 | ||||
Total deferred tax assets | 312,441 | 454,104 | ||||
Valuation allowance | 184,413 | 140,731 | ||||
Total net deferred tax (liabilities) | $ | (883,141 | ) | $ | (681,595 | ) |
As of Dec. 31, 2015, we had approximately $343.8 million of capital loss carryforwards for federal and state purposes which can only be utilized to the extent capital gains are recognized and, if not used prior to 2020, will expire. As of Dec. 31, 2015, we also had approximately $23.1 million of state net operating loss carryovers that, if not utilized, will expire in various amounts beginning in 2016 through 2035.
Included in total deferred tax assets are valuation allowances of approximately $184.4 million as of Dec. 31, 2015 and $140.7 million as of Dec. 28, 2014, primarily related to federal and state capital losses and state net operating losses available for carry forward to future years.
The increase in the valuation allowance from 2014 to 2015 is primarily related to additional federal and state capital loss carryforwards due to the uncertainty that exists regarding their future realizability. If, in the future, we believe that it is more-likely-than-not that these deferred tax benefits will be realized, the valuation allowances will be reversed in the Consolidated Statement of Income.
Realization of deferred tax assets for which valuation allowances have not been established is dependent upon generating sufficient future taxable income. We expect to realize the benefit of these deferred tax assets through future reversals of our deferred tax liabilities, through the recognition of taxable income in the allowable carryback and carryforward periods, and through implementation of future tax planning strategies. Although realization is not assured, we believe it is more-likely-than-not that all deferred tax assets for which valuation allowances have not been established will be realized.
Tax Matters Agreement
Prior to the June 29, 2015 spin-off of our publishing businesses we entered into a Tax Matters Agreement with Gannett Co., Inc. that governs each company's respective rights, responsibilities, and obligations with respect to tax liabilities and benefits, tax attributes, tax contests and other matters regarding income taxes, non-income taxes and related tax returns. The agreement provides that we will generally indemnify Gannett Co., Inc. against taxes attributable to assets or operations for all tax periods or portions thereof prior to the spin-off date including separately-filed U.S., state, and foreign taxes and for such periods.
47
Uncertain Tax Positions
The following table summarizes the activity related to unrecognized tax benefits, excluding the federal tax benefit of state tax deductions:
In thousands of dollars | ||||||
Dec. 31, 2015 | Dec. 28, 2014 | |||||
Change in unrecognized tax benefits | ||||||
Balance at beginning of year | $ | 58,886 | $ | 57,324 | ||
Additions based on tax positions related to the current year | 6,095 | 12,426 | ||||
Additions for tax positions of prior years | 853 | 868 | ||||
Reductions for tax positions of prior years | (24,858 | ) | (4,563 | ) | ||
Settlements | — | (129 | ) | |||
Reductions for transfers to Gannett Co., Inc. | (18,804 | ) | — | |||
Reductions due to lapse of statutes of limitations | (2,681 | ) | (7,040 | ) | ||
Balance at end of year | $ | 19,491 | $ | 58,886 | ||
The total amount of unrecognized tax benefits that, if recognized, would impact the effective tax rate was $12.5 million as of Dec. 31, 2015, and $11.6 million as of Dec. 28, 2014. This amount includes the federal tax benefit of state tax deductions.
We recognize interest and penalties related to unrecognized tax benefits as a component of income tax expense. We also recognize interest income attributable to overpayment of income taxes and from the reversal of interest expense previously recorded for uncertain tax positions which are subsequently released as a component of income tax expense. We recognized income from interest and the release of penalty reserves of $0.4 million in 2015, $3.4 million in 2014, and $5.4 million in 2013. The amount of accrued interest expense and penalties payable related to unrecognized tax benefits was $1.7 million as of Dec. 31, 2015 and $2 million as of Dec. 28, 2014.
We file income tax returns in the U.S. and various state jurisdictions. The 2011 through 2015 tax years remain subject to examination by the Internal Revenue Service and state authorities. Tax years before 2011 remain subject to examination by certain states primarily due to the filing of amended tax returns as a result of the settlement of the Internal Revenue Service examination for these years and due to ongoing audits.
It is reasonably possible that the amount of unrecognized benefit with respect to certain of our unrecognized tax positions will significantly increase or decrease within the next 12 months. These changes may be the result of settlement of ongoing audits, lapses of statutes of limitations or other regulatory developments. At this time, we estimate the amount of our gross unrecognized tax positions may decrease by up to approximately $3.8 million within the next 12 months primarily due to lapses of statutes of limitations and settlement of ongoing audits in various jurisdictions.
NOTE 6
Long-term debt
Our long-term debt is summarized below:
In thousands of dollars | ||||||
Dec. 31, 2015 | Dec. 28, 2014 | |||||
Unsecured notes bearing fixed rate interest at 10% due June 2015 | $ | — | $ | 66,568 | ||
Unsecured notes bearing fixed rate interest at 6.375% due September 2015 | — | 250,000 | ||||
Unsecured floating rate term loan due quarterly through August 2018 | 83,700 | 123,200 | ||||
VIE unsecured floating rate term loans due quarterly through December 2018 | 1,938 | 33,379 | ||||
Unsecured floating rate term loan due quarterly through June 2020 | 180,000 | — | ||||
Unsecured notes bearing fixed rate interest at 10% due April 2016 | 193,429 | 193,429 | ||||
Unsecured notes bearing fixed rate interest at 7.125% due September 2018 | 70,000 | 250,000 | ||||
Unsecured notes bearing fixed rate interest at 5.125% due October 2019 | 600,000 | 600,000 | ||||
Borrowings under revolving credit agreement expiring June 2020 | 720,000 | 640,000 | ||||
Unsecured notes bearing fixed rate interest at 5.125% due July 2020 | 600,000 | 600,000 | ||||
Unsecured notes bearing fixed rate interest at 4.875% due September 2021 | 350,000 | 350,000 | ||||
Unsecured notes bearing fixed rate interest at 6.375% due October 2023 | 650,000 | 650,000 | ||||
Unsecured notes bearing fixed rate interest at 5.50% due September 2024 | 325,000 | 325,000 | ||||
Unsecured notes bearing fixed rate interest at 7.75% due June 2027 | 200,000 | 200,000 | ||||
Unsecured notes bearing fixed rate interest at 7.25% due September 2027 | 240,000 | 240,000 | ||||
Total principal long-term debt | 4,214,067 | 4,521,576 | ||||
Other (fair market value adjustments and discounts) | (12,605 | ) | (25,694 | ) | ||
Total long-term debt | 4,201,462 | 4,495,882 | ||||
Less current portion of long-term debt maturities of VIE loans | 646 | 7,854 | ||||
Long-term debt, net of current portion | $ | 4,200,816 | $ | 4,488,028 | ||
Our debt balance at year end 2015 decreased by $287 million primarily reflecting debt payments of $587 million partially offset by additional borrowings, including the new $200 million term loan mentioned below.
48
On June 29, 2015, we entered into an agreement to amend and extend our existing revolving credit facility with one expiring on June 29, 2020 (the Amended and Restated Competitive Advance and Revolving Credit Agreement). As a result, the maximum total leverage ratio permitted by the new agreement is 5.0x through June 30, 2017, after which, as amended, it is reduced to 4.75x through June 30, 2018 and then to 4.50x thereafter. Commitment fees on the revolving credit agreement are equal to 0.25% - 0.40% of the undrawn commitments, depending upon our leverage ratio, and are computed on the average daily undrawn balance under the revolving credit agreement and paid each quarter. Under the Amended and Restated Competitive Advance and Revolving Credit Agreement, we may borrow at an applicable margin above the Eurodollar base rate (LIBOR loan) or the higher of the Prime Rate, the Federal Funds Effective Rate plus 0.50%, or the one month LIBOR rate plus 1.00% (ABR loan). The applicable margin is determined based on our leverage ratio but differs between LIBOR loans and ABR loans. For LIBOR-based borrowing, the margin varies from 1.75% to 2.50%. For ABR-based borrowing, the margin will vary from 0.75% to 1.50%. On September 23, 2015, we amended the Amended and Restated Competitive Advance and Revolving Credit Agreement to add an additional lender. Total commitments under the Amended and Restated Competitive Advance and Revolving Credit Agreement are $1.4 billion. As of Dec. 31, 2015, we had unused borrowing capacity of $658 million under our revolving credit agreement.
In June 2015, we also borrowed $200 million under a new five-year term loan due in 2020 that carries a year-end 2015 principal balance of $180 million. The interest rate on the term loan is equal to the same interest rates as borrowings under the Amended and Restated Competitive Advance and Revolving Credit Agreement. Both the revolving credit agreement and the term loan are guaranteed by a majority of our wholly-owned material domestic subsidiaries.
We made an early repayment of $180 million on the 7.125% notes due in September 2018 by paying 101.781% of the outstanding principal amount in accordance with the original terms.
We also have an effective shelf registration statement on Form S-3 on file with the U.S. Securities and Exchange Commission under which an unspecified amount of securities may be issued, subject to a $7.0 billion limit established by the Board of Directors. Proceeds from the sale of such securities may be used for general corporate purposes, including capital expenditures, working capital, securities repurchase programs, repayment of debt and financing of acquisitions. We may also invest borrowed funds that are not required for other purposes in short-term marketable securities.
Our debt maturities may be repaid with cash flow from operating activities, accessing capital markets or a combination of both. The following schedule of annual maturities of the principal amount of total debt assumes we use available capacity under our revolving credit agreement to refinance unsecured floating rate term loans and fixed rate notes due in 2016 through 2018. Based on this refinancing assumption, all of the obligations other than the VIE unsecured floating rate term loan due prior to 2019 are reflected as maturities for 2019 and beyond.
In thousands of dollars | |||
2016 (1) | $ | 646 | |
2017 (1) | 646 | ||
2018 (1) | 646 | ||
2019 | 640,000 | ||
2020 (2) | 1,807,129 | ||
Thereafter | 1,765,000 | ||
Total | $ | 4,214,067 | |
(1) Maturities of principal amount of debt due in 2016 through 2018 (primarily the 10% fixed rate notes due in April 2016 and the 7.125% fixed rate notes due in September 2018) are assumed to be repaid with funds from the revolving credit agreement, which matures in 2020. Excluding our ability to repay funds with the revolving credit agreement, contractual debt maturities are $266 million, $72 million and $131 million in 2016, 2017 and 2018, respectively.
(2) Assumes current revolving credit agreement borrowings comes due in 2020 and credit facility is not extended.
49
NOTE 7
Retirement plans
We, along with our subsidiaries, have various defined benefit retirement plans, including plans established under collective bargaining agreements. Our principal retirement plan is the TEGNA Retirement Plan (TRP). The TRP is a new plan and was formed in connection with the spin-off of our publishing businesses. The TRP assumed certain assets and liabilities from the Gannett Retirement Plan, with the remaining pension obligations being retained by Gannett. The disclosure tables below include the assets and obligations of the TRP, the TEGNA Supplemental Retirement Plan (SERP) and The G. B. Dealey Retirement Pension Plan (Dealey Plan). We use a Dec. 31 measurement date convention for our retirement plans.
Substantially all participants in the TRP, Dealey Plan and SERP had their benefits frozen before 2009. The Dealey Plan merged with the TRP plan as of Dec. 31, 2015.
Our pension costs, which include costs for our qualified and non-qualified plans, are presented in the following table:
In thousands of dollars | |||||||||
2015 | 2014 | 2013 | |||||||
(recast) | (recast) | ||||||||
Service cost—benefits earned during the period | $ | 920 | $ | 812 | $ | 1,051 | |||
Interest cost on benefit obligation | 23,800 | 23,558 | 9,760 | ||||||
Expected return on plan assets | (31,464 | ) | (28,697 | ) | (9,754 | ) | |||
Amortization of prior service costs | 673 | 599 | 599 | ||||||
Amortization of actuarial loss | 6,335 | 4,003 | 6,399 | ||||||
Pension expense for company-sponsored retirement plans | 264 | 275 | 8,055 | ||||||
Settlement charge | — | — | 1,356 | ||||||
Total pension cost | $ | 264 | $ | 275 | $ | 9,411 | |||
The following table provides a reconciliation of pension benefit obligations (on a projected benefit obligation measurement basis), plan assets and funded status of company-sponsored retirement plans, along with the related amounts that are recognized in the Consolidated Balance Sheets.
In thousands of dollars | ||||||
Dec. 31, 2015 | Dec. 28, 2014 | |||||
(recast) | ||||||
Change in benefit obligations | ||||||
Benefit obligations at beginning of year | $ | 566,224 | $ | 502,068 | ||
Service cost | 920 | 812 | ||||
Interest cost | 23,800 | 23,558 | ||||
Actuarial loss (gain) | (12,514 | ) | 67,596 | |||
Gross benefits paid | (34,401 | ) | (27,810 | ) | ||
Transfers | 42,595 | — | ||||
Benefit obligations at end of year | $ | 586,624 | $ | 566,224 | ||
Change in plan assets | ||||||
Fair value of plan assets at beginning of year | $ | 387,626 | $ | 360,374 | ||
Actual return on plan assets | (725 | ) | 25,571 | |||
Employer contributions | 12,008 | 29,491 | ||||
Gross benefits paid | (34,401 | ) | (27,810 | ) | ||
Transfers | 35,685 | — | ||||
Fair value of plan assets at end of year | $ | 400,193 | $ | 387,626 | ||
Funded status at end of year | $ | (186,431 | ) | $ | (178,598 | ) |
Amounts recognized in Consolidated Balance Sheets | ||||||
Accrued benefit cost—current | $ | (7,587 | ) | $ | (6,923 | ) |
Accrued benefit cost—noncurrent | $ | (178,844 | ) | $ | (171,675 | ) |
The funded status (on a projected benefit obligation basis)
of our principal retirement plans at Dec. 31, 2015, is as
follows:
In thousands of dollars | |||||||||
Fair Value of Plan Assets | Benefit Obligation | Funded Status | |||||||
GRP | $ | 155,103 | $ | 197,219 | $ | (42,116 | ) | ||
SERP (a) | — | 87,679 | (87,679 | ) | |||||
Dealey | 245,090 | 301,060 | (55,970 | ) | |||||
All other | — | 666 | (666 | ) | |||||
Total | $ | 400,193 | $ | 586,624 | $ | (186,431 | ) | ||
(a) The SERP is an unfunded, unsecured liability
The accumulated benefit obligation for all defined benefit pension plans was $576.3 million at Dec. 31, 2015, and $558.8 million at Dec. 28, 2014.
50
The following table presents information for our retirement plans for which accumulated benefits exceed assets:
In thousands of dollars | ||||||
Dec. 31, 2015 | Dec. 28, 2014 | |||||
(recast) | ||||||
Accumulated benefit obligation | $ | 576,333 | $ | 558,824 | ||
Fair value of plan assets | $ | 400,193 | $ | 387,626 | ||
The following table presents information for our retirement plans for which projected benefit obligations exceed assets:
In thousands of dollars | ||||||
Dec. 31, 2015 | Dec. 28, 2014 | |||||
(recast) | ||||||
Projected benefit obligation | $ | 586,624 | $ | 566,224 | ||
Fair value of plan assets | $ | 400,193 | $ | 387,626 | ||
The following table summarizes the amounts recorded in accumulated other comprehensive income (loss) that have not yet been recognized as a component of pension expense as of the dates presented (pre-tax):
In thousands of dollars | ||||||
Dec. 31, 2015 | Dec. 28, 2014 | |||||
(recast) | ||||||
Net actuarial losses | $ | (184,808 | ) | $ | (148,210 | ) |
Prior service cost | (3,367 | ) | (3,126 | ) | ||
Amounts in accumulated other comprehensive income (loss) | $ | (188,175 | ) | $ | (151,336 | ) |
The actuarial loss amounts expected to be amortized from accumulated other comprehensive income (loss) into net periodic benefit cost in 2016 are $6.8 million. The prior service cost amounts expected to be amortized from accumulated other comprehensive income (loss) into net periodic benefit cost in 2016 are $0.7 million.
Other changes in plan assets and benefit obligations recognized in other comprehensive income (loss) consist of the following for continuing operations only:
In thousands of dollars | |||
2015 | |||
Current year actuarial loss | $ | (43,821 | ) |
Amortization of previously deferred actuarial loss | 6,335 | ||
Amortization of previously deferred prior service costs | 673 | ||
Total | $ | (36,813 | ) |
Pension costs: The following assumptions were used to determine net pension costs:
2015 | 2014 | 2013 | |
(recast) | (recast) | ||
Discount rate | 4.19% | 4.84% | 3.89% |
Expected return on plan assets | 8.00% | 8.00% | 8.25% |
Rate of compensation increase | 3.00% | 3.00% | 3.00% |
The expected return on plan assets assumption was determined based on plan asset allocations, a review of historic capital market performance, historical plan asset performance and a forecast of expected future plan asset returns.
Benefit obligations and funded status: The following assumptions were used to determine the year-end benefit obligations:
Dec. 31, 2015 | Dec. 28, 2014 | |
(recast) | ||
Discount rate | 4.46% | 4.12% |
Rate of compensation increase | 3.00% | 3.00% |
Plan assets: The asset allocation for the TRP at the end of 2015 and 2014, and target allocations for 2016, by asset category, are presented in the table below:
Target Allocation | Allocation of Plan Assets | |||||
2016 | 2015 | 2014 | ||||
Equity securities | 60 | % | 58 | % | 65 | % |
Debt securities | 25 | 35 | 20 | |||
Other | 15 | 7 | 15 | |||
Total | 100 | % | 100 | % | 100 | % |
The primary objective of company-sponsored retirement plans is to provide eligible employees with scheduled pension benefits. Consistent with prudent standards for preservation of capital and maintenance of liquidity, the goal is to earn the highest possible total rate of return while minimizing risk. The principle means of reducing volatility and exercising prudent investment judgment is diversification by asset class and by investment manager; consequently, portfolios are constructed to attain prudent diversification in the total portfolio, each asset class, and within each individual investment manager’s portfolio. Investment diversification is consistent with the intent to minimize the risk of large losses. All objectives are based upon an investment horizon spanning five years so that interim market fluctuations can be viewed with the appropriate perspective. The target asset allocation represents the long-term perspective. Retirement plan assets will be rebalanced periodically to align them with the target asset allocations. Risk characteristics are measured and compared with an appropriate benchmark quarterly; periodic reviews are made of the investment objectives and the investment managers. Our actual investment return on our TRP and Dealey Plan assets was 1.0% for 2015, 8.2% for 2014 and 15.7% for 2013.
Retirement plan assets do not include shares of our common stock at the end of 2015. At the end of 2014, our portion of retirement plan assets held 78,000 shares valued at $2.6 million.
Cash flows: We estimate we will make the following benefit payments (from either retirement plan assets or directly from our funds), which reflect expected future employee service, as appropriate:
In thousands of dollars | |||
2016 | $ | 36,409 | |
2017 | $ | 42,097 | |
2018 | $ | 39,359 | |
2019 | $ | 40,416 | |
2020 | $ | 40,457 | |
2021-2025 | $ | 198,272 | |
51
401(k) savings plan
Substantially all our employees (other than those covered by a collective bargaining agreement) are eligible to participate in our principal defined contribution plan, The TEGNA Inc. 401(k) Savings Plan. Employees can elect to save up to 50% of compensation on a pre-tax basis subject to certain limits.
For most participants, the plan’s matching formula is 100% of the first 5% of employee contributions. We also make additional employer contributions on behalf of certain long-term employees. Compensation expense related to 401(k) contributions was $18.2 million in 2015, $19.3 million in 2014 and $15.0 million in 2013. We settled the 401(k) employee company stock match obligation by buying our stock in the open market and depositing it in the participants’ accounts.
Multi-employer plans that provide pension benefits: We contribute to a multi-employer defined benefit pension plan under the terms of collective-bargaining agreements (CBA) that cover our union-represented employees. The risks of participating in this multi-employer plan are different from single-employer plans in the following aspects:
• | We play no part in the management of plan investments or any other aspect of plan administration. |
• | Assets contributed to the multi-employer plan by one employer may be used to provide benefits to employees of other participating employers. |
• | If a participating employer stops contributing to the plan, the unfunded obligations of the plan may be borne by the remaining participating employers. |
• | If we choose to stop participating in some of our multi-employer plans, we may be required to pay those plans an amount based on the unfunded status of the plan, referred to as withdrawal liability. |
Our participation in this plan for the annual period ended Dec. 31, 2015, is outlined in the table below. The “EIN/Pension Plan Number” column provides the Employee Identification Number (EIN) and the three-digit plan number. The zone status is based on information that we received from the plan and is certified by the plan’s actuary. Among other factors, plans in the red zone are generally less than 65% funded; plans in the orange zone are both a) less than 80% funded and b) have an accumulated/expected funding deficiency in any of the next six plan years, net of any amortization extensions; plans in the yellow zone meet either one of the criteria mentioned in the orange zone; and plans in the green zone are at least 80% funded. The “FIP/RP Status Pending/Implemented” column indicates plans for which a financial improvement plan (FIP) or a rehabilitation plan (RP) is either pending or has been implemented. The last column lists the expiration date(s) of the collective-bargaining agreement(s) to which the plans are subject.
We make all required contributions to these plans as determined under the respective CBAs. Our contribution to the AFTRA Retirement Plan represented less than 5% of total contributions to the plan. This calculation is based on the plan financial statements issued at the end of December 31, 2014. At the date we issue our financial statements, Forms 5500 were unavailable for the plan years ending after December 31, 2014.
We incurred no expenses for multi-employer withdrawal liabilities for all periods presented below.
Multi-employer Pension Plans | |||||||||||||||
EIN Number/ | Zone Status Dec. 31, | FIP/RP Status Pending/Implemented | Contributions(in thousands) | Surcharge Imposed | Expiration Dates of CBAs | ||||||||||
Pension Plan Name | Plan Number | 2015 | 2014 | 2015 | 2014 | 2013 | |||||||||
AFTRA Retirement Plan (a) | 13-6414972/001 | Green as of Nov. 30, 2014 | Green as of Nov. 30, 2013 | NA | $ | 1,104 | $ | 973 | $ | 988 | NA | 9/11/2015 4/16/2017 1/27/2018 | |||
(a) This plan has elected to utilize special amortization provisions provided under the Preservation of Access to Care for Medicare Beneficiaries and Pension Relief Act of 2010.
52
NOTE 8
Fair value measurement
We measure and record certain assets and liabilities at fair value in the accompanying consolidated financial statements. ASC Topic 820, “Fair Value Measurement,” establishes a fair value hierarchy for those instruments measured at fair value that distinguishes between assumptions based on market data (observable inputs) and our own assumptions (unobservable inputs). The hierarchy consists of three levels:
Level 1 – Quoted market prices in active markets for identical assets or liabilities;
Level 2 – Inputs other than Level 1 inputs that are either directly or indirectly observable; and
Level 3 – Unobservable inputs developed using our own estimates and assumptions, which reflect those that a market participant would use.
The financial instruments measured at fair value in the accompanying Consolidated Balance Sheets consist of the following:
Company Owned Assets | ||||||||||||
In thousands of dollars | ||||||||||||
Fair value measurement as of Dec. 31, 2015 | ||||||||||||
Level 1 | Level 2 | Level 3 | Total | |||||||||
Assets: | ||||||||||||
Deferred compensation investments | $ | 77,199 | $ | — | $ | — | $ | 77,199 | ||||
Available for sale investment | 28,090 | — | — | 28,090 | ||||||||
Total Assets | $ | 105,289 | $ | — | $ | — | $ | 105,289 | ||||
In thousands of dollars | ||||||||||||
Fair value measurement as of Dec. 28, 2014 | ||||||||||||
Level 1 | Level 2 | Level 3 | Total | |||||||||
Assets: | ||||||||||||
Deferred compensation investments | $ | 65,950 | $ | — | $ | — | $ | 65,950 | ||||
Total Assets | $ | 65,950 | $ | — | $ | — | $ | 65,950 | ||||
Liabilities: | ||||||||||||
Contingent consideration payable | $ | — | $ | — | $ | 8,936 | $ | 8,936 | ||||
Total Liabilities | $ | — | $ | — | $ | 8,936 | $ | 8,936 | ||||
Deferred compensation investments of $77.2 million as of Dec. 31, 2015 and $66.0 million as of Dec. 28, 2014 consist of securities which are traded on public exchanges, therefore, they are classified as Level 1 assets. The available for sale investment is our 1.5% holding of Gannett's outstanding shares, which has been classified as a Level 1 asset as the shares are listed on the New York Stock Exchange. In 2014, we had $8.9 million of liabilities relating to certain acquisition agreements where we have agreed to pay the sellers earn-outs based on the financial performance of the acquired businesses. The contingent consideration payable as of Dec. 28, 2014, represented the estimated fair value of future earn-outs payable under such agreements, and was substantially paid in 2015.
In addition to the financial instruments listed in the table above, we hold other financial instruments, including cash and cash equivalents, receivables, accounts payable and debt. The carrying amounts for cash and cash equivalents, receivables and accounts payable approximated their fair values. The fair value of our total long-term debt, determined based on the bid and ask quotes for the related debt (Level 2), totaled $4.31 billion at Dec. 31, 2015 and $4.65 billion at Dec. 28, 2014.
In 2015, 2014 and 2013, we recorded non-cash goodwill impairment charges of $8.0 million, $30.3 million and $8.4 million in connection with our interim and annual goodwill impairment test. The fair value determination of goodwill was determined using a combination of a DCF analysis and market-based valuation methodologies and was classified as a Level 3 fair value measurement due to the significance of the unobservable inputs used. See Note 1 and 11 for further information on the non-cash goodwill impairment charges and our valuation methodologies.
The following tables set forth the fair values of our pension plans assets by level within the fair value hierarchy:
Pension Plan Assets/Liabilities | ||||||||||||
In thousands of dollars | ||||||||||||
Fair value measurement as of Dec. 31, 2015 | ||||||||||||
Level 1 | Level 2 | Level 3 | Total | |||||||||
Assets: | ||||||||||||
Cash and other | $ | 1,098 | $ | — | $ | — | $ | 1,098 | ||||
Corporate stock | 58,291 | — | — | 58,291 | ||||||||
Corporate bonds | — | 99 | — | 99 | ||||||||
Interest in common/collective trusts: | ||||||||||||
Equities | — | 172,046 | — | 172,046 | ||||||||
Fixed income | — | 135,914 | — | 135,914 | ||||||||
Interest in reg. invest. companies | 6,659 | — | — | 6,659 | ||||||||
Partnership/joint venture interests | 2,432 | 9,364 | 11,796 | |||||||||
Hedge funds | — | — | 14,290 | 14,290 | ||||||||
Total net fair value of plan assets | $ | 66,048 | $ | 310,491 | $ | 23,654 | $ | 400,193 | ||||
53
In thousands of dollars | ||||||||||||
Fair value measurement as of Dec. 28, 2014(a) | ||||||||||||
Level 1 | Level 2 | Level 3 | Total | |||||||||
Assets: | ||||||||||||
Cash and other | $ | 5,493 | $ | 218 | $ | — | $ | 5,711 | ||||
Corporate stock | 57,875 | — | — | 57,875 | ||||||||
Fixed income: | ||||||||||||
U.S. government-related securities | — | 260 | — | 260 | ||||||||
Mortgage backed securities | — | 260 | 6 | 266 | ||||||||
Other government bonds | — | 296 | — | 296 | ||||||||
Corporate bonds | — | 1,601 | 25 | 1,626 | ||||||||
Interest in common/collective trusts: | ||||||||||||
Equities | — | 196,924 | — | 196,924 | ||||||||
Fixed income | — | 93,400 | — | 93,400 | ||||||||
Interest in reg. invest. companies | 8,199 | — | — | 8,199 | ||||||||
Interest in 103-12 investments | — | 1,583 | — | 1,583 | ||||||||
Partnership/joint venture interests | — | 2,374 | 7,615 | 9,989 | ||||||||
Hedge funds | — | — | 11,589 | 11,589 | ||||||||
Derivative contracts | 8 | 173 | 8 | 189 | ||||||||
Total | $ | 71,575 | $ | 297,089 | $ | 19,243 | $ | 387,907 | ||||
Liabilities: | ||||||||||||
Derivative liabilities | $ | (8 | ) | $ | (142 | ) | $ | (131 | ) | $ | (281 | ) |
Total net fair value of plan assets | $ | 71,567 | $ | 296,947 | $ | 19,112 | $ | 387,626 | ||||
(a) | We use a Dec. 31 measurement date for our retirement plans. |
Valuation methodologies used for assets and liabilities measured at fair value are as follows:
Corporate stock classified as Level 1 is valued primarily at the closing price reported on the active market on which the individual securities are traded. The investments in Level 2 are primarily commingled funds recorded at fair value as determined by the sponsor of the respective funds based upon closing market quotes of the underlying assets.
U.S. government-related securities are treasury bonds, bills and notes that are primarily obligations of the U.S. Treasury. Values are obtained from industry vendors who use various pricing models or quotes for identical or similar securities. Mortgage-backed securities are typically not actively quoted. Values are obtained from industry vendors who use various pricing models or use quotes for identical or similar securities.
Other government and corporate bonds are mainly valued based on institutional bid evaluations using proprietary models, using discounted cash flow models or models that derive prices based on similar securities. Corporate bonds categorized in Level 3 are primarily from distressed issuers for whom the values represent an estimate of recovery in a potential or actual bankruptcy situation.
Interest in common/collective trusts are valued using the net asset value as provided monthly by the fund family or fund company. Shares in the common/collective trusts are generally redeemable upon request.
Fifteen of the investments in collective trusts are fixed income funds, one of which uses individual subfunds to efficiently add a representative sample of securities in individual market sectors to the portfolio. The remaining eleven investments in collective trusts are equity funds that are recorded at fair value as determined by the sponsor of the respective fund based upon closing market quotes of the underlying assets.
Interest in registered investment companies is valued using the published net asset values as quoted through publicly available pricing sources. The investments in Level 2 are proprietary funds of the individual fund managers and are not publicly quoted.
Pension plan assets include one Level 3 partnership as of Dec. 31, 2015 which is a real estate fund. Investments in partnerships and joint venture interests classified in Level 3 are valued based on an assessment of each underlying investment, considering items such as expected cash flows, changes in market outlook and subsequent rounds of financing. These investments are included in Level 3 of the fair value hierarchy because exit prices tend to be unobservable and reliance is placed on the above methods. Interest in partnership investments could be sold on the secondary market but cannot be redeemed. Instead, distributions are received as the underlying assets of the funds are liquidated. It is estimated that the underlying assets of the funds will be liquidated within approximately the next 8 to 10 years. There are future funding commitments of $1.0 million as of Dec. 31, 2015, and $1.5 million as of Dec. 28, 2014. Investments in partnerships and joint venture interests classified as Level 2 represents a limited partnership commingled fund valued using the net asset value as reported by the fund manager.
As of Dec. 31, 2015, pension plan assets include one Level 3 hedge fund which is a fund of hedge funds whose objective is to produce a return that is uncorrelated with market movements. Investments in hedge funds are valued at the net asset value as reported by the fund managers. Shares in the hedge funds are generally redeemable twice a year or on the last business day of each quarter with at least 60 days written notice subject to a potential 5% holdback. There are no unfunded commitments related to the hedge funds.
Derivatives primarily consist of forward and swap contracts. Forward contracts are valued at the spot rate, plus or minus forward points between the valuation date and maturity date. Swaps are valued at the mid-evaluation price using discounted cash flow models. Items in Level 3 are valued based on the market values of other securities for which they represent a synthetic combination.
We review audited financial statements and additional investor information to evaluate fair value estimates from our investment managers or fund administrator.
As of Dec. 31, 2015, our pension plan held Level 3 assets with a fair value of $23.7 million which consisted of an investment in a fund of hedge funds and an investment in a partnership. As of Dec. 28, 2014, our pension plans held Level 3 assets with a fair value of $19.1 million consisting primarily of investments in partnerships and hedge funds. There were no material gains/loss, purchases, or settlements during fiscal year 2015 and 2014. In addition, there were no transfers to/from Level 3 for the year ended Dec. 31, 2015 and Dec. 28, 2014. Our policy is to recognize transfers between levels at the beginning of the reporting period.
54
NOTE 9
Shareholders’ equity
At Dec. 31, 2015 and Dec. 28, 2014, our authorized capital was comprised of 800 million shares of common stock and 2 million shares of preferred stock. At Dec. 31, 2015 shareholders’ equity of TEGNA included 220 million shares that were outstanding (net of 105 million shares of common stock held in treasury). At Dec. 28, 2014 shareholders’ equity of TEGNA included 227 million shares that were outstanding (net of 98 million shares of common stock held in treasury). No shares of preferred stock were issued and outstanding at Dec. 31, 2015 or Dec. 28, 2014.
Capital stock and earnings per share
We report earnings per share on two bases, basic and diluted. All basic income per share amounts are based on the weighted average number of common shares outstanding during the year. The calculation of diluted earnings per share also considers the assumed dilution from the exercise of stock options and from performance shares and restricted stock units.
Our earnings per share (basic and diluted) for 2015, 2014, and 2013 are presented below:
In thousands, except per share amounts | |||||||||
2015 | 2014 | 2013 | |||||||
Income from continuing operations attributable to TEGNA Inc. | $ | 357,458 | $ | 687,936 | $ | 41,463 | |||
Income from discontinued operations, net of tax | 102,064 | 374,235 | 347,217 | ||||||
Net income attributable to TEGNA Inc. | $ | 459,522 | $ | 1,062,171 | $ | 388,680 | |||
Weighted average number of common shares outstanding - basic | 224,688 | 226,292 | 228,541 | ||||||
Effect of dilutive securities | |||||||||
Restricted stock | 2,236 | 2,624 | 2,839 | ||||||
PSUs | 1,867 | 1,999 | 1,649 | ||||||
Stock options | 930 | 992 | 1,160 | ||||||
Weighted average number of common shares outstanding - diluted | 229,721 | 231,907 | 234,189 | ||||||
Earnings from continuing operations per share - basic | $ | 1.59 | $ | 3.04 | $ | 0.18 | |||
Earnings from discontinued operations per share - basic | 0.45 | 1.65 | 1.52 | ||||||
Earnings per share - basic | $ | 2.04 | $ | 4.69 | $ | 1.70 | |||
Earnings from continuing operations per share - diluted | $ | 1.56 | $ | 2.97 | $ | 0.18 | |||
Earnings from discontinued operations per share - diluted | 0.44 | 1.61 | 1.48 | ||||||
Earnings per share - diluted | $ | 2.00 | $ | 4.58 | $ | 1.66 | |||
The diluted earnings per share amounts exclude the effects of approximately 0.2 million stock options outstanding for 2015, 0.8 million for 2014 and 2.4 million for 2013, as their inclusion would be anti-dilutive.
Share repurchase program
In June 2015, our Board of Directors approved a $750 million share repurchase program to be completed over a three-year period beginning June 29, 2015. On Oct. 20, 2015, our Board of Directors approved a $75 million increase to the share repurchase program, bringing the total authorized amount to $825 million. During 2015, 9.6 million shares were purchased under the current and former programs for $271.0 million. In 2014, 2.7 million shares were purchased under the former program for $75.8 million and in 2013, 4.9 million shares were purchased for $116.6 million. Repurchased shares are included in the Consolidated Balance Sheets as Treasury Stock. As of Dec. 31, 2015, the value of shares that may be repurchased under the existing program is $629.1 million.
The shares may be repurchased at management’s discretion, either in the open market or in privately negotiated block transactions. Management’s decision to repurchase shares will depend on price and other corporate developments. Purchases may occur from time to time and no maximum purchase price has been set. Certain of the shares we previously acquired have been reissued in settlement of employee stock awards.
Stock-Based Compensation Plans
In May 2001, our shareholders approved the adoption of the Omnibus Incentive Compensation Plan (the Plan). The Plan is administered by the Executive Compensation Committee of the Board of Directors and was amended and restated as of May 4, 2010, to increase the number of shares reserved for issuance to up to 60.0 million shares of our common stock for awards granted on or after the amendment date. The Plan provides for the granting of stock options, stock appreciation rights, restricted stock, restricted stock units, performance shares and other equity-based and cash-based awards. Awards may be granted to our employees and members of the Board of Directors. The Plan provides that shares of common stock subject to awards granted become available again for issuance if such awards are canceled or forfeited.
In 2011, we established a performance share award plan for senior executives pursuant to which awards were first made with a grant date of Jan. 1, 2012. Pursuant to the terms of this award, we may issue shares of our common stock (Performance Shares) to senior executives following the completion of a three-year period beginning on the grant date. Generally, if an executive remains in continuous employment with us during the full three-year incentive period, the number of performance share units (PSU) that an executive will receive will be determined based upon how our total shareholder return (TSR) compares to the TSR of a peer group of companies during the three-year period.
We recognize the grant date fair value of each PSU, less estimated forfeitures, as compensation expense ratably over the incentive period. Fair value is determined by using a Monte Carlo valuation model. Each PSU is equal to and paid in one share of our common stock, but carries no voting or dividend rights. The number of shares ultimately issued for each PSU award may range from 0% to 200% of the award’s target.
55
We also issue stock-based compensation to employees in the form of restricted stock units (RSUs). These awards generally entitle employees to receive at the end of a four-year incentive period one share of common stock for each RSU granted, conditioned on continued employment for the full incentive period. For RSU grants after 2014, the grants generally vest 25% per year. Under the plan, no more than 500,000 RSUs may be granted to any participant in any fiscal year. Employees who are granted RSUs have the right to receive shares of stock after completion of the incentive period; however, the RSUs do not pay dividends or carry voting rights during the incentive period. RSUs are valued based on the fair value of our common stock on the date of grant less the present value of the expected dividends not received during the relevant incentive period. The fair value of the RSU, less estimated forfeitures, is recognized as compensation expense ratably over the incentive period. We generally grant both RSUs and PSUs to employees on January 1.
The Plan also permits us to issue restricted stock. Restricted Stock is an award of common stock that is subject to restrictions and such other terms and conditions as the Executive Compensation Committee determines. Under the Plan, no more than 500,000 restricted shares may be granted to any participant in any fiscal year.
Determining fair value of PSUs
Valuation and amortization method – We determined the fair value of Performance Shares using the Monte Carlo valuation model. This model considers our likelihood, and the likelihood of our peer group companies’, share prices ending at various levels subject to certain price caps at the conclusion of the three-year incentive period. Key inputs into the Monte Carlo valuation model include expected term, expected volatility, risk-free interest rate and expected dividend yield. Each assumption is discussed below.
Expected term – The expected term represents the period that our stock-based awards are expected to be outstanding. The expected term for Performance Share awards is based on the incentive period.
Expected volatility – The fair value of stock-based awards reflects volatility factors calculated using historical market data for our common stock and also our peer group when the Monte Carlo method is used. The time frame used is equal to the expected term.
Risk-free interest rate – We base the risk-free interest rate on the yield to maturity at the time of the award grant on zero-coupon U.S. government bonds having a remaining life equal to the award’s expected life.
Expected dividend – The dividend assumption is based on our expectations about our dividend policy on the date of grant.
Estimated forfeitures – When estimating forfeitures, we consider voluntary termination behavior as well as analysis of actual forfeitures.
The following assumptions were used to estimate the fair value of performance share awards:
PSUs Granted During | 2015 | 2014 | 2013 |
Expected term | 3 yrs. | 3 yrs. | 3 yrs. |
Expected volatility | 32.00% | 39.32% | 40.80% |
Risk-free interest rate | 1.10% | 0.78% | 0.36% |
Expected dividend yield | 2.51% | 2.70% | 4.44% |
Impact from Publishing Spin on Equity Awards: In connection with the spin-off of our publishing businesses, and in accordance with our equity award Plan, the number of stock options, RSUs and target PSUs outstanding (collectively, stock awards) on June 29, 2015 (the Distribution Date), and the exercise prices of such stock options were adjusted with the intention of preserving the intrinsic value of the awards prior to the separation. Employees with outstanding stock awards granted prior to 2015, received one share of an equivalent Gannett stock award for every two shares of TEGNA stock award outstanding. For RSUs and PSUs granted in 2015 but prior to the Distribution Date, adjustments were determined by comparing the fair value of such awards immediately prior to the spin-off, to the fair value of such awards immediately after (the Adjustments).
Accordingly, each stock award granted in 2015 and outstanding as of the Distribution Date was increased by multiplying the size of such award by a factor of 1.18. The Adjustments resulted in an aggregate increase of approximately 125,000 equity awards (comprised of 75 thousand RSUs and 50 thousand target PSU’s) and are included in the line item “Adjustment due to spin-off of Publishing” in the tables that follow. These adjustments to our stock-based compensation awards did not have a material impact on compensation expense.
Stock-based Compensation Expense: The following table shows the stock-based compensation related amounts recognized in the Consolidated Statements of Income for equity awards:
In thousands, except per share amounts | |||||||||
2015 | 2014 | 2013 | |||||||
(recast) | (recast) | ||||||||
Restricted stock and RSUs | $ | 8,438 | $ | 8,604 | $ | 8,065 | |||
PSUs | 10,363 | 7,517 | 7,400 | ||||||
Stock options | 857 | 662 | 1,771 | ||||||
Total stock-based compensation | 19,658 | 16,783 | 17,236 | ||||||
Income tax benefit | 7,643 | 6,243 | 6,477 | ||||||
Stock-based compensation, net of tax | $ | 12,015 | $ | 10,540 | $ | 10,759 | |||
Per diluted share impact | $ | 0.05 | $ | 0.05 | $ | 0.05 | |||
56
Restricted Stock and RSUs: As of Dec. 31, 2015, there was $15.5 million of unrecognized compensation cost related to non-vested restricted stock and RSUs. This amount will be adjusted for future changes in estimated forfeitures and recognized on a straight-line basis over a weighted average period of 2.4 years. The tax benefit realized from the settlement of RSUs was $5.9 million in 2015, $9.5 million in 2014 and $7.0 million in 2013.
A summary of restricted stock and RSU awards is presented below:
2015 Restricted Stock and RSU Activity | Shares | Weighted average fair value | |||
Unvested at beginning of year | 3,577,598 | $ | 16.97 | ||
Granted | 491,690 | $ | 31.78 | ||
Settled | (1,485,735 | ) | $ | 14.66 | |
Canceled | (532,524 | ) | $ | 19.28 | |
Adjustment due to spin-off of Publishing (a) | 75,497 | ||||
Unvested at end of year (a) | 2,126,526 | $ | 21.55 | ||
(a) The weighted-average grant date fair value of the RSUs included in the line item “Adjustment due to spin-off of publishing" is equal to the weighted-average grant date fair value of the awards at their respective grant date divided by a factor of approximately 1.18. The weighted-average grant date fair value of the unvested RSUs as of Dec. 31, 2015 reflect the adjustment.
2014 Restricted Stock and RSU Activity | Shares | Weighted average fair value | |||
Unvested at beginning of year | 4,193,985 | $ | 13.92 | ||
Granted | 1,048,516 | $ | 27.26 | ||
Settled | (1,263,702 | ) | $ | 15.92 | |
Canceled | (401,201 | ) | $ | 16.13 | |
Unvested at end of year | 3,577,598 | $ | 16.97 | ||
2013 Restricted Stock and RSU Activity | Shares | Weighted average fair value | |||
Unvested at beginning of year | 4,069,509 | $ | 12.98 | ||
Granted | 1,588,628 | $ | 15.80 | ||
Settled | (1,035,256 | ) | $ | 13.95 | |
Canceled | (428,896 | ) | $ | 13.40 | |
Unvested at end of year | 4,193,985 | $ | 13.92 | ||
PSUs: As of Dec. 31, 2015, there was $3.9 million of unrecognized compensation cost related to non-vested performance shares. This amount will be adjusted for future changes in estimated forfeitures and recognized over a weighted average period of 1.7 years. The tax benefit realized from the settlement of PSUs was $11.2 million in 2015.
A summary of our performance shares awards is presented below:
2015 PSUs Activity | Target number of shares | Weighted average fair value | |||
Unvested at beginning of year | 2,100,115 | $ | 20.95 | ||
Granted | 285,458 | $ | 39.47 | ||
Settled | (925,640 | ) | $ | 14.23 | |
Canceled | (123,621 | ) | $ | 29.84 | |
Adjustment due to spin-off of Publishing (a) | 49,628 | ||||
Unvested at end of year (a) | 1,385,940 | $ | 29.21 | ||
(a) The weighted-average grant date fair value of the PSUs included in the line item “Adjustment due to spin-off of publishing" is equal to the weighted-average grant date fair value of the awards at their respective grant date divided by a factor of approximately 1.18. The weighted-average grant date fair value of the unvested PSUs as of December 31, 2015 reflect the adjustment.
2014 PSUs Activity | Target number of shares | Weighted average fair value | |||
Unvested at beginning of year | 1,760,488 | $ | 16.92 | ||
Granted | 436,340 | $ | 37.31 | ||
Canceled | (96,713 | ) | $ | 21.41 | |
Unvested at end of year | 2,100,115 | $ | 20.95 | ||
2013 PSUs Activity | Target number of shares | Weighted average fair value | |||
Unvested at beginning of year | 982,452 | $ | 14.23 | ||
Granted | 813,783 | $ | 20.12 | ||
Canceled | (35,747 | ) | $ | 15.86 | |
Unvested at end of year | 1,760,488 | $ | 16.92 | ||
57
Stock Options: We generally recognize compensation cost for stock options ratably over the four-year incentive period. At Dec. 31, 2015 and Dec. 28, 2014, there were 1.7 million (weighted average exercise price of $16.61) and 2.8 million (weighted average exercise price of $22.23) stock options outstanding. Stock options outstanding at Dec. 31, 2015 have a weighted average remaining contractual life of approximately 2.36 years and an aggregate intrinsic value of $16.4 million. All outstanding employee stock options have vested as of Dec. 31 2015.
There were 1.0 million (weighted average exercise price of $14.47) stock options exercised during 2014. The tax benefit realized from the stock options exercised was $3.3 million in 2015, $3 million in 2014, and $2.8 million in 2013. We did not grant stock options to employees during 2015 and 2014. The following table pertains to stock options granted in 2013, in addition to stock options that were exercised in 2015, 2014 and 2013 (in thousands, except for weighted-average grant-date fair value of stock options granted):
In thousands, except per share amounts | |||||||||
2015 | 2014 | 2013 | |||||||
Per share weighted average grant-date fair value of stock options granted | $ | — | $ | — | $ | 8.20 | |||
Grant-date fair value of all stock options that vested | 962 | 5,958 | 8,642 | ||||||
Intrinsic value of all stock options exercised | 11,378 | 15,003 | 16,675 | ||||||
In 2013, we estimated the fair value for stock options at the date of grant using the Black-Scholes option pricing model, which required us to make certain assumptions. We used the following weighted average assumptions in the model: risk-free interest rate of 0.75%, dividend yield of 3.00%, weighted average volatility factor of 61.94% and an expected option life of 4.5 years.
Accumulated other comprehensive income (loss)
The elements of our Accumulated Other Comprehensive Loss (AOCL) principally consisted of pension, retiree medical and life insurance liabilities and foreign currency translation gains. The following tables summarize the components of, and changes in, AOCL (net of tax and noncontrolling interests):
In thousands of dollars | ||||||||||||
2015 | Retirement Plans | Foreign Currency Translation | Other | Total | ||||||||
Balance at beginning of year | $ | (1,172,245 | ) | $ | 391,113 | $ | 2,363 | $ | (778,769 | ) | ||
Other comprehensive income before reclassifications | 23,094 | (1,966 | ) | 3,311 | 24,439 | |||||||
Spin-off publishing businesses | 1,012,745 | (409,276 | ) | — | 603,469 | |||||||
Amounts reclassified from AOCL | 19,910 | — | — | 19,910 | ||||||||
Balance at end of year | $ | (116,496 | ) | $ | (20,129 | ) | $ | 5,674 | $ | (130,951 | ) | |
In thousands of dollars | ||||||||||||
2014 | Retirement Plans | Foreign Currency Translation | Other | Total | ||||||||
Balance at beginning of year | $ | (923,595 | ) | $ | 427,177 | $ | 2,363 | $ | (494,055 | ) | ||
Other comprehensive income (loss) | (276,219 | ) | (36,064 | ) | — | (312,283 | ) | |||||
Amounts reclassified from AOCL | 27,569 | — | — | 27,569 | ||||||||
Balance at end of year | $ | (1,172,245 | ) | $ | 391,113 | $ | 2,363 | $ | (778,769 | ) | ||
In thousands of dollars | ||||||||||||
2013 | Retirement Plans | Foreign Currency Translation | Other | Total | ||||||||
Balance at beginning of year | $ | (1,119,263 | ) | $ | 418,122 | $ | — | $ | (701,141 | ) | ||
Other comprehensive income (loss) | 154,611 | 9,055 | 2,363 | 166,029 | ||||||||
Amounts reclassified from AOCL | 41,057 | — | — | 41,057 | ||||||||
Balance at end of year | $ | (923,595 | ) | $ | 427,177 | $ | 2,363 | $ | (494,055 | ) | ||
AOCL components are included in the computation of net periodic postretirement costs (see Note 7 for more detail). Reclassifications out of AOCL related to the retirement plans include the following:
In thousands of dollars | ||||||
2015 | 2014 | |||||
Amortization of prior service cost (credit) | $ | 1,176 | $ | (4,082 | ) | |
Amortization of actuarial loss | 31,357 | 46,489 | ||||
Total reclassifications, before tax | 32,533 | 42,407 | ||||
Income tax effect | (12,623 | ) | (14,838 | ) | ||
Total reclassifications, net of tax | $ | 19,910 | $ | 27,569 | ||
58
NOTE 10
Business operations and segment information
We classify our operations into two reportable segments: Media: consisting of 46 television stations operating in 38 markets, offering high-quality television programming and digital content; and Digital: primarily consisting of our Cars.com and CareerBuilder business units which operate in the automotive and human capital solutions industries. Our reportable segments have been determined based on management and internal reporting structure, the nature of products and services offered by the segments, and the financial information that is evaluated regularly by our chief operating decision maker.
The Digital Segment and the digital revenues line exclude online/digital revenues generated by digital platforms that are associated with our Media Segment's operating properties as such amounts are reflected in the Media Segment.
We generate most of our sales from work performed in the U.S. Our Digital Segment, principally from the CareerBuilder business unit, also generates sales from international operations. International sales totaled approximately $76.0 million in 2015, $75.8 million in 2014 and $62.3 million in 2013. Our long-lived assets in international countries totaled approximately $213.8 million at Dec. 31, 2015 and $205.0 million at Dec. 28, 2014.
Separate financial data for each of our business segments is presented in the table that follows. The accounting policies of the segments are those described in Note 1. We evaluate the performance of our segments based on operating income. Operating income represents total revenue less operating expenses, including depreciation, amortization of intangibles and facility consolidation and asset impairment charges. Operating income by reportable segment does not include general corporate expenses, interest expense, interest income, and other income and expense items of a non-operating nature, as the effects of these items are not considered as part of management's evaluation of the segments operating performance.
Corporate assets primarily include cash and cash equivalents, property and equipment used for corporate purposes and certain other financial investments.
Business segment financial information In thousands of dollars | |||||||||
2015 | 2014 | 2013 | |||||||
(recast) | (recast) | ||||||||
Operating revenues | |||||||||
Media | $ | 1,682,144 | $ | 1,691,866 | $ | 835,113 | |||
Digital | 1,368,801 | 934,275 | 768,010 | ||||||
Total | $ | 3,050,945 | $ | 2,626,141 | $ | 1,603,123 | |||
Operating income | |||||||||
Media (2) | $ | 714,237 | $ | 747,020 | $ | 361,915 | |||
Digital (2) | 229,386 | 119,908 | 107,413 | ||||||
Corporate (1) (2) | (68,418 | ) | (71,256 | ) | (64,633 | ) | |||
Net gain on sale of corporate building | 89,892 | — | — | ||||||
Unallocated (4) | (51,939 | ) | (88,173 | ) | (93,835 | ) | |||
Total | $ | 913,158 | $ | 707,499 | $ | 310,860 | |||
Depreciation, amortization and facility consolidation and asset impairment charges | |||||||||
Media (2) | $ | 81,665 | $ | 94,129 | $ | 29,625 | |||
Digital (2) | 146,907 | 91,967 | 57,654 | ||||||
Corporate (1) (2) | (82,342 | ) | 10,702 | 10,283 | |||||
Total | $ | 146,230 | $ | 196,798 | $ | 97,562 | |||
Equity (losses) income in unconsolidated investees, net | |||||||||
Media | $ | (2,794 | ) | $ | (1,667 | ) | $ | (94 | ) |
Digital | (2,151 | ) | 154,370 | 23,343 | |||||
Corporate | (119 | ) | (1,241 | ) | (2,194 | ) | |||
Total | $ | (5,064 | ) | $ | 151,462 | $ | 21,055 | ||
Capital expenditures | |||||||||
Media | $ | 52,141 | $ | 42,147 | $ | 18,394 | |||
Digital | 44,903 | 38,549 | 29,666 | ||||||
Corporate (1) | 790 | 1,556 | 1,733 | ||||||
Total | $ | 97,834 | $ | 82,252 | $ | 49,793 | |||
Identifiable assets | |||||||||
Media | $ | 4,799,375 | $ | 4,773,481 | |||||
Digital | 3,529,124 | 3,646,876 | |||||||
Corporate (1) | 201,994 | 410,892 | |||||||
Total (3) | $ | 8,530,493 | $ | 8,831,249 | |||||
(1) | Corporate amounts represent those not directly related to our two business segments. |
(2) | Operating income for Media and Digital Segments includes pre-tax facility consolidation and net asset (gains) impairment charges for each year presented. See Note 11. |
(3) | Total of business segment identifiable assets exclude assets recorded in discontinued operations on the consolidated balance sheets of $7 million at Dec. 31, 2015 and $2.4 billion at Dec 28, 2014. |
(4) | Unallocated expenses represent certain expenses that historically were allocated to the former Publishing Segment but that could not be allocated to discontinued operations as they were not clearly and specifically identifiable to the spun-off businesses. |
59
NOTE 11
Facility consolidation and net asset (gains) impairment charges
For each year presented, we recognized charges related to facility consolidations efforts, and also recorded non-cash impairment charges to reduce the book value of goodwill, other intangible assets and long-lived assets. In 2015, we recorded a gain on the sale of our headquarters building.
A summary of these charges by year is presented below (in thousands):
2015 | Pre-Tax Amount | ||||
Facility consolidation and net asset (gains) impairment charges: | |||||
Goodwill - Digital | $ | 8,000 | |||
Other intangibles - Digital | 900 | ||||
Other: | |||||
Media | 8,078 | ||||
Digital | 13,095 | ||||
Corporate | 962 | ||||
Gain on sale of corporate headquarters | (89,892 | ) | |||
Total facility consolidation and net asset (gains) impairment charges against operations | $ | (58,857 | ) | ||
2014 (recast) | Pre-Tax Amount | ||||
Facility consolidation and net asset (gains) impairment charges: | |||||
Goodwill - Digital | $ | 30,271 | |||
Other intangibles - Digital | 971 | ||||
Other - Media | 13,719 | ||||
Total facility consolidation and net asset (gains) impairment charges against operations | $ | 44,961 | |||
2013 (recast) | Pre-Tax Amount | ||||
Facility consolidation and net asset (gains) impairment charges: | |||||
Goodwill - Digital | $ | 20,044 | |||
Other intangibles - Digital | 1,652 | ||||
Other - Media | 1,033 | ||||
Total facility consolidation and net asset (gains) impairment charges against operations | $ | 22,729 | |||
Goodwill: In each year presented, we recorded non-cash goodwill impairment charges for certain reporting units within our Digital Segment. Based on the annual goodwill impairment test performed during the fourth quarter of 2015, the estimated fair value of each reporting unit exceeded its carrying amount, with the exception of our PointRoll reporting unit within our Digital Segment. Accordingly, after performing the second step of the goodwill impairment test, we recorded a non-cash goodwill impairment charge of $8 million during the fourth quarter of 2015, fully impairing the goodwill related to PointRoll.
In addition, during 2014 and 2013 in connection with interim and annual goodwill impairment tests, we recorded non-cash goodwill impairment charges related to certain reporting units within our Digital Segment (primarily PointRoll, ShopLocal and BLiNQ).
Other Intangibles: During 2015, 2014 and 2013, we recorded non-cash impairment charges within our Digital Segment for certain intangible assets, principally trade names, after the qualitative assessments indicated it was more likely than not that the carrying values exceeded the respective fair values. Accordingly, we prepared quantitative assessments in both years which also indicated that impairments existed. As a result of these assessments, we recorded non-cash impairment charges to reduce the carrying value of each asset to its respective fair value. Fair values were determined using a relief-from-royalty method. The impairments recorded were principally a result of revenue projections which were lower than expected. In 2014, the revised revenue projections were also coupled with a decrease in royalty rates of comparable arrangements thus negatively impacting our royalty assumptions.
Other charges (gain): During the fourth quarter of 2015, we recorded a pre-tax gain on of $89.9 million ($54.9 million after tax) on the sale of our corporate headquarters building. Other charges recorded at our Media and Digital Segments during 2015, 2014 and 2013 primarily relate to facility consolidation plans which led us to recognize charges associated with revising the useful lives of certain assets over a shortened period as well as shutdown costs.
60
NOTE 12
Commitments, contingent liabilities and other matters
Litigation: We, along with a number of our subsidiaries, are defendants in judicial and administrative proceedings involving matters incidental to our business. We do not believe that any material liability will be imposed as a result of these matters.
The liabilities associated with an environmental matter in Montgomery, AL, that we previously disclosed, and all other environmental liabilities related to the printing business operated by our former publishing businesses, were assumed by Gannett in connection with the separation.
Commitments: The following table summarizes the expected cash outflow related to our unconditional purchase obligations that are not recorded on our balance sheet as of Dec. 31, 2015. Such obligations include future payments related to operating leases, programming contracts and purchase obligations.
In thousands of dollars | |||||||||
Operating Leases | Program Broadcast Contracts | Purchase Obligations | |||||||
2016 | $ | 40,655 | $ | 148,894 | $ | 64,376 | |||
2017 | 36,673 | 202,329 | 38,943 | ||||||
2018 | 26,613 | 216,399 | 28,297 | ||||||
2019 | 21,789 | 130,793 | 20,584 | ||||||
2020 | 14,475 | 181 | 9,543 | ||||||
Thereafter | 64,019 | 135 | 14,063 | ||||||
Total | $ | 204,224 | $ | 698,731 | $ | 175,806 | |||
Leases: Approximate future minimum annual rentals payable under non-cancelable operating leases, primarily relate to facilities and equipment, total $204.2 million. Total minimum annual rentals have not been reduced for future minimum sublease rentals aggregating $3.0 million. Total rental expense reflected in 2015 was $38.1 million, $29.5 million in 2014 and $19.9 million in 2013.
Program broadcast contracts: We have $698.7 million of commitments under programming contracts that include television station commitments to purchase programming to be produced in future years. This also includes amounts related to our network affiliation agreements.
Purchase obligations: We have commitments under purchasing obligations totaling $175.8 million related to capital projects, interactive marketing agreements, licensing fees and other legally binding commitments. Amounts which we are liable for under purchase orders outstanding at Dec. 31, 2015, are reflected in the Consolidated Balance Sheet as accounts payable and accrued liabilities and are excluded from the $175.8 million.
Other matters: We were contingently liable for earnout payments to previous owners, depending upon the achievement of certain financial and performance metrics related to certain business acquisitions. During 2015, we substantially paid the remaining obligation of earnout payments to owners of businesses previously acquired (see Note 8).
NOTE 13
Discontinued Operations
On June 29, 2015, we completed the previously announced spin-off of our publishing businesses, creating a new independent publicly traded company, Gannett Co., Inc., through the distribution of 98.5% of our interest in Gannett to holders of our common shares. On June 29, 2015 each of our shareholders of record as of the close of business on the record date of June 22, 2015 received one share of Gannett common stock for every two shares of TEGNA common stock. Following the distribution, we own 1.5% of Gannett outstanding common shares. We will continue to own Gannett shares for a period of time not to exceed 5 years after distribution (see Note 8 for more information). In conjunction with the spin-off of the publishing businesses, we entered into a separation and distribution agreement with Gannett and also entered into various other agreements to effect the separation and provide a framework for a short term set of transition services as well as a tax matters agreement and an employee matters agreement.
Separation and Distribution Agreement - We entered into a separation and distribution agreement with Gannett which sets forth, among other things, the parties’ agreements regarding the principal transactions necessary to effect the separation. The separation agreement identified the assets transferred, the liabilities assumed and the contracts assigned to each of TEGNA and Gannett as part of the separation and also provides for the conditions under which and timing of transfers, assumptions and assignments occurred.
Transition Services Agreement - We entered into a transition services agreement with Gannett prior to the distribution pursuant to which TEGNA and its subsidiaries as well as Gannett and its subsidiaries will provide to each other a small number of services on an interim basis, not to exceed 24 months. These services include information technology, accounts payable, payroll, legal and other financial processing functions and administrative services. The agreed upon charges for such services are generally intended to allow the servicing party to recover all costs and expenses of providing such services.
The transition services agreement will terminate on the expiration of the term of the last service provided under it, no later than 24 months following the distribution date. The recipient for a particular service generally can terminate that service prior to the scheduled expiration date, subject generally to a minimum service period of 90 days and minimum notice period of 30 days. Due to interdependencies between some services, certain services may be extended or terminated early only if other services are coterminous.
Commercial Agreements - Our Digital Segment has certain revenue contracts with Gannett which were entered into in the ordinary course of business.
61
Tax Matters Agreement - Prior to the separation, we entered into a tax matters agreement with Gannett that states each company’s rights and responsibilities with respect to payment of taxes, tax return filings, control of tax examinations, assistance and cooperation. In general, we are responsible for taxes allocable to periods ending prior to the distribution (or the portion of periods up through the distribution), and Gannett is generally responsible for taxes allocable to periods beginning after the distribution (or the portion of periods beginning after the distribution). If the distribution fails to qualify as a tax-free transaction for U.S. federal income tax purposes and this failure is attributable to Gannett’s actions or inactions, the resulting liability is to be borne by Gannett.
Employee Matters Agreement - Gannett and TEGNA entered into an employee matters agreement prior to the separation to allocate liabilities and responsibilities relating to employment matters, employee compensation and benefits plans and programs and other related matters. The employee matters agreement governs certain compensation and employee benefit obligations with respect to the current and former employees and non-employee directors of each company.
The employee matters agreement provides that, unless otherwise specified, TEGNA is responsible for liabilities associated with employees who are employed by TEGNA following the separation as well as former employees whose last employment was with the TEGNA businesses and certain specified current and former corporate employees. Gannett is responsible for liabilities associated with employees who are employed by Gannett following the separation, former employees whose last employment was with the Gannett businesses and certain specified current and former corporate employees.
In addition to the spin-off of our publishing businesses, on November 5, 2015, we also sold our subsidiaries Clipper Magazine (Clipper), a direct mail advertising magazine business, and Mobestream Media (Mobestream), maker of a mobile rewards/coupon platform, to Valassis Direct Mail, Inc. With the sale of Clipper and Mobestream, we divested substantially all the operations of our Other Segment. Accordingly, we have presented the financial condition and results of operations of the former Publishing and Other Segments as discontinued operations.
Financial Statement Presentation
The publishing and Other Segment businesses are presented as discontinued operations in our Consolidated Balance Sheet and the Consolidated Statement of Income. In our consolidated statement of cash flows, the cash flows from discontinued operations are not separately classified.
The carrying value of the assets and liabilities of discontinued operations as of Dec. 28, 2014 were as follows:
In thousands | |||||||||
Publishing | Other | Total | |||||||
ASSETS | |||||||||
Current assets | |||||||||
Cash and cash equivalents | $ | 8,024 | $ | 155 | $ | 8,179 | |||
Trade receivables, net of allowances | 357,523 | 20,895 | 378,418 | ||||||
Other receivables | 16,422 | 1,300 | 17,722 | ||||||
Inventories | 38,861 | — | 38,861 | ||||||
Prepaid expenses and other current assets | 27,883 | 1,034 | 28,917 | ||||||
Assets held for sale | 18,434 | — | 18,434 | ||||||
Total current assets | 467,147 | 23,384 | 490,531 | ||||||
Property and equipment | |||||||||
Cost | 2,590,159 | 18,518 | 2,608,677 | ||||||
Less accumulated depreciation | (1,655,676 | ) | (10,526 | ) | (1,666,202 | ) | |||
Net property and equipment | 934,483 | 7,992 | 942,475 | ||||||
Intangible and other assets | |||||||||
Goodwill | 544,345 | 47,100 | 591,445 | ||||||
Indefinite-lived and amortizable intangible assets less accumulated amortization | 50,115 | 11,900 | 62,015 | ||||||
Deferred income taxes | 261,321 | — | 261,321 | ||||||
Investments and other assets | 63,125 | 34 | 63,159 | ||||||
Total intangible and other assets | 918,906 | 59,034 | 977,940 | ||||||
Total noncurrent assets | 1,853,389 | 67,026 | 1,920,415 | ||||||
Total assets | $ | 2,320,536 | $ | 90,410 | $ | 2,410,946 | |||
LIABILITIES AND EQUITY | |||||||||
Current liabilities | |||||||||
Accounts payable | $ | 125,888 | $ | 6,996 | $ | 132,884 | |||
Compensation | 77,606 | 4,193 | 81,799 | ||||||
Taxes | 26,195 | 679 | 26,874 | ||||||
Other | 89,096 | 3,760 | 92,856 | ||||||
Deferred income | 77,123 | 13,203 | 90,326 | ||||||
Total current liabilities | 395,908 | 28,831 | 424,739 | ||||||
Postretirement medical and life insurance liabilities | 93,474 | — | 93,474 | ||||||
Pension liabilities | 770,040 | — | 770,040 | ||||||
Other noncurrent liabilities | 161,899 | — | 161,899 | ||||||
Total noncurrent liabilities | 1,025,413 | — | 1,025,413 | ||||||
Total liabilities | $ | 1,421,321 | $ | 28,831 | $ | 1,450,152 | |||
62
The financial results of discontinued operations through Dec. 31, 2015 are presented as a profit (loss) from discontinued operations, net of income taxes, on our Condensed Consolidated Statements of Income.
The following table presents the financial results of discontinued operations:
In thousands | Year ended Dec. 31, 2015 | ||||||||
Publishing | Other | Total | |||||||
Operating revenues | $ | 1,400,006 | $ | 191,025 | $ | 1,591,031 | |||
Income (loss) from discontinued operations, before income taxes | 169,220 | (36,068 | ) | 133,152 | |||||
Provision for income taxes | 43,735 | (12,647 | ) | 31,088 | |||||
Income (loss) from discontinued operations, net of tax | 125,485 | (23,421 | ) | 102,064 | |||||
In thousands | Year ended Dec. 28, 2014 | ||||||||
Publishing | Other | Total | |||||||
Operating revenues | $ | 3,133,861 | $ | 248,172 | $ | 3,382,033 | |||
Income (loss) from discontinued operations, before income taxes | 372,549 | (7,186 | ) | 365,363 | |||||
Provision for income taxes | (11,817 | ) | 2,946 | (8,871 | ) | ||||
Income (loss) from discontinued operations, net of tax | 384,366 | (10,132 | ) | 374,234 | |||||
In thousands | Year ended Dec. 29, 2013 | ||||||||
Publishing | Other | Total | |||||||
Operating revenues | $ | 3,299,793 | $ | 258,446 | $ | 3,558,239 | |||
Income from discontinued operations, before income taxes | 441,286 | 6,009 | 447,295 | ||||||
Provision for income taxes | 97,246 | 2,832 | 100,078 | ||||||
Income from discontinued operations, net of tax | 344,040 | 3,177 | 347,217 | ||||||
The financial results reflected above may not represent our Publishing and Other Segments stand-alone operating results, as the results reported within income from discontinued operations, net, include only certain costs that are directly attributable to those businesses and exclude certain corporate overhead costs that were previously allocated for each period. In addition, the 2015 financial results include the pre-tax loss of $26.3 million ($14.8 million after tax) on the disposal of our Other Segment.
The depreciation, amortization, capital expenditures and significant cash investing items of the discontinued operations were as follows:
In thousands | Year ended Dec. 31, 2015 | ||||||||
Publishing | Other | Total | |||||||
Depreciation | $ | 49,542 | $ | 725 | $ | 50,267 | |||
Amortization | 7,008 | — | 7,008 | ||||||
Capital expenditures | (20,252 | ) | (681 | ) | (20,933 | ) | |||
Payments for acquisitions, net of cash acquired | (28,668 | ) | — | (28,668 | ) | ||||
Payments for investments | (2,000 | ) | — | (2,000 | ) | ||||
Proceeds from investments | 12,402 | — | 12,402 | ||||||
In thousands | Year ended Dec. 28, 2014 | ||||||||
Publishing | Other | Total | |||||||
Depreciation | $ | 99,029 | $ | 973 | $ | 100,002 | |||
Amortization | 13,885 | — | 13,885 | ||||||
Capital expenditures | (79,168 | ) | (454 | ) | (79,622 | ) | |||
Payments for acquisitions, net of cash acquired | (113 | ) | — | (113 | ) | ||||
Payments for investments | (2,500 | ) | — | (2,500 | ) | ||||
Proceeds from investments | 18,629 | — | 18,629 | ||||||
In thousands | Year ended Dec. 29, 2013 | ||||||||
Publishing | Other | Total | |||||||
Depreciation | $ | 98,197 | $ | 879 | $ | 99,076 | |||
Amortization | 14,119 | 1,544 | 15,663 | ||||||
Capital expenditures | (59,785 | ) | (829 | ) | (60,614 | ) | |||
Payments for acquisitions, net of cash acquired | (922 | ) | — | (922 | ) | ||||
Proceeds from investments | 26,806 | — | 26,806 | ||||||
63
SELECTED FINANCIAL DATA (Unaudited)
(See notes below as well as 'a' and 'b' on page 65)
In thousands of dollars, except per share amounts | Fiscal Year (1) | ||||||||||||||
2015 | 2014 | 2013 | 2012 | 2011 | |||||||||||
(recast) | (recast) | (recast) | (recast) | ||||||||||||
Operating revenue | $ | 3,050,945 | $ | 2,626,141 | $ | 1,603,123 | $ | 1,631,987 | $ | 1,409,098 | |||||
Operating expenses | 2,137,787 | 1,918,642 | 1,292,263 | 1,284,352 | 1,137,756 | ||||||||||
Operating income | 913,158 | 707,499 | 310,860 | 347,635 | 271,342 | ||||||||||
Non-operating (expense) income | |||||||||||||||
Equity income (loss) in unconsolidated investees, net | (5,064 | ) | 151,462 | 21,055 | 11,001 | 6,746 | |||||||||
Interest expense | (273,629 | ) | (272,668 | ) | (174,818 | ) | (148,974 | ) | (171,239 | ) | |||||
Other non-operating items (2) | (11,529 | ) | 404,403 | (45,279 | ) | 8,086 | (17,678 | ) | |||||||
Total | (290,222 | ) | 283,197 | (199,042 | ) | (129,887 | ) | (182,171 | ) | ||||||
Income before income taxes | 622,936 | 990,696 | 111,818 | 217,748 | 89,171 | ||||||||||
Provision for income taxes | 202,314 | 234,471 | 13,122 | 91,933 | 14,029 | ||||||||||
Income from continuing operations | 420,622 | 756,225 | 98,696 | 125,815 | 75,142 | ||||||||||
Income from continuing operations attributable to noncontrolling interests | (63,164 | ) | (68,289 | ) | (57,233 | ) | (50,727 | ) | (41,379 | ) | |||||
Income from continuing operations attributable to TEGNA Inc. | $ | 357,458 | $ | 687,936 | $ | 41,463 | $ | 75,088 | $ | 33,763 | |||||
Income from continuing operations per share: | |||||||||||||||
basic | $ | 1.59 | $ | 3.04 | $ | 0.18 | $ | 0.32 | $ | 0.14 | |||||
diluted | $ | 1.56 | $ | 2.97 | $ | 0.18 | $ | 0.32 | $ | 0.14 | |||||
Other selected financial data | |||||||||||||||
Dividends declared per share | $ | 0.68 | $ | 0.80 | $ | 0.80 | $ | 0.80 | $ | 0.24 | |||||
Non-GAAP income from continuing operations per diluted share (3) | $ | 1.44 | $ | 1.22 | $ | 0.34 | $ | 0.71 | $ | 0.20 | |||||
Weighted average number of common shares outstanding in thousands: | |||||||||||||||
basic | 224,688 | 226,292 | 228,541 | 232,327 | 239,228 | ||||||||||
diluted | 229,721 | 231,907 | 234,189 | 236,690 | 242,768 | ||||||||||
Financial position and cash flow | |||||||||||||||
Long-term debt, excluding current maturities (4) | $ | 4,200,816 | $ | 4,488,028 | $ | 3,707,010 | $ | 1,432,100 | $ | 1,760,363 | |||||
Shareholders’ equity | $ | 2,191,971 | $ | 3,254,914 | $ | 2,693,098 | $ | 2,350,614 | $ | 2,327,891 | |||||
Total assets | $ | 8,537,758 | $ | 11,242,195 | $ | 9,240,706 | $ | 6,379,886 | $ | 6,616,450 | |||||
Free cash flow (5) | $ | 557,139 | $ | 670,845 | $ | 410,463 | $ | 664,866 | $ | 741,685 | |||||
Return on equity (6) | 16.9 | % | 35.7 | % | 15.4 | % | 18.1 | % | 20.4 | % | |||||
Credit ratios | |||||||||||||||
Leverage ratio (7) | 4.08x | 2.96x | 3.24x | 1.41x | 1.67x | ||||||||||
(1) | Beginning with our 2015 fiscal year, we changed to a calendar year-end reporting cycle. All fiscal years prior to 2015 included 52 weeks, except for 2012 which included 53 weeks. |
(2) | Our income from other non-operating items in 2014 included a $476.7 million pre-tax non-cash gain ($285.9 million after-tax) on the acquisition of Cars.com. See Note 2 of the consolidated financial statements for further information. |
(3) | See page 22 for a reconciliation of income from continuing operations per share presented in accordance with GAAP. |
(4) | The increase in our long-term debt in 2014 and 2013 was primarily due to additional borrowings to fund the acquisitions of Cars.com and Belo in 2014 and 2013, respectively. See Note 2 of the consolidated financial statements for further information. |
(5) | See page 65 for a reconciliation of free cash flow to net cash flow from operating activities, which we believe is the most directly comparable measure calculated and presented in accordance with GAAP. |
(6) | Calculated using income from continuing operations attributable to TEGNA Inc. plus earnings from discontinued operations. |
(7) | The leverage ratio is calculated in accordance with our revolving credit agreement and term loan agreement. Currently, we are required to maintain a leverage ratio of less than 5.0x. These agreements are described more fully on page 25 in Management’s Discussion and Analysis of Financial Condition and Results of Operations. More information regarding the computation can be found in Exhibit 10.1 to the Form 10-Q for the quarterly period ended June 28, 2015, filed on Aug. 5, 2015. |
64
NOTES TO SELECTED FINANCIAL DATA (Unaudited)
(a)We, have made the significant acquisitions listed below during the period. The results of operations of these acquired businesses are included in the accompanying financial information from the date of acquisition. See Note 2 of the consolidated financial statements for further information on the acquisitions.
(b)During the period, we sold or otherwise disposed of substantially all of the assets or capital stock of certain other significant subsidiaries and divisions of other subsidiaries, which are listed below. See Note 2 and Note 13 of the consolidated financial statements for further information on the dispositions.
Acquisitions and dispositions occurring during 2015-2011 are shown below:
Acquisitions 2015-2011 | |||
Year | Name | Location | Description of Business |
2015 | Textkernel | Amsterdam | Software company providing semantic recruitment technology |
KGW, WHAS and KMSB | Portland, OR, Louisville, KY and Tucson, AZ | Television stations | |
2014 | Broadbean | London, United Kingdom | Global recruitment technology company |
London Broadcasting Company | Abilene, Beaumont, Bryan, Corpus Christi, Longview, Port Arthur, San Angelo, Sweetwater, Temple, Tyler, Waco all in Texas | Television stations | |
Classified Ventures LLC (d/b/a Cars.com) | Chicago, IL | Independent search site for car shoppers | |
SocialReferral B.V. | Netherlands | Software to power employee referral programs utilizing social media | |
2013 | Vietnam Online Network | Vietnam | Recruitment services and human resource solutions for employers |
Oil and Gas Job Search | Manchester, England | Online recruitment catering to the oil and gas industry | |
Belo Corp. | Arizona, Idaho, Kentucky, Louisiana, Missouri, North Carolina, Oregon, Texas, Virginia, Washington | Owner and operator of 20 television stations in 15 markets across the U.S. | |
2012 | Ceviu | Brazil | Information technology job board |
Top Language Jobs | Europe | Global online jobsite for multi-language jobs and candidates | |
BLiNQ Media, LLC | New York City, NY | Social engagement advertising solutions for agencies and brands | |
Mobestream Media | Dallas, TX | Developer of the Key Ring consumer rewards mobile platform | |
Economic Modeling Specialist Intl. | Moscow, ID | Economic software firm specializing in employment data/analysis | |
Rovion | Boston, MA | Self-service technology platform for rich media | |
2011 | JobsCentral | Singapore | Job search, employment and career web site |
JobScout24 | Germany | Job search, employment and career web site | |
Dispositions 2015-2011 | |||
Year | Name | Location | Description of Business |
2015 | Gannett Healthcare Group | Hoffman Estates, IL | Provides continuing education, certification test preparation, online recruitment, digital media, publications and related services for nurses and other healthcare professionals |
Gannett Co., Inc. | McLean, VA | Multi-platform news and information company | |
Clipper Magazine | Mountville, PA | Advertising and marketing solutions provider | |
Mobestream Media | Dallas, TX | Developer of the Key Ring consumer rewards mobile platform | |
PointRoll | King of Prussia, PA | Multi-screen digital ad tech and services company | |
2014 | KMOV | St. Louis, MO | Television station |
KTVK/KASW | Phoenix, AZ | Television stations | |
2013 | Captivate Network, Inc. | Chelmsford, MA | News and entertainment network |
Free cash flow reconciliation
Our free cash flow was $557.1 million for the year ended Dec. 31, 2015. Free cash flow is a non-GAAP liquidity measure that is defined as “net cash flow from operating activities” as reported on the Consolidated Statements of Cash Flows reduced by “purchase of property and equipment” and voluntary pension contributions, net of related tax benefit. We believe that free cash flow is a useful measure for management and investors to evaluate the level of cash generated by operations and the ability of its operations to fund investments in new and existing businesses, return cash to shareholders under our capital program, repay indebtedness, add to our cash balance, or to use in other discretionary activities.
Reconciliations from “Net cash flow from operating activities” to “Free cash flow” follow:
In thousands of dollars | 2015 | 2014 | 2013 | 2012 | 2011 | ||||||||||
Net cash flow from operating activities | $ | 613,106 | $ | 821,199 | $ | 511,488 | $ | 756,740 | $ | 814,136 | |||||
Purchase of property and equipment | (118,767 | ) | (150,354 | ) | (110,407 | ) | (91,874 | ) | (72,451 | ) | |||||
Voluntary pension employer contributions | 100,000 | — | 15,507 | — | — | ||||||||||
Tax benefit for voluntary pension employer contributions | (37,200 | ) | — | (6,125 | ) | — | — | ||||||||
Free cash flow | $ | 557,139 | $ | 670,845 | $ | 410,463 | $ | 664,866 | $ | 741,685 | |||||
65
QUARTERLY STATEMENTS OF INCOME (Unaudited) | |||||||||||||||||||
In thousands of dollars, except per share amounts | 2015 Quarters(1) | ||||||||||||||||||
First(2) | Second(3) | Third | Fourth(4) | Total | |||||||||||||||
Operating revenues | $ | 731,491 | $ | 756,672 | $ | 757,518 | $ | 805,264 | $ | 3,050,945 | |||||||||
Operating income | 182,472 | 185,689 | 218,102 | 326,895 | 913,158 | ||||||||||||||
Net income from continuing operations | 84,002 | 54,156 | 111,059 | 171,405 | 420,622 | ||||||||||||||
Net income from discontinued operations | 43,481 | 77,337 | (5,317 | ) | (13,437 | ) | 102,064 | ||||||||||||
Noncontrolling interest | (14,590 | ) | (15,624 | ) | (17,487 | ) | (15,463 | ) | (63,164 | ) | |||||||||
Net income | 112,893 | 115,869 | 88,255 | 142,505 | 459,522 | ||||||||||||||
Net income per share—basic | $ | 0.50 | $ | 0.51 | $ | 0.39 | $ | 0.65 | $ | 2.04 | |||||||||
Net income per share—diluted | $ | 0.49 | $ | 0.50 | $ | 0.38 | $ | 0.63 | $ | 2.00 | |||||||||
2014 Quarters | |||||||||||||||||||
First(5) | Second | Third | Fourth(6) | Total | |||||||||||||||
Operating revenues | $ | 566,043 | $ | 596,982 | $ | 621,070 | $ | 842,046 | $ | 2,626,141 | |||||||||
Operating income | 136,655 | 160,728 | 182,776 | 227,340 | 707,499 | ||||||||||||||
Net income from continuing operations | 19,168 | 163,326 | 71,362 | 502,369 | 756,225 | ||||||||||||||
Net income from discontinued operations | 50,422 | 62,585 | 68,630 | 192,598 | 374,235 | ||||||||||||||
Noncontrolling interest | (10,431 | ) | (17,444 | ) | (21,476 | ) | (18,938 | ) | (68,289 | ) | |||||||||
Net income | 59,159 | 208,467 | 118,516 | 676,029 | 1,062,171 | ||||||||||||||
Net income per share—basic | $ | 0.26 | $ | 0.92 | $ | 0.52 | $ | 2.99 | $ | 4.69 | |||||||||
Net income per share—diluted | $ | 0.25 | $ | 0.90 | $ | 0.51 | $ | 2.92 | $ | 4.58 | |||||||||
(1) | Beginning with our 2015 fiscal year, we changed our financial reporting cycle to a calendar year-end reporting cycle and an end-of-month quarterly reporting cycle. Accordingly, effective starting in the fourth quarter of 2015, our 2015 fourth quarter included the period from September 28, 2015 through December 31, 2015. |
(2) | Results for the first quarter of 2015 include special items affecting operating income. Special items primarily related to transformation costs and accelerated depreciation on certain assets, totaled $5.9 million ($3.7 million after-tax or $0.02 per share) which was offset by a $12.7 million gain ($7.9 million after tax or $0.03 per share) from the sale of a building. |
(3) | Results for the second quarter of 2015 include special items affecting operating income. Special items primarily related to non-cash impairments on certain intangibles totaled $13.7 million ($8.6 million after-tax or $0.04 per share). Refer to Notes 3 and 11 of our Consolidated Financial Statements for more information on impairment of intangible assets. |
(4) | Results for the fourth quarter of 2015 include special items affecting operating income. Special items consisting primarily of non-cash asset impairments and workforce restructuring totaled $19.0 million ($14.2 million after-tax or $0.06 per share) which was offset by an $89.9 million gain ($54.9 million after-tax or $0.24 per share) from the sale of our corporate office building. |
(5) | Results for the first quarter of 2014 include special items affecting operating income. Special items consisting primarily of integration costs totaled $9.8 million ($6.1 million after-tax or $0.03 per share). |
(6) | Results for the fourth quarter of 2014 include special items affecting operating income. Special items, consisting primarily of non-cash goodwill impairments within the Digital Segment, totaled $39.8 million ($34.2 million after tax or $0.15 per share). Refer to Notes 3 and 11 of our Consolidated Financial Statements for more information on goodwill impairment charges. Special tax items include a tax benefit of $129.1 million ($0.56 per share) related to the sale of a non-strategic subsidiary at a loss. |
66
ITEM 9.CHANGES IN AND DISAGREEMENTS WITH ACCOUNTANTS ON ACCOUNTING AND FINANCIAL DISCLOSURE
None.
ITEM 9A. CONTROLS AND PROCEDURES
Conclusion Regarding the Effectiveness of Disclosure Controls and Procedures
Under the supervision and with the participation of our management, including our principal executive officer and principal financial officer, we conducted an evaluation of our disclosure controls and procedures, as such term is defined under Rule 13a-15(e) promulgated under the Securities Exchange Act of 1934, as amended (the Exchange Act). Based on this evaluation, our principal executive officer and our principal financial officer concluded that our disclosure controls and procedures were effective as of the end of the period covered by this annual report.
Management’s Report on Internal Control Over Financial Reporting
Our management is responsible for establishing and maintaining adequate internal control over financial reporting, as such term is defined in Exchange Act Rule 13a-15(f). Under the supervision and with the participation of our management, including our principal executive officer and principal financial officer, we conducted an evaluation of the effectiveness of our internal control over financial reporting based on the framework in Internal Control - Integrated Framework (2013 framework) issued by the Committee of Sponsoring Organizations of the Treadway Commission. Based on our evaluation, our management concluded that our internal control over financial reporting was effective as of Dec. 31, 2015.
The effectiveness of our internal control over financial reporting as of Dec. 31, 2015, has been audited by Ernst & Young LLP, an independent registered public accounting firm, as stated in its report which is included elsewhere in this item.
Changes in Internal Control Over Financial Reporting
There has been no change in our internal control over financial reporting that occurred during our fiscal quarter ended Dec. 31, 2015, that has materially affected, or is reasonably likely to materially affect, our internal control over financial reporting.
67
Report of Independent Registered Public Accounting Firm
Board of Directors and Shareholders of TEGNA Inc.:
We have audited TEGNA Inc.’s internal control over financial reporting as of December 31, 2015, based on criteria established in Internal Control-Integrated Framework issued by the Committee of Sponsoring Organizations of the Treadway Commission (2013 framework) (the COSO criteria). TEGNA Inc.'s management is responsible for maintaining effective internal control over financial reporting, and for its assessment of the effectiveness of internal control over financial reporting included in the accompanying Management’s Report on Internal Control Over Financial Reporting. Our responsibility is to express an opinion on the company’s internal control over financial reporting based on our audit.
We conducted our audit in accordance with the standards of the Public Company Accounting Oversight Board (United States). Those standards require that we plan and perform the audit to obtain reasonable assurance about whether effective internal control over financial reporting was maintained in all material respects. Our audit included obtaining an understanding of internal control over financial reporting, assessing the risk that a material weakness exists, testing and evaluating the design and operating effectiveness of internal control based on the assessed risk, and performing such other procedures as we considered necessary in the circumstances. We believe that our audit provides a reasonable basis for our opinion.
A company’s internal control over financial reporting is a process designed to provide reasonable assurance regarding the reliability of financial reporting and the preparation of financial statements for external purposes in accordance with generally accepted accounting principles. A company’s internal control over financial reporting includes those policies and procedures that (1) pertain to the maintenance of records that, in reasonable detail, accurately and fairly reflect the transactions and dispositions of the assets of the company; (2) provide reasonable assurance that transactions are recorded as necessary to permit preparation of financial statements in accordance with generally accepted accounting principles, and that receipts and expenditures of the company are being made only in accordance with authorizations of management and directors of the company; and (3) provide reasonable assurance regarding prevention or timely detection of unauthorized acquisition, use, or disposition of the company’s assets that could have a material effect on the financial statements.
Because of its inherent limitations, internal control over financial reporting may not prevent or detect misstatements. Also, projections of any evaluation of effectiveness to future periods are subject to the risk that controls may become inadequate because of changes in conditions, or that the degree of compliance with the policies or procedures may deteriorate.
In our opinion, TEGNA Inc. maintained, in all material respects, effective internal control over financial reporting as of December 31, 2015, based on the COSO criteria.
We also have audited, in accordance with the standards of the Public Company Accounting Oversight Board (United States), the 2015 consolidated financial statements of TEGNA Inc. and our report dated February 29, 2016 expressed an unqualified opinion thereon.
/s/ Ernst & Young LLP
McLean, Virginia
February 29, 2016
68
PART III
ITEM 10. DIRECTORS, EXECUTIVE OFFICERS AND CORPORATE GOVERNANCE
The information captioned “Your Board of Directors,” “Information about Directors - The Board’s Nominees,” “Committees of the Board of Directors,” “Committee Charters” and “Ethics Policy” under the heading “PROPOSAL 1 – ELECTION OF DIRECTORS” and the information under “SECTION 16(A) BENEFICIAL OWNERSHIP REPORTING COMPIANCE” in our 2016 proxy statement is incorporated herein by reference.
William A. Behan
Senior Vice President, Labor Relations (2010-present).
Formerly: Vice President, Labor Relations (2007-2010).
Age 57.
Victoria D. Harker
Executive Vice President and Chief Financial Officer (June 2015-present). Formerly: Chief Financial Officer (2012-2015), Executive Vice President, Chief Financial Officer and President of Global Business Services, AES Corporation (2006-2012). Age 51.
Nicholas Lehman
Chief Strategy Officer (December 2015-present). Formerly: President, Digital, NBCUniversal (2011-2015), CEO, Plum TV (2010-2011), Founder, Uncommon Media (2009), COO, Programming, IAC (2007-2008), Executive Vice President and General Manager, Interactive Media Group, MTV Networks (2005-2007). Age 44.
Kevin E. Lord
Senior Vice President and Chief Human Resources Officer (October 2012-present). Formerly: Executive Vice President, Human Resources, NBC News (2007-2012). Age 53.
David T. Lougee
President, TEGNA Media (July 2007-present). Age 57.
Gracia C. Martore
President and Chief Executive Officer (October 2011-present). Formerly: President and Chief Operating Officer (February 2010-October 2011); Executive Vice President and CFO (2006-2010). Age 64.
Todd A. Mayman
Executive Vice President, Chief Legal and Administrative Officer (June 2015 - present). Formerly: Senior Vice President, General Counsel and Secretary (2009-2015), Vice President, Associate General Counsel, Secretary and Chief Governance Officer (2007-2009). Age 56.
John A. Williams
President, TEGNA Digital (January 2008-present). Age 65.
ITEM 11. EXECUTIVE COMPENSATION
The information captioned “EXECUTIVE COMPENSATION,” “DIRECTOR COMPENSATION,” “OUTSTANDING DIRECTOR EQUITY AWARDS AT FISCAL YEAR-END” AND “PROPOSAL 1–ELECTION OF DIRECTORS – Compensation Committee Interlocks and Insider Participation; Related Transactions” in our 2016 proxy statement is incorporated herein by reference.
ITEM 12. SECURITY OWNERSHIP OF CERTAIN BENEFICIAL OWNERS AND MANAGEMENT AND RELATED STOCKHOLDER MATTERS
The information captioned “EQUITY COMPENSATION PLAN INFORMATION” and “SECURITIES BENEFICIALLY OWNED BY DIRECTORS, EXECUTIVE OFFICERS AND PRINCIPAL SHAREHOLDERS” in our 2016 proxy statement is incorporated herein by reference.
ITEM 13. CERTAIN RELATIONSHIPS AND RELATED TRANSACTIONS, AND DIRECTOR INDEPENDENCE
The information captioned “Director Independence” and “Compensation Committee Interlocks and Insider Participation; Related Transactions” under the heading “PROPOSAL 1 – ELECTION OF DIRECTORS” in our 2016 proxy statement is incorporated herein by reference.
ITEM 14. PRINCIPAL ACCOUNTANT FEES AND SERVICES
The information captioned “PROPOSAL 1 – ELECTION OF DIRECTORS – Report of the Audit Committee” in our 2016 proxy statement is incorporated herein by reference.
PART IV
ITEM 15. EXHIBITS AND FINANCIAL STATEMENT SCHEDULES
(a) | Financial Statements, Financial Statement Schedules and Exhibits. |
(1)Financial Statements.
As listed in the Index to Financial Statements and Supplementary Data on page 30.
(2)Financial Statement Schedules.
All schedules are omitted as the required information is not applicable or the information is presented in the consolidated financial statements or related notes.
(3)Exhibits.
See Exhibit Index on pages 71-77 for list of exhibits filed with this Form 10-K. Management contracts and compensatory plans or arrangements are identified with asterisks on the Exhibit Index.
69
SIGNATURES
Pursuant to the requirements of Section 13 or 15(d) of the Securities Exchange Act of 1934, the registrant has duly caused this report to be signed on its behalf by the undersigned thereunto duly authorized.
Dated: February 29, 2016 | TEGNA Inc. (Registrant) | ||
By: | /s/ Victoria D. Harker | ||
Victoria D. Harker, | |||
Executive Vice President and Chief Financial Officer | |||
(principal financial officer) | |||
Pursuant to the requirements of the Securities Exchange Act of 1934, this report has been signed below by the following persons on behalf of the registrant in the capacities and on the dates indicated.
Dated: February 29, 2016 | /s/ Gracia C. Martore | |
Gracia C. Martore, | ||
President and Chief Executive | ||
Officer (principal executive officer) | ||
Dated: February 29, 2016 | /s/ Victoria D. Harker | |
Victoria D. Harker, | ||
Executive Vice President and Chief Financial Officer | ||
(principal financial officer) | ||
Dated: February 29, 2016 | /s/ Clifton A. McClelland III | |
Clifton A. McClelland III | ||
Vice President and Controller | ||
(principal accounting officer) | ||
Dated: February 29, 2016 | /s/ Howard D. Elias |
Howard D. Elias, Director | |
Dated: February 29, 2016 | /s/ Lidia Fonseca |
Lidia Fonseca, Director | |
Dated: February 29, 2016 | /s/ Jill Greenthal |
Jill Greenthal, Director | |
Dated: February 29, 2016 | /s/ Marjorie Magner |
Marjorie Magner, | |
Director, Chairman | |
Dated: February 29, 2016 | /s/ Gracia C. Martore |
Gracia C. Martore, Director | |
Dated: February 29, 2016 | /s/ Scott K. McCune |
Scott K. McCune, Director | |
Dated: February 29, 2016 | /s/ Henry W. McGee |
Henry W. McGee, Director | |
Dated: February 29, 2016 | /s/ Susan Ness |
Susan Ness, Director | |
Dated: February 29, 2016 | /s/ Bruce P. Nolop |
Bruce P. Nolop, Director | |
Dated: February 29, 2016 | /s/ Neal Shapiro |
Neal Shapiro, Director | |
70
EXHIBIT INDEX
Exhibit Number | Exhibit | Location | ||
3-1 | Third Restated Certificate of Incorporation of TEGNA Inc. | Incorporated by reference to Exhibit 3-1 to TEGNA Inc.’s Form 10-Q for the fiscal quarter ended April 1, 2007. | ||
3-1-1 | Amendment to Third Restated Certificate of Incorporation of TEGNA Inc. | Incorporated by reference to Exhibit 3-1 to TEGNA Inc.’s Form 8-K filed on May 1, 2015. | ||
3-1-2 | Amendment to Third Restated Certificate of Incorporation of TEGNA Inc. | Incorporated by reference to Exhibit 3-1 to TEGNA Inc.’s Form 8-K filed on July 2, 2015. | ||
3-2 | By-laws, as amended through December 8, 2015. | Incorporated by reference to Exhibit 3-2 to TEGNA Inc.’s Form 8-K filed on December 11, 2015. | ||
4-1 | Indenture dated as of March 1, 1983, between TEGNA Inc. and Citibank, N.A., as Trustee. | Incorporated by reference to Exhibit 4-2 to TEGNA Inc.’s Form 10-K for the fiscal year ended December 29, 1985. | ||
4-2 | First Supplemental Indenture dated as of November 5, 1986, among TEGNA Inc., Citibank, N.A., as Trustee, and Sovran Bank, N.A., as Successor Trustee. | Incorporated by reference to Exhibit 4 to TEGNA Inc.’s Form 8-K filed on November 9, 1986. | ||
4-3 | Second Supplemental Indenture dated as of June 1, 1995, among TEGNA Inc., NationsBank, N.A., as Trustee, and Crestar Bank, as Trustee. | Incorporated by reference to Exhibit 4 to TEGNA Inc.’s Form 8-K filed on June 15, 1995. | ||
4-4 | Third Supplemental Indenture, dated as of March 14, 2002, between TEGNA Inc. and Wells Fargo Bank Minnesota, N.A., as Trustee. | Incorporated by reference to Exhibit 4-16 to TEGNA Inc.’s Form 8-K filed on March 14, 2002. | ||
4-5 | Fourth Supplemental Indenture, dated as of June 16, 2005, between TEGNA Inc. and Wells Fargo Bank Minnesota, N.A., as Trustee. | Incorporated by reference to Exhibit 4-5 to TEGNA Inc.’s Form 10-Q for the fiscal quarter ended June 26, 2005. | ||
4-6 | Fifth Supplemental Indenture, dated as of May 26, 2006, between TEGNA Inc. and Wells Fargo Bank, N.A., as Trustee. | Incorporated by reference to Exhibit 4-5 to TEGNA Inc.’s Form 10-Q for the fiscal quarter ended June 25, 2006. | ||
4-7 | Sixth Supplemental Indenture, dated as of June 29, 2007, between TEGNA Inc. and Wells Fargo Bank, N.A., as Successor Trustee. | Incorporated by reference to Exhibit 4-5 to TEGNA Inc.’s Form 10-Q for the fiscal quarter ended July 1, 2007. | ||
4-8 | Eleventh Supplemental Indenture, dated as of October 3, 2013, between TEGNA Inc. and U.S. Bank National Association as Trustee. | Incorporated by reference to Exhibit 4-8 to TEGNA Inc.’s Form 10-K for the fiscal year ended December 29, 2013. | ||
4-9 | Specimen Certificate for TEGNA Inc.’s common stock, par value $1.00 per share. | Incorporated by reference to Exhibit 2 to TEGNA Inc.’s Form 8-B filed on June 14, 1972. | ||
10-1 | Supplemental Executive Medical Plan Amended and Restated as of January 1, 2011.* | Incorporated by reference to Exhibit 10-2 to TEGNA Inc.’s Form 10-K for the fiscal year ended December 26, 2010. | ||
10-1-1 | Amendment No. 1 to the Supplemental Executive Medical Plan Amended and Restated as of January 1, 2012.* | Incorporated by reference to Exhibit 10-1-1 to TEGNA Inc.’s Form 10-K for the fiscal year ended December 30, 2012. | ||
10-1-2 | Amendment No. 2 to the TEGNA Inc. Supplemental Executive Medical Plan dated as of June 26, 2015.* | Incorporated by reference to Exhibit 10-6 to TEGNA Inc.’s Form 10-Q for the fiscal quarter ended June 28, 2015. | ||
10-2 | Supplemental Executive Medical Plan for Retired Executives dated December 22, 2010 and effective January 1, 2011.* | Incorporated by reference to Exhibit 10-2-1 to TEGNA Inc.’s Form 10-K for the fiscal year ended December 26, 2010. | ||
10-2-1 | Amendment No. 1 to the TEGNA Inc. Supplemental Executive Medical Plan for Retired Executives dated as of June 26, 2015.* | Incorporated by reference to Exhibit 10-7 to TEGNA Inc.’s Form 10-Q for the fiscal quarter ended June 28, 2015. | ||
10-3 | TEGNA Inc. Supplemental Retirement Plan Restatement.* | Incorporated by reference to Exhibit 10-2 to TEGNA Inc.’s Form 10-Q for the fiscal quarter ended September 30, 2007. | ||
10-3-1 | Amendment No. 1 to the TEGNA Inc. Supplemental Retirement Plan dated July 31, 2008 and effective August 1, 2008.* | Incorporated by reference to Exhibit 10-1 to TEGNA Inc.’s Form 10-Q for the fiscal quarter ended September 28, 2008. | ||
10-3-2 | Amendment No. 2 to the TEGNA Inc. Supplemental Retirement Plan dated December 22, 2010.* | Incorporated by reference to Exhibit 10-3-2 to TEGNA Inc.’s Form 10-K for the fiscal year ended December 26, 2010. | ||
71
10-3-3 | Amendment No. 3 to the TEGNA Inc. Supplemental Retirement Plan dated as of June 26, 2015. | Incorporated by reference to Exhibit 10-8 to TEGNA Inc.’s Form 10-Q for the fiscal quarter ended June 28, 2015. | ||
10-4 | TEGNA Inc. Deferred Compensation Plan Restatement dated February 1, 2003 (reflects all amendments through July 25, 2006).* | Incorporated by reference to Exhibit 10-4 to TEGNA Inc.’s Form 10-K for the fiscal year ended December 31, 2006. | ||
10-4-1 | TEGNA Inc. Deferred Compensation Plan Rules for Post-2004 Deferrals.* | Incorporated by reference to Exhibit 10-3 to TEGNA Inc.’s Form 10-Q for the fiscal quarter ended July 1, 2007. | ||
10-4-2 | Amendment No. 1 to the TEGNA Inc. Deferred Compensation Plan Rules for Post-2004 Deferrals dated July 31, 2008 and effective August 1, 2008.* | Incorporated by reference to Exhibit 10-2 to TEGNA Inc.’s Form 10-Q for the fiscal quarter ended September 28, 2008. | ||
10-4-3 | Amendment No. 2 to the TEGNA Inc. Deferred Compensation Plan Rules for Post-2004 Deferrals dated December 9, 2008.* | Incorporated by reference to Exhibit 10-4-3 to TEGNA Inc.’s Form 10-K for the fiscal year ended December 28, 2008. | ||
10-4-4 | Amendment No. 3 to the TEGNA Inc. Deferred Compensation Plan Rules for Post-2004 Deferrals dated October 27, 2009.* | Incorporated by reference to Exhibit 10-4-4 to TEGNA Inc.’s Form 10-K for the fiscal year ended December 27, 2009. | ||
10-4-5 | Amendment No. 4 to the TEGNA Inc. Deferred Compensation Plan Rules for Post-2004 Deferrals dated December 22, 2010.* | Incorporated by reference to Exhibit 10-4-5 to TEGNA Inc.’s Form 10-K for the fiscal year ended December 26, 2010. | ||
10-4-6 | Amendment No. 5 to the TEGNA Inc. Deferred Compensation Plan Rules for Post-2004 Deferrals dated as of June 26, 2015.* | Incorporated by reference to Exhibit 10-10 to TEGNA Inc.’s Form 10-Q for the fiscal quarter ended June 28, 2015. | ||
10-4-7 | Amendment No. 6 to the TEGNA Inc. Deferred Compensation Plan Rues for Post-2004 Deferrals dated as of December 8, 2015.* | Attached. | ||
10-5 | Amendment to the TEGNA Inc. Deferred Compensation Plan Restatement Rules for Pre-2005 Deferrals dated as of June 26, 2015.* | Incorporated by reference to Exhibit 10-9 to TEGNA Inc.’s Form 10-Q for the fiscal quarter ended June 28, 2015. | ||
10-6 | TEGNA Inc. Transitional Compensation Plan Restatement.* | Incorporated by reference to Exhibit 10-1 to TEGNA Inc.’s Form 10-Q for the fiscal quarter ended September 30, 2007. | ||
10-6-1 | Amendment No. 1 to TEGNA Inc. Transitional Compensation Plan Restatement dated as of May 4, 2010.* | Incorporated by reference to Exhibit 10-3 to TEGNA Inc.’s Form 10-Q for the fiscal quarter ended March 28, 2010. | ||
10-6-2 | Amendment No. 2 to TEGNA Inc. Transitional Compensation Plan Restatement dated as of December 22, 2010.* | Incorporated by reference to Exhibit 10-5-2 to TEGNA Inc.’s Form 10-K for the fiscal year ended December 26, 2010. | ||
10-6-3 | Amendment No. 3 to TEGNA Inc. Transitional Compensation Plan Restatement dated as of June 26, 2015.* | Incorporated by reference to Exhibit 10-11 to TEGNA Inc.’s Form 10-Q for the fiscal quarter ended June 28, 2015. | ||
10-6-4 | Notice to Transitional Compensation Plan Restatement Participants.* | Attached. | ||
10-7 | TEGNA Inc. Omnibus Incentive Compensation Plan, as amended and restated as of May 4, 2010.* | Incorporated by reference to Exhibit 10-2 to TEGNA Inc.’s Form 10-Q for the fiscal quarter ended March 28, 2010. | ||
10-7-1 | Amendment No. 1 to the TEGNA Inc. 2001 Omnibus Incentive Compensation Plan (Amended and Restated as of May 4, 2010).* | Incorporated by reference to Exhibit 10-1 to TEGNA Inc.’s Form 8-K filed on February 25, 2015. | ||
10-7-2 | Amendment No. 2 to the TEGNA Inc. 2001 Omnibus Incentive Compensation Plan dated as of June 26, 2015.* | Incorporated by reference to Exhibit 10-12 to TEGNA Inc.’s Form 10-Q for the fiscal quarter ended June 28, 2015. | ||
10-7-3 | Form of Director Stock Option Award Agreement.* | Incorporated by reference to Exhibit 10-7-3 to TEGNA Inc.’s Form 10-K for the fiscal year ended December 30, 2007. | ||
10-7-4 | Form of Director Restricted Stock Unit Award Agreement.* | Incorporated by reference to Exhibit 10-6-9 to TEGNA Inc.’s Form 10-K for the fiscal year ended December 28, 2014. | ||
10-7-5 | Form of Director Restricted Stock Unit Award Agreement.* | Incorporated by reference to Exhibit 10-20 to TEGNA Inc.’s Form 10-Q for the fiscal quarter ended September 27, 2015. | ||
10-7-6 | Form of Director Restricted Stock Unit Award Agreement.* | Incorporated by reference to Exhibit 10-3-1 to TEGNA Inc.’s Form 8-K filed on December 11, 2015. | ||
72
10-7-7 | Form of Executive Officer Stock Option Award Agreement.* | Incorporated by reference to Exhibit 10-6-5 to TEGNA Inc.’s Form 10-K for the fiscal year ended December 28, 2008. | ||
10-7-8 | Form of Executive Officer Restricted Stock Unit Award Agreement.* | Incorporated by reference to Exhibit 10-2 to TEGNA Inc.’s Form 10-Q for the fiscal quarter ended March 31, 2013. | ||
10-7-9 | Form of Executive Officer Restricted Stock Unit Award Agreement.* | Incorporated by reference to Exhibit 10-6-10 to TEGNA Inc.’s Form 10-K for the fiscal year ended December 28, 2014. | ||
10-7-10 | Form of Executive Officer Restricted Stock Unit Award Agreement.* | Incorporated by reference to Exhibit 10-21 to TEGNA Inc.’s Form 10-Q for the fiscal quarter ended September 27, 2015. | ||
10-7-11 | Form of Executive Officer Restricted Stock Unit Award Agreement.* | Incorporated by reference to Exhibit 10-3-2 to TEGNA Inc.’s Form 8-K filed on December 11, 2015. | ||
10-7-12 | Form of Executive Officer Performance Share Award Agreement.* | Incorporated by reference to Exhibit 10-6-8 to TEGNA Inc.’s Form 10-K for the fiscal year ended December 29, 2013. | ||
10-7-13 | Form of Executive Officer Performance Share Award Agreement. * | Incorporated by reference to Exhibit 10-6-11 to TEGNA Inc.’s Form 10-K for the fiscal year ended December 28, 2014. | ||
10-7-14 | Form of Executive Officer Performance Share Award Agreement.* | Incorporated by reference to Exhibit 10-6-11 to TEGNA Inc.’s Form 10-Q for the fiscal quarter ended March 29, 2015. | ||
10-7-15 | Form of Executive Officer Performance Share Award Agreement.* | Incorporated by reference to Exhibit 10-3-3 to TEGNA Inc.’s Form 8-K filed on December 11, 2015. | ||
73
10-8 | Amendment and Restatement Agreement, dated as of August 5, 2013, to each of (i) the Amended and Restated Competitive Advance and Revolving Credit Agreement, dated as of March 11, 2002 and effective as of March 18, 2002, as amended and restated as of December 13, 2004 and effective as of January 5, 2005, as amended by the First Amendment thereto, dated as of February 28, 2007 and effective as of March 15, 2007, as further amended by the Second Amendment thereto, dated as of October 23, 2008 and effective as of October 31, 2008, as further amended by the Third Amendment thereto, dated as of September 28, 2009, as further amended by the Fourth Amendment thereto, dated as of August 25, 2010 and as further amended by the Fifth Amendment and Waiver, dated as of September 30, 2010 (the “2002 Credit Agreement”), among TEGNA Inc., a Delaware corporation (“TEGNA”), the several banks and other financial institutions from time to time parties to the Credit Agreement (the “2002 Lenders”), JPMorgan Chase Bank, N.A., as administrative agent (in such capacity, the “2002 Administrative Agent”), JPMorgan Chase Bank, N.A. and Citibank, N.A., as syndication agents, and Barclays Bank PLC, as documentation agent, (ii) the Competitive Advance and Revolving Credit Agreement, dated as of February 27, 2004 and effective as of March 15, 2004, as amended by the First Amendment thereto, dated as of February 28, 2007 and effective as of March 15, 2007, as further amended by the Second Amendment thereto, dated as of October 23, 2008 and effective as of October 31, 2008, as further amended by the Third Amendment thereto, dated as of September 28, 2009, as further amended by the Fourth Amendment thereto, dated as of August 25, 2010, and as further amended by the Fifth Amendment and Waiver, dated as of September 30, 2010 (the “2004 Credit Agreement”), among TEGNA, the several banks and other financial institutions from time to time parties to the Credit Agreement (the “2004 Lenders”), JPMorgan Chase Bank, N.A., as administrative agent (in such capacity, the “Administrative Agent”), JPMorgan Chase Bank, N.A. and Citibank, N.A., as syndication agents, and Barclays Bank PLC and SunTrust Bank, as documentation agents and (iii) the Competitive Advance and Revolving Credit Agreement, dated as of December 13, 2004 and effective as of January 5, 2005, as amended by the First Amendment thereto, dated as of February 28, 2007 and effective as of March 15, 2007, as further amended by the Second Amendment thereto, dated as of October 23, 2008 and effective as of October 31, 2008, as further amended by the Third Amendment thereto, dated as of September 28, 2009, as further amended by the Fourth Amendment thereto, dated as of August 25, 2010 and as further amended by the Fifth Amendment and Waiver, dated as of September 30, 2010 (the “2005 Credit Agreement” and, together with the 2002 Credit Agreement and the 2004 Credit Agreement, the “Credit Agreements”), among TEGNA, the several banks and other financial institutions from time to time parties to the Credit Agreement (the “2005 Lenders” and, together with the 2002 Lenders and the 2004 Lenders, the “Lenders”), JPMorgan Chase Bank, N.A., as administrative agent (in such capacity, the “2005 Administrative Agent” and, together with the 2002 Administrative Agent and the 2004 Administrative Agent, the “Administrative Agent”), JPMorgan Chase Bank, N.A. and Citibank, N.A., as syndication agents, and Barclays Bank PLC, as documentation agent, by and between TEGNA, the Guarantors under the Credit Agreements as of the date hereof, the Administrative Agent, JPMorgan Chase Bank, N.A. and Bank of America, N.A., as issuing lenders and the Lenders party thereto. | Incorporated by reference to Exhibit 10-1 to TEGNA Inc.’s Form 10-Q for the fiscal quarter ended September 29, 2013. | ||
74
10-9 | Master Assignment and Assumption, dated as of August 5, 2013, by and between each of the lenders listed thereon as assignors and/or assignees. | Incorporated by reference to Exhibit 10-2 to TEGNA Inc.’s Form 10-Q for the fiscal quarter ended September 29, 2013. | ||
10-10 | Amended and Restated Competitive Advance and Revolving Credit Agreement, dated as of August 5, 2013, by and among TEGNA Inc., the several banks and other financial institutions from time to time parties thereto, JPMorgan Chase Bank, N.A., as administrative agent, and JPMorgan Chase Bank, N.A. and Citibank, N.A. as syndication agents. | Incorporated by reference to Exhibit 10-3 to TEGNA Inc.’s Form 10-Q for the fiscal quarter ended September 29, 2013. | ||
10-11 | Sixth Amendment, dated as of September 24, 2013, to the Competitive Advance and Revolving Credit Agreement, dated as of December 13, 2004 and effective as of January 5, 2005, as amended by the First Amendment thereto, dated as of February 28, 2007 and effective as of March 15, 2007, as further amended by the Second Amendment thereto, dated as of October 23, 2008 and effective as of October 31, 2008, as further amended by the Third Amendment thereto, dated as of September 28, 2009, as further amended by the Fourth Amendment thereto, dated as of August 25, 2010, as further amended by the Fifth Amendment and Waiver, dated as of September 30, 2010, and as further amended and restated pursuant to the Amended and Restated Competitive Advance and Revolving Credit Agreement, dated as of August 5, 2013, by and among TEGNA Inc., JPMorgan Chase Bank, N.A., as administrative agent, and the several banks and other financial institutions from time to time parties thereto. | Incorporated by reference to Exhibit 10-4 to TEGNA Inc.’s Form 10-Q for the fiscal quarter ended September 29, 2013. | ||
10-12 | Seventh Amendment, dated as of February 13, 2015, to the Competitive Advance and Revolving Credit Agreement, dated as of December 13, 2004 and effective as of January 5, 2005, as amended and restated as of August 5, 2013 and as further amended by the Sixth Amendment thereto, dated as of September 24, 2013, among TEGNA Inc., JPMorgan Chase Bank, N.A., as administrative agent, and the several banks and other financial institutions from time to time parties. | Incorporated by reference to Exhibit 10-1 to TEGNA Inc.’s Form 10-Q for the fiscal quarter ended March 29, 2015. | ||
10-13 | Eighth Amendment, dated as of June 29, 2015, to the Amended and Restated Competitive Advance and Revolving Credit Agreement, dated as of December 13, 2004 and effective as of January 5, 2005, as amended and restated as of August 5, 2013, and as further amended by the Seventh Amendment thereto dated as of February 13, 2015, and the Sixth Amendment thereto dated September 24, 2013, among TEGNA Inc., JPMorgan Chase Bank N.A., as administrative agent, and the several banks and other financial institutions from time to time parties thereto, as set forth on Exhibit A to the Eight Amendment. | Incorporated by reference to Exhibit 10-1 to TEGNA Inc.’s Form 10-Q for the fiscal quarter ended June 28, 2015. | ||
10-14 | Increased Facility Activation Notice, dated September 25, 2013, pursuant to the Amended and Restated Competitive Advance and Revolving Credit Agreement, dated as of August 5, 2013, by and among TEGNA Inc., JPMorgan Chase Bank N.A., as administrative agent, and the several banks and other financial institutions from time to time parties thereto. | Incorporated by reference to Exhibit 10-5 to TEGNA Inc.’s Form 10-Q for the fiscal quarter ended September 29, 2013. | ||
10-14-1 | Increased Facility Activation Notice, dated May 5, 2014, pursuant to the Amended and Restated Competitive Advance and Revolving Credit Agreement, dated as of August 5, 2013, by and among TEGNA Inc., JP Morgan Chase Bank, N.A., as administrative agent, and the several banks and other financial institutions from time to time parties thereto. | Incorporated by reference to Exhibit 10-1 to TEGNA Inc.’s Form 10-Q for the fiscal quarter ended June 29, 2014. | ||
10-14-2 | Increased Facility Activation Notice, dated as of September 23, 2015, pursuant to the Amended and Restated Competitive Advance and Revolving Credit Agreement, dated as of August 5, 2013, by and among TEGNA Inc., JPMorgan Chase Bank N.A., as administrative agent, and the several banks and other financial institutions from time to time parties thereto. | Incorporated by reference to Exhibit 10-1 to TEGNA Inc.’s Form 10-Q for the fiscal quarter ended September 27, 2015. | ||
10-15 | Description of TEGNA Inc.’s Non-Employee Director Compensation.* | Incorporated by reference to Exhibit 10-1 to TEGNA Inc.’s Form 10-Q for the fiscal quarter ended March 31, 2013. | ||
10-15-1 | Description of TEGNA Inc.’s Non-Employee Director Compensation.* | Incorporated by reference to Exhibit 10-4 to TEGNA Inc.’s Form 10-Q for the fiscal quarter ended March 29, 2015. | ||
75
10-15-2 | Description of TEGNA Inc.’s Non-Employee Director Compensation.* | Incorporated by reference to Exhibit 10-15 to TEGNA Inc.’s Form 10-Q for the fiscal quarter ended June 28, 2015. | ||
10-16 | Employment Agreement dated February 27, 2007, between TEGNA Inc. and Gracia C. Martore.* | Incorporated by reference to Exhibit 10-15 to TEGNA Inc.’s Form 10-K for the fiscal year ended December 31, 2006. | ||
10-16-1 | Amendment, dated as of August 7, 2007, to Employment Agreement dated February 27, 2007.* | Incorporated by reference to Exhibit 10-5 to TEGNA Inc.’s Form 10-Q for the fiscal quarter ended July 1, 2007. | ||
10-16-2 | Amendment, dated as of December 24, 2010, to Employment Agreement dated February 27, 2007.* | Incorporated by reference to Exhibit 10-14-2 to TEGNA Inc.’s Form 10-K for the year ended December 26, 2010. | ||
10-17 | Amendment for Section 409A Plans dated December 31, 2008.* | Incorporated by reference to Exhibit 10-14 to TEGNA Inc.’s Form 10-K for the fiscal year ended December 28, 2008. | ||
10-18 | Executive Life Insurance Plan document dated December 31, 2008.* | Incorporated by reference to Exhibit 10-15 to TEGNA Inc.’s Form 10-K for the fiscal year ended December 28, 2008. | ||
10-18-1 | Amendment No. 1 to the TEGNA Inc. Executive Life Insurance Plan Document dated as of June 26, 2015.* | Incorporated by reference to Exhibit 10-13 to TEGNA Inc.’s Form 10-Q for the fiscal quarter ended June 28, 2015. | ||
10-19 | Key Executive Life Insurance Plan dated October 29, 2010.* | Incorporated by reference to Exhibit 10-1 to TEGNA Inc.’s Form 10-Q for the fiscal quarter ended September 26, 2010. | ||
10-19-1 | Amendment No. 1 to the TEGNA Inc. Key Executive Life Insurance Plan dated as of June 26, 2015.* | Incorporated by reference to Exhibit 10-14 to TEGNA Inc.’s Form 10-Q for the fiscal quarter ended June 28, 2015. | ||
10-20 | Form of Participation Agreement under Key Executive Life Insurance Plan.* | Incorporated by reference to Exhibit 10-2 to TEGNA Inc.’s Form 10-Q for the fiscal quarter ended September 26, 2010. | ||
10-21 | Omnibus Amendment to Terms and Conditions of Restricted Stock Awards dated as of December 31, 2008.* | Incorporated by reference to Exhibit 10-17 to TEGNA Inc.’s Form 10-K for the fiscal year ended December 28, 2008. | ||
10-22 | Omnibus Amendment to Terms and Conditions of Stock Unit Awards dated as of December 31, 2008.* | Incorporated by reference to Exhibit 10-18 to TEGNA Inc.’s Form 10-K for the fiscal year ended December 28, 2008. | ||
10-23 | Omnibus Amendment to Terms and Conditions of Stock Option Awards dated as of December 31, 2008.* | Incorporated by reference to Exhibit 10-19 to TEGNA Inc.’s Form 10-K for the fiscal year ended December 28, 2008. | ||
10-24 | TEGNA Leadership Team Transitional Severance Plan* | Incorporated by reference to Exhibit 10-1 to TEGNA Inc.'s Form 10-Q for the fiscal quarter ended September 28, 2014. | ||
10-25 | TEGNA Inc. 2015 Change in Control Severance Plan.* | Incorporated by reference to Exhibit 10-1 to TEGNA Inc.'s Form 8-K filed on December 11, 2015. | ||
10-26 | TEGNA Inc. Executive Severance Plan.* | Incorporated by reference to Exhibit 10-2 to TEGNA Inc.'s Form 8-K filed on December 11, 2015. | ||
10-27 | Unit Purchase Agreement, dated as of August 5, 2014, by and among TEGNA Inc., Classified Ventures, LLC, the unit holders of Classified Ventures, LLC (the “sellers”), certain subsidiaries of the Sellers, Gannett Satellite Information Network, Inc., and Belo Ventures, Inc. | Incorporated by reference to Exhibit 2-1 to TEGNA Inc.'s Form 8-K filed on August 5, 2014. | ||
10-28 | Letter Agreement dated as of March 1, 2015, by and among the Icahn Group and TEGNA Inc. | Incorporated by reference to Exhibit 99-2 to TEGNA Inc.'s Form 8-K filed on March 2, 2015. | ||
10-29 | Voting and Proxy Agreement, dated as of October 15, 2015, by and among the Icahn Group and TEGNA Inc. | Incorporated by reference to Exhibit 10-1 to TEGNA Inc.'s Form 8-K filed on October 16, 2015. | ||
10-30 | Purchase and Sale Agreement, dated as of June 24, 2015, by and between GTMP Holdings, LLC and Tamares Tysons Corner LLC. | Incorporated by reference to Exhibit 10-3 to TEGNA Inc.'s Form 10-Q for the fiscal quarter ended September 27, 2015. | ||
10-30-1 | First Amendment to Purchase and Sale Agreement, dated as of July 2, 2015, by and between GTMP Holdings, LLC and Tamares Tysons Corner LLC. | Incorporated by reference to Exhibit 10-4 to TEGNA Inc.'s Form 10-Q for the fiscal quarter ended September 27, 2015. | ||
10-30-2 | Second Amendment to Purchase and Sale Agreement, dated as of July 14, 2015, by and between GTMP Holdings, LLC and Tamares Tysons Corner LLC. | Incorporated by reference to Exhibit 10-5 to TEGNA Inc.'s Form 10-Q for the fiscal quarter ended September 27, 2015. | ||
10-31 | Separation and Distribution Agreement, dated as of June 26, 2015, by and between TEGNA Inc. and Gannett Co., Inc., formerly known as Gannett SpinCo., Inc. | Incorporated by reference to Exhibit 2-1 to TEGNA Inc.'s Form 8-K filed on July 2, 2015. | ||
76
10-32 | Transition Services Agreement dated as of June 26, 2015, by and between TEGNA Inc. and Gannett Co., Inc., formerly known as Gannett SpinCo., Inc. | Incorporated by reference to Exhibit 10-1 to TEGNA Inc.'s Form 8-K filed on July 2, 2015. | ||
10-33 | Tax Matters Agreement, dated as of June 26, 2015, by and between TEGNA Inc. and Gannett Co., Inc., formerly known as Gannett SpinCo., Inc. | Incorporated by reference to Exhibit 10-2 to TEGNA Inc.'s Form 8-K filed on July 2, 2015. | ||
10-34 | Employee Matters Agreement, dated as of June 26, 2015, by and between TEGNA Inc. and Gannett Co., Inc., formerly known as Gannett SpinCo., Inc. | Incorporated by reference to Exhibit 10-3 to TEGNA Inc.'s Form 8-K filed on July 2, 2015. | ||
21 | Subsidiaries of TEGNA Inc. | Attached. | ||
23 | Consent of Independent Registered Public Accounting Firm. | Attached. | ||
31-1 | Certification Pursuant to Rule 13a-14(a) under the Securities Exchange Act of 1934. | Attached. | ||
31-2 | Certification Pursuant to Rule 13a-14(a) under the Securities Exchange Act of 1934. | Attached. | ||
32-1 | Section 1350 Certification. | Attached. | ||
32-2 | Section 1350 Certification. | Attached. | ||
101 | The following financial information from TEGNA Inc. Annual Report on Form 10-K for the year ended December 31, 2015, formatted in XBRL includes: (i) Consolidated Balance Sheets at December 31, 2015 and December 28, 2014, (ii) Consolidated Statements of Income for the 2015, 2014 and 2013 fiscal years, (iii) Consolidated Statements of Comprehensive Income for the 2015, 2014 and 2013 fiscal years, (iv) Consolidated Cash Flow Statements for the 2015, 2014 and 2013 fiscal years; (v) Consolidated Statements of Equity for the 2015, 2014 and 2013 fiscal years; and (vi) the Notes to Consolidated Financial Statements. | Attached. | ||
For purposes of the incorporation by reference of documents as Exhibits, all references to Form 10-K, 10-Q and 8-K of TEGNA Inc. refer to Forms 10-K, 10-Q and 8-K filed with the Commission under Commission file number 1-6961.
We agree to furnish to the Commission, upon request, a copy of each agreement with respect to long-term debt not filed herewith in reliance upon the exemption from filing applicable to any series of debt which does not exceed 10% of our total consolidated assets.
* | Asterisks identify management contracts and compensatory plans or arrangements. |
77
GLOSSARY OF FINANCIAL TERMS
Presented below are definitions of certain key financial and operational terms that we hope will enhance the reading and understanding of our 2015 Form 10-K.
ADJUSTED EBITDA – Net income attributable to TEGNA before (1) net income attributable to noncontrolling interests, (2) income taxes, (3) interest expense, (4) equity income, (5) other non-operating items, (6) workforce restructuring, (7) other transformation costs, (8) asset impairment charges, (9) depreciation and (10) amortization.
AMORTIZATION – A charge against our earnings that represents the write off of intangible assets over the projected life of the assets.
BALANCE SHEET – A summary statement that reflects our assets, liabilities and equity at a particular point in time.
MEDIA REVENUES – Primarily amounts charged to customers for commercial advertising aired on our television stations.
CURRENT ASSETS – Cash and other assets that are expected to be converted to cash within one year.
CURRENT LIABILITIES – Amounts owed that will be paid within one year.
DEFERRED INCOME – Revenue derived principally from advance subscription payments for advance fees for recruitment solutions. Revenue is recognized in the period in which it is earned (as recruitment solutions are delivered).
DEPRECIATION – A charge against our earnings that allocates the cost of property and equipment over the estimated useful lives of the assets.
DIGITAL/ONLINE REVENUES – These include revenue from advertising placed on all digital platforms that are associated with our media operations which are reflected as revenues of those business segment, and revenues from the businesses that comprise the Digital Segment, primarily CareerBuilder (human capital solutions), and Cars.com (website for car shoppers).
DIGITAL SEGMENT – Our reportable segment that includes the results of CareerBuilder, Cars.com, G/O Digital and Cofactor (also operating as ShopLocal).
DIVIDEND – A payment we make to our shareholders of a portion of our earnings.
EARNINGS PER SHARE (basic) – Our earnings divided by the average number of shares outstanding for the period.
EARNINGS PER SHARE (diluted) - Our earnings divided by the average number of shares outstanding for the period, giving effect to assumed dilution from outstanding stock options and restricted stock units.
EQUITY EARNINGS FROM INVESTMENTS – For those investments in which we own 50% or less, an income or loss entry is recorded in the Statements of Income representing our ownership share of the operating results of the investee company.
FOREIGN CURRENCY TRANSLATION – The process of reflecting foreign currency accounts of subsidiaries in the reporting currency of the parent company.
FREE CASH FLOW – Net cash flow from operating activities reduced by purchase of property and equipment as well as payments for investments and increased by proceeds from investments and voluntary pension contributions, net of related tax benefit.
GAAP – Generally accepted accounting principles.
GOODWILL – In a business purchase, this represents the excess of amounts paid over the fair value of tangible and other identified intangible assets acquired net of liabilities assumed.
NET INCOME ATTRIBUTABLE TO NONCONTROLLING INTERESTS – The portion of equity and net earnings in consolidated subsidiaries that is owned by others.
PERFORMANCE SHARE UNIT – An equity award that gives key employees the right to earn a number of shares of common stock over an incentive period based on how our total shareholder return (TSR) compares to the TSR of a representative peer group of companies.
PURCHASE – A business acquisition. The acquiring company records at its cost the acquired assets less liabilities assumed. The reported income of an acquiring company includes the operations of the acquired company from the date of acquisition.
RESTRICTED STOCK – An award that gives key employees the right to shares of our stock, pursuant to a vesting schedule.
RETAINED EARNINGS – Our earnings not paid out as dividends to shareholders.
STATEMENT OF CASH FLOWS – A financial statement that reflects cash flows from operating, investing and financing activities, providing a comprehensive view of changes in our cash and cash equivalents.
STATEMENT OF COMPREHENSIVE INCOME – A financial statement that reflects our changes in equity (net assets) from transactions and other events from non-owner sources. Comprehensive income comprises net income and other items reported directly in shareholders’ equity, principally the foreign currency translation adjustment and funded status of postretirement plans.
STATEMENT OF EQUITY – A financial statement that reflects changes in our common stock, retained earnings and other equity accounts.
STATEMENT OF INCOME – A financial statement that reflects our profit by measuring revenues and expenses.
STOCK-BASED COMPENSATION – The payment to employees for services received with equity instruments such as restricted stock, performance share units and stock options.
STOCK OPTION – An award that gives key employees the right to buy shares of our stock, pursuant to a vesting schedule, at the market price of the stock on the date of the award.
VARIABLE INTEREST ENTITY (VIE) - A variable interest entity is an entity that lacks equity investors or whose equity investors do not have a controlling interest in the entity through their equity investments.
78