UNITED STATES
SECURITIES AND EXCHANGE COMMISSION
Washington, DC 20549
FORM 10-K
(Mark One)
x | ANNUAL REPORT PURSUANT TO SECTION 13 OR 15(d) OF THE SECURITIES EXCHANGE ACT OF 1934 |
For the fiscal year ended December 28, 2014
¨ | TRANSITION REPORT PURSUANT TO SECTION 13 OR 15(d) OF THE SECURITIES EXCHANGE ACT OF 1934 |
For the transition period from to
Commission file number 1-6961
GANNETT CO., INC.
(Exact name of registrant as specified in its charter)
Delaware | 16-0442930 | |
(State or Other Jurisdiction of Incorporation or Organization) | (I.R.S. Employer Identification No.) | |
7950 Jones Branch Drive, McLean, Virginia | 22107-0910 | |
(Address of principal executive offices) | (Zip Code) | |
Registrant’s telephone number, including area code: (703) 854-6000
Securities registered pursuant to Section 12(b) of the Act:
Title of Each Class | Name of Each Exchange on Which Registered | |
Common Stock, par value $1.00 per share | The New York Stock Exchange | |
Securities registered pursuant to Section 12(g) of the Act: None
Indicate by check mark if the registrant is a well-known seasoned issuer, as defined in Rule 405 of the Securities Act. Yes x No ¨
Indicate by check mark if the registrant is not required to file reports pursuant to Section 13 or Section 15(d) of the Act. Yes ¨ No x
Indicate by check mark whether the registrant (1) has filed all reports required to be filed by Section 13 or 15(d) of the Securities Exchange Act of 1934 during the preceding 12 months (or for such shorter period that the registrant was required to file such reports), and (2) has been subject to such filing requirements for the past 90 days.
Yes x No ¨
Indicate by check mark whether the registrant has submitted electronically and posted on its corporate Web site, if any, every Interactive Data File required to be submitted and posted pursuant to Rule 405 of Regulation S-T (§232.405 of this chapter) during the preceding 12 months (or for such shorter period that the registrant was required to submit and post such files). Yes x No ¨
Indicate by check mark if disclosure of delinquent filers pursuant to Item 405 of Regulation S-K is not contained herein, and will not be contained, to the best of registrant’s knowledge, in definitive proxy or information statements incorporated by reference in Part III of this Form 10-K or any amendment to this Form 10-K (Check box if no delinquent filers). x
Indicate by check mark whether the registrant is a large accelerated filer, an accelerated filer, a non-accelerated filer or a smaller reporting company. See the definitions of “large accelerated filer,” “accelerated filer” and “smaller reporting company” in Rule 12b-2 of the Exchange Act:
Large accelerated filer | x | Accelerated filer | ¨ | Non-accelerated filer | ¨ | Smaller reporting company | ¨ |
Indicate by check mark whether the registrant is a shell company (as defined in Rule 12b-2 of the Act). Yes ¨ No x
The aggregate market value of the voting common equity held by non-affiliates of the registrant based on the closing sales price of the registrant’s Common Stock as reported on The New York Stock Exchange on June 27, 2014, was $6,921,231,774. The registrant has no non-voting common equity.
As of Feb. 1, 2015, 226,851,543 shares of the registrant’s Common Stock were outstanding.
DOCUMENTS INCORPORATED BY REFERENCE
The definitive proxy statement relating to the registrant’s Annual Meeting of Shareholders to be held on April 29, 2015, is incorporated by reference in Part III to the extent described therein.
INDEX TO GANNETT CO., INC.
2014 FORM 10-K
Item No. | Page | |
1 | ||
1A. | ||
1B. | ||
2 | ||
3 | ||
4 | ||
5 | ||
6 | ||
7 | ||
7A. | ||
8 | ||
9 | ||
9A. | ||
10 | ||
11 | ||
12 | ||
13 | ||
14 | ||
15 | ||
2
PART I
ITEM 1.BUSINESS
Overview
Gannett is an international media and marketing solutions company and one of the largest, most geographically diverse local content providers in the U.S. Through a vast network of broadcast, digital, mobile and print products, we inform and engage more than 115 million people every month. Our portfolio of trusted brands offers marketers unmatched local-to-national reach and customizable, innovative marketing solutions. As a digital media leader, we provide access to content on many different platforms; digital marketing services to businesses to help them more effectively use digital technology to engage customers and reach their sales goals; and Internet-based human resource solutions.
Our properties cover a wide range of geographies, demographics and content areas. Our connection to, and understanding of, our communities and local market relationships – many of which have spanned decades – provides us with unparalleled advantages.
We provide consumers with the information and entertainment they seek and connect them to their communities of interest through multiple platforms including television stations, desktop, smartphone, tablet products and print publications. We help businesses grow by providing marketing solutions that reach and engage their customers across diverse platforms.
We are focused on seizing the many opportunities presented by new digital technologies leading to shifting consumer trends while delivering leading-edge news and information and marketing solutions to consumers and advertisers across multimedia platforms. All of our businesses are focused on providing outstanding user experiences throughout their portfolio of products and services.
We are organized along three business segments: Broadcasting, Publishing and Digital. In 2014, we announced plans to create two publicly traded companies: one primarily focused on our Broadcasting and Digital businesses, and the other on our Publishing business and their related digital assets. The expected timetable for achieving that separation is mid-2015.
Within our Broadcasting Segment, we own or service (through shared service agreements or other similar agreements) 46 television stations in 38 markets. Excluding owner-operators, we are the No. 1 NBC affiliate group, No. 1 CBS affiliate group, and the No. 4 ABC affiliate group. These stations cover almost one-third of the U.S. population in markets with more than 35 million households. We are the largest independent station group of major network affiliates in the top 25 markets, with a uniquely diversified portfolio. Each television station has a robust digital presence, including mobile, to reach consumers wherever they are. About 32 million unique visitors access Gannett Broadcasting media organizations every month through desktops, smartphones and tablets, and there have been close to 1.7 million downloads of Broadcasting’s apps on mobile devices as consumer interest in mobile content delivery continues to increase in popularity.
Our Publishing Segment has tremendous national-to-local reach, comprising U.S. Community Publishing’s (USCP) rich portfolio of 81 unmatched, trusted local media organizations, a renowned national brand in USA TODAY, and international scale with our popular Newsquest media properties in the U.K. - along with hundreds of engaging affiliated digital, mobile and non-daily print products. USA TODAY is currently the nation’s number one newspaper in consolidated print and digital circulation, according to the Alliance for Audited Media’s September 2014 Publisher’s Statement. In addition, the inclusion of a unique branded edition of USA TODAY in 35 USCP local print editions provides local readers with even more exceptional local, regional and national news and information – all in one easily accessible package. USA TODAY in
February 2015 announced partnership deals with several non-Gannett news organizations to include the USA TODAY Local Edition as part of their print and digital offering to readers.
In the U.K, through our Newsquest group, we produce 18 daily paid-for publications and more than 125 weekly publications, magazines and trade publications. In late 2014, Newsquest launched a new daily paid-for title focused on the community supporting independence for Scotland from the rest of the U.K.
Publishing has a significant digital presence: Every month approximately 73.5 million unique visitors access USA TODAY content and approximately 30 million unique visitors seek out USCP digital media through desktops, smartphones and tablets. In addition, there have been more than 21 million downloads of USA TODAY’s award-winning app on mobile devices and 2 million downloads of USCP apps. Newsquest’s network of web sites attracts nearly 20 million unique visitors every month. Collectively, print products reach approximately 9.7 million dedicated U.S. readers every weekday, approximately 10.5 million every Sunday, and, in the U.K., Newsquest has a total average readership of approximately 6 million every week.
We own and operate a number of stand-alone digital subsidiaries, which are included in our Digital Segment, including two digital leaders, Cars.com and CareerBuilder, as well as several other well-positioned online companies.
Cars.com, which Gannett acquired full ownership of in October 2014, is the leading destination for online car shoppers, offering credible information from consumers and experts to help car buyers formulate opinions on what to buy, where to buy and how much to pay for a car. CareerBuilder, a global leader in human capital solutions, majority-owned by Gannett, provides services ranging from labor market intelligence to talent management software and other recruitment tools. It is the largest online job site in the U.S., measured both by traffic and revenue, has a presence in more than 60 markets worldwide and focuses on technology solutions and niche sites. Having served the market for almost twenty years, CareerBuilder continues to benefit from a history of building customer relationships, having gained market share each of the last nine years. Together, Cars.com and CareerBuilder provide our advertising partners with access to two very important categories – automotive and human capital solutions.
We generate revenues within our Broadcasting Segment through advertising, fees paid for retransmission of our television signals on satellite and cable networks and payments for other services, such as producing advertising content. Advertising includes local advertising focused on the immediate geographic area of the stations, national advertising, and advertising on the stations’ desktop, smartphone and tablet products. We generate revenue within our Publishing Segment through advertising and subscriptions to our print and digital publications. Our advertising teams sell retail, classified and national advertising across multiple platforms including print, online, mobile and tablet as well as niche publications. Across both Broadcasting and Publishing Segments, we generate revenue by providing digital marketing products and services, ranging from search to social media to web site development. CareerBuilder, the largest company in the Digital Segment, generates revenues both through its own sales force by providing talent and compensation intelligence, human resource related consulting services and recruitment solutions and through sales of employment advertising placed by affiliated media organizations. Cars.com generates revenues through online automotive advertising targeting car dealerships and national advertisers through its own direct sales force as well as its affiliate sales channels.
3
We have made substantial progress in our digital transformation, which has fundamentally changed the way we interact with our audiences and advertisers. In step with changes in the media landscape, we have used new technology to meet evolving consumer demands and create valuable new revenue streams. We generate digital revenues through online content subscription fees and advertising on various digital platforms including more than 120 domestic web sites affiliated with our publishing and television markets. In December, Gannett’s consolidated domestic Internet audience was 115 million unique visitors reaching 46% of the Internet audience, according to comScore Media Metrix Multi-platform.
Our digital offerings are deeply integrated with publishing and broadcasting product offerings, supported by shared infrastructure. Many digital offerings are reported within the operating results of our Publishing and Broadcasting Segments. As more fully described under “Strategy,” and “Strategic Acquisitions,” we have a number of initiatives underway supporting our digital transformation.
Strategy
In 2014, we made major strides toward achieving our transformation goals, while remaining focused on successfully executing our strategic growth initiatives, ensuring our continued evolution within the ever-changing media landscape.
We are following an ambitious business strategy integrated with a comprehensive capital allocation plan, which is designed to leverage our strong brands, deep community ties and financial strength. The strategy is centered on three themes:
• | Enhance local core news and marketing operations to make local franchises stronger and ties with the communities even deeper, thereby growing Publishing and the higher growth, higher margin Broadcasting and Digital businesses; |
• | Leverage hometown and brand advantages to accelerate growth by entering into or expanding high potential businesses; and |
• | Optimize assets on an ongoing basis to maintain a strong financial profile to improve efficiency and effectiveness, and drive increased shareholder value. |
We acquired Belo Corp. in December 2013, and Cars.com in October 2014. The addition of these two businesses created a dramatically more diversified, higher-margin and higher growth multimedia business. The Belo acquisition added deep connections in new markets, predominantly in Texas and the Northwest, and provided us with even greater geographic and network diversification. Cars.com is a leading independent research site for car shoppers and its acquisition doubled the size of our Digital Segment. The Digital and Broadcasting Segments on a combined basis now generate more than two-thirds of our Adjusted EBITDA and position us for sustainable growth and success in the digital age.
In addition to integrating these major acquisitions, during 2014 we continued to pursue and make significant progress on a number of specific strategic initiatives which are integrated across all three of our business segments: Broadcasting, Publishing and Digital. Progress on these strategic initiatives, capital allocation plan, and strategic acquisitions and dispositions follows:
All Access Content Subscription Model: In 2014, USCP continued to successfully enhance the All Access Content Subscription Model for its local media across the U.S. All subscriptions include full web, mobile, e-Edition and tablet access, with subscription prices that vary according to the frequency of print home delivery. In 2014, USCP engaged more than 1.6 million digitally activated subscribers and saw an increase of more than 27% in digital-only subscribers as well.
In some markets, particularly those with younger demographics, digital-only subscribers are approaching 10% of all accounts - and growing. In 2011, before the launch of the All Access Model, circulation revenues accounted for 29% of the division’s total revenue. In 2014, circulation revenues accounted for 36% of USCP total revenue.
The success of the All Access Content Subscription Model led us to create a USCP and USA TODAY pilot at four local Gannett media organizations. The project provided local consumers with an enhanced news product that leverages our unique ability to generate and distribute national content while enhancing its ever-important local hometown coverage. In addition to the local units enhancing their publications with more unique and robust local content, a local edition of USA TODAY is being included inside the print edition and e-Edition of each local publication. The initiative leverages our outstanding national content to further complement local reporting and creates new revenue streams for content we are already producing, creating added value. The added USA TODAY edition includes national News, Money and lifestyle content seven days a week. USA TODAY’s Sports coverage is integrated into local sports sections and a Life edition is included every Sunday. Readers get an average of approximately 70 pages of additional content per week in print and e-Editions as a result of these integration efforts. Following the success of the initiative in the pilot markets, we rolled out the project to an additional 31 local daily publications across the country in the first half of 2014. As a result of research, we know consumer reaction to the additional content has been very positive, which enhances the appeal of the local publications as preferred information sources for readers and makes them attractive platforms for advertisers looking to reach readers on both a local and national scale.
Digital Relaunch & Mobile: In 2014, the Digital Relaunch initiative was completed, providing all of Gannett’s Publishing and Broadcast properties (excluding certain former Belo stations) with a full suite of new products, including a proprietary content management system, a new database storage tier, programming tools, application frameworks and market-leading desktop sites, mobile web sites and mobile apps. This collection of products and services, known as the Gannett Digital Platform (the “GDP”), consists of three major components: (i) authoring and classification tools; (ii) a centralized data store managing over 25,000 new assets such as articles, videos, photos or interactive features per day as well as structured content and user data (including subscription management); and (iii) programming tools and frameworks for advertising and user experience that drive more than 600 digital products.
The migration of all Publishing and Broadcast sites onto the GDP has provided immediate benefits by enabling the sharing of content and information quickly and efficiently, and driving editorial and advertising innovation across applications. In 2014, new, innovative, high-end advertising products were deployed across our digital sites and applications, helping to drive digital advertising revenue growth and increasing the average price paid for our desktop advertising impressions. The launch of the new sites and applications has also resulted in a significant increase in both users and engagement across all platforms. Multi-platform unique visitors rose 23% year-over-year in December 2014 across divisions, according to comScore Media Metrix. In fact, at the end of 2014, we ranked No. 3 in the News and Information category, up from No. 5 in 2013. Cross-platform video plays have increased 51% year-over-year and for USCP, minutes spent per visitor have set all-time records, up 41% in December 2014.
4
In 2014, the Gannett Digital team also began preparing the groundwork for the next evolution of the GDP. This next generation platform will focus on the ability to create personalized experiences by connecting users’ preferences and behaviors with our large store of centralized content assets and advertising products.
USA TODAY Sports Media Group: USA TODAY Sports Media Group covers sports from the local high school level through college and professional teams and continues to build upon USA TODAY’s 30-year relationship with American sports fans. Its goal is to be the leading sports content provider by leveraging its national and local content, investing in original content, and acquiring additional distribution and content. In 2014, USA TODAY Sports Media Group continued to build upon the growth of 2013, expanding its digital presence to more than 42 million unique visitors each month. The efforts resulted in a 27% increase in comScore cross-platform unique visitor traffic year-over-year, with significant mobile audience growth of 60% versus 2013. Group highlights included:
• | Significant growth of “For The Win,” our social media sports news and entertainment site, growing page views by 24% year-over-year. |
• | Development of the College Football Fan Index, the only digital index that combines social media activity and fan voting to determine the ultimate college football fanbase. |
• | Launch of a new Fantasy section that includes information related to managing fantasy teams as well as opportunities to play in contests through Fantasy Score, a Weekly and Daily Fantasy League. |
• | Launch of the new USA TODAY Sports App in February 2015. The app includes trending sports news, scores, notifications and a quick and entertaining take on sports stories. The app is available for free of charge in the iOS App Store and Google Play for Android phones. |
USA TODAY Travel Media Group: The Travel Media Group worked collaboratively with USCP markets to continue the roll-out of local travel sections and now is part of nearly 30 local digital sites as a new travel section. It provides local markets with USA TODAY’s premium travel and lifestyle content, driving new opportunities with incremental traffic and advertising inventory. The Travel Media Group also completed the mobile-web roll-out for all eight Experience web sites, which supported a 9% increase in mobile web traffic in the fourth quarter 2014, vs. the third quarter 2014. Experience America reported record high, cross-platform page views of 13.8 million in October.
G/O Digital (Digital Marketing Services): G/O Digital offers a wide array of leading-edge digital marketing solutions that enable marketers and advertisers to better connect with local consumers online through products that drive results. For local businesses, G/O Digital offers an integrated digital marketing suite of products/services from search to social media to website development. For national brands and agencies, G/O Digital delivers local digital activation at national scale powered by G/O Digital brands: Shoplocal, BLiNQ Media and Key Ring.
G/O Digital partners with the nation’s top brands and retailers, including P&G, Target, Walmart and Walgreens, and leads digital marketing campaigns for thousands of local businesses across more than 110 local markets. Driven by the strong partnership with USCP and Broadcasting sales forces, G/O Digital again saw strong revenue traction year-over-year from small to medium-sized business (SMB) customers, with revenues from local advertisers up 66% over 2013, led by increases across key product solutions, including search, email and social marketing products.
Reinforcing its commitment to simplifying digital marketing and helping small and medium-sized businesses to grow their businesses, G/O Digital was recognized by Yahoo! as a Strategic Local Ambassador, which is the highest Yahoo! partnership tier and adds to its already strong search foundation as G/O Digital had previously been named a Google Premier SMB Partner. In addition, G/O Digital was ranked No. 2 nationwide by localseocompanies.com as the “Best Local SEO Company.” In 2014, G/O Digital also launched its “Leaders in Local” video series to highlight the value and benefits G/O Digital delivers to local businesses across the country. The launch was promoted via television and digital ads across Gannett broadcast markets, as well as a native advertising campaign within USATODAY.com.
Signaling its innovation and collaboration with national brands, retailers, agencies and publishers, G/O Digital has been named a finalist in the category of “Best In-Stream Video” at the 2015 Digiday Video Awards for its digital video advertising campaign for Lowe’s Home Improvement. This accomplishment reinforces G/O Digital’s mission to reshape the industry’s understanding and expectations of content marketing to deliver dynamic, personalized experiences and local store sales.
BLiNQ Media launched a first-to-market social marketing product, AutoLiFT, to enable auto brands, agencies and dealers to target in-market car shoppers with dynamic, localized incentives on Facebook. The solution’s public launch marks a milestone in automotive advertising.
Key Ring launched its latest features enhancement, known as Key Ring Express. As a result, users now receive notifications triggered by beacons and geo-fence targeting within 100 meters of store locations. Signaling its top position as the go-to mobile shopping app, Key Ring also was selected as the winner in the category of “Best Mobile App for E-Commerce & Retail” at the 2014 Digiday Mobi Awards.
Gannett Publishing Services: In 2011, Gannett Publishing Services (GPS) was formed to improve the efficiency of, and reduce the cost associated with, the production and distribution of Gannett’s printed products across all divisions in the U.S. In 2014, GPS completed its third year of directly managing the production and distribution functions for all of Gannett’s domestic publications, including all community newspapers and USA TODAY. GPS provides printing services in 35 U.S. locations and distribution services in all 50 states. Providing an efficient, cost-effective print platform and distribution network has resulted in substantial cost savings and superior operational performance. GPS continues to generate new revenue opportunities by leveraging its existing assets to provide advertising production, printing and packaging, and distribution services to third parties as an integrated nationwide business.
During 2014, GPS reduced annualized distribution costs and production costs by over $16 million as a result of consolidation, automation and other efficiency efforts.
Sourcing: The Sourcing initiative focuses on leveraging company-wide spending in key procurement categories and savings from contract renegotiations, increasing the efficiencies of operations as well as system enhancements to realize savings across all divisions. The goal of this initiative is to continually review consumption patterns and find efficient, productive ways to conduct business through centralized sourcing and procurement from negotiated partner agreements. In 2014, these efforts resulted in cost reductions of $69 million in specifically targeted spending categories.
5
Space Consolidation: The space consolidation initiative continues to proceed as we closed on a number of real estate sales opportunities and consolidated expiring leases. The real estate team focuses continually on portfolio optimization which includes selling older, underutilized buildings, relocating to more efficient, flexible, digitally-oriented office space, reconfiguring spaces to take advantage of leasing and subleasing opportunities, and combining operations where possible. Since the beginning of 2012, we have sold 54 properties consisting of more than 3 million square feet of space and more than 100 acres of excess land for a total of almost $140 million. Recent examples include the Detroit Free Press moving from a 100-year old building of approximately 326,000 square feet to a state-of-the-art, digital media facility in leased office space of 85,000 square feet; and The Indianapolis Star’s move from its 100-year old building of approximately 325,000 square feet to 104,000 square feet of space with a “mission-control” digital news hub.
Capital Allocation: Our approach to capital allocation is a key source of financial strength in support of current initiatives as well as providing flexibility for future opportunities. We spent $76 million in 2014 to repurchase 2.7 million of our shares, at an average price per share of $28.13. This share repurchase program was temporarily suspended upon the announcement of the Cars.com acquisition, but was re-initiated in February of 2015, well ahead of the timeline we had previously anticipated, as a result of our strong operating performance and the strength of our balance sheet. We have completed more than 50% of our $300 million authorization with 5.6 million shares repurchased at an average price of $27.03 per share.
In addition, dividends of $.80 per share were again distributed in 2014, allowing us to maximize the allocation of capital to provide strong return to shareholders during our growth and expansion efforts.
Strategic Actions, Acquisitions and Dispositions
In August 2014, we announced a plan to create two publicly traded companies: one exclusively focused on the Broadcasting and Digital businesses, and the other on the Publishing business. The transaction will create two focused companies with increased opportunities to grow organically across all businesses as well as pursue strategic acquisitions and is expected to be completed in mid-2015.
Strategic acquisitions continue to be a key component of our effort to grow our higher-margin businesses, and to accelerate growth by entering into or expanding high potential businesses across all of our segments. At the same time we announced the spin-off of our Publishing business, we also announced an agreement to acquire full ownership of Cars.com (formerly known as Classified Ventures, LLC). In October 2014, we acquired the remaining 73% interest in Cars.com, for $1.8 billion. Acquiring full ownership of Cars.com doubled Gannett’s Digital Segment, further accelerated our digital transformation and expanded our leading position in local media and marketing services in the automotive sector, one of the largest and most important categories for local marketing and advertising revenue.
In July 2014, we acquired six of London Broadcasting Company’s television stations in Texas for $215 million in an all-cash transaction. The acquisition included KCEN (NBC) in Waco-Temple-Bryan, KYTX (CBS) in Tyler-Longview, KIII (ABC) in Corpus Christi, KBMT (ABC) and its digital sub-channel KJAC (NBC) in Beaumont-Port Arthur, KXVA (FOX) in Abilene-Sweetwater and KIDY (FOX) in San Angelo. The purchase of these stations further deepened our broadcasting presence in the state of Texas without any overlap of Gannett’s current local broadcast and publishing portfolio.
In June 2014, we, along with Sander Media LLC, completed the previously announced sale of KTVK-TV and KASW-TV in Phoenix, AZ, to Meredith Corporation. As part of the sale, Sander Media conveyed to Meredith substantially all of its assets used in the operation of both KTVK-TV and KASW-TV, which Sander Media acquired upon completion of the Gannett-Belo transaction on December 23, 2013. We also conveyed certain other assets that we used to provide services to both KTVK-TV and KASW-TV, which we acquired from Belo upon close of the Gannett-Belo transaction. At the closing, Meredith simultaneously conveyed KASW-TV to SagamoreHill of Phoenix, LLC, which, through its affiliates, owns and operates two television stations in two markets.
In February 2014, we, along with Sander Media LLC, completed the sale of KMOV-TV in St. Louis, MO, to Meredith Corporation, following the receipt of regulatory approvals. The total sale price of the combined stations (KTVK-TV and KASW-TV in Phoenix and KMOV-TV in St. Louis) was $407.5 million.
We are now the largest independent station group of major network affiliates in the top 25 markets, with 18 stations in those markets. Excluding owner operators, we are now the largest owner of CBS affiliates and expanded our NBC affiliate group, which is already No. 1. We are the No. 4 ABC affiliate group.
In the Digital Segment, CareerBuilder acquired Broadbean, a leader in job distribution, candidate sourcing and big data analytics software, in April 2014. This acquisition was the latest step in CareerBuilder’s evolution as the premiere HR Software as a Service (SaaS) provider and focuses on bring recruiters and HR managers a faster, more convenient and more cost-effective way to acquire talent. Broadbean posts jobs on more than 6,000 job boards and social networks in 183 countries and has more than 60,000 users. Broadbean distributes more than 2 million jobs and generates more than 10 million job applications each month. Broadbean uses one interface to seamlessly search across various resume databases and, like CareerBuilder, offers powerful analytics around sourcing candidates and hires.
After the end of our fiscal year, we sold Gannett Healthcare Group (GHG) on December 29, 2014, to OnCourse Learning, an online education and training provider. GHG is a leading provider of continuing education, certification test preparation, online recruitment, digital media, publications and related services for nurses and other healthcare professionals in the United States.
General Company Information
Gannett was founded by Frank E. Gannett and associates in 1906 and was incorporated in 1923. We listed shares publicly for the first time in 1967 and reincorporated in Delaware in 1972. Our 227 million outstanding shares of common stock are held by approximately 7,200 shareholders of record in all 50 states and several foreign countries. We are headquartered in McLean, VA, near Washington, DC.
Business Segments
We have three principal business segments: Broadcasting, Publishing and Digital. Operating revenues and income from desktop, smartphone and tablet products associated with publishing operations are reported in the Publishing Segment. Operating revenues and income from desktop, smartphone and tablet products associated with broadcasting stations are reported in the Broadcasting Segment.
Financial information for each of our reportable segments can be found under Item 7 “Management’s Discussion and Analysis of Financial Condition and Results of Operations” and Item 8 “Financial Statements and Supplementary Data” of this Form 10-K.
6
Broadcasting Segment
Our Broadcasting Segment continues to achieve strategic growth following our acquisition of Belo Corp. on Dec. 23, 2013 and in 2014, six of London Broadcasting Company’s television stations in Texas. The purchase of these stations further deepens our broadcasting presence in the state of Texas without any overlap of our current local broadcast and publishing portfolio.
With the Belo and London transactions, we now have a presence in almost one-third of U.S. television households with a total market reach of more than 35 million households. Our station portfolio has doubled from 23 full-power stations to 46, including stations serviced by Gannett through shared services or other similar arrangements. Today we are more diversified by region and network affiliation and are now a leading company in the industry. Other than the Big Four networks themselves, we are the largest owner of Big Four affiliated stations in the top 25 markets.
Broadcasting Segment revenue in 2014 more than doubled to a new record and was up significantly on a pro forma basis as well. We are ahead of schedule in achieving the synergies we projected at the time we announced the Belo and London transactions, such as achieving higher retransmission consent rates and reducing redundant corporate costs. In addition, we are also increasing revenue share, audience share, and increasing operating efficiencies by applying numerous centralized services to those stations.
Broadcast affiliates and their network partners continue to have the broadest appeal in terms of household viewership, viewing time, and audience reach. The overall reach of events such as the Olympics and NFL Football, along with our extensive local news and non-news programming, continues to surpass the reach in viewership of individual cable channels. Our ratings and reach are driven by the quality of programs we and our network partners produce and by the strong local connections we have to our communities, which gives us a unique position among the numerous program choices viewers have, regardless of platform. Regarding retransmission consent revenues, broadcasters in each market combined represent about a third of all viewing, but only about a sixth of all subscriber fees. The market is continuing to align itself between audience and subscriber fees.
The primary sources of our broadcasting revenues are: 1) core advertising which includes local and national non-political advertising; 2) political advertising revenues which are driven by elections and peak in even years (e.g. 2014, 2012) and particularly in the second half of those years; 3) retransmission revenues representing fees paid by satellite and cable networks and telecommunications companies to carry our television signals on their network; 4) digital revenues which encompass digital marketing services and advertising on the stations’ website, tablet and mobile products; and 5) payments by advertisers to television stations for other services, such as production of programming from third parties and production of advertising material.
The advertising revenues generated by a station’s local news programs make up a significant part of its total revenues. Advertising rates are influenced by the demand for advertising time. This demand is influenced by a variety of factors, including the size and demographics of the local population, the concentrations of retail stores, local economic conditions in general, and the popularity of the station’s programming. As the market fluctuates with supply and demand, so does the station’s pricing. Almost all national advertising is placed through independent advertising representatives. Local advertising time is sold by each station’s own sales force.
Generally, a network provides programs to its affiliated television stations and sells on its own behalf commercial advertising for certain of the available advertising spots within the network programs. Our television stations produce local programming such as news, sports, and entertainment.
Retransmission consent and affiliation agreements: Pursuant to Federal Communications Commission (FCC) rules, every three years a local television station must elect to either (1) require cable and/or direct broadcasting satellite operators to carry the station’s signal or (2) enter into retransmission consent negotiations for carriage. At present, we have retransmission consent agreements with the majority of cable operators and the primary satellite providers for carriage of our television stations. We also have retransmission agreements with several major telecommunications companies.
Revenue from television retransmission fees has increased steadily in the last several years, better reflecting the value of the content that our Broadcasting Segment provides. While core advertising still represents a majority of broadcasting revenues, the contribution from retransmission revenues continues to grow.
In 2014, we completed retransmission negotiations with more than 300 providers. These are multi-year agreements that provide us with significant and steady revenue streams. Retransmission revenues are expected to grow significantly in 2015 and beyond.
On the affiliation agreement side, our ABC affiliation agreement was just renewed through 2018, a deal that includes those stations acquired from Belo and London Broadcasting as well as our original Gannett stations. Other affiliation agreements with CBS and NBC are staggered as a result of those recent acquisitions.
Programming and production: The costs of locally produced and purchased syndicated programming are a significant portion of television operating expenses. Syndicated programming costs are determined based upon largely uncontrollable market factors, including demand from the independent and affiliated stations within the market. In recent years, our television stations have emphasized our locally produced news and entertainment programming in an effort to provide programs that distinguish the stations from the competition, to increase locally responsible programming, and to be more cost effective.
Our television stations led the way in covering major news events during 2014. We also lead our communities by rallying and engaging people to participate in making our communities stronger, better places to work and live. For example, we leveraged our broad footprint for our coverage of the Ferguson, MO, civil unrest in 2014, with our coverage spanning more than four months and including journalists from across Gannett Broadcasting and USA TODAY. However, we also focused on finding solutions and affecting positive change through our #STL Together campaign, which created a pathway for dialog. #STL Together brought community leaders together to urge calm and promote unity. From the Ferguson police shooting and rioting, to the school shooting outside of Seattle, WA, to our nationwide Ebola coverage, Broadcasting provided strong community leadership on the issues as well as outstanding in-depth news coverage on-air, online and through our mobile devices.
Gannett television stations also led the way on the ratings side for the 2014 Winter Olympics in Sochi, Russia. Gannett NBC-affiliated stations, including those we service, took the top four spots in prime time and the top three spots in every Olympic day part among major market NBC stations within the most important demographic, adults 25 to 54. In prime time, KARE in Minneapolis-St. Paul was No. 1; KUSA in Denver, No. 2; KGW in Portland, OR, No. 3; and KING in Seattle was No. 4. We also saw extremely strong carry-over from prime time to late night news. Throughout the year, the division continued working closely with USA TODAY and USCP to develop and enhance content for consumers.
7
Stations collectively made a difference in their local communities by participating in our national Make A Difference Day. NBC joined the initiative this year, bringing more national attention to the effort, which was fully supported by our Broadcasting stations. Efforts ranged from 13,000 kids in Portland, OR, receiving school supplies, thanks to KGW, to two soldiers in Knoxville receiving a renovated and furnished home as a result of WBIR leading the effort.
This year Gannett stations earned a number of prestigious journalism awards including three Alfred I. DuPont awards (KPNX in Phoenix, WLTX in Columbia, SC, and WTSP in Tampa-St. Petersburg, FL), a George Polk Award, National Emmys, Peabody and multiple Edward R. Murrow awards. The following six broadcast properties received eight National Murrow Awards: WXIA in Atlanta, WGRZ in Buffalo, WFAA in Dallas, KARE in Minneapolis-St. Paul, KING in Seattle and WBIR in Knoxville, which accepted the award for Overall Excellence. No other broadcast company won as many national Murrow awards.
Competition: In each of its broadcast markets, our stations and affiliated digital platforms compete for revenues with other network-affiliated and independent television broadcasters and with other advertising media, such as radio broadcasters, cable television, newspapers, magazines, direct mail, out-of-home advertising and Internet media. Other sources of present and potential competition for our broadcasting properties include home video and audio recorders and players, direct broadcasting satellite, low power television, Internet radio, video offerings (both wire line and wireless) of telephone companies as well as developing video services. The stations compete in the emerging local electronic media space, which includes Internet or Internet-enabled devices, handheld wireless devices such as mobile phones and tablets, social media platforms, digital spectrum opportunities associated with DTV and the new Internet-enabled television. The technology that enables consumers to receive news and information continues to evolve. Our broadcasting stations compete principally on the basis of their audience share, advertising rates and audience composition.
The Broadcasting Segment continues to focus on increasing engagement on all platforms with local customers. As was the case the last several years, Gannett television stations saw growth in digital metrics as the stations’ content remains in high demand and product improvements continue to be favorably received by consumers. In 2014, total digital visitors were up 33% pro forma while total digital page views were up 12% pro forma. Mobile, including phones and tablets, apps and mobile web, grew significantly in 2014 and now accounts for 43% of the total digital page views. Digital video plays increased 34% pro forma as video continues to be highly desired on all platforms. Product enhancements to both the desktop and mobile digital products occur every year and are part of a continuous cycle of improving the customer experience and increasing consumer engagement.
Broadcasting is positioned to maximize engagement through social media. The synergistic relationship between social media and television is strong and we continue to explore ways to socially engage consumers on all screens for all types of programs. From major sporting events such as the Super Bowl and March Madness, to signature television events like the Grammy or Academy Award shows, to national breaking news events like the Ferguson police shooting or local news events like record snow storms in Buffalo, social media influences what people watch, what they share and what they talk about. Our social media reach doubled in 2014 and now counts over 8 million fans and followers for Twitter and Facebook.
Regulation: Our television stations are operated under the authority of the FCC, the Communications Act of 1934, as amended (Communications Act), and the rules and policies of the FCC (FCC Regulations).
Television broadcast licenses are granted for periods of eight years. They are renewable upon application to the FCC and usually are renewed except in rare cases in which a petition to deny, a complaint or an adverse finding as to the licensee’s qualifications results in loss of the license. We believe we are in substantial compliance with all applicable provisions of the Communications Act and FCC Regulations. We continue to file license renewal applications for our stations, including for several stations with license renewal applications pending from the last round of license renewals, and we expect these renewals to be granted in the ordinary course.
FCC Regulations also limit concentration of broadcasting control and regulate network and local programming practices. FCC Regulations govern multiple media ownership, limit, or in some cases prohibit, the common ownership or control of most communications media serving common market areas (for example, television and radio; television and daily newspapers; or radio and daily newspapers). The Communications Act includes a national ownership cap under which one company is permitted to serve no more than 39% of all U.S. television households. The market reach of stations that broadcast on UHF channels is discounted by 50% (the UHF discount). Our 42 television stations (excluding four stations we currently service under shared services and similar arrangements) reach approximately 24% of U.S. television households, applying the UHF discount. The FCC has proposed repeal of the UHF discount, and that proceeding remains pending. Without applying the UHF discount, our national reach would be approximately 29%. FCC Regulations permit common ownership of two television stations in the same market in certain defined circumstances, including situations where at least one of the commonly owned stations is outside the market’s top four rated stations at the time of acquisition and at least eight independent media “voices” remain after the acquisition.
FCC Regulations prohibit a television station owner from owning a daily newspaper in cases where the station’s contour encompasses the newspaper’s city of publication. In 2007, the FCC granted a permanent waiver authorizing our continued ownership of both KPNX-TV and The Arizona Republic in Phoenix, AZ. The FCC commenced a new review of its ownership rules in 2014, as it is required to do every four years. The FCC has proposed to retain the local television ownership rule, and proposed a modest relaxation of the newspaper/broadcast rule. Also in 2014, the FCC determined that certain joint sales agreements (JSAs) between television stations will be treated as attributable ownership interests. We are not parties to JSAs that will be made attributable under this rule. The FCC has proposed to require disclosure of shared services agreements and local news agreements. The current chair of the FCC has stated that he expects the ownership review commenced in 2014 to be completed by mid-2016. We are party to shared services agreements with certain third parties that own stations in markets where we also own daily newspapers. We are unable to predict whether or how the FCC’s rules in this area may change.
Congress has adopted legislation requiring the FCC to make changes to the rules concerning negotiation of retransmission consent agreements (which govern cable and satellite operators’ carriage of our signals). It is possible that in the future, Congress and the FCC will make additional changes to the Communications Act and to the statutory cable and satellite copyright regime, and to other FCC Regulations, respectively, including the rules concerning negotiation of retransmission consent; local exclusivity with respect to network and syndicated content; and other rules and policies
8
affecting our operations. As authorized by and pursuant to certain requirements established by Congress, the FCC has adopted certain rules and is seeking comment on additional rules to govern a voluntary “incentive auction” to reallocate certain spectrum currently occupied by television broadcast stations to mobile wireless broadband services, along with a related “repacking” of the television spectrum for remaining television stations. The repacking may entail television stations moving to different channels, having smaller service areas, and/or accepting additional interference. Congress has required that the FCC make “all reasonable efforts” to preserve the coverage area and population served of full-power and Class A television stations. The FCC’s interpretation of this requirement is subject to a judicial appeal. The legislation authorizing the repacking establishes a $1.75 billion fund for reimbursement of costs incurred by stations that are required to change channels in the repacking. It is too early to predict the likelihood, timing or outcome of any additional FCC regulatory action in this regard or the ultimate impact of the incentive auction and repacking upon our business.
In December 2014, the FCC proposed to expand the definition of multichannel video programming distributor (MVPD) to include certain “over-the-top” distributors of video programming that stream content to consumers over the Internet. If the FCC adopts this proposal, it could result in changes to how our stations’ signals are distributed, as well as how our video programming competitors reach viewers. We are unable to predict at this time whether the FCC will adopt this proposal or what the effect on our retransmission and advertising revenues will be, if any.
Publishing Segment
Our publishing business comprises 100 daily publications and digital platforms in the U.S. and U.K., including more than 400 non-daily publications in the U.S. and more than 125 such titles in the U.K. All of our local publishing operations and affiliated digital products operate through fully integrated shared support, sales and service platforms. Other businesses that are part of the publishing business include:
• | Clipper Magazine, a direct mail advertising magazine that publishes hundreds of local market editions under the brands Local Flavor, Clipper Magazine, Savvy Shopper and Mint Magazine in 29 states to more than 27 million consumers. |
• | Gannett Government Media, a worldwide multimedia business with digital, print and broadcast media properties focused on government, military and defense technology audiences. |
More than 73 million unique visitors access USA TODAY every month through desktops, smartphones and tablets; and 30.1 million unique visitors seek out USCP digital media monthly. Collectively, U.S. print products reach approximately 9.7 million dedicated U.S. readers every weekday, approximately 10.5 million every Sunday.
USA TODAY is currently the nation’s number one newspaper in consolidated print and digital circulation, according to the Alliance for Audited Media’s September 2014 Publisher’s Statement, with total daily circulation of 4.1 million and Sunday circulation of 3.7 million, which includes daily print, digital replica, digital non-replica, and branded editions. Our branded editions include the USA TODAY Local sections that are inserted into 35 community newspapers as of year-end. USA TODAY in February 2015 announced partnership deals with several non-Gannett news organizations to include the USA TODAY Local Edition as part of their print and digital offering to readers.
USA TODAY was introduced in 1982 as the country’s first national, general-interest daily publication. In 2014, we continued to build upon the success of 2013, solidifying our position as a leader
in digital content. Cross platform page views grew to an average of more than 1.2 billion a month, an increase of 13% over 2013. Our mobile products helped drive that growth, with an average 54% growth in monthly page views, reaching a high of more than 450 million page views. USA TODAY mobile visitors totaled 44.8 million in December 2014, reaching 25% of the mobile audience. This was a 33% increase from December 2013, according to comScore Mobile Metrix. In addition, USA TODAY's award-winning app is a top news app with 21.2 million downloads across iPad, iPhone, Android, Windows and Kindle Fire.
Newsquest’s digital audience increased substantially during 2014, with audited average daily unique users rising by 36%. Newsquest has a total average readership of approximately 6 million every week. During the year, Newsquest journalists took top prizes in five categories in the U.K.-wide Regional Press Awards.
USA TODAY digital and print content is produced at facilities in McLean, VA, and transmitted digitally to offset printing plants around the country. It is printed at our plants in 13 U.S. markets and commercially at offset plants owned by other print providers in 23 other U.S. markets.
Publishing non-daily products continued to be an important part of our market strategy in 2014. We produce non-daily publications in the U.S., including glossy lifestyle magazines, community publications and publications focused on a specific topic, such as health or cars.
Our strategy for non-daily publications is to appeal to key advertising segments (e.g., affluent women, families with children or young readers). Non-daily products help our print operations increase overall impressions and frequency for advertisers looking to reach specific audience segments or in some cases, like community weeklies, provide a lower price point alternative for smaller advertisers with specific geographic targets, thus helping to increase the local media organization’s local market share.
Audience research: As our publishing businesses relentlessly pursue their mission to meet consumers’ news and information needs anytime, anywhere and on any platform, we remain focused on an audience aggregation strategy. We consider the reach and coverage of our products across multiple platforms and measure the frequency with which consumers interact with each product to ensure our audiences remain highly engaged.
For example, results from a 2014 Scarborough Newspaper Penetration Report indicate two out of three adults in the Gannett Wisconsin East markets either read the print version of our publications (Appleton Post-Crescent/Fond du Lac Reporter/Green Bay Press-Gazette/Manitowoc Herald Times Reporter/Oshkosh Northwestern) or visit their web sites. This makes the Wisconsin East group the top-ranked local publishing operation in the country for integrated (combined print and online) audience penetration. According to the same report, three other USCP media organizations ranked in the Top 10: the Rochester (NY) Democrat and Chronicle ranked No. 3; the Des Moines Register, No. 8; and The Courier-Journal in Louisville, KY, No. 10.
We have gathered audience aggregation data for 55 of our markets and will continue to add more data in 2015. Aggregated audience data allows advertising sales staff to provide detailed information to advertisers about how best to reach their potential customers and the most effective product combination and frequency. This approach enables us to increase total advertising revenue potential while maximizing advertiser effectiveness.
In addition to the audience-based initiative, we continue to measure customer attitudes, behaviors and opinions to better understand customers’ digital use patterns and use qualitative research with audiences and advertisers to better determine their needs. In 2014, the USCP research group launched an ongoing
9
consumer satisfaction program in key markets. The initial wave included more than 7,600 interviews with consumers in 12 markets.
The group also conducted extensive consumer research regarding the integration of a USA TODAY edition into Gannett local newspapers resulting in USA TODAY now being inserted in 35 of our local USCP publications. Research showed that our subscribers reacted very favorably with nearly half saying they were more satisfied than before the addition of USA TODAY, and a third of them reporting they spend more time with the newspaper because of the additional USA TODAY content.
Advertising: We have advertising departments that sell retail, classified and national advertising across multiple platforms including print, online, mobile, tablet as well as niche publications. We have a national advertising sales force focused on the largest national advertisers and a separate sales organization to support classified employment sales - the Digital Employment Sales Center. G/O Digital provides marketing specialists to small and medium-sized businesses, and our Client Solutions groups provide customized marketing solutions. We have relationships with outside representative firms that specialize in the selling of national ads.
Retail display advertising is associated with local merchants or locally owned businesses. Retail includes regional and national chains - such as department and grocery stores - that sell in the local market.
National advertising is display advertising principally from advertisers who are promoting national products or brands. Examples are pharmaceuticals, travel, airlines, or packaged goods. Both retail and national ads include preprints, typically stand-alone multiple page fliers that are inserted in the daily print product.
Classified advertising includes the major categories of automotive, employment, legal and real estate/rentals. Advertising for classified segments is published in the classified sections, in other sections within the publication, on affiliated digital platforms and in niche magazines that specialize in the segment.
Proprietary research indicates that local and national advertisers find it challenging to manage the complexity of their marketing investment, particularly digital solutions. They are seeking to reach an increasingly elusive audience and are struggling to influence attitudes and behavior at each stage of the purchase path. To help advertisers solve this problem, a refined approach to media planning was created to present advertisers with targeted, integrated solutions. The planning process leverages our considerable advantage in data analysis and secondary research. The result is a tailored media/marketing plan where the individual elements work in concert to amplify and reinforce the advertiser’s message.
USCP continues to use online reader panels in 18 markets to measure advertising recall and effectiveness, article response, and identify consumer sentiment and trends. The reader panels include more than 30,000 opt-in respondents who have provided valuable feedback on more than 8,100 advertisements and 5,800 news articles. This capability allows sales staff in markets to provide deeper insights and return-on-investment metrics to advertisers.
Our consultative multi-media sales approach has been tailored to all levels of advertisers, from small, locally owned merchants to large, complex businesses. Along with this sales approach, we have intensified our sales and management training and improved the quality of sales calls. Digital product integration, sales pipeline management and a five-step consultative sales process were focus areas in 2014, with formal training delivered in all our markets. Front-line sales managers in all USCP markets participated in intensive training to help them coach their sales executives for top performance.
Online operations: In support of the All Access Content Subscription Model, we continue to invest in a significant expansion of mobile offerings across local markets, including native applications for iPhone and Android smartphones and iPads and tablet-optimized web sites. The mobile audience at our USCP markets continued to grow in 2014, ultimately making up approximately 30% of total page views, with mobile web sites and the native iPhone applications leading the way.
Through the All Access Content Subscription Model, we made a clear commitment to provide consumers with the content they most want on the devices they use to access news and information about their local communities. Mobile page views increased 114% and mobile visitors increased 184% in 2014 on a year-over-year basis.
In 2013, we implemented a social media content management software tool to allow the division’s journalists and marketing and customer service teams to more effectively manage multiple social media profiles and significantly increase their responsiveness and engagement with consumers.
We continue to enjoy a long-standing relationship of trust in our local business communities. Our advertising sales staff delivers solutions for our customers. Our digital marketing services provide localized marketing solutions to national and small to medium-sized businesses, helping them navigate the increasingly complex and diverse world of digital marketing. In 2014, we further expanded our G/O Digital suite of products and continued our partnership with Yahoo! to offer more digital solutions to advertisers. Through this, we are able to offer our customers expanded digital reach.
The overriding objective of our digital strategy is to provide compelling content that best serves our customers. A key reason customers turn to our digital platforms is to find local news and information. The credibility of the local media organization, a known and trusted information source, includes its digital platforms (tablet, mobile applications and its web site) and differentiates these digital sources from competing digital products. This allows our local media organizations to compete successfully as information providers.
A second objective in our digital business development is to leverage the natural synergies between the local media organizations and local digital platforms. The local content, customer relationships, news and advertising sales staff, and promotional capabilities are all competitive advantages for us. Our strategy is to use these advantages to create strong and timely content, sell packaged advertising products that meet the needs of advertisers, operate efficiently and leverage the known and trusted brand of the local media organization.
Gannett Media Technology International (GMTI) builds, manages and maintains the infrastructure that supports the desktop, mobile and native app digital presence associated with our U.S. newspaper and television businesses. GMTI partners with Gannett development teams to design applications and deliver platform enhancements in accelerated, iterative cycles with stringent quality standards. GMTI also provides application support and training for our teams across the country.
Circulation: USCP delivers content in print and online, via mobile devices and tablets. Digital access increased across all publications, driven by the All Access Content Subscription Model. USCP’s All Access Content Subscription Model has more than 1.6 million digitally activated subscribers, enabling them easy access to content-rich products. In a trend generally consistent with the domestic publishing industry, print circulation volume declined in 2014.
EZ Pay, a payment system which automatically deducts subscription payments from customers’ credit cards or bank accounts, enhances the subscriber retention rate. At the end of 2014, EZ Pay was used by 63% of all subscribers at our USCP sites.
10
For USCP, single copy represents approximately 15% of daily and 24% of Sunday net paid circulation volume.
The single copy price of USA TODAY at newsstands and vending machines was $2.00 in 2014. Mail subscriptions are available nationwide and abroad, and home, hotel and office delivery is available in many markets. Approximately 82% of its net paid circulation results are from single-copy sales at newsstands, vending machines or provided to hotel guests. The remainder is from home and office delivery, mail, educational and other sales.
At the end of 2014, 71 of our domestic daily publications, including USA TODAY, were published in the morning, and 11 were published in the evening.
Production and distribution: In 2011, Gannett Publishing Services, or GPS, was formed to improve the efficiency and reduce the cost associated with producing and distributing our printed products across all divisions in the United States. GPS directly manages the production and distribution operations for all of our domestic publishing operations including all community newspapers and USA TODAY.
GPS leverages our existing assets, including employee talent and experience, physical plants and equipment, and its vast national and local distribution networks. GPS is responsible for imaging, advertising production, page processing, internal and external printing and packaging, and internal and external distribution of our printed products. We continue to benefit from consolidations of print facilities and the optimization of our carrier force and routing structure within our distribution network.
Gannett Imaging and Ad Design Centers (GIADC), which are utilized for commercial imaging and advertising production, serve 81 publishing properties, including USA TODAY and all USCP dailies with the exception of Guam, our Broadcasting properties, and complete special projects for other internal businesses. GIADC is utilized for commercial imaging and/or advertising production by 44 external customers. In 2014, we completed the centralization of our page-release process into the GIADC centers, resulting in standardization and efficiencies. The GIADC now handles the step between the creation of the printed pages at our five regional Design Studios and the production at both internal and external plants.
At the end of 2014, almost all USCP and USA TODAY employees were utilizing a common content management system. The common content management system enables the communication and collaboration needed to build strong design remotely. The studios are operationally efficient while enhancing design in company-wide publications.
Newsquest operates its publishing activities around regional centers to maximize the use of management, finance, printing and personnel resources. This enables the group to offer readers and advertisers a range of attractive products across the market. The clustering of titles and, usually, the publication of a free print product alongside a paid-for print product, allows cross-selling of advertising serving the same or contiguous markets, satisfying the needs of its advertisers and audiences.
Newsquest produces free and paid-for print products with quality local editorial content. Newsquest also distributes advertising leaflets in the communities it serves. Most of Newsquest’s paid-for distribution is outsourced to wholesalers, although direct delivery is employed as well to maximize circulation sales opportunities.
Newspaper partnerships: We own a 19.49% interest in California Newspapers Partnership, which includes 19 daily California newspapers; a 40.64% interest in Texas-New Mexico Newspapers Partnership, which includes six daily newspapers in Texas and New Mexico and four newspapers in Pennsylvania; a 13.50% interest in Ponderay Newsprint Company in the state of Washington; and a 50% partnership interest in TNI Partners, which provides service to a non-Gannett publication in Tucson, AZ.
Competition: Our publishing operations and affiliated digital platforms compete with other media and digital ventures for advertising. Publishing operations also compete for circulation and readership against other professional news and information operations and amateur content creators. Very few of our publishing operations have daily competitors that are published in the same city. Most of our print products compete with other print products published in suburban areas, nearby cities and towns, free-distribution and paid-advertising publications (such as weeklies), and other media, including magazines, television, direct mail, cable television, radio, outdoor advertising, directories, e-mail marketing, web sites and mobile-device platforms.
The rate of development of opportunities in, and competition from, digital media, including web site, tablet and mobile products, is increasing. Through internal development, content distribution programs, acquisitions and partnerships, our efforts to explore new opportunities in the news, information and communications business and in audience generation will keep expanding.
We continue to seek more effective ways to engage with local communities using all available media platforms and tools.
Environmental regulation: We are committed to protecting the environment. Our goal is to ensure our facilities comply with federal, state, local and foreign environmental laws and to incorporate appropriate environmental practices and standards in our operations. We are one of the industry leaders in the use of recycled newsprint, increasing our purchase of newsprint containing recycled content from 42,000 metric tons in 1989 to 138,980 metric tons in 2014. During 2014, 37% of our domestic newsprint purchases contained recycled content, with an average recycled content of 45%. Additional information about our environmental and sustainability initiatives can be found on page 13.
Our operations use inks, solvents and fuels. The use, management and disposal of these substances are sometimes regulated by environmental agencies. We retain a corporate environmental consultant who, along with internal and outside counsel, oversees regulatory compliance and preventive measures. Some of our subsidiaries have been included among the potentially responsible parties in connection with sites that have been identified as possibly requiring environmental remediation. Additional information about these matters can be found in Part I, Item 3, Legal Proceedings, in this Form 10-K.
Raw materials: Newsprint, which is the basic raw material used in print publication, has been and may continue to be subject to significant price changes from time to time. During 2014, our total newsprint consumption was 377,467 metric tons, including consumption by USA TODAY, tonnage at non-Gannett print sites and Newsquest. Newsprint consumption was 7% less than in 2013. We purchase newsprint from 15 domestic and global suppliers.
In 2014, global newsprint supplies were adequate. We continue to moderate newsprint consumption and expense through press web-width reductions and the use of lighter basis weight paper. We believe available sources of newsprint, together with present inventories, will continue to be adequate to supply the needs of our publishing operations.
Joint operating agencies: Our publishing subsidiary in Detroit participates in a joint operating agency (JOA). The JOA performs the production, sales and distribution functions for the subsidiary and another publishing company under a joint operating agreement. Operating results for the Detroit JOA are fully consolidated along with a charge for the minority partner’s share of profits.
11
Digital Segment
The largest businesses within our Digital Segment are Cars.com, CareerBuilder, PointRoll and Shoplocal.
In October 2014, we acquired the remaining 73% interest we did not already own in Cars.com. With the acquisition, Cars.com joined CareerBuilder.com and several other online companies in Gannett’s digital business.
Launched in 1998, Cars.com is a leading independent research site for car shoppers with approximately 30 million visits per month. Independent automotive research sites have become an integral part of today’s car shopping process. Today, nearly all consumers visit a third-party site such as Cars.com during their shopping journey to research vehicle and dealership information and build confidence in the decision-making process. Cars.com offers credible and easy-to-understand information from consumers and experts to provide car buyers greater control over the shopping process. Leveraging its growing audience, Cars.com informs digital marketing strategies through consumer insights and innovative products, helping automotive dealers and manufacturers more effectively reach in-market car shoppers. Cars.com hosts approximately 4 million vehicle listings and serves more than 20,000 customers that are primarily franchise and independent car dealers in all 50 states. In January 2015, Cars.com expanded into the area of service, introducing a solution that provides information about reputable repair shops and allows consumers to get estimates on potential vehicle repairs. Cars.com is located in Chicago, IL.
CareerBuilder is the global leader in human capital solutions, helping companies target, attract and retain talent. Through constant innovation, unparalleled technology, and customer care delivered at every touch point, CareerBuilder helps match the right talent with the right opportunity more than any other site.
CareerBuilder offers a wide array of services and works with the world’s top employers, providing everything from labor market intelligence to talent management software and other recruitment solutions. CareerBuilder is changing the way companies source, engage and re-engage talent. CareerBuilder1 is a single sign-on HR software solution that leverages advertising, data and technology into one pre-hire platform so employers can hire the best talent, faster. Most of the revenues are generated by its own sales force but substantial revenues are earned through sales of employment advertising placed with CareerBuilder’s owners’ affiliated media organizations.
Its online job site, CareerBuilder.com, is the largest in North America with the highest revenue.
Headquartered in Chicago, IL, CareerBuilder and its subsidiaries operate in the U.S., Europe, Canada, Asia, Australia and South America. Its sites, combined with its partnerships, give CareerBuilder a presence in more than 60 markets worldwide.
In 2014, CareerBuilder acquired Broadbean Technology Limited, Broadbean Incorporated and Broadbean Technology PTY LTD (collectively Broadbean), headquartered in the U.K. Broadbean is the global leader in providing sophisticated, yet easy-to-use candidate sourcing tools that help recruiters improve efficiency and increase return on investment. Broadbean’s software makes it easy to distribute jobs and search for talent online, while providing tools that optimize the recruitment process and integrate internal systems. Broadbean’s analytics assist employers by giving insight on the most successful sourcing channels as well as providing metrics to increase effectiveness, ultimately lowering the cost of online recruitment spend. Broadbean is a leader in job distribution, candidate sourcing and big data analytics software.
PointRoll is a multi-screen digital advertising technology and services company. PointRoll enables advertisers, agencies, and publishers to create, target, deploy, and optimize digital campaigns in real time across any digital channel including display, rich media, in-stream video, mobile, tablet and more. PointRoll provides the creative tools, analytics and expertise marketers need to effectively engage consumers and convert them into buyers and brand supporters. Founded in May 2000, PointRoll has been instrumental in the evolution of digital engagement and has evolved beyond the expandable banner advertising to offer marketers the ability to find consumers wherever they are across any digital platform and deliver a relevant brand or direct response experience, dramatically improving advertising effectiveness while gaining actionable insights. PointRoll is headquartered in King of Prussia, PA, and maintains offices across the U.S.
Shoplocal is the leader in turnkey local, at scale interactive marketing that turns content into commerce for national retailers, brands and agencies. Shoplocal offers a complete suite of innovative digital advertising solutions to connect with shoppers along the path to purchase, driving measurable in-store sales and ROI. Shoplocal partners with more than 100 of the nation’s top retailers and brands, including CVS, Kohl’s, Lowe’s, Macy’s, Publix, Staples, Target, Walmart and Walgreens, to deliver localized promotions to shoppers at national scale through online circulars, display advertising, search, social media, digital out of home and mobile. Shoplocal is headquartered in Chicago, IL.
Competition: For Cars.com, in recent years dealers have shifted an increasing portion of their advertising budgets to new entrants with niche advertising products. Dealers also continue to invest in SEM and SEO to drive traffic directly to their own websites, bypassing third-party sites while still investing in traditional media such as television, radio and newspapers. Cars.com has maintained its leadership position through its award-winning site and through innovative new products for its advertisers. In the current competitive climate, the need to innovate and to connect an advertiser’s investment to eventual sales at a local level will be of increasing importance.
For CareerBuilder, the largest online employment site in North America, the market for online recruitment solutions is highly competitive with a multitude of online and offline competitors. Competitors include other employment related web sites, general classified advertising web sites, professional networking and social networking web sites, traditional media companies, Internet portals, search engines and blogs. The barriers for entry into the online recruitment market are relatively low and new competitors continue to emerge. Recent trends include the rising popularity of professional and social media networking websites which have gained traction with employer advertisers. The number of niche job boards targeting specific industry verticals has also continued to increase. CareerBuilder’s ability to maintain its existing customer base and generate new customers depends to a significant degree on the quality of its services, pricing, product innovation and reputation among customers and potential customers.
For PointRoll, the market for rich media advertising technology solutions is highly competitive. Competitors include divisions of larger public media and technology companies, and several earlier-stage independent rich media, dynamic ad, video, mobile, and social advertising technology specialists. The barriers to entry in the rich media market are moderate. Recent trends include the shift towards audience-centric, exchange-based media buying, entry of dynamic advertising generation specialists, the move towards automated creative design tools, and the shift toward video content online with associated in-stream advertising opportunities. Increasingly, marketers and their agencies are looking for advertising technology providers that can scale across media platforms, including rich
12
media, video and mobile. PointRoll’s ability to maintain and grow its customer base and revenue depends largely on its continued product innovation, level of service quality, depth of marketing analytics and ultimately the effectiveness of its rich media advertising and resulting customer satisfaction.
For Shoplocal, the market for digital store promotions is highly competitive and evolving as digital media transforms marketing programs. Shoplocal competitors in the online circular space are few. Media fragmentation continues to challenge retailers and Shoplocal is well positioned to deliver solutions to meet this challenge. Shoplocal anticipates continued benefits from growth in online-influenced offline retail sales. The scale of Shoplocal’s proprietary retail database and its established distribution partnerships is a source of advantage in this space. Shoplocal enables delivery of all types of promotional content to any digitally connected device across all platforms, a key factor with the continued surge in mobile and social usage among consumers.
Regulation and legislation (impacting Digital Segment businesses and digital operations associated with Publishing and Broadcasting businesses): The U.S. Congress has passed legislation which regulates certain aspects of the Internet, including content, copyright infringement, taxation, access charges, liability for third-party activities and jurisdiction. Federal, state, local and foreign governmental organizations have enacted and also are considering other legislative and regulatory proposals that would regulate the Internet. Areas of potential regulation include, but are not limited to, user privacy and intellectual property ownership. With respect to user privacy, the legislative and regulatory proposals could regulate behavioral advertising, which specifically refers to the use of user behavioral data for the creation and delivery of more relevant, targeted Internet advertisements. Some of our properties leverage certain aspects of user behavioral data in their solutions.
Employees
At the end of 2014, we and our subsidiaries had approximately 31,250 full-time and part-time employees including 2,800 CareerBuilder employees.
2014 | 2013 | ||||
Broadcast | 5,100 | 4,800 | |||
Publishing | 20,950 | 23,000 | |||
Digital | 4,400 | 3,000 | |||
Corporate and unallocated | 800 | 800 | |||
Total company | 31,250 | 31,600 | |||
Approximately 10% of our employees (including subsidiaries) in the U.S. are represented by labor unions. They are represented by 67 local bargaining units, most of which are affiliated with one of eight international unions under collective bargaining agreements. These agreements conform generally with the pattern of labor agreements in the publishing and broadcasting industries. We do not engage in industry-wide or company-wide bargaining. Our U.K. subsidiaries bargain with two unions over working practices, wages and health and safety issues only.
Environmental and Sustainability Initiatives
We are committed to making smart decisions to protect the environment and manage our environmental impact responsibly. We have taken a number of steps to reduce our environmental impact and underscore our commitment to sustainability.
We have been an industry pioneer in switching to environmentally-friendly press products, such as low-VOC (Volatile Organic Compound) washes and fountain solutions and citrus-based press cleaners. All colored inks we use are soy-based rather than petroleum-based, and delivered in reusable containers. Our waste ink is recycled, either on-site or at the manufacturer’s facility. We continue to minimize landfill usage by collecting used paper, plastics and other materials for recycling and have substantially reduced water usage by switching to dry methods of photo processing and plate processing.
We have reduced greenhouse emissions by using newsprint vendors who practice sustainability, switching to light-weight newsprint, and reducing the web width of the newspapers printed.
We are focused on energy efficiency. We have relocated many employees in older facilities to newer, more energy efficient offices. We have also installed more energy efficient systems and appliances in many of our buildings. Since 2012, our energy reduction program has reduced estimated energy usage by almost 12 million kilowatt hours annually. For 2015, we have identified new projects to reduce power consumption further.
Our Green Operating Employee Group serves as a forum to review and recommend “green” ideas and practices. The group maintains an intranet site that provides an accessible, informative and interactive resource highlighting new and innovative green best practices which help our businesses and properties develop more sustainable operating practices.
Many of our media organizations cover environmental and sustainability issues. A good example is The Des Moines Register, which – in a journalistic first – used a combination of traditional print coverage and emerging digital technologies, including virtual reality, to examine how Iowa farm families are responding to climate change as well as cultural, economic and technological changes. The series was published across many of our other digital media properties.
Make A Difference Day is the nation’s largest day of volunteering. For more than 20 years, we have mobilized millions of people across the U.S. for this national day of service. Volunteer efforts often include environmentally beneficial projects such as planting trees or gardens, cleaning up trash and planting sod.
The Gannett Foundation supports non-profit activities in communities where we do business and contributes to a variety of charitable causes through its Community Grant Program. One of Gannett Foundation’s community action grant priorities is environmental conservation.
13
MARKETS WE SERVE
TELEVISION STATIONS AND AFFILIATED DIGITAL PLATFORMS
State/District of Columbia | City | Station/web site | Channel/Network | Affiliation Agreement Expires in | Weekly Audience (5) | Founded | |
Arizona | Flagstaff | KNAZ-TV: azcentral.com/12news | Ch. 2/NBC | 2017 | (6 | ) | 1970 |
Phoenix | KPNX-TV: azcentral.com/12news | Ch. 12/NBC | 2017 | 1,187,000 | 1953 | ||
Tucson | KMSB-TV(1): tucsonnewsnow.com | Ch. 11/FOX | 2016 | 212,000 | 1967 | ||
KTTU-TV(1): tucsonnewsnow.com | Ch. 18/MNTV | 2016 | 81,000 | 1984 | |||
Arkansas | Little Rock | KTHV-TV: todaysthv.com | Ch. 11/CBS | 2015 | 416,000 | 1955 | |
California | Sacramento | KXTV-TV: news10.net | Ch. 10/ABC | 2018 | 832,000 | 1955 | |
Colorado | Denver | KTVD-TV: ktvd.com | Ch. 20/MNTV | 2016 | 562,000 | 1988 | |
KUSA-TV: 9news.com | Ch. 9/NBC | 2017 | 1,114,000 | 1952 | |||
District of Columbia | Washington | WUSA-TV: wusa9.com | Ch. 9/CBS | 2015 | 1,682,000 | 1949 | |
Florida | Jacksonville | WJXX-TV: firstcoastnews.com | Ch. 25/ABC | 2018 | 390,000 | 1989 | |
WTLV-TV: firstcoastnews.com | Ch. 12/NBC | 2017 | 450,000 | 1957 | |||
Tampa-St. Petersburg | WTSP-TV: wtsp.com | Ch. 10/CBS | 2015 | 1,238,000 | 1965 | ||
Georgia | Atlanta | WATL-TV: myatltv.com | Ch. 36/MNTV | 2016 | 737,000 | 1954 | |
WXIA-TV: 11alive.com | Ch. 11/NBC | 2017 | 1,512,000 | 1948 | |||
Macon | WMAZ-TV: 13wmaz.com | Ch. 13/CBS | 2015 | 199,000 | 1953 | ||
Idaho | Boise | KTVB-TV(3): ktvb.com | Ch. 7/NBC | 2015 | 191,000 | 1953 | |
Kentucky | Louisville | WHAS-TV(1): whas11.com | Ch. 11/ABC | 2018 | 456,000 | 1950 | |
Louisiana | New Orleans | WWL-TV: wwltv.com | Ch. 4/CBS | 2017 | 556,000 | 1957 | |
WUPL-TV(4): wupltv.com | Ch. 54/MNTV | 2016 | 154,000 | 1955 | |||
Maine | Bangor | WLBZ-TV: wlbz2.com | Ch. 2/NBC | 2017 | 106,000 | 1954 | |
Portland | WCSH-TV: wcsh6.com | Ch. 6/NBC | 2017 | 283,000 | 1953 | ||
Michigan | Grand Rapids | WZZM-TV: wzzm13.com | Ch. 13/ABC | 2018 | 350,000 | 1962 | |
Minnesota | Minneapolis-St. Paul | KARE-TV: kare11.com | Ch. 11/NBC | 2017 | 1,269,000 | 1953 | |
Missouri | St. Louis | KSDK-TV: ksdk.com | Ch. 5/NBC | 2017 | 964,000 | 1947 | |
New York | Buffalo | WGRZ-TV: wgrz.com | Ch. 2/NBC | 2017 | 499,000 | 1954 | |
North Carolina | Charlotte | WCNC-TV: wcnc.com | Ch. 36/NBC | 2015 | 734,000 | 1967 | |
Greensboro | WFMY-TV: digtriad.com | Ch. 2/CBS | 2015 | 549,000 | 1949 | ||
Ohio | Cleveland | WKYC-TV: wkyc.com | Ch. 3/NBC | 2017 | 1,107,000 | 1948 | |
Oregon | Portland | KGW-TV(1)(2): kgw.com | Ch. 8/NBC | 2015 | 809,000 | 1956 | |
South Carolina | Columbia | WLTX-TV: wltx.com | Ch. 19/CBS | 2015 | 278,000 | 1953 | |
Tennessee | Knoxville | WBIR-TV: wbir.com | Ch. 10/NBC | 2017 | 449,000 | 1956 | |
Texas | Abilene-Sweetwater | KXVA-TV: myfoxzone.com | Ch. 15/FOX | 2017 | 54,200 | 2001 | |
Austin | KVUE-TV: kvue.com | Ch. 24/ABC | 2018 | 448,000 | 1971 | ||
Beaumont-Port Arthur | KBMT-TV: 12newsnow.com | Ch. 12/ABC | 2018 | 137,000 | 1961 | ||
Corpus Christi | KIII-TV: kiiitv.com | Ch. 3/ABC | 2018 | 146,000 | 1964 | ||
Dallas/Ft. Worth | WFAA-TV: wfaa.com | Ch. 8/ABC | 2018 | 1,656,000 | 1949 | ||
Houston | KHOU-TV: khou.com | Ch. 11/CBS | 2017 | 1,548,000 | 1953 | ||
San Angelo | KIDY-TV: myfoxzone.com | Ch. 6/FOX | 2017 | 21,700 | 1984 | ||
San Antonio | KENS-TV: kens5.com | Ch. 5/CBS | 2017 | 641,000 | 1950 | ||
Tyler-Longview | KYTX-TV: cbs19.tv | Ch. 19/CBS | 2019 | 142,000 | 2008 | ||
Waco-Temple-College Station | KCEN-TV: kcentv.com | Ch. 9/NBC | 2016 | 202,000 | 1953 | ||
Virginia | Hampton/Norfolk | WVEC-TV: 13newsnow.com | Ch. 13/ABC | 2018 | 512,000 | 1953 | |
Washington | Seattle/Tacoma | KING-TV: king5.com | Ch. 5/NBC | 2015 | 1,259,000 | 1948 | |
KONG-TV: king5.com | Ch. 16/IND | 563,000 | 1997 | ||||
Spokane | KREM-TV: krem.com | Ch. 2/CBS | 2016 | 274,000 | 1954 | ||
KSKN-TV: spokanescw22.com | Ch. 22/CW | 2016 | 94,000 | 1983 | |||
(1) | We service these stations under shared services and similar arrangements. |
(2) | We also own KGWZ-LD, a low power television station in Portland, OR. |
(3) | We also own KTFT-LD (NBC), a low power television station in Twin Falls, ID. |
(4) | We also own WBXN-CA, a Class A television station in New Orleans, LA. |
(5) | Weekly audience is number of television households reached, according to the November 2014 Nielsen book. |
(6) | Audience numbers fall below minimum reporting standards. |
We also have two regional news channels, Texas Cable News (TXCN) in Dallas/Fort Worth, TX, and Northwest Cable News (NWCN) in Seattle/Tacoma, WA, and two local news channels, 24/7 NewsChannel in Boise, ID and NewsWatch on Channel 15 in New Orleans, LA. These operations provide news coverage and certain other programming in a comprehensive 24-hour a day format using the resources of our television stations in Texas, Washington, Oregon, Idaho, Louisiana and Arizona.
14
DAILY LOCAL MEDIA ORGANIZATIONS AND AFFILIATED DIGITAL PLATFORMS | ||||||||||||||
State Territory | Average 2014 Circulation - Print and Digital Replica and Non-Replica | |||||||||||||
City | Local media organization/web site | Morning | Afternoon | Sunday | Founded | |||||||||
Alabama | Montgomery | Montgomery Advertiser www.montgomeryadvertiser.com | 25,555 | 30,918 | 1829 | |||||||||
Arizona | Phoenix | The Arizona Republic www.azcentral.com | 232,502 | 487,441 | 1890 | |||||||||
Arkansas | Mountain Home | The Baxter Bulletin www.baxterbulletin.com | 8,423 | 1901 | ||||||||||
California | Palm Springs | The Desert Sun www.mydesert.com | 33,080 | 37,248 | 1927 | |||||||||
Salinas | The Salinas Californian www.thecalifornian.com | 7,368 | 1871 | |||||||||||
Visalia | Visalia Times-Delta/Tulare Advance-Register www.visaliatimesdelta.com www.tulareadvanceregister.com | 15,492 | 1859 | |||||||||||
Colorado | Fort Collins | Fort Collins Coloradoan www.coloradoan.com | 19,952 | 25,118 | 1873 | |||||||||
Delaware | Wilmington | The News Journal www.delawareonline.com | 71,934 | 104,550 | 1871 | |||||||||
Florida | Brevard County | FLORIDA TODAY www.floridatoday.com | 47,656 | 81,283 | 1966 | |||||||||
Fort Myers | The News-Press www.news-press.com | 50,130 | 71,310 | 1884 | ||||||||||
Pensacola | Pensacola News Journal www.pnj.com | 31,687 | 44,720 | 1889 | ||||||||||
Tallahassee | Tallahassee Democrat www.tallahassee.com | 29,652 | 42,100 | 1905 | ||||||||||
Guam | Hagatna | Pacific Daily News www.guampdn.com | 13,281 | 12,286 | 1944 | |||||||||
Indiana | Indianapolis | The Indianapolis Star www.indystar.com | 137,129 | 265,112 | 1903 | |||||||||
Lafayette | Journal and Courier www.jconline.com | 22,541 | 30,253 | 1829 | ||||||||||
Muncie | The Star Press www.thestarpress.com | 20,422 | 26,051 | 1899 | ||||||||||
Richmond | Palladium-Item www.pal-item.com | 9,616 | 14,194 | 1831 | ||||||||||
Iowa | Des Moines | The Des Moines Register www.desmoinesregister.com | 86,773 | 173,001 | 1849 | |||||||||
Iowa City | Iowa City Press-Citizen www.press-citizen.com | 10,079 | 1860 | |||||||||||
Kentucky | Louisville | The Courier-Journal www.courier-journal.com | 114,719 | 205,216 | 1868 | |||||||||
Louisiana | Alexandria | Alexandria Daily Town Talk www.thetowntalk.com | 15,350 | 20,517 | 1883 | |||||||||
Lafayette | The Daily Advertiser www.theadvertiser.com | 21,936 | 29,609 | 1865 | ||||||||||
Monroe | The News-Star www.thenewsstar.com | 21,540 | 25,937 | 1890 | ||||||||||
Opelousas | Daily World www.dailyworld.com | 4,409 | 5,556 | 1939 | ||||||||||
Shreveport | The Times www.shreveporttimes.com | 32,736 | 49,304 | 1871 | ||||||||||
Maryland | Salisbury | The Daily Times www.delmarvanow.com | 13,752 | 18,180 | 1900 | |||||||||
15
DAILY LOCAL MEDIA ORGANIZATIONS AND AFFILIATED DIGITAL PLATFORMS | ||||||||||||||
State Territory | Average 2014 Circulation - Print and Digital Replica and Non-Replica | |||||||||||||
City | Local media organization/web site | Morning | Afternoon | Sunday | Founded | |||||||||
Michigan | Battle Creek | Battle Creek Enquirer www.battlecreekenquirer.com | 11,663 | 16,675 | 1900 | |||||||||
Detroit | Detroit Free Press www.freep.com | 173,215 | 867,821 | 1832 | ||||||||||
Lansing | Lansing State Journal www.lansingstatejournal.com | 35,254 | 47,815 | 1855 | ||||||||||
Livingston County | Daily Press & Argus www.livingstondaily.com | 9,222 | 13,181 | 1843 | ||||||||||
Port Huron | Times Herald www.thetimesherald.com | 15,050 | 22,568 | 1900 | ||||||||||
Minnesota | St. Cloud | St. Cloud Times www.sctimes.com | 20,392 | 25,637 | 1861 | |||||||||
Mississippi | Hattiesburg | Hattiesburg American www.hattiesburgamerican.com | 7,886 | 10,663 | 1897 | |||||||||
Jackson | The Clarion-Ledger www.clarionledger.com | 46,090 | 53,774 | 1837 | ||||||||||
Missouri | Springfield | Springfield News-Leader www.news-leader.com | 29,206 | 46,607 | 1893 | |||||||||
Montana | Great Falls | Great Falls Tribune www.greatfallstribune.com | 22,195 | 24,838 | 1885 | |||||||||
Nevada | Reno | Reno Gazette-Journal www.rgj.com | 35,133 | 55,978 | 1870 | |||||||||
New Jersey | Asbury Park | Asbury Park Press www.app.com | 80,722 | 119,495 | 1879 | |||||||||
Bridgewater | Courier News www.mycentraljersey.com | 10,244 | 13,376 | 1884 | ||||||||||
Cherry Hill | Courier-Post www.courierpostonline.com | 35,860 | 47,618 | 1875 | ||||||||||
East Brunswick | Home News Tribune www.mycentraljersey.com | 20,261 | 24,360 | 1879 | ||||||||||
Morristown | Daily Record www.dailyrecord.com | 14,021 | 16,962 | 1900 | ||||||||||
Vineland | The Daily Journal www.thedailyjournal.com | 10,834 | 1864 | |||||||||||
New York | Binghamton | Press & Sun-Bulletin www.pressconnects.com | 28,896 | 38,687 | 1904 | |||||||||
Elmira | Star-Gazette www.stargazette.com | 12,862 | 19,960 | 1828 | ||||||||||
Ithaca | The Ithaca Journal www.theithacajournal.com | 9,405 | 1815 | |||||||||||
Poughkeepsie | Poughkeepsie Journal www.poughkeepsiejournal.com | 21,479 | 28,847 | 1785 | ||||||||||
Rochester | Rochester Democrat and Chronicle www.democratandchronicle.com | 96,444 | 138,159 | 1833 | ||||||||||
Westchester County | The Journal News www.lohud.com | 57,865 | 74,137 | 1829 | ||||||||||
North Carolina | Asheville | Asheville Citizen-Times www.citizen-times.com | 28,415 | 40,236 | 1870 | |||||||||
16
DAILY LOCAL MEDIA ORGANIZATIONS AND AFFILIATED DIGITAL PLATFORMS | ||||||||||||||
State Territory | Average 2014 Circulation - Print and Digital Replica and Non-Replica | |||||||||||||
City | Local media organization/web site | Morning | Afternoon | Sunday | Founded | |||||||||
Ohio | Bucyrus | Telegraph-Forum www.bucyrustelegraphforum.com | 3,508 | 1923 | ||||||||||
Chillicothe | Chillicothe Gazette www.chillicothegazette.com | 7,607 | 9,311 | 1800 | ||||||||||
Cincinnati | The Cincinnati Enquirer www.cincinnati.com | 114,021 | 215,203 | 1841 | ||||||||||
Coshocton | Coshocton Tribune www.coshoctontribune.com | 3,528 | 4,375 | 1842 | ||||||||||
Fremont | The News-Messenger www.thenews-messenger.com | 5,179 | 1856 | |||||||||||
Lancaster | Lancaster Eagle-Gazette www.lancastereaglegazette.com | 7,462 | 9,114 | 1807 | ||||||||||
Mansfield | News Journal www.mansfieldnewsjournal.com | 16,561 | 22,969 | 1885 | ||||||||||
Marion | The Marion Star www.marionstar.com | 5,855 | 7,180 | 1880 | ||||||||||
Newark | The Advocate www.newarkadvocate.com | 11,405 | 13,533 | 1820 | ||||||||||
Port Clinton | News Herald www.portclintonnewsherald.com | 2,218 | 1864 | |||||||||||
Zanesville | Times Recorder www.zanesvilletimesrecorder.com | 10,888 | 12,684 | 1852 | ||||||||||
Oregon | Salem | Statesman Journal www.statesmanjournal.com | 30,110 | 36,280 | 1851 | |||||||||
South Carolina | Greenville | The Greenville News www.greenvilleonline.com | 44,365 | 93,369 | 1874 | |||||||||
South Dakota | Sioux Falls | Argus Leader www.argusleader.com | 29,300 | 56,061 | 1881 | |||||||||
Tennessee | Clarksville | The Leaf-Chronicle www.theleafchronicle.com | 10,716 | 20,092 | 1808 | |||||||||
Jackson | The Jackson Sun www.jacksonsun.com | 14,025 | 21,460 | 1848 | ||||||||||
Murfreesboro | The Daily News Journal www.dnj.com | 10,264 | 13,246 | 1848 | ||||||||||
Nashville | The Tennessean www.tennessean.com | 93,531 | 208,357 | 1812 | ||||||||||
Utah | St. George | The Spectrum www.thespectrum.com | 13,370 | 15,424 | 1963 | |||||||||
Vermont | Burlington | The Burlington Free Press www.burlingtonfreepress.com | 23,477 | 27,707 | 1827 | |||||||||
Virginia | McLean | USA TODAY* www.usatoday.com | 4,139,380 | 3,686,797 | 1982 | |||||||||
Staunton | The Daily News Leader www.newsleader.com | 12,217 | 15,043 | 1904 | ||||||||||
Wisconsin | Appleton | The Post-Crescent www.postcrescent.com | 34,610 | 47,236 | 1853 | |||||||||
Fond du Lac | The Reporter www.fdlreporter.com | 9,206 | 11,963 | 1870 | ||||||||||
Green Bay | Green Bay Press-Gazette www.greenbaypressgazette.com | 38,977 | 56,968 | 1915 | ||||||||||
Manitowoc | Herald Times Reporter www.htrnews.com | 9,007 | 10,633 | 1898 | ||||||||||
Marshfield | Marshfield News-Herald www.marshfieldnewsherald.com | 7,086 | 1927 | |||||||||||
Oshkosh | Oshkosh Northwestern www.thenorthwestern.com | 11,634 | 16,199 | 1868 | ||||||||||
Sheboygan | The Sheboygan Press www.sheboyganpress.com | 13,162 | 16,251 | 1907 | ||||||||||
Stevens Point | Stevens Point Journal www.stevenspointjournal.com | 6,963 | 1873 | |||||||||||
Central Wisconsin Sunday | 14,325 | |||||||||||||
Wausau | Wausau Daily Herald www.wausaudailyherald.com | 13,678 | 18,230 | 1903 | ||||||||||
Wisconsin Rapids | The Daily Tribune www.wisconsinrapidstribune.com | 7,168 | 1914 | |||||||||||
* | USA TODAY morning and Sunday figure is the average print, digital replica, digital non-replica and branded editions according to the Alliance for Audited Media’s September 2014 Publisher’s Statement. |
17
DAILY PAID-FOR LOCAL MEDIA ORGANIZATIONS AND AFFILIATED DIGITAL PLATFORMS/NEWSQUEST PLC | ||||||
Circulation* | ||||||
City | Local media organization/web site | Monday-Saturday | Founded | |||
Basildon | Echo**: www.echo-news.co.uk | 22,961 | 1969 | |||
Blackburn | Lancashire Telegraph: www.lancashiretelegraph.co.uk | 13,092 | 1886 | |||
Bolton | The Bolton News: www.theboltonnews.co.uk | 12,351 | 1867 | |||
Bournemouth | Daily Echo: www.bournemouthecho.co.uk | 18,049 | 1900 | |||
Bradford | Telegraph & Argus: www.thetelegraphandargus.co.uk | 18,906 | 1868 | |||
Brighton | The Argus: www.theargus.co.uk | 14,370 | 1880 | |||
Colchester | The Gazette**: www.gazette-news.co.uk | 11,706 | 1970 | |||
Darlington | The Northern Echo: www.thenorthernecho.co.uk | 30,735 | 1870 | |||
Glasgow | Evening Times: www.eveningtimes.co.uk | 33,397 | 1876 | |||
Glasgow | The Herald: www.heraldscotland.com | 37,728 | 1783 | |||
Glasgow | The National: www.thenational.scot | *** | 2014 | |||
Newport | South Wales Argus: www.southwalesargus.co.uk | 13,197 | 1892 | |||
Oxford | Oxford Mail: www.oxfordmail.co.uk | 12,773 | 1928 | |||
Southampton | Southern Daily Echo: www.dailyecho.co.uk | 22,397 | 1888 | |||
Swindon | Swindon Advertiser: www.swindonadvertiser.co.uk | 11,987 | 1854 | |||
Weymouth | Dorset Echo: www.dorsetecho.co.uk | 13,267 | 1921 | |||
Worcester | Worcester News: www.worcesternews.co.uk | 8,885 | 1937 | |||
York | The Press: www.yorkpress.co.uk | 19,643 | 1882 | |||
* Circulation figures are according to ABC results for the period January - June 2014 ** Publishes Monday-Friday *** Founded in 2014. No certified circulation reported to date. | ||||||
Non-daily publications: Essex, London, Midlands, North East, North West, South Coast, South East, South and East Wales, South West, Yorkshire
DIGITAL |
Cars.com: www.cars.com Headquarters: Chicago, IL Sales offices: Abilene, TX; Albany, NY; Albuquerque, NM; Asheboro, NC; Atlanta, GA; Augusta, GA; Austin, TX; Bakersfield, CA; Baton Rouge, LA; Bay Area, CA; Beaumont, TX; Billings, MT; Birmingham, AL; Boston, MA; Buffalo, NY; Carbondale, IL; Cedar Rapids, IA; Champaign, IL; Charleston, SC; Chattanooga, TN; Columbus, OH; Corpus Christi, TX; Dayton, OH; Denver, CO; El Paso, TX; Erie, PA; Eugene, OR; Evansville, IN; Fairfield, IL; Flint, MI; Ft. Wayne, IN; Greensboro, NC; Harrisburg, PA; Honolulu, HI; Houston, TX; Huntington, WV; Huntsville, AL; Idaho Falls, ID; Jacksonville, FL; Jefferson City, MO; Knoxville, TN; La Crosse, WI; Las Vegas, NV; Little Rock, AR; Long Island, NY; Longview, WA; Lubbock, TX; Lufkin, TX; Madison, WI |
CareerBuilder: www.careerbuilder.com Headquarters: Chicago, IL Sales offices: Atlanta, GA; Boston, MA; Chicago, IL; Cincinnati, OH; Dallas, TX; Denver, CO; Detroit, MI; Edison, NJ; Houston, TX; Irvine, CA; Kansas City, KS; Los Angeles, CA; Minneapolis, MN; Moscow, ID; Nashville, TN; New York, NY; Orlando, FL; Philadelphia, PA; San Bruno, CA; Scottsdale, AZ; Washington, DC International offices: Australia, Brazil, Canada, China, France, Germany, Greece, India, Indonesia, Italy, Malaysia, Netherlands, Singapore, Spain, Sweden, United Kingdom, Vietnam |
PointRoll, Inc.: www.pointroll.com Headquarters: King of Prussia, PA Sales offices: Atlanta, GA; Boston, MA; Chicago, IL; Detroit, MI; Los Angeles, CA; New York, NY; San Francisco, CA |
Shoplocal: www.shoplocal.com; www.aboutshoplocal.com Headquarters: Chicago, IL Sales office: Chicago, IL |
Mobile and Tablet: We power more than 500 mobile and tablet products and partner with service providers to deliver push news alerts and mobile marketing campaigns. We have also developed and deployed leading applications for iPad, iPhone, Kindle, Android, Windows and BlackBerry. | ||
18
USA TODAY/USATODAY.com Headquarters and editorial offices: McLean, VA Print sites: Albuquerque, NM; Atlanta, GA; Boston, MA; Cleveland, OH; Columbia, SC; Columbus, OH; Dallas, TX; Denver, CO; Des Moines, IA; Detroit, MI; Eugene, OR; Fort Lauderdale, FL; Houston, TX; Indianapolis, IN; Kansas City, MO; Las Vegas, NV; Los Angeles, CA; Louisville, KY; Milwaukee, WI; Minneapolis, MN; Mobile, AL; Nashville, TN; Oklahoma City, OK; Orlando, FL; Phoenix, AZ; Rochester, NY; Rockaway, NJ; St. Louis, MO; St. Petersburg, FL; Salt Lake City, UT; San Jose, CA; Seattle, WA; Springfield, MO; Springfield, VA; Wilmington, DE; Winston-Salem, NC Advertising offices: Atlanta, GA; Chicago, IL; Dallas, TX; Detroit, MI; Los Angeles, CA; McLean, VA; New York, NY; San Francisco, CA |
USA TODAY Sports Media Group: www.Thebiglead.com; www.Thehuddle.com; www.Hoopshype.com; www.Mmajunkie.com; www.Bnqt.com; www.Baseballhq.com; www.Quickish.com; www.Usatodayhss.com; ftw.usatoday.com; q.usatoday.com; www.fantasyscore.com; www.spanningthesec.com; www.usatodaysportsimages.com Headquarters: Los Angeles Advertising offices: Los Angeles, CA; McLean, VA; New York, NY |
USA TODAY Travel Media Group Headquarters: McLean, VA Advertising offices: McLean, VA |
Reviewed.com: www.reviewed.com Headquarters: Cambridge, MA |
G/O Digital: G/O Digital: www.godigitalmarketing.com; BLiNQ Media: www.blinqmedia.com; Local Flavor: www.localflavor.com; Clipper Digital: www.clippermagazine.com; Mobestream Media (Key Ring): www.keyringapp.com Headquarters: Chicago, IL Sales offices: Atlanta, GA; Chicago, IL; Dallas, TX; New York, NY; Phoenix, AZ |
BLiNQ Media: www.blinqmedia.com Headquarters: Atlanta, GA Advertising offices: Atlanta, GA; Chicago, IL; New York, NY |
Mobestream Media: www.keyringapp.com Headquarters: Dallas, TX |
Clipper Magazine: www.clippermagazine.com; www.localflavor.com; www.mintmagazine.com; www.totalloyalty.com Headquarters: Mountville, PA |
Gannett Government Media Headquarters: Springfield, VA Brands: Army Times: www.armytimes.com, Navy Times: www.navytimes.com, Marine Corps Times: www.marinecorpstimes.com, Air Force Times: www.airforcetimes.com, Military Times: www.militarytimes.com, Federal Times: www.federaltimes.com, Defense News: www.defensenews.com, Defense News with Vago Muradian: www.defensenewstv.com, C4ISR & Networks: www.c4isrnet.com, Military Times Best for Vets: www.militarytimes.com/best-for-vets |
Gannett Media Technologies International: www.gmti.com Headquarters: Chesapeake, VA Regional office: Cincinnati, OH |
Non-daily publications: Weekly, semi-weekly, monthly or bimonthly publications in Alabama, Arizona, Arkansas, California, Colorado, Delaware, Florida, Guam, Indiana, Iowa, Kentucky, Louisiana, Maryland, Michigan, Minnesota, Mississippi, Missouri, Montana, Nevada, New Jersey, New York, North Carolina, Ohio, Oregon, South Carolina, South Dakota, Tennessee, Utah, Vermont, Virginia, Wisconsin |
Gannett Publishing Services: www.gannettpublishingservices.com Headquarters: McLean, VA Sales office: Atlanta, GA |
Gannett Satellite Information Network: McLean, VA |
GANNETT ON THE NET: News and information about us is available on our web site, www.gannett.com. In addition to news and other information about us, we provide access through this site to our annual report on Form 10-K, our quarterly reports on Form 10-Q, our current reports on Form 8-K and all amendments to those reports as soon as reasonably practicable after we file or furnish them electronically to the Securities and Exchange Commission (SEC). Certifications by our Chief Executive Officer and Chief Financial Officer are included as exhibits to our SEC reports (including to this Form 10-K). We also provide access on this web site to our Principles of Corporate Governance, the charters of our Audit, Transformation, Executive Compensation and Nominating and Public Responsibility Committees and other important governance documents and policies, including our Ethics and Inside Trading Policies. Copies of all of these corporate governance documents are available to any shareholder upon written request made to our Secretary at the headquarters address. We will disclose on this web site changes to, or waivers of, our corporate Ethics Policy. | |
19
ITEM 1A. RISK FACTORS
In addition to the other information contained or incorporated by reference into this Form 10-K, prospective investors should consider carefully the following risk factors before investing in our securities. The risks described below may not be the only risks we face. Additional risks that we do not yet perceive or that we currently believe are immaterial may adversely affect our business and the trading price of our securities.
Changes in economic conditions in the U.S., U.K. and other international markets we serve may depress demand for our products and services
Our operating results depend on the relative strength of the economy in our principal television, publishing and digital markets as well as the strength or weakness of regional and national economic factors. A decline in economic conditions in the U.S. and U.K. could have a significant adverse impact on our businesses, particularly publishing, and could significantly impact all key advertising revenue categories.
Competition from alternative forms of media may impair our ability to grow or maintain revenue levels in core and new businesses
Advertising produces the predominant share of our broadcasting, publishing and digital revenues, with affiliated web site, mobile and tablet revenues being an important component. With the continued development of alternative forms of media, particularly electronic media including those based on the Internet, our businesses may face increased competition. Alternative media sources may affect our ability to generate circulation revenues and our television audience. New and emerging technologies such as subscription streaming media services and mobile video are increasing competition for household audiences and advertisers. This competition may make it difficult for us to grow or maintain our print advertising, circulation and broadcasting revenues, which we believe will challenge us to expand the contributions of our online and other digital businesses.
The proposed separation of our Publishing business from our Broadcasting and Digital businesses is subject to various risks and uncertainties, and may not be completed on the terms or timeline currently contemplated, if at all
On Aug. 5, 2014, we announced our plan to create two publicly traded companies: one exclusively focused on our Broadcasting and Digital businesses, and the other on our Publishing business. The separation, which is expected to be completed mid-2015, is subject to certain customary conditions, including final approval of our Board of Directors. In addition, unanticipated developments, including possible delays in obtaining various tax opinions or rulings, regulatory approvals or clearances and uncertainty of the financial markets, could delay or prevent the completion of the proposed separation or cause the proposed separation to occur on terms or conditions that are different from those currently expected. As a result, we are unable to assure that we will complete the proposed separation on the terms or the timeline that we announced, if at all.
The proposed separation may not achieve some or all of the anticipated benefits
Executing the proposed separation will require us to incur costs as well as time and attention from our senior management and key employees, which could distract them from operating our business, disrupt operations, and result in the loss of business opportunities, which could adversely affect our business, financial condition, and results of operations. We may also experience increased difficulties in attracting, retaining and motivating key employees during the pendency of the separation and following its completion, which could harm our businesses. Even if the proposed separation is completed, we may not realize some or all of the anticipated benefits from the separation and the separation may in fact adversely affect our business. As independent, publicly traded companies, both companies will be smaller, less diversified companies with a narrower business focus and may be more vulnerable to changing market conditions and competitive pressures, which could materially and adversely affect their respective businesses, financial condition and results of operations. Separating the businesses may also eliminate or reduce synergies that existed before the separation, such as the operation of the digital sites and applications for our Publishing and Broadcasting properties as part of the integrated Gannett digital platform, which could have an adverse effect on the results of operations, financial condition and liquidity of each business.
There can be no assurance that the combined value of the common stock of the two publicly traded companies following the completion of the proposed separation will be equal to or greater than what the value of our common stock would have been had the proposed separation not occurred.
The value of our assets or operations may be diminished if our information technology systems fail to perform adequately or if we are the subject of a data breach or cyber attack
Our information technology systems are critically important to operating our business efficiently and effectively. We rely on our information technology systems to manage our business data, communications, news and advertising content, digital products, order entry, fulfillment and other business processes. The failure of our information technology systems to perform as we anticipate could disrupt our business and could result in transaction errors, processing inefficiencies, late or missed publications, and loss of sales and customers, causing our business and results to be impacted.
Furthermore, attempts to compromise information technology systems occur regularly across many industries and sectors, and we may be vulnerable to security breaches beyond our control. We invest in security resources and technology to protect our data and business processes against risk of data security breaches and cyber attack, but the techniques used to attempt attacks are constantly changing. A breach or successful attack could have a negative impact on our operations or business reputation. We maintain cyber risk insurance, but this insurance may be insufficient to cover all of our losses from any future breaches of our systems.
20
Volatility in the U.S. credit markets could significantly impact our ability to obtain new financing to fund our operations and strategic initiatives or to refinance our existing debt at reasonable rates as it matures
At the end of 2014, we had approximately $4.5 billion in long-term debt and approximately $625 million of additional borrowing capacity under our revolving credit facilities. This debt matures at various times during the years 2015-2027. While our cash flow is expected to be sufficient to pay amounts when due, if operating results deteriorate significantly, a portion of these maturities may need to be refinanced. Access to the capital markets for longer term financing is unpredictable, and volatile credit markets could make it harder for us to obtain debt financings generally.
Volatility in global financial markets directly affects the value of our pension plan assets and liabilities
Our three largest retirement plans, which account for 97% of total pension plan assets, were underfunded as of Dec. 28, 2014, by $728 million on a U.S. GAAP basis. Changes in interest rates and future investment returns can affect the funded status of our defined benefit plans and cause volatility in the net periodic benefit cost and future funding requirements of the plans.
Foreign exchange variability could adversely affect our consolidated operating results
Weakening of the British pound-to-U.S. dollar exchange rate could diminish Newsquest’s earnings contribution to consolidated results. Newsquest results for 2014 were translated to U.S. dollars at the average rate of 1.65. If the price of the British pound against the U.S. dollar had been 10% more or less than the actual price, operating income would have increased or decreased approximately 1% in 2014. CareerBuilder, with expanding overseas operations, also has foreign exchange risk but to a significantly lesser degree.
Changes in the regulatory environment could encumber or impede our efforts to improve operating results or the value of assets
Our broadcasting, publishing and digital operations are subject to government regulation. Changing regulations, particularly FCC Regulations which affect our television stations (including changes to our shared services and similar agreements), may result in increased costs, reduced valuations for certain broadcasting properties or other impacts, all of which may adversely impact our future profitability. All of our television stations are required to hold television broadcasting licenses from the FCC; when granted, these licenses are generally granted for a period of eight years. Under certain circumstances the FCC is not required to renew any license and could decline to renew either our current license applications that are pending or those submitted in the future.
Our strategic acquisitions, investments and partnerships could pose various risks, increase our leverage and may significantly impact our ability to expand our overall profitability
Acquisitions involve inherent risks, such as increasing leverage and debt service requirements and combining company cultures and facilities, which could have a material adverse effect on our results of operations or cash flow and could strain our human resources. We may be unable to successfully implement effective cost controls, achieve expected synergies or increase revenues as a result of an acquisition. Acquisitions may result in us assuming unexpected liabilities and in management diverting its attention from the operation of our business. Disclosures we make regarding past operating results of acquired entities and our pro forma results are based on financial information provided to us by acquired entities, which has not been reviewed by our auditors or subject to our internal controls. Acquisitions may result in us having greater exposure to the industry risks of the businesses underlying the acquisition. Strategic investments and partnerships with other companies expose us to the risk that we may be unable to control the operations of our investee or partnership, which could decrease the amount of benefits we realize from a particular relationship. We are exposed to the risk that our partners in strategic investments and infrastructure may encounter financial difficulties which could disrupt investee or partnership activities, or impair assets acquired, which would adversely affect future reported results of operations and shareholders’ equity. In addition, we may be unable to obtain financing necessary to complete acquisitions on attractive terms or at all. The failure to obtain regulatory approvals may prevent us from completing or realizing the anticipated benefits of acquisitions. Furthermore, acquisitions may subject us to new or different regulations which could have an adverse effect on our operations.
The value of our existing intangible assets may become impaired, depending upon future operating results
Goodwill and other intangible assets were approximately $7.74 billion at Dec. 28, 2014, representing approximately 69% of our total assets. We periodically evaluate our goodwill and other intangible assets to determine whether all or a portion of their carrying values may no longer be recoverable, in which case a non-cash charge to earnings may be necessary, as occurred in 2012-2014 (see Notes 3 and 4 to the Consolidated Financial Statements). Any future evaluations requiring an asset impairment charge for goodwill or other intangible assets would adversely affect future reported results of operations and shareholders’ equity, although such charges would not affect our cash flow.
Adverse results from litigation or governmental investigations can impact our business practices and operating results
From time to time, we are parties to litigation and regulatory, environmental and other proceedings with governmental authorities and administrative agencies. Adverse outcomes in lawsuits or investigations could result in significant monetary damages or injunctive relief that could adversely affect our operating results or financial condition as well as our ability to conduct our businesses as they are presently being conducted. See Note 11 of the Notes to Consolidated Financial Statements and Part I, Item 3. “Legal Proceedings” contained elsewhere in this report for a description of certain of our pending litigation and regulatory matters and other proceedings with governmental authorities.
ITEM 1B. UNRESOLVED STAFF COMMENTS
None.
21
ITEM 2. PROPERTIES
Broadcasting
Our broadcasting facilities are adequately equipped with the necessary television broadcasting equipment. We own or lease transmitter facilities in 47 locations. All of our stations have converted to digital television operations in accordance with applicable FCC Regulations. Our broadcasting facilities are adequate for present purposes. A listing of television stations can be found on page 14.
Publishing
Generally, we own many of the plants that house most aspects of the publication process. Certain U.S. Community Publishing operations have outsourced printing to non-Gannett publishers or commercial printers. In the case of USA TODAY, at Dec. 28, 2014, 23 non-Gannett printers were used to print it in U.S. markets where we had no company publishing sites with appropriate facilities. Non-Gannett printers in 10 foreign countries publish and distribute an international edition of USA TODAY under a royalty agreement. Clipper Magazine also is printed under contracts with commercial printing companies. Many of our local media organizations have outside news bureaus and sales offices, which generally are leased. In several markets, two or more of our local media organizations share combined facilities; and in certain locations, facilities are shared with other non-Gannett publishing properties. At the end of 2014, 64% of our U.S. daily publications were either printed by non-Gannett printers or printed in combination with other Gannett publications. Our publishing properties have rail siding facilities or access to main roads for newsprint delivery purposes and are conveniently located for distribution purposes.
During 2014, we continued our efforts to consolidate certain of our U.S. publishing facilities to achieve ongoing savings and greater efficiencies. Our facilities are adequate for present operations. A listing of publishing centers and key properties may be found on pages 15-17.
Newsquest owns certain of the plants where its publications are produced and leases other facilities. Newsquest senior management is based in central London. Newsquest reduced its printing facilities from 6 to 5 in 2014 to achieve savings and efficiencies. The remaining presses have good color capabilities and currently sustainable levels of utilization including some printing for other publishers. For those Newsquest publishing operations distant from a press facility, printing is outsourced. All of Newsquest’s properties are adequate for present purposes. A listing of Newsquest publishing centers and key properties may be found on page 18.
Digital
Generally, our digital businesses lease their facilities. This includes facilities for executive offices, sales offices and data centers. Our facilities are adequate for present operations. We believe that suitable additional or alternative space, including those under lease options, will be available at commercially reasonable terms for future expansion. A listing of key digital facilities can be found on pages 18-19.
Corporate facilities
We own the buildings where our headquarters and USA TODAY are located in McLean, VA. We also own data and network operations centers in nearby Silver Spring, MD, and in Phoenix, AZ. Headquarters facilities are adequate for present operations. We also lease space in our headquarters facilities to third-party tenants.
ITEM 3. LEGAL PROCEEDINGS
Information regarding legal proceedings may be found in Note 11 of the Notes to Consolidated Financial Statements.
Environmental
From time to time, some of our current and former subsidiaries have been included among potentially responsible parties in connection with sites that have been identified as possibly requiring environmental remediation. These environmental proceedings are highly complex, and require a variety of issues to be resolved, including the extent of contamination, the nature and extent of investigation and remedial action that may ultimately be required, and the number of parties that will be required to contribute to such investigation and remediation costs, before our liability for them, if any, will be known.
In March 2011, the Advertiser Company, a subsidiary which publishes The Montgomery Advertiser, was notified by the U.S. EPA that it has been identified as a potentially responsible party for the investigation and remediation of groundwater contamination in downtown Montgomery, AL. At this point in the investigation, incomplete information is available about the site, other potentially responsible parties and what further investigation and remediation may be required. Accordingly, future costs at the site, and The Advertiser Company’s share of such costs, if any, are undetermined. Some of The Advertiser Company’s fees and costs in connection with this matter may be reimbursed under its liability insurance policies.
Management does not expect that these pending proceedings will have a material adverse effect upon our consolidated results of operations or financial condition.
ITEM 4. MINE SAFETY DISCLOSURES
Not applicable.
22
PART II
ITEM 5.MARKET FOR REGISTRANT’S COMMON EQUITY, RELATED STOCKHOLDER MATTERS AND ISSUER PURCHASES OF EQUITY SECURITIES
Our shares are traded on the New York Stock Exchange with the symbol GCI.
Information regarding outstanding shares, shareholders and dividends may be found on pages 1, 6, 42 and 43 of this Form 10-K. Information about debt securities sold in private transactions may be found on pages 41-42 of this Form 10-K.
Gannett Common stock prices
High-low range by fiscal quarters based on NYSE-composite prices.
Year | Quarter | Low | High | Year | Quarter | Low | High | |||||||||||
2010 | First | $ | 12.77 | $ | 17.33 | 2013 | First | $ | 17.58 | $ | 22.11 | |||||||
Second | $ | 13.48 | $ | 19.69 | Second | $ | 19.53 | $ | 26.75 | |||||||||
Third | $ | 11.66 | $ | 15.28 | Third | $ | 23.98 | $ | 26.90 | |||||||||
Fourth | $ | 11.65 | $ | 16.17 | Fourth | $ | 23.75 | $ | 29.48 | |||||||||
2011 | First | $ | 14.26 | $ | 18.93 | 2014 | First | $ | 25.96 | $ | 30.43 | |||||||
Second | $ | 13.26 | $ | 15.80 | Second | $ | 25.53 | $ | 30.98 | |||||||||
Third | $ | 8.28 | $ | 14.70 | Third | $ | 29.88 | $ | 35.70 | |||||||||
Fourth | $ | 8.90 | $ | 14.47 | Fourth | $ | 25.95 | $ | 33.70 | |||||||||
2012 | First | $ | 13.16 | $ | 16.26 | 2015 | First* | $ | 29.30 | $ | 35.20 | |||||||
Second | $ | 12.17 | $ | 15.90 | * Through Feb. 24, 2015 | |||||||||||||
Third | $ | 13.16 | $ | 19.09 | ||||||||||||||
Fourth | $ | 16.35 | $ | 19.99 | ||||||||||||||
Purchases of Equity Securities
On June 11, 2013, our Board of Directors approved a new $300 million share repurchase program. While the Board of Directors reviews the program at least annually, there is no current expiration date for the new $300 million authorization. We spent $76 million in 2014 to repurchase 2.7 million of our shares, at an average price per share of $28.13. This share repurchase program was temporarily suspended upon the announcement of the Cars.com acquisition, but was re-initiated in February of 2015, well ahead of the timeline we had previously anticipated, as a result of our strong operating performance and the strength of our balance sheet. We have completed more than 50% of our $300 million authorization with 5.6 million shares repurchased at an average price of $27.03 per share.
23
Comparison of shareholder return – 2010 to 2014
The following graph compares the performance of our common stock during the period Dec. 27, 2009, to Dec. 28, 2014, with the S&P 500 Index, and a peer group index we selected.
Our peer group includes A.H. Belo Corp., AOL Inc., Discovery Communications Inc., The E.W. Scripps Company, Journal Communications, Inc., LinkedIn Corp., The McClatchy Company, Media General, Inc. (on an adjusted basis to reflect its merger with Young Broadcasting, LLC), Meredith Corp., Monster Worldwide Inc., The New York Times Company, News Corp. (on an adjusted basis to reflect the spin off by News Corporation), Nexstar Broadcasting Group Inc., ReachLocal Inc., Sinclair Broadcast Group Inc., and Yahoo Inc. (collectively, the “Peer Group”). Many of the Peer Group companies have a strong publishing/broadcasting orientation, but the Peer Group also includes companies in the digital media industry.
The S&P 500 Index includes 500 U.S. companies in the industrial, utilities and financial sectors and is weighted by market capitalization. The total returns of the Peer Group also are weighted by market capitalization.
The graph depicts representative results of investing $100 in our common stock, the S&P 500 Index and Peer Group index at closing on Dec. 27, 2009. It assumes that dividends were reinvested monthly with respect to our common stock, daily with respect to the S&P 500 Index and monthly with respect to each Peer Group company.
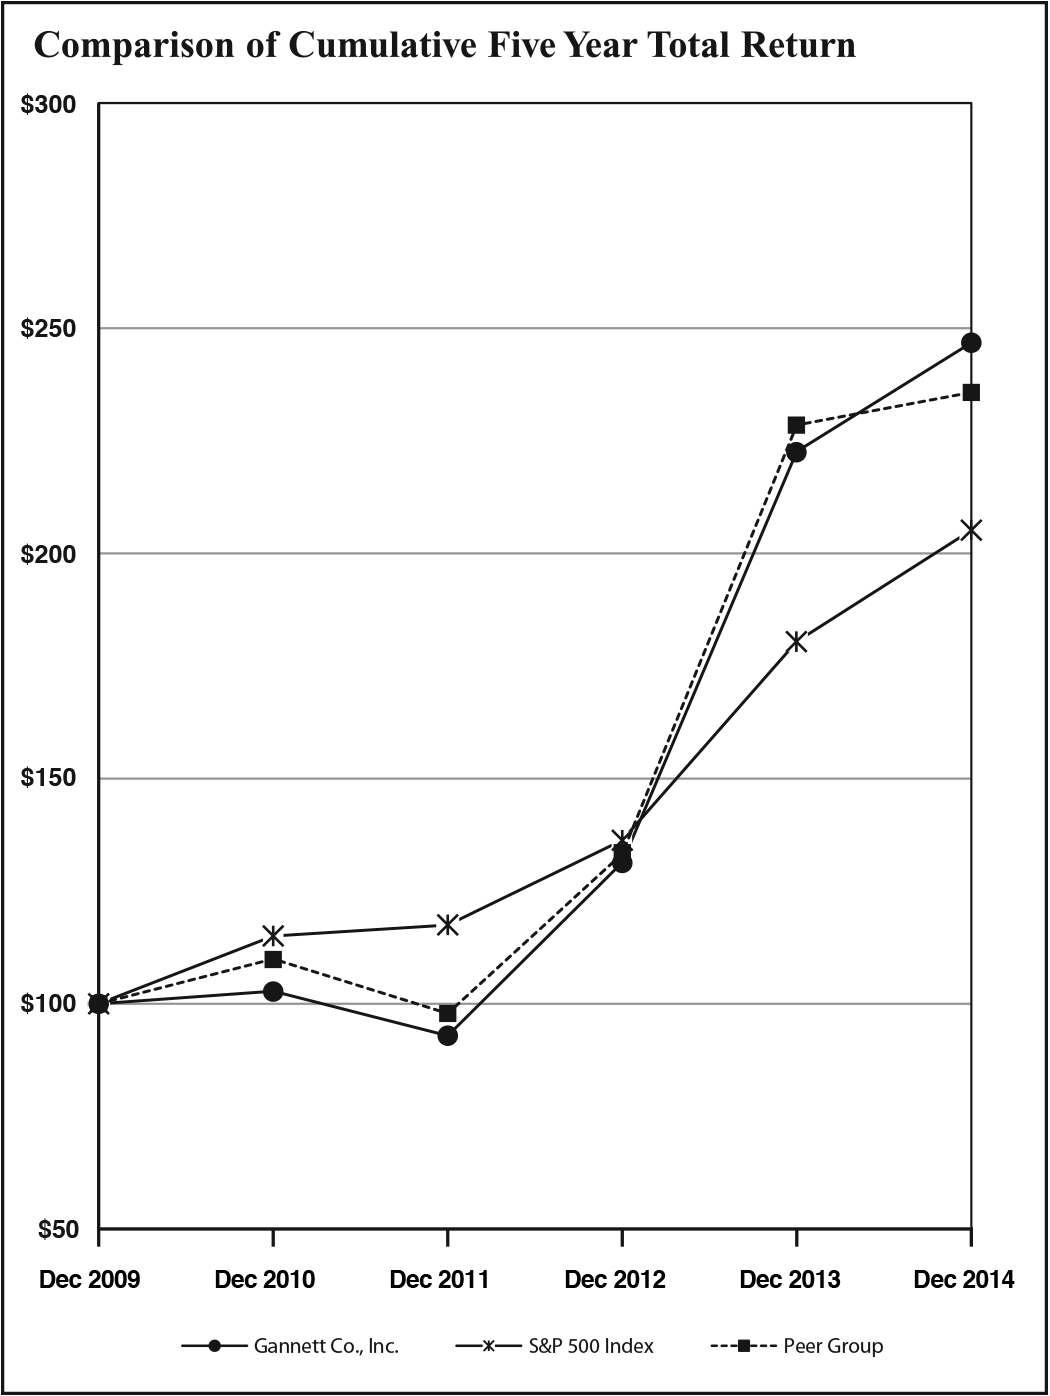
2009 | 2010 | 2011 | 2012 | 2013 | 2014 | |||||||||||||
Gannett Co., Inc. | $ | 100 | $ | 102.77 | $ | 92.87 | $ | 131.35 | $ | 222.61 | $ | 246.76 | ||||||
S&P 500 Index | $ | 100 | $ | 115.06 | $ | 117.49 | $ | 136.30 | $ | 180.44 | $ | 205.14 | ||||||
Peer Group | $ | 100 | $ | 109.94 | $ | 97.86 | $ | 133.27 | $ | 228.48 | $ | 235.72 | ||||||
ITEM 6. SELECTED FINANCIAL DATA
Selected financial data for the years 2010 through 2014 is contained under the heading “Selected Financial Data” on page 78 and is derived from our audited financial statements for those years.
The information contained in the “Selected Financial Data” is not necessarily indicative of the results of operations to be expected for future years, and should be read in conjunction with “Management’s Discussion and Analysis of Financial Condition and Results of Operations” included in Item 7 and the consolidated financial statements and related notes thereto included in Item 8 of this Form 10-K.
ITEM 7.MANAGEMENT’S DISCUSSION AND ANALYSIS OF FINANCIAL CONDITION AND RESULTS OF OPERATIONS
Certain factors affecting forward-looking statements
Certain statements in this Annual Report on Form 10-K contain certain forward-looking statements regarding business strategies, market potential, future financial performance and other matters. The words “believe,” “expect,” “estimate,” “could,” “should,” “intend,” “may,” “plan,” “seek,” “anticipate,” “project” and similar expressions, among others, generally identify “forward-looking statements,” which speak only as of the date the statements were made. These forward-looking statements are subject to certain risks and uncertainties that could cause actual results and events to differ materially from those anticipated in the forward-looking statements. We are not responsible for updating or revising any forward-looking statements, whether the result of new information, future events or otherwise, except as required by law.
Potential risks and uncertainties which could adversely affect our results include, without limitation, the following factors:
(a) competitive pressures in the markets in which we operate;
(b) increased consolidation among major retailers or other events which may adversely affect business operations of major customers and depress the level of local and national advertising; (c) a decline in viewership of major networks and local news programming resulting from alternative forms of media, or other factors; (d) macroeconomic trends and conditions; (e) economic downturns leading to a continuing or accelerated decrease in circulation or local, national or classified advertising; (f) potential disruption or interruption of our operations due to accidents, extraordinary weather events, civil unrest, political events, terrorism or cyber security attacks; (g) an accelerated decline in general print readership and/or advertiser patterns as a result of competitive alternative media or other factors; (h) an inability to adapt to technological changes or grow our online business; (i) an increase in newsprint, syndication programming costs or reverse retransmission payments over the levels anticipated; (j) labor relations, including, but not limited to, labor disputes which may cause revenue declines or increased labor costs; (k) an inability to realize benefits or synergies from acquisitions of new businesses or dispositions of existing businesses or to operate businesses effectively following acquisitions or divestitures; (l) our ability to attract and retain employees; (m) rapid technological changes and frequent new product introductions prevalent in electronic publishing and digital businesses; (n) an increase in interest rates; (o) a weakening in the British pound to U.S. dollar exchange rate; (p) volatility in financial and credit markets which could affect the value of retirement plan assets and our ability to raise funds through debt or equity issuances and otherwise affect our ability to access the credit and capital markets at the times and in the amounts needed and on acceptable terms; (q) changes in the regulatory environment which could encumber or impede our efforts to improve operating results or the
24
value of assets; (r) credit rating downgrades, which could affect the availability and cost of future financing; (s) adverse outcomes in proceedings with governmental authorities or administrative agencies; (t) the proposed separation of our Publishing business from our Broadcasting and Digital businesses may be distracting to management and may not be completed on the terms or timeline currently contemplated, if at all; and (u) an other than temporary decline in operating results and enterprise value that could lead to non-cash goodwill, other intangible asset, investment or property, plant and equipment impairment charges. We continue to monitor the uneven economic recovery in the U.S. and U.K., as well as new and developing competition and technological change, to evaluate whether any indicators of impairment exist, particularly for those reporting units where fair value is closer to carrying value.
Executive Summary
We are a leading international media and marketing solutions company operating primarily in the United States and the United Kingdom (U.K.). Approximately 91% of 2014 consolidated revenues are generated by our domestic operations and approximately 9% by our foreign operations, primarily in the U.K.
We implement our strategy and manage our operations through three business segments: Broadcasting (television), Publishing, and Digital. Through our Broadcasting Segment, we own or service (through shared service agreements or similar arrangements) 46 television stations with affiliated digital platforms sites. These stations serve almost one-third of the U.S. population in markets with more than 35 million households.
The Publishing Segment’s operations comprise 100 daily publications and digital platforms in the U.S. and the U.K., more than 400 non-daily publications in the U.S., and more than 125 such titles in the U.K. The Publishing Segment’s 82 U.S. daily publications include USA TODAY, which is currently the nation’s number one newspaper in consolidated print and digital circulation. Together with 18 daily paid-for publications our Newsquest division operates in the U.K., the total average daily print and digital circulation of our 100 domestic and U.K. daily publications was approximately 5.4 million for 2014. In the markets we serve, we also operate desktop, smartphone and tablet products which are tightly integrated with publishing operations. Our broadcasting and publishing operations have strategic business relationships with online affiliates including CareerBuilder, Cars.com, and Shoplocal.com.
The Publishing Segment also includes commercial printing, newswire, marketing and data services operations.
Our Digital Segment consists of Cars.com, CareerBuilder, PointRoll and Shoplocal. Cars.com, of which we recently acquired full ownership, is the leading destination for online car shoppers. CareerBuilder is the global leader in human capital solutions, helping companies to target, attract and retain talent. Its online job site, CareerBuilder.com, is the largest in North America with the highest revenue. CareerBuilder is rapidly expanding its international operations.
On August 5, 2014, following a strategic review of our growth strategies and structure, we announced a plan to separate our Publishing business into an independent publicly traded company. We expect to complete the transaction as a tax-free spin-off in mid-2015, subject to market, regulatory, and certain other conditions. We also announced that Robert J. Dickey has been appointed as CEO-designee of the standalone Publishing company following separation. The separation is subject to risks, uncertainties and conditions and there can be no assurance that the separation will be completed on the terms or on the timing currently contemplated, or at all. Please see the information in Item 1A Risk Factors of this
Form 10-K, which describes some of the risks and uncertainties associated with the proposed separation.
Fiscal year: Our fiscal year ends on the last Sunday of the calendar year. Our 2014 fiscal year ended on Dec. 28, 2014, and encompassed a 52-week period. Our 2013 fiscal year encompassed a 52-week period and the 2012 fiscal year encompassed a 53-week period.
Operating results summary: Company-wide operating revenues were $6.01 billion in 2014, an increase of 16% from $5.16 billion in 2013.
Broadcasting revenues for 2014 increased 103% to $1.69 billion, a record-high, driven primarily by the acquisitions of Belo and London Broadcasting Company television stations as well as substantially higher retransmission revenue, political and Winter Olympics advertising.
Publishing revenues were $3.42 billion for 2014 or 4% below 2013 levels, reflecting a 6% decline in advertising revenues, and a 1% decline in circulation revenues.
Digital Segment revenues totaled $919 million for 2014, a record high and an increase of 23%. The increase reflects strong results at CareerBuilder driven by the strength of human capital software solutions and the recent acquisition of Cars.com (formerly known as Classified Ventures, LLC).
Digital revenues company-wide, including the Digital Segment and all digital revenues generated by other business segments, were approximately $1.72 billion in 2014, nearly 30% of total operating revenues, a record-high, and an increase of 15% compared to 2013. The increase was driven primarily by higher revenue associated with digital advertising and marketing solutions across all segments, strong growth at CareerBuilder and the Cars.com acquisition.
Total operating expenses increased by 12% to $4.95 billion for 2014, primarily due to the Belo and Cars.com acquisitions. This increase was partially offset by lower volume-related expenses in our Publishing Segment and continued cost efficiency efforts company-wide.
Newsprint expense for publishing was 9% lower than in 2013 due to a decline in consumption and prices.
We reported operating income for 2014 of $1.06 billion compared to $739 million in 2013, a 43% increase.
Company-wide operating margins improved significantly to 18% in 2014 compared to 14% in 2013 driven by strong growth in Broadcasting Segment results.
Our net equity income in unconsolidated investees for 2014 was $167 million, an increase of $123 million over 2013, reflecting primarily the gain in the second quarter from the sale of Apartments.com by Classified Ventures, of which we owned 27%.
Interest expense was $273 million in 2014, an increase of $97 million compared to 2013, largely due to new debt associated with the Belo and Cars.com acquisitions.
Other non-operating items totaled $404 million in 2014, an increase of $452 million over 2013, primarily reflecting the write up of our prior investment in Cars.com to fair value once we completed the acquisition.
We reported net income attributable to Gannett of $1.06 billion or $4.58 per diluted share for 2014 compared to $389 million or $1.66 per diluted share for 2013.
Net income attributable to noncontrolling interests was $68 million in 2014, an increase of 19% or $11 million over 2013, reflecting significantly improved operating results at CareerBuilder.
During 2014, we paid out $181 million in dividends and repurchased 2.7 million shares at a cost of $76 million for an average price of $28.13 per share.
25
Outlook for 2015: For 2015, we expect revenue in our Broadcasting Segment to be impacted by challenging year-over-year comparisons due to the cyclical absence of record political advertising and significant Olympics revenues, which totaled $200 million in 2014. We anticipate Broadcasting Segment revenues in 2015 will benefit from higher retransmission revenues, television digital revenue growth and Super Bowl revenue across our NBC stations.
Within our Publishing Segment, we intend to drive growth opportunities by capitalizing on our national brand equity to increase the integration of local and national content, enhance our position as a trusted provider of local news through expanded digital offerings and leverage our expertise to provide integrated solutions to advertisers. While we expect traditional advertising and circulation revenues to remain challenging, some of that decline will be offset by growth in digital marketing services and other digital revenues. As discussed above on page 25, we plan to separate our Publishing business into an independent publicly traded company.
Digital Segment revenues are expected to increase significantly primarily due to the addition of Cars.com and continued growth at CareerBuilder.
Total operating expenses are also expected to increase in comparison to 2014. Broadcasting Segment expenses are anticipated to increase, commensurate with growth in revenue and reflecting increased reverse retransmission fees as a part of programming expenses. Publishing expenses will reflect lower spending due to cost reductions and efficiency gains on initiatives as well as lower newsprint expense, as consumption continues to decline.
The following 2015 outlook does not reflect the proposed separation of our Publishing business from our Broadcasting and Digital businesses:
• | Depreciation expense is expected to be in the range of $210 million to $215 million in 2015. Capital expenditures are expected to be approximately $135 million to $140 million. |
• | Amortization expense is expected to be in the range of $125 million to $140 million in 2015, a significant increase over 2014 primarily due to the Cars.com acquisition. |
• | We project our interest expense will increase slightly in 2015, reflecting the full year impact of debt issued in the second half of 2014 in connection with the Cars.com acquisition. |
Basis of reporting
Following is a discussion of the key factors that have affected our accounting for or reporting on the business over the last three fiscal years. This commentary should be read in conjunction with our financial statements, selected financial data and the remainder of this Form 10-K.
Critical accounting policies and the use of estimates: The preparation of financial statements in conformity with generally accepted accounting principles requires management to make estimates and assumptions about future events that affect the amounts reported in the financial statements and accompanying notes. Actual results could differ significantly from those estimates. We believe the following discussion addresses our most critical accounting policies, which are those that are important to the presentation of our financial condition and results of operations and require management’s most subjective and complex judgments.
Business Combinations: We allocate the fair value of purchase consideration to the tangible assets acquired, liabilities assumed and intangible assets acquired, based on their estimated fair values. The excess of the fair value of purchase consideration over the values of these identifiable assets and liabilities is recorded as goodwill. When determining the fair value of assets acquired and liabilities assumed, management makes significant estimates and assumptions, especially with respect to intangible assets.
Critical estimates in valuing certain identifiable assets include but are not limited to expected long-term market growth; station revenue shares within a market; future expected operating expenses; cost of capital; and appropriate discount rates. Management’s estimates of fair value are based upon assumptions believed to be reasonable, but which are inherently uncertain and unpredictable and, as a result, actual results may differ from estimates.
Goodwill: As of Dec. 28, 2014, goodwill represented approximately 40% of our total assets. Goodwill represents the excess of acquisition cost over the fair value of assets acquired, including identifiable intangible assets, net of liabilities assumed. Goodwill is tested for impairment on an annual basis (first day of fourth quarter) or between annual tests if events occur or circumstances change that would more likely than not reduce the fair value of a reporting unit below its carrying amount.
Before performing the annual two-step goodwill impairment test, we are first permitted to perform a qualitative assessment to determine if the two-step quantitative test must be completed. The qualitative assessment considers events and circumstances such as macroeconomic conditions, industry and market conditions, cost factors and overall financial performance, as well as company and specific reporting unit specifications. If after performing this assessment, we conclude it is more likely than not that the fair value of a reporting unit is less than its carrying amount, then we are required to perform a two-step quantitative test. Otherwise, the two-step test is not required. In the first step of the quantitative test, we are required to determine the fair value of each reporting unit and compare it to the carrying amount of the reporting unit. Fair value of the reporting unit is determined using various techniques, including multiple of earnings and discounted cash flow valuation. Determining the fair value of the reporting units is judgmental in nature and involves the use of significant estimates and assumptions. These estimates and assumptions include changes in revenue and operating margins used to project future cash flows, discount rates, valuation multiples of entities engaged in the same or similar lines of business and future economic and market conditions. If the carrying amount of the reporting unit exceeds the fair value of the reporting unit, we perform the second step of the impairment test, as this is an indication that the reporting unit goodwill may be impaired. In the second step of the impairment test, we determine the implied fair value of the reporting unit’s goodwill. If the carrying value of a reporting unit’s goodwill exceeds its implied fair value, then an impairment of goodwill has occurred and we must recognize an impairment loss for the difference between the carrying amount and the implied fair value of goodwill.
In 2014, following this testing, we recognized impairment charges in our Publishing Segment of $22 million and in our Digital Segment of $24 million. The charges were to bring the recorded goodwill equal to implied fair value based on future projections for each reporting unit. The impairment charges coincide with updated financial projections for each of these reporting units.
We used both the qualitative and quantitative assessments for our goodwill impairment testing during 2014.
26
We have 6 major reporting units (defined as reporting units with goodwill in excess of $50 million) which accounted for 99% of our goodwill balance at Dec. 28, 2014. The following table shows the aggregate goodwill for these units summarized at the segment level:
In millions of dollars | |||
Segment | Goodwill Balance | ||
Broadcasting | $ | 2,580 | |
Publishing | $ | 542 | |
Digital | $ | 1,313 | |
For the Broadcasting Segment, which is considered a single reporting unit, the estimated value would need to decline by over 40% to fail step one of the quantitative goodwill impairment test.
In the case of the Publishing Segment, there are three major reporting units that comprise the goodwill balance shown above. These consist of U.S. Community Publishing (including Gannett Publishing Services), Newsquest and USA TODAY group (which includes USA TODAY brand properties). For U.S. Community Publishing, USA TODAY group and Newsquest, the estimated fair value of each of these reporting units exceeded the carrying value at the most recent test. In order for the reporting unit with the least amount of headroom to fail step one of the quantitative goodwill impairment test, the estimated value of the reporting unit would have to decline by over 30%.
The Digital Segment balance represents primarily Cars.com and CareerBuilder. For CareerBuilder, we performed a qualitative assessment and concluded that it was more likely than not that the fair value was greater than the carrying value. After the impairment testing date, we completed our acquisition of Cars.com which is part of the Digital Segment. The carrying value of Cars.com on the day of acquisition was equal to its fair value.
Fair value of the reporting units depends on several factors, including the future strength of the economy in our principal broadcast, publishing and digital markets. Generally uneven recoveries in the U.S. and U.K. markets have had an adverse effect on most of our reporting units in recent years. The differences between fair value and carrying value have narrowed particularly for certain less significant reporting units in the Publishing Segment. New and developing competition as well as technological change could also adversely affect future fair value estimates. Any one or a combination of these factors could lead to declines in reporting unit fair values and result in goodwill impairment charges.
Indefinite Lived Intangibles: This asset grouping consists of FCC licenses for television stations and mastheads and trade names for publishing and digital businesses.
Indefinite lived assets are not subject to amortization and as a result they are tested for impairment annually (on the first day of the fourth quarter), or more frequently if events or changes in circumstances suggest that the asset might be impaired. We are permitted to perform a qualitative assessment to determine if it is more likely than not that the fair value of the indefinite lived asset is more than its carrying amount. If that is the case, then we would not have to perform the quantitative analysis. The qualitative assessment considers events and circumstances such as macroeconomic conditions, industry and market conditions, cost factors and overall financial performance of the indefinite lived asset.
Television FCC licenses are not subject to amortization and are tested for impairment annually (first day of fourth quarter), or more frequently if events or changes in circumstances indicate that the asset might be impaired. If the licenses are not tested qualitatively, then the quantitative impairment test consists of a comparison of the fair value of the license with its carrying amount. Fair value is estimated using an income approach referred to as the “Greenfield Approach.” This method requires multiple assumptions relating to
the future prospects of each individual television station including, but not limited to: (i) expected long-term market growth characteristics, (ii) station revenue shares within a market for a new entrant, (iii) future expected operating expenses, (iv) costs of capital and (v) appropriate discount rates. We performed a qualitative analysis on all of our FCC licenses on the impairment testing date and concluded that it was more likely than not that the fair value was more than the carrying value for each license.
We completed our acquisition of Belo in late 2013 and London Broadcasting in mid-2014 and as a result recorded FCC licenses for all stations acquired. As these FCC licenses were recorded at fair value on the date of acquisition, any future declines in the fair value of the FCC license would result in an impairment charge. Factors that could cause the fair value to decline would be negative changes in any of the assumptions described in the above Greenfield Approach. The discount rate used generally has a significant impact to the Greenfield Approach valuation. For our 2014 impairment testing date the discount rate had declined from when we completed our acquisition of Belo. Future increases in the discount rate assumptions could cause a decline in the fair value of our FCC licenses which may result in an impairment charge.
Local mastheads (publishing periodical titles and web site domain names) and other trade names are not subject to amortization and as a result they are tested for impairment annually (first day of the fourth quarter), or more frequently if events or changes in circumstances suggest that the asset might be impaired. The quantitative impairment test consists of a comparison of the fair value of each masthead/domain name or trade name with its carrying amount. We use a “relief from royalty” approach which utilizes a discounted cash flow model to determine the fair value of each masthead/domain name or trade name. Management’s judgments and estimates of future operating results in determining the reporting unit fair values are consistently applied to each underlying business in determining the fair value of each intangible asset. We do not believe that any of our larger trade names or mastheads (those with book values over $10 million) are at risk of requiring an impairment charge in the foreseeable future.
After the impairment testing date, we completed our acquisition of Cars.com and as a result recorded an indefinite-lived trade name valued at $872 million. As this trade name was recorded at fair value on the date of acquisition, any future declines in the fair value of the trade name would result in an impairment charge.
Other Long-Lived Assets (Property, Plant and Equipment and Amortizable Intangible Assets): Property, plant and equipment are recorded at cost and depreciated on a straight-line method over the estimated useful lives of such assets. Changes in circumstances, such as technological advances or changes to our business model or capital strategy, could result in actual useful lives differing from our estimates. In cases where we determine the useful life of buildings and equipment should be shortened, we would, after evaluating for impairment, depreciate the asset over its revised remaining useful life thereby increasing depreciation expense.
Accelerated depreciation was recorded in the years 2012-2014 for certain property, plant and equipment, reflecting specific decisions to consolidate production and other business services, primarily affecting the Publishing Segment.
If an indicator is present, we review our property, plant and equipment assets for potential impairment at the asset group level (generally at the local business level) by comparing the carrying value of such assets with the expected undiscounted cash flows to be generated by those asset groups/local business units. Due to expected continued cash flow in excess of carrying value from its businesses, no property, plant or equipment assets were considered impaired.
27
Our amortizable intangible assets consist mainly of customer relationships, internally valued technology and retransmission agreements. These asset values are amortized systematically over their estimated useful lives. An impairment test of these assets would be triggered if the undiscounted cash flows from the related asset group (business unit) were to be less than the asset carrying value.
We do not believe that any of our larger amortizable intangible assets (those with book values over $10 million) are at risk of requiring an impairment in the foreseeable future.
Pension Accounting: We, along with our subsidiaries, have various defined benefit retirement plans, under which substantially all of the benefits have been frozen in previous years. We account for our pension plans in accordance with the applicable accounting guidance, which requires us to include the funded status of our pension plans in our balance sheets, and to recognize, as a component of other comprehensive income (loss), the gains or losses that arise during the period, but are not recognized in pension expense. Pension expense is reported on the Consolidated Statements of Income as “Cost of sales and operating expenses,” or “Selling, general and administrative expenses”.
The determination of pension plan obligations and expense is dependent upon a number of assumptions regarding future events, the most important of which are the discount rate applied to pension plan obligations and the expected long-term rate of return on plan assets. The discount rate assumption is based on investment yields available at year-end on corporate bonds rated AA and above with a maturity to match the expected benefit payment stream. A decrease in discount rates would increase pension obligations.
We establish the expected long-term rate of return by developing a forward-looking, long-term return assumption for each pension fund asset class, taking into account factors such as the expected real return for the specific asset class and inflation. A single, long-term rate of return is then calculated as the weighted average of the target asset allocation percentages and the long-term return assumption for each asset class. We apply the expected long-term rate of return to the fair value of its pension assets in determining the dollar amount of its expected return. Changes in the expected long-term return on plan assets would increase or decrease pension plan expense. The effects of actual results differing from these assumptions are accumulated as unamortized gains and losses. A corridor approach is used in the amortization of these gains and losses, by amortizing the balance exceeding the greater of 10% of the beginning balances of the projected benefit obligation or the fair value of the plan assets. The amortization period is based on the average life expectancy of plan participants, which is currently estimated to be approximately 22 years for our principal retirement plan.
For 2014, the assumption used for the discount rate was 4.05% for our principal retirement plan obligations. As an indication of the sensitivity of pension liabilities to the discount rate assumption, a 50 basis point reduction in the discount rate at the end of 2014 would have increased plan obligations by approximately $125 million. A 50 basis point change in the discount rate used to calculate 2014 expense would have changed total pension plan expense for 2014 by approximately $1.8 million. We assumed a rate of 8.00% for our long-term expected return on pension assets used for our principal retirement plan. As an indication of the sensitivity of pension expense to the long-term rate of return assumption, a 50 basis point decrease in the expected rate of return on pension assets would have increased estimated pension plan expense for 2014 by approximately $9.8 million.
Income Taxes: Our annual tax rate is based on our income, statutory tax regulations and rates, and tax planning opportunities available in the various jurisdictions in which we operate. Significant judgment is required in determining our annual tax expense and in evaluating our tax positions.
Tax law requires certain items to be included in our tax returns at different times than when the items are reflected in the financial statements. The annual tax expense reflected in the Consolidated Statements of Income is different than that reported in our tax returns. Some of these differences are permanent, for example expenses recorded for accounting purposes that are not deductible in the returns such as non-deductible goodwill, and some differences are temporary and reverse over time, such as depreciation expense. Temporary differences create deferred tax assets and liabilities. Deferred tax liabilities generally represent tax expense recognized in the financial statements for which payment has been deferred, or expense for which a deduction has been taken already in the tax return but the expense has not yet been recognized in the financial statements. Deferred tax assets generally represent items that can be used as a tax deduction or credit in tax returns in future years for which a benefit has already been recorded in the financial statements. Valuation allowances are established when necessary to reduce deferred income tax assets to the amounts we believe are more likely than not to be recovered. In evaluating the amount of any such valuation allowance, we consider the existence of cumulative income or losses in recent years, the reversal of existing temporary differences, the existence of taxable income in prior carry back years, available tax planning strategies and estimates of future taxable income for each of our taxable jurisdictions. The latter two factors involve the exercise of significant judgment. As of Dec. 28, 2014, deferred tax asset valuation allowances totaled $200 million, primarily related to federal and state capital losses, foreign tax credits, foreign losses and state net operating losses available for carry forward to future years. Although realization is not assured, we believe it is more likely than not that all other deferred tax assets for which no valuation allowances have been established will be realized. This conclusion is based on our history of cumulative income in recent years and review of historical and projected future taxable income.
We determine whether it is more likely than not that a tax position will be sustained upon examination by the appropriate taxing authorities before any part of the benefit is recorded in our financial statements. A tax position is measured as the portion of the tax benefit that is greater than 50% likely to be realized upon settlement with a taxing authority (that has full knowledge of all relevant information). We may be required to change our provision for income taxes when the ultimate treatment of certain items is challenged or agreed to by taxing authorities, when estimates used in determining valuation allowances on deferred tax assets significantly change, or when receipt of new information indicates the need for adjustment in valuation allowances. Future events, such as changes in tax laws, tax regulations, or interpretations of such laws or regulations, could have an impact on the provision for income tax and the effective tax rate. Any such changes could significantly affect the amounts reported in the Consolidated Financial Statements in the year these changes occur.
The effect of a one percentage point change in the effective tax rate for 2014 would have resulted in a change of $13 million in the provision for income taxes and net income attributable to Gannett Co., Inc.
28
RESULTS OF OPERATIONS
Consolidated summary
A consolidated summary of our results is presented below.
In millions of dollars, except per share amounts | |||||||||||
2014 | Change | 2013 | Change | 2012 | |||||||
Operating revenue: | |||||||||||
Broadcasting | $ | 1,692 | 103% | $ | 835 | (8%) | $ | 906 | |||
Publishing advertising | 2,070 | (6%) | 2,199 | (7%) | 2,356 | ||||||
Publishing circulation | 1,119 | (1%) | 1,129 | 1% | 1,117 | ||||||
All other Publishing | 233 | (7%) | 250 | (2%) | 255 | ||||||
Digital | 919 | 23% | 748 | 4% | 719 | ||||||
Intersegment Elimination | (25 | ) | *** | — | *** | — | |||||
Total operating revenues | $ | 6,008 | 16% | $ | 5,161 | (4%) | $ | 5,353 | |||
Operating expenses | $ | 4,950 | 12% | $ | 4,422 | (3%) | $ | 4,563 | |||
Operating income | $ | 1,058 | 43% | $ | 739 | (6%) | $ | 790 | |||
Non-operating (income) expense, net | $ | (298 | ) | *** | $ | 180 | 51% | $ | 119 | ||
Net income: | |||||||||||
Per share – basic | $ | 4.69 | *** | $ | 1.70 | (7%) | $ | 1.83 | |||
Per share – diluted | $ | 4.58 | *** | $ | 1.66 | (7%) | $ | 1.79 | |||
A discussion of operating results of our Broadcasting, Publishing, and Digital Segments, along with other factors affecting net income attributable to Gannett, is as follows:
Broadcasting Segment
2014 was a record year for our Broadcasting Segment. The largest contributor was the significant expansion of our television station portfolio. At the end of 2014, our broadcasting operations included 46 television stations either owned or serviced through shared service agreements or other similar agreements. Stations in our broadcasting division cover almost one-third of the U.S. population in markets with more than 35 million households.
Broadcasting Segment revenues accounted for approximately 28% of our reported operating revenues in 2014. Broadcasting Segment revenues accounted for approximately 16% of our reported operating revenues in 2013 and 17% in 2012.
Over the last three years, Broadcasting Segment revenues, expenses and operating income were as follows:
In millions of dollars | |||||||||||
2014 | Change | 2013 | Change | 2012 | |||||||
Revenues | $ | 1,692 | *** | $ | 835 | (8%) | $ | 906 | |||
Expenses | 947 | *** | 473 | 2% | 462 | ||||||
Operating income | $ | 745 | *** | $ | 362 | (18%) | $ | 444 | |||
Broadcasting Segment revenues are grouped into five categories: Core (Local and National), Political, Retransmission, Digital and Other. The following table summarizes the year-over-year changes in these select revenue categories.
In millions | |||||||
2014 | Percentage Change From 2013 | ||||||
Reported(a) | Reported | Pro Forma (b) | |||||
Core (Local & National) | $ | 1,046 | 74% | (2%) | |||
Political | 159 | *** | *** | ||||
Retransmission (c) | 362 | 145% | 62% | ||||
Digital | 98 | 156% | 19% | ||||
Other | 28 | (24%) | (1%) | ||||
Total | $ | 1,692 | 103% | 19% | |||
(a) Numbers do not sum due to rounding. | |||||||
(b) The pro forma figures are presented as if the acquisition of Belo Corp. and the six acquired London Broadcasting Company television stations as well as the Captivate disposition had occurred at the beginning of 2013. See "Presentation of Pro Forma Information" on page 39. | |||||||
(c) Reverse compensation to network affiliates is included as part of programming costs and therefore is excluded from this line. | |||||||
Reported Broadcasting Segment revenues increased $857 million to $1.69 billion or 103% for 2014, a record high, primarily driven by the acquisition of Belo and London Broadcasting television stations, as well as substantially higher retransmission revenue and record non-presidential year political advertising. Core advertising revenues, which consist of Local and National non-political advertising, increased 74% to $1.05 billion in 2014 mainly due to television station acquisitions and $41 million in advertising associated with the Winter Olympics that was partially offset by political advertising displacement. Political advertising reached $159 million compared to $13 million in 2013, driven by a strong political footprint. Retransmission revenues increased 145% in 2014 resulting from the expansion of our Broadcasting Segment portfolio and rate increases. Within the Broadcasting Segment, digital revenue increased 156% compared to 2013 reflecting continued growth from digital marketing services products.
Broadcasting Segment costs doubled to $947 million in 2014. The increase is driven primarily by the acquisitions as well as higher investment in digital initiatives and reverse network compensation.
As a result of all of these factors, Broadcasting Segment operating income more than doubled to $745 million in 2014.
Broadcasting Segment results 2013-2012: Reported broadcasting revenues decreased $71 million to $835 million or 8% for 2013. The 2013 year-over-year comparison is impacted by the absence of a record level of political spending and advertising revenues associated with the 2012 Summer Olympics as well as an extra week in 2012’s results.
Core advertising revenues, while impacted by the displacement of record political revenues, were up 3% in 2013, reflecting strong growth in the media, medical, and services categories. Retransmission revenues increased 52% in 2013 and digital television revenues increased 21% compared to 2012.
Broadcasting Segment costs increased 2% to $473 million in 2013. The increase reflects higher digital sales and marketing costs in 2013 associated with online revenue growth and workforce restructuring costs associated with the Belo transaction.
As a result of all of these factors, Broadcasting Segment operating income decreased 18% to $362 million in 2013.

29
Publishing Segment
Our publishing operations include USCP, Gannett Publishing Services, USA TODAY group (which includes USA TODAY brand properties), Newsquest, which produces daily and non-daily publications in the U.K., Clipper Magazine, Gannett Government Media and other advertising and marketing services businesses. The Publishing Segment in 2014 contributed 57% of our revenues.
Publishing operating results were as follows:
Publishing operating results, in millions of dollars | |||||||||||
2014(a) | Change | 2013 | Change | 2012(a) | |||||||
Revenues | $ | 3,422 | (4%) | $ | 3,578 | (4%) | $ | 3,728 | |||
Expenses | 3,193 | (2%) | 3,264 | (3%) | 3,360 | ||||||
Operating income | $ | 228 | (27%) | $ | 314 | (15%) | $ | 369 | |||
(a) Numbers do not sum due to rounding. | |||||||||||
Foreign currency translation impacts: The average exchange rate used to translate U.K. publishing results was 1.65 for 2014, 1.56 for 2013 and 1.58 for 2012. Translation fluctuations impact U.K. publishing revenue, expense and operating income results.
Publishing Segment operating revenues: Publishing operating revenues are derived principally from advertising sales which accounted for 61% of total publishing revenues in 2014, and circulation sales which accounted for 33% of total publishing revenues in 2014. Advertising revenues include those derived from advertising placed with print products as well as publishing related Internet desktop, smartphone and tablet applications. These include revenue in the classified, retail and national advertising categories. Circulation revenues are derived principally from distributing our publications on our digital platforms, from home delivery and from single copy sales of our publications. Other publishing revenues are mainly from commercial printing.
The table below presents the principal components of Publishing Segment revenues for the last three years.
Publishing operating revenues, in millions of dollars | |||||||||||
2014 | Change | 2013 | Change | 2012 | |||||||
Advertising | $ | 2,070 | (6%) | $ | 2,199 | (7%) | $ | 2,356 | |||
Circulation | 1,119 | (1%) | 1,129 | 1% | 1,117 | ||||||
Commercial printing and other | 233 | (7%) | 250 | (2%) | 255 | ||||||
Total | $ | 3,422 | (4%) | $ | 3,578 | (4%) | $ | 3,728 | |||
Publishing Segment digital revenues were up for the year in the U.S. as well as at Newsquest in the U.K. Revenues benefited from our continued focus on digital marketing services. Domestic U.S. digital revenues were up 4%, while digital revenues at Newsquest increased 21% in local currency.
The table below presents the principal components of Publishing Segment advertising revenues for the last three years. These amounts include advertising revenue from printed publications as well as online advertising revenue from desktop, smartphone and tablets affiliated with the publications.
Advertising revenues, in millions of dollars | |||||||||||
2014 | Change | 2013 | Change | 2012 | |||||||
Retail | $ | 1,095 | (5%) | $ | 1,157 | (6%) | $ | 1,230 | |||
National | 321 | (12%) | 365 | (8%) | 396 | ||||||
Classified | 654 | (3%) | 677 | (7%) | 730 | ||||||
Total advertising revenue | $ | 2,070 | (6%) | $ | 2,199 | (7%) | $ | 2,356 | |||
Publishing Segment revenue comparisons 2014-2013:
Advertising Revenue: Advertising revenues for 2014 decreased $129 million or 6%. The decrease reflects lower advertising demand due to ongoing secular pressures.
The tables below present the percentage change in 2014 compared to 2013 for each of the major advertising and classified revenue categories, presented as if the Apartments.com sale, which affected classified real estate revenue comparisons, occurred at the beginning of 2013. Revenue recorded to classified real estate advertising related to Apartments.com sales totaled approximately $4 million in 2014 and $15 million in 2013.
The table below presents the percentage change for the retail, national, and classified categories for 2014 compared to 2013.
Advertising Revenue Year Over Year Comparisons | |||
U.S. Publishing | Newsquest (in pounds) | Total Publishing Segment | |
Retail | (6%) | (2%) | (5%) |
National | (14%) | (4%) | (12%) |
Classified | (4%) | (3%) | (2%) |
Total | (7%) | (3%) | (6%) |
Retail advertising revenues were down $62 million or 5% in 2014. In the U.S., revenues were down in all major categories. Retail advertising revenues, in local currency, were down 2% in the U.K.
National advertising revenues were down $44 million or 12% in 2014, primarily due to lower advertising sales for USCP, Newsquest, and USA TODAY.
The table below presents the percentage change in classified categories for 2014 compared to 2013 as if the Apartments.com sale occurred at the beginning of 2013.
Classified Revenue Year Over Year Comparisons | |||
U.S. Publishing | Newsquest (in pounds) | Total Publishing Segment | |
Automotive | (2%) | (6%) | (2%) |
Employment | (4%) | 7% | 1% |
Real Estate | (4%) | (9%) | (4%) |
Legal | (4%) | —% | (4%) |
Other | (8%) | (6%) | (6%) |
Total | (4%) | (3%) | (2%) |
Classified advertising revenues declined 4% in the U.S. and 3% in the U.K in 2014. Domestically, automotive advertising was down 2% for the year while employment and real estate both declined 4% for the year. In the U.K., while most classified advertising categories were lower, employment advertising improved 7% in local currency, reflecting the recovery in the U.K. economy.

30
Circulation Revenue: Publishing Segment circulation revenues decreased by $10 million or 1%. Circulation revenues decreased 1% in 2014 at USCP, reflecting an increase in home delivery revenue offset by a decrease in single copy revenue. Home delivery revenue was boosted by the pricing impact of placing USA TODAY local editions in 35 of our USCP units and the strength of our All Access Content Subscription Model, adding engaging content which allowed us to deploy strategic pricing initiatives. Circulation revenues were 4% lower at USA TODAY and 1% lower in local currency in the U.K., due to declines in print circulation volume, partially offset by cover price increases, implemented in 2013.
Daily average print and digital, replica and non-replica circulation, excluding USA TODAY, declined 9%, while Sunday net paid circulation declined 3%.
For local publishing operations in the U.S. and U.K., morning circulation accounted for approximately 95% of total daily volume, while evening circulation accounted for 5%.

Local publishing circulation volume is summarized in the table below.
Total average circulation volume, print and digital, replica and non-replica in thousands | ||||||||
2014 | Change | 2013 | Change | 2012 | ||||
Local Publications | ||||||||
Morning | 2,715 | (8%) | 2,967 | (8%) | 3,240 | |||
Evening | 145 | (10%) | 161 | (9%) | 177 | |||
Total daily | 2,860 | (9%) | 3,128 | (8%) | 3,417 | |||
Sunday | 4,569 | (3%) | 4,729 | (5%) | 5,003 | |||
Other Revenue: Commercial printing and other publishing revenues were down 7% in 2014 and totaled $233 million, reflecting the sale of a print business and a decrease in U.K. commercial print revenues. Commercial printing revenues in the U.S. and U.K. combined accounted for nearly 60% of total other revenues.
Publishing Segment revenue comparisons 2013-2012:
Advertising Revenue: Advertising revenues for 2013 declined $157 million or 7%. The decrease reflecting lower advertising demand due to secular pressures, a slow pace of the economic recovery, and the extra week in 2012.
Ad revenues were lower in both the U.S. and the U.K. In the U.K., in local currency, advertising revenues comparisons lagged comparisons in the U.S. Newsquest advertising revenues were down 8% compared with 6% decline for U.S. publishing.
Retail advertising revenues were down $73 million or 6% in 2013. In the U.S., revenues were down in all major categories. Retail advertising revenues were down 4% in the U.K. on a constant currency basis.
National advertising revenues were down $31 million or 8% in 2013, primarily due to lower advertising sales for U.S. Community Publishing, Newsquest, and as well as for USA TODAY and its associated businesses.
Classified advertising revenues declined $53 million or 7% in 2013 with a decline of 7% in the U.S. and 8% in the U.K. Domestically, automotive advertising was down 2% for the year while employment declined 10%. Real estate continued to reflect the housing issues nationwide and was down 5% for the year. Most classified advertising results in the U.K. lagged results in the U.S. as automotive, employment and real estate declined in local currency 10%, 4% and 9%, respectively.
Circulation Revenue: Publishing Segment circulation revenues increased by $12 million or 1% over 2012, reflecting the second consecutive annual company-wide circulation revenue increase. Circulation revenues were up as a result of the implementation of the All Access Content Subscription Model in 2012. Circulation revenues increased 3% in 2013 at USCP. Circulation revenue in the U.K. was up 3% compared to last year in local currency reflecting increases in cover prices.
Revenue comparisons reflect generally lower circulation volumes more than offset by price increases. Daily average print and digital, replica and non-replica circulation, excluding USA TODAY, declined 8%, while Sunday net paid circulation declined 5%.
Circulation revenues were lower at USA TODAY, reflecting lower average print daily circulation volume, partially offset by price increases.
For local publishing operations in the U.S. and U.K., morning circulation accounted for approximately 95% of total daily volume, while evening circulation accounted for 5%.
Other Revenue: Commercial printing and other publishing revenues were down 2% in 2013 and totaled $250 million. Declines in other publishing revenues were partially offset by an increase in commercial print revenues. Commercial printing revenues in the U.S. and U.K. combined, accounted for approximately 60% of total other revenues.
Publishing Segment digital revenues in 2013 were up for the year in the U.S. as well as at Newsquest in the U.K. Revenues benefited from our continued focus on digital marketing services and the All Access Content Subscription Model. Domestic U.S. digital revenues were up 34%, while digital revenues at Newsquest increased 13% in local currency.
Publishing Segment expense comparisons 2014-2013: Publishing operating expense decreased to $3.19 billion in 2014 primarily due to continued cost reductions and efficiency efforts as well as lower print volumes, partially offset by special charges for transformation costs, asset impairments and workforce restructuring.
Publishing payroll costs were down 4% compared to 2013, reflecting the impact of workforce restructuring.
Newsprint expense was down 9% in 2014 due to a decline in consumption and prices.
Publishing Segment expense comparisons 2013-2012: Publishing operating expense decreased to $3.26 billion in 2013 as continued cost efficiency efforts were partially offset by strategic initiative spending of $36 million. A majority of the strategic spending in 2013 was in conjunction with digital relaunches and the investments made in our digital marketing services business.
Publishing payroll costs were down 3% compared to 2012, reflecting the impact of workforce restructuring across certain divisions.
Newsprint expense was down 14% in 2013 due to a decline in consumption and prices.
31
Publishing Segment operating results 2014-2013: Publishing operating income decreased to $228 million in 2014 from $314 million in 2013. The principal factors affecting reported operating results comparisons for the full year were the following:
• | Lower operating results in the U.S. as advertising revenue categories were affected by the impact of the secular pressure on print advertising demand; |
• | Significant increase in digital revenue; |
• | Special charges for transformation costs and asset impairments as well as workforce restructuring costs totaled $123 million in 2014 and $89 million in 2013; |
• | A decrease in newsprint expense. |
Publishing Segment operating results 2013-2012: Publishing operating income decreased to $314 million in 2013 from $369 million in 2012. The principal factors affecting reported operating results comparisons for the full year were the following:
• | Lower operating results in the U.S. and U.K. as advertising revenue categories were affected by the impact of the soft economy on advertising demand, partially offset by an increase in circulation revenue at our USCP and U.K. operations; |
• | Strategic initiative spending in 2013 of $36 million; |
• | Special charges for transformation costs and asset impairments as well as workforce restructuring totaled $89 million in 2013 and $74 million in 2012; |
• | Significant increase in digital revenue; |
• | Negative impact of the extra week in 2012; and |
• | A decrease in newsprint expense. |
Digital Segment
The Digital Segment includes results for stand-alone digital subsidiaries including Cars.com, CareerBuilder, PointRoll, and Shoplocal.
On October 1, 2014, we completed the acquisition of the remaining 73% interest that we did not already own in Cars.com. Full year results for 2014 include Cars.com results following the acquisition on October 1.
On April 1, 2014, CareerBuilder acquired Broadbean, a leader in online recruitment software that enables job distribution, candidate sourcing and big data analytics for employers. The Broadbean acquisition, when combined with the addition of Economic Modeling Specialists Intl. in 2012, represents the next step in CareerBuilder’s transformation, positioning it as a leading company in the rapidly growing software-as-a-service market for talent management solutions.
Digital Segment revenues, expenses and operating income were as follows:
In millions of dollars | |||||||||||
2014 | Change | 2013 | Change | 2012 | |||||||
Revenues | $ | 919 | 23% | $ | 748 | 4% | $ | 719 | |||
Expenses | 764 | 23% | 620 | (8%) | 677 | ||||||
Operating income | $ | 155 | 21% | $ | 128 | *** | $ | 42 | |||
Digital Segment revenues increased $171 million or 23% over 2013 to a record high of $919 million, primarily reflecting the impact of the Cars.com acquisition, and continued growth in revenues at CareerBuilder.
Digital Segment expenses in 2014 increased 23% to $764 million, primarily due to the Cars.com acquisition and an increase in expenses at CareerBuilder associated with its revenue growth. As a result of these factors, Digital Segment operating income increased to $155 million in 2014.
CareerBuilder, a global leader in human capital solutions majority-owned by Gannett, provides services ranging from labor market intelligence to talent management software and other recruitment tools. It is the largest online job site in the U.S., measured both by traffic and revenue, has a presence in more than 60 markets worldwide and focuses on technology solutions and niche sites. Its North American network revenue is driven mainly from its own sales force but it also derives revenues from its owner affiliated businesses, including our local media organizations, which sell various CareerBuilder employment products including upsells of print employment ads. North American revenue increased 3%, compared to last year. CareerBuilder revenues in the Digital Segment exclude amounts recorded at Gannett-owned local media organizations.
Digital Segment results 2013-2012: Digital Segment revenues increased $29 million or 4% over 2012, primarily reflecting a strong increase in revenues at CareerBuilder.
Digital Segment expenses in 2013 decreased 8% to $620 million, primarily due to a $78 million decrease in impairment charges in 2013 partly offset by an increase in expenses at CareerBuilder associated with its revenue growth.
As a result of these factors, Digital Segment operating income increased to $128 million in 2013.
Consolidated operating expenses
Over the last three years, our consolidated operating expenses were as follows:
Consolidated operating expenses, in millions of dollars | |||||||||||
2014 | Change | 2013(a) | Change | 2012 | |||||||
Cost of sales | $ | 3,049 | 6% | $ | 2,882 | (2%) | $ | 2,944 | |||
Selling, general and admin. expenses | 1,539 | 19% | 1,292 | (1%) | 1,303 | ||||||
Depreciation | 186 | 21% | 153 | (5%) | 161 | ||||||
Amortization of intangible assets | 80 | *** | 36 | 9% | 33 | ||||||
Facility consolidation and asset impairment charges | 96 | 65% | 58 | (52%) | 122 | ||||||
Total | $ | 4,950 | 12% | $ | 4,422 | (3%) | $ | 4,563 | |||
(a) Numbers do not sum due to rounding. | |||||||||||
Total reported operating expenses increased 12% to $4.95 billion in 2014, primarily due to the impact of the acquisitions of Belo and the London Broadcasting Company television stations, as well as the acquisition of Cars.com partly offset by continued cost efficiency efforts company-wide as well as lower newsprint expense.
Depreciation expense was 21% higher in 2014, reflecting the acquisitions of television stations as well as Cars.com.
The non-cash facility consolidation and asset impairment charges for all years are more fully discussed beginning on page 34 and in Notes 3 and 4 to the Consolidated Financial Statements.
32
Payroll and benefits and newsprint costs (along with certain other production material costs), the largest elements of our normal operating expenses, are presented below, expressed as a percentage of total pre-tax operating expenses.
2014 | 2013 | 2012 | |
Payroll and employee benefits | 46.0% | 47.6% | 45.9% |
Newsprint and other production material | 8.6% | 10.1% | 11.2% |
Operating expense comparisons 2013-2012: Total reported operating expense decreased 3% to $4.42 billion in 2013, due to continued cost efficiency efforts company-wide, lower facility consolidation and asset impairment charges as well as lower newsprint expense. These were partially offset by $58 million in workforce restructuring charges and $41 million of strategic initiative investments made throughout the year.
Depreciation expense was 5% lower in 2013, reflecting certain assets reaching the end of their depreciable life.
Non-operating income and expense
Equity earnings: This income statement category reflects results from unconsolidated minority interest investments, including our equity share of operating results from our publishing partnerships, including the California Newspapers Partnership, Texas-New Mexico Newspapers Partnership, Tucson newspaper partnership and other online/digital businesses including Cars.com before we acquired it on October 1.
Our net equity income in unconsolidated investees for 2014 was $167 million, an increase of $123 million over 2013. This increase reflects primarily the gain on the sale of Apartments.com, partly offset by the lower equity income from Classified Ventures as well as softer results for newspaper partnerships.
Our net equity income in unconsolidated investees for 2013 was $44 million, an increase of $21 million over 2012. This increase reflects better results at Classified Ventures, the California Newspapers Partnership, as well as reduced impairment charges recognized in 2013.
Interest expense: 2014 interest expense increased by 55% to $273 million compared to 2013 due to a higher average debt level of $3.85 billion. The higher average debt level is related to additional borrowings, partly offset by a lower average interest rate.
Interest expense in 2013 was higher compared to 2012, due to a higher average debt level related to the issuance of $1.85 billion in senior notes in the second half of 2013 primarily related to the Belo acquisition which closed on Dec. 23, 2013.
We increased our long-term debt by $781 million or 21% in 2014. At the end of 2014, our leverage ratio was 2.96x, within the financial covenants under its revolving credit agreements.
A further discussion of our borrowing and related interest cost is presented in the “Liquidity and capital resources” section of this report beginning on page 40 and in Note 6 to the Consolidated Financial Statements.
Other non-operating items: We reported a net gain of $404 million for other non-operating items in 2014. The majority reflects the write-up of our prior 27% investment in Cars.com to fair value post acquisition and a gain related to required accounting for the pre-existing affiliate agreement between us and Cars.com. The net gain was partially offset by acquisition costs and expenses incurred for our previously announced separation in to two public companies.
Other non-operating items totaled a net loss of $48 million in 2013 with the majority related to costs associated with the Belo transaction and a non-cash charge associated with the change in control and sale of interests related to Captivate. These costs were partly offset by interest income earned in 2013.
We reported a net gain of $9 million in 2012 with the majority related to a gain on distribution from a cost method investment and interest income earned during 2012.
Provision for income taxes
We reported pre-tax income attributable to Gannett of $1.29 billion for 2014. The provision for income taxes reflects a special net tax benefit from the sale of a non-strategic subsidiary at a loss, for which a partial tax benefit was recognized. The effective tax rate on pre-tax income is 17.5%.
We reported pre-tax income attributable to Gannett of $502 million for 2013. The provision for income taxes reflects certain state audit settlements and a special net tax benefit from the release of certain tax reserves due to a multi-year federal audit settlement in 2013. The effective tax rate on pre-tax income is 22.6%.
The lower tax rate for 2014 compared to 2013 is due to special items contributing a net tax benefit that related primarily to the 2014 sale of a non-strategic subsidiary at a loss, for which a partial tax benefit was recognized, partially offset by a reduction in audit resolutions.
We reported pre-tax income attributable to Gannett of $620 million for 2012. The provision for income taxes reflects an impairment of non-deductible goodwill, certain state audit settlements and a special net tax benefit from the release of certain tax reserves due to a federal audit settlement in 2012. The effective tax rate on pre-tax income is 31.5%.
The lower effective tax rate for 2013 compared to 2012 is due to special items contributing a net tax benefit that related primarily to a multi-year federal audit settlement recognized in 2013 as well as a non-deductible goodwill impairment charge incurred in 2012.
Further information concerning income tax matters is contained in Note 9 of the Consolidated Financial Statements.
Net income attributable to Gannett Co., Inc.
Net income attributable to Gannett Co., Inc. and related per share amounts are presented in the table below.
In millions of dollars, except per share amounts | |||||||||||
2014 | Change | 2013 | Change | 2012 | |||||||
Net income | $ | 1,062 | *** | $ | 389 | (8%) | $ | 424 | |||
Per basic share | $ | 4.69 | *** | $ | 1.70 | (7%) | $ | 1.83 | |||
Per diluted share | $ | 4.58 | *** | $ | 1.66 | (7%) | $ | 1.79 | |||
Net income attributable to Gannett Co., Inc. consists of net income reduced by net income attributable to noncontrolling interests, primarily from CareerBuilder. Net income attributable to noncontrolling interests was $68 million in 2014, $57 million in 2013 and $51 million in 2012.
33
Operating results non-GAAP information
Presentation of non-GAAP information: We use non-GAAP financial performance and liquidity measures to supplement the financial information presented on a GAAP basis. These non-GAAP financial measures should not be considered in isolation from or as a substitute for the related GAAP measures, and should be read in conjunction with financial information presented on a GAAP basis.
We discuss in this report non-GAAP financial performance measures that exclude from its reported GAAP results the impact of special items consisting of:
• | Workforce restructuring charges; |
• | Transformation costs; |
• | Non-cash asset impairment charges; |
• | A non-cash charge related to a change in control and sale of interests in a business; |
• | Non-cash charges related to certain investments accounted for under the equity method; |
• | Equity income gain on the sale of Apartments.com by Classified Ventures; |
• | Non-operating income from the write-up of our prior equity investment in Cars.com to fair value post acquisition; |
• | Other non-operating expenses related to acquisition costs, donations to our foundation and expenses incurred for our previously announced spin-off of our publishing operation; and |
• | Special tax gains and charges, as well as the tax effect of the above special items. |
We believe that such expenses, charges and credits are not indicative of normal, ongoing operations and their inclusion in results makes for more difficult comparisons between years and with peer group companies. Workforce restructuring and transformation expenses primarily relate to incremental expenses we have incurred to consolidate or outsource production processes and centralize other functions. Workforce restructuring expenses include payroll and related benefit costs as well as charges related to our partial withdrawal from certain multi-employer pension plans. Transformation costs include incremental expenses incurred by us to execute on our transformation and growth plan and incremental expenses associated with optimizing our real estate portfolio. Asset impairment charges reflect non-cash charges to reduce the book value of certain intangible assets to their respective fair value, as our projections for the business underlying the related asset had declined.
In 2014, we recorded a pre-tax gain of $148 million related to the Classified Ventures sale of its Apartments.com business. This gain is reflected in the line equity income in unconsolidated investees, net.
Other non-operating items for 2014 included special gains and charges primarily related to (1) income related to the write-up of our prior investment in Cars.com to fair value post acquisition and the required accounting for the pre-existing affiliate agreement between us and Cars.com, (2) costs for acquiring six London Broadcasting Company television stations and the remaining outstanding shares of Cars.com, (3) expenses related to the planned spin-off of our publishing operation, (4) the early retirement of our 9.375% notes due in 2017, and (5) non-cash donations to our charitable foundation. Other non-operating items in 2013 included Belo acquisition related expenses, a non-cash charge related to a sale of interests in a business and a currency loss related to the weakening of the British pound associated with the downgrade of the U.K. sovereign credit rating.
The income tax provision for 2014 reflects a tax benefit related to our portfolio restructuring, the sale of a non-strategic investment, and a charge related to the sale of our interest in television station KMOV-TV in St. Louis, MO, in February 2014. The income tax provision for 2013 included special credits related to reserve releases as a result of federal exam resolution and lapse of certain statutes of limitations. Results for 2012 included a credit related primarily to tax settlements covering multiple years.
We discuss Adjusted EBITDA, a non-GAAP financial performance measure that we believe offers a useful view of our overall business operations. Adjusted EBITDA is defined as net income attributable to Gannett before (1) net income attributable to noncontrolling interests, (2) income taxes, (3) interest expense, (4) equity income, (5) other non-operating items, (6) workforce restructuring, (7) transformation costs, (8) asset impairment charges, (9) depreciation and (10) amortization. When Adjusted EBITDA is discussed in reference to performance on a consolidated basis, the most directly comparable GAAP financial measure is Net income attributable to Gannett.
We use non-GAAP financial performance measures for purposes of evaluating business unit and consolidated company performance. Therefore, we believe that each of the non-GAAP measures presented provides useful information to investors by allowing them to view our businesses through the eyes of our management and Board of Directors, facilitating comparison of results across historical periods, and providing a focus on the underlying ongoing operating performance of our businesses. Many of our peer group companies present similar non-GAAP measures to better facilitate industry comparisons.
Discussion of special charges and credits affecting reported results: We recorded workforce restructuring related costs totaling $40 million ($26 million after-tax or $.11 per share) in 2014, $58 million ($37 million after-tax or $.16 per share) in 2013, and $49 million ($29 million after-tax or $.12 per share) in 2012. These charges were taken in connection with workforce reductions related to facility consolidation and outsourcing efforts and as part of a general program to fundamentally change our cost structure.
Company-wide transformation plans led us to recognize charges in 2012-2014 associated with revising the useful lives of certain assets over a shortened period, as well as shutdown costs and charges to reduce the carrying value of assets held for sale to fair value less costs to sell. Total charges for these matters were $79 million ($44 million after-tax or $.19 per share) in 2014, $25 million ($15 million after-tax or $.06 per share) in 2013, and $32 million ($20 million after-tax or $.08 per share) in 2012.
We performed impairment tests on certain assets including goodwill and other intangible assets that resulted in the recognition of impairment charges in 2012-2014. During 2014, we recorded non-cash asset impairment charges of $51 million ($46 million after-tax or $.20 per share). In 2013, non-cash asset impairment charges totaled $33 million ($20 million after-tax or $.08 per share). In 2012, non-cash asset impairment totaled $90 million ($87 million after-tax or $.37 per share). These facility consolidation and non-cash impairment charges are detailed in Notes 3 and 4 to the Consolidated Financial Statements.
34
Other non-operating items totaled a gain of $542 million ($325 million after-tax or $1.40 per share) in 2014. The gain is primarily from the $477 million write-up of our prior 27% investment in Cars.com to fair value post acquisition and gain on the settlement of the pre-existing affiliate agreement between us and Cars.com, as well as our equity share of Classified Ventures’ gain on the sale of Apartments.com in April of 2014 that totaled $148 million. Non-operating charges in 2014 were primarily for acquisition costs for the Cars.com and London Broadcasting Company acquisitions, expenses incurred for our previously announced spin-off of our publishing operations, non-cash donations to our charitable foundation and the early retirement of our 9.375% notes due in 2017. In 2013, non-operating items charges totaled $55 million ($41 million after-tax or $.17 per share) and primarily related to a loss recognized on the Captivate transaction and Belo acquisition costs. In 2012, non-operating items charges totaled $7 million ($4 million after-tax or $.02 per share) related to asset impairments of a cost and equity method investment.
In 2014, we recorded special net tax benefits that totaled $218 million or $.94 per share that were primarily driven by a restructuring of our portfolio which included the sale of a non-strategic equity investment. We also recorded a tax benefit of $28 million or $.12 per share related to resolution of several federal tax claims in 2013. In 2012, we recorded $13 million or $.06 per share related primarily to tax settlements covering multiple years.
Consolidated results
The following is a discussion of our as adjusted non-GAAP financial results. All as adjusted (non-GAAP basis) measures are labeled as such or “adjusted”.
Adjustments to remove special items from GAAP operating expense follow:
In millions of dollars | |||||||||||
2014(a) | Change | 2013 | Change | 2012(a) | |||||||
Operating expense (GAAP basis) | $ | 4,950 | 12% | $ | 4,422 | (3%) | $ | 4,563 | |||
Remove special items: | |||||||||||
Workforce restructuring | (40 | ) | (30%) | (58 | ) | 19% | (49 | ) | |||
Transformation costs | (79 | ) | *** | (25 | ) | (21%) | (32 | ) | |||
Asset impairment charges | (51 | ) | 56% | (33 | ) | (63%) | (90 | ) | |||
As adjusted (non-GAAP basis) | $ | 4,779 | 11% | $ | 4,306 | (2%) | $ | 4,393 | |||
(a) Numbers do not sum due to rounding. | |||||||||||
Adjusted operating expenses increased 11% in 2014 over 2013 to $4.78 billion primarily due to the acquisitions of the Belo and London Broadcasting Company television stations and Cars.com, partly offset by continued efficiency efforts company-wide.
Adjusted operating expenses decreased 2% in 2013 over 2012 to $4.31 billion, due to continued efficiency efforts company-wide and the extra week in 2012, partly offset by an increase in Digital Segment expenses related to the increase in revenue.
Adjustments to remove special items from GAAP operating income follow:
In millions of dollars | |||||||||||
2014(a) | Change | 2013 | Change | 2012(a) | |||||||
Operating income (GAAP basis) | $ | 1,058 | 43% | $ | 739 | (6%) | $ | 790 | |||
Remove special items: | |||||||||||
Workforce restructuring | 40 | (30%) | 58 | 19% | 49 | ||||||
Transformation costs | 79 | *** | 25 | (21%) | 32 | ||||||
Asset impairment charges | 51 | 56% | 33 | (63%) | 90 | ||||||
As adjusted (non-GAAP basis) | $ | 1,229 | 44% | $ | 855 | (11%) | $ | 960 | |||
(a) Numbers do not sum due to rounding. | |||||||||||
Adjusted operating income increased 44% in 2014 over 2013 to $1.23 billion. The increase reflects substantially higher revenue growth in the Broadcasting and Digital Segments to record levels, partially offset by a decline in the Publishing Segment. Broadcasting Segment revenues and operating results were higher due to the Belo and London Broadcasting Company television station acquisitions and significant increases in Olympic and political spending as well as retransmission revenue, partly offset by higher expense related to revenue growth as well as higher reverse network compensation fees. Publishing Segment results reflected lower advertising demand and circulation revenue, partially offset by lower operating expenses due primarily to continuing cost efficiency efforts. Digital Segment revenues and operating results were higher primarily due to the impact of the Cars.com acquisition and strong results at Cars.com and CareerBuilder. Digital revenues company-wide including the Digital Segment and all digital revenues generated by other business segments were approximately $1.72 billion in 2014, nearly 30% of operating revenues, and an increase of 15% compared to 2013.
Adjusted operating income decreased 11% in 2013 over 2012 to $855 million. Broadcasting Segment revenues and operating results were lower, reflecting the absence of significant political and Olympic revenues generated in 2012. Publishing Segment revenues reflected lower advertising demand, partially offset by a 1% increase in circulation revenue. Digital Segment revenues increased, reflecting solid revenue growth at CareerBuilder. Digital revenues company-wide including the Digital Segment and all digital revenues generated by other business segments were approximately $1.47 billion in 2013, nearly 30% of operating revenues and an increase of 16% compared to 2012.
35
Adjustments to remove special items from GAAP non-operating expense which consist of equity income or loss, interest expense and other non-operating items follow:
In millions of dollars | |||||||||||
2014 | Change | 2013 | Change | 2012 | |||||||
Total non-operating (expense) income (GAAP basis) | $ | 298 | *** | $ | (180 | ) | 51% | $ | (119 | ) | |
Remove special items: | |||||||||||
Other non-operating items | (542 | ) | *** | 55 | *** | 7 | |||||
As adjusted (non-GAAP basis) | $ | (244 | ) | 95% | $ | (125 | ) | 11% | $ | (112 | ) |
Adjusted non-operating expense increased 95% in 2014 over 2013 to $244 million. This increase reflects higher interest expense due to higher average debt levels from additional borrowings.
Adjusted non-operating expense increased 11% in 2013 over 2012 to $125 million reflecting higher interest expense due to higher average debt levels principally related to the issuance of senior notes related to the Belo transaction.
A summary of the impact of special items on our effective tax rate follows:
In millions of dollars | |||||||||
2014 | 2013 | 2012(a) | |||||||
Provision for income taxes as reported (GAAP basis) | $ | 226 | $ | 113 | $ | 195 | |||
Remove special items: | |||||||||
Workforce restructuring | 15 | 21 | 19 | ||||||
Transformation costs | 36 | 10 | 13 | ||||||
Asset impairment charges | 5 | 13 | 4 | ||||||
Other non-operating items | (217 | ) | 15 | 3 | |||||
Special tax benefits | 218 | 28 | 13 | ||||||
As adjusted (non-GAAP basis) | $ | 283 | $ | 200 | $ | 246 | |||
As adjusted effective tax rate (non-GAAP basis) | 30.9 | % | 29.7 | % | 30.9 | % | |||
(a) Numbers do not sum due to rounding. | |||||||||
The adjusted effective tax rate in 2014 was 30.9% compared to 29.7% in 2013. The slightly higher rate for 2014 reflects a higher proportion of income derived in the U.S., which is taxed at a higher rate, mainly due to the income related to the acquisitions of Belo and Cars.com, as well as fewer tax reserve releases due to expiring statutes of limitations. The adjusted effective tax rate in 2013 was 29.7% compared to 30.9% in 2012. The lower rate for 2013 reflects higher reserve releases due to audit settlements and the lapse of certain statutes of limitations.
Adjustments to remove special items from GAAP net income attributable to Gannett Co., Inc. and diluted earnings per share follow:
In millions of dollars, except per share amounts | |||||||||||
2014(a) | Change | 2013(a) | Change | 2012(a) | |||||||
Net income attributable to Gannett Co., Inc. (GAAP basis) | $ | 1,062 | *** | $ | 389 | (8%) | $ | 424 | |||
Remove special items (net of tax): | |||||||||||
Workforce restructuring | 26 | (30%) | 37 | 26% | 29 | ||||||
Transformation costs | 44 | *** | 15 | (23%) | 20 | ||||||
Asset impairment charges | 46 | *** | 20 | — | 87 | ||||||
Other non-operating items | (325 | ) | *** | 41 | *** | 4 | |||||
Special tax benefits | (218 | ) | *** | (28 | ) | *** | (13 | ) | |||
As adjusted (non-GAAP basis) | $ | 634 | 34% | $ | 473 | (14%) | $ | 551 | |||
Diluted earnings per share (GAAP basis) | $ | 4.58 | *** | $ | 1.66 | (7%) | $ | 1.79 | |||
Remove special items (net of tax): | |||||||||||
Workforce restructuring | 0.11 | (31%) | 0.16 | 33% | 0.12 | ||||||
Transformation costs | 0.19 | *** | 0.06 | (25%) | 0.08 | ||||||
Asset impairment charges | 0.20 | *** | 0.08 | (78%) | 0.37 | ||||||
Other non-operating items | (1.40 | ) | *** | 0.17 | *** | 0.02 | |||||
Special tax benefits | (0.94 | ) | *** | (0.12 | ) | *** | (0.06 | ) | |||
As adjusted (non-GAAP basis) | $ | 2.73 | 35% | $ | 2.02 | (13%) | $ | 2.33 | |||
(a) Numbers do not sum due to rounding. | |||||||||||
Adjusted net income attributable to Gannett Co., Inc. increased 34% in 2014 (35% on a diluted per share basis) as a result of higher as adjusted (non-GAAP basis) operating income in the Broadcasting and Digital Segments, partially offset by lower operating income in the Publishing Segment.
Adjusted net income attributable to Gannett Co., Inc. decreased 14% in 2013 over 2012 (13% on a diluted per share basis) as a result of lower as adjusted (non-GAAP basis) operating income in the Broadcasting and Publishing Segments, partially offset by higher operating income in the Digital Segment.
36
Adjustments to reconcile GAAP net income attributable to Gannett Co., Inc. to Adjusted EBITDA follow:
In millions of dollars | |||||||||||
2014(a) | Change | 2013(a) | Change | 2012(a) | |||||||
Net income attributable to Gannett Co., Inc. (GAAP basis) | $ | 1,062 | *** | $ | 389 | (8%) | $ | 424 | |||
Net income attributable to noncontrolling interests | 68 | 19% | 57 | 13% | 51 | ||||||
Provision for income taxes | 226 | 99% | 113 | (42%) | 195 | ||||||
Interest expense | 273 | 55% | 176 | 17% | 150 | ||||||
Equity income in unconsolidated investees, net | (167 | ) | *** | (44 | ) | 96% | (22 | ) | |||
Other non-operating items | (404 | ) | *** | 48 | *** | (9 | ) | ||||
Operating income (GAAP basis) | $ | 1,058 | 43% | $ | 739 | (6%) | $ | 790 | |||
Remove special items: | |||||||||||
Workforce restructuring | 40 | (30%) | 58 | 19% | 49 | ||||||
Transformation costs | 79 | *** | 25 | (21%) | 32 | ||||||
Asset impairment charges | 51 | 56% | 33 | (63%) | 90 | ||||||
Adjusted operating income (non-GAAP basis) | $ | 1,229 | 44% | $ | 855 | (11%) | $ | 960 | |||
Depreciation | 186 | 21% | 153 | (5%) | 161 | ||||||
Adjusted amortization (non-GAAP basis) | 75 | *** | 36 | 9% | 33 | ||||||
Adjusted EBITDA (non-GAAP basis) | $ | 1,491 | 43% | $ | 1,045 | (9%) | $ | 1,154 | |||
(a) Numbers do not sum due to rounding. | |||||||||||
Adjusted EBITDA increased 43% to $1.49 billion in 2014 from $1.04 billion in 2013. Adjusted EBITDA margins increased significantly to 24.8% in 2014. Both increases reflect the acquisitions of Belo and Cars.com as well record results in our Broadcasting and Digital Segments.
Adjusted EBITDA decreased 9% to $1.04 billion in 2013 from $1.15 billion in 2012, driven by the absence of record political spending achieved in 2012 and revenue associated with the Summer Olympics along with a decrease in Publishing Segment results.
Segment results
The following is a discussion of our as adjusted non-GAAP financial results. All as adjusted (non-GAAP basis) measures are labeled as such or “adjusted”.
A summary of the impact of workforce restructuring charges and transformation costs on our Broadcasting Segment is presented below:
In millions of dollars | |||||||||||
2014 | Change | 2013 | Change | 2012 | |||||||
Broadcasting Segment operating expenses (GAAP basis) | $ | 947 | 100% | $ | 473 | 2% | $ | 462 | |||
Remove special items: | |||||||||||
Workforce restructuring | (4 | ) | (74%) | (14 | ) | *** | — | ||||
Transformation costs | (18 | ) | *** | (1 | ) | *** | — | ||||
As adjusted (non-GAAP basis) | $ | 925 | 102% | $ | 458 | (1%) | $ | 462 | |||
Broadcasting Segment operating income (GAAP basis) | $ | 745 | 106% | $ | 362 | (18%) | $ | 444 | |||
Remove special items: | |||||||||||
Workforce restructuring | 4 | (74%) | 14 | *** | — | ||||||
Transformation costs | 18 | *** | 1 | *** | — | ||||||
As adjusted (non-GAAP basis) | $ | 767 | 103% | $ | 377 | (15%) | $ | 444 | |||
Adjusted Broadcasting Segment operating expenses increased 102% in 2014 compared to 2013, driven primarily by acquisitions as well as higher investment in digital initiatives and reverse network compensation.
Adjusted Broadcasting Segment operating income increased 103% to $767 million in 2014, driven by record non-presidential political revenues, the expansion of the television station portfolio, Winter Olympics advertising, and a significant increase in retransmission and digital revenue.
Adjusted Broadcasting Segment operating expenses decreased 1% in 2013 compared to 2012 due to lower expenses associated with the record level of political spending achieved in 2012 and the Summer Olympics. Adjusted Broadcasting Segment operating income decreased 15% to $377 million in 2013, reflecting the absence of record political spending and Summer Olympic revenue achieved in 2012.
37
A summary of the impact of workforce restructuring charges, transformation costs and asset impairment charges on our Publishing Segment is presented below:
In millions of dollars | |||||||||||
2014(a) | Change | 2013(a) | Change | 2012(a) | |||||||
Publishing Segment operating expenses (GAAP basis) | $ | 3,193 | (2%) | $ | 3,264 | (3%) | $ | 3,360 | |||
Remove special items: | |||||||||||
Workforce restructuring | (34 | ) | (22%) | (43 | ) | 2% | (42 | ) | |||
Transformation costs | (61 | ) | *** | (24 | ) | (25%) | (32 | ) | |||
Asset impairment charges | (28 | ) | 29% | (21 | ) | *** | — | ||||
As adjusted (non-GAAP basis) | $ | 3,071 | (3%) | $ | 3,175 | (3%) | $ | 3,285 | |||
Publishing Segment operating income (GAAP basis) | $ | 228 | (27%) | $ | 314 | (15%) | $ | 369 | |||
Remove special items: | |||||||||||
Workforce restructuring | 34 | (22%) | 43 | 2% | 42 | ||||||
Transformation costs | 61 | *** | 24 | (25%) | 32 | ||||||
Asset impairment charges | 28 | 29% | 21 | *** | — | ||||||
As adjusted (non-GAAP basis) | $ | 351 | (13%) | $ | 402 | (9%) | $ | 443 | |||
(a) Numbers do not sum due to rounding. | |||||||||||
Adjusted Publishing Segment operating expenses decreased 3% in 2014 compared to 2013 due to continued cost efficiency efforts and lower newsprint expense. On the same basis, adjusted Publishing Segment operating income declined 13% in 2014 compared to 2013 due to lower advertising revenue, partially offset by the positive impact of the All Access Content Subscription Model and the addition of USA TODAY local editions at 35 of our USCP operations.
Adjusted Publishing Segment operating expenses decreased 3% in 2013 compared to 2012 as continued cost efficiency efforts were partially offset by strategic initiative spending of $36 million.
Adjusted Publishing Segment operating income declined 9% in 2013 compared to 2012 due to lower advertising revenue in the U.S. and U.K., $36 million of strategic initiative spending, the negative impact of the extra week in 2012, partially offset by a 1% increase in circulation revenue, and a decrease in newsprint expense.
A summary of the impact of workforce restructuring charges and asset impairment charges on our Digital Segment is presented below:
In millions of dollars | |||||||||||
2014 | Change | 2013(a) | Change | 2012 | |||||||
Digital Segment operating expenses (GAAP basis) | $ | 764 | 23% | $ | 620 | (8%) | $ | 677 | |||
Remove special items: | |||||||||||
Workforce restructuring | (3 | ) | *** | — | *** | — | |||||
Asset impairment charges | (24 | ) | *** | (12 | ) | (87%) | (90 | ) | |||
As adjusted (non-GAAP basis) | $ | 737 | 21% | $ | 609 | 4% | $ | 587 | |||
Digital Segment operating income (GAAP basis) | $ | 155 | 21% | $ | 128 | *** | $ | 42 | |||
Remove special items: | |||||||||||
Workforce restructuring | 3 | *** | — | *** | — | ||||||
Asset impairment charges | 24 | *** | 12 | (87%) | 90 | ||||||
As adjusted (non-GAAP basis) | $ | 182 | 30% | $ | 140 | 6% | $ | 132 | |||
(a) Numbers do not sum due to rounding. | |||||||||||
Year-over-year adjusted operating expense comparisons for 2014 and 2013 reflect primarily the impact of the Cars.com acquisition and higher expense related to strong revenue growth at CareerBuilder. On the same basis, adjusted operating income increased 30%, reflecting record revenues in our Digital Segment.
Year-over-year adjusted operating expense comparisons for 2013 and 2012 reflect increases in expenses at CareerBuilder associated with its revenue growth. The CareerBuilder revenue growth also drove the year-over-year improvements in adjusted Digital Segment operating income.
A summary of the impact of special charges on our Corporate Segment is presented below:
In millions of dollars | |||||||||||
2014 | Change | 2013(a) | Change | 2012 | |||||||
Corporate Segment operating expenses (GAAP basis) | $ | 71 | 10% | $ | 65 | —% | $ | 64 | |||
Remove special items: | |||||||||||
Workforce restructuring | — | *** | — | *** | (6 | ) | |||||
As adjusted (non-GAAP basis) | $ | 71 | 11% | $ | 64 | 11% | $ | 58 | |||
(a) Numbers do not sum due to rounding. | |||||||||||
38
Presentation of Pro Forma Information
Pro forma information is presented on the basis as if the acquisitions of Cars.com as well as the Belo and London Broadcasting Company televisions stations, the Captivate disposition, the sale of a print business and the Apartments.com sale had occurred at the beginning of 2013. This pro forma financial information is based on historical results of operations, adjusted for the allocation of the purchase price and other acquisition accounting adjustments, and is not necessarily indicative of what our results would have been had we operated the businesses since the beginning of 2013.
Pro forma adjustments include revenues and expenses for the former Belo stations acquired on December 23, 2013. The pro forma adjustments exclude revenues and expenses for the former Belo stations in Phoenix, AZ and St. Louis, MO. Certain of our subsidiaries and Sander Media, a holding company that has a station-operation agreement with us, agreed to sell these stations upon receiving government approval. KMOV-TV, the television station in St. Louis, was sold in February 2014 and the two television stations in Phoenix were sold in June 2014. Pro forma adjustments include the six television stations acquired from London Broadcasting Company on July 8, 2014. Pro forma adjustments include revenues and expenses for the acquisition of Cars.com on October 1, 2014. The pro forma adjustments reflect depreciation expense and amortization of intangibles related to the fair value adjustments of the assets acquired and the alignment of accounting policies for all acquisitions.
Pro forma adjustments include reductions to revenues and expenses for Captivate since we sold our controlling interest in Captivate in the third quarter of 2013. Adjustments also include revenue and expense reductions related to the second quarter 2014 sale of a print business and the impact from the second quarter 2014 Classified Ventures sale of Apartments.com.
Reconciliations of our Broadcasting Segment, Digital Segment and company-wide revenues and expenses on an as reported basis to a pro forma basis for 2014 and 2013 are below:
In millions of dollars | ||||||||||||
2014(a) | ||||||||||||
Gannett (as reported) | Special Items(b) | Pro Forma Adjustments(c) | Gannett Pro Forma Combined | |||||||||
Broadcasting revenue: | ||||||||||||
Core | $ | 1,046 | $ | — | $ | 20 | $ | 1,066 | ||||
Political | 159 | — | 1 | 160 | ||||||||
Retransmission | 362 | — | 4 | 366 | ||||||||
Digital | 98 | — | 1 | 98 | ||||||||
Other | 28 | — | 2 | 30 | ||||||||
Total broadcasting revenue | 1,692 | — | 27 | 1,719 | ||||||||
Broadcasting expenses | 947 | (22 | ) | 23 | 948 | |||||||
Broadcasting operating income | $ | 745 | $ | 22 | $ | 4 | $ | 771 | ||||
(a) Numbers may not sum due to rounding. (b) See reconciliation of special items beginning on page 34. (c) We acquired six television stations from London Broadcasting Company on July 8, 2014. Results from these television stations from that date and forward are included in the as reported numbers above. The pro forma combined numbers above present results as if the acquisition had taken place on the first day of 2014. | ||||||||||||
In millions of dollars | ||||||||||||
2013(a) | ||||||||||||
Gannett (as reported) | Special Items(b) | Pro Forma Adjustments(c) | Gannett Pro Forma Combined | |||||||||
Broadcasting revenue: | ||||||||||||
Core | $ | 600 | $ | — | $ | 483 | $ | 1,083 | ||||
Political | 13 | — | 9 | 22 | ||||||||
Retransmission | 148 | — | 78 | 226 | ||||||||
Digital | 38 | — | 44 | 82 | ||||||||
Other | 36 | — | (6 | ) | 30 | |||||||
Total broadcasting revenue | 835 | — | 607 | 1,442 | ||||||||
Broadcasting expenses | 473 | (15 | ) | 456 | 914 | |||||||
Broadcasting operating income | $ | 362 | $ | 15 | $ | 151 | $ | 529 | ||||
(a) Numbers may not sum due to rounding. (b) See reconciliation of special items beginning on page 34. (c) The pro forma adjustments include additions to revenue and expenses for the former Belo stations. They exclude revenues and expenses for the sale of stations in Phoenix, AZ and St. Louis, MO. Subsidiaries of Gannett and Sander Media, a holding company that has shared services agreement with Gannett, agreed to sell these stations upon receiving government approval. KMOV-TV, the television station in St. Louis, was sold in February 2014 and the two television stations in Phoenix were sold in June 2014. Revenue and expense adjustments were added for the acquisition of six London Broadcasting Company television stations. The pro forma adjustments for broadcasting expense reflect the addition of amortization for definite-lived intangible assets as if the acquisition of Belo and London Broadcasting Company television stations had occurred on the first day of 2013. Pro Forma adjustments also include the reductions to revenue and expenses for Captivate, as Gannett sold its controlling interest in Captivate in the third quarter of 2013. | ||||||||||||
Pro forma Broadcasting Segment revenue increased 19% in 2014 due to record non-presidential political spending as well as $41 million in Winter Olympic revenue. Retransmission revenue increased 62% and digital revenue was up 19% due to continued growth from digital marketing services products. Core advertising was impacted by the displacement resulting from record political advertising revenue and declined 2% on a pro forma basis. Broadcasting Segment expenses were up 4% on a pro forma basis, driven by the expenses associated with revenue growth initiatives at our new and existing stations, as well as reverse compensation and investments in sales and marketing tools in support of our sales transformation initiative.
In millions of dollars | ||||||||||||
2014 | ||||||||||||
Gannett (as reported) | Special Items(a) | Pro Forma Adjustments(b) | Gannett Pro Forma Combined | |||||||||
Digital operating revenue | $ | 919 | $ | — | $ | 378 | $ | 1,297 | ||||
Digital operating expense | 764 | (27 | ) | 354 | 1,091 | |||||||
Digital operating income | $ | 155 | $ | 27 | $ | 24 | $ | 206 | ||||
(a) See reconciliation of special items beginning on page 34. (b) The pro forma adjustments include additions to revenue and expenses for the acquisition of Cars.com. The pro forma adjustment reflects the addition of revenue amortization for certain unfavorable contracts and amortization for definite-lived intangible assets as if the acquisition of Cars.com had occurred on the first day of 2014. | ||||||||||||
39
In millions of dollars | ||||||||||||
2013(a) | ||||||||||||
Gannett (as reported) | Special Items(b) | Pro Forma Adjustments(c) | Gannett Pro Forma Combined | |||||||||
Digital operating revenue | $ | 748 | $ | — | $ | 452 | $ | 1,201 | ||||
Digital operating expense | 620 | (12 | ) | 435 | 1,044 | |||||||
Digital operating income | $ | 128 | $ | 12 | $ | 17 | $ | 157 | ||||
(a) Numbers may not sum due to rounding. (b) See reconciliation of special items beginning on page 34. (c) The pro forma adjustments include additions to revenue and expenses for the acquisition of Cars.com. The pro forma adjustment reflects the addition of revenue amortization for certain unfavorable contracts and amortization for definite-lived intangible assets as if the acquisition of Cars.com had occurred on the first day of 2013. In 2014, a small online business was moved from the Digital Segment to the Publishing Segment as a result of continued integration with other Publishing businesses. | ||||||||||||
Digital Segment revenue on a pro forma basis increased 8% in 2014 primarily due to growth in Cars.com and CareerBuilder revenues. Cars.com revenues on a pro forma basis reflect organic growth in the markets in which they sell direct as well as price increases for affiliates implemented October 1, 2014. Digital Segment expenses were up 4% on a pro forma basis reflecting increases in Cars.com and CareerBuilder expenses in support of higher revenues.
In millions of dollars | ||||||||||||
2014 | ||||||||||||
Gannett (as reported) | Special Items(a) | Pro Forma Adjustments(b) | Gannett Pro Forma Combined | |||||||||
Company-wide operating revenue | $ | 6,008 | $ | — | $ | 347 | $ | 6,355 | ||||
Company-wide operating expenses | 4,950 | (171 | ) | 317 | 5,096 | |||||||
Company-wide operating income | $ | 1,058 | $ | 171 | $ | 30 | $ | 1,259 | ||||
(a) See reconciliation of special items beginning on page 34. (b) The pro forma adjustments include all the pro forma adjustments discussed above. | ||||||||||||
In millions of dollars | ||||||||||||
2013 | ||||||||||||
Gannett (as reported) | Special Items(a) | Pro Forma Adjustments(b) | Gannett Pro Forma Combined | |||||||||
Company-wide operating revenue | $ | 5,161 | $ | — | $ | 969 | $ | 6,130 | ||||
Company-wide operating expenses | 4,422 | (116 | ) | 803 | 5,109 | |||||||
Company-wide operating income | $ | 739 | $ | 116 | $ | 166 | $ | 1,021 | ||||
(a) See reconciliation of special items beginning on page 34. (b) The pro forma adjustments include all the pro forma adjustments discussed above. | ||||||||||||
Pro forma company-wide revenues were $6.36 billion in 2014, a 4% increase compared to 2013. The increase reflects a significant increase in Broadcasting and Digital Segment revenues, partially offset by a decrease in Publishing Segment revenues.
Pro forma company-wide expenses declined slightly to $5.10 billion in 2014 as a result of higher Broadcasting and Digital Segment expenses, offset by lower Publishing Segment expenses.
As a result, company-wide pro forma operating income increased 23% to $1.26 billion in 2014, driven by a 46% increase in Broadcasting Segment operating income and a 32% increase in Digital Segment operating income.
FINANCIAL POSITION
Liquidity and capital resources
Our cash flow from operating activities was $821 million in 2014, versus $511 million in 2013, primarily reflecting the strength of our Broadcasting and Digital Segments propelled by strategic acquisitions, successful growth initiatives and operating efficiencies. Net cash tax payments were $83 million higher compared to 2013 due to higher earnings. Interest payments were up $116 million reflecting the issuance of debt to fund the Belo and Cars.com acquisitions.
Net cash used for investing activities totaled $1.66 billion for 2014. We received a $154.6 million cash distribution from Classified Ventures related to its sale of Apartments.com as a return of investment in 2014. Payments for acquisitions reflect the cash spent to acquire Cars.com; six London Broadcasting television stations in Texas, and CareerBuilder’s acquisition of Broadbean. Payments for acquisitions also reflect the cash spent by us to acquire KMOV-TV, KASW-TV and KTVK-TV television assets that were previously owned by other parties. We purchased those assets pursuant to an option agreement we had with the former owner. These assets and other KMOV-TV, KASW-TV and KTVK-TV assets we already owned were immediately sold to Meredith Corporation. Meredith purchased the assets for $407.5 million plus working capital. We used a portion of the proceeds in a tax efficient exchange to acquire six London Broadcasting Company television stations from SunTX Capital Partners, which closed early in our third quarter.
Cash provided by financing activities totaled $490 million in 2014. Proceeds from long term debt and term loans were $1.31 billion. These proceeds were used to partially finance the acquisition of Cars.com, repay the unsecured notes that matured in November 2014 and for other general corporate purposes. We repurchased approximately 2.7 million shares of our stock for $76 million, paid dividends totaling $181 million and made dividend payments and distributions to noncontrolling membership shareholders of $22 million.
Certain key measurements of the elements of working capital for the last three years are presented in the following chart:
Working capital measurements | |||
2014 | 2013 | 2012 | |
Current ratio | 1.3-to-1 | 1.9-to-1 | 1.1-to-1 |
Accounts receivable turnover | 6.9 | 6.8 | 7.8 |
Newsprint inventory turnover | 6.3 | 5.5 | 6.1 |
Our operations have historically generated strong positive cash flow which, along with our program of maintaining bank revolving credit availability, has provided adequate liquidity to meet our requirements, including those for acquisitions.
40
Long-term debt
Our long-term debt is summarized below:
In thousands of dollars | ||||||
Dec. 28, 2014 | Dec. 29, 2013 | |||||
Unsecured floating rate term loan due quarterly through August 2018 | $ | 123,200 | $ | 154,800 | ||
VIE unsecured floating rate term loans due quarterly through December 2018 | 33,379 | 39,270 | ||||
Unsecured notes bearing fixed rate interest at 8.75% due November 2014 | — | 250,000 | ||||
Unsecured notes bearing fixed rate interest at 10% due June 2015 | 66,568 | 66,568 | ||||
Unsecured notes bearing fixed rate interest at 6.375% due September 2015 | 250,000 | 250,000 | ||||
Unsecured notes bearing fixed rate interest at 10% due April 2016 | 193,429 | 193,429 | ||||
Unsecured notes bearing fixed rate interest at 9.375% due November 2017 | — | 250,000 | ||||
Borrowings under revolving credit agreement expiring August 2018 | 640,000 | — | ||||
Unsecured notes bearing fixed rate interest at 7.125% due September 2018 | 250,000 | 250,000 | ||||
Unsecured notes bearing fixed rate interest at 5.125% due October 2019 | 600,000 | 600,000 | ||||
Unsecured notes bearing fixed rate interest at 5.125% due July 2020 | 600,000 | 600,000 | ||||
Unsecured notes bearing fixed rate interest at 4.875% due September 2021 | 350,000 | — | ||||
Unsecured notes bearing fixed rate interest at 6.375% due October 2023 | 650,000 | 650,000 | ||||
Unsecured notes bearing fixed rate interest at 5.50% due September 2024 | 325,000 | — | ||||
Unsecured notes bearing fixed rate interest at 7.75% due June 2027 | 200,000 | 200,000 | ||||
Unsecured notes bearing fixed rate interest at 7.25% due September 2027 | 240,000 | 240,000 | ||||
Total principal long-term debt | 4,521,576 | 3,744,067 | ||||
Other (fair market value adjustments and discounts) | (25,694 | ) | (31,167 | ) | ||
Total long-term debt | 4,495,882 | 3,712,900 | ||||
Less current portion of long-term debt maturities of VIE loans | 7,854 | 5,890 | ||||
Long-term debt, net of current portion | $ | 4,488,028 | $ | 3,707,010 | ||
Our debt balance at year end 2014 increased by $781 million primarily reflecting additional borrowings to fund the acquisition of the remaining 73% of Cars.com we did not previously own. This was partially offset by the early repayment of the 9.375% notes due November 2017 and the repayment of the 8.75% notes due November 2014 for $250 million each. We redeemed the 9.375% notes by paying 104.688% of the outstanding principal amount in accordance with the original terms. The early redemption of these notes saved us approximately $19 million in interest expense for 2014.
In September 2014, and in support of the Cars.com acquisition, we completed the private placement of $350 million in aggregate principal amount of 4.875% senior unsecured notes due 2021 (the 2021 Notes). The 2021 Notes were priced at 98.531% of face value, resulting in a yield to maturity of 5.125%. Subject to certain exceptions, we are unable to redeem the 2021 Notes before Sept. 15, 2017. On the same day, we completed the private placement of $325 million in aggregate principal amount of 5.500% senior unsecured notes due 2024 (the 2024 Notes). The 2024 Notes were priced at 99.038% of face value, resulting in a yield to maturity of 5.625%. Subject to certain exceptions, we are unable to redeem the 2024 Notes before Sept. 15, 2019. The 2021 and 2024 Notes were issued
in a private offering that is exempt from the registration requirements of the Securities Act of 1933. The 2021 and 2024 Notes are guaranteed on a senior basis by our subsidiaries that guarantee our revolving credit facility, term loan and our other outstanding notes.
In August 2013, we entered into an agreement to replace, amend and restate our existing revolving credit facilities with a credit facility expiring on Aug. 5, 2018, which was further amended on Sept. 24, 2013 (the Credit Agreement). Total commitments under the Credit Agreement are $1.3 billion. Subject to total leverage ratio limits, the Credit Agreement eliminates our restriction on incurring additional indebtedness. The Credit Agreement was amended as of February 13, 2015. The maximum total leverage ratio permitted by the Credit Agreement as amended, is 4.0x through September 30, 2016, reducing to 3.75x thereafter. Commitment fees on the revolving credit agreement are equal to 0.375% - 0.50% of the undrawn commitments, depending upon our leverage ratio, and are computed on the average daily undrawn balance under the revolving credit agreement and paid each quarter. Under the Credit Agreement, we may borrow at an applicable margin above the Eurodollar base rate (LIBOR loan) or the higher of the Prime Rate, the Federal Funds Effective Rate plus 0.50%, or the one month LIBOR rate plus 1.00% (ABR loan). The applicable margin is determined based on our leverage ratio but differs between LIBOR loans and ABR loans. For LIBOR based borrowing, the margin varies from 1.75% to 2.5%. For ABR based borrowing, the margin will vary from 0.75% to 1.50%. Based on our leverage ratio as of Dec. 28, 2014, our applicable margins were 2.25% and 1.25%, respectively.
On Dec. 28, 2014, we had unused borrowing capacity of $625 million under our revolving credit agreement.
We have an effective universal shelf registration statement under which an unspecified amount of securities may be issued, subject to a $7.0 billion limit established by the Board of Directors. Proceeds from the sale of such securities may be used for general corporate purposes, including capital expenditures, working capital, securities repurchase programs, repayment of debt and financing of acquisitions. We may also invest borrowed funds that are not required for other purposes in short-term marketable securities.
The following schedule of annual maturities of the principal amount of total debt assumes we use available capacity under our revolving credit agreement to refinance unsecured floating rate term loans and notes due in 2015. Based on this refinancing assumption, all of the obligations other than VIE unsecured floating rate term loans due in 2015 are reflected as maturities for 2016 and beyond.
In thousands of dollars | |||
2015 (1) | $ | 7,854 | |
2016 | 232,883 | ||
2017 | 39,454 | ||
2018 | 1,276,385 | ||
2019 | 600,000 | ||
Thereafter | 2,365,000 | ||
Total | $ | 4,521,576 | |
(1) Maturities of principal amounts of debt due in 2015 (primarily the 10% fixed rate notes due in June 2015 and 6.375% fixed rate notes due in September 2015) are assumed to be repaid with funds from the revolving credit agreement, which matures in 2018.
41
Our debt maturities may be repaid with cash flow from operating activities, by accessing capital markets or a combination of both.
As previously noted, in August 2014, we announced our plan to separate our Publishing business into an independent publicly traded company. We expect to complete the separation in mid-2015. In connection with this action, we are undertaking capital structure planning for each company. We are working to ensure that each separate business is well capitalized with financial flexibility to pursue its strategic priorities.
Contractual obligations and commitments
The following table summarizes the expected cash outflows resulting from financial contracts and commitments as of the end of 2014.
Contractual obligations | Payments due by period | ||||||||||||||
In millions of dollars | Total | 2015 | 2016-17 | 2018-19 | Thereafter | ||||||||||
Long-term debt (1) | $ | 4,522 | $ | 8 | $ | 272 | $ | 1,877 | $ | 2,365 | |||||
Operating leases (2) | 331 | 64 | 104 | 67 | 96 | ||||||||||
Purchase obligations (3) | 241 | 142 | 67 | 32 | — | ||||||||||
Programming contracts (4) | 214 | 95 | 107 | 12 | — | ||||||||||
Other noncurrent liabilities (5) | 287 | 56 | 58 | 54 | 119 | ||||||||||
Total | $ | 5,595 | $ | 365 | $ | 608 | $ | 2,042 | $ | 2,580 | |||||
(1) | See Note 6 to the Consolidated Financial Statements. The amounts included above include periodic interest payments. Interest payments are based on interest rates in effect at year-end. |
(2) | See Note 11 to the Consolidated Financial Statements. |
(3) | Includes purchase obligations related to printing contracts, capital projects, interactive marketing agreements, wire services and other legally binding commitments. Amounts which we are liable for under purchase orders outstanding at Dec. 28, 2014, are reflected in the Consolidated Balance Sheets as accounts payable and accrued liabilities and are excluded from the table above. |
(4) | Programming contracts include television station commitments to purchase programming to be produced in future years. This also includes amounts fixed or currently accrued under network affiliation agreements. |
(5) | Other long-term liabilities consist of both unfunded and under-funded postretirement benefit plans. Unfunded plans include the Gannett Supplemental Executive Retirement Plan and the Gannett Retiree Welfare Plan. Employer contributions, which equal the expected benefit payments, are reflected in the table above over the next ten-year period. Our under-funded plans include the Gannett Retirement Plan, the G.B. Dealey Retirement Plan, the Newsquest Pension Scheme, and the Detroit Free Press, Inc. Newspaper Guild of Detroit Pension Plan. Expected employer contributions for these plans are included for the following fiscal year. Contributions beyond the next fiscal year are excluded due to uncertainties regarding significant assumptions involved in estimating these contributions, such as interest rate levels as well as the amount and timing of invested asset returns. |
Due to uncertainty with respect to the timing of future cash flows associated with unrecognized tax benefits at Dec. 28, 2014, we are unable to make reasonably reliable estimates of the period of cash settlement. Therefore, $59 million of unrecognized tax benefits have been excluded from the contractual obligations table above. See Note 9 to the Consolidated Financial Statements for a further discussion of income taxes.
In 2014, we shut down one of our publishing businesses and incurred $21.0 million of shutdown costs associated with future contractual promotional payments. These costs are accrued on our balance sheet at the end of 2014 and will be primarily paid in 2015. They have been excluded from the contractual obligations above.
For 2015, we expect to contribute $12 million to the Gannett Retirement Plan reflective of pension relief legislation enacted in 2014. We also expect to contribute $13 million to the Newsquest Plan. Due to uncertainties regarding significant assumptions involved in estimating future contributions, such as interest rate levels and the amount and timing of asset returns, we are unable to reasonably estimate future contributions beyond 2015, and therefore no plan contributions thereafter are reflected in the above table.
In December 1990, we adopted a Transitional Compensation Plan (the TCP). The TCP provides termination benefits to key executives whose employment is terminated under certain circumstances within two years following a change in control of our company. Benefits under the TCP include a severance payment of up to three years’ compensation and continued life and medical insurance coverage. We amended the TCP in April 2010 to provide that new participants will not be entitled to the benefit of the TCP’s excise tax gross-up or modified single trigger provisions.
In August 2014, we adopted the Gannett Leadership Team Transition Severance Plan (GLT Plan) to promote retention and minimize disruption for certain senior executives in connection with the potential spin-off of our publishing segment into a new, independent publicly traded company.
No amounts have been included in the above contractual obligation table for either the TCP or GLT plans.
Capital stock
In June 2013, we announced that our Board of Directors approved a new program to repurchase up to $300 million of our common stock. As of Dec. 28, 2014, the value of shares that may be repurchased under the existing program is $149 million.
Stock repurchases | Repurchases made in fiscal year | ||||||||
In millions | 2014 | 2013 | 2012 | ||||||
Number of shares purchased | 2.7 | 4.9 | 10.3 | ||||||
Dollar amount purchased | $ | 76 | $ | 117 | $ | 154 | |||
The share repurchase program was temporarily suspended upon the announcement of the Cars.com acquisition, but was re-initiated in February 2015, well ahead of the timeline we had previously anticipated, as a result of our strong operating performance and the strength of our balance sheet. The shares may be repurchased at management’s discretion, either in the open market or in privately negotiated block transactions. Management’s decision to repurchase shares will depend on price and other corporate developments. Purchases may occur from time to time and no maximum purchase price has been set. There is no expiration date for the $300 million stock repurchase program. Certain of the shares we previously acquired have been reissued in settlement of employee stock awards.
The Gannett Co., Inc. 401(k) Savings Plan, our principal defined contribution plan which was established in 1990, includes a company matching contribution in the form of our stock. We fund the match by buying our stock in the open market and depositing it in the participant’s account.
Our common stock outstanding at Dec. 28, 2014, totaled 226,739,091 shares, compared with 227,568,888 shares at Dec. 29, 2013.
42
Dividends
Dividends declared on common stock amounted to $181 million in 2014, compared with $183 million in 2013.

Cash dividends | Payment date | Per share | |||
2014 | 4th Quarter | Jan. 2, 2015 | $ | 0.20 | |
3rd Quarter | Oct. 1, 2014 | $ | 0.20 | ||
2nd Quarter | Jul. 1, 2014 | $ | 0.20 | ||
1st Quarter | Apr. 1, 2014 | $ | 0.20 | ||
2013 | 4th Quarter | Jan. 2, 2014 | $ | 0.20 | |
3rd Quarter | Oct. 1, 2013 | $ | 0.20 | ||
2nd Quarter | Jul. 1, 2013 | $ | 0.20 | ||
1st Quarter | Apr. 1, 2013 | $ | 0.20 | ||
On Feb. 24, 2015, the Board of Directors declared a dividend of $.20 per share, payable on April 1, 2015, to shareholders of record as of the close of business March 6, 2015.
Accumulated other comprehensive income (loss)
Our foreign currency translation adjustment, included in accumulated other comprehensive income (loss) and reported as part of shareholders’ equity, totaled $391 million at the end of 2014 and $427 million at the end of 2013. The decrease reflected a weakening of the British pound against the U.S. dollar. Newsquest’s assets and liabilities at Dec. 28, 2014, were translated from British pounds to U.S. dollars at an exchange rate of 1.56 versus 1.65 at the end of 2013. Newsquest’s financial results were translated at an average rate of 1.65 for 2014, 1.56 for 2013 and 1.58 for 2012.
We recognized the funded status of our pension and retiree medical benefit plans in the Consolidated Balance Sheets. At Dec. 28, 2014, accumulated other comprehensive loss includes a reduction of equity of $1.17 billion and at Dec. 29, 2013, the reduction of equity was $921 million, for losses that will be amortized to pension and other postretirement costs in future years. The increased reduction was driven by lower rates used to discount our pension obligations as well as updates to assumed life expectancies of the plan’s participants.
Effects of inflation and changing prices and other matters
Our results of operations and financial condition have not been significantly affected by inflation. The effects of inflation and changing prices on our property, plant and equipment and related depreciation expense have been reduced as a result of an ongoing capital expenditure program and the availability of replacement assets with improved technology and efficiency.
We are exposed to foreign exchange rate risk primarily due to our ownership of Newsquest, which uses the British pound as its functional currency, which is then translated into U.S. dollars. Our foreign currency translation adjustment, related principally to Newsquest and reported as part of shareholders’ equity, totaled $391 million at Dec. 28, 2014. Newsquest’s assets and liabilities were translated from British pounds to U.S. dollars at the Dec. 28, 2014, exchange rate of 1.56. Refer to Item 7A for additional detail.
ITEM 7A. QUANTITATIVE AND QUALITATIVE DISCLOSURES ABOUT MARKET RISK
We believe that our market risk from financial instruments, such as accounts receivable, accounts payable and debt, is not material. We are exposed to foreign exchange rate risk on a limited basis primarily due to our operations in the United Kingdom, for which the British pound is the functional currency. Translation gains or losses affecting the Consolidated Statements of Income have not been significant in the past. If the price of the British pound against the U.S. dollar had been 10% more or less than the actual price, operating income would have increased or decreased approximately 1% in 2014.
Because we have $797 million in floating interest rate obligations outstanding at Dec. 28, 2014, we are subject to changes in the amount of interest expense we might incur. A 1/2% increase or decrease in the average interest rate for these obligations would result in an increase or decrease in annual interest expense of $4 million.
Refer to Note 12 to the Consolidated Financial Statements for information regarding the fair value of our long-term debt.
43
ITEM 8. | FINANCIAL STATEMENTS AND SUPPLEMENTARY DATA |
INDEX TO FINANCIAL STATEMENTS AND SUPPLEMENTARY DATA
Page | |
FINANCIAL STATEMENTS | |
OTHER INFORMATION | |
SUPPLEMENTARY DATA | |
FINANCIAL STATEMENT SCHEDULE | |
* | All other schedules prescribed under Regulation S-X are omitted because they are not applicable or not required. |
44
Report of Independent Registered Public Accounting Firm
Board of Directors and Shareholders of Gannett Co., Inc.:
We have audited the accompanying consolidated balance sheets of Gannett Co., Inc. as of December 28, 2014 and December 29, 2013, and the related consolidated statements of income, comprehensive income, cash flows, and equity for each of the three fiscal years in the period ended December 28, 2014. Our audits also included the financial statement schedule listed in the accompanying index in Item 8. These financial statements and schedule are the responsibility of the Company’s management. Our responsibility is to express an opinion on these financial statements and schedule based on our audits.
We conducted our audits in accordance with the standards of the Public Company Accounting Oversight Board (United States). Those standards require that we plan and perform the audit to obtain reasonable assurance about whether the financial statements are free of material misstatement. An audit includes examining, on a test basis, evidence supporting the amounts and disclosures in the financial statements. An audit also includes assessing the accounting principles used and significant estimates made by management, as well as evaluating the overall financial statement presentation. We believe that our audits provide a reasonable basis for our opinion.
In our opinion, the financial statements referred to above present fairly, in all material respects, the consolidated financial position of Gannett Co., Inc. at December 28, 2014 and December 29, 2013, and the consolidated results of its operations and its cash flows for each of the three fiscal years in the period ended December 28, 2014, in conformity with U.S. generally accepted accounting principles. Also, in our opinion, the related financial statement schedule, when considered in relation to the basic financial statements taken as a whole, presents fairly in all material respects the information set forth therein.
We also have audited, in accordance with the standards of the Public Company Accounting Oversight Board (United States), Gannett Co., Inc.’s internal control over financial reporting as of December 28, 2014, based on criteria established in Internal Control – Integrated Framework issued by the Committee of Sponsoring Organizations of the Treadway Commission (2013 framework) and our report dated February 25, 2015, included in Item 9A, expressed an unqualified opinion thereon.
/s/ Ernst & Young LLP
McLean, Virginia
February 25, 2015
45
GANNETT CO., INC. CONSOLIDATED BALANCE SHEETS | ||||||
In thousands of dollars | ||||||
Assets | Dec. 28, 2014 | Dec. 29, 2013 | ||||
Current assets | ||||||
Cash and cash equivalents | $ | 118,484 | $ | 469,203 | ||
Trade receivables, less allowance for doubtful receivables of $16,498 and $15,275, respectively | 912,004 | 834,052 | ||||
Other receivables | 72,763 | 28,592 | ||||
Inventories | 38,861 | 49,950 | ||||
Deferred income taxes | 158,648 | 21,245 | ||||
Assets held for sale | 69,998 | 395,851 | ||||
Prepaid expenses and other current assets | 109,707 | 124,592 | ||||
Total current assets | 1,480,465 | 1,923,485 | ||||
Property, plant and equipment | ||||||
Land | 191,530 | 237,554 | ||||
Buildings and improvements | 1,270,401 | 1,239,719 | ||||
Machinery, equipment and fixtures | 2,411,821 | 2,506,121 | ||||
Construction in progress | 28,117 | 24,485 | ||||
Total | 3,901,869 | 4,007,879 | ||||
Less accumulated depreciation | (2,292,654 | ) | (2,338,247 | ) | ||
Net property, plant and equipment | 1,609,215 | 1,669,632 | ||||
Intangible and other assets | ||||||
Goodwill | 4,499,927 | 3,790,472 | ||||
Indefinite-lived and amortizable intangible assets, less accumulated amortization of $265,727 and $201,178, respectively | 3,239,593 | 1,477,231 | ||||
Deferred income taxes | 63,647 | — | ||||
Investments and other assets | 312,608 | 379,886 | ||||
Total intangible and other assets | 8,115,775 | 5,647,589 | ||||
Total assets(a) | $ | 11,205,455 | $ | 9,240,706 | ||
46
GANNETT CO., INC. CONSOLIDATED BALANCE SHEETS | ||||||
In thousands of dollars | ||||||
Liabilities and equity | Dec. 28, 2014 | Dec. 29, 2013 | ||||
Current liabilities | ||||||
Accounts payable | ||||||
Trade | $ | 246,860 | $ | 176,055 | ||
Other | 34,924 | 39,245 | ||||
Accrued liabilities | ||||||
Compensation | 225,704 | 214,434 | ||||
Interest | 64,929 | 58,575 | ||||
Other | 273,995 | 226,153 | ||||
Dividends payable | 45,309 | 45,645 | ||||
Income taxes | 11,267 | 17,791 | ||||
Deferred income | 217,094 | 223,404 | ||||
Current portion of long-term debt | 7,854 | 5,890 | ||||
Total current liabilities | 1,127,936 | 1,007,192 | ||||
Income taxes | 56,578 | 49,748 | ||||
Deferred income taxes | 650,372 | 587,904 | ||||
Long-term debt | 4,488,028 | 3,707,010 | ||||
Postretirement medical and life insurance liabilities | 97,648 | 129,078 | ||||
Pension liabilities | 941,715 | 632,195 | ||||
Other noncurrent liabilities | 333,435 | 218,168 | ||||
Total noncurrent liabilities | 6,567,776 | 5,324,103 | ||||
Total liabilities(a) | 7,695,712 | 6,331,295 | ||||
Redeemable noncontrolling interest | 20,470 | 14,618 | ||||
Commitments and contingent liabilities (see Note 11) | ||||||
Equity | ||||||
Gannett Co., Inc. shareholders’ equity | ||||||
Preferred stock, par value $1: Authorized, 2,000,000 shares: Issued, none | — | — | ||||
Common stock, par value $1: Authorized, 800,000,000 shares: Issued, 324,418,632 shares | 324,419 | 324,419 | ||||
Additional paid-in capital | 546,406 | 552,368 | ||||
Retained earnings | 8,602,369 | 7,720,903 | ||||
Accumulated other comprehensive loss | (778,769 | ) | (494,055 | ) | ||
8,694,425 | 8,103,635 | |||||
Less Treasury stock, 97,679,541 shares and 96,849,744 shares, respectively, at cost | (5,439,511 | ) | (5,410,537 | ) | ||
Total Gannett Co., Inc. shareholders’ equity | 3,254,914 | 2,693,098 | ||||
Noncontrolling interests | 234,359 | 201,695 | ||||
Total equity | 3,489,273 | 2,894,793 | ||||
Total liabilities, redeemable noncontrolling interest and equity | $ | 11,205,455 | $ | 9,240,706 | ||
The accompanying notes are an integral part of these consolidated financial statements.
(a) Our consolidated assets as of Dec. 28, 2014, include total assets of $60.0 million related to variable interest entities (VIEs) and our consolidated assets as of Dec. 29, 2013, include $44.7 million of such assets. These assets can only be used to settle the obligations of the VIEs. Consolidated liabilities as of Dec. 28, 2014 include total liabilities of $4.3 million related to VIEs and our consolidated liabilities as of Dec. 29, 2013 include $2.7 million of such liabilities. The VIEs’ creditors have no recourse to us regarding these liabilities. See further description in Note 1 - Summary of significant accounting policies.
47
GANNETT CO., INC. CONSOLIDATED STATEMENTS OF INCOME | ||||||||||
In thousands of dollars, except per share amounts | ||||||||||
Fiscal year ended | Dec. 28, 2014 | Dec. 29, 2013 | Dec. 30, 2012 | |||||||
Operating revenues | $ | 6,008,174 | $ | 5,161,362 | $ | 5,353,197 | ||||
Operating expenses | ||||||||||
Cost of sales and operating expenses, exclusive of depreciation | 3,048,579 | 2,882,449 | 2,943,847 | |||||||
Selling, general and administrative expenses, exclusive of depreciation | 1,539,476 | 1,291,858 | 1,303,427 | |||||||
Depreciation | 185,868 | 153,203 | 160,746 | |||||||
Amortization of intangible assets | 79,856 | 36,369 | 33,293 | |||||||
Facility consolidation and asset impairment charges (see Notes 3 and 4) | 96,364 | 58,240 | 122,129 | |||||||
Total operating expenses | 4,950,143 | 4,422,119 | 4,563,442 | |||||||
Operating income | 1,058,031 | 739,243 | 789,755 | |||||||
Non-operating (expense) income | ||||||||||
Equity income in unconsolidated investees, net (see Notes 3 and 5) | 167,319 | 43,824 | 22,387 | |||||||
Interest expense | (273,244 | ) | (176,064 | ) | (150,469 | ) | ||||
Other non-operating items | 403,954 | (47,890 | ) | 8,734 | ||||||
Total | 298,029 | (180,130 | ) | (119,348 | ) | |||||
Income before income taxes | 1,356,060 | 559,113 | 670,407 | |||||||
Provision for income taxes | 225,600 | 113,200 | 195,400 | |||||||
Net income | 1,130,460 | 445,913 | 475,007 | |||||||
Net income attributable to noncontrolling interests | (68,289 | ) | (57,233 | ) | (50,727 | ) | ||||
Net income attributable to Gannett Co., Inc. | $ | 1,062,171 | $ | 388,680 | $ | 424,280 | ||||
Net income per share—basic | $ | 4.69 | $ | 1.70 | $ | 1.83 | ||||
Net income per share—diluted | $ | 4.58 | $ | 1.66 | $ | 1.79 | ||||
The accompanying notes are an integral part of these consolidated financial statements.
48
GANNETT CO., INC. CONSOLIDATED STATEMENTS OF COMPREHENSIVE INCOME | ||||||||||
In thousands of dollars | ||||||||||
Fiscal year ended | Dec. 28, 2014 | Dec. 29, 2013 | Dec. 30, 2012 | |||||||
Net income | $ | 1,130,460 | $ | 445,913 | $ | 475,007 | ||||
Redeemable noncontrolling interest (income not available to shareholders) | (3,420 | ) | (1,997 | ) | (254 | ) | ||||
Other comprehensive income (loss), before tax: | ||||||||||
Foreign currency translation adjustments | (43,766 | ) | 9,055 | 18,107 | ||||||
Pension and other postretirement benefit items: | ||||||||||
Actuarial gain (loss): | ||||||||||
Actuarial gain (loss) arising during the period | (500,389 | ) | 286,778 | (230,799 | ) | |||||
Amortization of actuarial loss | 46,489 | 64,381 | 55,372 | |||||||
Prior service cost: | ||||||||||
Change in prior service credit | 37,986 | 319 | — | |||||||
Amortization of prior service credit | (4,082 | ) | (1,599 | ) | (11,501 | ) | ||||
Settlement charge | — | 3,077 | 7,946 | |||||||
Other | 23,628 | (10,158 | ) | (11,375 | ) | |||||
Pension and other postretirement benefit items | (396,368 | ) | 342,798 | (190,357 | ) | |||||
Other | — | 2,363 | 1,791 | |||||||
Other comprehensive income (loss) before tax | (440,134 | ) | 354,216 | (170,459 | ) | |||||
Income tax effect related to components of other comprehensive income (loss) | 147,718 | (145,478 | ) | 66,948 | ||||||
Other comprehensive income (loss), net of tax | (292,416 | ) | 208,738 | (103,511 | ) | |||||
Comprehensive income | 834,624 | 652,654 | 371,242 | |||||||
Comprehensive income attributable to noncontrolling interests, net of tax | 57,167 | 56,888 | 52,264 | |||||||
Comprehensive income attributable to Gannett Co., Inc. | $ | 777,457 | $ | 595,766 | $ | 318,978 | ||||
The accompanying notes are an integral part of these consolidated financial statements.
49
GANNETT CO., INC. CONSOLIDATED STATEMENTS OF CASH FLOWS | ||||||||||
In thousands of dollars | ||||||||||
Fiscal year ended | Dec. 28, 2014 | Dec. 29, 2013 | Dec. 30, 2012 | |||||||
Cash flows from operating activities | ||||||||||
Net income | $ | 1,130,460 | $ | 445,913 | $ | 475,007 | ||||
Adjustments to reconcile net income to operating cash flows: | ||||||||||
Gain on Cars.com acquisition, net of tax | (285,860 | ) | — | — | ||||||
Depreciation | 185,868 | 153,203 | 160,746 | |||||||
Amortization of intangible assets | 79,856 | 36,369 | 33,293 | |||||||
Facility consolidation and asset impairment charges (see Notes 3 and 4) | 112,472 | 61,014 | 122,129 | |||||||
Stock-based compensation — equity awards | 33,882 | 33,437 | 26,608 | |||||||
Provision for deferred income taxes | 1,200 | 53,900 | 122,700 | |||||||
Pension expense, net of pension contributions | (111,194 | ) | (82,878 | ) | (95,377 | ) | ||||
Equity income in unconsolidated investees, net (see Notes 3 and 5) | (167,319 | ) | (43,824 | ) | (22,387 | ) | ||||
Other, net, including gains on asset sales | (12,313 | ) | (4,673 | ) | (36,056 | ) | ||||
Decrease (increase) in trade receivables | (1,514 | ) | (17,884 | ) | 35,799 | |||||
Decrease in other receivables | 7,504 | 9,329 | 6,200 | |||||||
Decrease (increase) in inventories | 10,032 | 4,489 | (7,167 | ) | ||||||
Increase (decrease) in accounts payable | 66,740 | (29,310 | ) | (3,284 | ) | |||||
Increase (decrease) in interest and taxes payable | (193,274 | ) | (53,101 | ) | 853 | |||||
Decrease in deferred income | (5,353 | ) | (12,233 | ) | (5,294 | ) | ||||
Change in other assets and liabilities, net | (29,988 | ) | (42,263 | ) | (57,030 | ) | ||||
Net cash flows from operating activities | 821,199 | 511,488 | 756,740 | |||||||
Cash flows from investing activities | ||||||||||
Purchase of property, plant and equipment | (150,354 | ) | (110,407 | ) | (91,874 | ) | ||||
Payments for acquisitions, net of cash acquired | (1,990,877 | ) | (1,451,006 | ) | (67,244 | ) | ||||
Payments for investments | (7,026 | ) | (3,380 | ) | (2,501 | ) | ||||
Proceeds from investments | 180,809 | 63,408 | 35,629 | |||||||
Proceeds from sale of certain assets | 305,347 | 113,895 | 39,009 | |||||||
Net cash used for investing activities | (1,662,101 | ) | (1,387,490 | ) | (86,981 | ) | ||||
Cash flows from financing activities | ||||||||||
Proceeds from (payments of) borrowings under revolving credit facilities, net | 640,000 | (205,000 | ) | (30,000 | ) | |||||
Proceeds from unsecured fixed rate loans | 666,732 | 1,827,799 | — | |||||||
Proceeds from (payments of) unsecured floating rate term loans | (37,490 | ) | 194,070 | — | ||||||
Payments of unsecured fixed rate notes | (500,000 | ) | (287,719 | ) | (306,571 | ) | ||||
Payments of debt issuance and financing costs | (10,548 | ) | (41,960 | ) | — | |||||
Dividends paid | (181,328 | ) | (183,233 | ) | (158,822 | ) | ||||
Cost of common shares repurchased | (75,815 | ) | (116,639 | ) | (153,948 | ) | ||||
Proceeds from issuance of common stock upon settlement of stock awards | 26,672 | 31,435 | 33,748 | |||||||
Distributions to noncontrolling membership interests | (22,072 | ) | (42,608 | ) | (47,100 | ) | ||||
Deferred payments for acquisitions | (15,687 | ) | (6,132 | ) | (1,027 | ) | ||||
Net cash provided by (used for) financing activities | 490,464 | 1,170,013 | (663,720 | ) | ||||||
Effect of currency exchange rate change | (281 | ) | 162 | 2,065 | ||||||
Increase (decrease) in cash and cash equivalents | (350,719 | ) | 294,173 | 8,104 | ||||||
Balance of cash and cash equivalents at beginning of year | 469,203 | 175,030 | 166,926 | |||||||
Balance of cash and cash equivalents at end of year | $ | 118,484 | $ | 469,203 | $ | 175,030 | ||||
Supplemental cash flow information: | ||||||||||
Cash paid for taxes, net of refunds | $ | 207,038 | $ | 124,378 | $ | 64,838 | ||||
Cash paid for interest | $ | 242,190 | $ | 126,180 | $ | 138,906 | ||||
Non-cash investing and financing activities | ||||||||||
Assets-held-for-sale proceeds | $ | 146,428 | $ | — | $ | — | ||||
Escrow deposit disbursement related to London Broadcasting Company television stations acquisition | $ | (134,908 | ) | $ | — | $ | — | |||
Capital expenditures | $ | (11,520 | ) | $ | — | $ | — | |||
The accompanying notes are an integral part of these consolidated financial statements.
50
GANNETT CO., INC. CONSOLIDATED STATEMENTS OF EQUITY | ||||||||||||||||||||||
In thousands of dollars | Gannett Co., Inc. Shareholders’ Equity | |||||||||||||||||||||
Fiscal years ended Dec. 30, 2012, Dec. 29, 2013, and Dec. 28, 2014 | Common stock $1 par value | Additional paid-in capital | Retained earnings | Accumulated other comprehensive income (loss) | Treasury stock | Noncontrolling Interests | Total | |||||||||||||||
Balance: Dec. 25, 2011 | $ | 324,419 | $ | 617,727 | $ | 7,276,200 | $ | (595,839 | ) | $ | (5,294,616 | ) | $ | 184,134 | $ | 2,512,025 | ||||||
Net income, 2012 | 424,280 | 50,727 | 475,007 | |||||||||||||||||||
Redeemable noncontrolling interest | (254 | ) | (254 | ) | ||||||||||||||||||
Other comprehensive income (loss), net of tax | (105,302 | ) | 1,791 | (103,511 | ) | |||||||||||||||||
Total comprehensive income | 371,242 | |||||||||||||||||||||
Dividends declared, 2012: $0.80 per share | (185,622 | ) | (185,622 | ) | ||||||||||||||||||
Distributions to noncontrolling membership shareholders | (47,100 | ) | (47,100 | ) | ||||||||||||||||||
Treasury stock acquired | (153,948 | ) | (153,948 | ) | ||||||||||||||||||
Stock options exercised | (42,282 | ) | 66,787 | 24,505 | ||||||||||||||||||
Restricted stock awards settled | (32,860 | ) | 25,890 | (6,970 | ) | |||||||||||||||||
Stock-based compensation | 26,608 | 26,608 | ||||||||||||||||||||
Tax benefit derived from stock awards settled | 9,243 | 9,243 | ||||||||||||||||||||
Other activity | (10,921 | ) | 850 | (10,071 | ) | |||||||||||||||||
Balance: Dec. 30, 2012 | $ | 324,419 | $ | 567,515 | $ | 7,514,858 | $ | (701,141 | ) | $ | (5,355,037 | ) | $ | 189,298 | $ | 2,539,912 | ||||||
Net income, 2013 | 388,680 | 57,233 | 445,913 | |||||||||||||||||||
Redeemable noncontrolling interest | (1,997 | ) | (1,997 | ) | ||||||||||||||||||
Other comprehensive income, net of tax | 207,086 | 1,652 | 208,738 | |||||||||||||||||||
Total comprehensive income | 652,654 | |||||||||||||||||||||
Dividends declared, 2013: $0.80 per share | (182,635 | ) | (182,635 | ) | ||||||||||||||||||
Distributions to noncontrolling membership shareholders | (42,390 | ) | (42,390 | ) | ||||||||||||||||||
Treasury stock acquired | (116,639 | ) | (116,639 | ) | ||||||||||||||||||
Stock options exercised | (18,518 | ) | 40,189 | 21,671 | ||||||||||||||||||
Restricted stock awards settled | (31,707 | ) | 21,227 | (10,480 | ) | |||||||||||||||||
Stock-based compensation | 33,437 | 33,437 | ||||||||||||||||||||
Tax benefit derived from stock awards settled | 9,764 | 9,764 | ||||||||||||||||||||
Other activity | (8,123 | ) | (277 | ) | (2,101 | ) | (10,501 | ) | ||||||||||||||
Balance: Dec. 29, 2013 | $ | 324,419 | $ | 552,368 | $ | 7,720,903 | $ | (494,055 | ) | $ | (5,410,537 | ) | $ | 201,695 | $ | 2,894,793 | ||||||
Net income, 2014 | 1,062,171 | 68,289 | 1,130,460 | |||||||||||||||||||
Redeemable noncontrolling interest | (3,420 | ) | (3,420 | ) | ||||||||||||||||||
Other comprehensive loss, net of tax | (284,714 | ) | (7,702 | ) | (292,416 | ) | ||||||||||||||||
Total comprehensive income | 834,624 | |||||||||||||||||||||
Dividends declared, 2014: $0.80 per share | (180,705 | ) | (180,705 | ) | ||||||||||||||||||
Distributions to noncontrolling membership shareholders | (22,072 | ) | (22,072 | ) | ||||||||||||||||||
Treasury stock acquired | (75,815 | ) | (75,815 | ) | ||||||||||||||||||
Stock options exercised | (10,399 | ) | 24,634 | 14,235 | ||||||||||||||||||
Restricted stock awards settled | (36,397 | ) | 22,493 | (13,904 | ) | |||||||||||||||||
Stock-based compensation | 33,882 | 33,882 | ||||||||||||||||||||
Tax benefit derived from stock awards settled | 12,437 | 12,437 | ||||||||||||||||||||
Other activity | (5,485 | ) | (286 | ) | (2,431 | ) | (8,202 | ) | ||||||||||||||
Balance: Dec. 28, 2014 | $ | 324,419 | $ | 546,406 | $ | 8,602,369 | $ | (778,769 | ) | $ | (5,439,511 | ) | $ | 234,359 | $ | 3,489,273 | ||||||
The accompanying notes are an integral part of these consolidated financial statements.
51
NOTES TO CONSOLIDATED FINANCIAL STATEMENTS
NOTE 1
Summary of significant accounting policies
Fiscal year: Our fiscal year ends on the last Sunday of the calendar year. Our 2014 fiscal year ended on Dec. 28, 2014, and encompassed a 52-week period. Our 2013 fiscal year encompassed a 52-week period and our 2012 fiscal year encompassed a 53-week period.
Use of estimates: The financial statements have been prepared in accordance with generally accepted accounting principles and necessarily include amounts based on estimates and assumptions by management. Actual results could differ from those amounts. Significant estimates include amounts for income taxes, pension and other post-employment benefits and valuation of long-lived and intangible assets.
Consolidation: The Consolidated Financial Statements include our accounts and our wholly and majority-owned subsidiaries after elimination of all intercompany transactions and profits. Investments in entities for which we do not have control, but have the ability to exercise significant influence over operating and financial policies, are accounted for under the equity method. Our share of net earnings and losses from these ventures is included in “Equity income in unconsolidated investees, net” in the Consolidated Statements of Income.
Variable Interest Entities (VIE): A variable interest entity is an entity that lacks equity investors or whose equity investors do not have a controlling interest in the entity through their equity investments. We consolidate VIEs when we are the primary beneficiary. In determining whether we are the primary beneficiary of a VIE for financial reporting purposes, we consider whether we have the power to direct the activities of the VIE that most significantly impact the economic performance of the VIE and whether we have the obligation to absorb losses or the right to receive returns that would be significant to the VIE.
On Dec. 23, 2013, we completed the previously announced merger transaction contemplated in the Agreement and Plan of Merger, dated June 12, 2013 (the Merger Agreement), among Belo Corp. (Belo), Delta Acquisition Corp., one of our wholly-owned subsidiaries (Merger Sub), and us. Pursuant to the Merger Agreement, Merger Sub merged with and into Belo (the Merger), with Belo surviving the Merger as one of our wholly-owned subsidiaries.
The total cash consideration for the Merger was approximately $1.47 billion, in addition to the assumption of $715 million in principal amount of outstanding Belo debt.
As part of the transactions contemplated by the Merger Agreement, we restructured certain of Belo’s media holdings. Simultaneously with the closing of the transactions contemplated by the Merger Agreement, we closed on Asset Purchase Agreements (collectively, the Restructuring Agreements) with Sander Holdings, LLC and certain of its subsidiaries and Tucker Operating Co. LLC (the Restructuring Assignees).
Pursuant to the Restructuring Agreements, the Belo subsidiaries that owned and operated Belo’s seven stations located in the Louisville, KY; Phoenix, AZ; Portland, OR; St. Louis, MO; and Tucson, AZ television markets entered into their respective Restructuring Agreement and thereupon assigned, transferred, and conveyed to the Restructuring Assignees designated assets, including the applicable Federal Communications Commission (FCC) licenses, and certain operating equipment and programming and distribution agreements relating to the respective stations. As previously announced, the closing of the Restructuring Agreements for station KMOV-TV in St. Louis, MO, was subject to the terms of a proposed consent decree with the U.S. Department of Justice, which requires a divestiture of that station. We entered into, effective after closing of the Merger and the conveyance under the Restructuring Agreements, shared services or other support agreements with the Restructuring Assignees. The Restructuring Assignees granted us (or our assignee) the right to acquire such stations in the future, subject to applicable law. To facilitate the efficient pricing of acquisition financing needs of the Restructuring Assignees, we guaranteed debt incurred by the Restructuring Assignees in connection with the closings under the Restructuring Agreements.
Consolidated VIEs: We have concluded that the owner entities of the seven stations constitute VIEs and the various agreements that we have entered into related to these entities represented variable interests in the VIEs. We have evaluated the arrangements with respect to the power to direct the activities of the VIE and whether we have significant benefits, as required under ASC Topic 810, “Consolidation” (ASC Topic 810). We consolidate four stations in the Louisville, KY; Portland, OR; and Tucson, AZ, television markets based on these evaluations.
As of the dates indicated, the carrying amounts and classification of the assets and liabilities of the consolidated VIEs mentioned above which have been included in our consolidated balance sheets as follows:
In thousands of dollars | ||||||
Dec. 28, 2014 | Dec. 29, 2013 | |||||
Current assets | $ | 20,541 | $ | 4,677 | ||
Plant, property and equipment, net | 10,084 | 8,061 | ||||
Intangible and other assets | 29,412 | 32,008 | ||||
Total assets | 60,037 | 44,746 | ||||
Current liabilities | 11,635 | 7,827 | ||||
Noncurrent liabilities | 26,028 | 34,173 | ||||
Total liabilities | $ | 37,663 | $ | 42,000 | ||
Non-consolidated VIEs: With respect to two stations located in Phoenix, AZ, and one in St. Louis, MO, we entered into forward sale agreements to cause the sale of the assets of these stations to a third party. The sale of the station in St. Louis was completed in February of 2014 and the sale of the two stations in Phoenix was completed in June of 2014. These three stations were not consolidated in our financial statements before their sale dates due to our involvement being limited to certain administrative, maintenance and monitoring services.
Segment presentation: The Digital Segment includes results from CareerBuilder, Cars.com, PointRoll and Shoplocal. The Digital Segment and the digital revenues lines exclude online/digital revenues generated by digital platforms that are associated with our publishing and broadcasting operating properties. Such amounts are reflected within those segments and are included as part of publishing revenues and broadcasting revenues in the Consolidated Statements of Income.
52
Noncontrolling interests presentation: Noncontrolling interests are presented as a component of equity on the Consolidated Balance Sheet. This balance primarily relates to the noncontrolling owners of CareerBuilder, LLC (CareerBuilder) for which our ownership percentage is at 52.9%. Net income in the Consolidated Statements of Income reflects 100% of CareerBuilder results as we hold the controlling interest. Net income is subsequently adjusted to remove the noncontrolling interest to arrive at Net income attributable to Gannett Co., Inc. On Aug. 31, 2012, CareerBuilder acquired 74% of Economic Modeling Specialists Intl. (EMSI), a software firm that specializes in employment data and labor market analytics. Shareholders for the remaining 26% of ownership hold put rights that permit them to put their equity interest to CareerBuilder. Since redemption of the noncontrolling interest is outside of our control, their equity interest is presented on the consolidated balance sheet in the caption “Redeemable noncontrolling interest”.
Operating agencies: Our publishing subsidiary in Detroit participates in a joint operating agency. The joint operating agency performs the production, sales and distribution functions for the subsidiary and another publishing company under a joint operating agreement. Operating results for the Detroit joint operating agency are fully consolidated along with a charge for the noncontrolling partner’s share of profits.
Cash and cash equivalents: Cash and cash equivalents consist of cash and investments with maturities of three months or less.
Trade receivables and allowances for doubtful accounts: Trade receivables are recorded at invoiced amounts and generally do not bear interest. The allowance for doubtful accounts reflects our estimate of credit exposure, determined principally on the basis of our collection experience, aging of our receivables and significant individual account credit risk.
Inventories: Inventories, consisting principally of newsprint, printing ink and plate material for our publishing operations, are valued at the lower of cost (first-in, first-out) or market.
Assets held for sale: In accordance with the guidance on the disposal of long-lived assets under ASC Topic 360, “Property, Plant and Equipment” (ASC Topic 360), we reported assets held for sale in our Broadcasting and Publishing Segments at Dec. 28, 2014, of $70 million and at Dec. 29, 2013, of 396 million.
Valuation of long-lived assets: In accordance with the requirements included within ASC Topic 350, “Intangibles—Goodwill and Other” (ASC Topic 350) and ASC Topic 360, we evaluate the carrying value of long-lived assets (mostly property, plant and equipment and definite-lived intangible assets) to be held and used whenever events or changes in circumstances indicate that the carrying amount may not be recoverable. The carrying value of a long-lived asset group is considered impaired when the projected undiscounted future cash flows are less than their carrying value. We measure impairment based on the amount by which the carrying value exceeds the fair value. Fair value is determined primarily using the projected future cash flows, discounted at a rate commensurate with the risk involved. Losses on long-lived assets to be disposed of are determined in a similar manner, except that fair values are reduced for the cost to dispose.
Property and depreciation: Property, plant and equipment is recorded at cost, and depreciation is provided generally on a straight-line basis over the estimated useful lives of the assets. The principal estimated useful lives are: buildings and improvements, 10 to 40 years; and machinery, equipment and fixtures, 3 to 30 years. Changes in the estimated useful life of an asset, which, for example, could happen as a result of facility consolidations, can affect depreciation expense and net income. Major renewals and improvements and interest incurred during the construction period of major additions are capitalized. Expenditures for maintenance, repairs and minor renewals are charged to expense as incurred.
Goodwill and other intangible assets: Goodwill represents the excess of acquisition cost over the fair value of assets acquired, including identifiable intangible assets, net of liabilities assumed. In accordance with the impairment testing provisions included in ASC Topic 350, goodwill is tested for impairment on an annual basis (first day of fourth quarter) or between annual tests if events occur or circumstances change that would more likely than not reduce the fair value of a reporting unit below its carrying amount.
Before performing the annual two-step goodwill impairment test, we are first permitted to perform a qualitative assessment to determine if the two-step quantitative test must be completed. The qualitative assessment considers events and circumstances such as macroeconomic conditions, industry and market conditions, cost factors and overall financial performance, as well as company and specific reporting unit specifications. If after performing this assessment, we conclude it is more likely than not that the fair value of a reporting unit is less than its carrying amount, then we are required to perform a two-step quantitative test. Otherwise, the two-step test is not required. In the first step of the quantitative test, we are required to determine the fair value of each reporting unit and compare it to the carrying amount of the reporting unit. Fair value of the reporting unit is determined using various techniques, including multiple of earnings and discounted cash flow valuation techniques. If the carrying amount of the reporting unit exceeds the fair value of the reporting unit, we perform the second step of the impairment test, as this is an indication that the reporting unit goodwill may be impaired. In the second step of the impairment test, we determine the implied fair value of the reporting unit’s goodwill. If the carrying value of a reporting unit’s goodwill exceeds its implied fair value, then an impairment of goodwill has occurred and we must recognize an impairment loss for the difference between the carrying amount and the implied fair value of goodwill.
In determining the reporting units, we consider the way we manage our businesses and the nature of those businesses. We have established our reporting units for publishing at or one level below the segment level. These reporting units therefore consist principally of U.S. Community Publishing, the USA TODAY group, the U.K. group, and certain individual stand-alone publishing businesses. For Digital, the reporting units are the stand-alone digital businesses such as Cars.com and CareerBuilder. For Broadcasting, goodwill is accounted for at the segment level.
We perform an impairment test annually, or more often if circumstances dictate, of our indefinite-lived intangible assets. Intangible assets that have finite useful lives are amortized over those useful lives and are evaluated for impairment in accordance with ASC Topic 350 as described above. We recognized impairment charges each year from 2012 through 2014. See Note 3 for additional information.
Investments and other assets: Investments where we have significant influence are recorded under the equity method of accounting. We recognized impairment charges each year from 2012-2014 related to such investments. See Note 3 for additional information.
Investments in non-public businesses in which we do not have control or do not exert significant influence are carried at cost and losses resulting from periodic evaluations of the carrying value of these investments are included as a non-operating expense. At Dec. 28, 2014, such investments totaled approximately $8.3 million and at Dec. 29, 2013, they totaled approximately $2.7 million.
Our television stations are parties to program broadcasting contracts. These contracts are recorded at the gross amount of the related liability when the programs are available for telecasting. The related assets are recorded at the lower of cost or estimated net realizable value. Program assets are classified as current (as a prepaid expense) or noncurrent (as an other asset) in the
53
Consolidated Balance Sheets, based upon the expected use of the programs in succeeding years. The amount charged to expense appropriately matches the cost of the programs with the revenues associated with them. The liability for these contracts is classified as current or noncurrent in accordance with the payment terms of the contracts. The payment period generally coincides with the period of telecast for the programs, but may be shorter.
Revenue recognition: Our revenues include amounts charged to customers for space purchased in our newspapers, digital ads placed on our digital platforms, advertising and marketing service fees, online subscription advertising products, commercial printing and advertising broadcast on our television stations. Publishing revenues also include circulation revenues for newspapers, both print and digital, purchased by readers or distributors, reduced by the amount of any discounts taken. Broadcasting revenues include revenues from the retransmission of our television signals on satellite and cable networks. Retransmission fees are recognized over the contract period based on a negotiated fee per subscriber. Advertising revenues are recognized, net of agency commissions, in the period when advertising is printed or placed on digital platforms or broadcast. Revenues for marketing services are generally recognized when advertisements or services are delivered. Online subscriptions are recognized over the subscription period. Commercial printing revenues are recognized when the product is delivered to the customer. Circulation revenues are recognized when purchased newspapers are distributed or made available on our digital platforms. Revenue from sales agreements that contain multiple deliverable elements is allocated to each element based on the relative best estimate of selling price. Elements are treated as separate units of accounting if there is standalone value upon delivery. Amounts received from customers in advance of revenue recognition are deferred as liabilities.
Retirement plans: Pension and other postretirement benefit costs under our defined benefit retirement plans are actuarially determined. We recognize the cost of postretirement benefits including pension, medical and life insurance benefits on an accrual basis over the average life expectancy of employees expected to receive such benefits for plans that have had their benefits frozen. For active plans, costs are recognized over the estimated average future service period.
Stock-based employee compensation: We grant restricted stock or restricted stock units (RSU) as well as performance shares to employees as a form of compensation. The expense for such awards is based on the grant date fair value of the award and is recognized on a straight-line basis over the requisite service period, which is generally the four-year incentive period for restricted stock and the three-year incentive period for performance shares. Expense for performance share awards for participants meeting certain retirement eligible criteria as defined in the plan are recognized using the accelerated attribution method. See Note 10 for further discussion.
Our stock option awards generally have graded vesting terms and we recognize compensation expense for these options on a straight-line basis over the requisite service period for the entire award (generally four years). Stock options are no longer issued to our employees.
Income taxes: We account for certain income and expense items differently for financial reporting purposes than for income tax reporting purposes. Deferred income taxes are provided in recognition of these temporary differences. See Note 9 for further discussion.
Per share amounts: We report earnings per share on two bases, basic and diluted. All basic income per share amounts are based on the weighted average number of common shares outstanding during the year. The calculation of diluted earnings per share also considers
the assumed dilution from the exercise of stock options and from performance share and restricted stock units.
Foreign currency translation: The income statements of foreign operations have been translated to U.S. dollars using the average currency exchange rates in effect during the relevant period. The balance sheets have been translated using the currency exchange rate as of the end of the accounting period. The impact of currency exchange rate changes on the translation of the balance sheets are included in other comprehensive income (loss) in the Consolidated Statement of Comprehensive Income and are classified as accumulated other comprehensive income (loss) in the Consolidated Balance Sheet and Statement of Equity.
Loss contingencies: We are subject to various legal proceedings, claims and regulatory matters, the outcomes of which are subject to significant uncertainty. We determine whether to disclose or accrue for loss contingencies based on an assessment of whether the risk of loss is remote, reasonably possible or probable, and whether it can be reasonably estimated. We accrue for loss contingencies when such amounts are probable and reasonably estimable. If a contingent liability is only reasonably possible, we will disclose the potential range of the loss, if material and estimable.
New accounting pronouncements: In April 2014, the Financial Accounting Standards Board (FASB) issued Accounting Standards Update (ASU) 2014-08 Presentation of Financial Statements (Topic 205); Property, Plant, and Equipment (Topic 360), and Reporting Discontinued Operations and Disclosures of Disposals of Components of an Entity. ASU No. 2014-08 amends the requirements for reporting and disclosing discontinued operations. Under ASU No. 2014-08, a disposal of a component of an entity or a group of components of an entity is required to be reported in discontinued operations if the disposal represents a strategic shift that has (or will have) a major effect on the entity’s operations and financial results. ASU No. 2014-08 is effective for interim and annual periods beginning after December 15, 2014, with early adoption permitted and is to be applied prospectively. We adopted the provisions of ASU No. 2014-08 in 2014 as it relates to a publishing business that was shut down at the end of 2014 and one that was sold in early 2015. Neither of these businesses had a major impact on our operations or financial results and were not considered discontinued operations.
In May 2014, FASB issued ASU 2014-09 Revenue from Contracts with Customers (Topic 606) which supersedes the guidance in Revenue Recognition (Topic 605). The core principle contemplated by ASU 2014-09 is that an entity should recognize revenue to depict the transfer of promised goods or services to customers in an amount that reflects the consideration to which the entity expects to be entitled in exchange for those goods or services. New disclosures about the nature, amount, timing and uncertainty of revenue and cash flows arising from contracts with customers are also required.
We are required to adopt ASU 2014-09 in the first quarter of 2017 and early application is not permitted. However, we will need to retroactively apply the standard to 2015 and 2016 at the time of adoption. We can choose to apply the standard using either the full retrospective approach or a modified retrospective approach where we will recognize a cumulative catch up adjustment to the opening balance of retained earnings. We are currently assessing the impact of adopting this pronouncement and the transition method we will use.
54
NOTE 2
Acquisitions, investments and dispositions
We made the following acquisitions, investments and dispositions in the years 2012 through 2014:
2014: On Oct. 1, 2014, we acquired the remaining 73% interest in Cars.com (formerly known as Classified Ventures, LLC) for $1.83 billion. We funded the acquisition with additional borrowings and cash on hand. As part of the acquisition, Cars.com entered into new five year affiliation agreements with each of the former newspaper investors at economic terms much more favorable to Cars.com. Acquiring full ownership of Cars.com further accelerated our digital transformation and expanded our position in local media and marketing services in the automotive sector.
The purchase price was allocated to the tangible assets and identified intangible assets acquired based on their estimated fair values. The excess purchase price over those fair values was recorded as goodwill. At the acquisition date, the purchase price assigned to the acquired assets and assumed liabilities is summarized as follows:
In thousands of dollars | |||
Cash and cash equivalents | $ | 43,767 | |
Receivables and other current assets | 108,577 | ||
Plant, property and equipment | 17,399 | ||
Indefinite-lived intangible assets | 872,320 | ||
Definite-lived intangible assets: | |||
Customer relationships | 789,540 | ||
Internally developed technology | 69,500 | ||
Other | 2,860 | ||
Investments and other noncurrent assets | 14,598 | ||
Goodwill | 715,970 | ||
Total assets acquired | 2,634,531 | ||
Current liabilities | 106,970 | ||
Other noncurrent liabilities | 132,606 | ||
Total liabilities assumed | 239,576 | ||
Net assets acquired | 2,394,955 | ||
Less: acquisition date fair value of 26.9% equity interest | 563,757 | ||
Acquisition purchase price | $ | 1,831,198 | |
We recognized a $476.7 million pre-tax non-cash gain ($285.9 million after-tax) on the acquisition of Cars.com, which is comprised of a $396.7 million gain on the write-up of our prior 27% investment in Cars.com to fair value and an $80.0 million gain related to the required accounting for the pre-existing affiliate agreement between us and Cars.com. The net gain is included in Other non-operating items on the Consolidated Statements of Income. The impact to our Consolidated Statements of Income, net of intersegment eliminations, since the Oct. 1, 2014, acquisition date was $129.0 million of revenue and $33.6 million of operating income.
Customer relationships are being amortized over a weighted average life of eleven years and internally developed technology is being amortized over a weighted average life of seven years. Acquired property and equipment will be depreciated on a straight-line basis over the respective estimated remaining useful lives. Goodwill is calculated as the excess of the consideration transferred over the fair value of the identifiable net assets acquired and represents the future economic benefits expected to arise from other intangible assets acquired that do not qualify for separate recognition, including assembled workforce and non-contractual relationships, as well as expected future synergies. We expect the purchase price allocated to goodwill and other indefinite-lived intangibles will be deductible for tax purposes. The initial purchase price allocation is preliminarily based upon all information available to us at the present time and is subject to change, and such changes could be material. We continue to review the underlying assumptions and valuation techniques utilized to calculate the fair value of primarily the Indefinite-lived and Definite-lived intangibles.
Pro forma information. The following table sets forth unaudited pro forma results of operations, assuming that the Cars.com acquisition, along with transactions necessary to finance the acquisition, occurred at the beginning of 2013:
Unaudited | ||||||
In thousands of dollars | 2014 | 2013 | ||||
Total revenues | $ | 6,340,703 | $ | 5,563,472 | ||
Net income attributable to Gannett Co., Inc. | $ | 754,851 | $ | 356,354 | ||
This pro forma financial information is based on historical results of operations, adjusted for the allocation of the purchase price and other acquisition accounting adjustments, and is not necessarily indicative of what our results would have been had we operated the businesses since the beginning of the annual period presented. The pro forma adjustments reflect amortization of intangibles and unfavorable contracts related to the fair value adjustments of the assets and liabilities acquired, additional interest expense related to the financing of the transactions, alignment of accounting policies and the related tax effects of the adjustments. Changes in affiliation agreements between Cars.com and its former investors that went in to effect on Oct. 1, 2014, were excluded from the pro forma adjustments dating back to the beginning of 2013. The pro forma table excludes adjustments for any other acquisitions in 2013 or 2014.
We incurred and expensed a total of $9.3 million of acquisition costs related to Cars.com for the year ended Dec. 28, 2014. Such costs were reflected in Other non-operating items in the Consolidated Statements of Income. These acquisition costs and the $285.9 million after-tax gain on the acquisition of Cars.com are not included in the pro forma amounts above as they are specifically related to the acquisition.
In February 2014, we completed the previously announced sale of KMOV-TV in St. Louis, MO, to Meredith Corporation, following regulatory approval. As a condition of the sale, Sander Media conveyed to Meredith Corporation substantially all of its assets used to operate KMOV-TV, which Sander Media acquired when the Gannett-Belo transaction closed on December 23, 2013. We conveyed certain other assets needed to provide services to KMOV-TV, which we also acquired from Belo.
55
In March 2014, Classified Ventures, in which we owned a 27% interest, agreed to sell Apartments.com to CoStar Group, Inc. for $585 million. This transaction closed on April 1, 2014. As a result of our ownership stake, we received a special $154.6 million distribution from Classified Ventures after the close of the transaction.
Early in the second quarter, our subsidiary CareerBuilder acquired Broadbean. Broadbean is a leading international job distribution, candidate sourcing and big data analytics software company. Broadbean is headquartered in London, United Kingdom and has offices in the U.S., France, Germany, the Netherlands and Australia.
In June 2014, we, along with Sander Media, LLC, completed the previously announced sale of KTVK-TV and KASW-TV in Phoenix, AZ, to Meredith Corporation. As part of the sale, Sander Media conveyed to Meredith substantially all of its assets used in the operation of both stations, which Sander Media acquired when the Belo transaction was completed in December 2013. We also conveyed certain other assets we used to provide services to both stations, which we acquired from the Belo transaction. At the closing, Meredith simultaneously conveyed KASW-TV to SagamoreHill of Phoenix, LLC, which through its affiliates, owns and operates two television stations in two markets. The total sale price of the Phoenix and St. Louis stations was $407.5 million plus working capital.
In July 2014, we acquired six London Broadcasting Company television stations in Texas for approximately $215.0 million in an all-cash transaction. We used proceeds of $134.9 million from the sale of the Phoenix and St. Louis stations to partially pay for these London Broadcasting Company stations via a tax efficient exchange. The acquisition included KCEN (NBC) in Waco-Temple-Bryan, KYTX (CBS) in Tyler-Longview, KIII (ABC) in Corpus Christi, KBMT (ABC) and its digital sub-current KJAC (NBC) in Beaumont-Port Arthur, KXVA (FOX) in Abilene-Sweetheart and KIDY (FOX) in San Angelo.
In August 2014, we announced our plan to create two publicly traded companies: one focused on our Broadcasting and Digital business, and the other on our Publishing business. The planned separation of the Publishing business will be implemented through a tax-free distribution of shares, of a new entity formed to hold our Publishing assets to our shareholders. We expect to complete the transaction mid-2015, subject to a number of customary conditions, including final approval of our Board of Directors, receipt of an opinion from tax counsel regarding the tax-free nature of the distribution, the effectiveness of Form 10 registration statement to be filed with the SEC in regard to the shares of the entity formed to hold our Publishing assets, and other customary matters. There can be no assurance regarding the ultimate timing of the proposed transaction or that it will be completed.
On Dec. 29, 2014, which was after the end of our fiscal year, we sold Gannett Healthcare Group (GHG) to OnCourse Learning, an online education and training provider. GHG is a leading provider of continuing education, certification test preparation, online recruitment, digital media, publications and related services for nurses and other healthcare professionals in the U.S. Net assets of $14.8 million for GHG were included in Assets held for sale on our Consolidated Balance Sheet as of Dec. 28, 2014.
2013: On Dec. 23, 2013, we completed the acquisition of Belo. The total cash consideration was $1.47 billion in addition to the assumption of $715 million in principal amount of outstanding Belo debt.
The source of the aggregate purchase price that we paid in the acquisition consisted of additional borrowings and cash on hand.
The purchase price was allocated to the tangible assets and identified intangible assets acquired based on their estimated fair values. The excess purchase price over those fair values was recorded as goodwill. The final allocated fair value of acquired assets and assumed liabilities is summarized as follows:
In thousands of dollars | |||
Cash and cash equivalents | $ | 38,107 | |
Receivables and other current assets | 163,326 | ||
Assets held for sale | 431,513 | ||
Plant, property and equipment | 254,267 | ||
Indefinite-lived FCC licenses | 835,900 | ||
Definite-lived intangible assets: | |||
Retransmission agreements | 99,803 | ||
Network affiliation agreements | 33,978 | ||
Other | 52,782 | ||
Investments and other noncurrent assets | 52,902 | ||
Goodwill | 928,739 | ||
Total assets acquired | 2,891,317 | ||
Current liabilities | 87,073 | ||
Deferred income taxes | 514,450 | ||
Other noncurrent liabilities | 76,500 | ||
Long-term debt | 741,708 | ||
Total liabilities assumed | 1,419,731 | ||
Net assets acquired | $ | 1,471,586 | |
The retransmission agreements intangible assets are being amortized over a weighted average life of eight years and network affiliate agreements intangible assets are being amortized over a weighted average life of nine years. Acquired property and equipment are being depreciated on a straight-line basis over the respective estimated remaining useful lives. Goodwill is calculated as the excess of the consideration transferred over the fair value of the identifiable net assets acquired and represents the future economic benefits expected to arise from other intangible assets acquired that do not qualify for separate recognition, including assembled workforce and non-contractual relationships, as well as expected future synergies. We expect the purchase price allocated to goodwill and other indefinite-lived intangibles will not be deductible for tax purposes as no new tax basis in these intangibles was created due to the acquisition being a stock acquisition. The final allocation presented above is based upon our estimate of the fair values using valuation techniques including income, cost and market approaches.
Certain measurement period adjustments have been made since the initial allocation in the fourth quarter of 2013, which were not material to our consolidated financial statements.
Under the acquisition method of accounting, the results of the acquired operations for the 17 consolidated television stations are included in our financial statements beginning Dec. 23, 2013. Net broadcasting revenues and operating income of these stations included in our Consolidated Statements of Income were immaterial for the year ended Dec. 29, 2013.
We incurred and expensed a total of $33.0 million of acquisition costs for the year ended Dec. 29, 2013, related to the Belo acquisition. Such costs were reflected in Other non-operating items in the Consolidated Statements of Income.
56
In March 2013, CareerBuilder acquired Vietnam Online Network (KiemViec.com & HR Vietnam), Vietnam’s second largest career site by revenue, and first by number of registered users, specializing in recruitment services and human resource solutions for employers.
In April 2013, CareerBuilder acquired Oil and Gas Job Search (OilandGasJobSearch.com). Headquartered in England, Oil and Gas Job Search is the oil and gas industry’s leading online job site outside North America with job postings worldwide.
2012: In January 2012, we acquired the assets of Fantasy Sports Ventures/Big Lead Sports, a leading sports digital site.
In April 2012, CareerBuilder acquired two new businesses: Ceviu and Top Language Jobs. Ceviu is the leading information technology job board in Brazil. Top Language Jobs is Europe’s number one language specialist recruitment job portal. It operates the largest global network of job boards dedicated to multilingual job seekers looking for work internationally.
In August 2012, we completed the acquisition of BLiNQ Media, LLC, a leading global innovator of social engagement advertising solutions for agencies and brands.
In September 2012, we acquired Mobestream Media, developer of the Key Ring consumer rewards mobile platform (Key Ring) available on all major smartphones.
Also in September 2012, CareerBuilder acquired a controlling interest in EMSI. EMSI is an economic software firm that specializes in employment data and labor market analysis. EMSI collects and interprets large amounts of labor data, which is used in work force development and talent strategy.
In October 2012, we acquired Rovion. Rovion’s primary product, Ad Composer, includes a self-service technology platform that enables the full development and deployment of rich media and mobile HTML5 ads by clients which lack coding expertise.
NOTE 3
Facility consolidation and asset impairment charges
For each year presented, we recognized charges related to facility consolidations efforts, and in certain of these periods, we also recorded non-cash impairment charges to reduce the book value of goodwill, other intangible assets, long-lived assets, certain investments in which we hold a non-controlling interest which are accounted for under the equity method, and charges to write off certain publishing and broadcasting assets that were donated during 2014 and 2013.
A summary of these charges by year is presented below:
In thousands, except per share amounts | |||||||||
2014 | Pre-Tax Amount | After-Tax Amount | Per Share Amount | ||||||
Facility consolidation and asset impairment charges: | |||||||||
Goodwill: | |||||||||
Publishing | $ | 21,881 | $ | 18,881 | $ | 0.08 | |||
Digital | 23,700 | 23,700 | 0.10 | ||||||
Total goodwill | 45,581 | 42,581 | 0.18 | ||||||
Other intangible assets - Publishing | 3,548 | 2,148 | 0.01 | ||||||
Property, plant and equipment - Publishing | 19,467 | 13,467 | 0.06 | ||||||
Other: | |||||||||
Broadcasting | 13,720 | 8,219 | 0.04 | ||||||
Publishing | 14,048 | 8,049 | 0.03 | ||||||
Total other | 27,768 | 16,268 | 0.07 | ||||||
Total facility consolidation and asset impairment charges against operations | 96,364 | 74,464 | 0.32 | ||||||
Non-operating charges: | |||||||||
Equity method investments | 3,063 | 2,163 | 0.01 | ||||||
Other - Broadcasting | 16,108 | 6,508 | 0.03 | ||||||
Total charges | $ | 115,535 | $ | 83,135 | $ | 0.36 | |||
In thousands, except per share amounts | |||||||||
2013 | Pre-Tax Amount (a) | After-Tax Amount(a) | Per Share Amount(a) | ||||||
Facility consolidation and asset impairment charges: | |||||||||
Goodwill: | |||||||||
Publishing | $ | 8,430 | $ | 4,930 | $ | 0.02 | |||
Digital | 11,614 | 6,914 | 0.03 | ||||||
Total goodwill | 20,044 | 11,844 | 0.05 | ||||||
Other intangible assets - Publishing | 12,952 | 7,852 | 0.03 | ||||||
Property, plant and equipment - Publishing | 14,756 | 8,856 | 0.04 | ||||||
Other: | |||||||||
Broadcasting | 1,033 | 533 | — | ||||||
Publishing | 9,454 | 5,754 | 0.02 | ||||||
Total other | 10,487 | 6,287 | 0.03 | ||||||
Total facility consolidation and asset impairment charges against operations | 58,240 | 34,840 | 0.15 | ||||||
Non-operating charges: | |||||||||
Equity method investments | 731 | 431 | — | ||||||
Other - Publishing | 2,774 | 1,774 | 0.01 | ||||||
Total charges | $ | 61,745 | $ | 37,045 | $ | 0.16 | |||
(a) Total amounts may not sum due to rounding.
57
In thousands, except per share amounts | |||||||||
2012 | Pre-Tax Amount | After-Tax Amount | Per Share Amount(a) | ||||||
Facility consolidation and asset impairment charges: | |||||||||
Goodwill - Digital | $ | 90,053 | $ | 86,553 | $ | 0.37 | |||
Property, plant and equipment - Publishing | 29,520 | 17,920 | 0.08 | ||||||
Other - Publishing | 2,556 | 1,656 | 0.01 | ||||||
Total facility consolidation and asset impairment charges against operations | 122,129 | 106,129 | 0.45 | ||||||
Non-operating charges: | |||||||||
Equity method investments | 7,036 | 4,336 | 0.02 | ||||||
Total charges | $ | 129,165 | $ | 110,465 | $ | 0.47 | |||
(a) Total amounts may not sum due to rounding.
In connection with the required annual impairment test of goodwill and indefinite-lived intangibles, potential impairments were indicated in certain of the years presented for certain reporting units in our Publishing and Digital Segments. The fair value of the reporting units was determined based on a multiple of earnings technique and/or a discounted cash flow technique. We then undertook the next step in the impairment testing process by determining the fair value of assets and liabilities within these reporting units. The implied value was less than the carrying value; and therefore impairment charges were taken.
During 2014 and 2013, we recorded non-cash impairment charges for certain intangible assets, principally trade names and a masthead, after the qualitative assessments indicated it was more likely than not that the carrying values exceeded the respective fair values. Accordingly, we prepared quantitative assessments in both years which also indicated that impairments existed. As a results of these assessments, we recorded non-cash impairment charges to reduce the carrying value of each asset to its respective fair value. Fair values were determined using a relief-from-royalty method. The impairments recorded were principally a result of revenue projections which were lower than expected. In 2014, the revised revenue projections were also coupled with a decrease in royalty rates of comparable arrangements thus negatively impacting our royalty assumptions.
Facility consolidation plans led us to recognize charges associated with revising the useful lives of certain assets over a shortened period as well as shutdown costs. Charges were recognized in each year presented. Certain assets classified as held-for-sale in accordance with ASC Topic 360 resulted in charges also being recognized as the carrying values were reduced to equal the fair value less cost to dispose. These fair values were based on estimates of prices for similar assets.
In each year presented, carrying values of certain investments in which we own noncontrolling interests were written down to fair value because the businesses underlying the investments had experienced significant and sustained operating losses, leading us to conclude that they were other than temporarily impaired.
We recorded non-operating charges to write off certain Publishing and Broadcasting Segment assets that were donated during 2014 and 2013.
NOTE 4
Goodwill and other intangible assets
The following table displays goodwill, indefinite-lived intangible assets, and amortizable intangible assets at Dec. 28, 2014, and Dec. 29, 2013.
In thousands of dollars | |||||||||
Gross | Accumulated Amortization | Net | |||||||
Dec. 28, 2014 | |||||||||
Goodwill | $ | 4,499,927 | $ | — | $ | 4,499,927 | |||
Indefinite-lived intangibles: | |||||||||
Television station FCC licenses | 1,191,950 | — | 1,191,950 | ||||||
Mastheads and trade names | 951,776 | — | 951,776 | ||||||
Amortizable intangible assets: | |||||||||
Customer relationships | 1,078,738 | (212,438 | ) | 866,300 | |||||
Other | 282,856 | (53,289 | ) | 229,567 | |||||
Total | $ | 8,005,247 | $ | (265,727 | ) | $ | 7,739,520 | ||
Dec. 29, 2013 | |||||||||
Goodwill | $ | 3,790,472 | $ | — | $ | 3,790,472 | |||
Indefinite-lived intangibles: | |||||||||
Television station FCC licenses | 1,091,204 | — | 1,091,204 | ||||||
Mastheads and trade names | 82,570 | — | 82,570 | ||||||
Amortizable intangible assets: | |||||||||
Customer relationships | 290,845 | (177,515 | ) | 113,330 | |||||
Other | 213,790 | (23,663 | ) | 190,127 | |||||
Total | $ | 5,468,881 | $ | (201,178 | ) | $ | 5,267,703 | ||
Amortization expense was $79.9 million in 2014 and $36.4 million in 2013. The increase primarily reflects the impact of the Cars.com acquisition in 2014 and the Belo acquisition in late 2013. Customer relationships, which include subscriber lists and advertiser relationships, are amortized on a straight-line basis over their useful lives. Other intangibles primarily include retransmission agreements, network affiliations, internally developed technology, patents and amortizable trade names and are amortized on a straight-line basis over their useful lives.
The following table shows the projected annual amortization expense, as of Dec. 28, 2014, related to amortizable intangibles assuming no acquisitions or dispositions:
In thousands of dollars | |||
2015 | $ | 124,536 | |
2016 | $ | 116,495 | |
2017 | $ | 109,641 | |
2018 | $ | 106,772 | |
2019 | $ | 102,737 | |
58
The following table shows the changes in the carrying amount of goodwill during 2014 and 2013.
In thousands of dollars | ||||||||||||
Broadcasting | Publishing | Digital | Total | |||||||||
Goodwill | ||||||||||||
Gross balance at Dec. 30, 2012 | $ | 1,618,602 | $ | 7,754,959 | $ | 722,781 | $ | 10,096,342 | ||||
Accumulated impairment losses | — | (7,132,817 | ) | (116,656 | ) | (7,249,473 | ) | |||||
Net balance at Dec. 30, 2012 | $ | 1,618,602 | $ | 622,142 | $ | 606,125 | $ | 2,846,869 | ||||
Acquisitions & adjustments | 943,841 | 2,266 | 28,115 | 974,222 | ||||||||
Impairment | — | (8,430 | ) | (11,614 | ) | (20,044 | ) | |||||
Dispositions | (19,000 | ) | — | — | (19,000 | ) | ||||||
Foreign currency exchange rate changes | (110 | ) | 3,903 | 4,632 | 8,425 | |||||||
Balance at Dec. 29, 2013 | $ | 2,543,333 | $ | 619,881 | $ | 627,258 | $ | 3,790,472 | ||||
Gross balance at Dec. 29, 2013 | 2,543,333 | 7,807,416 | 755,528 | 11,106,277 | ||||||||
Accumulated impairment losses | — | (7,187,535 | ) | (128,270 | ) | (7,315,805 | ) | |||||
Net balance at Dec. 29, 2013 | $ | 2,543,333 | $ | 619,881 | $ | 627,258 | $ | 3,790,472 | ||||
Acquisitions & adjustments | 35,268 | 4,579 | 749,250 | 789,097 | ||||||||
Assets held for sale | — | (6,288 | ) | — | (6,288 | ) | ||||||
Impairment | — | (21,881 | ) | (23,700 | ) | (45,581 | ) | |||||
Foreign currency exchange rate changes | — | (11,134 | ) | (16,639 | ) | (27,773 | ) | |||||
Balance at Dec. 28, 2014 | $ | 2,578,601 | $ | 585,157 | $ | 1,336,169 | $ | 4,499,927 | ||||
Gross balance at Dec. 28, 2014 | 2,578,601 | 7,662,543 | 1,488,139 | 11,729,283 | ||||||||
Accumulated impairment losses | — | (7,077,386 | ) | (151,970 | ) | (7,229,356 | ) | |||||
Net balance at Dec. 28, 2014 | $ | 2,578,601 | $ | 585,157 | $ | 1,336,169 | $ | 4,499,927 | ||||
NOTE 5
Investments
Our investments include several that are accounted for under the equity method. Principal among these are the following:
% Owned Dec. 28, 2014 | |
Ponderay Newsprint Company | 13.50% |
Captivate Holdings, LLC | 16.74% |
California Newspapers Partnership | 19.49% |
Wanderful Media, LLC | 19.50% |
4Info | 24.53% |
Livestream | 27.73% |
Pearl, LLC | 32.10% |
Homefinder.com | 33.33% |
Topix | 33.71% |
Garnet Media | 34.00% |
Texas-New Mexico Newspapers Partnership | 40.64% |
TNI Partners | 50.00% |
The aggregate carrying value of equity investments at Dec. 28, 2014, was $95.7 million and $164.9 million at Dec. 29, 2013. Certain differences exist between our investment carrying value and the underlying equity of the investee companies principally due to fair value measurement at the date of investment acquisition and due to impairment charges we recorded for certain of the investments.
Our 2014 results included a pre-tax gain of $148.4 million related to the sale of Apartments.com by Classified Ventures. This gain is reflected in the Equity income in unconsolidated investees, net line.
59
NOTE 6
Long-term debt
Our long-term debt is summarized below:
In thousands of dollars | ||||||
Dec. 28, 2014 | Dec. 29, 2013 | |||||
Unsecured floating rate term loan due quarterly through August 2018 | $ | 123,200 | $ | 154,800 | ||
VIE unsecured floating rate term loans due quarterly through December 2018 | 33,379 | 39,270 | ||||
Unsecured notes bearing fixed rate interest at 8.75% due November 2014 | — | 250,000 | ||||
Unsecured notes bearing fixed rate interest at 10% due June 2015 | 66,568 | 66,568 | ||||
Unsecured notes bearing fixed rate interest at 6.375% due September 2015 | 250,000 | 250,000 | ||||
Unsecured notes bearing fixed rate interest at 10% due April 2016 | 193,429 | 193,429 | ||||
Unsecured notes bearing fixed rate interest at 9.375% due November 2017 | — | 250,000 | ||||
Borrowings under revolving credit agreement expiring August 2018 | 640,000 | — | ||||
Unsecured notes bearing fixed rate interest at 7.125% due September 2018 | 250,000 | 250,000 | ||||
Unsecured notes bearing fixed rate interest at 5.125% due October 2019 | 600,000 | 600,000 | ||||
Unsecured notes bearing fixed rate interest at 5.125% due July 2020 | 600,000 | 600,000 | ||||
Unsecured notes bearing fixed rate interest at 4.875% due September 2021 | 350,000 | — | ||||
Unsecured notes bearing fixed rate interest at 6.375% due October 2023 | 650,000 | 650,000 | ||||
Unsecured notes bearing fixed rate interest at 5.50% due September 2024 | 325,000 | — | ||||
Unsecured notes bearing fixed rate interest at 7.75% due June 2027 | 200,000 | 200,000 | ||||
Unsecured notes bearing fixed rate interest at 7.25% due September 2027 | 240,000 | 240,000 | ||||
Total principal long-term debt | 4,521,576 | 3,744,067 | ||||
Other (fair market value adjustments and discounts) | (25,694 | ) | (31,167 | ) | ||
Total long-term debt | 4,495,882 | 3,712,900 | ||||
Less current portion of long-term debt maturities of VIE loans | 7,854 | 5,890 | ||||
Long-term debt, net of current portion | $ | 4,488,028 | $ | 3,707,010 | ||
Our debt balance at year end 2014 increased by $781 million primarily reflecting additional borrowings to fund the acquisition of the remaining 73% of Cars.com we did not previously own. This was partially offset by the early repayment of the 9.375% notes due November 2017 and the repayment of the 8.75% notes due November 2014 for $250 million each. We redeemed the 9.375% notes by paying 104.688% of the outstanding principal amount in accordance with the original terms. The early redemption of these notes saved us approximately $19 million in interest expense for 2014.
In September 2014, and in support of the Cars.com acquisition, we completed the private placement of $350 million in aggregate principal amount of 4.875% senior unsecured notes due 2021 (the 2021 Notes). The 2021 Notes were priced at 98.531% of face value, resulting in a yield to maturity of 5.125%. Subject to certain exceptions, we are unable to redeem the 2021 Notes before Sept. 15, 2017. On the same day, we completed the private placement of $325 million in aggregate principal amount of 5.500% senior unsecured notes due 2024 (the 2024 Notes). The 2024 Notes were priced at 99.038% of face value, resulting in a yield to maturity of 5.625%. Subject to certain exceptions, we are unable to redeem the 2024 Notes before Sept. 15, 2019. The 2021 and 2024 Notes were issued in a private offering that is exempt from the registration requirements of the Securities Act of 1933. The 2021 and 2024 Notes are guaranteed on a senior basis by our subsidiaries that guarantee our revolving credit facility, term loan and our other outstanding notes.
In August 2013, we entered into an agreement to replace, amend and restate our existing revolving credit facilities with a credit facility expiring on Aug. 5, 2018, which was further amended on Sept. 24, 2013 (the Credit Agreement). Total commitments under the Credit Agreement are $1.3 billion. Subject to total leverage ratio limits, the Credit Agreement eliminates our restriction on incurring additional indebtedness. The Credit Agreement was amended as of February 13, 2015. The maximum total leverage ratio permitted by the Credit Agreement as amended, is 4.0x through September 30, 2016, reducing to 3.75x thereafter. Commitment fees on the revolving credit agreement are equal to 0.375% -0.50% of the undrawn commitments, depending upon our leverage ratio, and are computed on the average daily undrawn balance under the revolving credit agreement and paid each quarter. Under the Credit Agreement, we may borrow at an applicable margin above the Eurodollar base rate (LIBOR loan) or the higher of the Prime Rate, the Federal Funds Effective Rate plus 0.50%, or the one month LIBOR rate plus 1.00% (ABR loan). The applicable margin is determined based on our leverage ratio but differs between LIBOR loans and ABR loans. For LIBOR based borrowing, the margin varies from 1.75% to 2.5%. For ABR based borrowing, the margin will vary from 0.75% to 1.50%. Based on our leverage ratio as of Dec. 28, 2014, our applicable margins were 2.25% and 1.25%, respectively.
On Dec. 28, 2014, we had unused borrowing capacity of $625.5 million under our revolving credit agreement.
We have an effective universal shelf registration statement under which an unspecified amount of securities may be issued, subject to a $7.0 billion limit established by the Board of Directors. Proceeds from the sale of such securities may be used for general corporate purposes, including capital expenditures, working capital, securities repurchase programs, repayment of debt and financing of acquisitions. We may also invest borrowed funds that are not required for other purposes in short-term marketable securities.
60
The following schedule of annual maturities of the principal amount of total debt assumes we use available capacity under our revolving credit agreement to refinance unsecured floating rate term loans and notes due in 2015. Based on this refinancing assumption, all of the obligations other than VIE unsecured floating rate term loans due in 2015 are reflected as maturities for 2016 and beyond.
In thousands of dollars | |||
2015 (1) | $ | 7,854 | |
2016 | 232,883 | ||
2017 | 39,454 | ||
2018 | 1,276,385 | ||
2019 | 600,000 | ||
Thereafter | 2,365,000 | ||
Total | $ | 4,521,576 | |
(1) Maturities of principal amount of debt due in 2015 (primarily the 10% fixed rate notes due in June 2015 and the 6.375% fixed rate notes due in September 2015) are assumed to be repaid with funds from the revolving credit agreement, which matures in 2018.
Our debt maturities may be repaid with cash flow from operating activities, by accessing capital markets or a combination of both.
NOTE 7
Retirement plans
We, along with our subsidiaries, have various defined benefit retirement plans, including plans established under collective bargaining agreements. Our principal retirement plan is the Gannett Retirement Plan (GRP). The disclosure tables below include the assets and obligations of the GRP, the Gannett Supplemental Retirement Plan (SERP), the Newsquest Pension Scheme in the U.K. (Newsquest Plan), the Newspaper Guild of Detroit Pension Plan, and The G. B. Dealey Retirement Pension Plan (Dealey Plan). We use a Dec. 31 measurement date convention for our retirement plans.
Substantially all participants in the GRP, Dealey Plan and SERP had their benefits frozen before 2009. Participants of the Newsquest Plan had their benefits frozen effective March 31, 2011.
Our pension costs, which include costs for our qualified and non-qualified plans, are presented in the following table:
In thousands of dollars | |||||||||
2014 | 2013 | 2012 | |||||||
Service cost—benefits earned during the period | $ | 5,311 | $ | 7,538 | $ | 7,545 | |||
Interest cost on benefit obligation | 168,991 | 141,030 | 155,376 | ||||||
Expected return on plan assets | (234,862 | ) | (198,216 | ) | (189,863 | ) | |||
Amortization of prior service costs | 7,566 | 7,566 | 7,689 | ||||||
Amortization of actuarial loss | 45,731 | 63,212 | 53,429 | ||||||
Pension expense (benefit) for company-sponsored retirement plans | (7,263 | ) | 21,130 | 34,176 | |||||
Settlement charge | — | 3,077 | 7,946 | ||||||
Total pension cost (benefit) | $ | (7,263 | ) | $ | 24,207 | $ | 42,122 | ||
The following table provides a reconciliation of pension benefit obligations (on a projected benefit obligation measurement basis), plan assets and funded status of company-sponsored retirement plans, along with the related amounts that are recognized in the Consolidated Balance Sheets.
In thousands of dollars | ||||||
Dec. 28, 2014 | Dec. 29, 2013 | |||||
Change in benefit obligations | ||||||
Benefit obligations at beginning of year | $ | 3,672,249 | $ | 3,573,085 | ||
Service cost | 5,311 | 7,538 | ||||
Interest cost | 168,991 | 141,030 | ||||
Plan amendments | — | 177 | ||||
Plan participants’ contributions | 5 | 4 | ||||
Actuarial loss (gain) | 438,296 | (104,131 | ) | |||
Foreign currency translation | (57,779 | ) | 21,758 | |||
Gross benefits paid | (227,269 | ) | (230,979 | ) | ||
Acquisitions | — | 274,510 | ||||
Settlements | — | (10,743 | ) | |||
Benefit obligations at end of year | $ | 3,999,804 | $ | 3,672,249 | ||
Change in plan assets | ||||||
Fair value of plan assets at beginning of year | $ | 3,028,467 | $ | 2,552,316 | ||
Actual return on plan assets | 180,033 | 364,652 | ||||
Plan participants’ contributions | 5 | 4 | ||||
Employer contributions | 103,933 | 107,086 | ||||
Gross benefits paid | (227,269 | ) | (230,979 | ) | ||
Acquisitions | — | 229,774 | ||||
Settlements | — | (10,743 | ) | |||
Foreign currency translation | (42,655 | ) | 16,357 | |||
Fair value of plan assets at end of year | $ | 3,042,514 | $ | 3,028,467 | ||
Funded status at end of year | $ | (957,290 | ) | $ | (643,782 | ) |
Amounts recognized in Consolidated Balance Sheets | ||||||
Noncurrent assets | $ | — | $ | 3,684 | ||
Accrued benefit cost—current | $ | (15,575 | ) | $ | (15,271 | ) |
Accrued benefit cost—noncurrent | $ | (941,715 | ) | $ | (632,195 | ) |
61
The funded status (on a projected benefit obligation basis) of our principal retirement plans at Dec. 28, 2014, is as follows:
In thousands of dollars | |||||||||
Fair Value of Plan Assets | Benefit Obligation | Funded Status | |||||||
GRP | $ | 1,973,928 | $ | 2,392,208 | $ | (418,280 | ) | ||
SERP (a) | — | 216,049 | (216,049 | ) | |||||
Newsquest | 716,519 | 970,674 | (254,155 | ) | |||||
Dealey | 259,320 | 314,755 | (55,435 | ) | |||||
All other | 92,747 | 106,118 | (13,371 | ) | |||||
Total | $ | 3,042,514 | $ | 3,999,804 | $ | (957,290 | ) | ||
(a) The SERP is an unfunded, unsecured liability | |||||||||
The accumulated benefit obligation for all defined benefit pension plans was $3.98 billion at Dec. 28, 2014, and $3.65 billion at Dec. 29, 2013.
The following table presents information for our retirement plans for which accumulated benefits exceed assets:
In thousands of dollars | ||||||
Dec. 28, 2014 | Dec. 29, 2013 | |||||
Accumulated benefit obligation | $ | 3,979,493 | $ | 3,568,021 | ||
Fair value of plan assets | $ | 3,042,514 | $ | 2,938,480 | ||
The following table presents information for our retirement plans for which projected benefit obligations exceed assets:
In thousands of dollars | ||||||
Dec. 28, 2014 | Dec. 29, 2013 | |||||
Projected benefit obligation | $ | 3,999,804 | $ | 3,585,947 | ||
Fair value of plan assets | $ | 3,042,514 | $ | 2,938,480 | ||
The following table summarizes the amounts recorded in accumulated other comprehensive income (loss) that have not yet been recognized as a component of pension expense as of the dates presented (pre-tax):
In thousands of dollars | ||||||
Dec. 28, 2014 | Dec. 29, 2013 | |||||
Net actuarial losses | $ | (1,811,857 | ) | $ | (1,390,975 | ) |
Prior service cost | (46,383 | ) | (53,949 | ) | ||
Amounts in accumulated other comprehensive income (loss) | $ | (1,858,240 | ) | $ | (1,444,924 | ) |
The actuarial loss amounts expected to be amortized from accumulated other comprehensive income (loss) into net periodic benefit cost in 2015 are $60.5 million. The prior service cost amounts expected to be amortized from accumulated other comprehensive income (loss) into net periodic benefit cost in 2015 are $7.6 million.
The increased reduction to accumulated other comprehensive income was driven by lower rates used to discount our pension obligations as well as updates to assumed life expectancies of the plan’s participants.
Other changes in plan assets and benefit obligations recognized in other comprehensive loss consist of the following:
In thousands of dollars | |||
2014 | |||
Current year actuarial gain (loss) | $ | (493,124 | ) |
Amortization of actuarial loss | 45,731 | ||
Amortization of prior service costs | 7,566 | ||
Foreign currency gain | 26,511 | ||
Total | $ | (413,316 | ) |
Pension costs: The following assumptions were used to determine net pension costs:
2014 | 2013 | 2012 | |
Discount rate | 4.75% | 4.08% | 4.83% |
Expected return on plan assets | 7.93% | 7.94% | 7.95% |
Rate of compensation increase | 2.97% | 2.97% | 2.96% |
The expected return on plan assets assumption was determined based on plan asset allocations, a review of historic capital market performance, historical plan asset performance and a forecast of expected future plan asset returns.
Benefit obligations and funded status: The following assumptions were used to determine the year-end benefit obligations:
Dec. 28, 2014 | Dec. 29, 2013 | |
Discount rate | 3.96% | 4.75% |
Rate of compensation increase | 2.96% | 2.97% |
During 2014, we made the following contributions to our principal retirement plans: $56.1 million to the GRP, $20.1 million to the Dealey Plan and $14.7 million to the Newsquest Plan. In 2015, we expect to contribute $12.0 million to the GRP and $12.8 million to the Newsquest Plan.
Plan assets: The asset allocation for the GRP at the end of 2014 and 2013, and target allocations for 2015, by asset category, are presented in the table below:
Target Allocation | Allocation of Plan Assets | |||||
2015 | 2014 | 2013 | ||||
Equity securities | 65 | % | 65 | % | 64 | % |
Debt securities | 20 | 20 | 22 | |||
Other | 15 | 15 | 14 | |||
Total | 100 | % | 100 | % | 100 | % |
62
The primary objective of company-sponsored retirement plans is to provide eligible employees with scheduled pension benefits; the “prudent man” guideline is followed with regard to the investment management of retirement plan assets. Consistent with prudent standards for preservation of capital and maintenance of liquidity, the goal is to earn the highest possible total rate of return while minimizing risk. The principal means of reducing volatility and exercising prudent investment judgment is diversification by asset class and by investment manager; consequently, portfolios are constructed to attain prudent diversification in the total portfolio, each asset class, and within each individual investment manager’s portfolio. Investment diversification is consistent with the intent to minimize the risk of large losses. All objectives are based upon an investment horizon spanning five years so that interim market fluctuations can be viewed with the appropriate perspective. The target asset allocation represents the long-term perspective. Retirement plan assets will be rebalanced periodically to align them with the target asset allocations. Risk characteristics are measured and compared with an appropriate benchmark quarterly; periodic reviews are made of the investment objectives and the investment managers. Our actual investment return on our Gannett Retirement Plan assets was 5.2% for 2014, 16.4% for 2013 and 12.6% for 2012.
Retirement plan assets include approximately 1.2 million shares of our common stock valued at approximately $39.7 million at the end of 2014 and $36.7 million at the end of 2013. The plan received dividends of approximately $1.0 million on these shares in 2014 and 2013.
Cash flows: We estimate we will make the following benefit payments (from either retirement plan assets or directly from our funds), which reflect expected future service, as appropriate:
In thousands of dollars | |||
2015 | $ | 222,327 | |
2016 | $ | 225,846 | |
2017 | $ | 230,012 | |
2018 | $ | 229,063 | |
2019 | $ | 232,081 | |
2020-2024 | $ | 1,146,800 | |
401(k) savings plan
Substantially all our employees (other than those covered by a collective bargaining agreement) who are scheduled to work at least 1,000 hours during each year of employment are eligible to participate in our principal defined contribution plan, The Gannett Co., Inc. 401(k) Savings Plan. Employees can elect to save up to 50% of compensation on a pre-tax basis subject to certain limits.
For most participants, the plan’s matching formula is 100% of the first 5% of employee contributions. We also make additional employer contributions on behalf of certain long-term employees. Compensation expense related to 401(k) contributions was $48.1 million in 2014, $47.5 million in 2013, and $51.3 million in 2012. We settled the 401(k) employee match obligation by buying our stock in the open market and depositing it in the participants’ accounts.
Multi-employer plans that provide pension benefits: We contribute to a number of multi-employer defined benefit pension plans under the terms of collective-bargaining agreements (CBA) that cover our union-represented employees. The risks of participating in these multi-employer plans are different from single-employer plans in the following aspects:
• | We play no part in the management of plan investments or any other aspect of plan administration. |
• | Assets contributed to the multi-employer plan by one employer may be used to provide benefits to employees of other participating employers. |
• | If a participating employer stops contributing to the plan, the unfunded obligations of the plan may be borne by the remaining participating employers. |
• | If we choose to stop participating in some of our multi-employer plans, we may be required to pay those plans an amount based on the unfunded status of the plan, referred to as withdrawal liability. |
63
Our participation in these plans for the annual period ended Dec. 28, 2014, is outlined in the table below. The “EIN/Pension Plan Number” column provides the Employee Identification Number (EIN) and the three-digit plan number. Unless otherwise noted, the two most recent Pension Protection Act (PPA) zone statuses available are for the plan’s year-end at Dec. 31, 2013 and Dec. 31, 2012. The zone status is based on information that we received from the plan and is certified by the plan’s actuary. Among other factors, plans in the red zone are generally less than 65% funded; plans in the orange zone are both a) less than 80% funded and b) have an accumulated/expected funding deficiency in any of the next six plan years, net of any amortization extensions; plans in the yellow zone meet either one of the criteria mentioned in the orange zone; and plans in the green zone are at least 80% funded. The “FIP/RP Status Pending/Implemented” column indicates plans for which a financial improvement plan (FIP) or a rehabilitation plan (RP) is either pending or has been implemented. The last column lists the expiration date(s) of the collective-bargaining agreement(s) to which the plans are subject.
We make all required contributions to these plans as determined under the respective CBAs. For each of the plans listed below, our contribution represented less than 5% of total contributions to the plan except for one plan where we contributed approximately 13% of the total contributions to the Newspaper Guild International Pension Plan. This calculation is based on the plan financial statements issued at the end of December 31, 2013. At the date we issue our financial statements, Forms 5500 were unavailable for the plan years ending after December 31, 2013.
We incurred expenses for multi-employer withdrawal liabilities of $8.2 million in 2014 and $3.8 million in 2012. Other noncurrent liabilities on the Consolidated Balance Sheet include $41.2 million as of Dec. 28, 2014, and $34.1 million as of Dec. 29, 2013, for such withdrawal liabilities.
Multi-employer Pension Plans | |||||||||||||||
EIN Number/ | Zone Status Dec. 31, | FIP/RP Status Pending/Implemented | Contributions(in thousands) | Surcharge Imposed | Expiration Dates of CBAs | ||||||||||
Pension Plan Name | Plan Number | 2014 | 2013 | 2014 | 2013 | 2012 | |||||||||
AFTRA Retirement Plan (a) | 13-6414972/001 | Green as of Nov. 30, 2013 | Green as of Nov. 30, 2012 | NA | $ | 973 | $ | 988 | $ | 965 | NA | 5/31/2015 9/11/2015 4/18/2017 | |||
CWA/ITU Negotiated Pension Plan | 13-6212879/001 | Red | Red | Implemented | 433 | 242 | 572 | No | 2/1/2015 11/8/2015 2/23/2016 | ||||||
GCIU—Employer Retirement Benefit Plan (a), (b) | 91-6024903/001 | Red | Red | Implemented | 71 | 216 | 380 | No | N/A | ||||||
The Newspaper Guild International Pension Plan (a) | 52-1082662/001 | Red | Red | Implemented | 244 | 279 | 415 | No | 2/23/2016 | ||||||
IAM National Pension Plan (a) | 51-6031295/002 | Green | Green | NA | 403 | 736 | 341 | NA | 4/30/2016 | ||||||
Teamsters Pension Trust Fund of Philadelphia and Vicinity (a) | 23-1511735/001 | Yellow | Yellow | Implemented | 1,298 | 1,355 | 876 | NA | 7/29/2015 2/23/2016 | ||||||
Central Pension Fund of the International Union of Operating Engineers and Participating Employers (a) | 36-6052390/001 | Green as of Jan. 31, 2014 | Green as of Jan. 31, 2013 | NA | 153 | 160 | 158 | NA | 4/30/2016 | ||||||
Central States Southeast and Southwest Areas Pension Fund (b) | 36-6044243/001 | Red | Red | Implemented | — | 40 | 260 | No | N/A | ||||||
Total | $ | 3,575 | $ | 4,016 | $ | 3,967 | |||||||||
(a) This plan has elected to utilize special amortization provisions provided under the Preservation of Access to Care for Medicare Beneficiaries and Pension Relief Act of 2010. | |||||||||||||||
(b) We have no ongoing participation in these plans. | |||||||||||||||
64
NOTE 8
Postretirement benefits other than pensions
We provide health care and life insurance benefits to certain retired employees who meet age and service requirements. Most of our retirees contribute to the cost of these benefits and retiree contributions are increased as actual benefit costs increase. The cost of providing retiree health care and life insurance benefits is actuarially determined. Our policy is to fund benefits as claims and premiums are paid. Commencing July 1, 2014, for certain Medicare-eligible retirees, our approach to deliver postretirement healthcare moved to a private retiree exchange. For those individuals, we began providing a stipend which is accessible through a Health Reimbursement Account. We eliminated postretirement medical and life insurance benefits for most U.S. employees under 50 years of age effective Jan. 1, 2006. We use a Dec. 31 measurement date for these plans.
Postretirement benefit cost for health care and life insurance included the following components:
In thousands of dollars | |||||||||
2014 | 2013 | 2012 | |||||||
Service cost – benefits earned during the period | $ | 369 | $ | 529 | $ | 545 | |||
Interest cost on net benefit obligation | 4,711 | 5,656 | 7,744 | ||||||
Amortization of prior service credit | (11,648 | ) | (9,165 | ) | (19,190 | ) | |||
Amortization of actuarial loss | 758 | 1,169 | 1,943 | ||||||
Net periodic postretirement benefit credit | $ | (5,810 | ) | $ | (1,811 | ) | $ | (8,958 | ) |
The table below provides a reconciliation of benefit obligations and funded status of our postretirement benefit plans:
In thousands of dollars | ||||||
Dec. 28, 2014 | Dec. 29, 2013 | |||||
Change in benefit obligations | ||||||
Net benefit obligations at beginning of year | $ | 146,809 | $ | 169,592 | ||
Service cost | 369 | 529 | ||||
Interest cost | 4,711 | 5,656 | ||||
Plan participants’ contributions | 5,133 | 9,629 | ||||
Plan amendments | (37,986 | ) | (496 | ) | ||
Actuarial loss (gain) | 6,954 | (16,476 | ) | |||
Gross benefits paid | (18,739 | ) | (28,022 | ) | ||
Federal subsidy on benefits paid | 683 | 4,169 | ||||
Acquisitions | — | 2,228 | ||||
Net benefit obligations at end of year | $ | 107,934 | $ | 146,809 | ||
Change in plan assets | ||||||
Fair value of plan assets at beginning of year | $ | — | $ | — | ||
Employer contributions | 13,606 | 18,393 | ||||
Plan participants’ contributions | 5,133 | 9,629 | ||||
Gross benefits paid | (18,739 | ) | (28,022 | ) | ||
Fair value of plan assets at end of year | $ | — | $ | — | ||
Benefit obligation at end of year | $ | (107,934 | ) | $ | (146,809 | ) |
Amounts recognized in Consolidated Balance Sheets | ||||||
Accrued benefit cost—current | $ | (10,286 | ) | $ | (17,731 | ) |
Accrued benefit cost—noncurrent | $ | (97,648 | ) | $ | (129,078 | ) |
The following table summarizes the amounts recorded in accumulated other comprehensive income (loss) that have not yet been recognized as a component of net periodic postretirement benefit credit as of the dates presented (pre-tax):
In thousands of dollars | ||||||
Dec. 28, 2014 | Dec. 29, 2013 | |||||
Net actuarial losses | $ | (12,594 | ) | $ | (6,087 | ) |
Prior service credit | 42,542 | 16,204 | ||||
Amounts in accumulated other comprehensive income (loss) | $ | 29,948 | $ | 10,117 | ||
The actuarial loss and prior service credit estimated to be amortized from accumulated other comprehensive loss into net periodic benefit cost in 2015 are $1.5 million and $10.0 million, respectively.
Other changes in plan assets and benefit obligations recognized in other comprehensive (loss) consist of the following:
In thousands of dollars | |||
2014 | |||
Current year actuarial loss | $ | (7,265 | ) |
Change in prior service cost | 37,986 | ||
Amortization of actuarial loss | 758 | ||
Amortization of prior service credit | (11,648 | ) | |
Total | $ | 19,831 | |
Postretirement benefit costs: The following assumptions were used to determine postretirement benefit cost:
2014 | 2013 | 2012 | ||||
Discount rate | 4.50 | % | 3.80 | % | 4.75 | % |
Health care cost trend rate assumed for next year | 6.26 | % | 7.17 | % | 6.50 | % |
Ultimate trend rate | 5.00 | % | 5.00 | % | 5.00 | % |
Year that ultimate trend rate is reached | 2018 | 2017 | 2016 | |||
Benefit obligations and funded status: The following assumptions were used to determine the year-end benefit obligation:
Dec. 28, 2014 | Dec. 29, 2013 | |||
Discount rate | 4.00 | % | 4.75 | % |
Health care cost trend rate assumed for next year | 6.26 | % | 7.17 | % |
Ultimate trend rate | 5.00 | % | 5.00 | % |
Year that ultimate trend rate is reached | 2018 | 2017 | ||
Assumed health care cost trend rates have an effect on the amounts reported for the health care plans. The effect of a 1% change in the health care cost trend rate would result in a change of approximately $0.3 million in the 2014 postretirement benefit obligation and no measurable change in the aggregate service and interest components of the 2014 expense.
65
Cash flows: We expect to make the following benefit payments, which reflect expected future service, and to receive the following federal subsidy benefits as appropriate:
In thousands of dollars | Benefit Payments | ||
2015 | $ | 10,287 | |
2016 | $ | 9,109 | |
2017 | $ | 8,502 | |
2018 | $ | 8,578 | |
2019 | $ | 7,970 | |
2020-2023 | $ | 32,087 | |
The amounts above exclude the participants’ share of the benefit cost. Our policy is to fund benefits as claims, stipends and premiums are paid. We expect no subsidy benefits for 2015 and beyond.
NOTE 9
Income taxes
The provision (benefit) for income taxes consists of the following:
In thousands of dollars | |||||||||
2014 | Current | Deferred | Total | ||||||
Federal | $ | 217,500 | $ | (38,000 | ) | $ | 179,500 | ||
State and other | 5,800 | 37,200 | 43,000 | ||||||
Foreign | 1,100 | 2,000 | 3,100 | ||||||
Total | $ | 224,400 | $ | 1,200 | $ | 225,600 | |||
In thousands of dollars | |||||||||
2013 | Current | Deferred | Total | ||||||
Federal | $ | 95,000 | $ | 39,400 | $ | 134,400 | |||
State and other | (36,700 | ) | 8,000 | (28,700 | ) | ||||
Foreign | 1,000 | 6,500 | 7,500 | ||||||
Total | $ | 59,300 | $ | 53,900 | $ | 113,200 | |||
In thousands of dollars | |||||||||
2012 | Current | Deferred | Total | ||||||
Federal | $ | 82,200 | $ | 106,000 | $ | 188,200 | |||
State and other | (2,600 | ) | 17,100 | 14,500 | |||||
Foreign | (6,900 | ) | (400 | ) | (7,300 | ) | |||
Total | $ | 72,700 | $ | 122,700 | $ | 195,400 | |||
The components of net income attributable to Gannett Co., Inc. before income taxes consist of the following:
In thousands of dollars | |||||||||
2014 | 2013 | 2012 | |||||||
Domestic | $ | 1,207,669 | $ | 426,162 | $ | 538,988 | |||
Foreign | 80,102 | 75,718 | 80,692 | ||||||
Total | $ | 1,287,771 | $ | 501,880 | $ | 619,680 | |||
The provision for income taxes on varies from the U.S. federal statutory tax rate as a result of the following differences:
2014 | 2013 | 2012 | ||||
U.S. statutory tax rate | 35.0 | % | 35.0 | % | 35.0 | % |
Increase (decrease) in taxes resulting from: | ||||||
Non-deductible goodwill impairment | 1.2 | — | 5.2 | |||
State/other income taxes net of federal income tax | 3.6 | 2.7 | 2.2 | |||
Statutory rate differential and permanent differences in earnings in foreign jurisdictions | (2.0 | ) | (5.7 | ) | (5.6 | ) |
Audit resolutions | (0.1 | ) | (7.9 | ) | (4.6 | ) |
Loss on sale of subsidiary | (19.0 | ) | — | — | ||
Lapse of statutes of limitations net of federal income tax | (0.5 | ) | (2.6 | ) | (1.8 | ) |
Domestic manufacturing deduction | (1.7 | ) | (2.1 | ) | (1.7 | ) |
Other, net | 1.0 | 3.2 | 2.8 | |||
Effective tax rate | 17.5 | % | 22.6 | % | 31.5 | % |
Absent the impact of facility consolidation, asset impairment, certain gains and expenses recognized in non-operating categories and workforce restructuring charges, the special net tax benefit from the release of certain tax reserves due to audit settlements, and the lapse of statutes of limitations, all for the years from 2012 to 2014, as well as the special net tax benefit from the sale of a non-strategic subsidiary in 2014, our effective tax rate would have been 30.9% for 2014, 29.7% for 2013, and 30.9% for 2012.
Deferred income taxes reflect temporary differences in the recognition of revenue and expense for tax reporting and financial statement purposes. Deferred tax liabilities and assets are adjusted for enacted changes in tax laws or tax rates of the various tax jurisdictions. The amounts of such adjustments for 2014, 2013 and 2012 were not significant.
66
Deferred tax liabilities and assets were composed of the following at the end of 2014 and 2013:
In thousands of dollars | ||||||
Dec. 28, 2014 | Dec. 29, 2013 | |||||
Liabilities | ||||||
Accelerated depreciation | $ | 262,657 | $ | 302,650 | ||
Accelerated amortization of deductible intangibles | 589,014 | 678,744 | ||||
Partnership investments including impairments | 244,582 | — | ||||
Other | 18,961 | 24,882 | ||||
Total deferred tax liabilities | 1,115,214 | 1,006,276 | ||||
Assets | ||||||
Accrued compensation costs | 64,255 | 75,492 | ||||
Pension | 343,566 | 219,413 | ||||
Postretirement medical and life | 37,794 | 55,921 | ||||
Federal tax benefits of uncertain state tax positions | 12,135 | 12,474 | ||||
Partnership investments including impairments | — | 1,140 | ||||
Loss carryforwards | 361,133 | 74,018 | ||||
Other | 77,977 | 84,738 | ||||
Total deferred tax assets | 896,860 | 523,196 | ||||
Valuation allowance | 200,123 | 83,579 | ||||
Total net deferred tax assets (liabilities) | $ | (418,477 | ) | $ | (566,659 | ) |
Amounts recognized in Consolidated Balance Sheets | ||||||
Current deferred tax assets | $ | 158,648 | $ | 21,245 | ||
Assets held for sale | $ | 9,600 | $ | — | ||
Noncurrent deferred tax assets | $ | 63,647 | $ | — | ||
Noncurrent deferred tax liabilities | $ | (650,372 | ) | $ | (587,904 | ) |
As of Dec. 28, 2014, we had approximately $728.8 million of capital loss carryforwards for federal and state purposes which, if not used prior to 2020, will expire, and can only be utilized to the extent capital gains are recognized. As of Dec. 28, 2014, we also had approximately $16.8 million of foreign tax credits, $1.8 million of state credits, $278.4 million of foreign net operating loss carryforwards, $489.0 million of apportioned state net operating loss carryovers, and $35.3 million of foreign capital loss carryforwards. The foreign tax credits expire in various amounts beginning in 2016 through 2024, the state credits expire between 2016 and 2023 in various amounts, and the state and foreign net operating loss carryovers expire in various amounts beginning in 2015 through 2034. The foreign capital losses can be carried forward indefinitely.
Included in total deferred tax assets are valuation allowances of approximately $200.1 million in 2014 and $83.6 million in 2013, primarily related to federal and state capital losses, foreign tax credits, foreign losses and state net operating losses available for carry forward to future years. The increase in the valuation allowance from 2013 to 2014 is related primarily to the $96.3 million valuation allowance with respect to additional federal and state capital loss carryforwards for which it was determined, based on an analysis of future sources of taxable income and other sources of positive and negative evidence, it is not more likely than not that the capital losses will be utilized before their expiration.
Realization of deferred tax assets for which valuation allowances have not been established is dependent upon generating sufficient future taxable income. We expect to realize the benefit of these deferred tax assets through future reversals of our deferred tax liabilities, through the recognition of taxable income in the allowable carryback and carryforward periods, and through implementation of future tax planning strategies. Although realization is not assured, we believe it is more likely than not that all deferred tax assets for which valuation allowances have not been established will be realized.
The following table summarizes the activity related to unrecognized tax benefits, excluding the federal tax benefit of state tax deductions:
In thousands of dollars | ||||||
Dec. 28, 2014 | Dec. 29, 2013 | |||||
Change in unrecognized tax benefits | ||||||
Balance at beginning of year | $ | 57,324 | $ | 86,180 | ||
Additions based on tax positions related to the current year | 12,426 | 29,470 | ||||
Additions for tax positions of prior years | 868 | 4,710 | ||||
Reductions for tax positions of prior years | (4,563 | ) | (33,109 | ) | ||
Settlements | (129 | ) | (1,246 | ) | ||
Reductions due to lapse of statutes of limitations | (7,040 | ) | (28,681 | ) | ||
Balance at end of year | $ | 58,886 | $ | 57,324 | ||
The total amount of unrecognized tax benefits that, if recognized, would impact the effective tax rate was $46.8 million as of Dec. 28, 2014, and $46.5 million as of Dec. 29, 2013. This amount includes the federal tax benefit of state tax deductions.
We recognize interest and penalties related to unrecognized tax benefits as a component of income tax expense. We also recognize interest income attributable to overpayment of income taxes and from the reversal of interest expense previously recorded for uncertain tax positions which are subsequently released as a component of income tax expense. We recognized income from interest and the release of penalty reserves of $4.6 million in 2014, $17.2 million in 2013, and $7.8 million in 2012. The amount of accrued interest and penalties payable related to unrecognized tax benefits was $6.9 million as of Dec. 28, 2014 and $11.5 million as of Dec. 29, 2013.
We file income tax returns in the U.S. and various state and foreign jurisdictions. The 2011 through 2014 tax years remain subject to examination by the IRS. The 2010 through 2014 tax years generally remain subject to examination by state authorities, and the tax year 2014 is subject to examination in the U.K. Tax years before 2010 remain subject to examination by certain states primarily due to the filing of amended tax returns as a result of the settlement of the IRS examination for these years and due to ongoing audits.
It is reasonably possible that the amount of unrecognized benefit with respect to certain of our unrecognized tax positions will significantly increase or decrease within the next 12 months. These changes may be the result of settlement of ongoing audits, lapses of statutes of limitations or other regulatory developments. At this time, we estimate the amount of our gross unrecognized tax positions may decrease by up to approximately $4.8 million within the next 12 months primarily due to lapses of statutes of limitations and settlement of ongoing audits in various jurisdictions.
67
NOTE 10
Shareholders’ equity
Capital stock and earnings per share
Our earnings per share (basic and diluted) for 2014, 2013, and 2012 are presented below:
In thousands, except per share amounts | |||||||||
2014 | 2013 | 2012 | |||||||
Net income attributable to Gannett Co., Inc. | $ | 1,062,171 | $ | 388,680 | $ | 424,280 | |||
Weighted average number of common shares outstanding (basic) | 226,292 | 228,541 | 232,327 | ||||||
Effect of dilutive securities | |||||||||
Restricted stock | 2,624 | 2,839 | 2,552 | ||||||
Performance shares | 1,999 | 1,649 | 944 | ||||||
Stock options | 992 | 1,160 | 867 | ||||||
Weighted average number of common shares outstanding (diluted) | 231,907 | 234,189 | 236,690 | ||||||
Earnings per share (basic) | $ | 4.69 | $ | 1.70 | $ | 1.83 | |||
Earnings per share (diluted) | $ | 4.58 | $ | 1.66 | $ | 1.79 | |||
The diluted earnings per share amounts exclude the effects of approximately 0.8 million stock options outstanding for 2014, 2.4 million for 2013 and 6.5 million for 2012, as their inclusion would be antidilutive.
Share repurchase program
In June 2013, we announced that our Board of Directors approved a new program to repurchase up to $300 million in our common stock. During 2014, 2.7 million shares were purchased under the current program for $75.8 million. In 2013, 4.9 million shares were purchased under the current and former programs for $116.6 million and in 2012, 10.3 million shares were purchased for $153.9 million. Repurchased shares are included in the Consolidated Balance Sheets as Treasury Stock. As of Dec. 28, 2014, the value of shares that may be repurchased under the existing program is $148.9 million. This share repurchase program was temporarily suspended upon the announcement of the Cars.com acquisition in 2014, but was re-initiated in February of 2015, well ahead of the timeline we had previously anticipated, as a result of our strong operating performance and the strength of our balance sheet.
The shares may be repurchased at management’s discretion, either in the open market or in privately negotiated block transactions. Management’s decision to repurchase shares will depend on price and other corporate developments. Purchases may occur from time to time and no maximum purchase price has been set. There is no expiration date for the $300 million stock repurchase program. Certain of the shares we previously acquired have been reissued in settlement of employee stock awards.
Equity-based awards
In May 2001, our shareholders approved the adoption of the Omnibus Incentive Compensation Plan (the Plan). The Plan is administered by the Executive Compensation Committee of the Board of Directors and was amended and restated as of May 4, 2010, to increase the number of shares reserved for issuance to up to 60.0 million shares of our common stock for awards granted on or after the amendment date. The Plan provides for the granting of stock options, stock appreciation rights, restricted stock, restricted stock units, performance shares and other equity-based and cash-based awards. Awards may be granted to our employees and members of the Board of Directors. The Plan provides that shares of common stock subject to awards granted become available again for issuance if such awards are canceled or forfeited.
During 2011, we established a performance share award plan for senior executives pursuant to which awards were first made with a grant date of Jan. 1, 2012. Pursuant to the terms of this award, we may issue shares of our common stock (Performance Shares) to senior executives following the completion of a three-year period beginning on the grant date. Generally, if an executive remains in continuous employment with us during the full three-year incentive period, the number of performance share units (PSU) that an executive will receive will be determined based upon how our total shareholder return (TSR) compares to the TSR of a peer group of media companies during the three-year period. The PSU agreement provides for pro rata vesting if an executive’s employment terminates before the end of the performance period due to death, disability, retirement, as defined in the award agreement. Non-vested units are forfeited upon termination for any other reason. Long-term equity awards – consisting of performance shares and restricted stock units – are generally made with a grant date of January 1.
The fair value and compensation expense of each PSU is determined on date of grant by using a Monte Carlo valuation model. Each PSU is equal to and paid in one share of our common stock, but carries no voting or dividend rights. The number of shares ultimately issued for each PSU award may range from 0% to 200% of the award’s target.
We issue stock-based compensation to employees in the form of restricted stock units (RSUs). These awards generally entitle employees to receive at the end of a four-year incentive period one share of common stock for each RSU granted, conditioned on continued employment for the full incentive period. RSUs generally vest on a pro rata basis if an executive’s employment terminates due to death, disability or retirement. For RSU grants after 2014, the grants generally vest 25% per year. Under the plan, no more than 500,000 RSUs may be granted to any participant in any fiscal year.
The Plan also permits us to issue restricted stock. Restricted Stock is an award of common stock that is subject to restrictions and such other terms and conditions as the Executive Compensation Committee determines. Under the Plan, no more than 500,000 restricted shares may be granted to any participant in any fiscal year.
The Plan also permits us to issue stock options. Stock options may be granted as either non-qualified stock options or incentive stock options. Options may be granted to purchase our common stock at not less than 100% of the fair market value on the day of grant. Options may be exercisable at such times and subject to such terms and conditions as the Executive Compensation Committee determines. The Plan restricts the granting of options to any participant in any fiscal year to no more than 1,000,000 shares. Options issued from 1996 through November 2004 have a 10-year exercise period, and options issued in December 2004 and thereafter have an eight-year exercise period. Options generally become exercisable at 25% per year. We discontinued annual stock option grants to senior executives when we began issuing Performance Shares.
68
We issued stock options to certain members of our Board of Directors as compensation for meeting fees and retainer fees, as well as long-term awards. Meeting fees paid as stock options fully vest upon grant. Retainers paid in the form of stock options vest in equal quarterly installments over one year. Long-term stock option awards vest in equal annual installments over four years. Expense is recognized on a straight-line basis over the vesting period based on the grant date fair value. Members of the Board of Directors were awarded no stock options as part of their compensation in 2014, 22,558 shares in 2013 and 74,611 shares in 2012. We ceased issuing stock options to members of the Board of Directors in May 2013.
We issued restricted stock to certain members of our Board of Directors as compensation for meeting fees and retainer fees, as well as annual long-term awards. Meeting fees paid as restricted stock fully vest upon grant. Retainers paid in the form of restricted shares vest in equal quarterly installments over one year. Long-term awards vest in equal monthly installments over three years. Expense is recognized on a straight-line basis over the vesting period based on the grant date fair value. Members of the Board of Directors were awarded 40,530 shares of restricted stock in 2014, 57,531 shares in 2013 and 31,929 shares in 2012, as part of their compensation plan. All vested shares will be issued to directors when they retire from the Board.
The Executive Compensation Committee may grant other types of awards that are valued in whole or in part by reference to or that are otherwise based on fair market value of our common stock or other criteria established by the Executive Compensation Committee including the achievement of performance goals. The maximum aggregate grant of Performance Shares that may be awarded to any participant in any fiscal year shall not exceed 500,000 shares of common stock. The maximum aggregate amount of performance units or cash-based awards that may be awarded to any participant in any fiscal year shall not exceed $10 million.
In the event of a change in control as defined in the Plan, unless otherwise specified in the award agreement, (1) all outstanding options will become immediately exercisable in full; (2) all restricted periods and restrictions imposed on non-performance based restricted stock awards will lapse; (3) all non-performance based restricted stock units will fully vest; and (4) target payment opportunities attainable under all outstanding awards of performance-based restricted stock, performance units and Performance Shares will be paid as specified in the Plan.
Determining fair value
Valuation and amortization method – We determined the fair value of Performance Shares using the Monte Carlo valuation model. This model considers our likelihood, and the likelihood of our peer group companies’, share prices ending at various levels subject to certain price caps at the conclusion of the three-year incentive period. We determined the fair value of stock options using the Black-Scholes option-pricing formula. Key inputs into the Monte Carlo valuation model and the Black-Scholes option-pricing formula include expected term, expected volatility, risk-free interest rate and expected dividend yield. Each assumption is discussed below.
Expected term – The expected term represents the period that our stock-based awards are expected to be outstanding. The expected term for Performance Share awards is based on the incentive period. For stock options, it is determined based on historical experience of similar awards, considering contractual terms of the awards, vesting schedules and expectations of future employee behavior.
Expected volatility – The fair value of stock-based awards reflects volatility factors calculated using historical market data for our common stock and also our peer group when the Monte Carlo method is used. The time frame used is equal to the expected term.
Risk-free interest rate – We base the risk-free interest rate on the yield to maturity at the time of the award grant on zero-coupon U.S. government bonds having a remaining life equal to the award’s expected life.
Expected dividend – The dividend assumption is based on our expectations about our dividend policy on the date of grant.
Estimated forfeitures – When estimating forfeitures, we consider voluntary termination behavior as well as analysis of actual forfeitures.
The following assumptions were used to estimate the fair value of performance share awards and stock options:
Performance Shares Granted During | 2014 | 2013 | 2012 |
Expected term | 3 yrs. | 3 yrs. | 3 yrs. |
Expected volatility | 39.32% | 40.80% | 69.47% |
Risk-free interest rate | 0.78% | 0.36% | 0.41% |
Expected dividend yield | 2.70% | 4.44% | 2.39% |
Stock Options Granted During(a) | 2013 | 2012 | |
Average expected term | 4.5 yrs. | 4.5 yrs. | |
Expected volatility | 61.94% | 65.74 - 66.95% | |
Weighted average volatility | 61.94% | 66.56% | |
Risk-free interest rates | 0.75% | 0.84% | |
Expected dividend yield | 3.00% | 5.00% | |
Weighted average expected dividend | 3.00% | 5.00% | |
(a) No stock options were granted after 2013 | |||
Stock-based Compensation Expense: The following table shows the stock-based compensation related amounts recognized in the Consolidated Statements of Income for equity awards:
In thousands, except per share amounts | |||||||||
2014 | 2013 | 2012 | |||||||
Restricted stock and RSUs | $ | 17,754 | $ | 18,105 | $ | 14,362 | |||
Performance shares | 14,850 | 12,331 | 7,991 | ||||||
Stock options and other | 1,278 | 3,001 | 4,255 | ||||||
Total stock-based compensation | 33,882 | 33,437 | 26,608 | ||||||
Income tax benefit | 12,875 | 12,706 | 10,111 | ||||||
Stock-based compensation, net of tax | $ | 21,007 | $ | 20,731 | $ | 16,497 | |||
Per diluted share impact | $ | 0.09 | $ | 0.09 | $ | 0.07 | |||
69
Restricted Stock and RSUs: As of Dec. 28, 2014, there was $30.2 million of unrecognized compensation cost related to non-vested restricted stock and RSUs. This amount will be adjusted for future changes in estimated forfeitures and recognized on a straight-line basis over a weighted average period of 2.4 years. The tax benefit realized from the settlement of RSUs was $9.5 million in 2014. The tax benefit realized in 2013 was $7.0 million and $5.4 million in 2012.
A summary of restricted stock and RSU awards is presented below:
2014 Restricted Stock and RSU Activity | Shares | Weighted average fair value | |||
Outstanding and unvested at beginning of year | 4,193,985 | $ | 13.92 | ||
Granted | 1,048,516 | $ | 27.26 | ||
Settled | (1,263,702 | ) | $ | 15.92 | |
Canceled | (401,201 | ) | $ | 16.13 | |
Outstanding and unvested at end of year | 3,577,598 | $ | 16.97 | ||
2013 Restricted Stock and RSU Activity | Shares | Weighted average fair value | |||
Outstanding and unvested at beginning of year | 4,069,509 | $ | 12.98 | ||
Granted | 1,588,628 | $ | 15.80 | ||
Settled | (1,035,256 | ) | $ | 13.95 | |
Canceled | (428,896 | ) | $ | 13.40 | |
Outstanding and unvested at end of year | 4,193,985 | $ | 13.92 | ||
2012 Restricted Stock and RSU Activity | Shares | Weighted average fair value | |||
Outstanding and unvested at beginning of year | 3,731,033 | $ | 10.73 | ||
Granted | 1,937,512 | $ | 12.33 | ||
Settled | (997,584 | ) | $ | 3.29 | |
Canceled | (601,452 | ) | $ | 11.95 | |
Outstanding and unvested at end of year | 4,069,509 | $ | 12.98 | ||
Performance Shares: As of Dec. 28, 2014, there was $8.1 million of unrecognized compensation cost related to non-vested performance shares. This amount will be adjusted for future changes in estimated forfeitures and recognized over a weighted average period of 1.7 years.
A summary of our performance shares awards is presented below:
2014 Performance Shares Activity | Target number of shares | Weighted average fair value | |||
Outstanding and unvested at beginning of year | 1,760,488 | $ | 16.92 | ||
Granted | 436,340 | $ | 37.31 | ||
Canceled | (96,713 | ) | $ | 21.41 | |
Outstanding and unvested at end of year | 2,100,115 | $ | 20.95 | ||
2013 Performance Shares Activity | Target number of shares | Weighted average fair value | |||
Outstanding and unvested at beginning of year | 982,452 | $ | 14.23 | ||
Granted | 813,783 | $ | 20.12 | ||
Canceled | (35,747 | ) | $ | 15.86 | |
Outstanding and unvested at end of year | 1,760,488 | $ | 16.92 | ||
2012 Performance Shares Activity | Target number of shares | Weighted average fair value | |||
Outstanding and unvested at beginning of year | — | $ | — | ||
Granted | 1,109,873 | $ | 14.21 | ||
Canceled | (127,421 | ) | $ | 14.12 | |
Outstanding and unvested at end of year | 982,452 | $ | 14.23 | ||
Stock Options: During 2014, options were exercised from which we received $14.2 million of cash. The intrinsic value of the options exercised was approximately $15.0 million. The actual tax benefit realized from the option exercises was $3.0 million.
During 2013, options were exercised from which we received $21.7 million of cash. The intrinsic value of the options exercised was approximately $16.7 million. The actual tax benefit realized from the option exercises was $2.8 million.
During 2012, options exercised from which we received $24.5 million of cash. The intrinsic value of the options exercised was approximately $21.3 million. The actual tax benefit realized from the option exercises was $3.9 million.
Option exercises are satisfied through the issuance of shares from treasury stock.
The total grant date fair value for options vested during 2014 was $6.0 million, $8.6 million for options vested during 2013 and $11.6 million for options vested during 2012.
70
A summary of our stock option awards is presented below:
2014 Stock Option Activity | Shares | Weighted average exercise price | Weighted average remaining contractual term (in years) | Aggregate intrinsic value | |||||
Outstanding at beginning of year | 5,575,401 | $ | 29.76 | 3.2 | $ | 46,988,804 | |||
Exercised | (968,891 | ) | $ | 14.47 | |||||
Canceled/expired | (1,599,852 | ) | $ | 53.89 | |||||
Outstanding at end of year | 3,006,658 | $ | 21.84 | 2.8 | $ | 37,497,113 | |||
Options exercisable at year end | 2,818,658 | $ | 22.23 | 2.7 | $ | 34,543,513 | |||
2013 Stock Option Activity | Shares | Weighted average exercise price | Weighted average remaining contractual term (in years) | Aggregate intrinsic value | ||||||
Outstanding at beginning of year | 11,344,018 | $ | 43.50 | 3.2 | $ | 16,902,892 | ||||
Granted | 22,558 | $ | 20.48 | |||||||
Exercised | (1,598,902 | ) | $ | 13.44 | ||||||
Canceled/expired | (4,192,273 | ) | $ | 73.11 | ||||||
Outstanding at end of year | 5,575,401 | $ | 29.76 | 3.2 | $ | 46,988,804 | ||||
Options exercisable at year end | 4,574,619 | $ | 32.85 | 2.8 | $ | 33,348,296 | ||||
Weighted average grant date fair value of options granted during the year | $ | 8.20 | ||||||||
2012 Stock Option Activity | Shares | Weighted average exercise price | Weighted average remaining contractual term (in years) | Aggregate intrinsic value | ||||||
Outstanding at beginning of year | 20,340,291 | $ | 47.66 | 3.5 | $ | 17,184,761 | ||||
Granted | 109,699 | $ | 14.33 | |||||||
Exercised | (2,716,637 | ) | $ | 9.38 | ||||||
Canceled/expired | (6,389,335 | ) | $ | 70.76 | ||||||
Outstanding at end of year | 11,344,018 | $ | 43.50 | 3.2 | $ | 16,902,892 | ||||
Options exercisable at year end | 8,942,897 | $ | 51.35 | 2.6 | $ | 8,845,944 | ||||
Weighted average grant date fair value of options granted during the year | $ | 5.43 | ||||||||
Accumulated other comprehensive income (loss)
The elements of our Accumulated Other Comprehensive Loss consisted of pension, retiree medical and life insurance liabilities and foreign currency translation gains. The following tables summarize the components of, and changes in, Accumulated Other Comprehensive Loss (net of tax and noncontrolling interests):
In thousands of dollars | |||||||||
2014 | Retirement Plans | Foreign Currency Translation | Total | ||||||
Balance at beginning of year | $ | (921,232 | ) | $ | 427,177 | $ | (494,055 | ) | |
Other comprehensive income before reclassifications | (276,219 | ) | (36,064 | ) | (312,283 | ) | |||
Amounts reclassified from accumulated other comprehensive income | 27,569 | — | 27,569 | ||||||
Balance at end of year | $ | (1,169,882 | ) | $ | 391,113 | $ | (778,769 | ) | |
In thousands of dollars | |||||||||
2013 | Retirement Plans | Foreign Currency Translation | Total | ||||||
Balance at beginning of year | $ | (1,119,263 | ) | $ | 418,122 | $ | (701,141 | ) | |
Other comprehensive income (loss) | 156,974 | 9,055 | 166,029 | ||||||
Amounts reclassified from accumulated other comprehensive income | 41,057 | — | 41,057 | ||||||
Balance at end of year | $ | (921,232 | ) | $ | 427,177 | $ | (494,055 | ) | |
In thousands of dollars | |||||||||
2012 | Retirement Plans | Foreign Currency Translation | Total | ||||||
Balance at beginning of year | $ | (995,854 | ) | $ | 400,015 | $ | (595,839 | ) | |
Other comprehensive income (loss) | (123,409 | ) | 18,107 | (105,302 | ) | ||||
Balance at end of year | $ | (1,119,263 | ) | $ | 418,122 | $ | (701,141 | ) | |
Accumulated Other Comprehensive Loss components are included in the computation of net periodic postretirement costs (see Notes 7 and 8 for more detail). Reclassifications out of Accumulated Other Comprehensive Loss related to these postretirement plans include the following:
In thousands of dollars | ||||||
2014 | 2013 | |||||
Amortization of prior service credit | $ | (4,082 | ) | $ | (1,599 | ) |
Amortization of actuarial loss | 46,489 | 64,381 | ||||
Settlement charge | — | 3,077 | ||||
Total reclassifications, before tax | 42,407 | 65,859 | ||||
Income tax effect | (14,838 | ) | (24,802 | ) | ||
Total reclassifications, net of tax | $ | 27,569 | $ | 41,057 | ||
71
NOTE 11
Commitments, contingent liabilities and other matters
Litigation: We, along with a number of our subsidiaries, are defendants in judicial and administrative proceedings involving matters incidental to their business. We do not believe that any material liability will be imposed as a result of these matters.
Leases: Approximate future minimum annual rentals payable under non-cancelable operating leases, primarily real-estate related, are as follows:
In thousands of dollars | |||
2015 | $ | 64,309 | |
2016 | 55,292 | ||
2017 | 49,209 | ||
2018 | 36,550 | ||
2019 | 30,057 | ||
Later years | 96,036 | ||
Total | $ | 331,453 | |
Total minimum annual rentals have not been reduced for future minimum sublease rentals aggregating $6.1 million. Total rental costs reflected in 2014 were $67.5 million, $58.4 million in 2013 and $64.6 million in 2012.
Program broadcast contracts: We have $213.5 million of commitments under programming contracts that include television station commitments to purchase programming to be produced in future years. This also includes amounts fixed or currently accrued under network affiliation agreements.
Purchase obligations: We have commitments under purchasing obligations totaling $240.9 million related to printing contracts, capital projects, interactive marketing agreements, wire services and other legally binding commitments. Amounts which we are liable for under purchase orders outstanding at Dec. 28, 2014, are reflected in the Consolidated Balance Sheet as accounts payable and accrued liabilities and are excluded from the $240.9 million.
Self insurance: We are self-insured for most of our employee medical coverage and for our casualty, general liability and libel coverage (subject to a cap above which third party insurance is in place). The liabilities are established on an actuarial basis, with the advice of consulting actuaries, and totaled $80.4 million at the end of 2014 and $92.0 million at the end of 2013.
Other matters: In December 1990, we adopted a Transitional Compensation Plan (the TCP). The TCP provides termination benefits to key executives whose employment is terminated under certain circumstances within two years following a change in control of our company. Benefits under the TCP include a severance payment of up to three years’ compensation and continued life and medical insurance coverage. We amended the TCP in April 2010 to provide that new participants will not be entitled to the benefit of the TCP’s excise tax gross-up or modified single trigger provisions.
In August 2014, we adopted the Gannett Leadership Team Transition Severance Plan (GLT Plan) to promote retention and minimize disruption for certain senior executives in connection with the potential spin-off of our publishing segment into a new, independent publicly traded company.
In March 2011, the Advertiser Company, one of our subsidiaries which publishes The Montgomery Advertiser, was notified by the U.S. EPA that it has been identified as a potentially responsible party for the investigation and remediation of groundwater contamination in downtown Montgomery, AL. At this point in the investigation, incomplete information is available about the site, other potentially responsible parties and what further investigation and remediation may be required. Accordingly, future costs at the site, and The Advertiser Company’s share of such costs, if any, are undetermined. Some of The Advertiser Company’s fees and costs related to this matter may be reimbursed under its liability insurance policies.
In 2014, we exited one of our publishing businesses and incurred $21.0 million of shutdown costs included in Selling, general and administrative expenses, exclusive of depreciation in the Consolidated Statements of Income. These costs, which are associated with future contractual promotional payments, were accrued on our Consolidated Balance Sheet at the end of 2014 and will be primarily paid in 2015.
We are contingently liable for earnout payments to previous owners, depending upon the achievement of certain financial and performance metrics related to certain business acquisitions. During 2014, we paid $22.4 million as the result of payments and adjustments to fair value.
72
NOTE 12
Fair value measurement
We measure and record certain assets and liabilities at fair value in the accompanying consolidated financial statements. ASC Topic 820, “Fair Value Measurement,” establishes a fair value hierarchy for those instruments measured at fair value that distinguishes between assumptions based on market data (observable inputs) and our own assumptions (unobservable inputs). The hierarchy consists of three levels:
Level 1 – Quoted market prices in active markets for identical assets or liabilities;
Level 2 – Inputs other than Level 1 inputs that are either directly or indirectly observable; and
Level 3 – Unobservable inputs developed using our own estimates and assumptions, which reflect those that a market participant would use.
The financial instruments measured at fair value in the accompanying Consolidated Balance Sheets consist of the following:
Company Owned Assets | ||||||||||||
In thousands of dollars | ||||||||||||
Fair value measurement as of Dec. 28, 2014 | ||||||||||||
Level 1 | Level 2 | Level 3 | Total | |||||||||
Assets: | ||||||||||||
Employee compensation related investments | $ | 41,017 | $ | — | $ | — | $ | 41,017 | ||||
Sundry investments | 36,641 | — | — | 36,641 | ||||||||
Total Assets | $ | 77,658 | $ | — | $ | — | $ | 77,658 | ||||
Liabilities: | ||||||||||||
Contingent consideration payable | $ | — | $ | — | $ | 9,912 | $ | 9,912 | ||||
Total Liabilities | $ | — | $ | — | $ | 9,912 | $ | 9,912 | ||||
In thousands of dollars | ||||||||||||
Fair value measurement as of Dec. 29, 2013 | ||||||||||||
Level 1 | Level 2 | Level 3 | Total | |||||||||
Assets: | ||||||||||||
Employee compensation related investments | $ | 28,117 | $ | — | $ | — | $ | 28,117 | ||||
Sundry investments | 34,227 | — | — | 34,227 | ||||||||
Total Assets | $ | 62,344 | $ | — | $ | — | $ | 62,344 | ||||
Liabilities: | ||||||||||||
Contingent consideration payable | $ | — | $ | — | $ | 32,267 | $ | 32,267 | ||||
Total Liabilities | $ | — | $ | — | $ | 32,267 | $ | 32,267 | ||||
Under certain acquisition agreements, we have agreed to pay the sellers earn-outs based on the financial performance of the acquired businesses. Contingent consideration payable in the table above represents the estimated fair value of future earn-outs payable under such agreements. The fair value of the contingent payments was measured based on the present value of the consideration expected to be transferred. The discount rate is a significant unobservable input in such present value computations. Discount rates ranged between 15% and 27% depending on the risk associated with the cash flows. Changes to the fair value of earn-outs are reflected in “Selling, general and administrative expenses” on our Condensed Consolidated Statements of Income. For the year ended Dec. 28, 2014, the contingent consideration decreased by $22.4 million as a result of payments and adjustments to fair value.
The following tables set forth by level within the fair value hierarchy the fair values of our pension plans assets:
Pension Plan Assets/Liabilities | ||||||||||||
In thousands of dollars | ||||||||||||
Fair value measurement as of Dec. 28, 2014(a) | ||||||||||||
Level 1 | Level 2 | Level 3 | Total | |||||||||
Assets: | ||||||||||||
Fixed income: | ||||||||||||
U.S. government-related securities | $ | — | $ | 4,005 | $ | — | $ | 4,005 | ||||
Mortgage backed securities | — | 3,995 | 95 | 4,090 | ||||||||
Other government bonds | — | 4,562 | — | 4,562 | ||||||||
Corporate bonds | — | 24,628 | 382 | 25,010 | ||||||||
Corporate stock | 924,294 | — | — | 924,294 | ||||||||
Real estate | — | — | 109,102 | 109,102 | ||||||||
Interest in common/collective trusts: | ||||||||||||
Equities | — | 890,201 | — | 890,201 | ||||||||
Fixed income | 6,592 | 310,128 | — | 316,720 | ||||||||
Interest in reg. invest. companies | 152,359 | 44,406 | — | 196,765 | ||||||||
Interest in 103-12 investments | — | 24,359 | — | 24,359 | ||||||||
Partnership/joint venture interests | — | 36,517 | 145,764 | 182,281 | ||||||||
Hedge funds | — | 20,166 | 325,673 | 345,839 | ||||||||
Derivative contracts | 8 | 3,003 | 124 | 3,135 | ||||||||
Total | $ | 1,083,253 | $ | 1,365,970 | $ | 581,140 | $ | 3,030,363 | ||||
Liabilities: | ||||||||||||
Derivative liabilities | $ | (13 | ) | $ | (2,529 | ) | $ | (2,008 | ) | $ | (4,550 | ) |
Total | $ | (13 | ) | $ | (2,529 | ) | $ | (2,008 | ) | $ | (4,550 | ) |
Cash and other | 14,039 | 2,662 | — | 16,701 | ||||||||
Total net fair value of plan assets | $ | 1,097,279 | $ | 1,366,103 | $ | 579,132 | $ | 3,042,514 | ||||
(a) | We use a Dec. 31 measurement date for our retirement plans. |
73
In thousands of dollars | ||||||||||||
Fair value measurement as of Dec. 29, 2013(a) | ||||||||||||
Level 1 | Level 2 | Level 3 | Total | |||||||||
Assets: | ||||||||||||
Fixed income: | ||||||||||||
U.S. government-related securities | $ | — | $ | 3,313 | $ | — | $ | 3,313 | ||||
Mortgage backed securities | — | 4,210 | 397 | 4,607 | ||||||||
Other government bonds | — | 4,947 | — | 4,947 | ||||||||
Corporate bonds | — | 29,599 | 856 | 30,455 | ||||||||
Corporate stock | 892,883 | — | — | 892,883 | ||||||||
Real estate | — | — | 98,909 | 98,909 | ||||||||
Interest in common/collective trusts: | ||||||||||||
Equities | — | 908,673 | — | 908,673 | ||||||||
Fixed income | — | 213,698 | — | 213,698 | ||||||||
Interest in reg. invest. companies | 281,029 | 42,610 | — | 323,639 | ||||||||
Interest in 103-12 investments | — | 28,691 | — | 28,691 | ||||||||
Partnership/joint venture interests | — | 36,402 | 148,550 | 184,952 | ||||||||
Hedge funds | — | 22,685 | 249,991 | 272,676 | ||||||||
Derivative contracts | 22 | 10,956 | 163 | 11,141 | ||||||||
Total | $ | 1,173,934 | $ | 1,305,784 | $ | 498,866 | $ | 2,978,584 | ||||
Liabilities: | ||||||||||||
Derivative liabilities | $ | (8 | ) | $ | (9,486 | ) | $ | (2,008 | ) | $ | (11,502 | ) |
Total | $ | (8 | ) | $ | (9,486 | ) | $ | (2,008 | ) | $ | (11,502 | ) |
Cash and other | 60,271 | 1,114 | — | 61,385 | ||||||||
Total net fair value of plan assets | $ | 1,234,197 | $ | 1,297,412 | $ | 496,858 | $ | 3,028,467 | ||||
(a) | We use a Dec. 31 measurement date for our retirement plans. |
Items included in “Cash and other” in the table above primarily consist of amounts categorized as cash and cash equivalents and pending purchases and sales of securities.
Valuation methodologies used for assets and liabilities measured at fair value are as follows:
U.S. government-related securities are treasury bonds, bills and notes that are primarily obligations to the U.S. Treasury. Values are obtained from industry vendors who use various pricing models or quotes for identical or similar securities. Mortgage-backed securities are typically not actively quoted. Values are obtained from industry vendors who use various pricing models or use quotes for identical or similar securities.
Other government and corporate bonds are mainly valued based on institutional bid evaluations using proprietary models, using discounted cash flow models or models that derive prices based on similar securities. Corporate bonds categorized in Level 3 are primarily from distressed issuers for whom the values represent an estimate of recovery in a potential or actual bankruptcy situation.
Corporate stock classified as Level 1 is valued primarily at the closing price reported on the active market on which the individual securities are traded. The investments in Level 2 are primarily commingled funds recorded at fair value as determined by the sponsor of the respective funds based upon closing market quotes of the underlying assets.
Investments in direct real estate have been valued by an independent qualified valuation professional in the U.K. using a valuation approach that capitalizes any current or future income streams at an appropriate multiplier. Investments in real estate funds are mainly valued utilizing the net asset valuations provided by the underlying private investment companies.
Interest in common/collective trusts and interest in 103-12 investments are valued using the net asset value as provided monthly by the fund family or fund company. Shares in the common/collective trusts are generally redeemable upon request.
Nine of the investments in collective trusts are fixed income funds, one of which uses individual subfunds to efficiently add a representative sample of securities in individual market sectors to the portfolio. The remaining twelve investments in collective trusts are equity funds that are recorded at fair value as determined by the sponsor of the respective fund based upon closing market quotes of the underlying assets.
Interest in registered investment companies is valued using the published net asset values as quoted through publicly available pricing sources. The investments in Level 2 are proprietary funds of the individual fund managers and are not publicly quoted.
Investments in partnerships and joint venture interests classified in Level 3 are valued based on an assessment of each underlying investment, considering items such as expected cash flows, changes in market outlook and subsequent rounds of financing. These investments are included in Level 3 of the fair value hierarchy because exit prices tend to be unobservable and reliance is placed on the above methods. Most of the partnerships are general leveraged buyout funds, others include a venture capital fund, a fund formed to invest in special credit opportunities, an infrastructure fund and a real estate fund. Interest in partnership investments could be sold on the secondary market but cannot be redeemed. Instead, distributions are received as the underlying assets of the funds are liquidated. It is estimated that the underlying assets of the funds will be liquidated within approximately the next 8 to 10 years. There are future funding commitments of $22.9 million as of Dec. 28, 2014, and $27.7 million as of Dec. 29, 2013. Investments in partnerships and joint venture interests classified as Level 2 represents a limited partnership commingled fund valued using the net asset value as reported by the fund manager.
74
Investments in hedge funds are valued at the net asset value as reported by the fund managers. Within this category is a fund of hedge funds whose objective is to produce a return that is uncorrelated with market movements. Other funds categorized as hedge funds were formed to invest in mortgage and credit trading opportunities. Shares in the hedge funds are generally redeemable twice a year or on the last business day of each quarter with at least 60 days written notice subject to potential 5% holdback. There are no unfunded commitments related to the hedge funds.
Derivatives primarily consist of forward and swap contracts. Forward contracts are valued at the spot rate, plus or minus forward
points between the valuation date and maturity date. Swaps are valued at the mid-evaluation price using discounted cash flow models. Items in Level 3 are valued based on the market values of other securities for which they represent a synthetic combination.
We review appraised valued, audited financial statements and additional information to evaluate fair value estimates from our investment managers or fund administrator. The tables below set forth a summary of changes in the fair value of our pension plan assets and liabilities, categorized as Level 3, for the fiscal year ended Dec. 28, 2014, and Dec. 29, 2013:
Pension Plan Assets/Liabilities | ||||||||||||||||||
In thousands of dollars | ||||||||||||||||||
For the year ended Dec. 28, 2014 | ||||||||||||||||||
Actual Return on Plan Assets | ||||||||||||||||||
Balance at beginning of year | Relating to assets still held at report date | Relating to assets sold during the period | Purchases, sales, and settlements | Transfers in and/or out of Level 3(1) | Balance at end of year | |||||||||||||
Assets: | ||||||||||||||||||
Fixed income: | ||||||||||||||||||
Mortgage-backed securities | $ | 397 | $ | — | $ | 2 | $ | (304 | ) | $ | — | $ | 95 | |||||
Corporate bonds | 856 | 116 | (125 | ) | (465 | ) | — | 382 | ||||||||||
Real estate | 98,909 | 279 | — | 9,914 | — | 109,102 | ||||||||||||
Partnership/joint venture interests | 148,550 | 586 | 21,785 | (25,157 | ) | — | 145,764 | |||||||||||
Hedge funds | 249,991 | 10,469 | 899 | 64,314 | — | 325,673 | ||||||||||||
Derivative contracts | 163 | — | 17 | (56 | ) | — | 124 | |||||||||||
Total | $ | 498,866 | $ | 11,450 | $ | 22,578 | $ | 48,246 | $ | — | $ | 581,140 | ||||||
Liabilities: | ||||||||||||||||||
Derivative liabilities | $ | (2,008 | ) | $ | — | $ | — | $ | — | $ | — | $ | (2,008 | ) | ||||
(1) | Our policy is to recognize transfers in and transfers out as of the beginning of the reporting period. |
Pension Plan Assets/Liabilities (continued) | ||||||||||||||||||
In thousands of dollars | ||||||||||||||||||
For the year ended Dec. 29, 2013 | ||||||||||||||||||
Actual Return on Plan Assets | ||||||||||||||||||
Balance at beginning of year | Relating to assets still held at report date | Relating to assets sold during the period | Purchases, sales, and settlements | Transfers in and/or out of Level 3(1) | Balance at end of year | |||||||||||||
Assets: | ||||||||||||||||||
Fixed income: | ||||||||||||||||||
Mortgage backed securities | $ | — | $ | — | $ | (3 | ) | $ | 400 | $ | — | $ | 397 | |||||
Corporate bonds | 797 | 199 | (4 | ) | (136 | ) | — | 856 | ||||||||||
Real estate | 97,385 | 1,865 | — | (341 | ) | — | 98,909 | |||||||||||
Partnership/joint venture interests | 130,995 | 11,972 | 13,327 | (9,576 | ) | 1,832 | 148,550 | |||||||||||
Hedge funds | 158,924 | 17,613 | 803 | 74,483 | (1,832 | ) | 249,991 | |||||||||||
Derivative contracts | 500 | (376 | ) | — | 39 | — | 163 | |||||||||||
Total | $ | 388,601 | $ | 31,273 | $ | 14,123 | $ | 64,869 | $ | — | $ | 498,866 | ||||||
Liabilities: | ||||||||||||||||||
Derivative liabilities | $ | (2,008 | ) | $ | — | $ | — | $ | — | $ | — | $ | (2,008 | ) | ||||
(1) | Our policy is to recognize transfers in and transfers out as of the beginning of the reporting period. |
75
The fair value of our total long-term debt, determined based on the bid and ask quotes for the related debt (Level 2), totaled $4.65 billion at Dec. 28, 2014. The fair value of our total long-term debt, determined based on the bid and ask quotes for the related debt (Level 2), totaled $3.93 billion at Dec. 29, 2013. Certain assets are measured at fair value on a nonrecurring basis; that is, the instruments are not measured at fair value on an ongoing basis but are subject to fair value adjustments only in certain circumstances (for example, when there is evidence of impairment).
The following tables summarize the non-financial assets measured at fair value on nonrecurring basis in the accompanying consolidated balance sheet as of Dec. 28, 2014, and Dec. 29, 2013:
Non-Financial Assets | ||||||||||||
In thousands of dollars | ||||||||||||
Fair value measurement as of Dec. 28, 2014 | ||||||||||||
Level 1 | Level 2 | Level 3 | Total | |||||||||
Asset held for sale - Quarter 4 | $ | — | $ | — | $ | 69,998 | $ | 69,998 | ||||
Goodwill - Quarter 4 | $ | — | $ | — | $ | 8,250 | $ | 8,250 | ||||
Non-Financial Assets | ||||||||||||
In thousands of dollars | ||||||||||||
Fair value measurement as of Dec. 29, 2013 | ||||||||||||
Level 1 | Level 2 | Level 3 | Total | |||||||||
Asset held for sale - Quarter 4 | $ | — | $ | — | $ | 395,851 | $ | 395,851 | ||||
Goodwill - Quarter 4 | $ | — | $ | — | $ | 21,790 | $ | 21,790 | ||||
The quantitative test of goodwill during the fourth quarter of 2014 for a reporting unit in our Digital Segment was based on a valuation that considered discounted cash flows and market-based information. Significant unobservable inputs in the discounted cash flows method included the ending year growth rate of 2% and the discount rate applied to the cash flows of 17.5%. If the growth rate and discount rate were to change by 1%, the impact to the valuation would have been approximately $2.8 million.
The quantitative test of goodwill during 2013 for both impaired assets was based on a valuation that considered discounted cash flows and market-based information. Significant unobservable inputs in the discounted cash flows method included the ending year growth rate of 3% and the discount rate applied to the cash flows of 16.0% for the impaired asset in our Digital Segment. For the impaired asset in our Publishing Segment, the ending year growth rate of 3% and discount rate of 20.5% were significant unobservable inputs in the discount cash flow method. If the growth rate and discount rate were to change by 1%, the combined impact to the valuations would have been approximately $1.4 million and $2.7 million, respectively.
NOTE 13
Business operations and segment information
We have determined that our reportable segments based on our management and internal reporting structure are Broadcasting, Publishing, and Digital.
At the end of 2014, our Broadcasting Segment included 46 television stations and affiliated online sites, including stations serviced by Gannett under shared services and similar agreements. These stations serve more than 35 million households covering almost one-third of the U.S. population.
Our Publishing Segment includes 100 daily publications and digital platforms in the U.S. and U.K., including more than 400 non-daily publications in the U.S. and more than 125 such titles in the U.K. The Publishing Segment also includes Clipper, Gannett Government Media, a network of offset presses for commercial printing and several small businesses.
The largest businesses within our Digital Segment are CareerBuilder, Cars.com, PointRoll and Shoplocal. The Digital Segment and the digital revenues line exclude online/digital revenues generated by digital platforms that are associated with our publishing and broadcasting operating properties. Such amounts are reflected within those segments and are included as part of publishing revenues and broadcasting revenues in the Consolidated Statements of Income.
Our foreign revenues, principally from publishing businesses in the United Kingdom and CareerBuilder’s international subsidiaries, totaled approximately $539.3 million in 2014, $519.8 million in 2013 and $546.2 million in 2012. Our long-lived assets in foreign countries, principally in the United Kingdom, totaled approximately $498.3 million at Dec. 28, 2014, $566.4 million at Dec. 29, 2013, and $529.8 million at Dec. 30, 2012.
Separate financial data for each of our business segments is presented in the table that follows. The accounting policies of the segments are those described in Note 1. We evaluate the performance of our segments based on operating income. Operating income represents total revenue less operating expenses, including depreciation, amortization of intangibles and facility consolidation and asset impairment charges. In determining operating income by industry segment, general corporate expenses, interest expense, interest income, and other income and expense items of a non-operating nature are not considered, as such items are not allocated to our segments.
Corporate assets include cash and cash equivalents, property, plant and equipment used for corporate purposes and certain other financial investments.
76
In thousands of dollars Business segment financial information | |||||||||
2014 | 2013 | 2012 | |||||||
Operating revenues | |||||||||
Broadcasting | $ | 1,692,304 | $ | 835,113 | $ | 906,104 | |||
Publishing | 3,421,729 | 3,577,804 | 3,728,144 | ||||||
Digital | 919,270 | 748,445 | 718,949 | ||||||
Intersegment eliminations (3) | (25,129 | ) | — | — | |||||
Total | $ | 6,008,174 | $ | 5,161,362 | $ | 5,353,197 | |||
Operating income | |||||||||
Broadcasting (2) | $ | 745,383 | $ | 361,915 | $ | 443,808 | |||
Publishing (2) | 228,307 | 313,697 | 368,644 | ||||||
Digital (2) | 155,482 | 128,264 | 41,700 | ||||||
Corporate (1) (2) | (71,141 | ) | (64,633 | ) | (64,397 | ) | |||
Total | $ | 1,058,031 | $ | 739,243 | $ | 789,755 | |||
Depreciation, amortization and facility consolidation and asset impairment charges | |||||||||
Broadcasting (2) | $ | 94,125 | $ | 29,625 | $ | 28,007 | |||
Publishing (2) | 167,134 | 153,380 | 147,750 | ||||||
Digital (2) | 81,974 | 46,415 | 123,990 | ||||||
Corporate (1) (2) | 18,855 | 18,392 | 16,421 | ||||||
Total | $ | 362,088 | $ | 247,812 | $ | 316,168 | |||
Equity income (losses) in unconsolidated investees, net | |||||||||
Broadcasting | $ | (1,667 | ) | $ | (94 | ) | $ | (597 | ) |
Publishing (4) | 10,646 | 18,724 | 2,855 | ||||||
Digital (4) | 158,340 | 25,194 | 20,129 | ||||||
Total | $ | 167,319 | $ | 43,824 | $ | 22,387 | |||
Identifiable assets | |||||||||
Broadcasting | $ | 4,773,481 | $ | 5,077,114 | $ | 2,001,979 | |||
Publishing (4) | 2,154,368 | 2,573,384 | 2,830,083 | ||||||
Digital (4) | 3,602,494 | 1,041,622 | 1,030,653 | ||||||
Corporate (1) | 675,112 | 548,586 | 517,171 | ||||||
Total | $ | 11,205,455 | $ | 9,240,706 | $ | 6,379,886 | |||
Capital expenditures | |||||||||
Broadcasting | $ | 42,147 | $ | 18,394 | $ | 17,473 | |||
Publishing | 81,776 | 62,480 | 56,597 | ||||||
Digital | 36,395 | 27,800 | 17,220 | ||||||
Corporate (1) | 1,556 | 1,733 | 584 | ||||||
Total | $ | 161,874 | $ | 110,407 | $ | 91,874 | |||
(1) | Corporate amounts represent those not directly related to our three business segments. |
(2) | Results for 2014 include pre-tax facility consolidation and asset impairment charges of $14 million for Broadcasting, $59 million for Publishing, and $24 million for Digital. Results for 2013 include pre-tax facility consolidation and asset impairment charges of $1 million for Broadcasting, $46 million for Publishing, and $12 million for Digital. Results for 2012 include pre-tax facility consolidation and asset impairment charges of $32 million for Publishing and $90 million for Digital. Refer to Notes 3 and 4 of the Consolidated Financial Statements for more information. |
(3) | Includes intersegment eliminations of $5 million for Publishing and $20 million for Digital. |
(4) | Publishing and Digital amounts for 2013 and 2012 have been reclassified to reflect the acquisition of Cars.com. |
77
SELECTED FINANCIAL DATA (Unaudited)
(See notes a and b on page 79)
In thousands of dollars, except per share amounts | 2014 | 2013 | 2012 | 2011 | 2010 | ||||||||||
Operating revenue | $ | 6,008,174 | $ | 5,161,362 | $ | 5,353,197 | $ | 5,239,989 | $ | 5,438,678 | |||||
Operating expenses | |||||||||||||||
Costs and expenses | 4,588,055 | 4,174,307 | 4,247,274 | 4,184,582 | 4,168,098 | ||||||||||
Depreciation | 185,868 | 153,203 | 160,746 | 165,739 | 182,514 | ||||||||||
Amortization of intangible assets | 79,856 | 36,369 | 33,293 | 31,634 | 31,362 | ||||||||||
Facility consolidation and asset impairment charges | 96,364 | 58,240 | 122,129 | 27,243 | 57,009 | ||||||||||
Total | 4,950,143 | 4,422,119 | 4,563,442 | 4,409,198 | 4,438,983 | ||||||||||
Operating income | 1,058,031 | 739,243 | 789,755 | 830,791 | 999,695 | ||||||||||
Non-operating (expense) income | |||||||||||||||
Equity income in unconsolidated investees, net | 167,319 | 43,824 | 22,387 | 8,197 | 19,140 | ||||||||||
Interest expense | (273,244 | ) | (176,064 | ) | (150,469 | ) | (173,140 | ) | (172,986 | ) | |||||
Other non-operating items | 403,954 | (47,890 | ) | 8,734 | (12,921 | ) | 111 | ||||||||
Total | 298,029 | (180,130 | ) | (119,348 | ) | (177,864 | ) | (153,735 | ) | ||||||
Income before income taxes | 1,356,060 | 559,113 | 670,407 | 652,927 | 845,960 | ||||||||||
Provision for income taxes | 225,600 | 113,200 | 195,400 | 152,800 | 244,013 | ||||||||||
Income from continuing operations | 1,130,460 | 445,913 | 475,007 | 500,127 | 601,947 | ||||||||||
Income from continuing operations attributable to noncontrolling interests | (68,289 | ) | (57,233 | ) | (50,727 | ) | (41,379 | ) | (34,619 | ) | |||||
Income from continuing operations attributable to Gannett Co., Inc. | $ | 1,062,171 | $ | 388,680 | $ | 424,280 | $ | 458,748 | $ | 567,328 | |||||
Income from continuing operations per share: | |||||||||||||||
basic | $ | 4.69 | $ | 1.70 | $ | 1.83 | $ | 1.92 | $ | 2.38 | |||||
diluted | $ | 4.58 | $ | 1.66 | $ | 1.79 | $ | 1.89 | $ | 2.35 | |||||
Other selected financial data | |||||||||||||||
Dividends declared per share | $ | 0.80 | $ | 0.80 | $ | 0.80 | $ | 0.24 | $ | 0.16 | |||||
Non-GAAP income from continuing operations per diluted share (1) | $ | 2.73 | $ | 2.02 | $ | 2.33 | $ | 2.13 | $ | 2.44 | |||||
Weighted average number of common shares outstanding in thousands: | |||||||||||||||
basic | 226,292 | 228,541 | 232,327 | 239,228 | 238,230 | ||||||||||
diluted | 231,907 | 234,189 | 236,690 | 242,768 | 241,605 | ||||||||||
Financial position and cash flow | |||||||||||||||
Long-term debt, excluding current maturities | $ | 4,488,028 | $ | 3,707,010 | $ | 1,432,100 | $ | 1,760,363 | $ | 2,352,242 | |||||
Redeemable noncontrolling interest | $ | 20,470 | $ | 14,618 | $ | 10,654 | $ | — | $ | 84,176 | |||||
Shareholders’ equity | $ | 3,254,914 | $ | 2,693,098 | $ | 2,350,614 | $ | 2,327,891 | $ | 2,163,754 | |||||
Total assets | $ | 11,205,455 | $ | 9,240,706 | $ | 6,379,886 | $ | 6,616,450 | $ | 6,816,844 | |||||
Free cash flow (2) | $ | 844,628 | $ | 470,491 | $ | 697,994 | $ | 775,261 | $ | 816,308 | |||||
Return on equity (3) | 35.7% | 15.4 | % | 18.1 | % | 20.4 | % | 30.1 | % | ||||||
Percentage increase (decrease) | |||||||||||||||
As reported, earnings from continuing operations per share: | |||||||||||||||
basic | 175.9 | % | (7.1 | %) | (4.7 | %) | (19.3 | %) | 58.7 | % | |||||
diluted | 175.9 | % | (7.3 | %) | (5.3 | %) | (19.6 | %) | 57.7 | % | |||||
Dividends declared per share | — | % | — | % | 233.3 | % | 50.0 | % | — | % | |||||
Credit ratios | |||||||||||||||
Leverage ratio (4) | 2.96x | 3.24x | 1.41x | 1.67x | 1.97x | ||||||||||
Times interest expense earned (5) | 4.5x | 4.9x | 6.4x | 5.5x | 6.2x | ||||||||||
(1) | See page 34 for a reconciliation of income from continuing operations per share presented in accordance with GAAP. |
(2) | See page 79 for a reconciliation of free cash flow to net cash flow from operating activities, which we believe is the most directly comparable measure calculated and presented in accordance with GAAP. |
(3) | Calculated using income from continuing operations attributable to Gannett Co., Inc. plus earnings from discontinued operations (but excluding the gain in 2010 on the disposal of publishing businesses). |
(4) | The leverage ratio is calculated in accordance with our revolving credit agreement and term loan agreement. Currently, we are required to maintain a leverage ratio of less than 4.0x. These agreements are described more fully on page 41 in Management’s Discussion and Analysis of Financial Condition and Results of Operations. More information regarding the computation can be found in Exhibit 10.3 to the Form 10-Q for the quarterly period ended Sept. 29, 2013, filed on Nov. 6, 2013. |
(5) | Calculated using operating income adjusted to remove the effect of certain special items. These special items are described more fully beginning on page 34 in Management’s Discussion and Analysis of Financial Condition and Results of Operations. |
78
NOTES TO SELECTED FINANCIAL DATA (Unaudited)
(a)We, along with our subsidiaries, made the significant acquisitions listed below during the period. The results of operations of these acquired businesses are included in the accompanying financial information from the date of acquisition.
(b)During the period, we sold or otherwise disposed of substantially all of the assets or capital stock of certain other significant subsidiaries and divisions of other subsidiaries, which are listed below.
Note 2 of the consolidated financial statements contains further information concerning certain of these acquisitions and dispositions.
Acquisitions and dispositions 2010-2014
Significant acquisitions and dispositions since the beginning of 2010 are shown below.
Acquisitions 2010-2014
Year | Name | Location | Publication times or business |
2010 | CareerSite.biz Limited | U.K. | Online recruitment niche sites focusing on nursing and rail workers. |
2011 | Reviewed.com | Cambridge, MA | A technology product review web site |
JobsCentral | Singapore | Job search, employment and career web site | |
Nutrition Dimension | Falls Church, VA | A continuing nutrition education, certification and review program | |
US PRESSWIRE | Atlanta, GA | A digital sports photography business | |
JobScout24 | Germany | Job search, employment and career web site | |
MMA Junkie | St. Petersburg, FL | Independent sports information web site | |
2012 | Fantasy Sports Ventures/Big Lead Sports | New York, NY | Independent digital sports property |
Ceviu | Brazil | Information technology job board | |
Top Language Jobs | Europe | Global online jobsite for multi-language jobs and candidates | |
Quickish | Bethesda, MD | Aggregator that offers a summary and a link for sports stories | |
BLiNQ Media, LLC | New York City, NY | Social engagement advertising solutions for agencies and brands | |
Mobestream Media | Dallas, TX | Developer of the Key Ring consumer rewards mobile platform | |
Economic Modeling Specialist Intl. | Moscow, ID | Economic software firm specializing in employment data/analysis | |
Rovion | Boston, MA | Self-service technology platform for rich media | |
2013 | 10Best, Inc. | Greenville, SC | Travel advice services for travelers in the U.S. and internationally |
Vietnam Online Network | Vietnam | Recruitment services and human resource solutions for employers | |
Oil and Gas Job Search | Manchester, England | Online recruitment catering to the oil and gas industry | |
Tripology | McLean, VA | Offers an interactive travel referral service | |
Belo Corp. | Arizona, Idaho, Kentucky, Louisiana, Missouri, North Carolina, Oregon, Texas, Virginia, Washington | Owner and operator of 20 television stations in 15 markets across the U.S. | |
2014 | Broadbean | London, United Kingdom | Global recruitment technology company |
London Broadcasting Company | Abilene, Beaumont, Bryan, Corpus Christi, Longview, Port Arthur, San Angelo, Sweetwater, Temple, Tyler, Waco all in Texas | Six Texas based television stations | |
Classified Ventures LLC (d/b/a Cars.com) | Chicago, IL | Independent search site for car shoppers | |
SocialReferral B.V. | Netherlands | Software to power employee referral programs utilizing social media | |
Dispositions 2010-2014
Year | Name | Location | Publication times or business |
2010 | The Honolulu Advertiser | Honolulu, HI | Daily newspaper |
Michigan Directory Company | Pigeon, MI | Directory publishing operation | |
2013 | Captivate Network, Inc. | Chelmsford, MA | News and entertainment network |
2014 | KMOV-TV | St. Louis, MO | Broadcast station |
KTVK/KASW-TV | Phoenix, AZ | Broadcast stations | |
Schedule Star | Wheeling , WV | High School athletic management and scheduling software | |
Free cash flow reconciliation
Our free cash flow was $844.6 million for the year ended Dec. 28, 2014. Free cash flow is a non-GAAP liquidity measure that is defined as “net cash flow from operating activities” as reported on the Consolidated Statements of Cash Flows reduced by “purchase of property, plant and equipment” as well as “payments for investments” and increased by “proceeds from investments” and voluntary pension contributions, net of related tax benefit. We believe that free cash flow is a useful measure for management and investors to evaluate the level of cash generated by operations and the ability of its operations to fund investments in new and existing businesses, return cash to shareholders under our capital program, repay indebtedness, add to our cash balance, or to use in other discretionary activities.
Reconciliations from “Net cash flow from operating activities” to “Free cash flow” follow:
In thousands of dollars | 2014 | 2013 | 2012 | 2011 | 2010 | ||||||||||
Net cash flow from operating activities | $ | 821,199 | $ | 511,488 | $ | 756,740 | $ | 814,136 | $ | 772,884 | |||||
Purchase of property, plant and equipment | (150,354 | ) | (110,407 | ) | (91,874 | ) | (72,451 | ) | (69,070 | ) | |||||
Voluntary pension employer contributions | — | 15,507 | — | — | 130,000 | ||||||||||
Tax benefit for voluntary pension employer contributions | — | (6,125 | ) | — | — | (52,000 | ) | ||||||||
Payments for investments | (7,026 | ) | (3,380 | ) | (2,501 | ) | (19,406 | ) | (10,984 | ) | |||||
Proceeds from investments | 180,809 | 63,408 | 35,629 | 52,982 | 45,478 | ||||||||||
Free cash flow | $ | 844,628 | $ | 470,491 | $ | 697,994 | $ | 775,261 | $ | 816,308 | |||||
79
QUARTERLY STATEMENTS OF INCOME (Unaudited) | |||||||||||||||
In thousands of dollars, except per share amounts | |||||||||||||||
Fiscal year ended Dec. 28, 2014 | 1st Quarter(1) | 2nd Quarter(2) | 3rd Quarter(3) | 4th Quarter(4) | Total | ||||||||||
Operating revenues | $ | 1,404,066 | $ | 1,460,004 | $ | 1,443,137 | $ | 1,700,967 | $ | 6,008,174 | |||||
Operating expenses | |||||||||||||||
Cost of sales and operating expenses, exclusive of depreciation | 767,532 | 775,627 | 757,301 | 748,119 | 3,048,579 | ||||||||||
Selling, general and administrative expenses, exclusive of depreciation | 355,213 | 353,779 | 347,123 | 483,361 | 1,539,476 | ||||||||||
Depreciation | 44,764 | 44,850 | 46,681 | 49,573 | 185,868 | ||||||||||
Amortization of intangible assets | 17,743 | 14,471 | 14,894 | 32,748 | 79,856 | ||||||||||
Facility consolidation and asset impairment charges | 14,820 | 28,775 | 6,621 | 46,148 | 96,364 | ||||||||||
Total | 1,200,072 | 1,217,502 | 1,172,620 | 1,359,949 | 4,950,143 | ||||||||||
Operating income | 203,994 | 242,502 | 270,517 | 341,018 | 1,058,031 | ||||||||||
Non-operating (expense) income | |||||||||||||||
Equity income in unconsolidated investees, net | 8,491 | 156,540 | 1,756 | 532 | 167,319 | ||||||||||
Interest expense | (69,648 | ) | (64,148 | ) | (65,931 | ) | (73,517 | ) | (273,244 | ) | |||||
Other non-operating items | (20,748 | ) | (2,982 | ) | (17,450 | ) | 445,134 | 403,954 | |||||||
Total | (81,905 | ) | 89,410 | (81,625 | ) | 372,149 | 298,029 | ||||||||
Income before income taxes | 122,089 | 331,912 | 188,892 | 713,167 | 1,356,060 | ||||||||||
Provision for income taxes | 52,500 | 106,000 | 48,900 | 18,200 | 225,600 | ||||||||||
Net income | 69,589 | 225,912 | 139,992 | 694,967 | 1,130,460 | ||||||||||
Net income attributable to noncontrolling interests | (10,430 | ) | (17,445 | ) | (21,476 | ) | (18,938 | ) | (68,289 | ) | |||||
Net income attributable to Gannett Co., Inc. | $ | 59,159 | $ | 208,467 | $ | 118,516 | $ | 676,029 | $ | 1,062,171 | |||||
Per share computations | |||||||||||||||
Net income per share—basic | $ | 0.26 | $ | 0.92 | $ | 0.52 | $ | 2.99 | $ | 4.69 | |||||
Net income per share—diluted | $ | 0.25 | $ | 0.90 | $ | 0.51 | $ | 2.92 | $ | 4.58 | |||||
Dividends per share | $ | 0.20 | $ | 0.20 | $ | 0.20 | $ | 0.20 | $ | 0.80 | |||||
(1) | Results for the first quarter of 2014 include special charges affecting operating income. Workforce restructuring and transformation costs totaled $22.8 million ($13.4 million after-tax or $.06 per share). Non-operating items include $20.4 million ($12.1 million after-tax or $.05 per share) primarily related to the redemption of our 2017 notes. Offsetting these was a $23.8 million special tax charge ($.10 per share) related to the sale of the KMOV-TV station in St. Louis, MO. Refer to the discussion beginning on page 34 and Notes 3 and 4 to the Consolidated Financial Statements for more information on special items. |
(2) | Results for the second quarter of 2014 include special charges affecting operating income. Workforce restructuring charges, transformation costs and non-cash asset impairments totaled $51.7 million ($37.4 million after-tax or $.02 per share). Non-operating items include $143.5 million ($91.2 million after-tax or $.39 per share) primarily related to the pre-tax gain from the sale of Apartments.com. Refer to the discussion beginning on page 34 and Notes 3 and 4 to the Consolidated Financial Statements for more information on special items. |
(3) | Results for the third quarter of 2014 include special charges affecting operating income. Workforce restructuring charges and transformation costs totaled $9.6 million ($7.2 million after-tax or $.03 per share). Non-operating items include $20.5 million ($16.2 million after-tax or $.07 per share) primarily related to transaction costs. Special tax items include a tax benefit of $5.6 million ($.02 per share). Refer to the discussion beginning on page 34 and Notes 3 and 4 to the Consolidated Financial Statements for more information on special items. |
(4) | Results for the fourth quarter of 2014 include special charges affecting operating income. Workforce restructuring charges, transformation costs and non-cash asset impairments totaled $87.2 million ($57.7 million after tax or $.03 per share). Non-operating items include $439.2 million ($262.3 million after-tax or $1.13 per share) primarily related to the write-up of our equity investment in Cars.com offset partially by transaction related costs. Special tax items include a tax benefit of $236.6 million ($1.02 per share) related to the sale of an investment. Refer to the discussion beginning on page 34 and Notes 3 and 4 to the Consolidated Financial Statements for more information on special items. |
80
QUARTERLY STATEMENTS OF INCOME (Unaudited) | |||||||||||||||
In thousands of dollars, except per share amounts | |||||||||||||||
Fiscal year ended Dec. 29, 2013 | 1st Quarter(1) | 2nd Quarter(2) | 3rd Quarter(3) | 4th Quarter(4) | Total | ||||||||||
Operating revenues | $ | 1,237,735 | $ | 1,302,699 | $ | 1,252,890 | $ | 1,368,038 | $ | 5,161,362 | |||||
Operating expenses | |||||||||||||||
Cost of sales and operating expenses, exclusive of depreciation | 719,724 | 726,869 | 713,369 | 722,487 | 2,882,449 | ||||||||||
Selling, general and administrative expenses, exclusive of depreciation | 314,115 | 320,615 | 315,677 | 341,451 | 1,291,858 | ||||||||||
Depreciation | 38,926 | 38,467 | 38,195 | 37,615 | 153,203 | ||||||||||
Amortization of intangible assets | 9,128 | 9,368 | 8,071 | 9,802 | 36,369 | ||||||||||
Facility consolidation and asset impairment charges | 4,785 | 4,498 | 5,880 | 43,077 | 58,240 | ||||||||||
Total | 1,086,678 | 1,099,817 | 1,081,192 | 1,154,432 | 4,422,119 | ||||||||||
Operating income | 151,057 | 202,882 | 171,698 | 213,606 | 739,243 | ||||||||||
Non-operating (expense) income | |||||||||||||||
Equity income in unconsolidated investees, net | 7,794 | 9,424 | 11,711 | 14,895 | 43,824 | ||||||||||
Interest expense | (35,405 | ) | (36,174 | ) | (41,628 | ) | (62,857 | ) | (176,064 | ) | |||||
Other non-operating items | (1,583 | ) | (9,791 | ) | (17,580 | ) | (18,936 | ) | (47,890 | ) | |||||
Total | (29,194 | ) | (36,541 | ) | (47,497 | ) | (66,898 | ) | (180,130 | ) | |||||
Income before income taxes | 121,863 | 166,341 | 124,201 | 146,708 | 559,113 | ||||||||||
Provision for income taxes | 5,400 | 39,600 | 26,700 | 41,500 | 113,200 | ||||||||||
Net income | 116,463 | 126,741 | 97,501 | 105,208 | 445,913 | ||||||||||
Net income attributable to noncontrolling interests | (11,898 | ) | (13,121 | ) | (17,753 | ) | (14,461 | ) | (57,233 | ) | |||||
Net income attributable to Gannett Co., Inc. | $ | 104,565 | $ | 113,620 | $ | 79,748 | $ | 90,747 | $ | 388,680 | |||||
Per share computations(5) | |||||||||||||||
Net income per share—basic | $ | 0.46 | $ | 0.50 | $ | 0.35 | $ | 0.40 | $ | 1.70 | |||||
Net income per share—diluted | $ | 0.44 | $ | 0.48 | $ | 0.34 | $ | 0.39 | $ | 1.66 | |||||
Dividends per share | $ | 0.20 | $ | 0.20 | $ | 0.20 | $ | 0.20 | $ | 0.80 | |||||
(1) | Results for the first quarter of 2013 include special charges affecting operating income. Workforce restructuring and transformation costs totaled $10.2 million ($6.2 million after-tax or $.03 per share). Non-operating items include $3.7 million ($3.1 million after-tax or $.01 per share) primarily related to a currency related loss and a non-cash impairment charge relating to an investment accounted for under the equity method. Offsetting these was tax benefits of $27.8 million ($.12 per share) related to the reserve releases as a result of federal exam resolution and the lapse of a statute of limitations. Refer to the discussion beginning on page 34 and Notes 3 and 4 to the Consolidated Financial Statements for more information on special items. |
(2) | Results for the second quarter of 2013 include special charges affecting operating income. Workforce restructuring charges and transformation costs totaled $26.2 million ($15.8 million after-tax or $.07 per share). Non-operating items include $9.5 million ($5.7 million after-tax or $.02 per share) of transformation costs related to our acquisition of Belo. Refer to the discussion beginning on page 34 and Notes 3 and 4 to the Consolidated Financial Statements for more information on special items. |
(3) | Results for the third quarter of 2013 include special charges affecting operating income. Workforce restructuring charges and transformation costs totaled $15.1 million ($9.2 million after-tax or $.04 per share). Non-operating items include $21.0 million ($10.8 million after-tax or $.05 per share) related to the loss from the change in control and sale of interests in a business as well transformation costs related to our acquisition of Belo. Refer to the discussion beginning on page 34 and Notes 3 and 4 to the Consolidated Financial Statements for more information on special items. |
(4) | Results for the fourth quarter of 2013 include special charges affecting operating income. Workforce restructuring charges, transformation costs and non-cash asset impairments totaled $64.6 million ($40.8 million after tax or $.18 per share). Non-operating items include $21.0 million ($20.9 million after-tax or $.09 per share) of charges primarily related to our acquisition of Belo. Refer to the discussion beginning on page 34 and Notes 3 and 4 to the Consolidated Financial Statements for more information on special items. |
(5) | As a result of rounding and the required method of computing shares in interim periods, the total of the quarterly earnings per share amounts may not equal the earnings per share amount of the year. |
81
SCHEDULE II – Valuation and qualifying accounts and reserves
In thousands of dollars | |||||||||||||||
Allowance for doubtful receivables | Balance at beginning of period | Additions charged to cost and expenses | Additions/(reductions) for acquisitions/ dispositions (1) | Deductions from reserves (2) | Balance at end of period | ||||||||||
Fiscal year ended Dec. 28, 2014 | $ | 15,275 | $ | 13,029 | $ | 2,031 | $ | (13,837 | ) | $ | 16,498 | ||||
Fiscal year ended Dec. 29, 2013 | $ | 22,006 | $ | 11,519 | $ | (385 | ) | $ | (17,865 | ) | $ | 15,275 | |||
Fiscal year ended Dec. 30, 2012 | $ | 34,646 | $ | 9,736 | $ | 24 | $ | (22,400 | ) | $ | 22,006 | ||||
(1) | Includes foreign currency translation adjustments in each year. |
(2) | Consists of write-offs, net of recoveries in each year. |
ITEM 9.CHANGES IN AND DISAGREEMENTS WITH ACCOUNTANTS ON ACCOUNTING AND FINANCIAL DISCLOSURE
None.
ITEM 9A. CONTROLS AND PROCEDURES
Conclusion Regarding the Effectiveness of Disclosure Controls and Procedures
Under the supervision and with the participation of our management, including our principal executive officer and principal financial officer, we conducted an evaluation of our disclosure controls and procedures, as such term is defined under Rule 13a-15(e) promulgated under the Securities Exchange Act of 1934, as amended (the Exchange Act). Based on this evaluation, our principal executive officer and our principal financial officer concluded that our disclosure controls and procedures were effective as of the end of the period covered by this annual report.
Management’s Report on Internal Control Over Financial Reporting
Our management is responsible for establishing and maintaining adequate internal control over financial reporting, as such term is defined in Exchange Act Rule 13a-15(f). Under the supervision and with the participation of our management, including our principal executive officer and principal financial officer, we conducted an evaluation of the effectiveness of our internal control over financial reporting based on the framework in Internal Control - Integrated Framework (2013 framework) issued by the Committee of Sponsoring Organizations of the Treadway Commission. Based on our evaluation, our management concluded that our internal control over financial reporting was effective as of Dec. 28, 2014.
Management’s assessment of and conclusion on the effectiveness of internal control over financial reporting did not include the internal controls of Cars.com, which is included in the 2014 consolidated financial statements of Gannett Co., Inc. On Oct. 1, 2014, we completed our acquisition of Cars.com. In connection with this, we began consolidating results of Cars.com and it represented approximately 1% of our total assets at Dec. 28, 2014, and 2% of our total revenue for the year ended Dec. 28, 2014. Due to the timing of this acquisition and as permitted by SEC guidance, management excluded Cars.com from its Dec. 28, 2014, assessment of internal control over financial reporting.
The effectiveness of our internal control over financial reporting as of Dec. 28, 2014, has been audited by Ernst & Young LLP, an independent registered public accounting firm, as stated in its report which is included elsewhere in this item.
Changes in Internal Control Over Financial Reporting
There has been no change in our internal control over financial reporting that occurred during our fiscal quarter ended Dec. 28, 2014, that has materially affected, or is reasonably likely to materially affect, our internal control over financial reporting.
82
Report of Independent Registered Public Accounting Firm
Board of Directors and Shareholders of Gannett Co., Inc.:
We have audited Gannett Co., Inc.’s internal control over financial reporting as of December 28, 2014, based on criteria established in Internal Control-Integrated Framework issued by the Committee of Sponsoring Organizations of the Treadway Commission (2013 framework) (the COSO criteria). Gannett’s management is responsible for maintaining effective internal control over financial reporting, and for its assessment of the effectiveness of internal control over financial reporting included in the accompanying Management’s Report on Internal Control Over Financial Reporting. Our responsibility is to express an opinion on the company’s internal control over financial reporting based on our audit.
We conducted our audit in accordance with the standards of the Public Company Accounting Oversight Board (United States). Those standards require that we plan and perform the audit to obtain reasonable assurance about whether effective internal control over financial reporting was maintained in all material respects. Our audit included obtaining an understanding of internal control over financial reporting, assessing the risk that a material weakness exists, testing and evaluating the design and operating effectiveness of internal control based on the assessed risk, and performing such other procedures as we considered necessary in the circumstances. We believe that our audit provides a reasonable basis for our opinion.
A company’s internal control over financial reporting is a process designed to provide reasonable assurance regarding the reliability of financial reporting and the preparation of financial statements for external purposes in accordance with generally accepted accounting principles. A company’s internal control over financial reporting includes those policies and procedures that (1) pertain to the maintenance of records that, in reasonable detail, accurately and fairly reflect the transactions and dispositions of the assets of the company; (2) provide reasonable assurance that transactions are recorded as necessary to permit preparation of financial statements in accordance with generally accepted accounting principles, and that receipts and expenditures of the company are being made only in accordance with authorizations of management and directors of the company; and (3) provide reasonable assurance regarding prevention or timely detection of unauthorized acquisition, use, or disposition of the company’s assets that could have a material effect on the financial statements.
Because of its inherent limitations, internal control over financial reporting may not prevent or detect misstatements. Also, projections of any evaluation of effectiveness to future periods are subject to the risk that controls may become inadequate because of changes in conditions, or that the degree of compliance with the policies or procedures may deteriorate.
As indicated in the accompanying Management’s Report on Internal Control Over Financial Reporting, management’s assessment of and conclusion on the effectiveness of internal control over financial reporting did not include the internal controls of Cars.com, which is included in the 2014 consolidated financial statements of Gannett Co., Inc. and constituted 1 percent of total assets as of December 28, 2014 and 2 percent of the company’s total revenue for the year ended December 28, 2014. Our audit of internal control over financial reporting of Gannett Co., Inc. also did not include an evaluation of the internal control over financial reporting of Cars.com.
In our opinion, Gannett Co., Inc. maintained, in all material respects, effective internal control over financial reporting as of December 28, 2014, based on the COSO criteria.
We also have audited, in accordance with the standards of the Public Company Accounting Oversight Board (United States), the 2014 consolidated financial statements of Gannett Co., Inc. and our report dated February 25, 2015 expressed an unqualified opinion thereon.
/s/ Ernst & Young LLP
McLean, Virginia
February 25, 2015
83
PART III
ITEM 10. DIRECTORS, EXECUTIVE OFFICERS AND CORPORATE GOVERNANCE
The information captioned “Your Board of Directors,” “Information about Directors - The Board’s Nominees,” “Committees of the Board of Directors,” “Committee Charters” and “Ethics Policy” under the heading “PROPOSAL 1 –ELECTION OF DIRECTORS” and the information under “SECTION 16(A) BENEFICIAL OWNERSHIP REPORTING COMPIANCE” in our 2015 proxy statement is incorporated herein by reference.
William A. Behan
Senior Vice President, Labor Relations, Gannett (2010-present). Formerly: Vice President, Labor Relations (2007-2010). Age 56.
Robert J. Dickey
President, U.S. Community Publishing, (February 2008-present). Formerly: Senior Group President, Gannett’s Pacific Group and Chairman of Phoenix Newspapers Inc. (2005-2008). Age 57
Victoria D. Harker
Chief Financial Officer (July 2012-present). Formerly: Executive Vice President, Chief Financial Officer and President of Global Business Services, AES Corporation (2006-2012). Age 50.
Larry S. Kramer
President and Publisher, USA TODAY (May 2012-present). Formerly: Professor of Media Management, Newhouse School of Communications, Syracuse University (2009-2012); Senior Advisor, Polaris Venture Partners (2008-2010); President of CBS Digital Media (2005-2006) and Advisor to CBS (2006-2008); and Chairman, CEO and Founder, MarketWatch, Inc. (1997-2005). Age 64.
Kevin E. Lord
Senior Vice President and Chief Human Resources Officer (October 2012-present). Formerly: Executive Vice President, Human Resources, NBC News (2007-2012). Age 52.
David T. Lougee
President, Gannett Broadcasting (July 2007-present). Age 56.
Gracia C. Martore
President and Chief Executive Officer (October 2011-present). Formerly: President and Chief Operating Officer (February 2010-October 2011); Executive Vice President and CFO (2006-2010). Age 63.
Todd A. Mayman
Senior Vice President, General Counsel and Secretary (April 2009-present). Formerly: Vice President, Associate General Counsel, Secretary and Chief Governance Officer (2007-2009). Age 55.
David A. Payne
Senior Vice President and Chief Digital Officer, Gannett (2011-present). Formerly: President and CEO, ShortTail Media, Inc. (2008-2011); and Senior Vice President and General Manager, CNN.com (2004-2008). Age 52.
John A. Williams
President, Gannett Digital Ventures (January 2008-present). Age 64.
ITEM 11. EXECUTIVE COMPENSATION
The information captioned “EXECUTIVE COMPENSATION,” “DIRECTOR COMPENSATION,” “OUTSTANDING DIRECTOR EQUITY AWARDS AT FISCAL YEAR-END” AND “PROPOSAL 1–ELECTION OF DIRECTORS – Compensation Committee Interlocks and Insider Participation; Related Transactions” in our 2015 proxy statement is incorporated herein by reference.
ITEM 12. SECURITY OWNERSHIP OF CERTAIN BENEFICIAL OWNERS AND MANAGEMENT AND RELATED STOCKHOLDER MATTERS
The information captioned “EQUITY COMPENSATION PLAN INFORMATION” and “SECURITIES BENEFICIALLY OWNED BY DIRECTORS, EXECUTIVE OFFICERS AND PRINCIPAL SHAREHOLDERS” in our 2015 proxy statement is incorporated herein by reference.
ITEM 13. CERTAIN RELATIONSHIPS AND RELATED TRANSACTIONS, AND DIRECTOR INDEPENDENCE
The information captioned “Director Independence” and “Compensation Committee Interlocks and Insider Participation; Related Transactions” under the heading “PROPOSAL 1 – ELECTION OF DIRECTORS” in our 2015 proxy statement is incorporated herein by reference.
ITEM 14. PRINCIPAL ACCOUNTANT FEES AND SERVICES
The information captioned “PROPOSAL 1 – ELECTION OF DIRECTORS – Report of the Audit Committee” in our 2015 proxy statement is incorporated herein by reference.
PART IV
ITEM 15. EXHIBITS AND FINANCIAL STATEMENT SCHEDULES
(a) | Financial Statements, Financial Statement Schedules and Exhibits. |
(1)Financial Statements.
As listed in the Index to Financial Statements and Supplementary Data on page 44.
(2)Financial Statement Schedules.
As listed in the Index to Financial Statements and Supplementary Data on page 44.
Note: All other schedules are omitted as the required information is not applicable or the information is presented in the consolidated financial statements or related notes.
(3)Exhibits.
See Exhibit Index on pages 86-90 for list of exhibits filed with this Form 10-K. Management contracts and compensatory plans or arrangements are identified with asterisks on the Exhibit Index.
84
SIGNATURES
Pursuant to the requirements of Section 13 or 15(d) of the Securities Exchange Act of 1934, the registrant has duly caused this report to be signed on its behalf by the undersigned thereunto duly authorized.
Dated: February 25, 2015 | GANNETT CO., INC. (Registrant) | ||
By: | /s/ Victoria D. Harker | ||
Victoria D. Harker, | |||
Chief Financial Officer | |||
(principal financial officer) | |||
Pursuant to the requirements of the Securities Exchange Act of 1934, this report has been signed below by the following persons on behalf of the registrant in the capacities and on the dates indicated.
Dated: February 25, 2015 | /s/ Gracia C. Martore | |
Gracia C. Martore, | ||
President and Chief Executive | ||
Officer (principal executive officer) | ||
Dated: February 25, 2015 | /s/ Victoria D. Harker | |
Victoria D. Harker, | ||
Chief Financial Officer | ||
(principal financial officer) | ||
(principal accounting officer) | ||
Dated: February 25, 2015 | /s/ John E. Cody |
John E. Cody, Director | |
Dated: February 25, 2015 | /s/ Howard D. Elias |
Howard D. Elias, Director | |
Dated: February 25, 2015 | /s/ Lidia Fonseca |
Lidia Fonseca, Director | |
Dated: February 25, 2015 | /s/ John Jeffry Louis |
John Jeffry Louis, Director | |
Dated: February 25, 2015 | /s/ Marjorie Magner |
Marjorie Magner, | |
Director, Chairman | |
Dated: February 25, 2015 | /s/ Gracia C. Martore |
Gracia C. Martore, Director | |
Dated: February 25, 2015 | /s/ Scott K. McCune |
Scott K. McCune, Director | |
Dated: February 25, 2015 | /s/ Susan Ness |
Susan Ness, Director | |
Dated: February 25, 2015 | /s/ Tony A. Prophet |
Tony A. Prophet, Director | |
Dated: February 25, 2015 | /s/ Neal Shapiro |
Neal Shapiro, Director | |
85
EXHIBIT INDEX
Exhibit Number | Exhibit | Location | ||
2-1 | Agreement and Plan of Merger, dated as of June 12, 2013, by and among Gannett Co., Inc., Belo Corp. and Delta Acquisition Corp. | Incorporated by reference to Exhibit 2.1 to Gannett Co., Inc.’s Form 8-K filed on June 18, 2013. | ||
3-1 | Third Restated Certificate of Incorporation of Gannett Co., Inc. | Incorporated by reference to Exhibit 3-1 to Gannett Co., Inc.’s Form 10-Q for the fiscal quarter ended April 1, 2007. | ||
3-2 | Amended by-laws of Gannett Co., Inc. | Incorporated by reference to Exhibit 3-2 to Gannett Co., Inc.’s Form 8-K dated July 29, 2014 and filed on August 1, 2014. | ||
4-1 | Indenture dated as of March 1, 1983, between Gannett Co., Inc. and Citibank, N.A., as Trustee. | Incorporated by reference to Exhibit 4-2 to Gannett Co., Inc.’s Form 10-K for the fiscal year ended December 29, 1985. | ||
4-2 | First Supplemental Indenture dated as of November 5, 1986, among Gannett Co., Inc., Citibank, N.A., as Trustee, and Sovran Bank, N.A., as Successor Trustee. | Incorporated by reference to Exhibit 4 to Gannett Co., Inc.’s Form 8-K filed on November 9, 1986. | ||
4-3 | Second Supplemental Indenture dated as of June 1, 1995, among Gannett Co., Inc., NationsBank, N.A., as Trustee, and Crestar Bank, as Trustee. | Incorporated by reference to Exhibit 4 to Gannett Co., Inc.’s Form 8-K filed on June 15, 1995. | ||
4-4 | Third Supplemental Indenture, dated as of March 14, 2002, between Gannett Co., Inc. and Wells Fargo Bank Minnesota, N.A., as Trustee. | Incorporated by reference to Exhibit 4.16 to Gannett Co., Inc.’s Form 8-K filed on March 14, 2002. | ||
4-5 | Fourth Supplemental Indenture, dated as of June 16, 2005, between Gannett Co., Inc. and Wells Fargo Bank Minnesota, N.A., as Trustee. | Incorporated by reference to same numbered exhibit to Gannett Co., Inc.’s Form 10-Q for the fiscal quarter ended June 26, 2005. | ||
4-6 | Fifth Supplemental Indenture, dated as of May 26, 2006, between Gannett Co., Inc. and Wells Fargo Bank, N.A., as Trustee. | Incorporated by reference to Exhibit 4-5 to Gannett Co. Inc.’s Form 10-Q for the fiscal quarter ended June 25, 2006. | ||
4-7 | Sixth Supplemental Indenture, dated as of June 29, 2007, between Gannett Co., Inc. and Wells Fargo Bank, N.A., as Successor Trustee. | Incorporated by reference to Exhibit 4.5 to Gannett Co., Inc.’s Form 10-Q for the fiscal quarter ended July 1, 2007. | ||
4-8 | Eleventh Supplemental Indenture, dated as of October 3, 2013, between Gannett Co., Inc. and U.S. Bank National Association as Trustee. | Incorporated by reference to Exhibit 4.8 to Gannett Co., Inc.’s Form 10-K for the fiscal year ended December 29, 2013. | ||
4-9 | Specimen Certificate for Gannett Co., Inc.’s common stock, par value $1.00 per share. | Incorporated by reference to Exhibit 2 to Gannett Co., Inc.’s Form 8-B filed on June 14, 1972. | ||
10-1 | Supplemental Executive Medical Plan Amended and Restated as of January 1, 2011.* | Incorporated by reference to Exhibit 10-2 to Gannett Co., Inc.’s Form 10-K for the fiscal year ended December 26, 2010. | ||
10-1-1 | Amendment No. 1 to the Supplemental Executive Medical Plan Amended and Restated as of January 1, 2012.* | Incorporated by reference to Exhibit 10-1-1 to Gannett Co., Inc.’s Form 10-K for the fiscal year ended December 30, 2012. | ||
10-2 | Supplemental Executive Medical Plan for Retired Executives dated December 22, 2010 and effective January 1, 2011.* | Incorporated by reference to Exhibit 10-2-1 to Gannett Co., Inc.’s Form 10-K for the fiscal year ended December 26, 2010. | ||
10-3 | Gannett Supplemental Retirement Plan Restatement.* | Incorporated by reference to Exhibit 10-2 to Gannett Co., Inc.’s Form 10-Q for the fiscal quarter ended September 30, 2007. | ||
10-3-1 | Amendment No. 1 to the Gannett Co., Inc. Supplemental Retirement Plan dated July 31, 2008 and effective August 1, 2008.* | Incorporated by reference to Exhibit 10-1 to Gannett Co., Inc.’s Form 10-Q for the fiscal quarter ended September 28, 2008. | ||
10-3-2 | Amendment No. 2 to the Gannett Co., Inc. Supplemental Retirement Plan dated December 22, 2010.* | Incorporated by reference to Exhibit 10-3-2 to Gannett Co., Inc.’s Form 10-K for the fiscal year ended December 26, 2010. | ||
86
10-4 | Gannett Co., Inc. Deferred Compensation Plan Restatement dated February 1, 2003 (reflects all amendments through July 25, 2006).* | Incorporated by reference to Exhibit 10-4 to Gannett Co., Inc.’s Form 10-K for the fiscal year ended December 31, 2006. | ||
10-4-1 | Gannett Co., Inc. Deferred Compensation Plan Rules for Post-2004 Deferrals.* | Incorporated by reference to Exhibit 10-3 to Gannett Co., Inc.’s Form 10-Q for the fiscal quarter ended July 1, 2007. | ||
10-4-2 | Amendment No. 1 to the Gannett Co., Inc. Deferred Compensation Plan Rules for Post-2004 Deferrals dated July 31, 2008 and effective August 1, 2008.* | Incorporated by reference to Exhibit 10-2 to Gannett Co., Inc.’s Form 10-Q for the fiscal quarter ended September 28, 2008. | ||
10-4-3 | Amendment No. 2 to the Gannett Co., Inc. Deferred Compensation Plan Rules for Post-2004 Deferrals dated December 9, 2008.* | Incorporated by reference to Exhibit 10-4-3 to Gannett Co., Inc.’s Form 10-K for the fiscal year ended December 28, 2008. | ||
10-4-4 | Amendment No. 3 to the Gannett Co., Inc. Deferred Compensation Plan Rules for Post-2004 Deferrals dated October 27, 2009.* | Incorporated by reference to Exhibit 10-4-4 to Gannett Co., Inc.’s Form 10-K for the fiscal year ended December 27, 2009. | ||
10-4-5 | Amendment No. 4 to the Gannett Co., Inc. Deferred Compensation Plan Rules for Post-2004 Deferrals dated December 22, 2010.* | Incorporated by reference to Exhibit 10-4-5 to Gannett Co., Inc.’s Form 10-K for the fiscal year ended December 26, 2010. | ||
10-5 | Gannett Co., Inc. Transitional Compensation Plan Restatement.* | Incorporated by reference to Exhibit 10-1 to Gannett Co., Inc.’s Form 10-Q for the fiscal quarter ended September 30, 2007. | ||
10-5-1 | Amendment No. 1 to Gannett Co., Inc. Transitional Compensation Plan Restatement dated as of May 4, 2010.* | Incorporated by reference to Exhibit 10-3 to Gannett Co., Inc.’s Form 10-Q for the fiscal quarter ended March 28, 2010. | ||
10-5-2 | Amendment No. 2 to Gannett Co., Inc. Transitional Compensation Plan Restatement dated as of December 22, 2010.* | Incorporated by reference to Exhibit 10-5-2 to Gannett Co., Inc.’s Form 10-K for the fiscal year ended December 26, 2010. | ||
10-6 | Gannett Co., Inc. Omnibus Incentive Compensation Plan, as amended and restated as of May 4, 2010.* | Incorporated by reference to Exhibit 10-2 to Gannett Co., Inc.’s Form 10-Q for the fiscal quarter ended March 28, 2010. | ||
10-6-1 | Gannett Co., Inc. 2001 Inland Revenue Approved Sub-Plan for the United Kingdom.* | Incorporated by reference to Exhibit 10-1 to Gannett Co., Inc.’s Form 10-Q for the fiscal quarter ended September 26, 2004. | ||
10-6-2 | Form of Director Stock Option Award Agreement.* | Incorporated by reference to Exhibit 10-7-3 to Gannett Co., Inc.’s Form 10-K for the fiscal year ended December 30, 2007. | ||
10-6-3 | Form of Director Restricted Stock Award Agreement.* | Incorporated by reference to Exhibit 10-6-4 to Gannett Co., Inc.’s Form 10-K for the fiscal year ended December 28, 2008. | ||
10-6-4 | Form of Executive Officer Stock Option Award Agreement.* | Incorporated by reference to Exhibit 10-6-5 to Gannett Co., Inc.’s Form 10-K for the fiscal year ended December 28, 2008. | ||
10-6-5 | Form of Executive Officer Restricted Stock Unit Award Agreement.* | Incorporated by reference to Exhibit 10-6-6 to Gannett Co., Inc.’s Form 10-K for the fiscal year ended December 28, 2008. | ||
10-6-6 | Form of Executive Officer Performance Share Award Agreement.* | Incorporated by reference to Exhibit 99-1 to Gannett Co., Inc.’s Form 8-K/A filed on December 9, 2011. | ||
10-6-7 | Form of Executive Officer Restricted Stock Unit Award Agreement.* | Incorporated by reference to Exhibit 10-2 to Gannett Co., Inc.’s Form 10-Q for the fiscal quarter ended March 31, 2013. | ||
10-6-8 | Form of Executive Officer Performance Share Award Agreement.* | Incorporated by reference to Exhibit 10-6-8 to Gannett Co., Inc.’s Form 10-K for the fiscal year ended December 29, 2013. | ||
10-6-9 | Form of Director Restricted Stock Unit Award Agreement.* | Attached. | ||
10-6-10 | Form of Executive Officer Restricted Stock Unit Award Agreement. * | Attached. | ||
10-6-11 | Form of Executive Officer Performance Share Award Agreement. * | Attached. | ||
10-7 | Gannett U.K. Limited Share Incentive Plan, as amended effective June 25, 2004.* | Incorporated by reference to Exhibit 10-2 to Gannett Co., Inc.’s Form 10-Q for the fiscal quarter ended June 27, 2004. | ||
87
10-8 | Amendment and Restatement Agreement, dated as of August 5, 2013, to each of (i) the Amended and Restated Competitive Advance and Revolving Credit Agreement, dated as of March 11, 2002 and effective as of March 18, 2002, as amended and restated as of December 13, 2004 and effective as of January 5, 2005, as amended by the First Amendment thereto, dated as of February 28, 2007 and effective as of March 15, 2007, as further amended by the Second Amendment thereto, dated as of October 23, 2008 and effective as of October 31, 2008, as further amended by the Third Amendment thereto, dated as of September 28, 2009, as further amended by the Fourth Amendment thereto, dated as of August 25, 2010 and as further amended by the Fifth Amendment and Waiver, dated as of September 30, 2010 (the “2002 Credit Agreement”), among Gannett Co., Inc., a Delaware corporation (“Gannett”), the several banks and other financial institutions from time to time parties to the Credit Agreement (the “2002 Lenders”), JPMorgan Chase Bank, N.A., as administrative agent (in such capacity, the “2002 Administrative Agent”), JPMorgan Chase Bank, N.A. and Citibank, N.A., as syndication agents, and Barclays Bank PLC, as documentation agent, (ii) the Competitive Advance and Revolving Credit Agreement, dated as of February 27, 2004 and effective as of March 15, 2004, as amended by the First Amendment thereto, dated as of February 28, 2007 and effective as of March 15, 2007, as further amended by the Second Amendment thereto, dated as of October 23, 2008 and effective as of October 31, 2008, as further amended by the Third Amendment thereto, dated as of September 28, 2009, as further amended by the Fourth Amendment thereto, dated as of August 25, 2010, and as further amended by the Fifth Amendment and Waiver, dated as of September 30, 2010 (the “2004 Credit Agreement”), among Gannett, the several banks and other financial institutions from time to time parties to the Credit Agreement (the “2004 Lenders”), JPMorgan Chase Bank, N.A., as administrative agent (in such capacity, the “Administrative Agent”), JPMorgan Chase Bank, N.A. and Citibank, N.A., as syndication agents, and Barclays Bank PLC and SunTrust Bank, as documentation agents and (iii) the Competitive Advance and Revolving Credit Agreement, dated as of December 13, 2004 and effective as of January 5, 2005, as amended by the First Amendment thereto, dated as of February 28, 2007 and effective as of March 15, 2007, as further amended by the Second Amendment thereto, dated as of October 23, 2008 and effective as of October 31, 2008, as further amended by the Third Amendment thereto, dated as of September 28, 2009, as further amended by the Fourth Amendment thereto, dated as of August 25, 2010 and as further amended by the Fifth Amendment and Waiver, dated as of September 30, 2010 (the “2005 Credit Agreement” and, together with the 2002 Credit Agreement and the 2004 Credit Agreement, the “Credit Agreements”), among Gannett, the several banks and other financial institutions from time to time parties to the Credit Agreement (the “2005 Lenders” and, together with the 2002 Lenders and the 2004 Lenders, the “Lenders”), JPMorgan Chase Bank, N.A., as administrative agent (in such capacity, the “2005 Administrative Agent” and, together with the 2002 Administrative Agent and the 2004 Administrative Agent, the “Administrative Agent”), JPMorgan Chase Bank, N.A. and Citibank, N.A., as syndication agents, and Barclays Bank PLC, as documentation agent, by and between Gannett, the Guarantors under the Credit Agreements as of the date hereof, the Administrative Agent, JPMorgan Chase Bank, N.A. and Bank of America, N.A., as issuing lenders and the Lenders party thereto. | Incorporated by reference to Exhibit 10-1 to Gannett Co., Inc.’s Form 10-Q for the fiscal quarter ended September 29, 2013. | ||
88
10-9 | Master Assignment and Assumption, dated as of August 5, 2013, by and between each of the lenders listed thereon as assignors and/or assignees. | Incorporated by reference to Exhibit 10-2 to Gannett Co., Inc.’s Form 10-Q for the fiscal quarter ended September 29, 2013. | ||
10-10 | Amended and Restated Competitive Advance and Revolving Credit Agreement, dated as of August 5, 2013, by and among Gannett, the several banks and other financial institutions from time to time parties thereto, JPMorgan Chase Bank, N.A., as administrative agent, and JPMorgan Chase Bank, N.A. and Citibank, N.A. as syndication agents | Incorporated by reference to Exhibit 10-3 to Gannett Co., Inc.’s Form 10-Q for the fiscal quarter ended September 29, 2013. | ||
10-11 | Sixth Amendment, dated as of September 24, 2013, to the Competitive Advance and Revolving Credit Agreement, dated as of December 13, 2004 and effective as of January 5, 2005, as amended by the First Amendment thereto, dated as of February 28, 2007 and effective as of March 15, 2007, as further amended by the Second Amendment thereto, dated as of October 23, 2008 and effective as of October 31, 2008, as further amended by the Third Amendment thereto, dated as of September 28, 2009, as further amended by the Fourth Amendment thereto, dated as of August 25, 2010, as further amended by the Fifth Amendment and Waiver, dated as of September 30, 2010, and as further amended and restated pursuant to the Amended and Restated Competitive Advance and Revolving Credit Agreement, dated as of August 5, 2013, by and among Gannett Co., Inc., JPMorgan Chase Bank, N.A., as administrative agent, and the several banks and other financial institutions from time to time parties thereto. | Incorporated by reference to Exhibit 10-4 to Gannett Co., Inc.’s Form 10-Q for the fiscal quarter ended September 29, 2013. | ||
10-12 | Increased Facility Activation Notice, dated September 25, 2013, pursuant to the Amended and Restated Competitive Advance and Revolving Credit Agreement, dated as of August 5, 2013, by and among Gannett Co., Inc., JPMorgan Chase Bank N.A., as administrative agent, and the several banks and other financial institutions from time to time parties thereto. | Incorporated by reference to Exhibit 10-5 to Gannett Co., Inc.’s Form 10-Q for the fiscal quarter ended September 29, 2013. | ||
10-12-1 | Increased Facility Activation Notice, dated May 5, 2014, pursuant to the Amended and Restated Competitive Advance and Revolving Credit Agreement, dated as of August 5, 2013, by and among Gannett Co., Inc., JP Morgan Chase Bank, N.A., as administrative agent, and the several banks and other financial institutions from time to time parties thereto. | Incorporated by reference to Exhibit 10-1 to Gannett Co., Inc.’s Form 10-Q for the fiscal quarter ended June 29, 2014. | ||
10-13 | Description of Gannett Co., Inc.’s Non-Employee Director Compensation.* | Incorporated by reference to Exhibit 10-1 to Gannett Co., Inc.’s Form 10-Q for the fiscal quarter ended March 31, 2013. | ||
10-14 | Employment Agreement dated February 27, 2007, between Gannett Co., Inc. and Gracia C. Martore.* | Incorporated by reference to Exhibit 10-15 to Gannett Co., Inc.’s Form 10-K for the fiscal year ended December 31, 2006. | ||
10-14-1 | Amendment, dated as of August 7, 2007, to Employment Agreement dated February 27, 2007.* | Incorporated by reference to Exhibit 10-5 to Gannett Co., Inc.’s Form 10-Q for the fiscal quarter ended July 1, 2007. | ||
10-14-2 | Amendment, dated as of December 24, 2010, to Employment Agreement dated February 27, 2007.* | Incorporated by reference to Exhibit 10-14-2 to Gannett Co., Inc.’s Form 10-K for the year ended December 26, 2010. | ||
10-15 | Termination Benefits Agreement dated as of March 16, 2011 between Gannett Co., Inc. and David A. Payne.* | Incorporated by reference to Exhibit 10-15 to Gannett Co., Inc.’s Form 10-K for the year ended December 25, 2011. | ||
10-16 | Termination Benefits Agreement dated as of July 23, 2012 between Gannett Co., Inc. and Victoria D. Harker.* | Incorporated by reference to Exhibit 99-2 to Gannett Co., Inc.’s Form 8-K filed on June 22, 2012. | ||
10-17 | Amendment for section 409A Plans dated December 31, 2008.* | Incorporated by reference to Exhibit 10-14 to Gannett Co., Inc.’s Form 10-K for the fiscal year ended December 28, 2008. | ||
10-18 | Executive Life Insurance Plan document dated December 31, 2008.* | Incorporated by reference to Exhibit 10-15 to Gannett Co., Inc.’s Form 10-K for the fiscal year ended December 28, 2008. | ||
10-19 | Key Executive Life Insurance Plan dated October 29, 2010.* | Incorporated by reference to Exhibit 10-1 to Gannett Co., Inc.’s Form 10-Q for the fiscal quarter ended September 26, 2010. | ||
10-20 | Form of Participation Agreement under Key Executive Life Insurance Plan.* | Incorporated by reference to Exhibit 10-2 to Gannett Co., Inc.’s Form 10-Q for the fiscal quarter ended September 26, 2010. | ||
10-21 | Omnibus Amendment to Terms and Conditions of Restricted Stock Awards dated as of December 31, 2008.* | Incorporated by reference to Exhibit 10-17 to Gannett Co., Inc.’s Form 10-K for the fiscal year ended December 28, 2008. | ||
89
10-22 | Omnibus Amendment to Terms and Conditions of Stock Unit Awards dated as of December 31, 2008.* | Incorporated by reference to Exhibit 10-18 to Gannett Co., Inc.’s Form 10-K for the fiscal year ended December 28, 2008. | ||
10-23 | Omnibus Amendment to Terms and Conditions of Stock Option Awards dated as of December 31, 2008.* | Incorporated by reference to Exhibit 10-19 to Gannett Co., Inc.’s Form 10-K for the fiscal year ended December 28, 2008. | ||
10-24 | Gannett Leadership Team Transitional Severance Plan* | Incorporated by reference to Exhibit 10-1 to Gannett Co., Inc. Form 10-Q for the fiscal quarter ended September 28, 2014. | ||
10-25 | Unit Purchase Agreement, dated as of August 5, 2014, by and among Gannett Co., Inc., Classified Ventures, LLC, the unit holders of Classified Ventures, LLC (the “sellers”), certain subsidiaries of the Sellers, Gannett Satellite Information Network, Inc., and Belo Ventures, Inc. | Incorporated by reference to Exhibit 2-1 to Gannett Co., Inc. Form 8-K filed on August 5, 2014. | ||
21 | Subsidiaries of Gannett Co., Inc. | Attached. | ||
23 | Consent of Independent Registered Public Accounting Firm. | Attached. | ||
31-1 | Certification Pursuant to Rule 13a-14(a) under the Securities Exchange Act of 1934. | Attached. | ||
31-2 | Certification Pursuant to Rule 13a-14(a) under the Securities Exchange Act of 1934. | Attached. | ||
32-1 | Section 1350 Certification. | Attached. | ||
32-2 | Section 1350 Certification. | Attached. | ||
101 | The following financial information from Gannett Co., Inc. Annual Report on Form 10-K for the year ended December 28, 2014, formatted in XBRL includes: (i) Consolidated Balance Sheets at December 28, 2014 and December 29, 2013, (ii) Consolidated Statements of Income for the 2014, 2013 and 2012 fiscal years, (iii) Consolidated Statements of Comprehensive Income for the 2014, 2013 and 2012 fiscal years, (iv) Consolidated Cash Flow Statements for the 2014, 2013 and 2012 fiscal years; (v) Consolidated Statements of Equity for the 2014, 2013 and 2012 fiscal years; and (vi) the Notes to Consolidated Financial Statements. | Attached. | ||
For purposes of the incorporation by reference of documents as Exhibits, all references to Form 10-K, 10-Q and 8-K of Gannett Co., Inc. refer to Forms 10-K, 10-Q and 8-K filed with the Commission under Commission file number 1-6961.
We agree to furnish to the Commission, upon request, a copy of each agreement with respect to long-term debt not filed herewith in reliance upon the exemption from filing applicable to any series of debt which does not exceed 10% of our total consolidated assets.
* | Asterisks identify management contracts and compensatory plans or arrangements. |
90
GLOSSARY OF FINANCIAL TERMS
Presented below are definitions of certain key financial and operational terms that we hope will enhance the reading and understanding of our 2014 Form 10-K.
ADJUSTED EBITDA – Net income attributable to Gannett before (1) net income attributable to noncontrolling interests, (2) income taxes, (3) interest expense, (4) equity income, (5) other non-operating items, (6) workforce restructuring, (7) other transformation costs, (8) asset impairment charges, (9) depreciation and (10) amortization.
ADVERTISING REVENUES – Amounts charged to customers for space purchased in our print products and/or associated digital platforms. There are three major types of advertising revenue: retail ads from local merchants, such as department stores; classified ads, which include automotive, real estate and “help wanted”; and national ads, which promote products or brand names on a nationwide basis.
AMORTIZATION – A charge against our earnings that represents the write off of intangible assets over the projected life of the assets.
BALANCE SHEET – A summary statement that reflects our assets, liabilities and equity at a particular point in time.
BROADCASTING REVENUES – Primarily amounts charged to customers for commercial advertising aired on our television stations.
CIRCULATION – The number of newspapers sold to customers each day (paid circulation). We keep separate records of morning, evening and Sunday circulation.
CIRCULATION REVENUES – Amounts charged to readers of our subscription-based newspapers (print or online) or distributors reduced by the amount of discounts. Charges vary from city to city and depend on the type of sale (i.e., subscription or single copy) and distributor arrangements.
CURRENT ASSETS – Cash and other assets that are expected to be converted to cash within one year.
CURRENT LIABILITIES – Amounts owed that will be paid within one year.
DEFERRED INCOME – Revenue derived principally from advance subscription payments for newspapers and advance fees for recruitment solutions. Revenue is recognized in the period in which it is earned (as newspapers are delivered or made available on our digital platforms; or as recruitment solutions delivered).
DEPRECIATION – A charge against our earnings that allocates the cost of property, plant and equipment over the estimated useful lives of the assets.
DIGITAL/ONLINE REVENUES – These include revenue from advertising placed on all digital platforms that are associated with our publishing and broadcasting operations which are reflected as revenues of those business segments, and revenues from the businesses that comprise the Digital Segment, principal of which are CareerBuilder (human capital solutions), Cars.com (website for car shoppers) and PointRoll (technology/marketing services revenue).
DIGITAL SEGMENT – Our reportable segment that includes the results of CareerBuilder, Cars.com, PointRoll and Shoplocal.
DIVIDEND – A payment we make to our shareholders of a portion of our earnings.
EARNINGS PER SHARE (basic) – Our earnings divided by the average number of shares outstanding for the period.
EARNINGS PER SHARE (diluted) - Our earnings divided by the average number of shares outstanding for the period, giving effect to assumed dilution from outstanding stock options and restricted stock units.
EQUITY EARNINGS FROM INVESTMENTS – For those investments in which we own 50% or less, an income or loss entry is recorded in the Statements of Income representing our ownership share of the operating results of the investee company.
FOREIGN CURRENCY TRANSLATION – The process of reflecting foreign currency accounts of subsidiaries in the reporting currency of the parent company.
FREE CASH FLOW – Net cash flow from operating activities reduced by purchase of property, plant and equipment as well as payments for investments and increased by proceeds from investments and voluntary pension contributions, net of related tax benefit.
GAAP – Generally accepted accounting principles.
GOODWILL – In a business purchase, this represents the excess of amounts paid over the fair value of tangible and other identified intangible assets acquired net of liabilities assumed.
INVENTORIES – Raw materials, principally newsprint, used in the business.
NET INCOME ATTRIBUTABLE TO NONCONTROLLING INTERESTS – The portion of equity and net earnings in consolidated subsidiaries that is owned by others.
PERFORMANCE SHARE UNIT – An equity award that gives key employees the right to earn a number of shares of common stock over an incentive period based on how our total shareholder return (TSR) compares to the TSR of a representative peer group of companies.
PURCHASE – A business acquisition. The acquiring company records at its cost the acquired assets less liabilities assumed. The reported income of an acquiring company includes the operations of the acquired company from the date of acquisition.
RESTRICTED STOCK – An award that gives key employees the right to shares of our stock, pursuant to a vesting schedule.
RETAINED EARNINGS – Our earnings not paid out as dividends to shareholders.
STATEMENT OF CASH FLOWS – A financial statement that reflects cash flows from operating, investing and financing activities, providing a comprehensive view of changes in our cash and cash equivalents.
STATEMENT OF COMPREHENSIVE INCOME – A financial statement that reflects our changes in equity (net assets) from transactions and other events from non-owner sources. Comprehensive income comprises net income and other items reported directly in shareholders’ equity, principally the foreign currency translation adjustment and funded status of postretirement plans.
STATEMENT OF EQUITY – A financial statement that reflects changes in our common stock, retained earnings and other equity accounts.
STATEMENT OF INCOME – A financial statement that reflects our profit by measuring revenues and expenses.
STOCK-BASED COMPENSATION – The payment to employees for services received with equity instruments such as restricted stock, performance share units and stock options.
STOCK OPTION – An award that gives key employees the right to buy shares of our stock, pursuant to a vesting schedule, at the market price of the stock on the date of the award.
VARIABLE INTEREST ENTITY (VIE) - A variable interest entity is an entity that lacks equity investors or whose equity investors do not have a controlling interest in the entity through their equity investments.
91