UNITED STATES
SECURITIES AND EXCHANGE COMMISSION
Washington, D.C. 20549
FORM
(Mark One)
| | ANNUAL REPORT PURSUANT TO SECTION 13 OR 15(d) OF THE SECURITIES EXCHANGE ACT OF 1934 |
For the fiscal year ended
OR
| | TRANSITION REPORT PURSUANT TO SECTION 13 OR 15(d) OF THE SECURITIES EXCHANGE ACT OF 1934 |
For the transition period from _____________ to _____________
Commission file number:
H.B. FULLER COMPANY
(Exact name of registrant as specified in its charter)
| (State or other jurisdiction of | (I.R.S. Employer |
| incorporation or organization) | Identification No.) |
| (Address of principal executive offices) | (Zip Code) |
Registrant’s telephone number, including area code: (
Securities registered pursuant to Section 12(b) of the Act:
| Title of each class | Trading Symbol | Name of each exchange on which registered |
| | | |
Securities registered pursuant to Section 12(b) of the Act: none
Indicate by check mark if the registrant is a well-known seasoned issuer, as defined in Rule 405 of the Securities Act. ☒
Indicate by check mark if the registrant is not required to file reports pursuant to Section 13 or Section 15(d) of the Act. ☐ Yes ☒
Indicate by check mark whether the registrant (1) has filed all reports required to be filed by Section 13 or 15(d) of the Securities Exchange Act of 1934 during the preceding 12 months (or for such shorter period that the registrant was required to file such reports), and (2) has been subject to such filing requirements for the past 90 days. ☒
Indicate by check mark whether the registrant has submitted electronically every Interactive Data File required to be submitted pursuant to Rule 405 of Regulation S-T during the preceding 12 months (or for such shorter period that the registrant was required to submit and post such files). ☒
Indicate by check mark whether the registrant is a large accelerated filer, an accelerated filer, a non-accelerated filer, or a smaller reporting company. See the definitions of “large accelerated filer”, “accelerated filer”, “smaller reporting company” or “emerging growth company” in Rule 12b-2 of the Exchange Act. (Check one):
| Accelerated filer ☐ | |
| Non-accelerated filer ☐ | Smaller reporting company |
| Emerging growth company |
If an emerging growth company, indicate by check mark if the registrant has elected not to use the extended transition period for complying with any new or revised financial accounting standards provided pursuant to Section 13(a) of the Exchange Act. ☐
Indicate by check mark whether the registrant has filed a report on and attestation to its management’s assessment of the effectiveness of its internal control over financial reporting under Section 404(b) of the Sarbanes-Oxley Act (15 U.S.C. 7262(b)) by the registered public accounting firm that prepared or issued its audit report.
Indicate by check mark whether the registrant is a shell company (as defined in Rule 12b-2 of the Act).
The aggregate market value of the Common Stock, par value $1.00 per share, held by non-affiliates of the registrant as of May 28, 2021 was approximately $
The number of shares outstanding of the Registrant’s Common Stock, par value $1.00 per share, was
DOCUMENTS INCORPORATED BY REFERENCE
Part III incorporates information by reference to portions of the registrant’s Proxy Statement for the Annual Meeting of Shareholders to be held on April 7, 2022.
H.B. FULLER COMPANY
2021 Annual Report on Form 10-K
H.B. Fuller Company was founded in 1887 and incorporated as a Minnesota corporation in 1915. Our stock is traded on the New York Stock Exchange (“NYSE”) under the ticker symbol FUL. As used herein, “H.B. Fuller”, “we”, “us”, “our”, “management” or “company” includes H.B. Fuller and its subsidiaries unless otherwise indicated. Where we refer to 2021, 2020 and 2019 herein, the reference is to our fiscal years ended November 27, 2021, November 28, 2020, and November 30, 2019, respectively.
We are a leading worldwide formulator, manufacturer and marketer of adhesives, sealants and other specialty chemical products. Sales operations span 35 countries in North America, Europe, Latin America, the Asia Pacific region, India, the Middle East and Africa. Industrial adhesives represent our core product offering. Customers use our adhesives products in manufacturing common consumer and industrial goods, including food and beverage containers, disposable diapers, medical products, windows, doors, flooring, roofing, appliances, sportswear, footwear, multi-wall bags, water filtration products, insulation, textiles, automobiles, recreational vehicles, buses, trucks and trailers, marine products, solar energy systems, electronics and products for the aerospace and defense industries. Our adhesives help improve the performance of our customers’ products or improve their manufacturing processes. We also provide our customers with technical support and unique solutions designed to address their specific needs. In addition, we have established a variety of product offerings for residential and commercial construction markets, such as tile-setting adhesives, grouts, sealants and related products.
We have three reportable segments: Hygiene, Health and Consumable Adhesives, Engineering Adhesives and Construction Adhesives. See Management’s Discussion and Analysis of Financial Condition and Results of Operations (the “MD&A”) in Item 7 of this Annual Report for a description of our segment operating results.
Non-U.S. Operations
The principal markets, products and methods of distribution outside the United States vary with each of our regional operations generally maintaining integrated business units that contain dedicated supplier networks, manufacturing, logistics and sales organizations. The vast majority of the products sold within any region are produced within the region, and the respective regions do not import significant amounts of product from other regions. As of November 27, 2021, we had sales offices and manufacturing plants in 21 countries outside the United States and satellite sales offices in another 13 countries.
We have a Code of Business Conduct and detailed Core Policies that we apply across all of our operations around the world. These policies represent a set of common values that apply to all employees and all of our business dealings. We have adopted policies and processes, and conduct employee training, intended to ensure compliance with various economic sanctions and export controls, including the regulations of the U.S. Treasury Department’s Office of Foreign Assets Control (“OFAC”). We do not conduct any business in the following countries that are subject to U.S. economic sanctions: Cuba; Iran; North Korea; Syria and the Crimea region of the Ukraine.
Competition
Many of our markets are highly competitive. However, we compete effectively due to the quality and breadth of our adhesives, sealants and specialty chemical portfolio and the experience and expertise of our commercial organizations. Within the adhesives and other specialty chemical markets, we believe few suppliers have comparable global reach and corresponding ability to deliver quality and consistency to multinational customers. Our competition is made up generally of two types of companies: (1) similar multinational suppliers and (2) regional or specialty suppliers that typically compete in only one region or within a narrow geographic area within a region. The multinational competitors typically maintain a broad product offering and range of technology, while regional or specialty companies tend to have limited or more focused product ranges and technology.
Principal competitive factors in the sale of adhesives and other specialty chemicals are product performance, supply assurance, technical service, quality, price and customer service.
Customers
We have cultivated strong, integrated relationships with a diverse set of customers worldwide. Our customers are among the technology and market leaders in consumer goods, construction and industrial markets. We pride ourselves on long-term, collaborative customer relationships and a diverse portfolio of customers in which no single customer accounted for more than 10 percent of consolidated net revenue.
Our leading customers include manufacturers of food and beverages, hygiene products, clothing, major appliances, electronics, automobiles, aerospace and defense products, solar energy systems, filters, construction materials, wood flooring, furniture, cabinetry, windows, doors, tissue and towel, corrugation, tube winding, packaging, labels and tapes.
Our products are delivered directly to customers primarily from our manufacturing and distribution facilities, with additional deliveries made through distributors and retailers.
Human Capital Resources and Management
Employees and Labor Relations
As of November 27, 2021, we have approximately 6,500 employees in 45 countries, including approximately 2,500 employees based in the U.S. Approximately 450 U.S. employees are subject to collective bargaining agreements with various unions. Approximately 750 employees in foreign countries are subject to collective bargaining agreements. Overall, we consider our employee relations to be good.
Health and Safety
We care about our colleagues and anyone who enters our workplace and we believe that nothing we do is worth getting hurt for. We have a strong environmental, health and safety program that focuses on implementing policies and training programs, as well as performing self-audits to enhance work safety. Importantly during 2021, our experience and continuing focus on workplace safety have enabled us to preserve business continuity without sacrificing our commitment to keeping our colleagues and workplace visitors safe during the COVID-19 pandemic.
Competitive Pay and Benefits
Our primary compensation strategy is “Pay for Performance”, which supports a culture of accountability and performance. Our compensation guiding principles are to structure compensation that is simple, aligned and balanced. We believe that these principles are strongly aligned with the strategic priorities of our business and our objective to deliver value for our shareholders.
We are committed to fair pay and strive to be externally competitive while ensuring internal equity across our organization. We conduct global pay equity assessments and compensation reviews, and when necessary, we take action to address areas of concern.
Quality, affordable health care is the foundation of the comprehensive benefits package we offer our employees. It is one of the tools we use to recruit and retain, and it is seen as the preferred benefit by most employees. Employees in the United States earning below $52,000 each year have 100% of their individual health care costs covered by the Company in the form of a medical premium reimbursement.
Results-Driven, Collaborative Culture
Our purpose is connecting what matters for all stakeholders and we go about this by winning the right way through our core values. We expect employees to act with integrity and hold each other accountable for our actions. We value our global team’s diverse perspectives, backgrounds and experiences. We make daily, conscious choices to excel, by always bringing passion and creativity to our work, and by striving for innovation ethically and fairly. Our worldwide network of culture champions supports our focus on being At Our Best. Our communication on goals, targets and performance is frequent and transparent. We continue to leverage flexible work options available to employees who don't need our facilities to perform their jobs and this continues to enhance connections across the company, as well as with customers and external partners. This supports our desire to be first and fastest in finding solutions for customers and improving our overall effectiveness. Finally, we continue to take great pride in our focus on giving back to the communities in which we operate through the giving efforts of the H.B. Fuller Foundation and the thousands of employee volunteer hours each year.
Inclusion and Diversity
As a global company, we currently have employees present in over 40 countries around the world. We place strong value on collaboration and we believe that working together leads to better outcomes for our customers. This extends to the way we treat each other as team members. We strive to create an environment where innovative ideas can flourish by demonstrating respect for each other and valuing the diverse opinions, background and viewpoints of employees. We believe that diversity in our teams leads to new ideas, helps us solve problems and allows us to better connect with our global customer base.
We are taking specific actions to foster inclusion and diversity into our culture. Learning resources have been implemented to support greater awareness and understanding of the behaviors expected from employees. We have introduced employee networking groups, an expanded and enhanced mentoring program and focused development programs with the goal of creating meaningful opportunities for employees. We have adjusted our recruiting practices to ensure we are getting the right level of exposure to diverse candidates.
Talent Development
We recognize how important it is for our colleagues to develop and progress in their careers. We provide a variety of resources to help our colleagues grow in their current roles and build new skills, including online development resources focused on specific business imperatives with access to hundreds of online courses in our learning management system. We have implemented an innovative delivery method for leadership training to drive experiential learning and to increase access to leaders around the world. Individual development planning is a part of our annual goal setting process and people managers are expected to have regular discussions with employees to measure progress and make needed adjustments. We focus on getting employees into roles with greater responsibility and opportunities for advancement that are also aligned with their career path to facilitate development and maximize potential. Finally, we provide ambitious employees with short-term opportunities in unique assignments in addition to their current roles. These assignments support the employees’ development while also supporting company initiatives that are required to be resourced with talented employees.
Raw Materials
We use several principal raw materials in our manufacturing processes, including tackifying resins, polymers, synthetic rubbers, vinyl acetate monomer and plasticizers. We generally avoid sole source supplier arrangements for raw materials.
The majority of our raw materials are petroleum/natural gas based derivatives. Under normal conditions, raw materials are available on the open market. Prices and availability are subject to supply and demand market mechanisms. Raw material costs are primarily determined by the balance of supply against the aggregate demand from the adhesives industry and other industries that use the same raw material streams. The cost of crude oil and natural gas, the primary feedstocks for our raw materials, can also impact the cost of our raw materials.
See Item 1A. Risk Factors for a discussion of the effects of the COVID-19 pandemic on raw material cost and availability.
Patents, Trademarks and Licenses
Much of the technology we use in our products and manufacturing processes is available in the public domain. For technology not available in the public domain, we rely on trade secrets and patents when appropriate to protect our competitive position. We also license some patented technology from other sources. Our business is not materially dependent upon licenses or similar rights or on any single patent or group of related patents.
We enter into agreements with many employees to protect rights to technology and intellectual property. Confidentiality commitments also are routinely obtained from customers, suppliers and others to safeguard proprietary information.
We own numerous trademarks and service marks in various countries. Trademarks, such as H.B. Fuller®, Swift®, Advantra®, Clarity®, Sesame®, TEC®, Foster®, Rakoll®, Rapidex®, Full-Care®, Thermonex®, Silaprene®, Eternabond®, Cilbond®, and TONSAN® are important in marketing products. Many of our trademarks and service marks are registered. U.S. trademark registrations are for a term of ten years and are renewable every ten years as long as the trademarks are used in the regular course of trade.
Research and Development
Our investment in research and development creates new and innovative adhesive technology platforms, enhances product performance, ensures a competitive cost structure and leverages available raw materials. New product development is a key research and development outcome, providing higher-value solutions to existing customers or meeting new customers’ needs. Projects are developed in local laboratories in each region, where we understand our customer base the best. Platform developments are coordinated globally through our network of laboratories.
Through designing and developing new polymers and new formulations, we expect to continue to grow in our current markets. We also develop new applications for existing products and technologies, and improve manufacturing processes to enhance productivity and product quality. Research and development efforts are closely aligned to customer needs. We foster open innovation, seek supplier-driven new technology and use relationships with academic and other institutions to enhance our capabilities.
As climate change and other sustainability concerns become more prevalent, governmental and non-governmental organizations, customers and investors are increasingly focusing on these issues. We continue to monitor our markets to ensure we are developing the adhesives and sealants to support our customers’ responses to changing consumer demand, new product designs and upcoming regulatory and sustainability efforts. We invest significantly in innovation, research and expertise, which are crucial for the continuous extraction of value from our business strategy. This also facilitates the creation of new high-performance solutions that enable customers to improve their products and processes to better achieve their sustainability programs.
Regulatory Compliance
We comply with applicable federal, state, local and foreign laws and regulations relating to environmental protection and workers' safety, including those required by the U.S. Environmental Protection Agency (the “EPA”) and the EU’s Registration, Evaluation, Authorization and Restriction of Chemicals (“REACH”) regulation. This includes regular review of and upgrades to environmental, health and safety policies, practices and procedures as well as improved production methods to minimize our facilities’ outgoing waste, based on evolving societal standards and increased environmental understanding. Expenditures to comply with environmental regulations over the next two years are estimated to be approximately $24.2 million, including approximately $3.7 million of capital expenditures. See additional disclosure under Item 3. Legal Proceedings.
Various legislation, regulations and international accords pertaining to climate change have been implemented or are being considered for implementation, particularly as they relate to the reduction of greenhouse gas emissions. We have not determined that any of these laws directly impact the Company at this time; however, we continue to monitor the development and implementation of such legislation and regulation. We also continue to regularly report our sustainability efforts and metrics under the Global Reporting Initiative (“GRI”) framework and report our goals and progress in our annual Sustainability Report.
The Foreign Corrupt Practices Act (the “FCPA”) prohibits bribery of government officials to benefit business interests. We operate and sell our products in countries that are rated as high-risk for corruption, which creates the risk of unauthorized conduct by our employees, customs brokers, distributors or other third party intermediaries that could be in violation of the FCPA or similar local regulations. We comply with the FCPA’s requirements to make and keep accurate books and records that accurately and fairly reflect our transactions and to devise and maintain an adequate system of internal accounting controls.
We are also subject to and comply with increasingly complex privacy and data protection laws and regulations in the United States and other jurisdictions. This includes the European Union’s General Data Protection Regulation (“GDPR”), which enforces rules relating to the protection of processing and movement of personal data. The interpretation and enforcement of such regulations are continuously evolving and there may be uncertainty with respect to how to comply with them. Noncompliance with GDPR and other data protection laws could result in damage to our reputation and payment of monetary penalties.
Seasonality
Our operating segments have historically had lower net revenue in winter months, which is primarily our first fiscal quarter, mainly due to international holidays and the seasonal decline in construction and consumer spending activities.
Information About Our Executive Officers
The following table shows the name, age and business experience for the past five years of the executive officers as of January 5, 2022. Unless otherwise noted, the positions described are positions with the company or its subsidiaries.
| Name |
Age |
Positions |
Period Served |
|
|
|
|
|
| James J. Owens |
57 |
President and Chief Executive Officer |
November 2010 - Present |
|
|
|
|
|
| Zhiwei Cai |
59 |
Executive Vice President, Engineering Adhesives |
August 2019 - Present |
| Senior Vice President, Engineering Adhesives | February 2016 - August 2019 | ||
| Heather A. Campe |
48 |
Senior Vice President, International Growth | December 2021 - Present |
| Senior Vice President, Global Hygiene, Health and Consumable Adhesives | August 2019 - November 2021 | ||
| Senior Vice President, Americas Adhesives | October 2016 - August 2019 | ||
| Theodore M. Clark |
68 |
Executive Vice President and Chief Operating Officer |
August 2019 - Present |
| Senior Vice President, Royal Adhesives | October 2017 - August 2019 | ||
| President and CEO, Royal Adhesives and Sealants, LLC | 2003 - 2017 | ||
| John J. Corkrean |
56 |
Executive Vice President and Chief Financial Officer |
May 2016 - Present |
| James J. East | 57 | Senior Vice President, Hygiene, Health and Consumable Adhesives | October 2021 - Present |
| Vice President, Engineering Adhesives Americas and Global Director Automotive | April 2018 - October 2021 | ||
| Global Business Director, General Industries and Business Director, Cyberbond LLC | June 2016 - March 2018 |
| Traci L. Jensen |
55 |
Vice President, Global Business Process Improvement |
December 2019 - Present |
| Senior Vice President, Construction Products | July 2016 - December 2019 | ||
|
|
|
|
|
| Timothy J. Keenan |
64 |
Vice President, General Counsel and Corporate Secretary |
December 2006 - Present |
|
|
|
|
|
| M. Shahbaz Malik |
54 |
Senior Vice President, Construction Adhesives |
December 2019 - Present |
| Vice President and Business Leader, North America Distribution, Masonite International Corporation (global residential doors business) | 2018 - 2019 | ||
| Senior Vice President, Sales, Marketing and Supply Chain, Continental Building Products, Inc. (North America manufacturer of wallboard and joint compound materials) | 2014 - 2018 | ||
| Nathanial D. Weaver |
46 |
Vice President, Human Resources |
March 2020 - Present |
| Director, Human Resources | 2017 - March 2020 | ||
| Vice President, Global Hygiene | 2013 - 2017 |
The Board of Directors elects the executive officers annually.
Available Information
For more information about us, visit our website at: www.hbfuller.com.
We file annual, quarterly and current reports, proxy statements and other information with the Securities and Exchange Commission (“SEC”) via EDGAR. Our SEC filings are available free of charge to the public on the SEC website at www.sec.gov and on our website as soon as reasonably practicable after they have been filed with or furnished to the SEC.
As a global manufacturer of adhesives, sealants and other specialty chemical products, we operate in a business environment that is subject to various risks and uncertainties. Below are the most significant factors that could adversely affect our business, financial condition and results of operations.
Strategic and Operational Risks
The COVID-19 pandemic has affected and will continue to affect our operations and financial results.
In December 2019, a novel strain of coronavirus (“COVID-19”) was reported to have surfaced in Wuhan, China, which became a global pandemic. Throughout fiscal year 2021, the COVID-19 pandemic continued to have a significant disruptive impact on global economies, supply chains and industrial production. We have effectively managed our global operations throughout the pandemic, implementing rigorous protocols focused on the health and safety of our employees and ensuring business continuity across our supplier, manufacturing and distribution networks. These actions enabled us to meet our customers’ increased demands for adhesive solutions, effectively allocate our resources and manage expenses, and deliver strong financial results, while maintaining a safe workplace for employees. Concerns remain that there could be a prolonged resurgence of cases triggering additional government mandated lockdowns or similar restrictions, for example due to the emergence of new variants against which existing vaccines are not as effective or which may be more easily transmitted.
Due to the evolving and highly uncertain nature of the pandemic, it is currently not possible to estimate any additional direct or indirect impacts this outbreak may have on our business. Any disruption of the manufacturing of our products, commerce and related activity caused by the COVID-19 pandemic, including ongoing labor shortages and supply chain constraints, could materially and adversely affect our results of operations and financial condition.
Increases in prices and declines in the availability of raw materials have adversely affected, and could continue to erode, our profit margins, and could negatively impact our operating results.
In 2021, raw material costs made up approximately 75 percent of our cost of sales. Based on 2021 financial results, a hypothetical one percent change in our raw material costs would have resulted in a change in net income of approximately $13.2 million or $0.24 per diluted share. Accordingly, changes in the cost of raw materials, due to scarcity, supplier disruptions, inflation and for other reasons, can significantly impact our earnings. Raw materials needed to manufacture products are obtained from a number of suppliers and many of the raw materials are petroleum and natural gas based derivatives. Under normal market conditions, these raw materials are generally available on the open market from a variety of producers. While alternate supplies of most key raw materials are available, supplier production outages may lead to strained supply-demand situations for certain raw materials. The substitution of key raw materials requires us to identify new supply sources, reformulate and re-test and may require seeking re-approval from our customers using those products. From time to time, the prices and availability of these raw materials may fluctuate, which could impair our ability to procure necessary materials, or increase the cost of manufacturing products. If the prices of raw materials increase in a short period of time, we may be unable to pass these increases on to our customers in a timely manner and could experience reductions to our profit margins.
The COVID-19 pandemic has had a significant impact on raw material prices, which could continue in the future. Further, the COVID-19 pandemic and responses to it have significantly limited or prevented the movement of goods and services worldwide, which has resulted in and could continue to result in disruptions in our supply chain and our difficulty in procuring or inability to procure raw materials necessary for the manufacturing of our products. The impact of the COVID-19 pandemic and responses to it has increased and could continue to increase the costs of making and distributing our products or result in delays in delivering, or an inability to deliver, them to our customers.
We experience substantial competition in each of the operating segments and geographic areas in which we operate.
Our wide variety of products are sold in numerous markets, each of which is highly competitive. Our competitive position in markets is, in part, subject to external factors. For example, supply and demand for certain of our products is driven by end-use markets and worldwide capacities which, in turn, impact demand for and pricing of our products. Many of our direct competitors are part of large multinational companies and may have more resources than we do. Any increase in competition may result in lost market share or reduced prices, which could result in reduced profit margins. This may impair the ability to grow or even to maintain current levels of revenues and earnings. While we have an extensive customer base, loss of certain top customers could adversely affect our financial condition and results of operations until such business is replaced, and no assurances can be made that we would be able to regain or replace any lost customers.
Failure to develop new products and protect our intellectual property could negatively impact our future performance and growth.
Ongoing innovation and product development are important factors in our competitiveness. Failure to create new products and generate new ideas could negatively impact our ability to grow and deliver strong financial results. We continually apply for and obtain U.S. and foreign patents to protect the results of our research for use in our operations and licensing. We are party to a number of patent licenses and other technology agreements. We rely on patents, confidentiality agreements and internal security measures to protect our intellectual property. Failure to protect this intellectual property could negatively affect our future performance and growth.
A failure in our information technology systems could negatively impact our business.
We rely on information technology to record and process transactions, manage our business and maintain the financial accuracy of our records. Our computer systems are subject to damage or interruption from various sources, including power outages, computer and telecommunications failures, computer viruses, security breaches, vandalism, catastrophic events and human error. Interruptions of our computer systems could disrupt our business, for example by leading to plant downtime and/or power outages, and could result in the loss of business and cause us to incur additional expense.
Information technology security threats are increasing in frequency and sophistication. Our information technology systems could be breached by unauthorized outside parties or misused by employees or other insiders intent on extracting sensitive information, corrupting information or disrupting business processes. Such unauthorized access and a failure to effectively recover from breaches could compromise confidential information, disrupt our business, harm our reputation, result in the loss of assets including trade secrets and other intellectual property, customer confidence and business, result in regulatory proceedings and legal claims, and have a negative impact on our financial results.
We are in the process of implementing a global Enterprise Resource Planning (“ERP”) system that we refer to as Project ONE, which will upgrade and standardize our information system. Implementation of Project ONE began in our North America adhesives business in 2014 and, through 2021, we completed implementation of this system in various parts of our business including Latin America (except Brazil), Australia and various other businesses in North America and EIMEA. During 2022 and beyond, we will continue implementation in North America, EIMEA and Asia Pacific.
Any delays or other failure to achieve our implementation goals may adversely impact our financial results. In addition, the failure to either deliver the application on time or anticipate the necessary readiness and training needs could lead to business disruption and loss of business. Failure or abandonment of any part of the ERP system could result in a write-off of part or all of the costs that have been capitalized on the project.
Risks associated with acquisitions could have an adverse effect on us and the inability to execute organizational restructuring may affect our results.
As part of our growth strategy, from time to time, we have made acquisitions of complementary businesses or products. The ability to grow through acquisitions depends upon our ability to identify, negotiate, complete and integrate suitable acquisitions. If we fail to successfully integrate acquisitions into our existing business, our results of operations and our cash flows could be adversely affected. Our acquisition strategy also involves other risks and uncertainties, including distraction of management from current operations, greater than expected liabilities and expenses, inadequate return on capital, unidentified issues not discovered in our investigations and evaluations of those strategies and acquisitions, and difficulties implementing and maintaining consistent standards, controls, procedures, policies and systems. Future acquisitions could result in additional debt and other liabilities, and increased interest expense, restructuring charges and amortization expense related to intangible assets.
In addition, our profitability is dependent on our ability to drive sustainable productivity improvements such as cost savings through organizational restructuring. Delays or unexpected costs may prevent us from realizing the full operational and financial benefits of such restructuring initiatives and may potentially disrupt our operations.
Legal and Regulatory Risks
The impact of changing laws or regulations or the manner of interpretation or enforcement of existing laws or regulations could adversely impact our financial performance and restrict our ability to operate our business or execute our strategies.
New laws or regulations, or changes in existing laws or regulations or the manner of their interpretation or enforcement, could increase our cost of doing business and restrict our ability to operate our business or execute our strategies. In addition, compliance with laws and regulations is complicated by our substantial global footprint, which will require significant and additional resources to ensure compliance with applicable laws and regulations in the various countries where we conduct business.
Our global operations expose us to trade and economic sanctions and other restrictions imposed by the U.S., the EU and other governments and organizations. The U.S. Departments of Justice, Commerce, State and Treasury and other federal agencies and authorities have a broad range of civil and criminal penalties they may seek to impose against corporations and individuals for violations of economic sanctions laws, export control laws, the FCPA and other federal statutes and regulations, including those established by the OFAC. Under these laws and regulations, as well as other anti-corruption laws, anti-money-laundering laws, export control laws, customs laws, sanctions laws and other laws governing our operations, various government agencies may require export licenses, may seek to impose modifications to business practices, including cessation of business activities in sanctioned countries or with sanctioned persons or entities and modifications to compliance programs, which may increase compliance costs, and may subject us to fines, penalties and other sanctions. A violation of these laws, regulations, policies or procedures could adversely impact our business, results of operations and financial condition.
Although we have implemented policies and procedures in these areas, we cannot assure that our policies and procedures are sufficient or that directors, officers, employees, representatives, manufacturers, suppliers and agents have not engaged and will not engage in conduct in violation of such policies and procedures.
Costs and expenses resulting from compliance with environmental laws and regulations may negatively impact our operations and financial results.
We are subject to numerous environmental laws and regulations that impose various environmental controls on us or otherwise relate to environmental protection, the sale and export of certain chemicals or hazardous materials, and various health and safety matters. The costs of complying with these laws and regulations can be significant and may increase as applicable requirements and their enforcement become more stringent and new rules are implemented. Adverse developments and/or periodic settlements could negatively impact our results of operations and cash flows. See Item 3. Legal Proceedings for a discussion of current environmental matters.
Climate change, or legal, regulatory or market measures to address climate change, may materially adversely affect our financial condition and business operations.
Climate change resulting from increased concentrations of carbon dioxide and other greenhouse gases in the atmosphere could present risks to our future operations from natural disasters and extreme weather conditions, such as hurricanes, tornadoes, earthquakes, wildfires or flooding. Such extreme weather conditions could pose physical risks to our facilities and disrupt operation of our supply chain and may increase operational costs. The impacts of climate change on global water resources may result in water scarcity, which could in the future impact our ability to access sufficient quantities of water in certain locations and result in increased costs. Concern over climate change could result in new legal or regulatory requirements designed to mitigate the effects of climate change on the environment. If such laws or regulations are more stringent than current legal or regulatory requirements, we may experience increased compliance burdens and costs to meet the regulatory obligations and may adversely affect raw material sourcing, manufacturing operations and the distribution of our products.
We have lawsuits and claims against us with uncertain outcomes.
Our operations from time to time are parties to or targets of lawsuits, claims, investigations and proceedings, including product liability, personal injury, asbestos, patent and intellectual property, commercial, contract, environmental, antitrust, health and safety, and employment matters, which are handled and defended in the ordinary course of business. The results of any future litigation or settlement of such lawsuits and claims are inherently unpredictable, but such outcomes could be adverse and material in amount. See Item 3. Legal Proceedings for a discussion of current litigation.
The Company’s effective tax rate could be volatile and materially change as a result of the adoption of new tax legislation and other factors.
A change in tax laws is one of many factors that impact the Company’s effective tax rate. The U.S. Congress and other government agencies in jurisdictions where the Company does business have had an extended focus on issues related to the taxation of multinational corporations. As a result, the tax laws in the U.S. and other countries in which the Company does business could change, and any such changes could adversely impact our effective tax rate, financial condition and results of operations.
The Organization for Economic Co-operation and Development ("OECD"), an international association of 38 countries including the United States, has proposed changes to numerous long-standing tax principles. These proposals, if finalized and adopted by the associated countries, will likely increase tax uncertainty and may adversely affect our provision for income taxes.
The current U.S. presidential administration could enact changes in tax laws that could negatively impact the Company’s effective tax rate. Prior to the U.S. presidential election, President Biden proposed an increase in the U.S. corporate income tax rate from 21% to 28%, doubling the rate of tax on certain earnings of foreign subsidiaries, the creation of a 10% penalty on certain imports and a 15% minimum tax on worldwide book income. Additionally, the proposed changes include significant provisions related to the deductibility of interest. If any or all of these (or similar) proposals are ultimately enacted into law, in whole or in part, they could have a negative impact to the Company’s effective tax rate.
Additional income tax expense or exposure to additional income tax liabilities could have a negative impact on our financial results.
We are subject to income tax laws and regulations in the United States and various foreign jurisdictions. Significant judgment is required in evaluating and estimating our provision and accruals for these taxes. Our income tax liabilities are dependent upon the location of earnings among these different jurisdictions. Our income tax provision and income tax liabilities could be adversely affected by the jurisdictional mix of earnings, changes in valuation of deferred tax assets and liabilities and changes in tax laws and regulations. In the ordinary course of our business, we are also subject to continuous examinations of our income tax returns by tax authorities. Although we believe our tax estimates are reasonable, the final results of any tax examination or related litigation could be materially different from our related historical income tax provisions and accruals. Adverse developments in an audit, examination or litigation related to previously filed tax returns, or in the relevant jurisdiction’s tax laws, regulations, administrative practices, principles and interpretations could have a material effect on our results of operations and cash flows in the period or periods for which that development occurs, as well as for prior and subsequent periods.
Financial Risks
We may be required to record impairment charges on our goodwill or long-lived assets.
Weak demand may cause underutilization of our manufacturing capacity or elimination of product lines; contract terminations or customer shutdowns may force sale or abandonment of facilities and equipment; or other events associated with weak economic conditions or specific product or customer events may require us to record an impairment on tangible assets, such as facilities and equipment, as well as intangible assets, such as intellectual property or goodwill, which would have a negative impact on our financial results.
Our current indebtedness could have a negative impact on our liquidity or restrict our activities.
Our current indebtedness contains various covenants that limit our ability to engage in specified types of transactions. Our overall leverage and the terms of our financing arrangements could:
| ● |
limit our ability to obtain additional financing in the future for working capital, capital expenditures and acquisitions; |
| ● |
make it more difficult to satisfy our obligations under the terms of our indebtedness; |
| ● |
limit our ability to refinance our indebtedness on terms acceptable to us or at all; |
| ● |
limit our flexibility to plan for and adjust to changing business and market conditions in the industries in which we operate and increase our vulnerability to general adverse economic and industry conditions; |
| ● |
require us to dedicate a substantial portion of our cash flow to make interest and principal payments on our debt, thereby limiting the availability of our cash flow to fund future acquisitions, working capital, business activities, and other general corporate requirements; |
| ● |
limit our ability to obtain additional financing for working capital, to fund growth or for general corporate purposes, even when necessary to maintain adequate liquidity, particularly if any ratings assigned to our debt securities by rating organizations were revised downward; and |
| ● |
subject us to higher levels of indebtedness than our competitors, which may cause a competitive disadvantage and may reduce our flexibility in responding to increased competition. |
In addition, the restrictive covenants require us to maintain specified financial ratios and satisfy other financial condition tests. Our ability to meet those financial ratios and tests will depend on our ongoing financial and operating performance, which, in turn, will be subject to economic conditions and to financial, market and competitive factors, many of which are beyond our control. A breach of any of these covenants could result in a default under the instruments governing our indebtedness.
The interest rates of our term loans are priced using a spread over LIBOR.
LIBOR, the London Interbank Offered Rate, is the basic rate of interest used in lending between banks on the London interbank market and is widely used as a reference for setting the interest rate on loans globally. We typically use LIBOR as a reference rate or index in our term loans such that the interest due to our creditors pursuant to a term loan extended to us is calculated using LIBOR. Most of our term loan agreements contain a stated minimum value for LIBOR.
On July 27, 2017, the United Kingdom’s Financial Conduct Authority, which regulates the entity that calculates LIBOR, announced that LIBOR should be phased out by the end of 2021. Subsequently, on March 5, 2021, LIBOR’s administrator announced that publication of overnight, one-month, three-month, six-month and 12-month U.S. dollar LIBOR would cease immediately following publication of such interest rates on June 30, 2023, and that publication of all other currency and tenor variants would cease immediately following publication on December 31, 2021.
The U.S. Federal Reserve, in conjunction with the Alternative Reference Rates Committee, a steering committee comprised of large U.S. financial institutions and other market participants, is considering replacing U.S. dollar LIBOR with a new index calculated by short-term repurchase agreements, backed by Treasury securities (“SOFR”). Whether or not SOFR attains market traction as a LIBOR replacement tool remains in question. SOFR is observed and backward looking, which stands in contrast with LIBOR under the current methodology, which can be an estimated forward-looking rate and relies, to some degree, on the expert judgment of submitting panel members. Given that SOFR is a secured rate backed by government securities, it will be a rate that does not take into account bank credit risk (as is the case with LIBOR). The SOFR rate is therefore likely to be lower than LIBOR rates and is less likely to correlate with the funding costs of financial institutions.
If LIBOR ceases to exist prior to the maturity of our contracts, we will be required to substitute an index such as the Prime Rate or renegotiate our credit agreements that utilize LIBOR as the reference rate, and substitute an index to replace LIBOR with the new standard that is established. If we borrow under the Prime Rate, we will see increased borrowing costs until the agreements are amended or renegotiated to incorporate the new SOFR borrowing rate or another substitute index.
MacroeconomicRisks
Uncertainties in foreign economic, political, regulatory and social conditions and fluctuations in foreign currency may adversely affect our results.
Approximately 57 percent, or $1.9 billion, of our net revenue was generated outside the United States in 2021. International operations could be adversely affected by changes in economic, political, regulatory, and social conditions, especially in Brazil, Russia, China, the Middle East, including Turkey and Egypt, and other developing or emerging markets where we do business. An economic downturn in the businesses or geographic areas in which we sell our products could reduce demand for these products and result in a decrease in sales volume that could have a negative impact on our results of operations. Product demand often depends on end-use markets. Economic conditions that reduce consumer confidence or discretionary spending may reduce product demand. Challenging economic conditions may also impair the ability of our customers to pay for products they have purchased, and as a result, our reserves for doubtful accounts and write-offs of accounts receivable may increase. In addition, trade protection measures, anti-bribery and anti-corruption regulations, restrictions on repatriation of earnings, differing intellectual property rights and changes in legal and regulatory requirements that restrict the sales of products or increase costs could adversely affect our results of operations.
Fluctuations in exchange rates between the U.S. dollar and other currencies could potentially result in increases or decreases in net revenue, cost of raw materials and earnings and may adversely affect the value of our assets outside the United States. In 2021, the change in foreign currencies positively impacted our net revenue by approximately $64.0 million. In 2021, we spent approximately $1.8 billion for raw materials worldwide of which approximately $996.7 million was purchased outside the United States. Based on 2021 financial results, a hypothetical one percent change in our cost of sales due to foreign currency rate changes would have resulted in a change in net income of approximately $9.4 million or $0.17 per diluted share. Although we utilize risk management tools, including hedging, as appropriate, to mitigate market fluctuations in foreign currencies, any changes in strategy in regard to risk management tools can also affect revenue, expenses and results of operations and there can be no assurance that such measures will result in cost savings or that all market fluctuation exposure will be eliminated.
Distressed financial markets may result in dramatic deflation of financial asset valuations and a general disruption in capital markets.
Adverse equity market conditions and volatility in the credit markets could have a negative impact on the value of our pension trust assets, our future estimated pension liabilities and other postretirement benefit plans. In addition, we could be required to provide increased pension plan funding. As a result, our financial results could be negatively impacted. Reduced access to capital markets may affect our ability to invest in strategic growth initiatives such as acquisitions. In addition, the reduced credit availability could limit our customers’ ability to invest in their businesses, refinance maturing debt obligations, or meet their ongoing working capital needs. If these customers do not have sufficient access to the financial markets, demand for our products may decline.
Catastrophic events could disrupt our operations or the operations of our suppliers or customers, having a negative impact on our financial results.
Unexpected events, including global pandemics, natural disasters and severe weather events, fires or explosions at our facilities or those of our suppliers, acts of war or terrorism, supply disruptions or breaches of security of our information technology systems could increase the cost of doing business or otherwise harm our operations, our customers and our suppliers. Such events could reduce demand for our products or make it difficult or impossible for us to receive raw materials from suppliers and deliver products to our customers.
Item 1B. Unresolved Staff Comments
None.
Principal executive offices and central research facilities are located in the St. Paul, Minnesota area. These facilities are company-owned. Manufacturing operations are carried out at 34 plants located throughout the United States and at 35 plants located in 21 other countries. In addition, numerous sales and service offices are located throughout the world. We believe that the properties owned or leased are suitable and adequate for our business. Operating capacity varies by product line, but additional production capacity is available for most product lines by increasing the number of shifts worked. The following is a list of our manufacturing plants as of November 27, 2021 (each of the listed properties are owned by us, unless otherwise specified):
| Segment |
Segment |
||||
| Hygiene, Health and Consumable Adhesives |
Engineering Adhesives |
||||
| Argentina |
Buenos Aires |
France |
Surbourg |
||
| Australia |
Dandenong South |
Germany |
Wunstorf |
||
| Australia |
Sydney1 |
Germany |
Nienburg |
||
| Brazil |
Sorocaba2 |
Germany |
Langelsheim1 |
||
| Brazil |
Curitiba1 |
Germany |
Pirmasens |
||
| Brazil |
Guarulhos |
Italy |
Pianezze |
||
| Chile |
Maipu, Santiago |
People's Republic of China |
Beijing |
||
| Colombia |
Rionegro |
People's Republic of China |
Nanjing - ShanXu Road |
||
| Egypt |
6th of October City |
` |
People's Republic of China |
Nanjing - Xinjinhu Road1 |
|
| France |
Blois |
People's Republic of China |
Suzhou |
||
| Germany |
Lueneburg |
People's Republic of China | Yantai |
||
| Greece | Lamia | Portugal | Mindelo | ||
| India | Pune | United Kingdom |
Preston1 | ||
| Indonesia | Mojokerto |
United States |
California - Irvine1 |
||
| Kenya |
Nairobi1 |
United States |
California - Wilmington1 | ||
| Malaysia |
Selangor |
United States |
Georgia - Norcross1 | ||
| New Zealand |
Auckland1 |
United States |
Georgia - Ball Ground1 |
||
| People's Republic of China |
Guangzhou |
United States |
Illinois - Frankfort - Corsair |
||
| Philippines |
Manila |
United States |
Illinois - Frankfort - West Drive |
||
| United Kingdom |
Dukinfield |
United States |
Indiana - South Bend |
||
| United States |
Georgia - Covington |
United States |
Ohio - Bellevue1 |
||
| United States |
Georgia - Tucker |
United States |
Massachusetts - Peabody1 | ||
| United States |
Illinois - Seneca |
United States |
Michigan - Grand Rapids |
||
| United States |
Illinois - Elgin2 |
United States |
Minnesota - Fridley |
||
| United States |
Kentucky - Paducah |
United States |
New Hampshire - Raymond1 |
||
| United States |
Ohio - Blue Ash |
United States |
New Jersey - Wayne2 |
||
| United States |
Minnesota - Vadnais Heights | ||||
| United States |
New York - Syracuse1 | Construction Adhesives |
|||
| United States |
South Carolina - Simpsonville | Canada |
Ontario1 |
||
| United States |
Texas - Mesquite | United States |
California - La Mirada |
||
| United States |
California - Roseville | United States |
Florida - Gainesville |
||
| United States |
Washington - Vancouver | United States |
Georgia - Dalton |
||
| Vietnam |
Binh Duong1 |
United States |
Illinois - Aurora |
||
|
|
|
United States |
Michigan - Michigan Center |
||
|
|
|
United States |
New Jersey - Edison |
||
| United States |
Ohio - Chagrin Falls |
||||
| United States |
Texas - Houston |
||||
| United States |
Texas - Mansfield |
||||
1 Leased Property
2 Idle Property
Environmental Matters
From time to time, we become aware of compliance matters relating to, or receive notices from, federal, state or local entities regarding possible or alleged violations of environmental, health or safety laws and regulations. Also, from time to time, we are identified as a potentially responsible party (“PRP”) under the Comprehensive Environmental Response, Compensation and Liability Act (“CERCLA”) and/or similar state laws that impose liability for costs relating to the clean up of contamination resulting from past spills, disposal or other release of hazardous substances. We are also subject to similar laws in some of the countries where current and former facilities are located. Our environmental, health and safety department monitors compliance with applicable laws on a global basis.
Currently, we are involved in various environmental investigations, clean up activities and administrative proceedings and lawsuits. In particular, we are currently deemed a PRP in conjunction with numerous other parties, in a number of government enforcement actions associated with landfills and/or hazardous waste sites. As a PRP, we may be required to pay a share of the costs of investigation and clean up of these sites.
We are also engaged in environmental remediation and monitoring efforts at a number of current and former operating facilities. To the extent we can reasonably estimate the amount of our probable liabilities for environmental matters, we establish a financial provision. It is reasonably possible that we may have additional liabilities related to these known environmental matters. However, the full extent of our future liability for environmental matters is difficult to predict because of uncertainty as to the cost of investigation and clean up of the sites, our responsibility for such hazardous substances and the number of and financial condition of other potentially responsible parties.
While uncertainties exist with respect to the amounts and timing of the ultimate environmental liabilities, based on currently available information, we have concluded that these matters, individually or in the aggregate, will not have a material adverse effect on our results of operations, financial condition or cash flow. However, adverse developments and/or periodic settlements could negatively impact the results of operations or cash flows in one or more future periods.
Other Legal Proceedings
From time to time and in the ordinary course of business, we are a party to, or a target of, lawsuits, claims, investigations and proceedings, including product liability, personal injury, contract, patent and intellectual property, environmental, health and safety, tax and employment matters. While we are unable to predict the outcome of these matters, we have concluded, based upon currently available information, that the ultimate resolution of any pending matter, individually or in the aggregate, including asbestos, will not have a material adverse effect on our results of operations, financial condition or cash flow. However, adverse developments and/or periodic settlements could negatively impact the results of operations or cash flows in one or more future periods.
For additional information regarding environmental matters and other legal proceedings, see Note 14 to our Consolidated Financial Statements.
Item 4. Mine Safety Disclosures
Not applicable.
Item 5. Market for Registrant's Common Equity, Related Stockholder Matters and Issuer Purchases of Equity Securities
Our common stock is traded on the New York Stock Exchangeunder the symbol FUL. As of January 20, 2022, there were 1,396 common shareholders of record for our common stock.
Issuer Purchases of Equity Securities
Information on our purchases of equity securities during the fourth quarter of 2021 is as follows:
| (c) |
(d) |
|||||||||||||||
| Total Number of |
Approximate Dollar |
|||||||||||||||
| (a) |
Shares |
Value of Shares that |
||||||||||||||
| Total |
(b) |
Purchased as |
may yet be |
|||||||||||||
| Number of |
Average |
Part of a Publicly |
Purchased Under the |
|||||||||||||
| Shares |
Price Paid |
Announced Plan |
Plan or Program |
|||||||||||||
| Period |
Purchased |
per Share |
or Program |
(thousands) |
||||||||||||
| August 29, 2021 - October 2, 2021 |
103 | $ | 66.01 | - | $ | 187,170 | ||||||||||
| October 3, 2021 - October 30, 2021 |
- | $ | - | - | $ | 187,170 | ||||||||||
| October 31, 2021 - November 27, 2021 |
100 | $ | 72.09 | - | $ | 187,170 | ||||||||||
On April 6, 2017, the Board of Directors authorized a share repurchase program of up to $200.0 million of our outstanding common shares for a period of up to five years. Under the program, we are authorized to repurchase shares for cash on the open market, from time to time, in privately negotiated transactions or block transactions, or through an accelerated repurchase agreement. The timing of such repurchases is dependent on price, market conditions and applicable regulatory requirements. Upon repurchase of the shares, we reduced our common stock for the par value of the shares with the excess being applied against additional paid in capital. This authorization replaces the September 30, 2010 authorization to repurchase shares.
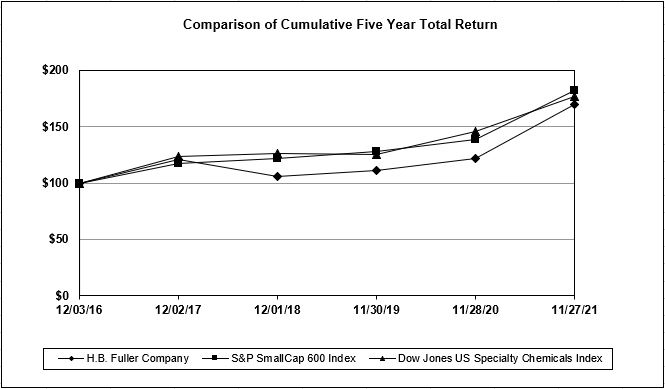
Total Shareholder Return Graph
The line graph below compares the cumulative total shareholder return on our common stock for the last five fiscal years with cumulative total return on the S&P Small Cap 600 Index and Dow Jones U.S. Specialty Chemicals Index. This graph assumes a $100 investment in each of H.B. Fuller, the S&P Small Cap 600 Index and the Dow Jones U.S. Specialty Chemicals Index at the close of trading on December 3, 2016, and also assumes the reinvestment of all dividends.
Item 6. Selected Financial Data
Reserved.
Item 7. Management's Discussion and Analysis of Financial Condition and Results of Operations
Overview
H.B. Fuller Company is a global formulator, manufacturer and marketer of adhesives and other specialty chemical products. We have three reportable segments: Hygiene, Health and Consumable Adhesives, Engineering Adhesives and Construction Adhesives.
The Hygiene, Health and Consumable Adhesives operating segment manufactures and supplies adhesives products in the assembly, packaging, converting, nonwoven and hygiene, health and beauty, flexible packaging, graphic arts and envelope markets. The Engineering Adhesives operating segment provides high-performance adhesives to the transportation, electronics, medical, clean energy, aerospace and defense, performance wood, insulating glass, textile, appliance and heavy machinery markets. The Construction Adhesives operating segment manufactures and provides specialty adhesives, sealants, tapes, mortars, grouts, and application devices for commercial building roofing systems, heavy infrastructure projects, road/highway/airport transportation applications, telecom/5G utilities, industrial LNG plants, building envelope applications, HVAC insulation systems, and for both residential and commercial flooring underlayment solutions.
Total Company
When reviewing our financial statements, it is important to understand how certain external factors impact us. These factors include:
| ● |
Changes in the prices of our raw materials that are primarily derived from refining crude oil and natural gas, |
| ● |
Global supply of and demand for raw materials, |
| ● |
Economic growth rates, and |
| ● |
Currency exchange rates compared to the U.S. dollar |
We purchase thousands of raw materials, the majority of which are petroleum/natural gas derivatives. The price of these derivatives impacts the cost of our raw materials. However, the supply of and demand for key raw materials has a greater impact on our costs. As demand increases in high-growth areas, the supply of key raw materials may tighten, resulting in certain materials being put on allocation. Natural disasters, such as hurricanes, also can have an impact as key raw material producers are shut down for extended periods of time. We continually monitor capacity utilization figures, market supply and demand conditions, feedstock costs and inventory levels, as well as derivative and intermediate prices, which affect our raw materials. With approximately 75 percent of our cost of sales accounted for by raw materials, our financial results are extremely sensitive to changing costs in this area.
The pace of economic growth directly impacts certain industries to which we supply products. For example, adhesives-related revenues from durable goods customers in areas such as appliances, furniture and other woodworking applications tend to fluctuate with the overall economic activity. In business components such as Construction Adhesives and insulating glass in Engineering Adhesives, revenues tend to move with more specific economic indicators such as housing starts and other construction-related activity.
The movement of foreign currency exchange rates as compared to the U.S. dollar impacts the translation of the foreign entities’ financial statements into U.S. dollars. As foreign currencies weaken against the U.S. dollar, our revenues and costs decrease as the foreign currency-denominated financial statements translate into fewer U.S. dollars. The fluctuations of the Euro and the Chinese renminbi against the U.S. dollar have the largest impact on our financial results as compared to all other currencies. In 2021, currency fluctuations had a positive impact on net revenue of approximately $64.0 million as compared to 2020.
Key financial results andtransactions for 2021 included the following:
| ● |
Net revenue increased 17.5 percent from 2020 primarily driven by a 9.6 percent increase in sales volume, a 5.6 percent increase in product pricing and a 2.3 percent increase due to currency fluctuations. |
| ● |
Gross profit margin decreased to 25.8 percent from 27.1 percent in 2020 primarily due to higher raw material costs partially offset by higher net revenue. |
| ● |
Cash flow generated by operating activities was $213.3 million in 2021 as compared to $331.6 million in 2020. |
Our total year organic sales growth, which we define as the combined variances from sales volume and product pricing, increased 15.2 percent for 2021 compared to 2020.
In 2021, our diluted earnings per share was $2.97 compared to $2.36 in 2020. The higher earnings per share in 2021 compared to 2020 was primarily due to higher net revenue, higher other income, net and lower interest expense, partially offset by higher raw material and operating costs and higher income tax expense.
Changes in Accounting Principles
In the first quarter of 2021, we adopted new accounting standards related to the measurement of credit losses on financial statements requiring financial assets measured at amortized cost basis be presented at the net amount expected to be collected. Prior periods were not restated for this adoption.
In the first quarter of 2020, we adopted new accounting standards related to the accounting for leases which requires us to recognize the assets and liabilities arising from all leases, including those classified as operating leases under previous accounting guidance, on the balance sheet and requires disclosure of key information about leasing arrangements. Prior periods were not restated for this adoption.
Project ONE
In December 2012, our Board of Directors approved a multi-year project to replace and enhance our existing core information technology platforms. The scope for this project includes most of the basic transaction processing for the company including customer orders, procurement, manufacturing and financial reporting. The project envisions harmonized business processes for all of our operating segments supported with one standard software configuration. The execution of this project, which we refer to as Project ONE, is being supported by internal resources and consulting services. Implementation of Project ONE began in our North America adhesives business in 2014 and, through 2021, we completed implementation of this system in various parts of our business including Latin America (except Brazil), Australia, and various other businesses in North America and EIMEA. During 2022 and beyond, we will continue implementation in North America, EIMEA and Asia Pacific.
Total expenditures for Project ONE are estimated to be $170 to $185 million, of which 55-60% is expected to be capital expenditures. Our total project-to-date expenditures are approximately $133 million, of which approximately $73 million are capital expenditures. Given the complexity of the implementation, the total investment to complete the project may exceed our estimate.
Restructuring Plan
During the fourth quarter of 2019, we approved a restructuring plan related to organizational changes and other actions to optimize operations in connection with the realignment of the Company into three global business units (“2020 Restructuring Plan”). We have incurred costs of $18.6 million under this plan as of November 27, 2021. We expect to incur total costs of approximately $20.0 million ($15.8 million after-tax), which includes cash expenditures for severance and related employee costs globally, costs related to streamlining of processes, and other restructuring-related costs. The 2020 Restructuring Plan was implemented in the fourth quarter of 2019 and is currently expected to be completed in fiscal 2022.
Critical Accounting Policies and Significant Estimates
Management’s discussion and analysis of our results of operations and financial condition are based upon the Consolidated Financial Statements, which have been prepared in accordance with accounting principles generally accepted in the United States of America. The preparation of these financial statements requires us to make estimates and judgments that affect the reported amounts of assets, liabilities, revenues and expenses and related disclosure of contingent assets and liabilities. We believe the critical accounting policies and areas that require the most significant judgments and estimates to be used in the preparation of the Consolidated Financial Statements relate to goodwill impairment; pension and other postretirement plans; long-lived assets recoverability; valuation of product, environmental and other litigation liabilities; valuation of deferred tax assets and accuracy of tax contingencies; and valuation of acquired assets and liabilities.
Goodwill
Goodwill is the excess of cost of an acquired entity over the amounts assigned to assets acquired and liabilities assumed in a purchase business combination. Goodwill is allocated to our reporting units, which are our operating segments or one level below our operating segments (the component level). Reporting units are determined by the discrete financial information available for the component and whether it is regularly reviewed by segment management. Components are aggregated into a single reporting unit if they share similar economic characteristics. Our reporting units are as follows: Hygiene, Health and Consumable Adhesives, Engineering Adhesives and Construction Adhesives.
We evaluate our goodwill for impairment annually at the beginning of the fourth quarter or earlier upon the occurrence of substantive unfavorable changes in economic conditions, industry trends, costs, cash flows, or ongoing declines in market capitalization. The quantitative impairment test requires judgment, including the identification of reporting units, the assignment of assets, liabilities and goodwill to reporting units, and the determination of fair value of each reporting unit. The impairment test requires the comparison of the fair value of each reporting unit with its carrying amount, including goodwill. In performing the impairment test, we determined the fair value of our reporting units through the income approach by using discounted cash flow (“DCF”) analyses. Determining fair value requires the Company to make judgments about appropriate discount rates, perpetual growth rates and the amount and timing of expected future cash flows. The cash flows employed in the DCF analysis for each reporting unit are based on the reporting unit's budget, long-term business plan and recent operating performance. Discount rate assumptions are based on an assessment of the risk inherent in the future cash flows of the respective reporting unit and market conditions. Given the inherent uncertainty in determining the assumptions underlying a DCF analysis, actual results may differ from those used in our valuations. In assessing the reasonableness of the determined fair values, we also reconciled the aggregate determined fair value of the Company to the Company's market capitalization, which, at the date of our 2021 impairment test, included a 28 percent control premium.
For the 2021 impairment test, the fair value of the reporting units exceeded the respective carrying values by 38 percent to 129 percent ("headroom"). Significant assumptions used in the DCF analysis included discount rates that ranged from 8.2 percent to 9.1 percent and long-term revenue growth rates.
See Note 5 to the Consolidated Financial Statements for further information regarding goodwill.
Pension and Other Postretirement Plan Assumptions
We sponsor defined-benefit pension plans in both the U.S. and non-U.S. entities. Also in the U.S., we sponsor other postretirement plans for health care and life insurance benefits. Expenses and liabilities for the pension plans and other postretirement plans are actuarially calculated. These calculations are based on our assumptions related to the discount rate, expected return on assets, projected salary increases and health care cost trend rates. Note 10 to the Consolidated Financial Statements includes disclosure of assumptions employed in these measurements for both the non-U.S. and U.S. plans.
The discount rate assumption is determined using an actuarial yield curve approach, which results in a discount rate that reflects the characteristics of the plan. The approach identifies a broad population of corporate bonds that meet the quality and size criteria for the particular plan. We use this approach rather than a specific index that has a certain set of bonds that may or may not be representative of the characteristics of our particular plan. A higher discount rate reduces the present value of the pension obligations. The discount rate for the U.S. pension plan was 2.76 percent at November 27, 2021, 2.53 percent at November 28, 2020 and 3.19 percent at November 30, 2019. Net periodic pension cost for a given fiscal year is based on assumptions developed at the end of the previous fiscal year. A discount rate change of 0.5 percentage points at November 27, 2021 would impact U.S. pension and other postretirement plan (income) expense by approximately $0.1 million (pre-tax) in fiscal 2021. Discount rates for non-U.S. plans are determined in a manner consistent with the U.S. plans.
The expected long-term rate of return on plan assets assumption for the U.S. pension plan was 7.25 percent in 2021 and 7.50 in 2020 and 2019. Our expected long-term rate of return on U.S. plan assets was based on our target asset allocation assumption of 60 percent equities and 40 percent fixed-income. Management, in conjunction with our external financial advisors, determines the expected long-term rate of return on plan assets by considering the expected future returns and volatility levels for each asset class that are based on historical returns and forward looking observations. For 2021, the expected long-term rate of return on the target equities allocation was 8.00 percent and the expected long-term rate of return on the target fixed-income allocation was 3.90 percent. The total plan rate of return assumption included an estimate of the effect of diversification and the plan expense. A change of 0.5 percentage points for the expected return on assets assumption would impact U.S. net pension and other postretirement plan expense by approximately $2.7 million (pre-tax).
Management, in conjunction with our external financial advisors, uses the actual historical rates of return of the asset categories to assess the reasonableness of the expected long-term rate of return on plan assets. The most recent 10-year and 20-year historical equity returns are shown in the table below. Our expected rate of return on our total portfolio is consistent with the historical patterns observed over longer time frames.
| Total |
Fixed |
|||||||||||
| U.S. Pension Plan Historical Actual Rates of Return |
Portfolio |
Equities |
Income |
|||||||||
| 10-year period |
9.5 | % | 9.0 | % | 6.7 | % | ||||||
| 20-year period |
7.2 | % | 7.3 | % | 7.9 | %* | ||||||
* Beginning in 2006, our target allocation migrated from 100 percent equities to our current allocation of 60 percent equities and 40 percent fixed-income. The historical actual rate of return for the fixed income of 8.2 percent is since inception (15 years, 11 months).
The expected long-term rate of return on plan assets assumption for non-U.S. pension plans was a weighted-average of 6.15 percent in 2021 compared to 6.23 percent in 2020 and 6.21 percent in 2019. The expected long-term rate of return on plan assets assumption used in each non-U.S. plan is determined on a plan-by-plan basis for each local jurisdiction and is based on expected future returns for the investment mix of assets currently in the portfolio for that plan. Management, in conjunction with our external financial advisors, develops expected rates of return for each plan, considers expected long-term returns for each asset category in the plan, reviews expectations for inflation for each local jurisdiction, and estimates the effect of active management of the plan’s assets. Our largest non-U.S. pension plans are in the United Kingdom and Germany. The expected long-term rate of return on plan assets for the United Kingdom was 6.75 percent and the expected long-term rate of return on plan assets for Germany was 5.50 percent. Management, in conjunction with our external financial advisors, uses actual historical returns of the asset portfolio to assess the reasonableness of the expected rate of return for each plan.
The projected salary increase assumption is based on historic trends and comparisons to the external market. Higher rates of increase result in higher pension expenses. As this rate is also a long-term expected rate, it is less likely to change on an annual basis. Under the U.S. pension plan, the compensation amount was locked-in as of May 31, 2011 and thus the benefit no longer includes compensation increases. The 4.50 percent rate for 2020 and 2019 is for the supplemental executive retirement plan only; for 2021, there is no compensation increase as subsequent to November 27, 2021, there were no active employees in the supplemental executive retirement plan. Projected salary increase assumptions for non-U.S. plans are determined in a manner consistent with the U.S. plans.
Recoverability of Long-Lived Assets
The assessment of the recoverability of long-lived assets reflects our assumptions and estimates. Factors that we must estimate when performing impairment tests include sales volume, prices, inflation, currency exchange rates, tax rates and capital spending. Significant judgment is involved in estimating these factors, and they include inherent uncertainties. The measurement of the recoverability of these assets is dependent upon the accuracy of the assumptions used in making these estimates and how the estimates compare to the eventual future operating performance of the specific businesses to which the assets are attributed.
Judgments made by us include the expected useful lives of long-lived assets. The ability to realize undiscounted cash flows in excess of the carrying amounts of such assets is affected by factors such as the ongoing maintenance and improvement of the assets, changes in economic conditions and changes in operating performance.
Product, Environmental and Other Litigation Liabilities
As disclosed in Item 3. Legal Proceedings and in Note 1 and Note 14 to the Consolidated Financial Statements, we are subject to various claims, lawsuits and other legal proceedings. Reserves for loss contingencies associated with these matters are established when it is determined that a liability is probable and the amount can be reasonably estimated. The assessment of the probable liabilities is based on the facts and circumstances known at the time that the financial statements are being prepared. For cases in which it is determined that a liability is probable but only a range for the potential loss exists, the minimum amount of the range is recorded and subsequently adjusted as better information becomes available.
For cases in which insurance coverage is available, the gross amount of the estimated liabilities is accrued, and a receivable is recorded for any probable estimated insurance recoveries. A discussion of environmental, product and other litigation liabilities is disclosed in Item 3. Legal Proceedings and Note 14 to the Consolidated Financial Statements.
Based upon currently available facts, we do not believe that the ultimate resolution of any pending legal proceeding, individually or in the aggregate, will have a material adverse effect on our long-term financial condition. However, adverse developments and/or periodic settlements could negatively affect our results of operations or cash flows in one or more future quarters.
Income Tax Accounting
As part of the process of preparing the Consolidated Financial Statements, we are required to estimate income taxes in each of the jurisdictions in which we operate. The process involves estimating actual current tax expense along with assessing temporary differences resulting from differing treatment of items for book and tax purposes. These temporary differences result in deferred tax assets and liabilities, which are included in the Consolidated Balance Sheets. We record a valuation allowance to reduce our deferred tax assets to the amount that is more-likely-than-not to be realized. We have considered future taxable income and ongoing tax planning strategies in assessing the need for the valuation allowance. Increases in the valuation allowance result in additional expense to be reflected within the tax provision in the Consolidated Statements of Income. As of November 27, 2021, the valuation allowance to reduce deferred tax assets totaled $11.3 million.
We recognize tax benefits for tax positions for which it is more-likely-than-not that the tax position will be sustained by the applicable tax authority at the largest amount of tax benefit that is greater than fifty percent likely of being realized upon ultimate settlement. We do not recognize a financial statement benefit for a tax position that does not meet the more-likely-than-not threshold. We believe that our liabilities for income taxes reflect the most likely outcome. It is difficult to predict the final outcome or the timing of the resolution of any particular tax position. Future changes in judgment related to the resolution of tax positions will impact earnings in the quarter of such change. We adjust our income tax liabilities related to tax positions in light of changing facts and circumstances. Settlement with respect to a tax position would usually require cash. Based upon our analysis of tax positions taken on prior year returns and expected tax positions to be taken for the current year tax returns, we have identified gross uncertain tax positions of $13.3 million as of November 27, 2021.
We have not recorded U.S. deferred income taxes for certain of our non-U.S. subsidiaries undistributed earnings as such amounts are intended to be indefinitely reinvested outside of the U.S. Should we change our business strategies related to these non-U.S. subsidiaries, additional U.S. tax liabilities could be incurred. It is not practical to estimate the amount of these additional tax liabilities. See Note 11 to the Consolidated Financial Statements for further information on income tax accounting.
Acquisition Accounting
As we enter into business combinations, we perform acquisition accounting requirements including the following:
| ● |
Identifying the acquirer, |
| ● |
Determining the acquisition date, |
| ● |
Recognizing and measuring the identifiable assets acquired and the liabilities assumed, and |
| ● |
Recognizing and measuring goodwill or a gain from a bargain purchase |
We complete valuation procedures and record the resulting fair value of the acquired assets and assumed liabilities based upon the valuation of the business enterprise and the tangible and intangible assets acquired. Enterprise value allocation methodology requires management to make assumptions and apply judgment to estimate the fair value of assets acquired and liabilities assumed. If estimates or assumptions used to complete the enterprise valuation and estimates of the fair value of the acquired assets and assumed liabilities significantly differed from assumptions made, the resulting difference could materially affect the fair value of net assets.
The calculation of the fair value of the tangible assets, including property, plant and equipment, utilizes the cost approach, which computes the cost to replace the asset, less accrued depreciation resulting from physical deterioration, functional obsolescence and external obsolescence. The calculation of the fair value of the identified intangible assets are determined using cash flow models following the income approach or a discounted market-based methodology approach. Significant inputs include estimated revenue growth rates, gross margins, operating expenses, and estimated attrition, royalty and discount rates. Goodwill is recorded as the difference in the fair value of the acquired assets and assumed liabilities and the purchase price.
Results of Operations
Net revenue
| ($ in millions) |
2021 |
2020 |
2021 vs 2020 |
|||||||||
| Net revenue |
$ | 3,278.0 | $ | 2,790.3 | 17.5 | % | ||||||
We review variances in net revenue in terms of changes related to sales volume and product pricing (referred to as organic revenue growth), business acquisitions and divestitures (M&A) and changes in foreign currency exchange rates. The following table shows the net revenue variance analysis for fiscal 2021 compared to fiscal 2020:
| 2021 vs 2020 |
||||
| Organic revenue growth |
15.2 | % | ||
| Currency |
2.3 | % | ||
| Net revenue growth |
17.5 | % | ||
Organic revenue growth was a positive 15.2 percent in 2021 compared to 2020 driven by a 22.2 percent increase in Engineering Adhesives, a 16.1 percent increase in Construction Adhesives and a 9.2 percent increase in Hygiene, Health and Consumable Adhesives. The positive 2.3 percent currency impact was primarily driven by a stronger Euro and Chinese renminbi partially offset by a weaker Brazilian real, Turkish lira and Argentinian peso compared to the U.S. dollar.
Cost of sales
| ($ in millions) |
2021 |
2020 |
2021 vs 2020 |
|||||||||
| Raw materials |
$ | 1,810.0 | $ | 1,476.4 | 22.6 | % | ||||||
| Other manufacturing costs |
622.7 | 557.2 | 11.7 | % | ||||||||
| Cost of sales |
$ | 2,432.7 | $ | 2,033.6 | 19.6 | % | ||||||
| Percent of net revenue |
74.2 | % | 72.9 | % | ||||||||
Cost of sales in 2021 compared to 2020 increased 130 basis points as a percentage of net revenue. Raw material cost as a percentage of net revenue increased 230 basis points in 2021 compared to 2020 due to higher raw material costs. Other manufacturing costs as a percentage of net revenue decreased 100 basis points in 2021 compared to 2020 due to higher net revenue.
Gross profit
| ($ in millions) |
2021 |
2020 |
2021 vs 2020 |
|||||||||
| Gross profit |
$ | 845.3 | $ | 756.7 | 11.7 | % | ||||||
| Percent of net revenue |
25.8 | % | 27.1 | % | ||||||||
Gross profit in 2021 increased 11.7 percent and gross profit margin decreased 130 basis points compared to 2020. The decrease in gross profit margin was primarily due to higher raw material costs partially offset by higher net revenue.
Selling, general and administrative (SG&A) expenses
| ($ in millions) |
2021 |
2020 |
2021 vs 2020 |
|||||||||
| SG&A |
$ | 592.7 | $ | 538.3 | 10.1 | % | ||||||
| Percent of net revenue |
18.1 | % | 19.3 | % | ||||||||
SG&A expenses for 2021 increased $54.4 million, or 10.1 percent, compared to 2020. The increase is primarily due to higher discretionary spending and compensation costs compared to the prior year and unfavorable impact of foreign currency exchange rates on spending outside the U.S. SG&A expenses as a percent of revenue decreased by 120 basis points compared with the prior year.
Other income, net
| ($ in millions) |
2021 |
2020 |
||||||
| Other income, net |
$ | 32.9 | $ | 15.4 | ||||
Other income, net includes foreign transaction losses of $6.0 million and $3.1 million in 2021 and 2020, respectively. Loss on disposal of assets were $0.6 million and $0.1 million in 2021 and 2020, respectively. Defined benefit pension benefit was $32.1 million and $17.9 million in 2021 and 2020, respectively. Other income of $7.4 million and $0.7 million was also included in 2021 and 2020, respectively. Other income in 2021 includes gains related to legal entity mergers and a transactional tax legal settlement in Brazil.
Interest expense
| ($ in millions) |
2021 |
2020 |
||||||
| Interest expense |
$ | 78.1 | $ | 86.8 | ||||
Interest expense was $78.1 million and $86.8 million in 2021 and 2020, respectively. The decrease in interest expense is due to lower U.S. debt balances and lower interest rates. We capitalized $0.9 million and $0.6 million of interest expense in 2021 and 2020, respectively.
Interest income
| ($ in millions) |
2021 |
2020 |
||||||
| Interest income |
$ | 9.5 | $ | 11.4 | ||||
Interest income in 2021 and 2020 was $9.5 million and $11.4 million, respectively. The decrease in interest income in 2021 compared to 2020 is due to lower interest rates and lower cash balances.
Income tax expense:
| ($ in millions) |
2021 |
2020 |
||||||
| Income tax expense |
$ | 63.0 | $ | 41.9 | ||||
| Effective tax rate |
29.1 | % | 26.5 | % | ||||
Income tax expense of $63.0 million in 2021 includes $4.3 million of discrete tax expense, primarily related to the revaluation of cross-currency swap agreements due to depreciation of the Euro versus the U.S. dollar, changes in valuation allowances and several foreign discrete items. Excluding the discrete tax expense of $4.3 million, the overall effective tax rate was 27.1 percent.
Income tax expense of $41.9 million in 2020 includes $1.1 million of discrete tax expense, primarily related to tax expense for uncertain tax positions and several foreign discrete items, offset by U.S. benefits for state deferred rate changes and a benefit related to the revaluation of cross-currency swap agreements due to appreciation of the Euro versus U.S. dollar. Excluding the discrete tax expense of $1.1 million, the overall effective tax rate was 25.8 percent.
The increase in the overall effective tax rate for 2021 compared to 2020, excluding the impact of discrete items, is primarily due to the change in the foreign rate differential resulting from a change in mix of earnings across jurisdictions.
Income from equity method investments
| ($ in millions) |
2021 |
2020 |
||||||
| Income from equity method investments |
$ | 7.7 | $ | 7.4 | ||||
The income from equity method investments relates to our 50 percent ownership of the Sekisui-Fuller joint venture in Japan. The higher income for 2021 compared to 2020 relates to higher net income in our joint venture.
Net income attributable to H.B. Fuller
| ($ in millions) |
2021 |
2020 |
2021 vs 2020 |
|||||||||
| Net income attributable to H.B. Fuller |
$ | 161.4 | $ | 123.7 | 30.5 | % | ||||||
| Percent of net revenue |
4.9 | % | 4.4 | % | ||||||||
Net income attributable to H.B. Fuller was $161.4 million in 2021 compared to $123.7 million in 2020. Diluted earnings per share were $2.97 per share in 2021 and $2.36 per share in 2020.
Operating Segment Results
We are required to report segment information in the same way that we internally organize our business for assessing performance and making decisions regarding allocation of resources. For segment evaluation by the chief operating decision maker, segment operating income is defined as gross profit less SG&A expenses. Inter-segment revenues are recorded at cost plus a markup for administrative costs. Corporate expenses, other than those included in Corporate Unallocated, are allocated to each operating segment.
We have three reportable segments: Hygiene, Health and Consumable Adhesives, Engineering Adhesives and Construction Adhesives. The tables below provide certain information regarding the net revenue and segment operating income of each of our operating segments. Corporate Unallocated includes business acquisition and integration-related charges, organizational restructuring-related charges, the results of business divestitures and costs related to the implementation of Project ONE.
Net Revenue by Segment
| 2021 |
2020 |
|||||||||||||||
| Net |
% of |
Net |
% of |
|||||||||||||
| ($ in millions) |
Revenue |
Total |
Revenue |
Total |
||||||||||||
| Hygiene, Health and Consumable Adhesives |
$ | 1,472.7 | 45 | % | $ | 1,332.8 | 48 | % | ||||||||
| Engineering Adhesives |
1,371.8 | 42 | % | 1,088.3 | 39 | % | ||||||||||
| Construction Adhesives |
433.5 | 13 | % | 369.2 | 13 | % | ||||||||||
| Segment total |
3,278.0 | 100 | % | 2,790.3 | 100 | % | ||||||||||
| Corporate Unallocated |
- | 0 | % | - | 0 | % | ||||||||||
| Total |
$ | 3,278.0 | 100 | % | $ | 2,790.3 | 100 | % | ||||||||
Segment Operating Income (Loss)
| 2021 |
2020 |
|||||||||||||||
| Operating |
% of |
Operating |
% of |
|||||||||||||
| ($ in millions) |
Income (Loss) |
Total |
Income (Loss) |
Total |
||||||||||||
| Hygiene, Health and Consumable Adhesives |
$ | 138.4 | 55 | % | $ | 130.8 | 60 | % | ||||||||
| Engineering Adhesives |
135.9 | 54 | % | 104.0 | 48 | % | ||||||||||
| Construction Adhesives |
14.1 | 5 | % | 11.1 | 5 | % | ||||||||||
| Segment total |
288.4 | 114 | % | 245.9 | 113 | % | ||||||||||
| Corporate Unallocated |
(35.8 | ) | (14 | )% | (27.6 | ) | (13 | )% | ||||||||
| Total |
$ | 252.6 | 100 | % | $ | 218.3 | 100 | % | ||||||||
The following table provides a reconciliation of segment operating income to income before income taxes and income from equity method investments, as reported in the Consolidated Statements of Income.
| ($ in millions) |
2021 |
2020 |
||||||
| Segment operating income |
$ | 252.6 | $ | 218.3 | ||||
| Other income, net |
32.9 | 15.4 | ||||||
| Interest expense |
(78.1 | ) | (86.8 | ) | ||||
| Interest income |
9.5 | 11.4 | ||||||
| Income before income taxes and income from equity method investments |
$ | 216.9 | $ | 158.3 | ||||
Hygiene, Health and Consumable Adhesives
| ($ in millions) |
2021 |
2020 |
2021 vs 2020 |
|||||||||
| Net revenue |
$ | 1,472.7 | $ | 1,332.8 | 10.5 | % | ||||||
| Segment operating income |
$ | 138.4 | $ | 130.8 | 5.8 | % | ||||||
| Segment profit margin % |
9.4 | % | 9.8 | % | ||||||||
The following tables provide details of Hygiene, Health and Consumable Adhesives net revenue variances:
| 2021 vs 2020 |
||||
| Organic revenue growth |
9.2 | % | ||
| Currency |
1.3 | % | ||
| Net revenue growth |
10.5 | % | ||
Net revenue increased 10.5 percent in 2021 compared to 2020. The 9.2 percent increase in organic growth was attributable to an increase in sales volume and favorable product pricing. The positive currency effect was due to the stronger Euro and Chinese renminbi partially offset by a weaker Brazilian real, Argentinian peso and Turkish lira compared to the U.S. dollar. As a percentage of net revenue, raw material costs increased 160 basis points due to higher raw material costs partially offset by higher net revenue. Other manufacturing costs as a percentage of net revenue decreased 90 basis points due to higher net revenue. SG&A expenses as a percentage of net revenue decreased 30 basis points in 2021 as compared to 2020. Segment operating income increased 5.8 percent and segment operating margin as a percentage of net revenue decreased 40 basis points in 2021 as compared to 2020.
Engineering Adhesives
| ($ in millions) |
2021 |
2020 |
2021 vs 2020 |
|||||||||
| Net revenue |
$ | 1,371.8 | $ | 1,088.3 | 26.1 | % | ||||||
| Segment operating income |
$ | 135.9 | $ | 104.0 | 30.7 | % | ||||||
| Segment profit margin % |
9.9 | % | 9.6 | % | ||||||||
The following tables provide details of Engineering Adhesives net revenue variances:
| 2021 vs 2020 |
||||
| Organic revenue growth |
22.2 | % | ||
| Currency |
3.9 | % | ||
| Net revenue growth |
26.1 | % | ||
Net revenue increased 26.1 percent in 2021 compared to 2020. The 22.2 percent increase in organic growth was attributable to higher sales volume and favorable product pricing. The positive currency effect was due to a stronger Euro and Chinese renminbi partially offset by a weaker Brazilian real, Turkish lira and Argentinian peso compared to the U.S. dollar. Raw material costs as a percentage of net revenue increased 320 basis points due to higher raw material costs partially offset by higher net revenue. Other manufacturing costs as a percentage of net revenue decreased 110 basis points due to higher net revenue. SG&A expense as a percentage of net revenue decreased 240 basis points due to higher net revenue. Segment operating income increased 30.7 percent and segment operating margin increased 30 basis points compared to 2020.
Construction Adhesives
| ($ in millions) |
2021 |
2020 |
2021 vs 2020 |
|||||||||
| Net revenue |
$ | 433.5 | $ | 369.2 | 17.4 | % | ||||||
| Segment operating income (loss) |
$ | 14.1 | $ | 11.1 | 26.9 | % | ||||||
| Segment profit margin % |
3.3 | % | 3.0 | % | ||||||||
The following tables provide details of Construction Adhesives net revenue variances:
| 2021 vs 2020 |
||||
| Organic revenue growth |
16.1 | % | ||
| Currency |
1.3 | % | ||
| Net revenue growth |
17.4 | % | ||
Net revenue increased 17.4 percent in 2021 compared to 2020. The 16.1 percent increase in organic growth was attributable to higher sales volume and favorable product pricing. The positive currency effect was due to the stronger Australian dollar, Canadian dollar and Euro compared to the U.S. dollar. Raw material costs as a percentage of net revenue increased 360 basis points due to higher raw material costs partially offset by higher net revenue. Other manufacturing costs as a percentage of net revenue decreased 220 basis points primarily due to higher net revenue. SG&A expenses as a percentage of net revenue decreased 170 basis points also due to higher net revenue. Segment operating income increased 26.9 percent and segment operating margin increased 30 basis points compared to 2020.
Corporate Unallocated
| ($ in millions) |
2021 |
2020 |
2021 vs 2020 |
|||||||||
| Net revenue |
$ | - | $ | - | NMP |
|||||||
| Segment operating loss |
$ | (35.8 | ) | $ | (27.6 | ) | 29.8 | % | ||||
| Segment profit margin % |
NMP |
NMP |
||||||||||
NMP = Non-meaningful percentage
Corporate Unallocated includes acquisition and integration-related charges, restructuring-related charges, the results of business divestitures and costs related to the implementation of Project ONE.
Segment operating loss increased 29.8 percent in 2021 reflecting increased organizational realignment costs compared to 2020.
Financial Condition, Liquidity and Capital Resources
Total cash and cash equivalents as of November 27, 2021 were $61.8 million compared to $100.5 million as of November 28, 2020. Total long and short-term debt was $1,616.5 million as of November 27, 2021 and $1,773.9 million as of November 28, 2020.
We believe that cash flows from operating activities will be adequate to meet our short-term and long-term liquidity and capital expenditure needs. In addition, we believe we have the ability to obtain both short-term and long-term debt to meet our financing needs for the foreseeable future. Cash available in the United States has historically been sufficient and we expect it will continue to be sufficient to fund U.S. operations, U.S. capital spending and U.S. pension and other postretirement benefit contributions in addition to funding U.S. acquisitions, dividend payments, debt service and share repurchases as needed. For those international earnings considered to be reinvested indefinitely, we currently have no intention to, and plans do not indicate a need to, repatriate these funds for U.S. operations.
Our credit agreements include restrictive covenants that, if not met, could lead to a renegotiation of our credit lines and a significant increase in our cost of financing. At November 27, 2021, we were in compliance with all covenants of our contractual obligations as shown in the following table:
| Covenant |
Debt Instrument |
Measurement |
Result as of November 27, 2021 |
| Total Indebtedness / TTM EBITDA |
Term Loan B Credit Agreement |
Not greater than 5.9 |
2.2 |
| Total Indebtedness / TTM EBITDA | Revolving Credit Agreement | Not greater than 5.9 | 2.2 |
| TTM EBITDA / Consolidated Interest Expense | Revolving Credit Agreement | Not less than 2.0 | 5.8 |
| ● |
TTM = trailing 12 months |
| ● |
EBITDA for Term Loan B covenant purposes is defined as consolidated net income, plus interest expense, expense for taxes paid or accrued, depreciation and amortization, certain non-cash impairment losses, extraordinary non-cash losses incurred other than in the ordinary course of business, nonrecurring extraordinary non-cash restructuring charges and the non-cash impact of purchase accounting, expenses related to the Royal Adhesives acquisition not to exceed $40.0 million, expenses relating to the integration of Royal Adhesives during the fiscal years ending in 2017, 2018 and 2019 not exceeding $30 million in aggregate, restructuring expenses that began prior to the Royal Adhesives acquisition incurred in fiscal years ending in 2017 and 2018 not exceeding $28 million in aggregate, and non-capitalized charges relating to the SAP implementation during fiscal years ending in 2017 through 2021 not exceeding $13 million in any single fiscal year, minus extraordinary non-cash gains. For the Total Indebtedness / TTM EBITDA ratio, TTM EBITDA is adjusted for the pro forma results from Material Acquisitions and Material Divestitures as if the acquisition or divestiture occurred at the beginning of the calculation period. The full definition is set forth in the Term Loan B Credit Agreement and can be found in the Company’s 8-K filing dated October 20, 2017. |
|
| ● | EBITDA for Revolving Credit Facility covenant purposes is defined as consolidated net income, plus interest expense, expense for taxes paid or accrued, depreciation and amortization, non-cash impairment losses related to long-lived assets, intangible assets or goodwill, nonrecurring or unusual non-cash losses incurred other than in the ordinary course of business, nonrecurring or unusual non-cash restructuring charges and the non-cash impact of purchase accounting, fees, premiums, expenses and other transaction costs incurred or paid by the borrower or any of its Subsidiaries on the effective date in connection with the transactions, this agreement and the other loan documents, the 2020 supplemental indenture and the transactions contemplated hereby and thereby, one-time, non-capitalized charges and expenses relating to the Company’s SAP implementation during fiscal years ending in 2017 through 2024, in an amount not exceeding $15.0 million in any single fiscal year of the Company, charges and expenses relating to the ASP Royal Acquisition, including but not limited to advisory and financing costs, during the Company’s fiscal years ending in 2020 and 2021, in an aggregate amount (as to such years combined) not exceeding $40.0 million, charges and expenses related to the reorganization of the Company and its subsidiaries from five business units to three business units to reduce costs during the Company’s fiscal years ending in 2020 and 2021 in an aggregate amount (as to such years combined) not exceeding $24.0 million, and charges and expenses related to the Company’s manufacturing and operations project to improve delivery, implement cost savings and reduce inventory during the Company’s fiscal years ending in 2020, 2021 and 2022 in an aggregate amount (as to such years combined) not exceeding $15.5 million. | |
| ● | Consolidated Interest Expense for the Revolving Credit Facility is defined as the interest expense (including without limitation the portion of capital lease obligations that constitutes imputed interest in accordance with GAAP) of the Company and its subsidiaries calculated on a consolidated basis for such period with respect to all outstanding indebtedness of the Company and its subsidiaries allocable to such period in accordance with GAAP. |
We believe we have the ability to meet all of our contractual obligations and commitments in fiscal 2022.
Net Financial Assets (Liabilities)
| ($ in millions) |
2021 |
2020 |
||||||
| Financial assets: |
||||||||
| Cash and cash equivalents |
$ | 61.8 | $ | 100.5 | ||||
| Foreign exchange contracts |
5.7 | 2.3 | ||||||
| Cash flow hedges |
14.5 | 2.5 | ||||||
| Financial liabilities: |
||||||||
| Notes payable |
(25.0 | ) | (16.9 | ) | ||||
| Long-term debt |
(1,591.5 | ) | (1,757.0 | ) | ||||
| Foreign exchange contracts |
(6.1 | ) | (5.3 | ) | ||||
| Interest rate swaps |
(22.9 | ) | (33.0 | ) | ||||
| Net financial liabilities |
$ | (1,563.5 | ) | $ | (1,706.9 | ) | ||
Of the $61.8 million in cash and cash equivalents as of November 27, 2021, $58.4 million was held outside the U.S. Of the $58.4 million of cash held outside the U.S., earnings on $56.0 million are indefinitely reinvested outside of the U.S. It is not practical for us to determine the U.S. tax implications of the repatriation of these funds.
There are no contractual or regulatory restrictions on the ability of consolidated and unconsolidated subsidiaries to transfer funds in the form of cash dividends, loans or advances to us, except for: 1) a credit facility limitation restricting investments, loans, advances or capital contributions from Loan Parties to non-Loan Parties in excess of $100.0 million, 2) a credit facility limitation that provides total investments, loans, advances or guarantees not otherwise permitted in the credit agreement for all subsidiaries shall not exceed $125.0 million in the aggregate, 3) a credit facility limitation that provides total investments, dividends, and distributions shall not exceed the Available Amount defined in these agreements, all three of which do not apply once our secured leverage ratio drops below 4.0x and 4) typical statutory restrictions, which prohibit distributions in excess of net capital or similar tests. The Royal Adhesives acquisition and any investments, loans, and advances established to consummate the Royal Adhesives acquisition, are excluded from the credit facility limitations described above. Additionally, we have taken the income tax position that the majority of our cash in non-U.S. locations is indefinitely reinvested.
Debt Outstanding and Debt Capacity
Notes Payable
Notes payable were $25.0 million at November 27, 2021 and $16.9 million at November 28, 2020. These amounts primarily represented various foreign subsidiaries’ short-term borrowings that were not part of committed lines. The weighted-average interest rates on these short-term borrowings were 8.1 percent in 2021 and 2020.
Long-Term Debt
Long-term debt consisted of a secured term loan (“Term Loan B”) and two unsecured public notes (“Public Notes”). The Term Loan B has a principal amount of $1,001.2 million and bears a floating interest rate at LIBOR plus 2.00 percent (2.09 percent at November 27, 2021) and matures in fiscal year 2024. The 10-year Public Notes have a principal amount of $300.0 million, bear fixed interest at 4.00 percent and mature in 2027. We are subject to a par call of 1.00 percent except within three months of the maturity date. The 8-year Public Notes have a principal amount of $300.0 million, bear fixed interest at 4.25 percent and mature in 2028. We are subject to a par call plus 50 percent of coupon in year 4, plus 25 percent of coupon in year 5 and at par thereafter. We currently have no intention to prepay the Public Notes. Additional details on the Public Notes and the Term Loan B Credit Agreement can be found in Form 8-K dated February 9, 2017, Form 8-K dated October 20, 2017 and Form 8-K dated October 20, 2020, respectively. Interest payable on our long-term debt totaled $3.4 million as of November 27, 2021.
We executed interest rate swap agreements for the purpose of obtaining a fixed interest rate on $800.0 million of the $2,150.0 million Term Loan B. We have designated forecasted interest payments resulting from the variability of 1-month LIBOR in relation to $800.0 million of the Term Loan B as the hedged item in cash flow hedges. The combined fair value of the interest rate swaps in total was a liability of $12.3 million at November 27, 2021 and was included in other liabilities in the Consolidated Balance Sheets. We are applying the hypothetical derivative method to assess hedge effectiveness for these interest rate swaps. Changes in the fair value of a hypothetically perfect swap with terms that match the critical terms of our $800.0 million variable rate Term Loan B are compared with the change in the fair value of the swaps.
We entered into interest rate swap agreements to convert our $300.0 million Public Notes that were issued on October 20, 2020 to a variable interest rate of 1-month LIBOR plus 3.28 percent. We entered into interest rate swap agreements to convert $150.0 million of our $300.0 million Public Notes that were issued on February 14, 2017 to a variable interest rate of 1-month LIBOR plus 1.86 percent. See Note 7 to the Consolidated Financial Statements for further discussion on the issuance of our Public Notes. The swaps were designated for hedge accounting treatment as fair value hedges. We applied the hypothetical derivative method to assess hedge effectiveness for this interest rate swap. Changes in the fair value of a hypothetically perfect swap with terms that match the critical terms of our fixed rate Public Notes are compared with the change in the fair value of the swaps. On May 1, 2020, we terminated the swap agreement. Upon termination, we received $15.8 million in cash. The remaining swap liability will be accounted for as a discount on long-term debt and will be amortized to interest expense over the remaining life of the Public Notes of seven years.
Lines of Credit
We have a revolving credit agreement with a consortium of financial institutions at November 27, 2021. This credit agreement creates a secured multi-currency revolving credit facility that we can draw upon to repay existing indebtedness, finance working capital needs, finance acquisitions, and for general corporate purposes up to a maximum of $400.0 million. Interest on the revolving credit facility is payable at LIBOR plus 1.50 percent (1.59 percent at November 27, 2021). A facility fee of 0.25 percent of the unused commitment under the revolving credit facility is payable quarterly. The interest rate and the facility fee are based on a leverage grid. The credit facility expires on July 22, 2024. As of November 27, 2021, our lines of credit were undrawn. Additional details on the revolving credit agreement can be found in Form 8-K dated October 20, 2020. For further information related to debt outstanding and debt capacity, see Note 7 to the Consolidated Financial Statements.
Uncertainty relating to the LIBOR phase out at the end of 2021 may adversely impact the value of, and our obligations under, our Term Loan B, Public Notes and revolving credit facility. See the applicable discussion under Item 1A. Risk Factors.
Goodwill and Other Intangible Assets
As of November 27, 2021, goodwill totaled $1,298.8 million (30.4 percent of total assets) and other intangible assets, net of accumulated amortization, totaled $687.1 million (16.1 percent of total assets).
The components of goodwill and other identifiable intangible assets, net of amortization, by segment at November 27, 2021 are as follows:
| 2021 |
||||||||||||||||
| Hygiene, Health |
||||||||||||||||
| and Consumable |
Engineering |
Construction |
||||||||||||||
| ($ in millions) |
Adhesives |
Adhesives |
Adhesives |
Total |
||||||||||||
| Goodwill |
$ | 325.4 | $ | 662.0 | $ | 311.4 | $ | 1,298.8 | ||||||||
| Purchased technology and patents |
7.0 | 36.4 | 10.2 | 53.6 | ||||||||||||
| Customer relationships |
108.0 | 253.9 | 235.6 | 597.5 | ||||||||||||
| Tradenames |
4.6 | 16.5 | 8.7 | 29.8 | ||||||||||||
| Other finite-lived intangible assets |
2.3 | 0.2 | 3.2 | 5.7 | ||||||||||||
| Indefinite-lived intangible assets |
- | 0.5 | - | 0.5 | ||||||||||||
| 2020 |
||||||||||||||||
| Hygiene, Health |
||||||||||||||||
| and Consumable |
Engineering |
Construction |
||||||||||||||
| ($ in millions) |
Adhesives |
Adhesives |
Adhesives |
Total |
||||||||||||
| Goodwill |
$ | 332.9 | $ | 667.9 | $ | 311.2 | $ | 1,312.0 | ||||||||
| Purchased technology and patents |
9.1 | 40.2 | 11.2 | 60.5 | ||||||||||||
| Customer relationships |
120.0 | 276.7 | 257.7 | 654.4 | ||||||||||||
| Tradenames |
5.3 | 18.7 | 9.9 | 33.9 | ||||||||||||
| Other finite-lived intangible assets |
2.8 | 0.3 | 3.5 | 6.6 | ||||||||||||
| Indefinite-lived intangible assets |
- | 0.5 | - | 0.5 | ||||||||||||
Selected Metrics of Liquidity and Capital Resources
Key metrics we monitor are net working capital as a percent of annualized net revenue, trade receivables days sales outstanding (DSO), inventory days on hand, free cash flow after dividends and debt capitalization ratio.
| November 27, |
November 28, |
|||||||
| 2021 |
2020 |
|||||||
| Net working capital as a percentage of annualized net revenue1 |
15.7 | % | 16.8 | % | ||||
| Trade receivables DSO (in days)2 |
62 | 60 | ||||||
| Inventory days on hand (in days)3 |
65 | 55 | ||||||
| Free cash flow after dividends4 |
$ | 82.3 | $ | 210.8 | ||||
| Debt capitalization ratio5 |
50.2 | % | 56.1 | % | ||||
1 Current quarter net working capital (trade receivables, net of allowance for doubtful accounts plus inventory minus trade payables) divided by annualized net revenue (current quarter, multiplied by 4).
2 Trade receivables net of allowance for doubtful accounts multiplied by 91 (13 weeks) and divided by the net revenue for the quarter.
3 Total inventory multiplied by 91 and divided by cost of sales (excluding delivery costs) for the quarter.
4 Net cash provided by operating activities less purchased property, plant and equipment and dividends paid. See reconciliation to net cash provided by operating activities to free cash flow after dividends below.
5 Total debt divided by (total debt plus total stockholders’ equity).
Free cash flow after dividends, a non-GAAP financial measure, is defined as net cash provided by operating activities less purchased property, plant and equipment and dividends paid. Free cash flow after dividends is an integral financial measure used by the Company to assess its ability to generate cash in excess of its operating needs, therefore, the Company believes this financial measure provides useful information to investors. The following table reflects the manner in which free cash flow after dividends is determined and provides a reconciliation of free cash flow after dividends to net cash provided by operating activities, the most directly comparable financial measure calculated and reported in accordance with U.S. GAAP.
Reconciliation of “Net cash provided by operating activities” to "Free cash flow after dividends"
| ($ in millions) |
2021 |
2020 |
||||||
| Net cash provided by operating activities |
$ | 213.3 | $ | 331.6 | ||||
| Less: Purchased property, plant and equipment |
96.1 | 87.3 | ||||||
| Less: Dividends paid |
34.9 | 33.5 | ||||||
| Free cash flow after dividends |
$ | 82.3 | $ | 210.8 | ||||
Summary of Cash Flows
Cash Flows from Operating Activities
| ($ in millions) |
2021 |
2020 |
||||||
| Net cash provided by operating activities |
$ | 213.3 | $ | 331.6 | ||||
Net income including non-controlling interest was $161.5 million in 2021 and $123.8 million in 2020. Depreciation and amortization expense totaled $143.2 million in 2021 compared to $138.8 million in 2020. Depreciation and amortization expense in 2021 and 2020 reflect assets acquired in our business acquisitions.
Changes in net working capital (trade receivables, inventory and trade payables) accounted for a use of cash of $83.9 million and a source of cash of $24.0 million in 2021 and 2020, respectively. Following is an assessment of each of the net working capital components:
| ● |
Trade Receivables, net – Changes in trade receivables resulted in a $124.8 million use of cash in 2021 compared to a $14.8 million use of cash in 2020. The higher use of cash in 2021 compared to 2020 was related to higher net revenue compared to the prior year. The DSO was 62 days at November 27, 2021 and 60 days at November 28, 2020. |
| ● |
Inventory – Changes in inventory resulted in a $135.4 million use of cash in 2021 compared to a $15.7 million source of cash in 2020. The use of cash in 2021 compared to the source of cash in 2020 was due to increasing inventory levels and higher raw materials costs in 2021 compared to 2020. Inventory days on hand were 65 days at the end of 2021 compared to 55 days at the end of 2020. |
| ● |
Trade Payables – Changes in trade payables resulted in a $176.3 million and $23.1 million source of cash in 2021and 2020, respectively. The increase in the source of cash was primarily related to the timing of payments and extension of payment terms globally. |
Contributions to our pension and other postretirement benefit plans were $3.8 million and $5.5 million in 2021 and 2020, respectively. Income taxes payable resulted in a $4.1 million use of cash and a $5.5 million source of cash in 2021 and 2020, respectively. Other assets resulted in a $79.1 million use of cash and a $38.4 million source of cash in 2021 and 2020, respectively. The use of cash in 2021 is primarily driven by an increase in pension and post-retirement assets related to year-end pension valuation and an increase in derivative assets. Accrued compensation was a $27.7 million source of cash compared to a $2.6 million source of cash in 2021 and 2020, respectively, relating to higher accruals for our employee incentive plans. Other operating activity was a $108.6 million source of cash in 2021 and a $15.7 million use of cash in 2020. Other operating activity in 2021 includes equity adjustments of approximately $55.0 million related to year-end pension valuations.
Cash Flows Used In Investing Activities
| ($ in millions) |
2021 |
2020 |
||||||
| Net cash used in investing activities |
$ | (94.7 | ) | $ | (109.5 | ) | ||
Purchases of property, plant and equipment were $96.1 million in 2021 compared to $87.3 million in 2020. The higher purchases in 2021 reflect the timing of capital projects and expenditures related to growth initiatives. Proceeds from the sale of property, plant and equipment were $3.0 million in 2021 compared to $1.5 million in 2020.
In 2021, we acquired STR Holdings, Inc. for $5.4 million. In 2020, we acquired D.H.M Adhesives, Inc. for $9.5 million and also purchased other business assets for $5.6 million. See Note 2 to the Consolidated Financial Statements for further information on acquisitions. In 2021, we received payment of a government grant related to the building of a plant in China of $5.8 million and in 2021 and 2020, we expended cash related to the building of this plant of $1.8 million and $8.6 million, respectively.
Cash Flows Used In Financing Activities
| ($ in millions) |
2021 |
2020 |
||||||
| Net cash used in financing activities |
$ | (154.1 | ) | $ | (239.2 | ) | ||
In 2021 and 2020, we repaid $156.5 million and $518.0 million of long-term debt, respectively, and in 2020, we issued $300.0 million of unsecured public notes. See Note 7 to the Consolidated Financial Statements for further discussion of debt borrowings and repayments. Cash paid for dividends were $34.9 million and $33.5 million in 2021 and 2020, respectively. Cash generated from the exercise of stock options was $32.3 million and $12.3 million in 2021 and 2020, respectively. Repurchases of common stock related to statutory minimum tax withholding upon vesting of restricted stock were $2.7 million in 2021 compared to $3.4 million in 2020. There were no repurchases from our share repurchase program in 2021 and 2020.
We are subject to mandatory prepayments in the first quarter of each fiscal year equal to 50% of Excess Cash Flow, as defined in the Term Loan B Credit Agreement, of the prior fiscal year less any voluntary prepayments made during that fiscal year. The Excess Cash Flow Percentage shall be reduced to 25% when our Secured Leverage Ratio is below 4.25:1.00 and to 0% when our Secured Leverage Ratio is below 3.75:1.00. The prepayment for the 2021 measurement period was satisfied through amounts prepaid during 2021. We have estimated the 2022 prepayment to be zero.
We expect 2022 capital expenditures to be between $100.0 million and $110.0 million.
Forward-Looking Statements and Risk Factors
The Private Securities Litigation Reform Act of 1995 provides a safe harbor for forward-looking statements. This Annual Report on Form 10-K contains forward-looking statements within the meaning of the Private Securities Litigation Reform Act of 1995. These statements may be identified by the use of words like "plan," "expect," "aim," "believe," "project," "anticipate," "intend," "estimate," "will," "should," "could" (including the negative or variations thereof) and other expressions that indicate future events and trends. These plans and expectations are based upon certain underlying assumptions, including those mentioned with the specific statements. Such assumptions are in turn based upon internal estimates and analyses of current market conditions and trends, our plans and strategies, economic conditions and other factors. These plans and expectations and the assumptions underlying them are necessarily subject to risks and uncertainties inherent in projecting future conditions and results. Actual results could differ materially from expectations expressed in the forward-looking statements if one or more of the underlying assumptions and expectations proves to be inaccurate or is unrealized. In addition to the factors described in this report, Item 1A. Risk Factors identifies some of the important factors that could cause our actual results to differ materially from those in any such forward-looking statements. In order to comply with the terms of the safe harbor, we have identified these important factors which could affect our financial performance and could cause our actual results for future periods to differ materially from the anticipated results or other expectations expressed in the forward-looking statements. These factors should be considered, together with any similar risk factors or other cautionary language that may be made elsewhere in this Annual Report on Form 10-K.
The list of important factors in Item 1A. Risk Factors does not necessarily present the risk factors in order of importance. This disclosure, including that under Forward-Looking Statements and Risk Factors, and other forward-looking statements and related disclosures made by us in this report and elsewhere from time to time, represents our best judgment as of the date the information is given. We do not undertake responsibility for updating any of such information, whether as a result of new information, future events, or otherwise, except as required by law. Investors are advised, however, to consult any further public company disclosures (such as in filings with the SEC or in our press releases) on related subjects.
Item 7A. Quantitative and Qualitative Disclosures about Market Risk
Market Risk
We are exposed to various market risks, including changes in interest rates, foreign currency rates and prices of raw materials. Market risk is the potential loss arising from adverse changes in market rates and prices, such as interest rates and foreign currency exchange rates.
Our financial performance may be negatively affected by unfavorable economic conditions. Recessionary economic conditions may have an adverse impact on our sales volumes, pricing levels and profitability. As domestic and international economic conditions change, trends in discretionary consumer spending also become unpredictable and subject to reductions due to uncertainties about the future. A general reduction in consumer discretionary spending due to a recession in the domestic and international economies, or uncertainties regarding future economic prospects, could have a material adverse effect on our results of operations.
Interest Rate Risk
Exposure to changes in interest rates results primarily from borrowing activities used to fund operations. Committed floating rate credit facilities are used to fund a portion of operations. We believe that probable near-term changes in interest rates would not materially affect financial condition, results of operations or cash flows. The annual impact on interest expense of a one-percentage point interest rate change on the outstanding balance of our variable rate debt, net of interest rate swap derivatives as of November 27, 2021, would have resulted in a change in net income of approximately $0.1 million or $0.0 per diluted share.
Foreign Exchange Risk
As a result of being a global enterprise, there is exposure to market risks from changes in foreign currency exchange rates. Our operating results and financial condition are subject to both currency translation and currency transaction risk. Approximately 57 percent of net revenue was generated outside of the United States in 2021. Principal foreign currency exposures relate to the Euro, British pound sterling, Canadian dollar, Chinese renminbi, Japanese yen, Australian dollar, Argentine peso, Brazilian real, Colombian peso, Mexican peso, Turkish lira, Egyptian pound, Indian rupee, Indonesian rupiah and Malaysian ringgit.
We enter into cross border transactions through importing and exporting goods to and from different countries and locations. These transactions generate foreign exchange risk as they create assets, liabilities and cash flows in currencies other than their functional currency. This also applies to services provided and other cross border agreements among subsidiaries. Our objective is to balance, where possible, non-functional currency denominated assets to non-functional currency denominated liabilities to have a natural hedge and minimize foreign exchange impacts.
In the event a natural hedge is not available, we take steps to minimize risks from foreign currency exchange rate fluctuations through normal operating and financing activities and, when deemed appropriate, through the use of derivative instruments. We do not enter into any speculative positions with regard to derivative instruments.
Based on 2021 financial results, a hypothetical one percent change in our cost of sales due to foreign currency rate changes would have resulted in a change in net income attributable to H.B. Fuller of approximately $9.4 million or $0.17 per diluted share. Based on 2021 financial results and foreign currency balance sheet positions as of November 27, 2021, a hypothetical overall 10 percent change in the U.S. dollar would have resulted in a change in net income of approximately $15.8 million or $0.29 per diluted share.
Raw Materials
The principal raw materials used to manufacture products include resins, polymers, synthetic rubbers, vinyl acetate monomer and plasticizers. We generally avoid sole source supplier arrangements for raw materials. While alternate supplies of most key raw materials are available, unplanned supplier production outages may lead to strained supply-demand situations for several key raw materials such as ethylene and propylene, several polymers and other petroleum derivatives such as waxes.
The purchase of raw materials is our largest expenditure. Our objective is to purchase raw materials that meet both our quality standards and production needs at the lowest total cost. Most raw materials are purchased on the open market or under contracts that limit the frequency but not the magnitude of price increases. In some cases, however, the risk of raw material price changes is managed by strategic sourcing agreements which limit price increases to increases in supplier feedstock costs, while requiring decreases as feedstock costs decline. The leverage of having substitute raw materials approved for use wherever possible is used to minimize the impact of possible price increases. Based on 2021 financial results, a hypothetical one percent change in our raw material costs would have resulted in a change in net income of approximately $13.2 million or $0.24 per diluted share.
See Item 1A. Risk Factors for a discussion of the effects of the COVID-19 pandemic on raw material cost and availability.
Recently Issued Accounting Pronouncements
See Note 1 to the Consolidated Financial Statements for information concerning new accounting standards and the impact of the implementation of these standards on our financial statements.
Item 8. Financial Statements and Supplementary Data
Report of Independent Registered Public Accounting Firm
To the Stockholders and the Board of Directors of H.B. Fuller Company
Opinion on the Financial Statements
We have audited the accompanying consolidated balance sheets of H.B. Fuller Company and subsidiaries (the Company) as of November 27, 2021 and November 28, 2020, the related consolidated statements of income, comprehensive income, total equity and cash flows for each of the two years ended November 27, 2021 and November 28, 2020, and the related notes (collectively referred to as the “consolidated financial statements”). In our opinion, the consolidated financial statements present fairly, in all material respects, the financial position of the Company at November 27, 2021 and November 28, 2020, and the results of its operations and its cash flows for each of the two years ended November 27, 2021 and November 28, 2020, in conformity with U.S. generally accepted accounting principles.
We also have audited, in accordance with the standards of the Public Company Accounting Oversight Board (United States) (PCAOB), the Company's internal control over financial reporting as of November 27, 2021, based on criteria established in Internal Control-Integrated Framework issued by the Committee of Sponsoring Organizations of the Treadway Commission (2013 framework) and our report dated January 25, 2022 expressed an unqualified opinion thereon.
Basis for Opinion
These financial statements are the responsibility of the Company's management. Our responsibility is to express an opinion on the Company’s financial statements based on our audit. We are a public accounting firm registered with the PCAOB and are required to be independent with respect to the Company in accordance with the U.S. federal securities laws and the applicable rules and regulations of the Securities and Exchange Commission and the PCAOB.
We conducted our audit in accordance with the standards of the PCAOB. Those standards require that we plan and perform the audit to obtain reasonable assurance about whether the financial statements are free of material misstatement, whether due to error or fraud. Our audit included performing procedures to assess the risks of material misstatement of the financial statements, whether due to error or fraud, and performing procedures that respond to those risks. Such procedures included examining, on a test basis, evidence regarding the amounts and disclosures in the financial statements. Our audit also included evaluating the accounting principles used and significant estimates made by management, as well as evaluating the overall presentation of the financial statements. We believe that our audit provides a reasonable basis for our opinion.
Critical Audit Matter
The critical audit matter communicated below is a matter arising from the current period audit of the consolidated financial statements that was communicated or required to be communicated to the audit committee and that: (1) relates to accounts or disclosures that are material to the financial statements and (2) involved our especially challenging, subjective or complex judgments. The communication of the critical audit matter does not alter in any way our opinion on the consolidated financial statements, taken as a whole, and we are not, by communicating the critical audit matter below, providing a separate opinion on the critical audit matter or on the account or disclosure to which it relates.
Valuation of Goodwill for the Construction Adhesives reporting unit
Description of the Matter
At November 27, 2021, the Company had goodwill of approximately $311 million related to the Construction Adhesive reporting unit. As discussed in Notes 1 and 5 of the consolidated financial statements, the Company performs goodwill impairment testing on an annual basis as of the beginning of the fourth quarter, and between annual tests if an event occurs or circumstances change that would more likely than not reduce the fair value of a reporting unit below its carrying amount.
Auditing management’s goodwill impairment test for the Construction Adhesives reporting unit was complex and judgmental due to the significant estimation required in determining the fair value of the reporting unit. In particular, the Company estimates fair value using the income approach which is sensitive to certain assumptions, such as forecasted revenue and related revenue growth rate, the earnings before interest, taxes, depreciation and amortization (EBITDA) margins rate, the weighted average cost of capital and the tax rate which are affected by management’s business plans and expectations about future market or economic conditions.
How We Addressed the Matter in Our Audit
We obtained an understanding, evaluated the design, and tested the operating effectiveness of controls over the Company's goodwill impairment review process, including controls over management’s review of the significant assumptions described above.
To test the estimated fair value of the Construction Adhesive reporting unit, we performed audit procedures that included, among others, assessing the valuation methodology used by management and testing the significant assumptions discussed above, as well as the underlying data used by the Company in its analysis. For example, we compared the significant assumptions used by management in the prospective financial information to current industry, market and economic trends as well as other relevant factors. We assessed the reasonableness of the forecasted future revenue growth rate and EBITDA margins rate by comparing the forecasts to historical results. We involved our valuation specialists to assist in our evaluation of the valuation models, methodologies and significant assumptions used by the Company, specifically the weighted average cost of capital. We compared the projected tax rates with current enacted rates and assessed the reasonableness of the forecasted profits and losses by jurisdiction by comparing to historical results.
/s/ Ernst & Young LLP
We have served as the Company’s auditor since 2019.
Minneapolis, Minnesota
January 25, 2022
Report of Independent Registered Public Accounting Firm
To the Stockholders and the Board of Directors of H.B. Fuller Company
Opinion on Internal Control Over Financial Reporting
We have audited H.B. Fuller Company and subsidiaries’ internal control over financial reporting as of November 27, 2021, based on criteria established in Internal Control—Integrated Framework issued by the Committee of Sponsoring Organizations of the Treadway Commission (2013 framework) (the COSO criteria). In our opinion, H.B. Fuller Company and subsidiaries (the Company) maintained, in all material respects, effective internal control over financial reporting as of November 27, 2021, based on the COSO criteria.
We also have audited, in accordance with the standards of the Public Company Accounting Oversight Board (United States) (PCAOB), the consolidated balance sheets of the Company as of November 27, 2021 and November 28, 2020, the related consolidated statements of income, comprehensive income, total equity and cash flows for each of the two years ended November 27, 2021 and November 28, 2020, and the related notes and our report dated January 25, 2022 expressed an unqualified opinion thereon.
Basis for Opinion
The Company’s management is responsible for maintaining effective internal control over financial reporting and for its assessment of the effectiveness of internal control over financial reporting included in the accompanying Management’s Report on Internal Control over Financial Reporting. Our responsibility is to express an opinion on the Company’s internal control over financial reporting based on our audit. We are a public accounting firm registered with the PCAOB and are required to be independent with respect to the Company in accordance with the U.S. federal securities laws and the applicable rules and regulations of the Securities and Exchange Commission and the PCAOB.
We conducted our audit in accordance with the standards of the PCAOB. Those standards require that we plan and perform the audit to obtain reasonable assurance about whether effective internal control over financial reporting was maintained in all material respects.
Our audit included obtaining an understanding of internal control over financial reporting, assessing the risk that a material weakness exists, testing and evaluating the design and operating effectiveness of internal control based on the assessed risk, and performing such other procedures as we considered necessary in the circumstances. We believe that our audit provides a reasonable basis for our opinion.
Definition and Limitations of Internal Control Over Financial Reporting
A company’s internal control over financial reporting is a process designed to provide reasonable assurance regarding the reliability of financial reporting and the preparation of financial statements for external purposes in accordance with generally accepted accounting principles. A company’s internal control over financial reporting includes those policies and procedures that (1) pertain to the maintenance of records that, in reasonable detail, accurately and fairly reflect the transactions and dispositions of the assets of the company; (2) provide reasonable assurance that transactions are recorded as necessary to permit preparation of financial statements in accordance with generally accepted accounting principles, and that receipts and expenditures of the company are being made only in accordance with authorizations of management and directors of the company; and (3) provide reasonable assurance regarding prevention or timely detection of unauthorized acquisition, use, or disposition of the company’s assets that could have a material effect on the financial statements.
Because of its inherent limitations, internal control over financial reporting may not prevent or detect misstatements. Also, projections of any evaluation of effectiveness to future periods are subject to the risk that controls may become inadequate because of changes in conditions, or that the degree of compliance with the policies or procedures may deteriorate.
/s/ Ernst & Young LLP
Minneapolis, Minnesota
January 25, 2022
Report of Independent Registered Public Accounting Firm
To the Stockholders and Board of Directors
H.B. Fuller Company
Opinion on the Consolidated Financial Statements
We have audited the accompanying consolidated statements of income, comprehensive income, total equity, and cash flows of H.B. Fuller Company and subsidiaries (the Company), for the fiscal year ended November 30, 2019, and the related notes (collectively, the consolidated financial statements). In our opinion, the consolidated financial statements present fairly, in all material respects, the results of operations of the Company and its cash flows for the fiscal year ended November 30, 2019, in conformity with U.S. generally accepted accounting principles.
Basis for Opinion
These consolidated financial statements are the responsibility of the Company’s management. Our responsibility is to express an opinion on these consolidated financial statements based on our audit. We are a public accounting firm registered with the PCAOB and are required to be independent with respect to the Company in accordance with the U.S. federal securities laws and the applicable rules and regulations of the Securities and Exchange Commission and the PCAOB.
We conducted our audit in accordance with the standards of the PCAOB. Those standards require that we plan and perform the audit to obtain reasonable assurance about whether the consolidated financial statements are free of material misstatement, whether due to error or fraud. Our audit included performing procedures to assess the risks of material misstatement of the consolidated financial statements, whether due to error or fraud, and performing procedures that respond to those risks. Such procedures included examining, on a test basis, evidence regarding the amounts and disclosures in the consolidated financial statements. Our audit also included evaluating the accounting principles used and significant estimates made by management, as well as evaluating the overall presentation of the consolidated financial statements. We believe that our audit provides a reasonable basis for our opinion.
/s/ KPMG LLP
We served as the Company’s auditor from 2003 to 2020.
Minneapolis, Minnesota
January 24, 2020, except for Note 15, as to which the date is June 29, 2021
CONSOLIDATED STATEMENTS OF INCOME
H.B. Fuller Company and Subsidiaries
(In thousands, except per share amounts)
| Fiscal Years |
||||||||||||
| November 27, |
November 28, |
November 30, |
||||||||||
| 2021 |
2020 |
2019 |
||||||||||
| Net revenue |
$ | $ | $ | |||||||||
| Cost of sales |
( |
) | ( |
) | ( |
) | ||||||
| Gross profit |
||||||||||||
| Selling, general and administrative expenses |
( |
) | ( |
) | ( |
) | ||||||
| Other income, net |
||||||||||||
| Interest expense |
( |
) | ( |
) | ( |
) | ||||||
| Interest income |
||||||||||||
| Income before income taxes and income from equity method investments |
||||||||||||
| Income tax expense |
( |
) | ( |
) | ( |
) | ||||||
| Income from equity method investments |
||||||||||||
| Net income including non-controlling interest |
||||||||||||
| Net income attributable to non-controlling interest |
( |
) | ( |
) | ( |
) | ||||||
| Net income attributable to H.B. Fuller |
$ | $ | $ | |||||||||
| Earnings per share attributable to H.B. Fuller common stockholders: |
||||||||||||
| Basic |
$ | $ | $ | |||||||||
| Diluted |
$ | $ | $ | |||||||||
| Weighted-average common shares outstanding: |
||||||||||||
| Basic |
||||||||||||
| Diluted |
||||||||||||
| Dividends declared per common share |
$ | $ | $ | |||||||||
See accompanying Notes to Consolidated Financial Statements.
CONSOLIDATED STATEMENTS OF COMPREHENSIVE INCOME
H.B. Fuller Company and Subsidiaries
(In thousands)
| Fiscal Years |
||||||||||||
| November 27, |
November 28, |
November 30, |
||||||||||
| 2021 |
2020 |
2019 |
||||||||||
| Net income including non-controlling interest |
$ | $ | $ | |||||||||
| Other comprehensive income (loss) |
||||||||||||
| Foreign currency translation |
( |
) | ( |
) | ||||||||
| Defined benefit pension plans adjustment, net of tax |
( |
) | ||||||||||
| Interest rate swaps, net of tax |
( |
) | ( |
) | ||||||||
| Cash-flow hedges, net of tax |
( |
) | ||||||||||
| Other comprehensive income (loss) |
( |
) | ||||||||||
| Comprehensive income |
||||||||||||
| Less: Comprehensive income attributable to non-controlling interest |
||||||||||||
| Comprehensive income attributable to H.B. Fuller |
$ | $ | $ | |||||||||
See accompanying Notes to Consolidated Financial Statements.
CONSOLIDATED BALANCE SHEETS
H.B. Fuller Company and Subsidiaries
(In thousands, except share and per share amounts)
| November 27, | November 28, | |||||||
| 2021 | 2020 | |||||||
| Assets | ||||||||
| Current assets: | ||||||||
| Cash and cash equivalents | $ | $ | ||||||
| Trade receivables, net | ||||||||
| Inventories | ||||||||
| Other current assets | ||||||||
| Total current assets | ||||||||
| Property, plant and equipment, net | ||||||||
| Goodwill | ||||||||
| Other intangibles, net | ||||||||
| Other assets | ||||||||
| Total assets | $ | $ | ||||||
| Liabilities, non-controlling interest and total equity | ||||||||
| Current liabilities: | ||||||||
| Notes payable | $ | $ | ||||||
| Current maturities of long-term debt | ||||||||
| Trade payables | ||||||||
| Accrued compensation | ||||||||
| Income taxes payable | ||||||||
| Other accrued expenses | ||||||||
| Total current liabilities | ||||||||
| Long-term debt, net of current maturities | ||||||||
| Accrued pension liabilities | ||||||||
| Other liabilities | ||||||||
| Total liabilities | ||||||||
| Commitments and contingencies (Note 14) | ||||||||
| Equity: | ||||||||
| H.B. Fuller stockholders' equity: | ||||||||
| Preferred stock ( shares outstanding) Shares authorized – | ||||||||
| Common stock, par value $ per share, Shares authorized – , Shares outstanding – and for 2021 and 2020, respectively | ||||||||
| Additional paid-in capital | ||||||||
| Retained earnings | ||||||||
| Accumulated other comprehensive loss | ( | ) | ( | ) | ||||
| Total H.B. Fuller stockholders' equity | ||||||||
| Non-controlling interest | ||||||||
| Total equity | ||||||||
| Total liabilities, non-controlling interest and total equity | $ | $ | ||||||
See accompanying Notes to Consolidated Financial Statements.
CONSOLIDATED STATEMENTS OF TOTAL EQUITY
H.B. Fuller Company and Subsidiaries
(In thousands)
| H.B. Fuller Company Shareholders |
||||||||||||||||||||||||
| Accumulated |
||||||||||||||||||||||||
| Additional |
Other |
Non- |
||||||||||||||||||||||
| Common |
Paid-in |
Retained |
Comprehensive |
Controlling |
||||||||||||||||||||
| Stock |
Capital |
Earnings |
Income (Loss) |
Interest |
Total |
|||||||||||||||||||
| Balance at December 1, 2018, as previously reported |
$ | $ | $ | $ | ( |
) | $ | $ | ||||||||||||||||
| Change in accounting principles |
||||||||||||||||||||||||
| Balance at December 1, 2018, as adjusted |
$ | $ | $ | $ | ( |
) | $ | $ | ||||||||||||||||
| Comprehensive income (loss) |
( |
) | ||||||||||||||||||||||
| Dividends |
( |
) | ( |
) | ||||||||||||||||||||
| Stock option exercises |
||||||||||||||||||||||||
| Share-based compensation plans other, net |
||||||||||||||||||||||||
| Repurchases of common stock |
( |
) | ( |
) | ( |
) | ||||||||||||||||||
| Balance at November 30, 2019 |
$ | $ | $ | $ | ( |
) | $ | $ | ||||||||||||||||
| Comprehensive income (loss) |
||||||||||||||||||||||||
| Dividends |
( |
) | ( |
) | ||||||||||||||||||||
| Stock option exercises |
||||||||||||||||||||||||
| Share-based compensation plans other, net |
||||||||||||||||||||||||
| Repurchases of common stock |
( |
) | ( |
) | ( |
) | ||||||||||||||||||
| Balance at November 28, 2020 |
$ | $ | $ | $ | ( |
) | $ | $ | ||||||||||||||||
| Comprehensive income |
||||||||||||||||||||||||
| Dividends |
( |
) | ( |
) | ||||||||||||||||||||
| Stock option exercises |
||||||||||||||||||||||||
| Share-based compensation plans other, net |
||||||||||||||||||||||||
| Repurchases of common stock |
( |
) | ( |
) | ( |
) | ||||||||||||||||||
| Balance at November 27, 2021 |
$ | $ | $ | $ | ( |
) | $ | $ | ||||||||||||||||
CONSOLIDATED STATEMENTS of CASH FLOWS
H.B. Fuller Company and Subsidiaries
(In thousands)
| Fiscal Years | ||||||||||||
| November 27, | November 28, | November 30, | ||||||||||
| 2021 | 2020 | 2019 | ||||||||||
| Cash flows from operating activities: | ||||||||||||
| Net income including non-controlling interest | $ | $ | $ | |||||||||
| Adjustments to reconcile net income including non-controlling interest to net cash provided by operating activities: | ||||||||||||
| Depreciation | ||||||||||||
| Amortization | ||||||||||||
| Deferred income taxes | ( | ) | ( | ) | ||||||||
| Income from equity method investments, net of dividends received | ( | ) | ||||||||||
| Loss (gain) on sale of assets | ( | ) | ||||||||||
| Share-based compensation | ||||||||||||
| Pension and other postretirement benefit plan contributions | ( | ) | ( | ) | ( | ) | ||||||
| Pension and other postretirement benefit plan income | ( | ) | ( | ) | ( | ) | ||||||
| Mark to market adjustment related to contingent consideration liabilities | ||||||||||||
| Change in assets and liabilities, net of effects of acquisitions: | ||||||||||||
| Trade receivables, net | ( | ) | ( | ) | ( | ) | ||||||
| Inventories | ( | ) | ||||||||||
| Other assets | ( | ) | ( | ) | ||||||||
| Trade payables | ||||||||||||
| Accrued compensation | ||||||||||||
| Other accrued expenses | ( | ) | ||||||||||
| Income taxes payable | ( | ) | ||||||||||
| Other liabilities | ( | ) | ||||||||||
| Other | ( | ) | ||||||||||
| Net cash provided by operating activities | ||||||||||||
| Cash flows from investing activities: | ||||||||||||
| Purchased property, plant and equipment | ( | ) | ( | ) | ( | ) | ||||||
| Purchased businesses, net of cash acquired | ( | ) | ( | ) | ( | ) | ||||||
| Purchased business assets | ( | ) | ||||||||||
| Purchased business remaining equity | ( | ) | ||||||||||
| Proceeds from sale of property, plant and equipment | ||||||||||||
| Proceeds from sale of business | ||||||||||||
| Cash received from government grant | ||||||||||||
| Cash outflow related to government grant | ( | ) | ( | ) | ( | ) | ||||||
| Net cash (used in) provided by investing activities | ( | ) | ( | ) | ||||||||
| Cash flows from financing activities: | ||||||||||||
| Proceeds from issuance of long-term debt | ||||||||||||
| Repayment of long-term debt | ( | ) | ( | ) | ( | ) | ||||||
| Net proceeds from notes payable | ||||||||||||
| Dividends paid | ( | ) | ( | ) | ( | ) | ||||||
| Contingent consideration payment | ( | ) | ( | ) | ( | ) | ||||||
| Proceeds from stock options exercised | ||||||||||||
| Repurchases of common stock | ( | ) | ( | ) | ( | ) | ||||||
| Net cash used in financing activities | ( | ) | ( | ) | ( | ) | ||||||
| Effect of exchange rate changes on cash and cash equivalents | ( | ) | ( | ) | ||||||||
| Net change in cash and cash equivalents | ( | ) | ( | ) | ( | ) | ||||||
| Cash and cash equivalents at beginning of year | ||||||||||||
| Cash and cash equivalents at end of year | $ | $ | $ | |||||||||
| Supplemental disclosure of cash flow information: | ||||||||||||
| Dividends paid with company stock | $ | $ | $ | |||||||||
| Cash paid for interest, net of amount capitalized of $, $, and $ for the years ended November 27, 2021, November 28, 2020 and November 30, 2019, respectively | $ | $ | $ | |||||||||
| Cash paid for income taxes, net of refunds | $ | $ | $ | |||||||||
See accompanying Notes to Consolidated Financial Statements.
NOTES TO CONSOLIDATED FINANCIAL STATEMENTS
H.B. Fuller Company and Subsidiaries
(In thousands, except share and per share amounts)
Note 1: Nature of Business and Summary of Significant Accounting Policies
Nature of Business
H.B. Fuller Company and our subsidiaries formulate, manufacture and market specialty adhesives, sealants, coatings, polymers, tapes, encapsulants, additives and other specialty chemical products globally, with sales operations in
We have reportable segments: Hygiene, Health and Consumable Adhesives, Engineering Adhesives and Construction Adhesives. In 2021, as a percentage of total net revenue by operating segment, Hygiene, Health and Consumable Adhesives accounted for
Our Hygiene, Health and Consumable Adhesives operating segment produces and supplies a full range of specialty industrial adhesives such as thermoplastic, thermoset, reactive, water-based and solvent-based products for applications in various markets, including packaging (food and beverage containers, flexible packaging, consumer goods, package integrity and re-enforcement, and non-durable goods), converting (corrugation, folding carton, tape and label, paper converting, envelopes, books, multi-wall bags, sacks, and tissue and towel), nonwoven and hygiene (disposable diapers, feminine care and medical garments) and health and beauty.
Our Engineering Adhesives operating segment produces and supplies high performance industrial adhesives such as reactive, light cure, two-part liquids, polyurethane, silicone, film and fast cure products to the durable assembly (appliances and filters), performance wood (windows, doors and wood flooring) and textile (footwear and sportswear), transportation, electronics, medical, clean energy, aerospace and defense, appliance, heavy machinery and insulating glass markets.
Our Construction Adhesives operating segment includes products used for tile setting (adhesives, grouts, mortars, sealers and levelers), the commercial roofing industry (pressure-sensitive adhesives, tapes and sealants) and heating, ventilation and air conditioning and insulation applications (duct sealants, weather barriers and fungicidal coatings and block fillers). This operating segment also includes caulks and sealants for the consumer market and professional trade, sold through retailers, primarily in Australia.
Principles of Consolidation
The Consolidated Financial Statements include the accounts of H.B. Fuller Company and its wholly-owned and majority-owned subsidiaries. All significant intercompany transactions and accounts have been eliminated. Investments in affiliated companies in which we exercise significant influence, but which we do not control, are accounted for in the Consolidated Financial Statements under the equity method of accounting. As such, consolidated net income includes our equity portion in current earnings of such companies, after elimination of intercompany profits. Investments in which we do not exercise significant influence (generally less than a 20 percent ownership interest) are accounted for using the measurement alternative.
Our
Our fiscal year ends on the Saturday closest to November 30. Fiscal year-end dates were November 27, 2021, November 28, 2020, and November 30, 2019 for 2021, 2020 and 2019, respectively.
Use of Estimates
Preparation of the Consolidated Financial Statements in conformity with U.S. generally accepted accounting principles (“U.S. GAAP”) requires us to make estimates and assumptions that affect the amounts reported in the financial statements and accompanying notes. Actual results could differ from those estimates.
Revenue Recognition
We sell a variety of adhesives, sealants and other specialty chemical products to a diverse customer base. The vast majority of our arrangements contain a single performance obligation to transfer manufactured goods to the customer as governed by an individual purchase order.
We recognize revenue at the amount of consideration to which we expect to be entitled in exchange for transferring the promised goods to the customer. The transaction price includes an estimation of any variable amounts of consideration to which we will be entitled. The most common forms of variable consideration within our arrangements are customer rebates, which are recorded as a reduction to revenue at the time of the initial sale using the expected value method. The expected value method is the sum of probability-weighted amounts in a range of possible consideration amounts and is based on a consideration of historical, current and forecast information. Changes in estimates are updated each reporting period. There are no material instances where variable consideration is constrained and not recorded at the initial time of sale. Product returns are recorded as a reduction to revenue based on historical experience and anticipated sales returns that occur in the normal course of business. We primarily have assurance-type warranties that do not result in separate performance obligations. We have elected to present revenue net of sales and other similar taxes.
We recognize revenue when control of goods is transferred to the customer. For the vast majority of our arrangements, control transfers at a point in time either upon shipment or upon delivery of the goods to the customer. The timing of transfer of control is determined considering the timing of the transfer of legal title, physical possession, and risks and rewards of goods to the customer.
We record shipping and handling revenue in net revenue and outbound shipping and handling costs in cost of goods sold. The majority of our shipping and handling activities are performed prior to transfer of control of the goods to the customer. For those arrangements where we provide shipping and handling services after control of the goods has transferred to the customer, we have elected the practical expedient allowed under Financial Accounting Standards Board (“FASB”) Accounting Standard Codification (“ASC”) Topic 606 to account for these activities as a fulfillment cost rather than as a separate performance obligation.
Provisions for sales returns are estimated based on historical experience and are adjusted for known returns, if material. Customer incentive programs (primarily volume purchase rebates) and arrangements such as cooperative advertising, slotting fees and buy-downs are recorded as a reduction of net revenue in accordance with ASC 606. Customer incentives recorded in the Consolidated Statements of Income as a reduction of net revenue were $
For certain products, consigned inventory is maintained at customer locations. For this inventory, revenue is recognized in the period that the inventory is consumed. Sales to distributors require a distribution agreement or purchase order. As a normal practice, distributors do not have a right of return.
Cost of Sales
Cost of sales includes raw materials, container costs, direct labor, manufacturing overhead, freight costs and other less significant indirect costs related to the production of our products.
Selling, General and Administrative Expenses
Selling, general and administrative (“SG&A”) expenses include sales and marketing, research and development, technical and customer service, finance, legal, human resources, general management and similar expenses.
Income Taxes
The income tax provision is computed based on income before income from equity method investments included in the Consolidated Statement of Income. The asset and liability approach is used to recognize deferred tax assets and liabilities for the expected future tax consequences of temporary differences between the carrying amounts and the tax bases of assets and liabilities. Enacted statutory tax rates applicable to future years are applied to differences between the financial statement carrying amounts and the tax basis of existing assets and liabilities. The effect on deferred taxes of a change in tax rates is recognized in income in the period that includes the enactment date. Valuation allowances reduce deferred tax assets when it is not more-likely-than-not that a tax benefit will be realized. See Note 11 for further information.
Acquisition Accounting
As we enter into business combinations, we perform acquisition accounting requirements including the following:
|
| ● | Identifying the acquirer, |
|
| ● | Determining the acquisition date, |
|
| ● | Recognizing and measuring the identifiable assets acquired and the liabilities assumed, and |
|
| ● | Recognizing and measuring goodwill or a gain from a bargain purchase |
We complete valuation procedures and record the resulting fair value of the acquired assets and assumed liabilities based upon the valuation of the business enterprise and the tangible and intangible assets acquired. Enterprise value allocation methodology requires management to make assumptions and apply judgment to estimate the fair value of assets acquired and liabilities assumed. If estimates or assumptions used to complete the enterprise valuation and estimates of the fair value of the acquired assets and assumed liabilities significantly differed from assumptions made, the resulting difference could materially affect the fair value of net assets.
The calculation of the fair value of the tangible assets, including property, plant and equipment, utilizes the cost approach, which computes the cost to replace the asset, less accrued depreciation resulting from physical deterioration, functional obsolescence and external obsolescence. The calculation of the fair value of the identified intangible assets is determined using cash flow models following the income approach or a discounted market-based methodology approach. Significant inputs include estimated revenue growth rates, gross margins, operating expenses and estimated attrition, royalty and discount rates. Goodwill is recorded as the difference in the fair value of the acquired assets and assumed liabilities and the purchase price.
Cash Equivalents
Cash equivalents are highly liquid instruments with an original maturity of three months or less. We review cash and cash equivalent balances on a bank by bank basis to identify book overdrafts. Book overdrafts occur when the amount of outstanding checks exceed the cash deposited at a given bank. Book overdrafts, if any, are included in trade payables in our Consolidated Balance Sheets and in operating activities in our Consolidated Statements of Cash Flows.
Restrictions on Cash
There were
Trade Receivables and Allowances
Trade receivables are recorded at the invoiced amount and do not bear interest. Allowances are maintained for doubtful accounts, credits related to pricing or quantities shipped and early payment discounts. The allowance for doubtful accounts includes an estimate of future uncollectible receivables based on the aging of the receivable balance and our collection experience. The allowance also includes specific customer accounts when it is probable that the full amount of the receivable will not be collected. Current expectations of future credit losses using market and industry data are considered in the specific customer accounts. See Note 4 for further information.
Inventories
Inventories are recorded at cost (not in excess of net realizable value) as determined by the weighted-average cost method and are valued at the lower of cost or net realizable value.
Investments
Investments with a value of $
Equity Investments
Investments in an entity where we own less than 20% of the voting stock of the entity and do not exercise significant influence over operating and financial policies of the entity are accounted for using the measurement alternative at cost less impairment plus or minus observable price changes in orderly transactions. We have a policy in place to review our investments at least annually, to evaluate the accounting method and identify observable price changes that could indicate impairment. If we believe that an impairment exists, it is our policy to calculate the fair value of the investment and recognize as impairment any amount by which the carrying value exceeds the fair value of the investment. We did have any impairment of our equity investments for the years ended November 27, 2021, November 28, 2020, and November 30, 2019. The book value of the equity investments was $
Property, Plant and Equipment
Property, plant and equipment are carried at cost and depreciated over the useful lives of the assets using the straight-line method. Estimated useful lives range from
Goodwill
We evaluate our goodwill for impairment annually at the beginning of the fourth quarter or earlier upon the occurrence of substantive unfavorable changes in economic conditions, industry trends, costs, cash flows or ongoing declines in market capitalization. The quantitative impairment test requires judgment, including the identification of reporting units, the assignment of assets, liabilities and goodwill to reporting units, and the determination of fair value of each reporting unit. The impairment test requires the comparison of the fair value of each reporting unit with its carrying amount, including goodwill. In performing the impairment test, we determined the fair value of our reporting units through the income approach by using discounted cash flow (“DCF”) analyses. Determining fair value requires the company to make judgments about appropriate discount rates, perpetual growth rates and the amount and timing of expected future cash flows. The cash flows employed in the DCF analysis for each reporting unit are based on the reporting unit's budget, long-term business plan and recent operating performance. Discount rate assumptions are based on an assessment of the risk inherent in the future cash flows of the respective reporting unit and market conditions. If the estimated fair value of a reporting unit exceeds its carrying value, goodwill is considered to not be impaired. If the carrying value exceeds estimated fair value, an impairment charge is recorded for any excess of the carrying value over the estimated fair value. Based on the analysis performed for our fiscal 2021 annual impairment test, there were no indications of impairment for any of our reporting units. See Note 5 for further information.
Intangible Assets
Intangible assets include patents, customer lists, technology, trademarks and other intangible assets acquired from independent parties and are amortized on a straight-line basis with estimated useful lives ranging from
Impairment of Long-Lived Assets
Our long-lived assets are tested for impairment whenever events or circumstances indicate that a carrying amount of an asset (asset group) may not be recoverable. An impairment loss would be measured and recognized when the carrying amount of an asset (asset group) exceeds the estimated undiscounted future cash flows expected to result from the use of the asset (asset group) and its eventual disposition. The impairment loss to be recorded would be the excess of the asset's carrying value over its fair value. Fair value is generally determined using a DCF analysis or other valuation technique. Costs related to internally developed intangible assets are expensed as incurred.
Foreign Currency Translation
Assets and liabilities of non-U.S. functional currency entities are translated to U.S. dollars at period-end exchange rates, and the resulting gains and losses arising from the translation of those net assets are recorded as a cumulative translation adjustment, a component of accumulated other comprehensive income (loss) in stockholders' equity. Revenues and expenses are translated using average exchange rates during the year. Foreign currency transaction gains and losses are included in other income, net in the Consolidated Statements of Income.
We consider a subsidiary’s sales price drivers, currency denomination of sales transactions and inventory purchases to be the primary indicators in determining a foreign subsidiary’s functional currency. Our subsidiaries in certain European countries have a functional currency different than their local currency. All other foreign subsidiaries, which are located in North America, Latin America, Europe and the Asia Pacific region, have the same local and functional currency.
Pension and Other Postretirement Benefits
We sponsor defined-benefit pension plans in both the U.S. and non-U.S. entities. Also in the U.S., we sponsor other postretirement plans for health care and life insurance benefits. Expenses and liabilities for the pension plans and other postretirement plans are actuarially calculated. These calculations are based on our assumptions related to the discount rate, expected return on assets, projected salary increases, health care cost trend rates and mortality rates. The discount rate assumption is determined using an actuarial yield curve approach, which results in a discount rate that reflects the characteristics of the plan. The approach identifies a broad population of corporate bonds that meet the quality and size criteria for the particular plan. We use this approach rather than a specific index that has a certain set of bonds that may or may not be representative of the characteristics of our particular plan. Our expected long-term rate of return on U.S. plan assets was based on our target asset allocation assumption of
Asset Retirement Obligations
We recognize asset retirement obligations ("ARO") in the period in which we have an existing legal obligation associated with the retirement of a tangible long-lived asset, and the amount can be reasonably estimated. The ARO is recognized at fair value when the liability is incurred. Upon initial recognition of a liability, that cost is capitalized as part of the related long-lived asset and depreciated on a straight-line basis over the remaining estimated useful life of the related asset. We have recognized a liability related to special handling of asbestos related materials in certain facilities for which we have plans or expectation of plans to undertake a major renovation or demolition project that would require the removal of asbestos or have plans or expectation of plans to exit a facility. In addition, we have determined that we have facilities with some level of asbestos that will require abatement action in the future. Once the probability and timeframe of an action are determined, we apply certain assumptions to determine the related liability and asset. These assumptions include the use of inflation rates, the use of credit adjusted risk-free discount rates and the estimation of costs to handle asbestos related materials. The recorded liability is required to be adjusted for changes resulting from the passage of time and/or revisions to the timing or the amount of the original estimate. The asset retirement obligation liability was $
Environmental Costs
Environmental expenditures that relate to current operations are expensed or capitalized as appropriate. Expenditures that relate to an existing condition caused by past operations, and which do not contribute to current or future revenue generation, are expensed. Liabilities are recorded when environmental assessments are made, or remedial efforts are probable, and the costs can be reasonably estimated. The timing of these accruals is generally no later than the completion of feasibility studies.
Contingent Consideration Liability
Concurrent with business acquisitions, we enter into agreements that require us to pay the sellers a certain amount based upon a formula related to the entity’s financial results. The change in fair value of the contingent consideration liability is recorded in SG&A expenses in the Consolidated Statements of Income.
Share-based Compensation
We have various share-based compensation programs which provide for equity awards, including non-qualified stock options, incentive stock options, restricted stock units, performance awards and deferred compensation. We use the straight-line attribution method to recognize compensation expense associated with share-based awards based on the fair value on the date of grant, net of the estimated forfeiture rate. Expense is recognized over the requisite service period related to each award, which is the period between the grant date and the earlier of the award’s stated vesting term or the date the employee is eligible for early retirement based on the terms of the plan. The fair value of stock options is estimated using the Black-Scholes option pricing model. All of our stock compensation expense is recorded in SG&A expenses in the Consolidated Statements of Income. See Note 9 for additional information.
Earnings per Share
Basic earnings per share is calculated by dividing net income attributable to H.B. Fuller by the weighted-average number of common shares outstanding during the applicable period. Diluted earnings per share is based upon the weighted-average number of common and common equivalent shares outstanding during the applicable period. The difference between basic and diluted earnings per share is attributable to share-based compensation awards. We use the treasury stock method to calculate the effect of outstanding awards, which computes total employee proceeds as the sum of (a) the amount the employee must pay upon exercise of the award and (b) the amount of unearned share-based compensation costs attributed to future services. Share-based compensation awards for which total employee proceeds exceed the average market price over the applicable period have an antidilutive effect on earnings per share, and accordingly, are excluded from the calculation of diluted earnings per share. The computations for basic and diluted earnings per share are as follows:
| (in thousands, except per share data) | 2021 | 2020 | 2019 | |||||||||
| Net income attributable to H.B. Fuller | $ | $ | $ | |||||||||
| Weighted-average common shares – basic | ||||||||||||
| Equivalent shares from share-based compensation plans | ||||||||||||
| Weighted-average common and common equivalent shares – diluted | ||||||||||||
| Basic earnings per share | $ | $ | $ | |||||||||
| Diluted earnings per share | $ | $ | $ | |||||||||
Share-based compensation awards for
Financial Instruments and Derivatives
As a part of our ongoing operations, we are exposed to market risks such as changes in foreign currency exchange rates and interest rates. To manage these risks, we may enter into derivative transactions pursuant to our established policies.
Our objective is to balance, where possible, non-functional currency denominated assets to non-functional currency denominated liabilities to have a natural hedge and minimize foreign exchange impacts. We minimize risks from foreign currency exchange rate fluctuations through normal operating and financing activities and, when deemed appropriate, through the use of derivative instruments. Derivatives consisted primarily of forward currency contracts used to manage foreign currency denominated assets and liabilities. For derivative instruments outstanding that were not designated as hedges for accounting purposes, the gains and losses related to mark-to-market adjustments were recognized as other income or expense in the income statement during the periods the derivative instruments were outstanding. To manage exposure to currency rate movements on expected cash flows, the company may enter into cross-currency swap agreements.
The company manages interest expense using a mix of fixed and floating rate debt. To manage exposure to interest rate movements and to reduce borrowing costs, the company may enter into interest rate swap agreements.
Changes in the fair values of derivatives are recorded in net earnings or other comprehensive income, based on the type of derivative, and whether the instrument is designated and effective as a hedge transaction. Gains or losses on derivative instruments reported in accumulated other comprehensive income (loss) are reclassified to earnings in the period the hedged item affects earnings. Any ineffectiveness is recognized in earnings in the current period. We maintain master netting arrangements that allow us to net settle contracts with the same counterparties; we do not elect to offset amounts in our Consolidated Balance Sheet. These arrangements generally do not call for collateral. We do not enter into any speculative positions with regard to derivative instruments. See Note 12 for further information regarding our financial instruments.
Purchase of Company Common Stock
Under the Minnesota Business Corporation Act, repurchased stock is included in authorized shares, but is not included in shares outstanding. The excess of the repurchase cost over par value is charged to additional paid-in capital. When additional paid-in capital is exhausted, the excess reduces retained earnings. We repurchased
Change in Accounting Principle - Credit Losses
In June 2016, the FASB issued ASU No. 2016-13, Financial Instruments - Credit Losses (Topic 326), Measurement of Credit Losses on Financial Statements. This ASU requires a financial asset (or a group of financial assets) measured at amortized cost basis to be presented at the net amount expected to be collected. The allowance for credit losses is a valuation account that is deducted from the amortized cost basis of the financial asset(s) to present the net carrying value at the amount expected to be collected on the financial asset. The FASB also issued ASU No. 2018-19, Codification Improvements to Topic 326, Financial Instruments - Credit Losses, in November 2018, ASU No. 2019-04, Codification Improvements to Topic 326, Financial Instruments, in April 2019 and ASU No. 2019-11, Codification Improvements to Topic 326, Financial Instruments, in November 2019. ASU No. 2018-19 clarifies that receivables arising from operating leases are within the scope of Topic 842, Leases. ASU No. 2019-04 and ASU No. 2019-11 clarify various scoping and other issues arising from ASU No. 2016-13. The amendments in these ASUs affect the guidance in ASU No. 2016-13 and are effective in the same timeframe as ASU No. 2016-13. We adopted these ASUs and related standards during the first quarter ended February 27, 2021. Based on the conducted analyses on the change in accounting principle, the ASUs did not have a material impact on the Consolidated Statements of Income or the Consolidated Balance Sheets. Therefore, a modified retrospective adjustment was not required. The trade receivables and allowances significant accounting policy has been changed in accordance with these ASUs.
Change in Accounting Principle – Revenue Recognition
In May 2014, FASB issued ASU No. 2014-09, Revenue from Contracts with Customers (Topic 606), which requires an entity to recognize the amount of revenue to which it expects to be entitled for the transfer of promised goods or services to customers. We adopted this ASU during the quarter ended March 2, 2019 using the modified retrospective method of adoption. As a result of the adoption of this ASU, we recorded an increase to opening retained earnings of $
In March 2016, the FASB issued ASU No. 2016-08, Revenue from Contracts with Customers (Topic 606), Principal versus Agent Considerations (Reporting Revenue Gross versus Net). This ASU provides guidance on recording revenue on a gross basis versus a net basis based on the determination of whether an entity is a principal or an agent when another party is involved in providing goods or services to a customer. The amendments in this ASU affect the guidance in ASU No. 2014-09 and were adopted during the quarter ended March 2, 2019 with ASU No. 2014-09 as discussed above.
Change in Accounting Principle – Income Tax Impact of Intra-Entity Transfers of Assets Other Than Inventory
In October 2016, the FASB issued ASU No. 2016-16, Income Taxes (Topic 740): Intra-Entity Transfers of Assets Other Than Inventory. This ASU changes the timing of income tax recognition for an intercompany sale of assets. The ASU requires the seller’s tax effects and the buyer’s deferred taxes to be recognized immediately upon the sale instead of deferring accounting for the income tax implications until the assets are sold to a third party or recovered through use. We adopted this ASU during the quarter ended March 2, 2019. We recorded a decrease to opening retained earnings of $
New Accounting Pronouncements
In November 2021, the FASB issued ASU No. 2021-10, Government Assistance (Topic 832): Disclosures by Business Entities about Government Assistance. This ASU requires business entities to make annual disclosures about transactions with a government they account for by analogizing to a grant or contribution accounting model under ASC 958-605. Our effective date for adoption of this ASU is our fiscal year beginning December 4, 2022 with early adoption permitted. We have evaluated the effect that this guidance will have on our Consolidated Financial Statements and determined it will not have a material impact.
Recently issued accounting standards or pronouncements not disclosed above have been excluded as they are not relevant to the company.
Note 2: Acquisitions
STR Holdings, Inc.
On January 13, 2021, we acquired certain assets of STR Holdings, Inc. ("STR") for a base purchase price of $
D.H.M. Adhesives, Inc.
On February 3, 2020, we acquired certain assets of D.H.M. Adhesives, Inc. (“D.H.M.”) for approximately $
Ramapo Sales and Marketing, Inc.
On May 17, 2019, we acquired certain assets from a window and insulating glass sealants sales and distribution company, Ramapo Sales and Marketing, Inc. (“Ramapo”), headquartered in Charleston, South Carolina. This acquisition supports the integration of the insulating glass business that we acquired as part of the Royal Adhesives acquisition. The purchase price of $
Dalton Holdings, LLC
On July 1, 2019, we completed the sale of Dalton Holdings, LLC (“Dalton Holdings”), which primarily manufactures surfactants and thickeners, within the Americas Adhesives segment. The sale resulted in a pre-tax gain on sale of $
Note 3: Restructuring Actions
The company has approved restructuring plans consisting of consolidation plans, organizational changes and other actions related to the reorganization of our business into segments, the integration of the operations of Royal Adhesives with the operations of the company and other actions to optimize operations. The following table summarizes the pre-tax distribution of charges under these restructuring plans by income statement classification:
| November 27, 2021 |
November 28, 2020 |
November 30, 2019 |
||||||||||
| Cost of sales |
$ | ( |
) | $ | $ | |||||||
| Selling, general and administrative |
||||||||||||
| $ | $ | $ | ||||||||||
The restructuring charges are all recorded in Corporate Unallocated for segment reporting purposes.
A summary of the restructuring liability is presented below:
| Employee- |
||||||||||||
| Related |
Other |
Total |
||||||||||
| Balance at end November 30, 2019 |
$ | $ | $ | |||||||||
| Expense incurred |
||||||||||||
| Cash payments |
( |
) | ( |
) | ( |
) | ||||||
| Foreign currency translation |
||||||||||||
| Balance at end November 28, 2020 |
$ | $ | $ | |||||||||
| Expense incurred |
( |
) | ||||||||||
| Non-cash charges |
( |
) | ( |
) | ||||||||
| Cash payments |
( |
) | ( |
) | ( |
) | ||||||
| Foreign currency translation |
( |
) | ( |
) | ||||||||
| Balance at end November 27, 2021 |
$ | $ | $ | |||||||||
Non-cash charges include accelerated depreciation resulting from the cessation of use of certain long-lived assets. Restructuring liabilities have been classified as a component of other accrued expenses on the Consolidated Balance Sheets.
Note 4: Supplemental Financial Statement Information
Statement of Income Information
Additional details of income statement amounts for 2021, 2020 and 2019 are as follows:
| 2021 |
2020 |
2019 |
||||||||||
| Foreign currency transaction losses, net |
$ | ( |
) | $ | ( |
) | $ | ( |
) | |||
| (Loss) gain on disposal of assets |
( |
) | ( |
) | ||||||||
| Net periodic pension benefit |
||||||||||||
| Other, net |
||||||||||||
| Total other income, net |
$ | $ | $ | |||||||||
| Research and development expenses (included in SG&A expenses) |
$ | $ | $ | |||||||||
Balance Sheet Information
Additional details of balance sheet amounts as of November 27, 2021 and November 28, 2020 are as follows:
| 2021 |
2020 |
|||||||
| Inventories |
||||||||
| Raw materials |
$ | $ | ||||||
| Finished goods |
||||||||
| Total inventories |
$ | $ | ||||||
| Other current assets |
||||||||
| Other receivables |
$ | $ | ||||||
| Prepaid income taxes |
||||||||
| Prepaid taxes other than income taxes |
||||||||
| Prepaid expenses |
||||||||
| Assets held for sale |
||||||||
| Total other current assets |
$ | $ | ||||||
| Property, plant and equipment |
||||||||
| Land |
$ | $ | ||||||
| Buildings and improvements |
||||||||
| Machinery and equipment |
||||||||
| Construction in progress |
||||||||
| Total, at cost |
||||||||
| Accumulated depreciation |
( |
) | ( |
) | ||||
| Net property, plant and equipment |
$ | $ | ||||||
| Other assets |
||||||||
| Investments and company owned life insurance |
$ | $ | ||||||
| Equity method investments |
||||||||
| Equity investments |
||||||||
| Long-term deferred income taxes |
||||||||
| Prepaid pension costs |
||||||||
| Postretirement other than pension asset |
||||||||
| Operating lease right-of-use assets |
||||||||
| Other long-term receivables |
||||||||
| Other long-term assets |
||||||||
| Total other assets |
$ | $ | ||||||
| Other accrued expenses |
||||||||
| Taxes other than income taxes |
$ | $ | ||||||
| Miscellaneous services |
||||||||
| Customer rebates |
||||||||
| Interest |
||||||||
| Insurance |
||||||||
| Product liability |
||||||||
| Contingent consideration liability |
||||||||
| Current operating lease liabilities |
||||||||
| Accrued expenses |
||||||||
| Total other accrued expenses |
$ | $ | ||||||
| Other liabilities |
||||||||
| Asset retirement obligations |
$ | $ | ||||||
| Long-term deferred income taxes |
||||||||
| Long-term income tax liability |
||||||||
| Long-term deferred compensation |
||||||||
| Postretirement other than pension |
||||||||
| Noncurrent operating lease liabilities |
||||||||
| Long-term accrued payroll tax |
||||||||
| Environmental liabilities |
||||||||
| Other long-term liabilities |
||||||||
| Total other liabilities |
$ | $ | ||||||
Additional details on the trade receivables allowance for doubtful accounts, credits related to pricing or quantities shipped and early payment discounts for 2021, 2020 and 2019 are as follows:
| 2021 |
2020 |
2019 |
||||||||||
| Balance at beginning of year |
$ | $ | $ | |||||||||
| Charged to expenses and other adjustments |
( |
) | ||||||||||
| Write-offs |
( |
) | ( |
) | ( |
) | ||||||
| Foreign currency translation effect |
( |
) | ( |
) | ||||||||
| Balance at end of year |
$ | $ | $ | |||||||||
Statement of Comprehensive Income Information
The following tables provides details of total comprehensive income (loss):
| November 27, 2021 |
||||||||||||||||
| Non-controlling |
||||||||||||||||
| H.B. Fuller Stockholders |
Interest |
|||||||||||||||
| Pretax |
Tax |
Net |
Net |
|||||||||||||
| Net income attributable to H.B. Fuller and non-controlling interests |
- | - | $ | $ | ||||||||||||
| Other comprehensive income (loss) |
||||||||||||||||
| Foreign currency translation adjustment1 |
$ | ( |
) | - | ( |
) | ( |
) | ||||||||
| Defined benefit pension plans adjustment2 |
( |
) | - | |||||||||||||
| Interest rate swap3 |
( |
) | - | |||||||||||||
| Other cash flow hedges3 |
( |
) | ( |
) | - | |||||||||||
| Other comprehensive income (loss) |
$ | $ | ( |
) | ( |
) | ||||||||||
| Comprehensive income |
$ | $ | ||||||||||||||
| November 28, 2020 |
||||||||||||||||
| Non-controlling |
||||||||||||||||
| H.B. Fuller Stockholders |
Interest |
|||||||||||||||
| Pretax |
Tax |
Net |
Net |
|||||||||||||
| Net income attributable to H.B. Fuller and non-controlling interests |
- | - | $ | $ | ||||||||||||
| Other comprehensive income (loss) |
||||||||||||||||
| Foreign currency translation adjustment1 |
$ | - | ||||||||||||||
| Defined benefit pension plans adjustment2 |
( |
) | - | |||||||||||||
| Interest rate swap3 |
( |
) | ( |
) | - | |||||||||||
| Other cash flow hedges3 |
( |
) | - | |||||||||||||
| Other comprehensive income |
$ | $ | ||||||||||||||
| Comprehensive income |
$ | $ | ||||||||||||||
| November 30, 2019 |
||||||||||||||||
| Non-controlling |
||||||||||||||||
| H.B. Fuller Stockholders |
Interest |
|||||||||||||||
| Pretax |
Tax |
Net |
Net |
|||||||||||||
| Net income attributable to H.B. Fuller and non-controlling interests |
- | - | $ | $ | ||||||||||||
| Other comprehensive income (loss) |
||||||||||||||||
| Foreign currency translation adjustment1 |
$ | ( |
) | - | ( |
) | ||||||||||
| Defined benefit pension plans adjustment2 |
( |
) | ( |
) | - | |||||||||||
| Interest rate swap3 |
( |
) | ( |
) | - | |||||||||||
| Other cash flow hedges3 |
( |
) | - | |||||||||||||
| Other comprehensive (loss) income |
$ | ( |
) | $ | ( |
) | ||||||||||
| Comprehensive income |
$ | $ | ||||||||||||||
1 Income taxes are not provided for foreign currency translation relating to indefinite investments in international subsidiaries.
2 Loss reclassified from accumulated other comprehensive income (loss) into earnings as part of net periodic cost related to pension and other postretirement benefit plans is reported in cost of sales and SG&A expenses.
3 Loss reclassified from accumulated other comprehensive income (loss) into earnings is reported in other income, net.
Statement of Total Equity Information
Components of accumulated other comprehensive income (loss) are as follows:
| November 27, 2021 | ||||||||||||
| Non- | ||||||||||||
| H.B. Fuller | controlling | |||||||||||
| Total | Stockholders | Interests | ||||||||||
| Foreign currency translation adjustment | $ | ( | ) | $ | ( | ) | $ | ( | ) | |||
| Interest rate swap, net of taxes of $ | ( | ) | ( | ) | ||||||||
| Cash flow hedges, net of taxes of ($) | ||||||||||||
| Defined benefit pension plans adjustment, net of taxes of $ | ( | ) | ( | ) | ||||||||
| Reclassification of AOCI tax effects | ( | ) | ( | ) | ||||||||
| Total accumulated other comprehensive loss | $ | ( | ) | $ | ( | ) | $ | ( | ) | |||
| November 28, 2020 | ||||||||||||
| Non- | ||||||||||||
| H.B. Fuller | controlling | |||||||||||
| Total | Stockholders | Interests | ||||||||||
| Foreign currency translation adjustment | $ | ( | ) | $ | ( | ) | $ | ( | ) | |||
| Interest rate swap, net of taxes of $ | ( | ) | ( | ) | ||||||||
| Cash flow hedges, net of taxes of ($) | - | |||||||||||
| Defined benefit pension plans adjustment, net of taxes of $ | ( | ) | ( | ) | - | |||||||
| Reclassification of AOCI tax effects | ( | ) | ( | ) | - | |||||||
| Total accumulated other comprehensive loss | $ | ( | ) | $ | ( | ) | $ | ( | ) | |||
| November 30, 2019 | ||||||||||||
| Non- | ||||||||||||
| H.B. Fuller | controlling | |||||||||||
| Total | Stockholders | Interests | ||||||||||
| Foreign currency translation adjustment | $ | ( | ) | $ | ( | ) | $ | ( | ) | |||
| Interest rate swap, net of taxes of ($) | ( | ) | ( | ) | ||||||||
| Cash flow hedges, net of taxes of $ | ||||||||||||
| Defined benefit pension plans adjustment, net of taxes of $ | ( | ) | ( | ) | ||||||||
| Reclassification of AOCI tax effects | ( | ) | ( | ) | ||||||||
| Total accumulated other comprehensive loss | $ | ( | ) | $ | ( | ) | $ | ( | ) | |||
Note 5: Goodwill and Other Intangible Assets
Goodwill balances by reportable segment as of November 27, 2021 and November 28, 2020 consisted of the following:
| 2021 |
2020 |
|||||||
| Hygiene, Health and Consumable Adhesives |
$ | $ | ||||||
| Engineering Adhesives |
||||||||
| Construction Adhesives |
||||||||
| Total |
$ | $ | ||||||
Additional details related to goodwill for 2021 and 2020 are as follows:
| 2021 |
2020 |
|||||||
| Balance at beginning of year |
$ | $ | ||||||
| Ramapo acquisition |
( |
) | ||||||
| D.H.M acquisition |
||||||||
| Foreign currency translation effect |
( |
) | ||||||
| Balance at end of year |
$ | $ | ||||||
We evaluate our goodwill for impairment annually at the beginning of the fourth quarter or earlier upon the occurrence of substantive unfavorable changes in economic conditions, industry trends, costs, cash flows, or ongoing declines in market capitalization. The quantitative impairment test requires judgment, including the identification of reporting units, the assignment of assets, liabilities and goodwill to reporting units, and the determination of fair value of each reporting unit. The impairment test requires the comparison of the fair value of each reporting unit with its carrying amount, including goodwill. In performing the impairment test, we determined the fair value of our reporting units through the income approach by using DCF analyses. Determining fair value requires the company to make judgments about appropriate discount rates, perpetual growth rates and the amount and timing of expected future cash flows. The cash flows employed in the DCF analysis for each reporting unit are based on the reporting unit's budget, long-term business plan, and recent operating performance. Discount rate assumptions are based on an assessment of the risk inherent in the future cash flows of the respective reporting unit and market conditions. Based on the analysis performed during the fourth quarter of 2021, there were no indications of impairment for any of our reporting units.
Balances of amortizable identifiable intangible assets, excluding goodwill and other non-amortizable intangible assets, are as follows:
| Purchased |
||||||||||||||||||||
| Technology |
Customer |
|||||||||||||||||||
| Amortizable Intangible Assets |
and Patents |
Relationships |
Tradename |
All Other |
Total |
|||||||||||||||
| As of November 27, 2021 |
||||||||||||||||||||
| Original cost |
$ | $ | $ | $ | $ | |||||||||||||||
| Accumulated amortization |
( |
) | ( |
) | ( |
) | ( |
) | ( |
) | ||||||||||
| Net identifiable intangibles |
$ | $ | $ | $ | $ | |||||||||||||||
| Weighted-average useful lives (in years) |
||||||||||||||||||||
| As of November 28, 2020 |
||||||||||||||||||||
| Original cost |
$ | $ | $ | $ | $ | |||||||||||||||
| Accumulated amortization |
( |
) | ( |
) | ( |
) | ( |
) | $ | ( |
) | |||||||||
| Net identifiable intangibles |
$ | $ | $ | $ | $ | |||||||||||||||
| Weighted-average useful lives (in years) |
||||||||||||||||||||
Amortization expense with respect to amortizable intangible assets was $
Estimated aggregate amortization expense based on the current carrying value of amortizable intangible assets for the next five fiscal years are as follows:
| Fiscal Year |
2022 |
2023 |
2024 |
2025 |
2026 |
Thereafter |
||||||||||||||||||
| Amortization Expense |
$ | $ | $ | $ | $ | $ | ||||||||||||||||||
The above amortization expense forecast is an estimate. Actual amounts may change from such estimated amounts due to fluctuations in foreign currency exchange rates, additional intangible asset acquisitions, potential impairment, accelerated amortization or other events.
Non-amortizable intangible assets as of November 27, 2021 and November 28, 2020 were $
Note 6: Leases
We adopted ASU No. 2016-02 and related standards (collectively, “ASC 842”), which replaced previous lease accounting guidance, during the first quarter ended February 29, 2020 using the modified retrospective method of adoption. As a result of electing this transition method, prior periods have not been restated. The adoption of ASC 842 resulted in the recording of right-of-use assets and associated lease liabilities of approximately $
As a lessee, the company leases office, manufacturing and warehouse space, and equipment. Certain lease agreements include rental payments adjusted annually based on changes in an inflation index. Our leases do not contain material residual value guarantees or material restrictive covenants. Lease expense is recognized on a straight-line basis over the lease term. We determine if an arrangement is a lease upon inception. A contract is or contains a lease if the contract conveys the right to control the use of an identified asset for a period of time in exchange for consideration. The right to control the use of an asset includes the right to obtain substantially all of the economic benefits of the underlying asset and the right to direct how and for what purpose the asset is used.
Operating lease and finance lease right-of-use assets and liabilities are recognized at commencement date based on the present value of lease payments over the lease term. The discount rate used to calculate present value is the company’s incremental borrowing rate. We determine the incremental borrowing rate for each lease based primarily on its lease term and the economic environment of the applicable country or region.
Certain leases include one or more options to renew, with terms that can extend the lease term up to years. We include options to renew the lease as part of the right-of-use lease asset and liability when it is reasonably certain we will exercise the option. In addition, certain leases contain termination options with an associated penalty. In general, the company is not reasonably certain to exercise such options.
For the measurement and classification of lease agreements, we group lease and non-lease components into a single lease component for all underlying asset classes. Variable lease payments primarily include payments for non-lease components, such as maintenance costs, payments for leased assets used beyond their non-cancelable lease term as adjusted for contractual options to terminate or renew, and payments for non-components such as sales tax. Certain leases contain immaterial variable lease payments based on usage.
The components of lease expense are as follows:
| November 27, 2021 | November 28, 2020 | |||||||
| Operating lease cost | $ | $ | ||||||
| Finance lease cost: | ||||||||
| Amortization of assets1 | ||||||||
| Interest on lease liabilities1 | ||||||||
| Variable lease cost | ||||||||
| Total net lease cost | $ | $ | ||||||
1 In 2020, finance leases were not material for disclosure.
Supplemental balance sheet information related to leases is as follows:
| Location on | |||||||||
| Balance Sheet | November 27, 2021 | November 28, 2020 | |||||||
| Operating leases: | |||||||||
| Operating lease right-of-use assets | Other assets | $ | $ | ||||||
| Current operating lease liabilities | Other accrued expenses | ||||||||
| Noncurrent operating lease liabilities | Other liabilities | ||||||||
| Total operating lease liabilities | $ | $ | |||||||
| Finance leases: | |||||||||
| Equipment right-of-use assets1 | Property, plant and equipment | $ | |||||||
| Current obligations of finance leases1 | Other accrued expenses | $ | |||||||
| Finance leases, net of current obligations1 | Other liabilities | ||||||||
| Total finance lease liabilities | $ | ||||||||
1 In 2020, finance leases were not material for disclosure.
As of November 27, 2021, the weighted average remaining lease term is
Supplemental information related to leases is as follows:
| November 27, 2021 | November 28, 2020 | |||||||
| Cash paid amounts included in the measurement of lease liabilities: | ||||||||
| Operating cash flows from operating leases | $ | $ | ||||||
| Operating cash flows from finance leases1 | ||||||||
| Financing cash flows from finance leases1 | ||||||||
| Right-of-use assets obtained in exchange for lease liabilities: | ||||||||
| Operating leases | $ | $ | ||||||
| Finance leases1 | ||||||||
1 In 2020, finance leases were not material for disclosure.
Maturities of lease liabilities are as follows:
| November 27, 2021 | ||||||||
| Fiscal Year | Finance Leases | Operating Leases | ||||||
| 2022 | $ | $ | ||||||
| 2023 | ||||||||
| 2024 | ||||||||
| 2025 | ||||||||
| 2026 | ||||||||
| 2027 and beyond | ||||||||
| Total | ||||||||
| Less: amounts representing interest | ( | ) | ( | ) | ||||
| Present value of future minimum payments | ||||||||
| Less: current obligations | ( | ) | ( | ) | ||||
| Noncurrent lease liabilities | $ | $ | ||||||
Rent expense for all operating leases, which includes minimum lease payments and other charges such as common area maintenance fees, was $
Note 7: Notes Payable, Long-Term Debt and Lines of Credit
Notes Payable
Notes payable were $
Long-Term Debt
| Weighted-Average | Fiscal Year | Balance at | Balance at | |||||||||||||
| Interest Rate at | Maturity | November 27, | November 28, | |||||||||||||
| Long-Term Debt | November 27, 2021 | Date | 2021 | 2020 | ||||||||||||
| Revolving credit facility | % | $ | $ | |||||||||||||
| Term Loan B1 | % | |||||||||||||||
| Public Notes2 | % | |||||||||||||||
| Public Notes3 | % | |||||||||||||||
| Other, including debt issuance cost and discount | ( | ) | ( | ) | ||||||||||||
| Total debt | $ | $ | ||||||||||||||
| Less: current maturities | ||||||||||||||||
| Total long-term debt, excluding current maturities | $ | $ | ||||||||||||||
1 Term Loan B, due on October 20, 2024, $
2 Public Notes, due February 15, 2027, $
3 Public Notes, due October 15, 2028, $
Term Loans
On October 20, 2017, we entered into a secured term loan credit agreement (“Term Loan B Credit Agreement”) with a consortium of financial institutions under which we established a $
On February 27, 2018, we entered into an interest rate swap agreement to convert $
We are subject to mandatory prepayments in the first quarter of each fiscal year equal to
Public Notes
On February 14, 2017, we issued $
On October 20, 2020, we issued $
The Public Notes are senior unsecured obligations of the company and will rank equally with the company’s other unsecured and unsubordinated debt from time to time outstanding.
Fair Value of Long-Term Debt
Long-term debt had an estimated fair value of $
Long-term Debt Maturities
Maturities of long-term debt for the next five fiscal years are as follows:
| Fiscal Year | 2022 | 2023 | 2024 | 2025 | 2026 | Thereafter | ||||||||||||||||||
| Long-term debt obligations | $ | $ | $ | $ | $ | $ | ||||||||||||||||||
Revolving Credit Facility
On October 20, 2020, we amended and restated our revolving credit facility. The revolving credit facility is secured along with the Term Loan B Credit Agreement, by a first-priority security interest in substantially all of the personal property assets of the company and each Guarantor, including
As of November 27, 2021, amounts related to our revolving credit facility was as follows:
| Committed | Drawn | Unused | ||||||||||
| Revolving credit facility | $ | $ | $ | |||||||||
The secured, multi-currency revolving credit facility can be drawn upon for general corporate purposes up to a maximum of $
Covenants
The secured Term Loan B Credit Agreement and secured revolving credit facility are subject to certain covenants and restrictions. Restrictive covenants include, but are not limited to, limitations on secured and unsecured borrowings, interest coverage, intercompany transfers and investments, third party investments, dispositions of assets, leases, liens, dividends and distributions, and contains a maximum secured debt to trailing twelve months EBITDA requirement. Certain covenants become less restrictive after meeting leverage or other financial ratios. In addition, we cannot be a member of any consolidated group as defined for income tax purposes other than with our subsidiaries. At November 27, 2021 and November 28, 2020, all financial covenants were met.
The Indenture under which the Public Notes have been issued contains covenants imposing certain limitations on the ability of the company to incur liens or enter into sales and leaseback transactions. It also provides for customary events of default (subject in certain cases to customary grace and cure periods), which include among other things nonpayment, breach of covenants in the Indenture and certain events of bankruptcy and insolvency. If an event of default occurs and is continuing with respect to the Public Notes, the Trustee or holders of at least 25% in principal amount outstanding of the Public Notes may declare the principal and the accrued and unpaid interest, if any, on all of the outstanding Public Notes to be due and payable. These covenants and events of default are subject to a number of important qualifications, limitations and exceptions that are described in the Indenture.
Note 8: Stockholders' Equity
Preferred Stock
The Board of Directors is authorized to issue up to
Common Stock
There were
On April 6, 2017, the Board of Directors authorized a share repurchase program of up to $
| Common Shares Outstanding | 2021 | 2020 | 2019 | |||||||||
| Beginning balance | ||||||||||||
| Stock options exercised | ||||||||||||
| Deferred compensation paid | ||||||||||||
| Restricted units vested | ||||||||||||
| Shares withheld for taxes | ( | ) | ( | ) | ( | ) | ||||||
| Ending balance | ||||||||||||
Note 9: Accounting for Share-Based Compensation
Overview
We have various share-based compensation programs, which provide for equity awards including non-qualified stock options, incentive stock options, restricted stock units, performance awards and deferred compensation. These equity awards fall under several plans and are described below.
Share-based Compensation Plans
We currently grant stock options and restricted stock units under equity compensation and deferred compensation plans.
Stock options are granted to officers and key employees at prices not less than the fair market value at the date of grant. Non-qualified stock options are generally exercisable beginning year from the date of grant in cumulative yearly amounts of
Restricted stock awards are nonvested stock-based awards that include grants of restricted stock units. Restricted stock awards are independent of option grants and are subject to forfeiture if employment terminates prior to the release of the restrictions. Such awards generally vest beginning year from the date of grant or
Restricted stock units have dividend equivalent rights equal to the cash dividend paid on restricted stock shares. However, restricted stock units do not have voting rights of common stock and are not considered issued and outstanding upon grant. Restricted stock units become newly issued shares when vested. The dividend equivalent rights for restricted stock units are forfeitable.
We expense the cost, which is the grant date fair market value, of the restricted stock units ratably over the period during which the restrictions lapse. The grant date fair value is our closing stock price on the date of grant.
We are required to recognize compensation expense when an employee is eligible to retire. We consider employees eligible to retire at age 55 and after 10 years of service. Awards granted to retirement-eligible employees are forfeited if the retirement-eligible employees retire prior to 180 days after the grant. Accordingly, the related compensation expense is recognized during the 180 day period for awards granted to retirement-eligible employees or over the period from the grant date to the date retirement eligibility is achieved, if less than the stated vesting period.
2020 Master Incentive Plan
This plan allows for granting of awards to employees. The plan permits granting of (a) stock options; (b) stock appreciation rights; (c) restricted stock and restricted stock units; (d) performance awards; (e) dividend equivalents; (f) other awards based on our common stock, including shares for amounts employees deferred under the Key Employee Deferred Compensation Plan. There were
2018 Master Incentive Plan
This plan allows for granting of awards to employees. The plan permits granting of (a) stock options; (b) stock appreciation rights; (c) restricted stock and restricted stock units; (d) performance awards; (e) dividend equivalents; (f) other awards based on our common stock, including shares for amounts employees deferred under the Key Employee Deferred Compensation Plan.
Year 2016 Master Incentive Plan
This plan allows for granting of awards to employees. The plan permits granting of (a) stock options; (b) stock appreciation rights; (c) restricted stock awards; (d) performance awards; (e) dividend equivalents; and (f) other awards based on our common stock, including shares for amounts employees deferred under the Key Employee Deferred Compensation Plan.
2009 Directors’ Stock Incentive Plan
This plan permits granting of (a) shares for amounts non-employee directors defer under the Directors’ Deferred Compensation Plan and (b) discretionary grants of restricted stock, stock options, stock appreciation rights, performance awards and other stock awards.
Directors' Deferred Compensation Plan
This plan allows non-employee directors to defer all or a portion of their retainer and meeting fees in a number of investment choices, including units representing shares of our common stock. We provide a
Key Employee Deferred Compensation Plan
This plan allows key employees to defer a portion of their eligible compensation in a number of investment choices, including units representing shares of company common stock. We provide a
Grant-Date Fair Value
We use the Black-Scholes option-pricing model to calculate the grant-date fair value of stock option awards. The fair value of options granted during 2021, 2020 and 2019 were calculated using the following assumptions:
| 2021 |
2020 |
2019 |
||||||||||
| Expected life (in years) |
||||||||||||
| Weighted-average expected volatility |
% | % | % | |||||||||
| Expected volatility range |
||||||||||||
| Risk-free interest rate |
||||||||||||
| Weighted-average expected dividend |
% | % | % | |||||||||
| Expected dividend yield range |
||||||||||||
| Weighted-average fair value of grants |
$ | $ | $ | |||||||||
Expected life – We use historical employee exercise and option expiration data to estimate the expected life assumption for the Black-Scholes grant-date valuation. We believe that this historical data is currently the best estimate of the expected term of a new option. We use a weighted-average expected life for all awards.
Expected volatility – Volatility is calculated using our stock’s historical volatility for the same period of time as the expected life. We have no reason to believe that its future volatility will differ from the past.
Risk-free interest rate – The rate is based on the U.S. Treasury yield curve in effect at the time of the grant for the same period of time as the expected life.
Expected dividend yield – The calculation is based on the total expected annual dividend payout divided by the average stock price.
Expense
We use the straight-line attribution method to recognize share-based compensation expense for option awards and restricted stock units with graded and cliff vesting. Incentive stock options and performance awards are based on certain performance-based metrics and the expense is adjusted quarterly, based on our projections of the achievement of those metrics. The amount of share-based compensation expense recognized during a period is based on the value of the portion of the awards that are ultimately expected to vest. The expense is recognized over the requisite service period, which for us is the period between the grant date and the earlier of the award’s stated vesting term or the date the employee is eligible for early vesting based on the terms of the plans.
Total share-based compensation expense was $
As of November 27, 2021, $
Stock Option Activity
The stock option activity for the years ended November 27, 2021, November 28, 2020, and November 30, 2019 is summarized below:
| Weighted- |
||||||||
| Average |
||||||||
| Options |
Exercise Price |
|||||||
| Outstanding at December 1, 2018 |
$ | |||||||
| Granted |
||||||||
| Exercised |
( |
) | ||||||
| Forfeited or cancelled |
( |
) | ||||||
| Outstanding at November 30, 2019 |
$ | |||||||
| Granted |
||||||||
| Exercised |
( |
) | ||||||
| Forfeited or cancelled |
( |
) | ||||||
| Outstanding at November 28, 2020 |
$ | |||||||
| Granted |
||||||||
| Exercised |
( |
) | ||||||
| Forfeited or cancelled |
( |
) | ||||||
| Outstanding at November 27, 2021 |
$ | |||||||
The fair value of options granted during 2021, 2020 and 2019 was $
Restricted Stock Activity
The nonvested restricted stock activity for the years ended November 27, 2021, November 28, 2020, and November 30, 2019 is summarized below:
| Weighted- |
||||||||||||
| Weighted- |
Average |
|||||||||||
| Average |
Remaining |
|||||||||||
| Grant |
Contractual |
|||||||||||
| Date Fair |
Life |
|||||||||||
| Units |
Value |
(in Years) |
||||||||||
| Nonvested at December 1, 2018 |
$ | |||||||||||
| Granted |
||||||||||||
| Vested |
( |
) | - | |||||||||
| Forfeited |
( |
) | ||||||||||
| Nonvested at November 30, 2019 |
$ | |||||||||||
| Granted |
||||||||||||
| Vested |
( |
) | - | |||||||||
| Forfeited |
( |
) | ||||||||||
| Nonvested at November 28, 2020 |
$ | |||||||||||
| Granted |
||||||||||||
| Vested |
( |
) | - | |||||||||
| Forfeited |
( |
) | ||||||||||
| Nonvested at November 27, 2021 |
$ | |||||||||||
Total fair value of restricted stock vested during 2021, 2020, and 2019 was $
We repurchased
Deferred Compensation Activity
Deferred compensation units are fully vested at the date of contribution. The deferred compensation units outstanding for the years ended November 27, 2021, November 28, 2020, and November 30, 2019 is summarized below:
| Non-employee |
||||||||||||
| Directors |
Employees |
Total |
||||||||||
| Units outstanding December 1, 2018 |
||||||||||||
| Participant contributions |
||||||||||||
| Company match contributions1 |
||||||||||||
| Payouts |
( |
) | ( |
) | ||||||||
| Units outstanding November 30, 2019 |
||||||||||||
| Participant contributions |
||||||||||||
| Company match contributions1 |
||||||||||||
| Payouts |
( |
) | ( |
) | ( |
) | ||||||
| Units outstanding November 28, 2020 |
||||||||||||
| Participant contributions |
||||||||||||
| Company match contributions1 |
||||||||||||
| Payouts |
( |
) | ( |
) | ( |
) | ||||||
| Units outstanding November 27, 2021 |
||||||||||||
1 The non-employee directors’ company match includes
The fair value of non-employee directors’ company matches for 2021, 2020 and 2019 was $
Note 10: Pension and Postretirement Benefits
Defined Contribution Plan
All U.S. employees have the option of contributing up to
All U.S. employees are eligible to receive an annual discretionary non-elective contribution to the 401(k) plan of up to 3 percent based on achieving the company’s earnings per share target. This discretionary contribution is in addition to the contributions described above. A discretionary non-elective contribution of $
The defined contribution plan liability recorded in the Consolidated Balance Sheets was $
Defined Benefit Plans
Noncontributory defined benefit pension plans cover all U.S. employees employed prior to January 1, 2007. Benefits for these plans are based primarily on each employee’s years of service and average compensation. During 2011, we made significant changes to our U.S. pension plan. The changes included: benefits under the plan were locked-in using service and salary as of May 31, 2011, participants no longer earn benefits for future service and salary as they had in the past, affected participants receive a three percent increase to the locked-in benefit for every year they continue to work for us and we are making a retirement contribution of three percent of eligible compensation to the 401(k) Plan for those participants. The funding policy is consistent with the funding requirements of federal law and regulations. Plan assets consist principally of listed equity securities and bonds. During 2020, we amended the U.S. pension plan to add a program for eligible employees to take a lump sum distribution. A total of $
Health care and life insurance benefits are provided for eligible retired employees and their eligible dependents. These benefits are provided through various insurance companies and health care providers. Costs are accrued during the years the employee renders the necessary service.
Certain non-U.S. subsidiaries provide pension benefits for their employees consistent with local practices and regulations. These plans are primarily defined benefit plans covering substantially all employees upon completion of a specified period of service. Benefits for these plans are generally based on years of service and annual compensation.
Following is a reconciliation of the beginning and ending balances of the benefit obligation and fair value of plan assets as of November 27, 2021 and November 28, 2020:
| Pension Benefits | Other Postretirement | |||||||||||||||||||||||
| U.S. Plans | Non-U.S. Plans | Benefits | ||||||||||||||||||||||
| 2021 | 2020 | 2021 | 2020 | 2021 | 2020 | |||||||||||||||||||
| Change in projected benefit obligation | ||||||||||||||||||||||||
| Benefit obligation at beginning of year | $ | $ | $ | $ | $ | $ | ||||||||||||||||||
| Service cost | ||||||||||||||||||||||||
| Interest cost | ||||||||||||||||||||||||
| Participant contributions | ||||||||||||||||||||||||
| Actuarial (gain)/loss1 | ( | ) | ( | ) | ( | ) | ||||||||||||||||||
| Other | ||||||||||||||||||||||||
| Curtailments | ||||||||||||||||||||||||
| Settlement payments | ( | ) | ( | ) | ( | ) | ||||||||||||||||||
| Benefits paid | ( | ) | ( | ) | ( | ) | ( | ) | ( | ) | ( | ) | ||||||||||||
| Foreign currency translation effect | ( | ) | ||||||||||||||||||||||
| Benefit obligation at end of year | ||||||||||||||||||||||||
| Change in plan assets | ||||||||||||||||||||||||
| Fair value of plan assets at beginning of year | ||||||||||||||||||||||||
| Actual return on plan assets | ||||||||||||||||||||||||
| Employer contributions | ||||||||||||||||||||||||
| Participant contributions | ||||||||||||||||||||||||
| Other | ||||||||||||||||||||||||
| Settlement payments | ( | ) | ( | ) | ||||||||||||||||||||
| Benefits paid2 | ( | ) | ( | ) | ( | ) | ( | ) | ( | ) | ( | ) | ||||||||||||
| Foreign currency translation effect | ( | ) | ||||||||||||||||||||||
| Fair value of plan assets at end of year | ||||||||||||||||||||||||
| Plan assets in excess of (less than) benefit obligation as of year end | $ | $ | $ | ( | ) | $ | ( | ) | $ | $ | ||||||||||||||
1 Actuarial loss in 2021 and actuarial loss in 2020 for the U.S. Plans is primarily due to assumption changes. Actuarial loss in 2021 and actuarial loss in 2020 for the Non-U.S. Plans are due to both assumption changes and plan experience.
2 Amount excludes benefit payments made from sources other than plan assets.
| Amounts in accumulated other comprehensive income (loss) that have not been recognized as components of net periodic benefit cost | Pension Benefits | Other Postretirement | ||||||||||||||||||||||
| U.S. Plans | Non-U.S. Plans | Benefits | ||||||||||||||||||||||
| 2021 | 2020 | 2021 | 2020 | 2021 | 2020 | |||||||||||||||||||
| Unrecognized actuarial loss | $ | $ | $ | $ | $ | ( | ) | $ | ( | ) | ||||||||||||||
| Unrecognized prior service (benefit) cost | ( | ) | ( | ) | ||||||||||||||||||||
| Ending balance | $ | $ | $ | $ | $ | ( | ) | $ | ( | ) | ||||||||||||||
| Pension Benefits | Other Postretirement | |||||||||||||||||||||||
| U.S. Plans | Non-U.S. Plans | Benefits | ||||||||||||||||||||||
| 2021 | 2020 | 2021 | 2020 | 2021 | 2020 | |||||||||||||||||||
| Statement of financial position as of fiscal year-end | ||||||||||||||||||||||||
| Non-current assets | $ | $ | $ | $ | $ | $ | ||||||||||||||||||
| Accrued benefit cost | ||||||||||||||||||||||||
| Current liabilities | ( | ) | ( | ) | ( | ) | ( | ) | ( | ) | ( | ) | ||||||||||||
| Non-current liabilities | ( | ) | ( | ) | ( | ) | ( | ) | ( | ) | ( | ) | ||||||||||||
| Ending balance | $ | $ | $ | ( | ) | $ | ( | ) | $ | $ | ||||||||||||||
The accumulated benefit obligation of the U.S. pension and other postretirement plans was $
The following amounts relate to pension plans with accumulated benefit obligations in excess of plan assets as of November 27, 2021 and November 28, 2020:
| Pension Benefits and Other Postretirement Benefits | ||||||||||||||||
| U.S. Plans | Non-U.S. Plans | |||||||||||||||
| 2021 | 2020 | 2021 | 2020 | |||||||||||||
| Accumulated benefit obligation | $ | $ | $ | $ | ||||||||||||
| Fair value of plan assets | ||||||||||||||||
The following amounts relate to pension plans with projected benefit obligations in excess of plan assets as of November 27, 2021 and November 28, 2020:
| Pension Benefits and Other Postretirement Benefits | ||||||||||||||||
| U.S. Plans | Non-U.S. Plans | |||||||||||||||
| 2021 | 2020 | 2021 | 2020 | |||||||||||||
| Projected benefit obligation | $ | $ | $ | $ | ||||||||||||
| Fair value of plan assets | $ | |||||||||||||||
Information about the expected cash flows is as follows:
| Pension Benefits | Other | ||||||||||||
| Non-U.S. | Postretirement | ||||||||||||
| U.S. Plans | Plans | Benefits | |||||||||||
| Employer contributions | |||||||||||||
| 2022 | $ | $ | $ | ||||||||||
| Expected benefit payments | |||||||||||||
| 2022 | |||||||||||||
| 2023 | |||||||||||||
| 2024 | |||||||||||||
| 2025 | |||||||||||||
| 2026-2031 | |||||||||||||
The components of our net period defined benefit pension and postretirement benefit costs other than service cost are presented as non-operating expenses and service cost is presented in operating expenses.
Components of net periodic benefit cost and other supplemental information for the years ended November 27, 2021, November 28, 2020, and November 30, 2019 are as follows:
| Pension Benefits | Other | |||||||||||||||||||||||||||||||||||
| U.S. Plans | Non-U.S. Plans | Postretirement Benefits | ||||||||||||||||||||||||||||||||||
| Net periodic cost (benefit) | 2021 | 2020 | 2019 | 2021 | 2020 | 2019 | 2021 | 2020 | 2019 | |||||||||||||||||||||||||||
| Service cost | $ | $ | $ | $ | $ | $ | $ | $ | $ | |||||||||||||||||||||||||||
| Interest cost | ||||||||||||||||||||||||||||||||||||
| Expected return on assets | ( | ) | ( | ) | ( | ) | ( | ) | ( | ) | ( | ) | ( | ) | ( | ) | ( | ) | ||||||||||||||||||
| Amortization: | ||||||||||||||||||||||||||||||||||||
| Prior service cost (benefit) | ( | ) | ( | ) | ||||||||||||||||||||||||||||||||
| Actuarial loss | ||||||||||||||||||||||||||||||||||||
| Curtailment loss | ||||||||||||||||||||||||||||||||||||
| Settlement charge | ||||||||||||||||||||||||||||||||||||
| Net periodic (benefit) cost | $ | ( | ) | $ | ( | ) | $ | ( | ) | $ | ( | ) | $ | ( | ) | $ | ( | ) | $ | ( | ) | $ | ( | ) | $ | ( | ) | |||||||||
| Pension Benefits | Other | |||||||||||||||||||||||||||||||||||
| U.S. Plans | Non-U.S. Plans | Postretirement Benefits | ||||||||||||||||||||||||||||||||||
| Weighted-average assumptions used to determine benefit obligations | 2021 | 2020 | 2019 | 2021 | 2020 | 2019 | 2021 | 2020 | 2019 | |||||||||||||||||||||||||||
| Discount rate | % | % | % | % | % | % | % | % | % | |||||||||||||||||||||||||||
| Rate of compensation increase1 | % | % | % | % | % | % | N/A | N/A | N/A | |||||||||||||||||||||||||||
| Weighted-average assumptions used to determine net costs for years ended | 2021 | 2020 | 2019 | 2021 | 2020 | 2019 | 2021 | 2020 | 2019 | |||||||||||||||||||||||||||
| Discount rate | % | % | % | % | % | % | % | % | % | |||||||||||||||||||||||||||
| Expected return on plan assets | % | % | % | % | % | % | % | % | % | |||||||||||||||||||||||||||
| Rate of compensation increase1 | % | % | % | % | % | % | 0.00 | % | N/A | N/A | ||||||||||||||||||||||||||
1 Under the U.S. pension plan, the compensation amount was locked-in as of May 31, 2011 and thus the benefit no longer includes compensation increases. The
The discount rate assumption is determined using an actuarial yield curve approach, which results in a discount rate that reflects the characteristics of the plan. The approach identifies a broad population of corporate bonds that meet the quality and size criteria for the particular plan. We use this approach rather than a specific index that has a certain set of bonds that may or may be representative of the characteristics of our particular plan. A higher discount rate reduces the present value of the pension obligations. The discount rate for the U.S. pension plan was
For the U.S. pension plan, we adopted the Adjusted Pri-2012 base mortality table projected generationally using scale MP-2021.
The expected long-term rate of return on plan assets assumption for the U.S. pension plan was
Management, in conjunction with our external financial advisors, uses the actual historical rates of return of the asset categories to assess the reasonableness of the expected long-term rate of return on plan assets.
The expected long-term rate of return on plan assets assumption for non-U.S. pension plans was a weighted-average of
| Assumed health care trend rates | 2021 | 2020 | 2019 | ||||||
| Health care cost trend rate assumed for next year | % | % | % | ||||||
| Rate to which the cost trend rate is assumed to decline (the ultimate trend rate) | % | % | % | ||||||
| Fiscal year that the rate reaches the ultimate trend rate | |||||||||
The asset allocation for the company’s U.S. and non-U.S. pension plans at the end of 2021 and 2020 follows.
| U.S. Pension Plans | Non-U.S. Pension Plans | Other Postretirement Plans | ||||||||||||||||||||||||||||||||||
| Percentage of | Percentage of | Percentage of | ||||||||||||||||||||||||||||||||||
| Plan Assets at | Plan Assets at | Plan Assets at | ||||||||||||||||||||||||||||||||||
| Target | Year-End | Target | Year-End | Target | Year-End | |||||||||||||||||||||||||||||||
| Asset Category | 2021 | 2021 | 2020 | 2021 | 2021 | 2020 | 2021 | 2021 | 2020 | |||||||||||||||||||||||||||
| Equities | % | % | % | % | % | % | % | % | % | |||||||||||||||||||||||||||
| Fixed income | % | % | % | % | % | % | % | % | % | |||||||||||||||||||||||||||
| Insurance | % | % | % | % | % | % | % | % | % | |||||||||||||||||||||||||||
| Cash1 | % | % | % | % | % | % | % | % | % | |||||||||||||||||||||||||||
| Total | % | % | % | % | % | % | % | % | % | |||||||||||||||||||||||||||
1 Negative cash for 2020 represents unsettled pending trades within an investment that are classified in cash and cash equivalents until settled.
Plan Asset Management
Plan assets are held in trust and invested in mutual funds, separately managed accounts and other commingled investment vehicles holding U.S. and non-U.S. equity securities, fixed income securities and other investment classes. We employ a total return approach whereby a mix of equities and fixed income investments are used to maximize the long-term return of plan assets for a prudent level of risk. Futures and options may also be used to enhance risk-adjusted long-term returns while improving portfolio diversification and duration. Risk management is accomplished through diversification across asset classes, utilization of multiple investment managers and general plan-specific investment policies. Risk tolerance is established through careful consideration of the plan liabilities, plan funded status and our assessment of our overall liquidity position. This asset allocation policy mix is reviewed annually and actual versus target allocations are monitored regularly and rebalanced on an as-needed basis. Plan assets are invested using a combination of active and passive investment strategies. Passive, or “indexed” strategies, attempt to mimic rather than exceed the investment performance of a market benchmark. The plans’ active investment strategies employ multiple investment management firms which in aggregate cover a range of investment styles and approaches. Performance is monitored and compared to relevant benchmarks on a regular basis.
The U.S. pension plans consist of two plans: a pension plan and a supplemental executive retirement plan (“SERP”). There were
During 2021, we maintained our assets within the allowed ranges of the target asset allocation mix of
The non-U.S. pension plans consist of all the pension plans administered by us outside the U.S., principally consisting of plans in Germany, the United Kingdom, France and Canada. During 2021, we maintained our assets for the non-U.S. pension plans at the specific target asset allocation mix determined for each plan plus or minus the allowed rate and continued our focus to reduce volatility of plan assets in future periods and to more closely match the duration of the assets with the duration of the liabilities of the individual plans. We plan to maintain the portfolios at their respective target asset allocations in 2021.
Other postretirement benefits plans consist of two U.S. plans: a retiree medical health care plan and a group term life insurance plan. There were
Fair Value of Plan Assets
The following table presents plan assets categorized within a three-level fair value hierarchy as described in Note 13.
| November 27, 2021 | ||||||||||||||||
| U.S. Pension Plans | Level 1 | Level 2 | Level 3 | Total Assets | ||||||||||||
| Equities | $ | $ | $ | $ | ||||||||||||
| Fixed income | ||||||||||||||||
| Cash | ||||||||||||||||
| Total categorized in the fair value hierarchy | $ | $ | $ | $ | ||||||||||||
| Non-U.S. Pension Plans | Level 1 | Level 2 | Level 3 | Total Assets | ||||||||||||
| Equities | $ | $ | $ | $ | ||||||||||||
| Fixed income | ||||||||||||||||
| Cash | ||||||||||||||||
| Total categorized in the fair value hierarchy | ||||||||||||||||
| Other investments measured at NAV1 | ||||||||||||||||
| Total | $ | $ | $ | $ | ||||||||||||
| Other Postretirement Benefits | Level 1 | Level 2 | Level 3 | Total Assets | ||||||||||||
| Insurance | $ | $ | $ | $ | ||||||||||||
| Cash | ||||||||||||||||
| Total | $ | $ | $ | $ | ||||||||||||
| November 28, 2020 | ||||||||||||||||
| U.S. Pension Plans | Level 1 | Level 2 | Level 3 | Total Assets | ||||||||||||
| Equities | $ | $ | $ | $ | ||||||||||||
| Fixed income | ||||||||||||||||
| Cash | ||||||||||||||||
| Total categorized in the fair value hierarchy | ||||||||||||||||
| Other investments measured at NAV1 | ||||||||||||||||
| Total | $ | $ | $ | $ | ||||||||||||
| Non-U.S. Pension Plans | Level 1 | Level 2 | Level 3 | Total Assets | ||||||||||||
| Equities | $ | $ | $ | $ | ||||||||||||
| Fixed income | ||||||||||||||||
| Cash | ||||||||||||||||
| Total categorized in the fair value hierarchy | ||||||||||||||||
| Other investments measured at NAV1 | ||||||||||||||||
| Total | $ | $ | $ | $ | ||||||||||||
| Other Postretirement Benefits | Level 1 | Level 2 | Level 3 | Total Assets | ||||||||||||
| Insurance | $ | $ | $ | $ | ||||||||||||
| Cash | ||||||||||||||||
| Total | $ | $ | $ | $ | ||||||||||||
1 In accordance with ASC Topic 820-10, Fair Value Measurement, certain investments that are measured at NAV (Net Asset Value per share) (or its equivalent) practical expedient have not been classified in the fair value hierarchy. The fair value amounts represented in this table are intended to permit reconciliation of the fair value hierarchy to the amounts presented in the statement of financial position.
2 Negative cash for 2020 represents unsettled pending trades within an investment that are classified in cash and cash equivalents until settled.
The definitions of fair values of our pension and other postretirement benefit plan assets at November 27, 2021 and November 28, 2020 by asset category are as follows:
Equities—Primarily publicly traded common stock for purposes of total return and to maintain equity exposure consistent with policy allocations. Investments include: (i) U.S. and non-U.S. equity securities and mutual funds valued at closing prices from national exchanges; and (ii) commingled funds valued at unit values or net asset values provided by the investment managers, which are based on the fair value of the underlying investments. Funds valued at net asset value have various investment strategies including seeking maximum total returns consistent with prudent investment management, seeking current income consistent with preservation of capital and daily liquidity and seeking to approximate the risk and return characterized by a specific index fund. There are no restrictions for redeeming holdings out of these funds and the funds have no unfunded commitments.
Fixed income—Primarily corporate and government debt securities for purposes of total return and managing fixed income exposure to policy allocations. Investments include (i) mutual funds valued at closing prices from national exchanges, (ii) corporate and government debt securities valued at closing prices from national exchanges, (iii) commingled funds valued at unit values or net asset value provided by the investment managers, which are based on the fair value of the underlying investments, and (iv) an annuity contract, the value of which is determined by the provider and represents the amount the plan would receive if the contract were cashed out at year-end.
Insurance—Insurance contracts for purposes of funding postretirement medical benefits. Fair values are the cash surrender values as determined by the providers which are the amounts the plans would receive if the contracts were cashed out at year end.
Cash–Cash balances on hand, accrued income and pending settlements of transactions for purposes of handling plan payments. Fair values are the cash balances as reported by the Trustees of the plans.
The following is a roll forward of the Level 3 investments of our pension and postretirement benefit plan assets during the years ended November 27, 2021 and November 28, 2020:
| Fixed Income | ||||||||
| U.S. Pension Plans | 2021 | 2020 | ||||||
| Level 3 balance at beginning of year | $ | $ | ||||||
| Purchases, sales, issuances and settlements, net | ( | ) | ( | ) | ||||
| Level 3 balance at end of year | $ | $ | ||||||
| Fixed Income | ||||||||
| Non-U.S. Pension Plans | 2021 | 2020 | ||||||
| Level 3 balance at beginning of year | $ | $ | ||||||
| Net transfers into / (out of) level 3 | ||||||||
| Net gains | ( | ) | ( | ) | ||||
| Currency change effect | ( | ) | ||||||
| Level 3 balance at end of year | $ | $ | ||||||
| Insurance | ||||||||
| Other Postretirement Benefits | 2021 | 2020 | ||||||
| Level 3 balance at beginning of year | $ | $ | ||||||
| Net transfers into / (out of) level 3 | ( | ) | ( | ) | ||||
| Purchases, sales, issuances and settlements, net | ( | ) | ( | ) | ||||
| Net gains | ||||||||
| Level 3 balance at end of year | $ | $ | ||||||
Note 11: Income Taxes
| Income before income taxes and income from equity method investments |
2021 |
2020 |
2019 |
|||||||||
| United States |
$ | $ | $ | |||||||||
| Non-U.S. |
||||||||||||
| Total |
$ | $ | $ | |||||||||
| Components of the provision for income tax expense (benefit) |
2021 |
2020 |
2019 |
|||||||||
| Current: |
||||||||||||
| U.S. federal |
$ | $ | $ | |||||||||
| State |
||||||||||||
| Non-U.S. |
||||||||||||
| Deferred: |
||||||||||||
| U.S. federal |
( |
) | ( |
) | ( |
) | ||||||
| State |
( |
) | ( |
) | ||||||||
| Non-U.S. |
( |
) | ( |
) | ( |
) | ||||||
| ( |
) | ( |
) | ( |
) | |||||||
| Total |
$ | $ | $ | |||||||||
| Reconciliation of effective income tax |
2021 |
2020 |
2019 |
|||||||||
| Tax at statutory U.S. federal income tax rate |
$ | $ | $ | |||||||||
| State income taxes, net of federal benefit |
( |
) | ||||||||||
| Foreign dividend repatriation |
||||||||||||
| Foreign operations |
( |
) | ||||||||||
| Executive compensation over $1.0 million |
||||||||||||
| Non-U.S. stock option expense |
||||||||||||
| Change in valuation allowance |
( |
) | ||||||||||
| Research and development tax credit |
( |
) | ( |
) | ( |
) | ||||||
| Foreign-derived intangible income |
( |
) | ( |
) | ( |
) | ||||||
| Global intangible low-taxed income |
||||||||||||
| Provision to return |
( |
) | ||||||||||
| Cross currency swap |
( |
) | ||||||||||
| Contingency reserve |
( |
) | ( |
) | ||||||||
| Other |
( |
) | ||||||||||
| Total income tax expense |
$ | $ | $ | |||||||||
| Deferred income tax balances at each year-end related to: | 2021 | 2020 | ||||||
| Deferred tax assets: | ||||||||
| Pension and other post-retirement benefit plans | $ | $ | ||||||
| Employee benefit costs | ||||||||
| Foreign tax credit carryforward | ||||||||
| Tax loss carryforwards | ||||||||
| Leases | ||||||||
| Hedging activity | ||||||||
| Interest deduction limitation | ||||||||
| Other | ||||||||
| Gross deferred tax assets | ||||||||
| Less: valuation allowance | ( | ) | ( | ) | ||||
| Total net deferred tax assets | ||||||||
| Deferred tax liability: | ||||||||
| Depreciation and amortization | ( | ) | ( | ) | ||||
| Pension and other post-retirement benefit plans | ( | ) | ( | ) | ||||
| Leases | ( | ) | ( | ) | ||||
| Total deferred tax liability | ( | ) | ( | ) | ||||
| Net deferred tax liability | $ | ( | ) | $ | ( | ) | ||
The difference between the change in the deferred tax assets in the balance sheet and the deferred tax provision is primarily due to the defined benefit pension plan adjustment and floating-to-fixed hedges recorded in accumulated other comprehensive income (loss).
Valuation allowances primarily relate to foreign net operating loss carryforwards and branch foreign tax credit carryforwards where the future potential benefits do not meet the more-likely-than-not realization test. The decrease in the valuation allowance is primarily related to a decrease in foreign net operating losses for which the Company does not expect to receive a full tax benefit.
Deferred tax assets and liabilities are measured using the currently enacted tax rates that apply to taxable income in effect for the years in which those deferred tax assets and liabilities are expected to be realized or settled. We record a valuation allowance to reduce deferred tax assets to the amount that is believed more-likely-than-not to be realized. We believe it is more-likely-than-not that reversal of deferred tax liabilities and forecasted income will be sufficient to fully recover the net deferred tax assets not already offset by a valuation allowance. In the event that all or part of the gross deferred tax assets are determined not to be realizable in the future, an adjustment to the valuation allowance would be charged to earnings in the period such determination is made.
U.S. income taxes have not been provided on approximately $
While non-U.S. operations have been profitable overall, there are cumulative tax losses of $
The U.S. has a branch foreign tax credit carryforward of $
The table below sets forth the changes to our gross unrecognized tax benefit as a result of uncertain tax positions, excluding accrued interest. We do not anticipate that the total unrecognized tax benefits will change significantly within the next twelve months.
| 2021 |
2020 |
|||||||
| Balance at beginning of year |
$ | $ | ||||||
| Tax positions related to the current year: |
||||||||
| Additions |
||||||||
| Tax positions related to prior years: |
||||||||
| Additions |
||||||||
| Reductions |
( |
) | ( |
) | ||||
| Settlements |
( |
) | ( |
) | ||||
| Lapses in applicable statutes of limitation |
( |
) | ( |
) | ||||
| Balance at end of year |
$ | $ | ||||||
Included in the balance of unrecognized tax benefits as of November 27, 2021 and November 28, 2020 are potential benefits of $
We report accrued interest and penalties related to unrecognized tax benefits in income tax expense. For the year ended November 27, 2021, we recognized a net benefit for interest and penalties of $
We are subject to U.S. federal income tax as well as income tax in numerous state and foreign jurisdictions. We are no longer subject to U.S. federal tax examination for years prior to or Swiss income tax examination for years prior to During the second quarter of 2016, H.B. Fuller (China) Adhesives, Ltd. was notified of a transfer pricing audit covering the calendar years through 2014. We are in various stages of examination and appeal in other foreign jurisdictions. Although the final outcomes of these examinations cannot currently be determined, we believe that we have recorded adequate liabilities with respect to these examinations.
Note 12: Financial Instruments
Overview
As a result of being a global enterprise, our earnings, cash flows and financial position are exposed to foreign currency risk from foreign currency denominated receivables and payables.
We use foreign currency forward contracts, cross-currency swaps and interest rate swaps to manage risks associated with foreign currency exchange rates and interest rates. We do not hold derivative financial instruments of a speculative nature or for trading purposes. We record derivatives as assets and liabilities on the balance sheet at fair value. Changes in fair value are recognized immediately in earnings unless the derivative qualifies and is designated as a hedge. Cash flows from derivatives are classified in the Consolidated Statement of Cash Flows in the same category as the cash flows from the items subject to designated hedge or undesignated (economic) hedge relationships. The company evaluates hedge effectiveness at inception and on an ongoing basis. If a derivative is no longer expected to be effective, hedge accounting is discontinued. Hedge ineffectiveness, if any, is recorded in earnings.
We are exposed to credit risk in the event of nonperformance of counterparties for foreign currency forward exchange contracts and interest rate swap agreements. We select investment-grade multinational banks and financial institutions as counterparties for derivative transactions and monitor the credit quality of each of these banks on a periodic basis as warranted. We do not anticipate nonperformance by any of these counterparties, and valuation allowances, if any, are de minimis.
Cash Flow Hedges
As of November 27, 2021, we had cash flow hedges of cross-currency swap agreements effective October 20, 2017 to convert a notional amount of $
The following table summarizes the cross-currency swaps outstanding as of November 27, 2021:
| Fiscal Year of | |||||||||||||
| Expiration | Interest Rate | Notional Value | Fair Value | ||||||||||
| Pay EUR | | % | $ | $ | |||||||||
| Receive USD | % | ||||||||||||
On February 27, 2018, we entered into an interest rate swap agreement to convert $
On April 23, 2018, we amended our Term Loan B Credit Agreement to reduce the interest rate from LIBOR plus
The amounts of pretax gains (losses) recognized in comprehensive income related to derivative instruments designated as cash flow hedges are as follows:
| November 27, 2021 |
November 28, 2020 |
November 30, 2019 |
||||||||||
| Cross-currency swap contracts |
$ | ( |
) | $ | $ | |||||||
| Interest rate swap contracts |
$ | $ | ( |
) | $ | ( |
) | |||||
Fair Value Hedges
On February 12, 2021, we entered into interest rate swap agreements to convert our $
Derivatives Not Designated As Hedging Instruments
The company uses foreign currency forward contracts to offset its exposure to the change in value of certain foreign currency denominated assets and liabilities held at foreign subsidiaries that are remeasured at the end of each period. Although the contracts are effective economic hedges, they are not designated as accounting hedges. Foreign currency forward contracts are recorded as assets and liabilities on the balance sheet at fair value. Changes in the value of these derivatives are recognized immediately in earnings, thereby offsetting the current earnings effect of the related foreign currency denominated assets and liabilities. See Note 13 for fair value amounts of these derivative instruments.
As of November 27, 2021, we had forward foreign currency contracts maturing between November 29, 2021 and September 13, 2022. The mark-to-market effect associated with these contracts was largely offset by the underlying transaction gains and losses resulting from the foreign currency exposures for which these contracts relate.
The amounts of pretax gains (losses) recognized in other income, net related to derivative instruments not designated as hedging instruments are as follows:
| November 27, 2021 |
November 28, 2020 |
November 30, 2019 |
||||||||||
| Foreign currency forward contracts |
$ | ( |
) | $ | ( |
) | $ | ( |
) | |||
Concentrations of credit risk with respect to trade accounts receivable are limited due to the large number of entities in the customer base and their dispersion across many different industries and countries. As of November 27, 2021, there were no significant concentrations of credit risk.
Note 13: Fair Value Measurements
Overview
Estimates of fair value for financial assets and liabilities are based on the framework established in the accounting guidance for fair value measurements. The framework defines fair value, provides guidance for measuring fair value and requires certain disclosures. The framework discusses valuation techniques, such as the market approach (comparable market prices), the income approach (present value of future income or cash flow) and the cost approach (cost to replace the service capacity of an asset or replacement cost). The framework utilizes a fair value hierarchy that prioritizes the inputs to valuation techniques used to measure fair value into three broad levels. The following is a brief description of those three levels:
| ● |
Level 1: Observable inputs such as quoted prices (unadjusted) in active markets for identical assets or liabilities. |
| ● |
Level 2: Inputs other than quoted prices that are observable for the asset or liability, either directly or indirectly. These include quoted prices for similar assets or liabilities in active markets and quoted prices for identical or similar assets or liabilities in markets that are not active. |
| ● |
Level 3: Unobservable inputs that reflect management’s assumptions, and include situations where there is little, if any, market activity for the asset or liability. |
Balances Measured at Fair Value on a Recurring Basis
The following table presents information about our financial assets and liabilities that are measured at fair value on a recurring basis as of November 27, 2021 and November 28, 2020, and indicates the fair value hierarchy of the valuation techniques utilized to determine such fair value.
| Fair Value Measurements |
||||||||||||||||
| Using: |
||||||||||||||||
| November 27, |
||||||||||||||||
| Description |
2021 |
Level 1 |
Level 2 |
Level 3 |
||||||||||||
| Assets: |
||||||||||||||||
| Marketable securities |
$ | $ | $ | $ | ||||||||||||
| Foreign exchange contract assets |
||||||||||||||||
| Cross-currency cash flow hedge assets |
||||||||||||||||
| Liabilities: |
||||||||||||||||
| Foreign exchange contract liabilities |
$ | $ | $ | $ | ||||||||||||
| Interest rate swaps, cash flow hedge liabilities |
||||||||||||||||
| Interest rate swaps, fair value hedge liabilities |
||||||||||||||||
| Contingent consideration liability |
||||||||||||||||
| Fair Value Measurements |
||||||||||||||||
| Using: |
||||||||||||||||
| November 28, |
||||||||||||||||
| Description |
2020 |
Level 1 |
Level 2 |
Level 3 |
||||||||||||
| Assets: |
||||||||||||||||
| Marketable securities |
$ | $ | $ | $ | ||||||||||||
| Foreign exchange contract assets |
||||||||||||||||
| Cross-currency cash flow hedge assets |
||||||||||||||||
| Liabilities: |
||||||||||||||||
| Foreign exchange contract liabilities |
$ | $ | $ | $ | ||||||||||||
| Cross-currency cash flow hedge liabilities |
||||||||||||||||
| Interest rate swaps, cash flow hedge liabilities |
||||||||||||||||
| Contingent consideration liability |
||||||||||||||||
See Note 7 for discussion regarding the fair value of debt.
We use the income approach in calculating the fair value of our contingent consideration liability using a real option model with Level 3 inputs. The expected cash flows are affected by various significant judgments and assumptions, including revenue growth rates, volatility and discount rate, which are sensitive to change. Estimates of fair value are inherently uncertain and represent only management’s reasonable expectation regarding future developments. These estimates and the judgments and assumptions upon which the estimates are based will, in all likelihood, differ in some respects from actual future results. The valuation of our contingent consideration liability related to the acquisition of D.H.M. resulted in a fair value of $
| Contingent consideration liability |
2021 |
|||
| Level 3 balance at beginning of year |
$ | |||
| Acquisition |
||||
| Payment of contingent consideration |
( |
) | ||
| Mark to market adjustment |
||||
| Level 3 balance at end of year |
$ | |||
Note 14: Commitments and Contingencies
Environmental Matters
From time to time, we become aware of compliance matters relating to, or receive notices from, federal, state or local entities regarding possible or alleged violations of environmental, health or safety laws and regulations. We review the circumstances of each individual site, considering the number of parties involved, the level of potential liability or our contribution relative to the other parties, the nature and magnitude of the hazardous substances involved, the method and extent of remediation, the estimated legal and consulting expense with respect to each site and the time period over which any costs would likely be incurred. Also, from time to time, we are identified as a potentially responsible party (“PRP”) under the Comprehensive Environmental Response, Compensation and Liability Act ("CERCLA") and/or similar state laws that impose liability for costs relating to the clean up of contamination resulting from past spills, disposal or other release of hazardous substances. We are also subject to similar laws in some of the countries where current and former facilities are located. Our environmental, health and safety department monitors compliance with applicable laws on a global basis. To the extent we can reasonably estimate the amount of our probable liabilities for environmental matters, we establish an undiscounted financial provision. We recorded liabilities of $
Currently we are involved in various environmental investigations, clean up activities and administrative proceedings and lawsuits. In particular, we are currently deemed a PRP in conjunction with numerous other parties, in a number of government enforcement actions associated with landfills and/or hazardous waste sites. As a PRP, we may be required to pay a share of the costs of investigation and clean up of these sites. In addition, we are engaged in environmental remediation and monitoring efforts at a number of current and former operating facilities. While uncertainties exist with respect to the amounts and timing of the ultimate environmental liabilities, based on currently available information, we have concluded that these matters, individually or in the aggregate, will not have a material adverse effect on our results of operations, financial condition or cash flow.
Other Legal Proceedings
From time to time and in the ordinary course of business, we are a party to, or a target of, lawsuits, claims, investigations and proceedings, including product liability, personal injury, contract, patent and intellectual property, environmental, health and safety, tax and employment matters. While we are unable to predict the outcome of these matters, we have concluded, based upon currently available information, that the ultimate resolution of any pending matter, individually or in the aggregate, including the asbestos litigation described in the following paragraphs, will not have a material adverse effect on our results of operations, financial condition or cash flow.
We have been named as a defendant in lawsuits in which plaintiffs have alleged injury due to products containing asbestos manufactured more than 35 years ago. The plaintiffs generally bring these lawsuits against multiple defendants and seek damages (both actual and punitive) in very large amounts. In many cases, plaintiffs are unable to demonstrate that they have suffered any compensable injuries or that the injuries suffered were the result of exposure to products manufactured by us. We are typically dismissed as a defendant in such cases without payment. If the plaintiff presents evidence indicating that compensable injury occurred as a result of exposure to our products, the case is generally settled for an amount that reflects the seriousness of the injury, the length, intensity and character of exposure to products containing asbestos, the number and solvency of other defendants in the case, and the jurisdiction in which the case has been brought.
A significant portion of the defense costs and settlements in asbestos-related litigation is paid by third parties, including indemnification pursuant to the provisions of a 1976 agreement under which we acquired a business from a third party. Currently, this third party is defending and paying settlement amounts, under a reservation of rights, in most of the asbestos cases tendered to the third party.
In addition to the indemnification arrangements with third parties, we have insurance policies that generally provide coverage for asbestos liabilities, including defense costs. Historically, insurers have paid a significant portion of our defense costs and settlements in asbestos-related litigation. However, certain of our insurers are insolvent. We have entered into cost-sharing agreements with our insurers that provide for the allocation of defense costs and settlements and judgments in asbestos-related lawsuits. These agreements require, among other things, that we fund a share of settlements and judgments allocable to years in which the responsible insurer is insolvent.
A summary of the number of and settlement amounts for asbestos-related lawsuits and claims is as follows:
| Year Ended |
Year Ended |
Year Ended |
||||||||||
| November 27, |
November 28, |
November 30, |
||||||||||
| 2021 |
2020 |
2019 |
||||||||||
| Lawsuits and claims settled |
||||||||||||
| Settlement amounts |
$ | $ | $ | |||||||||
| Insurance payments received or expected to be received |
$ | $ | $ | |||||||||
We do not believe that it would be meaningful to disclose the aggregate number of asbestos-related lawsuits filed against us because relatively few of these lawsuits are known to involve exposure to asbestos-containing products that we manufactured. Rather, we believe it is more meaningful to disclose the number of lawsuits that are settled and result in a payment to the plaintiff. To the extent we can reasonably estimate the amount of our probable liabilities for pending asbestos-related claims, we establish a financial provision and a corresponding receivable for insurance recoveries.
Based on currently available information, we have concluded that the resolution of any pending matter, including asbestos-related litigation, individually or in the aggregate, will not have a material adverse effect on our results of operations, financial condition or cash flow.
Note 15: Segments
We are required to report segment information in the same way that we internally organize our business for assessing performance and making decisions regarding allocation of resources. Revenue and operating income of each of our segments are regularly reviewed by our chief operating decision maker to make decisions about resources to be allocated to the segments and assess their performance. Segment operating income is identified as gross profit less SG&A expenses. Corporate expenses, other than those included in Corporate Unallocated, are allocated to each operating segment. Consistent with our internal management reporting, Corporate Unallocated amounts include business acquisition and integration costs, organizational restructuring charges and project costs associated with our implementation of Project ONE. Corporate assets are not allocated to the operating segments. Inter-segment revenues are recorded at cost plus a markup for administrative costs.
We have reportable segments: Hygiene, Health and Consumable Adhesives, Engineering Adhesives and Construction Adhesives. The business components within each operating segment are managed to maximize the results of the overall operating segment rather than the results of any individual business component of the operating segment. Results of individual components of each operating segment are subject to numerous allocations of segment-wide costs that may or may not have been focused on that particular component for a particular reporting period. The costs for these allocated resources are not tracked on a “where-used” basis as financial performance is assessed at the total operating segment level.
Reportable operating segment financial information for all periods presented is as follows:
| 2021 |
2020 |
2019 |
||||||||||
| Net revenue |
||||||||||||
| Hygiene, Health and Consumable Adhesives |
$ | $ | $ | |||||||||
| Engineering Adhesives |
||||||||||||
| Construction Adhesives |
||||||||||||
| Corporate Unallocated1 |
||||||||||||
| Total |
$ | $ | $ | |||||||||
| Segment operating income |
||||||||||||
| Hygiene, Health and Consumable Adhesives |
$ | $ | $ | |||||||||
| Engineering Adhesives |
||||||||||||
| Construction Adhesives |
||||||||||||
| Total segment |
||||||||||||
| Corporate Unallocated1 |
( |
) | ( |
) | ( |
) | ||||||
| Total |
$ | $ | $ | |||||||||
| Depreciation and amortization |
||||||||||||
| Hygiene, Health and Consumable Adhesives |
$ | $ | $ | |||||||||
| Engineering Adhesives |
||||||||||||
| Construction Adhesives |
||||||||||||
| Corporate Unallocated1 |
||||||||||||
| Total |
$ | $ | $ | |||||||||
| Total assets2 |
||||||||||||
| Hygiene, Health and Consumable Adhesives |
$ | $ | ||||||||||
| Engineering Adhesives |
||||||||||||
| Construction Adhesives |
||||||||||||
| Corporate |
||||||||||||
| Total |
$ | $ | ||||||||||
| Capital expenditures |
||||||||||||
| Hygiene, Health and Consumable Adhesives |
$ | $ | ||||||||||
| Engineering Adhesives |
||||||||||||
| Construction Adhesives |
||||||||||||
| Corporate |
||||||||||||
| Total |
$ | $ | ||||||||||
1 Consistent with our internal management reporting, Corporate Unallocated amounts in the tables above include charges that are not allocated to the Company’s reportable segments.
2 Segment assets include primarily inventory, accounts receivable, property, plant and equipment, goodwill, intangible assets and other miscellaneous assets. Corporate assets include primarily corporate property, plant and equipment, deferred tax assets, certain investments and other assets.
Reconciliation of segment operating income to income before income taxes and income from equity method investments:
| 2021 |
2020 |
2019 |
||||||||||
| Segment operating income |
$ | $ | $ | |||||||||
| Other income, net |
||||||||||||
| Interest expense |
( |
) | ( |
) | ( |
) | ||||||
| Interest income |
||||||||||||
| Income before income taxes and income from equity method investments |
$ | $ | $ | |||||||||
Financial information about geographic areas
| Net Revenue |
||||||||||||
| 2021 |
2020 |
2019 |
||||||||||
| United States |
$ | $ | $ | |||||||||
| China |
||||||||||||
| Germany |
||||||||||||
| Countries with more than 10 percent of total |
||||||||||||
| All other countries with less than 10 percent of total |
||||||||||||
| Total |
$ | $ | $ | |||||||||
| Property, Plant and Equipment, net |
||||||||||||
| 2021 |
2020 |
2019 |
||||||||||
| United States |
$ | $ | $ | |||||||||
| Germany |
||||||||||||
| China |
||||||||||||
| All other countries with less than 10 percent of total |
||||||||||||
| Total |
$ | $ | $ | |||||||||
We view the following disaggregation of net revenue by geographic region as useful to understanding the composition of revenue recognized during the respective reporting periods:
| November 27, 2021 |
||||||||||||||||||||
| Hygiene, Health and |
Engineering |
Construction |
Corporate |
|||||||||||||||||
| Consumable Adhesives |
Adhesives |
Adhesives |
Unallocated |
Total |
||||||||||||||||
| Americas |
$ | $ | $ | $ | $ | |||||||||||||||
| EIMEA |
||||||||||||||||||||
| Asia Pacific |
||||||||||||||||||||
| $ | $ | $ | $ | $ | ||||||||||||||||
| November 28, 2020 |
||||||||||||||||||||
| Hygiene, Health and |
Engineering |
Construction |
Corporate |
|||||||||||||||||
| Consumable Adhesives |
Adhesives |
Adhesives |
Unallocated |
Total |
||||||||||||||||
| Americas |
$ | $ | $ | $ | $ | |||||||||||||||
| EIMEA |
||||||||||||||||||||
| Asia Pacific |
||||||||||||||||||||
| $ | $ | $ | $ | $ | ||||||||||||||||
| November 30, 2019 |
||||||||||||||||||||
| Hygiene, Health and |
Engineering |
Construction |
Corporate |
|||||||||||||||||
| Consumable Adhesives |
Adhesives |
Adhesives |
Unallocated |
Total |
||||||||||||||||
| Americas |
$ | $ | $ | $ | $ | |||||||||||||||
| EIMEA |
||||||||||||||||||||
| Asia Pacific |
||||||||||||||||||||
| $ | $ | $ | $ | $ | ||||||||||||||||
Note 16: Subsequent Events
Acquisitions
On January 11, 2022, we completed the acquisition of Fourny NV for a base purchase price of approximately $
On November 30, 2021, we completed the acquisition of certain assets of Tissue Seal, LLC for a base purchase price of $
Item 9. Changes in and Disagreements with Accountants on Accounting and Financial Disclosure
Not applicable.
Item 9A. Controls and Procedures
Disclosure Controls and Procedures
As of the end of the period covered by this report, management conducted an evaluation, under the supervision and with the participation of our President and Chief Executive Officer and Executive Vice President, Chief Financial Officer, of our disclosure controls and procedures (as defined in Rules 13a-15(e) and 15d-15(e) under the Securities Exchange Act of 1934 (“Exchange Act”)). Based on its evaluation, our management concluded that, as of November 27, 2021, our disclosure controls and procedures were effective (1) to ensure that information required to be disclosed by us in reports that we file or submit under the Exchange Act is recorded, processed, summarized and reported, within the time periods specified in the SEC’s rules and forms and (2) to ensure that information require to be disclosed by us in the reports that we file or submit under the Exchange Act is accumulated and communicated to us, including our principal executive and principal financial officers, as appropriate to allow timely decisions regarding required disclosure.
Management's Report on Internal Control over Financial Reporting
Our management is responsible for establishing and maintaining adequate internal control over financial reporting. Our internal control over financial reporting is a process designed to provide reasonable assurance regarding the reliability of financial reporting and the preparation of financial statements for external purposes in accordance with accounting principles generally accepted in the United States. Because of its inherent limitations, internal control over financial reporting may not prevent or detect misstatements. Therefore, even those systems determined to be effective can provide only reasonable assurance of achieving their control objectives.
Our management assessed the effectiveness of our internal control over financial reporting as of November 27, 2021. In making this assessment, we used the criteria set forth by the Committee of Sponsoring Organizations of the Treadway Commission (COSO) in Internal Control – Integrated Framework (2013 Framework). Based on its assessment, management concluded that, as of November 27, 2021, the Company’s internal control over financial reporting was effective. Ernst and Young LLP, an independent registered public accounting firm, has issued an auditors’ report on our internal control over financial reporting as of November 27, 2021, which is included elsewhere in this Form 10-K.
Changes in Internal Control over Financial Reporting
There were no changes in our internal control over financial reporting (as defined in Rule 13a-15(f) under the Exchange Act) during our most recently completed fiscal quarter that have materially affected or are reasonably likely to materially affect our internal control over financial reporting.
None.
Item 9C. Disclosure Regarding Foreign Jurisdictions that Prevent Inspections.
None.
Item 10. Directors, Executive Officers and Corporate Governance
The information under the headings “Proposal 1 - Election of Directors”, “Delinquent Section 16(a) Reports” and “Corporate Governance - Audit Committee” contained in the company's Proxy Statement for the Annual Meeting of Shareholders to be held on April 7, 2022 (the “2022 Proxy Statement”) is incorporated herein by reference.
The information contained at the end of Item 1. hereof under the heading “Information About Our Executive Officers” is incorporated herein by reference.
Since the date of our 2021 Proxy Statement, there have been no material changes to the procedures by which shareholders may recommend nominees to our Board of Directors.
The company has a code of business conduct applicable to all of its directors and employees, including its principal executive officer, principal financial officer, principal accounting officer, controller and other employees performing similar functions. A copy of the code of business conduct is available under the Investor Relations section of the company’s website at www.hbfuller.com. The company intends to disclose on its website information with respect to any amendment to or waiver from a provision of its code of business conduct that applies to its principal executive officer, principal financial officer, principal accounting officer, controller and other employees performing similar functions within four business days following the date of such amendment or waiver.
Item 11. Executive Compensation
The information under the headings “Executive Compensation,” “Director Compensation” and “CEO Pay Ratio Disclosure” contained in the 2022 Proxy Statement is incorporated herein by reference.
Item 12. Security Ownership of Certain Beneficial Owners and Management and Related Stockholder Matters
The information under the heading “Security Ownership of Certain Beneficial Owners and Management” contained in the 2022 Proxy Statement is incorporated herein by reference.
Equity Compensation Plan Information
| (c) |
||||||||||||
| (a) |
(b) |
Number of |
||||||||||
| Number of |
Weighted- |
securities remaining |
||||||||||
| securities to be |
average |
available for future |
||||||||||
| issued upon |
exercise price |
issuance under |
||||||||||
| exercise of |
of outstanding |
equity compensation |
||||||||||
| outstanding |
options, |
plans (excluding |
||||||||||
| options, warrants |
warrants and |
securities reflected |
||||||||||
| Period |
and rights |
rights |
in column (a)) |
|||||||||
| Equity compensation plans approved by security holders |
5,524,757 | 1 | $ | 47.77 | 2 | 2,253,157 | 3 | |||||
| Equity compensation plans not approved by security holders |
- | N/A | - | |||||||||
| Total |
5,524,757 | $ | 47.77 | 2,253,157 | ||||||||
1 Consists of outstanding stock options to acquire 4,972,392 shares of common stock, 358,126 outstanding time-based restricted stock units and 194,239 outstanding performance-based restricted stock units granted under the Company's equity compensation plans.
2 Consists of the weighted average exercise price of stock options granted under the Company's equity compensation plans.
3 Number of shares of common stock remaining available for future issuance under the Amended and Restated H.B. Fuller Company 2020 Master Incentive Plan.
Item 13. Certain Relationships and Related Transactions and Director Independence
The information under the headings “Certain Relationships and Related Transactions” and “Corporate Governance - Director Independence” contained in the 2022 Proxy Statement is incorporated herein by reference.
Item 14. Principal Accountant Fees and Services
The information under the heading “Fees Paid to Independent Registered Public Accounting Firms” contained in the 2022 Proxy Statement is incorporated herein by reference.
Item 15. Exhibits and Financial Statement Schedules
| (a) |
Documents filed as part of this report: |
| 1. |
Consolidated Financial Statements |
|
| Consolidated Statements of Income for the fiscal years ended November 27, 2021, November 28, 2020, and November 30, 2019. | ||
| Consolidated Statements of Comprehensive Income for the fiscal years ended November 27, 2021, November 28, 2020, and November 30, 2019. | ||
| Consolidated Balance Sheets as of November 27, 2021 and November 28, 2020. | ||
| Consolidated Statements of Total Equity for the fiscal years ended November 27, 2021, November 28, 2020, and November 30, 2019. | ||
| Consolidated Statements of Cash Flows for the fiscal years ended November 27, 2021, November 28, 2020, and November 30, 2019. | ||
| Notes to Consolidated Financial Statements | ||
| Report of Independent Registered Public Accounting Firm |
| 2. |
Financial Statement Schedules |
|
| All financial statement schedules are omitted as the required information is inapplicable or the information is presented in the consolidated financial statements or related notes. |
| 3. |
Exhibits |
|
|
|
Item |
|
Incorporation by Reference |
|||
|
|
|
|
|
|
|||
| 3.1 |
|
Restated Articles of Incorporation of H.B. Fuller Company, as amended |
|
Exhibit 3.1 to the Quarterly Report on Form 10-Q for the quarter ended September 2, 2006 and Exhibit 3.1 to the Current Report on Form 8-K dated October 12, 2016. |
|||
|
|
|
|
|
|
|||
| 3.2 |
|
|
Exhibit 3.1 to the Current Report on Form 8-K dated December 2, 2015. |
||||
|
|
|
|
|
|
|||
| 4.1 |
|
Form of Certificate for common stock, par value $1.00 per share |
|
Exhibit 4.1 to the Annual Report on Form 10-K, as amended, for the year ended November 28, 2009. |
|||
|
|
|
|
|
|
|||
| 4.2 |
|
|
Exhibit 4.1 to the Current Report on Form 8-K dated February 9, 2017. |
||||
| 4.3 |
|
|
Exhibit 4.2 to the Current Report on Form 8-K dated February 9, 2017. |
||||
|
|
|
|
|
|
|||
| 4.4 |
|
|
Exhibit 4.6 to the Current Report on Form 10-K dated January 31, 2018. |
||||
| 4.5 |
|
Exhibit 4.1 to the Current Report on Form 8-K dated October 20, 2020. |
|||||
|
|
|
|
|
|
|||
| 4.6 |
|
Form of Global Note representing the 4.000% Notes due 2027 (included in Exhibit 4.3) |
|
Exhibit 4.2 to the Current Report on Form 8-K dated February 9, 2017. |
|||
| 4.7 |
|
Form of Global Note representing the 4.250% Notes due 2028 (included in Exhibit 4.5) |
|
Exhibit 4.2 to the Current Report on Form 8-K dated October 20, 2020. |
|||
|
|
|
|
|
|
|||
| 4.8 |
|
Exhibit 4.8 to the Annual Report on Form 10-K dated January 24, 2020. |
|||||
| 10.1 |
|
|
Exhibit 1.1 to the Current Report on Form 8-K dated October 31, 2014. |
||||
|
|
|
|
|
|
|||
| 10.2 |
|
|
Exhibit 10.1 to the Current Report on Form 8-K dated April 12, 2017, Exhibit 10.1 to the Current Report on Form 8-K dated September 29, 2017, and Exhibit 10.1 to the Current Report on Form 8-K dated November 17, 2017. |
||||
| 10.3 |
|
|
Exhibit 10.1 to the Current Report on Form 8-K dated October 20, 2020. |
||||
|
|
|
|
|
|
|||
| 10.4 |
|
|
Exhibit 10.2 to the Current Report on Form 8-K dated April 12, 2017. |
||||
|
|
|
|
|
|
|||
| 10.5 |
|
|
Exhibit 10.1 to the Current Report on Form 8-K dated October 20, 2017 and Exhibit 10.1 to the Current Report on Form 10-Q dated September 28, 2018. |
||||
| 10.6 |
|
|
Exhibit 10.1 to the Current Report on Form 8-K dated September 2, 2017. |
||||
|
|
|
|
|
|
|||
| *10.7 |
|
Amended and Restated H.B. Fuller Company Year 2000 Stock Incentive Plan |
|
Exhibit 10.1 to the Current Report on Form 8-K dated April 5, 2006. |
|||
| *10.8 |
|
H.B. Fuller Company Supplemental Executive Retirement Plan II – 2008, as amended |
|
Exhibit 10.2 to the Current Report on Form 8-K dated December 19, 2007, Exhibit 10.5 to the Annual Report on Form 10-K for the year ended November 29, 2008 and Exhibit 10.1 to the Quarterly Report on Form 10-Q for the quarter ended May 28, 2011. |
|||
|
|
|
|
|
|
|||
| *10.9 | Third Declaration of Amendment of the H.B. Fuller Company Supplemental Executive Retirement Plan II - 2008 | ||||||
| *10.10 |
|
|
Exhibit 10(k) to the Annual Report on Form 10-K for the year ended November 29, 1997, Exhibit 10(k) to the Annual Report on Form 10-K405 for the year ended November 28, 1998, Exhibit 10.3 to the Current Report on Form 8-K dated December 19, 2007 and Exhibit 10.1 to the Quarterly Report on Form 10-Q for the quarter ended May 30, 2009. |
||||
| *10.11 |
|
H.B.Fuller Company Key Employee Deferred Compensation Plan (2021 Restatement)
|
|
|
|||
|
|
|
|
|||||
| *10.12 |
|
Form of Change in Control Agreement between H.B. Fuller Company and each of its executive officers |
Exhibit 10.11 to the Annual Report on Form 10-K for the year ended November 29, 2008. |
||||
| *10.13 |
|
|
Exhibit 10.9 to the Current Report on Form 8-K dated January 24, 2019. |
||||
|
|
|
|
|
|
|||
| *10.14 |
|
Form of Severance Agreement between H.B. Fuller Company and each of its executive officers |
|
Exhibit 10.2 to the Quarterly Report on Form 10-Q for the quarter ended May 31, 2008. |
|||
|
|
|||||||
| *10.15 |
|
|
Exhibit 10.1 to the Current Report on Form 8-K dated January 20, 2011. |
||||
|
|
|
|
|
|
|||
| *10.16 |
|
|
Exhibit 10.1 to the Current Report on Form 8-K dated January 26, 2012 |
||||
|
|
|
|
|
|
|||
| *10.17 |
|
|
Exhibit 10.1 to the Current Report on Form 8-K dated January 24, 2013. |
||||
|
|
|
|
|
|
|||
| *10.18 |
|
Exhibit 10.2 to the Current Report on Form 8-K dated January 23, 2014. |
|||||
|
|
|
|
|
|
|||
| *10.19 |
|
|
Exhibit 10.1 to the Current Report on Form 8-K dated April 6, 2016. |
||||
| *10.20 |
|
|
Exhibit 10.2 to the Current Report on Form 8-K dated October 20, 2017. |
||||
|
|
|
|
|
|
|||
| *10.21 |
|
Exhibit 10.1 to the Current Report on Form 8-K dated April 18, 2018. |
|||||
| *10.22 |
|
Exhibit 10.2 to the Current Report on Form 8-K dated April 18, 2018. |
|||||
|
|
|||||||
| *10.23 |
|
Exhibit 10.3 to the Current Report on Form 8-K dated April 18, 2018. |
|||||
|
|
|||||||
| *10.24 |
|
|
Exhibit 10.4 to the Current Report on Form 8-K dated April 18, 2018. |
||||
| *10.25 |
|
Exhibit 10.5 to the Current Report on Form 8-K dated April 18, 2018. |
|||||
|
|
|||||||
| *10.26 |
|
Exhibit 10.1 to the Current Report on Form 8-K dated January 24, 2019. |
|||||
|
|
|||||||
| *10.27 |
|
Exhibit 10.2 to the Current Report on Form 8-K dated January 24, 2019. |
|||||
|
|
|||||||
| *10.28 |
|
Exhibit 10.3 to the Current Report on Form 8-K dated January 24, 2019. |
|||||
|
|
|||||||
| *10.29 |
|
Exhibit 10.4 to the Current Report on Form 8-K dated January 24, 2019. |
|||||
|
|
|||||||
| *10.30 |
|
Exhibit 10.5 to the Current Report on Form 8-K dated January 24, 2019. |
|||||
| *10.31 |
|
Exhibit 10.6 to the Current Report on Form 8-K dated January 24, 2019. |
|||||
|
|
|||||||
| *10.32 |
|
|
Exhibit 10.1 to the Current Report on Form 8-K dated April 2, 2020. |
||||
| *10.33 |
|
|
Exhibit 10.2 to the Current Report on Form 8-K dated April 2, 2020. |
||||
| *10.34 |
|
|
Exhibit 10.3 to the Current Report on Form 8-K dated April 2, 2020. |
||||
| *10.35 |
|
|
Exhibit 10.4 to the Current Report on Form 8-K dated April 2, 2020. |
||||
| *10.36 |
|
|
Exhibit 10.5 to the Current Report on Form 8-K dated April 2, 2020. |
||||
| *10.37 | Form of Restricted Stock Unit (CEO) Award Agreement under the H.B. Fuller Company 2020 Master Incentive Plan | Exhibit 10.1 to the Current Report on Form 8-K dated January 27, 2021. | |||||
| *10.38 | Form of Performance-Based Non-Qualified Stock Option (CEO, TSR) Award Agreement under the H.B. Fuller Company 2020 Master Incentive Plan | Exhibit 10.2 to the Current Report on Form 8-K dated January 27, 2021. | |||||
| *10.39 |
|
|
Exhibit 10.4 to the Current Report on Form 8-K dated December 19, 2007 and Exhibit 10.1 to the Quarterly Report on Form 10-Q for the quarter ended May 31, 2008. Exhibit 10.1 to the Quarterly Report on Form 10-Q for the quarter ended March 2, 2019, Exhibit 10.1 to the Quarterly Report on Form 10-Q for the quarter ended June 1, 2019, and Exhibit 10.43 to the Annual Report on Form 10-K for the year ended November 28, 2020. |
||||
| *10.40 |
|
||||||
|
|
|
|
|
|
|||
| *10.41 |
|
|
Exhibit 10.22 to the Annual Report on Form 10-K for the year ended November 29, 2008 and Exhibit 10.23 to the Annual Report on Form 10-K for the year ended November 29, 2008. |
||||
|
|
|
|
|
|
|||
| *10.42 |
|
|
Exhibit 10.2 to the Quarterly Report on Form 10-Q for the quarter ended May 30, 2009. |
||||
| *10.43 |
H.B. Fuller Company Management Short-Term Incentive Plan for Executive Officers |
Exhibit 10.7 to the Current Report on Form 8-K dated January 24, 2019. |
||
| *10.44 |
H.B. Fuller Company Management Short-Term Incentive Plan for Executive Officers |
Exhibit 10.1 to the Current Report on Form 8-K dated January 15, 2020. |
||
|
|
|
|
||
| *10.45 |
Exhibit 10.8 to the Current Report on Form 8-K dated January 24, 2019. |
|||
|
|
|
|
||
| *10.46 |
Amended and Restated H.B. Fuller Company Annual and Long-Term Incentive Plan |
Exhibit 10.1 to the Current Report on Form 8-K dated April 3, 2008 |
||
|
|
|
|
||
| *10.47 |
Annex B to the H.B. Fuller Company Proxy Statement on Schedule 14A filed with the Securities and Exchange Commission on February 27, 2013. |
|||
|
|
|
|
||
| *10.48 |
Annex B to the H.B. Fuller Company Proxy Statement on Schedule 14A filed with the Securities and Exchange Commission on February 24, 2016. |
|||
| *10.49 |
Annex B to the H.B. Fuller Company Proxy Statement on Schedule 14A filed with the Securities and Exchange Commission on February 28, 2018. |
|||
| *10.50 |
Amended and Restated H.B. Fuller Company 2020 Master Incentive Plan |
Annex B to the H.B. Fuller Company Proxy Statement on Schedule 14A filed with the Securities and Exchange Commission on February 24, 2021. |
||
| 21 |
|
|||
| 23.1 |
|
|||
| 23.2 | Consent of KPMG LLP | |||
|
|
|
|
||
| 24 |
|
|||
|
|
|
|
||
| 31.1 |
|
|||
|
|
|
|
||
| 31.2 |
|
|||
|
|
|
|
||
| 32.1 |
|
|||
|
|
|
|
||
| 32.2 |
|
|||
|
|
|
|
||
| 101 |
The following materials from the H.B. Fuller Company Annual Report on Form 10-K for the fiscal year ended November 27, 2021 formatted in Inline Extensible Business Reporting Language (Inline XBRL): (i) the Consolidated Statements of Income, (ii) the Consolidated Statements of Comprehensive Income, (iii) the Consolidated Balance Sheets, (iv) the Consolidated Statements of Total Equity, (v) the Consolidated Statements of Cash Flows and (vi) the Notes to Consolidated Financial Statements. |
|
||
| 104 |
Cover Page Interactive Data File (formatted in Inline XBRL and contained in Exhibit 101) |
|
||
| * Asterisked items are management contracts or compensatory plans or arrangements required to be filed. | ||||
| (b) |
See Exhibit Index and Exhibits attached to this Form 10-K. |
None
Pursuant to the requirements of Section 13 or 15(d) of the Securities Exchange Act of 1934, the registrant has duly caused this report to be signed on its behalf by the undersigned, thereunto duly authorized.
|
|
H.B. FULLER COMPANY |
|
|
|
|
|
|
|
|
|
By: |
/s/ James J. Owens |
|
| Dated: January 25, 2022 |
|
JAMES J. OWENS |
|
|
|
|
President and Chief Executive Officer |
|
Pursuant to the requirements of the Securities Exchange Act of 1934, this report has been signed below by the following persons on behalf of the registrant and in the capacities and on the dates indicated:
| Signature |
Title |
||||
|
/s/ James J. Owens |
President and Chief Executive Officer and Director |
||||
| JAMES J. OWENS |
(Principal Executive Officer) |
||||
|
/s/ John J. Corkrean |
Executive Vice President, Chief Financial Officer |
||||
| JOHN J. CORKREAN | (Principal Financial Officer) | ||||
| /s/ Robert J. Martsching | Vice President, Controller | ||||
| ROBERT J. MARTSCHING | (Principal Accounting Officer) | ||||
|
|
|
||||
| * | Director | ||||
| DANIEL L. FLORNESS | |||||
| * | Director | ||||
| THOMAS W. HANDLEY | |||||
| * | Director | ||||
| MICHAEL J. HAPPE | |||||
| * | Director | ||||
| RUTH S. KIMMELSHUE | |||||
| * | Director | ||||
| LEE R. MITAU | |||||
| * | Director | ||||
| DANTE C. PARRINI | |||||
| * | Director | ||||
| TERESA J. RASMUSSEN | |||||
| * | Director | ||||
| JOHN C. VAN RODEN, JR. | |||||
| * by /s/ Timothy J. Keenan | Director | ||||
| TIMOTHY J. KEENAN, Attorney in Fact | |||||
| Dated: January 25, 2022 |