UNITED STATES
SECURITIES AND EXCHANGE COMMISSION
Washington, D.C. 20549
FORM N-CSR
CERTIFIED SHAREHOLDER REPORT
OF
REGISTERED MANAGEMENT INVESTMENT COMPANIES
Investment Company Act file number: 811-02652
| Name of Registrant: | Vanguard Index Funds |
| Address of Registrant: | P.O. Box 2600 |
| Valley Forge, PA 19482 |
| Name and address of agent for service: | Anne E. Robinson, Esquire |
| P.O. Box 876 | |
| Valley Forge, PA 19482 |
Registrant’s telephone number, including area code: (610) 669-1000
Date of fiscal year end: December 31
Date of reporting period: January 1, 2023—December 31, 2023
Item 1: Reports to Shareholders

Your Fund’s Performance at a Glance | 1 |
About Your Fund’s Expenses | 2 |
Performance Summary | 4 |
Financial Statements | 7 |
| • | The financial markets delivered very robust returns for the 12 months ended December 31, 2023. Returns for Vanguard 500 Index Fund ranged from 26.11% for Investor Shares to 26.28% for Institutional Select Shares. It closely tracked its target index, the Standard & Poor’s 500 Index. The fund provides exposure to the stocks of the largest U.S. companies. |
| • | With inflation continuing to ease, a number of major central banks left off hiking interest rates. Global growth, employment, and consumer spending showed resilience, but the prospect of rates remaining high for an extended period spurred volatility at times. Toward year-end, however, global stocks and bonds rallied as falling inflation and softening economic growth raised market expectations for rate cuts in 2024. |
| • | All but two of the 11 industry sectors recorded positive returns for the 12 months. Information technology, communication services, and consumer discretionary all posted very strong results. |
| • | For the 10 years ended December 31, the fund posted average annual returns of 11.88% for Investor Shares and 11.99% for both ETF Shares (based on net asset value) and Admiral Shares. Institutional Select Shares recorded an annualized return of 14.02% since their 2016 inception. |
| Average Annual Total Returns Periods Ended December 31, 2023 | |||
| One Year | Three Years | Five Years | |
| Stocks | |||
| Russell 1000 Index (Large-caps) | 26.53% | 8.97% | 15.52% |
| Russell 2000 Index (Small-caps) | 16.93 | 2.22 | 9.97 |
| Russell 3000 Index (Broad U.S. market) | 25.96 | 8.54 | 15.16 |
| FTSE All-World ex US Index (International) | 15.82 | 1.98 | 7.52 |
| Bonds | |||
| Bloomberg U.S. Aggregate Float Adjusted Index (Broad taxable market) | 5.60% | -3.33% | 1.17% |
| Bloomberg Municipal Bond Index (Broad tax-exempt market) | 6.40 | -0.40 | 2.25 |
| FTSE Three-Month U.S. Treasury Bill Index | 5.26 | 2.24 | 1.91 |
| CPI | |||
| Consumer Price Index | 3.35% | 5.60% | 4.07% |
| • | Based on actual fund return. This section helps you to estimate the actual expenses that you paid over the period. The ”Ending Account Value“ shown is derived from the fund‘s actual return, and the third column shows the dollar amount that would have been paid by an investor who started with $1,000 in the fund. You may use the information here, together with the amount you invested, to estimate the expenses that you paid over the period. |
| • | Based on hypothetical 5% yearly return. This section is intended to help you compare your fund‘s costs with those of other mutual funds. It assumes that the fund had a yearly return of 5% before expenses, but that the expense ratio is unchanged. In this case—because the return used is not the fund’s actual return—the results do not apply to your investment. The example is useful in making comparisons because the Securities and Exchange Commission requires all mutual funds to calculate expenses based on a 5% return. You can assess your fund’s costs by comparing this hypothetical example with the hypothetical examples that appear in shareholder reports of other funds. |
| Six Months Ended December 31, 2023 | |||
| Beginning Account Value 6/30/2023 | Ending Account Value 12/31/2023 | Expenses Paid During Period | |
| Based on Actual Fund Return | |||
| 500 Index Fund | |||
| Investor Shares | $1,000.00 | $1,079.60 | $0.73 |
| ETF Shares | 1,000.00 | 1,080.30 | 0.16 |
| Admiral™ Shares | 1,000.00 | 1,080.20 | 0.21 |
| Institutional Select Shares | 1,000.00 | 1,080.30 | 0.05 |
| Based on Hypothetical 5% Yearly Return | |||
| 500 Index Fund | |||
| Investor Shares | $1,000.00 | $1,024.50 | $0.71 |
| ETF Shares | 1,000.00 | 1,025.05 | 0.15 |
| Admiral Shares | 1,000.00 | 1,025.00 | 0.20 |
| Institutional Select Shares | 1,000.00 | 1,025.16 | 0.05 |
| Average Annual Total Returns Periods Ended December 31, 2023 | |||||
| One Year | Five Years | Ten Years | Final Value of a $10,000 Investment | ||

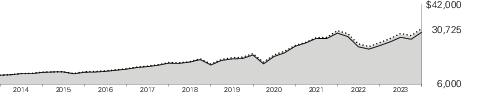
| 500 Index Fund Investor Shares | 26.11% | 15.53% | 11.88% | $30,725 |

| S&P 500 Index | 26.29 | 15.69 | 12.03 | 31,149 |

| Dow Jones U.S. Total Stock Market Float Adjusted Index | 26.06 | 15.05 | 11.40 | 29,422 |
| One Year | Five Years | Ten Years | Final Value of a $10,000 Investment | ||
| 500 Index Fund ETF Shares Net Asset Value | 26.25% | 15.65% | 11.99% | $31,037 | |
| 500 Index Fund ETF Shares Market Price | 26.33 | 15.66 | 12.00 | 31,054 | |
| S&P 500 Index | 26.29 | 15.69 | 12.03 | 31,149 | |
| Dow Jones U.S. Total Stock Market Float Adjusted Index | 26.06 | 15.05 | 11.40 | 29,422 | |
| Average Annual Total Returns Periods Ended December 31, 2023 | |||||
| One Year | Five Years | Ten Years | Final Value of a $10,000 Investment | ||
| 500 Index Fund Admiral Shares | 26.24% | 15.65% | 11.99% | $31,043 | |
| S&P 500 Index | 26.29 | 15.69 | 12.03 | 31,149 | |
| Dow Jones U.S. Total Stock Market Float Adjusted Index | 26.06 | 15.05 | 11.40 | 29,422 | |
| One Year | Five Years | Since Inception (6/24/2016) | Final Value of a $5,000,000,000 Investment | ||
| 500 Index Fund Institutional Select Shares | 26.28% | 15.68% | 14.02% | $13,406,371,500 | |
| S&P 500 Index | 26.29 | 15.69 | 14.02 | 13,410,327,500 | |
| Dow Jones U.S. Total Stock Market Float Adjusted Index | 26.06 | 15.05 | 13.49 | 12,946,697,500 | |
| One Year | Five Years | Ten Years | |
| 500 Index Fund ETF Shares Market Price | 26.33% | 106.99% | 210.54% |
| 500 Index Fund ETF Shares Net Asset Value | 26.25 | 106.84 | 210.37 |
| S&P 500 Index | 26.29 | 107.21 | 211.49 |
| Communication Services | 8.6% |
| Consumer Discretionary | 10.9 |
| Consumer Staples | 6.2 |
| Energy | 3.9 |
| Financials | 12.9 |
| Health Care | 12.6 |
| Industrials | 8.8 |
| Information Technology | 28.9 |
| Materials | 2.4 |
| Real Estate | 2.5 |
| Utilities | 2.3 |
| Shares | Market Value• ($000) | ||
| AES Corp. | 16,347,204 | 314,684 | |
| Evergy Inc. | 5,607,298 | 292,701 | |
| NRG Energy Inc. | 5,516,965 | 285,227 | |
| NiSource Inc. | 10,088,087 | 267,839 | |
| Pinnacle West Capital Corp. | 2,773,003 | 199,212 | |
| 22,874,545 | |||
| Total Common Stocks (Cost $588,003,536) | 976,810,547 | ||
| Temporary Cash Investments (0.3%) | |||
| Money Market Fund (0.3%) | |||
| 3,4 | Vanguard Market Liquidity Fund, 5.435% (Cost $2,581,279) | 25,824,367 | 2,581,920 |
| Total Investments (99.9%) (Cost $590,584,815) | 979,392,467 | ||
| Other Assets and Liabilities—Net (0.1%) | 955,501 | ||
| Net Assets (100%) | 980,347,968 | ||
| Cost is in $000. | |||
| • | See Note A in Notes to Financial Statements. |
| * | Non-income-producing security. |
| 1 | Includes partial security positions on loan to broker-dealers. The total value of securities on loan is $37,536,000. |
| 2 | Security value determined using significant unobservable inputs. |
| 3 | Affiliated money market fund available only to Vanguard funds and certain trusts and accounts managed by Vanguard. Rate shown is the 7-day yield. |
| 4 | Collateral of $40,254,000 was received for securities on loan. |
| CVR—Contingent Value Rights. |
| Futures Contracts | ||||
| ($000) | ||||
| Expiration | Number of Long (Short) Contracts | Notional Amount | Value and Unrealized Appreciation (Depreciation) | |
| Long Futures Contracts | ||||
| E-mini S&P 500 Index | March 2024 | 11,305 | 2,724,505 | 70,958 |
| Over-the-Counter Total Return Swaps | ||||||
| Reference Entity | Termination Date | Counterparty | Notional Amount ($000) | Floating Interest Rate Received (Paid)1 (%) | Value and Unrealized Appreciation ($000) | Value and Unrealized (Depreciation) ($000) |
| Citigroup Inc. | 8/29/25 | BANA | 30,864 | (5.931) | — | (132) |
| Fidelity National Information Services Inc. | 8/30/24 | BANA | 33,639 | (5.881) | 136 | — |
| Fidelity National Information Services Inc. | 8/30/24 | BANA | 30,035 | (5.978) | 152 | — |
| Fidelity National Information Services Inc. | 8/30/24 | BANA | 30,035 | (5.977) | — | (93) |
| Fidelity National Information Services Inc. | 8/30/24 | BANA | 30,035 | (5.976) | — | (88) |
| Fidelity National Information Services Inc. | 8/30/24 | BANA | 30,035 | (5.976) | — | (83) |
| Fidelity National Information Services Inc. | 8/30/24 | BANA | 30,035 | (5.975) | — | (77) |
| Fidelity National Information Services Inc. | 8/30/24 | BANA | 18,021 | (5.881) | 73 | — |
| Global Payments Inc. | 8/30/24 | BANA | 172,085 | (5.931) | — | (415) |
| Goldman Sachs Group Inc. | 8/29/25 | BANA | 251,136 | (6.031) | 710 | — |
| Invesco Ltd. | 8/30/24 | BANA | 4,460 | (5.881) | 33 | — |
| Kroger Co. | 1/31/24 | GSI | 44,110 | (5.324) | 1,522 | — |
| Netflix Inc. | 8/30/24 | BANA | 48,688 | (5.331) | — | (204) |
| VICI Properties Inc. | 8/30/24 | BANA | 84,482 | (5.981) | 718 | — |
| Visa Inc. Class A | 8/30/24 | BANA | 65,088 | 5.231 | — | (140) |
| 3,344 | (1,232) | |||||
| 1 | Based on Overnight Bank Funding Rate as of the most recent reset date. Floating interest payment received/paid monthly. |
| BANA—Bank of America, N.A. | |
| GSI—Goldman Sachs International. |
| ($000s, except shares, footnotes, and per-share amounts) | Amount |
| Assets | |
| Investments in Securities, at Value1 | |
| Unaffiliated Issuers (Cost $588,003,536) | 976,810,547 |
| Affiliated Issuers (Cost $2,581,279) | 2,581,920 |
| Total Investments in Securities | 979,392,467 |
| Investment in Vanguard | 31,035 |
| Cash | 2,982 |
| Cash Collateral Pledged—Futures Contracts | 134,729 |
| Receivables for Investment Securities Sold | 60,221 |
| Receivables for Accrued Income | 928,234 |
| Receivables for Capital Shares Issued | 645,981 |
| Unrealized Appreciation—Over-the-Counter Swap Contracts | 3,344 |
| Total Assets | 981,198,993 |
| Liabilities | |
| Payables for Investment Securities Purchased | 247,045 |
| Collateral for Securities on Loan | 40,254 |
| Payables for Capital Shares Redeemed | 541,870 |
| Payables to Vanguard | 13,694 |
| Variation Margin Payable—Futures Contracts | 6,930 |
| Unrealized Depreciation—Over-the-Counter Swap Contracts | 1,232 |
| Total Liabilities | 851,025 |
| Net Assets | 980,347,968 |
| 1 Includes $37,536,000 of securities on loan. | |
| Statement of Assets and Liabilities (continued) | |
| At December 31, 2023, net assets consisted of: | |
| ($000s, except shares, footnotes, and per-share amounts) | Amount |
| Paid-in Capital | 609,117,816 |
| Total Distributable Earnings (Loss) | 371,230,152 |
| Net Assets | 980,347,968 |
| Investor Shares—Net Assets | |
| Applicable to 7,218,564 outstanding $.001 par value shares of beneficial interest (unlimited authorization) | 3,176,561 |
| Net Asset Value Per Share—Investor Shares | $440.05 |
| ETF Shares—Net Assets | |
| Applicable to 852,102,904 outstanding $.001 par value shares of beneficial interest (unlimited authorization) | 372,050,529 |
| Net Asset Value Per Share—ETF Shares | $436.63 |
| Admiral Shares—Net Assets | |
| Applicable to 1,038,239,890 outstanding $.001 par value shares of beneficial interest (unlimited authorization) | 456,812,377 |
| Net Asset Value Per Share—Admiral Shares | $439.99 |
| Institutional Select Shares—Net Assets | |
| Applicable to 635,921,838 outstanding $.001 par value shares of beneficial interest (unlimited authorization) | 148,308,501 |
| Net Asset Value Per Share—Institutional Select Shares | $233.22 |
| Year Ended December 31, 2023 | |
| ($000) | |
| Investment Income | |
| Income | |
| Dividends1 | 14,020,764 |
| Interest2 | 149,303 |
| Securities Lending—Net | 516 |
| Total Income | 14,170,583 |
| Expenses | |
| The Vanguard Group—Note B | |
| Investment Advisory Services | 18,349 |
| Management and Administrative—Investor Shares | 4,142 |
| Management and Administrative—ETF Shares | 66,283 |
| Management and Administrative—Admiral Shares | 136,013 |
| Management and Administrative—Institutional Select Shares | 9,506 |
| Marketing and Distribution—Investor Shares | 138 |
| Marketing and Distribution—ETF Shares | 14,875 |
| Marketing and Distribution—Admiral Shares | 16,088 |
| Marketing and Distribution—Institutional Select Shares | 249 |
| Custodian Fees | 3,015 |
| Auditing Fees | 45 |
| Shareholders’ Reports—Investor Shares | 4 |
| Shareholders’ Reports—ETF Shares | 3,958 |
| Shareholders’ Reports—Admiral Shares | 1,792 |
| Shareholders’ Reports—Institutional Select Shares | — |
| Trustees’ Fees and Expenses | 521 |
| Other Expenses | 23 |
| Total Expenses | 275,001 |
| Expenses Paid Indirectly | (175) |
| Net Expenses | 274,826 |
| Net Investment Income | 13,895,757 |
| Realized Net Gain (Loss) | |
| Investment Securities Sold2,3 | 20,395,522 |
| Futures Contracts | 306,185 |
| Swap Contracts | 94,710 |
| Realized Net Gain (Loss) | 20,796,417 |
| Statement of Operations (continued) | |
| Year Ended December 31, 2023 | |
| ($000) | |
| Change in Unrealized Appreciation (Depreciation) | |
| Investment Securities2 | 164,440,380 |
| Futures Contracts | 130,883 |
| Swap Contracts | (994) |
| Change in Unrealized Appreciation (Depreciation) | 164,570,269 |
| Net Increase (Decrease) in Net Assets Resulting from Operations | 199,262,443 |
| 1 | Dividends are net of foreign withholding taxes of $3,752,000. |
| 2 | Interest income, realized net gain (loss), capital gain distributions received, and change in unrealized appreciation (depreciation) from an affiliated company of the fund were $142,398,000, $229,000, $15,000, and ($303,000), respectively. Purchases and sales are for temporary cash investment purposes. |
| 3 | Includes $25,287,854,000 of net gain (loss) resulting from in-kind redemptions. |
| Year Ended December 31, | ||
| 2023 ($000) | 2022 ($000) | |
| Increase (Decrease) in Net Assets | ||
| Operations | ||
| Net Investment Income | 13,895,757 | 12,276,461 |
| Realized Net Gain (Loss) | 20,796,417 | 27,249,293 |
| Change in Unrealized Appreciation (Depreciation) | 164,570,269 | (197,719,707) |
| Net Increase (Decrease) in Net Assets Resulting from Operations | 199,262,443 | (158,193,953) |
| Distributions | ||
| Investor Shares | (46,502) | (51,118) |
| ETF Shares | (5,133,943) | (4,305,991) |
| Admiral Shares | (6,583,499) | (6,152,722) |
| Institutional Select Shares | (2,092,603) | (1,760,089) |
| Total Distributions | (13,856,547) | (12,269,920) |
| Capital Share Transactions | ||
| Investor Shares | (596,976) | (599,158) |
| ETF Shares | 42,127,992 | 39,905,931 |
| Admiral Shares | 331,303 | 2,645,315 |
| Institutional Select Shares | 8,310,030 | 17,199,992 |
| Net Increase (Decrease) from Capital Share Transactions | 50,172,349 | 59,152,080 |
| Total Increase (Decrease) | 235,578,245 | (111,311,793) |
| Net Assets | ||
| Beginning of Period | 744,769,723 | 856,081,516 |
| End of Period | 980,347,968 | 744,769,723 |
| Investor Shares | |||||
| For a Share Outstanding Throughout Each Period | Year Ended December 31, | ||||
| 2023 | 2022 | 2021 | 2020 | 2019 | |
| Net Asset Value, Beginning of Period | $354.17 | $439.86 | $346.60 | $298.16 | $231.44 |
| Investment Operations | |||||
| Net Investment Income1 | 5.990 | 5.605 | 4.910 | 5.128 | 4.801 |
| Net Realized and Unrealized Gain (Loss) on Investments | 85.860 | (85.733) | 93.389 | 48.323 | 67.211 |
| Total from Investment Operations | 91.850 | (80.128) | 98.299 | 53.451 | 72.012 |
| Distributions | |||||
| Dividends from Net Investment Income | (5.970) | (5.562) | (5.039) | (5.011) | (5.292) |
| Distributions from Realized Capital Gains | — | — | — | — | — |
| Total Distributions | (5.970) | (5.562) | (5.039) | (5.011) | (5.292) |
| Net Asset Value, End of Period | $440.05 | $354.17 | $439.86 | $346.60 | $298.16 |
| Total Return2 | 26.11% | -18.23% | 28.53% | 18.25% | 31.33% |
| Ratios/Supplemental Data | |||||
| Net Assets, End of Period (Millions) | $3,177 | $3,093 | $4,512 | $4,504 | $4,723 |
| Ratio of Total Expenses to Average Net Assets | 0.14%3 | 0.14%3 | 0.14% | 0.14% | 0.14% |
| Ratio of Net Investment Income to Average Net Assets | 1.52% | 1.47% | 1.25% | 1.73% | 1.82% |
| Portfolio Turnover Rate4 | 2% | 2% | 2% | 4% | 4% |
| 1 | Calculated based on average shares outstanding. |
| 2 | Total returns do not include account service fees that may have applied in the periods shown. Fund prospectuses provide information about any applicable account service fees. |
| 3 | The ratio of expenses to average net assets for the period net of reduction from custody fee offset arrangements was 0.14%. |
| 4 | Excludes the value of portfolio securities received or delivered as a result of in-kind purchases or redemptions of the fund’s capital shares, including ETF Creation Units. |
| ETF Shares | |||||
| For a Share Outstanding Throughout Each Period | Year Ended December 31, | ||||
| 2023 | 2022 | 2021 | 2020 | 2019 | |
| Net Asset Value, Beginning of Period | $351.41 | $436.47 | $343.93 | $295.87 | $229.68 |
| Investment Operations | |||||
| Net Investment Income1 | 6.412 | 6.012 | 5.353 | 5.413 | 5.298 |
| Net Realized and Unrealized Gain (Loss) on Investments | 85.165 | (85.125) | 92.624 | 47.950 | 66.463 |
| Total from Investment Operations | 91.577 | (79.113) | 97.977 | 53.363 | 71.761 |
| Distributions | |||||
| Dividends from Net Investment Income | (6.357) | (5.947) | (5.437) | (5.303) | (5.571) |
| Distributions from Realized Capital Gains | — | — | — | — | — |
| Total Distributions | (6.357) | (5.947) | (5.437) | (5.303) | (5.571) |
| Net Asset Value, End of Period | $436.63 | $351.41 | $436.47 | $343.93 | $295.87 |
| Total Return2 | 26.25% | -18.15% | 28.66% | 18.35% | 31.46% |
| Ratios/Supplemental Data | |||||
| Net Assets, End of Period (Millions) | $372,051 | $262,211 | $279,850 | $177,991 | $130,728 |
| Ratio of Total Expenses to Average Net Assets | 0.03%3 | 0.03%3 | 0.03% | 0.03% | 0.03% |
| Ratio of Net Investment Income to Average Net Assets | 1.63% | 1.60% | 1.36% | 1.83% | 1.98% |
| Portfolio Turnover Rate4 | 2% | 2% | 2% | 4% | 4% |
| 1 | Calculated based on average shares outstanding. |
| 2 | Total returns do not include account service fees that may have applied in the periods shown. Fund prospectuses provide information about any applicable account service fees. |
| 3 | The ratio of expenses to average net assets for the period net of reduction from custody fee offset arrangements were 0.03%. |
| 4 | Excludes the value of portfolio securities received or delivered as a result of in-kind purchases or redemptions of the fund’s capital shares, including ETF Creation Units. |
| Admiral Shares | |||||
| For a Share Outstanding Throughout Each Period | Year Ended December 31, | ||||
| 2023 | 2022 | 2021 | 2020 | 2019 | |
| Net Asset Value, Beginning of Period | $354.11 | $439.83 | $346.57 | $298.14 | $231.44 |
| Investment Operations | |||||
| Net Investment Income1 | 6.404 | 6.000 | 5.326 | 5.427 | 5.319 |
| Net Realized and Unrealized Gain (Loss) on Investments | 85.843 | (85.767) | 93.371 | 48.314 | 66.962 |
| Total from Investment Operations | 92.247 | (79.767) | 98.697 | 53.741 | 72.281 |
| Distributions | |||||
| Dividends from Net Investment Income | (6.367) | (5.953) | (5.437) | (5.311) | (5.581) |
| Distributions from Realized Capital Gains | — | — | — | — | — |
| Total Distributions | (6.367) | (5.953) | (5.437) | (5.311) | (5.581) |
| Net Asset Value, End of Period | $439.99 | $354.11 | $439.83 | $346.57 | $298.14 |
| Total Return2 | 26.24% | -18.15% | 28.66% | 18.37% | 31.46% |
| Ratios/Supplemental Data | |||||
| Net Assets, End of Period (Millions) | $456,812 | $367,498 | $453,239 | $359,553 | $319,624 |
| Ratio of Total Expenses to Average Net Assets | 0.04%3 | 0.04%3 | 0.04% | 0.04% | 0.04% |
| Ratio of Net Investment Income to Average Net Assets | 1.62% | 1.58% | 1.35% | 1.83% | 1.97% |
| Portfolio Turnover Rate4 | 2% | 2% | 2% | 4% | 4% |
| 1 | Calculated based on average shares outstanding. |
| 2 | Total returns do not include account service fees that may have applied in the periods shown. Fund prospectuses provide information about any applicable account service fees. |
| 3 | The ratio of expenses to average net assets for the period net of reduction from custody fee offset arrangements was 0.04%. |
| 4 | Excludes the value of portfolio securities received or delivered as a result of in-kind purchases or redemptions of the fund’s capital shares, including ETF Creation Units. |
| Institutional Select Shares | |||||
| For a Share Outstanding Throughout Each Period | Year Ended December 31, | ||||
| 2023 | 2022 | 2021 | 2020 | 2019 | |
| Net Asset Value, Beginning of Period | $187.66 | $233.06 | $183.64 | $157.98 | $122.64 |
| Investment Operations | |||||
| Net Investment Income1 | 3.462 | 3.249 | 2.885 | 2.924 | 2.857 |
| Net Realized and Unrealized Gain (Loss) on Investments | 45.493 | (45.458) | 49.478 | 25.597 | 35.484 |
| Total from Investment Operations | 48.955 | (42.209) | 52.363 | 28.521 | 38.341 |
| Distributions | |||||
| Dividends from Net Investment Income | (3.395) | (3.191) | (2.943) | (2.861) | (3.001) |
| Distributions from Realized Capital Gains | — | — | — | — | — |
| Total Distributions | (3.395) | (3.191) | (2.943) | (2.861) | (3.001) |
| Net Asset Value, End of Period | $233.22 | $187.66 | $233.06 | $183.64 | $157.98 |
| Total Return | 26.28% | -18.13% | 28.70% | 18.40% | 31.49% |
| Ratios/Supplemental Data | |||||
| Net Assets, End of Period (Millions) | $148,309 | $111,968 | $118,481 | $94,870 | $81,230 |
| Ratio of Total Expenses to Average Net Assets | 0.01%2 | 0.01%2 | 0.01% | 0.01% | 0.01% |
| Ratio of Net Investment Income to Average Net Assets | 1.65% | 1.62% | 1.38% | 1.86% | 2.00% |
| Portfolio Turnover Rate3 | 2% | 2% | 2% | 4% | 4% |
| 1 | Calculated based on average shares outstanding. |
| 2 | The ratio of expenses to average net assets for the period net of reduction from custody fee offset arrangements was 0.01%. |
| 3 | Excludes the value of portfolio securities received or delivered as a result of in-kind purchases or redemptions of the fund’s capital shares, including ETF Creation Units. |
| A. | The following significant accounting policies conform to generally accepted accounting principles for U.S. investment companies. The fund consistently follows such policies in preparing its financial statements. |
| B. | In accordance with the terms of a Funds' Service Agreement (the “FSA”) between Vanguard and the fund, Vanguard furnishes to the fund investment advisory, corporate management, administrative, marketing, and distribution services at Vanguard’s cost of operations (as defined by the FSA). These costs of operations are allocated to the fund based on methods and guidelines approved by the board of trustees and are generally settled twice a month. |
| C. | The fund’s custodian bank has agreed to reduce its fees when the fund maintains cash on deposit in the non-interest-bearing custody account. For the year ended December 31, 2023, custodian fee offset arrangements reduced the fund’s expenses by $175,000 (an annual rate of less than 0.01% of average net assets). |
| D. | Various inputs may be used to determine the value of the fund’s investments and derivatives. These inputs are summarized in three broad levels for financial statement purposes. The inputs or methodologies used to value securities are not necessarily an indication of the risk associated with investing in those securities. |
| Level 1 ($000) | Level 2 ($000) | Level 3 ($000) | Total ($000) | |
| Investments | ||||
| Assets | ||||
| Common Stocks | 976,810,547 | — | — | 976,810,547 |
| Temporary Cash Investments | 2,581,920 | — | — | 2,581,920 |
| Total | 979,392,467 | — | — | 979,392,467 |
| Derivative Financial Instruments | ||||
| Assets | ||||
| Futures Contracts1 | 70,958 | — | — | 70,958 |
| Swap Contracts | — | 3,344 | — | 3,344 |
| Total | 70,958 | 3,344 | — | 74,302 |
| Liabilities | ||||
| Swap Contracts | — | 1,232 | — | 1,232 |
| 1 | Includes cumulative appreciation (depreciation) on futures contracts and centrally cleared swaps, if any, as reported in the Schedule of Investments. Only current day’s variation margin is reported within the Statement of Assets and Liabilities. |
| E. | Permanent differences between book-basis and tax-basis components of net assets are reclassified among capital accounts in the financial statements to reflect their tax character. These reclassifications have no effect on net assets or net asset value per share. As of period end, permanent differences primarily attributable to the accounting for applicable in-kind redemptions and swap agreements were reclassified between the following accounts: |
| Amount ($000) | |
| Paid-in Capital | 25,288,331 |
| Total Distributable Earnings (Loss) | (25,288,331) |
| Amount ($000) | |
| Undistributed Ordinary Income | 212,833 |
| Undistributed Long-Term Gains | — |
| Net Unrealized Gains (Losses) | 388,378,108 |
| Capital Loss Carryforwards | (17,360,789) |
| Qualified Late-Year Losses | — |
| Other Temporary Differences | — |
| Total | 371,230,152 |
| Year Ended December 31, | ||
| 2023 Amount ($000) | 2022 Amount ($000) | |
| Ordinary Income* | 13,856,547 | 12,269,920 |
| Long-Term Capital Gains | — | — |
| Total | 13,856,547 | 12,269,920 |
| * | Includes short-term capital gains, if any. |
| Amount ($000) | |
| Tax Cost | 591,014,359 |
| Gross Unrealized Appreciation | 413,939,478 |
| Gross Unrealized Depreciation | (25,561,370) |
| Net Unrealized Appreciation (Depreciation) | 388,378,108 |
| F. | During the year ended December 31, 2023, the fund purchased $102,584,036,000 of investment securities and sold $52,488,052,000 of investment securities, other than temporary cash investments. Purchases and sales include $76,816,130,000 and $33,972,887,000, respectively, in connection with in-kind purchases and redemptions of the fund's capital shares. |
| G. | Capital share transactions for each class of shares were: |
| Year Ended December 31, | |||||
| 2023 | 2022 | ||||
| Amount ($000) | Shares (000) | Amount ($000) | Shares (000) | ||
| Investor Shares | |||||
| Issued | 148,701 | 374 | 156,806 | 409 | |
| Issued in Lieu of Cash Distributions | 46,496 | 117 | 51,111 | 142 | |
| Redeemed | (792,173) | (2,005) | (807,075) | (2,076) | |
| Net Increase (Decrease)—Investor Shares | (596,976) | (1,514) | (599,158) | (1,525) | |
| ETF Shares | |||||
| Issued | 73,338,523 | 182,751 | 85,049,475 | 222,763 | |
| Issued in Lieu of Cash Distributions | — | — | — | — | |
| Redeemed | (31,210,531) | (76,825) | (45,143,544) | (117,750) | |
| Net Increase (Decrease)—ETF Shares | 42,127,992 | 105,926 | 39,905,931 | 105,013 | |
| Admiral Shares | |||||
| Issued | 34,205,497 | 86,235 | 39,120,573 | 102,648 | |
| Issued in Lieu of Cash Distributions | 5,732,224 | 14,309 | 5,367,387 | 14,913 | |
| Redeemed | (39,606,418) | (100,108) | (41,842,645) | (110,248) | |
| Net Increase (Decrease)—Admiral Shares | 331,303 | 436 | 2,645,315 | 7,313 | |
| Institutional Select Shares | |||||
| Issued | 20,807,286 | 97,892 | 19,836,476 | 100,749 | |
| Issued in Lieu of Cash Distributions | 2,092,603 | 9,846 | 1,760,089 | 9,243 | |
| Redeemed | (14,589,859) | (68,463) | (4,396,573) | (21,716) | |
| Net Increase (Decrease)—Institutional Select Shares | 8,310,030 | 39,275 | 17,199,992 | 88,276 | |
| H. | Significant market disruptions, such as those caused by pandemics (e.g., COVID-19 pandemic), natural or environmental disasters, war (e.g., Russia’s invasion of Ukraine), acts of terrorism, or other events, can adversely affect local and global markets and normal market operations. Any such disruptions could have an adverse impact on the value of the fund’s investments and fund performance. |
| I. | Management has determined that no events or transactions occurred subsequent to December 31, 2023, that would require recognition or disclosure in these financial statements. |
Philadelphia, Pennsylvania
February 15, 2024


| Vanguard Small-Cap Index Fund |
| Vanguard Small-Cap Growth Index Fund |
| Vanguard Small-Cap Value Index Fund |
| 1 | |
| 2 | |
| 4 | |
| 46 | |
| 75 |
| • | The financial markets delivered robust returns for the 12 months ended December 31, 2023. Returns for the Vanguard Small-Cap Index Funds ranged from 15.86% for Investor Shares of the Small-Cap Value Index Fund to 21.44% for Institutional Shares of the Small-Cap Growth Index Fund. Strong net returns from securities lending helped most share classes of all three funds to slightly outperform their target indexes. |
| • | Major central banks stopped hiking interest rates as inflation continued to ease. Global growth, employment, and consumer spending proved resilient, but the prospect of rates remaining high for an extended period spurred occasional volatility. Toward year-end, however, stocks and bonds rallied worldwide as expectations for rate cuts in 2024 rose. |
| • | Strong equity returns were widespread. Consumer discretionary and industrial stocks were among the top sector-level contributors to all three funds’ target indexes. Technology shares also drove the Small-Cap Index Fund and the Small-Cap Growth Index Fund, while financials also boosted the Small-Cap Value Index Fund. Telecommunications slightly weighed on all three. |
| • | For the 10 years ended December 31, 2023, the funds’ annualized returns ranged from 7.73% for Investor Shares of the Small-Cap Growth Index Fund to 8.51% for Institutional Shares of the Small-Cap Value Index Fund. The funds closely tracked their indexes. |
| Average Annual Total Returns Periods Ended December 31, 2023 | |||
| One Year | Three Years | Five Years | |
| Stocks | |||
| Russell 1000 Index (Large-caps) | 26.53% | 8.97% | 15.52% |
| Russell 2000 Index (Small-caps) | 16.93 | 2.22 | 9.97 |
| Russell 3000 Index (Broad U.S. market) | 25.96 | 8.54 | 15.16 |
| FTSE All-World ex US Index (International) | 15.82 | 1.98 | 7.52 |
| Bonds | |||
| Bloomberg U.S. Aggregate Float Adjusted Index (Broad taxable market) | 5.60% | -3.33% | 1.17% |
| Bloomberg Municipal Bond Index (Broad tax-exempt market) | 6.40 | -0.40 | 2.25 |
| FTSE Three-Month U.S. Treasury Bill Index | 5.26 | 2.24 | 1.91 |
| CPI | |||
| Consumer Price Index | 3.35% | 5.60% | 4.07% |
| • | Based on actual fund return. This section helps you to estimate the actual expenses that you paid over the period. The ”Ending Account Value“ shown is derived from the fund’s actual return, and the third column shows the dollar amount that would have been paid by an investor who started with $1,000 in the fund. You may use the information here, together with the amount you invested, to estimate the expenses that you paid over the period. |
| • | Based on hypothetical 5% yearly return. This section is intended to help you compare your fund‘s costs with those of other mutual funds. It assumes that the fund had a yearly return of 5% before expenses, but that the expense ratio is unchanged. In this case—because the return used is not the fund’s actual return—the results do not apply to your investment. The example is useful in making comparisons because the Securities and Exchange Commission requires all mutual funds to calculate expenses based on a 5% return. You can assess your fund’s costs by comparing this hypothetical example with the hypothetical examples that appear in shareholder reports of other funds. |
| Six Months Ended December 31, 2023 | |||
| Beginning Account Value 6/30/2023 | Ending Account Value 12/31/2023 | Expenses Paid During Period | |
| Based on Actual Fund Return | |||
| Small-Cap Index Fund | |||
| Investor Shares | $1,000.00 | $1,081.20 | $0.89 |
| ETF Shares | 1,000.00 | 1,081.80 | 0.26 |
| Admiral™ Shares | 1,000.00 | 1,081.80 | 0.26 |
| Institutional Shares | 1,000.00 | 1,081.90 | 0.21 |
| Institutional Plus Shares | 1,000.00 | 1,081.90 | 0.16 |
| Small-Cap Growth Index Fund | |||
| Investor Shares | $1,000.00 | $1,056.00 | $0.98 |
| ETF Shares | 1,000.00 | 1,056.60 | 0.36 |
| Admiral Shares | 1,000.00 | 1,056.70 | 0.36 |
| Institutional Shares | 1,000.00 | 1,056.70 | 0.31 |
| Small-Cap Value Index Fund | |||
| Investor Shares | $1,000.00 | $1,100.80 | $1.01 |
| ETF Shares | 1,000.00 | 1,101.40 | 0.37 |
| Admiral Shares | 1,000.00 | 1,101.40 | 0.37 |
| Institutional Shares | 1,000.00 | 1,101.40 | 0.32 |
| Based on Hypothetical 5% Yearly Return | |||
| Small-Cap Index Fund | |||
| Investor Shares | $1,000.00 | $1,024.35 | $0.87 |
| ETF Shares | 1,000.00 | 1,024.95 | 0.26 |
| Admiral Shares | 1,000.00 | 1,024.95 | 0.26 |
| Institutional Shares | 1,000.00 | 1,025.00 | 0.20 |
| Institutional Plus Shares | 1,000.00 | 1,025.05 | 0.15 |
| Small-Cap Growth Index Fund | |||
| Investor Shares | $1,000.00 | $1,024.25 | $0.97 |
| ETF Shares | 1,000.00 | 1,024.85 | 0.36 |
| Admiral Shares | 1,000.00 | 1,024.85 | 0.36 |
| Institutional Shares | 1,000.00 | 1,024.90 | 0.31 |
| Small-Cap Value Index Fund | |||
| Investor Shares | $1,000.00 | $1,024.25 | $0.97 |
| ETF Shares | 1,000.00 | 1,024.85 | 0.36 |
| Admiral Shares | 1,000.00 | 1,024.85 | 0.36 |
| Institutional Shares | 1,000.00 | 1,024.90 | 0.31 |

| Average Annual Total Returns Periods Ended December 31, 2023 | |||||
| One Year | Five Years | Ten Years | Final Value of a $10,000 Investment | ||

| Small-Cap Index Fund Investor Shares | 18.05% | 11.57% | 8.30% | $22,195 |

| CRSP US Small Cap Index | 18.09 | 11.66 | 8.41 | 22,413 |

| Dow Jones U.S. Total Stock Market Float Adjusted Index | 26.06 | 15.05 | 11.40 | 29,422 |
| One Year | Five Years | Ten Years | Final Value of a $10,000 Investment | ||
| Small-Cap Index Fund ETF Shares Net Asset Value | 18.21% | 11.70% | 8.43% | $22,469 | |
| Small-Cap Index Fund ETF Shares Market Price | 18.31 | 11.73 | 8.44 | 22,484 | |
| CRSP US Small Cap Index | 18.09 | 11.66 | 8.41 | 22,413 | |
| Dow Jones U.S. Total Stock Market Float Adjusted Index | 26.06 | 15.05 | 11.40 | 29,422 | |
| Average Annual Total Returns Periods Ended December 31, 2023 | |||||
| One Year | Five Years | Ten Years | Final Value of a $10,000 Investment | ||
| Small-Cap Index Fund Admiral Shares | 18.20% | 11.70% | 8.43% | $22,467 | |
| CRSP US Small Cap Index | 18.09 | 11.66 | 8.41 | 22,413 | |
| Dow Jones U.S. Total Stock Market Float Adjusted Index | 26.06 | 15.05 | 11.40 | 29,422 | |
| One Year | Five Years | Ten Years | Final Value of a $5,000,000 Investment | ||
| Small-Cap Index Fund Institutional Shares | 18.22% | 11.72% | 8.44% | $11,246,770 | |
| CRSP US Small Cap Index | 18.09 | 11.66 | 8.41 | 11,206,742 | |
| Dow Jones U.S. Total Stock Market Float Adjusted Index | 26.06 | 15.05 | 11.40 | 14,710,990 | |
| One Year | Five Years | Ten Years | Final Value of a $100,000,000 Investment | ||
| Small-Cap Index Fund Institutional Plus Shares | 18.22% | 11.73% | 8.46% | $225,184,560 | |
| CRSP US Small Cap Index | 18.09 | 11.66 | 8.41 | 224,134,830 | |
| Dow Jones U.S. Total Stock Market Float Adjusted Index | 26.06 | 15.05 | 11.40 | 294,219,800 | |
| Cumulative Returns of ETF Shares: December 31, 2013, Through December 31, 2023 | |||
| One Year | Five Years | Ten Years | |
| Small-Cap Index Fund ETF Shares Market Price | 18.31% | 74.13% | 124.84% |
| Small-Cap Index Fund ETF Shares Net Asset Value | 18.21 | 73.91 | 124.69 |
| CRSP US Small Cap Index | 18.09 | 73.60 | 124.13 |
| Basic Materials | 3.9% |
| Consumer Discretionary | 16.2 |
| Consumer Staples | 3.1 |
| Energy | 5.3 |
| Financials | 14.1 |
| Health Care | 11.0 |
| Industrials | 21.7 |
| Real Estate | 7.5 |
| Technology | 13.0 |
| Telecommunications | 1.3 |
| Utilities | 2.9 |
| Shares | Market Value• ($000) | |||||
| Northwest Natural Holding Co. | 893,879 | 34,808 | ||||
| Clearway Energy Inc. Class A | 878,788 | 22,479 | ||||
| * | Enviri Corp. | 1,017,687 | 9,159 | |||
| Excelerate Energy Inc. Class A | 468,159 | 7,238 | ||||
| *,1 | NuScale Power Corp. Class A | 1,464,713 | 4,819 | |||
| *,1 | Net Power Inc. | 342,741 | 3,462 | |||
| 3,928,146 | ||||||
| Total Common Stocks (Cost $100,156,763) | 133,504,067 | |||||
| Temporary Cash Investments (1.5%) | ||||||
| Money Market Fund (1.5%) | ||||||
| 3,4 | Vanguard Market Liquidity Fund, 5.435% (Cost $2,031,751) | 20,333,209 | 2,032,914 | |||
| Total Investments (101.3%) (Cost $102,188,514) | 135,536,981 | |||||
| Other Assets and Liabilities—Net (-1.3%) | (1,753,491) | |||||
| Net Assets (100%) | 133,783,490 | |||||
| Cost is in $000. |
| • | See Note A in Notes to Financial Statements. |
| * | Non-income-producing security. |
| 1 | Includes partial security positions on loan to broker-dealers. The total value of securities on loan is $1,653,618,000. |
| 2 | Security value determined using significant unobservable inputs. |
| 3 | Affiliated money market fund available only to Vanguard funds and certain trusts and accounts managed by Vanguard. Rate shown is the 7-day yield. |
| 4 | Collateral of $1,839,571,000 was received for securities on loan. |
| REIT—Real Estate Investment Trust. |
| Futures Contracts | ||||
| ($000) | ||||
| Expiration | Number of Long (Short) Contracts | Notional Amount | Value and Unrealized Appreciation (Depreciation) | |
| Long Futures Contracts | ||||
| E-mini Russell 2000 Index | March 2024 | 793 | 81,191 | (375) |
| E-mini S&P 500 Index | March 2024 | 49 | 11,809 | 391 |
| E-mini S&P Mid-Cap 400 Index | March 2024 | 782 | 219,703 | 6,828 |
| 6,844 | ||||
| Over-the-Counter Total Return Swaps | ||||||
| Reference Entity | Termination Date | Counterparty | Notional Amount ($000) | Floating Interest Rate Received (Paid)1 (%) | Value and Unrealized Appreciation ($000) | Value and Unrealized (Depreciation) ($000) |
| Arbor Realty Trust Inc. | 1/31/24 | GSI | 7,690 | (5.331) | — | (113) |
| Invesco Ltd. | 8/30/24 | BANA | 3,996 | (5.882) | 1,037 | — |
| Ollie's Bargain Outlet Holdings Inc. | 1/31/24 | GSI | 20,634 | (5.331) | 2,100 | — |
| 3,137 | (113) | |||||
| 1 | Based on USD Overnight Bank Funding Rate as of the most recent reset date. Floating interest payment received/paid monthly. |
| BANA—Bank of America, N.A. | |
| GSI—Goldman Sachs International. |
| ($000s, except shares, footnotes, and per-share amounts) | Amount |
| Assets | |
| Investments in Securities, at Value1 | |
| Unaffiliated Issuers (Cost $100,156,763) | 133,504,067 |
| Affiliated Issuers (Cost $2,031,751) | 2,032,914 |
| Total Investments in Securities | 135,536,981 |
| Investment in Vanguard | 4,012 |
| Cash Collateral Pledged—Futures Contracts | 19,499 |
| Receivables for Investment Securities Sold | 44,876 |
| Receivables for Accrued Income | 155,324 |
| Receivables for Capital Shares Issued | 129,717 |
| Unrealized Appreciation—Over-the-Counter Swap Contracts | 3,137 |
| Total Assets | 135,893,546 |
| Liabilities | |
| Due to Custodian | 56,249 |
| Payables for Investment Securities Purchased | 2,791 |
| Collateral for Securities on Loan | 1,839,571 |
| Payables for Capital Shares Redeemed | 204,296 |
| Payables to Vanguard | 2,768 |
| Variation Margin Payable—Futures Contracts | 4,268 |
| Unrealized Depreciation—Over-the-Counter Swap Contracts | 113 |
| Total Liabilities | 2,110,056 |
| Net Assets | 133,783,490 |
| 1 Includes $1,653,618,000 of securities on loan. | |
| Statement of Assets and Liabilities (continued) | |
| At December 31, 2023, net assets consisted of: | |
| ($000s, except shares, footnotes, and per-share amounts) | Amount |
| Paid-in Capital | 114,056,266 |
| Total Distributable Earnings (Loss) | 19,727,224 |
| Net Assets | 133,783,490 |
| Investor Shares—Net Assets | |
| Applicable to 3,674,352 outstanding $.001 par value shares of beneficial interest (unlimited authorization) | 375,455 |
| Net Asset Value Per Share—Investor Shares | $102.18 |
| ETF Shares—Net Assets | |
| Applicable to 236,757,474 outstanding $.001 par value shares of beneficial interest (unlimited authorization) | 50,491,539 |
| Net Asset Value Per Share—ETF Shares | $213.26 |
| Admiral Shares—Net Assets | |
| Applicable to 507,421,002 outstanding $.001 par value shares of beneficial interest (unlimited authorization) | 51,853,899 |
| Net Asset Value Per Share—Admiral Shares | $102.19 |
| Institutional Shares—Net Assets | |
| Applicable to 200,510,855 outstanding $.001 par value shares of beneficial interest (unlimited authorization) | 20,489,629 |
| Net Asset Value Per Share—Institutional Shares | $102.19 |
| Institutional Plus Shares—Net Assets | |
| Applicable to 35,846,826 outstanding $.001 par value shares of beneficial interest (unlimited authorization) | 10,572,968 |
| Net Asset Value Per Share—Institutional Plus Shares | $294.95 |
| Year Ended December 31, 2023 | |
| ($000) | |
| Investment Income | |
| Income | |
| Dividends1 | 1,846,241 |
| Interest2 | 35,924 |
| Securities Lending—Net | 165,861 |
| Total Income | 2,048,026 |
| Expenses | |
| The Vanguard Group—Note B | |
| Investment Advisory Services | 2,565 |
| Management and Administrative—Investor Shares | 632 |
| Management and Administrative—ETF Shares | 17,058 |
| Management and Administrative—Admiral Shares | 19,456 |
| Management and Administrative—Institutional Shares | 6,062 |
| Management and Administrative—Institutional Plus Shares | 2,238 |
| Marketing and Distribution—Investor Shares | 20 |
| Marketing and Distribution—ETF Shares | 2,345 |
| Marketing and Distribution—Admiral Shares | 2,182 |
| Marketing and Distribution—Institutional Shares | 604 |
| Marketing and Distribution—Institutional Plus Shares | 305 |
| Custodian Fees | 890 |
| Auditing Fees | 39 |
| Shareholders’ Reports—Investor Shares | 1 |
| Shareholders’ Reports—ETF Shares | 1,303 |
| Shareholders’ Reports—Admiral Shares | 603 |
| Shareholders’ Reports—Institutional Shares | 242 |
| Shareholders’ Reports—Institutional Plus Shares | 74 |
| Trustees’ Fees and Expenses | 72 |
| Other Expenses | 23 |
| Total Expenses | 56,714 |
| Net Investment Income | 1,991,312 |
| Realized Net Gain (Loss) | |
| Investment Securities Sold2,3 | (603,602) |
| Futures Contracts | 58,011 |
| Swap Contracts | 6,635 |
| Realized Net Gain (Loss) | (538,956) |
| Statement of Operations (continued) | |
| Year Ended December 31, 2023 | |
| ($000) | |
| Change in Unrealized Appreciation (Depreciation) | |
| Investment Securities2 | 19,055,312 |
| Futures Contracts | 17,061 |
| Swap Contracts | 4,458 |
| Change in Unrealized Appreciation (Depreciation) | 19,076,831 |
| Net Increase (Decrease) in Net Assets Resulting from Operations | 20,529,187 |
| 1 | Dividends are net of foreign withholding taxes of $367,000. |
| 2 | Interest income, realized net gain (loss), capital gain distributions received, and change in unrealized appreciation (depreciation) from an affiliated company of the fund were $33,673,000, $102,000, $1,000, and $581,000, respectively. Purchases and sales are for temporary cash investment purposes. |
| 3 | Includes $4,282,164,000 of net gain (loss) resulting from in-kind redemptions. |
| Year Ended December 31, | ||
| 2023 ($000) | 2022 ($000) | |
| Increase (Decrease) in Net Assets | ||
| Operations | ||
| Net Investment Income | 1,991,312 | 1,779,640 |
| Realized Net Gain (Loss) | (538,956) | 3,670,352 |
| Change in Unrealized Appreciation (Depreciation) | 19,076,831 | (30,136,638) |
| Net Increase (Decrease) in Net Assets Resulting from Operations | 20,529,187 | (24,686,646) |
| Distributions | ||
| Investor Shares | (6,045) | (6,214) |
| ETF Shares | (763,273) | (624,299) |
| Admiral Shares | (806,183) | (686,977) |
| Institutional Shares | (320,582) | (267,947) |
| Institutional Plus Shares | (166,742) | (147,092) |
| Total Distributions | (2,062,825) | (1,732,529) |
| Capital Share Transactions | ||
| Investor Shares | (106,228) | (85,166) |
| ETF Shares | 3,096,563 | 14,486 |
| Admiral Shares | (333,800) | 58,508 |
| Institutional Shares | 240,484 | (448,033) |
| Institutional Plus Shares | (50,188) | (1,200,734) |
| Net Increase (Decrease) from Capital Share Transactions | 2,846,831 | (1,660,939) |
| Total Increase (Decrease) | 21,313,193 | (28,080,114) |
| Net Assets | ||
| Beginning of Period | 112,470,297 | 140,550,411 |
| End of Period | 133,783,490 | 112,470,297 |
| Investor Shares | |||||
| For a Share Outstanding Throughout Each Period | Year Ended December 31, | ||||
| 2023 | 2022 | 2021 | 2020 | 2019 | |
| Net Asset Value, Beginning of Period | $87.93 | $108.35 | $93.20 | $79.35 | $63.21 |
| Investment Operations | |||||
| Net Investment Income1 | 1.412 | 1.256 | 1.230 | .928 | .832 |
| Net Realized and Unrealized Gain (Loss) on Investments | 14.314 | (20.439) | 15.130 | 13.897 | 16.319 |
| Total from Investment Operations | 15.726 | (19.183) | 16.360 | 14.825 | 17.151 |
| Distributions | |||||
| Dividends from Net Investment Income | (1.476) | (1.237) | (1.210) | (.975) | (1.011) |
| Distributions from Realized Capital Gains | — | — | — | — | — |
| Total Distributions | (1.476) | (1.237) | (1.210) | (.975) | (1.011) |
| Net Asset Value, End of Period | $102.18 | $87.93 | $108.35 | $93.20 | $79.35 |
| Total Return2 | 18.05% | -17.71% | 17.59% | 18.96% | 27.22% |
| Ratios/Supplemental Data | |||||
| Net Assets, End of Period (Millions) | $375 | $424 | $619 | $709 | $754 |
| Ratio of Total Expenses to Average Net Assets | 0.17% | 0.17%3 | 0.17% | 0.17% | 0.17% |
| Ratio of Net Investment Income to Average Net Assets | 1.52% | 1.34% | 1.17% | 1.26% | 1.14% |
| Portfolio Turnover Rate4 | 12% | 14% | 17% | 22% | 16% |
| 1 | Calculated based on average shares outstanding. |
| 2 | Total returns do not include account service fees that may have applied in the periods shown. Fund prospectuses provide information about any applicable account service fees. |
| 3 | The ratio of expenses to average net assets for the period net of reduction from custody fee offset arrangements was 0.17%. |
| 4 | Excludes the value of portfolio securities received or delivered as a result of in-kind purchases or redemptions of the fund’s capital shares, including ETF Creation Units. |
| ETF Shares | |||||
| For a Share Outstanding Throughout Each Period | Year Ended December 31, | ||||
| 2023 | 2022 | 2021 | 2020 | 2019 | |
| Net Asset Value, Beginning of Period | $183.52 | $226.15 | $194.54 | $165.64 | $131.94 |
| Investment Operations | |||||
| Net Investment Income1 | 3.218 | 2.891 | 2.769 | 2.262 | 2.298 |
| Net Realized and Unrealized Gain (Loss) on Investments | 29.839 | (42.700) | 31.637 | 28.863 | 33.707 |
| Total from Investment Operations | 33.057 | (39.809) | 34.406 | 31.125 | 36.005 |
| Distributions | |||||
| Dividends from Net Investment Income | (3.317) | (2.821) | (2.796) | (2.225) | (2.305) |
| Distributions from Realized Capital Gains | — | — | — | — | — |
| Total Distributions | (3.317) | (2.821) | (2.796) | (2.225) | (2.305) |
| Net Asset Value, End of Period | $213.26 | $183.52 | $226.15 | $194.54 | $165.64 |
| Total Return | 18.21% | -17.60% | 17.72% | 19.08% | 27.37% |
| Ratios/Supplemental Data | |||||
| Net Assets, End of Period (Millions) | $50,492 | $40,593 | $50,187 | $37,492 | $27,442 |
| Ratio of Total Expenses to Average Net Assets | 0.05% | 0.05%2 | 0.05% | 0.05% | 0.05% |
| Ratio of Net Investment Income to Average Net Assets | 1.66% | 1.49% | 1.25% | 1.47% | 1.49% |
| Portfolio Turnover Rate3 | 12% | 14% | 17% | 22% | 16% |
| 1 | Calculated based on average shares outstanding. |
| 2 | The ratio of expenses to average net assets for the period net of reduction from custody fee offset arrangements was 0.05%. |
| 3 | Excludes the value of portfolio securities received or delivered as a result of in-kind purchases or redemptions of the fund’s capital shares, including ETF Creation Units. |
| Admiral Shares | |||||
| For a Share Outstanding Throughout Each Period | Year Ended December 31, | ||||
| 2023 | 2022 | 2021 | 2020 | 2019 | |
| Net Asset Value, Beginning of Period | $87.94 | $108.37 | $93.22 | $79.37 | $63.23 |
| Investment Operations | |||||
| Net Investment Income1 | 1.534 | 1.383 | 1.358 | 1.029 | 1.108 |
| Net Realized and Unrealized Gain (Loss) on Investments | 14.305 | (20.461) | 15.131 | 13.887 | 16.136 |
| Total from Investment Operations | 15.839 | (19.078) | 16.489 | 14.916 | 17.244 |
| Distributions | |||||
| Dividends from Net Investment Income | (1.589) | (1.352) | (1.339) | (1.066) | (1.104) |
| Distributions from Realized Capital Gains | — | — | — | — | — |
| Total Distributions | (1.589) | (1.352) | (1.339) | (1.066) | (1.104) |
| Net Asset Value, End of Period | $102.19 | $87.94 | $108.37 | $93.22 | $79.37 |
| Total Return2 | 18.20% | -17.61% | 17.73% | 19.11% | 27.37% |
| Ratios/Supplemental Data | |||||
| Net Assets, End of Period (Millions) | $51,854 | $44,944 | $55,266 | $47,313 | $42,386 |
| Ratio of Total Expenses to Average Net Assets | 0.05% | 0.05%3 | 0.05% | 0.05% | 0.05% |
| Ratio of Net Investment Income to Average Net Assets | 1.65% | 1.48% | 1.29% | 1.40% | 1.50% |
| Portfolio Turnover Rate4 | 12% | 14% | 17% | 22% | 16% |
| 1 | Calculated based on average shares outstanding. |
| 2 | Total returns do not include account service fees that may have applied in the periods shown. Fund prospectuses provide information about any applicable account service fees. |
| 3 | The ratio of expenses to average net assets for the period net of reduction from custody fee offset arrangements was 0.05%. |
| 4 | Excludes the value of portfolio securities received or delivered as a result of in-kind purchases or redemptions of the fund’s capital shares, including ETF Creation Units. |
| Institutional Shares | |||||
| For a Share Outstanding Throughout Each Period | Year Ended December 31, | ||||
| 2023 | 2022 | 2021 | 2020 | 2019 | |
| Net Asset Value, Beginning of Period | $87.93 | $108.36 | $93.22 | $79.37 | $63.22 |
| Investment Operations | |||||
| Net Investment Income1 | 1.544 | 1.392 | 1.367 | 1.034 | 1.101 |
| Net Realized and Unrealized Gain (Loss) on Investments | 14.314 | (20.461) | 15.123 | 13.889 | 16.161 |
| Total from Investment Operations | 15.858 | (19.069) | 16.490 | 14.923 | 17.262 |
| Distributions | |||||
| Dividends from Net Investment Income | (1.598) | (1.361) | (1.350) | (1.073) | (1.112) |
| Distributions from Realized Capital Gains | — | — | — | — | — |
| Total Distributions | (1.598) | (1.361) | (1.350) | (1.073) | (1.112) |
| Net Asset Value, End of Period | $102.19 | $87.93 | $108.36 | $93.22 | $79.37 |
| Total Return | 18.22% | -17.60% | 17.73% | 19.12% | 27.40% |
| Ratios/Supplemental Data | |||||
| Net Assets, End of Period (Millions) | $20,490 | $17,363 | $21,841 | $18,957 | $17,337 |
| Ratio of Total Expenses to Average Net Assets | 0.04% | 0.04%2 | 0.04% | 0.04% | 0.04% |
| Ratio of Net Investment Income to Average Net Assets | 1.66% | 1.49% | 1.29% | 1.41% | 1.49% |
| Portfolio Turnover Rate3 | 12% | 14% | 17% | 22% | 16% |
| 1 | Calculated based on average shares outstanding. |
| 2 | The ratio of expenses to average net assets for the period net of reduction from custody fee offset arrangements was 0.04%. |
| 3 | Excludes the value of portfolio securities received or delivered as a result of in-kind purchases or redemptions of the fund’s capital shares, including ETF Creation Units. |
| Institutional Plus Shares | |||||
| For a Share Outstanding Throughout Each Period | Year Ended December 31, | ||||
| 2023 | 2022 | 2021 | 2020 | 2019 | |
| Net Asset Value, Beginning of Period | $253.81 | $312.78 | $269.07 | $229.09 | $182.49 |
| Investment Operations | |||||
| Net Investment Income1 | 4.479 | 3.998 | 4.029 | 2.988 | 3.186 |
| Net Realized and Unrealized Gain (Loss) on Investments | 41.301 | (59.013) | 43.607 | 40.111 | 46.645 |
| Total from Investment Operations | 45.780 | (55.015) | 47.636 | 43.099 | 49.831 |
| Distributions | |||||
| Dividends from Net Investment Income | (4.640) | (3.955) | (3.926) | (3.119) | (3.231) |
| Distributions from Realized Capital Gains | — | — | — | — | — |
| Total Distributions | (4.640) | (3.955) | (3.926) | (3.119) | (3.231) |
| Net Asset Value, End of Period | $294.95 | $253.81 | $312.78 | $269.07 | $229.09 |
| Total Return | 18.22% | -17.60% | 17.75% | 19.13% | 27.40% |
| Ratios/Supplemental Data | |||||
| Net Assets, End of Period (Millions) | $10,573 | $9,146 | $12,638 | $10,172 | $8,846 |
| Ratio of Total Expenses to Average Net Assets | 0.03% | 0.03%2 | 0.03% | 0.03% | 0.03% |
| Ratio of Net Investment Income to Average Net Assets | 1.67% | 1.48% | 1.32% | 1.41% | 1.49% |
| Portfolio Turnover Rate3 | 12% | 14% | 17% | 22% | 16% |
| 1 | Calculated based on average shares outstanding. |
| 2 | The ratio of expenses to average net assets for the period net of reduction from custody fee offset arrangements was 0.03%. |
| 3 | Excludes the value of portfolio securities received or delivered as a result of in-kind purchases or redemptions of the fund’s capital shares, including ETF Creation Units. |
| Level 1 ($000) | Level 2 ($000) | Level 3 ($000) | Total ($000) | |
| Investments | ||||
| Assets | ||||
| Common Stocks | 133,504,067 | — | — | 133,504,067 |
| Temporary Cash Investments | 2,032,914 | — | — | 2,032,914 |
| Total | 135,536,981 | — | — | 135,536,981 |
| Derivative Financial Instruments | ||||
| Assets | ||||
| Futures Contracts1 | 7,219 | — | — | 7,219 |
| Swap Contracts | — | 3,137 | — | 3,137 |
| Total | 7,219 | 3,137 | — | 10,356 |
| Liabilities | ||||
| Futures Contracts1 | 375 | — | — | 375 |
| Swap Contracts | — | 113 | — | 113 |
| Total | 375 | 113 | — | 488 |
| 1 | Includes cumulative appreciation (depreciation) on futures contracts and centrally cleared swaps, if any, as reported in the Schedule of Investments. Only current day’s variation margin is reported within the Statement of Assets and Liabilities. | |||
| Amount ($000) | |
| Paid-in Capital | 4,280,774 |
| Total Distributable Earnings (Loss) | (4,280,774) |
| Amount ($000) | |
| Undistributed Ordinary Income | 29,306 |
| Undistributed Long-Term Gains | — |
| Net Unrealized Gains (Losses) | 32,985,908 |
| Capital Loss Carryforwards | (13,287,990) |
| Qualified Late-Year Losses | — |
| Other Temporary Differences | — |
| Total | 19,727,224 |
| Year Ended December 31, | ||
| 2023 Amount ($000) | 2022 Amount ($000) | |
| Ordinary Income* | 2,062,825 | 1,732,529 |
| Long-Term Capital Gains | — | — |
| Total | 2,062,825 | 1,732,529 |
| * | Includes short-term capital gains, if any. |
| Amount ($000) | |
| Tax Cost | 102,551,073 |
| Gross Unrealized Appreciation | 45,791,683 |
| Gross Unrealized Depreciation | (12,805,775) |
| Net Unrealized Appreciation (Depreciation) | 32,985,908 |
| Year Ended December 31, | |||||
| 2023 | 2022 | ||||
| Amount ($000) | Shares (000) | Amount ($000) | Shares (000) | ||
| Investor Shares | |||||
| Issued | 26,467 | 282 | 35,984 | 380 | |
| Issued in Lieu of Cash Distributions | 6,045 | 65 | 6,214 | 70 | |
| Redeemed | (138,740) | (1,494) | (127,364) | (1,341) | |
| Net Increase (Decrease)—Investor Shares | (106,228) | (1,147) | (85,166) | (891) | |
| ETF Shares | |||||
| Issued | 9,726,067 | 49,586 | 12,638,116 | 65,853 | |
| Issued in Lieu of Cash Distributions | — | — | — | — | |
| Redeemed | (6,629,504) | (34,025) | (12,623,630) | (66,575) | |
| Net Increase (Decrease)—ETF Shares | 3,096,563 | 15,561 | 14,486 | (722) | |
| Admiral Shares | |||||
| Issued | 5,408,237 | 58,050 | 5,970,913 | 63,999 | |
| Issued in Lieu of Cash Distributions | 717,481 | 7,692 | 610,188 | 6,862 | |
| Redeemed | (6,459,518) | (69,419) | (6,522,593) | (69,746) | |
| Net Increase (Decrease)—Admiral Shares | (333,800) | (3,677) | 58,508 | 1,115 | |
| Institutional Shares | |||||
| Issued | 2,724,886 | 29,484 | 2,809,736 | 30,018 | |
| Issued in Lieu of Cash Distributions | 302,453 | 3,242 | 252,294 | 2,838 | |
| Redeemed | (2,786,855) | (29,669) | (3,510,063) | (36,950) | |
| Net Increase (Decrease)—Institutional Shares | 240,484 | 3,057 | (448,033) | (4,094) | |
| Institutional Plus Shares | |||||
| Issued | 658,220 | 2,444 | 1,096,807 | 4,082 | |
| Issued in Lieu of Cash Distributions | 166,571 | 619 | 147,006 | 572 | |
| Redeemed | (874,979) | (3,252) | (2,444,547) | (9,024) | |
| Net Increase (Decrease)—Institutional Plus Shares | (50,188) | (189) | (1,200,734) | (4,370) | |

| Average Annual Total Returns Periods Ended December 31, 2023 | |||||
| One Year | Five Years | Ten Years | Final Value of a $10,000 Investment | ||
|
| Small-Cap Growth Index Fund Investor Shares | 21.28% | 10.41% | 7.73% | $21,053 |
|
| CRSP US Small Cap Growth Index | 21.28 | 10.51 | 7.82 | 21,234 |
|
| Dow Jones U.S. Total Stock Market Float Adjusted Index | 26.06 | 15.05 | 11.40 | 29,422 |
| One Year | Five Years | Ten Years | Final Value of a $10,000 Investment | ||
| Small-Cap Growth Index Fund ETF Shares Net Asset Value | 21.42% | 10.54% | 7.86% | $21,313 | |
| Small-Cap Growth Index Fund ETF Shares Market Price | 21.48 | 10.57 | 7.87 | 21,324 | |
| CRSP US Small Cap Growth Index | 21.28 | 10.51 | 7.82 | 21,234 | |
| Dow Jones U.S. Total Stock Market Float Adjusted Index | 26.06 | 15.05 | 11.40 | 29,422 | |
| Average Annual Total Returns Periods Ended December 31, 2023 | |||||
| One Year | Five Years | Ten Years | Final Value of a $10,000 Investment | ||
| Small-Cap Growth Index Fund Admiral Shares | 21.41% | 10.54% | 7.86% | $21,308 | |
| CRSP US Small Cap Growth Index | 21.28 | 10.51 | 7.82 | 21,234 | |
| Dow Jones U.S. Total Stock Market Float Adjusted Index | 26.06 | 15.05 | 11.40 | 29,422 | |
| One Year | Five Years | Ten Years | Final Value of a $5,000,000 Investment | ||
| Small-Cap Growth Index Fund Institutional Shares | 21.44% | 10.55% | 7.87% | $10,665,400 | |
| CRSP US Small Cap Growth Index | 21.28 | 10.51 | 7.82 | 10,617,188 | |
| Dow Jones U.S. Total Stock Market Float Adjusted Index | 26.06 | 15.05 | 11.40 | 14,710,990 | |
| Cumulative Returns of ETF Shares: December 31, 2013, Through December 31, 2023 | |||
| One Year | Five Years | Ten Years | |
| Small-Cap Growth Index Fund ETF Shares Market Price | 21.48% | 65.26% | 113.24% |
| Small-Cap Growth Index Fund ETF Shares Net Asset Value | 21.42 | 65.06 | 113.13 |
| CRSP US Small Cap Growth Index | 21.28 | 64.85 | 112.34 |
| Basic Materials | 2.0% |
| Consumer Discretionary | 16.2 |
| Consumer Staples | 3.2 |
| Energy | 6.1 |
| Financials | 4.9 |
| Health Care | 17.6 |
| Industrials | 19.1 |
| Real Estate | 5.6 |
| Technology | 22.4 |
| Telecommunications | 1.5 |
| Utilities | 1.4 |
| Shares | Market Value• ($000) | |||||
| Temporary Cash Investments (2.2%) | ||||||
| Money Market Fund (2.2%) | ||||||
| 3,4 | Vanguard Market Liquidity Fund, 5.435% (Cost $728,374) | 7,286,285 | 728,483 | |||
| Total Investments (101.9%) (Cost $26,720,486) | 33,017,733 | |||||
| Other Assets and Liabilities—Net (-1.9%) | (620,138) | |||||
| Net Assets (100%) | 32,397,595 | |||||
| Cost is in $000. |
| • | See Note A in Notes to Financial Statements. |
| * | Non-income-producing security. |
| 1 | Includes partial security positions on loan to broker-dealers. The total value of securities on loan is $561,906,000. |
| 2 | Security value determined using significant unobservable inputs. |
| 3 | Affiliated money market fund available only to Vanguard funds and certain trusts and accounts managed by Vanguard. Rate shown is the 7-day yield. |
| 4 | Collateral of $629,622,000 was received for securities on loan. |
| Futures Contracts | ||||
| ($000) | ||||
| Expiration | Number of Long (Short) Contracts | Notional Amount | Value and Unrealized Appreciation (Depreciation) | |
| Long Futures Contracts | ||||
| E-mini Russell 2000 Index | March 2024 | 462 | 47,302 | 731 |
| Over-the-Counter Total Return Swaps | ||||||
| Reference Entity | Termination Date | Counterparty | Notional Amount ($000) | Floating Interest Rate Received (Paid)1 (%) | Value and Unrealized Appreciation ($000) | Value and Unrealized (Depreciation) ($000) |
| C3.ai Inc. Class A | 1/31/24 | GSI | 11,939 | (5.332) | — | (218) |
| Elastic NV | 8/30/24 | BANA | 3,214 | (5.332) | 1,280 | — |
| Fisker Inc. Class A | 1/31/24 | GSI | 1,296 | (5.331) | 102 | — |
| MicroStrategy Inc. Class A | 1/31/24 | CITNA | 10,713 | (5.332) | 2,822 | — |
| Middleby Corp. | 8/30/24 | BANA | 3,534 | (5.332) | 572 | — |
| Novocure Ltd. | 8/30/24 | BANA | 2,209 | (5.332) | 470 | — |
| Super Micro Computer Inc. | 1/31/24 | CITNA | 10,939 | (5.332) | 386 | — |
| Watsco Inc. | 8/30/24 | BANA | 7,645 | (5.332) | 893 | — |
| Watsco Inc. | 8/30/24 | BANA | 7,645 | (5.332) | 893 | — |
| Wolfspeed Inc. | 8/30/24 | BANA | 3,686 | (5.332) | 650 | — |
| 8,068 | (218) | |||||
| 1 | Based on USD Overnight Bank Funding Rate as of the most recent reset date. Floating interest payment received/paid monthly. |
| BANA—Bank of America, N.A. | |
| CITNA—Citibank, N.A. | |
| GSI—Goldman Sachs International. |
| ($000s, except shares, footnotes, and per-share amounts) | Amount |
| Assets | |
| Investments in Securities, at Value1 | |
| Unaffiliated Issuers (Cost $25,992,112) | 32,289,250 |
| Affiliated Issuers (Cost $728,374) | 728,483 |
| Total Investments in Securities | 33,017,733 |
| Investment in Vanguard | 962 |
| Cash Collateral Pledged—Futures Contracts | 3,140 |
| Cash Collateral Pledged—Over-the-Counter Swap Contracts | 40 |
| Receivables for Investment Securities Sold | 29,616 |
| Receivables for Accrued Income | 18,978 |
| Receivables for Capital Shares Issued | 13,525 |
| Unrealized Appreciation—Over-the-Counter Swap Contracts | 8,068 |
| Total Assets | 33,092,062 |
| Liabilities | |
| Due to Custodian | 27,806 |
| Payables for Investment Securities Purchased | 9,321 |
| Collateral for Securities on Loan | 629,622 |
| Payables for Capital Shares Redeemed | 25,757 |
| Payables to Vanguard | 982 |
| Variation Margin Payable—Futures Contracts | 761 |
| Unrealized Depreciation—Over-the-Counter Swap Contracts | 218 |
| Total Liabilities | 694,467 |
| Net Assets | 32,397,595 |
| 1 Includes $561,906,000 of securities on loan. | |
| Statement of Assets and Liabilities (continued) | |
| At December 31, 2023, net assets consisted of: | |
| ($000s, except shares, footnotes, and per-share amounts) | Amount |
| Paid-in Capital | 32,928,611 |
| Total Distributable Earnings (Loss) | (531,016) |
| Net Assets | 32,397,595 |
| Investor Shares—Net Assets | |
| Applicable to 1,316,714 outstanding $.001 par value shares of beneficial interest (unlimited authorization) | 89,484 |
| Net Asset Value Per Share—Investor Shares | $67.96 |
| ETF Shares—Net Assets | |
| Applicable to 64,320,925 outstanding $.001 par value shares of beneficial interest (unlimited authorization) | 15,546,221 |
| Net Asset Value Per Share—ETF Shares | $241.70 |
| Admiral Shares—Net Assets | |
| Applicable to 156,507,375 outstanding $.001 par value shares of beneficial interest (unlimited authorization) | 13,300,222 |
| Net Asset Value Per Share—Admiral Shares | $84.98 |
| Institutional Shares—Net Assets | |
| Applicable to 50,865,473 outstanding $.001 par value shares of beneficial interest (unlimited authorization) | 3,461,668 |
| Net Asset Value Per Share—Institutional Shares | $68.06 |
| Year Ended December 31, 2023 | |
| ($000) | |
| Investment Income | |
| Income | |
| Dividends1 | 164,122 |
| Interest2 | 2,226 |
| Securities Lending—Net | 45,193 |
| Total Income | 211,541 |
| Expenses | |
| The Vanguard Group—Note B | |
| Investment Advisory Services | 630 |
| Management and Administrative—Investor Shares | 154 |
| Management and Administrative—ETF Shares | 7,779 |
| Management and Administrative—Admiral Shares | 7,508 |
| Management and Administrative—Institutional Shares | 1,597 |
| Marketing and Distribution—Investor Shares | 5 |
| Marketing and Distribution—ETF Shares | 760 |
| Marketing and Distribution—Admiral Shares | 579 |
| Marketing and Distribution—Institutional Shares | 108 |
| Custodian Fees | 216 |
| Auditing Fees | 38 |
| Shareholders’ Reports—Investor Shares | — |
| Shareholders’ Reports—ETF Shares | 513 |
| Shareholders’ Reports—Admiral Shares | 156 |
| Shareholders’ Reports—Institutional Shares | 100 |
| Trustees’ Fees and Expenses | 17 |
| Other Expenses | 23 |
| Total Expenses | 20,183 |
| Net Investment Income | 191,358 |
| Realized Net Gain (Loss) | |
| Investment Securities Sold2,3 | (914,715) |
| Futures Contracts | (326) |
| Swap Contracts | (18,542) |
| Realized Net Gain (Loss) | (933,583) |
| Statement of Operations (continued) | |
| Year Ended December 31, 2023 | |
| ($000) | |
| Change in Unrealized Appreciation (Depreciation) | |
| Investment Securities2 | 6,403,205 |
| Futures Contracts | 587 |
| Swap Contracts | 11,128 |
| Change in Unrealized Appreciation (Depreciation) | 6,414,920 |
| Net Increase (Decrease) in Net Assets Resulting from Operations | 5,672,695 |
| 1 | Dividends are net of foreign withholding taxes of $107,000. |
| 2 | Interest income, realized net gain (loss), capital gain distributions received, and change in unrealized appreciation (depreciation) from an affiliated company of the fund were $2,156,000, ($52,000), $1,000, and ($63,000), respectively. Purchases and sales are for temporary cash investment purposes. |
| 3 | Includes $1,429,578,000 of net gain (loss) resulting from in-kind redemptions. |
| Year Ended December 31, | ||
| 2023 ($000) | 2022 ($000) | |
| Increase (Decrease) in Net Assets | ||
| Operations | ||
| Net Investment Income | 191,358 | 211,970 |
| Realized Net Gain (Loss) | (933,583) | (631,355) |
| Change in Unrealized Appreciation (Depreciation) | 6,414,920 | (10,014,591) |
| Net Increase (Decrease) in Net Assets Resulting from Operations | 5,672,695 | (10,433,976) |
| Distributions | ||
| Investor Shares | (527) | (378) |
| ETF Shares | (102,224) | (65,152) |
| Admiral Shares | (91,073) | (62,927) |
| Institutional Shares | (23,803) | (16,002) |
| Total Distributions | (217,627) | (144,459) |
| Capital Share Transactions | ||
| Investor Shares | (6,467) | (30,485) |
| ETF Shares | 962,195 | 383,979 |
| Admiral Shares | (478,614) | (400,974) |
| Institutional Shares | (67,568) | 230,883 |
| Net Increase (Decrease) from Capital Share Transactions | 409,546 | 183,403 |
| Total Increase (Decrease) | 5,864,614 | (10,395,032) |
| Net Assets | ||
| Beginning of Period | 26,532,981 | 36,928,013 |
| End of Period | 32,397,595 | 26,532,981 |
| Investor Shares | |||||
| For a Share Outstanding Throughout Each Period | Year Ended December 31, | ||||
| 2023 | 2022 | 2021 | 2020 | 2019 | |
| Net Asset Value, Beginning of Period | $56.38 | $79.21 | $75.20 | $55.89 | $42.36 |
| Investment Operations | |||||
| Net Investment Income1 | .326 | .371 | .257 | .241 | .178 |
| Net Realized and Unrealized Gain (Loss) on Investments | 11.639 | (22.943) | 3.938 | 19.331 | 13.617 |
| Total from Investment Operations | 11.965 | (22.572) | 4.195 | 19.572 | 13.795 |
| Distributions | |||||
| Dividends from Net Investment Income | (.385) | (.258) | (.185) | (.262) | (.265) |
| Distributions from Realized Capital Gains | — | — | — | — | — |
| Total Distributions | (.385) | (.258) | (.185) | (.262) | (.265) |
| Net Asset Value, End of Period | $67.96 | $56.38 | $79.21 | $75.20 | $55.89 |
| Total Return2 | 21.28% | -28.49% | 5.58% | 35.12% | 32.60% |
| Ratios/Supplemental Data | |||||
| Net Assets, End of Period (Millions) | $89 | $80 | $149 | $209 | $171 |
| Ratio of Total Expenses to Average Net Assets | 0.19% | 0.19%3 | 0.19% | 0.19% | 0.19% |
| Ratio of Net Investment Income to Average Net Assets | 0.53% | 0.60% | 0.32% | 0.42% | 0.35% |
| Portfolio Turnover Rate4 | 19% | 24% | 29% | 24% | 18% |
| 1 | Calculated based on average shares outstanding. |
| 2 | Total returns do not include account service fees that may have applied in the periods shown. Fund prospectuses provide information about any applicable account service fees. |
| 3 | The ratio of expenses to average net assets for the period net of reduction from custody fee offset arrangements was 0.19%. |
| 4 | Excludes the value of portfolio securities received or delivered as a result of in-kind purchases or redemptions of the fund’s capital shares, including ETF Creation Units. |
| ETF Shares | |||||
| For a Share Outstanding Throughout Each Period | Year Ended December 31, | ||||
| 2023 | 2022 | 2021 | 2020 | 2019 | |
| Net Asset Value, Beginning of Period | $200.53 | $281.61 | $267.36 | $198.68 | $150.57 |
| Investment Operations | |||||
| Net Investment Income1 | 1.449 | 1.623 | 1.291 | 1.129 | 1.175 |
| Net Realized and Unrealized Gain (Loss) on Investments | 41.356 | (81.603) | 13.975 | 68.729 | 48.077 |
| Total from Investment Operations | 42.805 | (79.980) | 15.266 | 69.858 | 49.252 |
| Distributions | |||||
| Dividends from Net Investment Income | (1.635) | (1.100) | (1.016) | (1.178) | (1.142) |
| Distributions from Realized Capital Gains | — | — | — | — | — |
| Total Distributions | (1.635) | (1.100) | (1.016) | (1.178) | (1.142) |
| Net Asset Value, End of Period | $241.70 | $200.53 | $281.61 | $267.36 | $198.68 |
| Total Return | 21.42% | -28.40% | 5.71% | 35.29% | 32.75% |
| Ratios/Supplemental Data | |||||
| Net Assets, End of Period (Millions) | $15,546 | $12,036 | $16,379 | $14,436 | $9,833 |
| Ratio of Total Expenses to Average Net Assets | 0.07% | 0.07%2 | 0.07% | 0.07% | 0.07% |
| Ratio of Net Investment Income to Average Net Assets | 0.66% | 0.74% | 0.45% | 0.55% | 0.64% |
| Portfolio Turnover Rate3 | 19% | 24% | 29% | 24% | 18% |
| 1 | Calculated based on average shares outstanding. |
| 2 | The ratio of expenses to average net assets for the period net of reduction from custody fee offset arrangements was 0.07%. |
| 3 | Excludes the value of portfolio securities received or delivered as a result of in-kind purchases or redemptions of the fund’s capital shares, including ETF Creation Units. |
| Admiral Shares | |||||
| For a Share Outstanding Throughout Each Period | Year Ended December 31, | ||||
| 2023 | 2022 | 2021 | 2020 | 2019 | |
| Net Asset Value, Beginning of Period | $70.51 | $99.01 | $94.02 | $69.87 | $52.95 |
| Investment Operations | |||||
| Net Investment Income1 | .503 | .568 | .448 | .392 | .419 |
| Net Realized and Unrealized Gain (Loss) on Investments | 14.542 | (28.682) | 4.899 | 24.172 | 16.902 |
| Total from Investment Operations | 15.045 | (28.114) | 5.347 | 24.564 | 17.321 |
| Distributions | |||||
| Dividends from Net Investment Income | (.575) | (.386) | (.357) | (.414) | (.401) |
| Distributions from Realized Capital Gains | — | — | — | — | — |
| Total Distributions | (.575) | (.386) | (.357) | (.414) | (.401) |
| Net Asset Value, End of Period | $84.98 | $70.51 | $99.01 | $94.02 | $69.87 |
| Total Return2 | 21.41% | -28.39% | 5.69% | 35.30% | 32.76% |
| Ratios/Supplemental Data | |||||
| Net Assets, End of Period (Millions) | $13,300 | $11,482 | $16,594 | $16,149 | $12,717 |
| Ratio of Total Expenses to Average Net Assets | 0.07% | 0.07%3 | 0.07% | 0.07% | 0.07% |
| Ratio of Net Investment Income to Average Net Assets | 0.65% | 0.73% | 0.45% | 0.54% | 0.65% |
| Portfolio Turnover Rate4 | 19% | 24% | 29% | 24% | 18% |
| 1 | Calculated based on average shares outstanding. |
| 2 | Total returns do not include account service fees that may have applied in the periods shown. Fund prospectuses provide information about any applicable account service fees. |
| 3 | The ratio of expenses to average net assets for the period net of reduction from custody fee offset arrangements was 0.07%. |
| 4 | Excludes the value of portfolio securities received or delivered as a result of in-kind purchases or redemptions of the fund’s capital shares, including ETF Creation Units. |
| Institutional Shares | |||||
| For a Share Outstanding Throughout Each Period | Year Ended December 31, | ||||
| 2023 | 2022 | 2021 | 2020 | 2019 | |
| Net Asset Value, Beginning of Period | $56.46 | $79.29 | $75.29 | $55.95 | $42.40 |
| Investment Operations | |||||
| Net Investment Income1 | .410 | .465 | .367 | .319 | .327 |
| Net Realized and Unrealized Gain (Loss) on Investments | 11.656 | (22.979) | 3.927 | 19.358 | 13.550 |
| Total from Investment Operations | 12.066 | (22.514) | 4.294 | 19.677 | 13.877 |
| Distributions | |||||
| Dividends from Net Investment Income | (.466) | (.316) | (.294) | (.337) | (.327) |
| Distributions from Realized Capital Gains | — | — | — | — | — |
| Total Distributions | (.466) | (.316) | (.294) | (.337) | (.327) |
| Net Asset Value, End of Period | $68.06 | $56.46 | $79.29 | $75.29 | $55.95 |
| Total Return | 21.44% | -28.39% | 5.70% | 35.31% | 32.77% |
| Ratios/Supplemental Data | |||||
| Net Assets, End of Period (Millions) | $3,462 | $2,935 | $3,805 | $3,676 | $3,218 |
| Ratio of Total Expenses to Average Net Assets | 0.06% | 0.06%2 | 0.06% | 0.06% | 0.06% |
| Ratio of Net Investment Income to Average Net Assets | 0.66% | 0.75% | 0.46% | 0.55% | 0.64% |
| Portfolio Turnover Rate3 | 19% | 24% | 29% | 24% | 18% |
| 1 | Calculated based on average shares outstanding. |
| 2 | The ratio of expenses to average net assets for the period net of reduction from custody fee offset arrangements was 0.06%. |
| 3 | Excludes the value of portfolio securities received or delivered as a result of in-kind purchases or redemptions of the fund’s capital shares, including ETF Creation Units. |
| Level 1 ($000) | Level 2 ($000) | Level 3 ($000) | Total ($000) | |
| Investments | ||||
| Assets | ||||
| Common Stocks | 32,289,250 | — | — | 32,289,250 |
| Temporary Cash Investments | 728,483 | — | — | 728,483 |
| Total | 33,017,733 | — | — | 33,017,733 |
| Derivative Financial Instruments | ||||
| Assets | ||||
| Futures Contracts1 | 731 | — | — | 731 |
| Swap Contracts | — | 8,068 | — | 8,068 |
| Total | 731 | 8,068 | — | 8,799 |
| Liabilities | ||||
| Swap Contracts | — | 218 | — | 218 |
| 1 | Includes cumulative appreciation (depreciation) on futures contracts and centrally cleared swaps, if any, as reported in the Schedule of Investments. Only current day’s variation margin is reported within the Statement of Assets and Liabilities. | |||
| Amount ($000) | |
| Paid-in Capital | 1,429,007 |
| Total Distributable Earnings (Loss) | (1,429,007) |
| Amount ($000) | |
| Undistributed Ordinary Income | 23,673 |
| Undistributed Long-Term Gains | — |
| Net Unrealized Gains (Losses) | 6,179,351 |
| Capital Loss Carryforwards | (6,734,040) |
| Qualified Late-Year Losses | — |
| Other Temporary Differences | — |
| Total | (531,016) |
| Year Ended December 31, | ||
| 2023 Amount ($000) | 2022 Amount ($000) | |
| Ordinary Income* | 217,627 | 144,459 |
| Long-Term Capital Gains | — | — |
| Total | 217,627 | 144,459 |
| * | Includes short-term capital gains, if any. |
| Amount ($000) | |
| Tax Cost | 26,838,382 |
| Gross Unrealized Appreciation | 9,733,509 |
| Gross Unrealized Depreciation | (3,554,158) |
| Net Unrealized Appreciation (Depreciation) | 6,179,351 |
| Year Ended December 31, | |||||
| 2023 | 2022 | ||||
| Amount ($000) | Shares (000) | Amount ($000) | Shares (000) | ||
| Investor Shares | |||||
| Issued | 11,145 | 181 | 11,003 | 172 | |
| Issued in Lieu of Cash Distributions | 527 | 8 | 378 | 7 | |
| Redeemed | (18,139) | (295) | (41,866) | (639) | |
| Net Increase (Decrease)—Investor Shares | (6,467) | (106) | (30,485) | (460) | |
| ETF Shares | |||||
| Issued | 3,836,013 | 17,299 | 4,457,870 | 20,609 | |
| Issued in Lieu of Cash Distributions | — | — | — | — | |
| Redeemed | (2,873,818) | (13,000) | (4,073,891) | (18,750) | |
| Net Increase (Decrease)—ETF Shares | 962,195 | 4,299 | 383,979 | 1,859 | |
| Admiral Shares | |||||
| Issued | 1,365,432 | 17,594 | 1,685,175 | 21,680 | |
| Issued in Lieu of Cash Distributions | 80,962 | 1,033 | 56,168 | 800 | |
| Redeemed | (1,925,008) | (24,971) | (2,142,317) | (27,226) | |
| Net Increase (Decrease)—Admiral Shares | (478,614) | (6,344) | (400,974) | (4,746) | |
| Institutional Shares | |||||
| Issued | 507,362 | 8,187 | 652,486 | 10,669 | |
| Issued in Lieu of Cash Distributions | 22,149 | 353 | 14,928 | 265 | |
| Redeemed | (597,079) | (9,656) | (436,531) | (6,944) | |
| Net Increase (Decrease)—Institutional Shares | (67,568) | (1,116) | 230,883 | 3,990 | |

| Average Annual Total Returns Periods Ended December 31, 2023 | |||||
| One Year | Five Years | Ten Years | Final Value of a $10,000 Investment | ||
|
| Small-Cap Value Index Fund Investor Shares | 15.86% | 11.72% | 8.36% | $22,324 |
|
| CRSP US Small Cap Value Index | 15.91 | 11.84 | 8.50 | 22,604 |
|
| Dow Jones U.S. Total Stock Market Float Adjusted Index | 26.06 | 15.05 | 11.40 | 29,422 |
| One Year | Five Years | Ten Years | Final Value of a $10,000 Investment | ||
| Small-Cap Value Index Fund ETF Shares Net Asset Value | 16.00% | 11.85% | 8.49% | $22,595 | |
| Small-Cap Value Index Fund ETF Shares Market Price | 16.08 | 11.87 | 8.50 | 22,605 | |
| CRSP US Small Cap Value Index | 15.91 | 11.84 | 8.50 | 22,604 | |
| Dow Jones U.S. Total Stock Market Float Adjusted Index | 26.06 | 15.05 | 11.40 | 29,422 | |
| Average Annual Total Returns Periods Ended December 31, 2023 | |||||
| One Year | Five Years | Ten Years | Final Value of a $10,000 Investment | ||
| Small-Cap Value Index Fund Admiral Shares | 15.99% | 11.85% | 8.49% | $22,596 | |
| CRSP US Small Cap Value Index | 15.91 | 11.84 | 8.50 | 22,604 | |
| Dow Jones U.S. Total Stock Market Float Adjusted Index | 26.06 | 15.05 | 11.40 | 29,422 | |
| One Year | Five Years | Ten Years | Final Value of a $5,000,000 Investment | ||
| Small-Cap Value Index Fund Institutional Shares | 15.99% | 11.87% | 8.51% | $11,311,030 | |
| CRSP US Small Cap Value Index | 15.91 | 11.84 | 8.50 | 11,301,929 | |
| Dow Jones U.S. Total Stock Market Float Adjusted Index | 26.06 | 15.05 | 11.40 | 14,710,990 | |
| Cumulative Returns of ETF Shares: December 31, 2013, Through December 31, 2023 | |||
| One Year | Five Years | Ten Years | |
| Small-Cap Value Index Fund ETF Shares Market Price | 16.08% | 75.19% | 126.05% |
| Small-Cap Value Index Fund ETF Shares Net Asset Value | 16.00 | 75.06 | 125.95 |
| CRSP US Small Cap Value Index | 15.91 | 74.96 | 126.04 |
| Basic Materials | 5.3% |
| Consumer Discretionary | 16.1 |
| Consumer Staples | 3.0 |
| Energy | 4.7 |
| Financials | 21.2 |
| Health Care | 6.0 |
| Industrials | 23.8 |
| Real Estate | 9.0 |
| Technology | 5.7 |
| Telecommunications | 1.1 |
| Utilities | 4.1 |
| Shares | Market Value• ($000) | |||||
| Temporary Cash Investments (1.0%) | ||||||
| Money Market Fund (1.0%) | ||||||
| 3,4 | Vanguard Market Liquidity Fund, 5.435% (Cost $538,297) | 5,386,280 | 538,520 | |||
| Total Investments (100.7%) (Cost $41,336,825) | 52,489,087 | |||||
| Other Assets and Liabilities—Net (-0.7%) | (356,550) | |||||
| Net Assets (100%) | 52,132,537 | |||||
| Cost is in $000. |
| • | See Note A in Notes to Financial Statements. |
| * | Non-income-producing security. |
| 1 | Includes partial security positions on loan to broker-dealers. The total value of securities on loan is $359,227,000. |
| 2 | Security value determined using significant unobservable inputs. |
| 3 | Affiliated money market fund available only to Vanguard funds and certain trusts and accounts managed by Vanguard. Rate shown is the 7-day yield. |
| 4 | Collateral of $392,410,000 was received for securities on loan, of which $390,365,000 is held in Vanguard Market Liquidity Fund and $2,045,000 is held in cash. |
| REIT—Real Estate Investment Trust. |
| Futures Contracts | ||||
| ($000) | ||||
| Expiration | Number of Long (Short) Contracts | Notional Amount | Value and Unrealized Appreciation (Depreciation) | |
| Long Futures Contracts | ||||
| E-mini Russell 2000 Index | March 2024 | 609 | 62,352 | 1,515 |
| Over-the-Counter Total Return Swaps | ||||||
| Reference Entity | Termination Date | Counterparty | Notional Amount ($000) | Floating Interest Rate Received (Paid)1 (%) | Value and Unrealized Appreciation ($000) | Value and Unrealized (Depreciation) ($000) |
| Atmos Energy Corp. | 1/31/24 | CITNA | 21,396 | (5.332) | 455 | — |
| Blackstone Mortgage Trust Inc. Class A | 1/31/24 | GSI | 10,776 | (5.331) | — | (286) |
| Bridgebio Pharma Inc. | 8/30/24 | BANA | 8,613 | (5.332) | 3,462 | — |
| Dick's Sporting Goods Inc. | 1/31/24 | CITNA | 33,826 | (5.332) | 4,501 | — |
| Over-the-Counter Total Return Swaps (continued) | ||||||
| Reference Entity | Termination Date | Counterparty | Notional Amount ($000) | Floating Interest Rate Received (Paid)1 (%) | Value and Unrealized Appreciation ($000) | Value and Unrealized (Depreciation) ($000) |
| Invesco Ltd. | 8/30/24 | BANA | 2,283 | (5.882) | 593 | — |
| Williams-Sonoma Inc. | 1/31/24 | CITNA | 42,197 | (5.332) | 3,029 | — |
| 12,040 | (286) | |||||
| 1 | Based on USD Overnight Bank Funding Rate as of the most recent reset date. Floating interest payment received/paid monthly. |
| BANA—Bank of America, N.A. | |
| CITNA—Citibank, N.A. | |
| GSI—Goldman Sachs International. |
| ($000s, except shares, footnotes, and per-share amounts) | Amount |
| Assets | |
| Investments in Securities, at Value1 | |
| Unaffiliated Issuers (Cost $40,798,528) | 51,950,567 |
| Affiliated Issuers (Cost $538,297) | 538,520 |
| Total Investments in Securities | 52,489,087 |
| Investment in Vanguard | 1,574 |
| Cash | 11,200 |
| Cash Collateral Pledged—Futures Contracts | 4,740 |
| Receivables for Investment Securities Sold | 1,144 |
| Receivables for Accrued Income | 82,910 |
| Receivables for Capital Shares Issued | 16,657 |
| Unrealized Appreciation—Over-the-Counter Swap Contracts | 12,040 |
| Total Assets | 52,619,352 |
| Liabilities | |
| Payables for Investment Securities Purchased | 48,865 |
| Collateral for Securities on Loan | 392,410 |
| Payables for Capital Shares Redeemed | 42,520 |
| Payables to Vanguard | 1,584 |
| Variation Margin Payable—Futures Contracts | 1,150 |
| Unrealized Depreciation—Over-the-Counter Swap Contracts | 286 |
| Total Liabilities | 486,815 |
| Net Assets | 52,132,537 |
| 1 Includes $359,227,000 of securities on loan. | |
| Statement of Assets and Liabilities (continued) | |
| At December 31, 2023, net assets consisted of: | |
| ($000s, except shares, footnotes, and per-share amounts) | Amount |
| Paid-in Capital | 46,586,540 |
| Total Distributable Earnings (Loss) | 5,545,997 |
| Net Assets | 52,132,537 |
| Investor Shares—Net Assets | |
| Applicable to 2,599,931 outstanding $.001 par value shares of beneficial interest (unlimited authorization) | 112,230 |
| Net Asset Value Per Share—Investor Shares | $43.17 |
| ETF Shares—Net Assets | |
| Applicable to 150,202,313 outstanding $.001 par value shares of beneficial interest (unlimited authorization) | 27,035,796 |
| Net Asset Value Per Share—ETF Shares | $180.00 |
| Admiral Shares—Net Assets | |
| Applicable to 251,099,300 outstanding $.001 par value shares of beneficial interest (unlimited authorization) | 19,420,612 |
| Net Asset Value Per Share—Admiral Shares | $77.34 |
| Institutional Shares—Net Assets | |
| Applicable to 128,703,159 outstanding $.001 par value shares of beneficial interest (unlimited authorization) | 5,563,899 |
| Net Asset Value Per Share—Institutional Shares | $43.23 |
| Year Ended December 31, 2023 | |
| ($000) | |
| Investment Income | |
| Income | |
| Dividends1 | 1,076,362 |
| Interest2 | 3,805 |
| Securities Lending—Net | 60,848 |
| Total Income | 1,141,015 |
| Expenses | |
| The Vanguard Group—Note B | |
| Investment Advisory Services | 1,036 |
| Management and Administrative—Investor Shares | 222 |
| Management and Administrative—ETF Shares | 14,071 |
| Management and Administrative—Admiral Shares | 10,699 |
| Management and Administrative—Institutional Shares | 2,534 |
| Marketing and Distribution—Investor Shares | 7 |
| Marketing and Distribution—ETF Shares | 1,319 |
| Marketing and Distribution—Admiral Shares | 903 |
| Marketing and Distribution—Institutional Shares | 185 |
| Custodian Fees | 645 |
| Auditing Fees | 39 |
| Shareholders’ Reports—Investor Shares | — |
| Shareholders’ Reports—ETF Shares | 912 |
| Shareholders’ Reports—Admiral Shares | 225 |
| Shareholders’ Reports—Institutional Shares | 125 |
| Trustees’ Fees and Expenses | 28 |
| Other Expenses | 23 |
| Total Expenses | 32,973 |
| Expenses Paid Indirectly | (2) |
| Net Expenses | 32,971 |
| Net Investment Income | 1,108,044 |
| Realized Net Gain (Loss) | |
| Investment Securities Sold2,3 | 1,307,965 |
| Futures Contracts | 2,858 |
| Swap Contracts | 19,299 |
| Realized Net Gain (Loss) | 1,330,122 |
| Statement of Operations (continued) | |
| Year Ended December 31, 2023 | |
| ($000) | |
| Change in Unrealized Appreciation (Depreciation) | |
| Investment Securities2 | 4,732,301 |
| Futures Contracts | 874 |
| Swap Contracts | 13,781 |
| Change in Unrealized Appreciation (Depreciation) | 4,746,956 |
| Net Increase (Decrease) in Net Assets Resulting from Operations | 7,185,122 |
| 1 | Dividends are net of foreign withholding taxes of $79,000. |
| 2 | Interest income, realized net gain (loss), capital gain distributions received, and change in unrealized appreciation (depreciation) from an affiliated company of the fund were $3,634,000, $28,000, $1,000, and $142,000, respectively. Purchases and sales are for temporary cash investment purposes. |
| 3 | Includes $2,717,640,000 of net gain (loss) resulting from in-kind redemptions. |
| Year Ended December 31, | ||
| 2023 ($000) | 2022 ($000) | |
| Increase (Decrease) in Net Assets | ||
| Operations | ||
| Net Investment Income | 1,108,044 | 937,395 |
| Realized Net Gain (Loss) | 1,330,122 | 2,870,695 |
| Change in Unrealized Appreciation (Depreciation) | 4,746,956 | (8,621,190) |
| Net Increase (Decrease) in Net Assets Resulting from Operations | 7,185,122 | (4,813,100) |
| Distributions | ||
| Investor Shares | (2,615) | (2,947) |
| ETF Shares | (573,501) | (477,621) |
| Admiral Shares | (412,279) | (352,210) |
| Institutional Shares | (118,067) | (91,664) |
| Total Distributions | (1,106,462) | (924,442) |
| Capital Share Transactions | ||
| Investor Shares | (51,145) | (38,171) |
| ETF Shares | 124,360 | (34,278) |
| Admiral Shares | (361,227) | 363,608 |
| Institutional Shares | 105,555 | 581,216 |
| Net Increase (Decrease) from Capital Share Transactions | (182,457) | 872,375 |
| Total Increase (Decrease) | 5,896,203 | (4,865,167) |
| Net Assets | ||
| Beginning of Period | 46,236,334 | 51,101,501 |
| End of Period | 52,132,537 | 46,236,334 |
| Investor Shares | |||||
| For a Share Outstanding Throughout Each Period | Year Ended December 31, | ||||
| 2023 | 2022 | 2021 | 2020 | 2019 | |
| Net Asset Value, Beginning of Period | $38.09 | $42.87 | $34.08 | $32.86 | $27.35 |
| Investment Operations | |||||
| Net Investment Income1 | .855 | .722 | .724 | .550 | .543 |
| Net Realized and Unrealized Gain (Loss) on Investments | 5.089 | (4.777) | 8.767 | 1.208 | 5.608 |
| Total from Investment Operations | 5.944 | (4.055) | 9.491 | 1.758 | 6.151 |
| Distributions | |||||
| Dividends from Net Investment Income | (.864) | (.725) | (.701) | (.538) | (.641) |
| Distributions from Realized Capital Gains | — | — | — | — | — |
| Total Distributions | (.864) | (.725) | (.701) | (.538) | (.641) |
| Net Asset Value, End of Period | $43.17 | $38.09 | $42.87 | $34.08 | $32.86 |
| Total Return2 | 15.86% | -9.43% | 27.96% | 5.72% | 22.61% |
| Ratios/Supplemental Data | |||||
| Net Assets, End of Period (Millions) | $112 | $149 | $208 | $234 | $255 |
| Ratio of Total Expenses to Average Net Assets | 0.19%3 | 0.19%3 | 0.19% | 0.19% | 0.19% |
| Ratio of Net Investment Income to Average Net Assets | 2.18% | 1.83% | 1.78% | 1.98% | 1.76% |
| Portfolio Turnover Rate4 | 16% | 13% | 16% | 26% | 19% |
| 1 | Calculated based on average shares outstanding. |
| 2 | Total returns do not include account service fees that may have applied in the periods shown. Fund prospectuses provide information about any applicable account service fees. |
| 3 | The ratio of expenses to average net assets for the period net of reduction from custody fee offset arrangements was 0.19%. |
| 4 | Excludes the value of portfolio securities received or delivered as a result of in-kind purchases or redemptions of the fund’s capital shares, including ETF Creation Units. |
| ETF Shares | |||||
| For a Share Outstanding Throughout Each Period | Year Ended December 31, | ||||
| 2023 | 2022 | 2021 | 2020 | 2019 | |
| Net Asset Value, Beginning of Period | $158.84 | $178.77 | $142.13 | $137.05 | $114.05 |
| Investment Operations | |||||
| Net Investment Income1 | 3.809 | 3.273 | 3.131 | 2.584 | 2.840 |
| Net Realized and Unrealized Gain (Loss) on Investments | 21.159 | (19.975) | 36.640 | 4.884 | 22.984 |
| Total from Investment Operations | 24.968 | (16.702) | 39.771 | 7.468 | 25.824 |
| Distributions | |||||
| Dividends from Net Investment Income | (3.808) | (3.228) | (3.131) | (2.388) | (2.824) |
| Distributions from Realized Capital Gains | — | — | — | — | — |
| Total Distributions | (3.808) | (3.228) | (3.131) | (2.388) | (2.824) |
| Net Asset Value, End of Period | $180.00 | $158.84 | $178.77 | $142.13 | $137.05 |
| Total Return | 16.00% | -9.29% | 28.07% | 5.82% | 22.76% |
| Ratios/Supplemental Data | |||||
| Net Assets, End of Period (Millions) | $27,036 | $23,786 | $26,854 | $17,837 | $14,808 |
| Ratio of Total Expenses to Average Net Assets | 0.07%2 | 0.07%2 | 0.07% | 0.07% | 0.07% |
| Ratio of Net Investment Income to Average Net Assets | 2.33% | 1.99% | 1.84% | 2.23% | 2.19% |
| Portfolio Turnover Rate3 | 16% | 13% | 16% | 26% | 19% |
| 1 | Calculated based on average shares outstanding. |
| 2 | The ratio of expenses to average net assets for the period net of reduction from custody fee offset arrangements was 0.07%. |
| 3 | Excludes the value of portfolio securities received or delivered as a result of in-kind purchases or redemptions of the fund’s capital shares, including ETF Creation Units. |
| Admiral Shares | |||||
| For a Share Outstanding Throughout Each Period | Year Ended December 31, | ||||
| 2023 | 2022 | 2021 | 2020 | 2019 | |
| Net Asset Value, Beginning of Period | $68.25 | $76.81 | $61.07 | $58.89 | $49.01 |
| Investment Operations | |||||
| Net Investment Income1 | 1.630 | 1.403 | 1.381 | 1.058 | 1.230 |
| Net Realized and Unrealized Gain (Loss) on Investments | 9.096 | (8.576) | 15.704 | 2.148 | 9.863 |
| Total from Investment Operations | 10.726 | (7.173) | 17.085 | 3.206 | 11.093 |
| Distributions | |||||
| Dividends from Net Investment Income | (1.636) | (1.387) | (1.345) | (1.026) | (1.213) |
| Distributions from Realized Capital Gains | — | — | — | — | — |
| Total Distributions | (1.636) | (1.387) | (1.345) | (1.026) | (1.213) |
| Net Asset Value, End of Period | $77.34 | $68.25 | $76.81 | $61.07 | $58.89 |
| Total Return2 | 15.99% | -9.31% | 28.09% | 5.85% | 22.76% |
| Ratios/Supplemental Data | |||||
| Net Assets, End of Period (Millions) | $19,421 | $17,505 | $19,307 | $14,314 | $13,907 |
| Ratio of Total Expenses to Average Net Assets | 0.07%3 | 0.07%3 | 0.07% | 0.07% | 0.07% |
| Ratio of Net Investment Income to Average Net Assets | 2.32% | 1.99% | 1.89% | 2.13% | 2.21% |
| Portfolio Turnover Rate4 | 16% | 13% | 16% | 26% | 19% |
| 1 | Calculated based on average shares outstanding. |
| 2 | Total returns do not include account service fees that may have applied in the periods shown. Fund prospectuses provide information about any applicable account service fees. |
| 3 | The ratio of expenses to average net assets for the period net of reduction from custody fee offset arrangements was 0.07%. |
| 4 | Excludes the value of portfolio securities received or delivered as a result of in-kind purchases or redemptions of the fund’s capital shares, including ETF Creation Units. |
| Institutional Shares | |||||
| For a Share Outstanding Throughout Each Period | Year Ended December 31, | ||||
| 2023 | 2022 | 2021 | 2020 | 2019 | |
| Net Asset Value, Beginning of Period | $38.15 | $42.94 | $34.14 | $32.92 | $27.39 |
| Investment Operations | |||||
| Net Investment Income1 | .915 | .796 | .781 | .597 | .684 |
| Net Realized and Unrealized Gain (Loss) on Investments | 5.083 | (4.806) | 8.775 | 1.199 | 5.527 |
| Total from Investment Operations | 5.998 | (4.010) | 9.556 | 1.796 | 6.211 |
| Distributions | |||||
| Dividends from Net Investment Income | (.918) | (.780) | (.756) | (.576) | (.681) |
| Distributions from Realized Capital Gains | — | — | — | — | — |
| Total Distributions | (.918) | (.780) | (.756) | (.576) | (.681) |
| Net Asset Value, End of Period | $43.23 | $38.15 | $42.94 | $34.14 | $32.92 |
| Total Return | 15.99% | -9.31% | 28.11% | 5.86% | 22.81% |
| Ratios/Supplemental Data | |||||
| Net Assets, End of Period (Millions) | $5,564 | $4,797 | $4,733 | $3,774 | $3,632 |
| Ratio of Total Expenses to Average Net Assets | 0.06%2 | 0.06%2 | 0.06% | 0.06% | 0.06% |
| Ratio of Net Investment Income to Average Net Assets | 2.33% | 2.02% | 1.91% | 2.14% | 2.20% |
| Portfolio Turnover Rate3 | 16% | 13% | 16% | 26% | 19% |
| 1 | Calculated based on average shares outstanding. |
| 2 | The ratio of expenses to average net assets for the period net of reduction from custody fee offset arrangements was 0.06%. |
| 3 | Excludes the value of portfolio securities received or delivered as a result of in-kind purchases or redemptions of the fund’s capital shares, including ETF Creation Units. |
| Level 1 ($000) | Level 2 ($000) | Level 3 ($000) | Total ($000) | |
| Investments | ||||
| Assets | ||||
| Common Stocks | 51,950,567 | — | — | 51,950,567 |
| Temporary Cash Investments | 538,520 | — | — | 538,520 |
| Total | 52,489,087 | — | — | 52,489,087 |
| Derivative Financial Instruments | ||||
| Assets | ||||
| Futures Contracts1 | 1,515 | — | — | 1,515 |
| Swap Contracts | — | 12,040 | — | 12,040 |
| Total | 1,515 | 12,040 | — | 13,555 |
| Liabilities | ||||
| Swap Contracts | — | 286 | — | 286 |
| 1 | Includes cumulative appreciation (depreciation) on futures contracts and centrally cleared swaps, if any, as reported in the Schedule of Investments. Only current day’s variation margin is reported within the Statement of Assets and Liabilities. | |||
| Amount ($000) | |
| Paid-in Capital | 2,716,602 |
| Total Distributable Earnings (Loss) | (2,716,602) |
| Amount ($000) | |
| Undistributed Ordinary Income | 41,192 |
| Undistributed Long-Term Gains | — |
| Net Unrealized Gains (Losses) | 11,081,196 |
| Capital Loss Carryforwards | (5,576,391) |
| Qualified Late-Year Losses | — |
| Other Temporary Differences | — |
| Total | 5,545,997 |
| Year Ended December 31, | ||
| 2023 Amount ($000) | 2022 Amount ($000) | |
| Ordinary Income* | 1,106,462 | 924,442 |
| Long-Term Capital Gains | — | — |
| Total | 1,106,462 | 924,442 |
| * | Includes short-term capital gains, if any. |
| Amount ($000) | |
| Tax Cost | 41,407,891 |
| Gross Unrealized Appreciation | 14,466,450 |
| Gross Unrealized Depreciation | (3,385,254) |
| Net Unrealized Appreciation (Depreciation) | 11,081,196 |
| Year Ended December 31, | |||||
| 2023 | 2022 | ||||
| Amount ($000) | Shares (000) | Amount ($000) | Shares (000) | ||
| Investor Shares | |||||
| Issued | 10,700 | 270 | 14,773 | 371 | |
| Issued in Lieu of Cash Distributions | 2,615 | 67 | 2,947 | 78 | |
| Redeemed | (64,460) | (1,642) | (55,891) | (1,394) | |
| Net Increase (Decrease)—Investor Shares | (51,145) | (1,305) | (38,171) | (945) | |
| ETF Shares | |||||
| Issued | 5,641,115 | 34,285 | 8,743,606 | 53,827 | |
| Issued in Lieu of Cash Distributions | — | — | — | — | |
| Redeemed | (5,516,755) | (33,825) | (8,777,884) | (54,300) | |
| Net Increase (Decrease)—ETF Shares | 124,360 | 460 | (34,278) | (473) | |
| Admiral Shares | |||||
| Issued | 2,405,153 | 34,163 | 2,968,180 | 42,013 | |
| Issued in Lieu of Cash Distributions | 360,909 | 5,150 | 309,221 | 4,569 | |
| Redeemed | (3,127,289) | (44,688) | (2,913,793) | (41,449) | |
| Net Increase (Decrease)—Admiral Shares | (361,227) | (5,375) | 363,608 | 5,133 | |
| Institutional Shares | |||||
| Issued | 804,902 | 20,622 | 1,285,688 | 33,018 | |
| Issued in Lieu of Cash Distributions | 113,084 | 2,885 | 87,334 | 2,308 | |
| Redeemed | (812,431) | (20,535) | (791,806) | (19,834) | |
| Net Increase (Decrease)—Institutional Shares | 105,555 | 2,972 | 581,216 | 15,492 | |
Philadelphia, Pennsylvania
February 16, 2024
| Fund | Percentage |
| Small-Cap Index Fund | 65.1% |
| Small-Cap Growth Index Fund | 54.7 |
| Small-Cap Value Index Fund | 68.8 |
| Fund | ($000) |
| Small-Cap Index Fund | 1,421,905 |
| Small-Cap Growth Index Fund | 134,646 |
| Small-Cap Value Index Fund | 823,319 |
| Fund | ($000) |
| Small-Cap Index Fund | 13,346 |
| Small-Cap Growth Index Fund | 810 |
| Small-Cap Value Index Fund | 1,438 |
| Fund | ($000) |
| Small-Cap Index Fund | 352,330 |
| Small-Cap Growth Index Fund | 52,557 |
| Small-Cap Value Index Fund | 172,719 |


Mid-Capitalization Portfolios
| Vanguard Extended Market Index Fund |
| Vanguard Mid-Cap Index Fund |
| Vanguard Mid-Cap Growth Index Fund |
| Vanguard Mid-Cap Value Index Fund |
Your Fund’s Performance at a Glance | 1 |
About Your Fund's Expenses | 2 |
Extended Market Index Fund | 4 |
Mid-Cap Index Fund | 49 |
Mid-Cap Growth Index Fund | 69 |
Mid-Cap Value Index Fund | 86 |
| • | The financial markets delivered robust returns for the 12 months ended December 31, 2023. Returns for the Vanguard Mid-Cap Index Funds ranged from 9.62% (for Investor Shares of the Mid-Cap Value Index Fund) to 23.14% (for Admiral Shares and ETF Shares of the Mid-Cap Growth Index Fund. Returns for ETF Shares are based on net asset value.) Returns for Vanguard Extended Market Index Fund, which holds small- and mid-capitalization stocks, ranged from 25.22% for Investor Shares to 25.44% for Institutional Select Shares. The funds generally tracked their target indexes closely. The Extended Market Index Fund outperformed, thanks to skilled trading and corporate-action elections by the fund’s manager, Vanguard Equity Index Group, in addition to securities lending revenue. |
| • | Major central banks stopped hiking interest rates when inflation eased. Global economic growth proved resilient, but the prospect of rates remaining high for an extended period spurred occasional volatility. Toward year-end, stocks and bonds rallied worldwide as expectations for rate cuts in 2024 rose. |
| • | At the sector level, technology shares contributed most to returns of all the funds’ target indexes, except the CRSP US Mid Cap Value Index, which was powered by industrials. |
| • | For the 10 years ended December 31, the funds’ annualized returns ranged from 8.36% (for Investor Shares of the Mid-Cap Value Index Fund) to 10.12% (for Admiral and ETF Shares of the Mid-Cap Growth Index Fund). The Extended Market Index Fund outperformed its target index, while the other funds closely tracked their indexes. |
| • | Note that the Extended Market Index Fund uses the Global Industry Classification Standard methodology, while the other funds use the Industry Classification Benchmark methodology. |
| Average Annual Total Returns Periods Ended December 31, 2023 | |||
| One Year | Three Years | Five Years | |
| Stocks | |||
| Russell 1000 Index (Large-caps) | 26.53% | 8.97% | 15.52% |
| Russell 2000 Index (Small-caps) | 16.93 | 2.22 | 9.97 |
| Russell 3000 Index (Broad U.S. market) | 25.96 | 8.54 | 15.16 |
| FTSE All-World ex US Index (International) | 15.82 | 1.98 | 7.52 |
| Bonds | |||
| Bloomberg U.S. Aggregate Float Adjusted Index (Broad taxable market) | 5.60% | -3.33% | 1.17% |
| Bloomberg Municipal Bond Index (Broad tax-exempt market) | 6.40 | -0.40 | 2.25 |
| FTSE Three-Month U.S. Treasury Bill Index | 5.26 | 2.24 | 1.91 |
| CPI | |||
| Consumer Price Index | 3.35% | 5.60% | 4.07% |
| • | Based on actual fund return. This section helps you to estimate the actual expenses that you paid over the period. The ”Ending Account Value“ shown is derived from the fund’s actual return, and the third column shows the dollar amount that would have been paid by an investor who started with $1,000 in the fund. You may use the information here, together with the amount you invested, to estimate the expenses that you paid over the period. |
| • | Based on hypothetical 5% yearly return. This section is intended to help you compare your fund‘s costs with those of other mutual funds. It assumes that the fund had a yearly return of 5% before expenses, but that the expense ratio is unchanged. In this case—because the return used is not the fund’s actual return—the results do not apply to your investment. The example is useful in making comparisons because the Securities and Exchange Commission requires all mutual funds to calculate expenses based on a 5% return. You can assess your fund’s costs by comparing this hypothetical example with the hypothetical examples that appear in shareholder reports of other funds. |
| Six Months Ended December 31, 2023 | |||
| Beginning Account Value 6/30/2023 | Ending Account Value 12/31/2023 | Expenses Paid During Period | |
| Based on Actual Fund Return | |||
| Extended Market Index Fund | |||
| Investor Shares | $1,000.00 | $1,112.10 | $1.01 |
| ETF Shares | 1,000.00 | 1,112.90 | 0.32 |
| Admiral™ Shares | 1,000.00 | 1,112.80 | 0.32 |
| Institutional Shares | 1,000.00 | 1,112.80 | 0.27 |
| Institutional Plus Shares | 1,000.00 | 1,112.90 | 0.21 |
| Institutional Select Shares | 1,000.00 | 1,113.00 | 0.11 |
| Mid-Cap Index Fund | |||
| Investor Shares | $1,000.00 | $1,065.10 | $0.88 |
| ETF Shares | 1,000.00 | 1,065.90 | 0.21 |
| Admiral Shares | 1,000.00 | 1,065.80 | 0.26 |
| Institutional Shares | 1,000.00 | 1,066.00 | 0.21 |
| Institutional Plus Shares | 1,000.00 | 1,065.90 | 0.16 |
| Mid-Cap Growth Index Fund | |||
| Investor Shares | $1,000.00 | $1,070.70 | $0.99 |
| ETF Shares | 1,000.00 | 1,071.40 | 0.37 |
| Admiral Shares | 1,000.00 | 1,071.40 | 0.37 |
| Mid-Cap Value Index Fund | |||
| Investor Shares | $1,000.00 | $1,060.40 | $0.99 |
| ETF Shares | 1,000.00 | 1,061.00 | 0.36 |
| Admiral Shares | 1,000.00 | 1,061.00 | 0.36 |
| Based on Hypothetical 5% Yearly Return | |||
| Extended Market Index Fund | |||
| Investor Shares | $1,000.00 | $1,024.25 | $0.97 |
| ETF Shares | 1,000.00 | 1,024.90 | 0.31 |
| Admiral Shares | 1,000.00 | 1,024.90 | 0.31 |
| Institutional Shares | 1,000.00 | 1,024.95 | 0.26 |
| Institutional Plus Shares | 1,000.00 | 1,025.00 | 0.20 |
| Institutional Select Shares | 1,000.00 | 1,025.10 | 0.10 |
| Mid-Cap Index Fund | |||
| Investor Shares | $1,000.00 | $1,024.35 | $0.87 |
| ETF Shares | 1,000.00 | 1,025.00 | 0.20 |
| Admiral Shares | 1,000.00 | 1,024.95 | 0.26 |
| Institutional Shares | 1,000.00 | 1,025.00 | 0.20 |
| Institutional Plus Shares | 1,000.00 | 1,025.05 | 0.15 |
| Mid-Cap Growth Index Fund | |||
| Investor Shares | $1,000.00 | $1,024.25 | $0.97 |
| ETF Shares | 1,000.00 | 1,024.85 | 0.36 |
| Admiral Shares | 1,000.00 | 1,024.85 | 0.36 |
| Mid-Cap Value Index Fund | |||
| Investor Shares | $1,000.00 | $1,024.25 | $0.97 |
| ETF Shares | 1,000.00 | 1,024.85 | 0.36 |
| Admiral Shares | 1,000.00 | 1,024.85 | 0.36 |

| Average Annual Total Returns Periods Ended December 31, 2023 | |||||
| One Year | Five Years | Ten Years | Final Value of a $10,000 Investment | ||

| Extended Market Index Fund Investor Shares | 25.22% | 11.77% | 8.40% | $22,413 |

| S&P Completion Index | 24.97 | 11.77 | 8.42 | 22,444 |

| Dow Jones U.S. Total Stock Market Float Adjusted Index | 26.06 | 15.05 | 11.40 | 29,422 |
| One Year | Five Years | Ten Years | Final Value of a $10,000 Investment | ||
| Extended Market Index Fund ETF Shares Net Asset Value | 25.39% | 11.91% | 8.54% | $22,702 | |
| Extended Market Index Fund ETF Shares Market Price | 25.49 | 11.92 | 8.55 | 22,716 | |
| S&P Completion Index | 24.97 | 11.77 | 8.42 | 22,444 | |
| Dow Jones U.S. Total Stock Market Float Adjusted Index | 26.06 | 15.05 | 11.40 | 29,422 | |
| One Year | Five Years | Ten Years | Final Value of a $10,000 Investment | ||
| Extended Market Index Fund Admiral Shares | 25.38% | 11.91% | 8.54% | $22,701 | |
| S&P Completion Index | 24.97 | 11.77 | 8.42 | 22,444 | |
| Dow Jones U.S. Total Stock Market Float Adjusted Index | 26.06 | 15.05 | 11.40 | 29,422 | |
| Average Annual Total Returns Periods Ended December 31, 2023 | |||||
| One Year | Five Years | Ten Years | Final Value of a $5,000,000 Investment | ||
| Extended Market Index Fund Institutional Shares | 25.41% | 11.92% | 8.56% | $11,366,202 | |
| S&P Completion Index | 24.97 | 11.77 | 8.42 | 11,221,856 | |
| Dow Jones U.S. Total Stock Market Float Adjusted Index | 26.06 | 15.05 | 11.40 | 14,710,990 | |
| One Year | Five Years | Ten Years | Final Value of a $100,000,000 Investment | ||
| Extended Market Index Fund Institutional Plus Shares | 25.41% | 11.93% | 8.57% | $227,611,590 | |
| S&P Completion Index | 24.97 | 11.77 | 8.42 | 224,437,120 | |
| Dow Jones U.S. Total Stock Market Float Adjusted Index | 26.06 | 15.05 | 11.40 | 294,219,800 | |
| One Year | Five Years | Since Inception (6/27/2016) | Final Value of a $3,000,000,000 Investment | ||
| Extended Market Index Fund Institutional Select Shares | 25.44% | 11.95% | 11.45% | $6,774,235,800 | |
| S&P Completion Index | 24.97 | 11.77 | 11.26 | 6,688,184,700 | |
| Dow Jones U.S. Total Stock Market Float Adjusted Index | 26.06 | 15.05 | 13.82 | 7,929,434,400 | |
| Cumulative Returns of ETF Shares: December 31, 2013, Through December 31, 2023 | |||
| One Year | Five Years | Ten Years | |
| Extended Market Index Fund ETF Shares Market Price | 25.49% | 75.62% | 127.16% |
| Extended Market Index Fund ETF Shares Net Asset Value | 25.39 | 75.51 | 127.02 |
| S&P Completion Index | 24.97 | 74.42 | 124.44 |
| Communication Services | 4.1% |
| Consumer Discretionary | 11.4 |
| Consumer Staples | 2.8 |
| Energy | 4.4 |
| Financials | 17.4 |
| Health Care | 11.8 |
| Industrials | 17.0 |
| Information Technology | 18.9 |
| Materials | 4.4 |
| Real Estate | 6.0 |
| Utilities | 1.8 |
| Futures Contracts | ||||
| ($000) | ||||
| Expiration | Number of Long (Short) Contracts | Notional Amount | Value and Unrealized Appreciation (Depreciation) | |
| Long Futures Contracts | ||||
| E-mini NASDAQ 100 Index | March 2024 | 272 | 92,608 | 3,876 |
| E-mini Russell 2000 Index | March 2024 | 1,432 | 146,615 | 7,635 |
| E-mini S&P 500 Index | March 2024 | 106 | 25,546 | 166 |
| E-mini S&P Mid-Cap 400 Index | March 2024 | 88 | 24,724 | 1,309 |
| 12,986 | ||||
| Over-the-Counter Total Return Swaps | ||||||
| Reference Entity | Termination Date | Counterparty | Notional Amount ($000) | Floating Interest Rate Received (Paid)1 (%) | Value and Unrealized Appreciation ($000) | Value and Unrealized (Depreciation) ($000) |
| BILL Holdings Inc. | 8/30/24 | BANA | 5,565 | (5.332) | 1,347 | — |
| Chewy Inc. Class A | 1/31/24 | GSI | 6,522 | (5.331) | 792 | — |
| Lucid Group Inc. | 1/31/24 | GSI | 8,777 | (5.331) | — | (1,045) |
| Sirius XM Holdings Inc. | 1/31/24 | GSI | 21,600 | (5.331) | 245 | — |
| Snowflake Inc. Class A | 8/30/24 | BANA | 29,653 | (5.332) | 1,666 | — |
| Wayfair Inc. Class A | 8/30/24 | BANA | 7,254 | (5.332) | 737 | — |
| 4,787 | (1,045) | |||||
| 1 | Based on USD Overnight Bank Funding Rate as of the most recent reset date. Floating interest payment received/paid monthly. |
| BANA—Bank of America, N.A. | |
| GSI—Goldman Sachs International. |
| ($000s, except shares, footnotes, and per-share amounts) | Amount |
| Assets | |
| Investments in Securities, at Value1 | |
| Unaffiliated Issuers (Cost $81,497,663) | 96,840,944 |
| Affiliated Issuers (Cost $2,088,111) | 2,089,208 |
| Total Investments in Securities | 98,930,152 |
| Investment in Vanguard | 2,927 |
| Cash Collateral Pledged—Futures Contracts | 20,202 |
| Receivables for Investment Securities Sold | 41,354 |
| Receivables for Accrued Income | 93,656 |
| Receivables for Capital Shares Issued | 68,068 |
| Unrealized Appreciation—Over-the-Counter Swap Contracts | 4,787 |
| Total Assets | 99,161,146 |
| Liabilities | |
| Due to Custodian | 19,818 |
| Payables for Investment Securities Purchased | 29,826 |
| Collateral for Securities on Loan | 1,733,477 |
| Payables for Capital Shares Redeemed | 163,855 |
| Payables to Vanguard | 1,901 |
| Variation Margin Payable—Futures Contracts | 3,626 |
| Unrealized Depreciation—Over-the-Counter Swap Contracts | 1,045 |
| Total Liabilities | 1,953,548 |
| Net Assets | 97,207,598 |
| 1 Includes $1,509,878,000 of securities on loan. | |
| Statement of Assets and Liabilities (continued) | |
At December 31, 2023, net assets consisted of: | |
| ($000s, except shares, footnotes, and per-share amounts) | Amount |
| Paid-in Capital | 87,284,948 |
| Total Distributable Earnings (Loss) | 9,922,650 |
| Net Assets | 97,207,598 |
| Investor Shares—Net Assets | |
| Applicable to 1,858,699 outstanding $.001 par value shares of beneficial interest (unlimited authorization) | 231,936 |
| Net Asset Value Per Share—Investor Shares | $124.78 |
| ETF Shares—Net Assets | |
| Applicable to 107,137,209 outstanding $.001 par value shares of beneficial interest (unlimited authorization) | 17,606,486 |
| Net Asset Value Per Share—ETF Shares | $164.34 |
| Admiral Shares—Net Assets | |
| Applicable to 189,589,142 outstanding $.001 par value shares of beneficial interest (unlimited authorization) | 23,638,744 |
| Net Asset Value Per Share—Admiral Shares | $124.68 |
| Institutional Shares—Net Assets | |
| Applicable to 121,426,884 outstanding $.001 par value shares of beneficial interest (unlimited authorization) | 15,138,897 |
| Net Asset Value Per Share—Institutional Shares | $124.68 |
| Institutional Plus Shares—Net Assets | |
| Applicable to 39,704,803 outstanding $.001 par value shares of beneficial interest (unlimited authorization) | 12,216,148 |
| Net Asset Value Per Share—Institutional Plus Shares | $307.67 |
| Institutional Select Shares—Net Assets | |
| Applicable to 141,614,265 outstanding $.001 par value shares of beneficial interest (unlimited authorization) | 28,375,387 |
| Net Asset Value Per Share—Institutional Select Shares | $200.37 |
| Year Ended December 31, 2023 | |
| ($000) | |
| Investment Income | |
| Income | |
| Dividends1 | 1,094,745 |
| Interest2 | 34,640 |
| Securities Lending—Net | 141,974 |
| Total Income | 1,271,359 |
| Expenses | |
| The Vanguard Group—Note B | |
| Investment Advisory Services | 1,799 |
| Management and Administrative—Investor Shares | 398 |
| Management and Administrative—ETF Shares | 7,237 |
| Management and Administrative—Admiral Shares | 11,162 |
| Management and Administrative—Institutional Shares | 5,844 |
| Management and Administrative—Institutional Plus Shares | 3,508 |
| Management and Administrative—Institutional Select Shares | 4,150 |
| Marketing and Distribution—Investor Shares | 10 |
| Marketing and Distribution—ETF Shares | 836 |
| Marketing and Distribution—Admiral Shares | 847 |
| Marketing and Distribution—Institutional Shares | 458 |
| Marketing and Distribution—Institutional Plus Shares | 370 |
| Marketing and Distribution—Institutional Select Shares | 49 |
| Custodian Fees | 639 |
| Auditing Fees | 48 |
| Shareholders’ Reports—Investor Shares | 1 |
| Shareholders’ Reports—ETF Shares | 417 |
| Shareholders’ Reports—Admiral Shares | 167 |
| Shareholders’ Reports—Institutional Shares | 191 |
| Shareholders’ Reports—Institutional Plus Shares | 148 |
| Shareholders’ Reports—Institutional Select Shares | — |
| Trustees’ Fees and Expenses | 51 |
| Other Expenses | 25 |
| Total Expenses | 38,355 |
| Expenses Paid Indirectly | (5) |
| Net Expenses | 38,350 |
| Net Investment Income | 1,233,009 |
| Realized Net Gain (Loss) | |
| Investment Securities Sold2,3 | 5,059,742 |
| Futures Contracts | 23,830 |
| Swap Contracts | 6,190 |
| Realized Net Gain (Loss) | 5,089,762 |
| Change in Unrealized Appreciation (Depreciation) | |
| Investment Securities2 | 13,569,568 |
| Futures Contracts | 26,926 |
| Swap Contracts | 10,301 |
| Change in Unrealized Appreciation (Depreciation) | 13,606,795 |
| Net Increase (Decrease) in Net Assets Resulting from Operations | 19,929,566 |
| 1 | Dividends are net of foreign withholding taxes of $295,000. |
| 2 | Interest income, realized net gain (loss), capital gain distributions received, and change in unrealized appreciation (depreciation) from an affiliated company of the fund were $32,828,000, $32,000, $2,000, and $510,000, respectively. Purchases and sales are for temporary cash investment purposes. |
| 3 | Includes $5,732,517,000 of net gain (loss) resulting from in-kind redemptions. |
| Year Ended December 31, | ||
| 2023 ($000) | 2022 ($000) | |
| Increase (Decrease) in Net Assets | ||
| Operations | ||
| Net Investment Income | 1,233,009 | 1,141,328 |
| Realized Net Gain (Loss) | 5,089,762 | 2,411,429 |
| Change in Unrealized Appreciation (Depreciation) | 13,606,795 | (32,279,720) |
| Net Increase (Decrease) in Net Assets Resulting from Operations | 19,929,566 | (28,726,963) |
| Distributions | ||
| Investor Shares | (2,799) | (2,370) |
| ETF Shares | (216,881) | (148,188) |
| Admiral Shares | (304,809) | (232,052) |
| Institutional Shares | (197,911) | (154,028) |
| Institutional Plus Shares | (157,589) | (131,076) |
| Institutional Select Shares | (358,784) | (248,096) |
| Total Distributions | (1,238,773) | (915,810) |
| Capital Share Transactions | ||
| Investor Shares | (44,315) | (72,334) |
| ETF Shares | 1,158,186 | 344,966 |
| Admiral Shares | (985,934) | (1,252,838) |
| Institutional Shares | (827,656) | (1,209,959) |
| Institutional Plus Shares | (656,866) | (1,175,993) |
| Institutional Select Shares | 877,035 | 3,290,411 |
| Net Increase (Decrease) from Capital Share Transactions | (479,550) | (75,747) |
| Total Increase (Decrease) | 18,211,243 | (29,718,520) |
| Net Assets | ||
| Beginning of Period | 78,996,355 | 108,714,875 |
| End of Period | 97,207,598 | 78,996,355 |
| Investor Shares | |||||
| For a Share Outstanding Throughout Each Period | Year Ended December 31, | ||||
| 2023 | 2022 | 2021 | 2020 | 2019 | |
| Net Asset Value, Beginning of Period | $100.93 | $138.80 | $124.83 | $95.66 | $75.74 |
| Investment Operations | |||||
| Net Investment Income1 | 1.411 | 1.280 | 1.216 | .983 | .962 |
| Net Realized and Unrealized Gain (Loss) on Investments | 23.876 | (38.141) | 14.134 | 29.401 | 20.089 |
| Total from Investment Operations | 25.287 | (36.861) | 15.350 | 30.384 | 21.051 |
| Distributions | |||||
| Dividends from Net Investment Income | (1.437) | (1.009) | (1.380) | (1.214) | (1.131) |
| Distributions from Realized Capital Gains | — | — | — | — | — |
| Total Distributions | (1.437) | (1.009) | (1.380) | (1.214) | (1.131) |
| Net Asset Value, End of Period | $124.78 | $100.93 | $138.80 | $124.83 | $95.66 |
| Total Return2 | 25.22% | -26.56% | 12.31% | 32.04% | 27.87% |
| Ratios/Supplemental Data | |||||
| Net Assets, End of Period (Millions) | $232 | $229 | $399 | $454 | $455 |
| Ratio of Total Expenses to Average Net Assets | 0.19%3 | 0.19%3 | 0.19% | 0.19% | 0.19% |
| Ratio of Net Investment Income to Average Net Assets | 1.28% | 1.14% | 0.87% | 1.04% | 1.09% |
| Portfolio Turnover Rate4 | 11% | 11% | 19% | 19% | 13% |
| 1 | Calculated based on average shares outstanding. |
| 2 | Total returns do not include account service fees that may have applied in the periods shown. Fund prospectuses provide information about any applicable account service fees. |
| 3 | The ratio of expenses to average net assets for the period net of reduction from custody fee offset arrangements was 0.19%. |
| 4 | Excludes the value of portfolio securities received or delivered as a result of in-kind purchases or redemptions of the fund’s capital shares, including ETF Creation Units. |
| ETF Shares | |||||
| For a Share Outstanding Throughout Each Period | Year Ended December 31, | ||||
| 2023 | 2022 | 2021 | 2020 | 2019 | |
| Net Asset Value, Beginning of Period | $132.92 | $182.81 | $164.43 | $126.02 | $99.77 |
| Investment Operations | |||||
| Net Investment Income1 | 2.086 | 1.914 | 1.867 | 1.509 | 1.636 |
| Net Realized and Unrealized Gain (Loss) on Investments | 31.415 | (50.278) | 18.576 | 38.668 | 26.255 |
| Total from Investment Operations | 33.501 | (48.364) | 20.443 | 40.177 | 27.891 |
| Distributions | |||||
| Dividends from Net Investment Income | (2.081) | (1.526) | (2.063) | (1.767) | (1.641) |
| Distributions from Realized Capital Gains | — | — | — | — | — |
| Total Distributions | (2.081) | (1.526) | (2.063) | (1.767) | (1.641) |
| Net Asset Value, End of Period | $164.34 | $132.92 | $182.81 | $164.43 | $126.02 |
| Total Return | 25.39% | -26.46% | 12.44% | 32.20% | 28.04% |
| Ratios/Supplemental Data | |||||
| Net Assets, End of Period (Millions) | $17,606 | $13,089 | $17,593 | $13,761 | $8,119 |
| Ratio of Total Expenses to Average Net Assets | 0.06%2 | 0.06%2 | 0.06% | 0.06% | 0.06% |
| Ratio of Net Investment Income to Average Net Assets | 1.44% | 1.31% | 1.02% | 1.20% | 1.40% |
| Portfolio Turnover Rate3 | 11% | 11% | 19% | 19% | 13% |
| 1 | Calculated based on average shares outstanding. |
| 2 | The ratio of expenses to average net assets for the period net of reduction from custody fee offset arrangements was 0.06%. |
| 3 | Excludes the value of portfolio securities received or delivered as a result of in-kind purchases or redemptions of the fund’s capital shares, including ETF Creation Units. |
| Admiral Shares | |||||
| For a Share Outstanding Throughout Each Period | Year Ended December 31, | ||||
| 2023 | 2022 | 2021 | 2020 | 2019 | |
| Net Asset Value, Beginning of Period | $100.85 | $138.70 | $124.75 | $95.61 | $75.70 |
| Investment Operations | |||||
| Net Investment Income1 | 1.557 | 1.437 | 1.408 | 1.112 | 1.236 |
| Net Realized and Unrealized Gain (Loss) on Investments | 23.851 | (38.129) | 14.106 | 29.367 | 19.918 |
| Total from Investment Operations | 25.408 | (36.692) | 15.514 | 30.479 | 21.154 |
| Distributions | |||||
| Dividends from Net Investment Income | (1.578) | (1.158) | (1.564) | (1.339) | (1.244) |
| Distributions from Realized Capital Gains | — | — | — | — | — |
| Total Distributions | (1.578) | (1.158) | (1.564) | (1.339) | (1.244) |
| Net Asset Value, End of Period | $124.68 | $100.85 | $138.70 | $124.75 | $95.61 |
| Total Return2 | 25.38% | -26.47% | 12.45% | 32.21% | 28.03% |
| Ratios/Supplemental Data | |||||
| Net Assets, End of Period (Millions) | $23,639 | $20,012 | $29,054 | $26,784 | $22,391 |
| Ratio of Total Expenses to Average Net Assets | 0.06%3 | 0.06%3 | 0.06% | 0.06% | 0.06% |
| Ratio of Net Investment Income to Average Net Assets | 1.42% | 1.29% | 1.01% | 1.18% | 1.39% |
| Portfolio Turnover Rate4 | 11% | 11% | 19% | 19% | 13% |
| 1 | Calculated based on average shares outstanding. |
| 2 | Total returns do not include account service fees that may have applied in the periods shown. Fund prospectuses provide information about any applicable account service fees. |
| 3 | The ratio of expenses to average net assets for the period net of reduction from custody fee offset arrangements was 0.06%. |
| 4 | Excludes the value of portfolio securities received or delivered as a result of in-kind purchases or redemptions of the fund’s capital shares, including ETF Creation Units. |
| Institutional Shares | |||||
| For a Share Outstanding Throughout Each Period | Year Ended December 31, | ||||
| 2023 | 2022 | 2021 | 2020 | 2019 | |
| Net Asset Value, Beginning of Period | $100.84 | $138.69 | $124.74 | $95.60 | $75.69 |
| Investment Operations | |||||
| Net Investment Income1 | 1.567 | 1.439 | 1.413 | 1.125 | 1.239 |
| Net Realized and Unrealized Gain (Loss) on Investments | 23.862 | (38.120) | 14.115 | 29.364 | 19.925 |
| Total from Investment Operations | 25.429 | (36.681) | 15.528 | 30.489 | 21.164 |
| Distributions | |||||
| Dividends from Net Investment Income | (1.589) | (1.169) | (1.578) | (1.349) | (1.254) |
| Distributions from Realized Capital Gains | — | — | — | — | — |
| Total Distributions | (1.589) | (1.169) | (1.578) | (1.349) | (1.254) |
| Net Asset Value, End of Period | $124.68 | $100.84 | $138.69 | $124.74 | $95.60 |
| Total Return | 25.41% | -26.46% | 12.47% | 32.23% | 28.05% |
| Ratios/Supplemental Data | |||||
| Net Assets, End of Period (Millions) | $15,139 | $12,983 | $19,456 | $18,659 | $14,927 |
| Ratio of Total Expenses to Average Net Assets | 0.05%2 | 0.05%2 | 0.05% | 0.05% | 0.05% |
| Ratio of Net Investment Income to Average Net Assets | 1.43% | 1.29% | 1.01% | 1.19% | 1.40% |
| Portfolio Turnover Rate3 | 11% | 11% | 19% | 19% | 13% |
| 1 | Calculated based on average shares outstanding. |
| 2 | The ratio of expenses to average net assets for the period net of reduction from custody fee offset arrangements was 0.05%. |
| 3 | Excludes the value of portfolio securities received or delivered as a result of in-kind purchases or redemptions of the fund’s capital shares, including ETF Creation Units. |
| Institutional Plus Shares | |||||
| For a Share Outstanding Throughout Each Period | Year Ended December 31, | ||||
| 2023 | 2022 | 2021 | 2020 | 2019 | |
| Net Asset Value, Beginning of Period | $248.85 | $342.27 | $307.85 | $235.94 | $186.80 |
| Investment Operations | |||||
| Net Investment Income1 | 3.898 | 3.597 | 3.595 | 2.798 | 3.078 |
| Net Realized and Unrealized Gain (Loss) on Investments | 58.870 | (94.104) | 34.757 | 72.466 | 49.178 |
| Total from Investment Operations | 62.768 | (90.507) | 38.352 | 75.264 | 52.256 |
| Distributions | |||||
| Dividends from Net Investment Income | (3.948) | (2.913) | (3.932) | (3.354) | (3.116) |
| Distributions from Realized Capital Gains | — | — | — | — | — |
| Total Distributions | (3.948) | (2.913) | (3.932) | (3.354) | (3.116) |
| Net Asset Value, End of Period | $307.67 | $248.85 | $342.27 | $307.85 | $235.94 |
| Total Return | 25.41% | -26.45% | 12.48% | 32.24% | 28.07% |
| Ratios/Supplemental Data | |||||
| Net Assets, End of Period (Millions) | $12,216 | $10,446 | $15,973 | $11,665 | $9,486 |
| Ratio of Total Expenses to Average Net Assets | 0.04%2 | 0.04%2 | 0.04% | 0.04% | 0.04% |
| Ratio of Net Investment Income to Average Net Assets | 1.44% | 1.31% | 1.04% | 1.20% | 1.41% |
| Portfolio Turnover Rate3 | 11% | 11% | 19% | 19% | 13% |
| 1 | Calculated based on average shares outstanding. |
| 2 | The ratio of expenses to average net assets for the period net of reduction from custody fee offset arrangements was 0.04%. |
| 3 | Excludes the value of portfolio securities received or delivered as a result of in-kind purchases or redemptions of the fund’s capital shares, including ETF Creation Units. |
| Institutional Select Shares | |||||
| For a Share Outstanding Throughout Each Period | Year Ended December 31, | ||||
| 2023 | 2022 | 2021 | 2020 | 2019 | |
| Net Asset Value, Beginning of Period | $162.04 | $222.86 | $200.45 | $153.63 | $121.63 |
| Investment Operations | |||||
| Net Investment Income1 | 2.580 | 2.421 | 2.352 | 1.855 | 2.059 |
| Net Realized and Unrealized Gain (Loss) on Investments | 38.338 | (61.319) | 22.661 | 47.179 | 31.999 |
| Total from Investment Operations | 40.918 | (58.898) | 25.013 | 49.034 | 34.058 |
| Distributions | |||||
| Dividends from Net Investment Income | (2.588) | (1.922) | (2.603) | (2.214) | (2.058) |
| Distributions from Realized Capital Gains | — | — | — | — | — |
| Total Distributions | (2.588) | (1.922) | (2.603) | (2.214) | (2.058) |
| Net Asset Value, End of Period | $200.37 | $162.04 | $222.86 | $200.45 | $153.63 |
| Total Return | 25.44% | -26.44% | 12.50% | 32.27% | 28.09% |
| Ratios/Supplemental Data | |||||
| Net Assets, End of Period (Millions) | $28,375 | $22,239 | $26,240 | $24,472 | $19,166 |
| Ratio of Total Expenses to Average Net Assets | 0.02%2 | 0.02%2 | 0.02% | 0.02% | 0.02% |
| Ratio of Net Investment Income to Average Net Assets | 1.46% | 1.36% | 1.05% | 1.22% | 1.44% |
| Portfolio Turnover Rate3 | 11% | 11% | 19% | 19% | 13% |
| 1 | Calculated based on average shares outstanding. |
| 2 | The ratio of expenses to average net assets for the period net of reduction from custody fee offset arrangements was 0.02%. |
| 3 | Excludes the value of portfolio securities received or delivered as a result of in-kind purchases or redemptions of the fund’s capital shares, including ETF Creation Units. |
| Level 1 ($000) | Level 2 ($000) | Level 3 ($000) | Total ($000) | |
| Investments | ||||
| Assets | ||||
| Common Stocks | 96,832,085 | — | 4,866 | 96,836,951 |
| Preferred Stocks | 125 | — | — | 125 |
| Rights | 2 | 102 | 2,648 | 2,752 |
| Warrants | — | — | 1,116 | 1,116 |
| Temporary Cash Investments | 2,089,208 | — | — | 2,089,208 |
| Total | 98,921,420 | 102 | 8,630 | 98,930,152 |
| Derivative Financial Instruments | ||||
| Assets | ||||
| Futures Contracts1 | 12,986 | — | — | 12,986 |
| Swap Contracts | — | 4,787 | — | 4,787 |
| Total | 12,986 | 4,787 | — | 17,773 |
| Liabilities | ||||
| Swap Contracts | — | 1,045 | — | 1,045 |
| 1 | Includes cumulative appreciation (depreciation) on futures contracts and centrally cleared swaps, if any, as reported in the Schedule of Investments. Only current day’s variation margin is reported within the Statement of Assets and Liabilities. | |||
| Amount ($000) | |
| Paid-in Capital | 5,721,800 |
| Total Distributable Earnings (Loss) | (5,721,800) |
| Amount ($000) | |
| Undistributed Ordinary Income | 42,694 |
| Undistributed Long-Term Gains | — |
| Net Unrealized Gains (Losses) | 14,687,076 |
| Capital Loss Carryforwards | (4,807,120) |
| Qualified Late-Year Losses | — |
| Other Temporary Differences | — |
| Total | 9,922,650 |
| Year Ended December 31, | ||
| 2023 Amount ($000) | 2022 Amount ($000) | |
| Ordinary Income* | 1,238,773 | 915,810 |
| Long-Term Capital Gains | — | — |
| Total | 1,238,773 | 915,810 |
| * | Includes short-term capital gains, if any. |
| Amount ($000) | |
| Tax Cost | 84,243,076 |
| Gross Unrealized Appreciation | 32,329,904 |
| Gross Unrealized Depreciation | (17,642,828) |
| Net Unrealized Appreciation (Depreciation) | 14,687,076 |
| Year Ended December 31, | |||||
| 2023 | 2022 | ||||
| Amount ($000) | Shares (000) | Amount ($000) | Shares (000) | ||
| Investor Shares | |||||
| Issued | 7,047 | 64 | 10,368 | 92 | |
| Issued in Lieu of Cash Distributions | 2,799 | 25 | 2,370 | 23 | |
| Redeemed | (54,161) | (496) | (85,072) | (721) | |
| Net Increase (Decrease)—Investor Shares | (44,315) | (407) | (72,334) | (606) | |
| Year Ended December 31, | |||||
| 2023 | 2022 | ||||
| Amount ($000) | Shares (000) | Amount ($000) | Shares (000) | ||
| ETF Shares | |||||
| Issued | 10,241,871 | 68,864 | 7,785,642 | 54,535 | |
| Issued in Lieu of Cash Distributions | — | — | — | — | |
| Redeemed | (9,083,685) | (60,200) | (7,440,676) | (52,300) | |
| Net Increase (Decrease)—ETF Shares | 1,158,186 | 8,664 | 344,966 | 2,235 | |
| Admiral Shares | |||||
| Issued | 1,528,622 | 13,910 | 2,057,224 | 18,437 | |
| Issued in Lieu of Cash Distributions | 253,200 | 2,264 | 193,334 | 1,884 | |
| Redeemed | (2,767,756) | (25,026) | (3,503,396) | (31,355) | |
| Net Increase (Decrease)—Admiral Shares | (985,934) | (8,852) | (1,252,838) | (11,034) | |
| Institutional Shares | |||||
| Issued | 2,289,403 | 20,910 | 2,414,097 | 21,403 | |
| Issued in Lieu of Cash Distributions | 183,474 | 1,642 | 143,746 | 1,400 | |
| Redeemed | (3,300,533) | (29,875) | (3,767,802) | (34,333) | |
| Net Increase (Decrease)—Institutional Shares | (827,656) | (7,323) | (1,209,959) | (11,530) | |
| Institutional Plus Shares | |||||
| Issued | 1,568,473 | 5,907 | 3,581,013 | 13,375 | |
| Issued in Lieu of Cash Distributions | 152,432 | 552 | 125,346 | 495 | |
| Redeemed | (2,377,771) | (8,729) | (4,882,352) | (18,563) | |
| Net Increase (Decrease)—Institutional Plus Shares | (656,866) | (2,270) | (1,175,993) | (4,693) | |
| Institutional Select Shares | |||||
| Issued | 3,253,688 | 18,298 | 4,415,226 | 25,617 | |
| Issued in Lieu of Cash Distributions | 358,784 | 1,994 | 248,096 | 1,506 | |
| Redeemed | (2,735,437) | (15,917) | (1,372,911) | (7,624) | |
| Net Increase (Decrease)—Institutional Select Shares | 877,035 | 4,375 | 3,290,411 | 19,499 | |

| Average Annual Total Returns Periods Ended December 31, 2023 | |||||
| One Year | Five Years | Ten Years | Final Value of a $10,000 Investment | ||
|
| Mid-Cap Index Fund Investor Shares | 15.84% | 12.57% | 9.27% | $24,275 |
|
| CRSP US Mid Cap Index | 15.98 | 12.73 | 9.44 | 24,643 |
|
| Dow Jones U.S. Total Stock Market Float Adjusted Index | 26.06 | 15.05 | 11.40 | 29,422 |
| One Year | Five Years | Ten Years | Final Value of a $10,000 Investment | ||
| Mid-Cap Index Fund ETF Shares Net Asset Value | 15.99% | 12.72% | 9.41% | $24,589 | |
| Mid-Cap Index Fund ETF Shares Market Price | 16.04 | 12.73 | 9.42 | 24,595 | |
| CRSP US Mid Cap Index | 15.98 | 12.73 | 9.44 | 24,643 | |
| Dow Jones U.S. Total Stock Market Float Adjusted Index | 26.06 | 15.05 | 11.40 | 29,422 | |
| One Year | Five Years | Ten Years | Final Value of a $10,000 Investment | ||
| Mid-Cap Index Fund Admiral Shares | 15.98% | 12.71% | 9.41% | $24,576 | |
| CRSP US Mid Cap Index | 15.98 | 12.73 | 9.44 | 24,643 | |
| Dow Jones U.S. Total Stock Market Float Adjusted Index | 26.06 | 15.05 | 11.40 | 29,422 | |
| Average Annual Total Returns Periods Ended December 31, 2023 | |||||
| One Year | Five Years | Ten Years | Final Value of a $5,000,000 Investment | ||
| Mid-Cap Index Fund Institutional Shares | 16.00% | 12.72% | 9.42% | $12,302,398 | |
| CRSP US Mid Cap Index | 15.98 | 12.73 | 9.44 | 12,321,356 | |
| Dow Jones U.S. Total Stock Market Float Adjusted Index | 26.06 | 15.05 | 11.40 | 14,710,990 | |
| One Year | Five Years | Ten Years | Final Value of a $100,000,000 Investment | ||
| Mid-Cap Index Fund Institutional Plus Shares | 16.00% | 12.73% | 9.43% | $246,303,260 | |
| CRSP US Mid Cap Index | 15.98 | 12.73 | 9.44 | 246,427,120 | |
| Dow Jones U.S. Total Stock Market Float Adjusted Index | 26.06 | 15.05 | 11.40 | 294,219,800 | |
| Cumulative Returns of ETF Shares: December 31, 2013, Through December 31, 2023 | |||
| One Year | Five Years | Ten Years | |
| Mid-Cap Index Fund ETF Shares Market Price | 16.04% | 82.07% | 145.95% |
| Mid-Cap Index Fund ETF Shares Net Asset Value | 15.99 | 81.93 | 145.89 |
| CRSP US Mid Cap Index | 15.98 | 82.04 | 146.43 |
| Basic Materials | 3.8% |
| Consumer Discretionary | 13.1 |
| Consumer Staples | 4.5 |
| Energy | 4.9 |
| Financials | 12.5 |
| Health Care | 9.5 |
| Industrials | 19.6 |
| Real Estate | 8.3 |
| Technology | 14.5 |
| Telecommunications | 1.9 |
| Utilities | 7.4 |
| Futures Contracts | ||||
| ($000) | ||||
| Expiration | Number of Long (Short) Contracts | Notional Amount | Value and Unrealized Appreciation (Depreciation) | |
| Long Futures Contracts | ||||
| E-mini S&P Mid-Cap 400 Index | March 2024 | 1,040 | 292,188 | 7,544 |
| Over-the-Counter Total Return Swaps | ||||||
| Reference Entity | Termination Date | Counterparty | Notional Amount ($000) | Floating Interest Rate Received (Paid)1 (%) | Value and Unrealized Appreciation ($000) | Value and Unrealized (Depreciation) ($000) |
| Alnylam Pharmaceuticals Inc. | 8/30/24 | BANA | 21,704 | (5.332) | 2,897 | — |
| Ameren Corp. | 1/31/24 | GSI | 1,076 | (5.331) | 17 | — |
| Coinbase Global Inc. Class A | 1/31/24 | GSI | 59,160 | (5.331) | 10,312 | — |
| CRSP US Mid Cap TR Index | 8/30/24 | BANA | 106,511 | (5.882) | 6,631 | — |
| Fidelity National Information Services Inc. | 8/30/24 | BANA | 29,480 | (5.979) | 707 | — |
| Fidelity National Information Services Inc. | 8/30/24 | BANA | 29,470 | (5.978) | 477 | — |
| Fidelity National Information Services Inc. | 8/30/24 | BANA | 29,460 | (5.979) | 472 | — |
| Fidelity National Information Services Inc. | 8/30/24 | BANA | 29,360 | (5.977) | 592 | — |
| Fidelity National Information Services Inc. | 8/30/24 | BANA | 28,920 | (5.977) | 1,038 | — |
| Fidelity National Information Services Inc. | 8/30/24 | BANA | 23,456 | (5.882) | 673 | — |
| Fidelity National Information Services Inc. | 8/30/24 | BANA | 12,000 | (5.976) | — | (16) |
| Global Payments Inc. | 8/30/24 | BANA | 151,372 | (5.932) | 13,355 | — |
| Hormel Foods Corp. | 1/31/24 | GSI | 13,986 | (5.331) | 441 | — |
| Molina Healthcare Inc. | 8/30/24 | BANA | 23,761 | (5.332) | — | (375) |
| Palantir Technologies Inc. Class A | 8/30/24 | BANA | 5,373 | (5.332) | — | (794) |
| Sirius XM Holdings Inc. | 1/31/24 | GSI | 13,365 | (5.331) | 151 | — |
| Trade Desk Inc. Class A | 8/30/24 | BANA | 24,661 | (5.332) | 423 | — |
| VICI Properties Inc. Class A | 8/30/24 | BANA | 79,209 | (5.982) | 6,005 | — |
| 44,191 | (1,185) | |||||
| 1 | Based on USD Overnight Bank Funding Rate as of the most recent reset date. Floating interest payment received/paid monthly. |
| BANA—Bank of America, N.A. | |
| GSI—Goldman Sachs International. |
| ($000s, except shares, footnotes, and per-share amounts) | Amount |
| Assets | |
| Investments in Securities, at Value1 | |
| Unaffiliated Issuers (Cost $102,451,201) | 154,511,384 |
| Affiliated Issuers (Cost $1,119,168) | 1,119,284 |
| Total Investments in Securities | 155,630,668 |
| Investment in Vanguard | 4,827 |
| Cash | 3,550 |
| Cash Collateral Pledged—Futures Contracts | 28,145 |
| Receivables for Accrued Income | 242,977 |
| Receivables for Capital Shares Issued | 79,665 |
| Unrealized Appreciation—Over-the-Counter Swap Contracts | 44,191 |
| Total Assets | 156,034,023 |
| Liabilities | |
| Payables for Investment Securities Purchased | 7,245 |
| Collateral for Securities on Loan | 199,138 |
| Payables for Capital Shares Redeemed | 357,218 |
| Payables to Vanguard | 2,923 |
| Variation Margin Payable—Futures Contracts | 4,715 |
| Unrealized Depreciation—Over-the-Counter Swap Contracts | 1,185 |
| Total Liabilities | 572,424 |
| Net Assets | 155,461,599 |
| 1 Includes $180,290,000 of securities on loan. | |
| Statement of Assets and Liabilities (continued) | |
At December 31, 2023, net assets consisted of: | |
| ($000s, except shares, footnotes, and per-share amounts) | Amount |
| Paid-in Capital | 124,561,160 |
| Total Distributable Earnings (Loss) | 30,900,439 |
| Net Assets | 155,461,599 |
| Investor Shares—Net Assets | |
| Applicable to 6,553,612 outstanding $.001 par value shares of beneficial interest (unlimited authorization) | 416,241 |
| Net Asset Value Per Share—Investor Shares | $63.51 |
| ETF Shares—Net Assets | |
| Applicable to 255,293,710 outstanding $.001 par value shares of beneficial interest (unlimited authorization) | 59,375,822 |
| Net Asset Value Per Share—ETF Shares | $232.58 |
| Admiral Shares—Net Assets | |
| Applicable to 199,014,585 outstanding $.001 par value shares of beneficial interest (unlimited authorization) | 57,330,173 |
| Net Asset Value Per Share—Admiral Shares | $288.07 |
| Institutional Shares—Net Assets | |
| Applicable to 343,633,753 outstanding $.001 par value shares of beneficial interest (unlimited authorization) | 21,867,485 |
| Net Asset Value Per Share—Institutional Shares | $63.64 |
| Institutional Plus Shares—Net Assets | |
| Applicable to 52,485,031 outstanding $.001 par value shares of beneficial interest (unlimited authorization) | 16,471,878 |
| Net Asset Value Per Share—Institutional Plus Shares | $313.84 |
| Year Ended December 31, 2023 | |
| ($000) | |
| Investment Income | |
| Income | |
| Dividends1 | 2,386,824 |
| Interest2 | 35,149 |
| Securities Lending—Net | 23,785 |
| Total Income | 2,445,758 |
| Expenses | |
| The Vanguard Group—Note B | |
| Investment Advisory Services | 3,060 |
| Management and Administrative—Investor Shares | 703 |
| Management and Administrative—ETF Shares | 15,555 |
| Management and Administrative—Admiral Shares | 22,525 |
| Management and Administrative—Institutional Shares | 6,976 |
| Management and Administrative—Institutional Plus Shares | 3,753 |
| Marketing and Distribution—Investor Shares | 21 |
| Marketing and Distribution—ETF Shares | 2,978 |
| Marketing and Distribution—Admiral Shares | 2,387 |
| Marketing and Distribution—Institutional Shares | 657 |
| Marketing and Distribution—Institutional Plus Shares | 449 |
| Custodian Fees | 191 |
| Auditing Fees | 37 |
| Shareholders’ Reports—Investor Shares | 1 |
| Shareholders’ Reports—ETF Shares | 1,389 |
| Shareholders’ Reports—Admiral Shares | 578 |
| Shareholders’ Reports—Institutional Shares | 169 |
| Shareholders’ Reports—Institutional Plus Shares | 90 |
| Trustees’ Fees and Expenses | 85 |
| Other Expenses | 23 |
| Total Expenses | 61,627 |
| Expenses Paid Indirectly | (8) |
| Net Expenses | 61,619 |
| Net Investment Income | 2,384,139 |
| Realized Net Gain (Loss) | |
| Investment Securities Sold2,3 | 560,466 |
| Futures Contracts | 40,311 |
| Swap Contracts | 23,882 |
| Realized Net Gain (Loss) | 624,659 |
| Change in Unrealized Appreciation (Depreciation) | |
| Investment Securities2 | 18,589,151 |
| Futures Contracts | 24,275 |
| Swap Contracts | 56,866 |
| Change in Unrealized Appreciation (Depreciation) | 18,670,292 |
| Net Increase (Decrease) in Net Assets Resulting from Operations | 21,679,090 |
| 1 | Dividends are net of foreign withholding taxes of $935,000. |
| 2 | Interest income, realized net gain (loss), capital gain distributions received, and change in unrealized appreciation (depreciation) from an affiliated company of the fund were $33,917,000, $178,000, $6,000, and ($264,000), respectively. Purchases and sales are for temporary cash investment purposes. |
| 3 | Includes $6,499,705,000 of net gain (loss) resulting from in-kind redemptions. |
| Year Ended December 31, | ||
| 2023 ($000) | 2022 ($000) | |
| Increase (Decrease) in Net Assets | ||
| Operations | ||
| Net Investment Income | 2,384,139 | 2,185,524 |
| Realized Net Gain (Loss) | 624,659 | 2,853,546 |
| Change in Unrealized Appreciation (Depreciation) | 18,670,292 | (36,662,503) |
| Net Increase (Decrease) in Net Assets Resulting from Operations | 21,679,090 | (31,623,433) |
| Distributions | ||
| Investor Shares | (6,392) | (7,365) |
| ETF Shares | (884,374) | (779,343) |
| Admiral Shares | (872,711) | (818,365) |
| Institutional Shares | (338,375) | (331,945) |
| Institutional Plus Shares | (256,449) | (235,283) |
| Total Distributions | (2,358,301) | (2,172,301) |
| Capital Share Transactions | ||
| Investor Shares | (116,598) | (126,905) |
| ETF Shares | 2,252,186 | 3,900,034 |
| Admiral Shares | (1,165,068) | (830,405) |
| Institutional Shares | (1,138,787) | (1,758,614) |
| Institutional Plus Shares | (455,704) | 710,097 |
| Net Increase (Decrease) from Capital Share Transactions | (623,971) | 1,894,207 |
| Total Increase (Decrease) | 18,696,818 | (31,901,527) |
| Net Assets | ||
| Beginning of Period | 136,764,781 | 168,666,308 |
| End of Period | 155,461,599 | 136,764,781 |
| Investor Shares | |||||
| For a Share Outstanding Throughout Each Period | Year Ended December 31, | ||||
| 2023 | 2022 | 2021 | 2020 | 2019 | |
| Net Asset Value, Beginning of Period | $55.66 | $69.54 | $56.52 | $48.64 | $37.71 |
| Investment Operations | |||||
| Net Investment Income1 | .887 | .807 | .652 | .698 | .577 |
| Net Realized and Unrealized Gain (Loss) on Investments | 7.851 | (13.875) | 13.065 | 7.937 | 11.018 |
| Total from Investment Operations | 8.738 | (13.068) | 13.717 | 8.635 | 11.595 |
| Distributions | |||||
| Dividends from Net Investment Income | (.888) | (.812) | (.697) | (.755) | (.665) |
| Distributions from Realized Capital Gains | — | — | — | — | — |
| Total Distributions | (.888) | (.812) | (.697) | (.755) | (.665) |
| Net Asset Value, End of Period | $63.51 | $55.66 | $69.54 | $56.52 | $48.64 |
| Total Return2 | 15.84% | -18.80% | 24.36% | 18.10% | 30.86% |
| Ratios/Supplemental Data | |||||
| Net Assets, End of Period (Millions) | $416 | $476 | $740 | $834 | $877 |
| Ratio of Total Expenses to Average Net Assets | 0.17%3 | 0.17%3 | 0.17% | 0.17% | 0.17% |
| Ratio of Net Investment Income to Average Net Assets | 1.52% | 1.36% | 1.02% | 1.49% | 1.31% |
| Portfolio Turnover Rate4 | 13% | 12% | 16% | 26% | 15% |
| 1 | Calculated based on average shares outstanding. |
| 2 | Total returns do not include account service fees that may have applied in the periods shown. Fund prospectuses provide information about any applicable account service fees. |
| 3 | The ratio of expenses to average net assets for the period net of reduction from custody fee offset arrangements was 0.17%. |
| 4 | Excludes the value of portfolio securities received or delivered as a result of in-kind purchases or redemptions of the fund’s capital shares, including ETF Creation Units. |
| ETF Shares | |||||
| For a Share Outstanding Throughout Each Period | Year Ended December 31, | ||||
| 2023 | 2022 | 2021 | 2020 | 2019 | |
| Net Asset Value, Beginning of Period | $203.84 | $254.69 | $207.00 | $178.14 | $138.08 |
| Investment Operations | |||||
| Net Investment Income1 | 3.589 | 3.302 | 2.741 | 2.772 | 2.663 |
| Net Realized and Unrealized Gain (Loss) on Investments | 28.686 | (50.886) | 47.811 | 29.084 | 40.043 |
| Total from Investment Operations | 32.275 | (47.584) | 50.552 | 31.856 | 42.706 |
| Distributions | |||||
| Dividends from Net Investment Income | (3.535) | (3.266) | (2.862) | (2.996) | (2.646) |
| Distributions from Realized Capital Gains | — | — | — | — | — |
| Total Distributions | (3.535) | (3.266) | (2.862) | (2.996) | (2.646) |
| Net Asset Value, End of Period | $232.58 | $203.84 | $254.69 | $207.00 | $178.14 |
| Total Return | 15.99% | -18.68% | 24.52% | 18.22% | 31.04% |
| Ratios/Supplemental Data | |||||
| Net Assets, End of Period (Millions) | $59,376 | $49,861 | $57,774 | $41,587 | $29,014 |
| Ratio of Total Expenses to Average Net Assets | 0.04%2 | 0.04%2 | 0.04% | 0.04% | 0.04% |
| Ratio of Net Investment Income to Average Net Assets | 1.68% | 1.53% | 1.16% | 1.61% | 1.62% |
| Portfolio Turnover Rate3 | 13% | 12% | 16% | 26% | 15% |
| 1 | Calculated based on average shares outstanding. |
| 2 | The ratio of expenses to average net assets for the period net of reduction from custody fee offset arrangements was 0.04%. |
| 3 | Excludes the value of portfolio securities received or delivered as a result of in-kind purchases or redemptions of the fund’s capital shares, including ETF Creation Units. |
| Admiral Shares | |||||
| For a Share Outstanding Throughout Each Period | Year Ended December 31, | ||||
| 2023 | 2022 | 2021 | 2020 | 2019 | |
| Net Asset Value, Beginning of Period | $252.47 | $315.46 | $256.40 | $220.66 | $171.04 |
| Investment Operations | |||||
| Net Investment Income1 | 4.381 | 4.028 | 3.333 | 3.418 | 3.296 |
| Net Realized and Unrealized Gain (Loss) on Investments | 35.571 | (63.000) | 59.242 | 36.010 | 49.578 |
| Total from Investment Operations | 39.952 | (58.972) | 62.575 | 39.428 | 52.874 |
| Distributions | |||||
| Dividends from Net Investment Income | (4.352) | (4.018) | (3.515) | (3.688) | (3.254) |
| Distributions from Realized Capital Gains | — | — | — | — | — |
| Total Distributions | (4.352) | (4.018) | (3.515) | (3.688) | (3.254) |
| Net Asset Value, End of Period | $288.07 | $252.47 | $315.46 | $256.40 | $220.66 |
| Total Return2 | 15.98% | -18.71% | 24.51% | 18.24% | 31.03% |
| Ratios/Supplemental Data | |||||
| Net Assets, End of Period (Millions) | $57,330 | $51,352 | $65,118 | $53,301 | $47,640 |
| Ratio of Total Expenses to Average Net Assets | 0.05%3 | 0.05%3 | 0.05% | 0.05% | 0.05% |
| Ratio of Net Investment Income to Average Net Assets | 1.65% | 1.51% | 1.14% | 1.61% | 1.62% |
| Portfolio Turnover Rate4 | 13% | 12% | 16% | 26% | 15% |
| 1 | Calculated based on average shares outstanding. |
| 2 | Total returns do not include account service fees that may have applied in the periods shown. Fund prospectuses provide information about any applicable account service fees. |
| 3 | The ratio of expenses to average net assets for the period net of reduction from custody fee offset arrangements was 0.05%. |
| 4 | Excludes the value of portfolio securities received or delivered as a result of in-kind purchases or redemptions of the fund’s capital shares, including ETF Creation Units. |
| Institutional Shares | |||||
| For a Share Outstanding Throughout Each Period | Year Ended December 31, | ||||
| 2023 | 2022 | 2021 | 2020 | 2019 | |
| Net Asset Value, Beginning of Period | $55.77 | $69.69 | $56.64 | $48.74 | $37.78 |
| Investment Operations | |||||
| Net Investment Income1 | .971 | .893 | .743 | .759 | .727 |
| Net Realized and Unrealized Gain (Loss) on Investments | 7.866 | (13.919) | 13.090 | 7.961 | 10.957 |
| Total from Investment Operations | 8.837 | (13.026) | 13.833 | 8.720 | 11.684 |
| Distributions | |||||
| Dividends from Net Investment Income | (.967) | (.894) | (.783) | (.820) | (.724) |
| Distributions from Realized Capital Gains | — | — | — | — | — |
| Total Distributions | (.967) | (.894) | (.783) | (.820) | (.724) |
| Net Asset Value, End of Period | $63.64 | $55.77 | $69.69 | $56.64 | $48.74 |
| Total Return | 16.00% | -18.70% | 24.53% | 18.26% | 31.04% |
| Ratios/Supplemental Data | |||||
| Net Assets, End of Period (Millions) | $21,867 | $20,231 | $27,312 | $22,291 | $20,425 |
| Ratio of Total Expenses to Average Net Assets | 0.04%2 | 0.04%2 | 0.04% | 0.04% | 0.04% |
| Ratio of Net Investment Income to Average Net Assets | 1.66% | 1.51% | 1.15% | 1.62% | 1.62% |
| Portfolio Turnover Rate3 | 13% | 12% | 16% | 26% | 15% |
| 1 | Calculated based on average shares outstanding. |
| 2 | The ratio of expenses to average net assets for the period net of reduction from custody fee offset arrangements was 0.04%. |
| 3 | Excludes the value of portfolio securities received or delivered as a result of in-kind purchases or redemptions of the fund’s capital shares, including ETF Creation Units. |
| Institutional Plus Shares | |||||
| For a Share Outstanding Throughout Each Period | Year Ended December 31, | ||||
| 2023 | 2022 | 2021 | 2020 | 2019 | |
| Net Asset Value, Beginning of Period | $275.06 | $343.68 | $279.34 | $240.40 | $186.34 |
| Investment Operations | |||||
| Net Investment Income1 | 4.831 | 4.458 | 3.688 | 3.774 | 3.598 |
| Net Realized and Unrealized Gain (Loss) on Investments | 38.747 | (68.641) | 64.544 | 39.230 | 54.052 |
| Total from Investment Operations | 43.578 | (64.183) | 68.232 | 43.004 | 57.650 |
| Distributions | |||||
| Dividends from Net Investment Income | (4.798) | (4.437) | (3.892) | (4.064) | (3.590) |
| Distributions from Realized Capital Gains | — | — | — | — | — |
| Total Distributions | (4.798) | (4.437) | (3.892) | (4.064) | (3.590) |
| Net Asset Value, End of Period | $313.84 | $275.06 | $343.68 | $279.34 | $240.40 |
| Total Return | 16.00% | -18.69% | 24.53% | 18.27% | 31.06% |
| Ratios/Supplemental Data | |||||
| Net Assets, End of Period (Millions) | $16,472 | $14,846 | $17,723 | $14,937 | $13,612 |
| Ratio of Total Expenses to Average Net Assets | 0.03%2 | 0.03%2 | 0.03% | 0.03% | 0.03% |
| Ratio of Net Investment Income to Average Net Assets | 1.67% | 1.53% | 1.16% | 1.63% | 1.62% |
| Portfolio Turnover Rate3 | 13% | 12% | 16% | 26% | 15% |
| 1 | Calculated based on average shares outstanding. |
| 2 | The ratio of expenses to average net assets for the period net of reduction from custody fee offset arrangements was 0.03%. |
| 3 | Excludes the value of portfolio securities received or delivered as a result of in-kind purchases or redemptions of the fund’s capital shares, including ETF Creation Units. |
| Level 1 ($000) | Level 2 ($000) | Level 3 ($000) | Total ($000) | |
| Investments | ||||
| Assets | ||||
| Common Stocks | 154,511,384 | — | — | 154,511,384 |
| Temporary Cash Investments | 1,119,284 | — | — | 1,119,284 |
| Total | 155,630,668 | — | — | 155,630,668 |
| Derivative Financial Instruments | ||||
| Assets | ||||
| Futures Contracts1 | 7,544 | — | — | 7,544 |
| Swap Contracts | — | 44,191 | — | 44,191 |
| Total | 7,544 | 44,191 | — | 51,735 |
| Liabilities | ||||
| Swap Contracts | — | 1,185 | — | 1,185 |
| 1 | Includes cumulative appreciation (depreciation) on futures contracts and centrally cleared swaps, if any, as reported in the Schedule of Investments. Only current day’s variation margin is reported within the Statement of Assets and Liabilities. | |||
| Amount ($000) | |
| Paid-in Capital | 6,500,259 |
| Total Distributable Earnings (Loss) | (6,500,259) |
| Amount ($000) | |
| Undistributed Ordinary Income | 122,056 |
| Undistributed Long-Term Gains | — |
| Net Unrealized Gains (Losses) | 51,972,233 |
| Capital Loss Carryforwards | (21,193,850) |
| Qualified Late-Year Losses | — |
| Other Temporary Differences | — |
| Total | 30,900,439 |
| Year Ended December 31, | ||
| 2023 Amount ($000) | 2022 Amount ($000) | |
| Ordinary Income* | 2,358,301 | 2,172,301 |
| Long-Term Capital Gains | — | — |
| Total | 2,358,301 | 2,172,301 |
| * | Includes short-term capital gains, if any. |
| Amount ($000) | |
| Tax Cost | 103,658,435 |
| Gross Unrealized Appreciation | 56,003,239 |
| Gross Unrealized Depreciation | (4,031,006) |
| Net Unrealized Appreciation (Depreciation) | 51,972,233 |
| Year Ended December 31, | |||||
| 2023 | 2022 | ||||
| Amount ($000) | Shares (000) | Amount ($000) | Shares (000) | ||
| Investor Shares | |||||
| Issued | 24,944 | 427 | 38,431 | 646 | |
| Issued in Lieu of Cash Distributions | 6,392 | 109 | 7,365 | 130 | |
| Redeemed | (147,934) | (2,529) | (172,701) | (2,864) | |
| Net Increase (Decrease)—Investor Shares | (116,598) | (1,993) | (126,905) | (2,088) | |
| ETF Shares | |||||
| Issued | 14,593,074 | 68,060 | 22,366,377 | 104,145 | |
| Issued in Lieu of Cash Distributions | — | — | — | — | |
| Redeemed | (12,340,888) | (57,375) | (18,466,343) | (86,375) | |
| Net Increase (Decrease)—ETF Shares | 2,252,186 | 10,685 | 3,900,034 | 17,770 | |
| Admiral Shares | |||||
| Issued | 5,182,979 | 19,544 | 6,210,546 | 23,079 | |
| Issued in Lieu of Cash Distributions | 769,218 | 2,888 | 713,328 | 2,783 | |
| Redeemed | (7,117,265) | (26,814) | (7,754,279) | (28,889) | |
| Net Increase (Decrease)—Admiral Shares | (1,165,068) | (4,382) | (830,405) | (3,027) | |
| Institutional Shares | |||||
| Issued | 2,518,909 | 43,175 | 3,105,126 | 52,367 | |
| Issued in Lieu of Cash Distributions | 314,097 | 5,340 | 306,818 | 5,408 | |
| Redeemed | (3,971,793) | (67,623) | (5,170,558) | (86,962) | |
| Net Increase (Decrease)—Institutional Shares | (1,138,787) | (19,108) | (1,758,614) | (29,187) | |
| Year Ended December 31, | |||||
| 2023 | 2022 | ||||
| Amount ($000) | Shares (000) | Amount ($000) | Shares (000) | ||
| Institutional Plus Shares | |||||
| Issued | 1,384,915 | 4,823 | 2,083,499 | 7,084 | |
| Issued in Lieu of Cash Distributions | 254,963 | 879 | 233,744 | 837 | |
| Redeemed | (2,095,582) | (7,190) | (1,607,146) | (5,516) | |
| Net Increase (Decrease)—Institutional Plus Shares | (455,704) | (1,488) | 710,097 | 2,405 | |

| Average Annual Total Returns Periods Ended December 31, 2023 | |||||
| One Year | Five Years | Ten Years | Final Value of a $10,000 Investment | ||
|
| Mid-Cap Growth Index Fund Investor Shares | 22.99% | 13.57% | 9.98% | $25,896 |
|
| CRSP US Mid Cap Growth Index | 23.20 | 13.75 | 10.17 | 26,341 |
|
| Dow Jones U.S. Total Stock Market Float Adjusted Index | 26.06 | 15.05 | 11.40 | 29,422 |
| One Year | Five Years | Ten Years | Final Value of a $10,000 Investment | ||
| Mid-Cap Growth Index Fund ETF Shares Net Asset Value | 23.14% | 13.70% | 10.12% | $26,213 | |
| Mid-Cap Growth Index Fund ETF Shares Market Price | 23.21 | 13.72 | 10.12 | 26,220 | |
| CRSP US Mid Cap Growth Index | 23.20 | 13.75 | 10.17 | 26,341 | |
| Dow Jones U.S. Total Stock Market Float Adjusted Index | 26.06 | 15.05 | 11.40 | 29,422 | |
| One Year | Five Years | Ten Years | Final Value of a $10,000 Investment | ||
| Mid-Cap Growth Index Fund Admiral Shares | 23.14% | 13.70% | 10.12% | $26,214 | |
| CRSP US Mid Cap Growth Index | 23.20 | 13.75 | 10.17 | 26,341 | |
| Dow Jones U.S. Total Stock Market Float Adjusted Index | 26.06 | 15.05 | 11.40 | 29,422 | |
| Cumulative Returns of ETF Shares: December 31, 2013, Through December 31, 2023 | |||
| One Year | Five Years | Ten Years | |
| Mid-Cap Growth Index Fund ETF Shares Market Price | 23.21% | 90.16% | 162.20% |
| Mid-Cap Growth Index Fund ETF Shares Net Asset Value | 23.14 | 90.01 | 162.13 |
| CRSP US Mid Cap Growth Index | 23.20 | 90.44 | 163.41 |
| Basic Materials | 1.7% |
| Consumer Discretionary | 13.1 |
| Consumer Staples | 1.9 |
| Energy | 6.9 |
| Financials | 6.9 |
| Health Care | 11.5 |
| Industrials | 20.2 |
| Real Estate | 7.3 |
| Technology | 24.8 |
| Telecommunications | 3.9 |
| Utilities | 1.8 |
| Futures Contracts | ||||
| ($000) | ||||
| Expiration | Number of Long (Short) Contracts | Notional Amount | Value and Unrealized Appreciation (Depreciation) | |
| Long Futures Contracts | ||||
| E-mini S&P 500 Index | March 2024 | 42 | 10,122 | 66 |
| E-mini S&P Mid-Cap 400 Index | March 2024 | 16 | 4,495 | (23) |
| 43 | ||||
| Over-the-Counter Total Return Swaps | ||||||
| Reference Entity | Termination Date | Counterparty | Notional Amount ($000) | Floating Interest Rate Received (Paid)1 (%) | Value and Unrealized Appreciation ($000) | Value and Unrealized (Depreciation) ($000) |
| Domino's Pizza Inc. | 8/30/24 | BANA | 10,608 | (5.332) | 511 | — |
| Domino's Pizza Inc. | 8/30/24 | BANA | 10,608 | (5.332) | 511 | — |
| 1,022 | — | |||||
| 1 | Based on USD Overnight Bank Funding Rate as of the most recent reset date. Floating interest payment received/paid monthly. |
| BANA—Bank of America, N.A. |
| ($000s, except shares, footnotes, and per-share amounts) | Amount |
| Assets | |
| Investments in Securities, at Value1 | |
| Unaffiliated Issuers (Cost $16,089,470) | 22,977,038 |
| Affiliated Issuers (Cost $62,161) | 62,161 |
| Total Investments in Securities | 23,039,199 |
| Investment in Vanguard | 707 |
| Cash Collateral Pledged—Futures Contracts | 1,670 |
| Receivables for Investment Securities Sold | 281 |
| Receivables for Accrued Income | 9,041 |
| Receivables for Capital Shares Issued | 7,869 |
| Unrealized Appreciation—Over-the-Counter Swap Contracts | 1,022 |
| Total Assets | 23,059,789 |
| Liabilities | |
| Due to Custodian | 266 |
| Payables for Investment Securities Purchased | 246 |
| Collateral for Securities on Loan | 19,279 |
| Payables for Capital Shares Redeemed | 34,207 |
| Payables to Vanguard | 706 |
| Variation Margin Payable—Futures Contracts | 189 |
| Total Liabilities | 54,893 |
| Net Assets | 23,004,896 |
| 1 Includes $17,419,000 of securities on loan. | |
At December 31, 2023, net assets consisted of: | |
| Paid-in Capital | 20,611,267 |
| Total Distributable Earnings (Loss) | 2,393,629 |
| Net Assets | 23,004,896 |
| Investor Shares—Net Assets | |
| Applicable to 572,826 outstanding $.001 par value shares of beneficial interest (unlimited authorization) | 49,471 |
| Net Asset Value Per Share—Investor Shares | $86.36 |
| ETF Shares—Net Assets | |
| Applicable to 53,966,345 outstanding $.001 par value shares of beneficial interest (unlimited authorization) | 11,851,141 |
| Net Asset Value Per Share—ETF Shares | $219.60 |
| Admiral Shares—Net Assets | |
| Applicable to 117,467,797 outstanding $.001 par value shares of beneficial interest (unlimited authorization) | 11,104,284 |
| Net Asset Value Per Share—Admiral Shares | $94.53 |
| Year Ended December 31, 2023 | |
| ($000) | |
| Investment Income | |
| Income | |
| Dividends1 | 176,605 |
| Interest2 | 1,197 |
| Securities Lending—Net | 2,061 |
| Total Income | 179,863 |
| Expenses | |
| The Vanguard Group—Note B | |
| Investment Advisory Services | 446 |
| Management and Administrative—Investor Shares | 82 |
| Management and Administrative—ETF Shares | 6,025 |
| Management and Administrative—Admiral Shares | 6,053 |
| Marketing and Distribution—Investor Shares | 3 |
| Marketing and Distribution—ETF Shares | 585 |
| Marketing and Distribution—Admiral Shares | 528 |
| Custodian Fees | 86 |
| Auditing Fees | 34 |
| Shareholders’ Reports—Investor Shares | — |
| Shareholders’ Reports—ETF Shares | 373 |
| Shareholders’ Reports—Admiral Shares | 139 |
| Trustees’ Fees and Expenses | 12 |
| Other Expenses | 23 |
| Total Expenses | 14,389 |
| Net Investment Income | 165,474 |
| Realized Net Gain (Loss) | |
| Investment Securities Sold2,3 | (359,856) |
| Futures Contracts | 2,140 |
| Swap Contracts | 66 |
| Realized Net Gain (Loss) | (357,650) |
| Change in Unrealized Appreciation (Depreciation) | |
| Investment Securities2 | 4,490,460 |
| Futures Contracts | 282 |
| Swap Contracts | 1,022 |
| Change in Unrealized Appreciation (Depreciation) | 4,491,764 |
| Net Increase (Decrease) in Net Assets Resulting from Operations | 4,299,588 |
| 1 | Dividends are net of foreign withholding taxes of $279,000. |
| 2 | Interest income, realized net gain (loss), capital gain distributions received, and change in unrealized appreciation (depreciation) from an affiliated company of the fund were $1,140,000, ($1,000), less than $1,000, and ($25,000), respectively. Purchases and sales are for temporary cash investment purposes. |
| 3 | Includes $792,304,000 of net gain (loss) resulting from in-kind redemptions. |
| Year Ended December 31, | ||
| 2023 ($000) | 2022 ($000) | |
| Increase (Decrease) in Net Assets | ||
| Operations | ||
| Net Investment Income | 165,474 | 143,006 |
| Realized Net Gain (Loss) | (357,650) | (287,627) |
| Change in Unrealized Appreciation (Depreciation) | 4,491,764 | (7,290,573) |
| Net Increase (Decrease) in Net Assets Resulting from Operations | 4,299,588 | (7,435,194) |
| Distributions | ||
| Investor Shares | (311) | (306) |
| ETF Shares | (83,169) | (71,823) |
| Admiral Shares | (79,306) | (70,682) |
| Total Distributions | (162,786) | (142,811) |
| Capital Share Transactions | ||
| Investor Shares | (6,325) | (17,561) |
| ETF Shares | 427,802 | 298,485 |
| Admiral Shares | (37,033) | 99,556 |
| Net Increase (Decrease) from Capital Share Transactions | 384,444 | 380,480 |
| Total Increase (Decrease) | 4,521,246 | (7,197,525) |
| Net Assets | ||
| Beginning of Period | 18,483,650 | 25,681,175 |
| End of Period | 23,004,896 | 18,483,650 |
| Investor Shares | |||||
| For a Share Outstanding Throughout Each Period | Year Ended December 31, | ||||
| 2023 | 2022 | 2021 | 2020 | 2019 | |
| Net Asset Value, Beginning of Period | $70.68 | $100.07 | $83.37 | $62.43 | $47.02 |
| Investment Operations | |||||
| Net Investment Income1 | .528 | .444 | .229 | .340 | .345 |
| Net Realized and Unrealized Gain (Loss) on Investments | 15.674 | (29.381) | 16.697 | 20.984 | 15.485 |
| Total from Investment Operations | 16.202 | (28.937) | 16.926 | 21.324 | 15.830 |
| Distributions | |||||
| Dividends from Net Investment Income | (.522) | (.453) | (.226) | (.384) | (.420) |
| Distributions from Realized Capital Gains | — | — | — | — | — |
| Total Distributions | (.522) | (.453) | (.226) | (.384) | (.420) |
| Net Asset Value, End of Period | $86.36 | $70.68 | $100.07 | $83.37 | $62.43 |
| Total Return2 | 22.99% | -28.93% | 20.32% | 34.32% | 33.72% |
| Ratios/Supplemental Data | |||||
| Net Assets, End of Period (Millions) | $49 | $46 | $86 | $81 | $63 |
| Ratio of Total Expenses to Average Net Assets | 0.19% | 0.19%3 | 0.19% | 0.19% | 0.19% |
| Ratio of Net Investment Income to Average Net Assets | 0.68% | 0.57% | 0.25% | 0.51% | 0.62% |
| Portfolio Turnover Rate4 | 14% | 22% | 25% | 22% | 18% |
| 1 | Calculated based on average shares outstanding. |
| 2 | Total returns do not include account service fees that may have applied in the periods shown. Fund prospectuses provide information about any applicable account service fees. |
| 3 | The ratio of expenses to average net assets for the period net of reduction from custody fee offset arrangements was 0.19%. |
| 4 | Excludes the value of portfolio securities received or delivered as a result of in-kind purchases or redemptions of the fund’s capital shares, including ETF Creation Units. |
| ETF Shares | |||||
| For a Share Outstanding Throughout Each Period | Year Ended December 31, | ||||
| 2023 | 2022 | 2021 | 2020 | 2019 | |
| Net Asset Value, Beginning of Period | $179.73 | $254.49 | $212.00 | $158.76 | $119.58 |
| Investment Operations | |||||
| Net Investment Income1 | 1.601 | 1.405 | .870 | 1.074 | 1.386 |
| Net Realized and Unrealized Gain (Loss) on Investments | 39.835 | (74.767) | 42.479 | 53.347 | 39.040 |
| Total from Investment Operations | 41.436 | (73.362) | 43.349 | 54.421 | 40.426 |
| Distributions | |||||
| Dividends from Net Investment Income | (1.566) | (1.398) | (.859) | (1.181) | (1.246) |
| Distributions from Realized Capital Gains | — | — | — | — | — |
| Total Distributions | (1.566) | (1.398) | (.859) | (1.181) | (1.246) |
| Net Asset Value, End of Period | $219.60 | $179.73 | $254.49 | $212.00 | $158.76 |
| Total Return | 23.14% | -28.84% | 20.47% | 34.46% | 33.86% |
| Ratios/Supplemental Data | |||||
| Net Assets, End of Period (Millions) | $11,851 | $9,313 | $12,798 | $10,164 | $6,995 |
| Ratio of Total Expenses to Average Net Assets | 0.07% | 0.07%2 | 0.07% | 0.07% | 0.07% |
| Ratio of Net Investment Income to Average Net Assets | 0.81% | 0.72% | 0.37% | 0.63% | 0.95% |
| Portfolio Turnover Rate3 | 14% | 22% | 25% | 22% | 18% |
| 1 | Calculated based on average shares outstanding. |
| 2 | The ratio of expenses to average net assets for the period net of reduction from custody fee offset arrangements was 0.07%. |
| 3 | Excludes the value of portfolio securities received or delivered as a result of in-kind purchases or redemptions of the fund’s capital shares, including ETF Creation Units. |
| Admiral Shares | |||||
| For a Share Outstanding Throughout Each Period | Year Ended December 31, | ||||
| 2023 | 2022 | 2021 | 2020 | 2019 | |
| Net Asset Value, Beginning of Period | $77.37 | $109.55 | $91.26 | $68.34 | $51.48 |
| Investment Operations | |||||
| Net Investment Income1 | .684 | .602 | .373 | .461 | .603 |
| Net Realized and Unrealized Gain (Loss) on Investments | 17.150 | (32.180) | 18.287 | 22.967 | 16.793 |
| Total from Investment Operations | 17.834 | (31.578) | 18.660 | 23.428 | 17.396 |
| Distributions | |||||
| Dividends from Net Investment Income | (.674) | (.602) | (.370) | (.508) | (.536) |
| Distributions from Realized Capital Gains | — | — | — | — | — |
| Total Distributions | (.674) | (.602) | (.370) | (.508) | (.536) |
| Net Asset Value, End of Period | $94.53 | $77.37 | $109.55 | $91.26 | $68.34 |
| Total Return2 | 23.14% | -28.84% | 20.48% | 34.48% | 33.86% |
| Ratios/Supplemental Data | |||||
| Net Assets, End of Period (Millions) | $11,104 | $9,124 | $12,797 | $10,712 | $8,173 |
| Ratio of Total Expenses to Average Net Assets | 0.07% | 0.07%3 | 0.07% | 0.07% | 0.07% |
| Ratio of Net Investment Income to Average Net Assets | 0.81% | 0.71% | 0.37% | 0.63% | 0.96% |
| Portfolio Turnover Rate4 | 14% | 22% | 25% | 22% | 18% |
| 1 | Calculated based on average shares outstanding. |
| 2 | Total returns do not include account service fees that may have applied in the periods shown. Fund prospectuses provide information about any applicable account service fees. |
| 3 | The ratio of expenses to average net assets for the period net of reduction from custody fee offset arrangements was 0.07%. |
| 4 | Excludes the value of portfolio securities received or delivered as a result of in-kind purchases or redemptions of the fund’s capital shares, including ETF Creation Units. |
| Level 1 ($000) | Level 2 ($000) | Level 3 ($000) | Total ($000) | |
| Investments | ||||
| Assets | ||||
| Common Stocks | 22,977,038 | — | — | 22,977,038 |
| Temporary Cash Investments | 62,161 | — | — | 62,161 |
| Total | 23,039,199 | — | — | 23,039,199 |
| Derivative Financial Instruments | ||||
| Assets | ||||
| Futures Contracts1 | 66 | — | — | 66 |
| Swap Contracts | — | 1,022 | — | 1,022 |
| Total | 66 | 1,022 | — | 1,088 |
| Liabilities | ||||
| Futures Contracts1 | 23 | — | — | 23 |
| 1 | Includes cumulative appreciation (depreciation) on futures contracts and centrally cleared swaps, if any, as reported in the Schedule of Investments. Only current day’s variation margin is reported within the Statement of Assets and Liabilities. | |||
| Amount ($000) | |
| Paid-in Capital | 793,305 |
| Total Distributable Earnings (Loss) | (793,305) |
| Amount ($000) | |
| Undistributed Ordinary Income | 5,044 |
| Undistributed Long-Term Gains | — |
| Net Unrealized Gains (Losses) | 6,850,493 |
| Capital Loss Carryforwards | (4,461,908) |
| Qualified Late-Year Losses | — |
| Other Temporary Differences | — |
| Total | 2,393,629 |
| Year Ended December 31, | ||
| 2023 Amount ($000) | 2022 Amount ($000) | |
| Ordinary Income* | 162,786 | 142,811 |
| Long-Term Capital Gains | — | — |
| Total | 162,786 | 142,811 |
| * | Includes short-term capital gains, if any. |
| Amount ($000) | |
| Tax Cost | 16,188,706 |
| Gross Unrealized Appreciation | 7,690,754 |
| Gross Unrealized Depreciation | (840,261) |
| Net Unrealized Appreciation (Depreciation) | 6,850,493 |
| Year Ended December 31, | |||||
| 2023 | 2022 | ||||
| Amount ($000) | Shares (000) | Amount ($000) | Shares (000) | ||
| Investor Shares | |||||
| Issued | 8,551 | 109 | 7,152 | 91 | |
| Issued in Lieu of Cash Distributions | 311 | 4 | 306 | 4 | |
| Redeemed | (15,187) | (192) | (25,019) | (303) | |
| Net Increase (Decrease)—Investor Shares | (6,325) | (79) | (17,561) | (208) | |
| ETF Shares | |||||
| Issued | 2,058,259 | 10,398 | 4,309,536 | 22,204 | |
| Issued in Lieu of Cash Distributions | — | — | — | — | |
| Redeemed | (1,630,457) | (8,250) | (4,011,051) | (20,674) | |
| Net Increase (Decrease)—ETF Shares | 427,802 | 2,148 | 298,485 | 1,530 | |
| Admiral Shares | |||||
| Issued | 1,523,152 | 17,926 | 1,795,061 | 20,960 | |
| Issued in Lieu of Cash Distributions | 70,921 | 822 | 63,404 | 794 | |
| Redeemed | (1,631,106) | (19,219) | (1,758,909) | (20,629) | |
| Net Increase (Decrease)—Admiral Shares | (37,033) | (471) | 99,556 | 1,125 | |

| Average Annual Total Returns Periods Ended December 31, 2023 | |||||
| One Year | Five Years | Ten Years | Final Value of a $10,000 Investment | ||
|
| Mid-Cap Value Index Fund Investor Shares | 9.62% | 11.17% | 8.36% | $22,320 |
|
| CRSP US Mid Cap Value Index | 9.78 | 11.34 | 8.53 | 22,667 |
|
| Dow Jones U.S. Total Stock Market Float Adjusted Index | 26.06 | 15.05 | 11.40 | 29,422 |
| One Year | Five Years | Ten Years | Final Value of a $10,000 Investment | ||
| Mid-Cap Value Index Fund ETF Shares Net Asset Value | 9.77% | 11.30% | 8.49% | $22,587 | |
| Mid-Cap Value Index Fund ETF Shares Market Price | 9.83 | 11.31 | 8.49 | 22,589 | |
| CRSP US Mid Cap Value Index | 9.78 | 11.34 | 8.53 | 22,667 | |
| Dow Jones U.S. Total Stock Market Float Adjusted Index | 26.06 | 15.05 | 11.40 | 29,422 | |
| One Year | Five Years | Ten Years | Final Value of a $10,000 Investment | ||
| Mid-Cap Value Index Fund Admiral Shares | 9.76% | 11.31% | 8.49% | $22,591 | |
| CRSP US Mid Cap Value Index | 9.78 | 11.34 | 8.53 | 22,667 | |
| Dow Jones U.S. Total Stock Market Float Adjusted Index | 26.06 | 15.05 | 11.40 | 29,422 | |
| Cumulative Returns of ETF Shares: December 31, 2013, Through December 31, 2023 | |||
| One Year | Five Years | Ten Years | |
| Mid-Cap Value Index Fund ETF Shares Market Price | 9.83% | 70.87% | 125.89% |
| Mid-Cap Value Index Fund ETF Shares Net Asset Value | 9.77 | 70.76 | 125.87 |
| CRSP US Mid Cap Value Index | 9.78 | 71.08 | 126.67 |
| Basic Materials | 5.6% |
| Consumer Discretionary | 13.0 |
| Consumer Staples | 6.7 |
| Energy | 3.2 |
| Financials | 17.5 |
| Health Care | 7.7 |
| Industrials | 19.4 |
| Real Estate | 9.2 |
| Technology | 5.5 |
| Utilities | 12.2 |
| Futures Contracts | ||||
| ($000) | ||||
| Expiration | Number of Long (Short) Contracts | Notional Amount | Value and Unrealized Appreciation (Depreciation) | |
| Long Futures Contracts | ||||
| E-mini S&P 500 Index | March 2024 | 26 | 6,266 | (17) |
| E-mini S&P Mid-Cap 400 Index | March 2024 | 48 | 13,486 | (128) |
| (145) | ||||
| Over-the-Counter Total Return Swaps | ||||||
| Reference Entity | Termination Date | Counterparty | Notional Amount ($000) | Floating Interest Rate Received (Paid)1 (%) | Value and Unrealized Appreciation ($000) | Value and Unrealized (Depreciation) ($000) |
| Constellation Energy Corp. | 1/31/24 | CITNA | 25,176 | (5.332) | — | (909) |
| Constellation Energy Corp. | 8/30/24 | BANA | 14,525 | (5.332) | — | (524) |
| Warner Bros Discovery Inc. | 1/31/24 | CITNA | 16,093 | (5.332) | 1,365 | — |
| 1,365 | (1,433) | |||||
| 1 | Based on USD Overnight Bank Funding Rate as of the most recent reset date. Floating interest payment received/paid monthly. |
| BANA—Bank of America, N.A. | |
| CITNA—Citibank, N.A. |
| ($000s, except shares, footnotes, and per-share amounts) | Amount |
| Assets | |
| Investments in Securities, at Value1 | |
| Unaffiliated Issuers (Cost $21,606,256) | 28,269,155 |
| Affiliated Issuers (Cost $48,429) | 48,445 |
| Total Investments in Securities | 28,317,600 |
| Investment in Vanguard | 892 |
| Cash Collateral Pledged—Futures Contracts | 1,390 |
| Cash Collateral Pledged—Over-the-Counter Swap Contracts | 270 |
| Receivables for Investment Securities Sold | 12,908 |
| Receivables for Accrued Income | 74,353 |
| Receivables for Capital Shares Issued | 9,309 |
| Unrealized Appreciation—Over-the-Counter Swap Contracts | 1,365 |
| Total Assets | 28,418,087 |
| Liabilities | |
| Due to Custodian | 4,322 |
| Payables for Investment Securities Purchased | 211 |
| Collateral for Securities on Loan | 48,225 |
| Payables for Capital Shares Redeemed | 31,213 |
| Payables to Vanguard | 872 |
| Variation Margin Payable—Futures Contracts | 177 |
| Unrealized Depreciation—Over-the-Counter Swap Contracts | 1,433 |
| Total Liabilities | 86,453 |
| Net Assets | 28,331,634 |
| 1 Includes $43,657,000 of securities on loan. | |
At December 31, 2023, net assets consisted of: | |
| Paid-in Capital | 26,772,587 |
| Total Distributable Earnings (Loss) | 1,559,047 |
| Net Assets | 28,331,634 |
| Investor Shares—Net Assets | |
| Applicable to 689,038 outstanding $.001 par value shares of beneficial interest (unlimited authorization) | 39,321 |
| Net Asset Value Per Share—Investor Shares | $57.07 |
| ETF Shares—Net Assets | |
| Applicable to 112,610,775 outstanding $.001 par value shares of beneficial interest (unlimited authorization) | 16,320,349 |
| Net Asset Value Per Share—ETF Shares | $144.93 |
| Admiral Shares—Net Assets | |
| Applicable to 159,460,910 outstanding $.001 par value shares of beneficial interest (unlimited authorization) | 11,971,964 |
| Net Asset Value Per Share—Admiral Shares | $75.08 |
| Year Ended December 31, 2023 | |
| ($000) | |
| Investment Income | |
| Income | |
| Dividends | 666,368 |
| Interest1 | 1,354 |
| Securities Lending—Net | 6,750 |
| Total Income | 674,472 |
| Expenses | |
| The Vanguard Group—Note B | |
| Investment Advisory Services | 602 |
| Management and Administrative—Investor Shares | 72 |
| Management and Administrative—ETF Shares | 8,914 |
| Management and Administrative—Admiral Shares | 6,936 |
| Marketing and Distribution—Investor Shares | 2 |
| Marketing and Distribution—ETF Shares | 842 |
| Marketing and Distribution—Admiral Shares | 629 |
| Custodian Fees | 348 |
| Auditing Fees | 35 |
| Shareholders’ Reports—Investor Shares | — |
| Shareholders’ Reports—ETF Shares | 751 |
| Shareholders’ Reports—Admiral Shares | 162 |
| Trustees’ Fees and Expenses | 16 |
| Other Expenses | 23 |
| Total Expenses | 19,332 |
| Expenses Paid Indirectly | (18) |
| Net Expenses | 19,314 |
| Net Investment Income | 655,158 |
| Realized Net Gain (Loss) | |
| Investment Securities Sold1,2 | 579,354 |
| Futures Contracts | 4,634 |
| Swap Contracts | 3,729 |
| Realized Net Gain (Loss) | 587,717 |
| Change in Unrealized Appreciation (Depreciation) | |
| Investment Securities1 | 1,330,296 |
| Futures Contracts | 245 |
| Swap Contracts | 1,375 |
| Change in Unrealized Appreciation (Depreciation) | 1,331,916 |
| Net Increase (Decrease) in Net Assets Resulting from Operations | 2,574,791 |
| 1 | Interest income, realized net gain (loss), capital gain distributions received, and change in unrealized appreciation (depreciation) from an affiliated company of the fund were $1,263,000, $25,000, less than $1,000, and ($5,000), respectively. Purchases and sales are for temporary cash investment purposes. |
| 2 | Includes $1,739,804,000 of net gain (loss) resulting from in-kind redemptions. |
| Year Ended December 31, | ||
| 2023 ($000) | 2022 ($000) | |
| Increase (Decrease) in Net Assets | ||
| Operations | ||
| Net Investment Income | 655,158 | 625,353 |
| Realized Net Gain (Loss) | 587,717 | 1,031,827 |
| Change in Unrealized Appreciation (Depreciation) | 1,331,916 | (4,126,567) |
| Net Increase (Decrease) in Net Assets Resulting from Operations | 2,574,791 | (2,469,387) |
| Distributions | ||
| Investor Shares | (921) | (970) |
| ETF Shares | (379,681) | (356,532) |
| Admiral Shares | (277,948) | (267,459) |
| Total Distributions | (658,550) | (624,961) |
| Capital Share Transactions | ||
| Investor Shares | (7,800) | (7,678) |
| ETF Shares | (785,146) | 1,666,234 |
| Admiral Shares | (570,787) | (147,140) |
| Net Increase (Decrease) from Capital Share Transactions | (1,363,733) | 1,511,416 |
| Total Increase (Decrease) | 552,508 | (1,582,932) |
| Net Assets | ||
| Beginning of Period | 27,779,126 | 29,362,058 |
| End of Period | 28,331,634 | 27,779,126 |
| Investor Shares | |||||
| For a Share Outstanding Throughout Each Period | Year Ended December 31, | ||||
| 2023 | 2022 | 2021 | 2020 | 2019 | |
| Net Asset Value, Beginning of Period | $53.27 | $59.16 | $46.83 | $46.96 | $37.50 |
| Investment Operations | |||||
| Net Investment Income1 | 1.202 | 1.129 | 1.006 | 1.0482 | .808 |
| Net Realized and Unrealized Gain (Loss) on Investments | 3.830 | (5.876) | 12.311 | (.122) | 9.566 |
| Total from Investment Operations | 5.032 | (4.747) | 13.317 | .926 | 10.374 |
| Distributions | |||||
| Dividends from Net Investment Income | (1.232) | (1.143) | (.987) | (1.056) | (.914) |
| Distributions from Realized Capital Gains | — | — | — | — | — |
| Total Distributions | (1.232) | (1.143) | (.987) | (1.056) | (.914) |
| Net Asset Value, End of Period | $57.07 | $53.27 | $59.16 | $46.83 | $46.96 |
| Total Return3 | 9.62% | -8.00% | 28.59% | 2.43% | 27.82% |
| Ratios/Supplemental Data | |||||
| Net Assets, End of Period (Millions) | $39 | $45 | $57 | $43 | $52 |
| Ratio of Total Expenses to Average Net Assets | 0.19%4 | 0.19%4 | 0.19% | 0.19% | 0.19% |
| Ratio of Net Investment Income to Average Net Assets | 2.24% | 2.05% | 1.83% | 2.58%2 | 1.90% |
| Portfolio Turnover Rate5 | 22% | 18% | 17% | 39% | 17% |
| 1 | Calculated based on average shares outstanding. |
| 2 | Net investment income per share and the ratio of net investment income to average net assets include $.142 and 0.35%, respectively, resulting from a special dividend from NortonLifeLock Inc. in February 2020. |
| 3 | Total returns do not include account service fees that may have applied in the periods shown. Fund prospectuses provide information about any applicable account service fees. |
| 4 | The ratio of expenses to average net assets for the period net of reduction from custody fee offset arrangements was 0.19%. |
| 5 | Excludes the value of portfolio securities received or delivered as a result of in-kind purchases or redemptions of the fund’s capital shares, including ETF Creation Units. |
| ETF Shares | |||||
| For a Share Outstanding Throughout Each Period | Year Ended December 31, | ||||
| 2023 | 2022 | 2021 | 2020 | 2019 | |
| Net Asset Value, Beginning of Period | $135.28 | $150.26 | $118.93 | $119.27 | $95.22 |
| Investment Operations | |||||
| Net Investment Income1 | 3.249 | 3.091 | 2.744 | 2.7812 | 2.497 |
| Net Realized and Unrealized Gain (Loss) on Investments | 9.695 | (14.996) | 31.258 | (.310) | 23.996 |
| Total from Investment Operations | 12.944 | (11.905) | 34.002 | 2.471 | 26.493 |
| Distributions | |||||
| Dividends from Net Investment Income | (3.294) | (3.075) | (2.672) | (2.811) | (2.443) |
| Distributions from Realized Capital Gains | — | — | — | — | — |
| Total Distributions | (3.294) | (3.075) | (2.672) | (2.811) | (2.443) |
| Net Asset Value, End of Period | $144.93 | $135.28 | $150.26 | $118.93 | $119.27 |
| Total Return | 9.77% | -7.88% | 28.74% | 2.50% | 27.98% |
| Ratios/Supplemental Data | |||||
| Net Assets, End of Period (Millions) | $16,320 | $15,995 | $16,086 | $11,061 | $10,339 |
| Ratio of Total Expenses to Average Net Assets | 0.07%3 | 0.07%3 | 0.07% | 0.07% | 0.07% |
| Ratio of Net Investment Income to Average Net Assets | 2.38% | 2.22% | 1.96% | 2.69%2 | 2.26% |
| Portfolio Turnover Rate4 | 22% | 18% | 17% | 39% | 17% |
| 1 | Calculated based on average shares outstanding. |
| 2 | Net investment income per share and the ratio of net investment income to average net assets include $.362 and 0.35%, respectively, resulting from a special dividend from NortonLifeLock Inc. in February 2020. |
| 3 | The ratio of expenses to average net assets for the period net of reduction from custody fee offset arrangements was 0.07%. |
| 4 | Excludes the value of portfolio securities received or delivered as a result of in-kind purchases or redemptions of the fund’s capital shares, including ETF Creation Units. |
| Admiral Shares | |||||
| For a Share Outstanding Throughout Each Period | Year Ended December 31, | ||||
| 2023 | 2022 | 2021 | 2020 | 2019 | |
| Net Asset Value, Beginning of Period | $70.08 | $77.84 | $61.61 | $61.79 | $49.33 |
| Investment Operations | |||||
| Net Investment Income1 | 1.677 | 1.586 | 1.413 | 1.4382 | 1.303 |
| Net Realized and Unrealized Gain (Loss) on Investments | 5.030 | (7.753) | 16.201 | (.162) | 12.422 |
| Total from Investment Operations | 6.707 | (6.167) | 17.614 | 1.276 | 13.725 |
| Distributions | |||||
| Dividends from Net Investment Income | (1.707) | (1.593) | (1.384) | (1.456) | (1.265) |
| Distributions from Realized Capital Gains | — | — | — | — | — |
| Total Distributions | (1.707) | (1.593) | (1.384) | (1.456) | (1.265) |
| Net Asset Value, End of Period | $75.08 | $70.08 | $77.84 | $61.61 | $61.79 |
| Total Return3 | 9.76% | -7.90% | 28.76% | 2.54% | 27.99% |
| Ratios/Supplemental Data | |||||
| Net Assets, End of Period (Millions) | $11,972 | $11,740 | $13,218 | $10,092 | $11,148 |
| Ratio of Total Expenses to Average Net Assets | 0.07%4 | 0.07%4 | 0.07% | 0.07% | 0.07% |
| Ratio of Net Investment Income to Average Net Assets | 2.37% | 2.19% | 1.95% | 2.69%2 | 2.28% |
| Portfolio Turnover Rate5 | 22% | 18% | 17% | 39% | 17% |
| 1 | Calculated based on average shares outstanding. |
| 2 | Net investment income per share and the ratio of net investment income to average net assets include $.187 and 0.35%, respectively, resulting from a special dividend from NortonLifeLock Inc. in February 2020. |
| 3 | Total returns do not include account service fees that may have applied in the periods shown. Fund prospectuses provide information about any applicable account service fees. |
| 4 | The ratio of expenses to average net assets for the period net of reduction from custody fee offset arrangements was 0.07%. |
| 5 | Excludes the value of portfolio securities received or delivered as a result of in-kind purchases or redemptions of the fund’s capital shares, including ETF Creation Units. |
| Level 1 ($000) | Level 2 ($000) | Level 3 ($000) | Total ($000) | |
| Investments | ||||
| Assets | ||||
| Common Stocks | 28,269,155 | — | — | 28,269,155 |
| Temporary Cash Investments | 48,445 | — | — | 48,445 |
| Total | 28,317,600 | — | — | 28,317,600 |
| Derivative Financial Instruments | ||||
| Assets | ||||
| Swap Contracts | — | 1,365 | — | 1,365 |
| Liabilities | ||||
| Futures Contracts1 | 145 | — | — | 145 |
| Swap Contracts | — | 1,433 | — | 1,433 |
| Total | 145 | 1,433 | — | 1,578 |
| 1 | Includes cumulative appreciation (depreciation) on futures contracts and centrally cleared swaps, if any, as reported in the Schedule of Investments. Only current day’s variation margin is reported within the Statement of Assets and Liabilities. | |||
| Amount ($000) | |
| Paid-in Capital | 1,739,093 |
| Total Distributable Earnings (Loss) | (1,739,093) |
| Amount ($000) | |
| Undistributed Ordinary Income | 6,194 |
| Undistributed Long-Term Gains | — |
| Net Unrealized Gains (Losses) | 6,642,233 |
| Capital Loss Carryforwards | (5,089,380) |
| Qualified Late-Year Losses | — |
| Other Temporary Differences | — |
| Total | 1,559,047 |
| Year Ended December 31, | ||
| 2023 Amount ($000) | 2022 Amount ($000) | |
| Ordinary Income* | 658,550 | 624,961 |
| Long-Term Capital Gains | — | — |
| Total | 658,550 | 624,961 |
| * | Includes short-term capital gains, if any. |
| Amount ($000) | |
| Tax Cost | 21,675,367 |
| Gross Unrealized Appreciation | 7,258,712 |
| Gross Unrealized Depreciation | (616,479) |
| Net Unrealized Appreciation (Depreciation) | 6,642,233 |
| Year Ended December 31, | |||||
| 2023 | 2022 | ||||
| Amount ($000) | Shares (000) | Amount ($000) | Shares (000) | ||
| Investor Shares | |||||
| Issued | 4,382 | 82 | 9,543 | 172 | |
| Issued in Lieu of Cash Distributions | 921 | 17 | 970 | 18 | |
| Redeemed | (13,103) | (245) | (18,191) | (326) | |
| Net Increase (Decrease)—Investor Shares | (7,800) | (146) | (7,678) | (136) | |
| ETF Shares | |||||
| Issued | 3,747,400 | 27,552 | 6,026,513 | 43,603 | |
| Issued in Lieu of Cash Distributions | — | — | — | — | |
| Redeemed | (4,532,546) | (33,175) | (4,360,279) | (32,425) | |
| Net Increase (Decrease)—ETF Shares | (785,146) | (5,623) | 1,666,234 | 11,178 | |
| Admiral Shares | |||||
| Issued | 1,601,367 | 22,657 | 2,265,008 | 31,170 | |
| Issued in Lieu of Cash Distributions | 246,708 | 3,514 | 237,416 | 3,400 | |
| Redeemed | (2,418,862) | (34,228) | (2,649,564) | (36,866) | |
| Net Increase (Decrease)—Admiral Shares | (570,787) | (8,057) | (147,140) | (2,296) | |
Philadelphia, Pennsylvania
February 15, 2024
| Fund | Percentage |
| Extended Market Index Fund | 62.4% |
| Mid-Cap Index Fund | 77.1 |
| Mid-Cap Growth Index Fund | 82.0 |
| Mid-Cap Value Index Fund | 80.8 |
| Fund | ($000) |
| Extended Market Index Fund | 838,526 |
| Mid-Cap Index Fund | 1,992,764 |
| Mid-Cap Growth Index Fund | 139,980 |
| Mid-Cap Value Index Fund | 563,390 |
| Fund | ($000) |
| Extended Market Index Fund | 12,975 |
| Mid-Cap Index Fund | 13,468 |
| Mid-Cap Growth Index Fund | 427 |
| Mid-Cap Value Index Fund | 499 |
| Fund | ($000) |
| Extended Market Index Fund | 214,308 |
| Mid-Cap Index Fund | 339,831 |
| Mid-Cap Growth Index Fund | 22,806 |
| Mid-Cap Value Index Fund | 93,843 |


| Vanguard Growth Index Fund |
| Vanguard Value Index Fund |
| Vanguard Large-Cap Index Fund |
Your Fund’s Performance at a Glance | 1 |
About Your Fund’s Expenses | 2 |
Growth Index Fund | 4 |
Value Index Fund | 27 |
Large-Cap Index Fund | 52 |
| • | The financial markets delivered robust returns for the 12 months ended December 31, 2023. Returns for the funds included in this report ranged from 9.11% for Investor Shares of Vanguard Value Index Fund to 46.78% for Institutional Shares and ETF Shares of Vanguard Growth Index Fund. (Returns for ETF Shares are based on net asset value). Returns for Vanguard Large-Cap Index Fund, which invests in growth and value stocks, ranged from 27.12% for Investor Shares to 27.29% for ETF Shares. The funds generally tracked their target indexes closely. Most share classes of the Value Index Fund slightly outperformed, thanks to skilled trading and corporate-action elections by the fund’s manager, Vanguard Equity Index Group. |
| • | Major central banks stopped hiking interest rates when inflation eased. Global economic growth proved resilient, but the prospect of rates remaining high for an extended period spurred occasional volatility. Toward year-end, stocks and bonds rallied worldwide as expectations for rate cuts in 2024 rose. |
| • | Technology stocks powered all three funds, but strong results were widespread. Seven of the 11 sectors in the CRSP US Large Cap Index, the Large-Cap Index Fund’s benchmark, recorded double-digit gains. Energy stocks were among the laggards. |
| • | For the 10 years ended December 31, 2023, the funds’ annualized returns ranged from 9.59% for Investor Shares of the Value Index Fund to 13.98% for Institutional Shares of the Growth Index Fund. |
| Average Annual Total Returns Periods Ended December 31, 2023 | |||
| One Year | Three Years | Five Years | |
| Stocks | |||
| Russell 1000 Index (Large-caps) | 26.53% | 8.97% | 15.52% |
| Russell 2000 Index (Small-caps) | 16.93 | 2.22 | 9.97 |
| Russell 3000 Index (Broad U.S. market) | 25.96 | 8.54 | 15.16 |
| FTSE All-World ex US Index (International) | 15.82 | 1.98 | 7.52 |
| Bonds | |||
| Bloomberg U.S. Aggregate Float Adjusted Index (Broad taxable market) | 5.60% | -3.33% | 1.17% |
| Bloomberg Municipal Bond Index (Broad tax-exempt market) | 6.40 | -0.40 | 2.25 |
| FTSE Three-Month U.S. Treasury Bill Index | 5.26 | 2.24 | 1.91 |
| CPI | |||
| Consumer Price Index | 3.35% | 5.60% | 4.07% |
| • | Based on actual fund return. This section helps you to estimate the actual expenses that you paid over the period. The ”Ending Account Value“ shown is derived from the fund‘s actual return, and the third column shows the dollar amount that would have been paid by an investor who started with $1,000 in the fund. You may use the information here, together with the amount you invested, to estimate the expenses that you paid over the period. |
| • | Based on hypothetical 5% yearly return. This section is intended to help you compare your fund‘s costs with those of other mutual funds. It assumes that the fund had a yearly return of 5% before expenses, but that the expense ratio is unchanged. In this case—because the return used is not the fund’s actual return—the results do not apply to your investment. The example is useful in making comparisons because the Securities and Exchange Commission requires all mutual funds to calculate expenses based on a 5% return. You can assess your fund’s costs by comparing this hypothetical example with the hypothetical examples that appear in shareholder reports of other funds. |
| Six Months Ended December 31, 2023 | |||
| Beginning Account Value 6/30/2023 | Ending Account Value 12/31/2023 | Expenses Paid During Period | |
| Based on Actual Fund Return | |||
| Growth Index Fund | |||
| Investor Shares | $1,000.00 | $1,101.10 | $0.95 |
| ETF Shares | 1,000.00 | 1,101.90 | 0.21 |
| Admiral™ Shares | 1,000.00 | 1,101.80 | 0.26 |
| Institutional Shares | 1,000.00 | 1,101.90 | 0.21 |
| Value Index Fund | |||
| Investor Shares | $1,000.00 | $1,064.60 | $0.94 |
| ETF Shares | 1,000.00 | 1,065.40 | 0.21 |
| Admiral Shares | 1,000.00 | 1,065.40 | 0.26 |
| Institutional Shares | 1,000.00 | 1,065.50 | 0.21 |
| Large-Cap Index Fund | |||
| Investor Shares | $1,000.00 | $1,084.70 | $0.89 |
| ETF Shares | 1,000.00 | 1,085.40 | 0.21 |
| Admiral Shares | 1,000.00 | 1,085.40 | 0.26 |
| Institutional Shares | 1,000.00 | 1,085.30 | 0.21 |
| Based on Hypothetical 5% Yearly Return | |||
| Growth Index Fund | |||
| Investor Shares | $1,000.00 | $1,024.30 | $0.92 |
| ETF Shares | 1,000.00 | 1,025.00 | 0.20 |
| Admiral Shares | 1,000.00 | 1,024.95 | 0.26 |
| Institutional Shares | 1,000.00 | 1,025.00 | 0.20 |
| Value Index Fund | |||
| Investor Shares | $1,000.00 | $1,024.30 | $0.92 |
| ETF Shares | 1,000.00 | 1,025.00 | 0.20 |
| Admiral Shares | 1,000.00 | 1,024.95 | 0.26 |
| Institutional Shares | 1,000.00 | 1,025.00 | 0.20 |
| Large-Cap Index Fund | |||
| Investor Shares | $1,000.00 | $1,024.35 | $0.87 |
| ETF Shares | 1,000.00 | 1,025.00 | 0.20 |
| Admiral Shares | 1,000.00 | 1,024.95 | 0.26 |
| Institutional Shares | 1,000.00 | 1,025.00 | 0.20 |
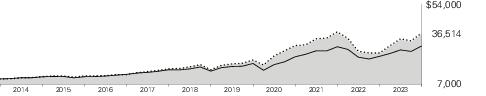
| Average Annual Total Returns Periods Ended December 31, 2023 | |||||
| One Year | Five Years | Ten Years | Final Value of a $10,000 Investment | ||

| Growth Index Fund Investor Shares | 46.60% | 19.02% | 13.83% | $36,514 |

| CRSP U.S. Large Cap Growth Index | 46.86 | 19.21 | 14.02 | 37,132 |

| Dow Jones U.S. Total Stock Market Float Adjusted Index | 26.06 | 15.05 | 11.40 | 29,422 |
| One Year | Five Years | Ten Years | Final Value of a $10,000 Investment | ||
| Growth Index Fund ETF Shares Net Asset Value | 46.78% | 19.17% | 13.98% | $36,992 | |
| Growth Index Fund ETF Shares Market Price | 46.85 | 19.18 | 13.98 | 37,006 | |
| CRSP U.S. Large Cap Growth Index | 46.86 | 19.21 | 14.02 | 37,132 | |
| Dow Jones U.S. Total Stock Market Float Adjusted Index | 26.06 | 15.05 | 11.40 | 29,422 | |
| Average Annual Total Returns Periods Ended December 31, 2023 | |||||
| One Year | Five Years | Ten Years | Final Value of a $10,000 Investment | ||
| Growth Index Fund Admiral Shares | 46.77% | 19.16% | 13.97% | $36,967 | |
| CRSP U.S. Large Cap Growth Index | 46.86 | 19.21 | 14.02 | 37,132 | |
| Dow Jones U.S. Total Stock Market Float Adjusted Index | 26.06 | 15.05 | 11.40 | 29,422 | |
| One Year | Five Years | Ten Years | Final Value of a $5,000,000 Investment | ||
| Growth Index Fund Institutional Shares | 46.78% | 19.17% | 13.98% | $18,500,697 | |
| CRSP U.S. Large Cap Growth Index | 46.86 | 19.21 | 14.02 | 18,565,986 | |
| Dow Jones U.S. Total Stock Market Float Adjusted Index | 26.06 | 15.05 | 11.40 | 14,710,990 | |
| One Year | Five Years | Ten Years | |
| Growth Index Fund ETF Shares Market Price | 46.85% | 140.49% | 270.06% |
| Growth Index Fund ETF Shares Net Asset Value | 46.78 | 140.32 | 269.92 |
| CRSP U.S. Large Cap Growth Index | 46.86 | 140.79 | 271.32 |
| Basic Materials | 1.4% |
| Consumer Discretionary | 20.4 |
| Consumer Staples | 0.7 |
| Energy | 1.3 |
| Financials | 2.6 |
| Health Care | 7.1 |
| Industrials | 8.8 |
| Real Estate | 1.8 |
| Technology | 54.8 |
| Telecommunications | 0.9 |
| Utilities | 0.2 |
| Shares | Market Value• ($000) | ||
| Temporary Cash Investments (0.2%) | |||
| Money Market Fund (0.2%) | |||
| 3,4 | Vanguard Market Liquidity Fund, 5.435% (Cost $436,274) | 4,363,751 | 436,288 |
| Total Investments (100.0%) (Cost $96,846,630) | 200,597,136 | ||
| Other Assets and Liabilities—Net (0.0%) | (47,610) | ||
| Net Assets (100%) | 200,549,526 | ||
| Cost is in $000. | |||
| • | See Note A in Notes to Financial Statements. |
| * | Non-income-producing security. |
| 1 | Includes partial security positions on loan to broker-dealers. The total value of securities on loan is $18,026,000. |
| 2 | Security value determined using significant unobservable inputs. |
| 3 | Affiliated money market fund available only to Vanguard funds and certain trusts and accounts managed by Vanguard. Rate shown is the 7-day yield. |
| 4 | Collateral of $19,678,000 was received for securities on loan. |
| CVR—Contingent Value Rights. |
| Futures Contracts | ||||
| ($000) | ||||
| Expiration | Number of Long (Short) Contracts | Notional Amount | Value and Unrealized Appreciation (Depreciation) | |
| Long Futures Contracts | ||||
| E-mini S&P 500 Index | March 2024 | 1,258 | 303,178 | 5,695 |
| Over-the-Counter Total Return Swaps | ||||||
| Reference Entity | Termination Date | Counterparty | Notional Amount ($000) | Floating Interest Rate Received (Paid)1 (%) | Value and Unrealized Appreciation ($000) | Value and Unrealized (Depreciation) ($000) |
| Netflix Inc. | 8/30/24 | BANA | 48,688 | (5.331) | — | (203) |
| Visa Inc. Class A | 8/30/24 | BANA | 115,856 | (5.231) | — | (250) |
| — | (453) | |||||
| 1 | Based on Overnight Bank Funding Rate as of the most recent reset date. Floating interest payment received/paid monthly. |
| BANA—Bank of America, N.A. |
| ($000s, except shares, footnotes, and per-share amounts) | Amount |
| Assets | |
| Investments in Securities, at Value1 | |
| Unaffiliated Issuers (Cost $96,410,356) | 200,160,848 |
| Affiliated Issuers (Cost $436,274) | 436,288 |
| Total Investments in Securities | 200,597,136 |
| Investment in Vanguard | 6,342 |
| Cash Collateral Pledged—Futures Contracts | 17,765 |
| Receivables for Investment Securities Sold | 3,000 |
| Receivables for Accrued Income | 102,093 |
| Receivables for Capital Shares Issued | 61,642 |
| Unrealized Appreciation—Over-the-Counter Swap Contracts | — |
| Total Assets | 200,787,978 |
| Liabilities | |
| Due to Custodian | 308 |
| Payables for Investment Securities Purchased | 2,280 |
| Collateral for Securities on Loan | 19,678 |
| Payables for Capital Shares Redeemed | 210,942 |
| Payables to Vanguard | 3,834 |
| Variation Margin Payable—Futures Contracts | 957 |
| Unrealized Depreciation—Over-the-Counter Swap Contracts | 453 |
| Total Liabilities | 238,452 |
| Net Assets | 200,549,526 |
| 1 Includes $18,026,000 of securities on loan. | |
| Statement of Assets and Liabilities (continued) | |
| At December 31, 2023, net assets consisted of: | |
| ($000s, except shares, footnotes, and per-share amounts) | Amount |
| Paid-in Capital | 107,635,777 |
| Total Distributable Earnings (Loss) | 92,913,749 |
| Net Assets | 200,549,526 |
| Investor Shares—Net Assets | |
| Applicable to 2,592,345 outstanding $.001 par value shares of beneficial interest (unlimited authorization) | 414,928 |
| Net Asset Value Per Share—Investor Shares | $160.06 |
| ETF Shares—Net Assets | |
| Applicable to 336,153,825 outstanding $.001 par value shares of beneficial interest (unlimited authorization) | 104,483,769 |
| Net Asset Value Per Share—ETF Shares | $310.82 |
| Admiral Shares—Net Assets | |
| Applicable to 422,229,731 outstanding $.001 par value shares of beneficial interest (unlimited authorization) | 67,554,938 |
| Net Asset Value Per Share—Admiral Shares | $160.00 |
| Institutional Shares—Net Assets | |
| Applicable to 175,595,011 outstanding $.001 par value shares of beneficial interest (unlimited authorization) | 28,095,891 |
| Net Asset Value Per Share—Institutional Shares | $160.00 |
| Year Ended December 31, 2023 | |
| ($000) | |
| Investment Income | |
| Income | |
| Dividends1 | 1,176,387 |
| Interest2 | 17,478 |
| Securities Lending—Net | 2,334 |
| Total Income | 1,196,199 |
| Expenses | |
| The Vanguard Group—Note B | |
| Investment Advisory Services | 3,706 |
| Management and Administrative—Investor Shares | 611 |
| Management and Administrative—ETF Shares | 27,066 |
| Management and Administrative—Admiral Shares | 24,042 |
| Management and Administrative—Institutional Shares | 8,014 |
| Marketing and Distribution—Investor Shares | 20 |
| Marketing and Distribution—ETF Shares | 3,747 |
| Marketing and Distribution—Admiral Shares | 2,672 |
| Marketing and Distribution—Institutional Shares | 672 |
| Custodian Fees | 921 |
| Auditing Fees | 33 |
| Shareholders’ Reports—Investor Shares | 1 |
| Shareholders’ Reports—ETF Shares | 1,637 |
| Shareholders’ Reports—Admiral Shares | 444 |
| Shareholders’ Reports—Institutional Shares | 97 |
| Trustees’ Fees and Expenses | 102 |
| Other Expenses | 23 |
| Total Expenses | 73,808 |
| Expenses Paid Indirectly | (165) |
| Net Expenses | 73,643 |
| Net Investment Income | 1,122,556 |
| Realized Net Gain (Loss) | |
| Investment Securities Sold2,3 | 6,577,015 |
| Futures Contracts | 23,384 |
| Swap Contracts | 36,605 |
| Foreign Currencies | (1) |
| Realized Net Gain (Loss) | 6,637,003 |
| Statement of Operations (continued) | |
| Year Ended December 31, 2023 | |
| ($000) | |
| Change in Unrealized Appreciation (Depreciation) | |
| Investment Securities2 | 55,181,916 |
| Futures Contracts | 6,495 |
| Swap Contracts | (231) |
| Change in Unrealized Appreciation (Depreciation) | 55,188,180 |
| Net Increase (Decrease) in Net Assets Resulting from Operations | 62,947,739 |
| 1 | Dividends are net of foreign withholding taxes of $348,000. |
| 2 | Interest income, realized net gain (loss), capital gain distributions received, and change in unrealized appreciation (depreciation) from an affiliated company of the fund were $16,936,000, $45,000, $3,000, and ($47,000), respectively. Purchases and sales are for temporary cash investment purposes. |
| 3 | Includes $9,903,213,000 of net gain (loss) resulting from in-kind redemptions. |
| Year Ended December 31, | ||
| 2023 ($000) | 2022 ($000) | |
| Increase (Decrease) in Net Assets | ||
| Operations | ||
| Net Investment Income | 1,122,556 | 943,411 |
| Realized Net Gain (Loss) | 6,637,003 | 875,348 |
| Change in Unrealized Appreciation (Depreciation) | 55,188,180 | (64,902,246) |
| Net Increase (Decrease) in Net Assets Resulting from Operations | 62,947,739 | (63,083,487) |
| Distributions | ||
| Investor Shares | (2,067) | (2,025) |
| ETF Shares | (594,545) | (458,691) |
| Admiral Shares | (382,500) | (312,198) |
| Institutional Shares | (159,537) | (128,919) |
| Total Distributions | (1,138,649) | (901,833) |
| Capital Share Transactions | ||
| Investor Shares | (71,816) | (141,965) |
| ETF Shares | 4,133,790 | 9,337,505 |
| Admiral Shares | 1,324,290 | (199,354) |
| Institutional Shares | 1,050,251 | 35,988 |
| Net Increase (Decrease) from Capital Share Transactions | 6,436,515 | 9,032,174 |
| Total Increase (Decrease) | 68,245,605 | (54,953,146) |
| Net Assets | ||
| Beginning of Period | 132,303,921 | 187,257,067 |
| End of Period | 200,549,526 | 132,303,921 |
| Investor Shares | |||||
| For a Share Outstanding Throughout Each Period | Year Ended December 31, | ||||
| 2023 | 2022 | 2021 | 2020 | 2019 | |
| Net Asset Value, Beginning of Period | $109.76 | $165.20 | $130.50 | $93.87 | $69.10 |
| Investment Operations | |||||
| Net Investment Income1 | .735 | .638 | .565 | .728 | .746 |
| Net Realized and Unrealized Gain (Loss) on Investments | 50.316 | (55.480) | 34.731 | 36.631 | 24.802 |
| Total from Investment Operations | 51.051 | (54.842) | 35.296 | 37.359 | 25.548 |
| Distributions | |||||
| Dividends from Net Investment Income | (.751) | (.598) | (.596) | (.729) | (.778) |
| Distributions from Realized Capital Gains | — | — | — | — | — |
| Total Distributions | (.751) | (.598) | (.596) | (.729) | (.778) |
| Net Asset Value, End of Period | $160.06 | $109.76 | $165.20 | $130.50 | $93.87 |
| Total Return2 | 46.60% | -33.22% | 27.10% | 40.01% | 37.08% |
| Ratios/Supplemental Data | |||||
| Net Assets, End of Period (Millions) | $415 | $345 | $692 | $750 | $572 |
| Ratio of Total Expenses to Average Net Assets | 0.17%3 | 0.17%3 | 0.17% | 0.17% | 0.17% |
| Ratio of Net Investment Income to Average Net Assets | 0.54% | 0.50% | 0.39% | 0.69% | 0.92% |
| Portfolio Turnover Rate4 | 5% | 5% | 8% | 6% | 11% |
| 1 | Calculated based on average shares outstanding. |
| 2 | Total returns do not include account service fees that may have applied in the periods shown. Fund prospectuses provide information about any applicable account service fees. |
| 3 | The ratio of expenses to average net assets for the period net of reduction from custody fee offset arrangements was 0.17%. |
| 4 | Excludes the value of portfolio securities received or delivered as a result of in-kind purchases or redemptions of the fund’s capital shares, including ETF Creation Units. |
| ETF Shares | |||||
| For a Share Outstanding Throughout Each Period | Year Ended December 31, | ||||
| 2023 | 2022 | 2021 | 2020 | 2019 | |
| Net Asset Value, Beginning of Period | $213.14 | $320.83 | $253.44 | $182.31 | $134.21 |
| Investment Operations | |||||
| Net Investment Income1 | 1.786 | 1.584 | 1.483 | 1.683 | 1.773 |
| Net Realized and Unrealized Gain (Loss) on Investments | 97.696 | (107.775) | 67.447 | 71.131 | 48.065 |
| Total from Investment Operations | 99.482 | (106.191) | 68.930 | 72.814 | 49.838 |
| Distributions | |||||
| Dividends from Net Investment Income | (1.802) | (1.499) | (1.540) | (1.684) | (1.738) |
| Distributions from Realized Capital Gains | — | — | — | — | — |
| Total Distributions | (1.802) | (1.499) | (1.540) | (1.684) | (1.738) |
| Net Asset Value, End of Period | $310.82 | $213.14 | $320.83 | $253.44 | $182.31 |
| Total Return | 46.78% | -33.13% | 27.26% | 40.16% | 37.26% |
| Ratios/Supplemental Data | |||||
| Net Assets, End of Period (Millions) | $104,484 | $68,198 | $90,506 | $68,474 | $46,481 |
| Ratio of Total Expenses to Average Net Assets | 0.04%2 | 0.04%2 | 0.04% | 0.04% | 0.04% |
| Ratio of Net Investment Income to Average Net Assets | 0.67% | 0.64% | 0.52% | 0.81% | 1.09% |
| Portfolio Turnover Rate3 | 5% | 5% | 8% | 6% | 11% |
| 1 | Calculated based on average shares outstanding. |
| 2 | The ratio of expenses to average net assets for the period net of reduction from custody fee offset arrangements were 0.04%. |
| 3 | Excludes the value of portfolio securities received or delivered as a result of in-kind purchases or redemptions of the fund’s capital shares, including ETF Creation Units. |
| Admiral Shares | |||||
| For a Share Outstanding Throughout Each Period | Year Ended December 31, | ||||
| 2023 | 2022 | 2021 | 2020 | 2019 | |
| Net Asset Value, Beginning of Period | $109.72 | $165.15 | $130.46 | $93.84 | $69.09 |
| Investment Operations | |||||
| Net Investment Income1 | .905 | .799 | .748 | .855 | .907 |
| Net Realized and Unrealized Gain (Loss) on Investments | 50.289 | (55.471) | 34.720 | 36.621 | 24.728 |
| Total from Investment Operations | 51.194 | (54.672) | 35.468 | 37.476 | 25.635 |
| Distributions | |||||
| Dividends from Net Investment Income | (.914) | (.758) | (.778) | (.856) | (.885) |
| Distributions from Realized Capital Gains | — | — | — | — | — |
| Total Distributions | (.914) | (.758) | (.778) | (.856) | (.885) |
| Net Asset Value, End of Period | $160.00 | $109.72 | $165.15 | $130.46 | $93.84 |
| Total Return2 | 46.77% | -33.14% | 27.26% | 40.19% | 37.23% |
| Ratios/Supplemental Data | |||||
| Net Assets, End of Period (Millions) | $67,555 | $45,295 | $68,372 | $53,928 | $38,103 |
| Ratio of Total Expenses to Average Net Assets | 0.05%3 | 0.05%3 | 0.05% | 0.05% | 0.05% |
| Ratio of Net Investment Income to Average Net Assets | 0.66% | 0.63% | 0.51% | 0.80% | 1.08% |
| Portfolio Turnover Rate4 | 5% | 5% | 8% | 6% | 11% |
| 1 | Calculated based on average shares outstanding. |
| 2 | Total returns do not include account service fees that may have applied in the periods shown. Fund prospectuses provide information about any applicable account service fees. |
| 3 | The ratio of expenses to average net assets for the period net of reduction from custody fee offset arrangements was 0.05%. |
| 4 | Excludes the value of portfolio securities received or delivered as a result of in-kind purchases or redemptions of the fund’s capital shares, including ETF Creation Units. |
| Institutional Shares | |||||
| For a Share Outstanding Throughout Each Period | Year Ended December 31, | ||||
| 2023 | 2022 | 2021 | 2020 | 2019 | |
| Net Asset Value, Beginning of Period | $109.72 | $165.16 | $130.47 | $93.85 | $69.09 |
| Investment Operations | |||||
| Net Investment Income1 | .920 | .812 | .762 | .867 | .912 |
| Net Realized and Unrealized Gain (Loss) on Investments | 50.288 | (55.481) | 34.721 | 36.620 | 24.742 |
| Total from Investment Operations | 51.208 | (54.669) | 35.483 | 37.487 | 25.654 |
| Distributions | |||||
| Dividends from Net Investment Income | (.928) | (.771) | (.793) | (.867) | (.894) |
| Distributions from Realized Capital Gains | — | — | — | — | — |
| Total Distributions | (.928) | (.771) | (.793) | (.867) | (.894) |
| Net Asset Value, End of Period | $160.00 | $109.72 | $165.16 | $130.47 | $93.85 |
| Total Return | 46.78% | -33.14% | 27.27% | 40.20% | 37.26% |
| Ratios/Supplemental Data | |||||
| Net Assets, End of Period (Millions) | $28,096 | $18,465 | $27,688 | $22,582 | $16,426 |
| Ratio of Total Expenses to Average Net Assets | 0.04%2 | 0.04%2 | 0.04% | 0.04% | 0.04% |
| Ratio of Net Investment Income to Average Net Assets | 0.67% | 0.64% | 0.52% | 0.82% | 1.09% |
| Portfolio Turnover Rate3 | 5% | 5% | 8% | 6% | 11% |
| 1 | Calculated based on average shares outstanding. |
| 2 | The ratio of expenses to average net assets for the period net of reduction from custody fee offset arrangements was 0.04%. |
| 3 | Excludes the value of portfolio securities received or delivered as a result of in-kind purchases or redemptions of the fund’s capital shares, including ETF Creation Units. |
| A. | The following significant accounting policies conform to generally accepted accounting principles for U.S. investment companies. The fund consistently follows such policies in preparing its financial statements. |
| B. | In accordance with the terms of a Funds' Service Agreement (the “FSA”) between Vanguard and the fund, Vanguard furnishes to the fund investment advisory, corporate management, administrative, marketing, and distribution services at Vanguard’s cost of operations (as defined by the FSA). These costs of operations are allocated to the fund based on methods and guidelines approved by the board of trustees and are generally settled twice a month. |
| C. | The fund’s custodian bank has agreed to reduce its fees when the fund maintains cash on deposit in the non-interest-bearing custody account. For the year ended December 31, 2023, custodian fee offset arrangements reduced the fund’s expenses by $165,000 (an annual rate of less than 0.01% of average net assets). |
| D. | Various inputs may be used to determine the value of the fund’s investments and derivatives. These inputs are summarized in three broad levels for financial statement purposes. The inputs or methodologies used to value securities are not necessarily an indication of the risk associated with investing in those securities. |
| Level 1 ($000) | Level 2 ($000) | Level 3 ($000) | Total ($000) | |
| Investments | ||||
| Assets | ||||
| Common Stocks | 200,160,848 | — | — | 200,160,848 |
| Temporary Cash Investments | 436,288 | — | — | 436,288 |
| Total | 200,597,136 | — | — | 200,597,136 |
| Derivative Financial Instruments | ||||
| Assets | ||||
| Futures Contracts1 | 5,695 | — | — | 5,695 |
| Liabilities | ||||
| Swap Contracts | — | 453 | — | 453 |
| 1 | Includes cumulative appreciation (depreciation) on futures contracts and centrally cleared swaps, if any, as reported in the Schedule of Investments. Only current day’s variation margin is reported within the Statement of Assets and Liabilities. |
| E. | Permanent differences between book-basis and tax-basis components of net assets are reclassified among capital accounts in the financial statements to reflect their tax character. These reclassifications have no effect on net assets or net asset value per share. As of period end, permanent differences primarily attributable to the accounting for applicable in-kind redemptions, foreign currency transactions, and swap agreements were reclassified between the following accounts: |
| Amount ($000) | |
| Paid-in Capital | 9,903,680 |
| Total Distributable Earnings (Loss) | (9,903,680) |
| Amount ($000) | |
| Undistributed Ordinary Income | 29,166 |
| Undistributed Long-Term Gains | — |
| Net Unrealized Gains (Losses) | 103,683,379 |
| Capital Loss Carryforwards | (10,798,796) |
| Qualified Late-Year Losses | — |
| Other Temporary Differences | — |
| Total | 92,913,749 |
| Year Ended December 31, | ||
| 2023 Amount ($000) | 2022 Amount ($000) | |
| Ordinary Income* | 1,138,649 | 901,833 |
| Long-Term Capital Gains | — | — |
| Total | 1,138,649 | 901,833 |
| * | Includes short-term capital gains, if any. |
| Amount ($000) | |
| Tax Cost | 96,913,757 |
| Gross Unrealized Appreciation | 106,926,045 |
| Gross Unrealized Depreciation | (3,242,666) |
| Net Unrealized Appreciation (Depreciation) | 103,683,379 |
| F. | During the year ended December 31, 2023, the fund purchased $30,561,666,000 of investment securities and sold $24,199,073,000 of investment securities, other than temporary cash investments. Purchases and sales include $19,098,511,000 and $15,323,990,000, respectively, in connection with in-kind purchases and redemptions of the fund's capital shares. |
| G. | Capital share transactions for each class of shares were: |
| Year Ended December 31, | |||||
| 2023 | 2022 | ||||
| Amount ($000) | Shares (000) | Amount ($000) | Shares (000) | ||
| Investor Shares | |||||
| Issued | 55,136 | 397 | 44,312 | 343 | |
| Issued in Lieu of Cash Distributions | 2,067 | 15 | 2,025 | 17 | |
| Redeemed | (129,019) | (961) | (188,302) | (1,408) | |
| Net Increase (Decrease)—Investor Shares | (71,816) | (549) | (141,965) | (1,048) | |
| Year Ended December 31, | |||||
| 2023 | 2022 | ||||
| Amount ($000) | Shares (000) | Amount ($000) | Shares (000) | ||
| ETF Shares | |||||
| Issued | 19,484,306 | 70,663 | 17,007,616 | 69,617 | |
| Issued in Lieu of Cash Distributions | — | — | — | — | |
| Redeemed | (15,350,516) | (54,475) | (7,670,111) | (31,750) | |
| Net Increase (Decrease)—ETF Shares | 4,133,790 | 16,188 | 9,337,505 | 37,867 | |
| Admiral Shares | |||||
| Issued | 8,600,018 | 62,400 | 8,117,723 | 63,614 | |
| Issued in Lieu of Cash Distributions | 341,776 | 2,406 | 277,829 | 2,333 | |
| Redeemed | (7,617,504) | (55,420) | (8,594,906) | (67,109) | |
| Net Increase (Decrease)—Admiral Shares | 1,324,290 | 9,386 | (199,354) | (1,162) | |
| Institutional Shares | |||||
| Issued | 3,413,487 | 24,671 | 2,976,818 | 23,224 | |
| Issued in Lieu of Cash Distributions | 153,620 | 1,081 | 124,124 | 1,042 | |
| Redeemed | (2,516,856) | (18,452) | (3,064,954) | (23,618) | |
| Net Increase (Decrease)—Institutional Shares | 1,050,251 | 7,300 | 35,988 | 648 | |
| H. | Significant market disruptions, such as those caused by pandemics (e.g., COVID-19 pandemic), natural or environmental disasters, war (e.g., Russia’s invasion of Ukraine), acts of terrorism, or other events, can adversely affect local and global markets and normal market operations. Any such disruptions could have an adverse impact on the value of the fund’s investments and fund performance. |
| I. | Management has determined that no events or transactions occurred subsequent to December 31, 2023, that would require recognition or disclosure in these financial statements. |
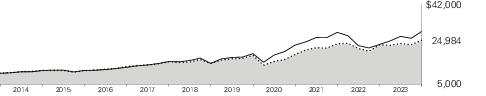
| Average Annual Total Returns Periods Ended December 31, 2023 | |||||
| One Year | Five Years | Ten Years | Final Value of a $10,000 Investment | ||
|
| Value Index Fund Investor Shares | 9.11% | 11.60% | 9.59% | $24,984 |
|
| CRSP U.S. Large Cap Value Index | 9.17 | 11.74 | 9.75 | 25,351 |
|
| Dow Jones U.S. Total Stock Market Float Adjusted Index | 26.06 | 15.05 | 11.40 | 29,422 |
| One Year | Five Years | Ten Years | Final Value of a $10,000 Investment | ||
| Value Index Fund ETF Shares Net Asset Value | 9.26% | 11.73% | 9.73% | $25,301 | |
| Value Index Fund ETF Shares Market Price | 9.32 | 11.75 | 9.73 | 25,308 | |
| CRSP U.S. Large Cap Value Index | 9.17 | 11.74 | 9.75 | 25,351 | |
| Dow Jones U.S. Total Stock Market Float Adjusted Index | 26.06 | 15.05 | 11.40 | 29,422 | |
| Average Annual Total Returns Periods Ended December 31, 2023 | |||||
| One Year | Five Years | Ten Years | Final Value of a $10,000 Investment | ||
| Value Index Fund Admiral Shares | 9.24% | 11.73% | 9.72% | $25,295 | |
| CRSP U.S. Large Cap Value Index | 9.17 | 11.74 | 9.75 | 25,351 | |
| Dow Jones U.S. Total Stock Market Float Adjusted Index | 26.06 | 15.05 | 11.40 | 29,422 | |
| One Year | Five Years | Ten Years | Final Value of a $5,000,000 Investment | ||
| Value Index Fund Institutional Shares | 9.26% | 11.74% | 9.73% | $12,659,524 | |
| CRSP U.S. Large Cap Value Index | 9.17 | 11.74 | 9.75 | 12,675,626 | |
| Dow Jones U.S. Total Stock Market Float Adjusted Index | 26.06 | 15.05 | 11.40 | 14,710,990 | |
| One Year | Five Years | Ten Years | |
| Value Index Fund ETF Shares Market Price | 9.32% | 74.25% | 153.08% |
| Value Index Fund ETF Shares Net Asset Value | 9.26 | 74.13 | 153.01 |
| CRSP U.S. Large Cap Value Index | 9.17 | 74.18 | 153.51 |
| Basic Materials | 2.1% |
| Consumer Discretionary | 7.1 |
| Consumer Staples | 9.9 |
| Energy | 7.0 |
| Financials | 19.2 |
| Health Care | 17.7 |
| Industrials | 15.5 |
| Real Estate | 3.2 |
| Technology | 9.2 |
| Telecommunications | 3.6 |
| Utilities | 5.5 |
| Futures Contracts | ||||
| ($000) | ||||
| Expiration | Number of Long (Short) Contracts | Notional Amount | Value and Unrealized Appreciation (Depreciation) | |
| Long Futures Contracts | ||||
| E-mini S&P 500 Index | March 2024 | 605 | 145,805 | 637 |
| Over-the-Counter Total Return Swaps | ||||||
| Reference Entity | Termination Date | Counterparty | Notional Amount ($000) | Floating Interest Rate Received (Paid)1 (%) | Value and Unrealized Appreciation ($000) | Value and Unrealized (Depreciation) ($000) |
| Citigroup Inc. | 8/29/25 | BANA | 10,288 | (5.931) | — | (44) |
| Conagra Brands Inc. | 8/30/24 | BANA | 7,882 | (5.331) | 63 | — |
| Ferguson plc | 8/30/24 | BANA | 13,129 | (5.331) | 4 | — |
| Fidelity National Information Services Inc. | 8/30/24 | BANA | 30,035 | (5.978) | 152 | — |
| Fidelity National Information Services Inc. | 8/30/24 | BANA | 21,024 | (5.977) | — | (65) |
| Fidelity National Information Services Inc. | 8/30/24 | BANA | 18,021 | (5.881) | 72 | — |
| Goldman Sachs Group Inc. | 8/29/25 | BANA | 96,442 | (6.031) | 273 | — |
| Johnson Controls International plc | 8/30/24 | BANA | 9,395 | (5.331) | 23 | — |
| Kroger Co. | 1/31/24 | GSI | 44,110 | (5.324) | 1,522 | — |
| Rivian Automotive Inc. | 8/30/24 | BANA | 10,088 | (5.331) | — | (31) |
| Rivian Automotive Inc. | 8/30/24 | BANA | 10,088 | (5.331) | — | (31) |
| US Bancorp | 8/30/24 | BANA | 32,460 | (5.331) | 245 | — |
| 2,354 | (171) | |||||
| 1 | Based on Overnight Bank Funding Rate as of the most recent reset date. Floating interest payment received/paid monthly. |
| BANA—Bank of America, N.A. | |
| GSI—Goldman Sachs International. |
| ($000s, except shares, footnotes, and per-share amounts) | Amount |
| Assets | |
| Investments in Securities, at Value1 | |
| Unaffiliated Issuers (Cost $122,266,469) | 155,507,813 |
| Affiliated Issuers (Cost $244,904) | 244,914 |
| Total Investments in Securities | 155,752,727 |
| Investment in Vanguard | 4,921 |
| Cash | 11 |
| Cash Collateral Pledged—Futures Contracts | 6,610 |
| Receivables for Investment Securities Sold | 25,560 |
| Receivables for Accrued Income | 219,948 |
| Receivables for Capital Shares Issued | 42,273 |
| Unrealized Appreciation—Over-the-Counter Swap Contracts | 2,354 |
| Total Assets | 156,054,404 |
| Liabilities | |
| Due to Custodian | 137 |
| Payables for Investment Securities Purchased | 1,691 |
| Collateral for Securities on Loan | 45,367 |
| Payables for Capital Shares Redeemed | 113,550 |
| Payables to Vanguard | 2,875 |
| Variation Margin Payable—Futures Contracts | 340 |
| Unrealized Depreciation—Over-the-Counter Swap Contracts | 171 |
| Total Liabilities | 164,131 |
| Net Assets | 155,890,273 |
| 1 Includes $40,620,000 of securities on loan. | |
| Statement of Assets and Liabilities (continued) | |
| At December 31, 2023, net assets consisted of: | |
| ($000s, except shares, footnotes, and per-share amounts) | Amount |
| Paid-in Capital | 130,477,847 |
| Total Distributable Earnings (Loss) | 25,412,426 |
| Net Assets | 155,890,273 |
| Investor Shares—Net Assets | |
| Applicable to 2,527,233 outstanding $.001 par value shares of beneficial interest (unlimited authorization) | 147,363 |
| Net Asset Value Per Share—Investor Shares | $58.31 |
| ETF Shares—Net Assets | |
| Applicable to 709,721,806 outstanding $.001 par value shares of beneficial interest (unlimited authorization) | 106,042,468 |
| Net Asset Value Per Share—ETF Shares | $149.41 |
| Admiral Shares—Net Assets | |
| Applicable to 575,028,549 outstanding $.001 par value shares of beneficial interest (unlimited authorization) | 33,517,529 |
| Net Asset Value Per Share—Admiral Shares | $58.29 |
| Institutional Shares—Net Assets | |
| Applicable to 277,647,560 outstanding $.001 par value shares of beneficial interest (unlimited authorization) | 16,182,913 |
| Net Asset Value Per Share—Institutional Shares | $58.29 |
| Year Ended December 31, 2023 | |
| ($000) | |
| Investment Income | |
| Income | |
| Dividends | 3,914,658 |
| Interest1 | 10,448 |
| Securities Lending—Net | 6,668 |
| Total Income | 3,931,774 |
| Expenses | |
| The Vanguard Group—Note B | |
| Investment Advisory Services | 3,296 |
| Management and Administrative—Investor Shares | 280 |
| Management and Administrative—ETF Shares | 30,152 |
| Management and Administrative—Admiral Shares | 13,147 |
| Management and Administrative—Institutional Shares | 5,222 |
| Marketing and Distribution—Investor Shares | 11 |
| Marketing and Distribution—ETF Shares | 4,773 |
| Marketing and Distribution—Admiral Shares | 1,632 |
| Marketing and Distribution—Institutional Shares | 524 |
| Custodian Fees | 1,010 |
| Auditing Fees | 33 |
| Shareholders’ Reports—Investor Shares | 2 |
| Shareholders’ Reports—ETF Shares | 2,203 |
| Shareholders’ Reports—Admiral Shares | 301 |
| Shareholders’ Reports—Institutional Shares | 130 |
| Trustees’ Fees and Expenses | 88 |
| Other Expenses | 22 |
| Total Expenses | 62,826 |
| Expenses Paid Indirectly | (36) |
| Net Expenses | 62,790 |
| Net Investment Income | 3,868,984 |
| Realized Net Gain (Loss) | |
| Investment Securities Sold1,2 | 5,137,419 |
| Futures Contracts | 35,800 |
| Swap Contracts | 20,443 |
| Realized Net Gain (Loss) | 5,193,662 |
| Statement of Operations (continued) | |
| Year Ended December 31, 2023 | |
| ($000) | |
| Change in Unrealized Appreciation (Depreciation) | |
| Investment Securities1 | 3,917,911 |
| Futures Contracts | 696 |
| Swap Contracts | 819 |
| Change in Unrealized Appreciation (Depreciation) | 3,919,426 |
| Net Increase (Decrease) in Net Assets Resulting from Operations | 12,982,072 |
| 1 | Interest income, realized net gain (loss), capital gain distributions received, and change in unrealized appreciation (depreciation) from an affiliated company of the fund were $9,925,000, $119,000, less than $1,000, and ($17,000), respectively. Purchases and sales are for temporary cash investment purposes. |
| 2 | Includes $7,972,904,000 of net gain (loss) resulting from in-kind redemptions. |
| Year Ended December 31, | ||
| 2023 ($000) | 2022 ($000) | |
| Increase (Decrease) in Net Assets | ||
| Operations | ||
| Net Investment Income | 3,868,984 | 3,671,256 |
| Realized Net Gain (Loss) | 5,193,662 | 6,671,995 |
| Change in Unrealized Appreciation (Depreciation) | 3,919,426 | (13,304,884) |
| Net Increase (Decrease) in Net Assets Resulting from Operations | 12,982,072 | (2,961,633) |
| Distributions | ||
| Investor Shares | (4,056) | (5,847) |
| ETF Shares | (2,609,981) | (2,511,165) |
| Admiral Shares | (824,747) | (791,346) |
| Institutional Shares | (406,537) | (393,370) |
| Total Distributions | (3,845,321) | (3,701,728) |
| Capital Share Transactions | ||
| Investor Shares | (93,887) | (19,293) |
| ETF Shares | 438,660 | 11,181,843 |
| Admiral Shares | (580,686) | 1,778,634 |
| Institutional Shares | (1,225,419) | 1,710,922 |
| Net Increase (Decrease) from Capital Share Transactions | (1,461,332) | 14,652,106 |
| Total Increase (Decrease) | 7,675,419 | 7,988,745 |
| Net Assets | ||
| Beginning of Period | 148,214,854 | 140,226,109 |
| End of Period | 155,890,273 | 148,214,854 |
| Investor Shares | |||||
| For a Share Outstanding Throughout Each Period | Year Ended December 31, | ||||
| 2023 | 2022 | 2021 | 2020 | 2019 | |
| Net Asset Value, Beginning of Period | $54.78 | $57.39 | $46.43 | $46.78 | $38.18 |
| Investment Operations | |||||
| Net Investment Income1 | 1.332 | 1.301 | 1.177 | 1.142 | 1.093 |
| Net Realized and Unrealized Gain (Loss) on Investments | 3.557 | (2.604) | 10.945 | (.362) | 8.623 |
| Total from Investment Operations | 4.889 | (1.303) | 12.122 | .780 | 9.716 |
| Distributions | |||||
| Dividends from Net Investment Income | (1.359) | (1.307) | (1.162) | (1.130) | (1.116) |
| Distributions from Realized Capital Gains | — | — | — | — | — |
| Total Distributions | (1.359) | (1.307) | (1.162) | (1.130) | (1.116) |
| Net Asset Value, End of Period | $58.31 | $54.78 | $57.39 | $46.43 | $46.78 |
| Total Return2 | 9.11% | -2.18% | 26.31% | 2.18% | 25.67% |
| Ratios/Supplemental Data | |||||
| Net Assets, End of Period (Millions) | $147 | $233 | $264 | $273 | $328 |
| Ratio of Total Expenses to Average Net Assets | 0.17%3 | 0.17%3 | 0.17% | 0.17% | 0.17% |
| Ratio of Net Investment Income to Average Net Assets | 2.43% | 2.38% | 2.22% | 2.75% | 2.58% |
| Portfolio Turnover Rate4 | 10% | 5% | 9% | 10% | 12% |
| 1 | Calculated based on average shares outstanding. |
| 2 | Total returns do not include account service fees that may have applied in the periods shown. Fund prospectuses provide information about any applicable account service fees. |
| 3 | The ratio of expenses to average net assets for the period net of reduction from custody fee offset arrangements was 0.17%. |
| 4 | Excludes the value of portfolio securities received or delivered as a result of in-kind purchases or redemptions of the fund’s capital shares, including ETF Creation Units. |
| ETF Shares | |||||
| For a Share Outstanding Throughout Each Period | Year Ended December 31, | ||||
| 2023 | 2022 | 2021 | 2020 | 2019 | |
| Net Asset Value, Beginning of Period | $140.37 | $147.08 | $118.98 | $119.90 | $97.84 |
| Investment Operations | |||||
| Net Investment Income1 | 3.677 | 3.529 | 3.212 | 3.055 | 3.046 |
| Net Realized and Unrealized Gain (Loss) on Investments | 9.034 | (6.707) | 28.045 | (.935) | 22.014 |
| Total from Investment Operations | 12.711 | (3.178) | 31.257 | 2.120 | 25.060 |
| Distributions | |||||
| Dividends from Net Investment Income | (3.671) | (3.532) | (3.157) | (3.040) | (3.000) |
| Distributions from Realized Capital Gains | — | — | — | — | — |
| Total Distributions | (3.671) | (3.532) | (3.157) | (3.040) | (3.000) |
| Net Asset Value, End of Period | $149.41 | $140.37 | $147.08 | $118.98 | $119.90 |
| Total Return | 9.26% | -2.05% | 26.47% | 2.23% | 25.85% |
| Ratios/Supplemental Data | |||||
| Net Assets, End of Period (Millions) | $106,042 | $99,459 | $92,776 | $61,580 | $55,909 |
| Ratio of Total Expenses to Average Net Assets | 0.04%2 | 0.04%2 | 0.04% | 0.04% | 0.04% |
| Ratio of Net Investment Income to Average Net Assets | 2.61% | 2.52% | 2.35% | 2.87% | 2.76% |
| Portfolio Turnover Rate3 | 10% | 5% | 9% | 10% | 12% |
| 1 | Calculated based on average shares outstanding. |
| 2 | The ratio of expenses to average net assets for the period net of reduction from custody fee offset arrangements were 0.04%. |
| 3 | Excludes the value of portfolio securities received or delivered as a result of in-kind purchases or redemptions of the fund’s capital shares, including ETF Creation Units. |
| Admiral Shares | |||||
| For a Share Outstanding Throughout Each Period | Year Ended December 31, | ||||
| 2023 | 2022 | 2021 | 2020 | 2019 | |
| Net Asset Value, Beginning of Period | $54.76 | $57.38 | $46.41 | $46.77 | $38.17 |
| Investment Operations | |||||
| Net Investment Income1 | 1.427 | 1.370 | 1.245 | 1.188 | 1.185 |
| Net Realized and Unrealized Gain (Loss) on Investments | 3.529 | (2.618) | 10.951 | (.367) | 8.581 |
| Total from Investment Operations | 4.956 | (1.248) | 12.196 | .821 | 9.766 |
| Distributions | |||||
| Dividends from Net Investment Income | (1.426) | (1.372) | (1.226) | (1.181) | (1.166) |
| Distributions from Realized Capital Gains | — | — | — | — | — |
| Total Distributions | (1.426) | (1.372) | (1.226) | (1.181) | (1.166) |
| Net Asset Value, End of Period | $58.29 | $54.76 | $57.38 | $46.41 | $46.77 |
| Total Return2 | 9.24% | -2.08% | 26.49% | 2.29% | 25.82% |
| Ratios/Supplemental Data | |||||
| Net Assets, End of Period (Millions) | $33,518 | $32,071 | $31,741 | $22,486 | $22,414 |
| Ratio of Total Expenses to Average Net Assets | 0.05%3 | 0.05%3 | 0.05% | 0.05% | 0.05% |
| Ratio of Net Investment Income to Average Net Assets | 2.60% | 2.51% | 2.34% | 2.86% | 2.75% |
| Portfolio Turnover Rate4 | 10% | 5% | 9% | 10% | 12% |
| 1 | Calculated based on average shares outstanding. |
| 2 | Total returns do not include account service fees that may have applied in the periods shown. Fund prospectuses provide information about any applicable account service fees. |
| 3 | The ratio of expenses to average net assets for the period net of reduction from custody fee offset arrangements was 0.05%. |
| 4 | Excludes the value of portfolio securities received or delivered as a result of in-kind purchases or redemptions of the fund’s capital shares, including ETF Creation Units. |
| Institutional Shares | |||||
| For a Share Outstanding Throughout Each Period | Year Ended December 31, | ||||
| 2023 | 2022 | 2021 | 2020 | 2019 | |
| Net Asset Value, Beginning of Period | $54.76 | $57.37 | $46.41 | $46.77 | $38.17 |
| Investment Operations | |||||
| Net Investment Income1 | 1.429 | 1.377 | 1.250 | 1.193 | 1.189 |
| Net Realized and Unrealized Gain (Loss) on Investments | 3.533 | (2.609) | 10.941 | (.368) | 8.581 |
| Total from Investment Operations | 4.962 | (1.232) | 12.191 | .825 | 9.770 |
| Distributions | |||||
| Dividends from Net Investment Income | (1.432) | (1.378) | (1.231) | (1.185) | (1.170) |
| Distributions from Realized Capital Gains | — | — | — | — | — |
| Total Distributions | (1.432) | (1.378) | (1.231) | (1.185) | (1.170) |
| Net Asset Value, End of Period | $58.29 | $54.76 | $57.37 | $46.41 | $46.77 |
| Total Return | 9.26% | -2.05% | 26.48% | 2.30% | 25.83% |
| Ratios/Supplemental Data | |||||
| Net Assets, End of Period (Millions) | $16,183 | $16,452 | $15,446 | $12,579 | $12,481 |
| Ratio of Total Expenses to Average Net Assets | 0.04%2 | 0.04%2 | 0.04% | 0.04% | 0.04% |
| Ratio of Net Investment Income to Average Net Assets | 2.60% | 2.52% | 2.35% | 2.87% | 2.76% |
| Portfolio Turnover Rate3 | 10% | 5% | 9% | 10% | 12% |
| 1 | Calculated based on average shares outstanding. |
| 2 | The ratio of expenses to average net assets for the period net of reduction from custody fee offset arrangements was 0.04%. |
| 3 | Excludes the value of portfolio securities received or delivered as a result of in-kind purchases or redemptions of the fund’s capital shares, including ETF Creation Units. |
| A. | The following significant accounting policies conform to generally accepted accounting principles for U.S. investment companies. The fund consistently follows such policies in preparing its financial statements. |
| B. | In accordance with the terms of a Funds' Service Agreement (the “FSA”) between Vanguard and the fund, Vanguard furnishes to the fund investment advisory, corporate management, administrative, marketing, and distribution services at Vanguard’s cost of operations (as defined by the FSA). These costs of operations are allocated to the fund based on methods and guidelines approved by the board of trustees and are generally settled twice a month. |
| C. | The fund’s custodian bank has agreed to reduce its fees when the fund maintains cash on deposit in the non-interest-bearing custody account. For the year ended December 31, 2023, custodian fee offset arrangements reduced the fund’s expenses by $36,000 (an annual rate of less than 0.01% of average net assets). |
| D. | Various inputs may be used to determine the value of the fund’s investments and derivatives. These inputs are summarized in three broad levels for financial statement purposes. The inputs or methodologies used to value securities are not necessarily an indication of the risk associated with investing in those securities. |
| Level 1 ($000) | Level 2 ($000) | Level 3 ($000) | Total ($000) | |
| Investments | ||||
| Assets | ||||
| Common Stocks | 155,507,813 | — | — | 155,507,813 |
| Temporary Cash Investments | 244,914 | — | — | 244,914 |
| Total | 155,752,727 | — | — | 155,752,727 |
| Derivative Financial Instruments | ||||
| Assets | ||||
| Futures Contracts1 | 637 | — | — | 637 |
| Swap Contracts | — | 2,354 | — | 2,354 |
| Total | 637 | 2,354 | — | 2,991 |
| Liabilities | ||||
| Swap Contracts | — | 171 | — | 171 |
| 1 | Includes cumulative appreciation (depreciation) on futures contracts and centrally cleared swaps, if any, as reported in the Schedule of Investments. Only current day’s variation margin is reported within the Statement of Assets and Liabilities. |
| E. | Permanent differences between book-basis and tax-basis components of net assets are reclassified among capital accounts in the financial statements to reflect their tax character. These reclassifications have no effect on net assets or net asset value per share. As of period end, permanent differences primarily attributable to the accounting for applicable in-kind redemptions, passive foreign investment companies, corporate actions, and swap agreements were reclassified between the following accounts: |
| Amount ($000) | |
| Paid-in Capital | 7,968,653 |
| Total Distributable Earnings (Loss) | (7,968,653) |
| Amount ($000) | |
| Undistributed Ordinary Income | 206,502 |
| Undistributed Long-Term Gains | — |
| Net Unrealized Gains (Losses) | 33,131,978 |
| Capital Loss Carryforwards | (7,926,054) |
| Qualified Late-Year Losses | — |
| Other Temporary Differences | — |
| Total | 25,412,426 |
| Year Ended December 31, | ||
| 2023 Amount ($000) | 2022 Amount ($000) | |
| Ordinary Income* | 3,845,321 | 3,701,728 |
| Long-Term Capital Gains | — | — |
| Total | 3,845,321 | 3,701,728 |
| * | Includes short-term capital gains, if any. |
| Amount ($000) | |
| Tax Cost | 122,620,748 |
| Gross Unrealized Appreciation | 38,476,906 |
| Gross Unrealized Depreciation | (5,344,928) |
| Net Unrealized Appreciation (Depreciation) | 33,131,978 |
| F. | During the year ended December 31, 2023, the fund purchased $32,222,136,000 of investment securities and sold $33,611,248,000 of investment securities, other than temporary cash investments. Purchases and sales include $16,881,532,000 and $17,707,243,000, respectively, in connection with in-kind purchases and redemptions of the fund's capital shares. |
| G. | Capital share transactions for each class of shares were: |
| Year Ended December 31, | |||||
| 2023 | 2022 | ||||
| Amount ($000) | Shares (000) | Amount ($000) | Shares (000) | ||
| Investor Shares | |||||
| Issued | 15,265 | 279 | 52,300 | 945 | |
| Issued in Lieu of Cash Distributions | 4,056 | 74 | 5,847 | 110 | |
| Redeemed | (113,208) | (2,078) | (77,440) | (1,404) | |
| Net Increase (Decrease)—Investor Shares | (93,887) | (1,725) | (19,293) | (349) | |
| ETF Shares | |||||
| Issued | 17,753,209 | 125,354 | 28,097,278 | 198,864 | |
| Issued in Lieu of Cash Distributions | — | — | — | — | |
| Redeemed | (17,314,549) | (124,175) | (16,915,435) | (121,125) | |
| Net Increase (Decrease)—ETF Shares | 438,660 | 1,179 | 11,181,843 | 77,739 | |
| Admiral Shares | |||||
| Issued | 4,041,652 | 73,435 | 6,740,145 | 122,919 | |
| Issued in Lieu of Cash Distributions | 718,875 | 13,124 | 691,593 | 13,000 | |
| Redeemed | (5,341,213) | (97,180) | (5,653,104) | (103,475) | |
| Net Increase (Decrease)—Admiral Shares | (580,686) | (10,621) | 1,778,634 | 32,444 | |
| Institutional Shares | |||||
| Issued | 2,550,479 | 46,217 | 3,365,017 | 61,474 | |
| Issued in Lieu of Cash Distributions | 394,481 | 7,209 | 379,225 | 7,126 | |
| Redeemed | (4,170,379) | (76,228) | (2,033,320) | (37,361) | |
| Net Increase (Decrease)—Institutional Shares | (1,225,419) | (22,802) | 1,710,922 | 31,239 | |
| H. | Significant market disruptions, such as those caused by pandemics (e.g., COVID-19 pandemic), natural or environmental disasters, war (e.g., Russia’s invasion of Ukraine), acts of terrorism, or other events, can adversely affect local and global markets and normal market operations. Any such disruptions could have an adverse impact on the value of the fund’s investments and fund performance. |
| I. | Management has determined that no events or transactions occurred subsequent to December 31, 2023, that would require recognition or disclosure in these financial statements. |
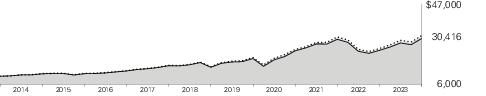
| Average Annual Total Returns Periods Ended December 31, 2023 | |||||
| One Year | Five Years | Ten Years | Final Value of a $10,000 Investment | ||
|
| Large-Cap Index Fund Investor Shares | 27.12% | 15.46% | 11.77% | $30,416 |
|
| CRSP U.S. Large Cap Index | 27.28 | 15.64 | 11.95 | 30,923 |
|
| Dow Jones U.S. Total Stock Market Float Adjusted Index | 26.06 | 15.05 | 11.40 | 29,422 |
| One Year | Five Years | Ten Years | Final Value of a $10,000 Investment | ||
| Large-Cap Index Fund ETF Shares Net Asset Value | 27.29% | 15.60% | 11.91% | $30,807 | |
| Large-Cap Index Fund ETF Shares Market Price | 27.38 | 15.62 | 11.92 | 30,825 | |
| CRSP U.S. Large Cap Index | 27.28 | 15.64 | 11.95 | 30,923 | |
| Dow Jones U.S. Total Stock Market Float Adjusted Index | 26.06 | 15.05 | 11.40 | 29,422 | |
| Average Annual Total Returns Periods Ended December 31, 2023 | |||||
| One Year | Five Years | Ten Years | Final Value of a $10,000 Investment | ||
| Large-Cap Index Fund Admiral Shares | 27.28% | 15.60% | 11.90% | $30,788 | |
| CRSP U.S. Large Cap Index | 27.28 | 15.64 | 11.95 | 30,923 | |
| Dow Jones U.S. Total Stock Market Float Adjusted Index | 26.06 | 15.05 | 11.40 | 29,422 | |
| One Year | Five Years | Ten Years | Final Value of a $5,000,000 Investment | ||
| Large-Cap Index Fund Institutional Shares | 27.28% | 15.61% | 11.91% | $15,409,788 | |
| CRSP U.S. Large Cap Index | 27.28 | 15.64 | 11.95 | 15,461,439 | |
| Dow Jones U.S. Total Stock Market Float Adjusted Index | 26.06 | 15.05 | 11.40 | 14,710,990 | |
| One Year | Five Years | Ten Years | |
| Large-Cap Index Fund ETF Shares Market Price | 27.38% | 106.60% | 208.25% |
| Large-Cap Index Fund ETF Shares Net Asset Value | 27.29 | 106.45 | 208.07 |
| CRSP U.S. Large Cap Index | 27.28 | 106.78 | 209.23 |
| Basic Materials | 1.7% |
| Consumer Discretionary | 14.3 |
| Consumer Staples | 4.9 |
| Energy | 3.9 |
| Financials | 10.3 |
| Health Care | 12.0 |
| Industrials | 11.9 |
| Real Estate | 2.4 |
| Technology | 33.8 |
| Telecommunications | 2.2 |
| Utilities | 2.6 |
| Shares | Market Value• ($000) | ||
| Temporary Cash Investments (0.1%) | |||
| Money Market Fund (0.1%) | |||
| 3,4 | Vanguard Market Liquidity Fund, 5.435% (Cost $52,015) | 520,282 | 52,018 |
| Total Investments (99.9%) (Cost $23,999,681) | 45,288,024 | ||
| Other Assets and Liabilities—Net (0.1%) | 63,659 | ||
| Net Assets (100%) | 45,351,683 | ||
| Cost is in $000. | |||
| • | See Note A in Notes to Financial Statements. |
| * | Non-income-producing security. |
| 1 | Includes partial security positions on loan to broker-dealers. The total value of securities on loan is $5,507,000. |
| 2 | Security value determined using significant unobservable inputs. |
| 3 | Affiliated money market fund available only to Vanguard funds and certain trusts and accounts managed by Vanguard. Rate shown is the 7-day yield. |
| 4 | Collateral of $6,112,000 was received for securities on loan. |
| CVR—Contingent Value Rights. |
| Futures Contracts | ||||
| ($000) | ||||
| Expiration | Number of Long (Short) Contracts | Notional Amount | Value and Unrealized Appreciation (Depreciation) | |
| Long Futures Contracts | ||||
| E-mini S&P 500 Index | March 2024 | 290 | 69,890 | 1,077 |
| Over-the-Counter Total Return Swaps | ||||||
| Reference Entity | Termination Date | Counterparty | Notional Amount ($000) | Floating Interest Rate Received (Paid)1 (%) | Value and Unrealized Appreciation ($000) | Value and Unrealized (Depreciation) ($000) |
| Visa Inc. Class A | 8/30/24 | BANA | 39,053 | (5.231) | — | (84) |
| 1 | Based on Overnight Bank Funding Rate as of the most recent reset date. Floating interest payment received/paid monthly. |
| BANA—Bank of America, N.A. |
| ($000s, except shares, footnotes, and per-share amounts) | Amount |
| Assets | |
| Investments in Securities, at Value1 | |
| Unaffiliated Issuers (Cost $23,947,666) | 45,236,006 |
| Affiliated Issuers (Cost $52,015) | 52,018 |
| Total Investments in Securities | 45,288,024 |
| Investment in Vanguard | 1,437 |
| Cash | 851 |
| Cash Collateral Pledged—Futures Contracts | 2,897 |
| Receivables for Investment Securities Sold | 840 |
| Receivables for Accrued Income | 41,823 |
| Receivables for Capital Shares Issued | 30,431 |
| Total Assets | 45,366,303 |
| Liabilities | |
| Payables for Investment Securities Purchased | 1,649 |
| Collateral for Securities on Loan | 6,112 |
| Payables for Capital Shares Redeemed | 5,780 |
| Payables to Vanguard | 848 |
| Variation Margin Payable—Futures Contracts | 147 |
| Unrealized Depreciation—Over-the-Counter Swap Contracts | 84 |
| Total Liabilities | 14,620 |
| Net Assets | 45,351,683 |
| 1 Includes $5,507,000 of securities on loan. | |
| Statement of Assets and Liabilities (continued) | |
| At December 31, 2023, net assets consisted of: | |
| ($000s, except shares, footnotes, and per-share amounts) | Amount |
| Paid-in Capital | 25,444,172 |
| Total Distributable Earnings (Loss) | 19,907,511 |
| Net Assets | 45,351,683 |
| Investor Shares—Net Assets | |
| Applicable to 257,106 outstanding $.001 par value shares of beneficial interest (unlimited authorization) | 22,676 |
| Net Asset Value Per Share—Investor Shares | $88.20 |
| ETF Shares—Net Assets | |
| Applicable to 140,730,194 outstanding $.001 par value shares of beneficial interest (unlimited authorization) | 30,728,234 |
| Net Asset Value Per Share—ETF Shares | $218.35 |
| Admiral Shares—Net Assets | |
| Applicable to 108,397,196 outstanding $.001 par value shares of beneficial interest (unlimited authorization) | 11,952,785 |
| Net Asset Value Per Share—Admiral Shares | $110.27 |
| Institutional Shares—Net Assets | |
| Applicable to 5,834,598 outstanding $.001 par value shares of beneficial interest (unlimited authorization) | 2,647,988 |
| Net Asset Value Per Share—Institutional Shares | $453.84 |
| Year Ended December 31, 2023 | |
| ($000) | |
| Investment Income | |
| Income | |
| Dividends1 | 642,902 |
| Interest2 | 5,352 |
| Securities Lending—Net | 1,120 |
| Total Income | 649,374 |
| Expenses | |
| The Vanguard Group—Note B | |
| Investment Advisory Services | 898 |
| Management and Administrative—Investor Shares | 29 |
| Management and Administrative—ETF Shares | 8,637 |
| Management and Administrative—Admiral Shares | 4,468 |
| Management and Administrative—Institutional Shares | 779 |
| Marketing and Distribution—Investor Shares | 1 |
| Marketing and Distribution—ETF Shares | 940 |
| Marketing and Distribution—Admiral Shares | 474 |
| Marketing and Distribution—Institutional Shares | 75 |
| Custodian Fees | 330 |
| Auditing Fees | 34 |
| Shareholders’ Reports—Investor Shares | — |
| Shareholders’ Reports—ETF Shares | 419 |
| Shareholders’ Reports—Admiral Shares | 67 |
| Shareholders’ Reports—Institutional Shares | 4 |
| Trustees’ Fees and Expenses | 25 |
| Other Expenses | 23 |
| Total Expenses | 17,203 |
| Expenses Paid Indirectly | (26) |
| Net Expenses | 17,177 |
| Net Investment Income | 632,197 |
| Realized Net Gain (Loss) | |
| Investment Securities Sold2,3 | 609,223 |
| Futures Contracts | 18,903 |
| Swap Contracts | 4,195 |
| Foreign Currencies | — |
| Realized Net Gain (Loss) | 632,321 |
| Statement of Operations (continued) | |
| Year Ended December 31, 2023 | |
| ($000) | |
| Change in Unrealized Appreciation (Depreciation) | |
| Investment Securities2 | 8,466,227 |
| Futures Contracts | 2,398 |
| Swap Contracts | (84) |
| Change in Unrealized Appreciation (Depreciation) | 8,468,541 |
| Net Increase (Decrease) in Net Assets Resulting from Operations | 9,733,059 |
| 1 | Dividends are net of foreign withholding taxes of $44,000. |
| 2 | Interest income, realized net gain (loss), capital gain distributions received, and change in unrealized appreciation (depreciation) from an affiliated company of the fund were $5,072,000, $18,000, less than $1,000, and ($6,000), respectively. Purchases and sales are for temporary cash investment purposes. |
| 3 | Includes $848,994,000 of net gain (loss) resulting from in-kind redemptions. |
| Year Ended December 31, | ||
| 2023 ($000) | 2022 ($000) | |
| Increase (Decrease) in Net Assets | ||
| Operations | ||
| Net Investment Income | 632,197 | 582,807 |
| Realized Net Gain (Loss) | 632,321 | 581,223 |
| Change in Unrealized Appreciation (Depreciation) | 8,468,541 | (9,661,685) |
| Net Increase (Decrease) in Net Assets Resulting from Operations | 9,733,059 | (8,497,655) |
| Distributions | ||
| Investor Shares | (290) | (330) |
| ETF Shares | (430,519) | (393,544) |
| Admiral Shares | (166,820) | (156,189) |
| Institutional Shares | (36,408) | (34,496) |
| Total Distributions | (634,037) | (584,559) |
| Capital Share Transactions | ||
| Investor Shares | 1,298 | (11,365) |
| ETF Shares | 435,596 | 1,959,159 |
| Admiral Shares | (43,037) | 215,566 |
| Institutional Shares | 50,913 | 77,917 |
| Net Increase (Decrease) from Capital Share Transactions | 444,770 | 2,241,277 |
| Total Increase (Decrease) | 9,543,792 | (6,840,937) |
| Net Assets | ||
| Beginning of Period | 35,807,891 | 42,648,828 |
| End of Period | 45,351,683 | 35,807,891 |
| Investor Shares | |||||
| For a Share Outstanding Throughout Each Period | Year Ended December 31, | ||||
| 2023 | 2022 | 2021 | 2020 | 2019 | |
| Net Asset Value, Beginning of Period | $70.38 | $89.03 | $71.00 | $59.72 | $46.36 |
| Investment Operations | |||||
| Net Investment Income1 | 1.142 | 1.058 | .956 | .969 | .918 |
| Net Realized and Unrealized Gain (Loss) on Investments | 17.823 | (18.646) | 18.025 | 11.268 | 13.466 |
| Total from Investment Operations | 18.965 | (17.588) | 18.981 | 12.237 | 14.384 |
| Distributions | |||||
| Dividends from Net Investment Income | (1.145) | (1.062) | (.951) | (.957) | (1.024) |
| Distributions from Realized Capital Gains | — | — | — | — | — |
| Total Distributions | (1.145) | (1.062) | (.951) | (.957) | (1.024) |
| Net Asset Value, End of Period | $88.20 | $70.38 | $89.03 | $71.00 | $59.72 |
| Total Return2 | 27.12% | -19.78% | 26.87% | 20.89% | 31.23% |
| Ratios/Supplemental Data | |||||
| Net Assets, End of Period (Millions) | $23 | $17 | $36 | $37 | $30 |
| Ratio of Total Expenses to Average Net Assets | 0.17%3 | 0.17%3 | 0.17% | 0.17% | 0.17% |
| Ratio of Net Investment Income to Average Net Assets | 1.44% | 1.38% | 1.19% | 1.61% | 1.75% |
| Portfolio Turnover Rate4 | 2% | 3% | 4% | 3% | 5% |
| 1 | Calculated based on average shares outstanding. |
| 2 | Total returns do not include account service fees that may have applied in the periods shown. Fund prospectuses provide information about any applicable account service fees. |
| 3 | The ratio of expenses to average net assets for the period net of reduction from custody fee offset arrangements was 0.17%. |
| 4 | Excludes the value of portfolio securities received or delivered as a result of in-kind purchases or redemptions of the fund’s capital shares, including ETF Creation Units. |
| ETF Shares | |||||
| For a Share Outstanding Throughout Each Period | Year Ended December 31, | ||||
| 2023 | 2022 | 2021 | 2020 | 2019 | |
| Net Asset Value, Beginning of Period | $174.22 | $220.44 | $175.80 | $147.88 | $114.77 |
| Investment Operations | |||||
| Net Investment Income1 | 3.079 | 2.905 | 2.646 | 2.594 | 2.581 |
| Net Realized and Unrealized Gain (Loss) on Investments | 44.134 | (46.233) | 44.617 | 27.890 | 33.204 |
| Total from Investment Operations | 47.213 | (43.328) | 47.263 | 30.484 | 35.785 |
| Distributions | |||||
| Dividends from Net Investment Income | (3.083) | (2.892) | (2.623) | (2.564) | (2.675) |
| Distributions from Realized Capital Gains | — | — | — | — | — |
| Total Distributions | (3.083) | (2.892) | (2.623) | (2.564) | (2.675) |
| Net Asset Value, End of Period | $218.35 | $174.22 | $220.44 | $175.80 | $147.88 |
| Total Return | 27.29% | -19.68% | 27.02% | 20.99% | 31.39% |
| Ratios/Supplemental Data | |||||
| Net Assets, End of Period (Millions) | $30,728 | $24,137 | $28,242 | $21,540 | $16,270 |
| Ratio of Total Expenses to Average Net Assets | 0.04%2 | 0.04%2 | 0.04% | 0.04% | 0.04% |
| Ratio of Net Investment Income to Average Net Assets | 1.57% | 1.55% | 1.33% | 1.74% | 1.93% |
| Portfolio Turnover Rate3 | 2% | 3% | 4% | 3% | 5% |
| 1 | Calculated based on average shares outstanding. |
| 2 | The ratio of expenses to average net assets for the period net of reduction from custody fee offset arrangements were 0.04%. |
| 3 | Excludes the value of portfolio securities received or delivered as a result of in-kind purchases or redemptions of the fund’s capital shares, including ETF Creation Units. |
| Admiral Shares | |||||
| For a Share Outstanding Throughout Each Period | Year Ended December 31, | ||||
| 2023 | 2022 | 2021 | 2020 | 2019 | |
| Net Asset Value, Beginning of Period | $87.98 | $111.33 | $88.79 | $74.69 | $57.96 |
| Investment Operations | |||||
| Net Investment Income1 | 1.544 | 1.456 | 1.325 | 1.303 | 1.299 |
| Net Realized and Unrealized Gain (Loss) on Investments | 22.293 | (23.348) | 22.530 | 14.084 | 16.774 |
| Total from Investment Operations | 23.837 | (21.892) | 23.855 | 15.387 | 18.073 |
| Distributions | |||||
| Dividends from Net Investment Income | (1.547) | (1.458) | (1.315) | (1.287) | (1.343) |
| Distributions from Realized Capital Gains | — | — | — | — | — |
| Total Distributions | (1.547) | (1.458) | (1.315) | (1.287) | (1.343) |
| Net Asset Value, End of Period | $110.27 | $87.98 | $111.33 | $88.79 | $74.69 |
| Total Return2 | 27.28% | -19.70% | 27.01% | 21.03% | 31.39% |
| Ratios/Supplemental Data | |||||
| Net Assets, End of Period (Millions) | $11,953 | $9,583 | $11,847 | $9,338 | $7,546 |
| Ratio of Total Expenses to Average Net Assets | 0.05%3 | 0.05%3 | 0.05% | 0.05% | 0.05% |
| Ratio of Net Investment Income to Average Net Assets | 1.56% | 1.54% | 1.32% | 1.73% | 1.92% |
| Portfolio Turnover Rate4 | 2% | 3% | 4% | 3% | 5% |
| 1 | Calculated based on average shares outstanding. |
| 2 | Total returns do not include account service fees that may have applied in the periods shown. Fund prospectuses provide information about any applicable account service fees. |
| 3 | The ratio of expenses to average net assets for the period net of reduction from custody fee offset arrangements was 0.05%. |
| 4 | Excludes the value of portfolio securities received or delivered as a result of in-kind purchases or redemptions of the fund’s capital shares, including ETF Creation Units. |
| Institutional Shares | |||||
| For a Share Outstanding Throughout Each Period | Year Ended December 31, | ||||
| 2023 | 2022 | 2021 | 2020 | 2019 | |
| Net Asset Value, Beginning of Period | $362.12 | $458.22 | $365.43 | $307.39 | $238.57 |
| Investment Operations | |||||
| Net Investment Income1 | 6.401 | 6.032 | 5.477 | 5.389 | 5.363 |
| Net Realized and Unrealized Gain (Loss) on Investments | 91.727 | (96.092) | 92.764 | 57.981 | 69.016 |
| Total from Investment Operations | 98.128 | (90.060) | 98.241 | 63.370 | 74.379 |
| Distributions | |||||
| Dividends from Net Investment Income | (6.408) | (6.040) | (5.451) | (5.330) | (5.559) |
| Distributions from Realized Capital Gains | — | — | — | — | — |
| Total Distributions | (6.408) | (6.040) | (5.451) | (5.330) | (5.559) |
| Net Asset Value, End of Period | $453.84 | $362.12 | $458.22 | $365.43 | $307.39 |
| Total Return | 27.28% | -19.69% | 27.03% | 21.05% | 31.39% |
| Ratios/Supplemental Data | |||||
| Net Assets, End of Period (Millions) | $2,648 | $2,071 | $2,524 | $2,149 | $1,796 |
| Ratio of Total Expenses to Average Net Assets | 0.04%2 | 0.04%2 | 0.04% | 0.04% | 0.04% |
| Ratio of Net Investment Income to Average Net Assets | 1.57% | 1.55% | 1.32% | 1.74% | 1.92% |
| Portfolio Turnover Rate3 | 2% | 3% | 4% | 3% | 5% |
| 1 | Calculated based on average shares outstanding. |
| 2 | The ratio of expenses to average net assets for the period net of reduction from custody fee offset arrangements was 0.04%. |
| 3 | Excludes the value of portfolio securities received or delivered as a result of in-kind purchases or redemptions of the fund’s capital shares, including ETF Creation Units. |
| A. | The following significant accounting policies conform to generally accepted accounting principles for U.S. investment companies. The fund consistently follows such policies in preparing its financial statements. |
| B. | In accordance with the terms of a Funds' Service Agreement (the “FSA”) between Vanguard and the fund, Vanguard furnishes to the fund investment advisory, corporate management, administrative, marketing, and distribution services at Vanguard’s cost of operations (as defined by the FSA). These costs of operations are allocated to the fund based on methods and guidelines approved by the board of trustees and are generally settled twice a month. |
| C. | The fund’s custodian bank has agreed to reduce its fees when the fund maintains cash on deposit in the non-interest-bearing custody account. For the year ended December 31, 2023, custodian fee offset arrangements reduced the fund’s expenses by $26,000 (an annual rate of less than 0.01% of average net assets). |
| D. | Various inputs may be used to determine the value of the fund’s investments and derivatives. These inputs are summarized in three broad levels for financial statement purposes. The inputs or methodologies used to value securities are not necessarily an indication of the risk associated with investing in those securities. |
| Level 1 ($000) | Level 2 ($000) | Level 3 ($000) | Total ($000) | |
| Investments | ||||
| Assets | ||||
| Common Stocks | 45,236,006 | — | — | 45,236,006 |
| Temporary Cash Investments | 52,018 | — | — | 52,018 |
| Total | 45,288,024 | — | — | 45,288,024 |
| Derivative Financial Instruments | ||||
| Assets | ||||
| Futures Contracts1 | 1,077 | — | — | 1,077 |
| Liabilities | ||||
| Swap Contracts | — | 84 | — | 84 |
| 1 | Includes cumulative appreciation (depreciation) on futures contracts and centrally cleared swaps, if any, as reported in the Schedule of Investments. Only current day’s variation margin is reported within the Statement of Assets and Liabilities. |
| E. | Permanent differences between book-basis and tax-basis components of net assets are reclassified among capital accounts in the financial statements to reflect their tax character. These reclassifications have no effect on net assets or net asset value per share. As of period end, permanent differences primarily attributable to the accounting for applicable in-kind redemptions, passive foreign investment companies, and swap agreements were reclassified between the following accounts: |
| Amount ($000) | |
| Paid-in Capital | 848,976 |
| Total Distributable Earnings (Loss) | (848,976) |
| Amount ($000) | |
| Undistributed Ordinary Income | 24,623 |
| Undistributed Long-Term Gains | — |
| Net Unrealized Gains (Losses) | 21,237,263 |
| Capital Loss Carryforwards | (1,354,375) |
| Qualified Late-Year Losses | — |
| Other Temporary Differences | — |
| Total | 19,907,511 |
| Year Ended December 31, | ||
| 2023 Amount ($000) | 2022 Amount ($000) | |
| Ordinary Income* | 634,037 | 584,559 |
| Long-Term Capital Gains | — | — |
| Total | 634,037 | 584,559 |
| * | Includes short-term capital gains, if any. |
| Amount ($000) | |
| Tax Cost | 24,050,761 |
| Gross Unrealized Appreciation | 22,277,410 |
| Gross Unrealized Depreciation | (1,040,147) |
| Net Unrealized Appreciation (Depreciation) | 21,237,263 |
| F. | During the year ended December 31, 2023, the fund purchased $2,536,258,000 of investment securities and sold $2,114,119,000 of investment securities, other than temporary cash investments. Purchases and sales include $1,436,121,000 and $1,201,221,000, respectively, in connection with in-kind purchases and redemptions of the fund's capital shares. |
| G. | Capital share transactions for each class of shares were: |
| Year Ended December 31, | |||||
| 2023 | 2022 | ||||
| Amount ($000) | Shares (000) | Amount ($000) | Shares (000) | ||
| Investor Shares | |||||
| Issued | 3,063 | 40 | 5,411 | 68 | |
| Issued in Lieu of Cash Distributions | 290 | 3 | 330 | 4 | |
| Redeemed | (2,055) | (26) | (17,106) | (231) | |
| Net Increase (Decrease)—Investor Shares | 1,298 | 17 | (11,365) | (159) | |
| ETF Shares | |||||
| Issued | 1,678,374 | 8,513 | 3,667,813 | 19,749 | |
| Issued in Lieu of Cash Distributions | — | — | — | — | |
| Redeemed | (1,242,778) | (6,325) | (1,708,654) | (9,325) | |
| Net Increase (Decrease)—ETF Shares | 435,596 | 2,188 | 1,959,159 | 10,424 | |
| Admiral Shares | |||||
| Issued | 1,245,186 | 12,576 | 1,800,154 | 19,196 | |
| Issued in Lieu of Cash Distributions | 135,776 | 1,352 | 126,959 | 1,400 | |
| Redeemed | (1,423,999) | (14,448) | (1,711,547) | (18,094) | |
| Net Increase (Decrease)—Admiral Shares | (43,037) | (520) | 215,566 | 2,502 | |
| Institutional Shares | |||||
| Issued | 436,811 | 1,089 | 424,874 | 1,093 | |
| Issued in Lieu of Cash Distributions | 31,807 | 77 | 30,324 | 81 | |
| Redeemed | (417,705) | (1,050) | (377,281) | (963) | |
| Net Increase (Decrease)—Institutional Shares | 50,913 | 116 | 77,917 | 211 | |
| H. | Significant market disruptions, such as those caused by pandemics (e.g., COVID-19 pandemic), natural or environmental disasters, war (e.g., Russia’s invasion of Ukraine), acts of terrorism, or other events, can adversely affect local and global markets and normal market operations. Any such disruptions could have an adverse impact on the value of the fund’s investments and fund performance. |
| I. | Management has determined that no events or transactions occurred subsequent to December 31, 2023, that would require recognition or disclosure in these financial statements. |
Philadelphia, Pennsylvania
February 15, 2024
| Fund | Percentage |
| Growth Index Fund | 90.0% |
| Value Index Fund | 93.4 |
| Large-Cap Index Fund | 92.9 |
| Fund | ($000) |
| Growth Index Fund | 1,104,262 |
| Value Index Fund | 3,845,321 |
| Large-Cap Index Fund | 634,037 |
| Fund | ($000) |
| Growth Index Fund | 6,482 |
| Value Index Fund | 3,979 |
| Large-Cap Index Fund | 2,012 |
| Fund | ($000) |
| Growth Index Fund | 34,387 |
| Value Index Fund | — |
| Large-Cap Index Fund | — |


| 1 | |
| 2 | |
| 4 | |
| 8 |
| • | For the 12 months ended December 31, 2023, returns for Vanguard Total Stock Market Index Fund ranged from 25.89% for Investor Shares to 26.05% for Institutional Select Shares. |
| • | The fourth quarter of 2023 was a volatile period for the financial markets. Stocks and bonds continued to lose ground early on amid concerns that interest rates might remain elevated for an extended period. They went on to post strong gains, however, as inflation remained on a downward trend and economic growth softened, leading the markets to anticipate that policy rates had reached their peak and that cuts were likely not too far down the road. |
| • | The fund, which offers investors exposure to every segment, size, and style of the U.S. equity market, closely tracked its target index, the CRSP US Total Market Index. |
| • | The majority of the index’s 11 sectors recorded positive returns for the 12 months. Consumer discretionary, consumer staples, and energy stocks helped performance the most. |
| Average Annual Total Returns Periods Ended December 31, 2023 | |||
| One Year | Three Years | Five Years | |
| Stocks | |||
| Russell 1000 Index (Large-caps) | 26.53% | 8.97% | 15.52% |
| Russell 2000 Index (Small-caps) | 16.93 | 2.22 | 9.97 |
| Russell 3000 Index (Broad U.S. market) | 25.96 | 8.54 | 15.16 |
| FTSE All-World ex US Index (International) | 15.82 | 1.98 | 7.52 |
| Bonds | |||
| Bloomberg U.S. Aggregate Float Adjusted Index (Broad taxable market) | 5.60% | -3.33% | 1.17% |
| Bloomberg Municipal Bond Index (Broad tax-exempt market) | 6.40 | -0.40 | 2.25 |
| FTSE Three-Month U.S. Treasury Bill Index | 5.26 | 2.24 | 1.91 |
| CPI | |||
| Consumer Price Index | 3.35% | 5.60% | 4.07% |
| • | Based on actual fund return. This section helps you to estimate the actual expenses that you paid over the period. The ”Ending Account Value“ shown is derived from the fund’s actual return, and the third column shows the dollar amount that would have been paid by an investor who started with $1,000 in the fund. You may use the information here, together with the amount you invested, to estimate the expenses that you paid over the period. |
| • | Based on hypothetical 5% yearly return. This section is intended to help you compare your fund‘s costs with those of other mutual funds. It assumes that the fund had a yearly return of 5% before expenses, but that the expense ratio is unchanged. In this case—because the return used is not the fund’s actual return—the results do not apply to your investment. The example is useful in making comparisons because the Securities and Exchange Commission requires all mutual funds to calculate expenses based on a 5% return. You can assess your fund’s costs by comparing this hypothetical example with the hypothetical examples that appear in shareholder reports of other funds. |
| Six Months Ended December 31, 2023 | |||
| Beginning Account Value 6/30/2023 | Ending Account Value 12/31/2023 | Expenses Paid During Period | |
| Based on Actual Fund Return | |||
| Total Stock Market Index Fund | |||
| Investor Shares | $1,000.00 | $1,084.10 | $0.74 |
| ETF Shares | 1,000.00 | 1,084.80 | 0.16 |
| Admiral™ Shares | 1,000.00 | 1,084.70 | 0.21 |
| Institutional Shares | 1,000.00 | 1,084.70 | 0.16 |
| Institutional Plus Shares | 1,000.00 | 1,084.80 | 0.11 |
| Institutional Select Shares | 1,000.00 | 1,084.80 | 0.05 |
| Based on Hypothetical 5% Yearly Return | |||
| Total Stock Market Index Fund | |||
| Investor Shares | $1,000.00 | $1,024.50 | $0.71 |
| ETF Shares | 1,000.00 | 1,025.05 | 0.15 |
| Admiral Shares | 1,000.00 | 1,025.00 | 0.20 |
| Institutional Shares | 1,000.00 | 1,025.05 | 0.15 |
| Institutional Plus Shares | 1,000.00 | 1,025.10 | 0.10 |
| Institutional Select Shares | 1,000.00 | 1,025.15 | 0.05 |
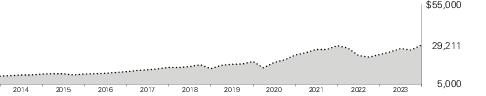
| Average Annual Total Returns Periods Ended December 31, 2023 | |||||
| One Year | Five Years | Ten Years | Final Value of a $10,000 Investment | ||

| Total Stock Market Index Fund Investor Shares | 25.89% | 14.95% | 11.32% | $29,211 |

| CRSP US Total Market Index | 25.98 | 15.08 | 11.44 | 29,545 |
| One Year | Five Years | Ten Years | Final Value of a $10,000 Investment | ||
| Total Stock Market Index Fund ETF Shares Net Asset Value | 26.03% | 15.07% | 11.44% | $29,530 | |
| Total Stock Market Index Fund ETF Shares Market Price | 26.11 | 15.09 | 11.44 | 29,546 | |
| CRSP US Total Market Index | 25.98 | 15.08 | 11.44 | 29,545 | |
| Average Annual Total Returns Periods Ended December 31, 2023 | |||||
| One Year | Five Years | Ten Years | Final Value of a $10,000 Investment | ||
| Total Stock Market Index Fund Admiral Shares | 26.01% | 15.07% | 11.43% | $29,511 | |
| CRSP US Total Market Index | 25.98 | 15.08 | 11.44 | 29,545 | |
| One Year | Five Years | Ten Years | Final Value of a $5,000,000 Investment | ||
| Total Stock Market Index Fund Institutional Shares | 26.02% | 15.08% | 11.44% | $14,770,565 | |
| CRSP US Total Market Index | 25.98 | 15.08 | 11.44 | 14,772,640 | |
| One Year | Five Years | Since Inception (4/28/2015) | Final Value of a $100,000,000 Investment | ||
| Total Stock Market Index Fund Institutional Plus Shares | 26.03% | 15.09% | 11.29% | $253,032,140 | |
| CRSP US Total Market Index | 25.98 | 15.08 | 11.28 | 252,780,380 | |
| One Year | Five Years | Since Inception (6/27/2016) | Final Value of a $5,000,000,000 Investment | ||
| Total Stock Market Index Fund Institutional Select Shares | 26.05% | 15.10% | 13.88% | $13,269,271,000 | |
| CRSP US Total Market Index | 25.98 | 15.08 | 13.85 | 13,249,208,500 | |
| Cumulative Returns of ETF Shares: December 31, 2013, Through December 31, 2023 | |||
| One Year | Five Years | Ten Years | |
| Total Stock Market Index Fund ETF Shares Market Price | 26.11% | 101.91% | 195.46% |
| Total Stock Market Index Fund ETF Shares Net Asset Value | 26.03 | 101.77 | 195.30 |
| CRSP US Total Market Index | 25.98 | 101.85 | 195.45 |
| Basic Materials | 2.0% |
| Consumer Discretionary | 14.5 |
| Consumer Staples | 4.7 |
| Energy | 4.1 |
| Financials | 10.8 |
| Health Care | 12.1 |
| Industrials | 13.1 |
| Real Estate | 3.0 |
| Technology | 31.1 |
| Telecommunications | 2.0 |
| Utilities | 2.6 |
| Shares | Market Value• ($000) | |||||
| Temporary Cash Investments (0.4%) | ||||||
| Money Market Fund (0.4%) | ||||||
| 4,5 | Vanguard Market Liquidity Fund, 5.435% (Cost $5,978,690) | 59,806,782 | 5,979,482 | |||
| Total Investments (100.1%) (Cost $703,118,641) | 1,460,185,426 | |||||
| Other Assets and Liabilities—Net (-0.1%) | (1,643,962) | |||||
| Net Assets (100%) | 1,458,541,464 | |||||
| Cost is in $000. |
| • | See Note A in Notes to Financial Statements. |
| * | Non-income-producing security. |
| 1 | Includes partial security positions on loan to broker-dealers. The total value of securities on loan is $3,088,263,000. |
| 2 | Security value determined using significant unobservable inputs. |
| 3 | Considered an affiliated company of the fund as the fund owns more than 5% of the outstanding voting securities of such company. |
| 4 | Affiliated money market fund available only to Vanguard funds and certain trusts and accounts managed by Vanguard. Rate shown is the 7-day yield. |
| 5 | Collateral of $3,557,335,000 was received for securities on loan. |
| CVR—Contingent Value Rights. | |
| REIT—Real Estate Investment Trust. |
| Futures Contracts | ||||
| ($000) | ||||
| Expiration | Number of Long (Short) Contracts | Notional Amount | Value and Unrealized Appreciation (Depreciation) | |
| Long Futures Contracts | ||||
| E-mini Russell 2000 Index | March 2024 | 4,453 | 455,920 | 32,365 |
| E-mini S&P 500 Index | March 2024 | 11,234 | 2,707,394 | 8,382 |
| E-mini S&P Mid-Cap 400 Index | March 2024 | 240 | 67,428 | 3,569 |
| 44,316 | ||||
| Over-the-Counter Total Return Swaps | ||||||
| Reference Entity | Termination Date | Counterparty | Notional Amount ($000) | Floating Interest Rate Received (Paid)1 (%) | Value and Unrealized Appreciation ($000) | Value and Unrealized (Depreciation) ($000) |
| Arbor Realty Trust Inc. | 1/31/24 | GSI | 7,690 | (5.331) | — | (112) |
| Citigroup Inc. | 8/29/25 | BANA | 32,270 | (5.932) | 3,589 | — |
| Fidelity National Information Services Inc. | 8/30/24 | BANA | 32,838 | (5.882) | 942 | — |
| Fidelity National Information Services Inc. | 8/30/24 | BANA | 32,838 | (5.882) | 942 | — |
| Fidelity National Information Services Inc. | 8/30/24 | BANA | 30,000 | (5.976) | — | (40) |
| Fidelity National Information Services Inc. | 8/30/24 | BANA | 29,480 | (5.979) | 707 | — |
| Fidelity National Information Services Inc. | 8/30/24 | BANA | 29,470 | (5.978) | 477 | — |
| Fidelity National Information Services Inc. | 8/30/24 | BANA | 29,460 | (5.979) | 472 | — |
| Fidelity National Information Services Inc. | 8/30/24 | BANA | 29,360 | (5.977) | 592 | — |
| Fidelity National Information Services Inc. | 8/30/24 | BANA | 28,920 | (5.977) | 1,038 | — |
| Global Payments Inc. | 8/30/24 | BANA | 210,756 | (5.932) | 18,594 | — |
| Goldman Sachs Group Inc. | 8/29/25 | BANA | 290,651 | (6.032) | 38,617 | — |
| Invesco Ltd. | 8/30/24 | BANA | 3,996 | (5.882) | 1,037 | — |
| Invesco Ltd. | 8/30/24 | BANA | 856 | (5.882) | 222 | — |
| Paycor HCM Inc. | 1/31/24 | CITNA | 4,242 | (5.332) | 59 | — |
| VICI Properties Inc. Class A | 8/30/24 | BANA | 141,978 | (5.982) | 10,763 | — |
| Visa Inc. Class A | 8/30/24 | BANA | 57,753 | (5.232) | 708 | — |
| Visa Inc. Class A | 8/30/24 | BANA | 51,336 | (5.332) | 625 | — |
| Yum! Brands Inc. | 8/30/24 | BANA | 21,971 | (5.332) | 909 | — |
| 80,293 | (152) | |||||
| 1 | Based on USD Overnight Bank Funding Rate as of the most recent reset date. Floating interest payment received/paid monthly. |
| BANA—Bank of America, N.A. | |
| CITNA—Citibank, N.A. | |
| GSI—Goldman Sachs International. |
| ($000s, except shares, footnotes, and per-share amounts) | Amount |
| Assets | |
| Investments in Securities, at Value1 | |
| Unaffiliated Issuers (Cost $697,136,333) | 1,454,203,653 |
| Affiliated Issuers (Cost $5,982,308) | 5,981,773 |
| Total Investments in Securities | 1,460,185,426 |
| Investment in Vanguard | 45,961 |
| Cash | 34,993 |
| Cash Collateral Pledged—Futures Contracts | 155,110 |
| Cash Collateral Pledged—Over-the-Counter Swap Contracts | 60 |
| Receivables for Investment Securities Sold | 69,834 |
| Receivables for Accrued Income | 1,368,254 |
| Receivables for Capital Shares Issued | 1,101,323 |
| Unrealized Appreciation—Over-the-Counter Swap Contracts | 80,293 |
| Total Assets | 1,463,041,254 |
| Liabilities | |
| Payables for Investment Securities Purchased | 38,873 |
| Collateral for Securities on Loan | 3,557,335 |
| Payables for Capital Shares Redeemed | 871,000 |
| Payables for Distributions | 3 |
| Payables to Vanguard | 18,400 |
| Variation Margin Payable—Futures Contracts | 14,027 |
| Unrealized Depreciation—Over-the-Counter Swap Contracts | 152 |
| Total Liabilities | 4,499,790 |
| Net Assets | 1,458,541,464 |
| 1 Includes $3,088,263,000 of securities on loan. | |
| Statement of Assets and Liabilities (continued) | |
| At December 31, 2023, net assets consisted of: | |
| ($000s, except shares, footnotes, and per-share amounts) | Amount |
| Paid-in Capital | 728,471,377 |
| Total Distributable Earnings (Loss) | 730,070,087 |
| Net Assets | 1,458,541,464 |
| Investor Shares—Net Assets | |
| Applicable to 177,030,981 outstanding $.001 par value shares of beneficial interest (unlimited authorization) | 20,442,743 |
| Net Asset Value Per Share—Investor Shares | $115.48 |
| ETF Shares—Net Assets | |
| Applicable to 1,466,627,292 outstanding $.001 par value shares of beneficial interest (unlimited authorization) | 347,955,269 |
| Net Asset Value Per Share—ETF Shares | $237.25 |
| Admiral Shares—Net Assets | |
| Applicable to 2,947,229,792 outstanding $.001 par value shares of beneficial interest (unlimited authorization) | 340,379,287 |
| Net Asset Value Per Share—Admiral Shares | $115.49 |
| Institutional Shares—Net Assets | |
| Applicable to 704,613,647 outstanding $.001 par value shares of beneficial interest (unlimited authorization) | 81,389,149 |
| Net Asset Value Per Share—Institutional Shares | $115.51 |
| Institutional Plus Shares—Net Assets | |
| Applicable to 2,802,586,697 outstanding $.001 par value shares of beneficial interest (unlimited authorization) | 607,187,771 |
| Net Asset Value Per Share—Institutional Plus Shares | $216.65 |
| Institutional Select Shares—Net Assets | |
| Applicable to 269,108,803 outstanding $.001 par value shares of beneficial interest (unlimited authorization) | 61,187,245 |
| Net Asset Value Per Share—Institutional Select Shares | $227.37 |
| Year Ended December 31, 2023 | |
| ($000) | |
| Investment Income | |
| Income | |
| Dividends—Unaffiliated Issuers1 | 20,631,366 |
| Dividends—Affiliated Issuers | 149 |
| Interest—Unaffiliated Issuers | 13,676 |
| Interest—Affiliated Issuers | 243,599 |
| Securities Lending—Net | 308,413 |
| Total Income | 21,197,203 |
| Expenses | |
| The Vanguard Group—Note B | |
| Investment Advisory Services | 32,625 |
| Management and Administrative—Investor Shares | 25,438 |
| Management and Administrative—ETF Shares | 67,204 |
| Management and Administrative—Admiral Shares | 101,815 |
| Management and Administrative—Institutional Shares | 18,148 |
| Management and Administrative—Institutional Plus Shares | 76,033 |
| Management and Administrative—Institutional Select Shares | 3,812 |
| Marketing and Distribution—Investor Shares | 1,054 |
| Marketing and Distribution—ETF Shares | 12,195 |
| Marketing and Distribution—Admiral Shares | 12,251 |
| Marketing and Distribution—Institutional Shares | 2,279 |
| Marketing and Distribution—Institutional Plus Shares | 14,384 |
| Marketing and Distribution—Institutional Select Shares | 101 |
| Custodian Fees | 1,876 |
| Auditing Fees | 253 |
| Shareholders’ Reports—Investor Shares | 188 |
| Shareholders’ Reports—ETF Shares | 3,033 |
| Shareholders’ Reports—Admiral Shares | 1,239 |
| Shareholders’ Reports—Institutional Shares | 64 |
| Shareholders’ Reports—Institutional Plus Shares | 2,413 |
| Shareholders’ Reports—Institutional Select Shares | — |
| Trustees’ Fees and Expenses | 787 |
| Interest Expense | — |
| Other Expenses | 138 |
| Total Expenses | 377,330 |
| Expenses Paid Indirectly | (8) |
| Net Expenses | 377,322 |
| Net Investment Income | 20,819,881 |
| Statement of Operations (continued) | |
| Year Ended December 31, 2023 | |
| ($000) | |
| Realized Net Gain (Loss) | |
| Capital Gain Distributions Received—Affiliated Issuers | 13 |
| Investment Securities Sold—Unaffiliated Issuers2 | 24,251,460 |
| Investment Securities Sold—Affiliated Issuers3 | 2,246 |
| Futures Contracts | 760,654 |
| Swap Contracts | (23,641) |
| Realized Net Gain (Loss) | 24,990,732 |
| Change in Unrealized Appreciation (Depreciation) | |
| Investment Securities—Unaffiliated Issuers | 256,421,058 |
| Investment Securities—Affiliated Issuers | (2,621) |
| Futures Contracts | 231,959 |
| Swap Contracts | 130,344 |
| Change in Unrealized Appreciation (Depreciation) | 256,780,740 |
| Net Increase (Decrease) in Net Assets Resulting from Operations | 302,591,353 |
| 1 | Dividends are net of foreign withholding taxes of $2,051,000. |
| 2 | Includes $25,907,196,000 of net gain (loss) resulting from in-kind redemptions. |
| 3 | Includes $582,000 of net gain (loss) resulting from in-kind redemptions. |
| Year Ended December 31, | ||
| 2023 ($000) | 2022 ($000) | |
| Increase (Decrease) in Net Assets | ||
| Operations | ||
| Net Investment Income | 20,819,881 | 18,662,820 |
| Realized Net Gain (Loss) | 24,990,732 | 5,664,235 |
| Change in Unrealized Appreciation (Depreciation) | 256,780,740 | (294,464,966) |
| Net Increase (Decrease) in Net Assets Resulting from Operations | 302,591,353 | (270,137,911) |
| Distributions | ||
| Investor Shares | (289,384) | (284,794) |
| ETF Shares | (4,851,485) | (4,187,918) |
| Admiral Shares | (4,859,268) | (4,513,747) |
| Institutional Shares | (1,178,824) | (1,107,318) |
| Institutional Plus Shares | (8,827,594) | (7,915,118) |
| Institutional Select Shares | (811,797) | (713,492) |
| Total Distributions | (20,818,352) | (18,722,387) |
| Capital Share Transactions | ||
| Investor Shares | (2,239,443) | (104,300,286) |
| ETF Shares | 21,896,112 | 25,952,138 |
| Admiral Shares | (108,385) | 4,099,576 |
| Institutional Shares | (1,318,438) | (155,304,571) |
| Institutional Plus Shares | (188,430) | 295,703,507 |
| Institutional Select Shares | 5,800,564 | 2,223,565 |
| Net Increase (Decrease) from Capital Share Transactions | 23,841,980 | 68,373,929 |
| Total Increase (Decrease) | 305,614,981 | (220,486,369) |
| Net Assets | ||
| Beginning of Period | 1,152,926,483 | 1,373,412,852 |
| End of Period | 1,458,541,464 | 1,152,926,483 |
| Investor Shares | |||||
| For a Share Outstanding Throughout Each Period | Year Ended December 31, | ||||
| 2023 | 2022 | 2021 | 2020 | 2019 | |
| Net Asset Value, Beginning of Period | $93.09 | $117.53 | $94.71 | $79.66 | $62.08 |
| Investment Operations | |||||
| Net Investment Income1 | 1.536 | 1.335 | 1.284 | 1.284 | 1.279 |
| Capital Gain Distributions Received | .0001,2 | .0001,2 | .0001,2 | — | — |
| Net Realized and Unrealized Gain (Loss) on Investments | 22.401 | (24.344) | 22.837 | 15.026 | 17.634 |
| Total from Investment Operations | 23.937 | (23.009) | 24.121 | 16.310 | 18.913 |
| Distributions | |||||
| Dividends from Net Investment Income | (1.547) | (1.431) | (1.301) | (1.260) | (1.333) |
| Distributions from Realized Capital Gains | — | — | — | — | — |
| Total Distributions | (1.547) | (1.431) | (1.301) | (1.260) | (1.333) |
| Net Asset Value, End of Period | $115.48 | $93.09 | $117.53 | $94.71 | $79.66 |
| Total Return3 | 25.89% | -19.60% | 25.59% | 20.87% | 30.65% |
| Ratios/Supplemental Data | |||||
| Net Assets, End of Period (Millions) | $20,443 | $18,409 | $133,977 | $153,845 | $139,686 |
| Ratio of Total Expenses to Average Net Assets | 0.14%4 | 0.14%4 | 0.14% | 0.14% | 0.14% |
| Ratio of Net Investment Income to Average Net Assets | 1.48% | 1.28% | 1.20% | 1.62% | 1.78% |
| Portfolio Turnover Rate5 | 2% | 3% | 4% | 8% | 4% |
| 1 | Calculated based on average shares outstanding. |
| 2 | Distribution was less than $.001 per share. |
| 3 | Total returns do not include account service fees that may have applied in the periods shown. Fund prospectuses provide information about any applicable account service fees. |
| 4 | The ratio of expenses to average net assets for the period net of reduction from custody fee offset arrangements was 0.14%. |
| 5 | Excludes the value of portfolio securities received or delivered as a result of in-kind purchases or redemptions of the fund’s capital shares, including ETF Creation Units. |
| ETF Shares | |||||
| For a Share Outstanding Throughout Each Period | Year Ended December 31, | ||||
| 2023 | 2022 | 2021 | 2020 | 2019 | |
| Net Asset Value, Beginning of Period | $191.25 | $241.49 | $194.61 | $163.70 | $127.56 |
| Investment Operations | |||||
| Net Investment Income1 | 3.411 | 3.191 | 2.912 | 2.831 | 2.809 |
| Capital Gain Distributions Received | .0001,2 | .0001,2 | .0001,2 | — | — |
| Net Realized and Unrealized Gain (Loss) on Investments | 46.002 | (50.248) | 46.898 | 30.848 | 36.236 |
| Total from Investment Operations | 49.413 | (47.057) | 49.810 | 33.679 | 39.045 |
| Distributions | |||||
| Dividends from Net Investment Income | (3.413) | (3.183) | (2.930) | (2.769) | (2.905) |
| Distributions from Realized Capital Gains | — | — | — | — | — |
| Total Distributions | (3.413) | (3.183) | (2.930) | (2.769) | (2.905) |
| Net Asset Value, End of Period | $237.25 | $191.25 | $241.49 | $194.61 | $163.70 |
| Total Return | 26.03% | -19.50% | 25.72% | 20.95% | 30.80% |
| Ratios/Supplemental Data | |||||
| Net Assets, End of Period (Millions) | $347,955 | $261,084 | $299,088 | $202,075 | $138,067 |
| Ratio of Total Expenses to Average Net Assets | 0.03%3 | 0.03%3 | 0.03% | 0.03% | 0.03% |
| Ratio of Net Investment Income to Average Net Assets | 1.60% | 1.55% | 1.31% | 1.73% | 1.89% |
| Portfolio Turnover Rate4 | 2% | 3% | 4% | 8% | 4% |
| 1 | Calculated based on average shares outstanding. |
| 2 | Distribution was less than $.001 per share. |
| 3 | The ratio of expenses to average net assets for the period net of reduction from custody fee offset arrangements was 0.03%. |
| 4 | Excludes the value of portfolio securities received or delivered as a result of in-kind purchases or redemptions of the fund’s capital shares, including ETF Creation Units. |
| Admiral Shares | |||||
| For a Share Outstanding Throughout Each Period | Year Ended December 31, | ||||
| 2023 | 2022 | 2021 | 2020 | 2019 | |
| Net Asset Value, Beginning of Period | $93.10 | $117.56 | $94.74 | $79.69 | $62.09 |
| Investment Operations | |||||
| Net Investment Income1 | 1.645 | 1.540 | 1.402 | 1.364 | 1.360 |
| Capital Gain Distributions Received | .0001,2 | .0001,2 | .0001,2 | — | — |
| Net Realized and Unrealized Gain (Loss) on Investments | 22.396 | (24.460) | 22.833 | 15.025 | 17.646 |
| Total from Investment Operations | 24.041 | (22.920) | 24.235 | 16.389 | 19.006 |
| Distributions | |||||
| Dividends from Net Investment Income | (1.651) | (1.540) | (1.415) | (1.339) | (1.406) |
| Distributions from Realized Capital Gains | — | — | — | — | — |
| Total Distributions | (1.651) | (1.540) | (1.415) | (1.339) | (1.406) |
| Net Asset Value, End of Period | $115.49 | $93.10 | $117.56 | $94.74 | $79.69 |
| Total Return3 | 26.01% | -19.53% | 25.71% | 20.99% | 30.80% |
| Ratios/Supplemental Data | |||||
| Net Assets, End of Period (Millions) | $340,379 | $274,489 | $341,733 | $273,622 | $252,536 |
| Ratio of Total Expenses to Average Net Assets | 0.04%4 | 0.04%4 | 0.04% | 0.04% | 0.04% |
| Ratio of Net Investment Income to Average Net Assets | 1.59% | 1.54% | 1.30% | 1.72% | 1.88% |
| Portfolio Turnover Rate5 | 2% | 3% | 4% | 8% | 4% |
| 1 | Calculated based on average shares outstanding. |
| 2 | Distribution was less than $.001 per share. |
| 3 | Total returns do not include account service fees that may have applied in the periods shown. Fund prospectuses provide information about any applicable account service fees. |
| 4 | The ratio of expenses to average net assets for the period net of reduction from custody fee offset arrangements was 0.04%. |
| 5 | Excludes the value of portfolio securities received or delivered as a result of in-kind purchases or redemptions of the fund’s capital shares, including ETF Creation Units. |
| Institutional Shares | |||||
| For a Share Outstanding Throughout Each Period | Year Ended December 31, | ||||
| 2023 | 2022 | 2021 | 2020 | 2019 | |
| Net Asset Value, Beginning of Period | $93.12 | $117.58 | $94.75 | $79.70 | $62.10 |
| Investment Operations | |||||
| Net Investment Income1 | 1.655 | 1.497 | 1.416 | 1.374 | 1.365 |
| Capital Gain Distributions Received | .0001,2 | .0001,2 | .0001,2 | — | — |
| Net Realized and Unrealized Gain (Loss) on Investments | 22.397 | (24.407) | 22.841 | 15.024 | 17.649 |
| Total from Investment Operations | 24.052 | (22.910) | 24.257 | 16.398 | 19.014 |
| Distributions | |||||
| Dividends from Net Investment Income | (1.662) | (1.550) | (1.427) | (1.348) | (1.414) |
| Distributions from Realized Capital Gains | — | — | — | — | — |
| Total Distributions | (1.662) | (1.550) | (1.427) | (1.348) | (1.414) |
| Net Asset Value, End of Period | $115.51 | $93.12 | $117.58 | $94.75 | $79.70 |
| Total Return | 26.02% | -19.51% | 25.73% | 21.00% | 30.81% |
| Ratios/Supplemental Data | |||||
| Net Assets, End of Period (Millions) | $81,389 | $66,751 | $249,282 | $180,586 | $152,716 |
| Ratio of Total Expenses to Average Net Assets | 0.03%3 | 0.03%3 | 0.03% | 0.03% | 0.03% |
| Ratio of Net Investment Income to Average Net Assets | 1.60% | 1.46% | 1.31% | 1.73% | 1.89% |
| Portfolio Turnover Rate4 | 2% | 3% | 4% | 8% | 4% |
| 1 | Calculated based on average shares outstanding. |
| 2 | Distribution was less than $.001 per share. |
| 3 | The ratio of expenses to average net assets for the period net of reduction from custody fee offset arrangements was 0.03%. |
| 4 | Excludes the value of portfolio securities received or delivered as a result of in-kind purchases or redemptions of the fund’s capital shares, including ETF Creation Units. |
| Institutional Plus Shares | |||||
| For a Share Outstanding Throughout Each Period | Year Ended December 31, | ||||
| 2023 | 2022 | 2021 | 2020 | 2019 | |
| Net Asset Value, Beginning of Period | $174.63 | $220.49 | $177.69 | $149.47 | $116.46 |
| Investment Operations | |||||
| Net Investment Income1 | 3.123 | 2.960 | 2.672 | 2.591 | 2.575 |
| Capital Gain Distributions Received | .0001,2 | .0001,2 | .0001,2 | — | — |
| Net Realized and Unrealized Gain (Loss) on Investments | 42.014 | (45.906) | 42.823 | 28.172 | 33.100 |
| Total from Investment Operations | 45.137 | (42.946) | 45.495 | 30.763 | 35.675 |
| Distributions | |||||
| Dividends from Net Investment Income | (3.117) | (2.914) | (2.695) | (2.543) | (2.665) |
| Distributions from Realized Capital Gains | — | — | — | — | — |
| Total Distributions | (3.117) | (2.914) | (2.695) | (2.543) | (2.665) |
| Net Asset Value, End of Period | $216.65 | $174.63 | $220.49 | $177.69 | $149.47 |
| Total Return | 26.03% | -19.51% | 25.74% | 21.02% | 30.82% |
| Ratios/Supplemental Data | |||||
| Net Assets, End of Period (Millions) | $607,188 | $488,093 | $296,554 | $226,288 | $188,188 |
| Ratio of Total Expenses to Average Net Assets | 0.02%3 | 0.02%3 | 0.02% | 0.02% | 0.02% |
| Ratio of Net Investment Income to Average Net Assets | 1.61% | 1.59% | 1.32% | 1.74% | 1.90% |
| Portfolio Turnover Rate4 | 2% | 3% | 4% | 8% | 4% |
| 1 | Calculated based on average shares outstanding. |
| 2 | Distribution was less than $.001 per share. |
| 3 | The ratio of expenses to average net assets for the period net of reduction from custody fee offset arrangements was 0.02%. |
| 4 | Excludes the value of portfolio securities received or delivered as a result of in-kind purchases or redemptions of the fund’s capital shares, including ETF Creation Units. |
| Institutional Select Shares | |||||
| For a Share Outstanding Throughout Each Period | Year Ended December 31, | ||||
| 2023 | 2022 | 2021 | 2020 | 2019 | |
| Net Asset Value, Beginning of Period | $183.25 | $231.36 | $186.45 | $156.83 | $122.20 |
| Investment Operations | |||||
| Net Investment Income1 | 3.312 | 3.093 | 2.821 | 2.772 | 2.709 |
| Capital Gain Distributions Received | .0001,2 | .0001,2 | .0001,2 | — | — |
| Net Realized and Unrealized Gain (Loss) on Investments | 44.079 | (48.139) | 44.937 | 29.532 | 34.731 |
| Total from Investment Operations | 47.391 | (45.046) | 47.758 | 32.304 | 37.440 |
| Distributions | |||||
| Dividends from Net Investment Income | (3.271) | (3.064) | (2.848) | (2.684) | (2.810) |
| Distributions from Realized Capital Gains | — | — | — | — | — |
| Total Distributions | (3.271) | (3.064) | (2.848) | (2.684) | (2.810) |
| Net Asset Value, End of Period | $227.37 | $183.25 | $231.36 | $186.45 | $156.83 |
| Total Return | 26.05% | -19.50% | 25.75% | 21.03% | 30.84% |
| Ratios/Supplemental Data | |||||
| Net Assets, End of Period (Millions) | $61,187 | $44,101 | $52,780 | $44,296 | $26,431 |
| Ratio of Total Expenses to Average Net Assets | 0.01%3 | 0.01%3 | 0.01% | 0.01% | 0.01% |
| Ratio of Net Investment Income to Average Net Assets | 1.62% | 1.57% | 1.33% | 1.76% | 1.91% |
| Portfolio Turnover Rate4 | 2% | 3% | 4% | 8% | 4% |
| 1 | Calculated based on average shares outstanding. |
| 2 | Distribution was less than $.001 per share. |
| 3 | The ratio of expenses to average net assets for the period net of reduction from custody fee offset arrangements was 0.01%. |
| 4 | Excludes the value of portfolio securities received or delivered as a result of in-kind purchases or redemptions of the fund’s capital shares, including ETF Creation Units. |
| Level 1 ($000) | Level 2 ($000) | Level 3 ($000) | Total ($000) | |
| Investments | ||||
| Assets | ||||
| Common Stocks | 1,454,190,053 | — | 6,440 | 1,454,196,493 |
| Preferred Stocks | 16 | — | — | 16 |
| Rights | — | 239 | 6,332 | 6,571 |
| Warrants | 13 | 487 | 2,364 | 2,864 |
| Temporary Cash Investments | 5,979,482 | — | — | 5,979,482 |
| Total | 1,460,169,564 | 726 | 15,136 | 1,460,185,426 |
| Derivative Financial Instruments | ||||
| Assets | ||||
| Futures Contracts1 | 44,316 | — | — | 44,316 |
| Swap Contracts | — | 80,293 | — | 80,293 |
| Total | 44,316 | 80,293 | — | 124,609 |
| Liabilities | ||||
| Swap Contracts | — | 152 | — | 152 |
| 1 | Includes cumulative appreciation (depreciation) on futures contracts and centrally cleared swaps, if any, as reported in the Schedule of Investments. Only current day’s variation margin is reported within the Statement of Assets and Liabilities. | |||
| Amount ($000) | |
| Paid-in Capital | 25,908,235 |
| Total Distributable Earnings (Loss) | (25,908,235) |
| Amount ($000) | |
| Undistributed Ordinary Income | 860,016 |
| Undistributed Long-Term Gains | — |
| Net Unrealized Gains (Losses) | 754,330,507 |
| Capital Loss Carryforwards | (25,120,436) |
| Qualified Late-Year Losses | — |
| Other Temporary Differences | — |
| Total | 730,070,087 |
| Year Ended December 31, | ||
| 2023 Amount ($000) | 2022 Amount ($000) | |
| Ordinary Income* | 20,818,352 | 18,722,387 |
| Long-Term Capital Gains | — | — |
| Total | 20,818,352 | 18,722,387 |
| * | Includes short-term capital gains, if any. |
| Amount ($000) | |
| Tax Cost | 705,854,919 |
| Gross Unrealized Appreciation | 804,253,337 |
| Gross Unrealized Depreciation | (49,922,830) |
| Net Unrealized Appreciation (Depreciation) | 754,330,507 |
| Year Ended December 31, | |||||
| 2023 | 2022 | ||||
| Amount ($000) | Shares (000) | Amount ($000) | Shares (000) | ||
| Investor Shares | |||||
| Issued | 317,778 | 3,167 | 3,914,517 | 36,574 | |
| Issued in Lieu of Cash Distributions | 289,384 | 2,758 | 284,794 | 2,978 | |
| Redeemed | (2,846,605) | (26,651) | (108,499,597) | (981,740) | |
| Net Increase (Decrease)—Investor Shares | (2,239,443) | (20,726) | (104,300,286) | (942,188) | |
| ETF Shares | |||||
| Issued | 52,502,894 | 241,918 | 50,798,717 | 249,707 | |
| Issued in Lieu of Cash Distributions | — | — | — | — | |
| Redeemed | (30,606,782) | (140,400) | (24,846,579) | (123,100) | |
| Net Increase (Decrease)—ETF Shares | 21,896,112 | 101,518 | 25,952,138 | 126,607 | |
| Admiral Shares | |||||
| Issued | 26,313,081 | 254,268 | 31,898,755 | 317,329 | |
| Issued in Lieu of Cash Distributions | 4,050,962 | 38,521 | 3,762,619 | 39,309 | |
| Redeemed | (30,472,428) | (293,822) | (31,561,798) | (315,336) | |
| Net Increase (Decrease)—Admiral Shares | (108,385) | (1,033) | 4,099,576 | 41,302 | |
| Year Ended December 31, | |||||
| 2023 | 2022 | ||||
| Amount ($000) | Shares (000) | Amount ($000) | Shares (000) | ||
| Institutional Shares | |||||
| Issued | 7,372,614 | 71,232 | 9,249,702 | 92,024 | |
| Issued in Lieu of Cash Distributions | 949,403 | 9,031 | 903,770 | 9,433 | |
| Redeemed | (9,640,455) | (92,509) | (165,458,043) | (1,504,789) | |
| Net Increase (Decrease)—Institutional Shares | (1,318,438) | (12,246) | (155,304,571) | (1,403,332) | |
| Institutional Plus Shares | |||||
| Issued | 35,342,057 | 188,265 | 320,489,415 | 1,582,401 | |
| Issued in Lieu of Cash Distributions | 8,750,147 | 44,372 | 7,850,659 | 43,753 | |
| Redeemed | (44,280,634) | (224,992) | (32,636,567) | (176,178) | |
| Net Increase (Decrease)—Institutional Plus Shares | (188,430) | 7,645 | 295,703,507 | 1,449,976 | |
| Institutional Select Shares | |||||
| Issued | 15,363,880 | 73,855 | 6,711,633 | 34,640 | |
| Issued in Lieu of Cash Distributions | 811,797 | 3,913 | 713,492 | 3,786 | |
| Redeemed | (10,375,113) | (49,312) | (5,201,560) | (25,901) | |
| Net Increase (Decrease)—Institutional Select Shares | 5,800,564 | 28,456 | 2,223,565 | 12,525 | |
| Current Period Transactions | ||||||||
| Dec. 31, 2022 Market Value ($000) | Purchases at Cost ($000) | Proceeds from Securities Sold ($000) | Realized Net Gain (Loss) ($000) | Change in Unrealized App. (Dep.) ($000) | Income ($000) | Capital Gain Distributions Received ($000) | Dec. 31, 2023 Market Value ($000) | |
| 1895 Bancorp of Wisconsin Inc. | NA1 | 74 | 25 | (12) | (1,029) | — | — | 2,291 |
| Franklin Financial Services Corp. | NA1 | 6,573 | 4,827 | 582 | 271 | 149 | — | NA2 |
| Vanguard Market Liquidity Fund | 10,588,790 | NA3 | NA3 | 1,676 | (1,863) | 243,599 | 13 | 5,979,482 |
| Total | 10,588,790 | 6,647 | 4,852 | 2,246 | (2,621) | 243,748 | 13 | 5,981,773 |
| 1 | Not applicable—at December 31, 2022, the issuer was not an affiliated company of the fund. |
| 2 | Not applicable—at December 31, 2023, the security was still held, but the issuer was no longer an affiliated company of the fund. |
| 3 | Not applicable—purchases and sales are for temporary cash investment purposes. |
Philadelphia, Pennsylvania
February 16, 2024

Item 2: Code of Ethics.
The Registrant has adopted a code of ethics that applies to the Registrant’s principal executive officer, principal financial officer, principal accounting officer or controller or persons performing similar functions. The Code of Ethics was amended during the reporting period covered by this report to make certain technical, non-material changes.
Item 3: Audit Committee Financial Expert.
All members of the Audit Committee have been determined by the Registrant’s Board of Trustees to be Audit Committee Financial Experts and to be independent: F. Joseph Loughrey, Mark Loughridge, Sarah Bloom Raskin, and Peter F. Volanakis.
Item 4: Principal Accountant Fees and Services.
| (a) | Audit Fees. |
Audit Fees of the Registrant.
Fiscal Year Ended December 31, 2023: $668,000
Fiscal Year Ended December 31, 2022: $632,000
Aggregate Audit Fees of Registered Investment Companies in the Vanguard Group.
Fiscal Year Ended December 31, 2023: $9,326,156
Fiscal Year Ended December 31, 2022: $10,494,508
Includes fees billed in connection with audits of the Registrant, other registered investment companies in the Vanguard complex, The Vanguard Group, Inc., and Vanguard Marketing Corporation.
| (b) | Audit-Related Fees. |
Fiscal Year Ended December 31, 2023: $3,295,934
Fiscal Year Ended December 31, 2022: $2,757,764
Includes fees billed in connection with assurance and related services provided to the Registrant, other registered investment companies in the Vanguard complex, The Vanguard Group, Inc., and Vanguard Marketing Corporation.
| (c) | Tax Fees. |
Fiscal Year Ended December 31, 2023: $1,678,928
Fiscal Year Ended December 31, 2022: $5,202,689
Includes fees billed in connection with tax compliance, planning, and advice services provided to the Registrant, other registered investment companies in the Vanguard complex, The Vanguard Group, Inc., and Vanguard Marketing Corporation.
| (d) | All Other Fees. |
Fiscal Year Ended December 31, 2023: $25,000
Fiscal Year Ended December 31, 2022: $298,000
Includes fees billed for services related to tax reported information provided to the Registrant, other registered investment companies in the Vanguard complex, The Vanguard Group, Inc., and Vanguard Marketing Corporation.
(e) (1) Pre-Approval Policies. The policy of the Registrant’s Audit Committee is to consider, and, if appropriate, approve before the principal accountant is engaged for such services, all specific audit and non-audit services provided to: the Registrant, other registered investment companies in the Vanguard complex, The Vanguard Group, Inc., and entities controlled by The Vanguard Group, Inc. that provide ongoing services to the Registrant. In making a determination, the Audit Committee considers whether the services are consistent with maintaining the principal accountant’s independence.
In the event of a contingency situation in which the principal accountant is needed to provide services in between scheduled Audit Committee meetings, the Chairman of the Audit Committee would be called on to consider and, if appropriate, pre-approve audit or permitted non-audit services in an amount sufficient to complete services through the next Audit Committee meeting, and to determine if such services would be consistent with maintaining the accountant’s independence. At the next scheduled Audit Committee meeting, services and fees would be presented to the Audit Committee for formal consideration, and, if appropriate, approval by the entire Audit Committee. The Audit Committee would again consider whether such services and fees are consistent with maintaining the principal accountant’s independence.
The Registrant’s Audit Committee is informed at least annually of all audit and non-audit services provided by the principal accountant to the Vanguard complex, whether such services are provided to: the Registrant, other registered investment companies in the Vanguard complex, The Vanguard Group, Inc., or other entities controlled by The Vanguard Group, Inc. that provide ongoing services to the Registrant.
(2) No percentage of the principal accountant’s fees or services were approved pursuant to the waiver provision of paragraph (c)(7)(i)(C) of Rule 2-01 of Regulation S-X.
(f) For the most recent fiscal year, over 50% of the hours worked under the principal accountant’s engagement were not performed by persons other than full-time, permanent employees of the principal accountant.
(g) Aggregate Non-Audit Fees.
Fiscal Year Ended December 31, 2023: $1,703,928
Fiscal Year Ended December 31, 2022: $5,500,689
Includes fees billed for non-audit services provided to the Registrant, other registered investment companies in the Vanguard complex, The Vanguard Group, Inc., and Vanguard Marketing Corporation.
(h) For the most recent fiscal year, the Audit Committee has determined that the provision of all non-audit services was consistent with maintaining the principal accountant’s independence.
Item 5: Audit Committee of Listed Registrants.
The Registrant is a listed issuer as defined in rule 10A-3 under the Securities Exchange Act of 1934 (“Exchange Act”). The Registrant has a separately-designated standing audit committee established in accordance with Section 3(a)(58)(A) of the Exchange Act. The Registrant’s audit committee members are: F. Joseph Loughrey, Mark Loughridge, Sarah Bloom Raskin, and Peter F. Volanakis.
Item 6: Investments.
Not applicable. The complete schedule of investments is included as part of the report to shareholders filed under Item 1 of this Form.
Item 7: Disclosure of Proxy Voting Policies and Procedures for Closed-End Management Investment Companies.
Not applicable.
Item 8: Portfolio Managers of Closed-End Management Investment Companies.
Not applicable.
Item 9: Purchase of Equity Securities by Closed-End Management Investment Company and Affiliated Purchasers.
Not applicable.
Item 10: Submission of Matters to a Vote of Security Holders.
Not applicable.
Item 11: Controls and Procedures.
(a) Disclosure Controls and Procedures. The Principal Executive and Financial Officers concluded that the Registrant’s Disclosure Controls and Procedures are effective based on their evaluation of the Disclosure Controls and Procedures as of a date within 90 days of the filing date of this report.
(b) Internal Control Over Financial Reporting. There were no significant changes in the Registrant’s Internal Control Over Financial Reporting or in other factors that could significantly affect this control during the period covered by this report, including any corrective actions with regard to significant deficiencies and material weaknesses.
Item 12: Disclosure of Securities Lending Activities for Closed-End Management Investment Companies.
Not applicable.
Item 13: Exhibits.
| (a)(1) | Code of Ethics filed herewith. |
| (a)(2) | Certifications filed herewith. |
| (b) | Certifications filed herewith. |
Pursuant to the requirements of the Securities Exchange Act of 1934 and the Investment Company Act of 1940, the registrant has duly caused this report to be signed on its behalf by the undersigned, thereunto duly authorized.
| VANGUARD INDEX FUNDS | ||
| BY: | /s/ MORTIMER J. BUCKLEY* | |
| MORTIMER J. BUCKLEY | ||
| CHIEF EXECUTIVE OFFICER | ||
Date: February 23, 2024
Pursuant to the requirements of the Securities Exchange Act of 1934 and the Investment Company Act of 1940, this report has been signed below by the following persons on behalf of the registrant and in the capacities and on the dates indicated.
| VANGUARD INDEX FUNDS | ||
| BY: | /s/ MORTIMER J. BUCKLEY* | |
| MORTIMER J. BUCKLEY | ||
| CHIEF EXECUTIVE OFFICER | ||
Date: February 23, 2024
| VANGUARD INDEX FUNDS | ||
| BY: | /s/ CHRISTINE BUCHANAN* | |
| CHRISTINE BUCHANAN | ||
| CHIEF FINANCIAL OFFICER | ||
Date: February 23, 2024
| * By: | /s/ Anne E. Robinson |
Anne E. Robinson, pursuant to a Power of Attorney filed on July 21, 2023 (see File Number 33-53683) and to a Power of Attorney filed on March 29, 2023 (see File Number 2-11444), Incorporated by Reference.