1 Cheniere Energy Analyst / Investor Day April 7, 2014
Forward Looking Statements 2 This presentation contains certain statements that are, or may be deemed to be, “forward‐looking statements” within the meaning of Section 27A of the Securities Act of 1933, as amended, and Section 21E of the Securities Exchange Act of 1934, as amended. All statements, other than statements of historical facts, included herein are “forward‐looking statements.” Included among “forward‐looking statements” are, among other things: statements regarding the ability of Cheniere Energy Partners, L.P. to pay distributions to its unitholders or Cheniere Energy Partners LP Holdings, LLC to pay dividends to its shareholders; statements regarding Cheniere Energy Partners, L.P.’s expected receipt of cash distributions from Sabine Pass LNG, L.P., Sabine Pass Liquefaction, LLC or Cheniere Creole Trail Pipeline, L.P., or Cheniere Energy Partners LP Holding, LLC’s expected receipt of cash distributions from Cheniere Energy Partners, L.P.; statements that Cheniere Energy Partners, L.P. expects to commence or complete construction of its proposed liquefaction facilities, or any expansions thereof, by certain dates or at all; statements that Cheniere Energy, Inc. expects to commence or complete construction of its proposed liquefaction facilities or other projects by certain dates or at all; statements regarding future levels of domestic and international natural gas production, supply or consumption or future levels of liquefied natural gas (“LNG”) imports into or exports from North America and other countries worldwide, regardless of the source of such information, or the transportation or demand for and prices related to natural gas, LNG or other hydrocarbon products; statements regarding any financing transactions or arrangements, or ability to enter into such transactions; statements relating to the construction of our natural gas liquefaction trains (“Trains”), or modifications to the Creole Trail Pipeline, including statements concerning the engagement of any engineering, procurement and construction ("EPC") contractor or other contractor and the anticipated terms and provisions of any agreement with any EPC or other contractor, and anticipated costs related thereto; statements regarding any agreement to be entered into or performed substantially in the future, including any revenues anticipated to be received and the anticipated timing thereof, and statements regarding the amounts of total LNG regasification, liquefaction or storage capacities that are, or may become, subject to contracts; statements regarding counterparties to our commercial contracts, construction contracts and other contracts; statements regarding our planned construction of additional Trains, including the financing of such Trains; statements that our Trains, when completed, will have certain characteristics, including amounts of liquefaction capacities; statements regarding any business strategy, our strengths, our business and operation plans or any other plans, forecasts, projections or objectives, including anticipated revenues and capital expenditures and EBITDA, any or all of which are subject to change; statements regarding projections of revenues, expenses, earnings or losses, working capital or other financial items; statements regarding legislative, governmental, regulatory, administrative or other public body actions, approvals, requirements, permits, applications, filings, investigations, proceedings or decisions; statements regarding our anticipated LNG and natural gas marketing activities; and any other statements that relate to non‐historical or future information. These forward‐looking statements are often identified by the use of terms and phrases such as “achieve,” “anticipate,” “believe,” “contemplate,” “develop,” “estimate,” “example,” “expect,” “forecast,” “opportunities,” “plan,” “potential,” “project,” “propose,” “subject to,” “strategy,” and similar terms and phrases, or by use of future tense. Although we believe that the expectations reflected in these forward‐looking statements are reasonable, they do involve assumptions, risks and uncertainties, and these expectations may prove to be incorrect. You should not place undue reliance on these forward‐looking statements, which speak only as of the date of this presentation. Our actual results could differ materially from those anticipated in these forward‐looking statements as a result of a variety of factors, including those discussed in “Risk Factors” in the Cheniere Energy, Inc., Cheniere Energy Partners, L.P., Cheniere Energy Partners L.P. Holdings, LLC and Sabine Pass Liquefaction, LLC Annual Reports on Form 10‐K filed with the SEC on February 21, 2014, which are incorporated by reference into this presentation. All forward‐looking statements attributable to us or persons acting on our behalf are expressly qualified in their entirety by these ”Risk Factors”. These forward‐looking statements are made as of the date of this presentation, and other than as required under the securities laws, we undertake no obligation to publicly update or revise any forward‐looking statements.

Introduction Analyst Day / Investor Day Charif Souki ‐ Chairman, President, and CEO April 2014

Value of the Cheniere Platform People 4 Financial Strength Cash Flows
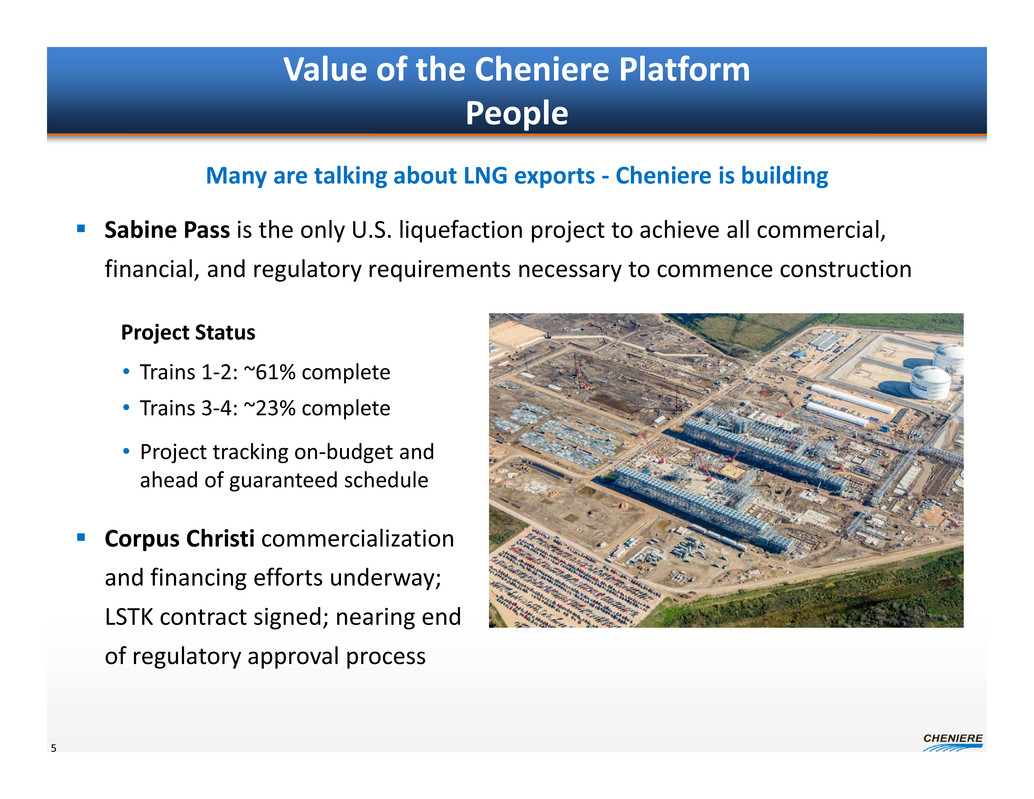
Value of the Cheniere Platform People Sabine Pass is the only U.S. liquefaction project to achieve all commercial, financial, and regulatory requirements necessary to commence construction Project Status • Trains 1‐2: ~61% complete • Trains 3‐4: ~23% complete • Project tracking on‐budget and ahead of guaranteed schedule Corpus Christi commercialization and financing efforts underway; LSTK contract signed; nearing end of regulatory approval process 5 Many are talking about LNG exports ‐ Cheniere is building
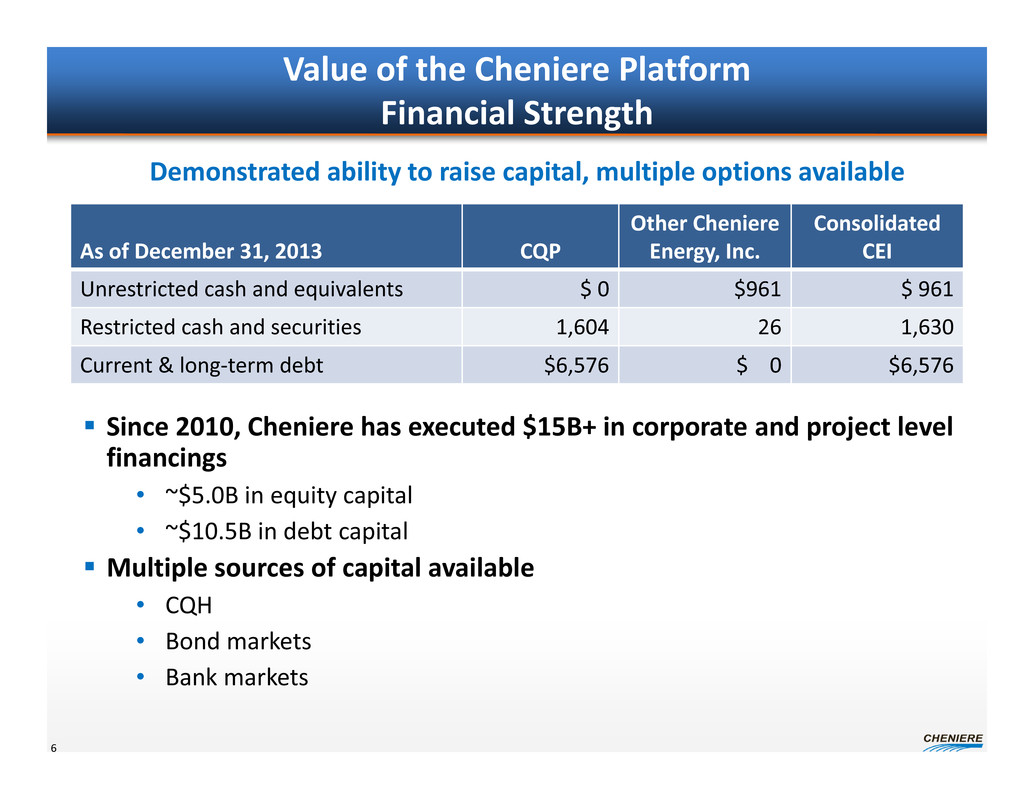
Value of the Cheniere Platform Financial Strength 6 Since 2010, Cheniere has executed $15B+ in corporate and project level financings • ~$5.0B in equity capital • ~$10.5B in debt capital Multiple sources of capital available • CQH • Bond markets • Bank markets Demonstrated ability to raise capital, multiple options available As of December 31, 2013 CQP Other Cheniere Energy, Inc. Consolidated CEI Unrestricted cash and equivalents $ 0 $961 $ 961 Restricted cash and securities 1,604 26 1,630 Current & long‐term debt $6,576 $ 0 $6,576
Value of the Cheniere Platform Cash Flows Significant cash flows under 20‐year take‐or‐pay contracts • ~$2.9B in fixed‐fee revenue contracted to date at Sabine Pass • Corpus Christi commercialization underway – 6 mtpa @ $3.50 equates to ~$1B+ in incremental fixed‐fee revenues – 2.3 mtpa signed to date for ~$413MM fixed‐fee revenues Upside from higher fixed fees in short/medium term contract market • 2 mtpa at Sabine Pass contracted to CMI • Corpus Christi additional volumes to be contracted in short/medium term market 7 9 trains: ~$3.5B ‐ $4.5B annual EBITDA

Macro Opportunities Continue to de‐risk Corpus Christi and SPL Trains 5 & 6 Seeking opportunities upstream and downstream from the platform Hydrocarbon abundance ‐ additional export opportunities 8

Keith Teague, Executive VP – Assets April 2014 Sabine Pass Liquefaction Train 1‐4 Construction Update Analyst / Investor Day

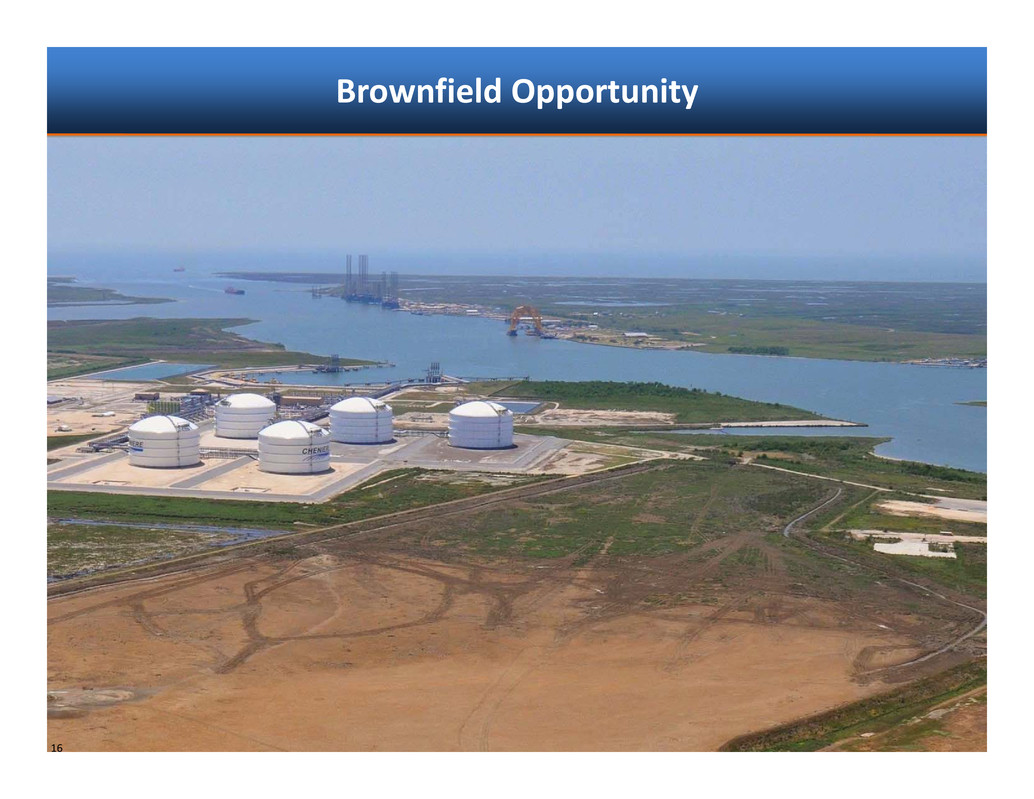
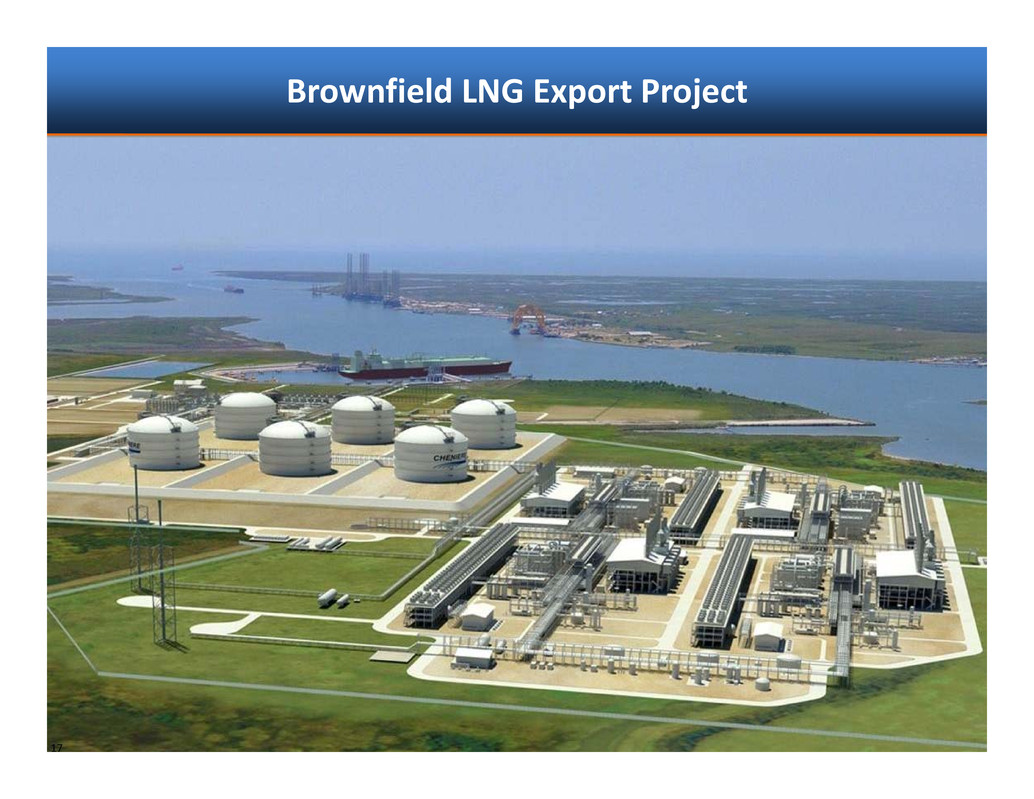
Brownfield LNG Export Project: Sabine Pass Liquefaction Utilizes Existing Assets, Trains 1‐4 Fully Contracted, Under Construction Current Facility ~1,000 acres in Cameron Parish, LA 40 ft ship channel 3.7 miles from coast 2 berths; 4 dedicated tugs 5 LNG storage tanks (~17 Bcfe of storage) 5.3 Bcf/d of pipeline interconnection Liquefaction Trains 1‐2 – Fully Contracted Lump Sum Turnkey EPC contract w/ Bechtel Total EPC contract price ~$4.0 billion Overall project ~61% complete (as of Feb 2014) Operations estimated late 2015/2016 Liquefaction Trains 3‐4 – Fully Contracted Lump Sum Turnkey EPC contract w/ Bechtel Total EPC contract price ~$3.8 billion Construction commenced in May 2013 Overall project ~23% complete (as of Feb 2014) Operations estimated 2016/2017 Liquefaction Expansion – Trains 5‐6 Bechtel commenced preliminary engineering Permitting initiated February 2013 10 Design production capacity is expected to be ~4.5 MTPA per train, using ConocoPhillips’ Optimized Cascade® Process. Significant infrastructure in place including storage, marine and pipeline interconnection facilities; pipeline quality natural gas to be sourced from U.S. pipeline network

Greenfield Opportunity 850+ acres in Southwest Cameron Parish, Louisiana Site situated along the Sabine Pass Ship Channel • 40’ deep shipping channel • 3.7 nautical miles from the coast • 22.8 nautical miles from the outer buoy Acreage consisted primarily of former dredge material placement areas S a t e l l i t e I m a g e r y , Oc t 2 0 0 4 11
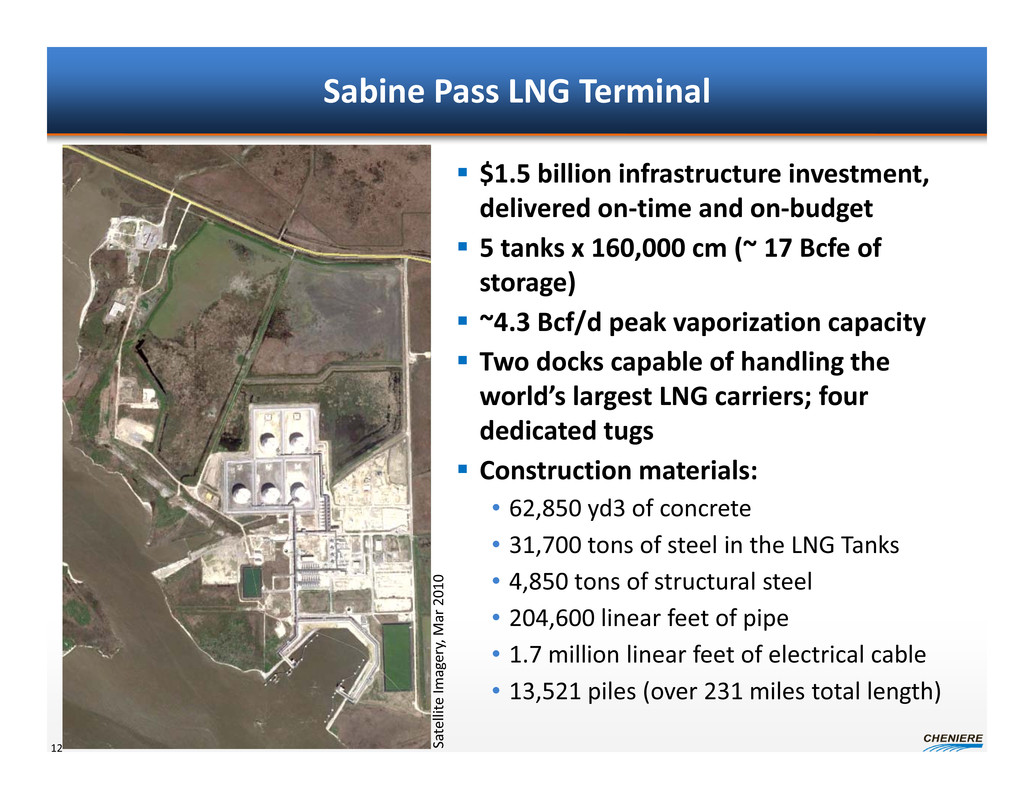
Sabine Pass LNG Terminal $1.5 billion infrastructure investment, delivered on‐time and on‐budget 5 tanks x 160,000 cm (~ 17 Bcfe of storage) ~4.3 Bcf/d peak vaporization capacity Two docks capable of handling the world’s largest LNG carriers; four dedicated tugs Construction materials: • 62,850 yd3 of concrete • 31,700 tons of steel in the LNG Tanks • 4,850 tons of structural steel • 204,600 linear feet of pipe • 1.7 million linear feet of electrical cable • 13,521 piles (over 231 miles total length) S a t e l l i t e I m a g e r y , M a r 2 0 1 0 12
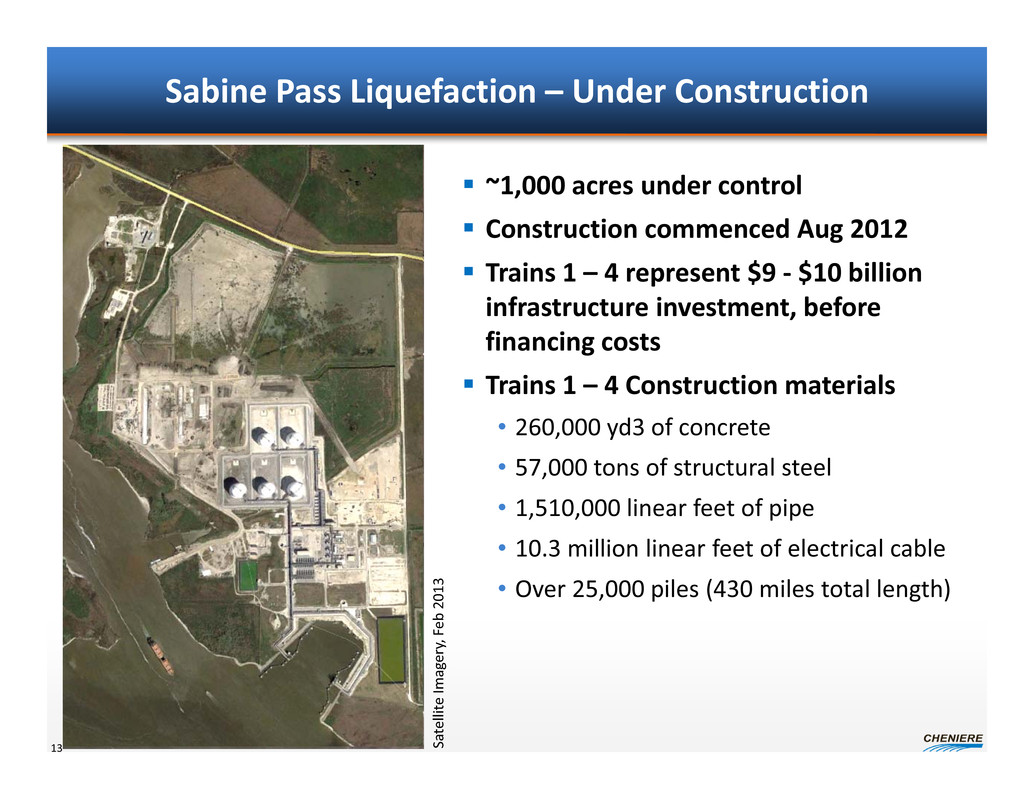
S a t e l l i t e I m a g e r y , F e b 2 0 1 3 Sabine Pass Liquefaction – Under Construction ~1,000 acres under control Construction commenced Aug 2012 Trains 1 – 4 represent $9 ‐ $10 billion infrastructure investment, before financing costs Trains 1 – 4 Construction materials • 260,000 yd3 of concrete • 57,000 tons of structural steel • 1,510,000 linear feet of pipe • 10.3 million linear feet of electrical cable • Over 25,000 piles (430 miles total length) 13
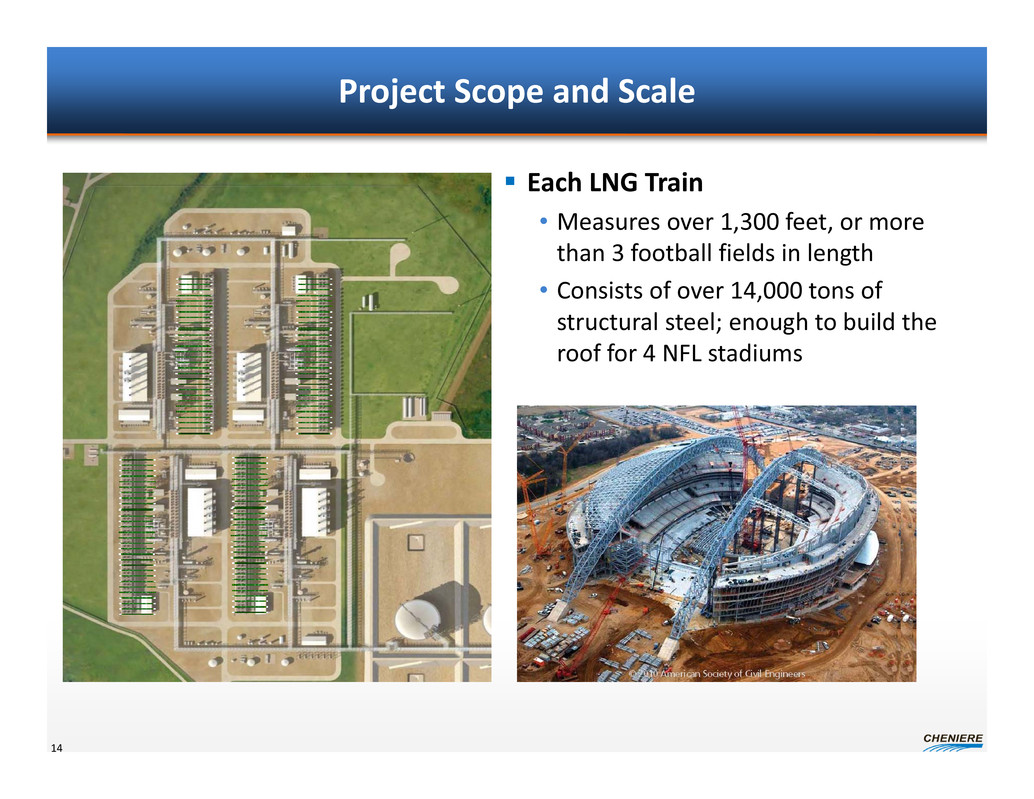
Project Scope and Scale Each LNG Train • Measures over 1,300 feet, or more than 3 football fields in length • Consists of over 14,000 tons of structural steel; enough to build the roof for 4 NFL stadiums 14

Project Scope and Scale Six GE LM2500 Gas Turbine Generators • Over 150 MW of installed generation capacity; enough to power 119,000 homes • Four in place and two being added Twenty four GE LM2500 Gas Turbines driving refrigerant compressors (6 per Train) • Horsepower equivalent of over 600 MW • Derivative of the GE CF6 aircraft engine utilized by Boeing, Airbus, Lockheed and McDonnell Douglas • Enough to power 6 Boeing 747 aircraft 15
Brownfield Opportunity 16
Brownfield LNG Export Project 17

Project Scope and Scale Four LNG Trains occupy a footprint sufficient for six MLB stadiums Project acreage: • Footprint of approximately 22 acres per Train • 60 acre footprint for interconnecting pipe racks and other facilities • 245 acres for material staging, laydown and employee parking 18
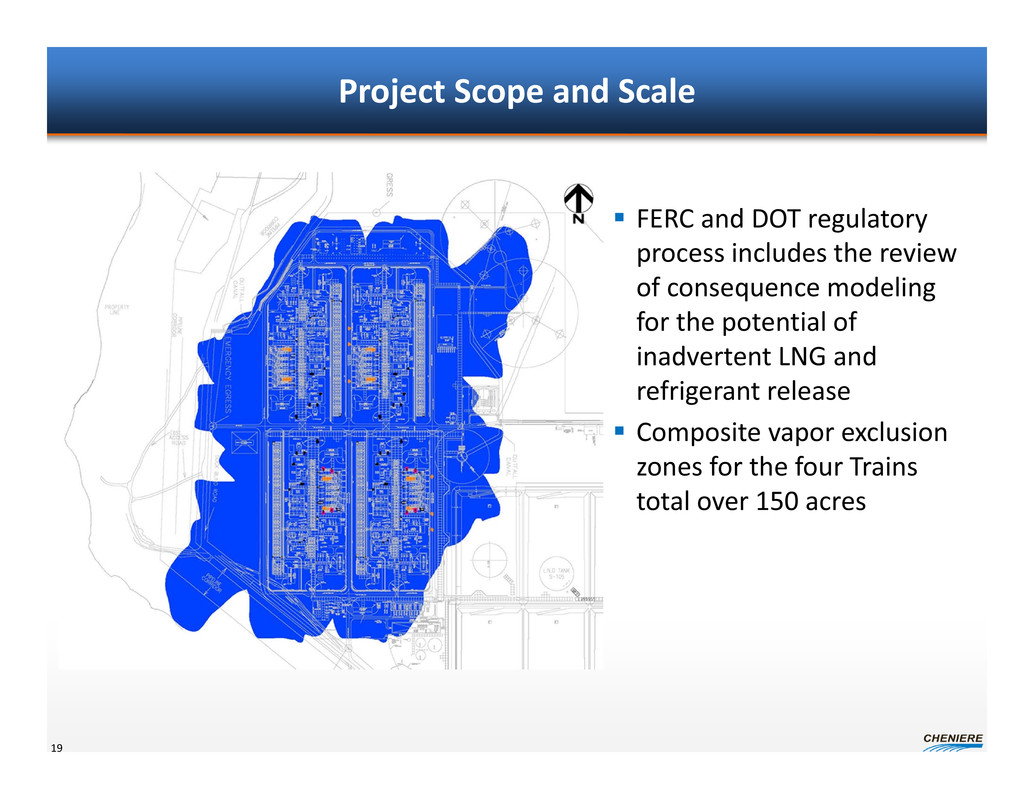
Project Scope and Scale FERC and DOT regulatory process includes the review of consequence modeling for the potential of inadvertent LNG and refrigerant release Composite vapor exclusion zones for the four Trains total over 150 acres 19
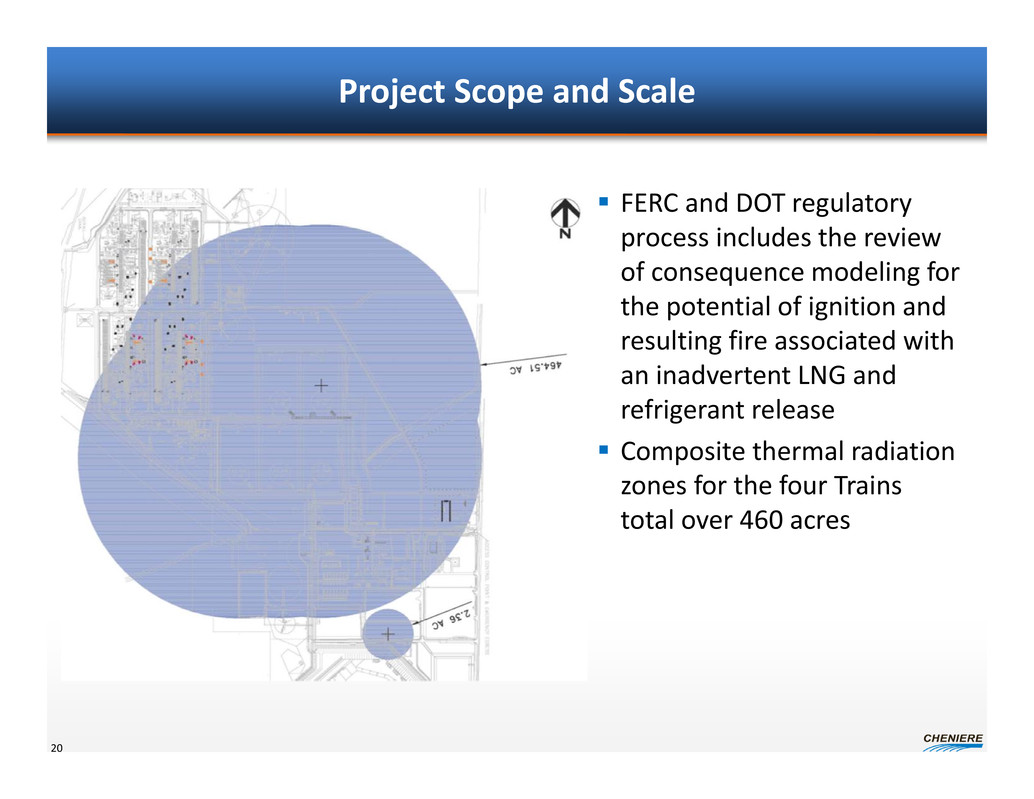
Project Scope and Scale FERC and DOT regulatory process includes the review of consequence modeling for the potential of ignition and resulting fire associated with an inadvertent LNG and refrigerant release Composite thermal radiation zones for the four Trains total over 460 acres 20
Project Siting Challenges – A Recap Physical • Scope and scale of the liquefaction process dictate a large acreage position • Sequential, simultaneous construction of multiple liquefaction trains dictate a large acreage position – Material staging and laydown areas – Accommodations for a significant construction workforce Regulatory • FERC and DOT regulatory review includes public safety considerations that dictate a large acreage position Thorough pre‐planning is one key to successful project execution 21
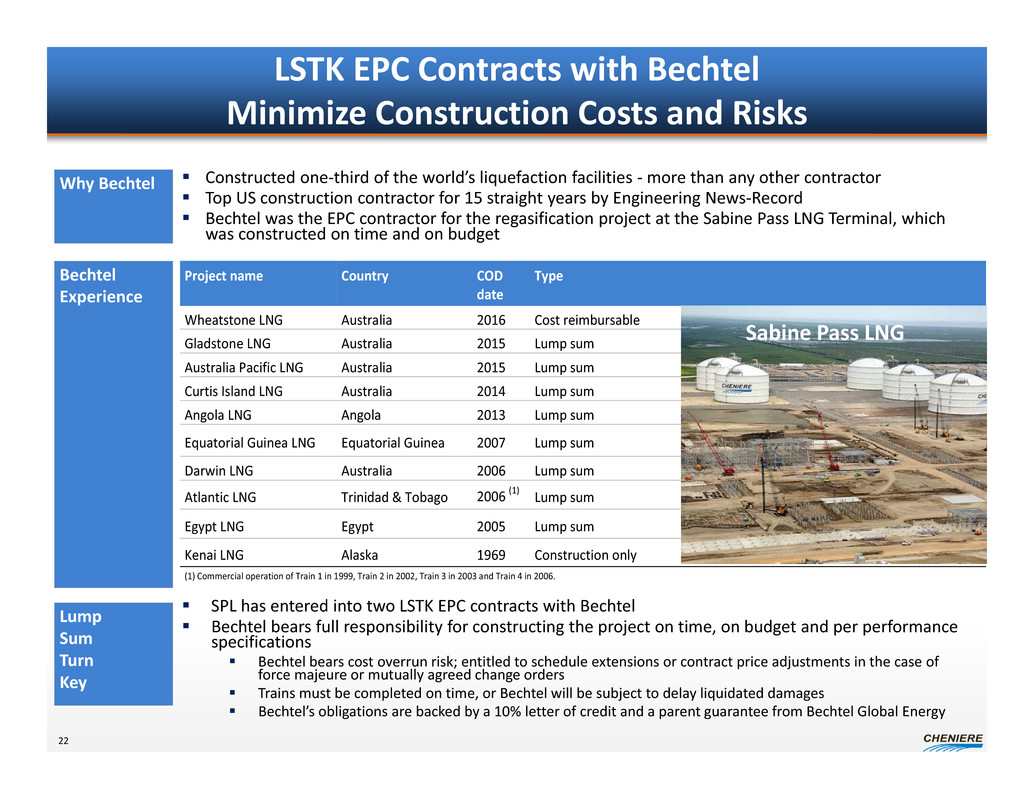
Why Bechtel Constructed one‐third of the world’s liquefaction facilities ‐more than any other contractor Top US construction contractor for 15 straight years by Engineering News‐Record Bechtel was the EPC contractor for the regasification project at the Sabine Pass LNG Terminal, which was constructed on time and on budget Bechtel Experience Lump Sum Turn Key SPL has entered into two LSTK EPC contracts with Bechtel Bechtel bears full responsibility for constructing the project on time, on budget and per performance specifications Bechtel bears cost overrun risk; entitled to schedule extensions or contract price adjustments in the case of force majeure or mutually agreed change orders Trains must be completed on time, or Bechtel will be subject to delay liquidated damages Bechtel’s obligations are backed by a 10% letter of credit and a parent guarantee from Bechtel Global Energy Project name Country COD date Type Wheatstone LNG Australia 2016 Cost reimbursable Gladstone LNG Australia 2015 Lump sum Australia Pacific LNG Australia 2015 Lump sum Curtis Island LNG Australia 2014 Lump sum Angola LNG Angola 2013 Lump sum Equatorial Guinea LNG Equatorial Guinea 2007 Lump sum Darwin LNG Australia 2006 Lump sum Atlantic LNG Trinidad & Tobago 2006 (1) Lump sum Egypt LNG Egypt 2005 Lump sum Kenai LNG Alaska 1969 Construction only (1) Commercial operation of Train 1 in 1999, Train 2 in 2002, Train 3 in 2003 and Train 4 in 2006. LSTK EPC Contracts with Bechtel Minimize Construction Costs and Risks 22 Sabine Pass LNG

Project Execution – 18 Months of Progress 23
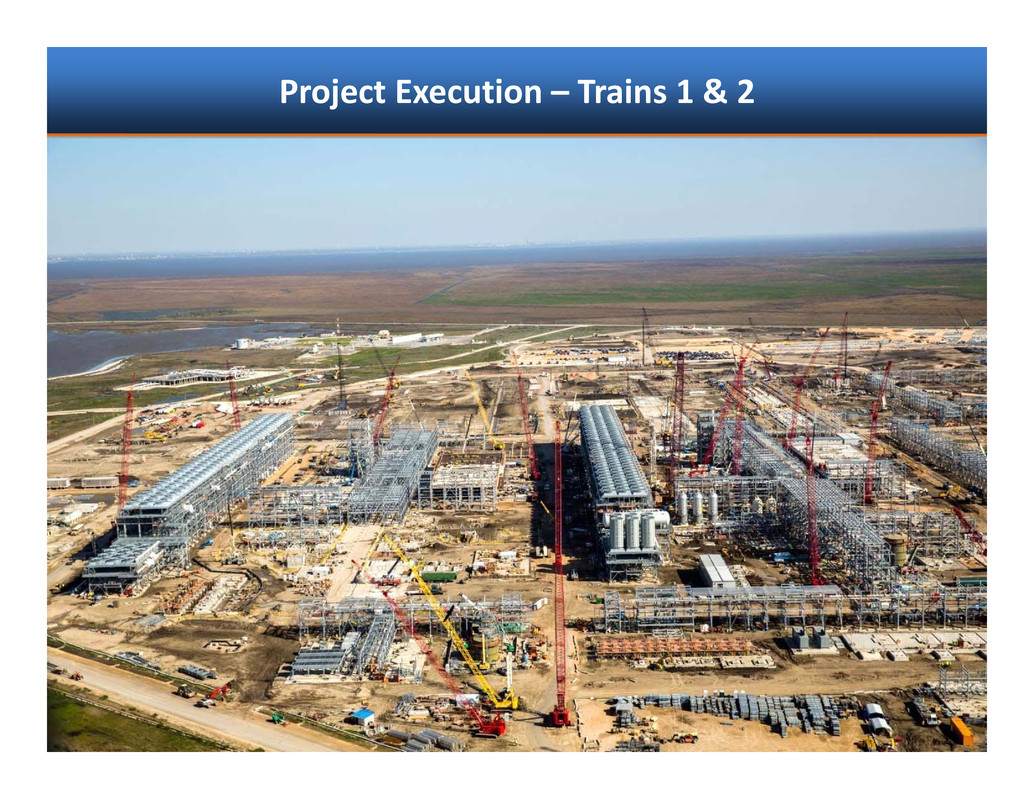
Project Execution – Trains 1 & 2

Project Execution – Trains 3 & 4

Project Execution – Train 1
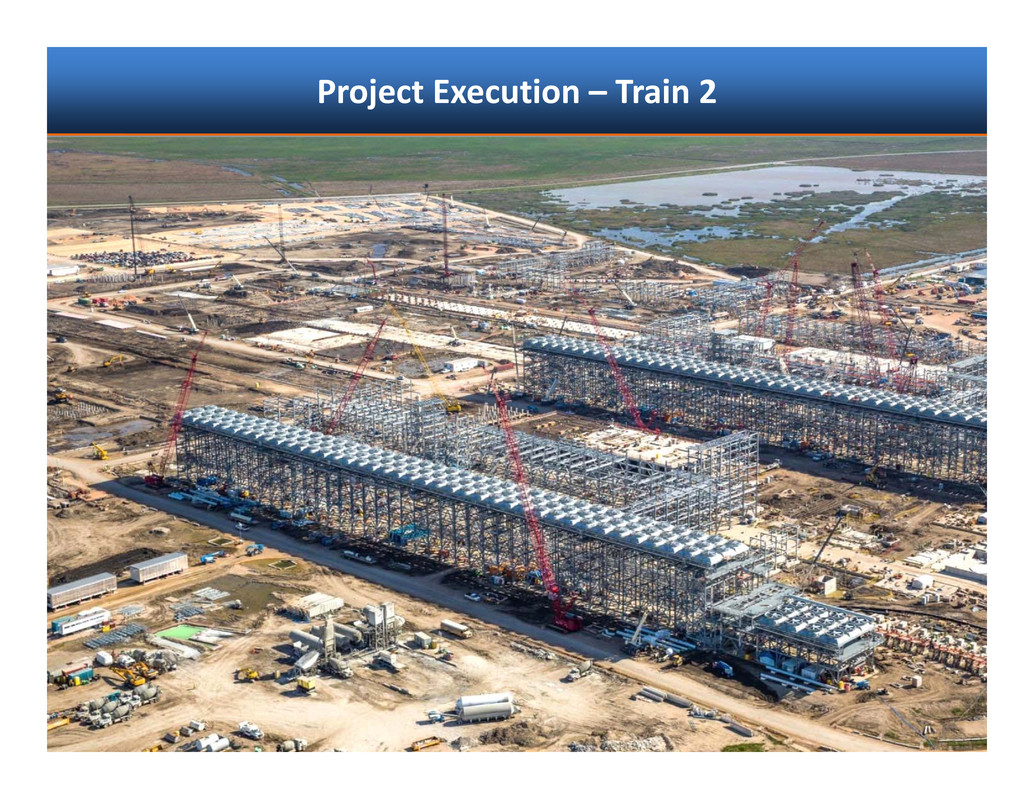
Project Execution – Train 2

Project Execution – New Warehouse and O&M Buildings

Project Execution ‐ Trains 1 ‐ 4 Despite recent winter weather delays, Target dates for first LNG remain 40 months from NTP for Train 1, and 48 months from NTP for Train 2 • Bechtel is executing against it’s schedule recovery plan Stage 1 (Trains 1&2) progress through Feb 2014: • Overall Project 60.8% complete vs. Target Plan of 63.6% • Engineering, Procurement, Subcontracts and Construction are 94.4%, 91.4%, 37.1% and 18.6% complete against the Target Plan of 93.0%, 95.6%, 38.0% and 21.4% respectively • Approximately $2.870 B of $4.058 B EPC Contract earned/invoiced Stage 2 (Trains 3&4) progress through Feb 2014: • Overall Project 23.3% complete vs. Target Plan of 22.3% • Engineering, Procurement, Subcontracts and Construction are 48.1%, 38.1%, 12.0% and 0.4% complete against the Target Plan of 45.0%, 37.1%, 8.6% and 0.7% respectively • Approximately $1.643 B of $3.748 B EPC Contract earned/invoiced 29 BG DFCD GN DFCD KOGAS DFCD GAIL DFCD Record First LNG – Egyptian LNG T1 First LNG Train 1 Train 2 Train 3 Train 4 Feb 2016 April 2017 Jun 2017 Mar 2018 June 2016 Sept 2017
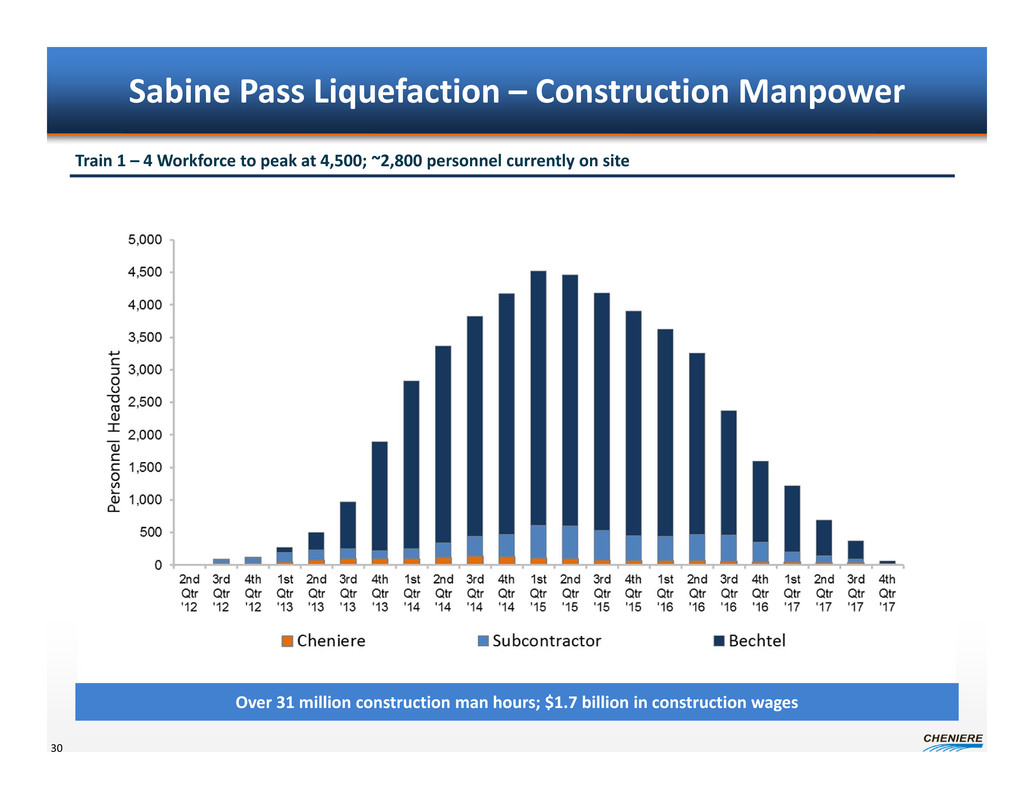
Sabine Pass Liquefaction – Construction Manpower 30 Over 31 million construction man hours; $1.7 billion in construction wages Train 1 – 4 Workforce to peak at 4,500; ~2,800 personnel currently on site
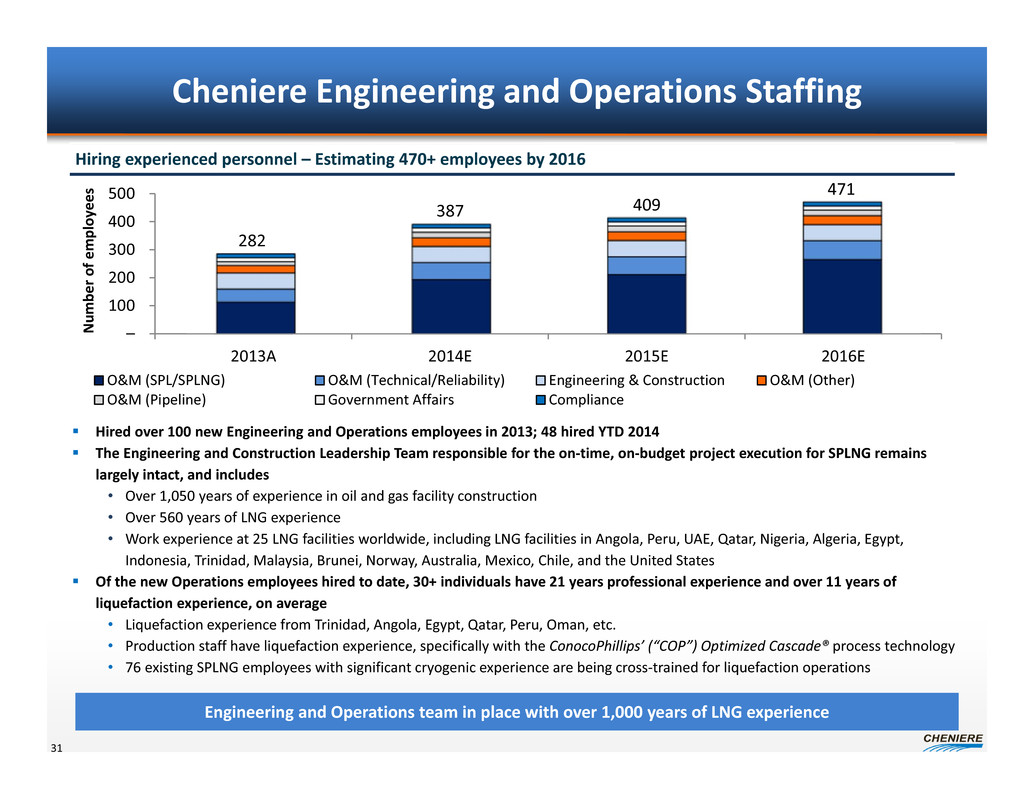
Cheniere Engineering and Operations Staffing 31 Hired over 100 new Engineering and Operations employees in 2013; 48 hired YTD 2014 The Engineering and Construction Leadership Team responsible for the on‐time, on‐budget project execution for SPLNG remains largely intact, and includes • Over 1,050 years of experience in oil and gas facility construction • Over 560 years of LNG experience • Work experience at 25 LNG facilities worldwide, including LNG facilities in Angola, Peru, UAE, Qatar, Nigeria, Algeria, Egypt, Indonesia, Trinidad, Malaysia, Brunei, Norway, Australia, Mexico, Chile, and the United States Of the new Operations employees hired to date, 30+ individuals have 21 years professional experience and over 11 years of liquefaction experience, on average • Liquefaction experience from Trinidad, Angola, Egypt, Qatar, Peru, Oman, etc. • Production staff have liquefaction experience, specifically with the ConocoPhillips’ (“COP”) Optimized Cascade® process technology • 76 existing SPLNG employees with significant cryogenic experience are being cross‐trained for liquefaction operations Engineering and Operations team in place with over 1,000 years of LNG experience Hiring experienced personnel – Estimating 470+ employees by 2016 282 387 409 455 – 100 200 300 400 500 2013A 2014E 2015E 2016E N u m b e r o f e m p l o y e e s O&M (SPL/SPLNG) O&M (Technical/Reliability) Engineering & Construction O&M (Other) O&M (Pipeline) Government Affairs Compliance 282 387 409 471

Experienced Liquefaction Operations Team 32 Tiered operating team in place with proven track record of managing liquefaction start up and operations Over 350 years of liquefaction experience M a n a g e m e n t P r o d u c t i o n T e c h n i c a l Leadership Team • Production Director • Training Advisor • Outage Planning Manager • Production Manager • VP, Sabine Pass Operations • VP, Operations Excellence • Director, Operations Planning • Director, Technical Services • Leadership Team (8 persons) with ~225 years of management experience, including ~105 years of liquefaction experience • Recent experience at Peru LNG project – Independent operator with no previous liquefaction experience • Achieved 97.5% ‐ 99% reliability (Years 1 – 2) Lead Production Engineer Shift Supervisors / Training Specialists Panel / Distributed Control System Operators Production Superintendent Production Engineers Senior Rotating Equipment Engineer Project Manager Materials Coordinator Senior Control Systems Engineer Senior Process Engineers • 18 liquefaction production employees with ~305 years of experience, including ~180 years of liquefaction experience • 17 of 18 employees have ConocoPhillips technology experience – key to achieving stable and predictable operations • Technical team with ~145 years of experience, including ~70 years of liquefaction experience • Technical staff created lessons learned from over 7 similar liquefaction projects

Sabine Pass Liquefaction Project Execution Keys to Success World class terminal site • Deep channel in close proximity to the coast • Sufficient acreage to satisfy siting challenges, both regulatory and physical World class Contractor • Bechtel has constructed one third of the world’s liquefaction facilities • Long, successful relationship between Cheniere and Bechtel • LSTK EPC Agreements where Bechtel bears cost, schedule & performance risk • Work proceeding on budget and well ahead of schedule guarantees World class Engineering and Operations Team • Over 1,000 years of LNG experience • Over 350 years of liquefaction experience 33
Katie Pipkin, SVP ‐ Business Development & Corporate Communications April 2014 Growth Projects – Corpus Christi and Sabine Pass T5‐6 Analyst / Investor Day
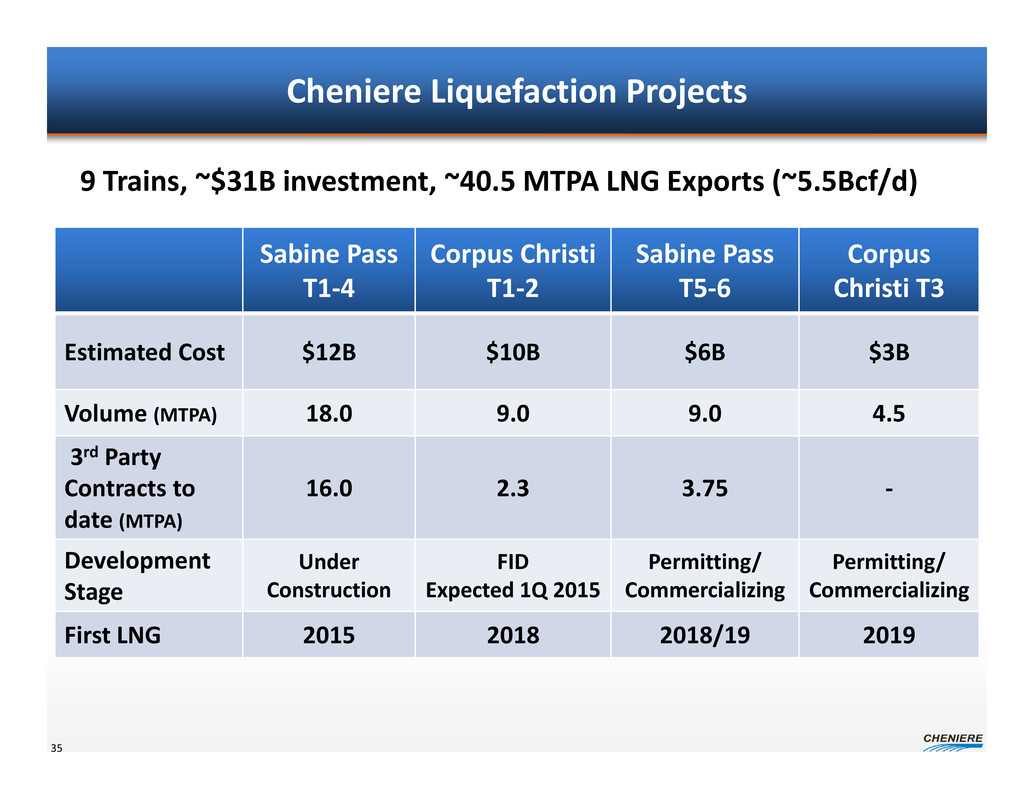
Cheniere Liquefaction Projects 35 Sabine Pass T1‐4 Corpus Christi T1‐2 Sabine Pass T5‐6 Corpus Christi T3 Estimated Cost $12B $10B $6B $3B Volume (MTPA) 18.0 9.0 9.0 4.5 3rd Party Contracts to date (MTPA) 16.0 2.3 3.75 ‐ Development Stage Under Construction FID Expected 1Q 2015 Permitting/ Commercializing Permitting/ Commercializing First LNG 2015 2018 2018/19 2019 9 Trains, ~$31B investment, ~40.5 MTPA LNG Exports (~5.5Bcf/d)

Source: Office of Oil and Gas Global Security and Supply, Office of Fossil Energy, U.S. Department of Energy; U.S. Federal Energy Regulatory Commission; Company releases U.S. LNG Export Projects Dominion Cove Point Under Construction Company Quantity (Bcf/d) DOE FERC* Contracts Cheniere Sabine Pass T1 – T4 2.2 Fully permitted Fully Subscribed Freeport 1.8 FTA + NonFTA T1‐T3 Lake Charles 2.0 FTA + NonFTA Dominion Cove Point 1.0 FTA + NonFTA Fully Subscribed Cameron LNG 1.7 FTA + NonFTA Fully Subscribed Jordan Cove 1.2/0.8 FTA + NonFTA Oregon LNG 1.25 FTA Cheniere Corpus Christi 2.1 FTA Partially Subscribed Cheniere Sabine Pass T5 – T6 1.3 FTA T5 Subscribed Excelerate 1.3 FTA Southern LNG 0.5 FTA Freeport LNG Corpus Christi Plus other proposed LNG export projects that have not filed a FERC application. • Application filing = • FERC scheduling notice issued = Filed FERC Application Proposed Projects Jordan Cove Oregon LNG Cameron LNG Lake Charles Sabine Pass 36 Southern LNG
Technical Considerations for Liquefaction Projects LNG projects are physically difficult • This will become apparent only through the FERC process • Sites of limited size or near dense populations • Possible, but expensive & delays Must have sufficient land for complex infrastructure and lay‐down areas • Without land, significant costs and 1‐2 years of delay Must have long time horizon • Minimum 24 months required to design an LNG project • ~48 months required for construction following FID • ~9 months per LNG train Consider EPC builder as a partner, rather than focus on price from competing contractors 37
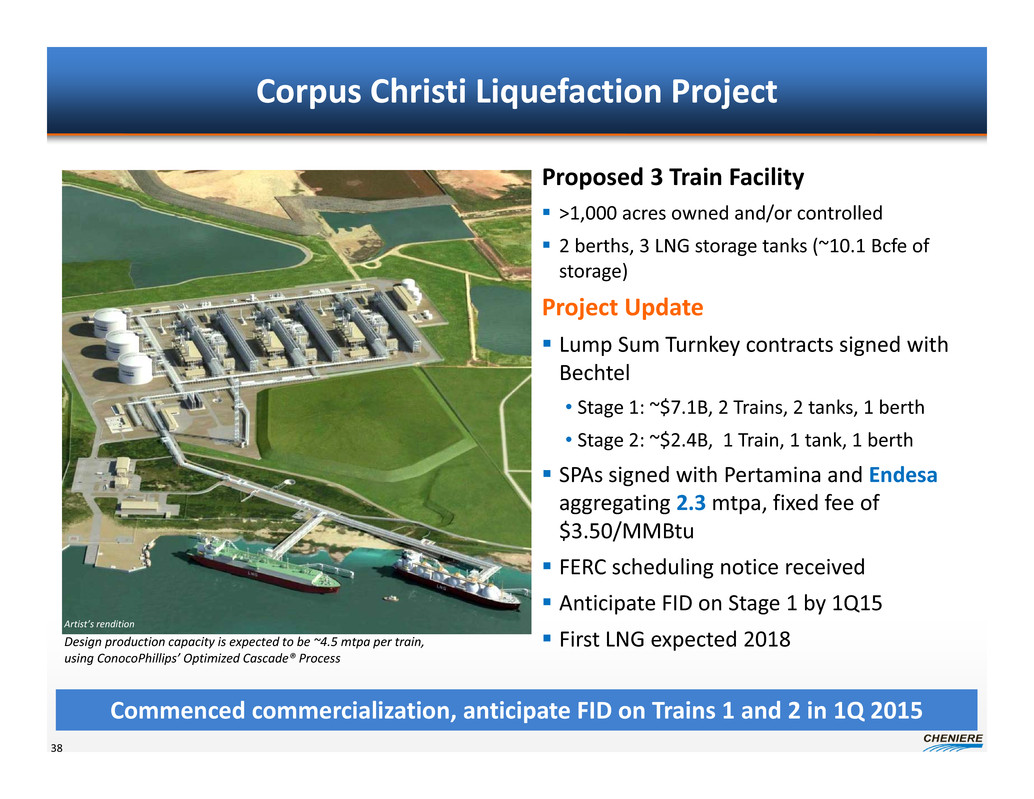
Corpus Christi Liquefaction Project 38 Proposed 3 Train Facility >1,000 acres owned and/or controlled 2 berths, 3 LNG storage tanks (~10.1 Bcfe of storage) Project Update Lump Sum Turnkey contracts signed with Bechtel • Stage 1: ~$7.1B, 2 Trains, 2 tanks, 1 berth • Stage 2: ~$2.4B, 1 Train, 1 tank, 1 berth SPAs signed with Pertamina and Endesa aggregating 2.3 mtpa, fixed fee of $3.50/MMBtu FERC scheduling notice received Anticipate FID on Stage 1 by 1Q15 First LNG expected 2018 Commenced commercialization, anticipate FID on Trains 1 and 2 in 1Q 2015 Artist’s rendition Design production capacity is expected to be ~4.5 mtpa per train, using ConocoPhillips’ Optimized Cascade® Process
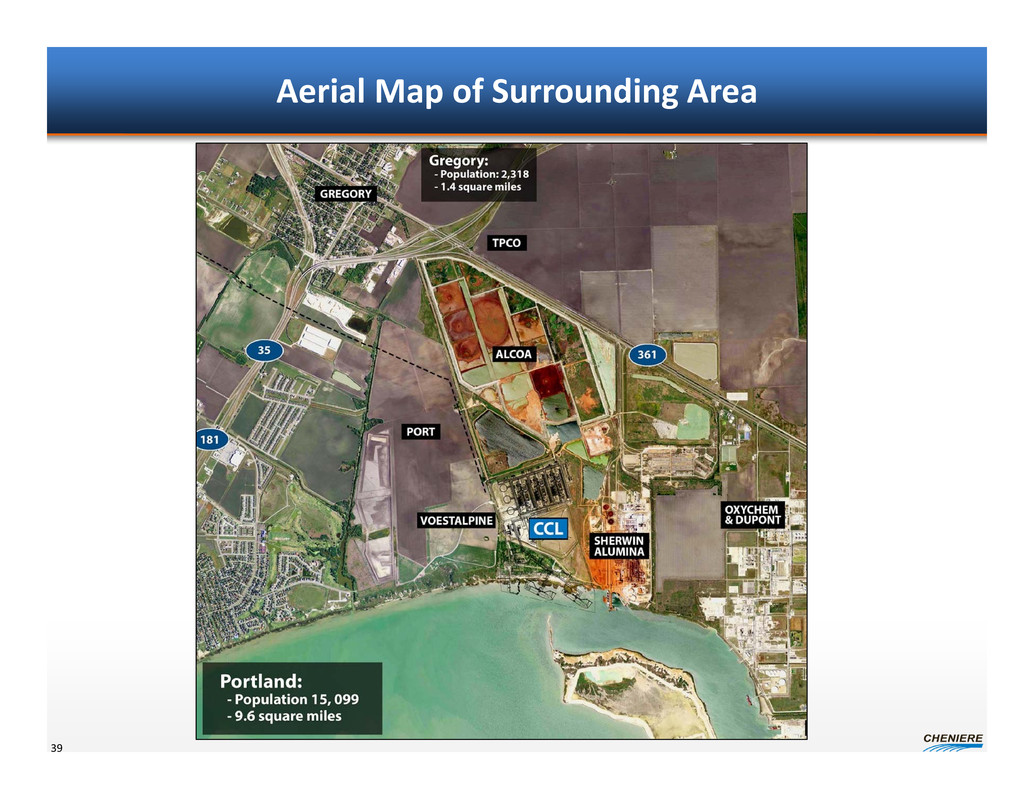
Aerial Map of Surrounding Area 39

Corpus Christi Pipeline Project 23 Miles of 48” Pipe, 2.25 bcf/d Deliverability 40 Corpus Christi Liquefaction Interconnects Tennessee Enterprise Transco NGPL KM Tejas Channel/HPL TETCO Sinton Compressor Station ~41,000 hp Taft Compressor Station ~12,300 hp

Sabine Pass Liquefaction 41 Trains 5 & 6 in the permitting stage Design production capacity is expected to be ~4.5 mtpa per train, using ConocoPhillips’ Optimized Cascade® Process Current Facility ~1,000 acres in Cameron Parish, LA 40 ft ship channel 3.7 miles from coast 2 berths; 4 dedicated tugs 5 LNG storage tanks (~17 Bcfe of storage) 5.3 Bcf/d of pipeline interconnection Liquefaction Trains 1‐4 Under Construction On an accelerated basis Liquefaction Trains 5 & 6 Under Development Bechtel working on FEED Permitting initiated February 2013 FERC application submitted September 2013

Competitive With Other Recent Liquefaction Projects 42 ‐ 500 1,000 1,500 2,000 * * * * Range of liquefaction project costs: $200 ‐ $2,000+ per ton 1 Bcf/d of capacity = $1.5B to $15.0B+ Corpus Christi liquefaction project estimated costs are ~$800/ton (1) Sabine Pass Trains 5 & 6 estimated costs are ~$550/ton (1) (1) Before financing costs, excludes Corpus Christi Pipeline. Cost estimates based on lump‐sum‐turnkey contract price received from Bechtel for three 4.5 mtpa trains and company estimates for owner’s costs. Source: Wood Mackenzie; Cheniere Research. Project costs reflect the liquefaction facility’s capex in dollars per ton. Chart includes a representative sample of brownfield and greenfield liquefaction facilities and does not include all liquefaction facilities existing or under construction. Note: Past results not a guarantee of future performance. *ConocoPhillips‐Bechtel Cost: $/ton Trains under construction Operating trains – ConocoPhillips‐Bechtel Operating trains – Other
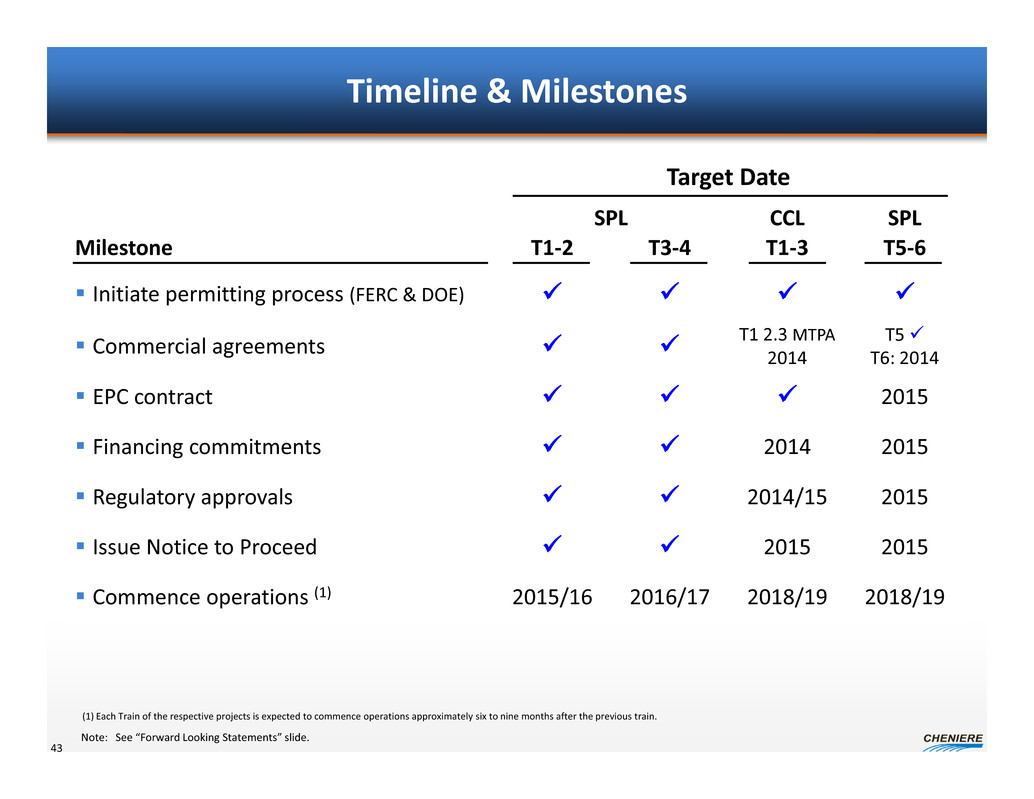
Timeline & Milestones Target Date SPL CCL SPL Milestone T1‐2 T3‐4 T1‐3 T5‐6 Initiate permitting process (FERC & DOE) Commercial agreements T1 2.3 MTPA2014 T5T6: 2014 EPC contract 2015 Financing commitments 2014 2015 Regulatory approvals 2014/15 2015 Issue Notice to Proceed 2015 2015 Commence operations (1) 2015/16 2016/17 2018/19 2018/19 43 (1) Each Train of the respective projects is expected to commence operations approximately six to nine months after the previous train. Note: See “Forward Looking Statements” slide.
Pat Outtrim, Vice President Government and Regulatory Affairs April 2014 Regulatory Review Analyst / Investor Day

Regulatory Process for LNG Facilities Dual regulatory tracks with DOE and FERC • Federal Energy Regulatory Commission (FERC) is lead agency that coordinates all federal and state agencies • Department of Energy (DOE) authorizes license to import and export natural gas U.S. Coast Guard reviews waterway suitability and security issues; coordinates with FERC State and local agencies provide environmental permits and construction permits and also coordinate with FERC Over 40 permits required 45
FERC as Lead Agency FERC is the coordinating agency that leads federal and state review of LNG projects National Environmental Policy Act (NEPA) empowers FERC to prepare an Environmental Impact Statement (EIS) for a project in cooperation with other state and federal agencies EPACT 2005 confirms FERC’s role as lead agency Requires all applicable Federal authorizations within 90 days of final order FERC application cost: ~$50 to $100 Million Delays of Federal authorizations result in financial impact 46
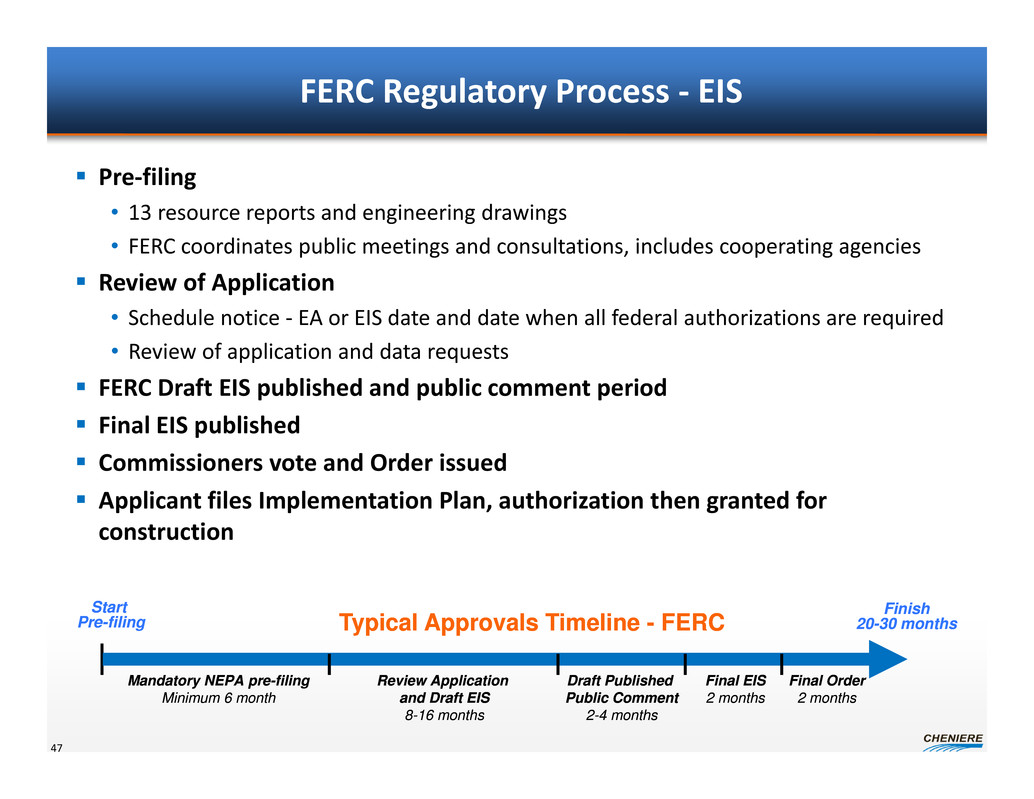
FERC Regulatory Process ‐ EIS Pre‐filing • 13 resource reports and engineering drawings • FERC coordinates public meetings and consultations, includes cooperating agencies Review of Application • Schedule notice ‐ EA or EIS date and date when all federal authorizations are required • Review of application and data requests FERC Draft EIS published and public comment period Final EIS published Commissioners vote and Order issued Applicant files Implementation Plan, authorization then granted for construction 47 Start Pre-filing Finish 20-30 monthsTypical Approvals Timeline - FERC Mandatory NEPA pre-filing Minimum 6 month Review Application and Draft EIS 8-16 months Draft Published Public Comment 2-4 months Final EIS 2 months Final Order 2 months
DOE Regulatory Process Non‐FTA countries DOE is a cooperating agency with FERC • Required to authorize exports to a foreign country unless there is a finding that such exports “will not be consistent with the public interest” • A statutory presumption in favor of approval by DOE of export applications, which opponents bear the burden of overcoming DOE Process • Applicant submits application to DOE • DOE issues notice of application in the Federal Register and begins review • DOE issues Contingent License (seven issued to date) • DOE waits for the final Order from FERC • DOE issues its “finding of no significant impact” or a “record of decision” – final order from DOE (one issued to date) 48
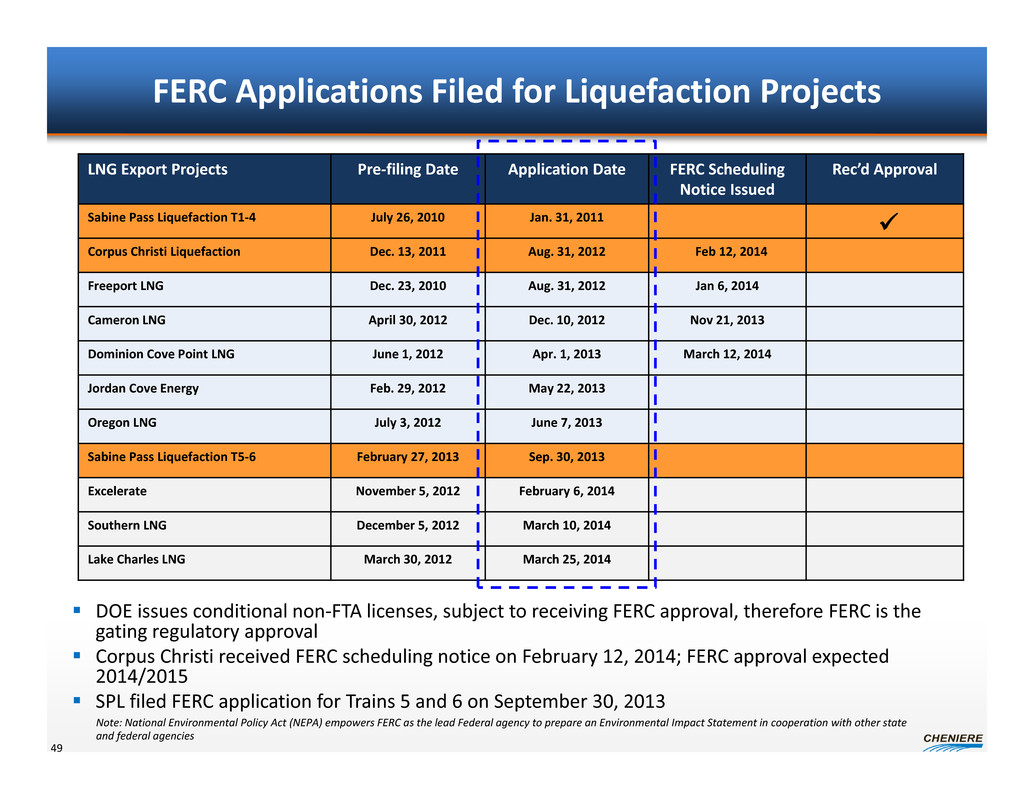
FERC Applications Filed for Liquefaction Projects DOE issues conditional non‐FTA licenses, subject to receiving FERC approval, therefore FERC is the gating regulatory approval Corpus Christi received FERC scheduling notice on February 12, 2014; FERC approval expected 2014/2015 SPL filed FERC application for Trains 5 and 6 on September 30, 2013 49 LNG Export Projects Pre‐filing Date Application Date FERC Scheduling Notice Issued Rec’d Approval Sabine Pass Liquefaction T1‐4 July 26, 2010 Jan. 31, 2011 Corpus Christi Liquefaction Dec. 13, 2011 Aug. 31, 2012 Feb 12, 2014 Freeport LNG Dec. 23, 2010 Aug. 31, 2012 Jan 6, 2014 Cameron LNG April 30, 2012 Dec. 10, 2012 Nov 21, 2013 Dominion Cove Point LNG June 1, 2012 Apr. 1, 2013 March 12, 2014 Jordan Cove Energy Feb. 29, 2012 May 22, 2013 Oregon LNG July 3, 2012 June 7, 2013 Sabine Pass Liquefaction T5‐6 February 27, 2013 Sep. 30, 2013 Excelerate November 5, 2012 February 6, 2014 Southern LNG December 5, 2012 March 10, 2014 Lake Charles LNG March 30, 2012 March 25, 2014 Note: National Environmental Policy Act (NEPA) empowers FERC as the lead Federal agency to prepare an Environmental Impact Statement in cooperation with other state and federal agencies

U.S. DOE Applications for LNG Exports* 50 Source: Office of Fossil Energy, U.S. Department of Energy; U.S. Federal Energy Regulatory Commission; Company releases ** Application filed = , FERC scheduling notice issued = * As of March 31, 2014. Note additional companies have filed for their DOE license; however, not all have initiated their FERC filing process. (1) “Order of Precedence” (2) Orders are conditional on applicant completing the environmental review process as part of the FERC licensing process, and other conditions such as submitting all relevant long‐term commercial agreements. (3) Application was filed for 1.4 Bcf/d; 0.4 Bcf/d was approved Expected Order to be Processed (1)2 Company Date Applicant Received FERC Approval to Begin Pre‐Filing Process Quantity (Bcf/d) Date Non FTA Received FERC** ContractsConditional (2) Final Cheniere Sabine Pass T1‐T4 8/4/2010 2.8 5/20/2011 8/7/2012 Fully Subscribed Freeport LNG Expansion, L.P. and FLNG Liquefaction 1/5/2011 1.4 5/17/2013 Fully Subscribed Lake Charles Exports, LLC 4/6/2012 2 8/7/2013 Dominion Cove Point LNG, LP 6/26/2012 1 9/11/2013 Fully Subscribed Freeport LNG Expansion, L.P. and FLNG Liquefaction 1/5/2011 0.4(3) 11/15/2013 Fully Subscribed Cameron LNG, LLC 5/9/2012 1.7 2/11/2014 Fully Subscribed Jordan Cove Energy Project, L.P. 3/6/2012 1.2/0.8 3/24/2014 1 LNG Development Company, LLC (d/b/a Oregon LNG) 7/16/2012 1.25 2 Cheniere Marketing, LLC (Corpus Christi) 12/22/2011 2.1 T1 Partially Subscribed 3 Excelerate Liquefaction Solutions 11/20/2012 1.38 4 Carib Energy (USA) LLC 0.03/0.01 5 Gulf Coast LNG Export, LLC 2.8 6 Southern LNG Company, L.L.C. 3/1/2013 0.5 7 Gulf LNG Liquefaction Company, LLC 1.5 8 CE FLNG, LLC 4/16/2013 1.07 9 Golden Pass Products LLC 5/30/2013 2.6 10 Pangea LNG (North America) Holdings, LLC 1.09 11 Trunkline LNG Export, LLC 2 12 Freeport‐McMoRan Energy, LLC 3.22 13 Sabine Pass Liquefaction, LLC (T5 ‐ Total Contract) 3/8/2013 0.28 T5 Fully Subscribed 14 Sabine Pass Liquefaction, LLC (T5 ‐ Centrica Contract) 3/8/2013 0.24 T5 Fully Subscribed 15 Venture Global LNG, LLC 0.67 16 Eos LNG, LLC 1.6 17 Barca LNG, LLC 1.6 18 Sabine Pass Liquefaction, LLC (Remaining T5 Volumes and T6) 3/8/2013 0.86 19 Magnolia LNG, LLC 3/20/2013 1.08 20 Delfin LNG, LLC 1.8 21 Waller LNG Services, LLC 0.19 22 Gasfin Development 0.2 23 Texas LNG 0.27 24 Louisiana LNG 0.28
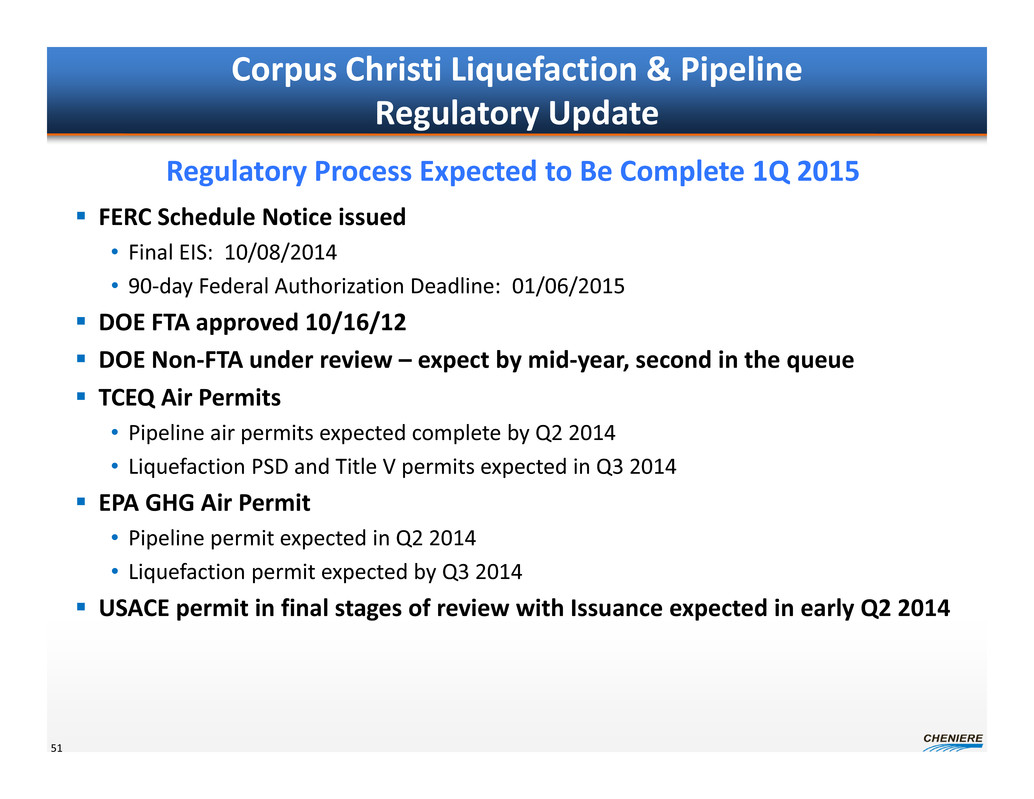
Corpus Christi Liquefaction & Pipeline Regulatory Update FERC Schedule Notice issued • Final EIS: 10/08/2014 • 90‐day Federal Authorization Deadline: 01/06/2015 DOE FTA approved 10/16/12 DOE Non‐FTA under review – expect by mid‐year, second in the queue TCEQ Air Permits • Pipeline air permits expected complete by Q2 2014 • Liquefaction PSD and Title V permits expected in Q3 2014 EPA GHG Air Permit • Pipeline permit expected in Q2 2014 • Liquefaction permit expected by Q3 2014 USACE permit in final stages of review with Issuance expected in early Q2 2014 51 Regulatory Process Expected to Be Complete 1Q 2015
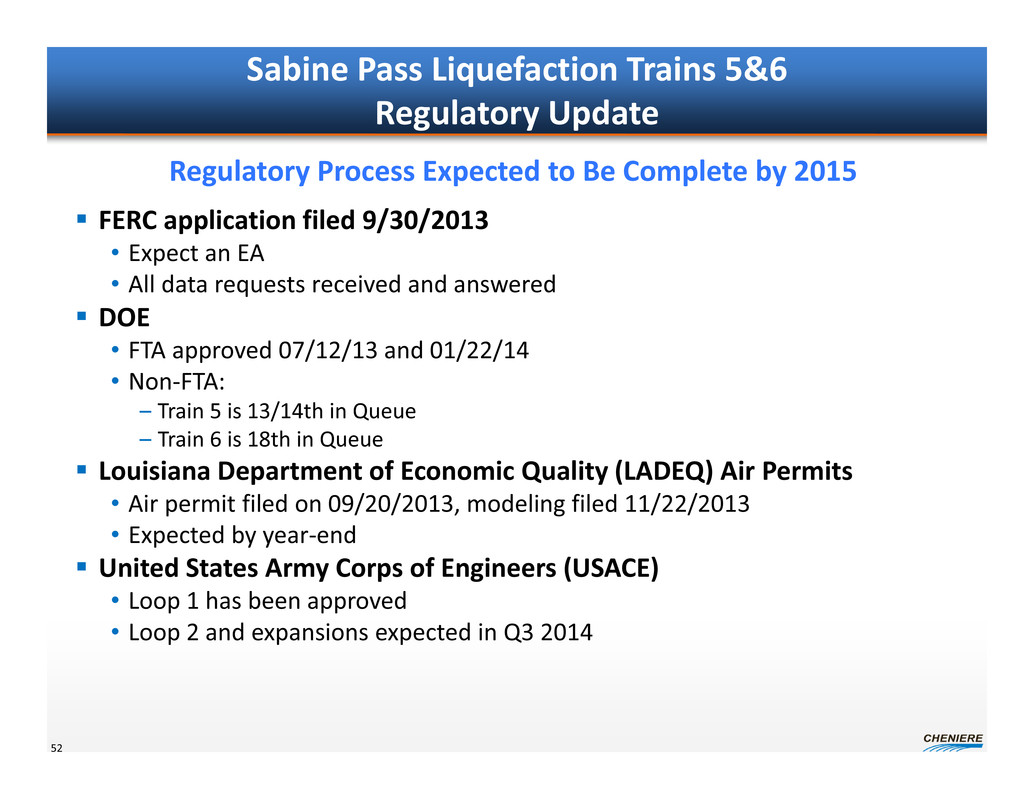
Sabine Pass Liquefaction Trains 5&6 Regulatory Update FERC application filed 9/30/2013 • Expect an EA • All data requests received and answered DOE • FTA approved 07/12/13 and 01/22/14 • Non‐FTA: – Train 5 is 13/14th in Queue – Train 6 is 18th in Queue Louisiana Department of Economic Quality (LADEQ) Air Permits • Air permit filed on 09/20/2013, modeling filed 11/22/2013 • Expected by year‐end United States Army Corps of Engineers (USACE) • Loop 1 has been approved • Loop 2 and expansions expected in Q3 2014 52 Regulatory Process Expected to Be Complete by 2015
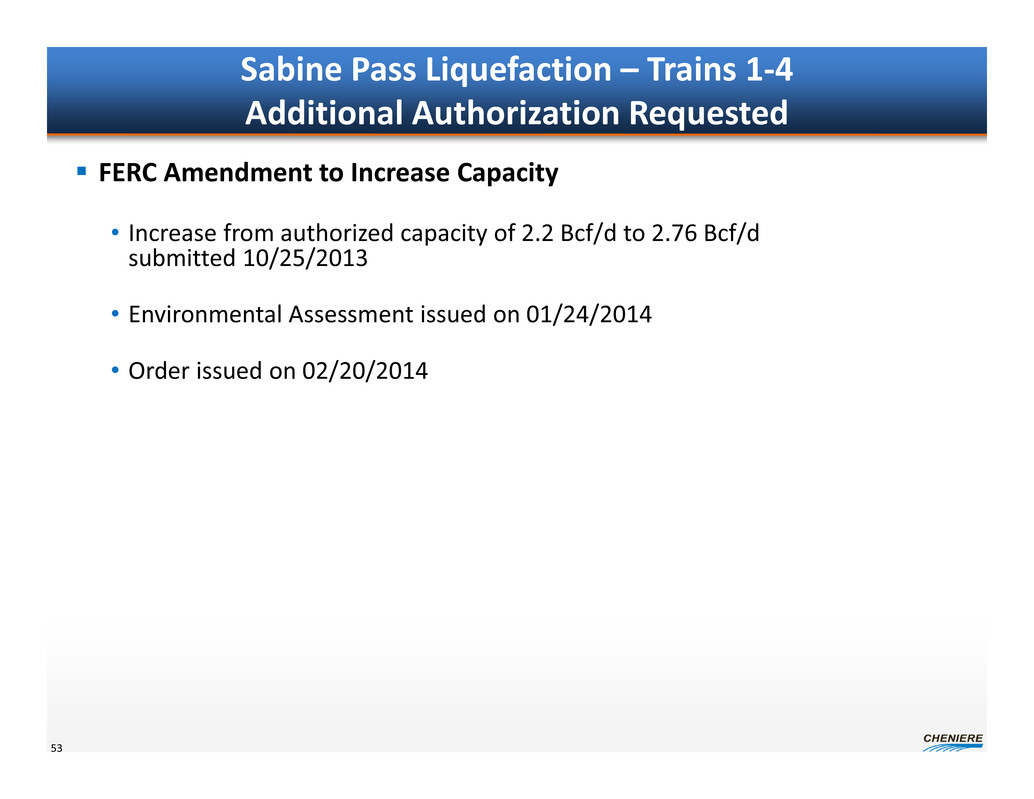
Sabine Pass Liquefaction – Trains 1‐4 Additional Authorization Requested FERC Amendment to Increase Capacity • Increase from authorized capacity of 2.2 Bcf/d to 2.76 Bcf/d submitted 10/25/2013 • Environmental Assessment issued on 01/24/2014 • Order issued on 02/20/2014 53
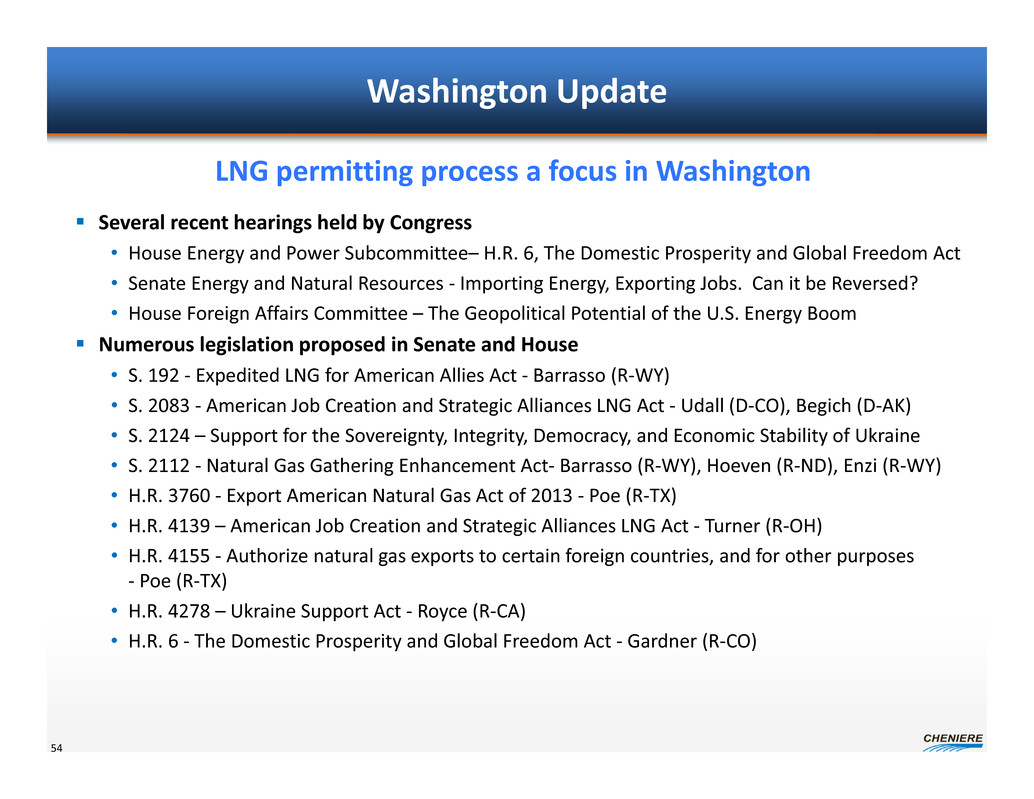
Washington Update Several recent hearings held by Congress • House Energy and Power Subcommittee– H.R. 6, The Domestic Prosperity and Global Freedom Act • Senate Energy and Natural Resources ‐ Importing Energy, Exporting Jobs. Can it be Reversed? • House Foreign Affairs Committee – The Geopolitical Potential of the U.S. Energy Boom Numerous legislation proposed in Senate and House • S. 192 ‐ Expedited LNG for American Allies Act ‐ Barrasso (R‐WY) • S. 2083 ‐ American Job Creation and Strategic Alliances LNG Act ‐ Udall (D‐CO), Begich (D‐AK) • S. 2124 – Support for the Sovereignty, Integrity, Democracy, and Economic Stability of Ukraine • S. 2112 ‐ Natural Gas Gathering Enhancement Act‐ Barrasso (R‐WY), Hoeven (R‐ND), Enzi (R‐WY) • H.R. 3760 ‐ Export American Natural Gas Act of 2013 ‐ Poe (R‐TX) • H.R. 4139 – American Job Creation and Strategic Alliances LNG Act ‐ Turner (R‐OH) • H.R. 4155 ‐ Authorize natural gas exports to certain foreign countries, and for other purposes ‐ Poe (R‐TX) • H.R. 4278 – Ukraine Support Act ‐ Royce (R‐CA) • H.R. 6 ‐ The Domestic Prosperity and Global Freedom Act ‐ Gardner (R‐CO) 54 LNG permitting process a focus in Washington
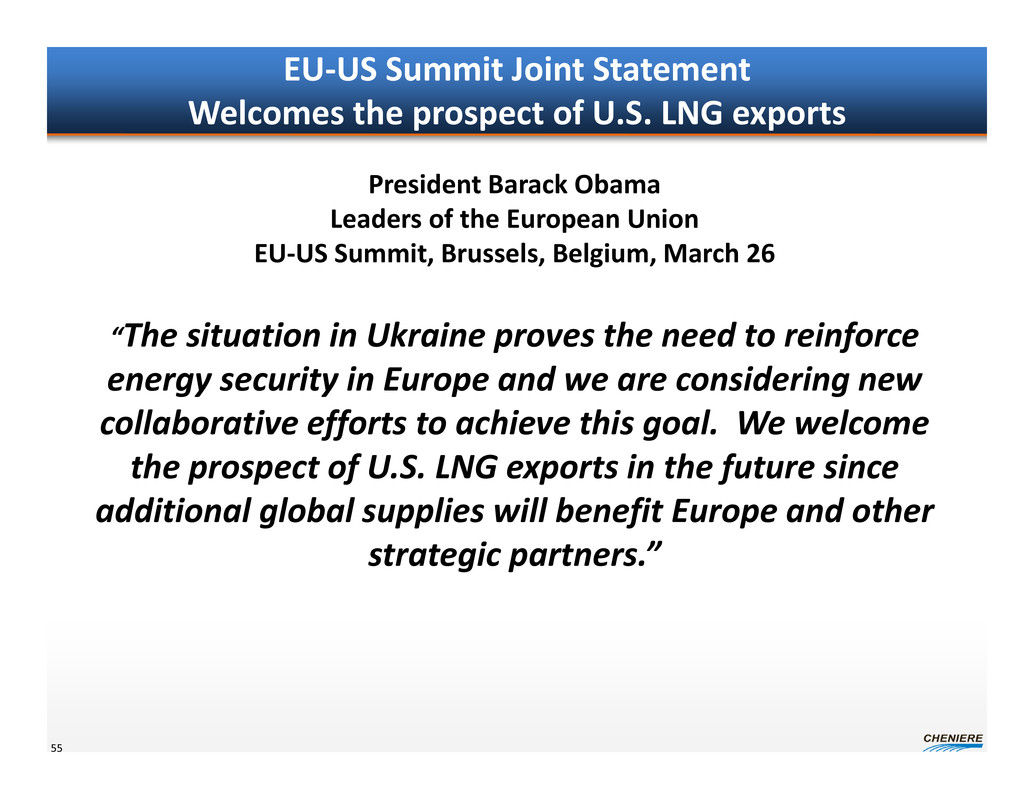
EU‐US Summit Joint Statement Welcomes the prospect of U.S. LNG exports 55 President Barack Obama Leaders of the European Union EU‐US Summit, Brussels, Belgium, March 26 “The situation in Ukraine proves the need to reinforce energy security in Europe and we are considering new collaborative efforts to achieve this goal. We welcome the prospect of U.S. LNG exports in the future since additional global supplies will benefit Europe and other strategic partners.”

Corey Grindal, Vice President, Supply April 2014 Supply Procurement Analyst / Investor Day
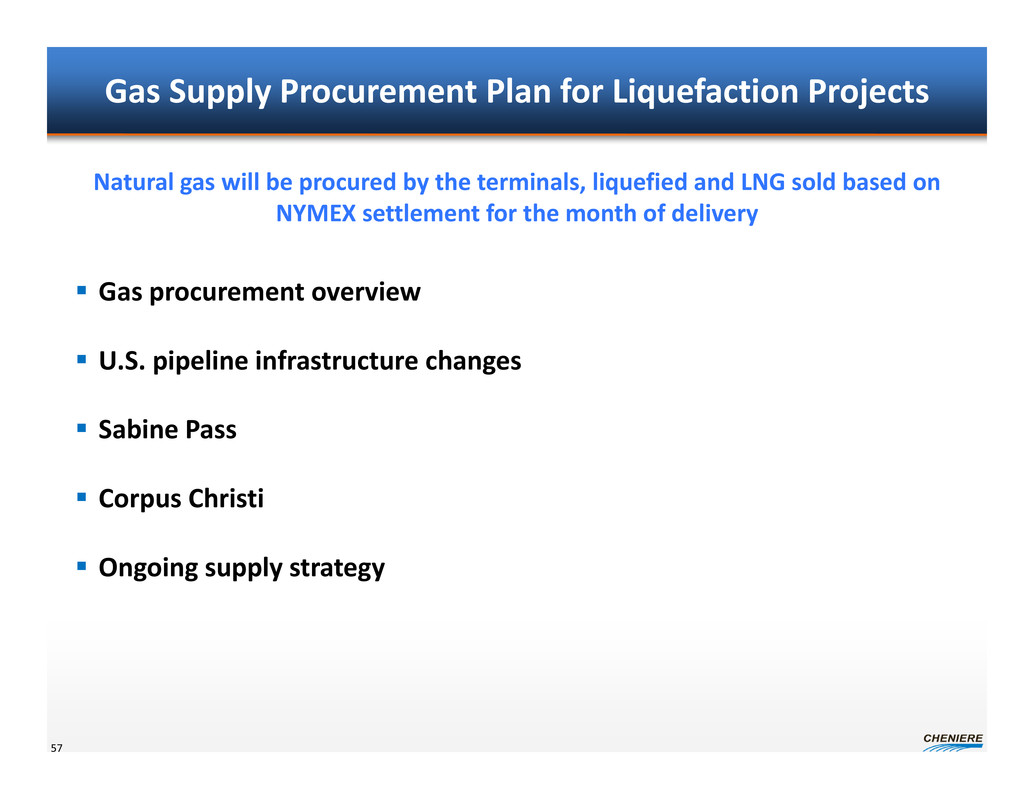
Gas Supply Procurement Plan for Liquefaction Projects Gas procurement overview U.S. pipeline infrastructure changes Sabine Pass Corpus Christi Ongoing supply strategy 57 Natural gas will be procured by the terminals, liquefied and LNG sold based on NYMEX settlement for the month of delivery
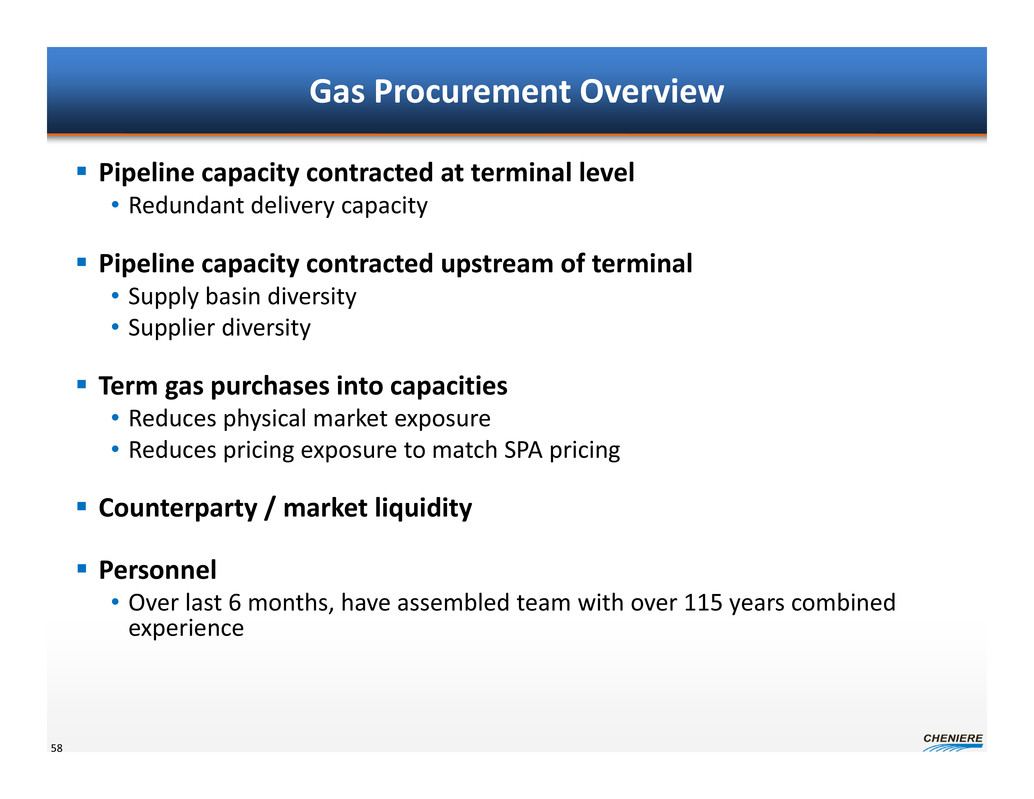
Gas Procurement Overview Pipeline capacity contracted at terminal level • Redundant delivery capacity Pipeline capacity contracted upstream of terminal • Supply basin diversity • Supplier diversity Term gas purchases into capacities • Reduces physical market exposure • Reduces pricing exposure to match SPA pricing Counterparty / market liquidity Personnel • Over last 6 months, have assembled team with over 115 years combined experience 58
U.S. Infrastructure Changes The United States is undergoing massive changes due to current and forecasted supply growth Over 10 Bcf/d of “retrofits” or reversals of traditional flows have been announced by U.S. interstate pipelines • 2 Bcf/d under construction or in‐service • 1.5 Bcf/d filed awaiting approval • 5 Bcf/d announced and contracted – soon to be filed with FERC • 1.4 Bcf/d announced Producers have been the primary contractors of capacity to ensure gas will flow from production basins Cheniere is: • Sponsoring or anchoring some projects that are strategic to SPL • Working with pipelines to ensure supplies can reach Cheniere facilities • Working with producers on securing supplies off of proposed expansions 59
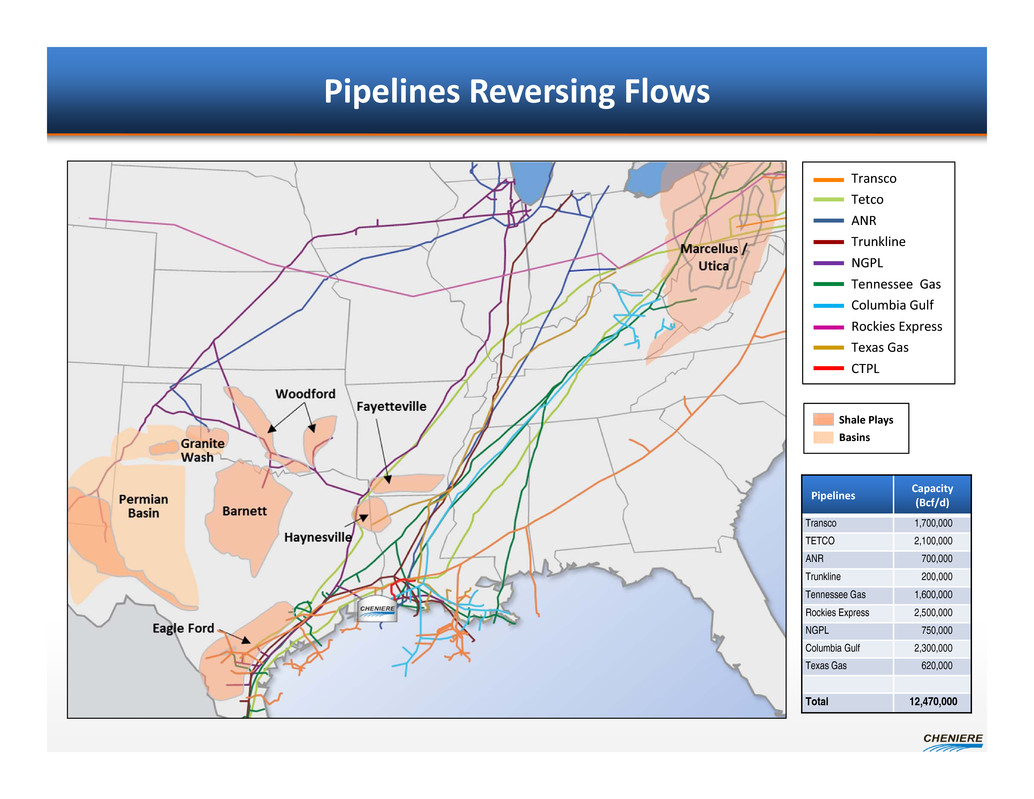
Pipelines Reversing Flows Transco Tetco ANR Trunkline NGPL Tennessee Gas Columbia Gulf Rockies Express Texas Gas CTPL Pipelines Capacity (Bcf/d) Transco 1,700,000 TETCO 2,100,000 ANR 700,000 Trunkline 200,000 Tennessee Gas 1,600,000 Rockies Express 2,500,000 NGPL 750,000 Columbia Gulf 2,300,000 Texas Gas 620,000 Total 12,470,000 Shale Plays Basins

Establishing NAESB* Contracts With Counterparties Producer driven supply base • Have signed NAESB agreements with over 20 producers to date – Examples of producers enabled to date and 4Q2013 rank** • #1 ExxonMobil/ XTO (XOM) #5 Devon Energy Services (DVN) • #2 Chesapeake Energy (CHK) #11 EQT Energy (EQT) • #3 Anadarko Petroleum (APC) #16 Range Resources (RRC) • #4 Southwestern Energy (SWN) #19 CONSOL Energy (CNX) – Target is to enable Top 40 North American gas producers Establishing market liquidity • Starting to sign NAESB agreements with major mid‐marketers • Will need for daily/ short‐term balancing • End use customers Target is by 4Q14 to have completed contracting efforts 61 * North American Energy Standards Board ** Source: PIRA Survey of U.S. Dry Gas Production

SPL Terminal Pipeline Network Direct Pipeline Capacity SPL contracting long‐term pipeline capacity • Creole Trail Pipeline: Trains 1 / 2 – 1.5 Bcf/d contracted at FID • Natural Gas Pipeline Company: Trains 1 /2 – 1.5 Bcf/d Interconnect – 0.5 Bcf/d contracted by SPL • Proposed pipeline to be announced: Trains 3 / 4 – Will contract for 1 Bcf/d+ • Kinder Morgan Louisiana Pipeline: Trains 5 / 6** – Will contract for over 1 Bcf/d 62 Terminal Capacity vs. SPA Requirements (Trains 1‐4) Creole Trail 1.5 Bcf/d NGPL 1.5 Bcf/d Pipe to Be Announced 1.2 Bcf/d Total 4.2 Bcf/d Less SPA Peak Requirements 3.0 Bcf/d Redundant Terminal Capacity 1.2 Bcf/d **capacity dependent upon Train 5/6 FID

SPL Terminal Pipelines 63 Cheniere Creole Trail Pipeline (CTPL) Kinder Morgan Louisiana Pipeline (KMLP) Natural Gas Pipeline Company (NGPL) Transco . Texas Eastern TrunklineTransco Pine Prairie Energy Center Texas Gas ANR TETCO Tennessee Trunkline Columbia Gulf NGPL Sabine Pass LNG Liquidity Points Storage Henry Hub

SPL Terminal Pipeline Network Upstream Pipeline Capacity Selectively contracting capacity from major supply basins: • Utica/ Marcellus – TETCO, TGP, Texas Gas, CGT, Rockies Express • Fayetteville – Trunkline, Texas Gas, ANR, NGPL, Columbia Gulf • Perryville/ Haynesville ‐ Trunkline, Texas Gas, ANR, CGT • MidContinent – NGPL, ANR, Panhandle Eastern • Texas – NGPL, Transco, Trunkline SPL will be able to access supplies from all major interstate pipelines in South Louisiana Having redundant capacities and optionality: • Reduces risk of being subject to pipeline constraints or bottlenecks • Provides access to lowest cost supply options • Provides ability to manage maintenance or unscheduled outages • Reduces dependence on one supplier, supply basin or source 64

Source: Lippman Consulting, Baker Hughes and Bentek, as of January 2014 SPL Supply Network Transco Tetco ANR Trunkline NGPL Tennessee Gas Columbia Gulf Rockies Express Texas Gas Permian Basin Barnett Granite Wash Eagle Ford Haynesville Woodford Fayetteville Marcellus / Utica Shale Plays Basins Sabine Pass
SPL Supply Transactions Completed Sabine Pass has termed up a significant amount of long‐term supply to date • Staggered over time and train completion • Accessing diverse supply basins • Using existing portfolio of pipeline capacity to reach terminal • Pricing to date provides terminal supply below 105% of NYMEX pricing 66
Corpus Christi Contracting Working with 8 pipelines on supplying CCPL • 3 Intrastates – Houston Pipeline/ Channel Industries (HPL) – Enterprise Texas Pipeline (ETP) – Kinder Morgan Texas/ Tejas (KMT) • 5 Interstates – Tennessee Gas Pipeline (TGP) – Natural Gas Pipeline (NGPL) – Transcontinental Pipeline (Transco) – GulfSouth Pipeline (GSPL) – Texas Eastern Transmission (TETCO) Supply basins targeted • Eagle Ford • Barnett • Permian • Woodford/ Mississippi Lime 67
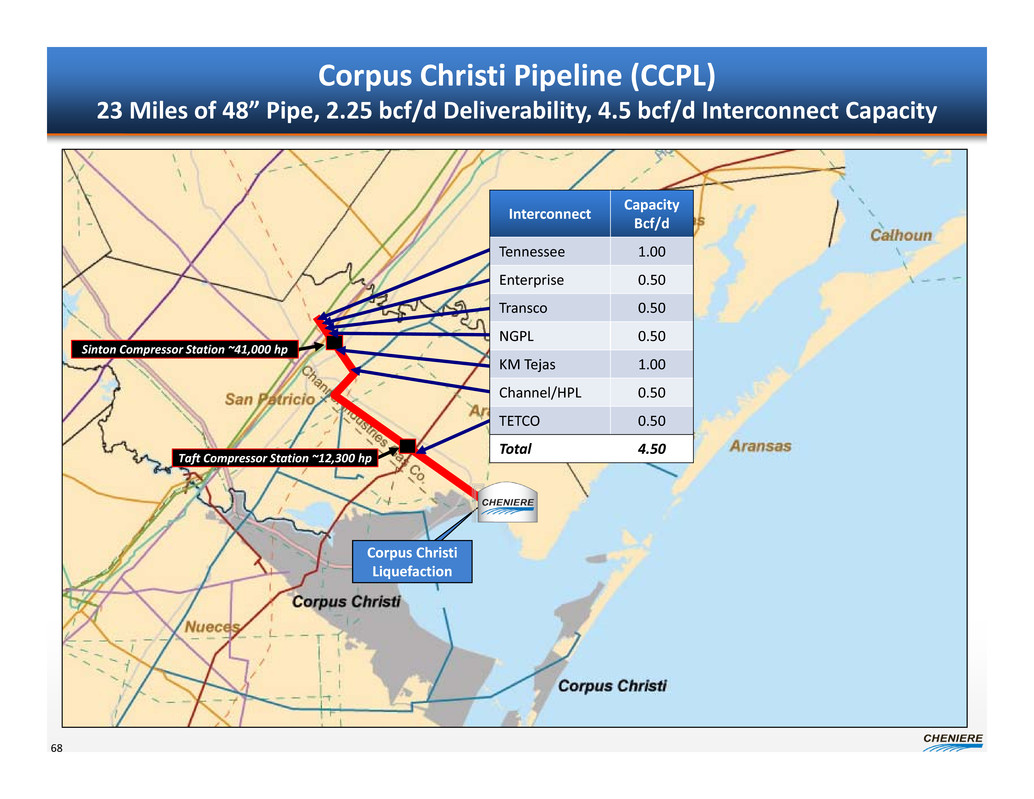
Corpus Christi Pipeline (CCPL) 23 Miles of 48” Pipe, 2.25 bcf/d Deliverability, 4.5 bcf/d Interconnect Capacity 68 Corpus Christi Liquefaction Interconnect Capacity Bcf/d Tennessee 1.00 Enterprise 0.50 Transco 0.50 NGPL 0.50 KM Tejas 1.00 Channel/HPL 0.50 TETCO 0.50 Total 4.50 Sinton Compressor Station ~41,000 hp Taft Compressor Station ~12,300 hp
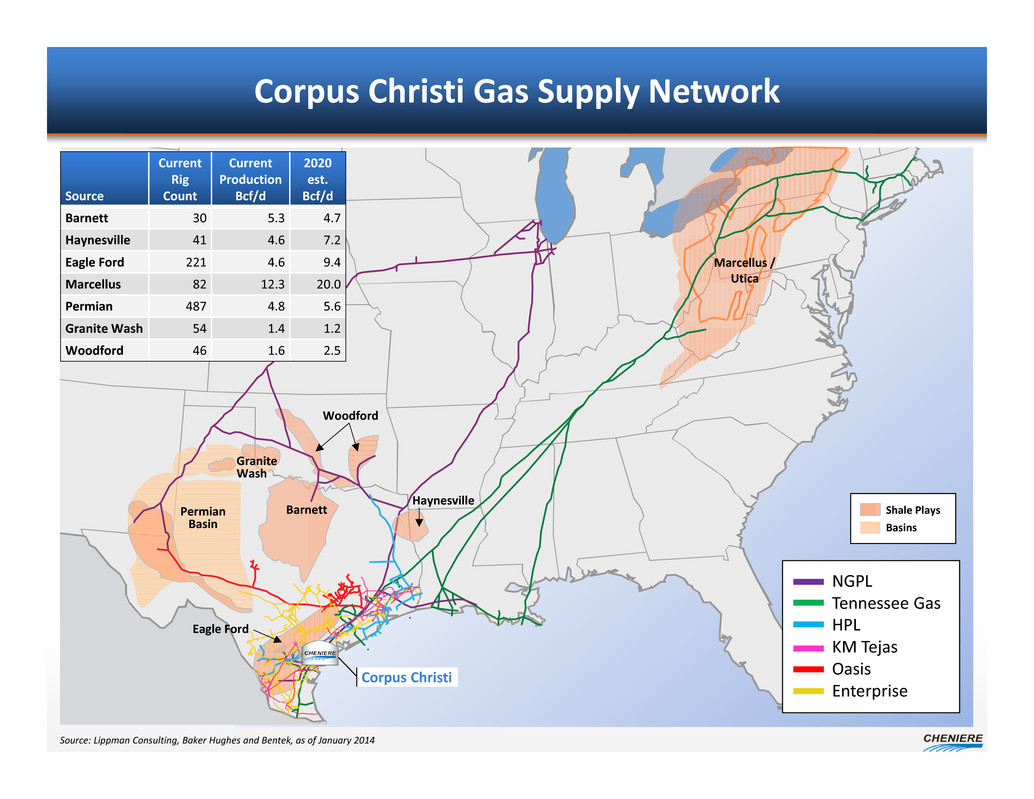
Shale Plays Basins Source: Lippman Consulting, Baker Hughes and Bentek, as of January 2014 Corpus Christi Gas Supply Network NGPL Tennessee Gas HPL KM Tejas Oasis Enterprise Permian Basin Barnett Granite Wash Eagle Ford Haynesville Marcellus / Utica Corpus Christi Source Current Rig Count Current Production Bcf/d 2020 est. Bcf/d Barnett 30 5.3 4.7 Haynesville 41 4.6 7.2 Eagle Ford 221 4.6 9.4 Marcellus 82 12.3 20.0 Permian 487 4.8 5.6 Granite Wash 54 1.4 1.2 Woodford 46 1.6 2.5 Woodford

Cheniere Ongoing Supply Strategy Sabine Pass • Continue to purchase gas supply and strategically fill existing pipeline capacity – Currently in discussion with 15+ counterparties on term deals – Structuring deals to best mitigate both physical risk and price risk • Acquire strategic upstream pipeline capacity – Actively negotiating with 10+ interstate natural gas pipelines – Diversify supply basins to manage physical risk Corpus Christi • Continue to develop pipeline infrastructure into CCPL with intent of contracting upon project FID • Engage producers and begin contracting for long term supply 70
Meg Gentle, Executive VP – Marketing April 2014 Commercializing Corpus Christi & Sabine Pass T6 Analyst / Investor Day
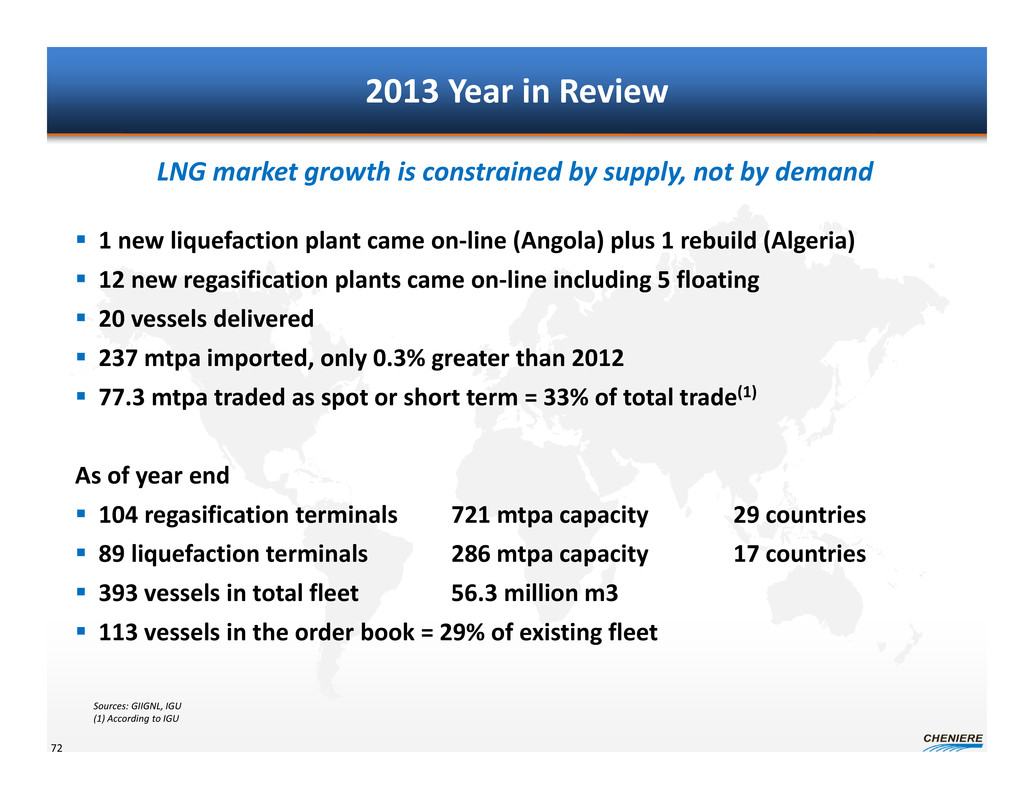
2013 Year in Review 1 new liquefaction plant came on‐line (Angola) plus 1 rebuild (Algeria) 12 new regasification plants came on‐line including 5 floating 20 vessels delivered 237 mtpa imported, only 0.3% greater than 2012 77.3 mtpa traded as spot or short term = 33% of total trade(1) As of year end 104 regasification terminals 721 mtpa capacity 29 countries 89 liquefaction terminals 286 mtpa capacity 17 countries 393 vessels in total fleet 56.3 million m3 113 vessels in the order book = 29% of existing fleet LNG market growth is constrained by supply, not by demand Sources: GIIGNL, IGU (1) According to IGU 72
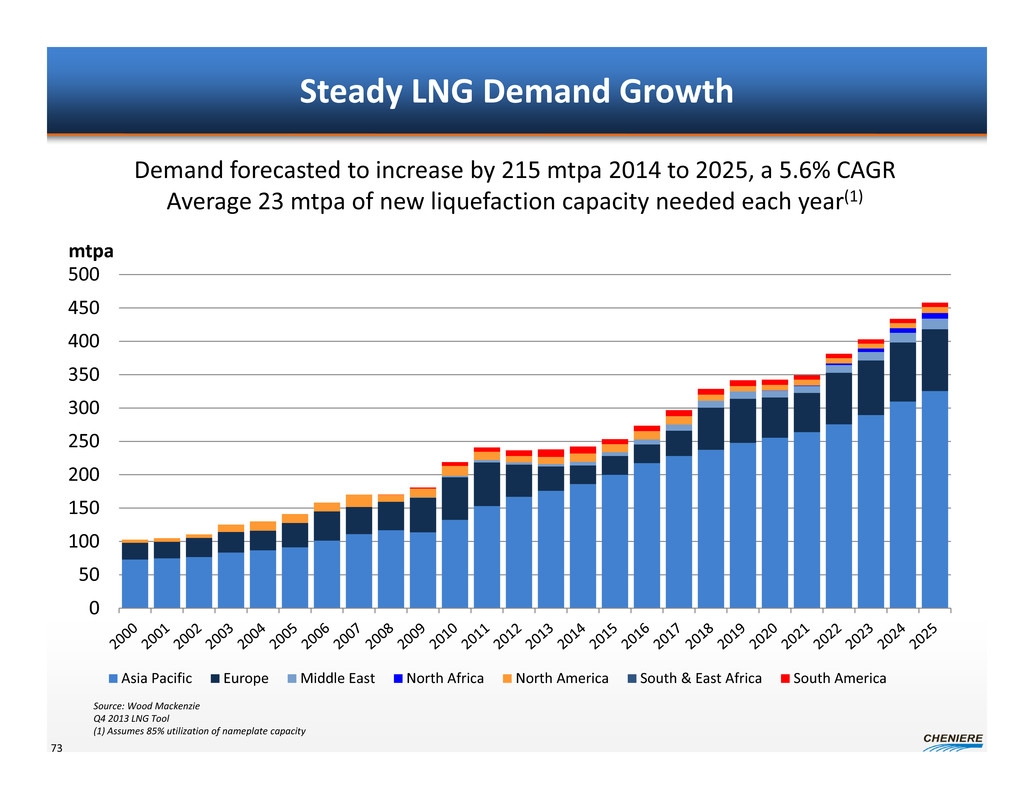
Steady LNG Demand Growth 0 50 100 150 200 250 300 350 400 450 500 mtpa Asia Pacific Europe Middle East North Africa North America South & East Africa South America 73 Source: Wood Mackenzie Q4 2013 LNG Tool (1) Assumes 85% utilization of nameplate capacity Demand forecasted to increase by 215 mtpa 2014 to 2025, a 5.6% CAGR Average 23 mtpa of new liquefaction capacity needed each year(1)
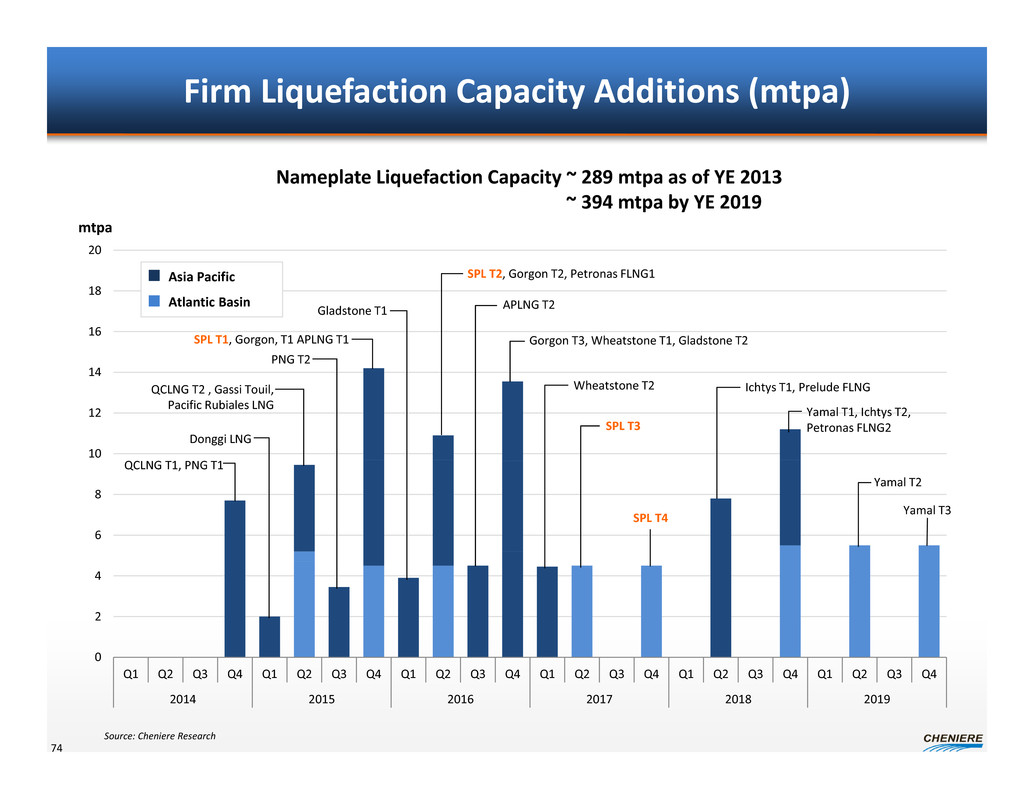
0 2 4 6 8 10 12 14 16 18 20 Q1 Q2 Q3 Q4 Q1 Q2 Q3 Q4 Q1 Q2 Q3 Q4 Q1 Q2 Q3 Q4 Q1 Q2 Q3 Q4 Q1 Q2 Q3 Q4 2014 2015 2016 2017 2018 2019 Firm Liquefaction Capacity Additions (mtpa) 74 Source: Cheniere Research Nameplate Liquefaction Capacity ~ 289 mtpa as of YE 2013 ~ 394 mtpa by YE 2019 QCLNG T1, PNG T1 SPL T1, Gorgon, T1 APLNG T1 QCLNG T2 , Gassi Touil, Pacific Rubiales LNG PNG T2 Gorgon T3, Wheatstone T1, Gladstone T2 Gladstone T1 Wheatstone T2 APLNG T2 SPL T3 Yamal T1, Ichtys T2, Petronas FLNG2 Ichtys T1, Prelude FLNG Yamal T2 SPL T2, Gorgon T2, Petronas FLNG1 SPL T4 Yamal T3 Donggi LNG Asia Pacific Atlantic Basin mtpa
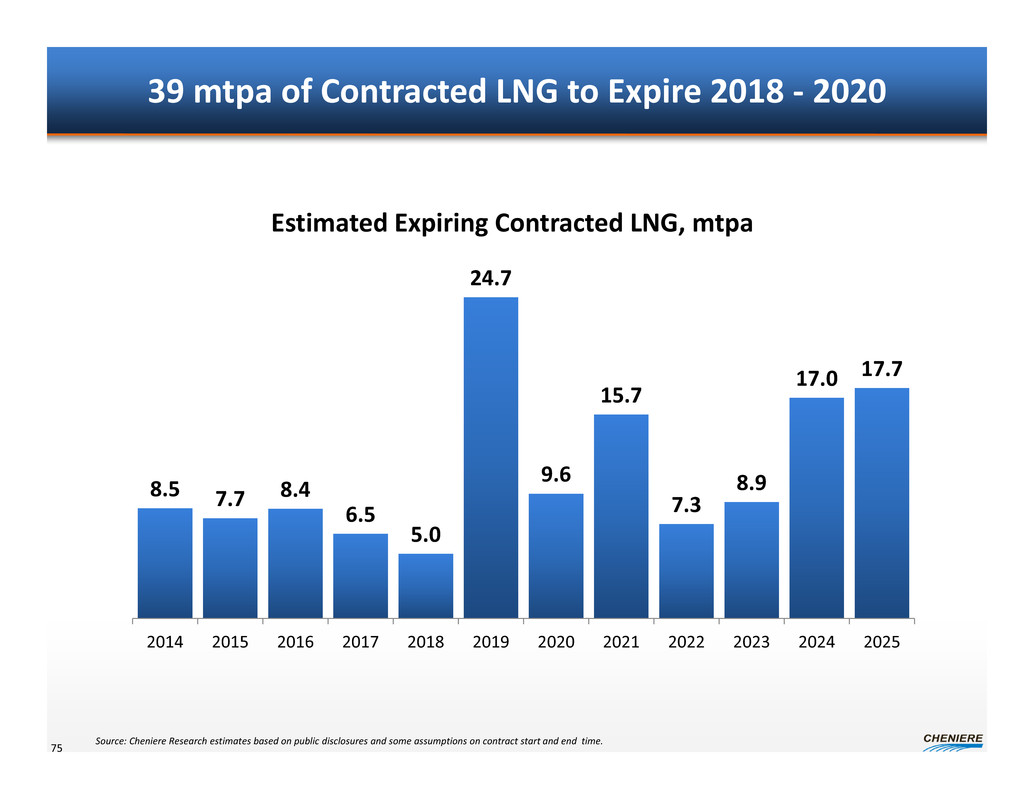
39 mtpa of Contracted LNG to Expire 2018 ‐ 2020 75 8.5 7.7 8.4 6.5 5.0 24.7 9.6 15.7 7.3 8.9 17.0 17.7 2014 2015 2016 2017 2018 2019 2020 2021 2022 2023 2024 2025 Estimated Expiring Contracted LNG, mtpa Source: Cheniere Research estimates based on public disclosures and some assumptions on contract start and end time.

What is our competitive advantage? 76 1. Low cost natural gas and Henry Hub pricing 2. Low cost construction 3. Full destination flexibility 4. Ability to cancel cargo lifting with notice 5. Contract structure – FOB tailgate vs tolling 6. Proven record of execution 7. On time / on budget construction 8. Short time to market 9. Financing reliability 10. Stable regulatory and political system

What is the plan? 77 Project Commercial Deadline Corpus Christi T1‐2 Pertamina 0.8 mtpa Complete Endesa 1.5 mtpa Complete FOB 3.7 mtpa 2014 Sabine Pass T6 FOB 2.0 mtpa TBD upon finalization of EPC Corpus Christi T3 TBD TBD

Short Term and Medium Term Marketing
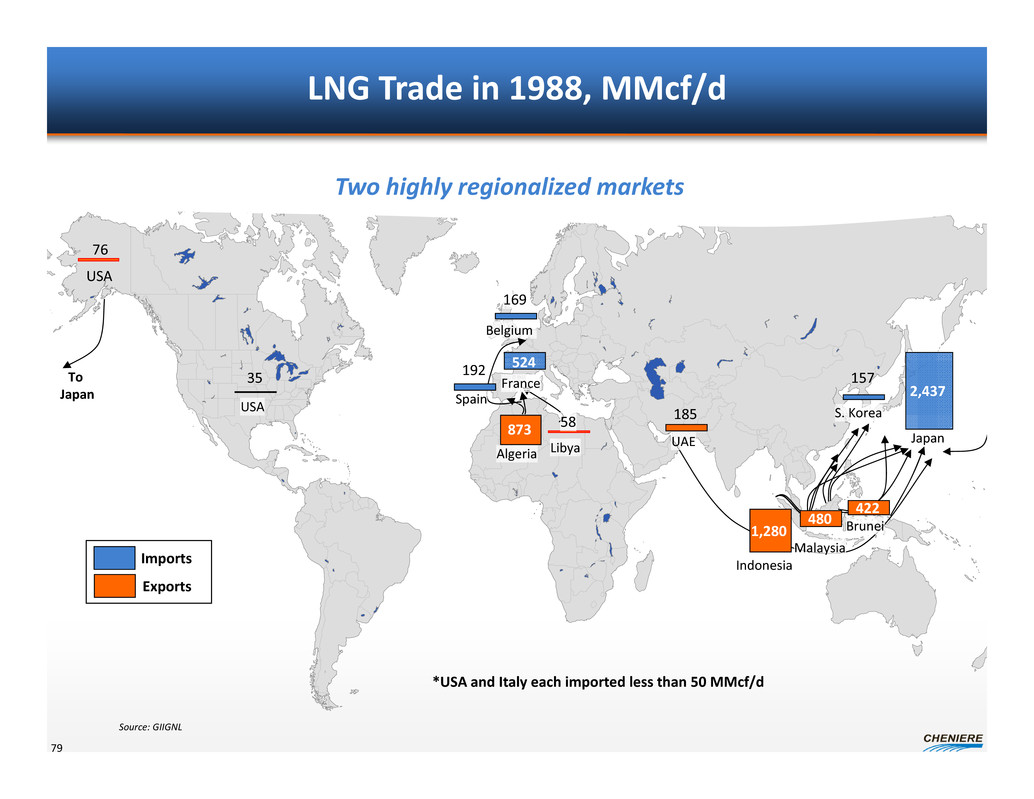
LNG Trade in 1988, MMcf/d *USA and Italy each imported less than 50 MMcf/d USA Libya Japan S. KoreaUSA Belgium Imports Exports Algeria Indonesia Malaysia Brunei UAE Spain FranceTo Japan 2,437 15719235 524 169 1,280 480 422 185 76 58873 Two highly regionalized markets Source: GIIGNL 79
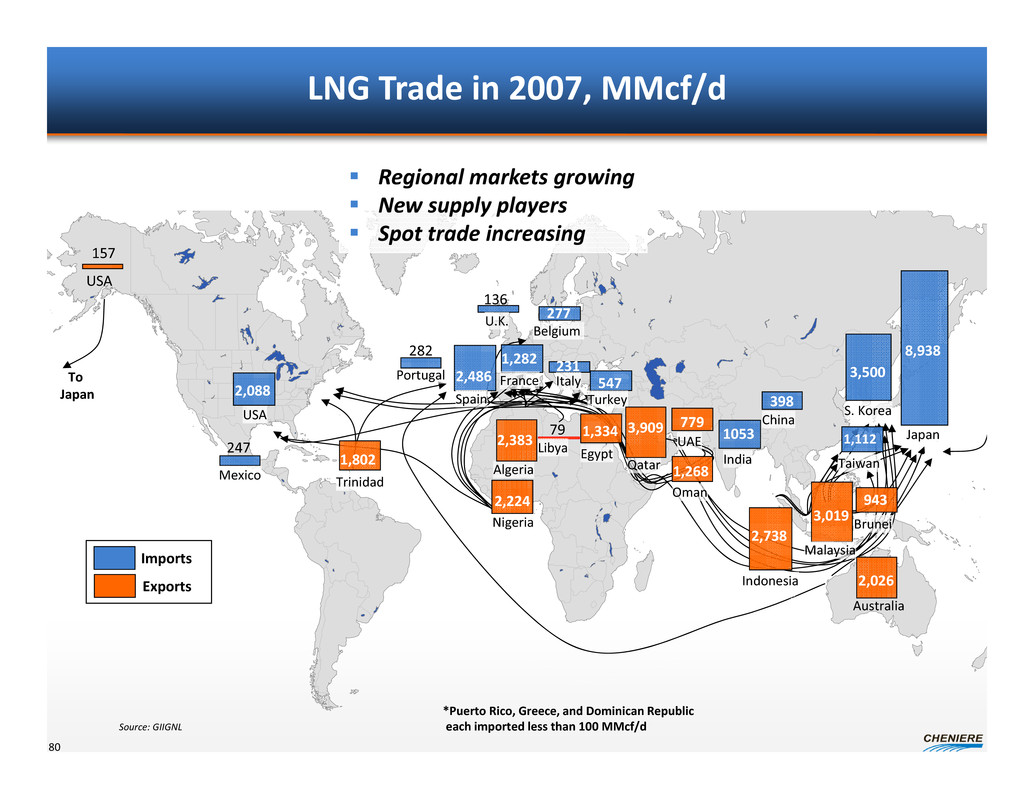
LNG Trade in 2007, MMcf/d 80 2,026 779 157 79 Trinidad Nigeria Australia USA Libya 8,938 3,500 2,088 231 Japan S. KoreaUSA Italy Belgium *Puerto Rico, Greece, and Dominican Republic each imported less than 100 MMcf/d Imports Exports Algeria 2,383 3,019 Indonesia Malaysia 1,112 Taiwan Brunei 943 2,738 Oman UAE Qatar 1,268 2,486 Turkey 1,282 Spain FranceTo Japan Regional markets growing New supply players Spot trade increasing 1053 India 547 247 Portugal 3,9091,334 Egypt 277 2,224 Source: GIIGNL 282 Mexico 398 China 136 U.K. 1,802
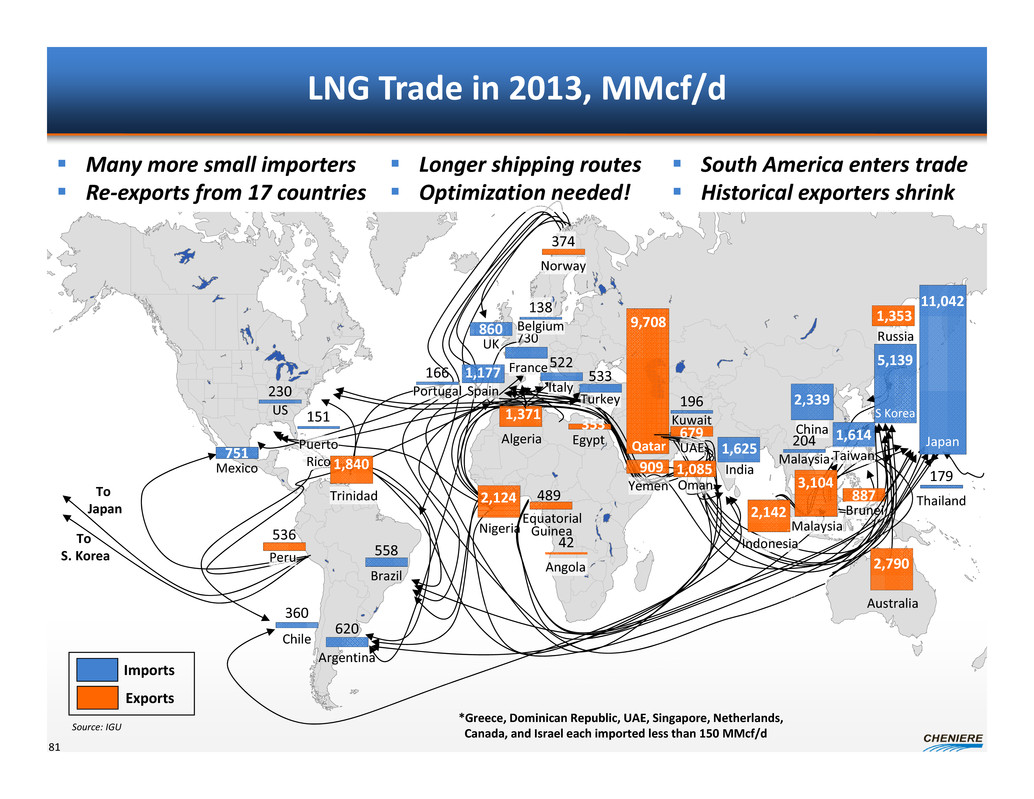
LNG Trade in 2013, MMcf/d 81 *Greece, Dominican Republic, UAE, Singapore, Netherlands, Canada, and Israel each imported less than 150 MMcf/d Imports Exports Many more small importers Re‐exports from 17 countries Source: IGU 1,371 887 353 489 2,142 536 1,353 Algeria Australia Brunei Egypt Equatorial GuineaNigeria 9,708 Qatar Russia Trinidad Peru To Japan To S. Korea 2,124 Indonesia 3,104 Malaysia 374 Norway 2,790 Oman 1,085 UAE 679 Yemen 909 2,339 China 11,042 Japan 5,139 S Korea Taiwan 1,614 France 730 Belgium 138 Italy 522 Turkey 533 UK 860 Argentina 620 558 Brazil Chile 360 751 Mexico Portugal 166 230 US 196 Kuwait 204 Malaysia 179 Thailand 151 Puerto Rico Longer shipping routes Optimization needed! 1,840 Angola 42 India 1,625 Spain 1,177 South America enters trade Historical exporters shrink

Flexibility 82 0% 4% 8% 12% 16% 19% 23% 27% 31% 35% 0 10 20 30 40 50 60 70 80 90 1995 1997 1999 2001 2003 2005 2007 2009 2011 2013 mtpa Non Long Term LNG Trade Sources: IHS, US DOE, IGU
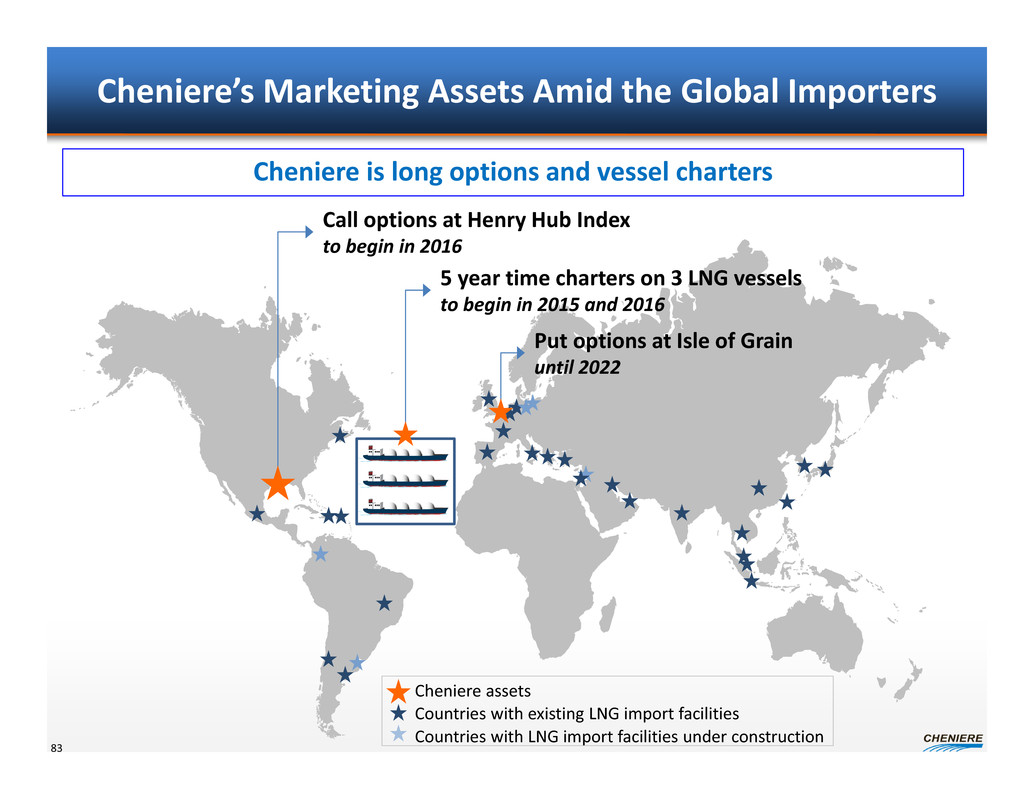
Cheniere’s Marketing Assets Amid the Global Importers Call options at Henry Hub Index to begin in 2016 Put options at Isle of Grain until 2022 5 year time charters on 3 LNG vessels to begin in 2015 and 2016 Cheniere is long options and vessel charters Cheniere assets Countries with existing LNG import facilities Countries with LNG import facilities under construction 83

Futures Prices Support $7.25 / MMBtu Intrinsic Margin $ 9.70 / MMBtu – gross margins realized from purchasing LNG at 115% of HH and selling at 15% of Brent; higher in the prompt month $ 7.25 / MMBtu – intrinsic margins net of shipping, boil‐off & fuel to Asia 84 $0 $13 $26 $39 $52 $64 $77 $90 $103 $116 $0 $2 $4 $6 $8 $10 $12 $14 $16 $18 May‐14 Nov‐14 May‐15 Nov‐15 May‐16 Nov‐16 May‐17 Nov‐17 May‐18 Nov‐18 $/Bbl$/MMBtu Brent and Henry Hub: 5 Years Futures Prices Henry Hub 115% Henry Hub Brent 15% Brent $10.83 / MMBtu
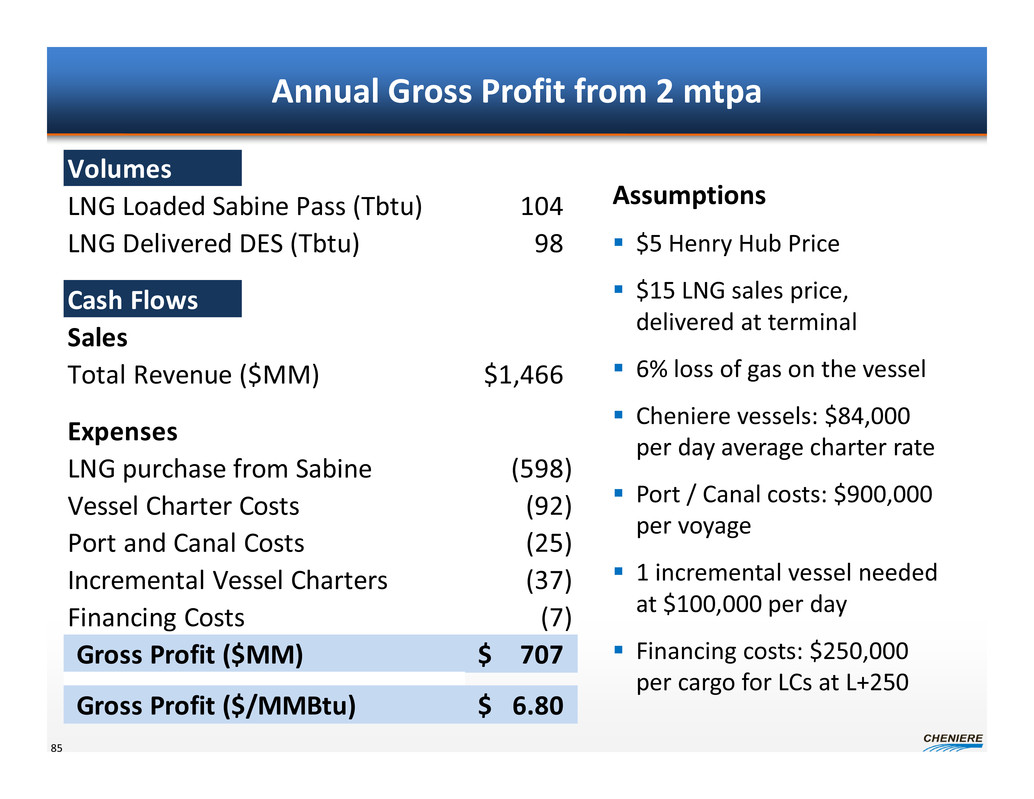
Annual Gross Profit from 2 mtpa 85 Assumptions $5 Henry Hub Price $15 LNG sales price, delivered at terminal 6% loss of gas on the vessel Cheniere vessels: $84,000 per day average charter rate Port / Canal costs: $900,000 per voyage 1 incremental vessel needed at $100,000 per day Financing costs: $250,000 per cargo for LCs at L+250 Volumes LNG Loaded Sabine Pass (Tbtu) 104 LNG Delivered DES (Tbtu) 98 Cash Flows Sales Total Revenue ($MM) 1,466$ Expenses LNG purchase from Sabine (598) Vessel Charter Costs (92) Port and Canal Costs (25) Incremental Vessel Charters (37) Financing Costs (7) Gross Profit ($MM) 707$ Gross Profit ($/MMBtu) 6.80$
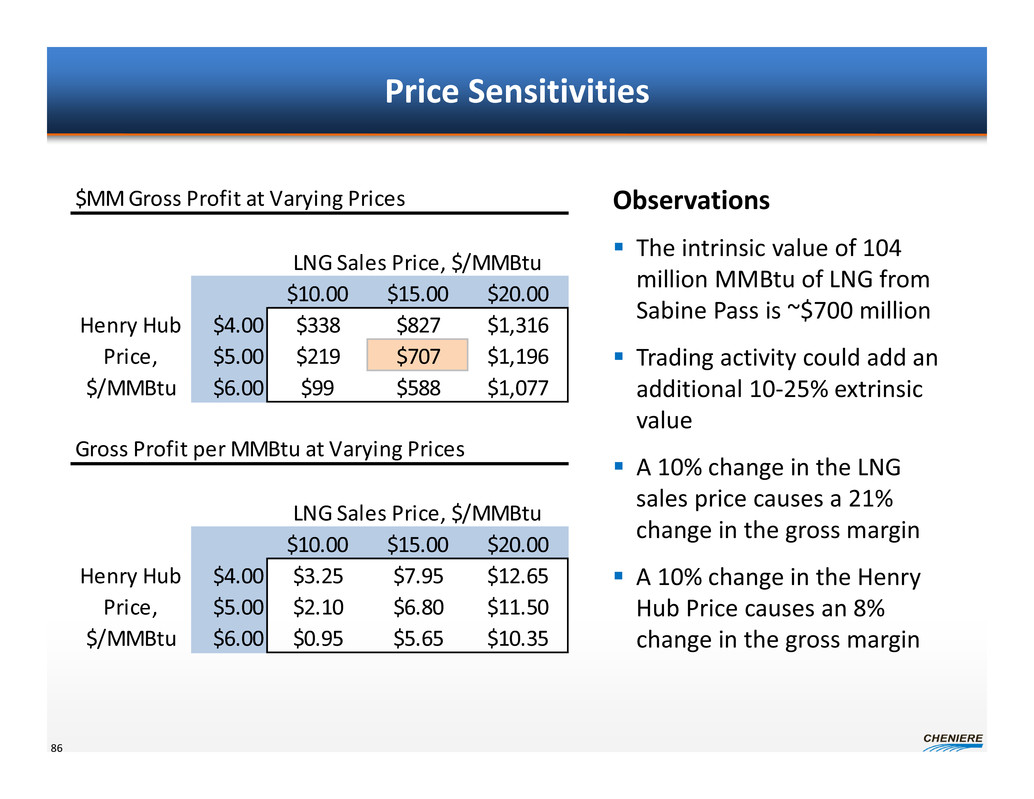
Price Sensitivities 86 Observations The intrinsic value of 104 million MMBtu of LNG from Sabine Pass is ~$700 million Trading activity could add an additional 10‐25% extrinsic value A 10% change in the LNG sales price causes a 21% change in the gross margin A 10% change in the Henry Hub Price causes an 8% change in the gross margin $MM Gross Profit at Varying Prices LNG Sales Price, $/MMBtu $10.00 $15.00 $20.00 $4.00 $338 $827 $1,316 $5.00 $219 $707 $1,196 $6.00 $99 $588 $1,077 Henry Hub Price, $/MMBtu Gross Profit per MMBtu at Varying Prices LNG Sales Price, $/MMBtu $10.00 $15.00 $20.00 $4.00 $3.25 $7.95 $12.65 $5.00 $2.10 $6.80 $11.50 $6.00 $0.95 $5.65 $10.35 Henry Hub Price, $/MMBtu
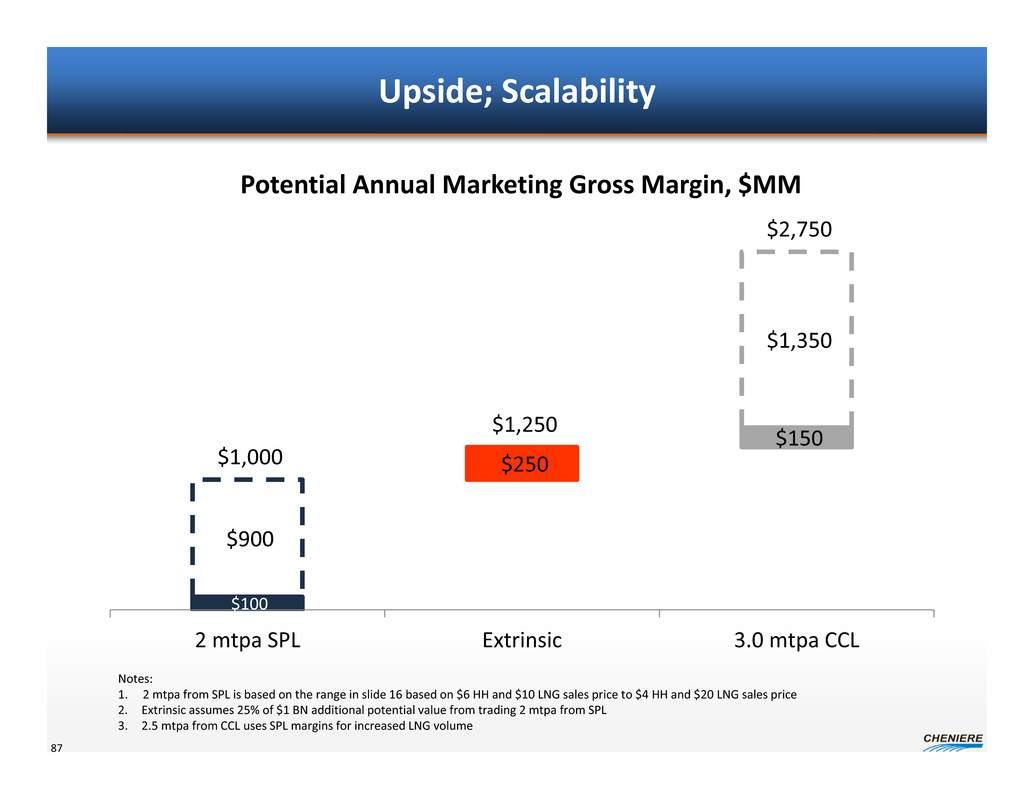
Upside; Scalability 87 $100 $900 $150 $250 $1,350 $1,000 $1,250 $2,750 2 mtpa SPL Extrinsic 3.0 mtpa CCL Potential Annual Marketing Gross Margin, $MM Notes: 1. 2 mtpa from SPL is based on the range in slide 16 based on $6 HH and $10 LNG sales price to $4 HH and $20 LNG sales price 2. Extrinsic assumes 25% of $1 BN additional potential value from trading 2 mtpa from SPL 3. 2.5 mtpa from CCL uses SPL margins for increased LNG volume
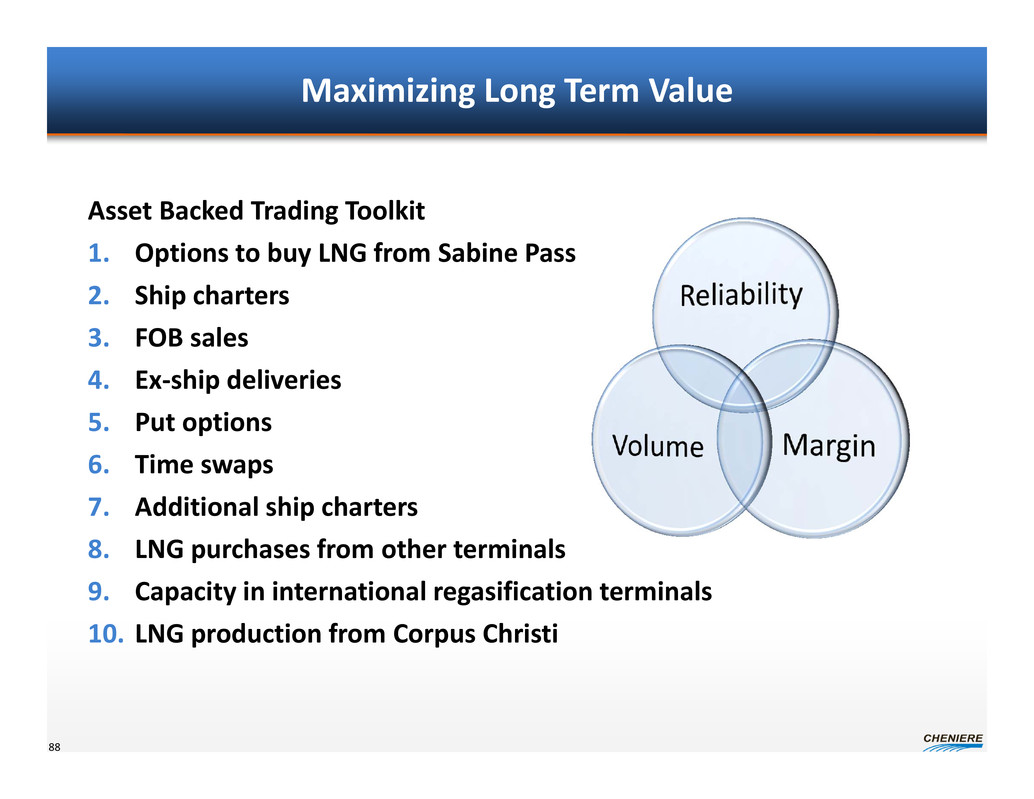
88 Maximizing Long Term Value Asset Backed Trading Toolkit 1. Options to buy LNG from Sabine Pass 2. Ship charters 3. FOB sales 4. Ex‐ship deliveries 5. Put options 6. Time swaps 7. Additional ship charters 8. LNG purchases from other terminals 9. Capacity in international regasification terminals 10. LNG production from Corpus Christi
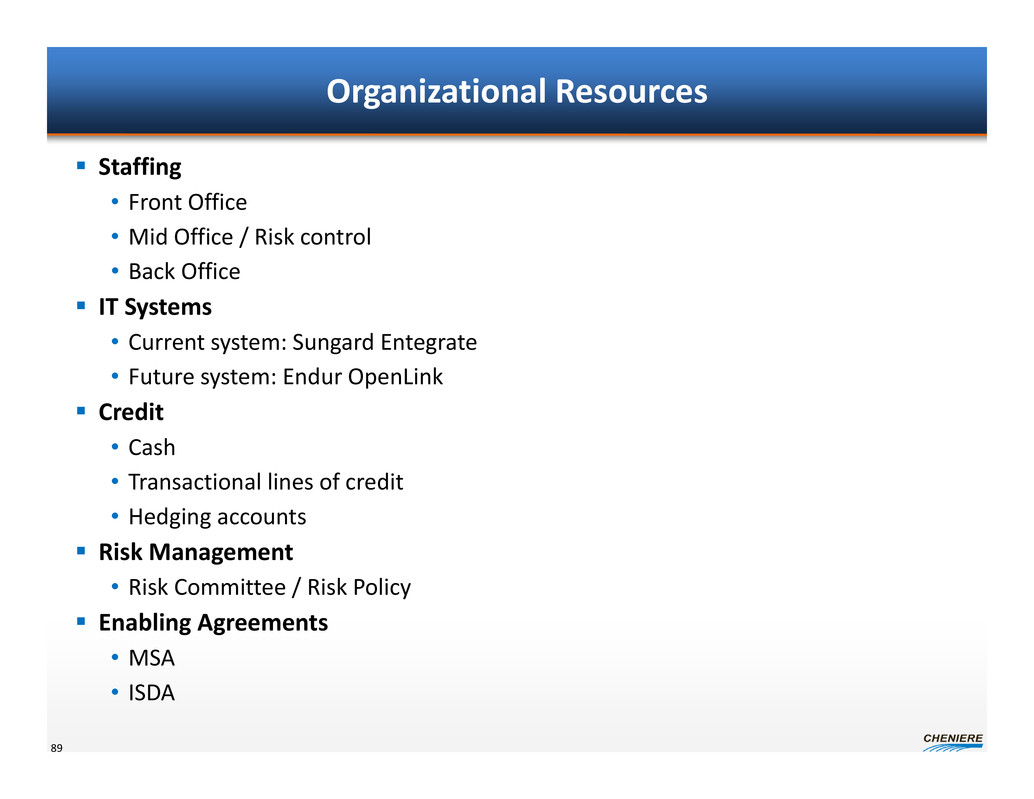
Organizational Resources Staffing • Front Office • Mid Office / Risk control • Back Office IT Systems • Current system: Sungard Entegrate • Future system: Endur OpenLink Credit • Cash • Transactional lines of credit • Hedging accounts Risk Management • Risk Committee / Risk Policy Enabling Agreements • MSA • ISDA 89

Conclusions The potential LNG market is limited by supply By 2020 we expect: • U.S. / Qatar / Australia will each produce > 70 mtpa of LNG • Over 50% of the LNG market will trade on a gas price basis • The entire LNG market could be flexible Cheniere Marketing • Develop a portfolio to maximize reliability and profits • Start with 2 mtpa – $500 MM ‐ $1 BN per year gross cash flow – Potential 10 – 25% additional extrinsic value • Scale up for > 5 mtpa including LNG purchases from Cheniere terminals and other places • Staffing, systems, and processes are underway and on schedule 90
Michael Wortley, Chief Financial Officer April 2014 Financial Update Analyst / Investor Day Conference
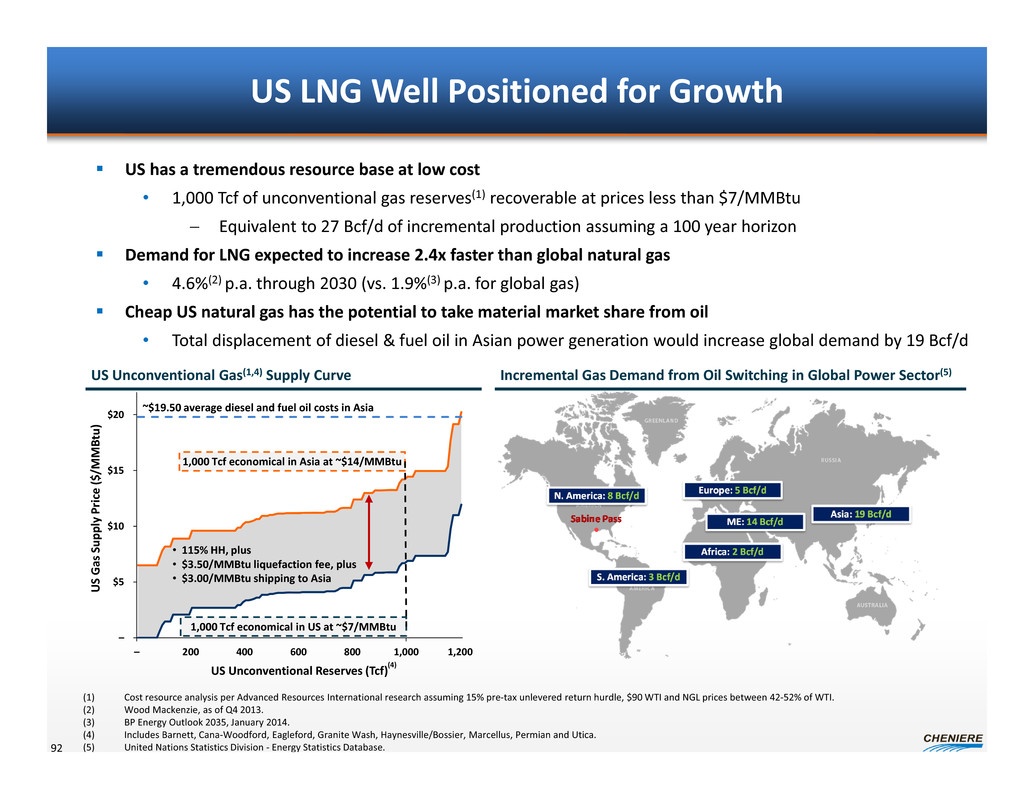
– $5 $10 $15 $20 – 200 400 600 800 1,000 1,200 U S G a s S u p p l y P r i c e ( $ / M M B t u ) US Unconventional Reserves (Tcf) 1,000 Tcf economical in Asia at ~$14/MMBtu US LNG Well Positioned for Growth US Unconventional Gas(1,4) Supply Curve US has a tremendous resource base at low cost • 1,000 Tcf of unconventional gas reserves(1) recoverable at prices less than $7/MMBtu Equivalent to 27 Bcf/d of incremental production assuming a 100 year horizon Demand for LNG expected to increase 2.4x faster than global natural gas • 4.6%(2) p.a. through 2030 (vs. 1.9%(3) p.a. for global gas) Cheap US natural gas has the potential to take material market share from oil • Total displacement of diesel & fuel oil in Asian power generation would increase global demand by 19 Bcf/d Incremental Gas Demand from Oil Switching in Global Power Sector(5) 1,000 Tcf economical in US at ~$7/MMBtu ~$19.50 average diesel and fuel oil costs in Asia • 115% HH, plus • $3.50/MMBtu liquefaction fee, plus • $3.00/MMBtu shipping to Asia (1) Cost resource analysis per Advanced Resources International research assuming 15% pre‐tax unlevered return hurdle, $90 WTI and NGL prices between 42‐52% of WTI. (2) Wood Mackenzie, as of Q4 2013. (3) BP Energy Outlook 2035, January 2014. (4) Includes Barnett, Cana‐Woodford, Eagleford, Granite Wash, Haynesville/Bossier, Marcellus, Permian and Utica. (5) United Nations Statistics Division ‐ Energy Statistics Database.92 (4)
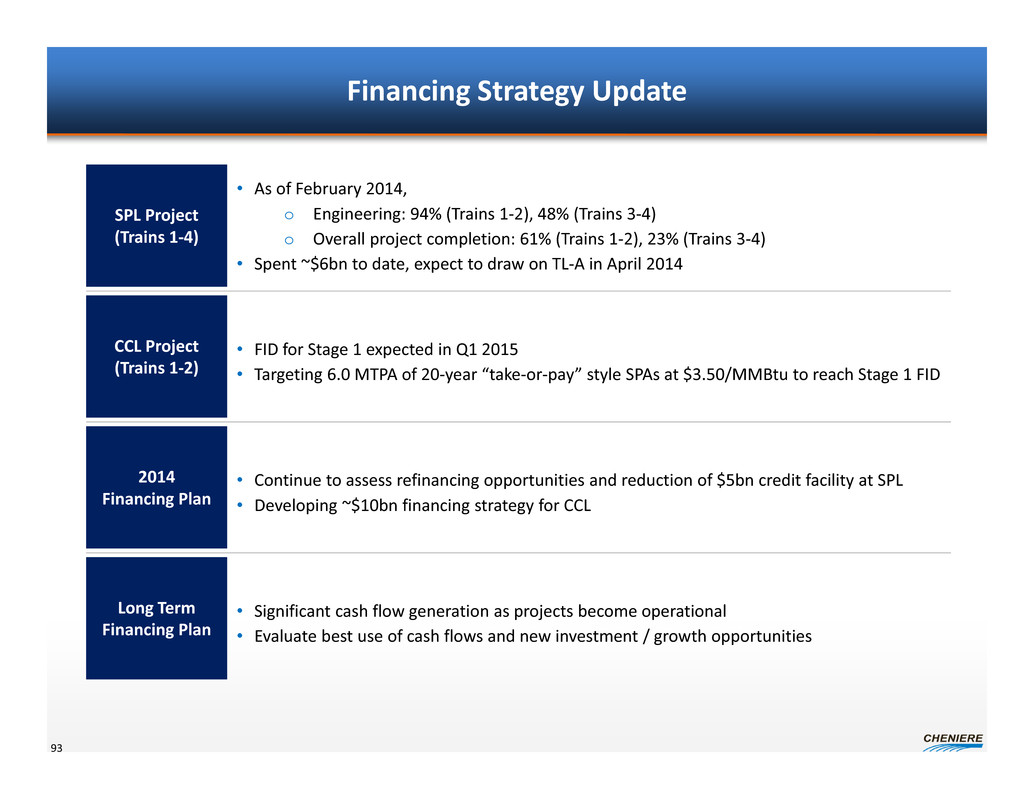
Financing Strategy Update 93 SPL Project (Trains 1‐4) CCL Project (Trains 1‐2) 2014 Financing Plan • As of February 2014, o Engineering: 94% (Trains 1‐2), 48% (Trains 3‐4) o Overall project completion: 61% (Trains 1‐2), 23% (Trains 3‐4) • Spent ~$6bn to date, expect to draw on TL‐A in April 2014 Long Term Financing Plan • FID for Stage 1 expected in Q1 2015 • Targeting 6.0 MTPA of 20‐year “take‐or‐pay” style SPAs at $3.50/MMBtu to reach Stage 1 FID • Continue to assess refinancing opportunities and reduction of $5bn credit facility at SPL • Developing ~$10bn financing strategy for CCL • Significant cash flow generation as projects become operational • Evaluate best use of cash flows and new investment / growth opportunities
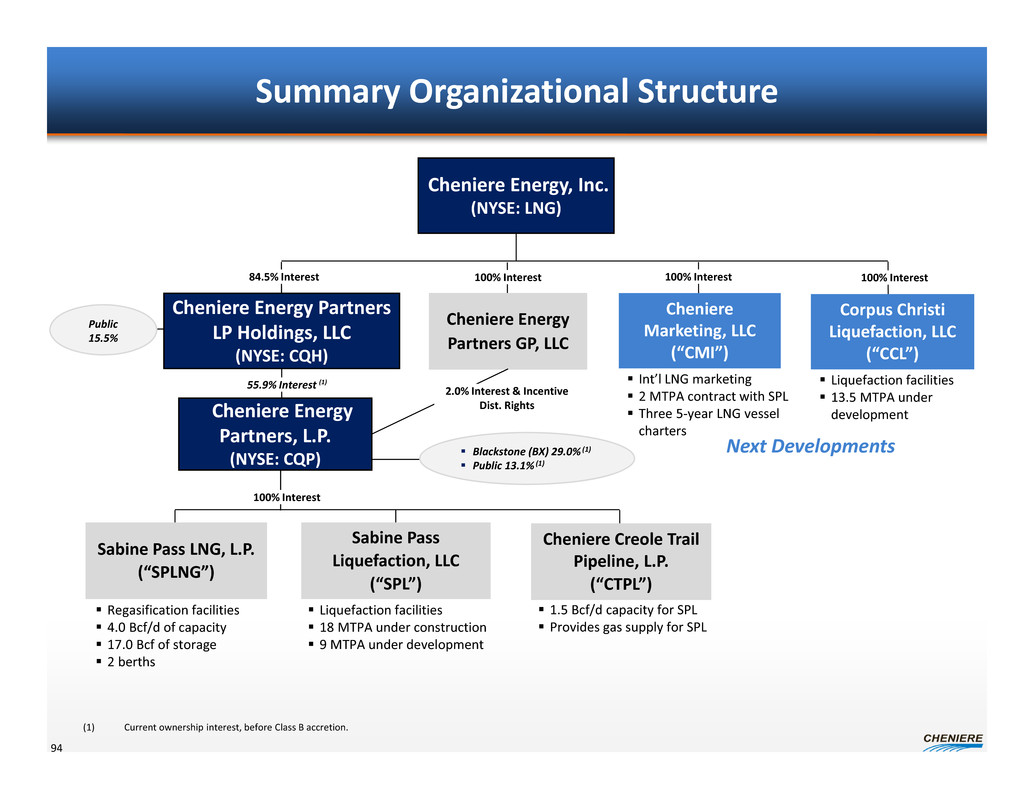
Summary Organizational Structure 94 Cheniere Energy, Inc. (NYSE: LNG) Sabine Pass LNG, L.P. (“SPLNG”) Sabine Pass Liquefaction, LLC (“SPL”) Cheniere Energy Partners, L.P. (NYSE: CQP) Cheniere Creole Trail Pipeline, L.P. (“CTPL”) Corpus Christi Liquefaction, LLC (“CCL”) Cheniere Marketing, LLC (“CMI”) Cheniere Energy Partners GP, LLC 100% Interest 100% Interest 100% Interest100% Interest Liquefaction facilities 13.5 MTPA under development Regasification facilities 4.0 Bcf/d of capacity 17.0 Bcf of storage 2 berths Liquefaction facilities 18 MTPA under construction 9 MTPA under development Cheniere Energy Partners LP Holdings, LLC (NYSE: CQH) 1.5 Bcf/d capacity for SPL Provides gas supply for SPL 84.5% Interest 55.9% Interest (1) 2.0% Interest & Incentive Dist. Rights Int’l LNG marketing 2 MTPA contract with SPL Three 5‐year LNG vessel charters Blackstone (BX) 29.0% (1) Public 13.1% (1) Public 15.5% Next Developments (1) Current ownership interest, before Class B accretion.
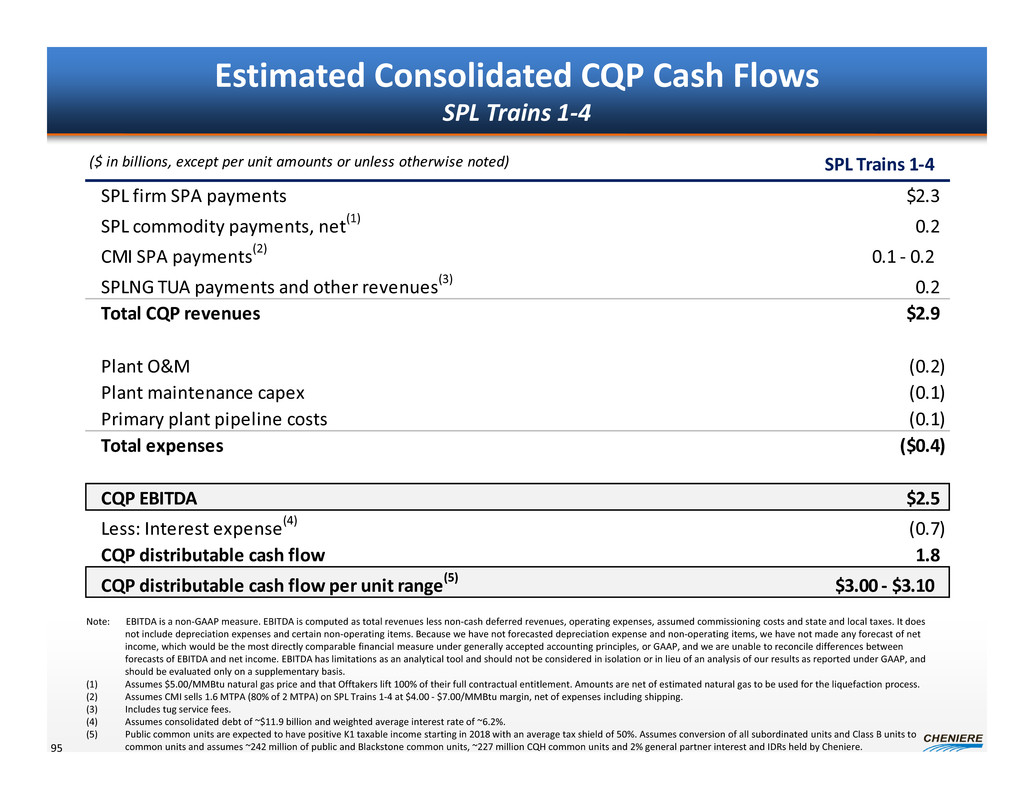
($ in billions, except per unit amounts or unless otherwise noted) SPL Trains 1‐4 SPL firm SPA payments $2.3 SPL commodity payments, net(1) 0.2 CMI SPA payments(2) 0.1 ‐ 0.2 SPLNG TUA payments and other revenues(3) 0.2 Total CQP revenues $2.9 Plant O&M (0.2) Plant maintenance capex (0.1) Primary plant pipeline costs (0.1) Total expenses ($0.4) CQP EBITDA $2.5 Less: Interest expense(4) (0.7) CQP distributable cash flow 1.8 CQP distributable cash flow per unit range(5) $3.00 ‐ $3.10 Estimated Consolidated CQP Cash Flows SPL Trains 1‐4 95 Note: EBITDA is a non‐GAAP measure. EBITDA is computed as total revenues less non‐cash deferred revenues, operating expenses, assumed commissioning costs and state and local taxes. It does not include depreciation expenses and certain non‐operating items. Because we have not forecasted depreciation expense and non‐operating items, we have not made any forecast of net income, which would be the most directly comparable financial measure under generally accepted accounting principles, or GAAP, and we are unable to reconcile differences between forecasts of EBITDA and net income. EBITDA has limitations as an analytical tool and should not be considered in isolation or in lieu of an analysis of our results as reported under GAAP, and should be evaluated only on a supplementary basis. (1) Assumes $5.00/MMBtu natural gas price and that Offtakers lift 100% of their full contractual entitlement. Amounts are net of estimated natural gas to be used for the liquefaction process. (2) Assumes CMI sells 1.6 MTPA (80% of 2 MTPA) on SPL Trains 1‐4 at $4.00 ‐ $7.00/MMBtu margin, net of expenses including shipping. (3) Includes tug service fees. (4) Assumes consolidated debt of ~$11.9 billion and weighted average interest rate of ~6.2%. (5) Public common units are expected to have positive K1 taxable income starting in 2018 with an average tax shield of 50%. Assumes conversion of all subordinated units and Class B units to common units and assumes ~242 million of public and Blackstone common units, ~227 million CQH common units and 2% general partner interest and IDRs held by Cheniere.
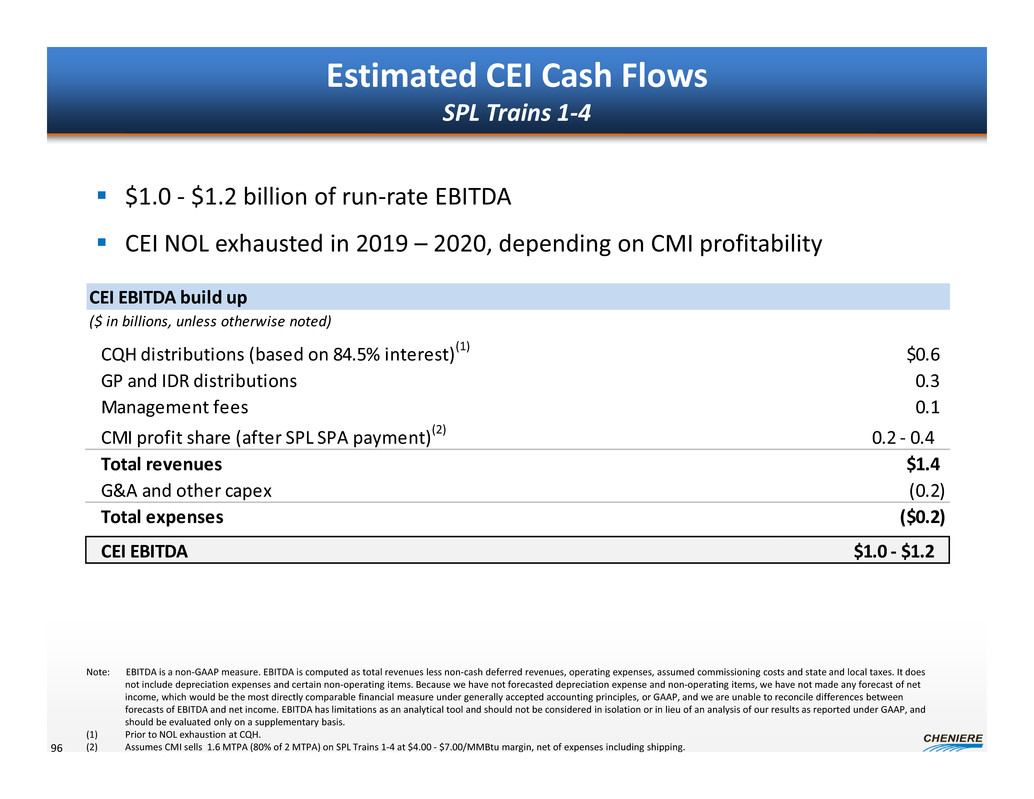
CEI EBITDA build up ($ in billions, unless otherwise noted) CQH distributions (based on 84.5% interest)(1) $0.6 GP and IDR distributions 0.3 Management fees 0.1 CMI profit share (after SPL SPA payment)(2) 0.2 ‐ 0.4 Total revenues $1.4 G&A and other capex (0.2) Total expenses ($0.2) CEI EBITDA $1.0 ‐ $1.2 Estimated CEI Cash Flows SPL Trains 1‐4 96 $1.0 ‐ $1.2 billion of run‐rate EBITDA CEI NOL exhausted in 2019 – 2020, depending on CMI profitability Note: EBITDA is a non‐GAAP measure. EBITDA is computed as total revenues less non‐cash deferred revenues, operating expenses, assumed commissioning costs and state and local taxes. It does not include depreciation expenses and certain non‐operating items. Because we have not forecasted depreciation expense and non‐operating items, we have not made any forecast of net income, which would be the most directly comparable financial measure under generally accepted accounting principles, or GAAP, and we are unable to reconcile differences between forecasts of EBITDA and net income. EBITDA has limitations as an analytical tool and should not be considered in isolation or in lieu of an analysis of our results as reported under GAAP, and should be evaluated only on a supplementary basis. (1) Prior to NOL exhaustion at CQH. (2) Assumes CMI sells 1.6 MTPA (80% of 2 MTPA) on SPL Trains 1‐4 at $4.00 ‐ $7.00/MMBtu margin, net of expenses including shipping.
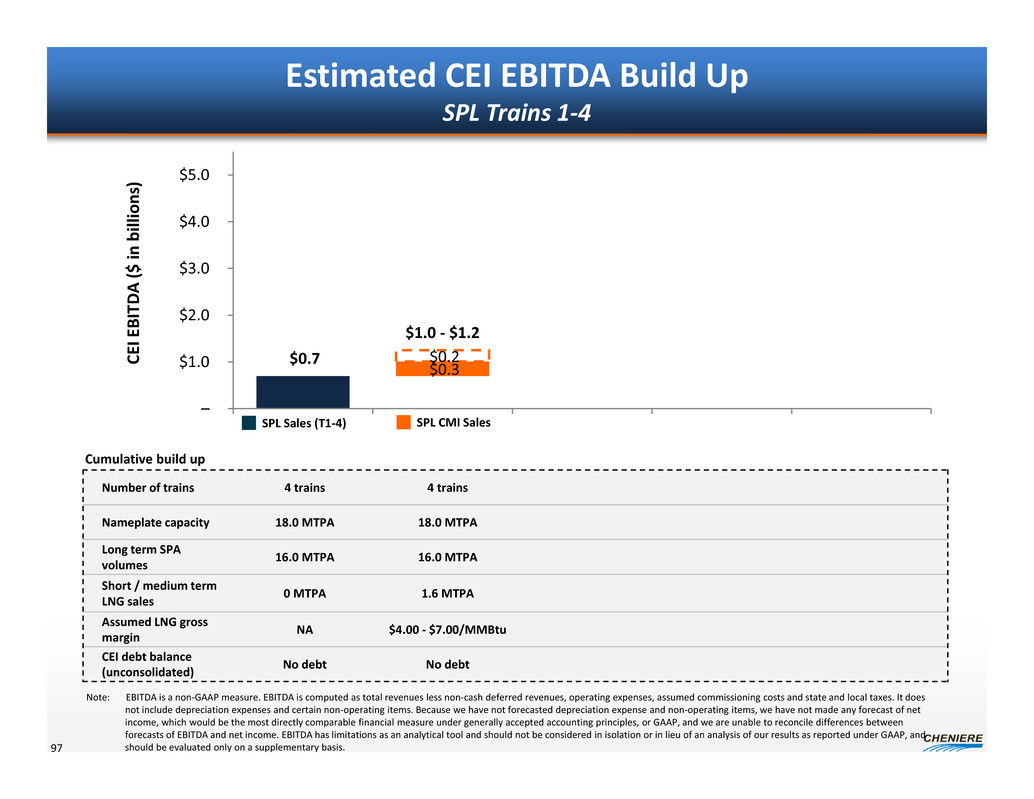
$0.3 $0.2 $0.7 $1.0 ‐ $1.2 – $1.0 $2.0 $3.0 $4.0 $5.0 C E I E B I T D A ( $ i n b i l l i o n s ) Estimated CEI EBITDA Build Up SPL Trains 1‐4 97 Number of trains 4 trains 4 trains Nameplate capacity 18.0 MTPA 18.0 MTPA Long term SPA volumes 16.0 MTPA 16.0 MTPA Short / medium term LNG sales 0 MTPA 1.6 MTPA Assumed LNG gross margin NA $4.00 ‐ $7.00/MMBtu CEI debt balance (unconsolidated) No debt No debt SPL Sales (T1‐4) SPL CMI Sales Cumulative build up Note: EBITDA is a non‐GAAP measure. EBITDA is computed as total revenues less non‐cash deferred revenues, operating expenses, assumed commissioning costs and state and local taxes. It does not include depreciation expenses and certain non‐operating items. Because we have not forecasted depreciation expense and non‐operating items, we have not made any forecast of net income, which would be the most directly comparable financial measure under generally accepted accounting principles, or GAAP, and we are unable to reconcile differences between forecasts of EBITDA and net income. EBITDA has limitations as an analytical tool and should not be considered in isolation or in lieu of an analysis of our results as reported under GAAP, and should be evaluated only on a supplementary basis.

~$4bn Corpus Christi Liquefaction Trains 1‐2 98 Corpus Christi Liquefaction Trains 1‐2 Design production capacity is expected to be ~4.5 MTPA per train, using ConocoPhillips’ Optimized Cascade® Process. CEI CCL (Trains 1‐2) LNG Customers Project Lenders ~$6bn CCL Trains 1‐2 FID Date Q1 2015 Capex Estimate ~$10 billion Project Equity ~$4 billion Project Debt ~$6 billion COD 2018 Commercial Assumptions 20‐year “take‐or‐pay” style SPAs 6.0 MTPA $3.50/MMBtu Short / medium term contracts 2.4 MTPA(1) $4.00 ‐ $7.00/MMBtu (1) Assumes sale of 2.4 MTPA (80% of 3.0 MTPA) of capacity. (2) Assumes CQH sell down to maintain CEI ownership at or above 80%. 20‐year SPA capacity sales • ~$1.1bn in annual revenues Short/medium term LNG sales • ~$0.5 ‐ ~$0.9bn in annual revenues • ~$2bn of debt / CQH sell down(2) / BS cash upfront • ~$2bn of funding during construction Houston New Orleans Gulf of Mexico Corpus Christi Artist’s rendition
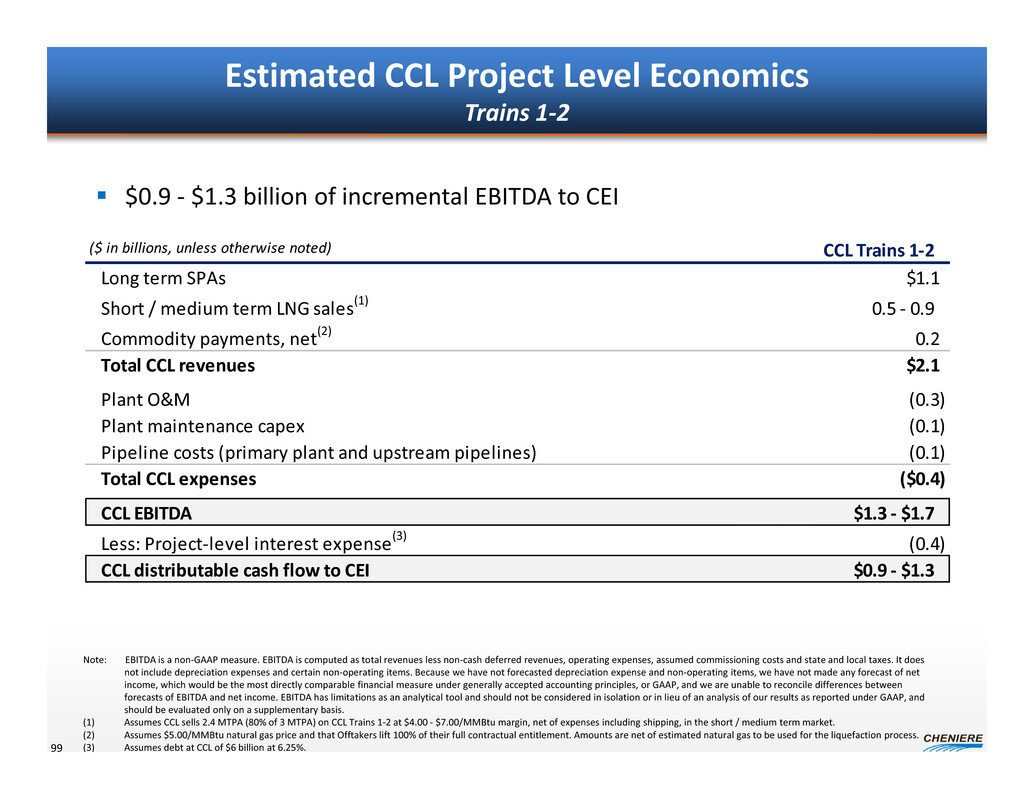
($ in billions, unless otherwise noted) CCL Trains 1‐2 Long term SPAs $1.1 Short / medium term LNG sales(1) 0.5 ‐ 0.9 Commodity payments, net(2) 0.2 Total CCL revenues $2.1 Plant O&M (0.3) Plant maintenance capex (0.1) Pipeline costs (primary plant and upstream pipelines) (0.1) Total CCL expenses ($0.4) CCL EBITDA $1.3 ‐ $1.7 Less: Project‐level interest expense(3) (0.4) CCL distributable cash flow to CEI $0.9 ‐ $1.3 Estimated CCL Project Level Economics Trains 1‐2 99 Note: EBITDA is a non‐GAAP measure. EBITDA is computed as total revenues less non‐cash deferred revenues, operating expenses, assumed commissioning costs and state and local taxes. It does not include depreciation expenses and certain non‐operating items. Because we have not forecasted depreciation expense and non‐operating items, we have not made any forecast of net income, which would be the most directly comparable financial measure under generally accepted accounting principles, or GAAP, and we are unable to reconcile differences between forecasts of EBITDA and net income. EBITDA has limitations as an analytical tool and should not be considered in isolation or in lieu of an analysis of our results as reported under GAAP, and should be evaluated only on a supplementary basis. (1) Assumes CCL sells 2.4 MTPA (80% of 3 MTPA) on CCL Trains 1‐2 at $4.00 ‐ $7.00/MMBtu margin, net of expenses including shipping, in the short / medium term market. (2) Assumes $5.00/MMBtu natural gas price and that Offtakers lift 100% of their full contractual entitlement. Amounts are net of estimated natural gas to be used for the liquefaction process. (3) Assumes debt at CCL of $6 billion at 6.25%. $0.9 ‐ $1.3 billion of incremental EBITDA to CEI

$0.3 $0.2 $0.9 $0.4 $0.7 $1.0 ‐ $1.2 $1.9 ‐ $2.5 – $1.0 $2.0 $3.0 $4.0 $5.0 C E I E B I T D A ( $ i n b i l l i o n s ) Estimated CEI EBITDA Build Up SPL Trains 1‐4 and CCL Trains 1‐2 100 SPL Sales (T1‐4) SPL CMI Sales CCL Sales (T1‐2) Number of trains 4 trains 4 trains 6 trains Nameplate capacity 18.0 MTPA 18.0 MTPA 27.0 MTPA Long term SPA volumes 16.0 MTPA 16.0 MTPA 22.0 MTPA Short / medium term LNG sales 0 MTPA 1.6 MTPA 4.0 MTPA Assumed LNG gross margin NA $4.00 ‐ $7.00/MMBtu CEI debt balance (unconsolidated) No debt No debt ~$2 billion Cumulative build up Note: EBITDA is a non‐GAAP measure. EBITDA is computed as total revenues less non‐cash deferred revenues, operating expenses, assumed commissioning costs and state and local taxes. It does not include depreciation expenses and certain non‐operating items. Because we have not forecasted depreciation expense and non‐operating items, we have not made any forecast of net income, which would be the most directly comparable financial measure under generally accepted accounting principles, or GAAP, and we are unable to reconcile differences between forecasts of EBITDA and net income. EBITDA has limitations as an analytical tool and should not be considered in isolation or in lieu of an analysis of our results as reported under GAAP, and should be evaluated only on a supplementary basis.

Sabine Pass Liquefaction Trains 5‐6 Expansion 101 SPL Trains 5‐6 Expansion SPL Trains 5‐6 Expansion FID Date H2 2015 Capex Estimate ~$6 billion Project Equity ~$1.5 billion Project Debt ~$4.5 billion COD 2018/2019 Commercial Assumptions Train 5 Train 6 20‐year “take‐or‐pay” style SPAs 3.75 MTPA $3.00/MMBtu 4.0 MTPA $3.50/MMBtu Short / medium term contracts 0.6 MTPA(1) $4 ‐ $7/MMBtu Equity SPL (Trains 5‐6) LNG customers Project Lenders ~$4.5bn~$1.5bn 20‐year SPA capacity sales and short / medium term LNG sales (1) Assumes sale of 80% of remaining train capacity. Design production capacity is expected to be ~4.5 MTPA per train, using ConocoPhillips’ Optimized Cascade® Process.

($ in billions, except per unit amounts or unless otherwise noted) SPL Trains 5‐6 SPL Trains 1‐6 SPL firm SPA payments(1) $1.4 $3.6 SPL commodity payments, net(2) 0.1 0.4 CMI SPA payments(3) 0.0 0.2 ‐ 0.2 SPLNG TUA payments and other revenues(4) (0.1) 0.2 Total CQP revenues $1.4 $4.4 Plant O&M (0.1) (0.4) Plant maintenance capex (0.1) (0.2) Primary plant pipeline costs (0.1) (0.2) Total expenses ($0.2) ($0.7) CQP EBITDA $1.2 $3.7 Less: Interest expense(5) (0.3) (1.0) CQP distributable cash flow 0.9 2.7 CQP distributable cash flow per unit range(6) $0.70 $3.80 ‐ $3.90 Estimated Consolidated CQP Cash Flows SPL Trains 1‐6 102 Note: EBITDA is a non‐GAAP measure. EBITDA is computed as total revenues less non‐cash deferred revenues, operating expenses, assumed commissioning costs and state and local taxes. It does not include depreciation expenses and certain non‐operating items. Because we have not forecasted depreciation expense and non‐operating items, we have not made any forecast of net income, which would be the most directly comparable financial measure under generally accepted accounting principles, or GAAP, and we are unable to reconcile differences between forecasts of EBITDA and net income. EBITDA has limitations as an analytical tool and should not be considered in isolation or in lieu of an analysis of our results as reported under GAAP, and should be evaluated only on a supplementary basis. (1) Assumes 4.0 MTPA sold at $3.50/MMBtu on Train 6. (2) Assumes $5.00/MMBtu natural gas price and that Offtakers lift 100% of their full contractual entitlement. Amounts are net of estimated natural gas to be used for the liquefaction process. (3) Assumes CMI sells 2.2 MTPA (SPL Trains 1‐4: 80% of 2 MTPA, plus SPL Trains 5: 80% of 0.75 MTPA) on SPL Trains 1‐5 at $4.00 ‐ $7.00/MMBtu margin, net of expenses including shipping. (4) Includes tug service fees and SPL’s obligation to take over the remaining Total TUA payment at SPLNG. (5) SPL Trains 1‐4 assume consolidated debt of ~$11.9 billion with weighted average interest rate of ~6.2%. SPL Trains 1‐6 assume consolidated debt of ~$16.5 billion with w.a. interest rate of ~6.2%. (6) Assumes conversion of all subordinated units and Class B units to common units and assumes ~269 million of public and Blackstone common units, ~227 million CQH common units and 2% general partner interest and IDRs held by Cheniere.

CQH dividend build up (100% of CQH interest) SPL Trains 1‐4 SPL Trains 5‐6 SPL Trains 1‐6 CQH pre‐tax cash flow $0.7 $0.2 $0.9 CQH dividend per share range (pre‐tax) $3.00 ‐ $3.10 – – CQH dividend per share range (after‐tax) $2.40 ‐ $2.50 $0.60 $3.10 ‐ $3.10 Effective CQH tax rate ~20% ~20% ~20% ($ in billions, except per share amounts or unless otherwise noted) Estimated CQH Cash Flows SPL Trains 1‐6 103 CQH NOL exhausted in 2019(1) with an average effective tax rate of ~20% thereafter (1) Assumes CEI maintains CQH ownership at or above 80%.

CEI EBITDA build up ($ in billions, except per unit amounts or unless otherwise noted) SPL Trains 5‐6 SPL Trains 1‐6 CQH distributions(1) $0.1 $0.6 GP and IDR distributions 0.4 0.8 Management fees 0.0 0.1 CMI profit (after SPL SPA payment) 0.2 0.3 ‐ 0.6 Total revenues $0.7 $2.0 G&A and other capex – (0.2) Total expenses – ($0.2) CEI EBITDA $0.7 $1.5 ‐ $1.8 Estimated CEI Cash Flows SPL Trains 1‐6 104 Note: EBITDA is a non‐GAAP measure. EBITDA is computed as total revenues less non‐cash deferred revenues, operating expenses, assumed commissioning costs and state and local taxes. It does not include depreciation expenses and certain non‐operating items. Because we have not forecasted depreciation expense and non‐operating items, we have not made any forecast of net income, which would be the most directly comparable financial measure under generally accepted accounting principles, or GAAP, and we are unable to reconcile differences between forecasts of EBITDA and net income. EBITDA has limitations as an analytical tool and should not be considered in isolation or in lieu of an analysis of our results as reported under GAAP, and should be evaluated only on a supplementary basis. (1) Based on 80% CEI ownership interest and after NOL exhaustion at CQH. $0.5 ‐ $0.7 billion of incremental EBITDA to CEI

$0.3 $0.2 $0.9 $0.4 $0.5 $0.1 $0.1 $0.7 $1.0 ‐ $1.2 $1.9 ‐ $2.5 $2.6 ‐ $3.3 – $1.0 $2.0 $3.0 $4.0 $5.0 C E I E B I T D A ( $ i n b i l l i o n s ) Estimated CEI EBITDA Build Up SPL Trains 1‐6 and CCL Trains 1‐2 105 SPL Sales (T1‐4) SPL CMI Sales CCL Sales (T1‐2) SPL Sales (T5‐6) Number of trains 4 trains 4 trains 6 trains 8 trains Nameplate capacity 18.0 MTPA 18.0 MTPA 27.0 MTPA 36.0 MTPA Long term SPA volumes 16.0 MTPA 16.0 MTPA 22.0 MTPA 27.8 MTPA(1) Short / medium term LNG sales 0 MTPA 1.6 MTPA 4.0 MTPA 6.6 MTPA(1) Assumed LNG gross margin NA $4.00 ‐ $7.00/MMBtu CEI debt balance (unconsolidated) No debt No debt ~$2 billion ~$2 billion Cumulative build up Note: EBITDA is a non‐GAAP measure. EBITDA is computed as total revenues less non‐cash deferred revenues, operating expenses, assumed commissioning costs and state and local taxes. It does not include depreciation expenses and certain non‐operating items. Because we have not forecasted depreciation expense and non‐operating items, we have not made any forecast of net income, which would be the most directly comparable financial measure under generally accepted accounting principles, or GAAP, and we are unable to reconcile differences between forecasts of EBITDA and net income. EBITDA has limitations as an analytical tool and should not be considered in isolation or in lieu of an analysis of our results as reported under GAAP, and should be evaluated only on a supplementary basis. (1) Assumes 4.0 MTPA sold at $3.50/MMBtu on Train 6 and split evenly across long term and short / medium term sales.
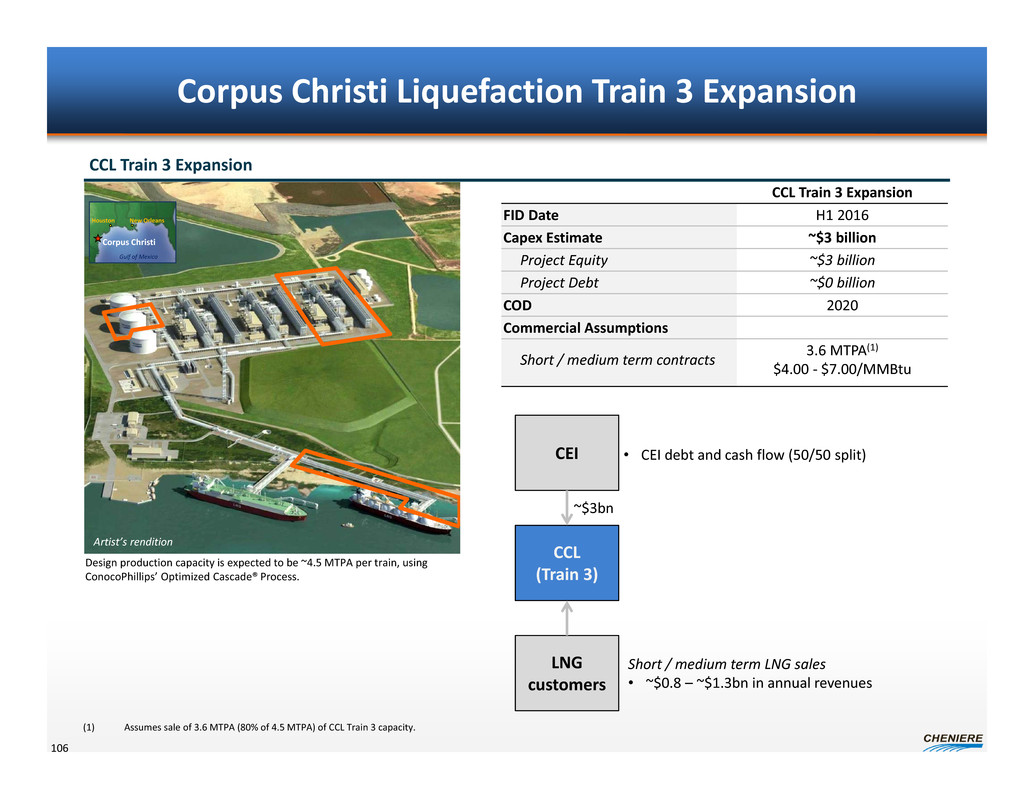
Corpus Christi Liquefaction Train 3 Expansion 106 CCL Train 3 Expansion Design production capacity is expected to be ~4.5 MTPA per train, using ConocoPhillips’ Optimized Cascade® Process. CCL Train 3 Expansion FID Date H1 2016 Capex Estimate ~$3 billion Project Equity ~$3 billion Project Debt ~$0 billion COD 2020 Commercial Assumptions Short / medium term contracts 3.6 MTPA(1) $4.00 ‐ $7.00/MMBtu CEI CCL (Train 3) LNG customers ~$3bn • CEI debt and cash flow (50/50 split) Short / medium term LNG sales • ~$0.8 – ~$1.3bn in annual revenues (1) Assumes sale of 3.6 MTPA (80% of 4.5 MTPA) of CCL Train 3 capacity. Artist’s rendition Houston New Orleans Gulf of Mexico Corpus Christi
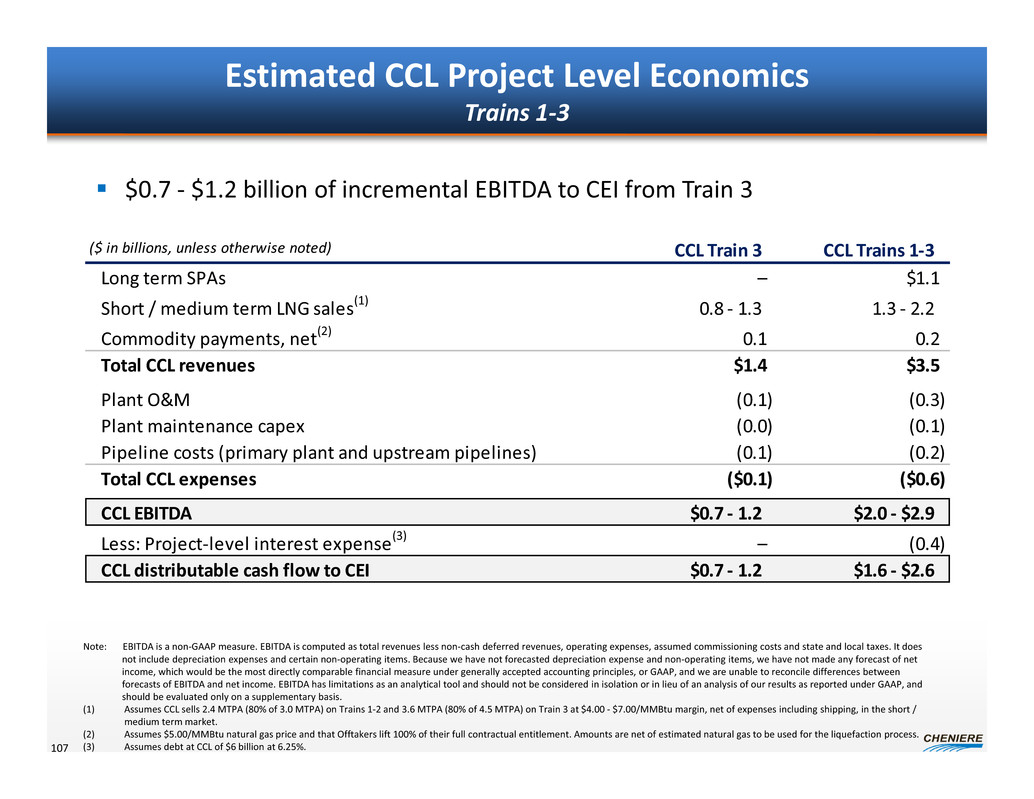
($ in billions, unless otherwise noted) CCL Train 3 CCL Trains 1‐3 Long term SPAs – $1.1 Short / medium term LNG sales(1) 0.8 ‐ 1.3 1.3 ‐ 2.2 Commodity payments, net(2) 0.1 0.2 Total CCL revenues $1.4 $3.5 Plant O&M (0.1) (0.3) Plant maintenance capex (0.0) (0.1) Pipeline costs (primary plant and upstream pipelines) (0.1) (0.2) Total CCL expenses ($0.1) ($0.6) CCL EBITDA $0.7 ‐ 1.2 $2.0 ‐ $2.9 Less: Project‐level interest expense(3) – (0.4) CCL distributable cash flow to CEI $0.7 ‐ 1.2 $1.6 ‐ $2.6 Estimated CCL Project Level Economics Trains 1‐3 107 Note: EBITDA is a non‐GAAP measure. EBITDA is computed as total revenues less non‐cash deferred revenues, operating expenses, assumed commissioning costs and state and local taxes. It does not include depreciation expenses and certain non‐operating items. Because we have not forecasted depreciation expense and non‐operating items, we have not made any forecast of net income, which would be the most directly comparable financial measure under generally accepted accounting principles, or GAAP, and we are unable to reconcile differences between forecasts of EBITDA and net income. EBITDA has limitations as an analytical tool and should not be considered in isolation or in lieu of an analysis of our results as reported under GAAP, and should be evaluated only on a supplementary basis. (1) Assumes CCL sells 2.4 MTPA (80% of 3.0 MTPA) on Trains 1‐2 and 3.6 MTPA (80% of 4.5 MTPA) on Train 3 at $4.00 ‐ $7.00/MMBtu margin, net of expenses including shipping, in the short / medium term market. (2) Assumes $5.00/MMBtu natural gas price and that Offtakers lift 100% of their full contractual entitlement. Amounts are net of estimated natural gas to be used for the liquefaction process. (3) Assumes debt at CCL of $6 billion at 6.25%. $0.7 ‐ $1.2 billion of incremental EBITDA to CEI from Train 3
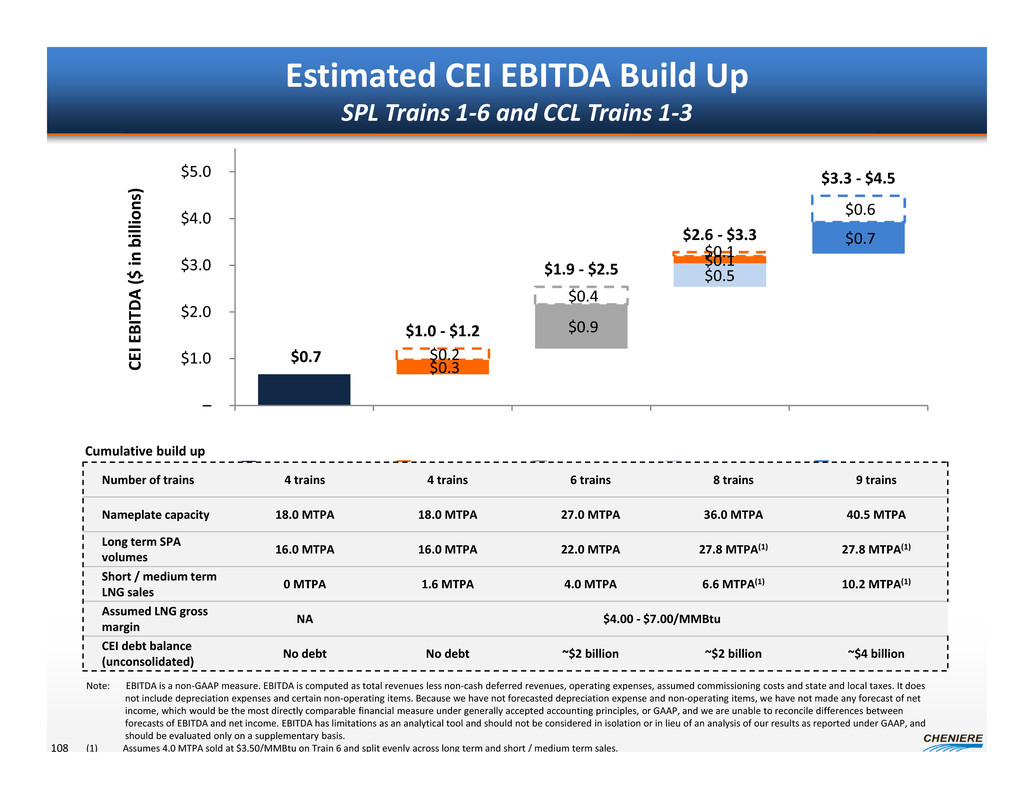
$0.3 $0.2 $0.9 $0.4 $0.5 $0.1 $0.1 $0.7 $0.6 $0.7 $1.0 ‐ $1.2 $1.9 ‐ $2.5 $2.6 ‐ $3.3 $3.3 ‐ $4.5 – $1.0 $2.0 $3.0 $4.0 $5.0 C E I E B I T D A ( $ i n b i l l i o n s ) Estimated CEI EBITDA Build Up SPL Trains 1‐6 and CCL Trains 1‐3 108 SPL Sales (T1‐4) SPL CMI Sales CCL Sales (T1‐2) SPL Sales (T5‐6) CCL Sales (T3) Number of trains 4 trains 4 trains 6 trains 8 trains 9 trains Nameplate capacity 18.0 MTPA 18.0 MTPA 27.0 MTPA 36.0 MTPA 40.5 MTPA Long term SPA volumes 16.0 MTPA 16.0 MTPA 22.0 MTPA 27.8 MTPA(1) 27.8 MTPA(1) Short / medium term LNG sales 0 MTPA 1.6 MTPA 4.0 MTPA 6.6 MTPA(1) 10.2 MTPA(1) Assumed LNG gross margin NA $4.00 ‐ $7.00/MMBtu CEI debt balance (unconsolidated) No debt No debt ~$2 billion ~$2 billion ~$4 billion Note: EBITDA is a non‐GAAP measure. EBITDA is computed as total revenues less non‐cash deferred revenues, operating expenses, assumed commissioning costs and state and local taxes. It does not include depreciation expenses and certain non‐operating items. Because we have not forecasted depreciation expense and non‐operating items, we have not made any forecast of net income, which would be the most directly comparable financial measure under generally accepted accounting principles, or GAAP, and we are unable to reconcile differences between forecasts of EBITDA and net income. EBITDA has limitations as an analytical tool and should not be considered in isolation or in lieu of an analysis of our results as reported under GAAP, and should be evaluated only on a supplementary basis. (1) Assumes 4.0 MTPA sold at $3.50/MMBtu on Train 6 and split evenly across long term and short / medium term sales. Cumulative build up
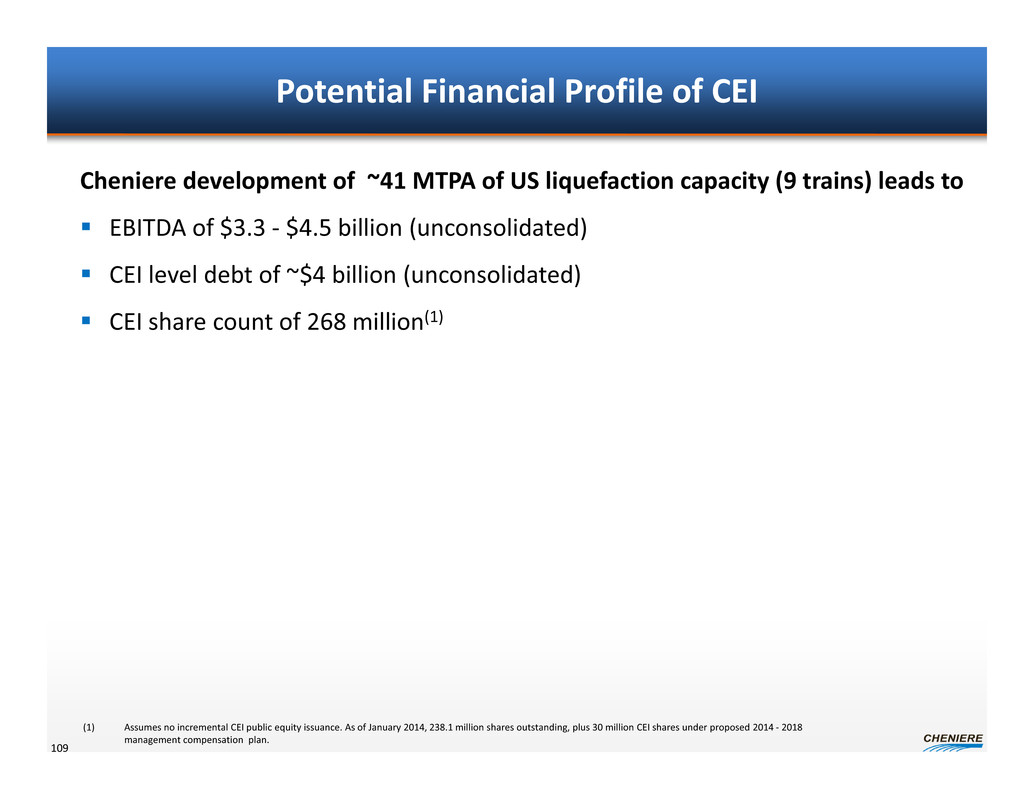
Potential Financial Profile of CEI 109 (1) Assumes no incremental CEI public equity issuance. As of January 2014, 238.1 million shares outstanding, plus 30 million CEI shares under proposed 2014 ‐ 2018 management compensation plan. Cheniere development of ~41 MTPA of US liquefaction capacity (9 trains) leads to EBITDA of $3.3 ‐ $4.5 billion (unconsolidated) CEI level debt of ~$4 billion (unconsolidated) CEI share count of 268 million(1)

Strategic Update and LTIP Analyst/ Investor Day Charif Souki, President, Chairman and CEO April 2014

U.S. Crude May Outpace Demand by 2017 Source: Ponderosa Advisors LLC 1 / 2 0 0 8 1 / 2 0 0 9 1 / 2 0 1 0 1 / 2 0 1 1 1 / 2 0 1 2 1 / 2 0 1 3 1 / 2 0 1 4 1 / 2 0 1 5 1 / 2 0 1 6 1 / 2 0 1 7 1 / 2 0 1 8 1 / 2 0 1 9 1 / 2 0 2 0 1 / 2 0 2 1 1 / 2 0 2 2 1 / 2 0 2 3 1 / 2 0 2 4 1 / 2 0 2 5 Effective U.S. Refining Capacity @92% Util Rate – 16 MMb/d Capacity Accounting for LT Contracts Actual History P r o d u c t i o n ( M M b / d ) Projected Production 111
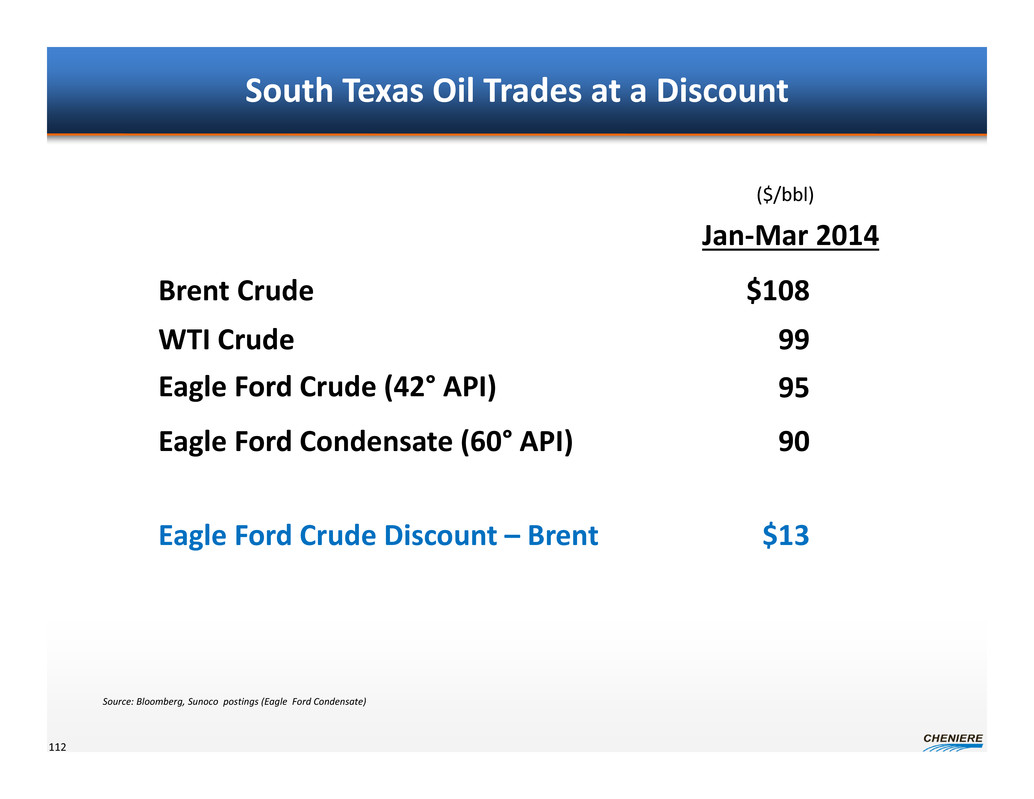
South Texas Oil Trades at a Discount Jan‐Mar 2014 Eagle Ford Condensate (60° API) ($/bbl) 90 Source: Bloomberg, Sunoco postings (Eagle Ford Condensate) Eagle Ford Crude Discount – Brent WTI Crude 99 Eagle Ford Crude (42° API) 95 $13 Brent Crude $108 112

U.S. Rig Activity 113 Oil Gas Source: Baker Hughes (March 28, 2014)
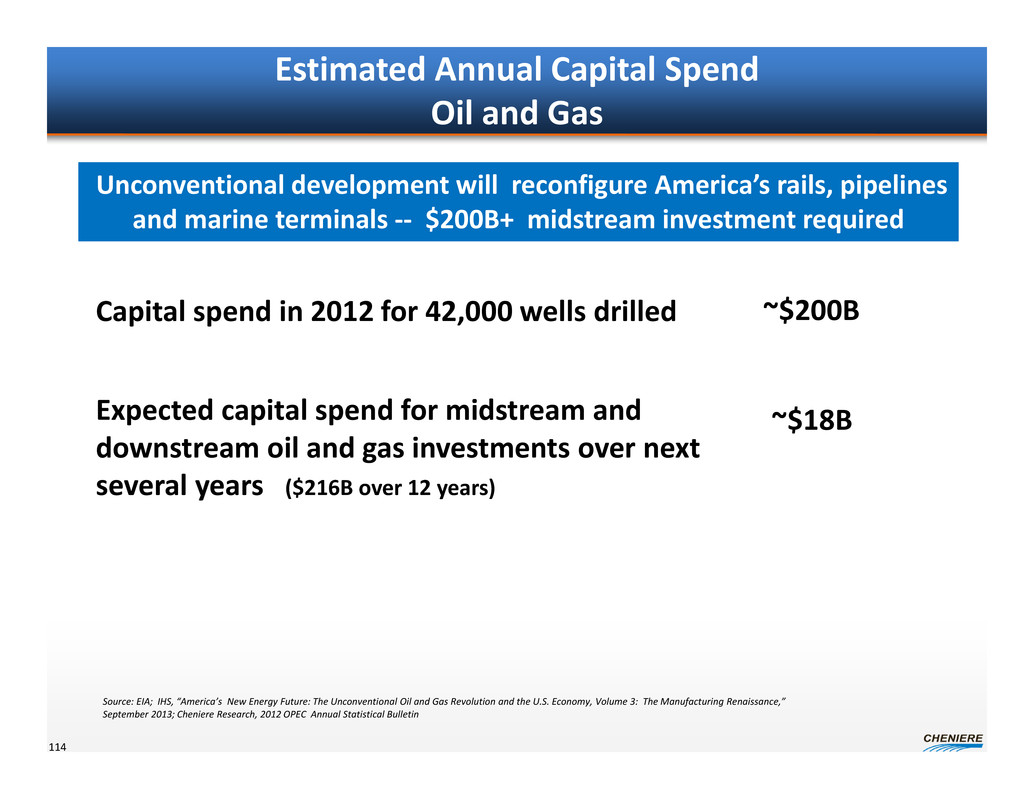
Capital spend in 2012 for 42,000 wells drilled ~$200B Expected capital spend for midstream and downstream oil and gas investments over next several years ($216B over 12 years) ~$18B Source: EIA; IHS, “America’s New Energy Future: The Unconventional Oil and Gas Revolution and the U.S. Economy, Volume 3: The Manufacturing Renaissance,” September 2013; Cheniere Research, 2012 OPEC Annual Statistical Bulletin Estimated Annual Capital Spend Oil and Gas Unconventional development will reconfigure America’s rails, pipelines and marine terminals ‐‐ $200B+ midstream investment required 114
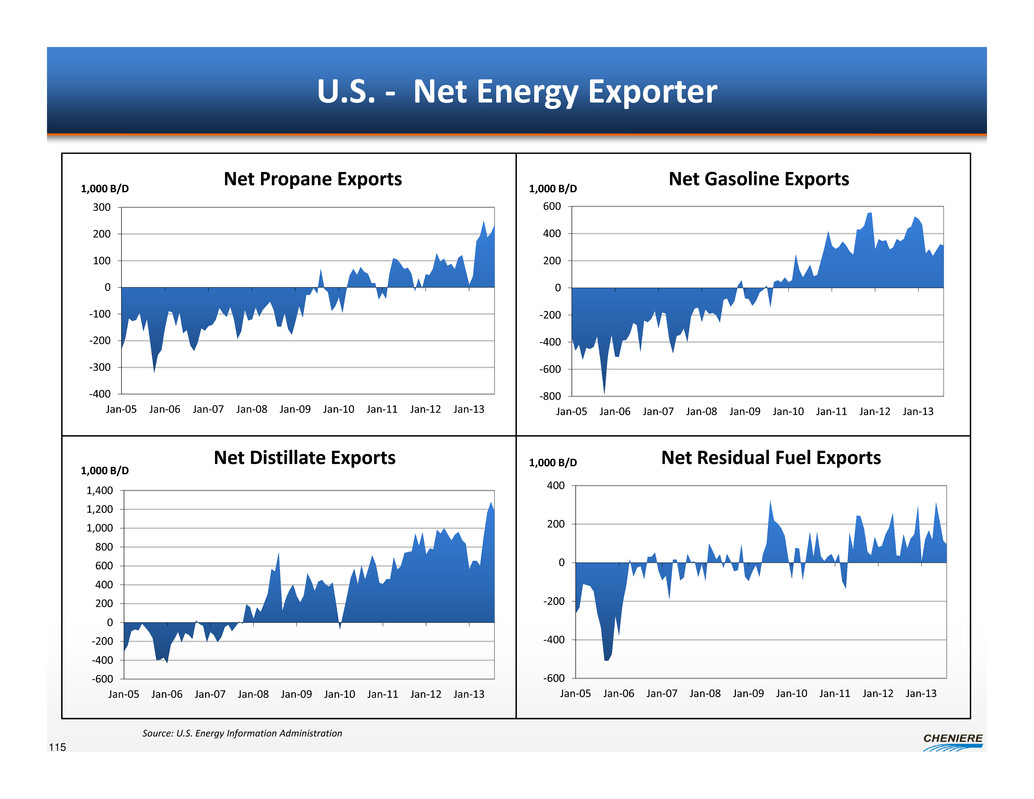
U.S. ‐ Net Energy Exporter ‐400 ‐300 ‐200 ‐100 0 100 200 300 Jan‐05 Jan‐06 Jan‐07 Jan‐08 Jan‐09 Jan‐10 Jan‐11 Jan‐12 Jan‐13 ‐800 ‐600 ‐400 ‐200 0 200 400 600 Jan‐05 Jan‐06 Jan‐07 Jan‐08 Jan‐09 Jan‐10 Jan‐11 Jan‐12 Jan‐13 ‐600 ‐400 ‐200 0 200 400 600 800 1,000 1,200 1,400 Jan‐05 Jan‐06 Jan‐07 Jan‐08 Jan‐09 Jan‐10 Jan‐11 Jan‐12 Jan‐13 115 Net Propane Exports 1,000 B/D 1,000 B/D Net Gasoline Exports Net Distillate Exports 1,000 B/D Net Residual Fuel Exports Source: U.S. Energy Information Administration ‐600 ‐400 ‐200 0 200 400 Jan‐05 Jan‐06 Jan‐07 Jan‐08 Jan‐09 Jan‐10 Jan‐11 Jan‐12 Jan‐13 1,000 B/D

Build‐up of NGLs Coming Source: Ponderosa Energy Advisors LLC Projected NGL Production 5,000 4,500 4,000 3,500 3,000 2,500 2,000 1,500 1,000 500 0 P r o j e c t e d P r o d u c t i o n ( M B b l d ) A ctive R ig Count 2,100 2,050 2,000 1,950 1,900 1,850 1,800 1,750 1,700 1,650 1,600 116

In Summary Expect 2‐3 MMBoe to be available for export based on current drilling Investment of $100‐$150B needed to support these exports Domestically, no one is paying attention 117 U.S. will need new export infrastructure Source: Cheniere estimates

Cheniere Strategy 118 2014: De‐risk Corpus Christi 2015: De‐risk Sabine Pass T5 & 6 Focus on next high return opportunities
2014 ‐ 2018 LTI Plan

2014‐2018 Long Term Incentive Plan 2014‐2018 LTIP is a 100% performance‐based equity incentive plan Designed to align the interests of stockholders and the Company Incentivizes management and employees to develop future projects and to continue to generate strong shareholder returns Retention tool during a crucial period Employees are compensated with base salary, annual cash awards and equity participation Replaces the 2011‐2013 Bonus Plan that expired in 2013 120 Aligns shareholders and Company, focused on shareholder returns Note: See 8‐K filed January 30, 2014 for more details, plan document attached to the 8‐K.

Key Features of the 2014‐2018 LTI Plan Awards completely dependent on total shareholder return (“TSR”) • If TSR is more than 9% then 10% of the increase is shared • No awards if TSR is less than 8%. • A pro rata portion is shared between 8% and 9% Three hurdles ensure the Company is rewarded only when shareholders are too • Annual TSR hurdle of 8% • Cumulative annualized TSR hurdle of 8% • High water mark ensures only new value creation is shared with the Company Percentage of new value shared with management and employees • Potential dilution over life of the Plan is expected to be between 1% and 2% annually • Even less than that when considering the impact of net share settlement Five year performance plan with eight year vesting schedule • Grants made annually over 5 years • Each grant vests in 4 installments, ¼ immediately and then annually over three years 121 Note: See 8‐K filed January 30, 2014 for more details, plan document attached to the 8‐K.
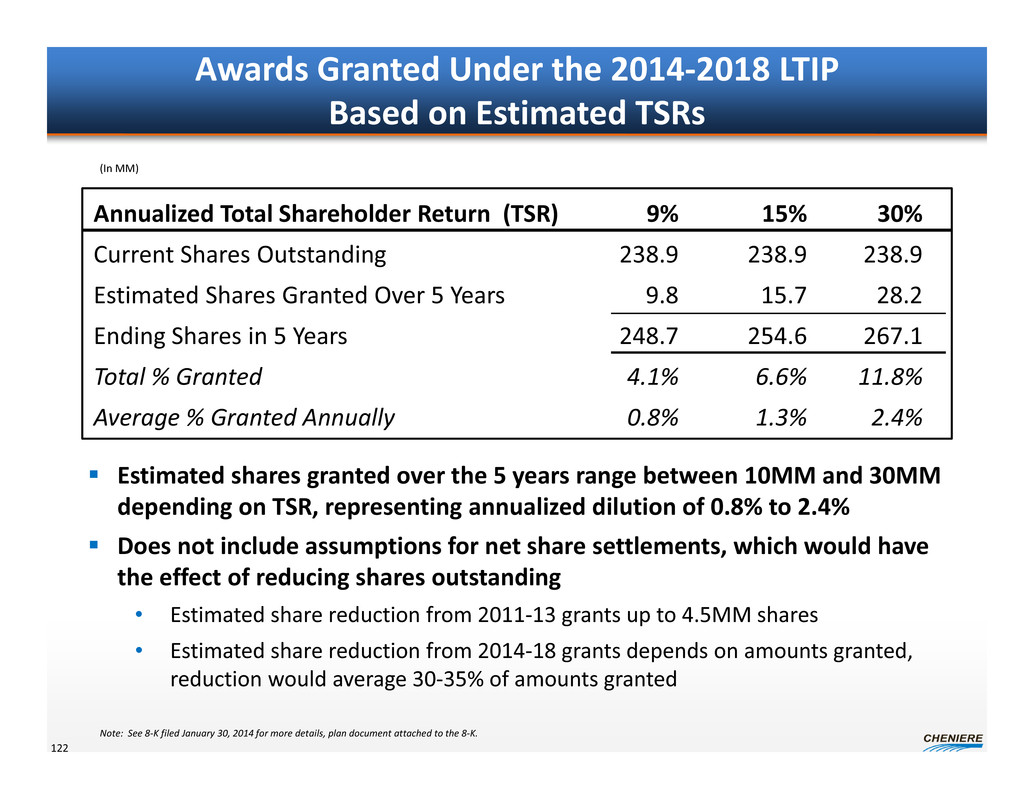
Awards Granted Under the 2014‐2018 LTIP Based on Estimated TSRs 122 Estimated shares granted over the 5 years range between 10MM and 30MM depending on TSR, representing annualized dilution of 0.8% to 2.4% Does not include assumptions for net share settlements, which would have the effect of reducing shares outstanding • Estimated share reduction from 2011‐13 grants up to 4.5MM shares • Estimated share reduction from 2014‐18 grants depends on amounts granted, reduction would average 30‐35% of amounts granted Annualized Total Shareholder Return (TSR) 9% 15% 30% Current Shares Outstanding 238.9 238.9 238.9 Estimated Shares Granted Over 5 Years 9.8 15.7 28.2 Ending Shares in 5 Years 248.7 254.6 267.1 Total % Granted 4.1% 6.6% 11.8% Average % Granted Annually 0.8% 1.3% 2.4% (In MM) Note: See 8‐K filed January 30, 2014 for more details, plan document attached to the 8‐K.
