Fifth Third Bancorp Investor Day December 7, 2017 Exhibit 99.1
Firm Overview Greg D. Carmichael President & Chief Executive Officer 1
Cautionary statement This presentation contains statements that we believe are “forward-looking statements” within the meaning of Section 27A of the Securities Act of 1933, as amended, and Rule 175 promulgated thereunder, and Section 21E of the Securities Exchange Act of 1934, as amended, and Rule 3b-6 promulgated thereunder. These statements relate to our financial condition, results of operations, plans, objectives, future performance or business. They usually can be identified by the use of forward-looking language such as “will likely result,” “may,” “are expected to,” “is anticipated,” “potential,” “estimate,” “forecast,” “projected,” “intends to,” or may include other similar words or phrases such as “believes,” “plans,” “trend,” “objective,” “continue,” “remain,” or similar expressions, or future or conditional verbs such as “will,” “would,” “should,” “could,” “might,” “can,” or similar verbs. You should not place undue reliance on these statements, as they are subject to risks and uncertainties, including but not limited to the risk factors set forth in our most recent Annual Report on Form 10-K, as updated by our Quarterly Reports on Form 10-Q. When considering these forward-looking statements, you should keep in mind these risks and uncertainties, as well as any cautionary statements we may make. Moreover, you should treat these statements as speaking only as of the date they are made and based only on information then actually known to us. We undertake no obligation to release revisions to these forward-looking statements or reflect events or circumstances after the date of this document. There are a number of important factors that could cause future results to differ materially from historical performance and these forward-looking statements. Factors that might cause such a difference include, but are not limited to: (1) general economic or real estate market conditions, either nationally or in the states in which Fifth Third, one or more acquired entities and/or the combined company do business, weaken or are less favorable than expected; (2) deteriorating credit quality; (3) political developments, wars or other hostilities may disrupt or increase volatility in securities markets or other economic conditions; (4) changes in the interest rate environment reduce interest margins; (5) prepayment speeds, loan origination and sale volumes, charge-offs and loan loss provisions; (6) Fifth Third’s ability to maintain required capital levels and adequate sources of funding and liquidity; (7) maintaining capital requirements and adequate sources of funding and liquidity may limit Fifth Third’s operations and potential growth; (8) changes and trends in capital markets; (9) problems encountered by larger or similar financial institutions may adversely affect the banking industry and/or Fifth Third; (10) competitive pressures among depository institutions increase significantly; (11) changes in customer preferences or information technology systems; (12) effects of critical accounting policies and judgments; (13) changes in accounting policies or procedures as may be required by the Financial Accounting Standards Board (FASB) or other regulatory agencies; (14) legislative or regulatory changes or actions, or significant litigation, adversely affect Fifth Third, one or more acquired entities and/or the combined company or the businesses in which Fifth Third, one or more acquired entities and/or the combined company are engaged, including the Dodd-Frank Wall Street Reform and Consumer Protection Act; (15) ability to maintain favorable ratings from rating agencies; (16) failure of models or risk management systems or controls; (17) fluctuation of Fifth Third’s stock price; (18) ability to attract and retain key personnel; (19) ability to receive dividends from its subsidiaries; (20) potentially dilutive effect of future acquisitions on current shareholders’ ownership of Fifth Third; (21) declines in the value of Fifth Third’s goodwill or other intangible assets; (22) effects of accounting or financial results of one or more acquired entities; (23) difficulties from Fifth Third’s investment in, relationship with, and nature of the operations of Vantiv Holding, LLC; (24) loss of income from any sale or potential sale of businesses; (25) difficulties in separating the operations of any branches or other assets divested; (26) losses or adverse impacts on the carrying values of branches and long-lived assets in connection with their sales or anticipated sales; (27) inability to achieve expected benefits from branch consolidations and planned sales within desired timeframes, if at all; (28) ability to secure confidential information and deliver products and services through the use of computer systems and telecommunications networks; (29) the negotiation and (if any) implementation by Vantiv, Inc. and/or Worldpay Group plc of the potential acquisition of Worldpay Group plc by Vantiv, Inc. and such other actions as Vantiv, Inc. and Worldpay Group plc may take in furtherance thereof; and (30) the impact of reputational risk created by these developments on such matters as business generation and retention, funding and liquidity. You should refer to our periodic and current reports filed with the Securities and Exchange Commission, or “SEC,” for further information on other factors, which could cause actual results to be significantly different from those expressed or implied by these forward-looking statements. In this presentation, we may sometimes provide non-GAAP financial information. Please note that although non-GAAP financial measures provide useful insight to analysts, investors and regulators, they should not be considered in isolation or relied upon as a substitute for analysis using GAAP measures. If applicable, we provide GAAP reconciliations for non-GAAP measures in a later slide in this presentation which is also available in the investor relations section of our website, www.53.com. 2
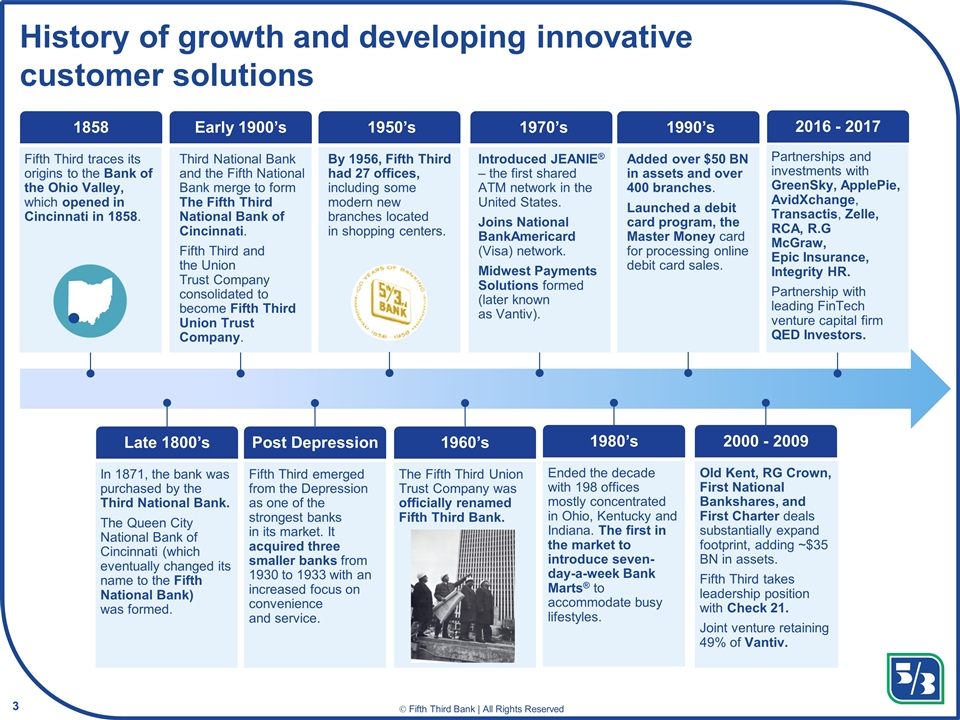
History of growth and developing innovative customer solutions 3 Fifth Third traces its origins to the Bank of the Ohio Valley, which opened in Cincinnati in 1858. 1858 In 1871, the bank was purchased by the Third National Bank. The Queen City National Bank of Cincinnati (which eventually changed its name to the Fifth National Bank) was formed. Late 1800’s Third National Bank and the Fifth National Bank merge to form The Fifth Third National Bank of Cincinnati. Fifth Third and the Union Trust Company consolidated to become Fifth Third Union Trust Company. Early 1900’s Fifth Third emerged from the Depression as one of the strongest banks in its market. It acquired three smaller banks from 1930 to 1933 with an increased focus on convenience and service. Post Depression By 1956, Fifth Third had 27 offices, including some modern new branches located in shopping centers. 1950’s The Fifth Third Union Trust Company was officially renamed Fifth Third Bank. 1960’s Partnerships and investments with GreenSky, ApplePie, AvidXchange, Transactis, Zelle, RCA, R.G McGraw, Epic Insurance, Integrity HR. Partnership with leading FinTech venture capital firm QED Investors. 2016 - 2017 Old Kent, RG Crown, First National Bankshares, and First Charter deals substantially expand footprint, adding ~$35 BN in assets. Fifth Third takes leadership position with Check 21. Joint venture retaining 49% of Vantiv. 2000 - 2009 Added over $50 BN in assets and over 400 branches. Launched a debit card program, the Master Money card for processing online debit card sales. 1990’s Ended the decade with 198 offices mostly concentrated in Ohio, Kentucky and Indiana. The first in the market to introduce seven-day-a-week Bank Marts® to accommodate busy lifestyles. 1980’s Introduced JEANIE® – the first shared ATM network in the United States. Joins National BankAmericard (Visa) network. Midwest Payments Solutions formed (later known as Vantiv). 1970’s
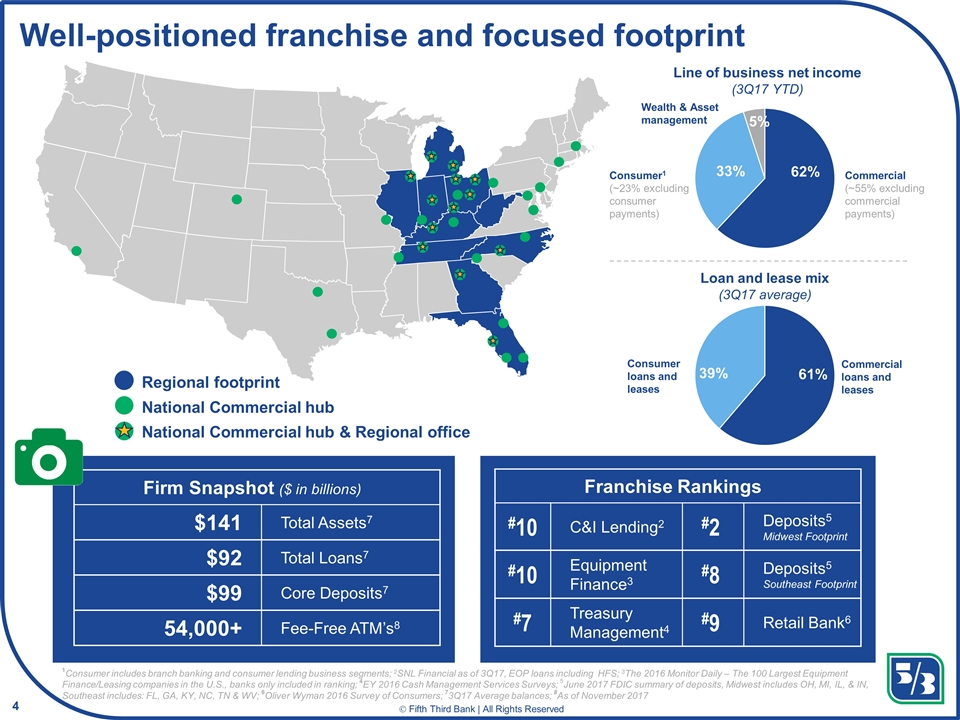
Well-positioned franchise and focused footprint 1Consumer includes branch banking and consumer lending business segments; 2SNL Financial as of 3Q17, EOP loans including HFS; 3The 2016 Monitor Daily – The 100 Largest Equipment Finance/Leasing companies in the U.S., banks only included in ranking; 4EY 2016 Cash Management Services Surveys; 5June 2017 FDIC summary of deposits, Midwest includes OH, MI, IL, & IN, Southeast includes: FL, GA, KY, NC, TN & WV; 6Oliver Wyman 2016 Survey of Consumers; 73Q17 Average balances; 8As of November 2017 4 Firm Snapshot ($ in billions) $141 Total Assets7 $92 Total Loans7 $99 Core Deposits7 54,000+ Fee-Free ATM’s8 Franchise Rankings #10 C&I Lending2 #2 Deposits5 Midwest Footprint #10 Equipment Finance3 #8 Deposits5 Southeast Footprint #7 Treasury Management4 #9 Retail Bank6 Regional footprint National Commercial hub Commercial loans and leases Consumer loans and leases Commercial (~55% excluding commercial payments) Consumer1 (~23% excluding consumer payments) Wealth & Asset management Line of business net income (3Q17 YTD) Loan and lease mix (3Q17 average) National Commercial hub & Regional office
Transparency of key objectives and expectations Highlight our ability to execute Opportunity to meet the broader Fifth Third management team Inaugural investor day – why now? 5
Building a franchise that will allow us to perform well through business cycles Assembled a team of experienced leaders that deliver results, think strategically, and operate at an accelerated “pace of play” Leveraging data, technology, strategic partnerships, and agile methodology to deliver solutions that increase revenue and drive efficiencies What is different about Fifth Third today? 6
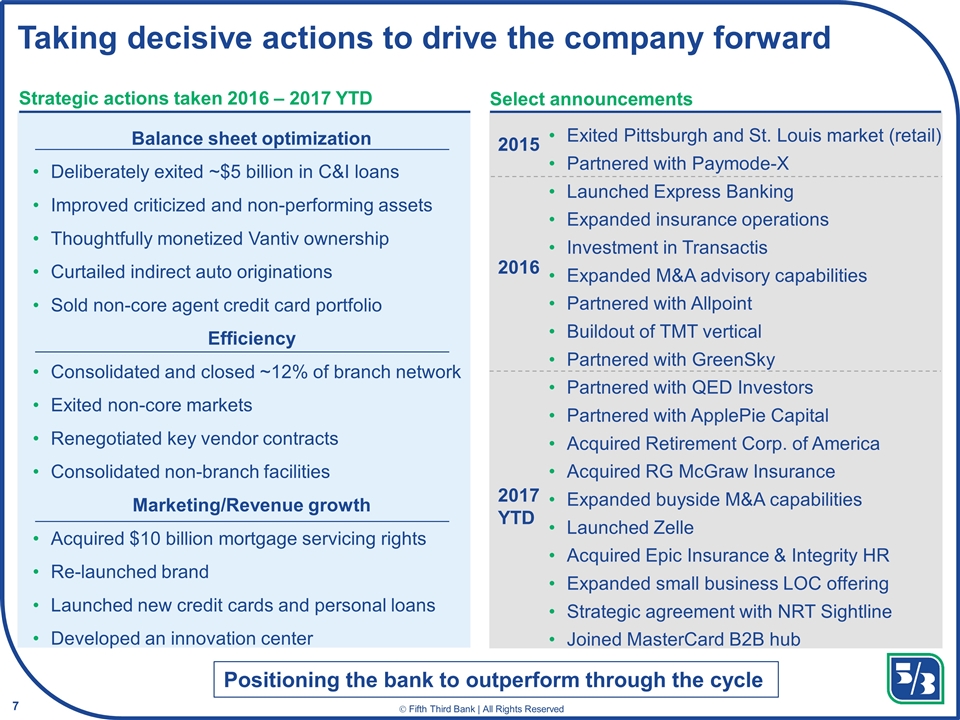
Taking decisive actions to drive the company forward Balance sheet optimization Deliberately exited ~$5 billion in C&I loans Improved criticized and non-performing assets Thoughtfully monetized Vantiv ownership Curtailed indirect auto originations Sold non-core agent credit card portfolio Efficiency Consolidated and closed ~12% of branch network Exited non-core markets Renegotiated key vendor contracts Consolidated non-branch facilities Marketing/Revenue growth Acquired $10 billion mortgage servicing rights Re-launched brand Launched new credit cards and personal loans Developed an innovation center Select announcements 2015 Strategic actions taken 2016 – 2017 YTD Exited Pittsburgh and St. Louis market (retail) Partnered with Paymode-X Launched Express Banking Expanded insurance operations Investment in Transactis Expanded M&A advisory capabilities Partnered with Allpoint Buildout of TMT vertical Partnered with GreenSky Partnered with QED Investors Partnered with ApplePie Capital Acquired Retirement Corp. of America Acquired RG McGraw Insurance Expanded buyside M&A capabilities Launched Zelle Acquired Epic Insurance & Integrity HR Expanded small business LOC offering Strategic agreement with NRT Sightline Joined MasterCard B2B hub 2016 2017 YTD Positioning the bank to outperform through the cycle 7
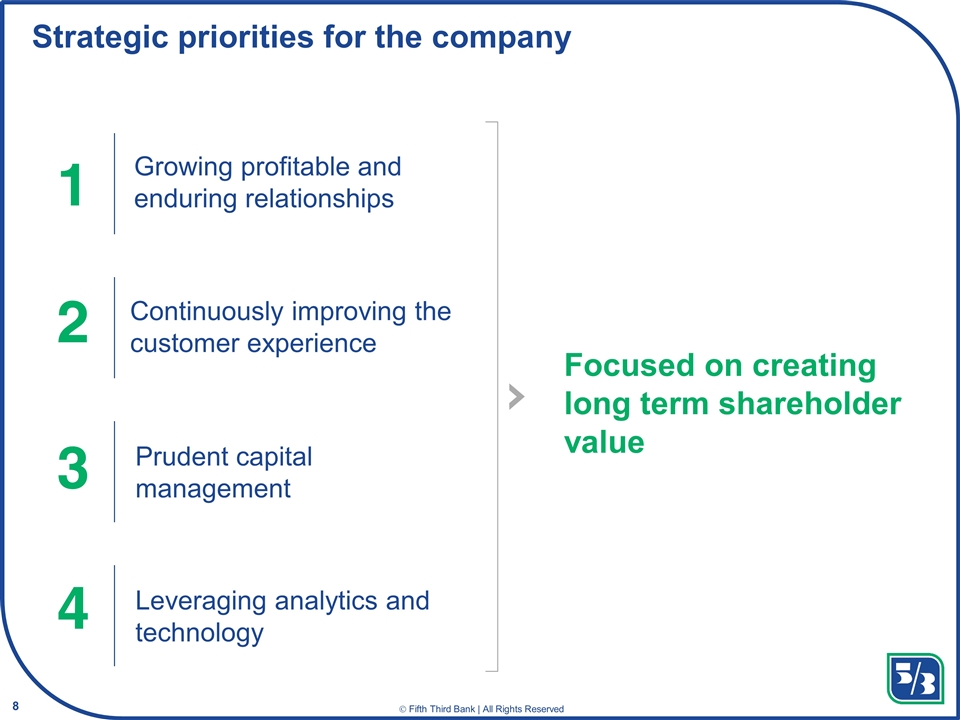
Strategic priorities for the company 1 2 3 Growing profitable and enduring relationships Continuously improving the customer experience 4 Leveraging analytics and technology Prudent capital management Focused on creating long term shareholder value 8
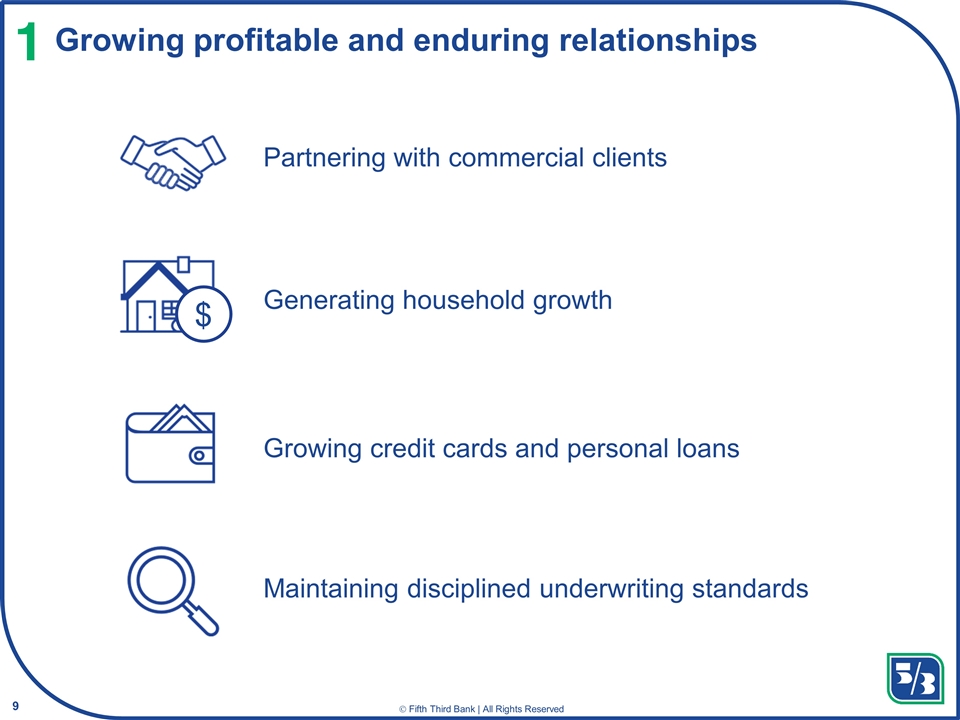
Growing profitable and enduring relationships Partnering with commercial clients Maintaining disciplined underwriting standards Growing credit cards and personal loans Generating household growth 1 $ 9
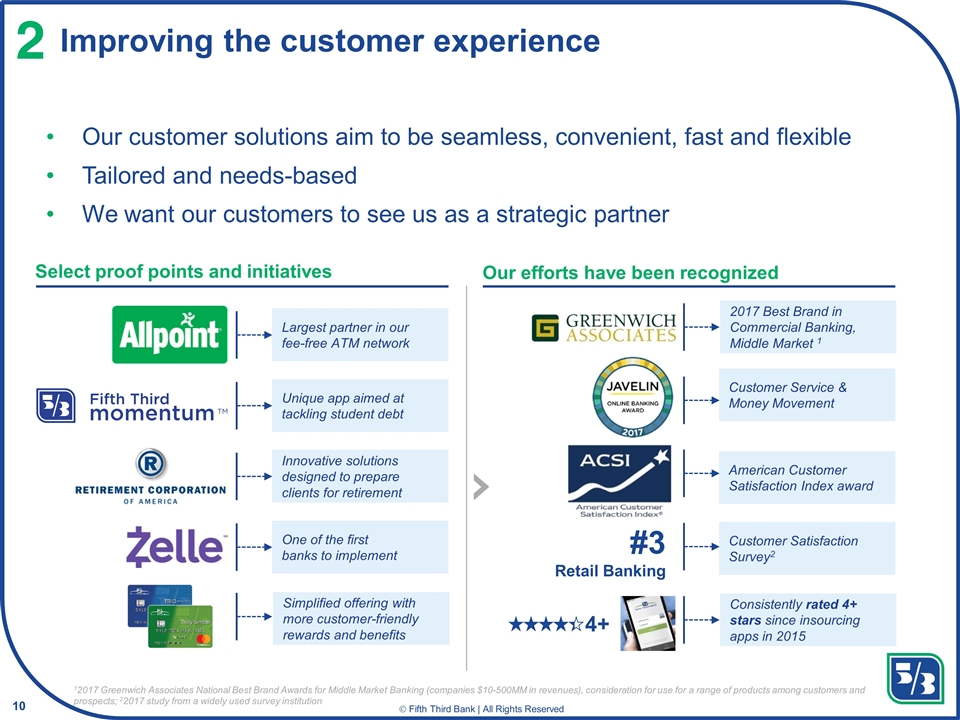
Improving the customer experience Our customer solutions aim to be seamless, convenient, fast and flexible Tailored and needs-based We want our customers to see us as a strategic partner 2 4+ #3 Retail Banking 12017 Greenwich Associates National Best Brand Awards for Middle Market Banking (companies $10-500MM in revenues), consideration for use for a range of products among customers and prospects; 22017 study from a widely used survey institution Largest partner in our fee-free ATM network Unique app aimed at tackling student debt Innovative solutions designed to prepare clients for retirement One of the first banks to implement Simplified offering with more customer-friendly rewards and benefits Select proof points and initiatives American Customer Satisfaction Index award Customer Satisfaction Survey2 Consistently rated 4+ stars since insourcing apps in 2015 Customer Service & Money Movement 2017 Best Brand in Commercial Banking, Middle Market 1 Our efforts have been recognized 10
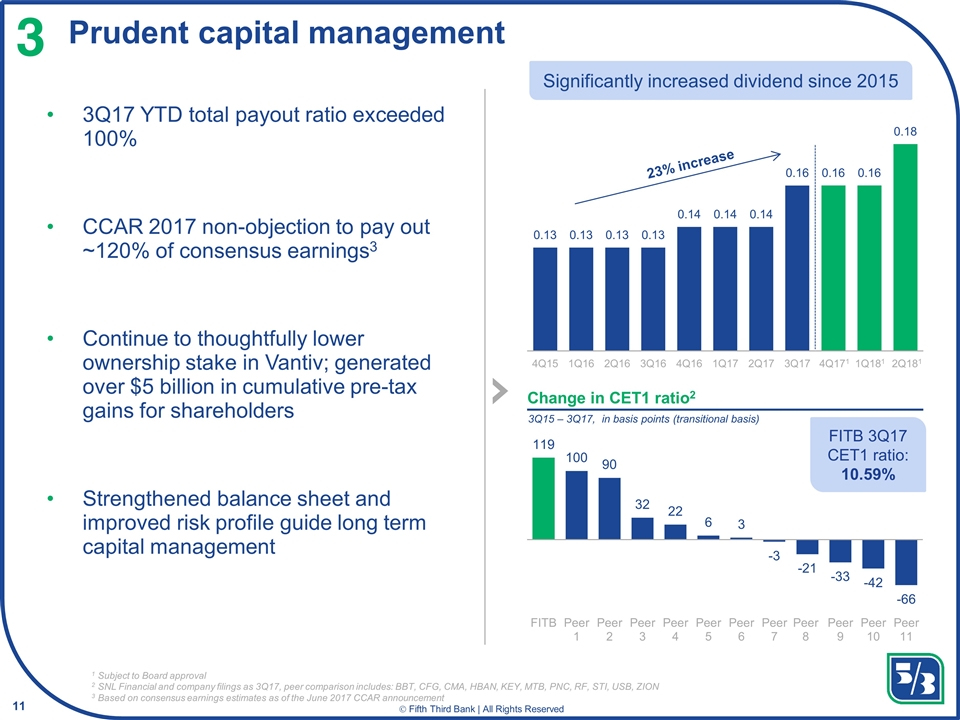
Prudent capital management 3 3Q17 YTD total payout ratio exceeded 100% CCAR 2017 non-objection to pay out ~120% of consensus earnings3 Continue to thoughtfully lower ownership stake in Vantiv; generated over $5 billion in cumulative pre-tax gains for shareholders Strengthened balance sheet and improved risk profile guide long term capital management Significantly increased dividend since 2015 1 Subject to Board approval 2 SNL Financial and company filings as 3Q17, peer comparison includes: BBT, CFG, CMA, HBAN, KEY, MTB, PNC, RF, STI, USB, ZION 3 Based on consensus earnings estimates as of the June 2017 CCAR announcement Change in CET1 ratio2 3Q15 – 3Q17, in basis points (transitional basis) 4Q171 1Q181 2Q181 FITB 3Q17 CET1 ratio: 10.59% 11
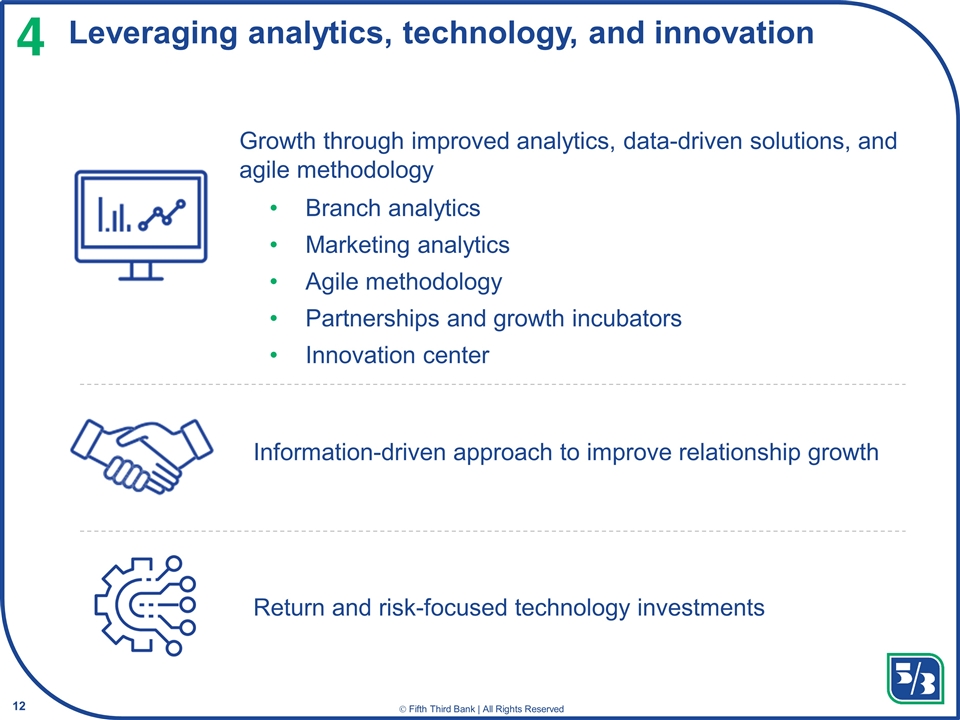
Leveraging analytics, technology, and innovation Return and risk-focused technology investments 4 Growth through improved analytics, data-driven solutions, and agile methodology Branch analytics Marketing analytics Agile methodology Partnerships and growth incubators Innovation center Information-driven approach to improve relationship growth 12
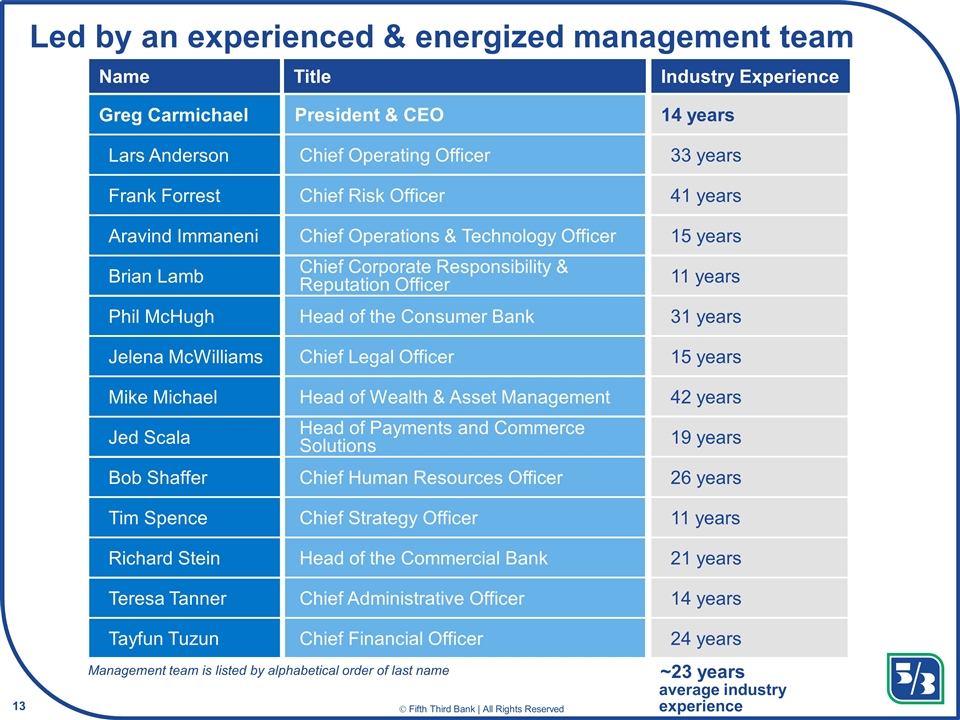
Led by an experienced & energized management team Management team is listed by alphabetical order of last name Name Title Industry Experience Greg Carmichael President & CEO 14 years Lars Anderson Chief Operating Officer 33 years Frank Forrest Chief Risk Officer 41 years Aravind Immaneni Chief Operations & Technology Officer 15 years Phil McHugh Head of the Consumer Bank 31 years Jelena McWilliams Chief Legal Officer 15 years Mike Michael Head of Wealth & Asset Management 42 years Bob Shaffer Chief Human Resources Officer 26 years Tim Spence Chief Strategy Officer 11 years Richard Stein Head of the Commercial Bank 21 years Brian Lamb Chief Corporate Responsibility & Reputation Officer 11 years Teresa Tanner Chief Administrative Officer 14 years Tayfun Tuzun Chief Financial Officer 24 years ~23 years average industry experience Jed Scala 19 years Head of Payments and Commerce Solutions 13
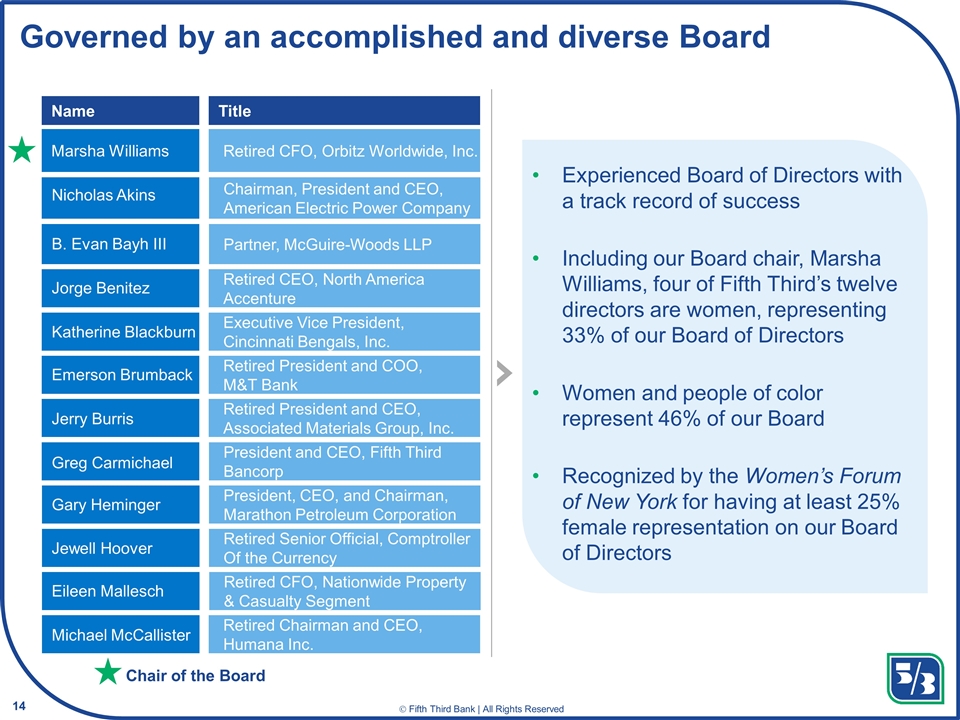
Governed by an accomplished and diverse Board Name Title Retired CFO, Orbitz Worldwide, Inc. Chairman, President and CEO, American Electric Power Company Partner, McGuire-Woods LLP Retired CEO, North America Accenture Executive Vice President, Cincinnati Bengals, Inc. Retired President and COO, M&T Bank Retired President and CEO, Associated Materials Group, Inc. President and CEO, Fifth Third Bancorp President, CEO, and Chairman, Marathon Petroleum Corporation Retired Senior Official, Comptroller Of the Currency Retired Chairman and CEO, Humana Inc. Retired CFO, Nationwide Property & Casualty Segment Marsha Williams Nicholas Akins B. Evan Bayh III Jorge Benitez Katherine Blackburn Emerson Brumback Jerry Burris Greg Carmichael Gary Heminger Jewell Hoover Eileen Mallesch Michael McCallister Chair of the Board Experienced Board of Directors with a track record of success Including our Board chair, Marsha Williams, four of Fifth Third’s twelve directors are women, representing 33% of our Board of Directors Women and people of color represent 46% of our Board Recognized by the Women’s Forum of New York for having at least 25% female representation on our Board of Directors 14
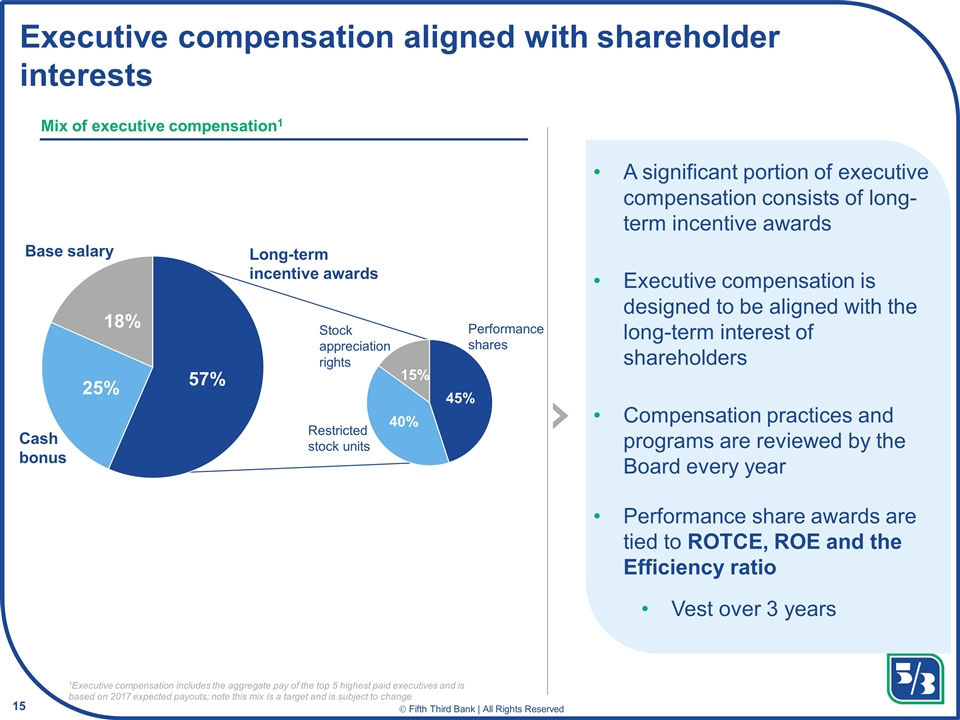
Stock appreciation rights Restricted stock units Executive compensation aligned with shareholder interests A significant portion of executive compensation consists of long-term incentive awards Executive compensation is designed to be aligned with the long-term interest of shareholders Compensation practices and programs are reviewed by the Board every year Performance share awards are tied to ROTCE, ROE and the Efficiency ratio Vest over 3 years Mix of executive compensation1 Long-term incentive awards 1Executive compensation includes the aggregate pay of the top 5 highest paid executives and is based on 2017 expected payouts; note this mix is a target and is subject to change Cash bonus Base salary Performance shares 15
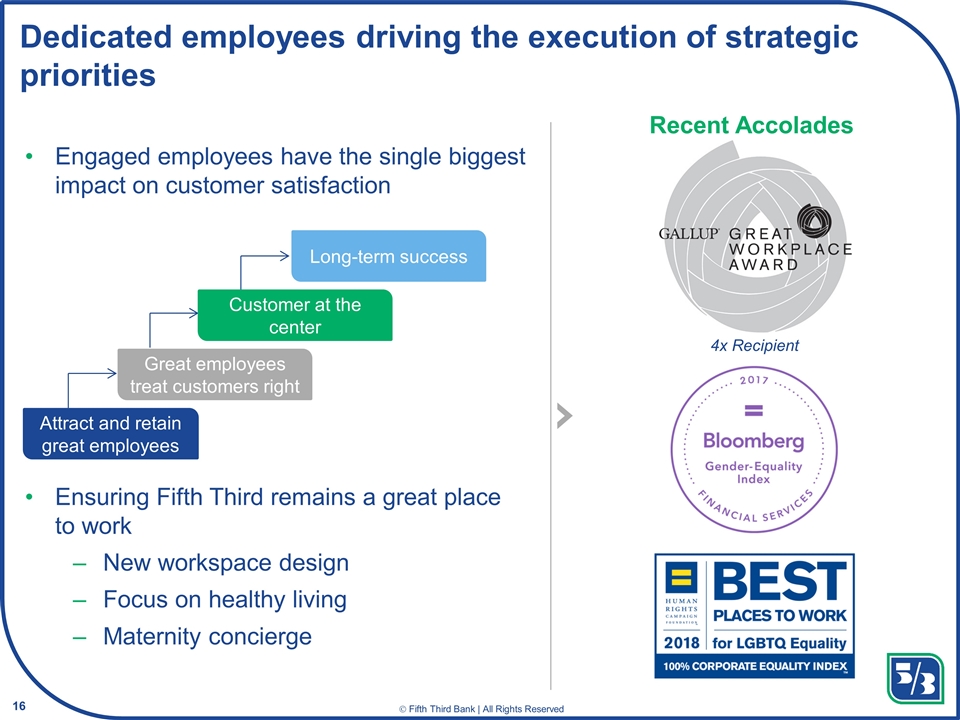
Ensuring Fifth Third remains a great place to work New workspace design Focus on healthy living Maternity concierge Dedicated employees driving the execution of strategic priorities Recent Accolades Engaged employees have the single biggest impact on customer satisfaction 4x Recipient Attract and retain great employees Great employees treat customers right Customer at the center Long-term success 16
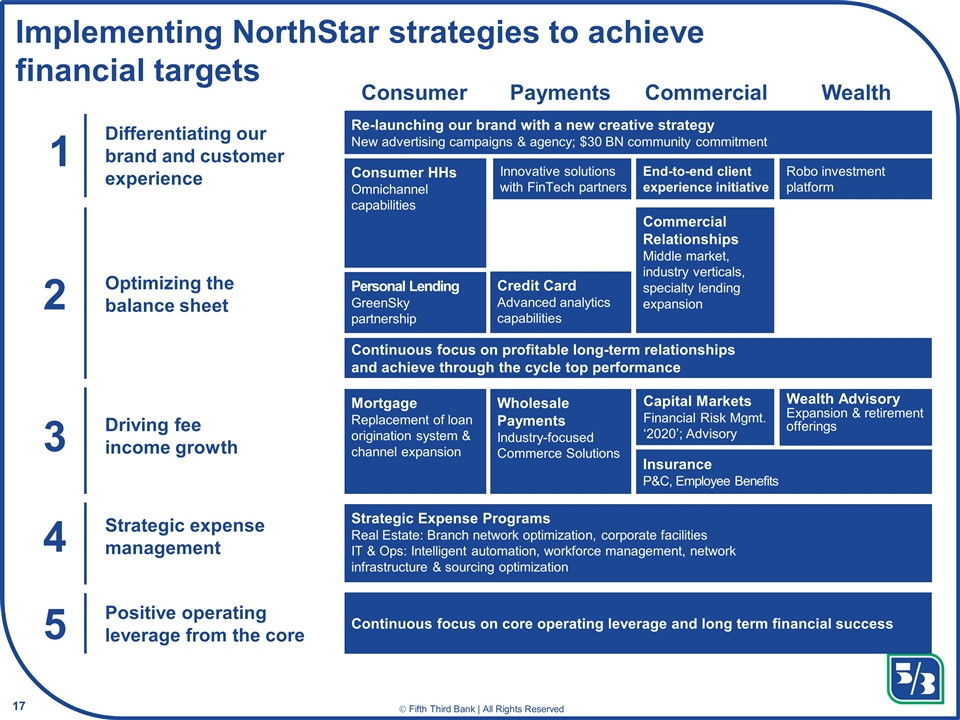
Capital Markets Financial Risk Mgmt. ‘2020’; Advisory Implementing NorthStar strategies to achieve financial targets 1 Differentiating our brand and customer experience 2 Optimizing the balance sheet Driving fee income growth 3 4 Strategic expense management Consumer Payments Commercial Wealth 5 Positive operating leverage from the core Personal Lending GreenSky partnership Credit Card Advanced analytics capabilities Wholesale Payments Industry-focused Commerce Solutions Insurance P&C, Employee Benefits Commercial Relationships Middle market, industry verticals, specialty lending expansion Wealth Advisory Expansion & retirement offerings Strategic Expense Programs Real Estate: Branch network optimization, corporate facilities IT & Ops: Intelligent automation, workforce management, network infrastructure & sourcing optimization Re-launching our brand with a new creative strategy New advertising campaigns & agency; $30 BN community commitment Consumer HHs Omnichannel capabilities Continuous focus on core operating leverage and long term financial success Mortgage Replacement of loan origination system & channel expansion Continuous focus on profitable long-term relationships and achieve through the cycle top performance End-to-end client experience initiative Robo investment platform Innovative solutions with FinTech partners 17
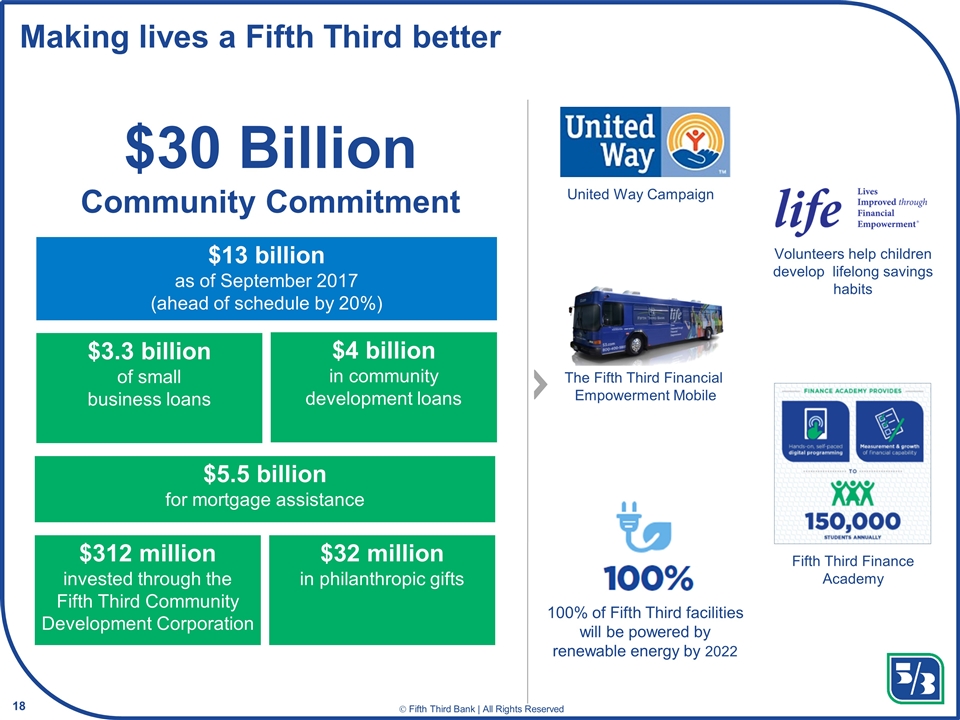
Making lives a Fifth Third better $30 Billion Community Commitment $312 million invested through the Fifth Third Community Development Corporation $13 billion as of September 2017 (ahead of schedule by 20%) $3.3 billion of small business loans $4 billion in community development loans $32 million in philanthropic gifts Volunteers help children develop lifelong savings habits United Way Campaign The Fifth Third Financial Empowerment Mobile $5.5 billion for mortgage assistance Fifth Third Finance Academy 100% of Fifth Third facilities will be powered by renewable energy by 2022 18
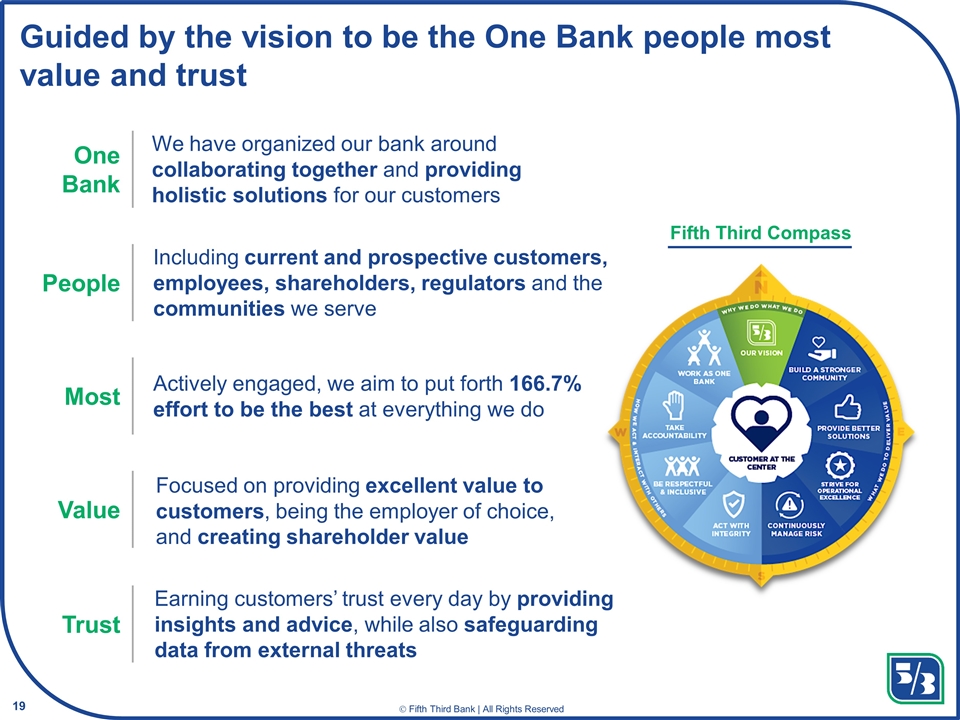
Guided by the vision to be the One Bank people most value and trust One Bank We have organized our bank around collaborating together and providing holistic solutions for our customers People Including current and prospective customers, employees, shareholders, regulators and the communities we serve Most Actively engaged, we aim to put forth 166.7% effort to be the best at everything we do Value Focused on providing excellent value to customers, being the employer of choice, and creating shareholder value Trust Earning customers’ trust every day by providing insights and advice, while also safeguarding data from external threats Fifth Third Compass 19
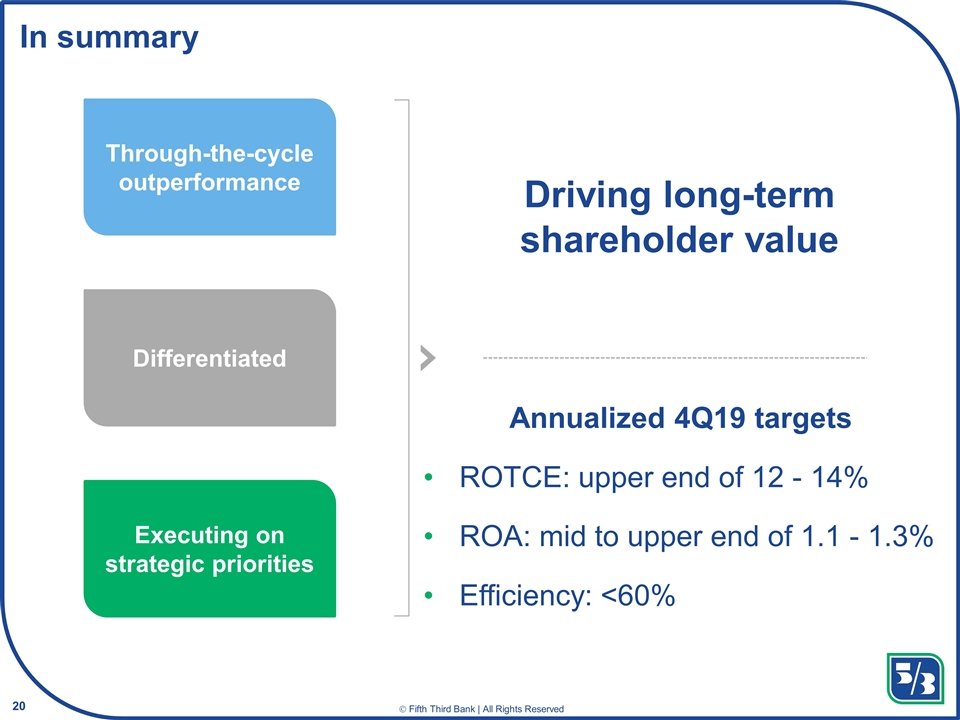
In summary Annualized 4Q19 targets ROTCE: upper end of 12 - 14% ROA: mid to upper end of 1.1 - 1.3% Efficiency: <60% Through-the-cycle outperformance Executing on strategic priorities Differentiated Driving long-term shareholder value 20
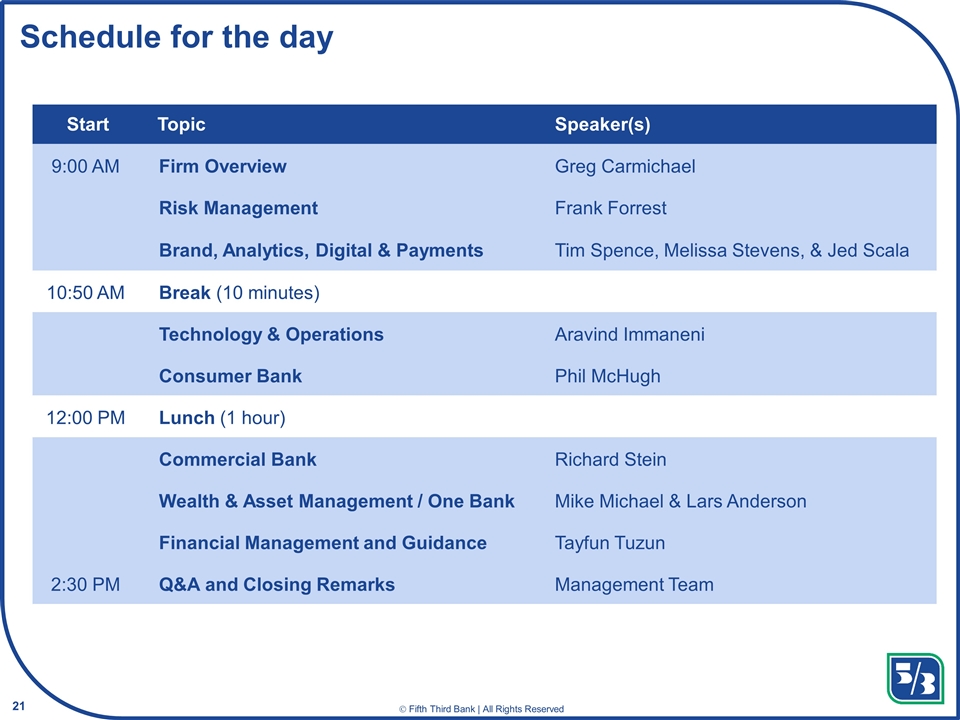
Schedule for the day Start Topic Speaker(s) 9:00 AM Firm Overview Greg Carmichael Risk Management Frank Forrest Brand, Analytics, Digital & Payments Tim Spence, Melissa Stevens, & Jed Scala 10:50 AM Break (10 minutes) Technology & Operations Aravind Immaneni Consumer Bank Phil McHugh 12:00 PM Lunch (1 hour) Commercial Bank Richard Stein Wealth & Asset Management / One Bank Mike Michael & Lars Anderson Financial Management and Guidance Tayfun Tuzun 2:30 PM Q&A and Closing Remarks Management Team 21
22
Risk Management Frank Forrest Executive Vice President Chief Risk Officer
Cautionary statement This presentation contains statements that we believe are “forward-looking statements” within the meaning of Section 27A of the Securities Act of 1933, as amended, and Rule 175 promulgated thereunder, and Section 21E of the Securities Exchange Act of 1934, as amended, and Rule 3b-6 promulgated thereunder. These statements relate to our financial condition, results of operations, plans, objectives, future performance or business. They usually can be identified by the use of forward-looking language such as “will likely result,” “may,” “are expected to,” “is anticipated,” “potential,” “estimate,” “forecast,” “projected,” “intends to,” or may include other similar words or phrases such as “believes,” “plans,” “trend,” “objective,” “continue,” “remain,” or similar expressions, or future or conditional verbs such as “will,” “would,” “should,” “could,” “might,” “can,” or similar verbs. You should not place undue reliance on these statements, as they are subject to risks and uncertainties, including but not limited to the risk factors set forth in our most recent Annual Report on Form 10-K, as updated by our Quarterly Reports on Form 10-Q. When considering these forward-looking statements, you should keep in mind these risks and uncertainties, as well as any cautionary statements we may make. Moreover, you should treat these statements as speaking only as of the date they are made and based only on information then actually known to us. We undertake no obligation to release revisions to these forward-looking statements or reflect events or circumstances after the date of this document. There are a number of important factors that could cause future results to differ materially from historical performance and these forward-looking statements. Factors that might cause such a difference include, but are not limited to: (1) general economic or real estate market conditions, either nationally or in the states in which Fifth Third, one or more acquired entities and/or the combined company do business, weaken or are less favorable than expected; (2) deteriorating credit quality; (3) political developments, wars or other hostilities may disrupt or increase volatility in securities markets or other economic conditions; (4) changes in the interest rate environment reduce interest margins; (5) prepayment speeds, loan origination and sale volumes, charge-offs and loan loss provisions; (6) Fifth Third’s ability to maintain required capital levels and adequate sources of funding and liquidity; (7) maintaining capital requirements and adequate sources of funding and liquidity may limit Fifth Third’s operations and potential growth; (8) changes and trends in capital markets; (9) problems encountered by larger or similar financial institutions may adversely affect the banking industry and/or Fifth Third; (10) competitive pressures among depository institutions increase significantly; (11) changes in customer preferences or information technology systems; (12) effects of critical accounting policies and judgments; (13) changes in accounting policies or procedures as may be required by the Financial Accounting Standards Board (FASB) or other regulatory agencies; (14) legislative or regulatory changes or actions, or significant litigation, adversely affect Fifth Third, one or more acquired entities and/or the combined company or the businesses in which Fifth Third, one or more acquired entities and/or the combined company are engaged, including the Dodd-Frank Wall Street Reform and Consumer Protection Act; (15) ability to maintain favorable ratings from rating agencies; (16) failure of models or risk management systems or controls; (17) fluctuation of Fifth Third’s stock price; (18) ability to attract and retain key personnel; (19) ability to receive dividends from its subsidiaries; (20) potentially dilutive effect of future acquisitions on current shareholders’ ownership of Fifth Third; (21) declines in the value of Fifth Third’s goodwill or other intangible assets; (22) effects of accounting or financial results of one or more acquired entities; (23) difficulties from Fifth Third’s investment in, relationship with, and nature of the operations of Vantiv Holding, LLC; (24) loss of income from any sale or potential sale of businesses; (25) difficulties in separating the operations of any branches or other assets divested; (26) losses or adverse impacts on the carrying values of branches and long-lived assets in connection with their sales or anticipated sales; (27) inability to achieve expected benefits from branch consolidations and planned sales within desired timeframes, if at all; (28) ability to secure confidential information and deliver products and services through the use of computer systems and telecommunications networks; (29) the negotiation and (if any) implementation by Vantiv, Inc. and/or Worldpay Group plc of the potential acquisition of Worldpay Group plc by Vantiv, Inc. and such other actions as Vantiv, Inc. and Worldpay Group plc may take in furtherance thereof; and (30) the impact of reputational risk created by these developments on such matters as business generation and retention, funding and liquidity. You should refer to our periodic and current reports filed with the Securities and Exchange Commission, or “SEC,” for further information on other factors, which could cause actual results to be significantly different from those expressed or implied by these forward-looking statements. In this presentation, we may sometimes provide non-GAAP financial information. Please note that although non-GAAP financial measures provide useful insight to analysts, investors and regulators, they should not be considered in isolation or relied upon as a substitute for analysis using GAAP measures. If applicable, we provide GAAP reconciliations for non-GAAP measures in a later slide in this presentation which is also available in the investor relations section of our website, www.53.com.
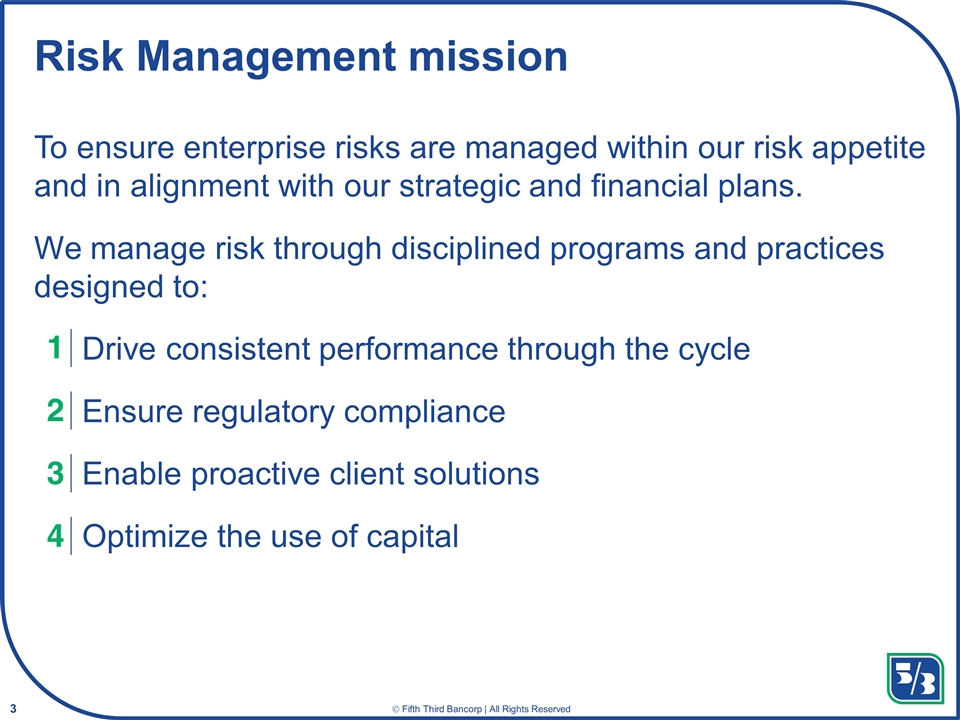
Risk Management mission To ensure enterprise risks are managed within our risk appetite and in alignment with our strategic and financial plans. We manage risk through disciplined programs and practices designed to: Drive consistent performance through the cycle Ensure regulatory compliance Enable proactive client solutions Optimize the use of capital 1 2 3 4
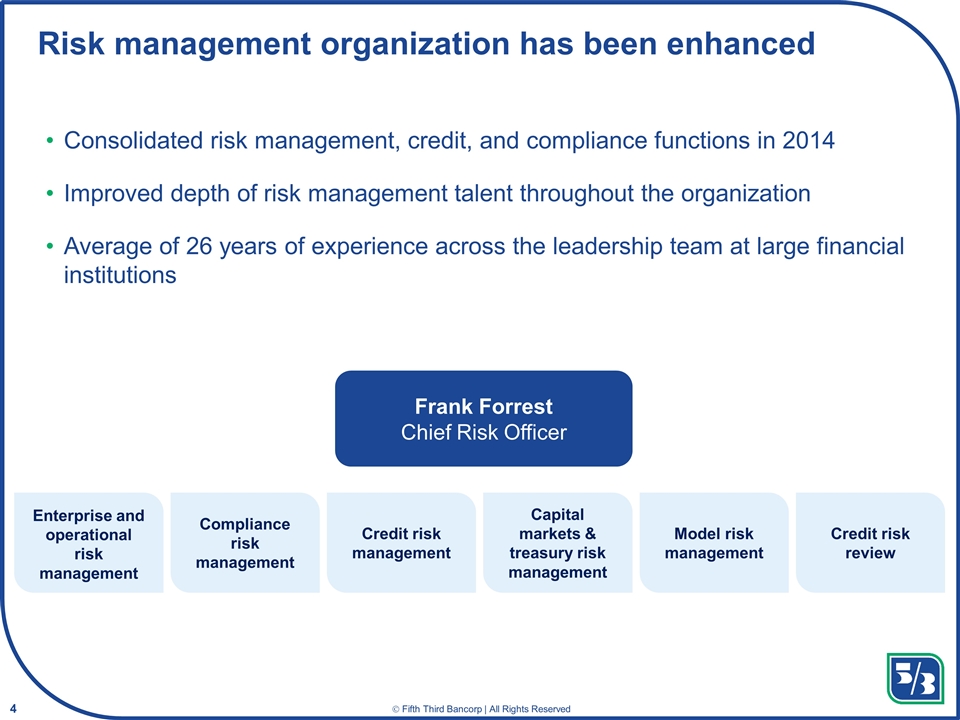
Frank Forrest Chief Risk Officer Risk management organization has been enhanced Consolidated risk management, credit, and compliance functions in 2014 Improved depth of risk management talent throughout the organization Average of 26 years of experience across the leadership team at large financial institutions Enterprise and operational risk management Compliance risk management Credit risk management Capital markets & treasury risk management Model risk management Credit risk review
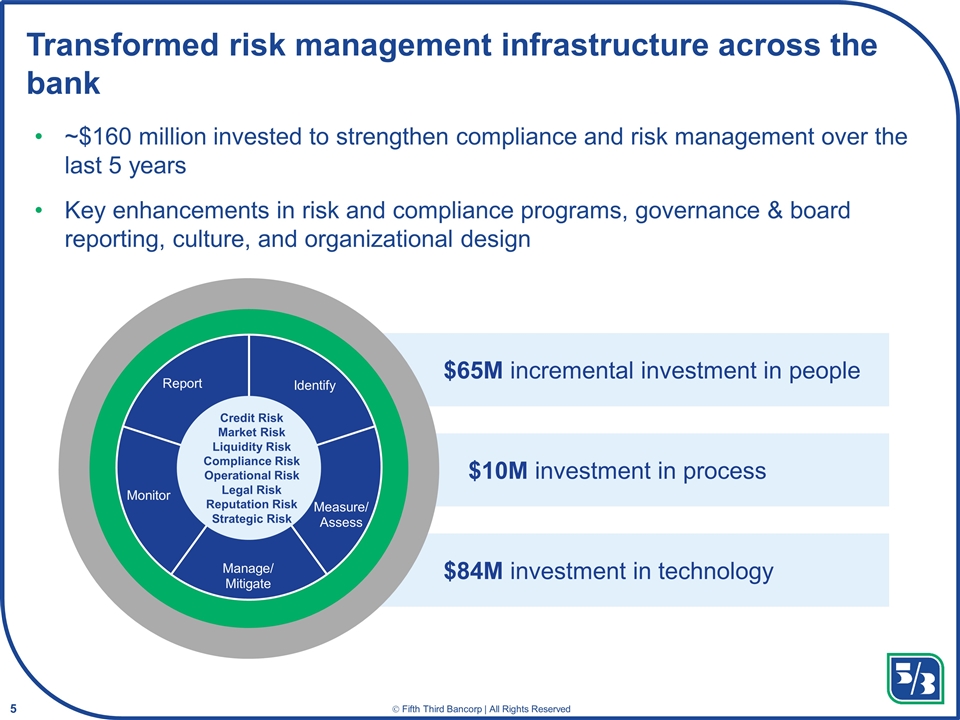
$65M incremental investment in people $10M investment in process $84M investment in technology Transformed risk management infrastructure across the bank ~$160 million invested to strengthen compliance and risk management over the last 5 years Key enhancements in risk and compliance programs, governance & board reporting, culture, and organizational design Credit Risk Market Risk Liquidity Risk Compliance Risk Operational Risk Legal Risk Reputation Risk Strategic Risk
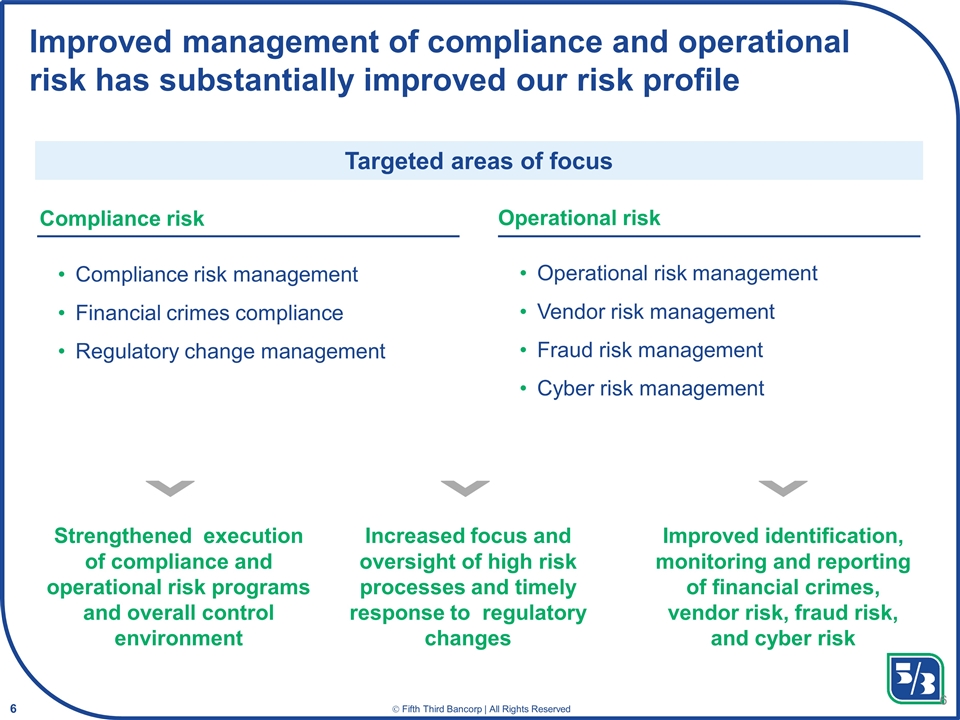
Targeted areas of focus Compliance risk Operational risk Compliance risk management Financial crimes compliance Regulatory change management Operational risk management Vendor risk management Fraud risk management Cyber risk management Improved identification, monitoring and reporting of financial crimes, vendor risk, fraud risk, and cyber risk Increased focus and oversight of high risk processes and timely response to regulatory changes Strengthened execution of compliance and operational risk programs and overall control environment Improved management of compliance and operational risk has substantially improved our risk profile
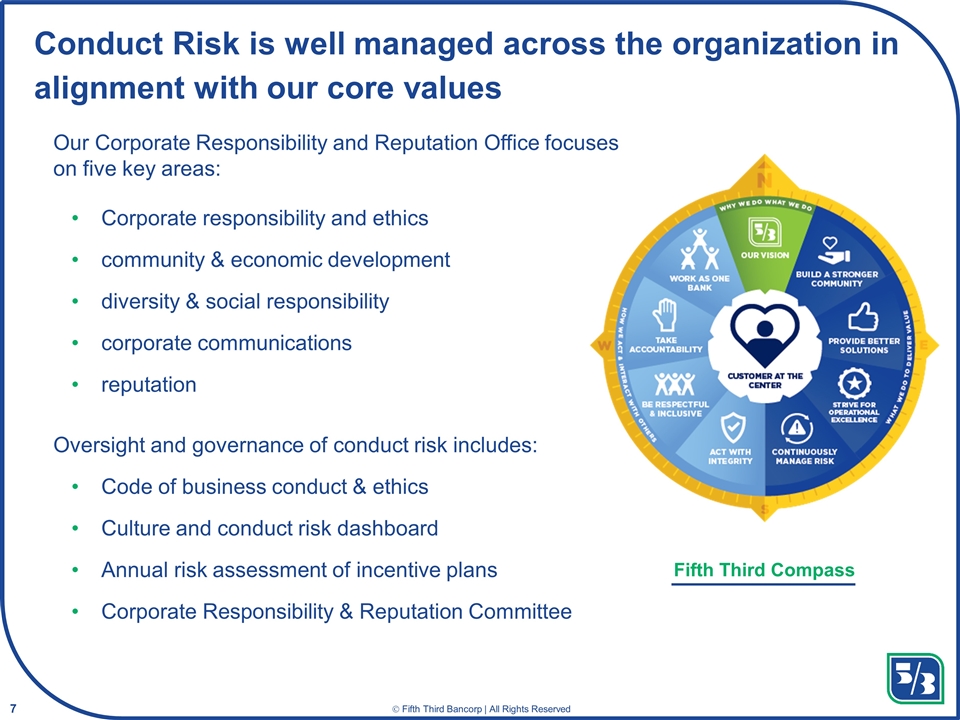
Conduct Risk is well managed across the organization in alignment with our core values Our Corporate Responsibility and Reputation Office focuses on five key areas: Corporate responsibility and ethics community & economic development diversity & social responsibility corporate communications reputation Oversight and governance of conduct risk includes: Code of business conduct & ethics Culture and conduct risk dashboard Annual risk assessment of incentive plans Corporate Responsibility & Reputation Committee Fifth Third Compass
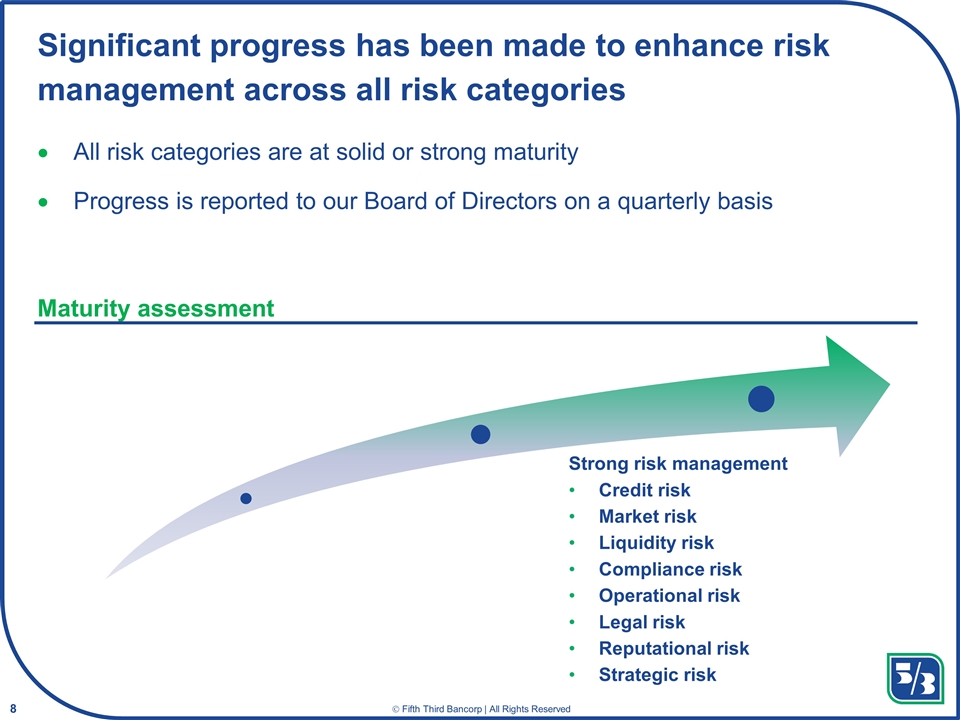
Significant progress has been made to enhance risk management across all risk categories All risk categories are at solid or strong maturity Progress is reported to our Board of Directors on a quarterly basis Strong risk management Credit risk Market risk Liquidity risk Compliance risk Operational risk Legal risk Reputational risk Strategic risk Maturity assessment
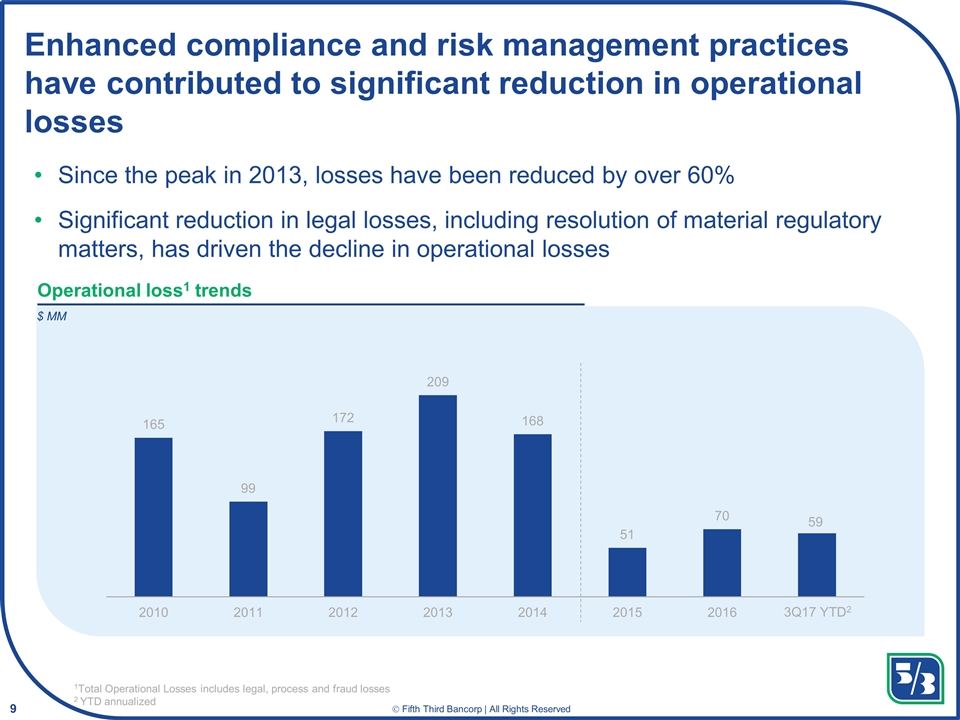
Enhanced compliance and risk management practices have contributed to significant reduction in operational losses Since the peak in 2013, losses have been reduced by over 60% Significant reduction in legal losses, including resolution of material regulatory matters, has driven the decline in operational losses 1Total Operational Losses includes legal, process and fraud losses 2 YTD annualized Operational loss1 trends 59 $ MM 3Q17 YTD2
Credit Risk Management
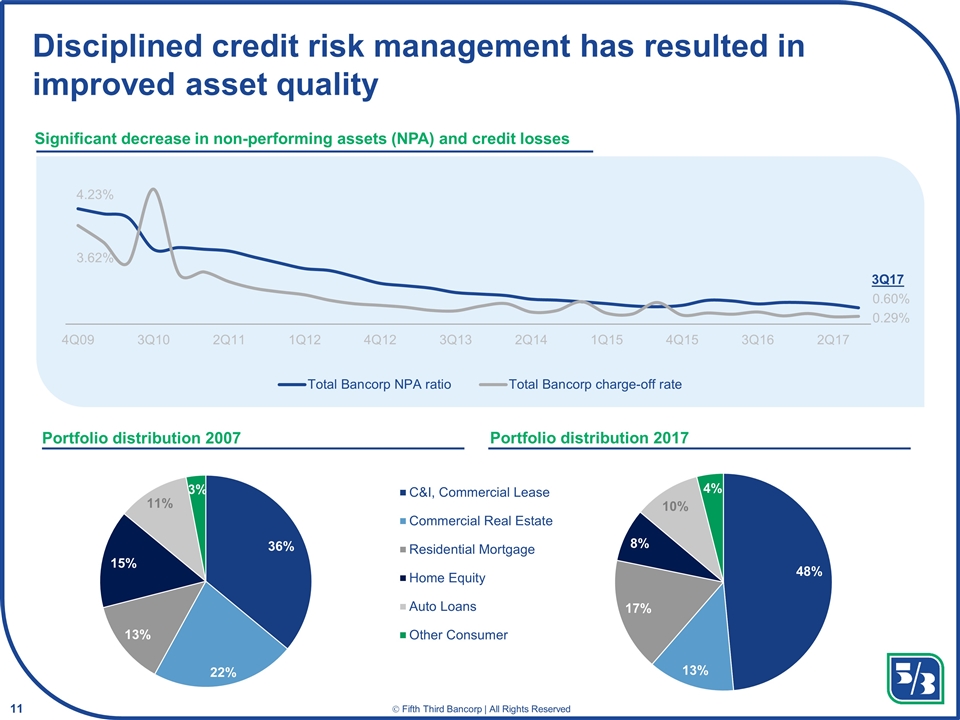
Disciplined credit risk management has resulted in improved asset quality Significant decrease in non-performing assets (NPA) and credit losses Portfolio distribution 2007 Portfolio distribution 2017 3Q17
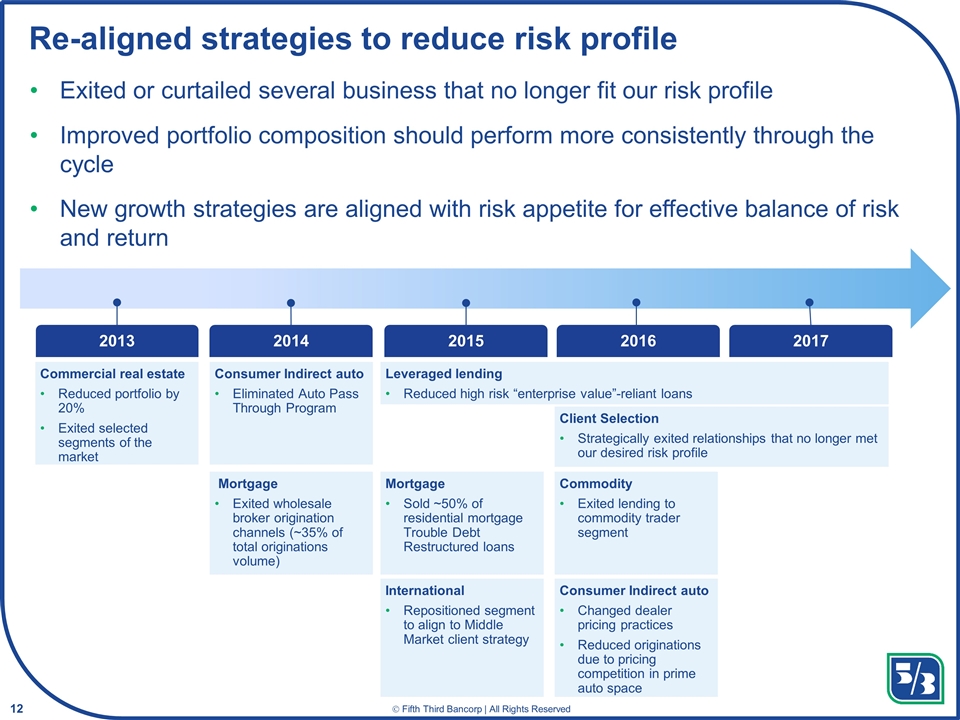
Re-aligned strategies to reduce risk profile Exited or curtailed several business that no longer fit our risk profile Improved portfolio composition should perform more consistently through the cycle New growth strategies are aligned with risk appetite for effective balance of risk and return Commercial real estate Reduced portfolio by 20% Exited selected segments of the market 2013 2014 Leveraged lending Reduced high risk “enterprise value”-reliant loans 2015 2017 2016 Consumer Indirect auto Eliminated Auto Pass Through Program Mortgage Exited wholesale broker origination channels (~35% of total originations volume) Mortgage Sold ~50% of residential mortgage Trouble Debt Restructured loans Client Selection Strategically exited relationships that no longer met our desired risk profile International Repositioned segment to align to Middle Market client strategy Consumer Indirect auto Changed dealer pricing practices Reduced originations due to pricing competition in prime auto space Commodity Exited lending to commodity trader segment
Consumer Credit
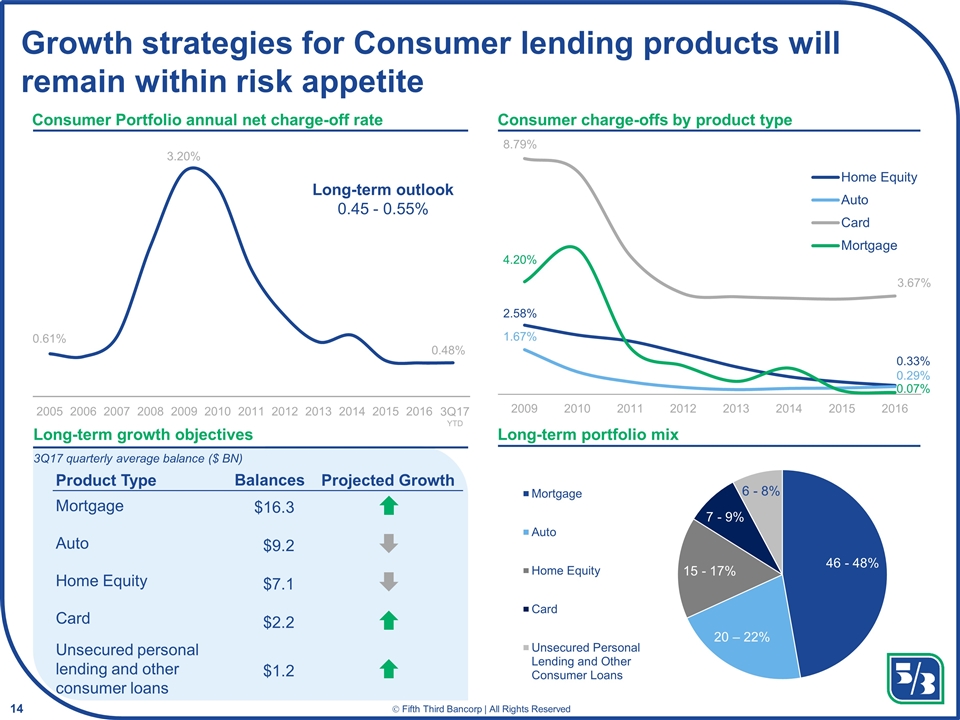
Growth strategies for Consumer lending products will remain within risk appetite Consumer Portfolio annual net charge-off rate Long-term portfolio mix Consumer charge-offs by product type Long-term outlook 0.45 - 0.55% Long-term growth objectives Mortgage Product Type Balances Projected Growth Auto Home Equity Card Unsecured personal lending and other consumer loans $16.3 $9.2 $7.1 $2.2 $1.2 3Q17 quarterly average balance ($ BN) 0.61% 3.20% 0.48% 2005 2006 2007 2008 2009 2010 2011 2012 2013 2014 2015 2016 3Q17 YTD
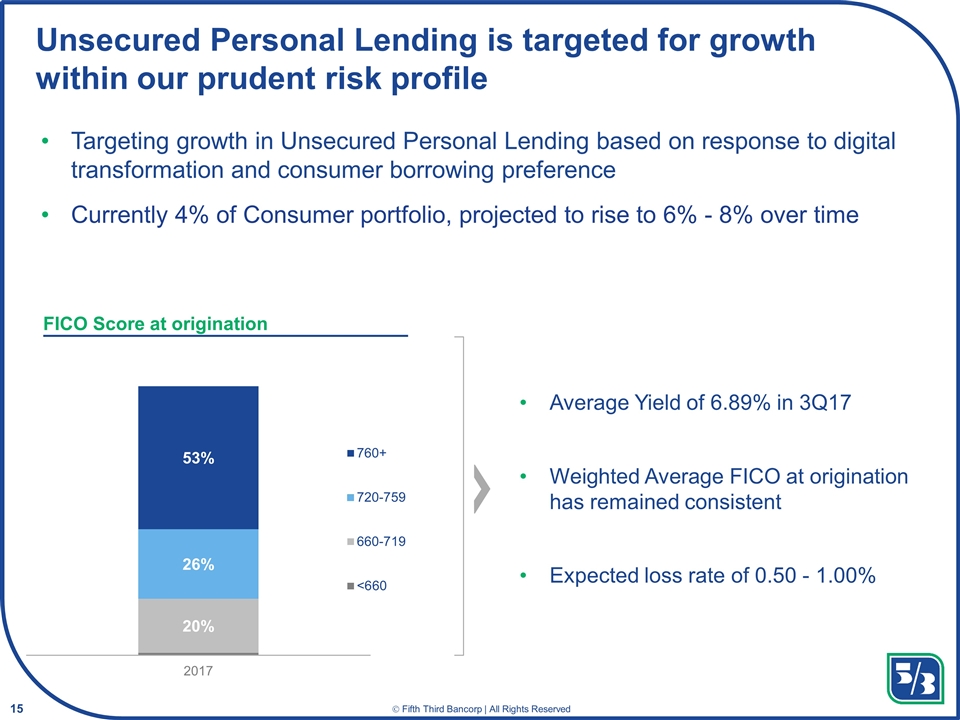
Unsecured Personal Lending is targeted for growth within our prudent risk profile Targeting growth in Unsecured Personal Lending based on response to digital transformation and consumer borrowing preference Currently 4% of Consumer portfolio, projected to rise to 6% - 8% over time Average Yield of 6.89% in 3Q17 Weighted Average FICO at origination has remained consistent Expected loss rate of 0.50 - 1.00% FICO Score at origination
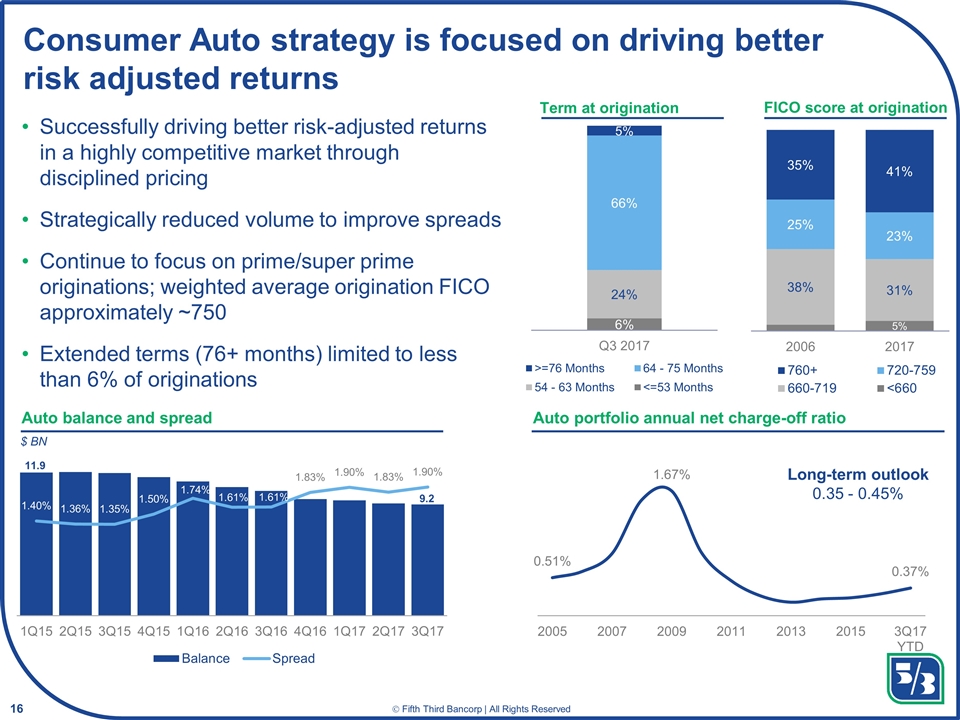
Term at origination Consumer Auto strategy is focused on driving better risk adjusted returns Auto balance and spread Auto portfolio annual net charge-off ratio Long-term outlook 0.35 - 0.45% FICO score at origination Successfully driving better risk-adjusted returns in a highly competitive market through disciplined pricing Strategically reduced volume to improve spreads Continue to focus on prime/super prime originations; weighted average origination FICO approximately ~750 Extended terms (76+ months) limited to less than 6% of originations 11.9 9.2 $ BN
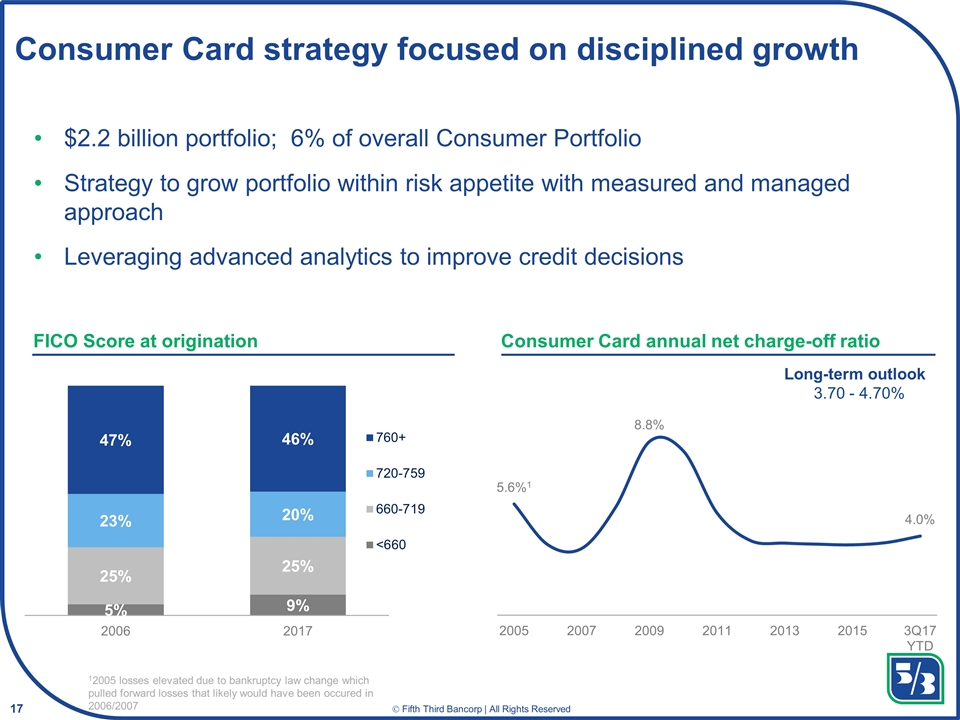
Consumer Card strategy focused on disciplined growth 12005 losses elevated due to bankruptcy law change which pulled forward losses that likely would have been occured in 2006/2007 FICO Score at origination $2.2 billion portfolio; 6% of overall Consumer Portfolio Strategy to grow portfolio within risk appetite with measured and managed approach Leveraging advanced analytics to improve credit decisions Consumer Card annual net charge-off ratio Long-term outlook 3.70 - 4.70%
Commercial Credit
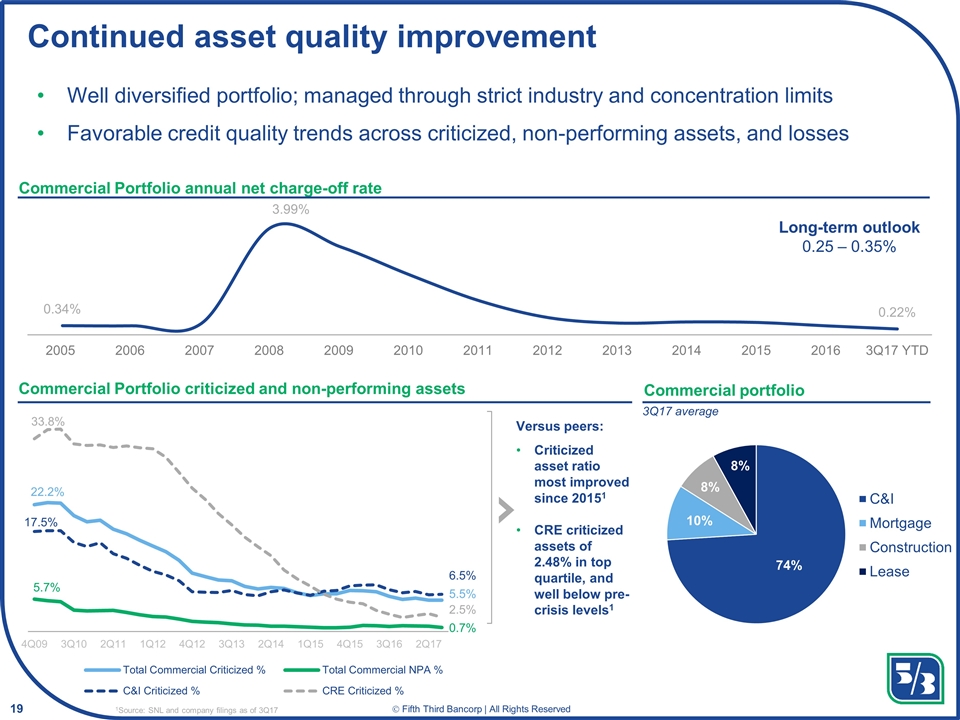
Continued asset quality improvement Well diversified portfolio; managed through strict industry and concentration limits Favorable credit quality trends across criticized, non-performing assets, and losses Commercial Portfolio annual net charge-off rate Commercial portfolio Commercial Portfolio criticized and non-performing assets Versus peers: Criticized asset ratio most improved since 20151 CRE criticized assets of 2.48% in top quartile, and well below pre-crisis levels1 Long-term outlook 0.25 – 0.35% 1Source: SNL and company filings as of 3Q17 3Q17 average
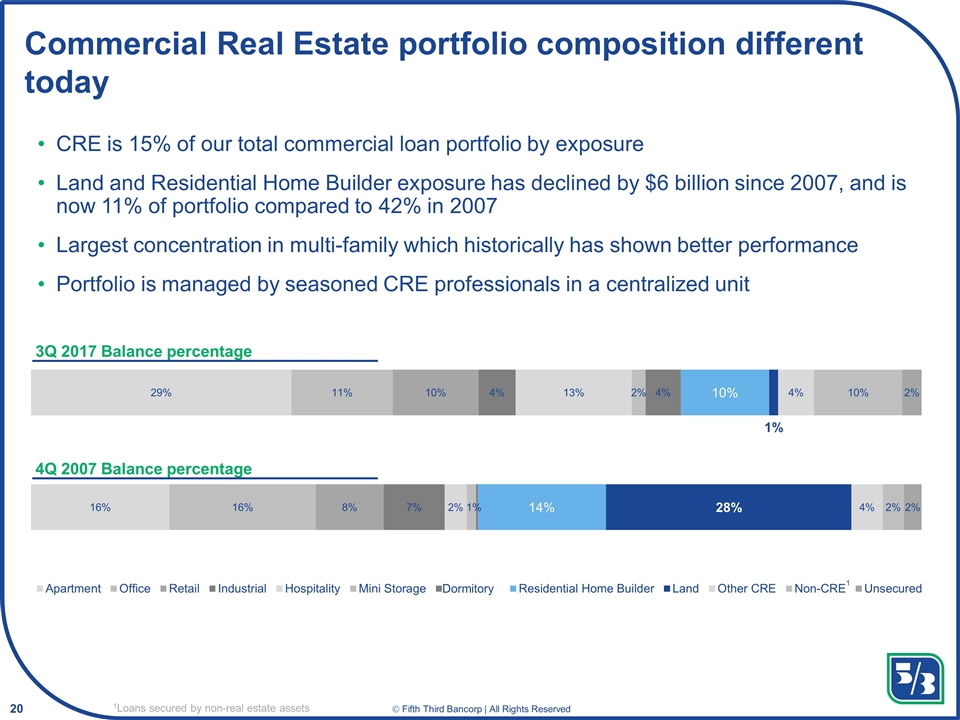
CRE is 15% of our total commercial loan portfolio by exposure Land and Residential Home Builder exposure has declined by $6 billion since 2007, and is now 11% of portfolio compared to 42% in 2007 Largest concentration in multi-family which historically has shown better performance Portfolio is managed by seasoned CRE professionals in a centralized unit Commercial Real Estate portfolio composition different today 1Loans secured by non-real estate assets 4Q 2007 Balance percentage 3Q 2017 Balance percentage 1
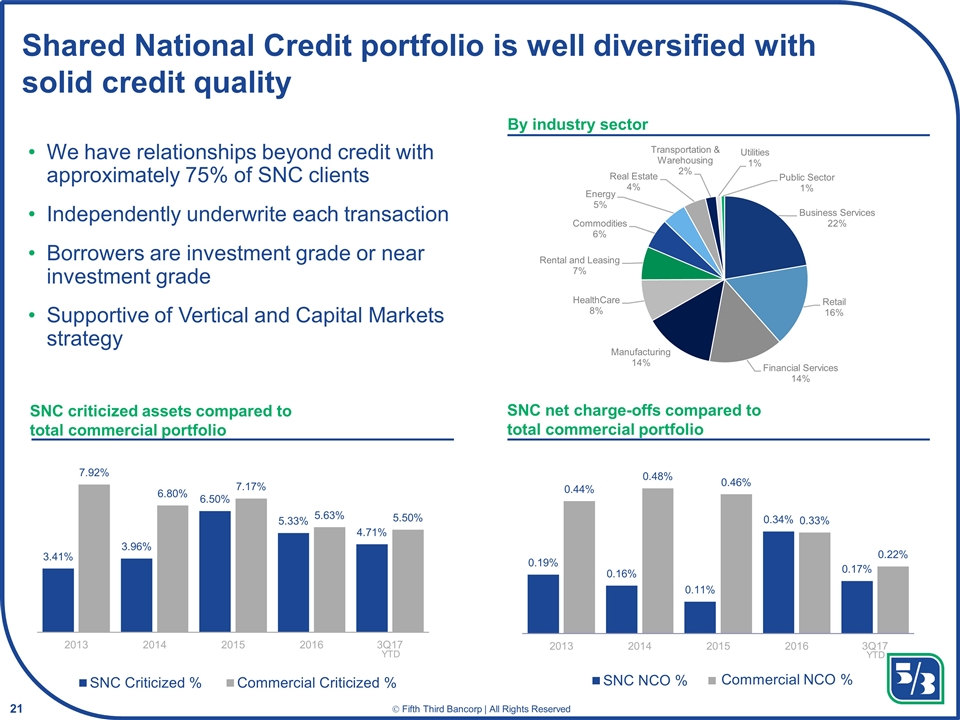
Shared National Credit portfolio is well diversified with solid credit quality By industry sector We have relationships beyond credit with approximately 75% of SNC clients Independently underwrite each transaction Borrowers are investment grade or near investment grade Supportive of Vertical and Capital Markets strategy SNC criticized assets compared to total commercial portfolio SNC net charge-offs compared to total commercial portfolio YTD YTD
Strengthened risk leadership, programs, and governance Enhanced risk culture and accountability Significantly improved asset quality Substantially reduced operational losses Well positioned with our regulators These outcomes have positioned us to perform well through all cycles In summary, we have transformed risk management and are achieving sustainable outcomes
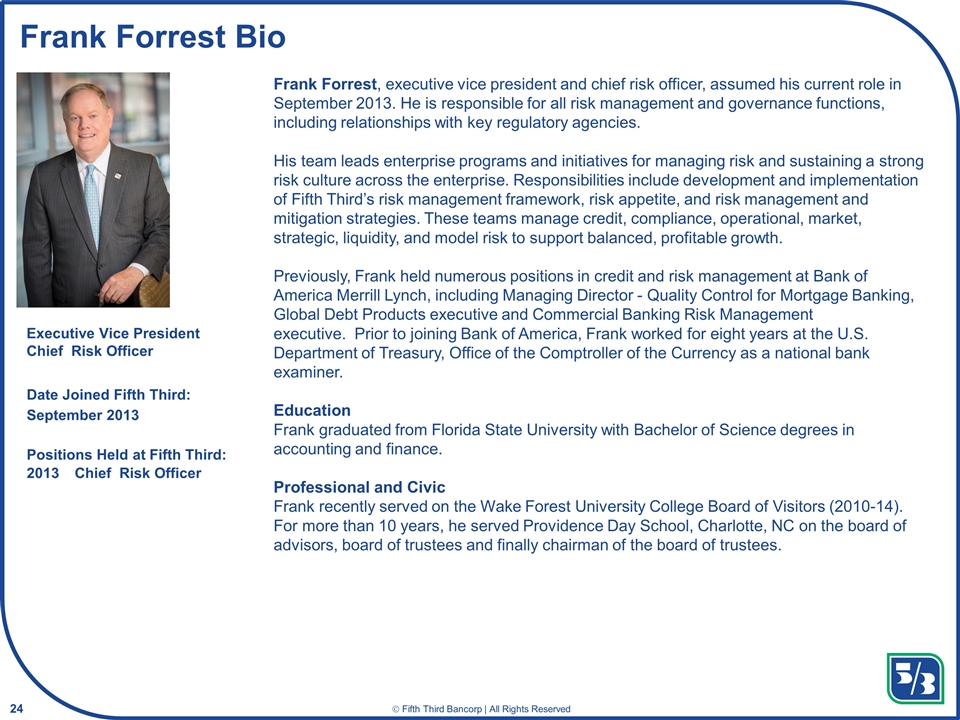
Frank Forrest Bio Executive Vice President Chief Risk Officer Date Joined Fifth Third: September 2013 Positions Held at Fifth Third: 2013Chief Risk Officer Frank Forrest, executive vice president and chief risk officer, assumed his current role in September 2013. He is responsible for all risk management and governance functions, including relationships with key regulatory agencies. His team leads enterprise programs and initiatives for managing risk and sustaining a strong risk culture across the enterprise. Responsibilities include development and implementation of Fifth Third’s risk management framework, risk appetite, and risk management and mitigation strategies. These teams manage credit, compliance, operational, market, strategic, liquidity, and model risk to support balanced, profitable growth. Previously, Frank held numerous positions in credit and risk management at Bank of America Merrill Lynch, including Managing Director - Quality Control for Mortgage Banking, Global Debt Products executive and Commercial Banking Risk Management executive. Prior to joining Bank of America, Frank worked for eight years at the U.S. Department of Treasury, Office of the Comptroller of the Currency as a national bank examiner. Education Frank graduated from Florida State University with Bachelor of Science degrees in accounting and finance. Professional and Civic Frank recently served on the Wake Forest University College Board of Visitors (2010-14). For more than 10 years, he served Providence Day School, Charlotte, NC on the board of advisors, board of trustees and finally chairman of the board of trustees.
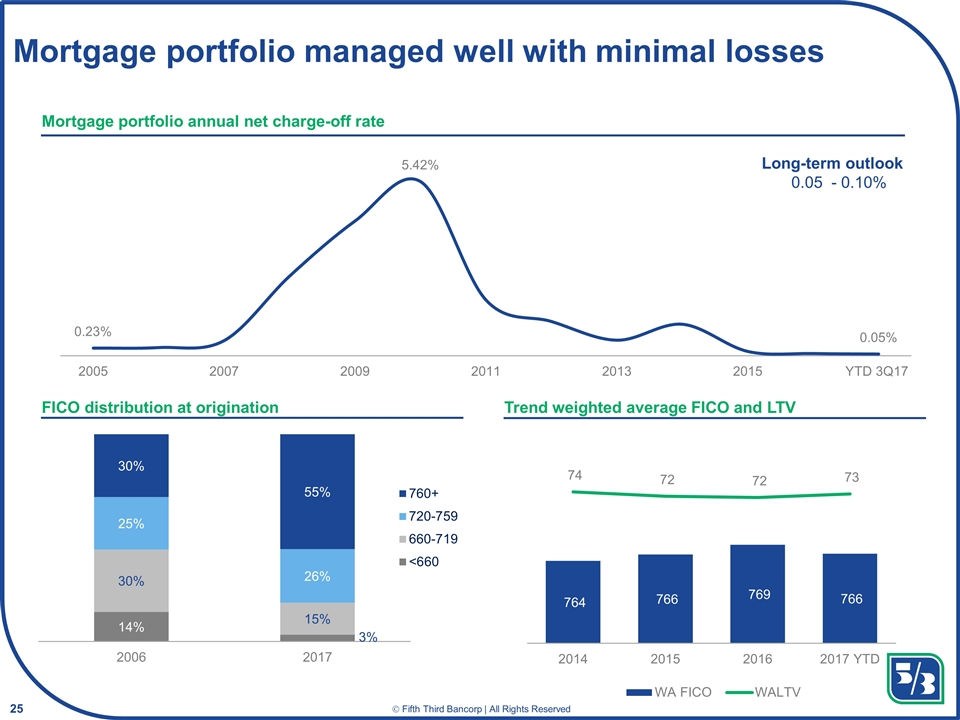
Mortgage portfolio managed well with minimal losses FICO distribution at origination Mortgage portfolio annual net charge-off rate Trend weighted average FICO and LTV Long-term outlook 0.05 - 0.10%
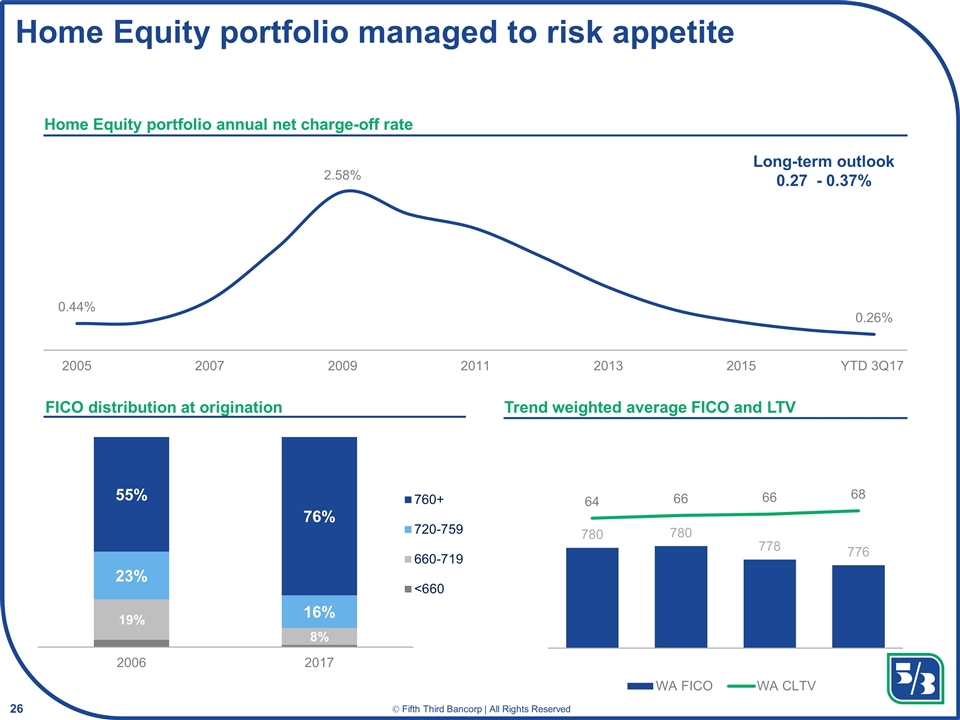
Home Equity portfolio managed to risk appetite Home Equity portfolio annual net charge-off rate FICO distribution at origination Trend weighted average FICO and LTV Long-term outlook 0.27 - 0.37%
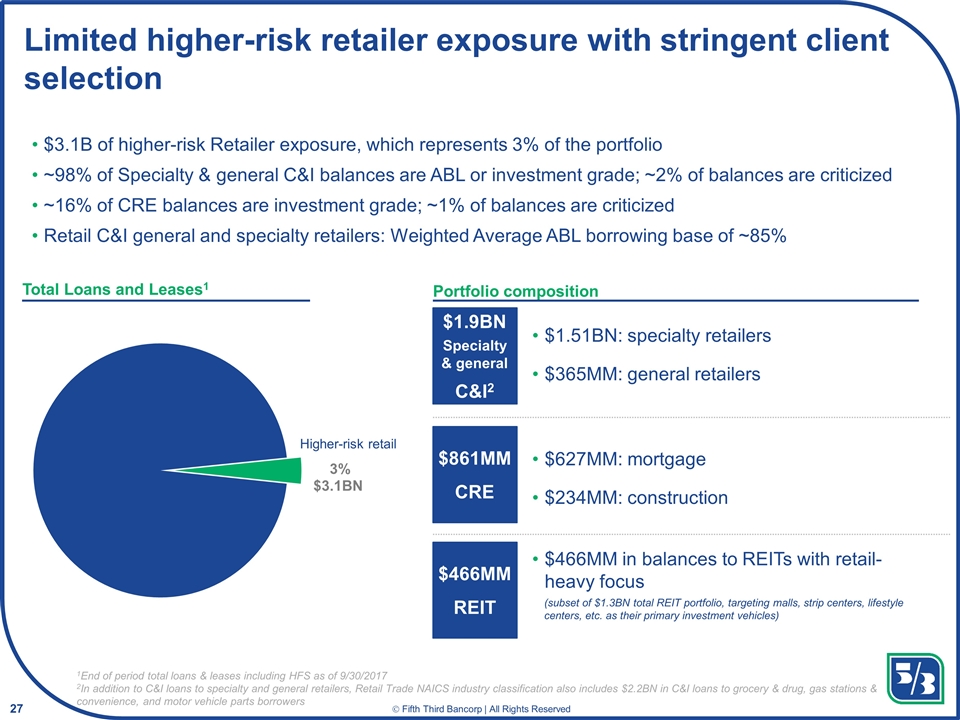
Limited higher-risk retailer exposure with stringent client selection $3.1B of higher-risk Retailer exposure, which represents 3% of the portfolio ~98% of Specialty & general C&I balances are ABL or investment grade; ~2% of balances are criticized ~16% of CRE balances are investment grade; ~1% of balances are criticized Retail C&I general and specialty retailers: Weighted Average ABL borrowing base of ~85% $861MM CRE $1.9BN Specialty & general C&I2 $1.51BN: specialty retailers $365MM: general retailers $466MM REIT $627MM: mortgage $234MM: construction $466MM in balances to REITs with retail-heavy focus (subset of $1.3BN total REIT portfolio, targeting malls, strip centers, lifestyle centers, etc. as their primary investment vehicles) 1End of period total loans & leases including HFS as of 9/30/2017 2In addition to C&I loans to specialty and general retailers, Retail Trade NAICS industry classification also includes $2.2BN in C&I loans to grocery & drug, gas stations & convenience, and motor vehicle parts borrowers Higher-risk retail Total Loans and Leases1 Portfolio composition
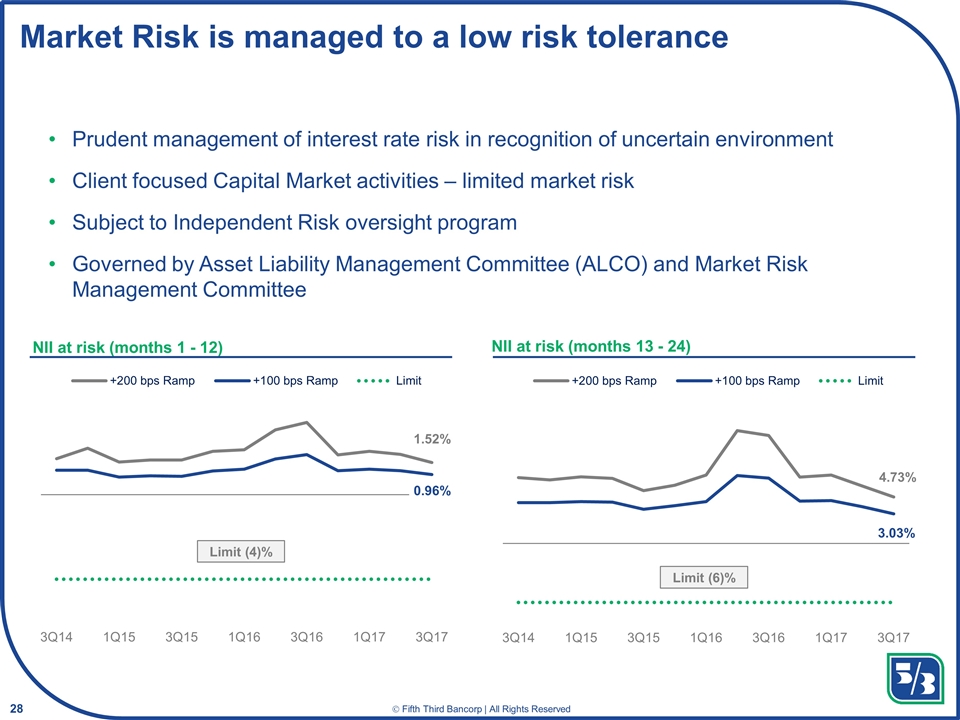
Market Risk is managed to a low risk tolerance Prudent management of interest rate risk in recognition of uncertain environment Client focused Capital Market activities – limited market risk Subject to Independent Risk oversight program Governed by Asset Liability Management Committee (ALCO) and Market Risk Management Committee NII at risk (months 1 - 12) NII at risk (months 13 - 24)
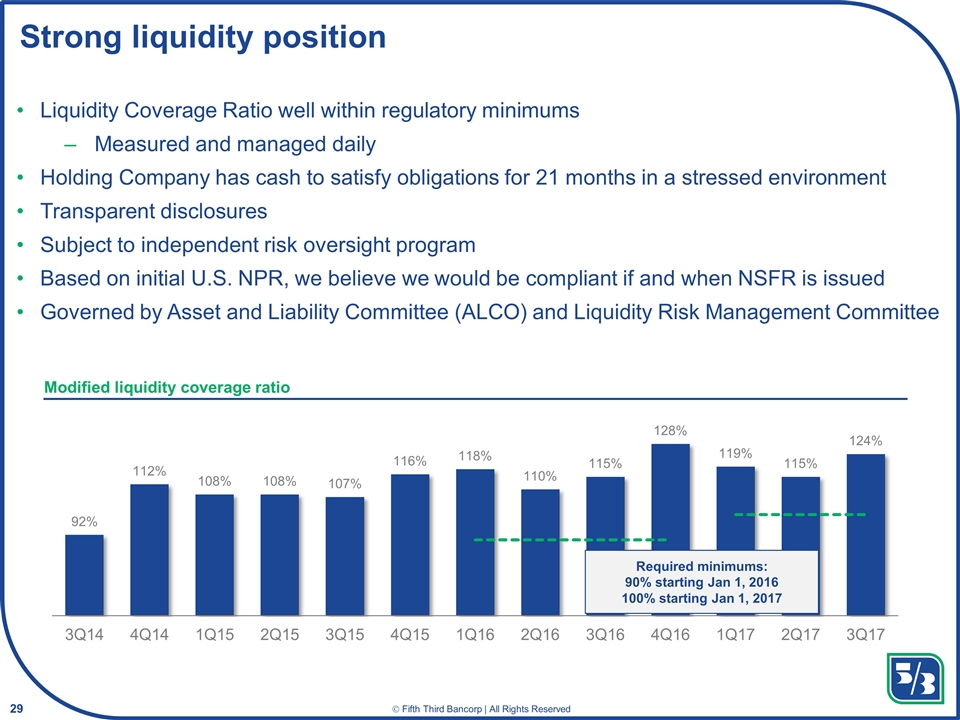
Liquidity Coverage Ratio well within regulatory minimums Measured and managed daily Holding Company has cash to satisfy obligations for 21 months in a stressed environment Transparent disclosures Subject to independent risk oversight program Based on initial U.S. NPR, we believe we would be compliant if and when NSFR is issued Governed by Asset and Liability Committee (ALCO) and Liquidity Risk Management Committee Strong liquidity position Modified liquidity coverage ratio
Strategic Differentiators: Brand, Analytics, Digital & Payments Tim Spence Executive Vice President Chief Strategy Officer Melissa Stevens Senior Vice President Chief Digital Officer Jed Scala Executive Vice President Head of Payments reprint
Cautionary statement This presentation contains statements that we believe are “forward-looking statements” within the meaning of Section 27A of the Securities Act of 1933, as amended, and Rule 175 promulgated thereunder, and Section 21E of the Securities Exchange Act of 1934, as amended, and Rule 3b-6 promulgated thereunder. These statements relate to our financial condition, results of operations, plans, objectives, future performance or business. They usually can be identified by the use of forward-looking language such as “will likely result,” “may,” “are expected to,” “is anticipated,” “potential,” “estimate,” “forecast,” “projected,” “intends to,” or may include other similar words or phrases such as “believes,” “plans,” “trend,” “objective,” “continue,” “remain,” or similar expressions, or future or conditional verbs such as “will,” “would,” “should,” “could,” “might,” “can,” or similar verbs. You should not place undue reliance on these statements, as they are subject to risks and uncertainties, including but not limited to the risk factors set forth in our most recent Annual Report on Form 10-K, as updated by our Quarterly Reports on Form 10-Q. When considering these forward-looking statements, you should keep in mind these risks and uncertainties, as well as any cautionary statements we may make. Moreover, you should treat these statements as speaking only as of the date they are made and based only on information then actually known to us. We undertake no obligation to release revisions to these forward-looking statements or reflect events or circumstances after the date of this document. There are a number of important factors that could cause future results to differ materially from historical performance and these forward-looking statements. Factors that might cause such a difference include, but are not limited to: (1) general economic or real estate market conditions, either nationally or in the states in which Fifth Third, one or more acquired entities and/or the combined company do business, weaken or are less favorable than expected; (2) deteriorating credit quality; (3) political developments, wars or other hostilities may disrupt or increase volatility in securities markets or other economic conditions; (4) changes in the interest rate environment reduce interest margins; (5) prepayment speeds, loan origination and sale volumes, charge-offs and loan loss provisions; (6) Fifth Third’s ability to maintain required capital levels and adequate sources of funding and liquidity; (7) maintaining capital requirements and adequate sources of funding and liquidity may limit Fifth Third’s operations and potential growth; (8) changes and trends in capital markets; (9) problems encountered by larger or similar financial institutions may adversely affect the banking industry and/or Fifth Third; (10) competitive pressures among depository institutions increase significantly; (11) changes in customer preferences or information technology systems; (12) effects of critical accounting policies and judgments; (13) changes in accounting policies or procedures as may be required by the Financial Accounting Standards Board (FASB) or other regulatory agencies; (14) legislative or regulatory changes or actions, or significant litigation, adversely affect Fifth Third, one or more acquired entities and/or the combined company or the businesses in which Fifth Third, one or more acquired entities and/or the combined company are engaged, including the Dodd-Frank Wall Street Reform and Consumer Protection Act; (15) ability to maintain favorable ratings from rating agencies; (16) failure of models or risk management systems or controls; (17) fluctuation of Fifth Third’s stock price; (18) ability to attract and retain key personnel; (19) ability to receive dividends from its subsidiaries; (20) potentially dilutive effect of future acquisitions on current shareholders’ ownership of Fifth Third; (21) declines in the value of Fifth Third’s goodwill or other intangible assets; (22) effects of accounting or financial results of one or more acquired entities; (23) difficulties from Fifth Third’s investment in, relationship with, and nature of the operations of Vantiv Holding, LLC; (24) loss of income from any sale or potential sale of businesses; (25) difficulties in separating the operations of any branches or other assets divested; (26) losses or adverse impacts on the carrying values of branches and long-lived assets in connection with their sales or anticipated sales; (27) inability to achieve expected benefits from branch consolidations and planned sales within desired timeframes, if at all; (28) ability to secure confidential information and deliver products and services through the use of computer systems and telecommunications networks; (29) the negotiation and (if any) implementation by Vantiv, Inc. and/or Worldpay Group plc of the potential acquisition of Worldpay Group plc by Vantiv, Inc. and such other actions as Vantiv, Inc. and Worldpay Group plc may take in furtherance thereof; and (30) the impact of reputational risk created by these developments on such matters as business generation and retention, funding and liquidity. You should refer to our periodic and current reports filed with the Securities and Exchange Commission, or “SEC,” for further information on other factors, which could cause actual results to be significantly different from those expressed or implied by these forward-looking statements. In this presentation, we may sometimes provide non-GAAP financial information. Please note that although non-GAAP financial measures provide useful insight to analysts, investors and regulators, they should not be considered in isolation or relied upon as a substitute for analysis using GAAP measures. If applicable, we provide GAAP reconciliations for non-GAAP measures in a later slide in this presentation which is also available in the investor relations section of our website, www.53.com.
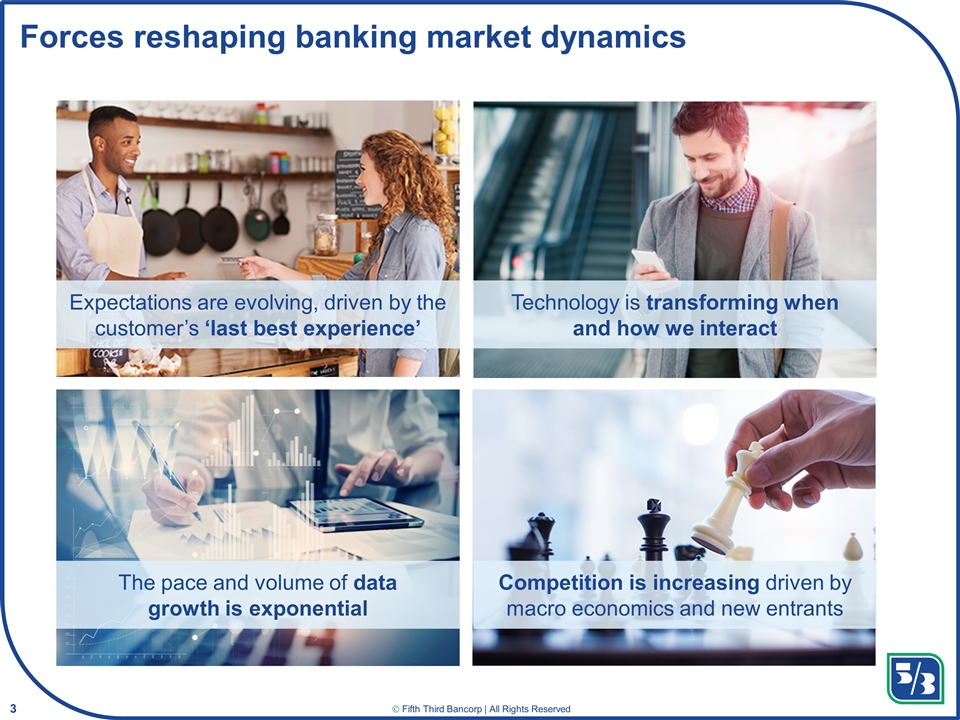
Forces reshaping banking market dynamics Expectations are evolving, driven by the customer’s ‘last best experience’ Technology is transforming when and how we interact The pace and volume of data growth is exponential Competition is increasing driven by macro economics and new entrants
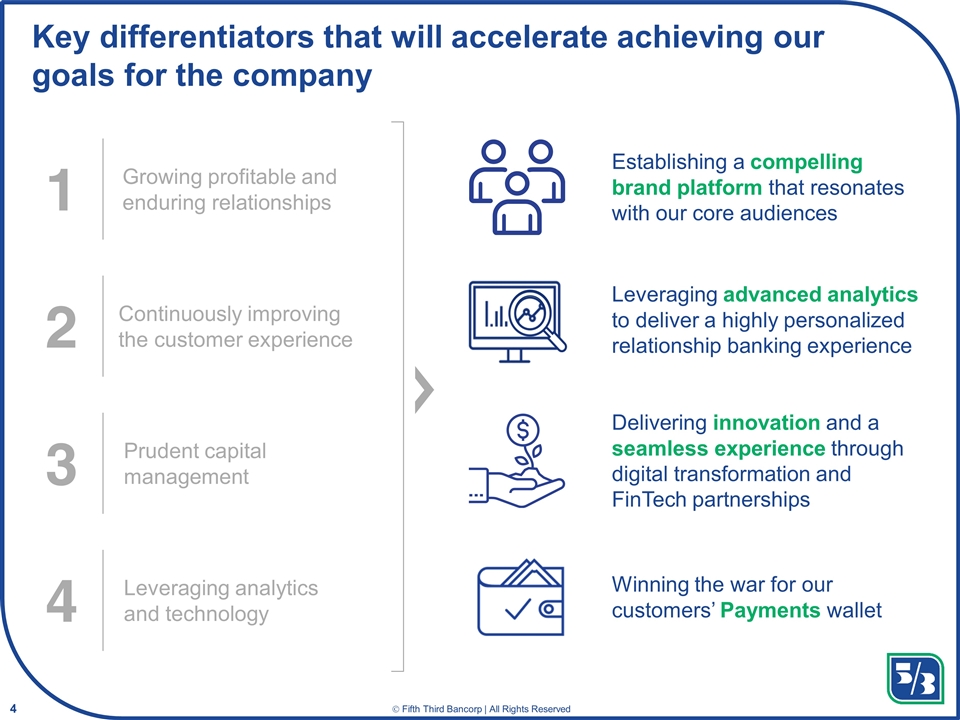
Key differentiators that will accelerate achieving our goals for the company 1 Growing profitable and enduring relationships 2 Continuously improving the customer experience 4 Leveraging analytics and technology 3 Prudent capital management Leveraging advanced analytics to deliver a highly personalized relationship banking experience Establishing a compelling brand platform that resonates with our core audiences Delivering innovation and a seamless experience through digital transformation and FinTech partnerships Winning the war for our customers’ Payments wallet
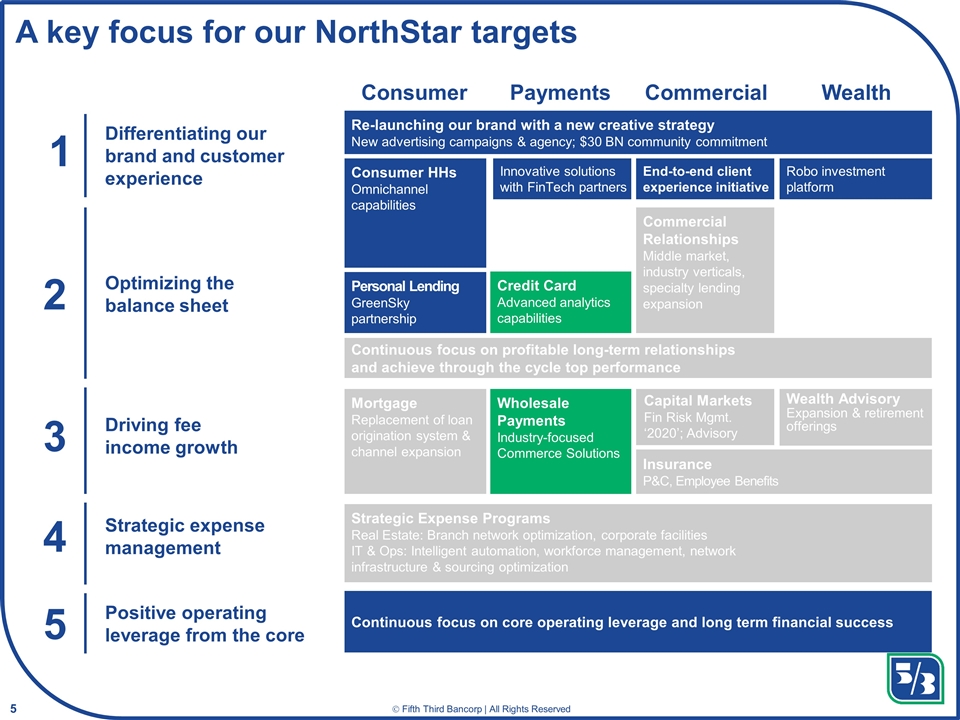
Capital Markets Fin Risk Mgmt. ‘2020’; Advisory A key focus for our NorthStar targets 1 Differentiating our brand and customer experience 2 Optimizing the balance sheet Driving fee income growth 3 4 Strategic expense management Consumer Payments Commercial Wealth 5 Positive operating leverage from the core Personal Lending GreenSky partnership Credit Card Advanced analytics capabilities Wholesale Payments Industry-focused Commerce Solutions Insurance P&C, Employee Benefits Commercial Relationships Middle market, industry verticals, specialty lending expansion Wealth Advisory Expansion & retirement offerings Strategic Expense Programs Real Estate: Branch network optimization, corporate facilities IT & Ops: Intelligent automation, workforce management, network infrastructure & sourcing optimization Re-launching our brand with a new creative strategy New advertising campaigns & agency; $30 BN community commitment Consumer HHs Omnichannel capabilities Continuous focus on core operating leverage and long term financial success Mortgage Replacement of loan origination system & channel expansion Continuous focus on profitable long-term relationships and achieve through the cycle top performance End-to-end client experience initiative Robo investment platform Innovative solutions with FinTech partners Reprint Complete Need to remerge
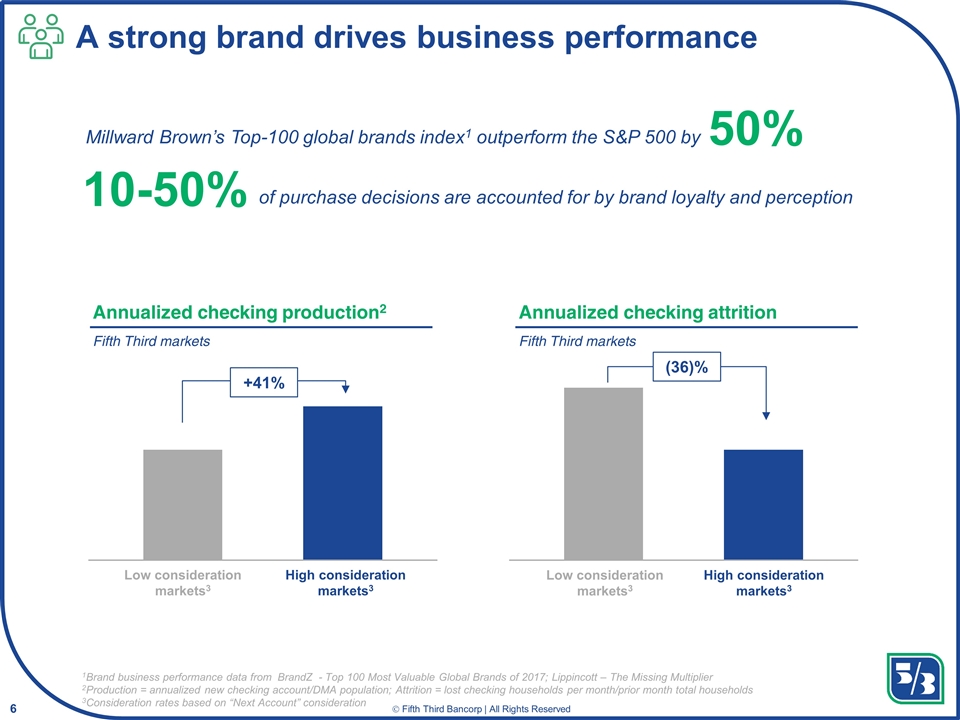
A strong brand drives business performance Low consideration markets3 High consideration markets3 Low consideration markets3 High consideration markets3 50% Millward Brown’s Top-100 global brands index1 outperform the S&P 500 by 10-50% of purchase decisions are accounted for by brand loyalty and perception +41% (36)% Annualized checking production2 Fifth Third markets Annualized checking attrition Fifth Third markets 1Brand business performance data from BrandZ - Top 100 Most Valuable Global Brands of 2017; Lippincott – The Missing Multiplier 2Production = annualized new checking account/DMA population; Attrition = lost checking households per month/prior month total households 3Consideration rates based on “Next Account” consideration
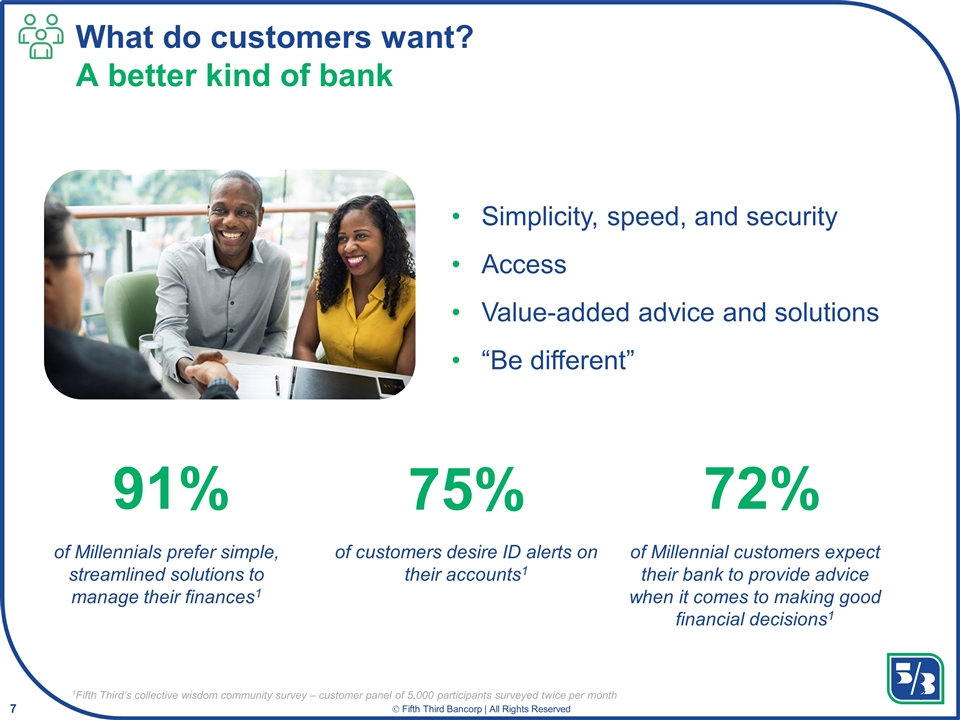
What do customers want? A better kind of bank Simplicity, speed, and security Access Value-added advice and solutions “Be different” 1Fifth Third’s collective wisdom community survey – customer panel of 5,000 participants surveyed twice per month 91% of Millennials prefer simple, streamlined solutions to manage their finances1 75% of customers desire ID alerts on their accounts1 72% of Millennial customers expect their bank to provide advice when it comes to making good financial decisions1
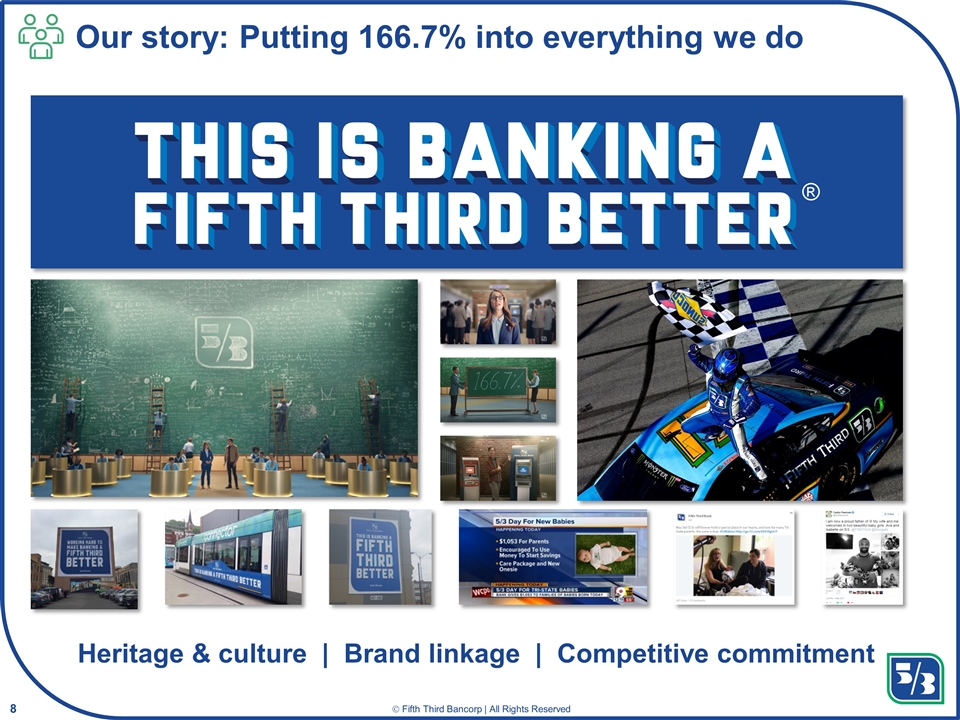
Our story: Putting 166.7% into everything we do Heritage & culture | Brand linkage | Competitive commitment ®
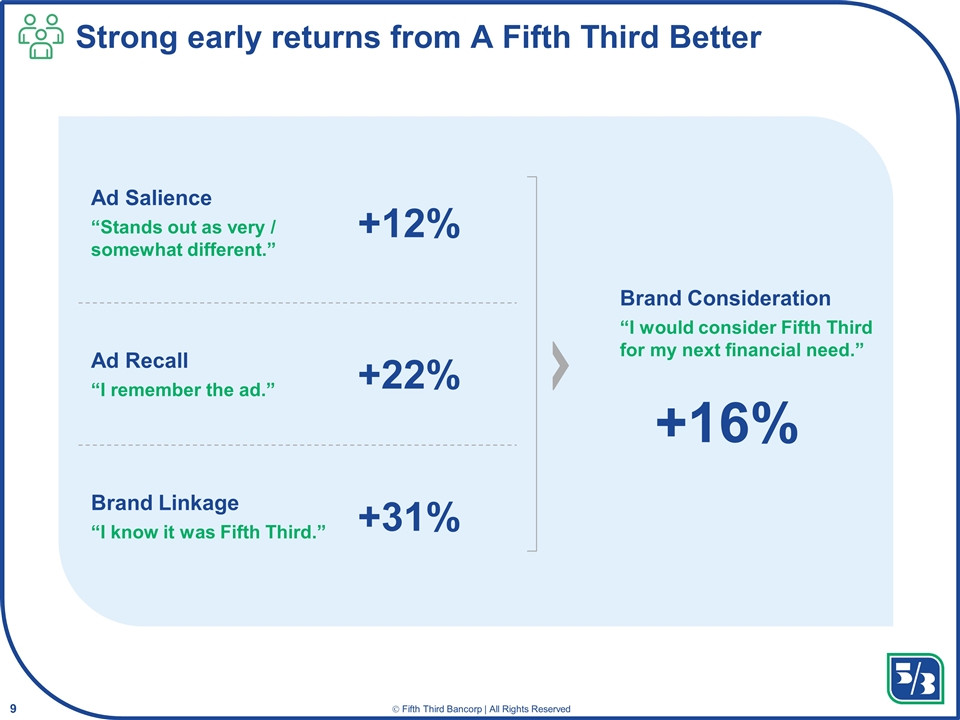
Strong early returns from A Fifth Third Better Ad Salience “Stands out as very / somewhat different.” +12% Ad Recall “I remember the ad.” +22% Brand Linkage “I know it was Fifth Third.” +31% Brand Consideration “I would consider Fifth Third for my next financial need.” +16%
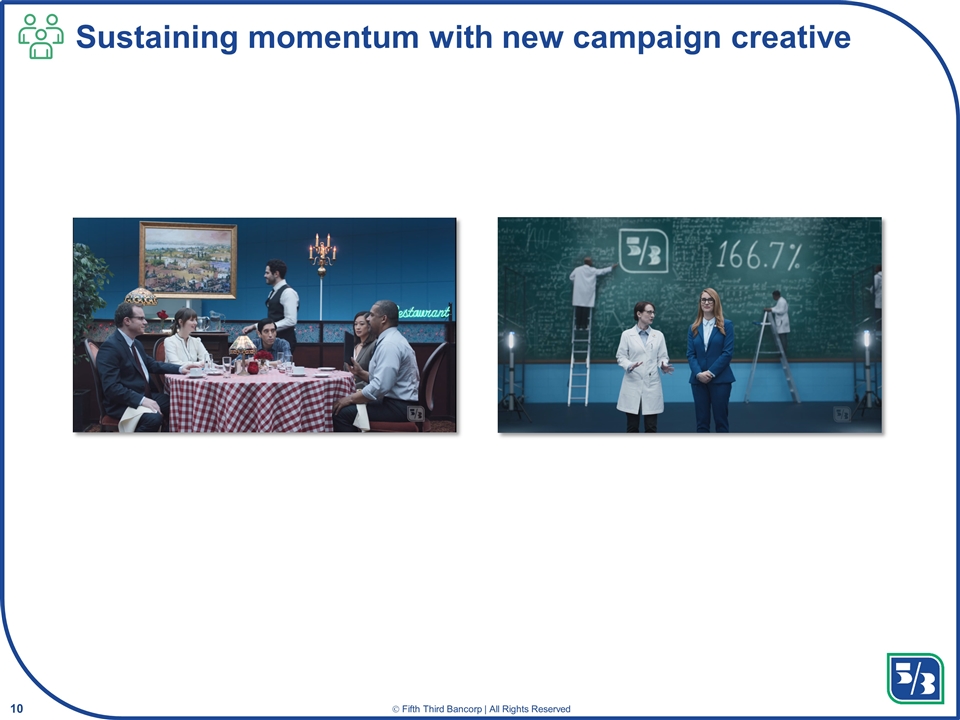
Sustaining momentum with new campaign creative reprint
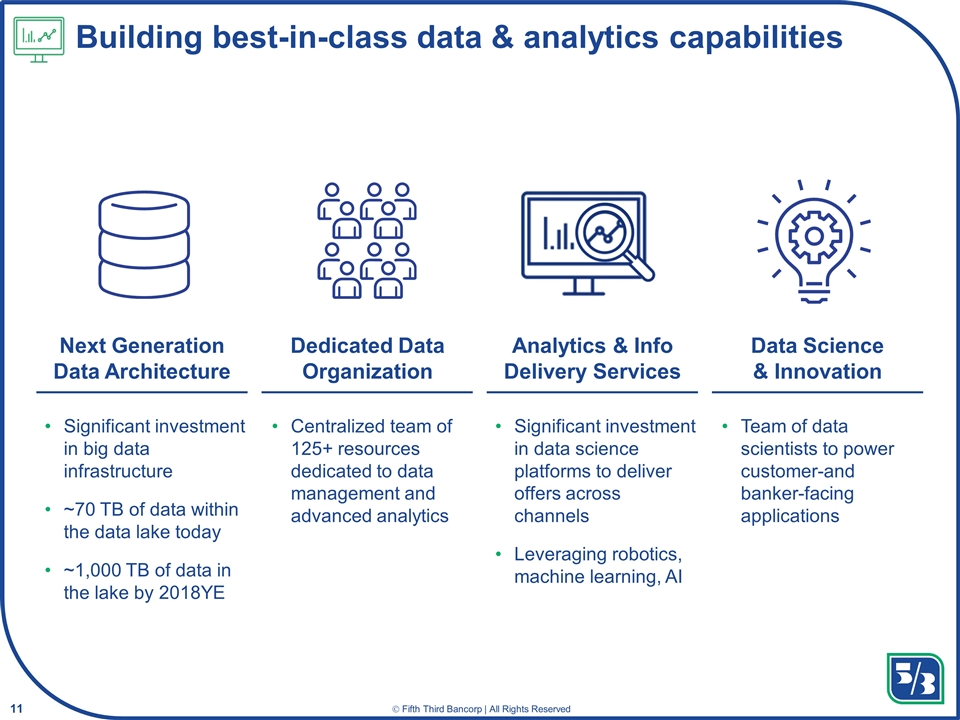
Next Generation Data Architecture Dedicated Data Organization Analytics & Info Delivery Services Data Science & Innovation Building best-in-class data & analytics capabilities Significant investment in big data infrastructure ~70 TB of data within the data lake today ~1,000 TB of data in the lake by 2018YE Centralized team of 125+ resources dedicated to data management and advanced analytics Significant investment in data science platforms to deliver offers across channels Leveraging robotics, machine learning, AI Team of data scientists to power customer-and banker-facing applications
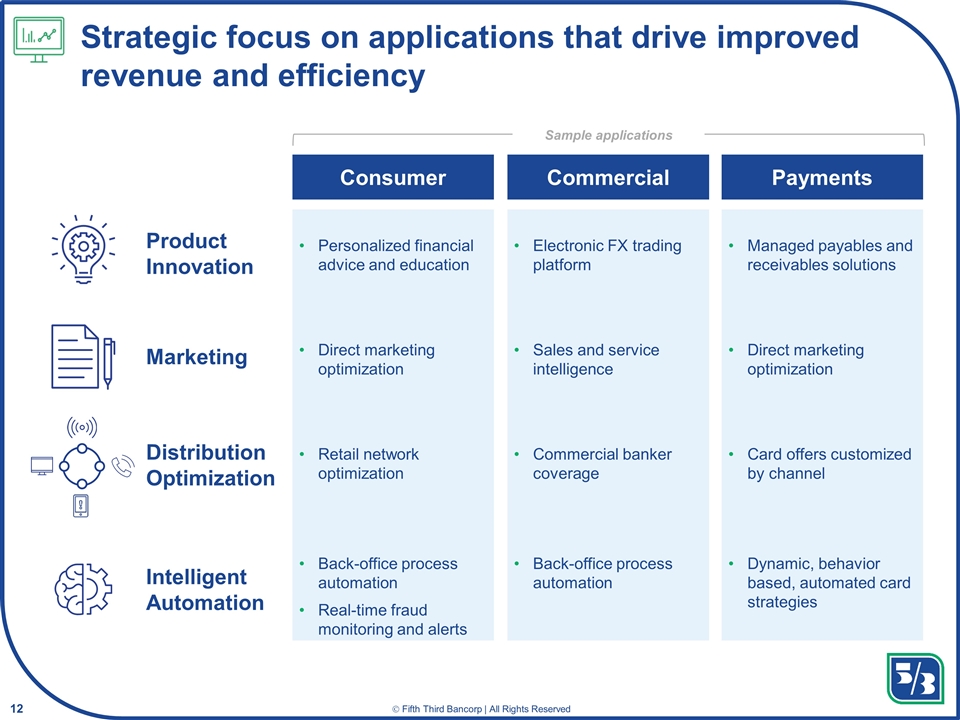
Distribution Optimization Intelligent Automation Product Innovation Marketing Strategic focus on applications that drive improved revenue and efficiency Direct marketing optimization Retail network optimization Back-office process automation Real-time fraud monitoring and alerts Personalized financial advice and education Electronic FX trading platform Managed payables and receivables solutions Sales and service intelligence Direct marketing optimization Commercial banker coverage Card offers customized by channel Back-office process automation Dynamic, behavior based, automated card strategies Sample applications Consumer Commercial Payments
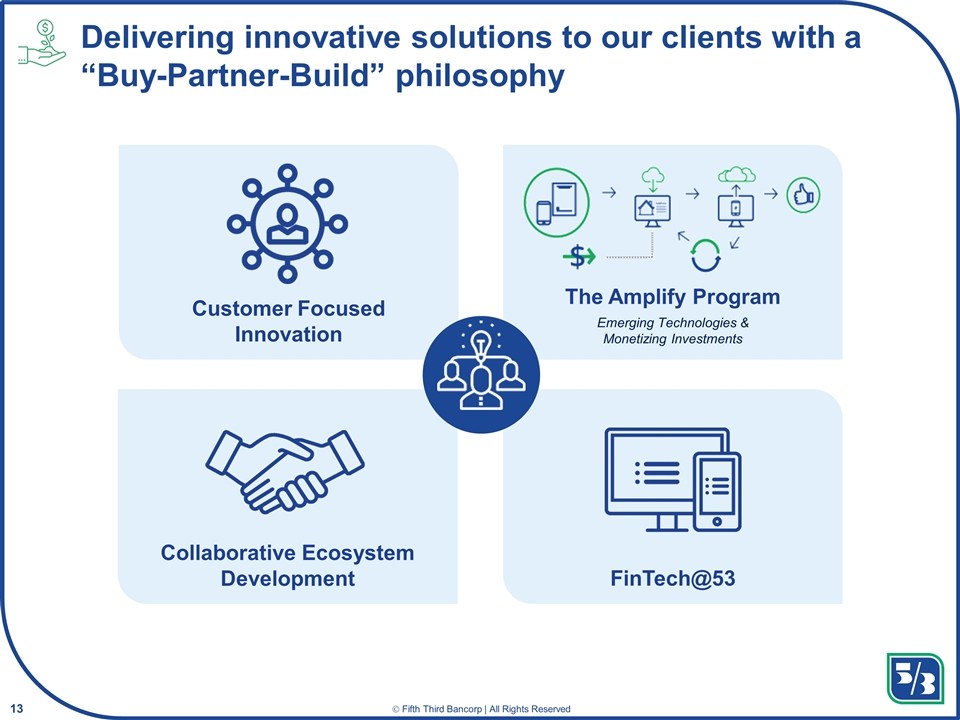
Customer Focused Innovation The Amplify Program Emerging Technologies & Monetizing Investments Collaborative Ecosystem Development FinTech@53 Delivering innovative solutions to our clients with a “Buy-Partner-Build” philosophy
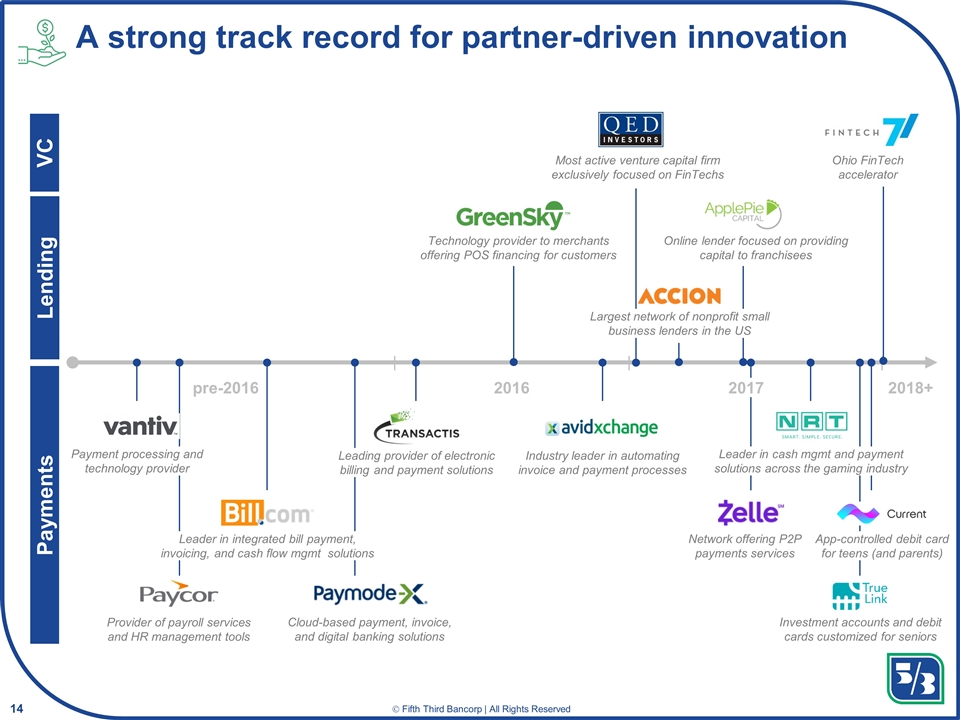
2018+ pre-2016 Technology provider to merchants offering POS financing for customers Leading provider of electronic billing and payment solutions Industry leader in automating invoice and payment processes Leader in cash mgmt and payment solutions across the gaming industry Provider of payroll services and HR management tools Leader in integrated bill payment, invoicing, and cash flow mgmt solutions Cloud-based payment, invoice, and digital banking solutions Payment processing and technology provider Largest network of nonprofit small business lenders in the US Online lender focused on providing capital to franchisees Network offering P2P payments services A strong track record for partner-driven innovation Most active venture capital firm exclusively focused on FinTechs 2017 Lending Payments 2016 Ohio FinTech accelerator VC Investment accounts and debit cards customized for seniors App-controlled debit card for teens (and parents) reprint
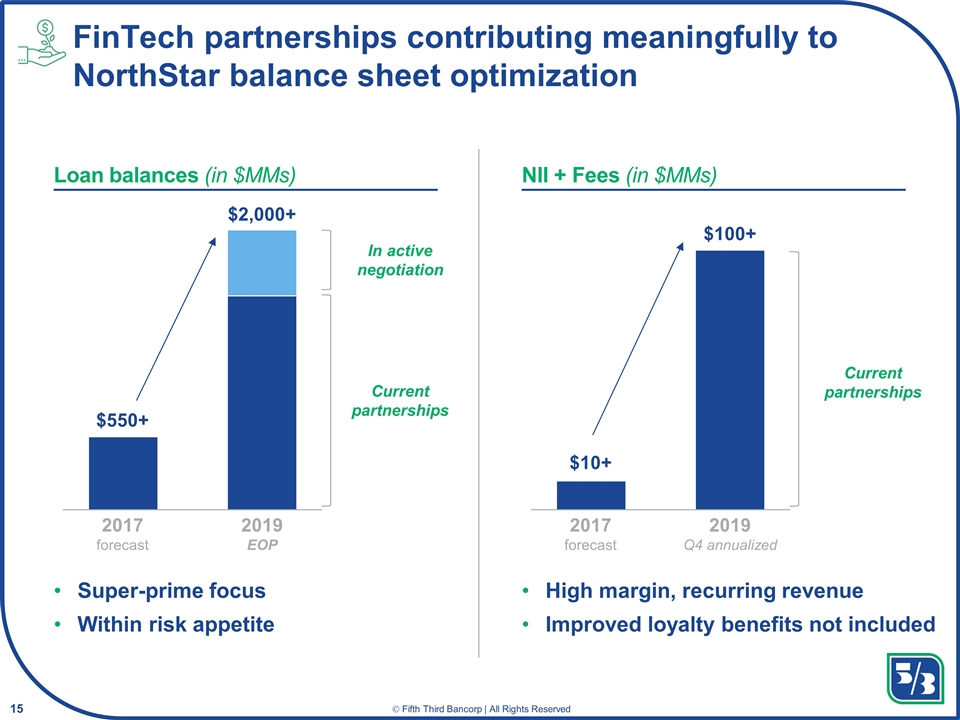
Super-prime focus Within risk appetite $550+ 2017 forecast 2019 EOP Current partnerships In active negotiation High margin, recurring revenue Improved loyalty benefits not included $10+ $100+ 2017 forecast 2019 Q4 annualized Current partnerships Loan balances (in $MMs) NII + Fees (in $MMs) $2,000+ FinTech partnerships contributing meaningfully to NorthStar balance sheet optimization
Digital Strategies Melissa Stevens Senior Vice President Chief Digital Officer
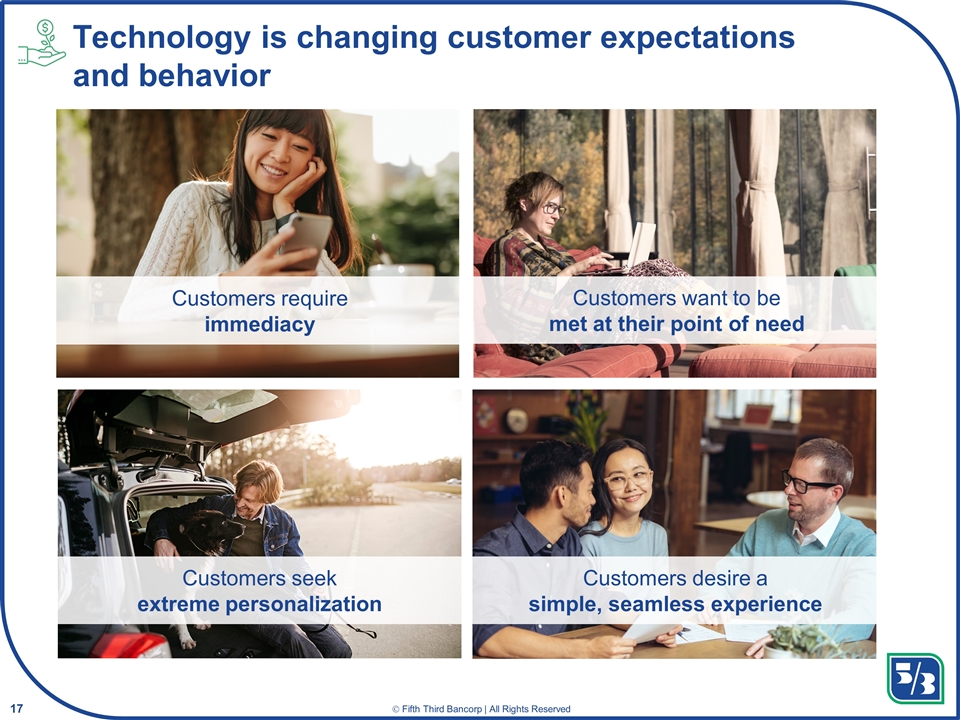
Technology is changing customer expectations and behavior Customers desire a simple, seamless experience Customers want to be met at their point of need Customers require immediacy Customers seek extreme personalization
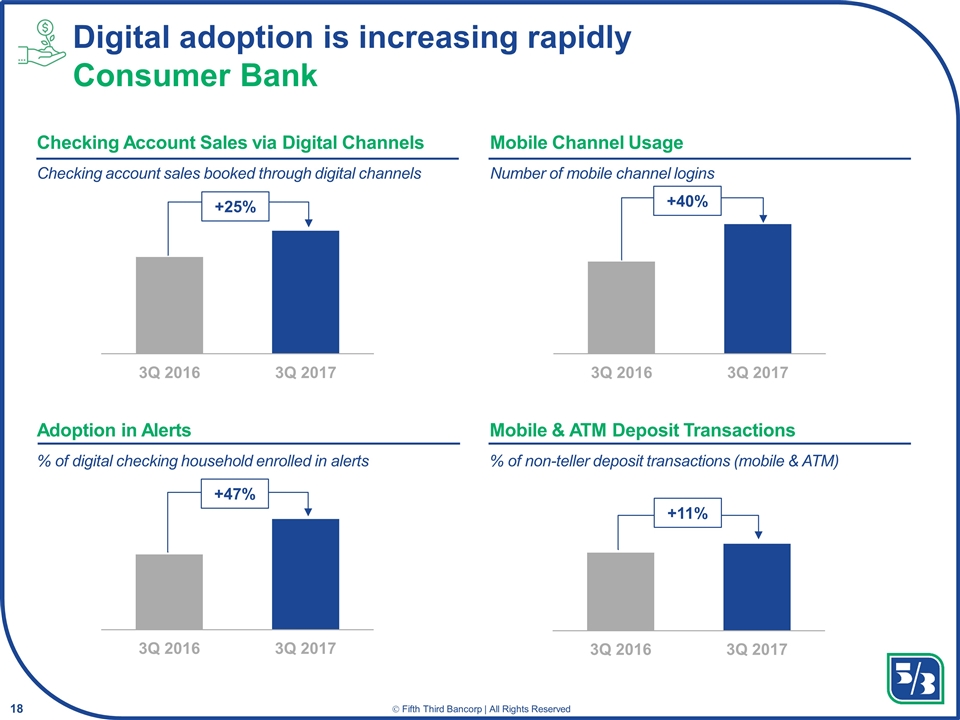
Digital adoption is increasing rapidly Consumer Bank Mobile Channel Usage Number of mobile channel logins Adoption in Alerts % of digital checking household enrolled in alerts Mobile & ATM Deposit Transactions % of non-teller deposit transactions (mobile & ATM) +40% Checking Account Sales via Digital Channels Checking account sales booked through digital channels +25% +47% +11%
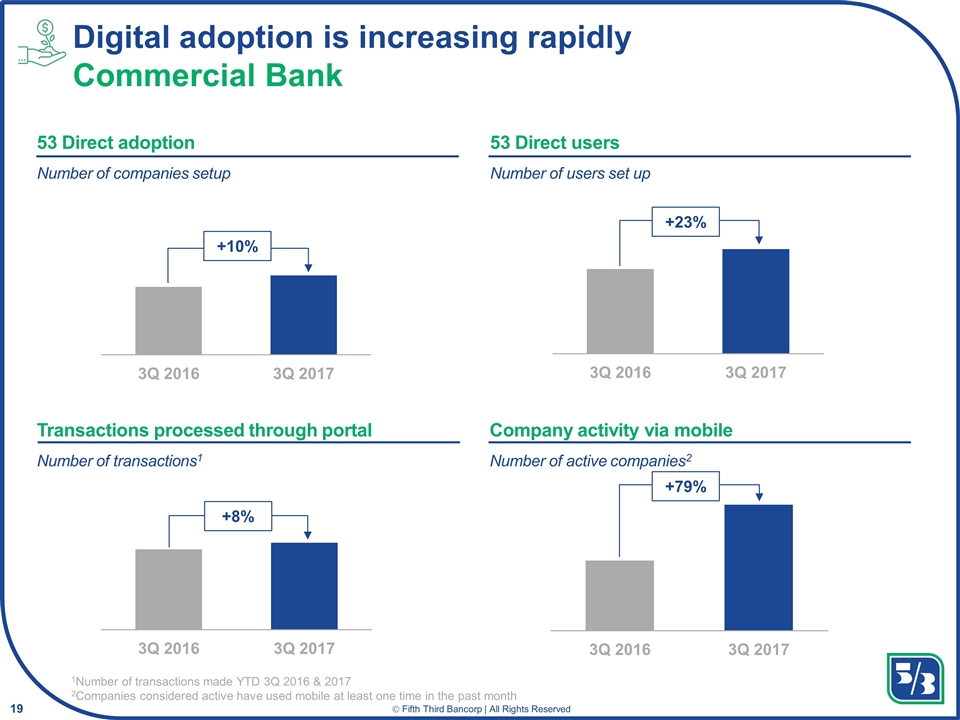
Digital adoption is increasing rapidly Commercial Bank 1Number of transactions made YTD 3Q 2016 & 2017 2Companies considered active have used mobile at least one time in the past month 53 Direct adoption Number of companies setup 53 Direct users Number of users set up Transactions processed through portal Number of transactions1 Company activity via mobile Number of active companies2 +10% +23% +8% +79%
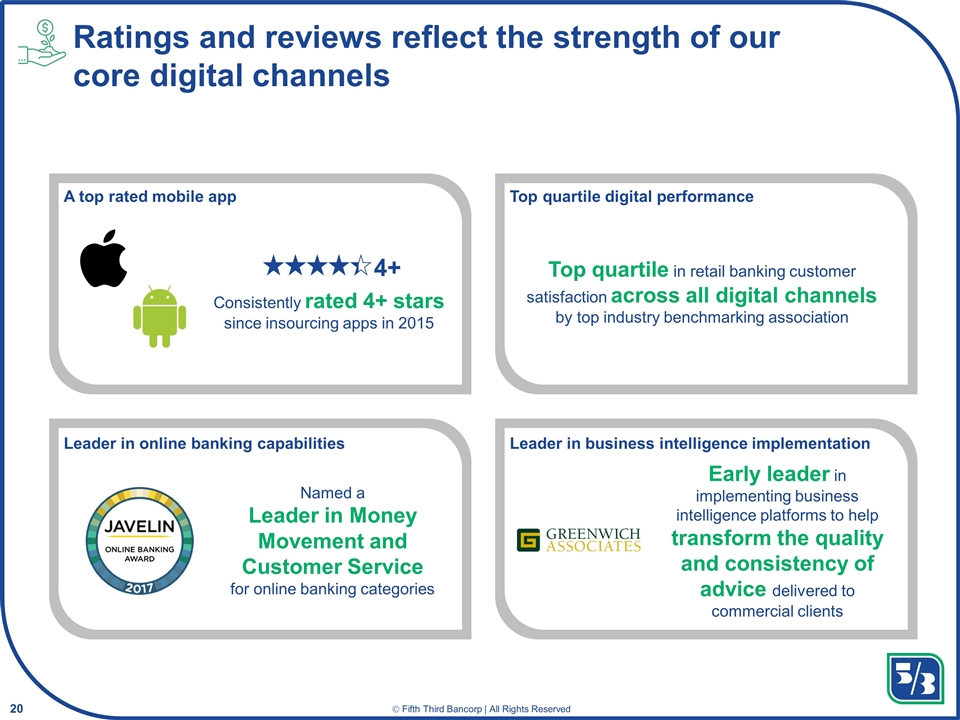
Ratings and reviews reflect the strength of our core digital channels A top rated mobile app Leader in online banking capabilities Top quartile digital performance Leader in business intelligence implementation Named a Leader in Money Movement and Customer Service for online banking categories Top quartile in retail banking customer satisfaction across all digital channels by top industry benchmarking association Consistently rated 4+ stars since insourcing apps in 2015 4+ Early leader in implementing business intelligence platforms to help transform the quality and consistency of advice delivered to commercial clients

Customer insights drive omnichannel experience design and innovation opportunities
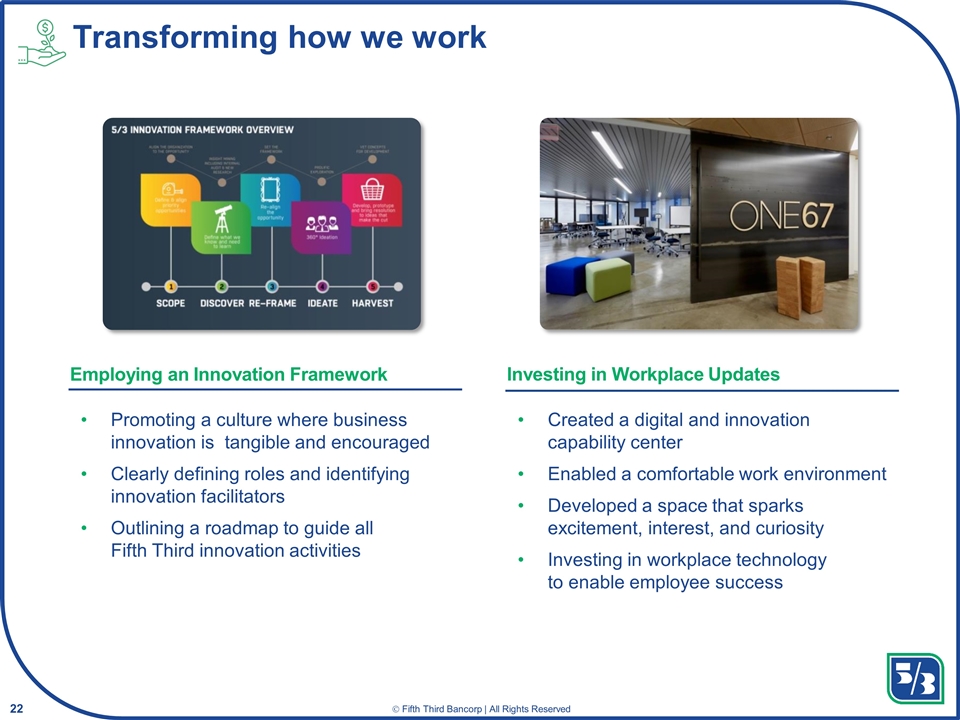
Transforming how we work Promoting a culture where business innovation is tangible and encouraged Clearly defining roles and identifying innovation facilitators Outlining a roadmap to guide all Fifth Third innovation activities Created a digital and innovation capability center Enabled a comfortable work environment Developed a space that sparks excitement, interest, and curiosity Investing in workplace technology to enable employee success Employing an Innovation Framework Investing in Workplace Updates
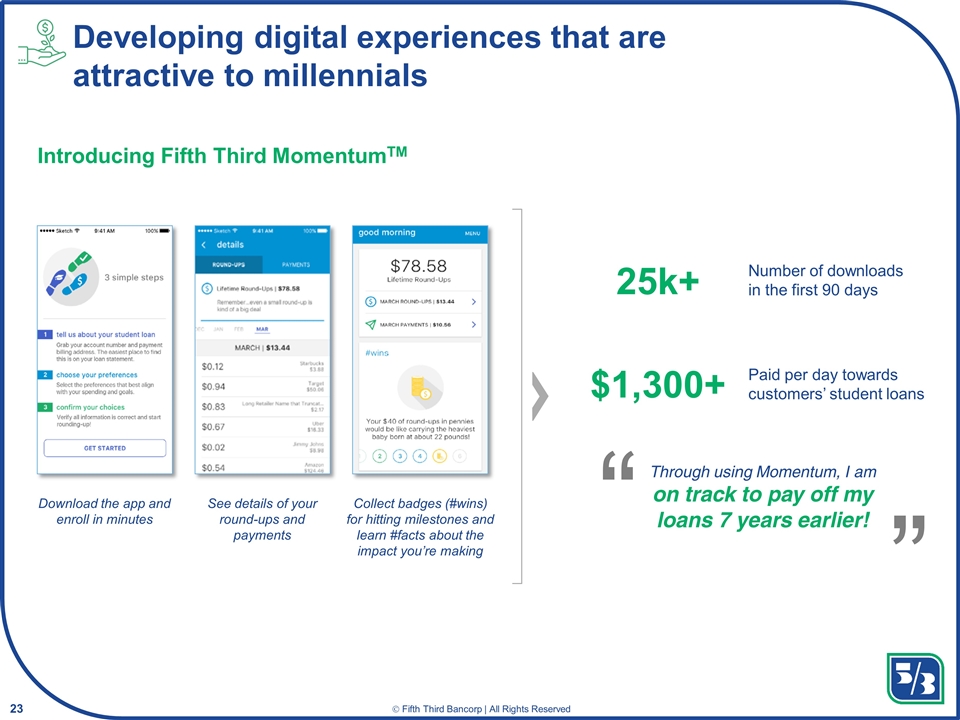
Developing digital experiences that are attractive to millennials Introducing Fifth Third MomentumTM Number of downloads in the first 90 days Paid per day towards customers’ student loans 25k+ $1,300+ Through using Momentum, I am on track to pay off my loans 7 years earlier! Download the app and enroll in minutes See details of your round-ups and payments Collect badges (#wins) for hitting milestones and learn #facts about the impact you’re making
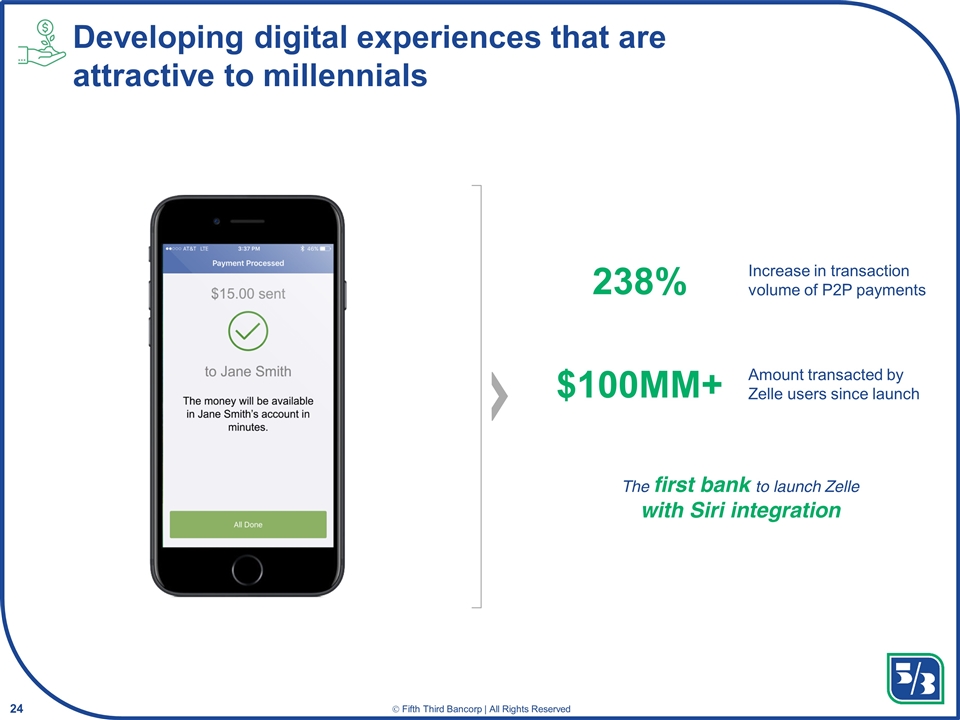
Developing digital experiences that are attractive to millennials Increase in transaction volume of P2P payments Amount transacted by Zelle users since launch 238% $100MM+ The first bank to launch Zelle with Siri integration
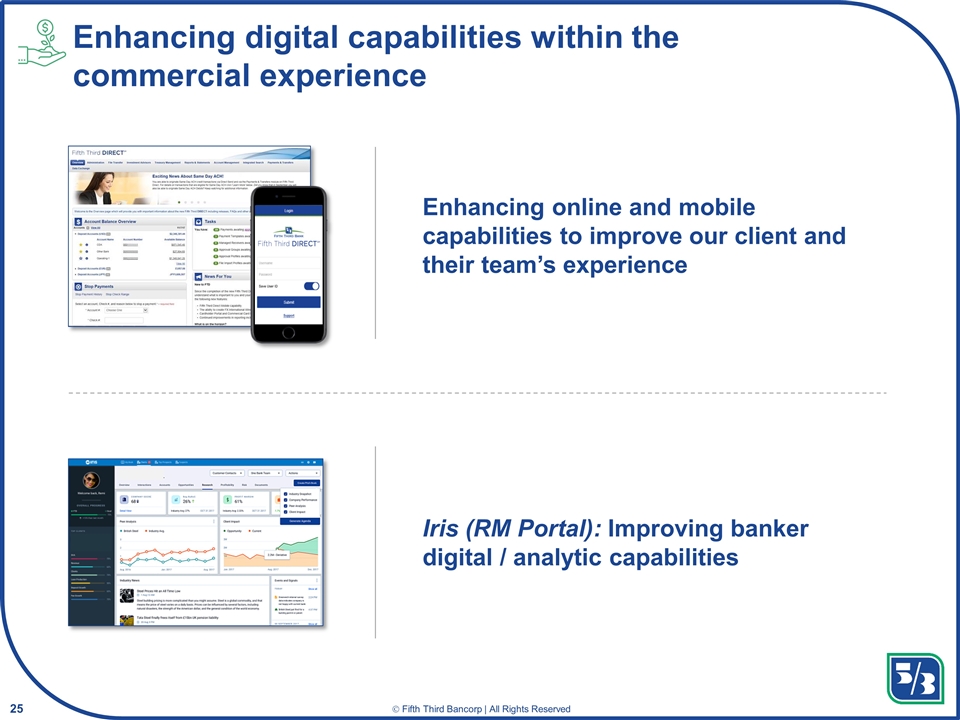
Enhancing digital capabilities within the commercial experience Enhancing online and mobile capabilities to improve our client and their team’s experience Iris (RM Portal): Improving banker digital / analytic capabilities
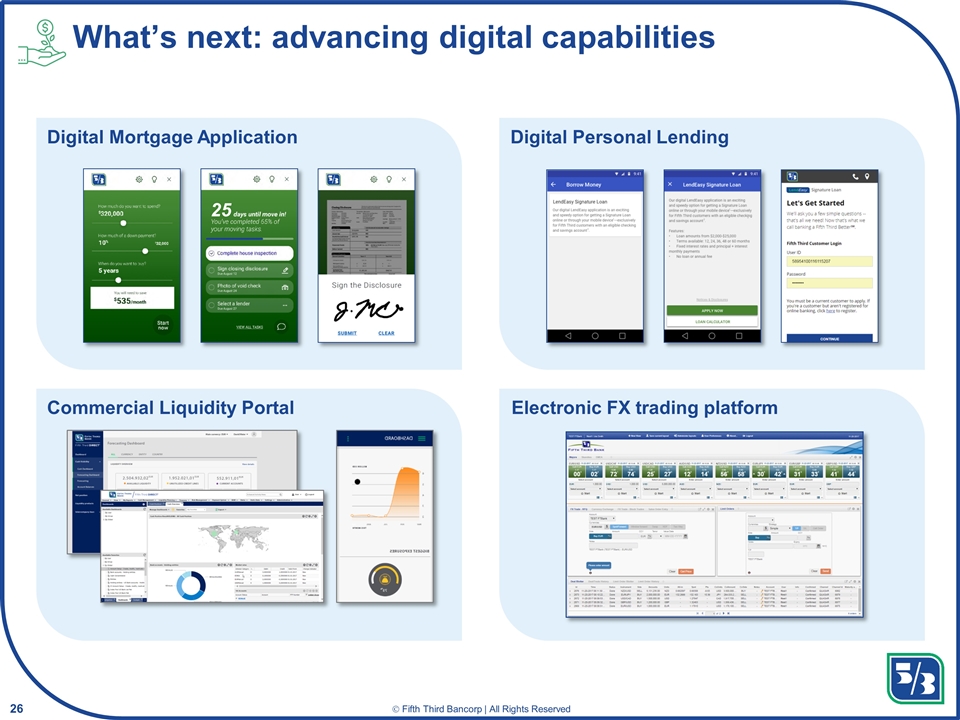
What’s next: advancing digital capabilities Digital Mortgage Application Digital Personal Lending Commercial Liquidity Portal Electronic FX trading platform 25
Payments & Commerce Solutions Jed Scala Executive Vice President Head of Payments Print to the end
Large, growing, attractive market New entrants present opportunities Increased expectations Relationship cornerstone Higher return business Provides diversification & resiliency Key contributor to NorthStar strategy Growing payments is strategically important Market Dynamics Customer Imperative Financial Objectives
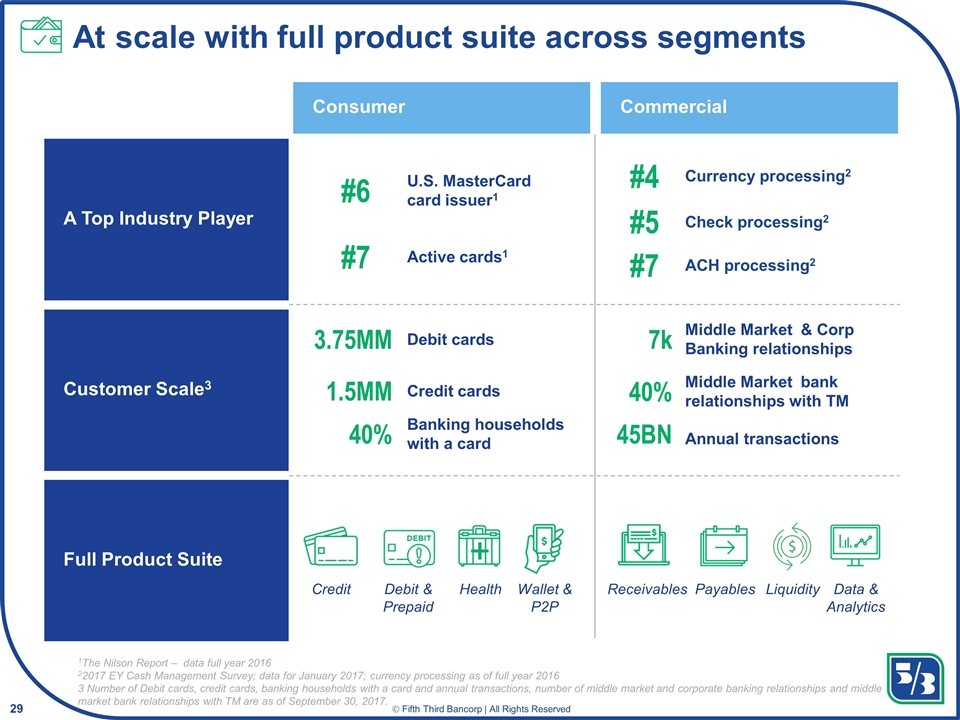
1The Nilson Report – data full year 2016 22017 EY Cash Management Survey; data for January 2017; currency processing as of full year 2016 3 Number of Debit cards, credit cards, banking households with a card and annual transactions, number of middle market and corporate banking relationships and middle market bank relationships with TM are as of September 30, 2017. A Top Industry Player Customer Scale3 Full Product Suite Consumer Commercial Active cards1 U.S. MasterCard card issuer1 #7 #6 3.75MM 1.5MM 40% Debit cards Credit cards Banking households with a card Credit Debit & Prepaid Health Wallet & P2P Check processing2 Currency processing2 #5 #4 ACH processing2 #7 7k 40% 45BN Middle Market & Corp Banking relationships Middle Market bank relationships with TM Annual transactions Receivables Payables Liquidity Data & Analytics At scale with full product suite across segments
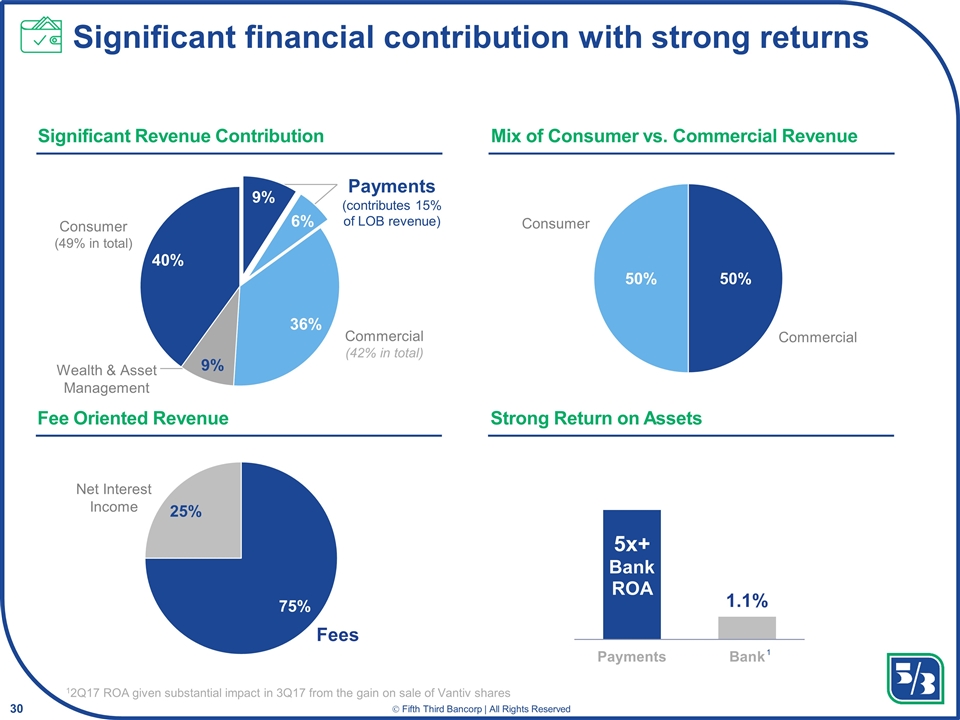
12Q17 ROA given substantial impact in 3Q17 from the gain on sale of Vantiv shares 1 Mix of Consumer vs. Commercial Revenue Fee Oriented Revenue Strong Return on Assets Significant Revenue Contribution Significant financial contribution with strong returns
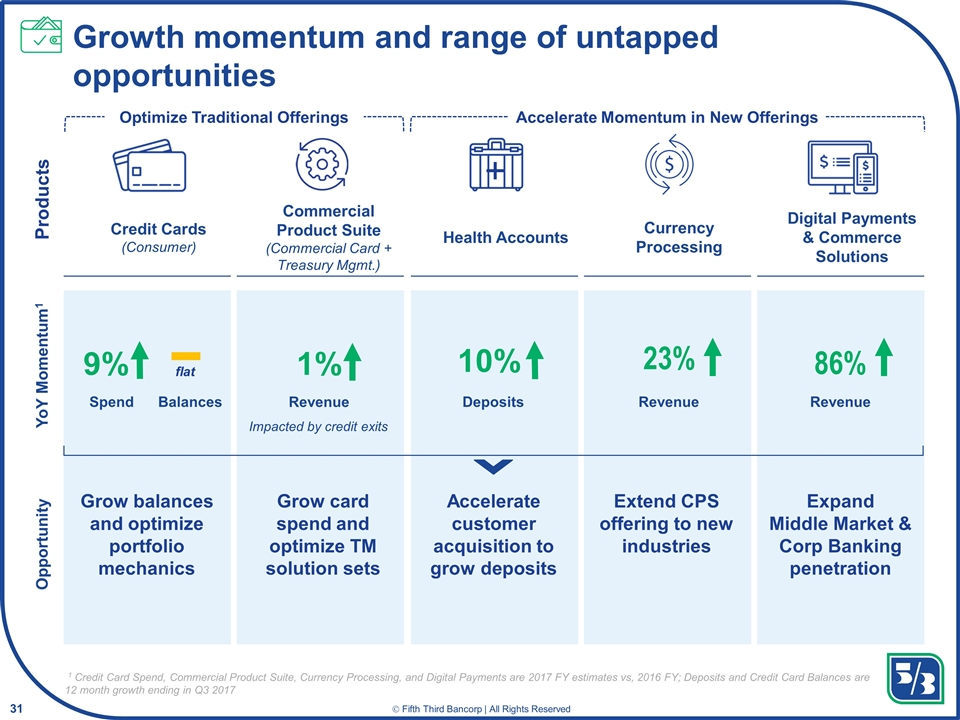
YoY Momentum1 Opportunity Products Optimize Traditional Offerings Accelerate Momentum in New Offerings Credit Cards (Consumer) Commercial Product Suite (Commercial Card + Treasury Mgmt.) Health Accounts Currency Processing Digital Payments & Commerce Solutions Deposits Revenue Revenue Revenue Spend 9% 10% 23% 86% 1% Balances flat Grow balances and optimize portfolio mechanics Grow card spend and optimize TM solution sets Accelerate customer acquisition to grow deposits Extend CPS offering to new industries Expand Middle Market & Corp Banking penetration 1 Credit Card Spend, Commercial Product Suite, Currency Processing, and Digital Payments are 2017 FY estimates vs, 2016 FY; Deposits and Credit Card Balances are 12 month growth ending in Q3 2017 -Changed “AR” to “Balances” under Credit Card column -Changed Revenue from “1%” to “4%” and added “excluding strategic exits -Need to validate that 4% is the correct number -Jamie asked if the last column was included in column 2 and if we pull it out, what would be the impact on the growth -Added “& Corp Banking” under opportunity under Digital Payments Column Impacted by credit exits Growth momentum and range of untapped opportunities
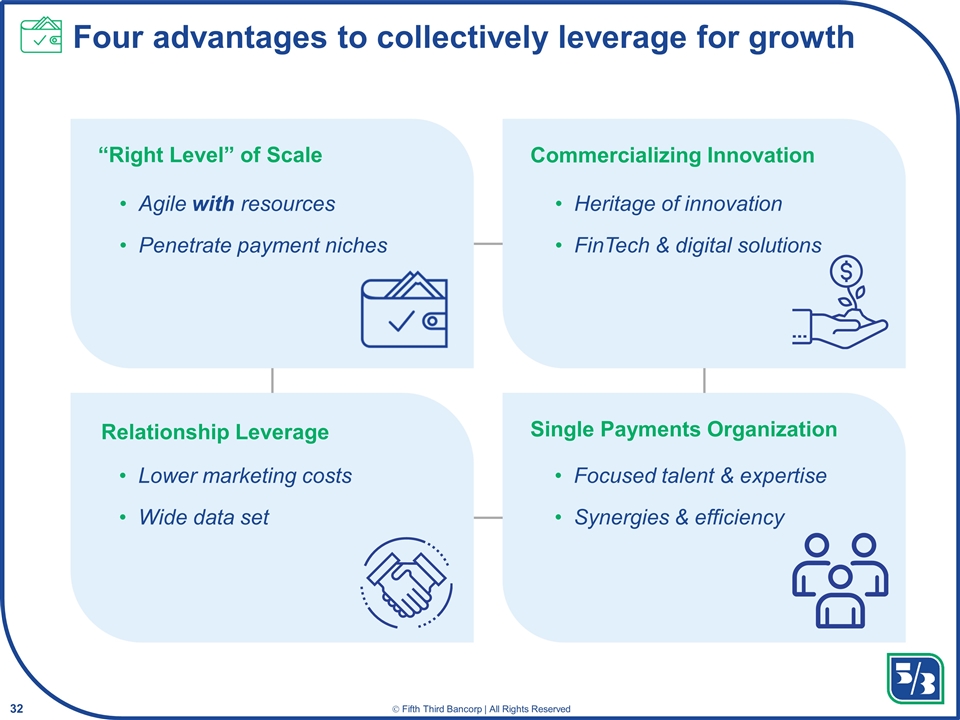
“Right Level” of Scale Commercializing Innovation Relationship Leverage Single Payments Organization Agile with resources Penetrate payment niches Heritage of innovation FinTech & digital solutions Lower marketing costs Wide data set Focused talent & expertise Synergies & efficiency Four advantages to collectively leverage for growth
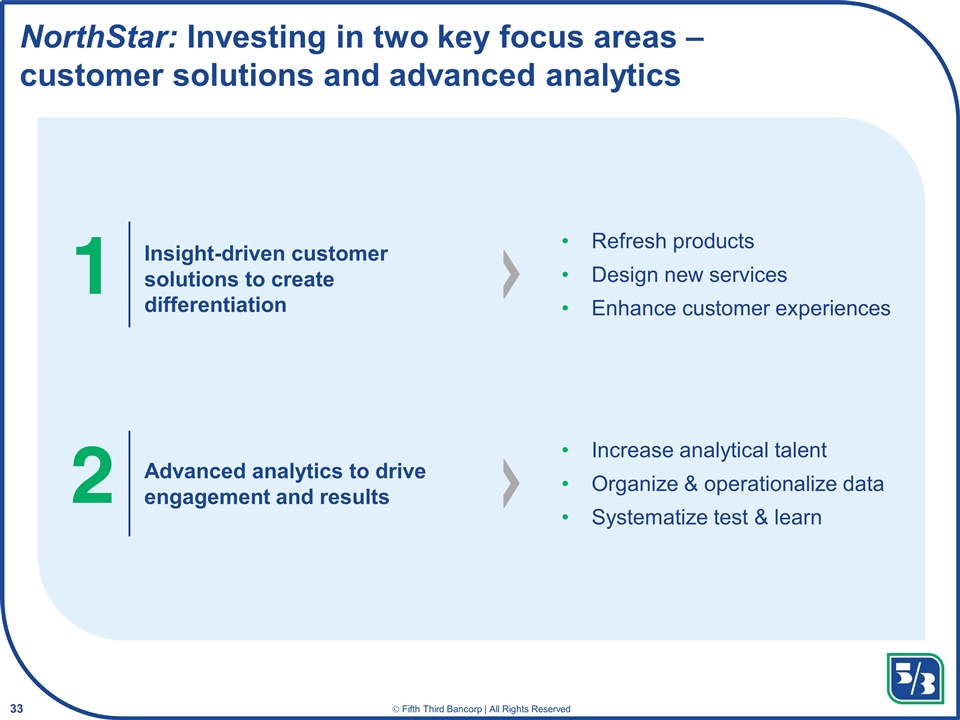
NorthStar: Investing in two key focus areas – customer solutions and advanced analytics 1 Insight-driven customer solutions to create differentiation Refresh products Design new services Enhance customer experiences 2 Advanced analytics to drive engagement and results Increase analytical talent Organize & operationalize data Systematize test & learn
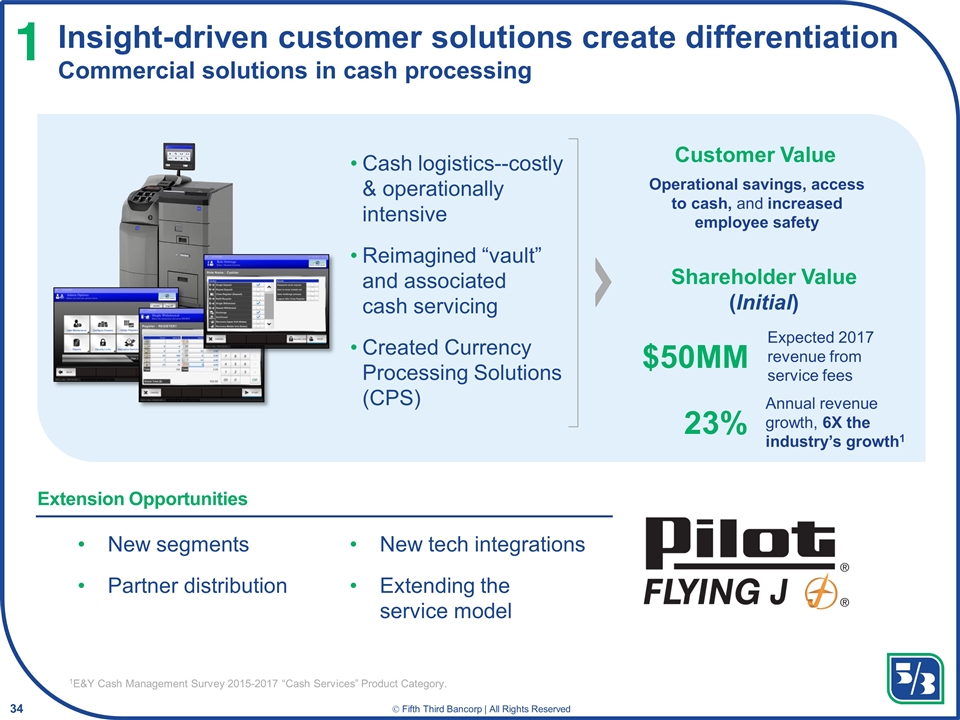
Insight-driven customer solutions create differentiation Commercial solutions in cash processing 1 Cash logistics--costly & operationally intensive Reimagined “vault” and associated cash servicing Created Currency Processing Solutions (CPS) Expected 2017 revenue from service fees Annual revenue growth, 6X the industry’s growth1 $50MM 23% Operational savings, access to cash, and increased employee safety -Removed Delaware North logo -researching amount of cash payments Added footnote 1E&Y Cash Management Survey 2015-2017 “Cash Services” Product Category. Customer Value Shareholder Value (Initial) New segments Partner distribution New tech integrations Extending the service model Extension Opportunities
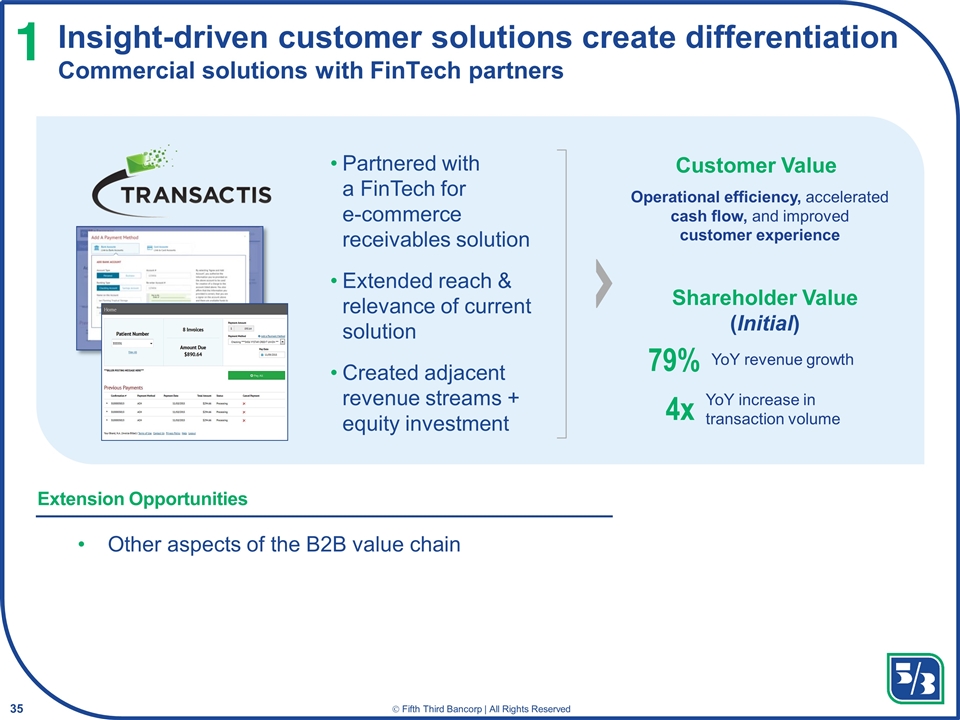
Insight-driven customer solutions create differentiation Commercial solutions with FinTech partners 1 Partnered with a FinTech for e-commerce receivables solution Extended reach & relevance of current solution Created adjacent revenue streams + equity investment YoY revenue growth YoY increase in transaction volume 79% 4x Operational efficiency, accelerated cash flow, and improved customer experience Customer Value Shareholder Value (Initial) Other aspects of the B2B value chain Extension Opportunities
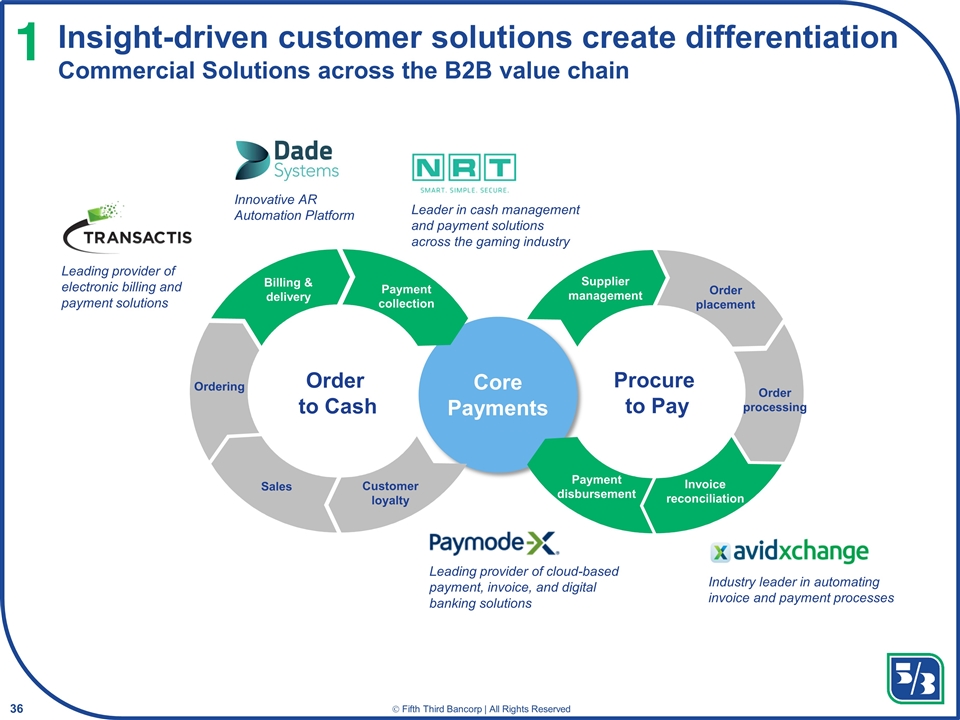
Insight-driven customer solutions create differentiation Commercial Solutions across the B2B value chain 1 Changed Supplier Management to Green per discussion with Bridgit Billing & delivery Payment collection Customer loyalty Sales Ordering Payment disbursement Invoice reconciliation Order processing Order placement Supplier management Order to Cash Procure to Pay Leading provider of electronic billing and payment solutions Leader in cash management and payment solutions across the gaming industry Core Payments Leading provider of cloud-based payment, invoice, and digital banking solutions Industry leader in automating invoice and payment processes Innovative AR Automation Platform
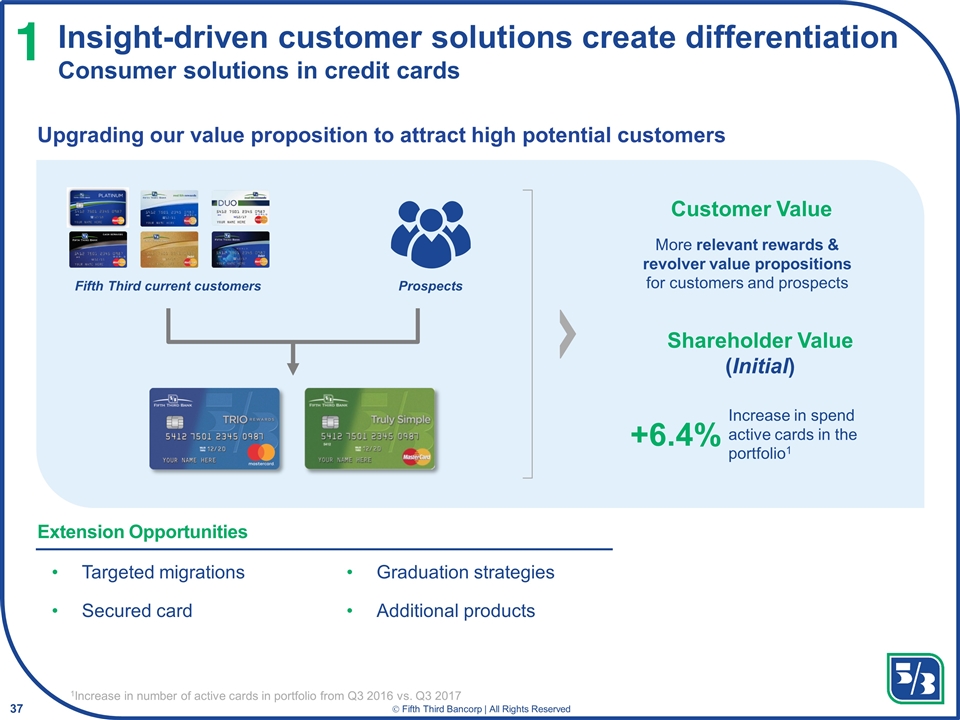
Insight-driven customer solutions create differentiation Consumer solutions in credit cards 1 Increase in spend active cards in the portfolio1 +6.4% More relevant rewards & revolver value propositions for customers and prospects Upgrading our value proposition to attract high potential customers Fifth Third current customers Prospects 1Increase in number of active cards in portfolio from Q3 2016 vs. Q3 2017 Customer Value Shareholder Value (Initial) Targeted migrations Secured card Graduation strategies Additional products Extension Opportunities
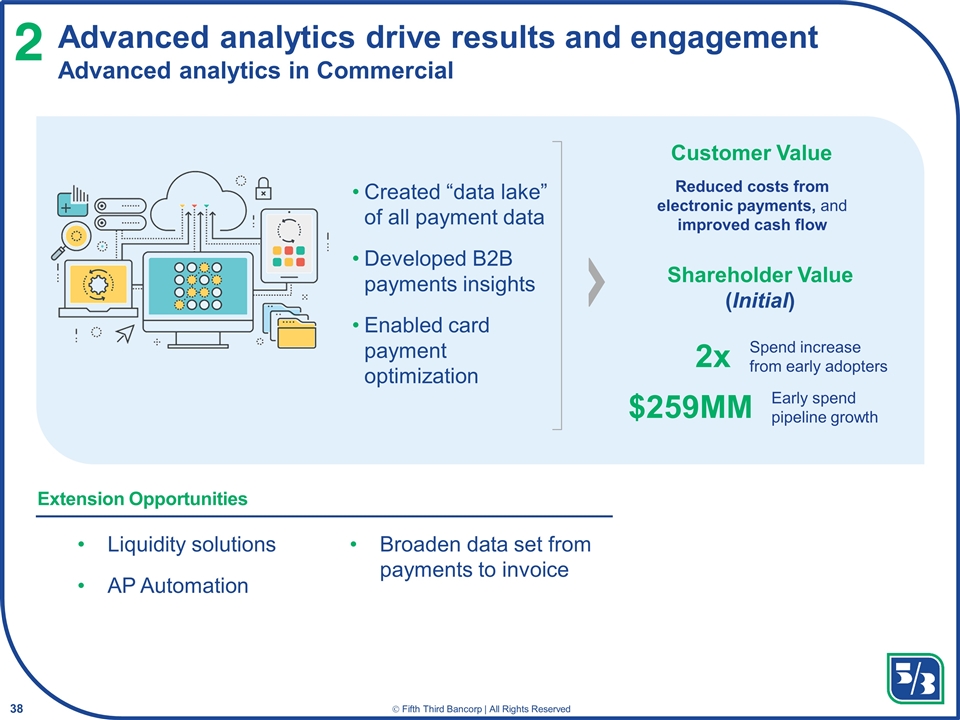
Advanced analytics drive results and engagement Advanced analytics in Commercial 2 Created “data lake” of all payment data Developed B2B payments insights Enabled card payment optimization Spend increase from early adopters Early spend pipeline growth 2x $259MM Reduced costs from electronic payments, and improved cash flow Customer Value Shareholder Value (Initial) Liquidity solutions AP Automation Broaden data set from payments to invoice Extension Opportunities
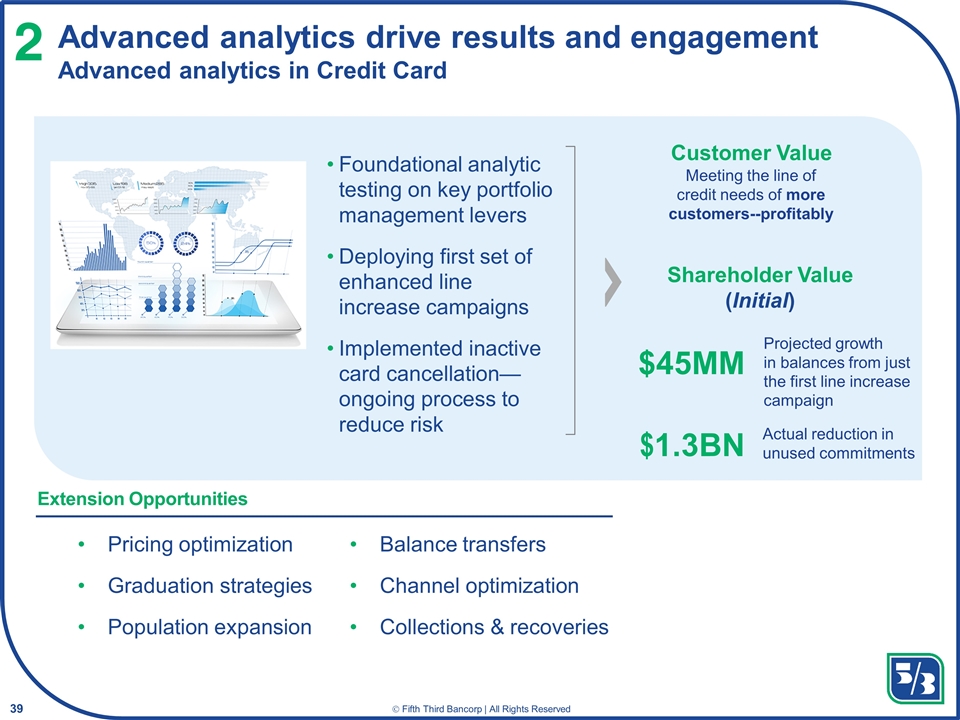
Advanced analytics drive results and engagement Advanced analytics in Credit Card 2 Foundational analytic testing on key portfolio management levers Deploying first set of enhanced line increase campaigns Implemented inactive card cancellation— ongoing process to reduce risk Projected growth in balances from just the first line increase campaign $45MM Meeting the line of credit needs of more customers--profitably Actual reduction in unused commitments $1.3BN Pricing optimization Graduation strategies Population expansion Balance transfers Channel optimization Collections & recoveries Extension Opportunities Customer Value Shareholder Value (Initial)
Payments & Commerce Solutions summary Existing large scale business with attractive returns Extending advantages by investing in customer solutions & analytics Executing at pace against a range of growth opportunities Targeting profitable growth and consistent performance
Market dynamics are creating the opportunity and imperative to reimagine the business model Brand, Analytics, Digital, and Payments summary Fifth Third is investing in key areas of differentiation to deliver a superior client experience and our NorthStar targets Strategies in each area are already bearing fruit and the signs of success are positive
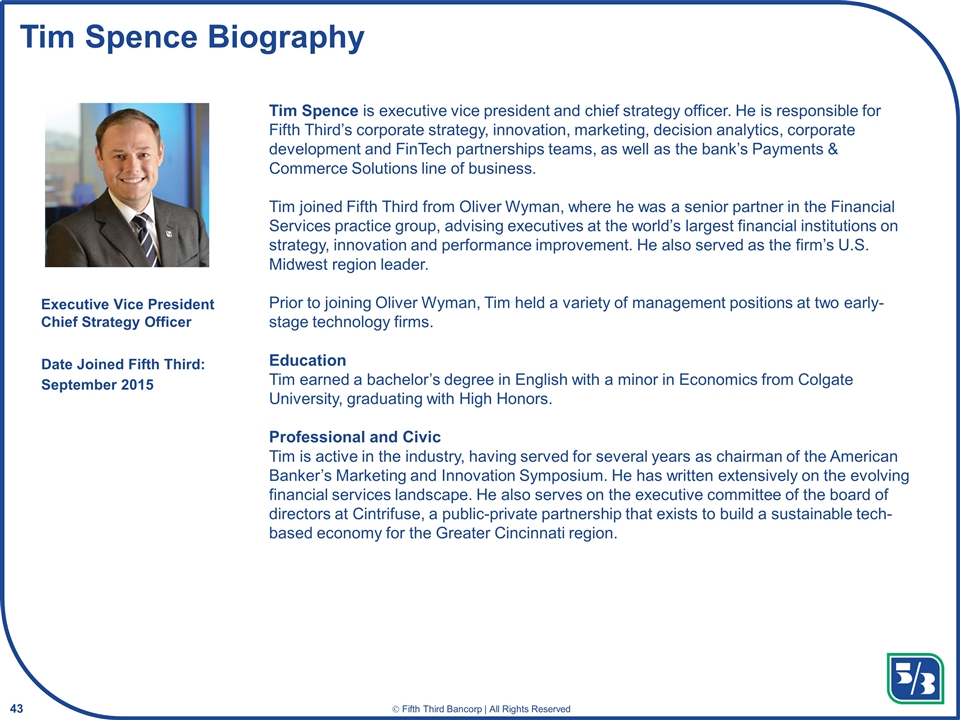
Tim Spence Biography Tim Spence is executive vice president and chief strategy officer. He is responsible for Fifth Third’s corporate strategy, innovation, marketing, decision analytics, corporate development and FinTech partnerships teams, as well as the bank’s Payments & Commerce Solutions line of business. Tim joined Fifth Third from Oliver Wyman, where he was a senior partner in the Financial Services practice group, advising executives at the world’s largest financial institutions on strategy, innovation and performance improvement. He also served as the firm’s U.S. Midwest region leader. Prior to joining Oliver Wyman, Tim held a variety of management positions at two early-stage technology firms. Education Tim earned a bachelor’s degree in English with a minor in Economics from Colgate University, graduating with High Honors. Professional and Civic Tim is active in the industry, having served for several years as chairman of the American Banker’s Marketing and Innovation Symposium. He has written extensively on the evolving financial services landscape. He also serves on the executive committee of the board of directors at Cintrifuse, a public-private partnership that exists to build a sustainable tech-based economy for the Greater Cincinnati region. Executive Vice President Chief Strategy Officer Date Joined Fifth Third: September 2015
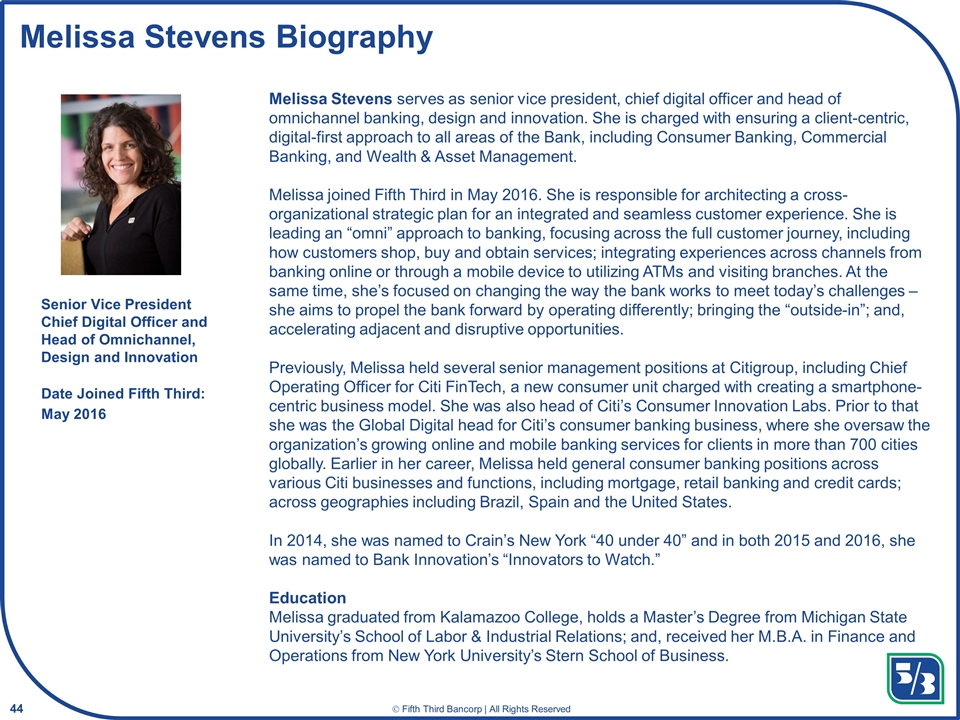
Melissa Stevens Biography Melissa Stevens serves as senior vice president, chief digital officer and head of omnichannel banking, design and innovation. She is charged with ensuring a client-centric, digital-first approach to all areas of the Bank, including Consumer Banking, Commercial Banking, and Wealth & Asset Management. Melissa joined Fifth Third in May 2016. She is responsible for architecting a cross-organizational strategic plan for an integrated and seamless customer experience. She is leading an “omni” approach to banking, focusing across the full customer journey, including how customers shop, buy and obtain services; integrating experiences across channels from banking online or through a mobile device to utilizing ATMs and visiting branches. At the same time, she’s focused on changing the way the bank works to meet today’s challenges – she aims to propel the bank forward by operating differently; bringing the “outside-in”; and, accelerating adjacent and disruptive opportunities. Previously, Melissa held several senior management positions at Citigroup, including Chief Operating Officer for Citi FinTech, a new consumer unit charged with creating a smartphone-centric business model. She was also head of Citi’s Consumer Innovation Labs. Prior to that she was the Global Digital head for Citi’s consumer banking business, where she oversaw the organization’s growing online and mobile banking services for clients in more than 700 cities globally. Earlier in her career, Melissa held general consumer banking positions across various Citi businesses and functions, including mortgage, retail banking and credit cards; across geographies including Brazil, Spain and the United States. In 2014, she was named to Crain’s New York “40 under 40” and in both 2015 and 2016, she was named to Bank Innovation’s “Innovators to Watch.” Education Melissa graduated from Kalamazoo College, holds a Master’s Degree from Michigan State University’s School of Labor & Industrial Relations; and, received her M.B.A. in Finance and Operations from New York University’s Stern School of Business. Senior Vice President Chief Digital Officer and Head of Omnichannel, Design and Innovation Date Joined Fifth Third: May 2016
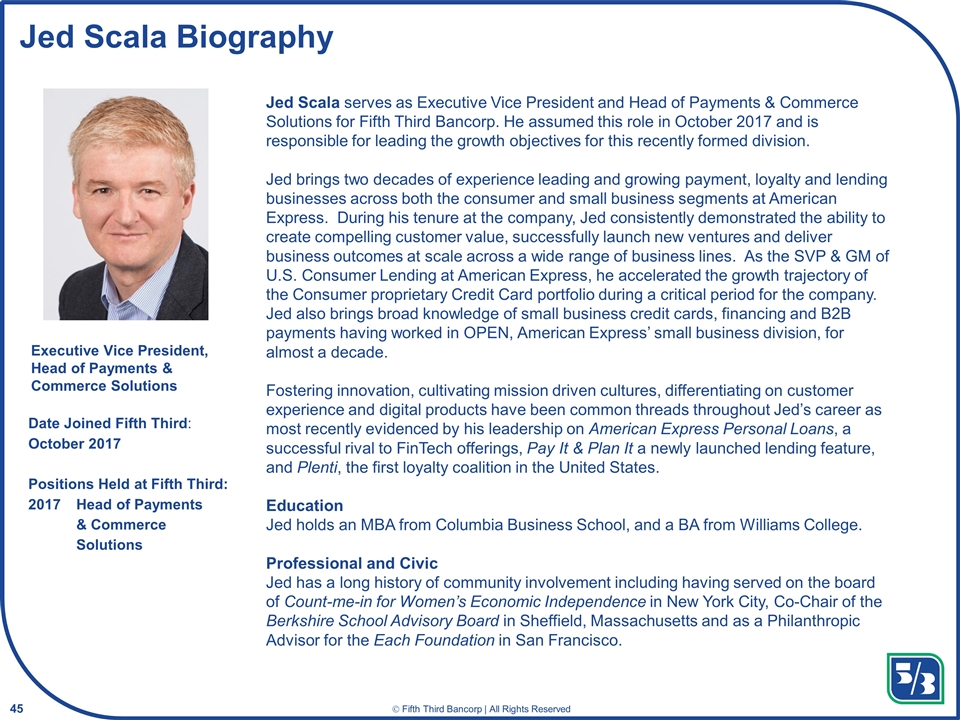
Jed Scala Biography Executive Vice President, Head of Payments & Commerce Solutions Date Joined Fifth Third: October 2017 Positions Held at Fifth Third: 2017Head of Payments & Commerce Solutions Jed Scala serves as Executive Vice President and Head of Payments & Commerce Solutions for Fifth Third Bancorp. He assumed this role in October 2017 and is responsible for leading the growth objectives for this recently formed division. Jed brings two decades of experience leading and growing payment, loyalty and lending businesses across both the consumer and small business segments at American Express. During his tenure at the company, Jed consistently demonstrated the ability to create compelling customer value, successfully launch new ventures and deliver business outcomes at scale across a wide range of business lines. As the SVP & GM of U.S. Consumer Lending at American Express, he accelerated the growth trajectory of the Consumer proprietary Credit Card portfolio during a critical period for the company. Jed also brings broad knowledge of small business credit cards, financing and B2B payments having worked in OPEN, American Express’ small business division, for almost a decade. Fostering innovation, cultivating mission driven cultures, differentiating on customer experience and digital products have been common threads throughout Jed’s career as most recently evidenced by his leadership on American Express Personal Loans, a successful rival to FinTech offerings, Pay It & Plan It a newly launched lending feature, and Plenti, the first loyalty coalition in the United States. Education Jed holds an MBA from Columbia Business School, and a BA from Williams College. Professional and Civic Jed has a long history of community involvement including having served on the board of Count-me-in for Women’s Economic Independence in New York City, Co-Chair of the Berkshire School Advisory Board in Sheffield, Massachusetts and as a Philanthropic Advisor for the Each Foundation in San Francisco.
Technology & Operations Aravind Immaneni Executive Vice President Chief Operations & Technology Officer
Cautionary statement This presentation contains statements that we believe are “forward-looking statements” within the meaning of Section 27A of the Securities Act of 1933, as amended, and Rule 175 promulgated thereunder, and Section 21E of the Securities Exchange Act of 1934, as amended, and Rule 3b-6 promulgated thereunder. These statements relate to our financial condition, results of operations, plans, objectives, future performance or business. They usually can be identified by the use of forward-looking language such as “will likely result,” “may,” “are expected to,” “is anticipated,” “potential,” “estimate,” “forecast,” “projected,” “intends to,” or may include other similar words or phrases such as “believes,” “plans,” “trend,” “objective,” “continue,” “remain,” or similar expressions, or future or conditional verbs such as “will,” “would,” “should,” “could,” “might,” “can,” or similar verbs. You should not place undue reliance on these statements, as they are subject to risks and uncertainties, including but not limited to the risk factors set forth in our most recent Annual Report on Form 10-K, as updated by our Quarterly Reports on Form 10-Q. When considering these forward-looking statements, you should keep in mind these risks and uncertainties, as well as any cautionary statements we may make. Moreover, you should treat these statements as speaking only as of the date they are made and based only on information then actually known to us. We undertake no obligation to release revisions to these forward-looking statements or reflect events or circumstances after the date of this document. There are a number of important factors that could cause future results to differ materially from historical performance and these forward-looking statements. Factors that might cause such a difference include, but are not limited to: (1) general economic or real estate market conditions, either nationally or in the states in which Fifth Third, one or more acquired entities and/or the combined company do business, weaken or are less favorable than expected; (2) deteriorating credit quality; (3) political developments, wars or other hostilities may disrupt or increase volatility in securities markets or other economic conditions; (4) changes in the interest rate environment reduce interest margins; (5) prepayment speeds, loan origination and sale volumes, charge-offs and loan loss provisions; (6) Fifth Third’s ability to maintain required capital levels and adequate sources of funding and liquidity; (7) maintaining capital requirements and adequate sources of funding and liquidity may limit Fifth Third’s operations and potential growth; (8) changes and trends in capital markets; (9) problems encountered by larger or similar financial institutions may adversely affect the banking industry and/or Fifth Third; (10) competitive pressures among depository institutions increase significantly; (11) changes in customer preferences or information technology systems; (12) effects of critical accounting policies and judgments; (13) changes in accounting policies or procedures as may be required by the Financial Accounting Standards Board (FASB) or other regulatory agencies; (14) legislative or regulatory changes or actions, or significant litigation, adversely affect Fifth Third, one or more acquired entities and/or the combined company or the businesses in which Fifth Third, one or more acquired entities and/or the combined company are engaged, including the Dodd-Frank Wall Street Reform and Consumer Protection Act; (15) ability to maintain favorable ratings from rating agencies; (16) failure of models or risk management systems or controls; (17) fluctuation of Fifth Third’s stock price; (18) ability to attract and retain key personnel; (19) ability to receive dividends from its subsidiaries; (20) potentially dilutive effect of future acquisitions on current shareholders’ ownership of Fifth Third; (21) declines in the value of Fifth Third’s goodwill or other intangible assets; (22) effects of accounting or financial results of one or more acquired entities; (23) difficulties from Fifth Third’s investment in, relationship with, and nature of the operations of Vantiv Holding, LLC; (24) loss of income from any sale or potential sale of businesses; (25) difficulties in separating the operations of any branches or other assets divested; (26) losses or adverse impacts on the carrying values of branches and long-lived assets in connection with their sales or anticipated sales; (27) inability to achieve expected benefits from branch consolidations and planned sales within desired timeframes, if at all; (28) ability to secure confidential information and deliver products and services through the use of computer systems and telecommunications networks; (29) the negotiation and (if any) implementation by Vantiv, Inc. and/or Worldpay Group plc of the potential acquisition of Worldpay Group plc by Vantiv, Inc. and such other actions as Vantiv, Inc. and Worldpay Group plc may take in furtherance thereof; and (30) the impact of reputational risk created by these developments on such matters as business generation and retention, funding and liquidity. You should refer to our periodic and current reports filed with the Securities and Exchange Commission, or “SEC,” for further information on other factors, which could cause actual results to be significantly different from those expressed or implied by these forward-looking statements. In this presentation, we may sometimes provide non-GAAP financial information. Please note that although non-GAAP financial measures provide useful insight to analysts, investors and regulators, they should not be considered in isolation or relied upon as a substitute for analysis using GAAP measures. If applicable, we provide GAAP reconciliations for non-GAAP measures in a later slide in this presentation which is also available in the investor relations section of our website, www.53.com.
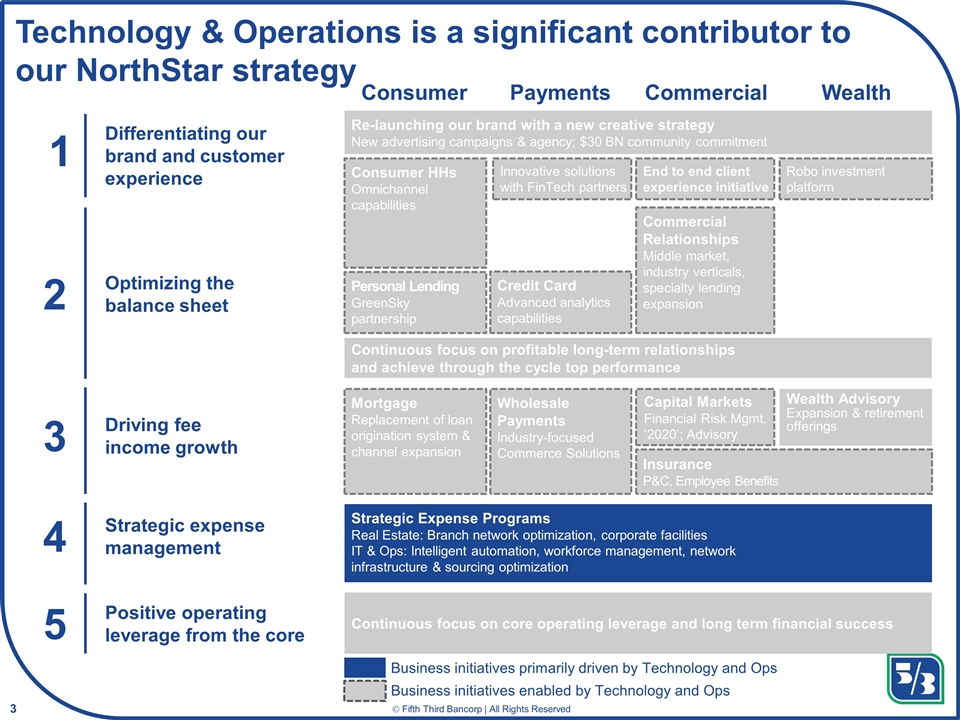
Capital Markets Financial Risk Mgmt. ‘2020’; Advisory Technology & Operations is a significant contributor to our NorthStar strategy 1 Differentiating our brand and customer experience 2 Optimizing the balance sheet Driving fee income growth 3 4 Strategic expense management Consumer Payments Commercial Wealth 5 Positive operating leverage from the core Personal Lending GreenSky partnership Credit Card Advanced analytics capabilities Wholesale Payments Industry-focused Commerce Solutions Insurance P&C, Employee Benefits Commercial Relationships Middle market, industry verticals, specialty lending expansion Wealth Advisory Expansion & retirement offerings Strategic Expense Programs Real Estate: Branch network optimization, corporate facilities IT & Ops: Intelligent automation, workforce management, network infrastructure & sourcing optimization Re-launching our brand with a new creative strategy New advertising campaigns & agency; $30 BN community commitment Consumer HHs Omnichannel capabilities Continuous focus on core operating leverage and long term financial success Mortgage Replacement of loan origination system & channel expansion Continuous focus on profitable long-term relationships and achieve through the cycle top performance End to end client experience initiative Robo investment platform Innovative solutions with FinTech partners Business initiatives enabled by Technology and Ops Business initiatives primarily driven by Technology and Ops
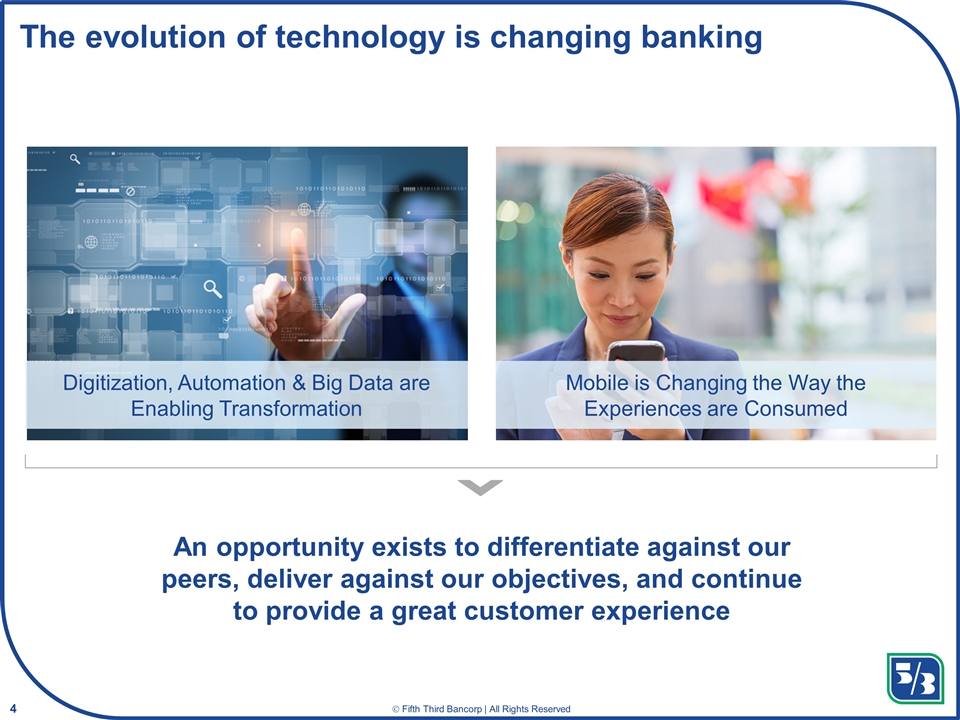
The evolution of technology is changing banking Digitization, Automation & Big Data are Enabling Transformation An opportunity exists to differentiate against our peers, deliver against our objectives, and continue to provide a great customer experience Mobile is Changing the Way the Experiences are Consumed
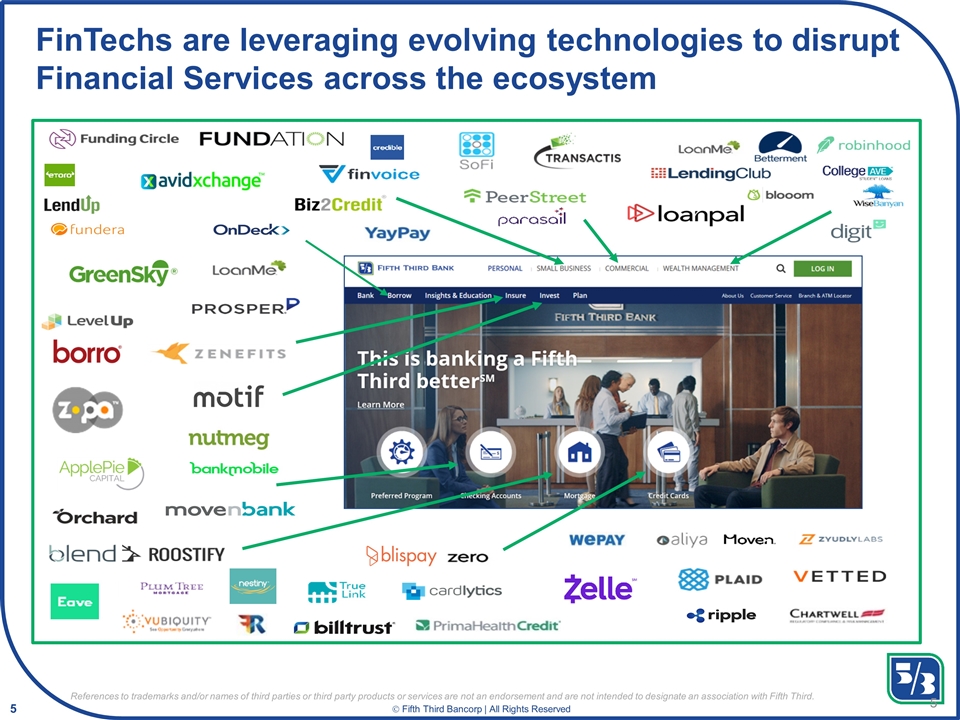
FinTechs are leveraging evolving technologies to disrupt Financial Services across the ecosystem References to trademarks and/or names of third parties or third party products or services are not an endorsement and are not intended to designate an association with Fifth Third.
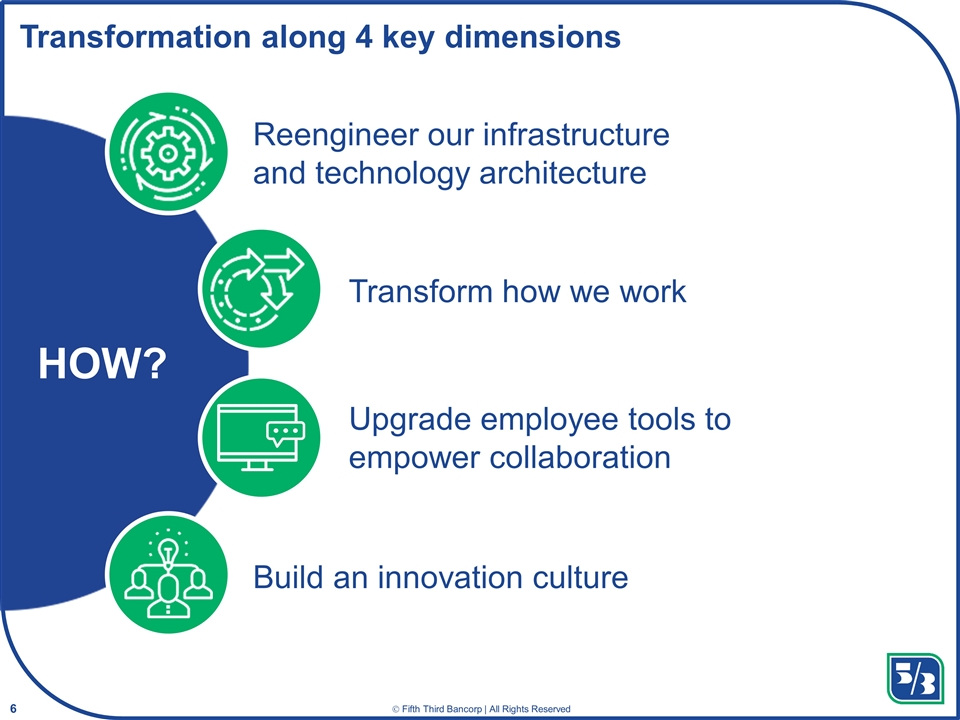
Build an innovation culture Transform how we work Upgrade employee tools to empower collaboration Reengineer our infrastructure and technology architecture HOW? Transformation along 4 key dimensions
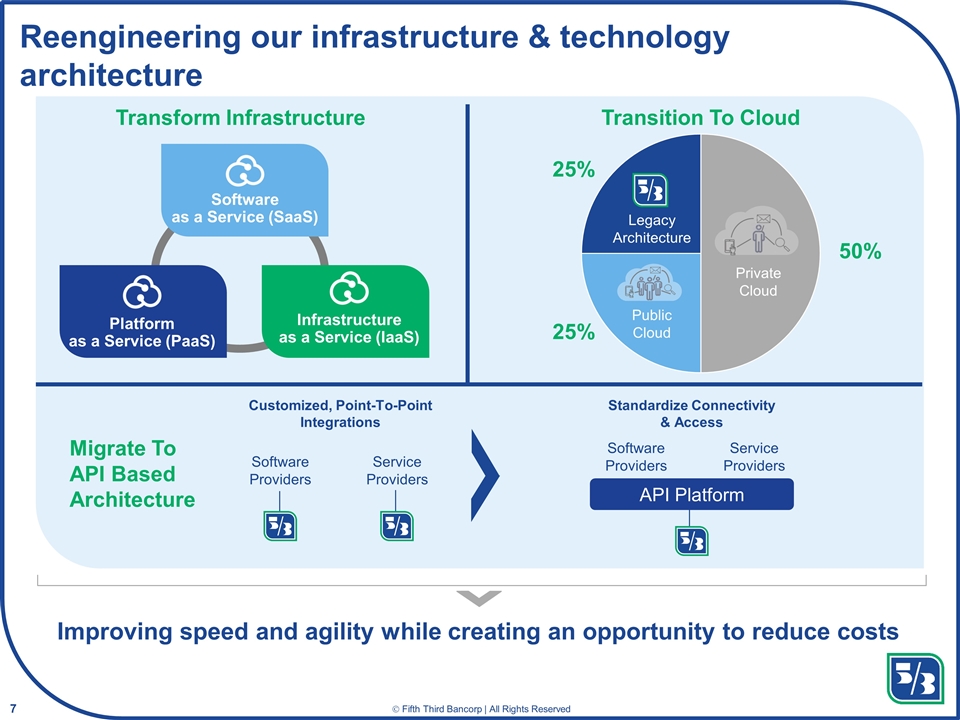
Reengineering our infrastructure & technology architecture Transform Infrastructure Transition To Cloud Migrate To API Based Architecture Platform as a Service (PaaS) Private Cloud Public Cloud Legacy Architecture Standardize Connectivity & Access Software Providers Service Providers Customized, Point-To-Point Integrations Software Providers Service Providers API Platform Improving speed and agility while creating an opportunity to reduce costs 25% 25% 50% Infrastructure as a Service (IaaS) Software as a Service (SaaS)
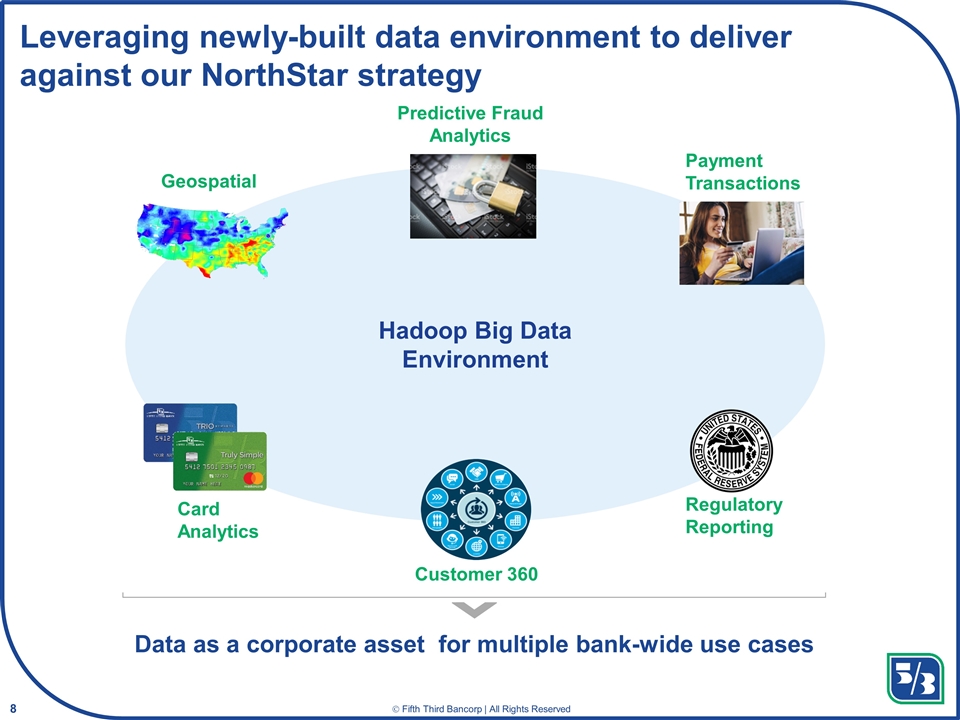
Leveraging newly-built data environment to deliver against our NorthStar strategy Data as a corporate asset for multiple bank-wide use cases Hadoop Big Data Environment Payment Transactions Card Analytics Regulatory Reporting Predictive Fraud Analytics Geospatial Customer 360
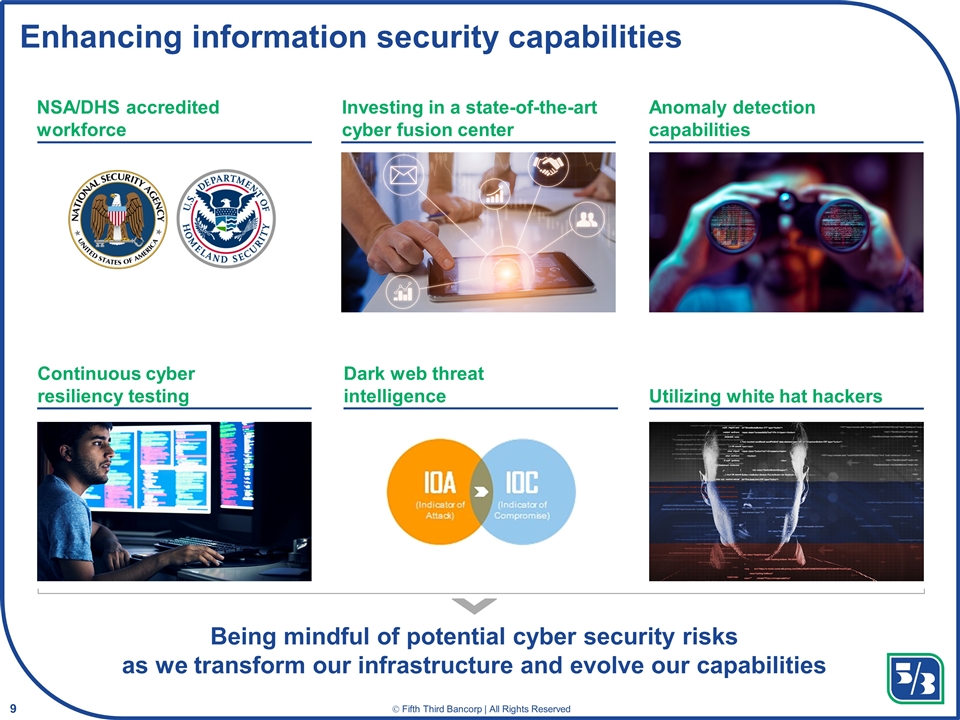
Enhancing information security capabilities Being mindful of potential cyber security risks as we transform our infrastructure and evolve our capabilities Investing in a state-of-the-art cyber fusion center Anomaly detection capabilities NSA/DHS accredited workforce Continuous cyber resiliency testing Dark web threat intelligence Utilizing white hat hackers
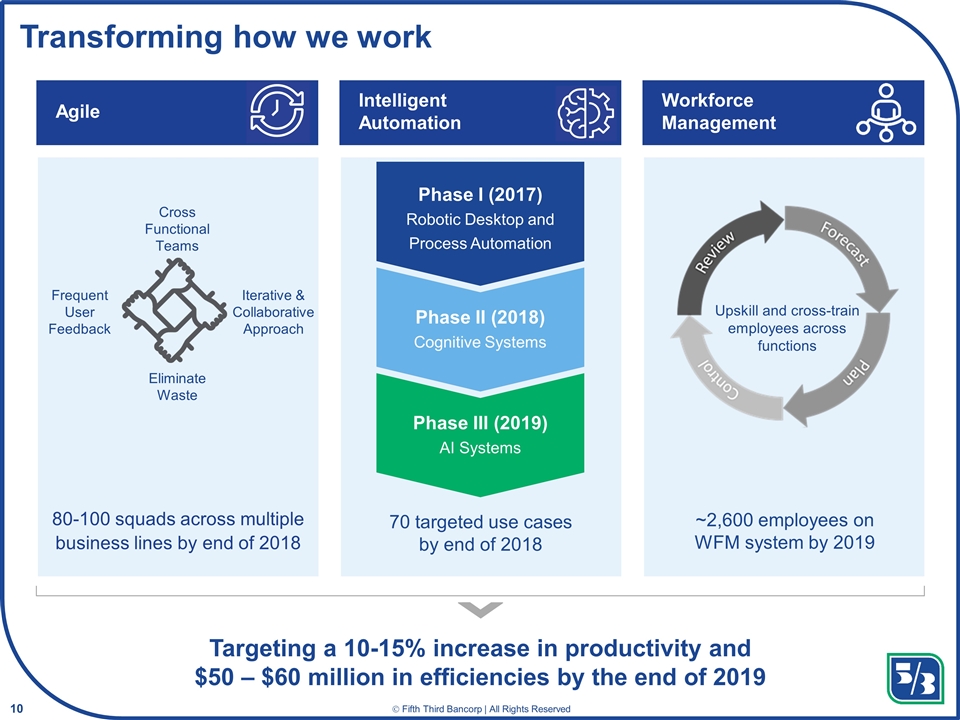
Transforming how we work Agile Intelligent Automation Workforce Management Cross Functional Teams Eliminate Waste Iterative & Collaborative Approach Frequent User Feedback 80-100 squads across multiple business lines by end of 2018 70 targeted use cases by end of 2018 ~2,600 employees on WFM system by 2019 Upskill and cross-train employees across functions Targeting a 10-15% increase in productivity and $50 – $60 million in efficiencies by the end of 2019 Phase I (2017) Robotic Desktop and Process Automation Phase II (2018) Cognitive Systems Phase III (2019) AI Systems
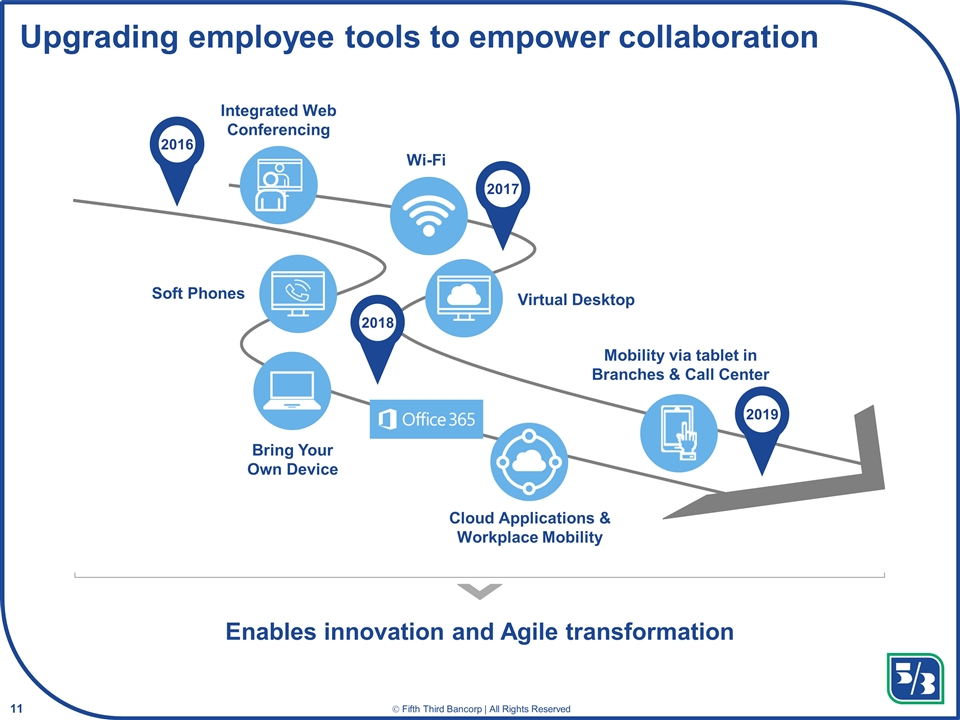
Upgrading employee tools to empower collaboration Soft Phones Bring Your Own Device Virtual Desktop Cloud Applications & Workplace Mobility Integrated Web Conferencing Wi-Fi Mobility via tablet in Branches & Call Center 2016 2017 2018 2019 Enables innovation and Agile transformation
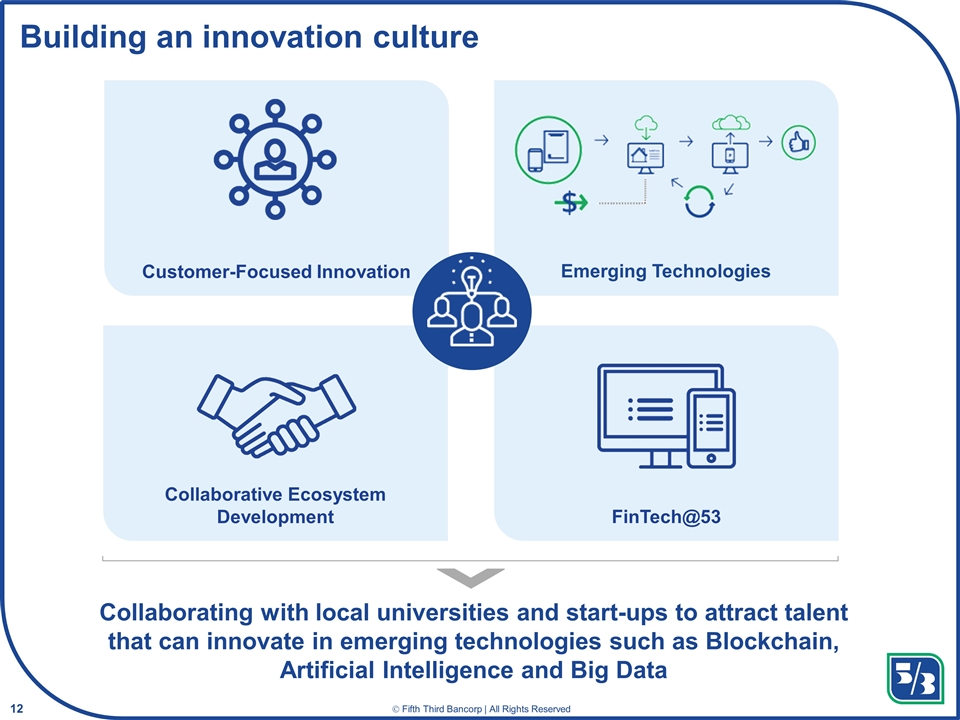
Building an innovation culture Collaborating with local universities and start-ups to attract talent that can innovate in emerging technologies such as Blockchain, Artificial Intelligence and Big Data Customer-Focused Innovation Collaborative Ecosystem Development FinTech@53 Emerging Technologies
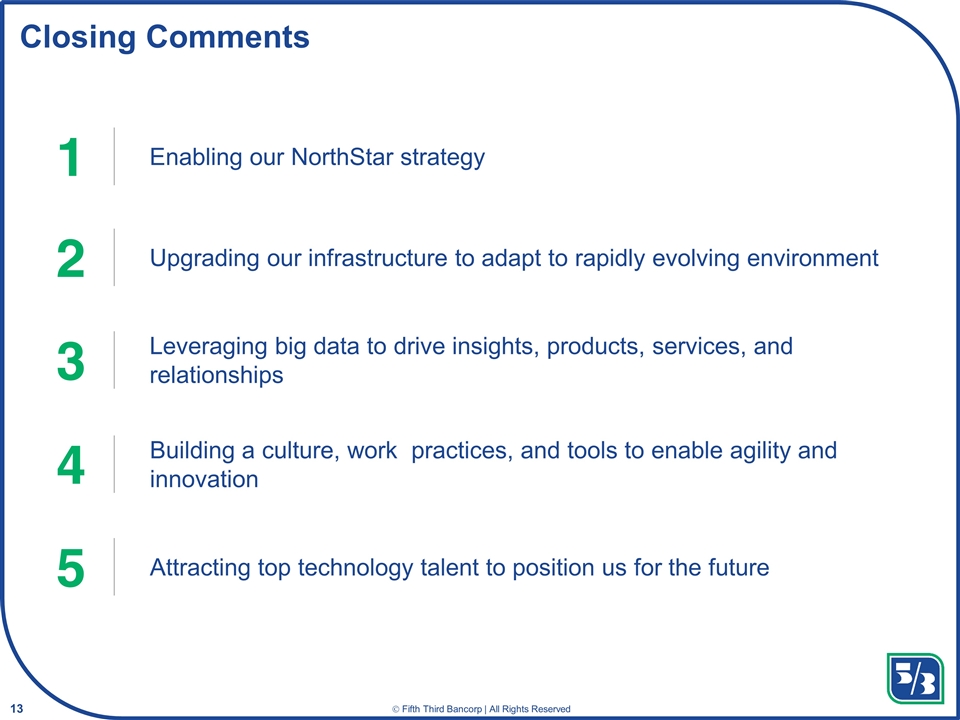
Closing Comments 1 Enabling our NorthStar strategy 2 Upgrading our infrastructure to adapt to rapidly evolving environment 3 Leveraging big data to drive insights, products, services, and relationships 4 Building a culture, work practices, and tools to enable agility and innovation 5 Attracting top technology talent to position us for the future
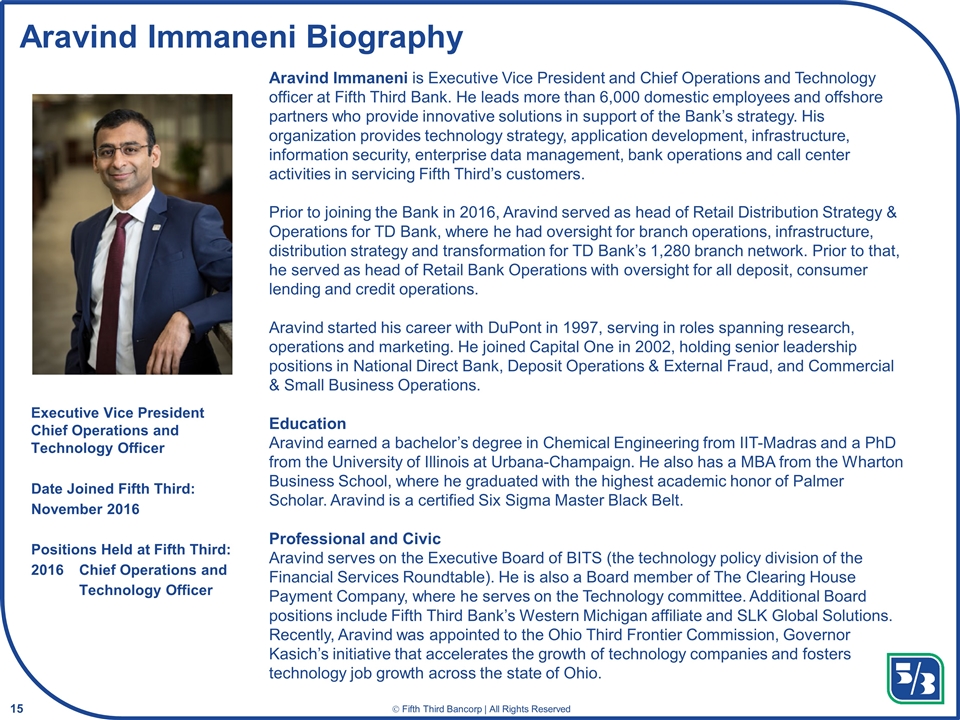
Aravind Immaneni Biography Aravind Immaneni is Executive Vice President and Chief Operations and Technology officer at Fifth Third Bank. He leads more than 6,000 domestic employees and offshore partners who provide innovative solutions in support of the Bank’s strategy. His organization provides technology strategy, application development, infrastructure, information security, enterprise data management, bank operations and call center activities in servicing Fifth Third’s customers. Prior to joining the Bank in 2016, Aravind served as head of Retail Distribution Strategy & Operations for TD Bank, where he had oversight for branch operations, infrastructure, distribution strategy and transformation for TD Bank’s 1,280 branch network. Prior to that, he served as head of Retail Bank Operations with oversight for all deposit, consumer lending and credit operations. Aravind started his career with DuPont in 1997, serving in roles spanning research, operations and marketing. He joined Capital One in 2002, holding senior leadership positions in National Direct Bank, Deposit Operations & External Fraud, and Commercial & Small Business Operations. Education Aravind earned a bachelor’s degree in Chemical Engineering from IIT-Madras and a PhD from the University of Illinois at Urbana-Champaign. He also has a MBA from the Wharton Business School, where he graduated with the highest academic honor of Palmer Scholar. Aravind is a certified Six Sigma Master Black Belt. Professional and Civic Aravind serves on the Executive Board of BITS (the technology policy division of the Financial Services Roundtable). He is also a Board member of The Clearing House Payment Company, where he serves on the Technology committee. Additional Board positions include Fifth Third Bank’s Western Michigan affiliate and SLK Global Solutions. Recently, Aravind was appointed to the Ohio Third Frontier Commission, Governor Kasich’s initiative that accelerates the growth of technology companies and fosters technology job growth across the state of Ohio. Executive Vice President Chief Operations and Technology Officer Date Joined Fifth Third: November 2016 Positions Held at Fifth Third: 2016Chief Operations and Technology Officer
Consumer Bank Phil McHugh Executive Vice President Head of the Consumer Bank
Cautionary statement This presentation contains statements that we believe are “forward-looking statements” within the meaning of Section 27A of the Securities Act of 1933, as amended, and Rule 175 promulgated thereunder, and Section 21E of the Securities Exchange Act of 1934, as amended, and Rule 3b-6 promulgated thereunder. These statements relate to our financial condition, results of operations, plans, objectives, future performance or business. They usually can be identified by the use of forward-looking language such as “will likely result,” “may,” “are expected to,” “is anticipated,” “potential,” “estimate,” “forecast,” “projected,” “intends to,” or may include other similar words or phrases such as “believes,” “plans,” “trend,” “objective,” “continue,” “remain,” or similar expressions, or future or conditional verbs such as “will,” “would,” “should,” “could,” “might,” “can,” or similar verbs. You should not place undue reliance on these statements, as they are subject to risks and uncertainties, including but not limited to the risk factors set forth in our most recent Annual Report on Form 10-K, as updated by our Quarterly Reports on Form 10-Q. When considering these forward-looking statements, you should keep in mind these risks and uncertainties, as well as any cautionary statements we may make. Moreover, you should treat these statements as speaking only as of the date they are made and based only on information then actually known to us. We undertake no obligation to release revisions to these forward-looking statements or reflect events or circumstances after the date of this document. There are a number of important factors that could cause future results to differ materially from historical performance and these forward-looking statements. Factors that might cause such a difference include, but are not limited to: (1) general economic or real estate market conditions, either nationally or in the states in which Fifth Third, one or more acquired entities and/or the combined company do business, weaken or are less favorable than expected; (2) deteriorating credit quality; (3) political developments, wars or other hostilities may disrupt or increase volatility in securities markets or other economic conditions; (4) changes in the interest rate environment reduce interest margins; (5) prepayment speeds, loan origination and sale volumes, charge-offs and loan loss provisions; (6) Fifth Third’s ability to maintain required capital levels and adequate sources of funding and liquidity; (7) maintaining capital requirements and adequate sources of funding and liquidity may limit Fifth Third’s operations and potential growth; (8) changes and trends in capital markets; (9) problems encountered by larger or similar financial institutions may adversely affect the banking industry and/or Fifth Third; (10) competitive pressures among depository institutions increase significantly; (11) changes in customer preferences or information technology systems; (12) effects of critical accounting policies and judgments; (13) changes in accounting policies or procedures as may be required by the Financial Accounting Standards Board (FASB) or other regulatory agencies; (14) legislative or regulatory changes or actions, or significant litigation, adversely affect Fifth Third, one or more acquired entities and/or the combined company or the businesses in which Fifth Third, one or more acquired entities and/or the combined company are engaged, including the Dodd-Frank Wall Street Reform and Consumer Protection Act; (15) ability to maintain favorable ratings from rating agencies; (16) failure of models or risk management systems or controls; (17) fluctuation of Fifth Third’s stock price; (18) ability to attract and retain key personnel; (19) ability to receive dividends from its subsidiaries; (20) potentially dilutive effect of future acquisitions on current shareholders’ ownership of Fifth Third; (21) declines in the value of Fifth Third’s goodwill or other intangible assets; (22) effects of accounting or financial results of one or more acquired entities; (23) difficulties from Fifth Third’s investment in, relationship with, and nature of the operations of Vantiv Holding, LLC; (24) loss of income from any sale or potential sale of businesses; (25) difficulties in separating the operations of any branches or other assets divested; (26) losses or adverse impacts on the carrying values of branches and long-lived assets in connection with their sales or anticipated sales; (27) inability to achieve expected benefits from branch consolidations and planned sales within desired timeframes, if at all; (28) ability to secure confidential information and deliver products and services through the use of computer systems and telecommunications networks; (29) the negotiation and (if any) implementation by Vantiv, Inc. and/or Worldpay Group plc of the potential acquisition of Worldpay Group plc by Vantiv, Inc. and such other actions as Vantiv, Inc. and Worldpay Group plc may take in furtherance thereof; and (30) the impact of reputational risk created by these developments on such matters as business generation and retention, funding and liquidity. You should refer to our periodic and current reports filed with the Securities and Exchange Commission, or “SEC,” for further information on other factors, which could cause actual results to be significantly different from those expressed or implied by these forward-looking statements. In this presentation, we may sometimes provide non-GAAP financial information. Please note that although non-GAAP financial measures provide useful insight to analysts, investors and regulators, they should not be considered in isolation or relied upon as a substitute for analysis using GAAP measures. If applicable, we provide GAAP reconciliations for non-GAAP measures in a later slide in this presentation which is also available in the investor relations section of our website, www.53.com.
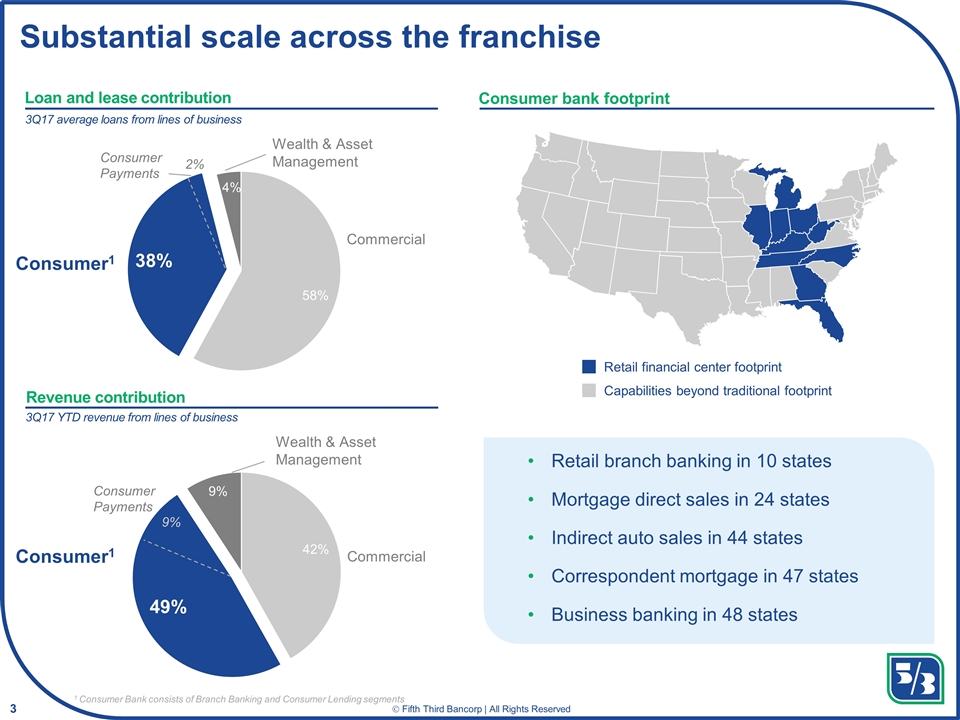
Substantial scale across the franchise Retail branch banking in 10 states Mortgage direct sales in 24 states Indirect auto sales in 44 states Correspondent mortgage in 47 states Business banking in 48 states Consumer bank footprint Retail financial center footprint Capabilities beyond traditional footprint Wealth & Asset Management 9% Consumer Payments Consumer1 Consumer1 Consumer Payments 2% Wealth & Asset Management Loan and lease contribution Revenue contribution 3Q17 average loans from lines of business 3Q17 YTD revenue from lines of business
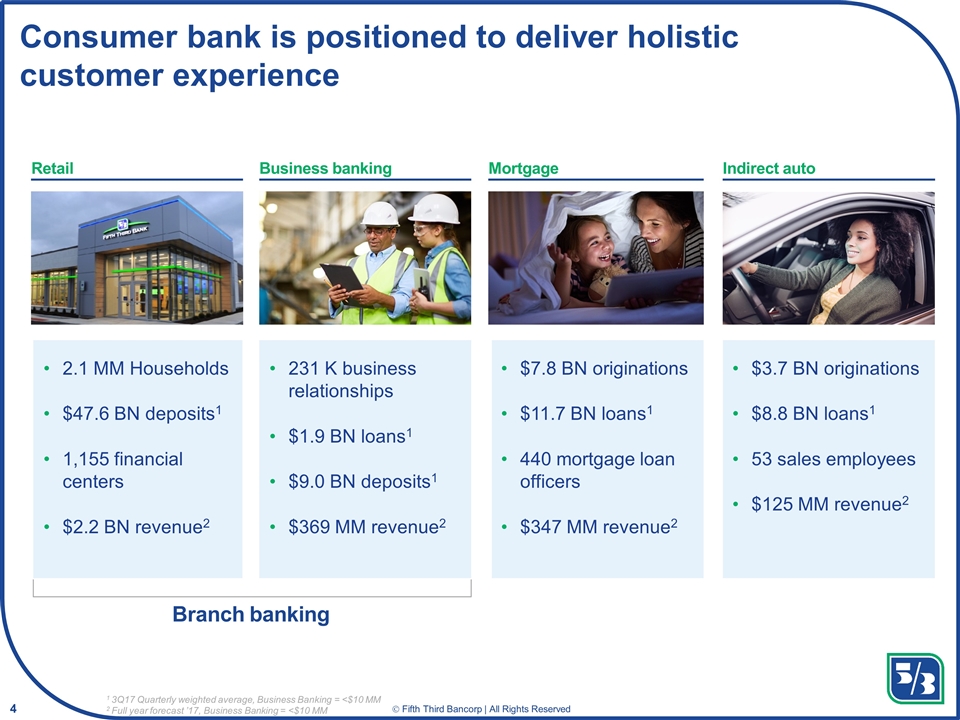
Consumer bank is positioned to deliver holistic customer experience 1 3Q17 Quarterly weighted average, Business Banking = <$10 MM 2 Full year forecast ’17, Business Banking = <$10 MM Retail Mortgage Indirect auto 2.1 MM Households $47.6 BN deposits1 1,155 financial centers $2.2 BN revenue2 $7.8 BN originations $11.7 BN loans1 440 mortgage loan officers $347 MM revenue2 $3.7 BN originations $8.8 BN loans1 53 sales employees $125 MM revenue2 Business banking 231 K business relationships $1.9 BN loans1 $9.0 BN deposits1 $369 MM revenue2 Branch banking
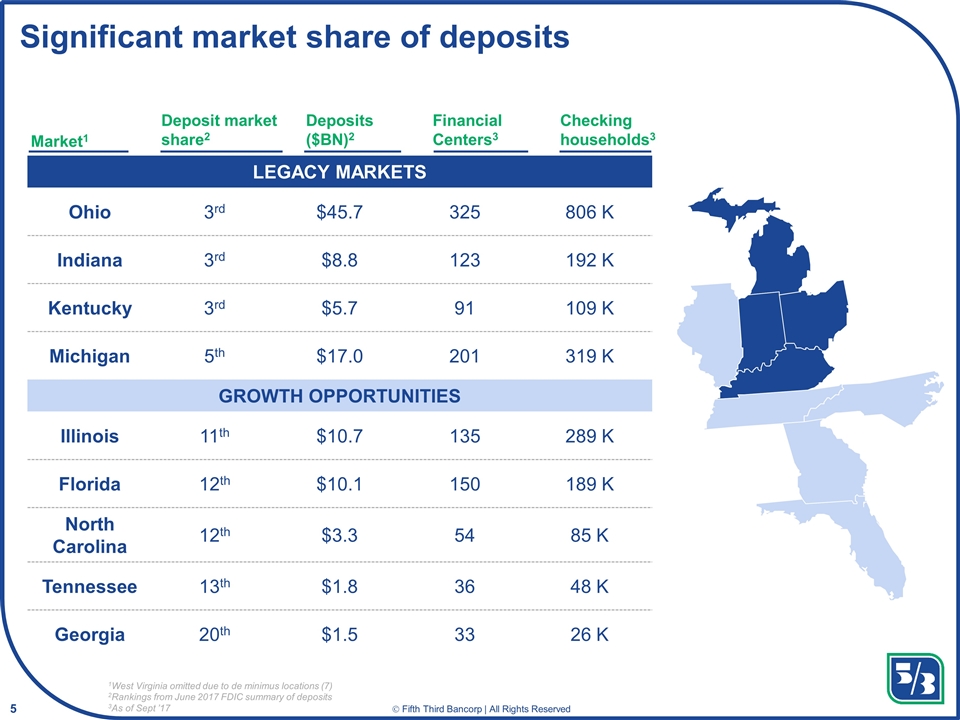
Significant market share of deposits LEGACY MARKETS Ohio 3rd $45.7 325 806 K Indiana 3rd $8.8 123 192 K Kentucky 3rd $5.7 91 109 K Michigan 5th $17.0 201 319 K GROWTH OPPORTUNITIES Illinois 11th $10.7 135 289 K Florida 12th $10.1 150 189 K North Carolina 12th $3.3 54 85 K Tennessee 13th $1.8 36 48 K Georgia 20th $1.5 33 26 K 1West Virginia omitted due to de minimus locations (7) 2Rankings from June 2017 FDIC summary of deposits 3As of Sept ’17 Market1 Deposit market share2 Deposits ($BN)2 Financial Centers3 Checking households3
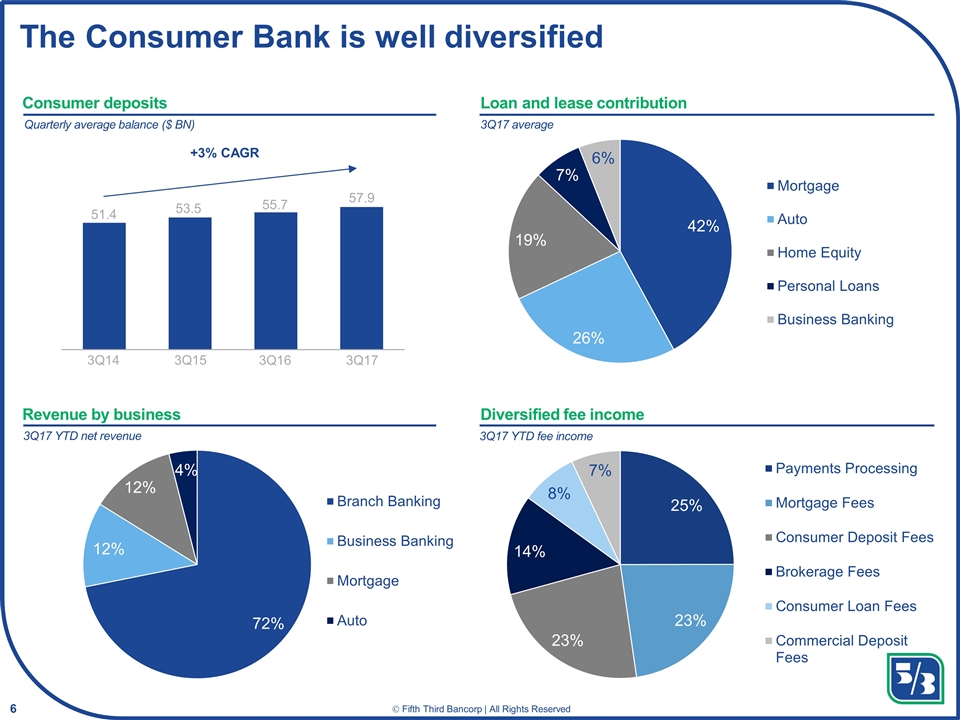
The Consumer Bank is well diversified +3% CAGR 51.4 53.5 55.7 57.9 3Q14 3Q15 3Q16 Loan and lease contribution Revenue by business Diversified fee income Consumer deposits 3Q17 average 3Q17 YTD fee income 3Q17 YTD net revenue Quarterly average balance ($ BN) 3Q17
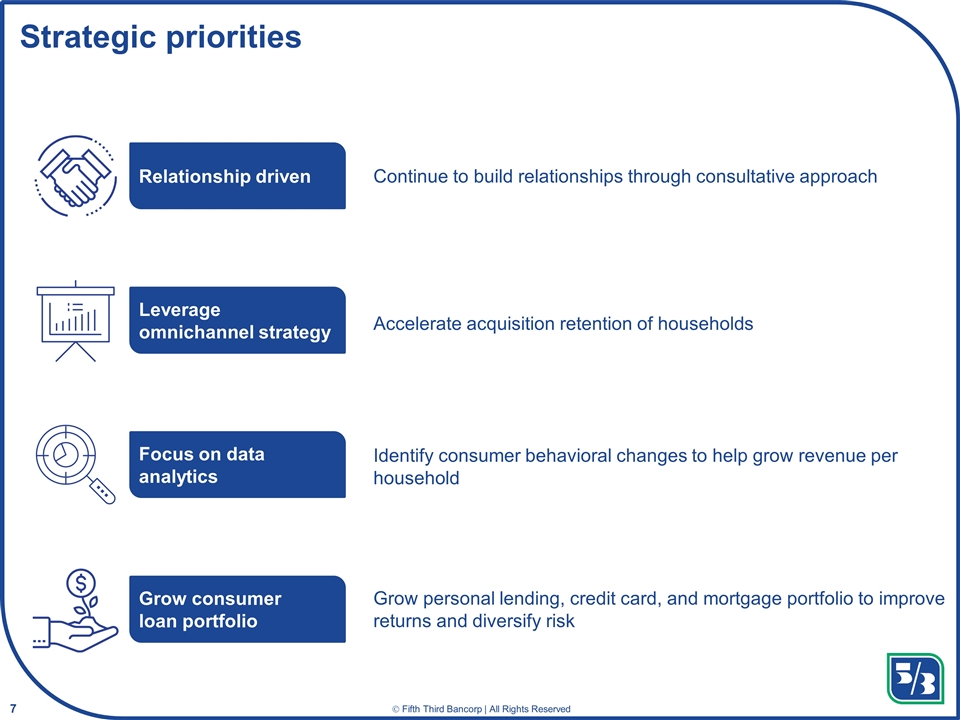
Strategic priorities Continue to build relationships through consultative approach Leverage omnichannel strategy Relationship driven Focus on data analytics Grow consumer loan portfolio Accelerate acquisition retention of households Identify consumer behavioral changes to help grow revenue per household Grow personal lending, credit card, and mortgage portfolio to improve returns and diversify risk
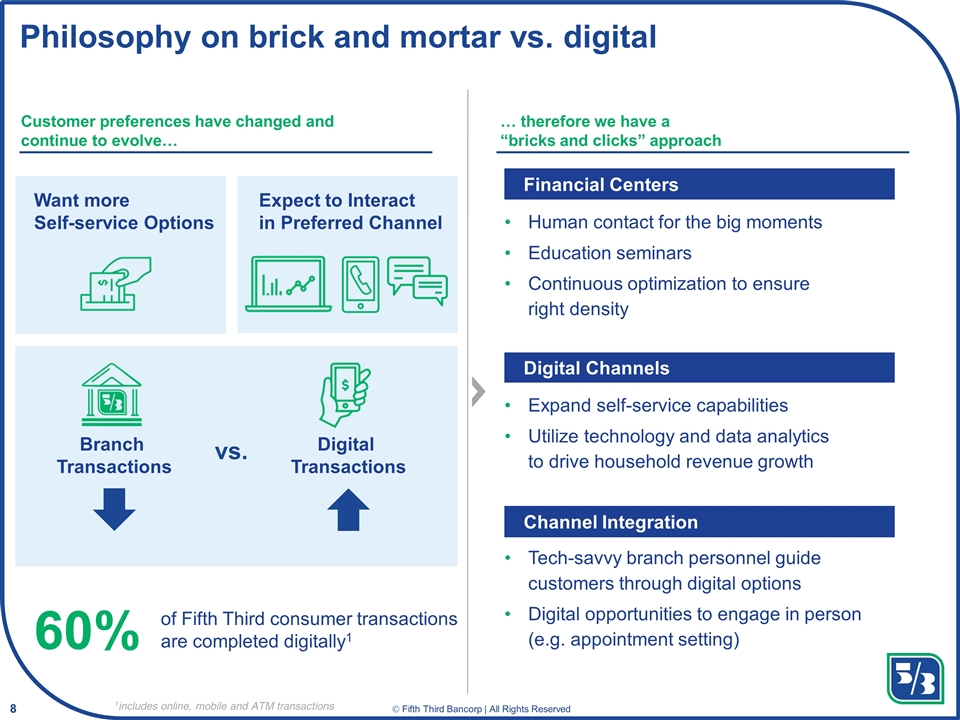
Philosophy on brick and mortar vs. digital 1includes online, mobile and ATM transactions Customer preferences have changed and continue to evolve… … therefore we have a “bricks and clicks” approach Human contact for the big moments Education seminars Continuous optimization to ensure right density Expand self-service capabilities Utilize technology and data analytics to drive household revenue growth Tech-savvy branch personnel guide customers through digital options Digital opportunities to engage in person (e.g. appointment setting) Financial Centers Digital Channels Channel Integration Expect to Interact in Preferred Channel of Fifth Third consumer transactions are completed digitally1 60% Want more Self-service Options Branch Transactions Digital Transactions vs.
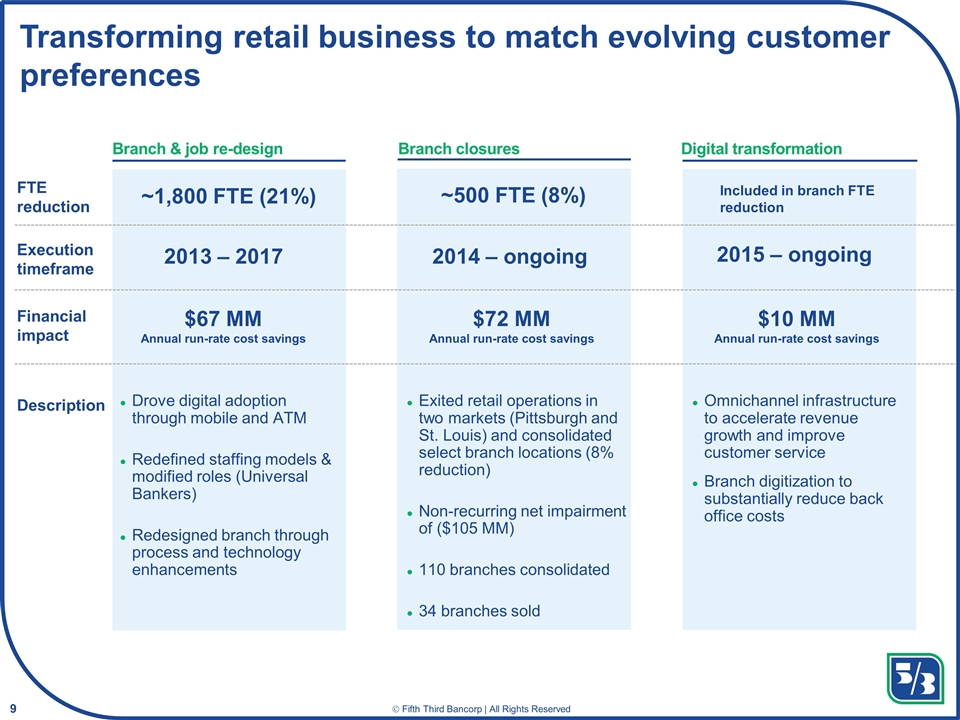
Transforming retail business to match evolving customer preferences FTE reduction Financial impact Description ~1,800 FTE (21%) ~500 FTE (8%) 2014 – ongoing 2015 – ongoing 2013 – 2017 $72 MM Annual run-rate cost savings Omnichannel infrastructure to accelerate revenue growth and improve customer service Branch digitization to substantially reduce back office costs Exited retail operations in two markets (Pittsburgh and St. Louis) and consolidated select branch locations (8% reduction) Non-recurring net impairment of ($105 MM) 110 branches consolidated 34 branches sold Drove digital adoption through mobile and ATM Redefined staffing models & modified roles (Universal Bankers) Redesigned branch through process and technology enhancements Execution timeframe $67 MM Annual run-rate cost savings Branch & job re-design Branch closures Digital transformation Included in branch FTE reduction $10 MM Annual run-rate cost savings
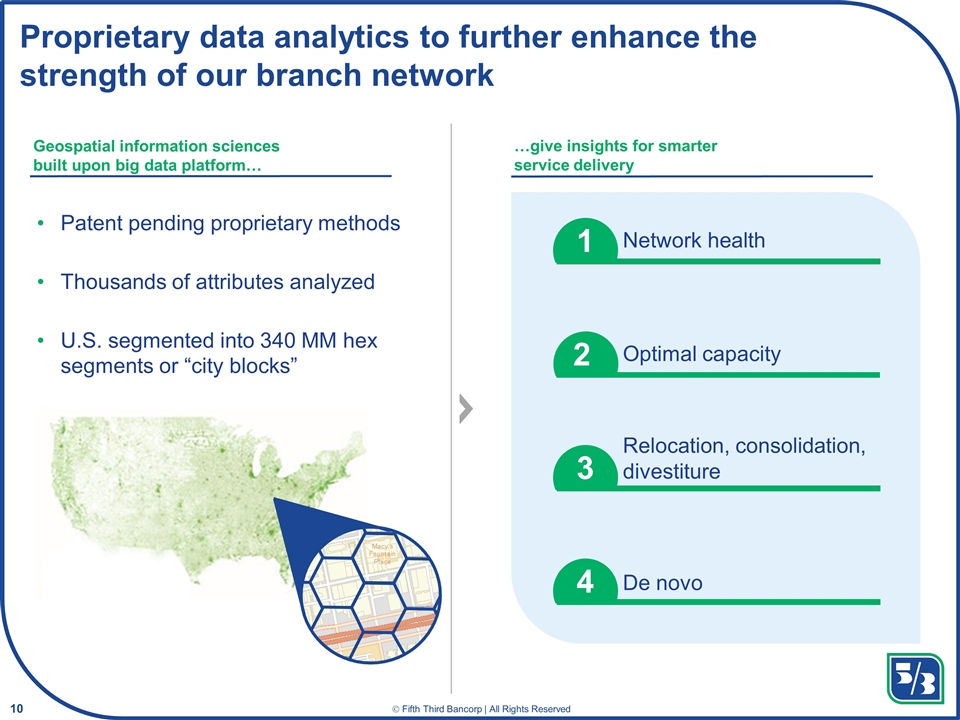
Proprietary data analytics to further enhance the strength of our branch network Network health Optimal capacity De novo Relocation, consolidation, divestiture Geospatial information sciences built upon big data platform… …give insights for smarter service delivery 1 2 3 4 Patent pending proprietary methods Thousands of attributes analyzed U.S. segmented into 340 MM hex segments or “city blocks”
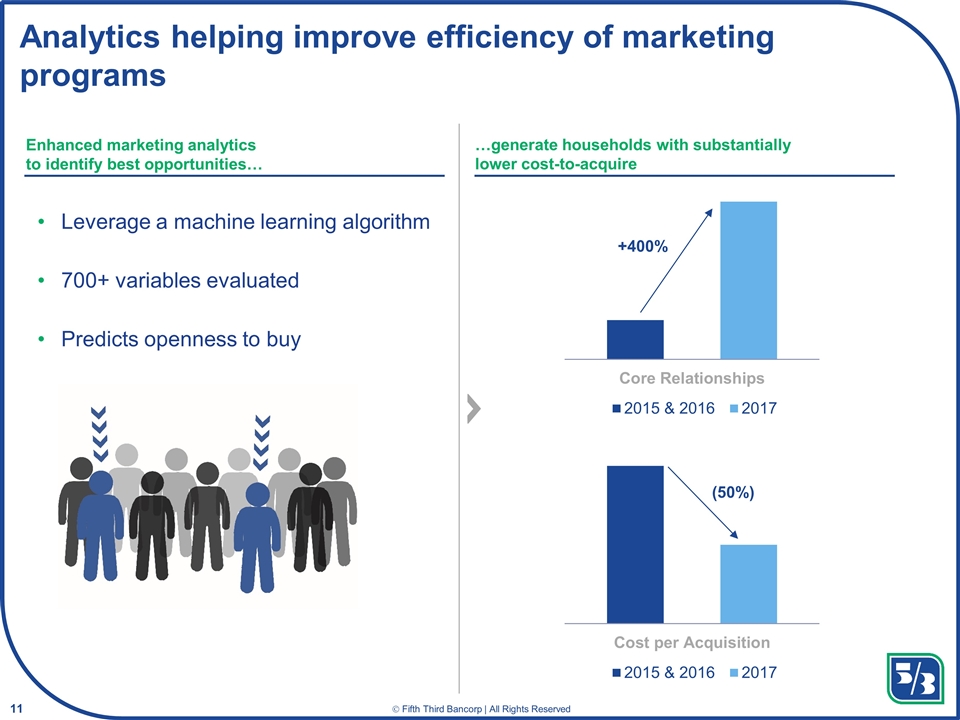
Analytics helping improve efficiency of marketing programs +400% Enhanced marketing analytics to identify best opportunities… …generate households with substantially lower cost-to-acquire Leverage a machine learning algorithm 700+ variables evaluated Predicts openness to buy (50%)
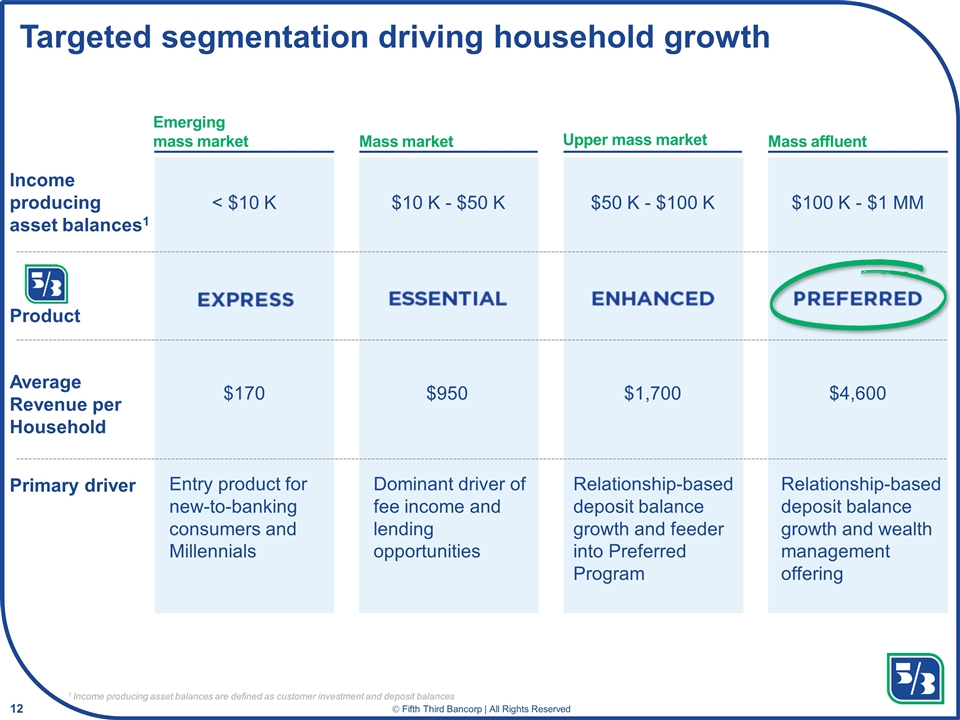
Targeted segmentation driving household growth Emerging mass market Mass market Upper mass market Mass affluent Income producing asset balances1 Product Average Revenue per Household Primary driver < $10 K $10 K - $50 K $50 K - $100 K $100 K - $1 MM $170 $950 $1,700 $4,600 Entry product for new-to-banking consumers and Millennials Dominant driver of fee income and lending opportunities Relationship-based deposit balance growth and feeder into Preferred Program Relationship-based deposit balance growth and wealth management offering 1 Income producing asset balances are defined as customer investment and deposit balances
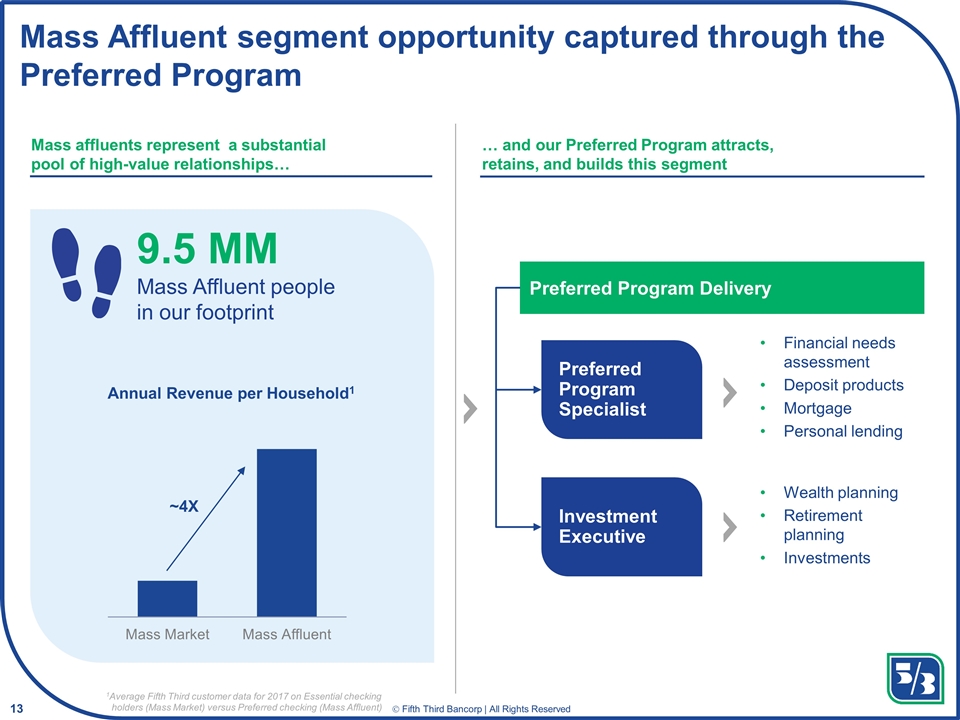
Mass Affluent segment opportunity captured through the Preferred Program 1Average Fifth Third customer data for 2017 on Essential checking holders (Mass Market) versus Preferred checking (Mass Affluent) Mass affluents represent a substantial pool of high-value relationships… … and our Preferred Program attracts, retains, and builds this segment Financial needs assessment Deposit products Mortgage Personal lending Preferred Program Specialist Wealth planning Retirement planning Investments Investment Executive Preferred Program Delivery 9.5 MM Mass Affluent people in our footprint Annual Revenue per Household1 ~4X
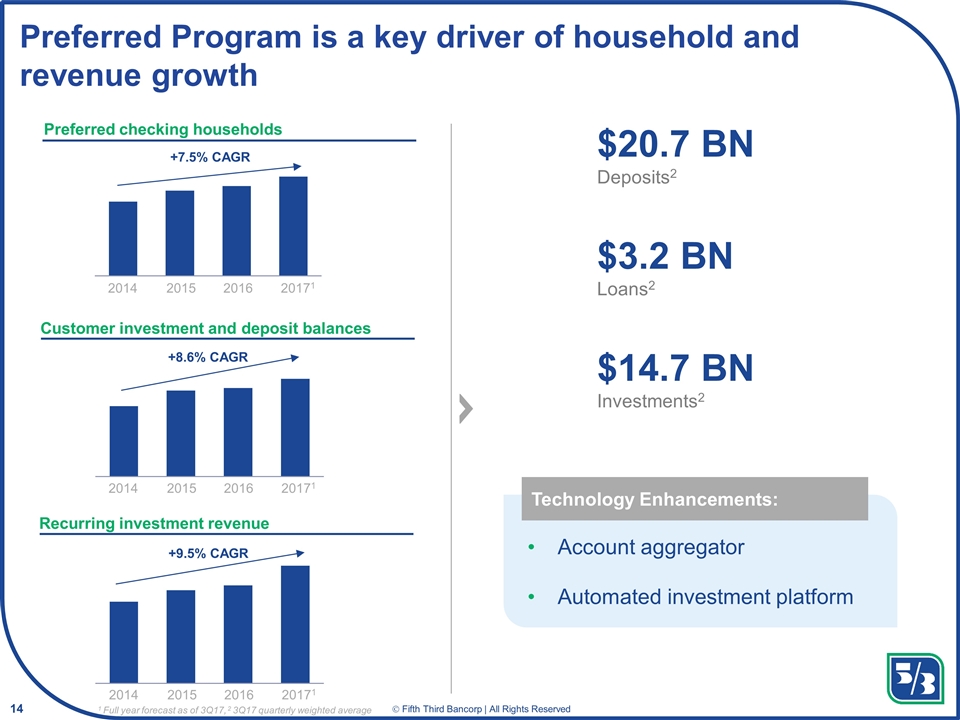
Preferred Program is a key driver of household and revenue growth +9.5% CAGR +8.6% CAGR +7.5% CAGR 2014 2015 2016 20171 2014 2015 2016 20171 2014 2015 2016 20171 $20.7 BN Deposits2 $3.2 BN Loans2 $14.7 BN Investments2 Preferred checking households Customer investment and deposit balances Recurring investment revenue Account aggregator Automated investment platform Technology Enhancements: 1 Full year forecast as of 3Q17, 2 3Q17 quarterly weighted average
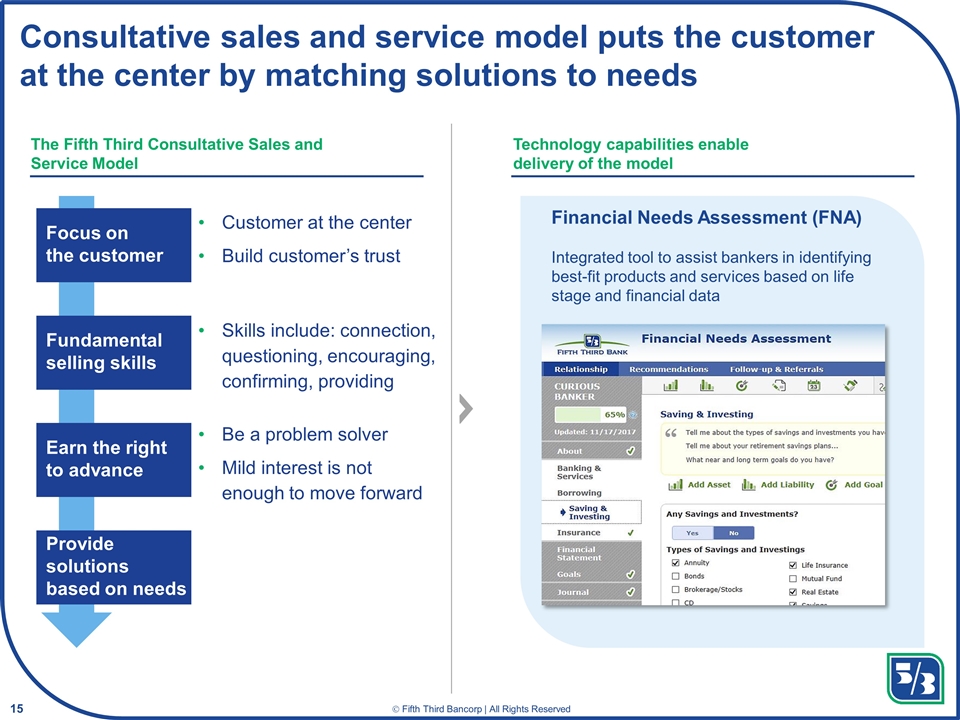
Consultative sales and service model puts the customer at the center by matching solutions to needs The Fifth Third Consultative Sales and Service Model Technology capabilities enable delivery of the model Customer at the center Build customer’s trust Skills include: connection, questioning, encouraging, confirming, providing Be a problem solver Mild interest is not enough to move forward Financial Needs Assessment (FNA) Integrated tool to assist bankers in identifying best-fit products and services based on life stage and financial data Focus on the customer Fundamental selling skills Earn the right to advance Provide solutions based on needs
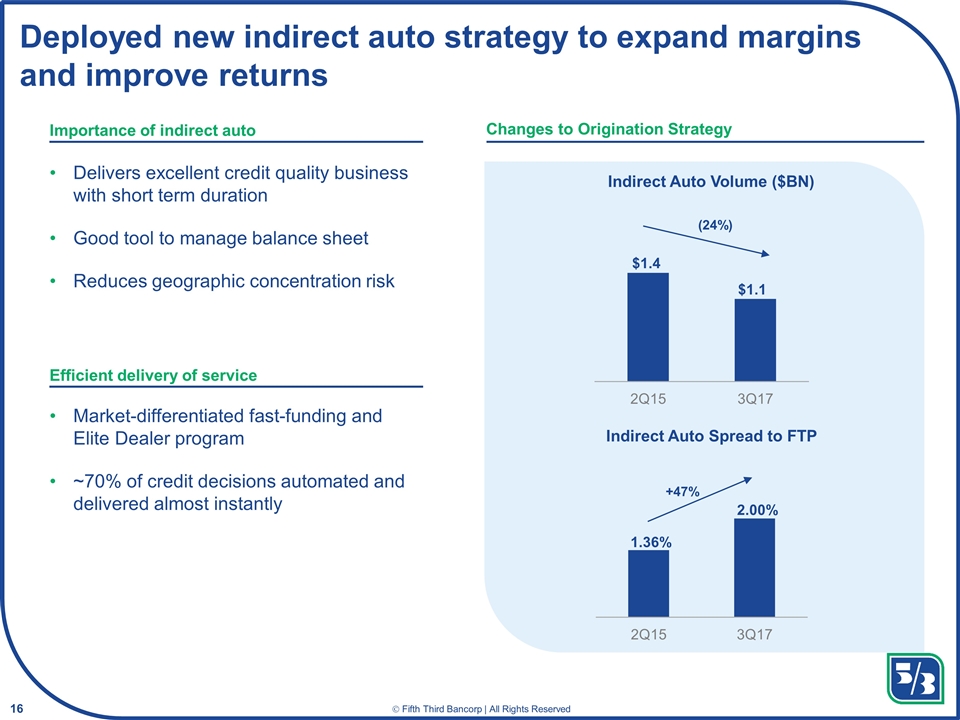
Delivers excellent credit quality business with short term duration Good tool to manage balance sheet Reduces geographic concentration risk Market-differentiated fast-funding and Elite Dealer program ~70% of credit decisions automated and delivered almost instantly Deployed new indirect auto strategy to expand margins and improve returns Importance of indirect auto Efficient delivery of service Changes to Origination Strategy (24%) +47% Indirect Auto Volume ($BN) Indirect Auto Spread to FTP 2.00% 1.36% $1.4 $1.1
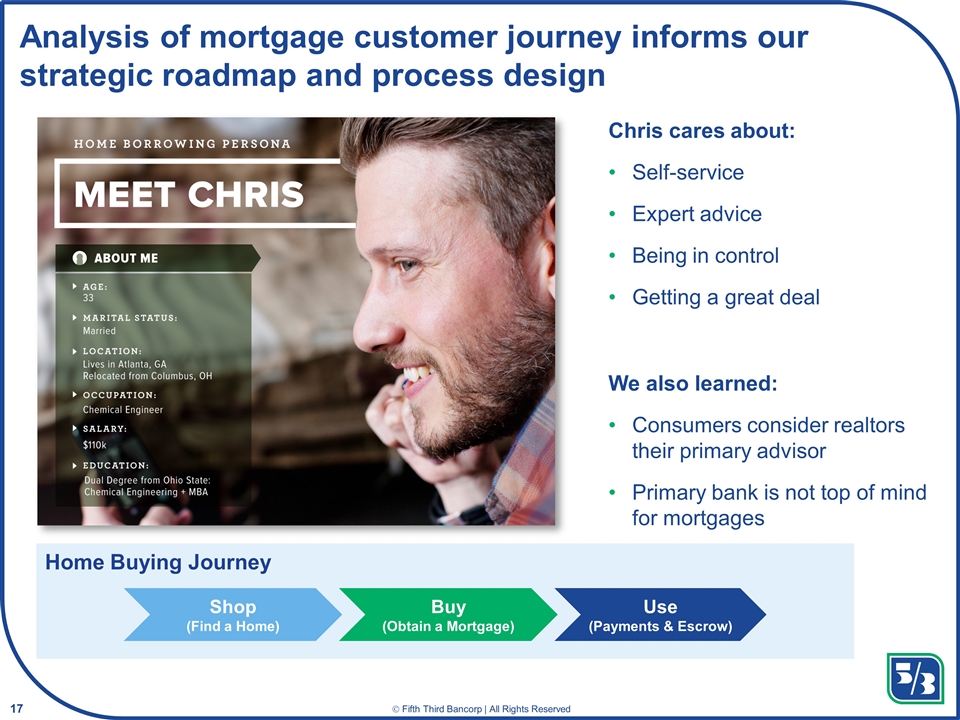
Analysis of mortgage customer journey informs our strategic roadmap and process design Chris cares about: Self-service Expert advice Being in control Getting a great deal We also learned: Consumers consider realtors their primary advisor Primary bank is not top of mind for mortgages Shop (Find a Home) Buy (Obtain a Mortgage) Use (Payments & Escrow) Home Buying Journey
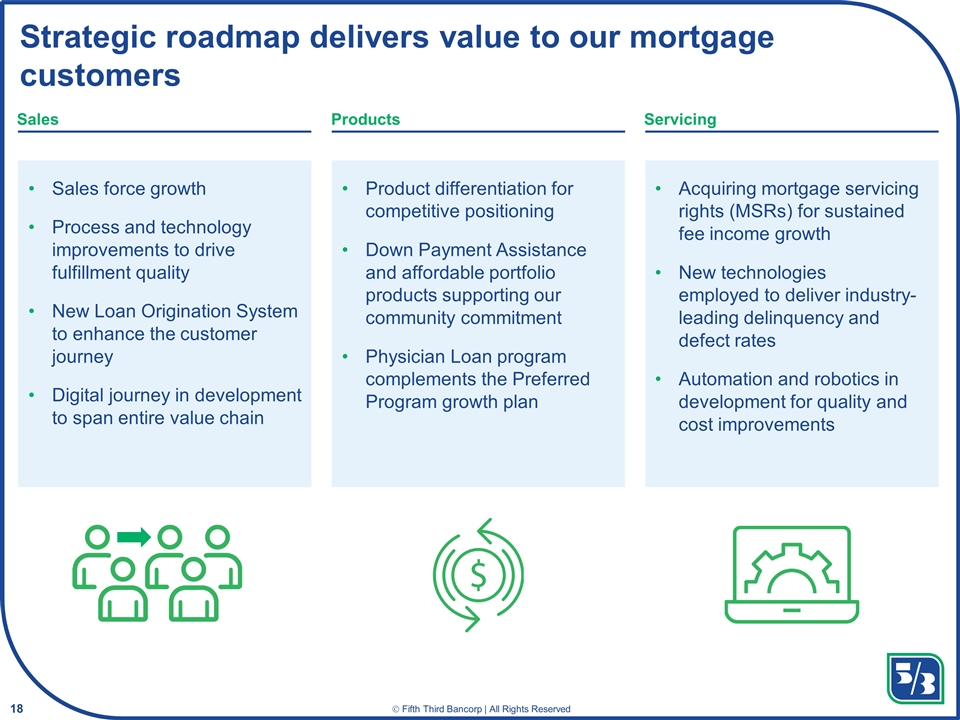
Strategic roadmap delivers value to our mortgage customers Sales Products Servicing Sales force growth Process and technology improvements to drive fulfillment quality New Loan Origination System to enhance the customer journey Digital journey in development to span entire value chain Product differentiation for competitive positioning Down Payment Assistance and affordable portfolio products supporting our community commitment Physician Loan program complements the Preferred Program growth plan Acquiring mortgage servicing rights (MSRs) for sustained fee income growth New technologies employed to deliver industry-leading delinquency and defect rates Automation and robotics in development for quality and cost improvements
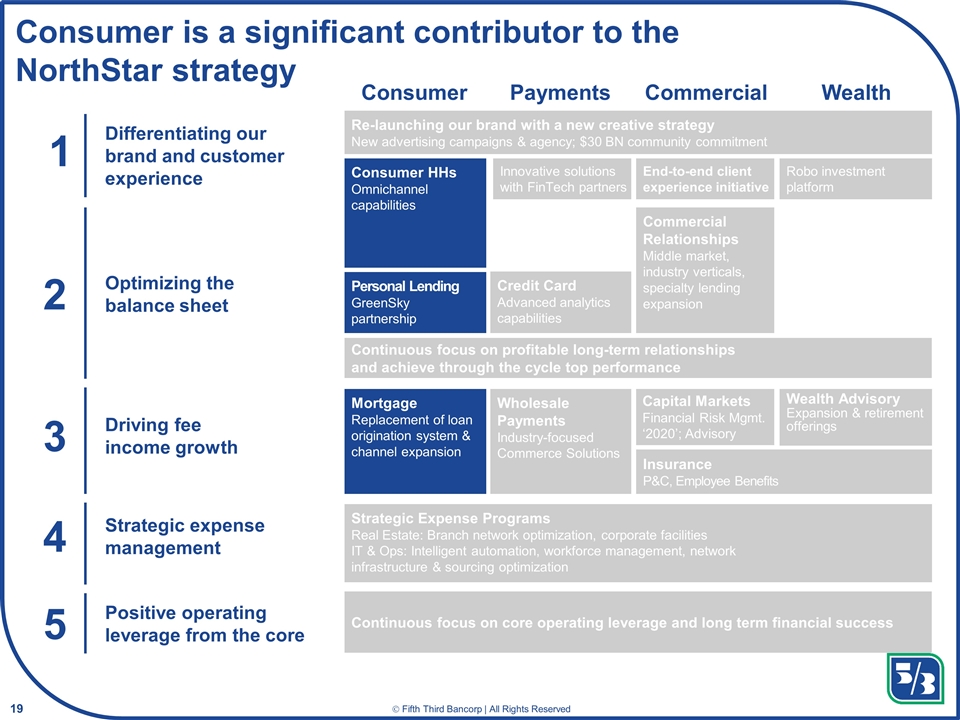
Capital Markets Financial Risk Mgmt. ‘2020’; Advisory Consumer is a significant contributor to the NorthStar strategy 1 Differentiating our brand and customer experience 2 Optimizing the balance sheet Driving fee income growth 3 4 Strategic expense management Consumer Payments Commercial Wealth 5 Positive operating leverage from the core Personal Lending GreenSky partnership Credit Card Advanced analytics capabilities Wholesale Payments Industry-focused Commerce Solutions Insurance P&C, Employee Benefits Commercial Relationships Middle market, industry verticals, specialty lending expansion Wealth Advisory Expansion & retirement offerings Strategic Expense Programs Real Estate: Branch network optimization, corporate facilities IT & Ops: Intelligent automation, workforce management, network infrastructure & sourcing optimization Re-launching our brand with a new creative strategy New advertising campaigns & agency; $30 BN community commitment Consumer HHs Omnichannel capabilities Continuous focus on core operating leverage and long term financial success Mortgage Replacement of loan origination system & channel expansion Continuous focus on profitable long-term relationships and achieve through the cycle top performance End-to-end client experience initiative Robo investment platform Innovative solutions with FinTech partners
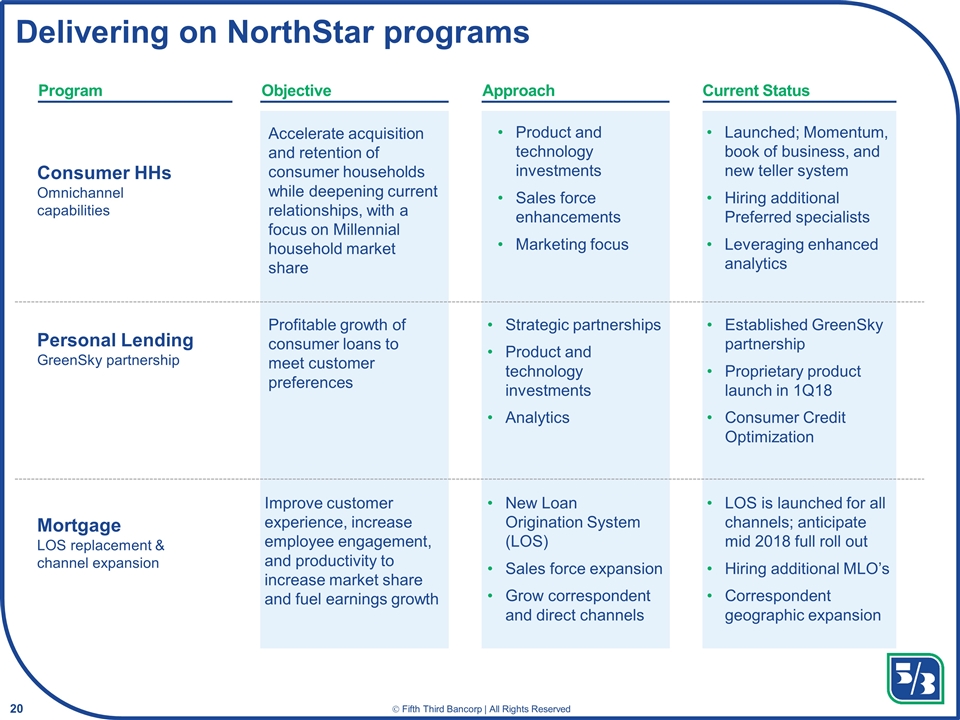
Delivering on NorthStar programs Consumer HHs Omnichannel capabilities Personal Lending GreenSky partnership Mortgage LOS replacement & channel expansion Program Objective Current Status Approach Accelerate acquisition and retention of consumer households while deepening current relationships, with a focus on Millennial household market share Product and technology investments Sales force enhancements Marketing focus Launched; Momentum, book of business, and new teller system Hiring additional Preferred specialists Leveraging enhanced analytics Profitable growth of consumer loans to meet customer preferences Strategic partnerships Product and technology investments Analytics Established GreenSky partnership Proprietary product launch in 1Q18 Consumer Credit Optimization Improve customer experience, increase employee engagement, and productivity to increase market share and fuel earnings growth New Loan Origination System (LOS) Sales force expansion Grow correspondent and direct channels LOS is launched for all channels; anticipate mid 2018 full roll out Hiring additional MLO’s Correspondent geographic expansion
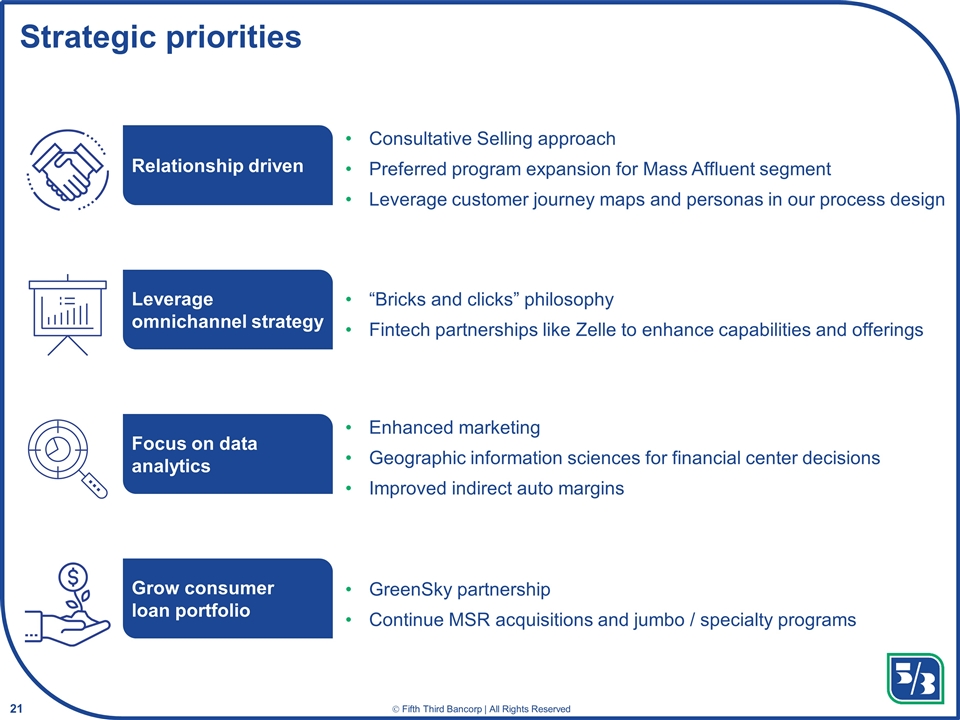
Strategic priorities Leverage omnichannel strategy Relationship driven Focus on data analytics Grow consumer loan portfolio Consultative Selling approach Preferred program expansion for Mass Affluent segment Leverage customer journey maps and personas in our process design “Bricks and clicks” philosophy Fintech partnerships like Zelle to enhance capabilities and offerings Enhanced marketing Geographic information sciences for financial center decisions Improved indirect auto margins GreenSky partnership Continue MSR acquisitions and jumbo / specialty programs
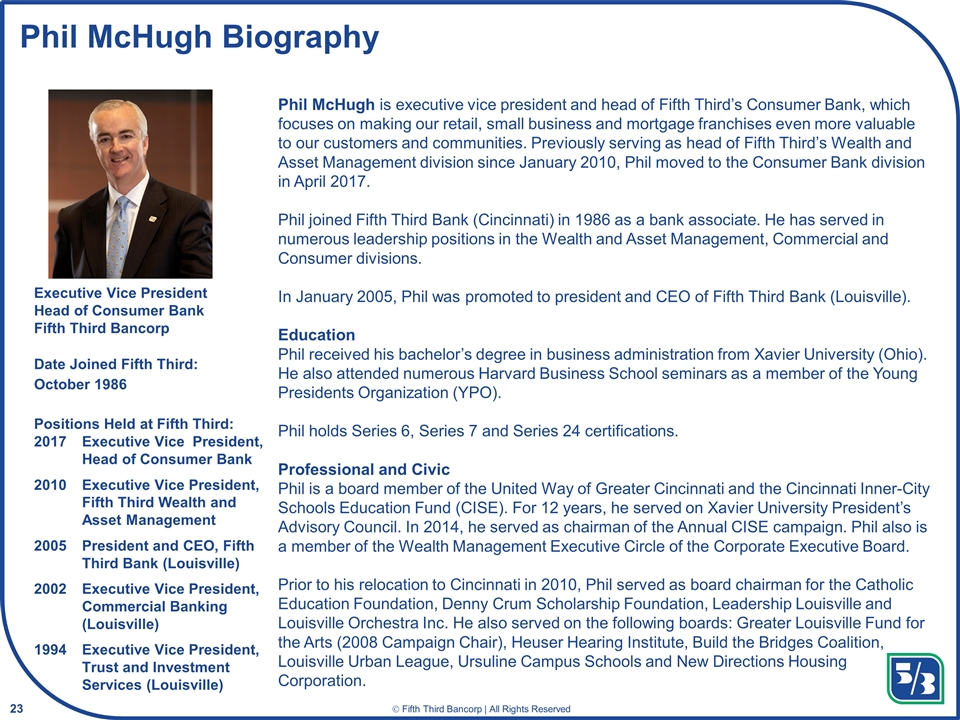
Phil McHugh Biography Phil McHugh is executive vice president and head of Fifth Third’s Consumer Bank, which focuses on making our retail, small business and mortgage franchises even more valuable to our customers and communities. Previously serving as head of Fifth Third’s Wealth and Asset Management division since January 2010, Phil moved to the Consumer Bank division in April 2017. Phil joined Fifth Third Bank (Cincinnati) in 1986 as a bank associate. He has served in numerous leadership positions in the Wealth and Asset Management, Commercial and Consumer divisions. In January 2005, Phil was promoted to president and CEO of Fifth Third Bank (Louisville). Education Phil received his bachelor’s degree in business administration from Xavier University (Ohio). He also attended numerous Harvard Business School seminars as a member of the Young Presidents Organization (YPO). Phil holds Series 6, Series 7 and Series 24 certifications. Professional and Civic Phil is a board member of the United Way of Greater Cincinnati and the Cincinnati Inner-City Schools Education Fund (CISE). For 12 years, he served on Xavier University President’s Advisory Council. In 2014, he served as chairman of the Annual CISE campaign. Phil also is a member of the Wealth Management Executive Circle of the Corporate Executive Board. Prior to his relocation to Cincinnati in 2010, Phil served as board chairman for the Catholic Education Foundation, Denny Crum Scholarship Foundation, Leadership Louisville and Louisville Orchestra Inc. He also served on the following boards: Greater Louisville Fund for the Arts (2008 Campaign Chair), Heuser Hearing Institute, Build the Bridges Coalition, Louisville Urban League, Ursuline Campus Schools and New Directions Housing Corporation. Executive Vice President Head of Consumer Bank Fifth Third Bancorp Date Joined Fifth Third: October 1986 Positions Held at Fifth Third: 2017Executive Vice President, Head of Consumer Bank 2010Executive Vice President, Fifth Third Wealth and Asset Management 2005President and CEO, Fifth Third Bank (Louisville) 2002Executive Vice President, Commercial Banking (Louisville) 1994Executive Vice President, Trust and Investment Services (Louisville)
Commercial Bank Wealth and Asset Management One Bank Strategy
Cautionary statement This presentation contains statements that we believe are “forward-looking statements” within the meaning of Section 27A of the Securities Act of 1933, as amended, and Rule 175 promulgated thereunder, and Section 21E of the Securities Exchange Act of 1934, as amended, and Rule 3b-6 promulgated thereunder. These statements relate to our financial condition, results of operations, plans, objectives, future performance or business. They usually can be identified by the use of forward-looking language such as “will likely result,” “may,” “are expected to,” “is anticipated,” “potential,” “estimate,” “forecast,” “projected,” “intends to,” or may include other similar words or phrases such as “believes,” “plans,” “trend,” “objective,” “continue,” “remain,” or similar expressions, or future or conditional verbs such as “will,” “would,” “should,” “could,” “might,” “can,” or similar verbs. You should not place undue reliance on these statements, as they are subject to risks and uncertainties, including but not limited to the risk factors set forth in our most recent Annual Report on Form 10-K, as updated by our Quarterly Reports on Form 10-Q. When considering these forward-looking statements, you should keep in mind these risks and uncertainties, as well as any cautionary statements we may make. Moreover, you should treat these statements as speaking only as of the date they are made and based only on information then actually known to us. We undertake no obligation to release revisions to these forward-looking statements or reflect events or circumstances after the date of this document. There are a number of important factors that could cause future results to differ materially from historical performance and these forward-looking statements. Factors that might cause such a difference include, but are not limited to: (1) general economic or real estate market conditions, either nationally or in the states in which Fifth Third, one or more acquired entities and/or the combined company do business, weaken or are less favorable than expected; (2) deteriorating credit quality; (3) political developments, wars or other hostilities may disrupt or increase volatility in securities markets or other economic conditions; (4) changes in the interest rate environment reduce interest margins; (5) prepayment speeds, loan origination and sale volumes, charge-offs and loan loss provisions; (6) Fifth Third’s ability to maintain required capital levels and adequate sources of funding and liquidity; (7) maintaining capital requirements and adequate sources of funding and liquidity may limit Fifth Third’s operations and potential growth; (8) changes and trends in capital markets; (9) problems encountered by larger or similar financial institutions may adversely affect the banking industry and/or Fifth Third; (10) competitive pressures among depository institutions increase significantly; (11) changes in customer preferences or information technology systems; (12) effects of critical accounting policies and judgments; (13) changes in accounting policies or procedures as may be required by the Financial Accounting Standards Board (FASB) or other regulatory agencies; (14) legislative or regulatory changes or actions, or significant litigation, adversely affect Fifth Third, one or more acquired entities and/or the combined company or the businesses in which Fifth Third, one or more acquired entities and/or the combined company are engaged, including the Dodd-Frank Wall Street Reform and Consumer Protection Act; (15) ability to maintain favorable ratings from rating agencies; (16) failure of models or risk management systems or controls; (17) fluctuation of Fifth Third’s stock price; (18) ability to attract and retain key personnel; (19) ability to receive dividends from its subsidiaries; (20) potentially dilutive effect of future acquisitions on current shareholders’ ownership of Fifth Third; (21) declines in the value of Fifth Third’s goodwill or other intangible assets; (22) effects of accounting or financial results of one or more acquired entities; (23) difficulties from Fifth Third’s investment in, relationship with, and nature of the operations of Vantiv Holding, LLC; (24) loss of income from any sale or potential sale of businesses; (25) difficulties in separating the operations of any branches or other assets divested; (26) losses or adverse impacts on the carrying values of branches and long-lived assets in connection with their sales or anticipated sales; (27) inability to achieve expected benefits from branch consolidations and planned sales within desired timeframes, if at all; (28) ability to secure confidential information and deliver products and services through the use of computer systems and telecommunications networks; (29) the negotiation and (if any) implementation by Vantiv, Inc. and/or Worldpay Group plc of the potential acquisition of Worldpay Group plc by Vantiv, Inc. and such other actions as Vantiv, Inc. and Worldpay Group plc may take in furtherance thereof; and (30) the impact of reputational risk created by these developments on such matters as business generation and retention, funding and liquidity. You should refer to our periodic and current reports filed with the Securities and Exchange Commission, or “SEC,” for further information on other factors, which could cause actual results to be significantly different from those expressed or implied by these forward-looking statements. In this presentation, we may sometimes provide non-GAAP financial information. Please note that although non-GAAP financial measures provide useful insight to analysts, investors and regulators, they should not be considered in isolation or relied upon as a substitute for analysis using GAAP measures. If applicable,we provide GAAP reconciliations for non-GAAP measures in a later slide in this presentation which is also available in the investor relations section of our website, www.53.com.
Commercial Bank Richard Stein Executive Vice President Head of the Commercial Bank
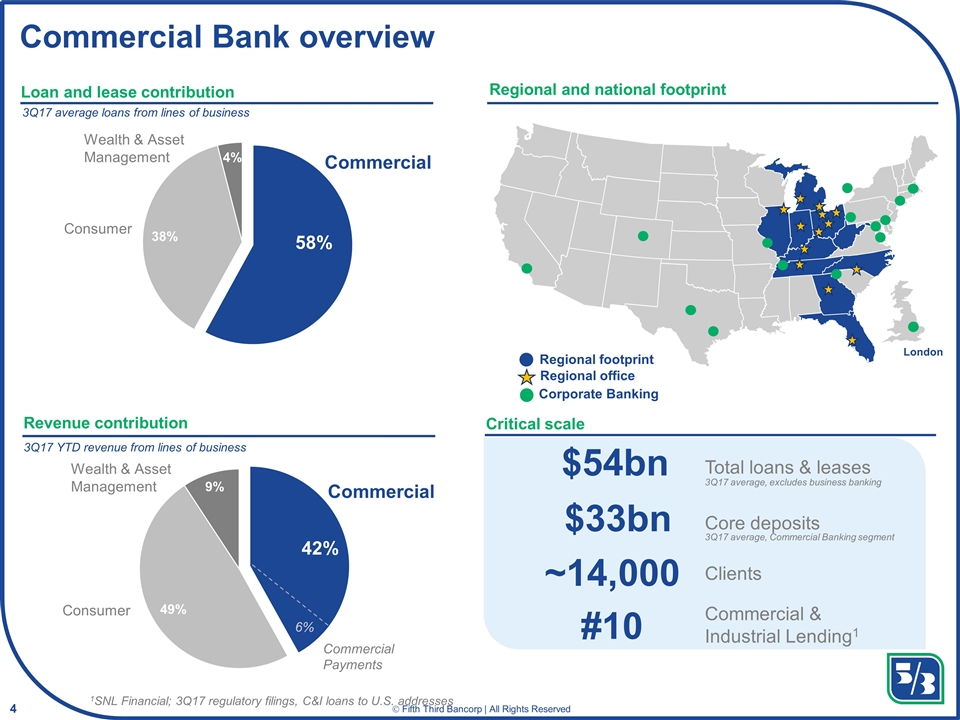
Commercial Bank overview Revenue contribution Regional and national footprint Critical scale Corporate Banking London $33bn Core deposits #10 Commercial & Industrial Lending1 ~14,000 Clients Loan and lease contribution 3Q17 average loans from lines of business 3Q17 YTD revenue from lines of business $54bn Total loans & leases Commercial 3Q17 average, excludes business banking 3Q17 average, Commercial Banking segment Regional office Regional footprint Commercial 1SNL Financial; 3Q17 regulatory filings, C&I loans to U.S. addresses Commercial Payments
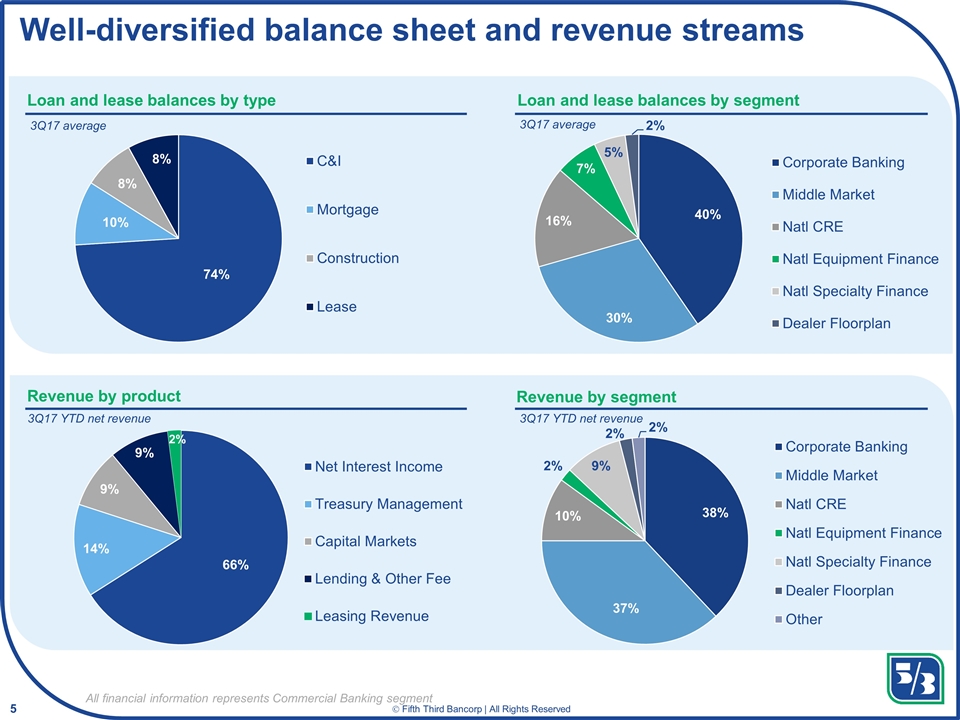
Well-diversified balance sheet and revenue streams Loan and lease balances by type Loan and lease balances by segment Revenue by product Revenue by segment 3Q17 YTD net revenue 3Q17 YTD net revenue 3Q17 average 3Q17 average All financial information represents Commercial Banking segment
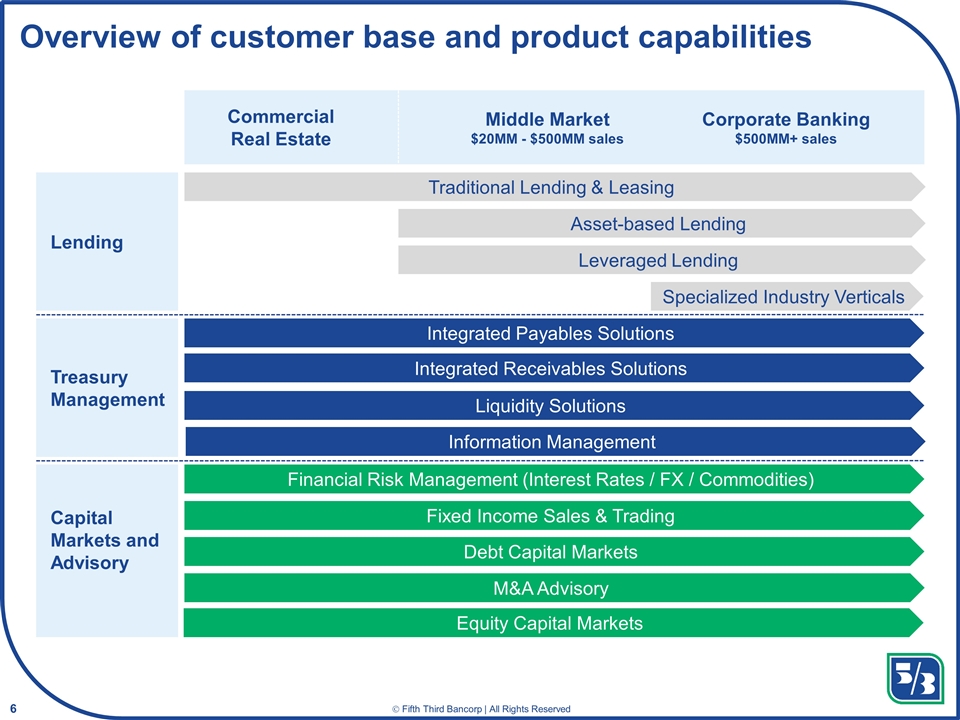
Overview of customer base and product capabilities Lending Treasury Management Capital Markets and Advisory Middle Market $20MM - $500MM sales Corporate Banking $500MM+ sales Asset-based Lending Specialized Industry Verticals Leveraged Lending Traditional Lending & Leasing Integrated Payables Solutions Integrated Receivables Solutions Financial Risk Management (Interest Rates / FX / Commodities) Fixed Income Sales & Trading Equity Capital Markets M&A Advisory Commercial Real Estate Debt Capital Markets Liquidity Solutions Information Management
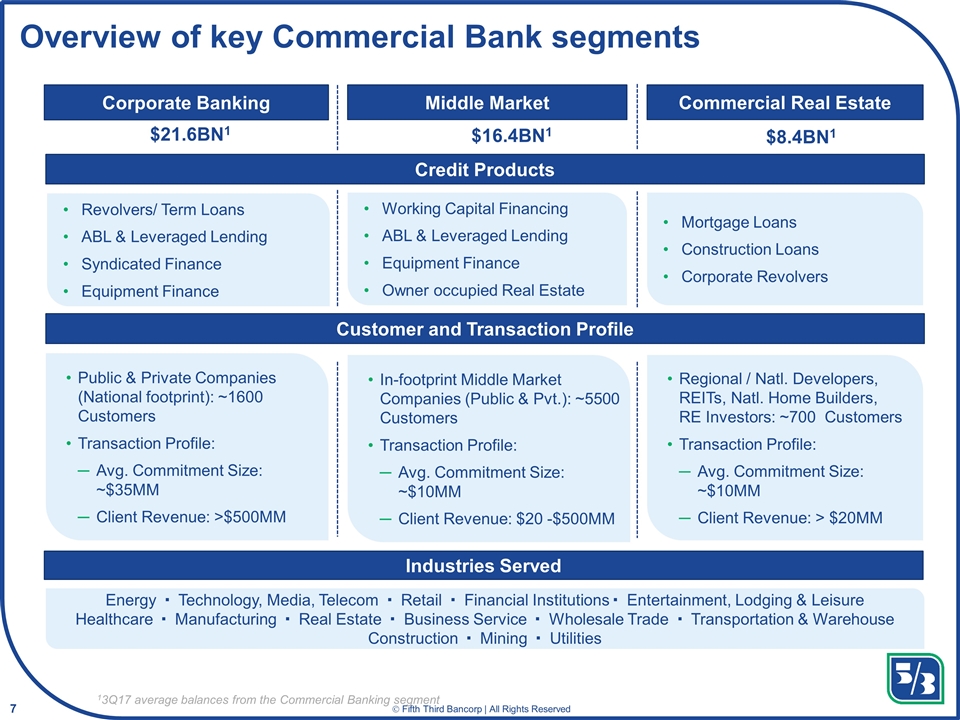
Overview of key Commercial Bank segments Middle Market Commercial Real Estate Credit Products Customer and Transaction Profile Industries Served $21.6BN1 $16.4BN1 $8.4BN1 Energy Technology, Media, Telecom Retail Financial Institutions Entertainment, Lodging & Leisure Healthcare Manufacturing Real Estate Business Service Wholesale Trade Transportation & Warehouse Construction Mining Utilities Working Capital Financing ABL & Leveraged Lending Equipment Finance Owner occupied Real Estate Mortgage Loans Construction Loans Corporate Revolvers Regional / Natl. Developers, REITs, Natl. Home Builders, RE Investors: ~700 Customers Transaction Profile: Avg. Commitment Size: ~$10MM Client Revenue: > $20MM Revolvers/ Term Loans ABL & Leveraged Lending Syndicated Finance Equipment Finance 13Q17 average balances from the Commercial Banking segment Public & Private Companies (National footprint): ~1600 Customers Transaction Profile: Avg. Commitment Size: ~$35MM Client Revenue: >$500MM In-footprint Middle Market Companies (Public & Pvt.): ~5500 Customers Transaction Profile: Avg. Commitment Size: ~$10MM Client Revenue: $20 -$500MM Corporate Banking
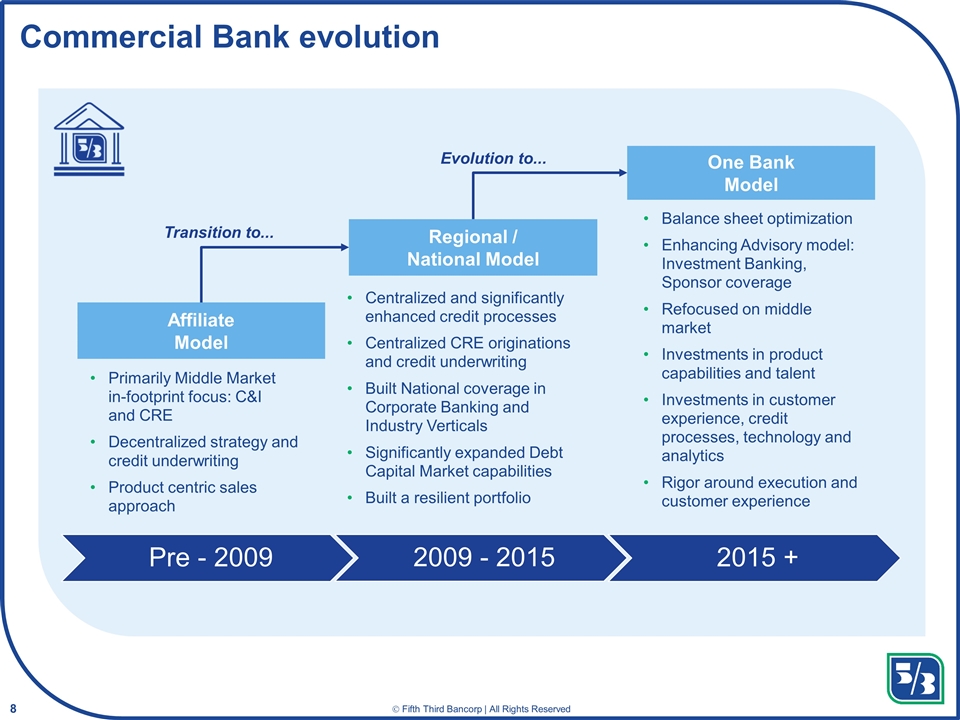
Commercial Bank evolution Pre - 2009 2009 - 2015 2015 + Primarily Middle Market in-footprint focus: C&I and CRE Decentralized strategy and credit underwriting Product centric sales approach Centralized and significantly enhanced credit processes Centralized CRE originations and credit underwriting Built National coverage in Corporate Banking and Industry Verticals Significantly expanded Debt Capital Market capabilities Built a resilient portfolio Balance sheet optimization Enhancing Advisory model: Investment Banking, Sponsor coverage Refocused on middle market Investments in product capabilities and talent Investments in customer experience, credit processes, technology and analytics Rigor around execution and customer experience Affiliate Model Regional / National Model One Bank Model Transition to... Evolution to...
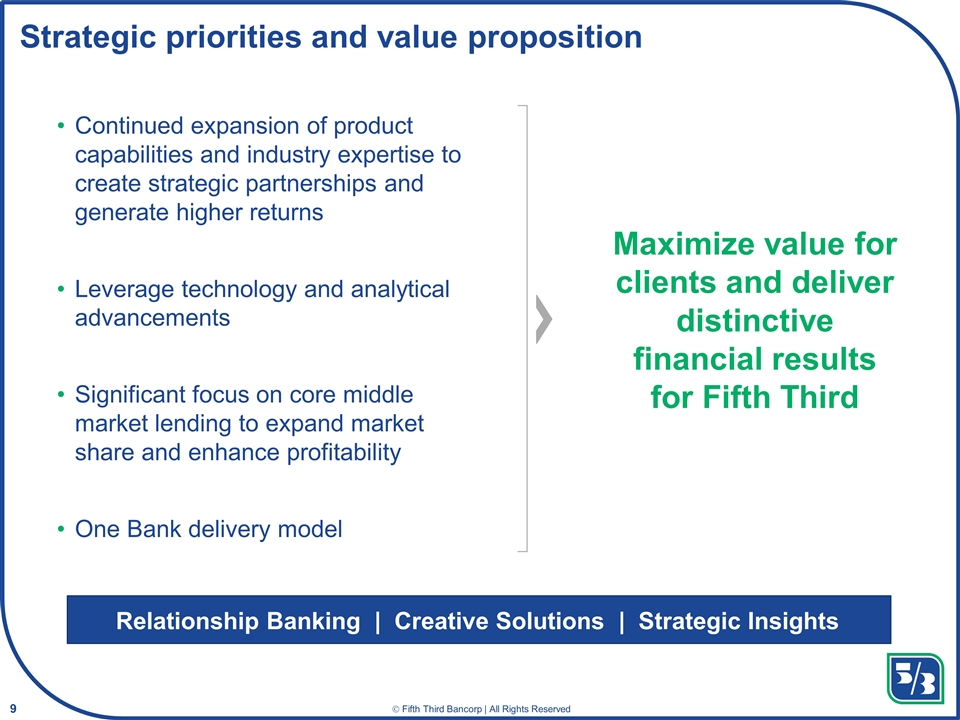
Strategic priorities and value proposition Continued expansion of product capabilities and industry expertise to create strategic partnerships and generate higher returns Leverage technology and analytical advancements Significant focus on core middle market lending to expand market share and enhance profitability One Bank delivery model Maximize value for clients and deliver distinctive financial results for Fifth Third Relationship Banking | Creative Solutions | Strategic Insights
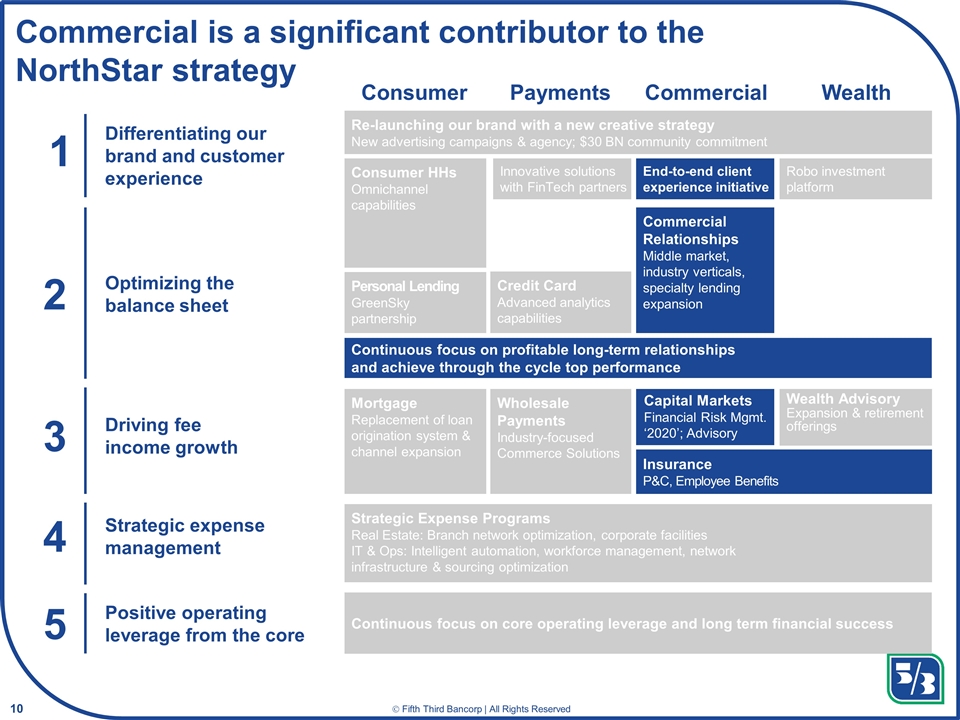
Capital Markets Financial Risk Mgmt. ‘2020’; Advisory Commercial is a significant contributor to the NorthStar strategy 1 Differentiating our brand and customer experience 2 Optimizing the balance sheet Driving fee income growth 3 4 Strategic expense management Consumer Payments Commercial Wealth 5 Positive operating leverage from the core Personal Lending GreenSky partnership Credit Card Advanced analytics capabilities Wholesale Payments Industry-focused Commerce Solutions Insurance P&C, Employee Benefits Commercial Relationships Middle market, industry verticals, specialty lending expansion Wealth Advisory Expansion & retirement offerings Strategic Expense Programs Real Estate: Branch network optimization, corporate facilities IT & Ops: Intelligent automation, workforce management, network infrastructure & sourcing optimization Re-launching our brand with a new creative strategy New advertising campaigns & agency; $30 BN community commitment Consumer HHs Omnichannel capabilities Continuous focus on core operating leverage and long term financial success Mortgage Replacement of loan origination system & channel expansion Continuous focus on profitable long-term relationships and achieve through the cycle top performance End-to-end client experience initiative Robo investment platform Innovative solutions with FinTech partners
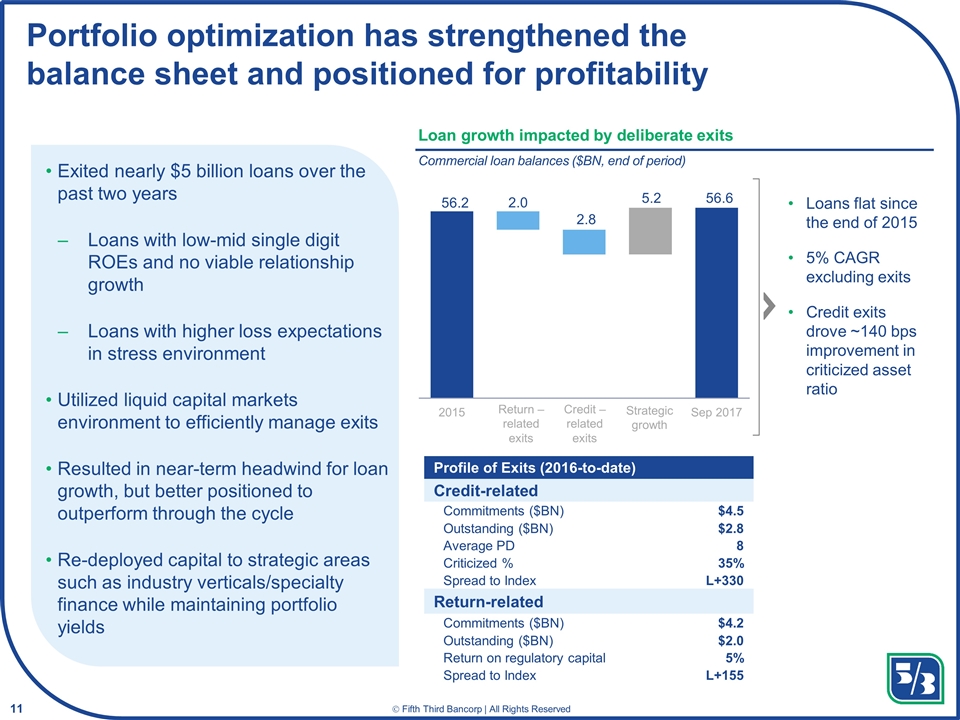
Portfolio optimization has strengthened the balance sheet and positioned for profitability Exited nearly $5 billion loans over the past two years Loans with low-mid single digit ROEs and no viable relationship growth Loans with higher loss expectations in stress environment Utilized liquid capital markets environment to efficiently manage exits Resulted in near-term headwind for loan growth, but better positioned to outperform through the cycle Re-deployed capital to strategic areas such as industry verticals/specialty finance while maintaining portfolio yields Loan growth impacted by deliberate exits Commercial loan balances ($BN, end of period) Loans flat since the end of 2015 5% CAGR excluding exits Credit exits drove ~140 bps improvement in criticized asset ratio Return – related exits Credit – related exits Strategic growth Profile of Exits (2016-to-date) Credit-related Commitments ($BN) $4.5 Outstanding ($BN) $2.8 Average PD 8 Criticized % 35% Spread to Index L+330 Return-related Commitments ($BN) $4.2 Outstanding ($BN) $2.0 Return on regulatory capital 5% Spread to Index L+155
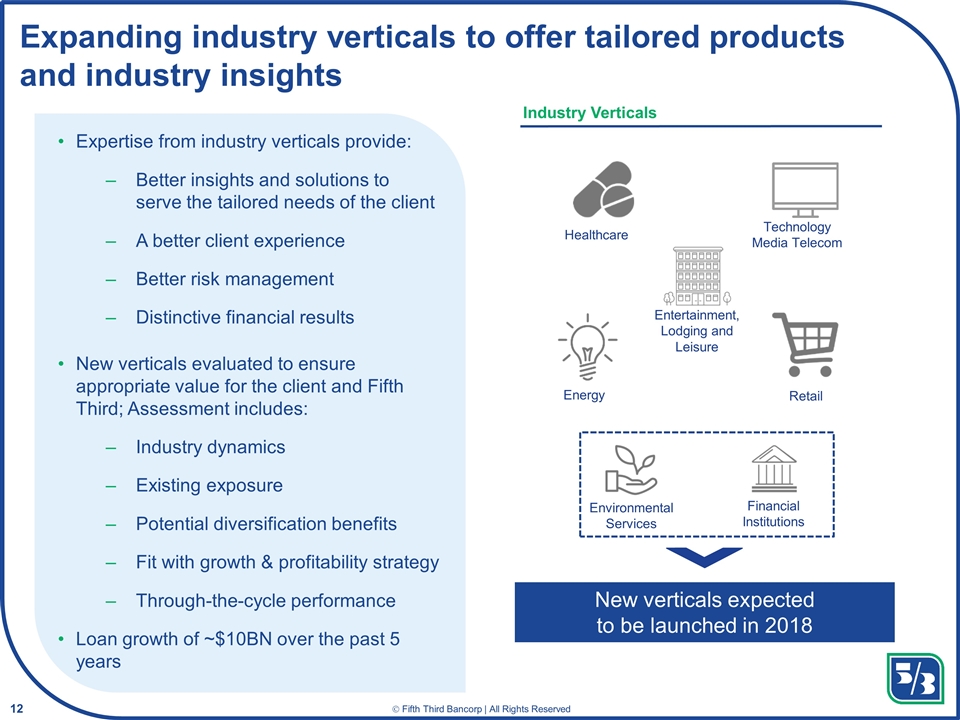
Expanding industry verticals to offer tailored products and industry insights Expertise from industry verticals provide: Better insights and solutions to serve the tailored needs of the client A better client experience Better risk management Distinctive financial results New verticals evaluated to ensure appropriate value for the client and Fifth Third; Assessment includes: Industry dynamics Existing exposure Potential diversification benefits Fit with growth & profitability strategy Through-the-cycle performance Loan growth of ~$10BN over the past 5 years Industry Verticals Healthcare Energy Environmental Services Entertainment, Lodging and Leisure Retail Technology Media Telecom Financial Institutions New verticals expected to be launched in 2018
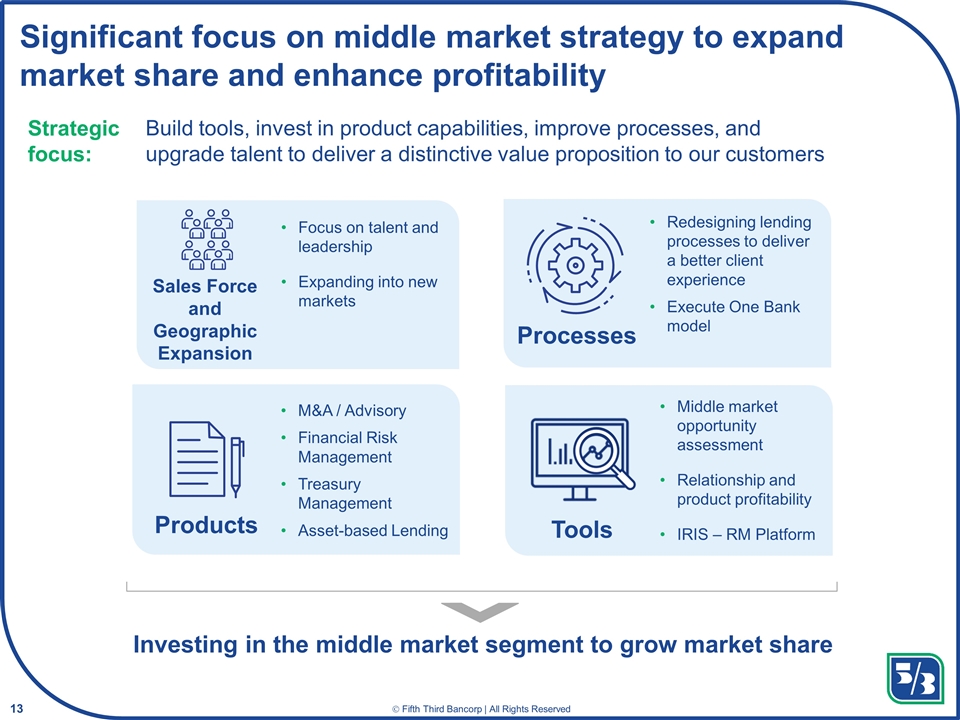
Investing in the middle market segment to grow market share Significant focus on middle market strategy to expand market share and enhance profitability Build tools, invest in product capabilities, improve processes, and upgrade talent to deliver a distinctive value proposition to our customers Strategic focus: Sales Force and Geographic Expansion Focus on talent and leadership Expanding into new markets Processes Redesigning lending processes to deliver a better client experience Execute One Bank model Products M&A / Advisory Financial Risk Management Treasury Management Asset-based Lending Tools Middle market opportunity assessment Relationship and product profitability IRIS – RM Platform
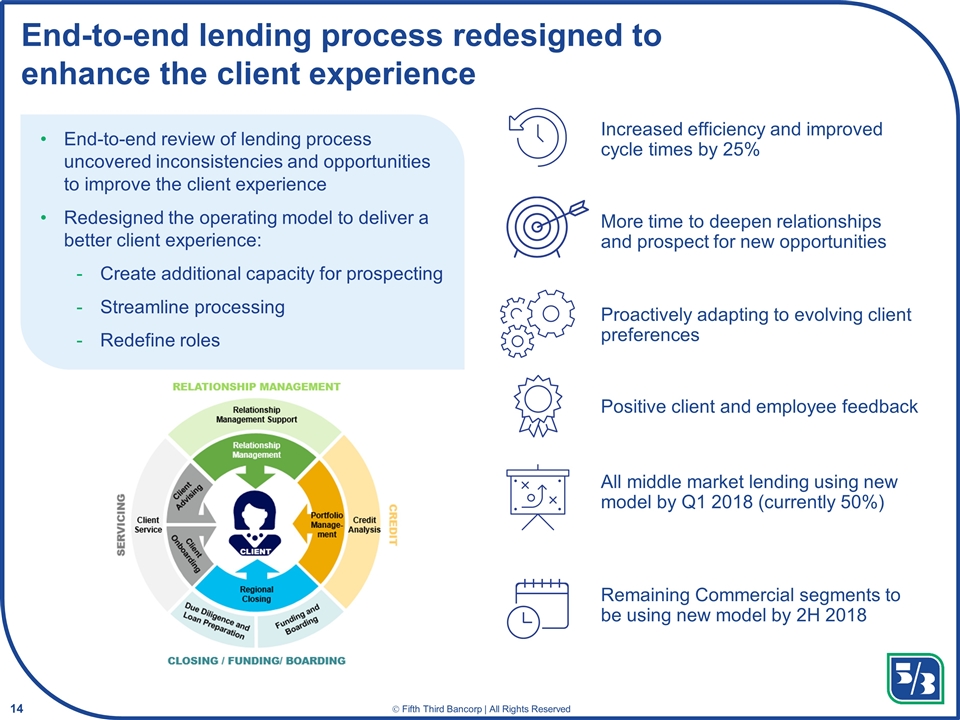
End-to-end lending process redesigned to enhance the client experience End-to-end review of lending process uncovered inconsistencies and opportunities to improve the client experience Redesigned the operating model to deliver a better client experience: Create additional capacity for prospecting Streamline processing Redefine roles Positive client and employee feedback Increased efficiency and improved cycle times by 25% More time to deepen relationships and prospect for new opportunities Proactively adapting to evolving client preferences All middle market lending using new model by Q1 2018 (currently 50%) Remaining Commercial segments to be using new model by 2H 2018
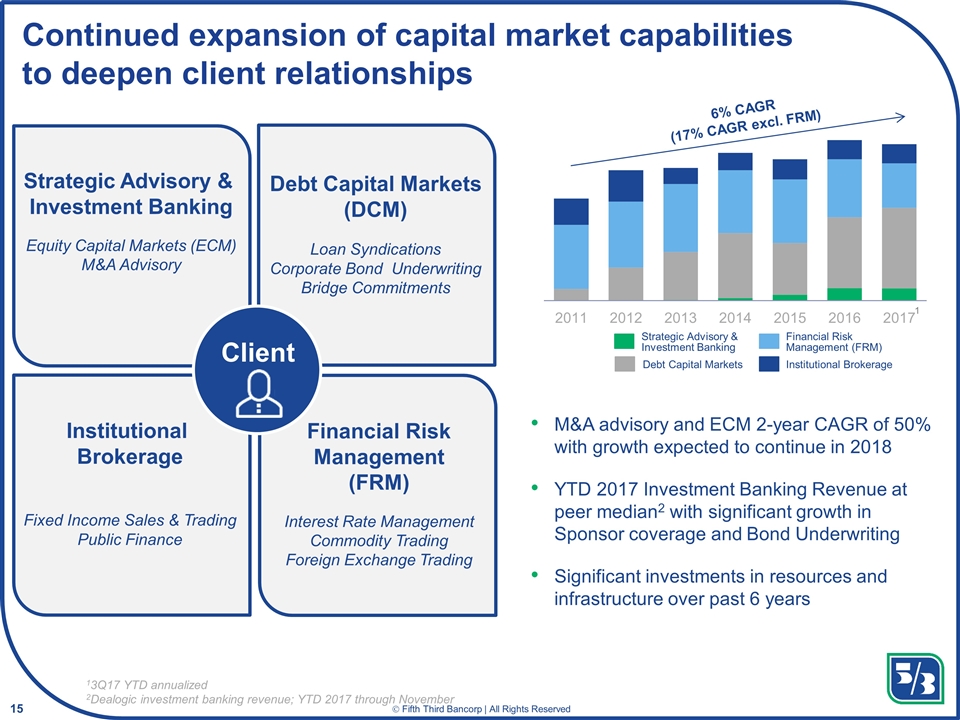
Strategic Advisory & Investment Banking Continued expansion of capital market capabilities to deepen client relationships Strategic Advisory & Investment Banking Equity Capital Markets (ECM) M&A Advisory Debt Capital Markets (DCM) Loan Syndications Corporate Bond Underwriting Bridge Commitments Institutional Brokerage Fixed Income Sales & Trading Public Finance Financial Risk Management (FRM) Interest Rate Management Commodity Trading Foreign Exchange Trading 6% CAGR (17% CAGR excl. FRM) 1 13Q17 YTD annualized 2Dealogic investment banking revenue; YTD 2017 through November M&A advisory and ECM 2-year CAGR of 50% with growth expected to continue in 2018 YTD 2017 Investment Banking Revenue at peer median2 with significant growth in Sponsor coverage and Bond Underwriting Significant investments in resources and infrastructure over past 6 years Client Debt Capital Markets Institutional Brokerage Financial Risk Management (FRM)
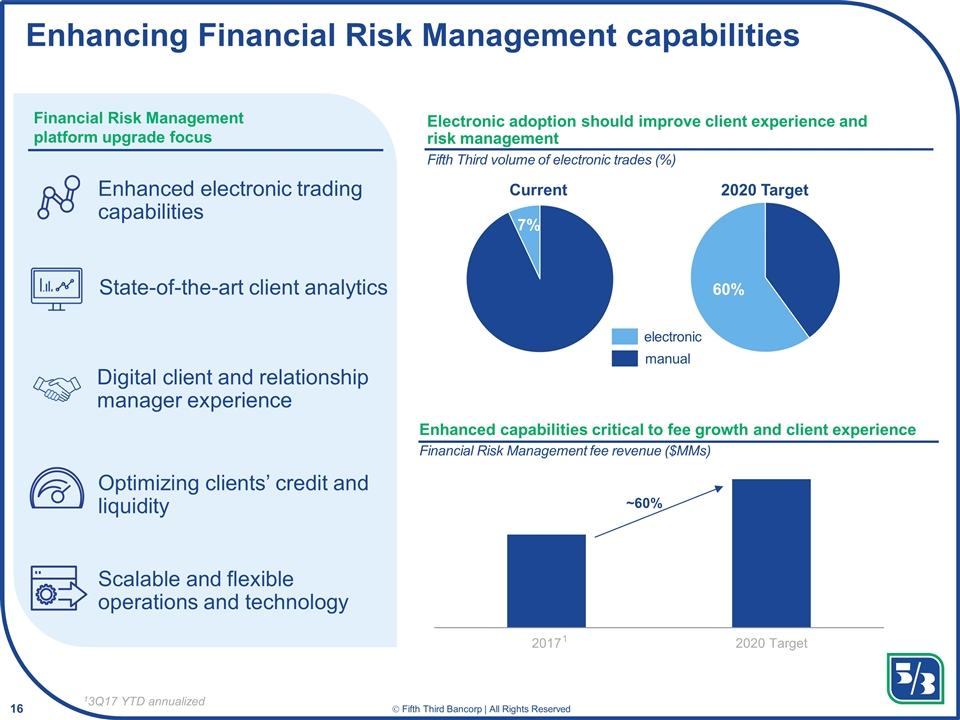
Enhanced electronic trading capabilities Enhancing Financial Risk Management capabilities State-of-the-art client analytics Digital client and relationship manager experience Optimizing clients’ credit and liquidity Scalable and flexible operations and technology Current 2020 Target Enhanced capabilities critical to fee growth and client experience Financial Risk Management fee revenue ($MMs) Electronic adoption should improve client experience and risk management Fifth Third volume of electronic trades (%) ~60% 1 13Q17 YTD annualized electronic manual Financial Risk Management platform upgrade focus
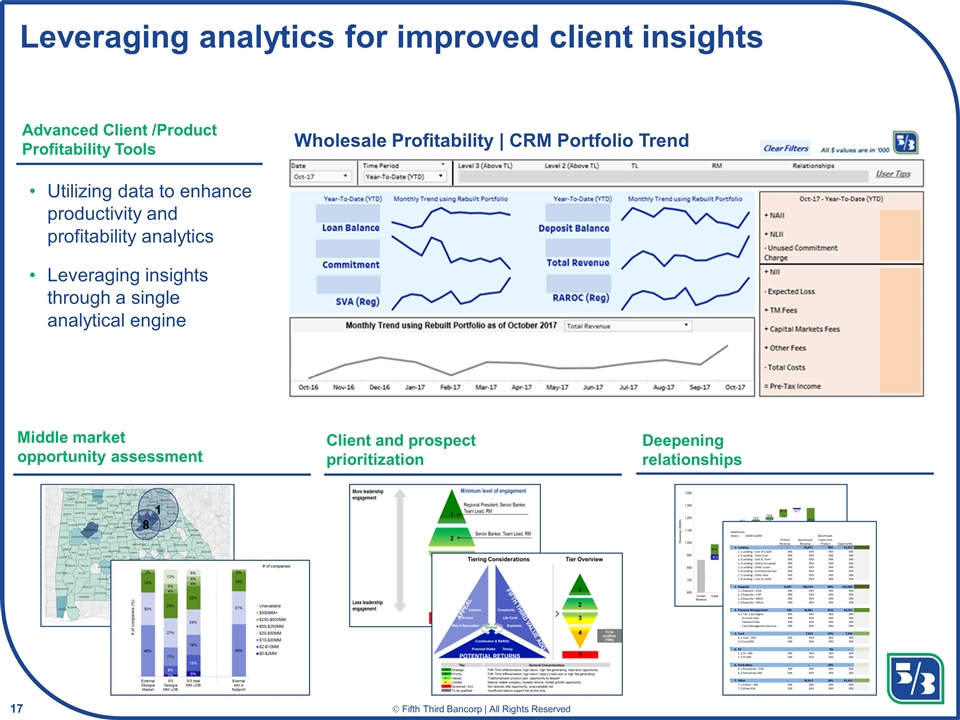
Leveraging analytics for improved client insights Deepening relationships Middle market opportunity assessment Client and prospect prioritization Utilizing data to enhance productivity and profitability analytics Leveraging insights through a single analytical engine Advanced Client /Product Profitability Tools Wholesale Profitability | CRM Portfolio Trend
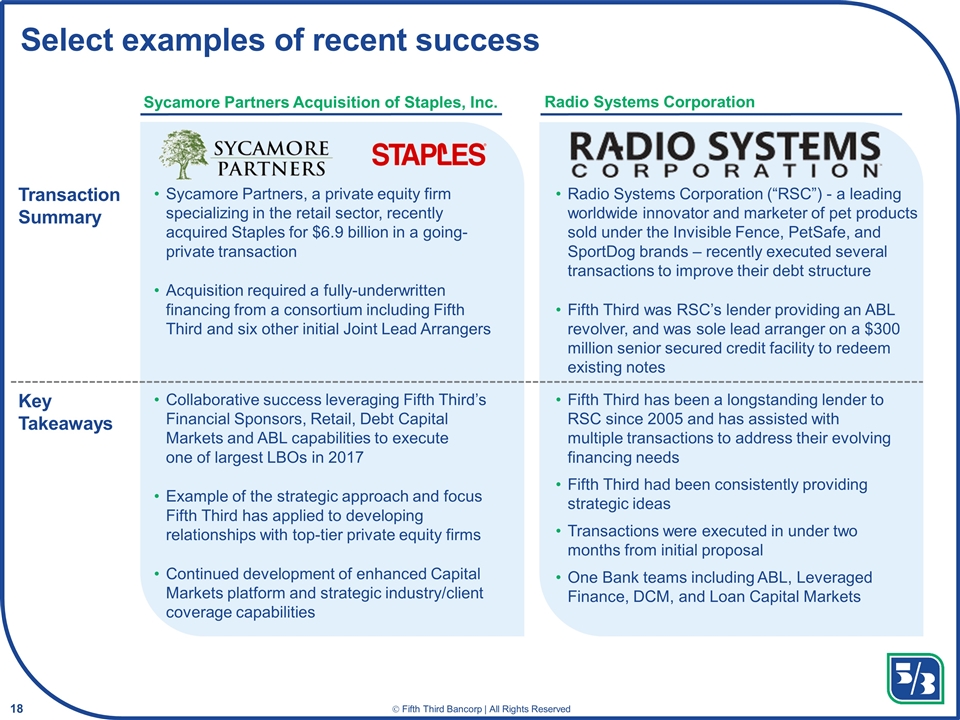
Select examples of recent success Transaction Summary Key Takeaways Radio Systems Corporation Sycamore Partners Acquisition of Staples, Inc. Radio Systems Corporation (“RSC”) - a leading worldwide innovator and marketer of pet products sold under the Invisible Fence, PetSafe, and SportDog brands – recently executed several transactions to improve their debt structure Fifth Third was RSC’s lender providing an ABL revolver, and was sole lead arranger on a $300 million senior secured credit facility to redeem existing notes Fifth Third has been a longstanding lender to RSC since 2005 and has assisted with multiple transactions to address their evolving financing needs Fifth Third had been consistently providing strategic ideas Transactions were executed in under two months from initial proposal One Bank teams including ABL, Leveraged Finance, DCM, and Loan Capital Markets Sycamore Partners, a private equity firm specializing in the retail sector, recently acquired Staples for $6.9 billion in a going-private transaction Acquisition required a fully-underwritten financing from a consortium including Fifth Third and six other initial Joint Lead Arrangers Collaborative success leveraging Fifth Third’s Financial Sponsors, Retail, Debt Capital Markets and ABL capabilities to execute one of largest LBOs in 2017 Example of the strategic approach and focus Fifth Third has applied to developing relationships with top-tier private equity firms Continued development of enhanced Capital Markets platform and strategic industry/client coverage capabilities
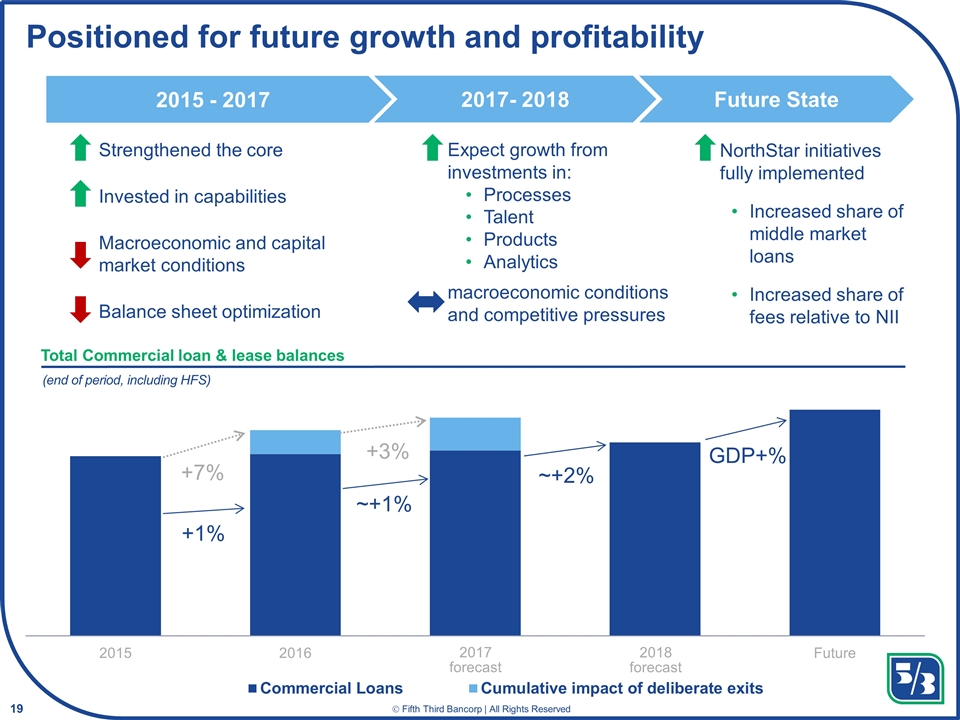
Strengthened the core Invested in capabilities Macroeconomic and capital market conditions Balance sheet optimization Positioned for future growth and profitability +1% ~+1% ~+2% GDP+% +7% +3% Expect growth from investments in: Processes Talent Products Analytics macroeconomic conditions and competitive pressures NorthStar initiatives fully implemented Increased share of middle market loans Increased share of fees relative to NII 2015 - 2017 2017- 2018 Future State +/- Total Commercial loan & lease balances (end of period, including HFS) 2017 forecast 2018 forecast
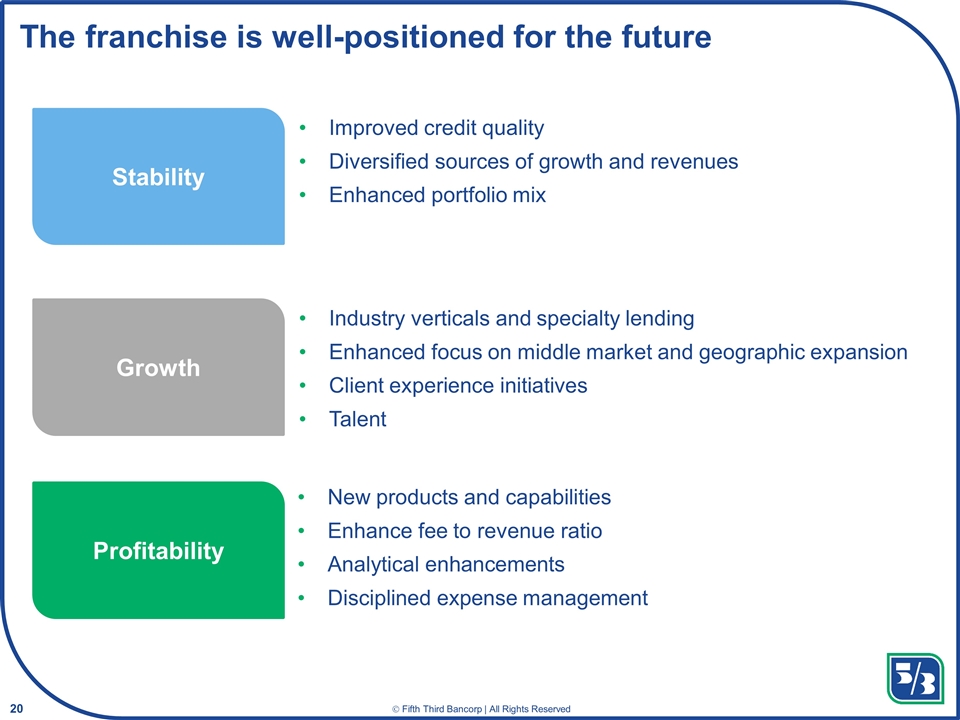
The franchise is well-positioned for the future Improved credit quality Diversified sources of growth and revenues Enhanced portfolio mix Industry verticals and specialty lending Enhanced focus on middle market and geographic expansion Client experience initiatives Talent New products and capabilities Enhance fee to revenue ratio Analytical enhancements Disciplined expense management Stability Profitability Growth
Wealth & Asset Management (WAM) Mike Michael Executive Vice President Head of Wealth & Asset Management
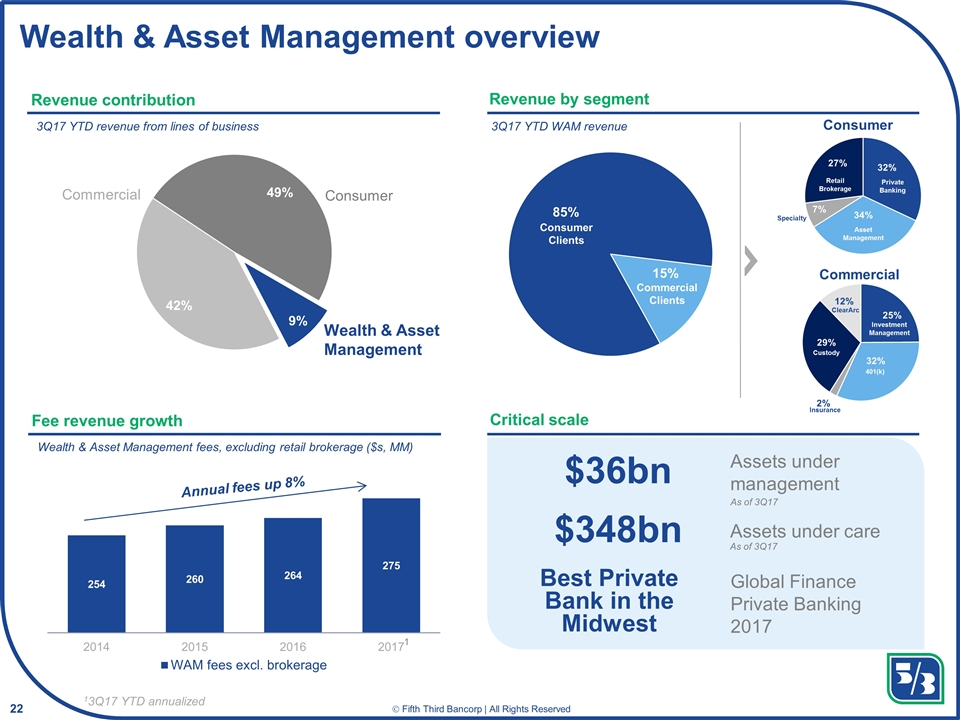
Wealth & Asset Management overview Revenue contribution Fee revenue growth Critical scale $36bn Assets under management $348bn Assets under care Global Finance Private Banking 2017 Best Private Bank in the Midwest 3Q17 YTD revenue from lines of business As of 3Q17 As of 3Q17 Revenue by segment Consumer Commercial Retail Brokerage Specialty Private Banking Asset Management Investment Management 401(k) Custody ClearArc Insurance 3Q17 YTD WAM revenue Consumer Clients Commercial Clients 13Q17 YTD annualized 1 Wealth & Asset Management fees, excluding retail brokerage ($s, MM)
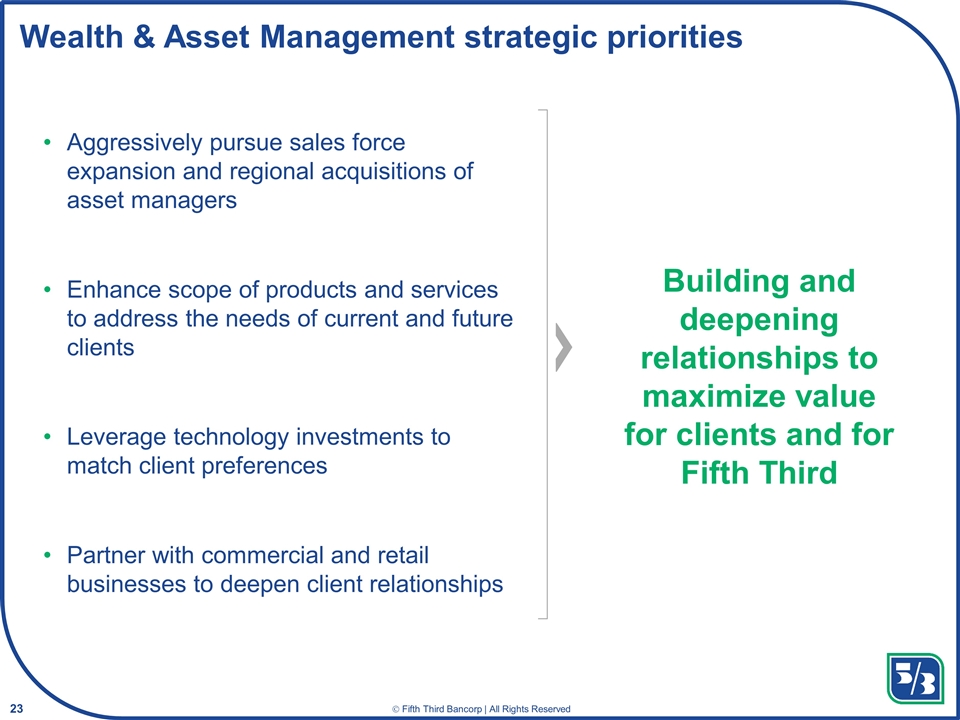
Wealth & Asset Management strategic priorities Aggressively pursue sales force expansion and regional acquisitions of asset managers Enhance scope of products and services to address the needs of current and future clients Leverage technology investments to match client preferences Partner with commercial and retail businesses to deepen client relationships Building and deepening relationships to maximize value for clients and for Fifth Third
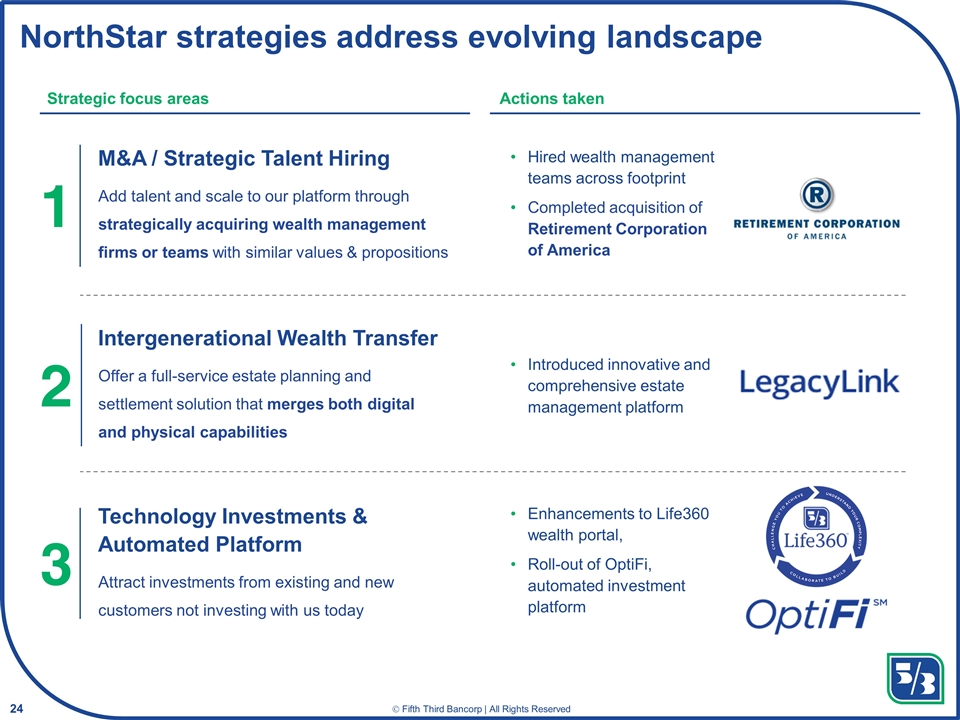
Hired wealth management teams across footprint Completed acquisition of Retirement Corporation of America NorthStar strategies address evolving landscape Strategic focus areas Actions taken 1 2 3 M&A / Strategic Talent Hiring Add talent and scale to our platform through strategically acquiring wealth management firms or teams with similar values & propositions Intergenerational Wealth Transfer Offer a full-service estate planning and settlement solution that merges both digital and physical capabilities Technology Investments & Automated Platform Attract investments from existing and new customers not investing with us today Enhancements to Life360 wealth portal, Roll-out of OptiFi, automated investment platform Introduced innovative and comprehensive estate management platform
One Bank Strategy Lars Anderson Executive Vice President Chief Operating Officer
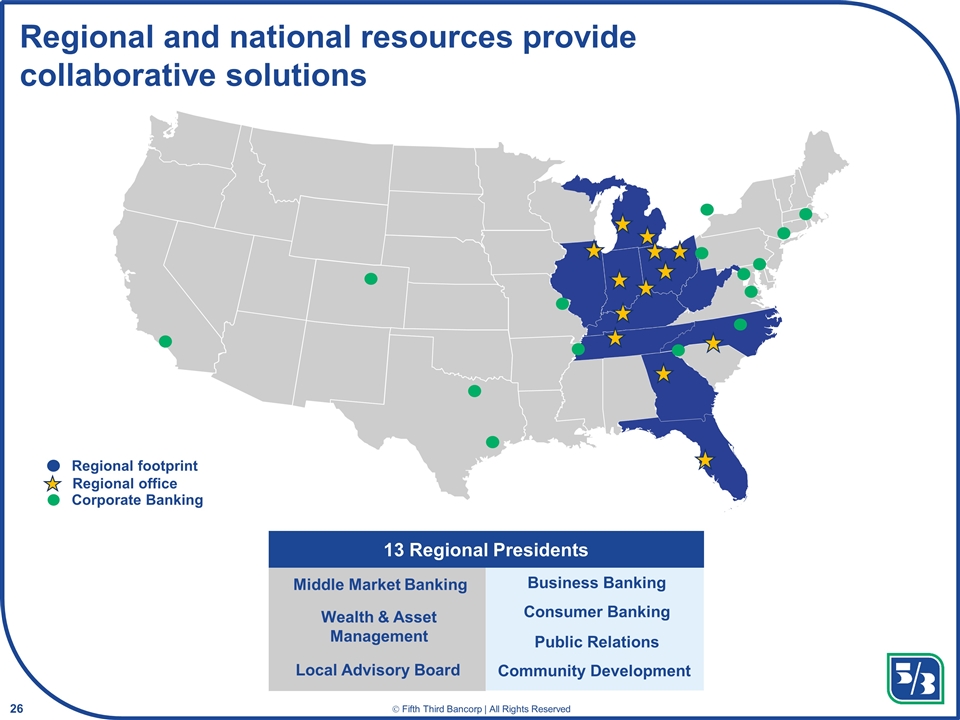
Regional and national resources provide collaborative solutions Middle Market Banking Wealth & Asset Management Business Banking Consumer Banking Public Relations Community Development 13 Regional Presidents Regional footprint Corporate Banking Regional office Local Advisory Board reprint
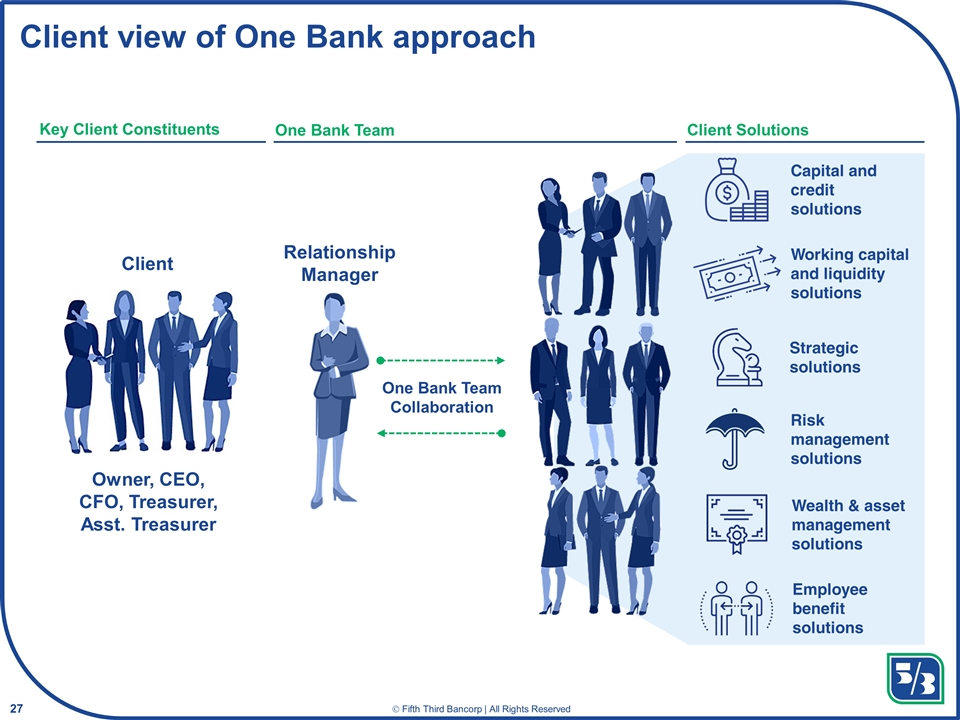
Client view of One Bank approach Key Client Constituents One Bank Team Client Solutions Capital and credit solutions Working capital and liquidity solutions Wealth & asset management solutions Risk management solutions Strategic solutions Employee benefit solutions One Bank Team Collaboration Relationship Manager Client Owner, CEO, CFO, Treasurer, Asst. Treasurer
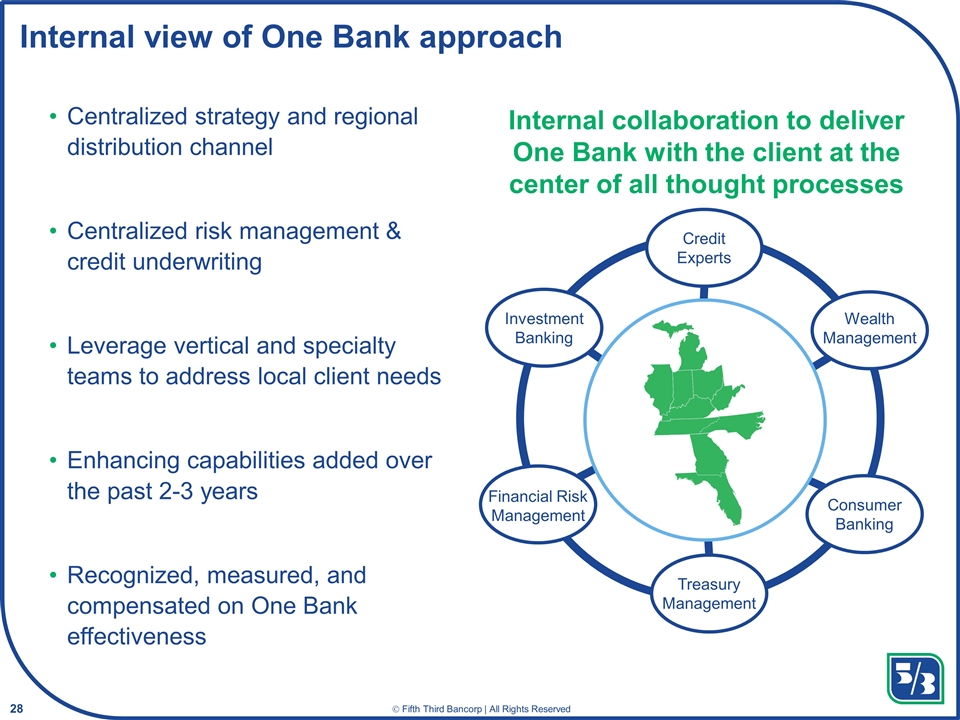
Internal view of One Bank approach Centralized strategy and regional distribution channel Centralized risk management & credit underwriting Leverage vertical and specialty teams to address local client needs Enhancing capabilities added over the past 2-3 years Recognized, measured, and compensated on One Bank effectiveness Internal collaboration to deliver One Bank with the client at the center of all thought processes Credit Experts Wealth Management Consumer Banking Investment Banking Treasury Management Financial Risk Management reprint
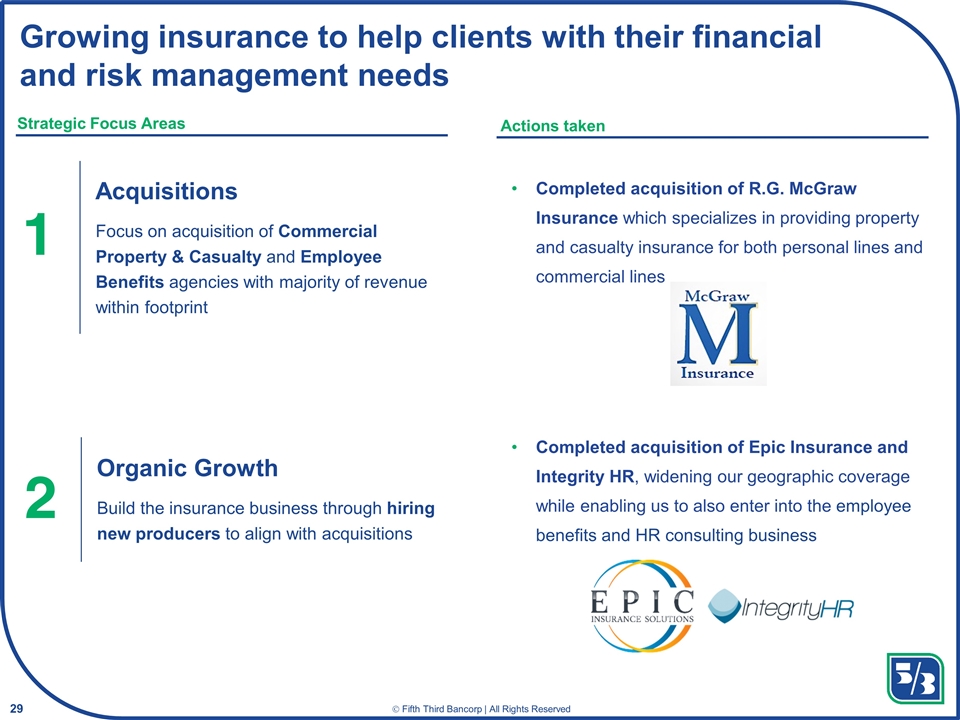
Completed acquisition of R.G. McGraw Insurance which specializes in providing property and casualty insurance for both personal lines and commercial lines Completed acquisition of Epic Insurance and Integrity HR, widening our geographic coverage while enabling us to also enter into the employee benefits and HR consulting business Growing insurance to help clients with their financial and risk management needs Strategic Focus Areas Actions taken 1 2 Acquisitions Focus on acquisition of Commercial Property & Casualty and Employee Benefits agencies with majority of revenue within footprint Organic Growth Build the insurance business through hiring new producers to align with acquisitions
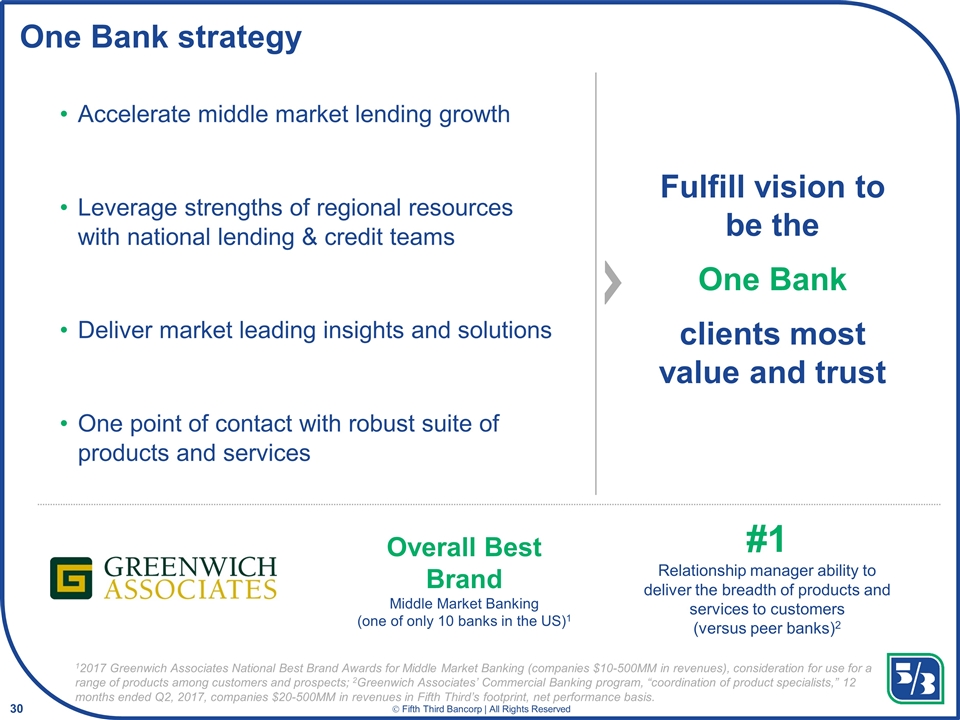
One Bank strategy Accelerate middle market lending growth Leverage strengths of regional resources with national lending & credit teams Deliver market leading insights and solutions One point of contact with robust suite of products and services Fulfill vision to be the One Bank clients most value and trust Overall Best Brand Middle Market Banking (one of only 10 banks in the US)1 12017 Greenwich Associates National Best Brand Awards for Middle Market Banking (companies $10-500MM in revenues), consideration for use for a range of products among customers and prospects; 2Greenwich Associates’ Commercial Banking program, “coordination of product specialists,” 12 months ended Q2, 2017, companies $20-500MM in revenues in Fifth Third’s footprint, net performance basis. #1 Relationship manager ability to deliver the breadth of products and services to customers (versus peer banks)2
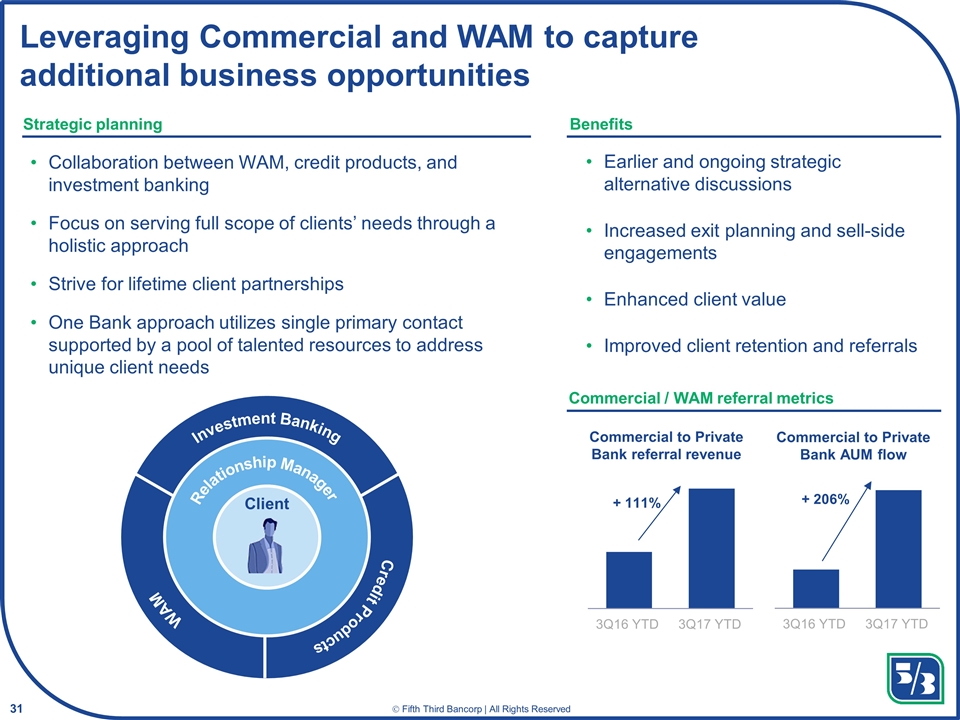
Leveraging Commercial and WAM to capture additional business opportunities Collaboration between WAM, credit products, and investment banking Focus on serving full scope of clients’ needs through a holistic approach Strive for lifetime client partnerships One Bank approach utilizes single primary contact supported by a pool of talented resources to address unique client needs Benefits Earlier and ongoing strategic alternative discussions Increased exit planning and sell-side engagements Enhanced client value Improved client retention and referrals Commercial to Private Bank referral revenue Strategic planning Commercial / WAM referral metrics + 111% Commercial to Private Bank AUM flow + 206% Relationship Manager Investment Banking WAM Credit Products Client
One Bank success story: Roadworks Manufacturing
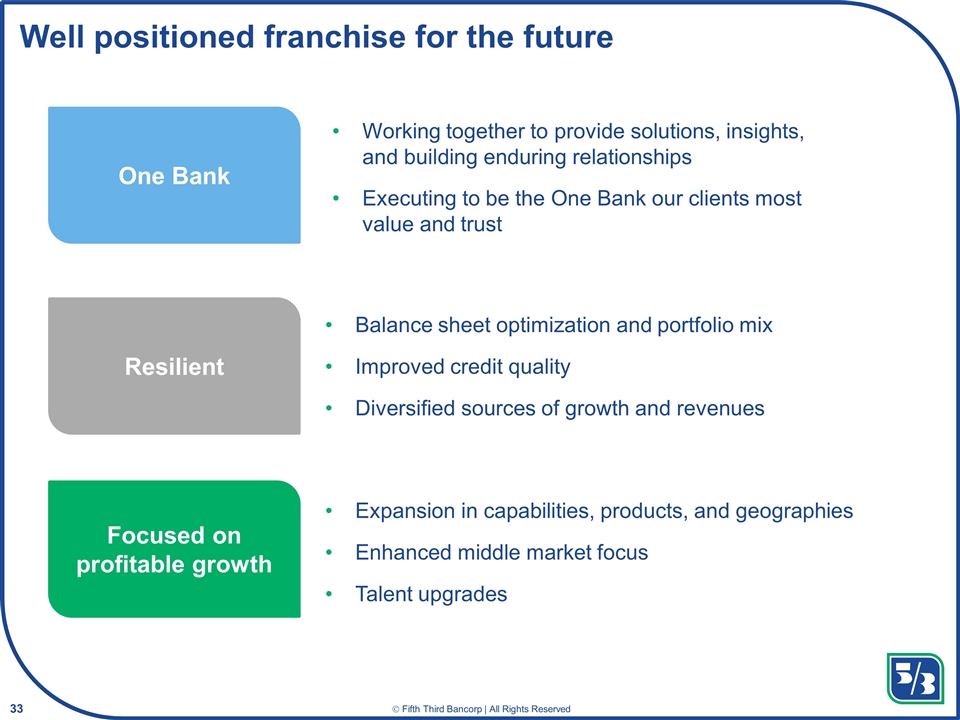
Well positioned franchise for the future Balance sheet optimization and portfolio mix Improved credit quality Diversified sources of growth and revenues 1 2 3 Working together to provide solutions, insights, and building enduring relationships Executing to be the One Bank our clients most value and trust Expansion in capabilities, products, and geographies Enhanced middle market focus Talent upgrades One Bank Focused on profitable growth Resilient
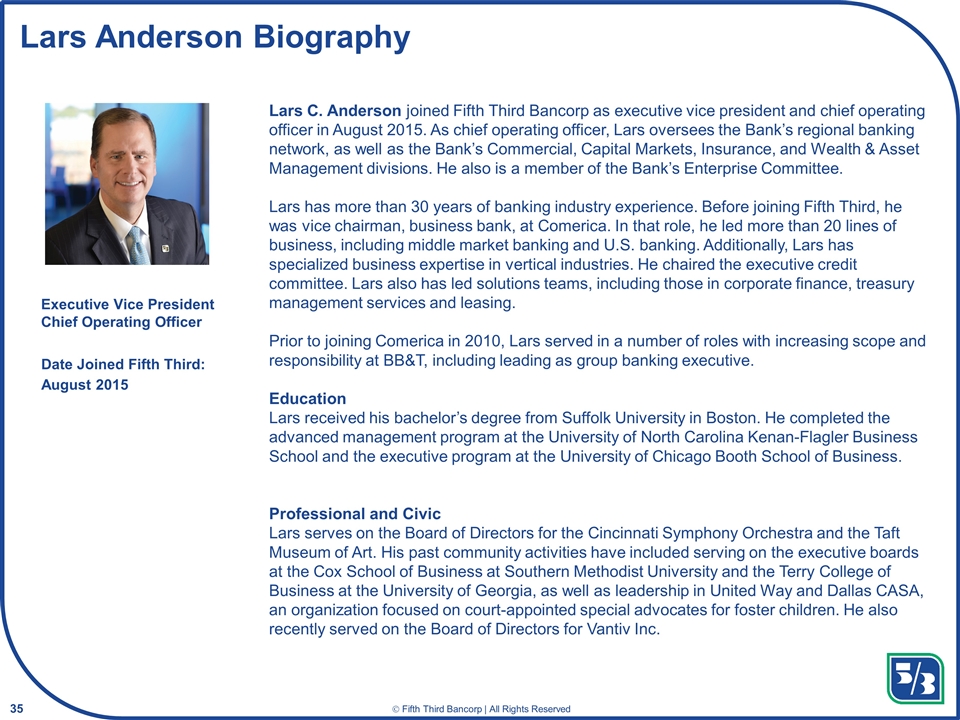
Lars Anderson Biography Lars C. Anderson joined Fifth Third Bancorp as executive vice president and chief operating officer in August 2015. As chief operating officer, Lars oversees the Bank’s regional banking network, as well as the Bank’s Commercial, Capital Markets, Insurance, and Wealth & Asset Management divisions. He also is a member of the Bank’s Enterprise Committee. Lars has more than 30 years of banking industry experience. Before joining Fifth Third, he was vice chairman, business bank, at Comerica. In that role, he led more than 20 lines of business, including middle market banking and U.S. banking. Additionally, Lars has specialized business expertise in vertical industries. He chaired the executive credit committee. Lars also has led solutions teams, including those in corporate finance, treasury management services and leasing. Prior to joining Comerica in 2010, Lars served in a number of roles with increasing scope and responsibility at BB&T, including leading as group banking executive. Education Lars received his bachelor’s degree from Suffolk University in Boston. He completed the advanced management program at the University of North Carolina Kenan-Flagler Business School and the executive program at the University of Chicago Booth School of Business. Professional and Civic Lars serves on the Board of Directors for the Cincinnati Symphony Orchestra and the Taft Museum of Art. His past community activities have included serving on the executive boards at the Cox School of Business at Southern Methodist University and the Terry College of Business at the University of Georgia, as well as leadership in United Way and Dallas CASA, an organization focused on court-appointed special advocates for foster children. He also recently served on the Board of Directors for Vantiv Inc. Executive Vice President Chief Operating Officer Date Joined Fifth Third: August 2015
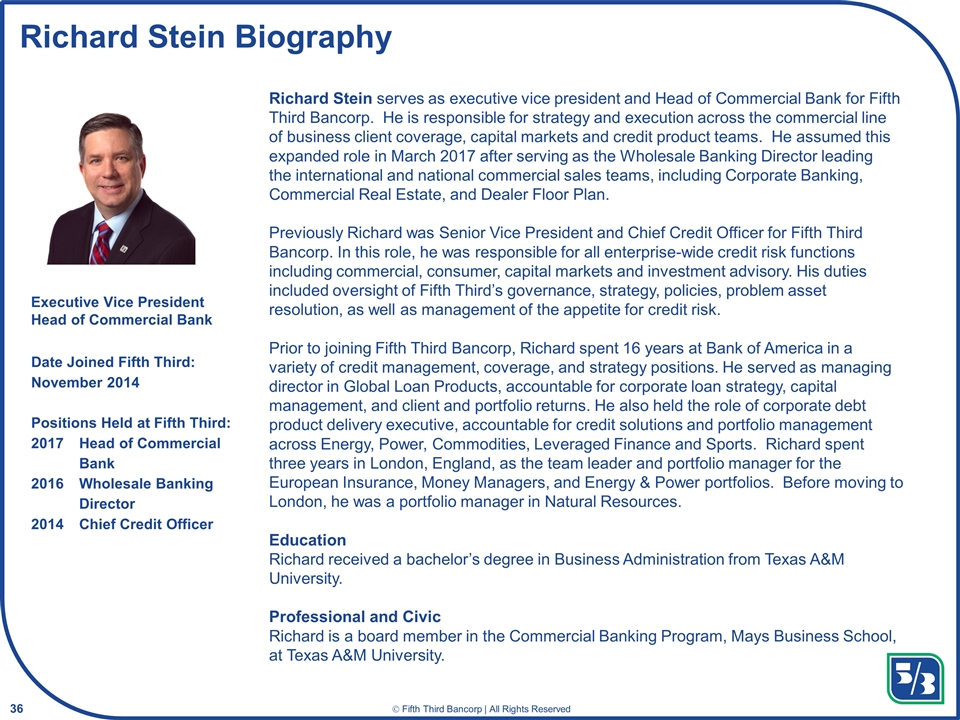
Richard Stein Biography Richard Stein serves as executive vice president and Head of Commercial Bank for Fifth Third Bancorp. He is responsible for strategy and execution across the commercial line of business client coverage, capital markets and credit product teams. He assumed this expanded role in March 2017 after serving as the Wholesale Banking Director leading the international and national commercial sales teams, including Corporate Banking, Commercial Real Estate, and Dealer Floor Plan. Previously Richard was Senior Vice President and Chief Credit Officer for Fifth Third Bancorp. In this role, he was responsible for all enterprise-wide credit risk functions including commercial, consumer, capital markets and investment advisory. His duties included oversight of Fifth Third’s governance, strategy, policies, problem asset resolution, as well as management of the appetite for credit risk. Prior to joining Fifth Third Bancorp, Richard spent 16 years at Bank of America in a variety of credit management, coverage, and strategy positions. He served as managing director in Global Loan Products, accountable for corporate loan strategy, capital management, and client and portfolio returns. He also held the role of corporate debt product delivery executive, accountable for credit solutions and portfolio management across Energy, Power, Commodities, Leveraged Finance and Sports. Richard spent three years in London, England, as the team leader and portfolio manager for the European Insurance, Money Managers, and Energy & Power portfolios. Before moving to London, he was a portfolio manager in Natural Resources. Education Richard received a bachelor’s degree in Business Administration from Texas A&M University. Professional and Civic Richard is a board member in the Commercial Banking Program, Mays Business School, at Texas A&M University. Executive Vice President Head of Commercial Bank Date Joined Fifth Third: November 2014 Positions Held at Fifth Third: 2017Head of Commercial Bank 2016Wholesale Banking Director 2014Chief Credit Officer
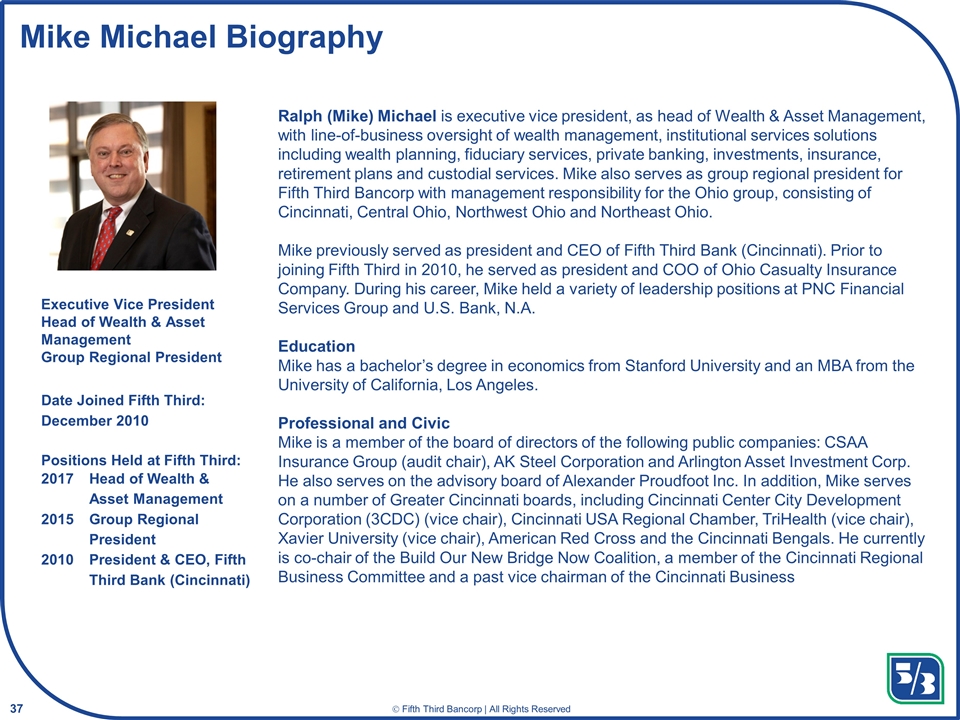
Mike Michael Biography Ralph (Mike) Michael is executive vice president, as head of Wealth & Asset Management, with line-of-business oversight of wealth management, institutional services solutions including wealth planning, fiduciary services, private banking, investments, insurance, retirement plans and custodial services. Mike also serves as group regional president for Fifth Third Bancorp with management responsibility for the Ohio group, consisting of Cincinnati, Central Ohio, Northwest Ohio and Northeast Ohio. Mike previously served as president and CEO of Fifth Third Bank (Cincinnati). Prior to joining Fifth Third in 2010, he served as president and COO of Ohio Casualty Insurance Company. During his career, Mike held a variety of leadership positions at PNC Financial Services Group and U.S. Bank, N.A. Education Mike has a bachelor’s degree in economics from Stanford University and an MBA from the University of California, Los Angeles. Professional and Civic Mike is a member of the board of directors of the following public companies: CSAA Insurance Group (audit chair), AK Steel Corporation and Arlington Asset Investment Corp. He also serves on the advisory board of Alexander Proudfoot Inc. In addition, Mike serves on a number of Greater Cincinnati boards, including Cincinnati Center City Development Corporation (3CDC) (vice chair), Cincinnati USA Regional Chamber, TriHealth (vice chair), Xavier University (vice chair), American Red Cross and the Cincinnati Bengals. He currently is co-chair of the Build Our New Bridge Now Coalition, a member of the Cincinnati Regional Business Committee and a past vice chairman of the Cincinnati Business Executive Vice President Head of Wealth & Asset Management Group Regional President Date Joined Fifth Third: December 2010 Positions Held at Fifth Third: 2017 Head of Wealth & Asset Management 2015 Group Regional President 2010 President & CEO, Fifth Third Bank (Cincinnati)
Finance Update Tayfun Tuzun Executive Vice President Chief Financial Officer
Cautionary statement This presentation contains statements that we believe are “forward-looking statements” within the meaning of Section 27A of the Securities Act of 1933, as amended, and Rule 175 promulgated thereunder, and Section 21E of the Securities Exchange Act of 1934, as amended, and Rule 3b-6 promulgated thereunder. These statements relate to our financial condition, results of operations, plans, objectives, future performance or business. They usually can be identified by the use of forward-looking language such as “will likely result,” “may,” “are expected to,” “is anticipated,” “potential,” “estimate,” “forecast,” “projected,” “intends to,” or may include other similar words or phrases such as “believes,” “plans,” “trend,” “objective,” “continue,” “remain,” or similar expressions, or future or conditional verbs such as “will,” “would,” “should,” “could,” “might,” “can,” or similar verbs. You should not place undue reliance on these statements, as they are subject to risks and uncertainties, including but not limited to the risk factors set forth in our most recent Annual Report on Form 10-K, as updated by our Quarterly Reports on Form 10-Q. When considering these forward-looking statements, you should keep in mind these risks and uncertainties, as well as any cautionary statements we may make. Moreover, you should treat these statements as speaking only as of the date they are made and based only on information then actually known to us. We undertake no obligation to release revisions to these forward-looking statements or reflect events or circumstances after the date of this document. There are a number of important factors that could cause future results to differ materially from historical performance and these forward-looking statements. Factors that might cause such a difference include, but are not limited to: (1) general economic or real estate market conditions, either nationally or in the states in which Fifth Third, one or more acquired entities and/or the combined company do business, weaken or are less favorable than expected; (2) deteriorating credit quality; (3) political developments, wars or other hostilities may disrupt or increase volatility in securities markets or other economic conditions; (4) changes in the interest rate environment reduce interest margins; (5) prepayment speeds, loan origination and sale volumes, charge-offs and loan loss provisions; (6) Fifth Third’s ability to maintain required capital levels and adequate sources of funding and liquidity; (7) maintaining capital requirements and adequate sources of funding and liquidity may limit Fifth Third’s operations and potential growth; (8) changes and trends in capital markets; (9) problems encountered by larger or similar financial institutions may adversely affect the banking industry and/or Fifth Third; (10) competitive pressures among depository institutions increase significantly; (11) changes in customer preferences or information technology systems; (12) effects of critical accounting policies and judgments; (13) changes in accounting policies or procedures as may be required by the Financial Accounting Standards Board (FASB) or other regulatory agencies; (14) legislative or regulatory changes or actions, or significant litigation, adversely affect Fifth Third, one or more acquired entities and/or the combined company or the businesses in which Fifth Third, one or more acquired entities and/or the combined company are engaged, including the Dodd-Frank Wall Street Reform and Consumer Protection Act; (15) ability to maintain favorable ratings from rating agencies; (16) failure of models or risk management systems or controls; (17) fluctuation of Fifth Third’s stock price; (18) ability to attract and retain key personnel; (19) ability to receive dividends from its subsidiaries; (20) potentially dilutive effect of future acquisitions on current shareholders’ ownership of Fifth Third; (21) declines in the value of Fifth Third’s goodwill or other intangible assets; (22) effects of accounting or financial results of one or more acquired entities; (23) difficulties from Fifth Third’s investment in, relationship with, and nature of the operations of Vantiv Holding, LLC; (24) loss of income from any sale or potential sale of businesses; (25) difficulties in separating the operations of any branches or other assets divested; (26) losses or adverse impacts on the carrying values of branches and long-lived assets in connection with their sales or anticipated sales; (27) inability to achieve expected benefits from branch consolidations and planned sales within desired timeframes, if at all; (28) ability to secure confidential information and deliver products and services through the use of computer systems and telecommunications networks; (29) the negotiation and (if any) implementation by Vantiv, Inc. and/or Worldpay Group plc of the potential acquisition of Worldpay Group plc by Vantiv, Inc. and such other actions as Vantiv, Inc. and Worldpay Group plc may take in furtherance thereof; and (30) the impact of reputational risk created by these developments on such matters as business generation and retention, funding and liquidity. You should refer to our periodic and current reports filed with the Securities and Exchange Commission, or “SEC,” for further information on other factors, which could cause actual results to be significantly different from those expressed or implied by these forward-looking statements. In this presentation, we may sometimes provide non-GAAP financial information. Please note that although non-GAAP financial measures provide useful insight to analysts, investors and regulators, they should not be considered in isolation or relied upon as a substitute for analysis using GAAP measures. If applicable, we provide GAAP reconciliations for non-GAAP measures in a later slide in this presentation which is also available in the investor relations section of our website, www.53.com.
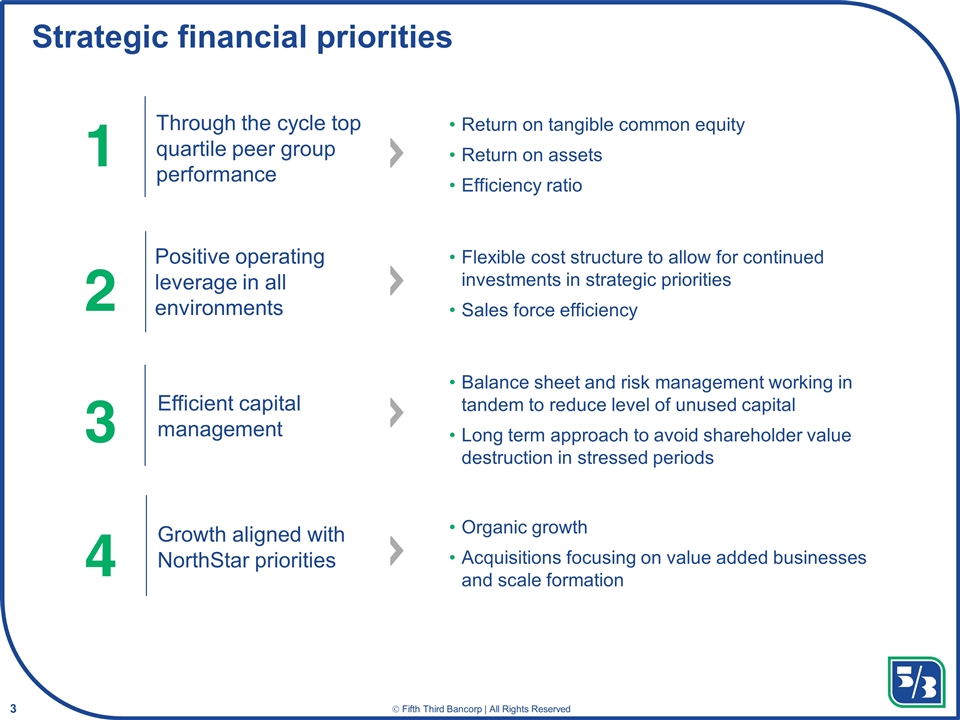
Growth aligned with NorthStar priorities Efficient capital management Positive operating leverage in all environments Through the cycle top quartile peer group performance Strategic financial priorities Return on tangible common equity Return on assets Efficiency ratio Flexible cost structure to allow for continued investments in strategic priorities Sales force efficiency Balance sheet and risk management working in tandem to reduce level of unused capital Long term approach to avoid shareholder value destruction in stressed periods Organic growth Acquisitions focusing on value added businesses and scale formation 1 3 2 4
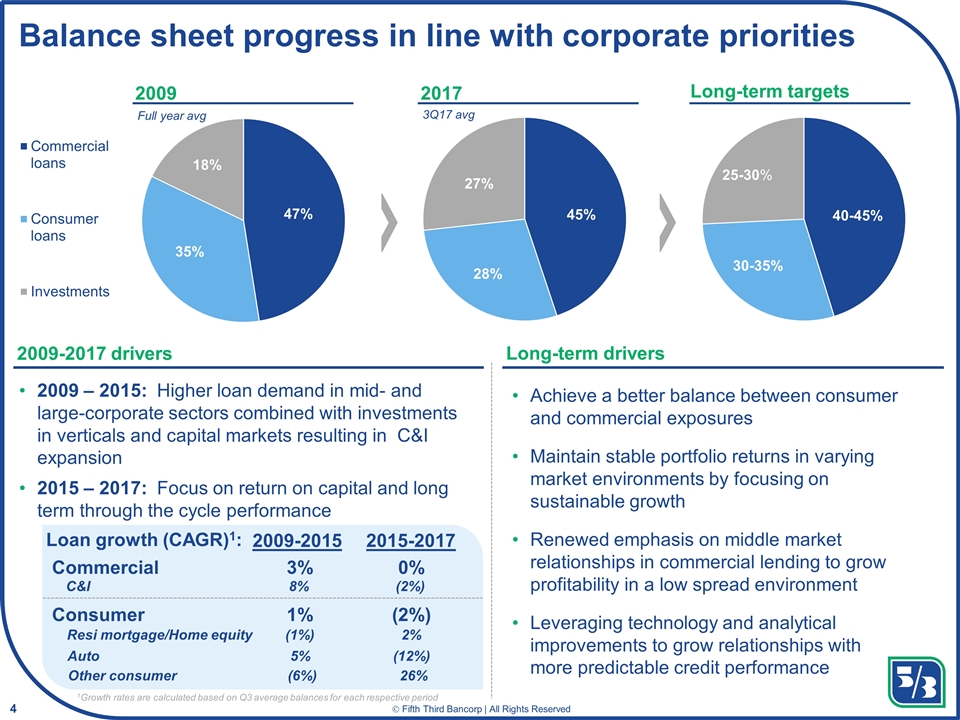
Balance sheet progress in line with corporate priorities 2017 2009 Long-term targets 2009-2017 drivers Long-term drivers 2009 – 2015: Higher loan demand in mid- and large-corporate sectors combined with investments in verticals and capital markets resulting in C&I expansion 2015 – 2017: Focus on return on capital and long term through the cycle performance Commercial 3% 0% Consumer 1% (2%) 2009-2015 2015-2017 Resi mortgage/Home equity (1%) 2% Auto 5% (12%) Other consumer (6%) 26% Achieve a better balance between consumer and commercial exposures Maintain stable portfolio returns in varying market environments by focusing on sustainable growth Renewed emphasis on middle market relationships in commercial lending to grow profitability in a low spread environment Leveraging technology and analytical improvements to grow relationships with more predictable credit performance 40-45% Loan growth (CAGR)1: C&I 8% (2%) Full year avg 3Q17 avg 1Growth rates are calculated based on Q3 average balances for each respective period
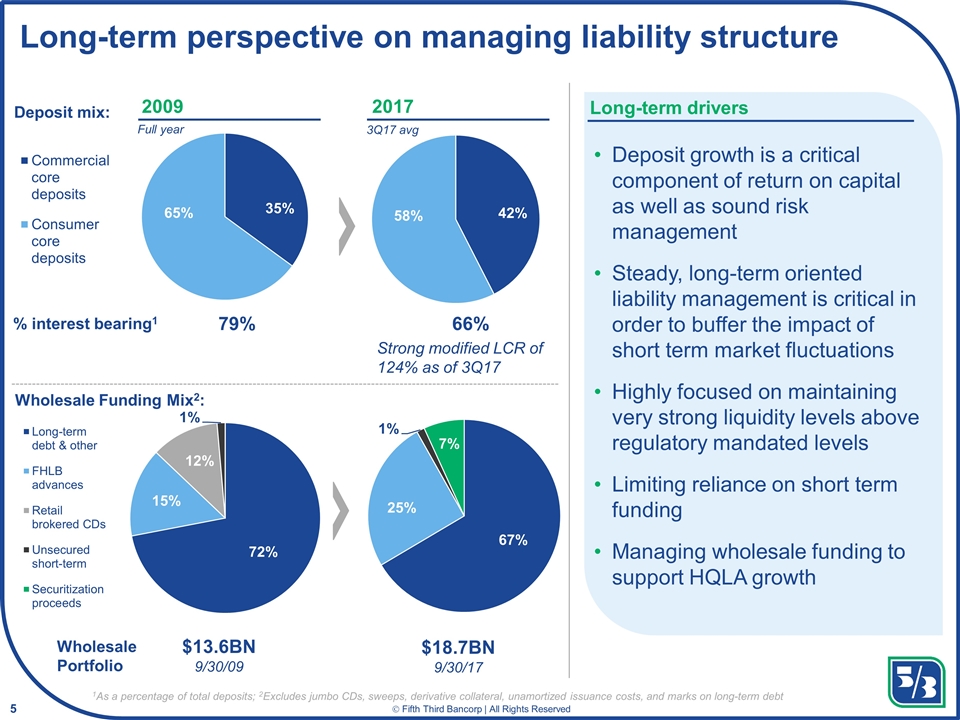
Long-term perspective on managing liability structure 2017 2009 % interest bearing1 79% 66% Deposit growth is a critical component of return on capital as well as sound risk management Steady, long-term oriented liability management is critical in order to buffer the impact of short term market fluctuations Highly focused on maintaining very strong liquidity levels above regulatory mandated levels Limiting reliance on short term funding Managing wholesale funding to support HQLA growth Deposit mix: Wholesale Portfolio $13.6BN 9/30/09 $18.7BN 9/30/17 Wholesale Funding Mix2: Long-term drivers Strong modified LCR of 124% as of 3Q17 Full year 3Q17 avg 1As a percentage of total deposits; 2Excludes jumbo CDs, sweeps, derivative collateral, unamortized issuance costs, and marks on long-term debt
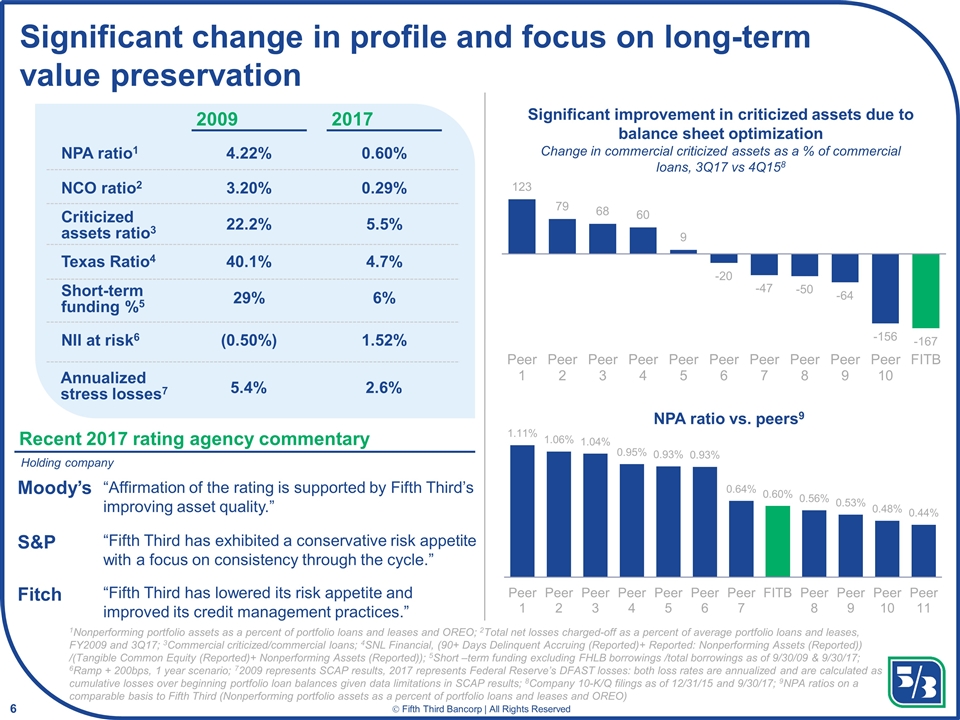
Significant change in profile and focus on long-term value preservation 2009 2017 NPA ratio1 Short-term funding %5 NII at risk6 NCO ratio2 Criticized assets ratio3 Texas Ratio4 4.22% 0.60% 3.20% 0.29% 22.2% 5.5% 40.1% 4.7% 29% 6% (0.50%) 1.52% Significant improvement in criticized assets due to balance sheet optimization Change in commercial criticized assets as a % of commercial loans, 3Q17 vs 4Q158 NPA ratio vs. peers9 Recent 2017 rating agency commentary Moody’s S&P Fitch “Affirmation of the rating is supported by Fifth Third’s improving asset quality.” Annualized stress losses7 5.4% 2.6% “Fifth Third has exhibited a conservative risk appetite with a focus on consistency through the cycle.” “Fifth Third has lowered its risk appetite and improved its credit management practices.” 1Nonperforming portfolio assets as a percent of portfolio loans and leases and OREO; 2Total net losses charged-off as a percent of average portfolio loans and leases, FY2009 and 3Q17; 3Commercial criticized/commercial loans; 4SNL Financial, (90+ Days Delinquent Accruing (Reported)+ Reported: Nonperforming Assets (Reported)) /(Tangible Common Equity (Reported)+ Nonperforming Assets (Reported)); 5Short –term funding excluding FHLB borrowings /total borrowings as of 9/30/09 & 9/30/17; 6Ramp + 200bps, 1 year scenario; 72009 represents SCAP results, 2017 represents Federal Reserve’s DFAST losses: both loss rates are annualized and are calculated as cumulative losses over beginning portfolio loan balances given data limitations in SCAP results; 8Company 10-K/Q filings as of 12/31/15 and 9/30/17; 9NPA ratios on a comparable basis to Fifth Third (Nonperforming portfolio assets as a percent of portfolio loans and leases and OREO) Holding company
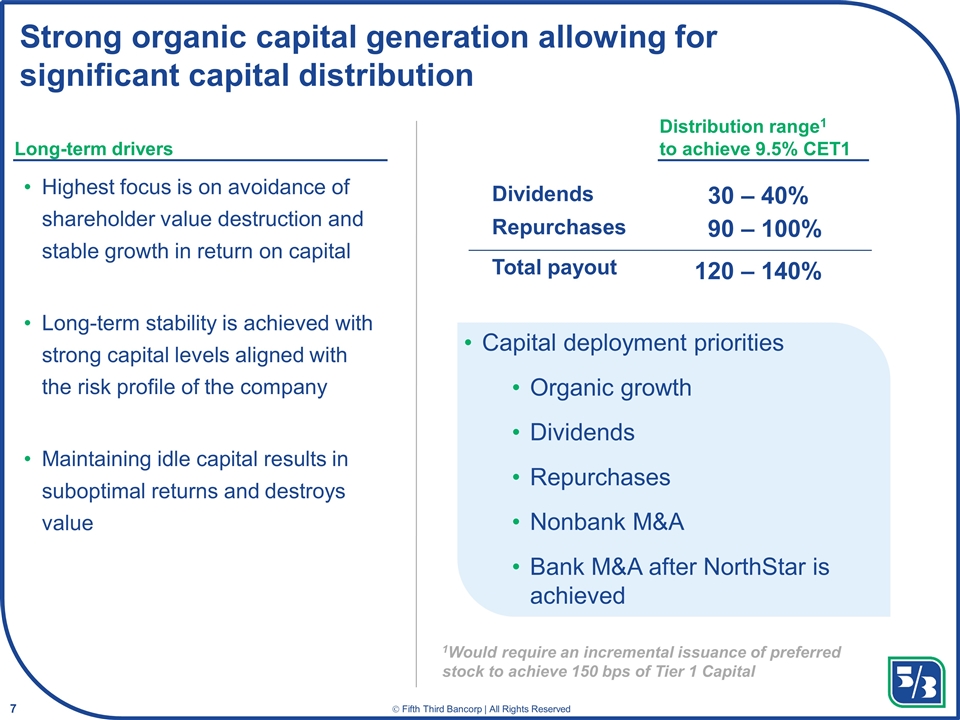
Strong organic capital generation allowing for significant capital distribution Highest focus is on avoidance of shareholder value destruction and stable growth in return on capital Long-term stability is achieved with strong capital levels aligned with the risk profile of the company Maintaining idle capital results in suboptimal returns and destroys value Dividends Repurchases Total payout Distribution range1 to achieve 9.5% CET1 30 – 40% 90 – 100% 120 – 140% Capital deployment priorities Organic growth Dividends Repurchases Nonbank M&A Bank M&A after NorthStar is achieved Long-term drivers 1Would require an incremental issuance of preferred stock to achieve 150 bps of Tier 1 Capital
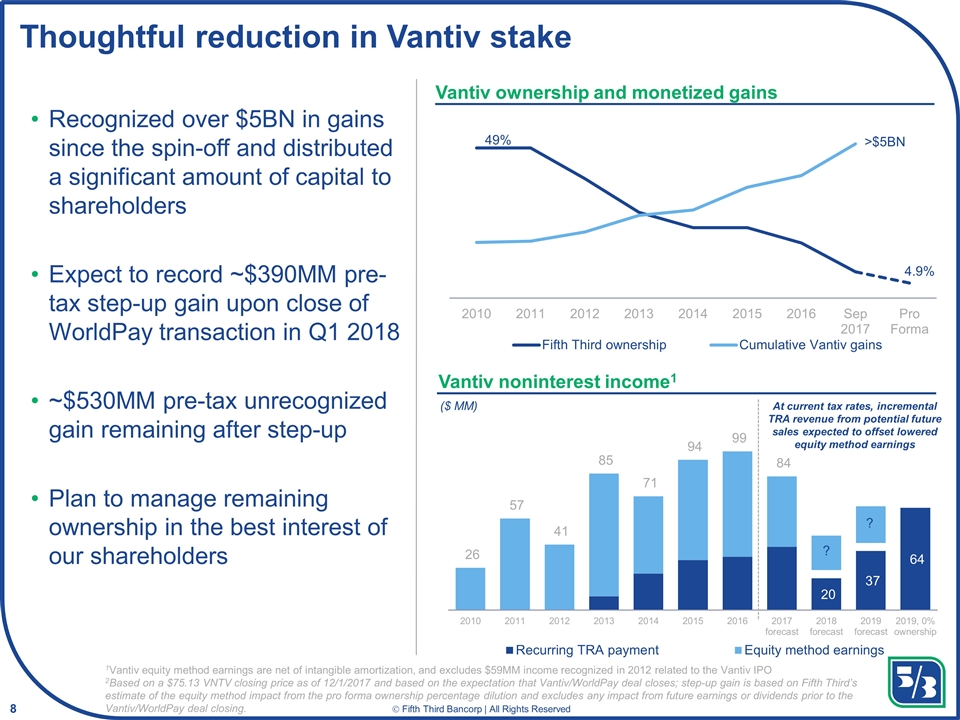
Thoughtful reduction in Vantiv stake 49% >$5BN Vantiv noninterest income1 At current tax rates, incremental TRA revenue from potential future sales expected to offset lowered equity method earnings Vantiv ownership and monetized gains 1Vantiv equity method earnings are net of intangible amortization, and excludes $59MM income recognized in 2012 related to the Vantiv IPO 2Based on a $75.13 VNTV closing price as of 12/1/2017 and based on the expectation that Vantiv/WorldPay deal closes; step-up gain is based on Fifth Third’s estimate of the equity method impact from the pro forma ownership percentage dilution and excludes any impact from future earnings or dividends prior to the Vantiv/WorldPay deal closing. Recognized over $5BN in gains since the spin-off and distributed a significant amount of capital to shareholders Expect to record ~$390MM pre-tax step-up gain upon close of WorldPay transaction in Q1 2018 ~$530MM pre-tax unrecognized gain remaining after step-up Plan to manage remaining ownership in the best interest of our shareholders ($ MM) ? ?
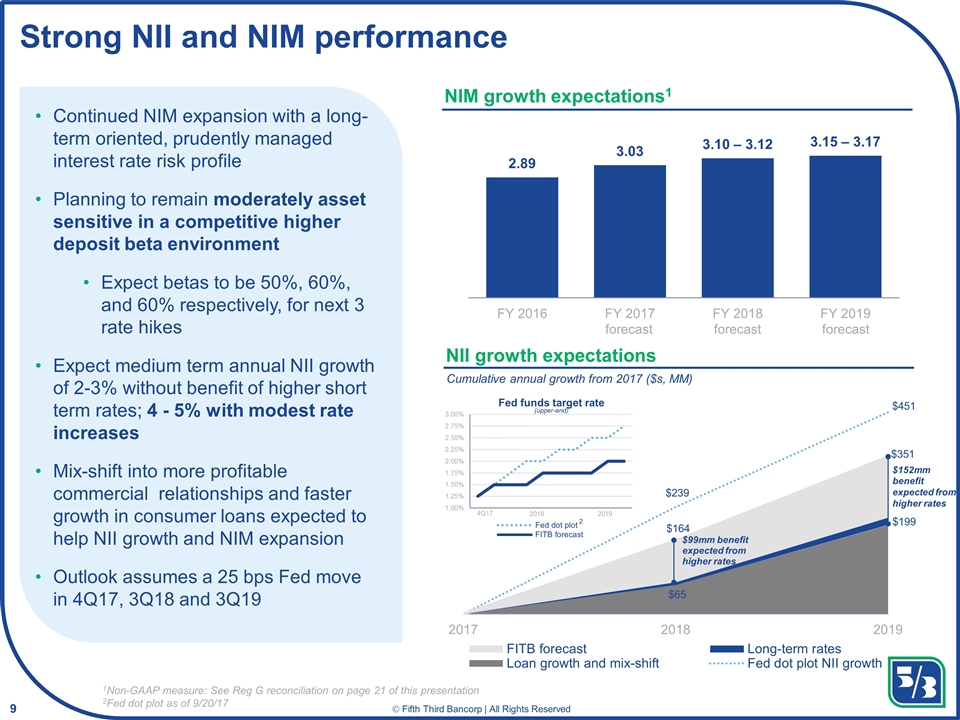
Strong NII and NIM performance Continued NIM expansion with a long-term oriented, prudently managed interest rate risk profile Planning to remain moderately asset sensitive in a competitive higher deposit beta environment Expect betas to be 50%, 60%, and 60% respectively, for next 3 rate hikes Expect medium term annual NII growth of 2-3% without benefit of higher short term rates; 4 - 5% with modest rate increases Mix-shift into more profitable commercial relationships and faster growth in consumer loans expected to help NII growth and NIM expansion Outlook assumes a 25 bps Fed move in 4Q17, 3Q18 and 3Q19 NIM growth expectations1 NII growth expectations Fed funds target rate (upper-end) 2018 2019 4Q17 Cumulative annual growth from 2017 ($s, MM) $99mm benefit expected from higher rates $152mm benefit expected from higher rates 1Non-GAAP measure: See Reg G reconciliation on page 21 of this presentation 2Fed dot plot as of 9/20/17 2 forecast forecast forecast
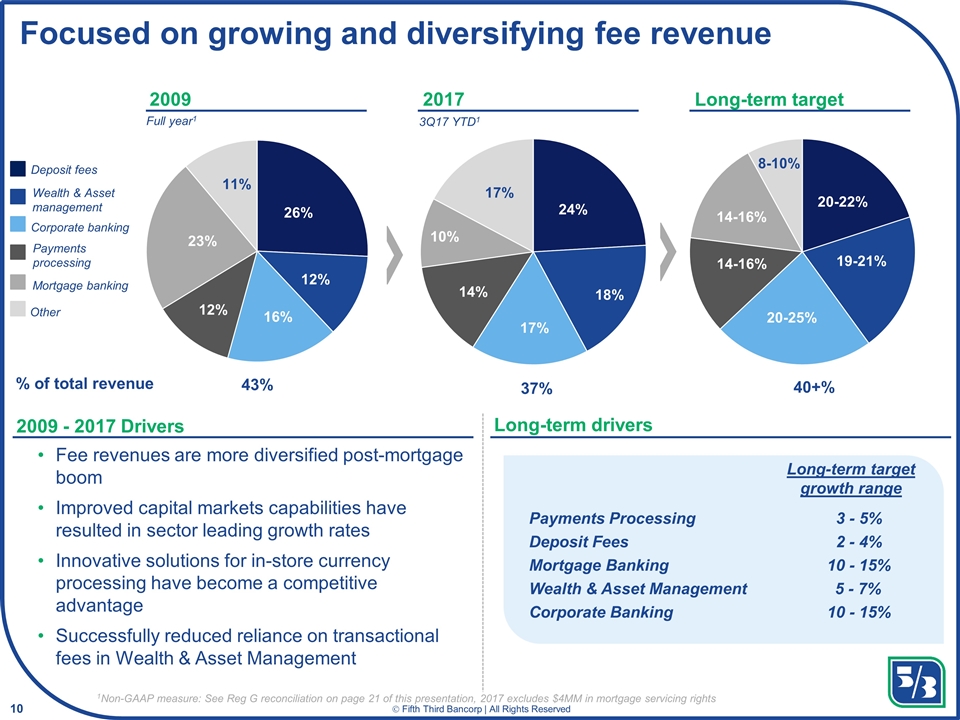
Focused on growing and diversifying fee revenue 2017 2009 Long-term target 2009 - 2017 Drivers Long-term drivers Fee revenues are more diversified post-mortgage boom Improved capital markets capabilities have resulted in sector leading growth rates Innovative solutions for in-store currency processing have become a competitive advantage Successfully reduced reliance on transactional fees in Wealth & Asset Management % of total revenue 43% 37% 40+% Full year1 3Q17 YTD1 Long-term target growth range 3 - 5% Payments Processing 2 - 4% Deposit Fees 10 - 15% Mortgage Banking 5 - 7% Wealth & Asset Management Corporate Banking 10 - 15% 14-16% 20-22% 14-16% 19-21% 20-25% 8-10% Deposit fees Wealth & Asset management Corporate banking Payments processing Mortgage banking Other 1Non-GAAP measure: See Reg G reconciliation on page 21 of this presentation, 2017 excludes $4MM in mortgage servicing rights
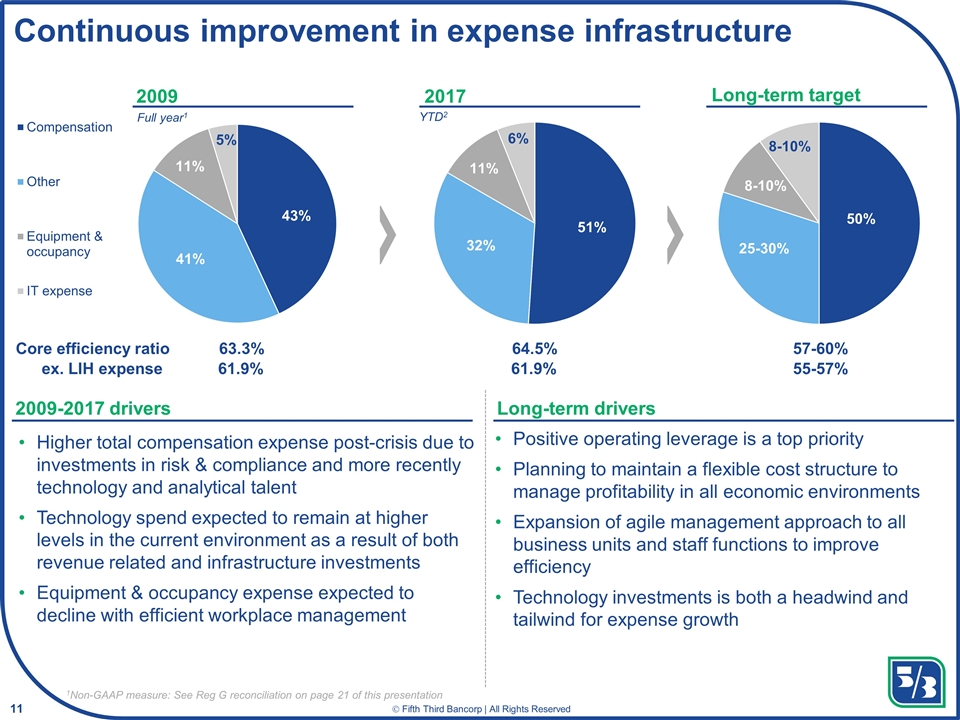
Continuous improvement in expense infrastructure 2017 2009 Long-term target 2009-2017 drivers Long-term drivers Positive operating leverage is a top priority Planning to maintain a flexible cost structure to manage profitability in all economic environments Expansion of agile management approach to all business units and staff functions to improve efficiency Technology investments is both a headwind and tailwind for expense growth Core efficiency ratio ex. LIH expense 63.3% 61.9% 64.5% 61.9% 57-60% 55-57% Higher total compensation expense post-crisis due to investments in risk & compliance and more recently technology and analytical talent Technology spend expected to remain at higher levels in the current environment as a result of both revenue related and infrastructure investments Equipment & occupancy expense expected to decline with efficient workplace management 50% 25-30% 8-10% 8-10% YTD2 Full year1 1Non-GAAP measure: See Reg G reconciliation on page 21 of this presentation
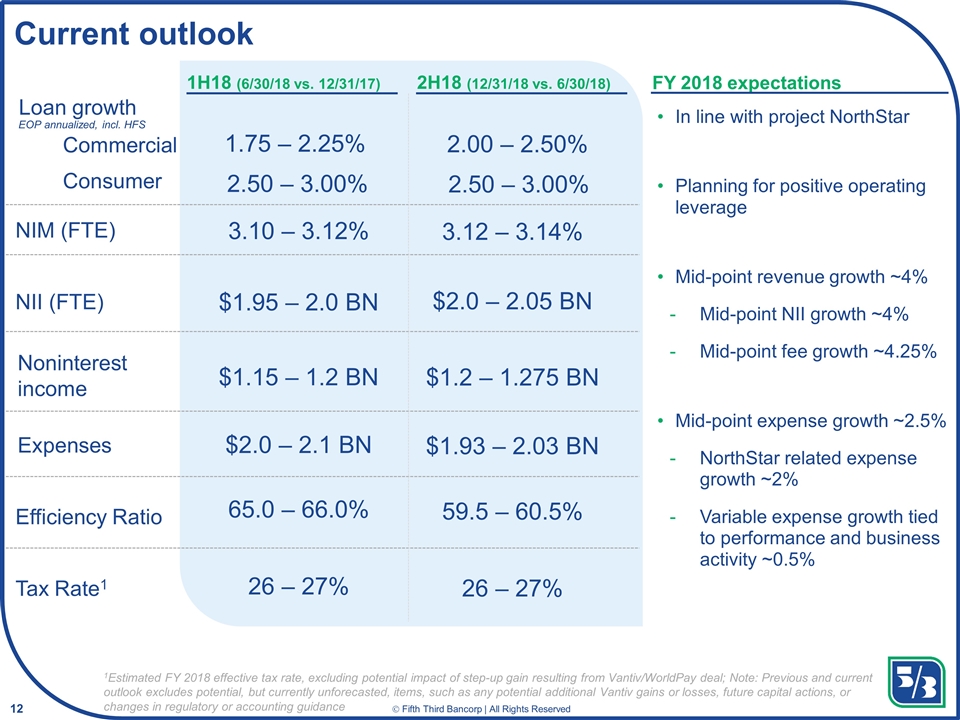
Current outlook 1H18 (6/30/18 vs. 12/31/17) Loan growth Commercial Consumer Expenses Tax Rate1 1.75 – 2.25% 2.50 – 3.00% $2.0 – 2.1 BN 26 – 27% Noninterest income $1.15 – 1.2 BN NII (FTE) $1.95 – 2.0 BN NIM (FTE) 3.10 – 3.12% Efficiency Ratio 65.0 – 66.0% 2H18 (12/31/18 vs. 6/30/18) 2.00 – 2.50% 2.50 – 3.00% $1.93 – 2.03 BN 26 – 27% $1.2 – 1.275 BN $2.0 – 2.05 BN 3.12 – 3.14% 59.5 – 60.5% 1Estimated FY 2018 effective tax rate, excluding potential impact of step-up gain resulting from Vantiv/WorldPay deal; Note: Previous and current outlook excludes potential, but currently unforecasted, items, such as any potential additional Vantiv gains or losses, future capital actions, or changes in regulatory or accounting guidance In line with project NorthStar Planning for positive operating leverage Mid-point revenue growth ~4% Mid-point NII growth ~4% Mid-point fee growth ~4.25% Mid-point expense growth ~2.5% NorthStar related expense growth ~2% Variable expense growth tied to performance and business activity ~0.5% FY 2018 expectations EOP annualized, incl. HFS
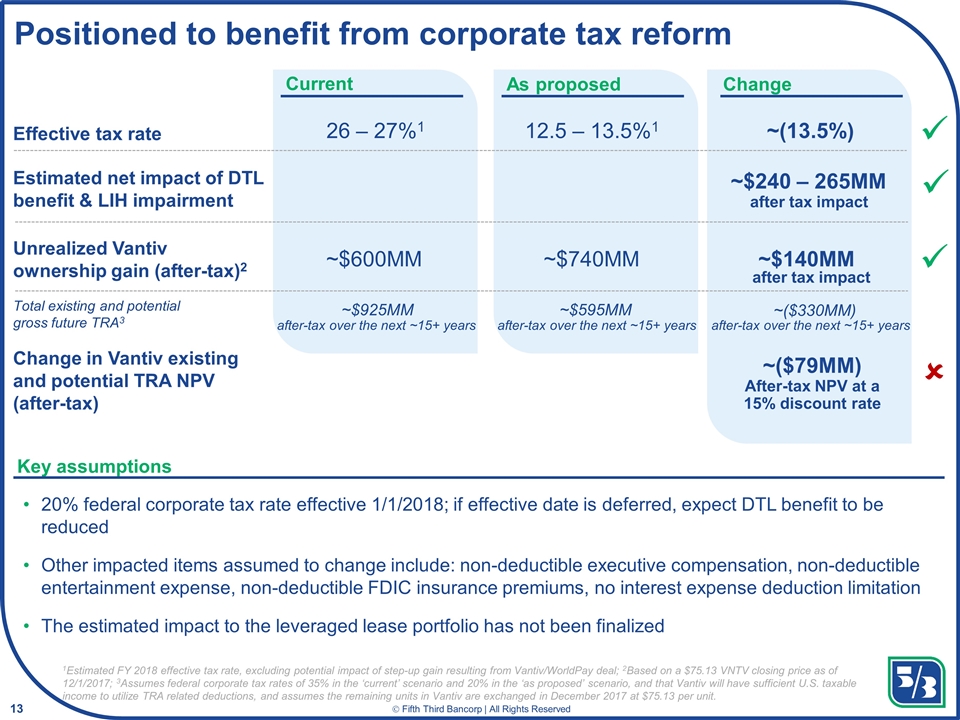
Unrealized Vantiv ownership gain (after-tax)2 Positioned to benefit from corporate tax reform 1Estimated FY 2018 effective tax rate, excluding potential impact of step-up gain resulting from Vantiv/WorldPay deal; 2Based on a $75.13 VNTV closing price as of 12/1/2017; 3Assumes federal corporate tax rates of 35% in the ‘current’ scenario and 20% in the ‘as proposed’ scenario, and that Vantiv will have sufficient U.S. taxable income to utilize TRA related deductions, and assumes the remaining units in Vantiv are exchanged in December 2017 at $75.13 per unit. Current As proposed Effective tax rate 26 – 27%1 12.5 – 13.5%1 Change ~(13.5%) Estimated net impact of DTL benefit & LIH impairment ~$240 – 265MM Key assumptions 20% federal corporate tax rate effective 1/1/2018; if effective date is deferred, expect DTL benefit to be reduced Other impacted items assumed to change include: non-deductible executive compensation, non-deductible entertainment expense, non-deductible FDIC insurance premiums, no interest expense deduction limitation The estimated impact to the leveraged lease portfolio has not been finalized ~$600MM ~$740MM ~$140MM ~$925MM ~$595MM ü ü û ü ~($330MM) after-tax over the next ~15+ years ~($79MM) After-tax NPV at a 15% discount rate after tax impact after-tax over the next ~15+ years after-tax over the next ~15+ years Change in Vantiv existing and potential TRA NPV (after-tax) Total existing and potential gross future TRA3 after tax impact
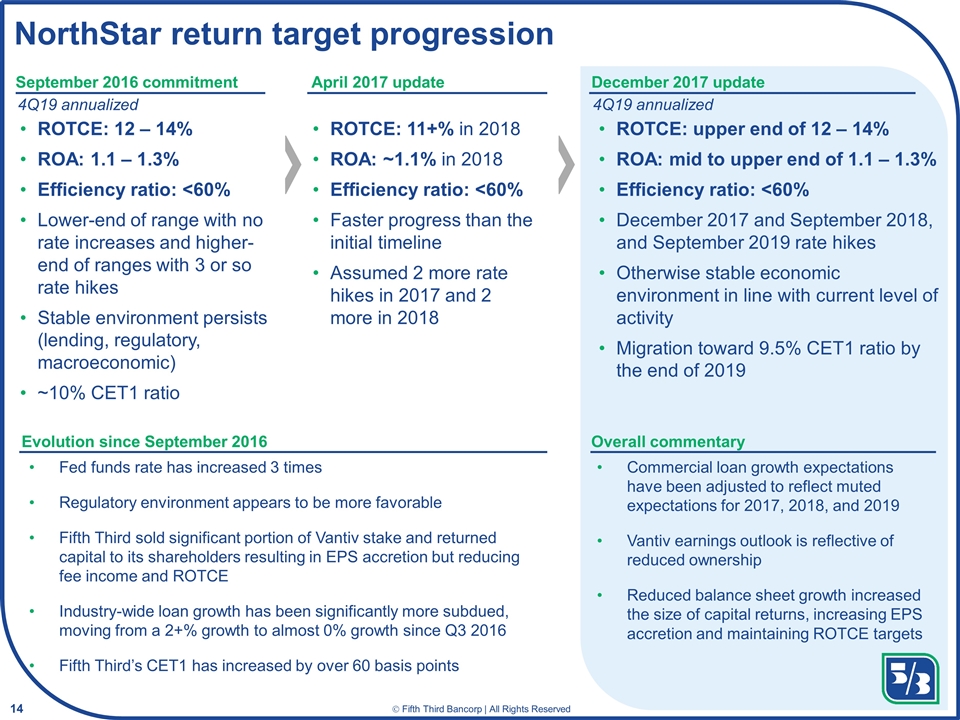
NorthStar return target progression September 2016 commitment April 2017 update December 2017 update ROTCE: 12 – 14% ROA: 1.1 – 1.3% Efficiency ratio: <60% Lower-end of range with no rate increases and higher-end of ranges with 3 or so rate hikes Stable environment persists (lending, regulatory, macroeconomic) ~10% CET1 ratio 4Q19 annualized ROTCE: 11+% in 2018 ROA: ~1.1% in 2018 Efficiency ratio: <60% Faster progress than the initial timeline Assumed 2 more rate hikes in 2017 and 2 more in 2018 ROTCE: upper end of 12 – 14% ROA: mid to upper end of 1.1 – 1.3% Efficiency ratio: <60% December 2017 and September 2018, and September 2019 rate hikes Otherwise stable economic environment in line with current level of activity Migration toward 9.5% CET1 ratio by the end of 2019 4Q19 annualized Evolution since September 2016 Fed funds rate has increased 3 times Regulatory environment appears to be more favorable Fifth Third sold significant portion of Vantiv stake and returned capital to its shareholders resulting in EPS accretion but reducing fee income and ROTCE Industry-wide loan growth has been significantly more subdued, moving from a 2+% growth to almost 0% growth since Q3 2016 Fifth Third’s CET1 has increased by over 60 basis points Commercial loan growth expectations have been adjusted to reflect muted expectations for 2017, 2018, and 2019 Vantiv earnings outlook is reflective of reduced ownership Reduced balance sheet growth increased the size of capital returns, increasing EPS accretion and maintaining ROTCE targets Overall commentary
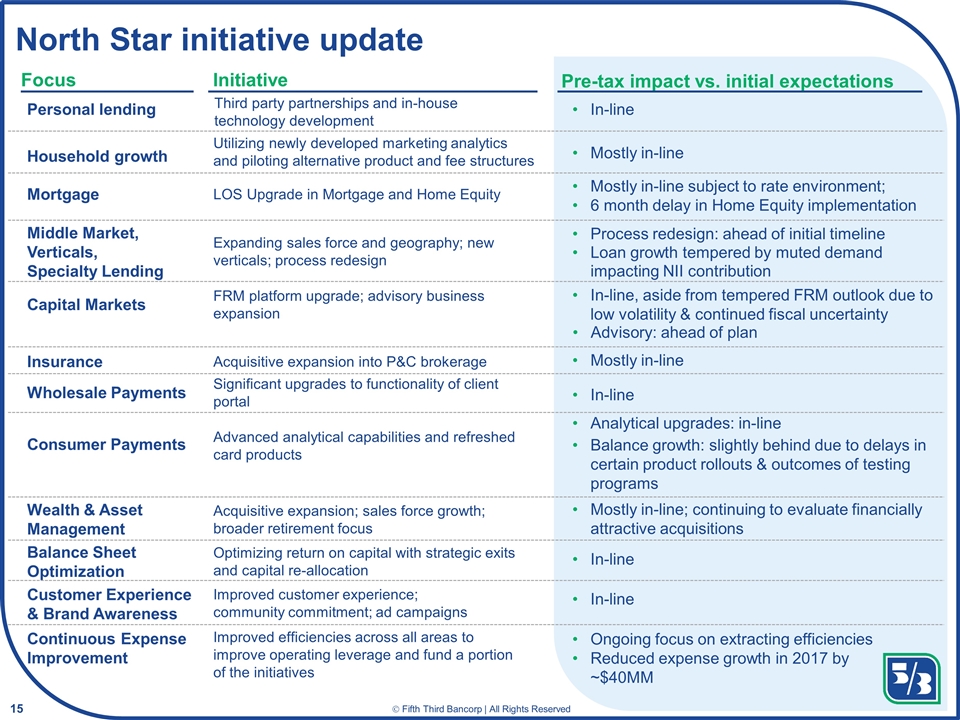
North Star initiative update Wealth & Asset Management Balance Sheet Optimization Customer Experience & Brand Awareness Continuous Expense Improvement Household growth Mortgage Utilizing newly developed marketing analytics and piloting alternative product and fee structures Focus Initiative Pre-tax impact vs. initial expectations Mostly in-line Personal lending Third party partnerships and in-house technology development In-line LOS Upgrade in Mortgage and Home Equity Mostly in-line subject to rate environment; 6 month delay in Home Equity implementation Middle Market, Verticals, Specialty Lending Capital Markets Insurance Expanding sales force and geography; new verticals; process redesign FRM platform upgrade; advisory business expansion Acquisitive expansion into P&C brokerage In-line, aside from tempered FRM outlook due to low volatility & continued fiscal uncertainty Mostly in-line Wholesale Payments Consumer Payments Significant upgrades to functionality of client portal In-line Advanced analytical capabilities and refreshed card products Acquisitive expansion; sales force growth; broader retirement focus Mostly in-line; continuing to evaluate financially attractive acquisitions Optimizing return on capital with strategic exits and capital re-allocation In-line Improved customer experience; community commitment; ad campaigns In-line Improved efficiencies across all areas to improve operating leverage and fund a portion of the initiatives Balance growth: slightly behind due to delays in certain product rollouts & outcomes of testing programs Ongoing focus on extracting efficiencies Reduced expense growth in 2017 by ~$40MM Process redesign: ahead of initial timeline Loan growth tempered by muted demand impacting NII contribution Analytical upgrades: in-line Advisory: ahead of plan
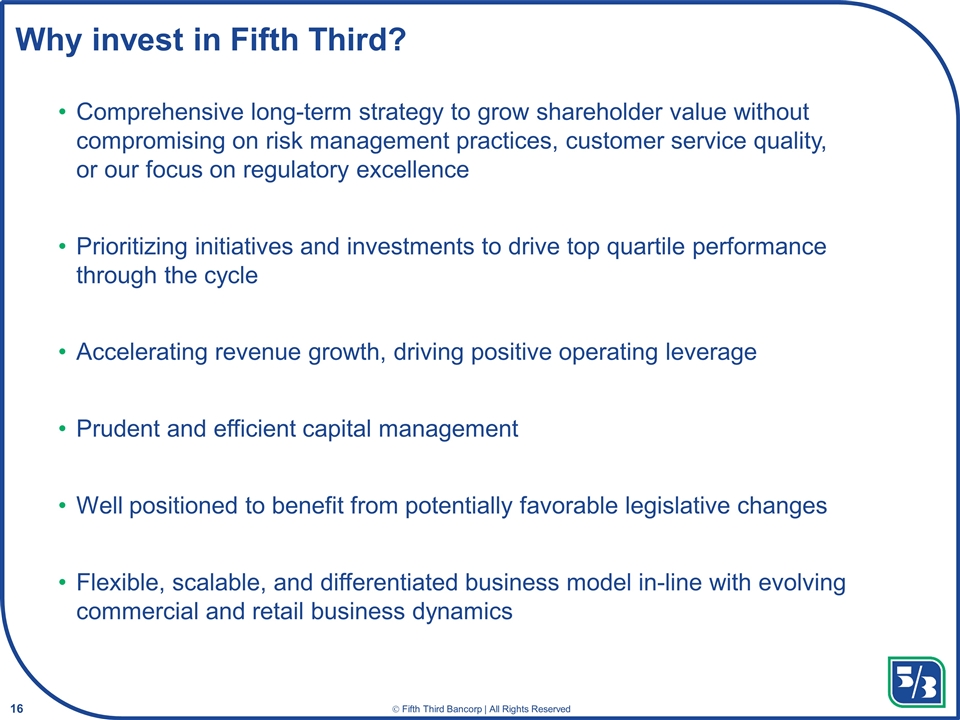
Why invest in Fifth Third? Comprehensive long-term strategy to grow shareholder value without compromising on risk management practices, customer service quality, or our focus on regulatory excellence Prioritizing initiatives and investments to drive top quartile performance through the cycle Accelerating revenue growth, driving positive operating leverage Prudent and efficient capital management Well positioned to benefit from potentially favorable legislative changes Flexible, scalable, and differentiated business model in-line with evolving commercial and retail business dynamics
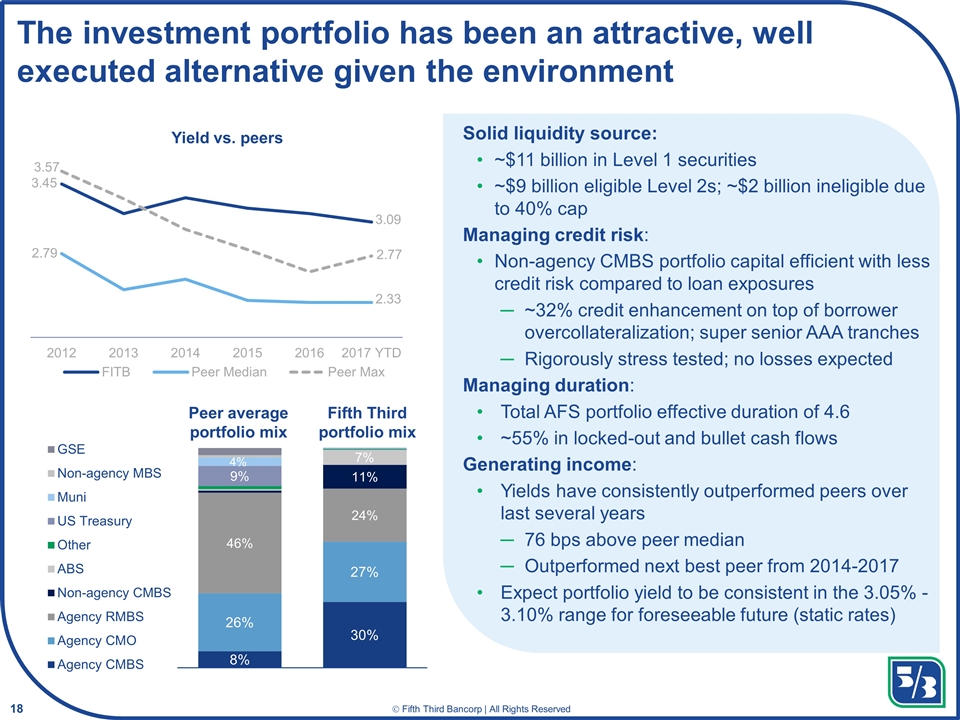
The investment portfolio has been an attractive, well executed alternative given the environment Fifth Third portfolio mix Solid liquidity source: ~$11 billion in Level 1 securities ~$9 billion eligible Level 2s; ~$2 billion ineligible due to 40% cap Managing credit risk: Non-agency CMBS portfolio capital efficient with less credit risk compared to loan exposures ~32% credit enhancement on top of borrower overcollateralization; super senior AAA tranches Rigorously stress tested; no losses expected Managing duration: Total AFS portfolio effective duration of 4.6 ~55% in locked-out and bullet cash flows Generating income: Yields have consistently outperformed peers over last several years 76 bps above peer median Outperformed next best peer from 2014-2017 Expect portfolio yield to be consistent in the 3.05% - 3.10% range for foreseeable future (static rates) Peer average portfolio mix 3.57 3.45 2.79 3.09 2.77 2.33
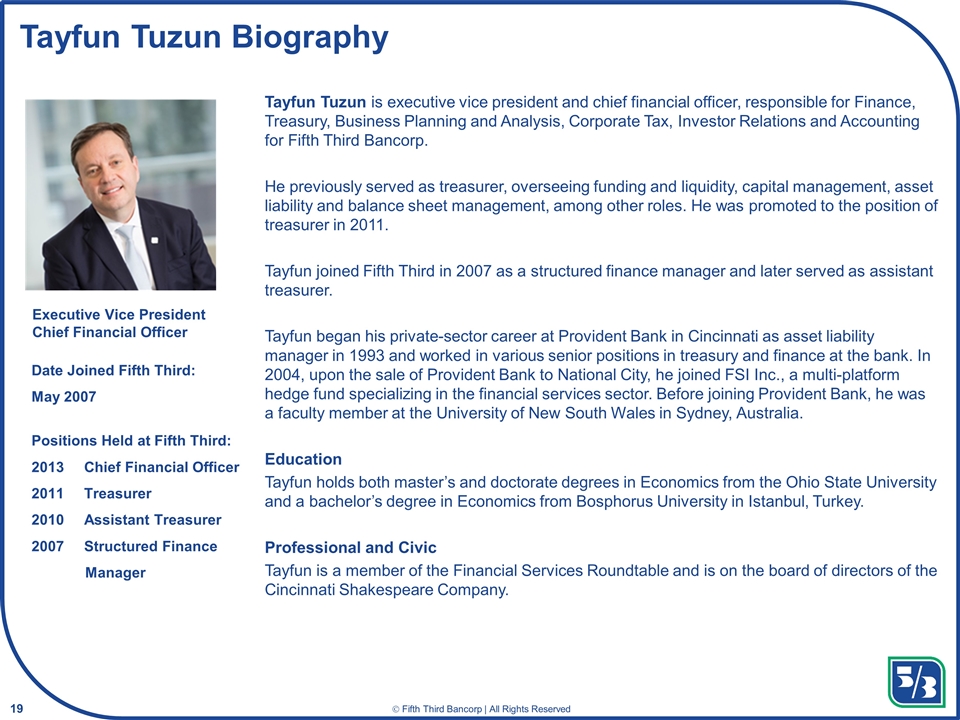
Tayfun Tuzun Biography Tayfun Tuzun is executive vice president and chief financial officer, responsible for Finance, Treasury, Business Planning and Analysis, Corporate Tax, Investor Relations and Accounting for Fifth Third Bancorp. He previously served as treasurer, overseeing funding and liquidity, capital management, asset liability and balance sheet management, among other roles. He was promoted to the position of treasurer in 2011. Tayfun joined Fifth Third in 2007 as a structured finance manager and later served as assistant treasurer. Tayfun began his private-sector career at Provident Bank in Cincinnati as asset liability manager in 1993 and worked in various senior positions in treasury and finance at the bank. In 2004, upon the sale of Provident Bank to National City, he joined FSI Inc., a multi-platform hedge fund specializing in the financial services sector. Before joining Provident Bank, he was a faculty member at the University of New South Wales in Sydney, Australia. Education Tayfun holds both master’s and doctorate degrees in Economics from the Ohio State University and a bachelor’s degree in Economics from Bosphorus University in Istanbul, Turkey. Professional and Civic Tayfun is a member of the Financial Services Roundtable and is on the board of directors of the Cincinnati Shakespeare Company. Date Joined Fifth Third: May 2007 Positions Held at Fifth Third: 2013 Chief Financial Officer 2011 Treasurer 2010 Assistant Treasurer 2007 Structured Finance Manager Executive Vice President Chief Financial Officer
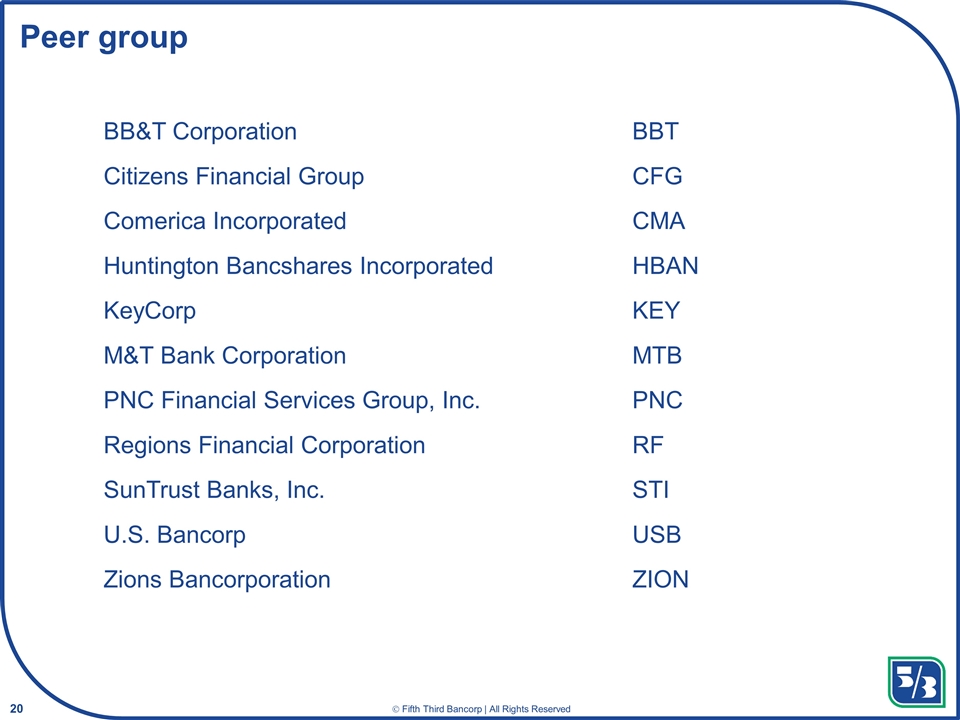
Peer group BB&T CorporationBBT Citizens Financial GroupCFG Comerica IncorporatedCMA Huntington Bancshares IncorporatedHBAN KeyCorpKEY M&T Bank CorporationMTB PNC Financial Services Group, Inc.PNC Regions Financial CorporationRF SunTrust Banks, Inc.STI U.S. BancorpUSB Zions BancorporationZION
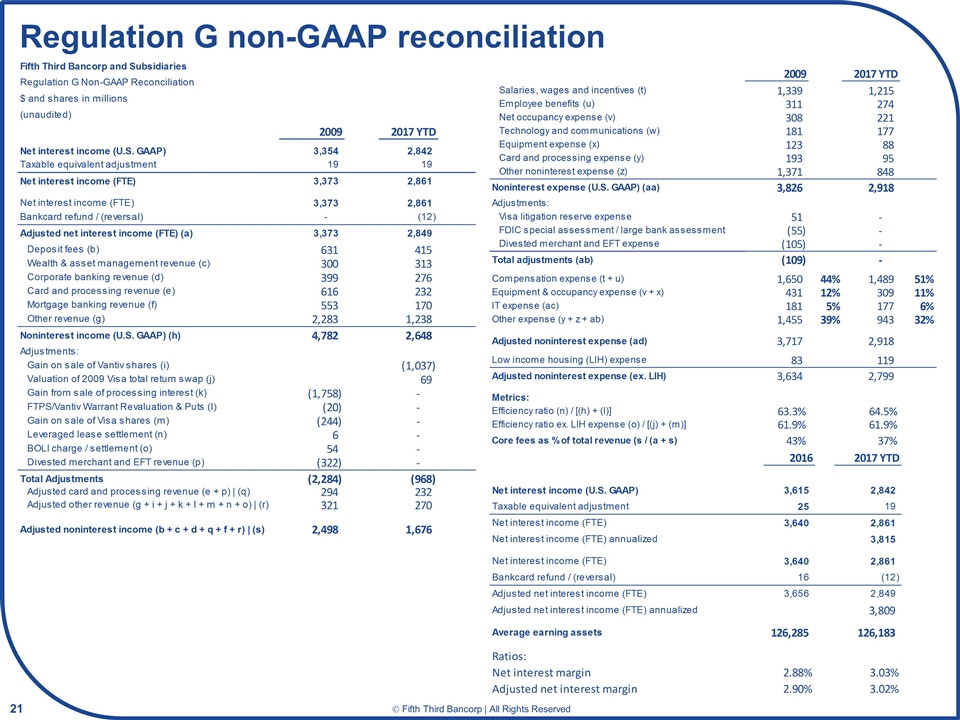
Regulation G non-GAAP reconciliation