EX-99.1
Exhibit 99.1
|
|
|
|
|

|
|
|
|
|
|
|
|
News Release |
|
|
|
| CONTACTS: |
|
Jim Eglseder (Investors) |
|
FOR IMMEDIATE RELEASE |
| |
|
(513) 534-8424 |
|
January 21, 2015 |
| |
|
Laura Wehby (Investors) |
|
|
| |
|
(513) 534-7407 |
|
|
| |
|
Larry Magnesen (Media) |
|
|
| |
|
(513) 534-8055 |
|
|
FIFTH THIRD ANNOUNCES FOURTH QUARTER EARNINGS PER DILUTED SHARE OF $0.43
2014 EARNINGS PER DILUTED SHARE OF $1.66
| |
• |
|
4Q14 net income available to common shareholders of $362 million, or $0.43 per diluted common share |
| |
• |
|
Includes a $56 million pre-tax (~$37 million after-tax, or $0.04 per share) positive valuation adjustment on the warrant Fifth Third holds in Vantiv, $23 million pre-tax (~$15 million after-tax, or $0.02 per share) of
provision expense related to the transfer of residential mortgage loans classified as troubled debt restructurings to held-for-sale, and a $19 million pre-tax (~$13 million after-tax, or $0.02 per share) charge related to the valuation of Visa total
return swap |
| |
• |
|
4Q14 return on average assets (ROA) of 1.13%; return on average common equity of 10.0%; return on average tangible common equity** of 12.1% |
| |
• |
|
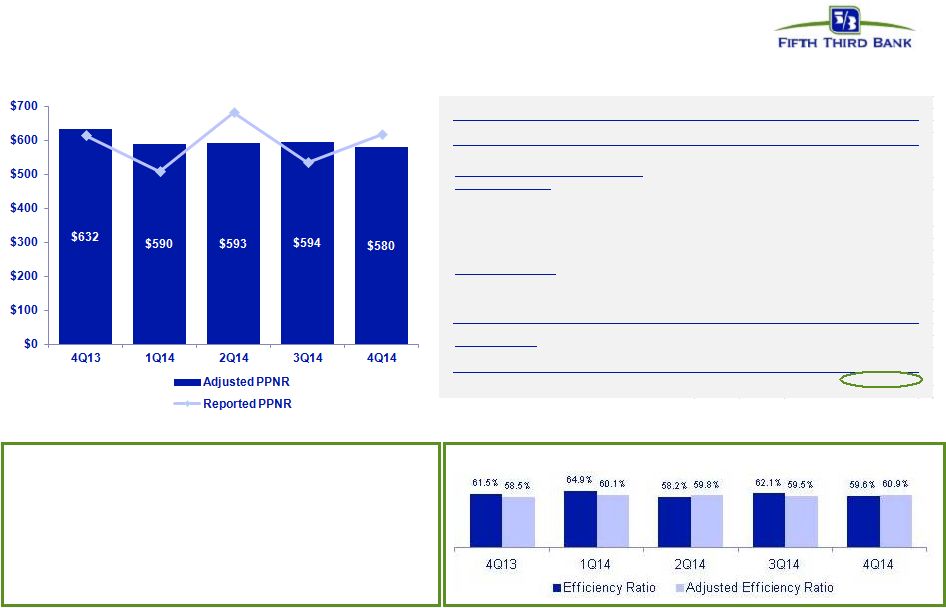
Pre-provision net revenue (PPNR)** of $618 million in 4Q14 |
| |
• |
|
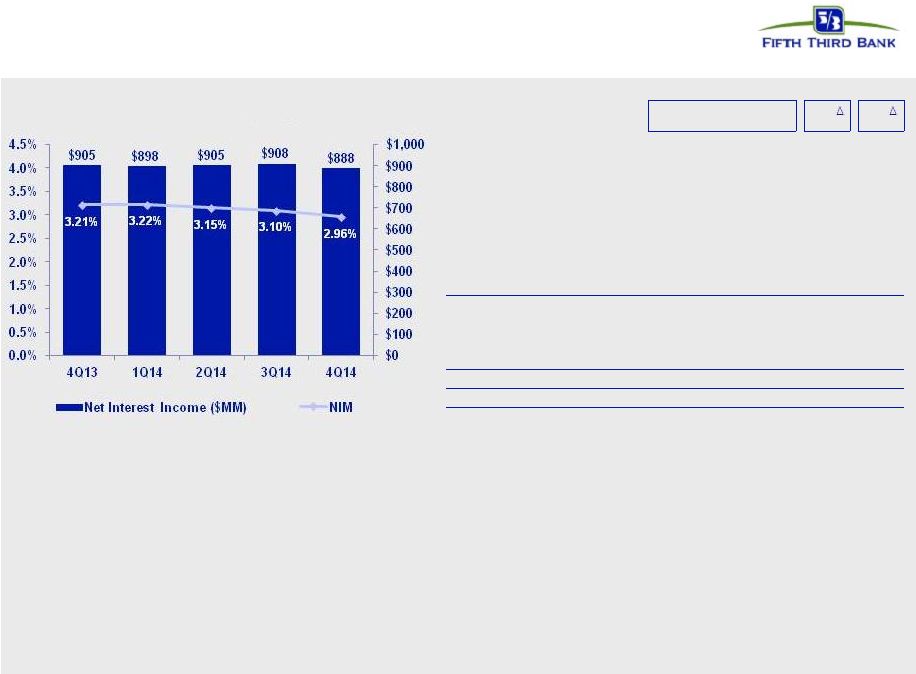
Net interest income (FTE) of $888 million, down 2% sequentially and down 2% from 4Q13; net interest margin of 2.96%, down 14 basis points sequentially |
| |
• |
|
Average portfolio loans of $91.0 billion, up $242 million sequentially and $3.1 billion from 4Q13 |
| |
• |
|
Noninterest income of $653 million compared with $520 million in the prior quarter; impacted by valuations on the Vantiv warrant and the valuation of the Visa total return swap during both quarters and the annual
payment received from Vantiv pursuant to the tax receivable agreement in the fourth quarter |
| |
• |
|
Noninterest expense of $918 million compared with $888 million in the prior quarter primarily driven by higher compensation-related expenses and credit-related costs |
| |
• |
|
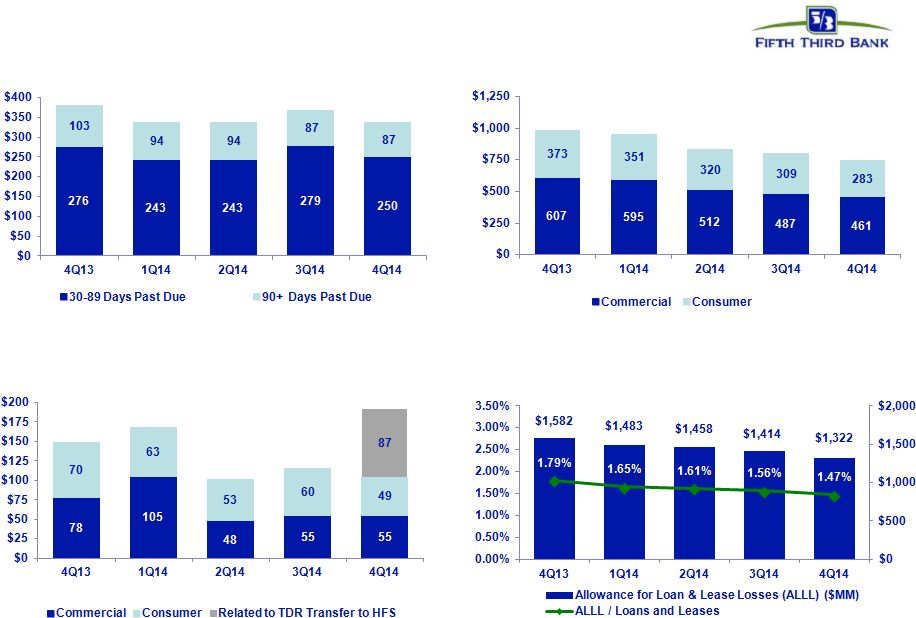
4Q14 net charge-offs of $191 million (0.83% of loans and leases) included $87 million of charge-offs related to the transfer of residential mortgage loans classified as troubled debt restructurings to held-for-sale;
3Q14 NCOs of $115 million (0.50% of loans and leases) and 4Q13 NCOs of $148 million (0.67% of loans and leases) |
| |
• |
|
4Q14 provision expense of $99 million included $23 million impact related to the aforementioned transfer of loans to held-for-sale; $71 million in 3Q14 and $53 million in 4Q13 |
| |
• |
|
Allowance for loan and lease losses decreased $92 million sequentially ($64 million reduction related to aforementioned transfer of loans to held-for-sale); allowance to loan ratio of 1.47% |
| |
• |
|
Total nonperforming assets (NPAs) of $783 million, including loans held-for-sale (HFS), declined $20 million sequentially; portfolio NPA ratio of 0.82% down 6 bps from 3Q14, NPL ratio of 0.64% down 4 bps from 3Q14; 2
bps improvement due to aforementioned transfer of loans to held-for-sale |
| |
• |
|
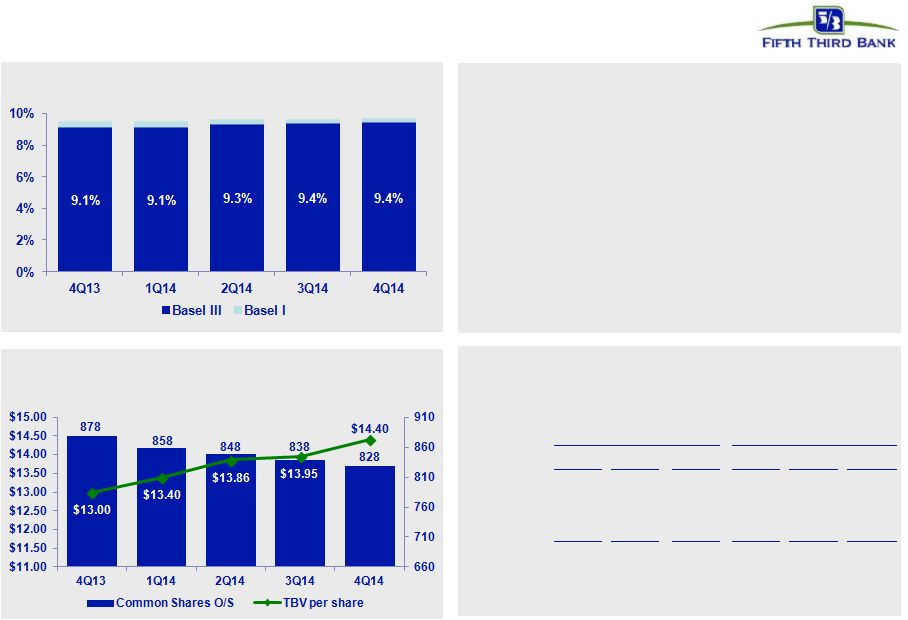
Tier 1 common ratio** 9.65%, vs. 9.64% in 3Q14 (Basel III pro forma estimate of ~9.4%) |
| |
• |
|
Tier 1 risk-based capital ratio 10.83%, Total risk-based capital ratio 14.33%, Leverage ratio 9.66% |
| |
• |
|
Tangible common equity ratio** of 8.71%; 8.43% excluding securities portfolio unrealized gains/losses |
| |
• |
|
Book value per share of $17.35; tangible book value per share** of $14.40; up 3% from 3Q14 and up 11% from 4Q13 |
| |
• |
|
Repurchased 10 million common shares in 4Q14; incremental impact from 3Q14 and 4Q14 transactions reduced average diluted share count by 11 million in 4Q14 |
| * |
Capital ratios estimated; presented under current U.S. capital regulations. The pro forma Basel III Tier I common equity ratio is management’s estimate based upon its current interpretation of the
Basel III Final Rule approved in July 2013. See “Capital Position” section for more information. |
| ** |
Non-GAAP measure; see Reg. G reconciliation on page 33. |
Fifth Third Bancorp (Nasdaq: FITB) today reported full year 2014 net income of $1.5 billion, down 19 percent from
net income of $1.8 billion in 2013. After preferred dividends, 2014 net income available to common shareholders was $1.4 billion, or $1.66 per diluted share, down 21 percent compared with 2013 net income available to common shareholders of $1.8
billion, or $2.02 per diluted share.
Fourth quarter 2014 net income was $385 million, an increase of 13 percent from net income of $340 million in the
third quarter of 2014 and a decrease of 4 percent from net income of $402 million in the fourth quarter of 2013. After preferred dividends, net income available to common shareholders was $362 million, or $0.43 per diluted share, in the fourth
quarter 2014, compared with $328 million, or $0.39 per diluted share, in the third quarter 2014, and $383 million, or $0.43 per diluted share, in the fourth quarter of 2013.
Fourth quarter 2014 included:
Income
| |
• |
|
$56 million positive valuation adjustment on the Vantiv warrant |
| |
• |
|
$23 million annual payment received from Vantiv pursuant to tax receivable agreement |
| |
• |
|
($19 million) charge related to the valuation of the total return swap entered into as part of the 2009 sale of Visa, Inc. Class B shares |
Expenses
| |
• |
|
($6 million) in severance expense |
| |
• |
|
$3 million reversal of litigation reserves |
Results also included $23 million of provision expense related to
the transfer of residential mortgage loans classified as troubled debt restructurings to held-for-sale. Additionally, results included an immaterial amount in mortgage repurchase provision.
Third quarter 2014 included:
Income
| |
• |
|
($53 million) negative valuation adjustment on the Vantiv warrant |
| |
• |
|
($3 million) charge related to the valuation of the total return swap entered into as part of the 2009 sale of Visa, Inc. Class B shares |
Expenses
| |
• |
|
($4 million) in litigation reserve charges |
| |
• |
|
($2 million) in severance expense |
Results also included the impact of $3 million in mortgage repurchase
provision.
Fourth quarter 2013 included:
Income
| |
• |
|
$91 million positive valuation adjustment on the Vantiv warrant |
| |
• |
|
($18 million) charge related to the valuation of the total return swap entered into as part of the 2009 sale of Visa, Inc. Class B shares |
| |
• |
|
$9 million annual payment received from Vantiv pursuant to tax receivable agreement |
Expenses
| |
• |
|
($69 million) in net charges to increase litigation reserves |
| |
• |
|
($8 million) of debt extinguishment costs associated with the redemption of Fifth Third Capital Trust IV trust preferred securities (TruPS) |
| |
• |
|
($8 million) contribution to Fifth Third Foundation |
| |
• |
|
($8 million) in severance expense |
Results also included a benefit to the mortgage repurchase provision of $28
million primarily related to Fifth Third’s settlement with Freddie Mac and corresponding expectations for future repurchase requests and file claims.
2
Earnings Highlights
|
|
|
|
|
|
|
|
|
|
|
|
|
|
|
|
|
|
|
|
|
|
|
|
|
|
|
|
|
| |
|
For the Three Months Ended |
|
|
% Change |
|
| |
|
December
2014 |
|
|
September
2014 |
|
|
June
2014 |
|
|
March
2014 |
|
|
December
2013 |
|
|
Seq |
|
|
Yr/Yr |
|
| Earnings ($ in millions) |
|
|
|
|
|
|
|
|
|
|
|
|
|
|
|
|
|
|
|
|
|
|
|
|
|
|
|
|
| Net income attributable to Bancorp |
|
$ |
385 |
|
|
$ |
340 |
|
|
$ |
439 |
|
|
$ |
318 |
|
|
$ |
402 |
|
|
|
13 |
% |
|
|
(4 |
%) |
| Net income available to common shareholders |
|
$ |
362 |
|
|
$ |
328 |
|
|
$ |
416 |
|
|
$ |
309 |
|
|
$ |
383 |
|
|
|
10 |
% |
|
|
(6 |
%) |
| Common Share Data |
|
|
|
|
|
|
|
|
|
|
|
|
|
|
|
|
|
|
|
|
|
|
|
|
|
|
|
|
| Earnings per share, basic |
|
|
0.44 |
|
|
|
0.39 |
|
|
|
0.49 |
|
|
|
0.36 |
|
|
|
0.44 |
|
|
|
13 |
% |
|
|
— |
|
| Earnings per share, diluted |
|
|
0.43 |
|
|
|
0.39 |
|
|
|
0.49 |
|
|
|
0.36 |
|
|
|
0.43 |
|
|
|
10 |
% |
|
|
— |
|
| Cash dividends per common share |
|
|
0.13 |
|
|
|
0.13 |
|
|
|
0.13 |
|
|
|
0.12 |
|
|
|
0.12 |
|
|
|
— |
|
|
|
8 |
% |
| Financial Ratios |
|
|
|
|
|
|
|
|
|
|
|
|
|
|
|
|
|
|
|
|
|
|
|
|
|
|
|
|
| Return on average assets |
|
|
1.13 |
% |
|
|
1.02 |
% |
|
|
1.34 |
% |
|
|
1.00 |
% |
|
|
1.24 |
% |
|
|
10 |
% |
|
|
(10 |
%) |
| Return on average common equity |
|
|
10.0 |
|
|
|
9.2 |
|
|
|
11.9 |
|
|
|
9.0 |
|
|
|
10.8 |
|
|
|
9 |
% |
|
|
(7 |
%) |
| Return on average tangible common equity(b) |
|
|
12.1 |
|
|
|
11.1 |
|
|
|
14.4 |
|
|
|
11.0 |
|
|
|
13.1 |
|
|
|
9 |
% |
|
|
(8 |
%) |
| Tier I risk-based capital |
|
|
10.83 |
|
|
|
10.83 |
|
|
|
10.80 |
|
|
|
10.45 |
|
|
|
10.43 |
|
|
|
— |
|
|
|
4 |
% |
| Tier I common equity(b) |
|
|
9.65 |
|
|
|
9.64 |
|
|
|
9.61 |
|
|
|
9.51 |
|
|
|
9.45 |
|
|
|
— |
|
|
|
2 |
% |
| Net interest margin(a) |
|
|
2.96 |
|
|
|
3.10 |
|
|
|
3.15 |
|
|
|
3.22 |
|
|
|
3.21 |
|
|
|
(5 |
%) |
|
|
(8 |
%) |
| Efficiency(a) |
|
|
59.6 |
|
|
|
62.1 |
|
|
|
58.2 |
|
|
|
64.9 |
|
|
|
61.5 |
|
|
|
(4 |
%) |
|
|
(3 |
%) |
| Common shares outstanding (in thousands) |
|
|
824,047 |
|
|
|
834,262 |
|
|
|
844,489 |
|
|
|
847,569 |
|
|
|
855,306 |
|
|
|
(1 |
%) |
|
|
(4 |
%) |
| Average common shares outstanding (in thousands): |
|
|
|
|
|
|
|
|
|
|
|
|
|
|
|
|
|
|
|
|
|
|
|
|
|
|
|
|
| Basic |
|
|
819,057 |
|
|
|
829,392 |
|
|
|
838,492 |
|
|
|
845,860 |
|
|
|
868,077 |
|
|
|
(1 |
%) |
|
|
(6 |
%) |
| Diluted |
|
|
827,831 |
|
|
|
838,324 |
|
|
|
848,245 |
|
|
|
857,924 |
|
|
|
877,511 |
|
|
|
(1 |
%) |
|
|
(6 |
%) |
| (a) |
Presented on a fully taxable equivalent basis. |
| (b) |
The tangible common equity and tier 1 common equity ratios, while not required by accounting principles generally accepted in the United States of America (U.S. GAAP), are considered to be critical metrics with which
to analyze banks. The ratios have been included herein to facilitate a greater understanding of the Bancorp’s capital structure and financial condition. See the Regulation G Non-GAAP Reconciliation table for a reconciliation of these ratios to
U.S. GAAP. |
The percentages in all of the tables in this earning release are calculated on actual dollar amounts and not the rounded
dollar amounts.
NM: Not meaningful.
“Fifth
Third reported full year net income available to common shareholders of $1.4 billion and earnings per diluted share were $1.66. Full year 2014 earnings included solid performance across our business lines highlighted by growth in corporate banking,
payments processing, and investment advisory revenue,” said Kevin T. Kabat, Vice Chairman and CEO of Fifth Third Bancorp. “Highlights for the year also included 7 percent growth in demand deposits and well-controlled expenses that were
down 6 percent. Return on average assets was 1.1 percent and return on average tangible common equity* was 12.2 percent.
“Fourth quarter earnings of
$385 million rounded out a solid year in a very tough operating environment. Average total deposits were up 3 percent sequentially, highlighted by 5 percent average demand deposit growth. Fee income comparisons were led by corporate banking which
increased 20 percent sequentially, led by strong results in capital markets fees to close out the year. We continue to make what we believe to be long-term value enhancing decisions when we deploy our shareholders’ equity and maintain our focus
on earnings growth as we anticipate a healthier economy in 2015.
| * |
Non-GAAP measure; see Reg. G reconciliation on page 33. |
3
“Full year net charge-offs were impacted by our decision to move $720 million of residential mortgage TDRs
to held-for-sale, as we look to take advantage of market conditions to reduce our TDR portfolio. This decision increased our charge-offs by $87 million. The intended transaction is in line with our previous statements about our view of the current
pricing for risk assets and is another indication of our strong focus to reduce the volatility of our future earnings. Otherwise in credit, nonperforming assets were down 24 percent from last year and remain at very low levels. Our credit
metrics are moving in the right direction and provide further support to our positive credit outlook.
“We continued to prudently and actively manage
our capital position, reducing our share count by another 4 percent in 2014. Fifth Third performed very well in 2014, and we made a number of decisions throughout the year to reduce risk and volatility of earnings, and we feel the Company is well
positioned as we enter 2015.”
Income Statement Highlights
|
|
|
|
|
|
|
|
|
|
|
|
|
|
|
|
|
|
|
|
|
|
|
|
|
|
|
|
|
| |
|
For the Three Months Ended |
|
|
% Change |
|
| |
|
December
2014 |
|
|
September
2014 |
|
|
June
2014 |
|
|
March
2014 |
|
|
December
2013 |
|
|
Seq |
|
|
Yr/Yr |
|
| Condensed Statements of Income ($ in millions) |
|
|
|
|
|
|
|
|
|
|
|
|
|
|
|
|
|
|
|
|
|
|
|
|
|
|
|
|
| Net interest income (taxable equivalent) |
|
$ |
888 |
|
|
$ |
908 |
|
|
$ |
905 |
|
|
$ |
898 |
|
|
$ |
905 |
|
|
|
(2 |
%) |
|
|
(2 |
%) |
| Provision for loan and lease losses |
|
|
99 |
|
|
|
71 |
|
|
|
76 |
|
|
|
69 |
|
|
|
53 |
|
|
|
40 |
% |
|
|
87 |
% |
| Total noninterest income |
|
|
653 |
|
|
|
520 |
|
|
|
736 |
|
|
|
564 |
|
|
|
703 |
|
|
|
26 |
% |
|
|
(7 |
%) |
| Total noninterest expense |
|
|
918 |
|
|
|
888 |
|
|
|
954 |
|
|
|
950 |
|
|
|
989 |
|
|
|
3 |
% |
|
|
(7 |
%) |
|
|
|
|
|
|
|
|
|
|
|
|
|
|
|
|
|
|
|
|
|
|
|
|
|
|
|
|
|
| Income before income taxes (taxable equivalent) |
|
|
524 |
|
|
|
469 |
|
|
|
611 |
|
|
|
443 |
|
|
|
566 |
|
|
|
12 |
% |
|
|
(8 |
%) |
|
|
|
|
|
|
|
|
|
|
|
|
|
|
|
|
|
|
|
|
|
|
|
|
|
|
|
|
|
| Taxable equivalent adjustment |
|
|
5 |
|
|
|
5 |
|
|
|
5 |
|
|
|
5 |
|
|
|
5 |
|
|
|
(4 |
%) |
|
|
(1 |
%) |
| Applicable income taxes |
|
|
134 |
|
|
|
124 |
|
|
|
167 |
|
|
|
119 |
|
|
|
159 |
|
|
|
8 |
% |
|
|
(16 |
%) |
|
|
|
|
|
|
|
|
|
|
|
|
|
|
|
|
|
|
|
|
|
|
|
|
|
|
|
|
|
| Net income |
|
|
385 |
|
|
|
340 |
|
|
|
439 |
|
|
|
319 |
|
|
|
402 |
|
|
|
13 |
% |
|
|
(4 |
%) |
| Less: Net income attributable to noncontrolling interests |
|
|
— |
|
|
|
— |
|
|
|
— |
|
|
|
1 |
|
|
|
— |
|
|
|
(70 |
%) |
|
|
NM |
|
|
|
|
|
|
|
|
|
|
|
|
|
|
|
|
|
|
|
|
|
|
|
|
|
|
|
|
|
|
| Net income attributable to Bancorp |
|
|
385 |
|
|
|
340 |
|
|
|
439 |
|
|
|
318 |
|
|
|
402 |
|
|
|
13 |
% |
|
|
(4 |
%) |
| Dividends on preferred stock |
|
|
23 |
|
|
|
12 |
|
|
|
23 |
|
|
|
9 |
|
|
|
19 |
|
|
|
87 |
% |
|
|
19 |
% |
|
|
|
|
|
|
|
|
|
|
|
|
|
|
|
|
|
|
|
|
|
|
|
|
|
|
|
|
|
| Net income available to common shareholders |
|
|
362 |
|
|
|
328 |
|
|
|
416 |
|
|
|
309 |
|
|
|
383 |
|
|
|
10 |
% |
|
|
(6 |
%) |
|
|
|
|
|
|
|
|
|
|
|
|
|
|
|
|
|
|
|
|
|
|
|
|
|
|
|
|
|
| Earnings per share, diluted |
|
$ |
0.43 |
|
|
$ |
0.39 |
|
|
$ |
0.49 |
|
|
$ |
0.36 |
|
|
$ |
0.43 |
|
|
|
10 |
% |
|
|
— |
|
4
Net Interest Income
|
|
|
|
|
|
|
|
|
|
|
|
|
|
|
|
|
|
|
|
|
|
|
|
|
|
|
|
|
| |
|
For the Three Months Ended |
|
|
% Change |
|
| |
|
December
2014 |
|
|
September
2014 |
|
|
June
2014 |
|
|
March
2014 |
|
|
December
2013 |
|
|
Seq |
|
|
Yr/Yr |
|
| Interest Income ($ in millions) |
|
|
|
|
|
|
|
|
|
|
|
|
|
|
|
|
|
|
|
|
|
|
|
|
|
|
|
|
| Total interest income (taxable equivalent) |
|
$ |
1,016 |
|
|
$ |
1,023 |
|
|
$ |
1,013 |
|
|
$ |
998 |
|
|
$ |
1,007 |
|
|
|
(1 |
%) |
|
|
1 |
% |
| Total interest expense |
|
|
128 |
|
|
|
115 |
|
|
|
108 |
|
|
|
100 |
|
|
|
102 |
|
|
|
11 |
% |
|
|
25 |
% |
|
|
|
|
|
|
|
|
|
|
|
|
|
|
|
|
|
|
|
|
|
|
|
|
|
|
|
|
|
| Net interest income (taxable equivalent) |
|
$ |
888 |
|
|
$ |
908 |
|
|
$ |
905 |
|
|
$ |
898 |
|
|
$ |
905 |
|
|
|
(2 |
%) |
|
|
(2 |
%) |
|
|
|
|
|
|
|
|
|
|
|
|
|
|
|
|
|
|
|
|
|
|
|
|
|
|
|
|
|
| Average Yield |
|
|
|
|
|
|
|
|
|
|
|
|
|
|
|
|
|
|
|
|
|
|
|
|
|
|
|
|
| Yield on interest-earning assets (taxable equivalent) |
|
|
3.38 |
% |
|
|
3.49 |
% |
|
|
3.53 |
% |
|
|
3.58 |
% |
|
|
3.57 |
% |
|
|
(3 |
%) |
|
|
(5 |
%) |
| Rate paid on interest-bearing liabilities |
|
|
0.61 |
% |
|
|
0.56 |
% |
|
|
0.54 |
% |
|
|
0.51 |
% |
|
|
0.52 |
% |
|
|
9 |
% |
|
|
17 |
% |
|
|
|
|
|
|
|
|
|
|
|
|
|
|
|
|
|
|
|
|
|
|
|
|
|
|
|
|
|
| Net interest rate spread (taxable equivalent) |
|
|
2.77 |
% |
|
|
2.93 |
% |
|
|
2.99 |
% |
|
|
3.07 |
% |
|
|
3.05 |
% |
|
|
(5 |
%) |
|
|
(9 |
%) |
|
|
|
|
|
|
|
|
|
|
|
|
|
|
|
|
|
|
|
|
|
|
|
|
|
|
|
|
|
| Net interest margin (taxable equivalent) |
|
|
2.96 |
% |
|
|
3.10 |
% |
|
|
3.15 |
% |
|
|
3.22 |
% |
|
|
3.21 |
% |
|
|
(5 |
%) |
|
|
(8 |
%) |
| Average Balances ($ in millions) |
|
|
|
|
|
|
|
|
|
|
|
|
|
|
|
|
|
|
|
|
|
|
|
|
|
|
|
|
| Loans and leases, including held for sale |
|
$ |
91,581 |
|
|
$ |
91,428 |
|
|
$ |
91,241 |
|
|
$ |
90,238 |
|
|
$ |
88,865 |
|
|
|
— |
|
|
|
3 |
% |
| Total securities and other short-term investments |
|
|
27,604 |
|
|
|
24,927 |
|
|
|
23,940 |
|
|
|
22,940 |
|
|
|
23,043 |
|
|
|
11 |
% |
|
|
20 |
% |
| Total interest-earning assets |
|
|
119,185 |
|
|
|
116,355 |
|
|
|
115,181 |
|
|
|
113,178 |
|
|
|
111,908 |
|
|
|
2 |
% |
|
|
7 |
% |
| Total interest-bearing liabilities |
|
|
82,544 |
|
|
|
81,157 |
|
|
|
80,770 |
|
|
|
79,130 |
|
|
|
77,573 |
|
|
|
2 |
% |
|
|
6 |
% |
| Bancorp shareholders’ equity |
|
|
15,644 |
|
|
|
15,486 |
|
|
|
15,157 |
|
|
|
14,862 |
|
|
|
14,757 |
|
|
|
1 |
% |
|
|
6 |
% |
Net interest income of $888 million on a fully taxable equivalent basis decreased $20 million from the third quarter primarily
driven by the effects of loan repricing and higher interest expense associated with the debt issuance in the third quarter of 2014 and partially offset by the benefit of loan growth. Additionally, net interest income was negatively impacted by lower
average investment securities balances and higher deposit costs in the quarter.
The net interest margin was 2.96 percent, a decrease of 14 bps from the
previous quarter primarily resulting from elevated cash balances due to growth in funding balances. Additionally, the net interest margin was negatively impacted by debt issuances and loan repricing during the quarter.
Compared with the fourth quarter of 2013, net interest income decreased $17 million and the net interest margin decreased 25 bps. The decrease in net interest
income was driven by the effect of loan repricing and higher interest expense resulting from increased long-term debt balances partially offset by higher investment securities balances and loan balances. The decline in the net interest margin was
primarily driven by the impact of loan repricing.
Securities
Average securities and other short-term investments were $27.6 billion in the fourth quarter of 2014 compared with $24.9 billion in the previous quarter and
$23.0 billion in the fourth quarter of 2013. Average securities of $22.4 billion decreased $216 million from the prior quarter reflecting the decision to not reinvest portfolio cash flows. Other short-term investments average balances of $5.2
billion increased $2.9 billion sequentially while end of period balances increased $4.3 billion reflecting higher cash balances held at the Federal Reserve.
5
Loans
|
|
|
|
|
|
|
|
|
|
|
|
|
|
|
|
|
|
|
|
|
|
|
|
|
|
|
|
|
| |
|
For the Three Months Ended |
|
|
% Change |
|
| |
|
December
2014 |
|
|
September
2014 |
|
|
June
2014 |
|
|
March
2014 |
|
|
December
2013 |
|
|
Seq |
|
|
Yr/Yr |
|
| Average Portfolio Loans and Leases ($ in millions) |
|
|
|
|
|
|
|
|
|
|
|
|
|
|
|
|
|
|
|
|
|
|
|
|
|
|
|
|
| Commercial: |
|
|
|
|
|
|
|
|
|
|
|
|
|
|
|
|
|
|
|
|
|
|
|
|
|
|
|
|
| Commercial and industrial loans |
|
$ |
41,277 |
|
|
$ |
41,477 |
|
|
$ |
41,374 |
|
|
$ |
40,377 |
|
|
$ |
38,835 |
|
|
|
— |
|
|
|
6 |
% |
| Commercial mortgage loans |
|
|
7,480 |
|
|
|
7,633 |
|
|
|
7,885 |
|
|
|
7,981 |
|
|
|
8,047 |
|
|
|
(2 |
%) |
|
|
(7 |
%) |
| Commercial construction loans |
|
|
1,909 |
|
|
|
1,563 |
|
|
|
1,362 |
|
|
|
1,116 |
|
|
|
952 |
|
|
|
22 |
% |
|
|
NM |
|
| Commercial leases |
|
|
3,600 |
|
|
|
3,571 |
|
|
|
3,555 |
|
|
|
3,607 |
|
|
|
3,578 |
|
|
|
1 |
% |
|
|
1 |
% |
|
|
|
|
|
|
|
|
|
|
|
|
|
|
|
|
|
|
|
|
|
|
|
|
|
|
|
|
|
| Subtotal—commercial loans and leases |
|
|
54,266 |
|
|
|
54,244 |
|
|
|
54,176 |
|
|
|
53,081 |
|
|
|
51,412 |
|
|
|
— |
|
|
|
6 |
% |
|
|
|
|
|
|
|
|
|
|
|
|
|
|
|
|
|
|
|
|
|
|
|
|
|
|
|
|
|
| Consumer: |
|
|
|
|
|
|
|
|
|
|
|
|
|
|
|
|
|
|
|
|
|
|
|
|
|
|
|
|
| Residential mortgage loans |
|
|
13,046 |
|
|
|
12,785 |
|
|
|
12,611 |
|
|
|
12,659 |
|
|
|
12,609 |
|
|
|
2 |
% |
|
|
3 |
% |
| Home equity |
|
|
8,937 |
|
|
|
9,009 |
|
|
|
9,101 |
|
|
|
9,194 |
|
|
|
9,296 |
|
|
|
(1 |
%) |
|
|
(4 |
%) |
| Automobile loans |
|
|
12,073 |
|
|
|
12,105 |
|
|
|
12,070 |
|
|
|
12,023 |
|
|
|
12,019 |
|
|
|
— |
|
|
|
— |
|
| Credit card |
|
|
2,324 |
|
|
|
2,295 |
|
|
|
2,232 |
|
|
|
2,230 |
|
|
|
2,202 |
|
|
|
1 |
% |
|
|
6 |
% |
| Other consumer loans and leases |
|
|
395 |
|
|
|
361 |
|
|
|
359 |
|
|
|
343 |
|
|
|
357 |
|
|
|
9 |
% |
|
|
11 |
% |
|
|
|
|
|
|
|
|
|
|
|
|
|
|
|
|
|
|
|
|
|
|
|
|
|
|
|
|
|
| Subtotal—consumer loans and leases |
|
|
36,775 |
|
|
|
36,555 |
|
|
|
36,373 |
|
|
|
36,449 |
|
|
|
36,483 |
|
|
|
1 |
% |
|
|
1 |
% |
|
|
|
|
|
|
|
|
|
|
|
|
|
|
|
|
|
|
|
|
|
|
|
|
|
|
|
|
|
| Total average loans and leases (excluding held for sale) |
|
$ |
91,041 |
|
|
$ |
90,799 |
|
|
$ |
90,549 |
|
|
$ |
89,530 |
|
|
$ |
87,895 |
|
|
|
— |
|
|
|
4 |
% |
| Average loans held for sale |
|
|
540 |
|
|
|
629 |
|
|
|
692 |
|
|
|
708 |
|
|
|
970 |
|
|
|
(14 |
%) |
|
|
(44 |
%) |
Average loan and lease balances (excluding loans held-for-sale) increased $242 million sequentially and increased $3.1
billion, or 4 percent, from the fourth quarter of 2013. The sequential increase in average loans and leases was primarily driven by growth in commercial construction and residential mortgage loans. Sequential growth was partially offset by
declines in commercial and industrial (C&I), commercial mortgage, and home equity loans. Period end loans and leases (excluding loans held-for-sale) of $90.1 billion decreased $540 million sequentially, reflecting the impact of $720 million
residential mortgage loans classified as troubled debt restructurings transferred to held-for-sale during the quarter, and increased $1.5 billion, or 2 percent, from a year ago.
Average commercial portfolio loan and lease balances were flat sequentially and increased $2.9 billion, or 6 percent, from the fourth quarter of 2013. Average
C&I loans decreased $200 million from the prior quarter and increased $2.4 billion from the fourth quarter of 2013. Within commercial real estate, average commercial mortgage balances continued to decline and average commercial construction
balances increased for the eighth consecutive quarter. Commercial line usage, on an end of period basis, was 32 percent of committed lines in the fourth quarter of 2014 compared with 32 percent in the third quarter of 2014 and 29 percent in the
fourth quarter of 2013.
Average consumer portfolio loan and lease balances increased $220 million, or 1 percent, sequentially and increased $292 million,
or 1 percent, year-over-year. Average residential mortgage loans increased 2 percent sequentially and 3 percent from a year ago. Average home equity loans declined 1 percent sequentially and 4 percent from the fourth quarter of 2013. Average credit
card loans increased 1 percent sequentially and 6 percent from the fourth quarter of 2013.
6
Average loans held-for-sale balances of $540 million decreased $89 million sequentially and $430 million compared
with the fourth quarter of 2013. Period end loans held-for-sale of $1.3 billion increased $620 million from the previous quarter and $317 million from the fourth quarter of 2013 primarily due to the transfer of certain residential mortgage loans
classified as troubled debt restructurings to held-for-sale.
Deposits
|
|
|
|
|
|
|
|
|
|
|
|
|
|
|
|
|
|
|
|
|
|
|
|
|
|
|
|
|
| |
|
For the Three Months Ended |
|
|
% Change |
|
| |
|
December
2014 |
|
|
September
2014 |
|
|
June
2014 |
|
|
March
2014 |
|
|
December
2013 |
|
|
Seq |
|
|
Yr/Yr |
|
| Average Deposits ($ in millions) |
|
|
|
|
|
|
|
|
|
|
|
|
|
|
|
|
|
|
|
|
|
| Demand |
|
$ |
33,301 |
|
|
$ |
31,790 |
|
|
$ |
31,275 |
|
|
$ |
30,626 |
|
|
$ |
30,765 |
|
|
|
5 |
% |
|
|
8 |
% |
| Interest checking |
|
|
25,478 |
|
|
|
24,926 |
|
|
|
25,222 |
|
|
|
25,911 |
|
|
|
24,650 |
|
|
|
2 |
% |
|
|
3 |
% |
| Savings |
|
|
15,173 |
|
|
|
15,759 |
|
|
|
16,509 |
|
|
|
16,903 |
|
|
|
17,323 |
|
|
|
(4 |
%) |
|
|
(12 |
%) |
| Money market |
|
|
17,023 |
|
|
|
15,222 |
|
|
|
13,942 |
|
|
|
12,439 |
|
|
|
11,285 |
|
|
|
12 |
% |
|
|
51 |
% |
| Foreign office(a) |
|
|
1,439 |
|
|
|
1,663 |
|
|
|
2,200 |
|
|
|
2,017 |
|
|
|
1,717 |
|
|
|
(13 |
%) |
|
|
(16 |
%) |
|
|
|
|
|
|
|
|
|
|
|
|
|
|
|
|
|
|
|
|
|
|
|
|
|
|
|
|
|
| Subtotal—Transaction deposits |
|
|
92,414 |
|
|
|
89,360 |
|
|
|
89,148 |
|
|
|
87,896 |
|
|
|
85,740 |
|
|
|
3 |
% |
|
|
8 |
% |
| Other time |
|
|
3,936 |
|
|
|
3,800 |
|
|
|
3,693 |
|
|
|
3,616 |
|
|
|
3,529 |
|
|
|
4 |
% |
|
|
12 |
% |
|
|
|
|
|
|
|
|
|
|
|
|
|
|
|
|
|
|
|
|
|
|
|
|
|
|
|
|
|
| Subtotal—Core deposits |
|
|
96,350 |
|
|
|
93,160 |
|
|
|
92,841 |
|
|
|
91,512 |
|
|
|
89,269 |
|
|
|
3 |
% |
|
|
8 |
% |
| Certificates—$100,000 and over |
|
|
2,998 |
|
|
|
3,339 |
|
|
|
3,840 |
|
|
|
5,576 |
|
|
|
7,456 |
|
|
|
(10 |
%) |
|
|
(60 |
%) |
| Other |
|
|
— |
|
|
|
— |
|
|
|
— |
|
|
|
— |
|
|
|
— |
|
|
|
NM |
|
|
|
NM |
|
|
|
|
|
|
|
|
|
|
|
|
|
|
|
|
|
|
|
|
|
|
|
|
|
|
|
|
|
|
| Total deposits |
|
$ |
99,348 |
|
|
$ |
96,499 |
|
|
$ |
96,681 |
|
|
$ |
97,088 |
|
|
$ |
96,725 |
|
|
|
3 |
% |
|
|
3 |
% |
| (a) |
Includes commercial customer Eurodollar sweep balances for which the Bancorp pays rates comparable to other commercial deposit accounts. |
Average core deposits increased $3.2 billion sequentially and increased $7.1 billion, or 8 percent, from the fourth quarter of 2013. Average transaction
deposits increased $3.1 billion from the third quarter of 2014 primarily driven by higher money market account, demand deposit, and interest checking balances, partially offset by lower savings and foreign office balances. Year-over-year transaction
deposits increased $6.7 billion, or 8 percent, driven by higher money market account, demand deposit, and interest checking balances, partially offset by lower savings and foreign office balances. Other time deposits increased 4 percent sequentially
and 12 percent compared with the fourth quarter of 2013.
Average commercial transaction deposits increased 5 percent sequentially and 10 percent from the
previous year. Sequential performance reflected higher demand deposit, money market account, and interest checking balances, partially offset by lower foreign office balances. Year-over-year growth reflected higher demand deposit, interest checking,
and money market account balances as customers are holding higher balances.
Average consumer transaction deposits increased 2 percent sequentially and
increased 6 percent from the fourth quarter of 2013. The sequential performance reflected higher money market account, interest checking, and demand deposit balances partially offset by lower savings balances. Year-over-year growth was driven by
increased money market account and demand deposit balances partially offset by lower savings and interest checking balances.
7
Wholesale Funding
|
|
|
|
|
|
|
|
|
|
|
|
|
|
|
|
|
|
|
|
|
|
|
|
|
|
|
|
|
| |
|
For the Three Months Ended |
|
|
% Change |
|
| |
|
December
2014 |
|
|
September
2014 |
|
|
June
2014 |
|
|
March
2014 |
|
|
December
2013 |
|
|
Seq |
|
|
Yr/Yr |
|
| Average Wholesale Funding ($ in millions) |
|
|
|
|
|
|
|
|
|
|
|
|
|
|
|
|
|
|
|
|
|
|
|
|
|
|
|
|
| Certificates—$100,000 and over |
|
$ |
2,998 |
|
|
$ |
3,339 |
|
|
$ |
3,840 |
|
|
$ |
5,576 |
|
|
$ |
7,456 |
|
|
|
(10 |
%) |
|
|
(60 |
%) |
| Other deposits |
|
|
— |
|
|
|
— |
|
|
|
— |
|
|
|
— |
|
|
|
— |
|
|
|
NM |
|
|
|
NM |
|
| Federal funds purchased |
|
|
161 |
|
|
|
520 |
|
|
|
606 |
|
|
|
547 |
|
|
|
301 |
|
|
|
(69 |
%) |
|
|
(47 |
%) |
| Other short-term borrowings |
|
|
1,481 |
|
|
|
1,973 |
|
|
|
2,234 |
|
|
|
1,808 |
|
|
|
2,177 |
|
|
|
(25 |
%) |
|
|
(32 |
%) |
| Long-term debt |
|
|
14,855 |
|
|
|
13,955 |
|
|
|
12,524 |
|
|
|
10,313 |
|
|
|
9,135 |
|
|
|
6 |
% |
|
|
63 |
% |
|
|
|
|
|
|
|
|
|
|
|
|
|
|
|
|
|
|
|
|
|
|
|
|
|
|
|
|
|
| Total wholesale funding |
|
$ |
19,495 |
|
|
$ |
19,787 |
|
|
$ |
19,204 |
|
|
$ |
18,244 |
|
|
$ |
19,069 |
|
|
|
(1 |
%) |
|
|
2 |
% |
Average wholesale funding of $19.5 billion decreased $292 million, or 1 percent, sequentially and increased $426 million, or 2
percent, compared with the fourth quarter of 2013. The sequential decrease was driven by a decrease in other short-term borrowings, federal funds purchased, and certificates $100,000 and over, partially offset by an increase in long-term debt.
Average other short-term borrowings decreased $492 million from the prior quarter primarily due to a decrease in FHLB borrowings. The year-over-year increase in average wholesale funding reflected an increase in long-term debt, partially offset by a
decrease in certificates $100,000 and over and other short-term borrowings. Average long-term debt balances reflected the $1.0 billion on-balance sheet auto securitization executed in the fourth quarter of 2014, as well as the full quarter impact of
$850 million of bank senior debt issued in the third quarter of 2014.
Noninterest Income
|
|
|
|
|
|
|
|
|
|
|
|
|
|
|
|
|
|
|
|
|
|
|
|
|
|
|
|
|
| |
|
For the Three Months Ended |
|
|
% Change |
|
| |
|
December
2014 |
|
|
September
2014 |
|
|
June
2014 |
|
|
March
2014 |
|
|
December
2013 |
|
|
Seq |
|
|
Yr/Yr |
|
| Noninterest Income ($ in millions) |
|
|
|
|
|
|
|
|
|
|
|
|
|
|
|
|
|
|
|
|
|
|
|
|
|
|
|
|
| Service charges on deposits |
|
$ |
142 |
|
|
$ |
145 |
|
|
$ |
139 |
|
|
$ |
133 |
|
|
$ |
142 |
|
|
|
(2 |
%) |
|
|
— |
|
| Corporate banking revenue |
|
|
120 |
|
|
|
100 |
|
|
|
107 |
|
|
|
104 |
|
|
|
94 |
|
|
|
20 |
% |
|
|
27 |
% |
| Mortgage banking net revenue |
|
|
61 |
|
|
|
61 |
|
|
|
78 |
|
|
|
109 |
|
|
|
126 |
|
|
|
— |
|
|
|
(51 |
%) |
| Investment advisory revenue |
|
|
100 |
|
|
|
103 |
|
|
|
102 |
|
|
|
102 |
|
|
|
98 |
|
|
|
(2 |
%) |
|
|
2 |
% |
| Card and processing revenue |
|
|
76 |
|
|
|
75 |
|
|
|
76 |
|
|
|
68 |
|
|
|
71 |
|
|
|
2 |
% |
|
|
7 |
% |
| Other noninterest income |
|
|
150 |
|
|
|
33 |
|
|
|
226 |
|
|
|
41 |
|
|
|
170 |
|
|
|
NM |
|
|
|
(13 |
%) |
| Securities gains, net |
|
|
4 |
|
|
|
3 |
|
|
|
8 |
|
|
|
7 |
|
|
|
2 |
|
|
|
15 |
% |
|
|
NM |
|
| Securities gains, net—non-qualifying hedges on mortgage servicing rights |
|
|
— |
|
|
|
— |
|
|
|
— |
|
|
|
— |
|
|
|
— |
|
|
|
— |
|
|
|
— |
|
|
|
|
|
|
|
|
|
|
|
|
|
|
|
|
|
|
|
|
|
|
|
|
|
|
|
|
|
|
| Total noninterest income |
|
$ |
653 |
|
|
$ |
520 |
|
|
$ |
736 |
|
|
$ |
564 |
|
|
$ |
703 |
|
|
|
26 |
% |
|
|
(7 |
%) |
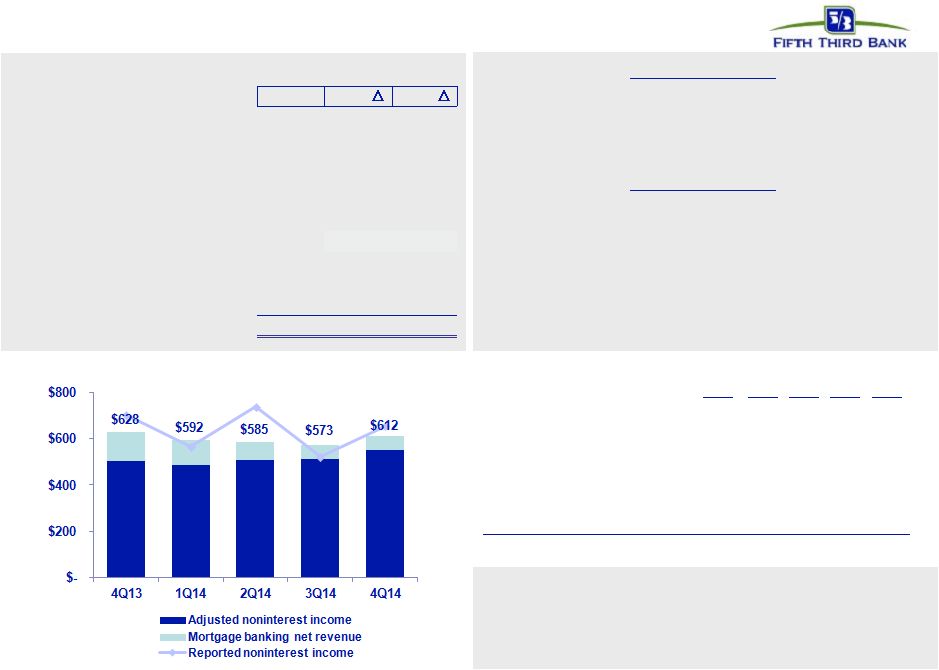
Noninterest income of $653 million increased $133 million sequentially and decreased $50 million compared with prior year
results. These comparisons reflect the impacts described below.
For the quarters ending December 31, 2014, September 30, 2014, and
December 31, 2013, the impacts of Vantiv warrant valuation adjustments were positive $56 million, negative $53 million, and positive $91 million, respectively. Quarterly results also included charges related to the valuation of the total return
swap entered into as part of the 2009 sale of Visa, Inc. Class B shares. Valuation adjustments on this swap were a negative $19 million, negative $3 million, and negative $18 million in the fourth quarter of 2014, the third quarter of 2014, and the
fourth quarter of 2013, respectively. Excluding these items and net securities gains in all periods, noninterest income of $612 million increased $39 million, or 7 percent,
8
from the previous quarter and decreased $16 million, or 3 percent, from the fourth quarter of 2013. The sequential increase was primarily due to the $23 million annual payment received from
Vantiv pursuant to the tax receivable agreement in the fourth quarter of 2014 and an increase in corporate banking revenue. The year-over-year decline was primarily due to lower mortgage banking net revenue partially offset by higher corporate
banking revenue and higher payments received from Vantiv pursuant to the tax receivable agreement in the fourth quarter of 2014 compared to the fourth quarter of 2013, which were $23 million and $9 million, respectively.
Service charges on deposits of $142 million decreased 2 percent from the third quarter and were flat compared with the same quarter last year. The sequential
decline was due to a 2 percent decrease in commercial service charges as well as a 2 percent decrease in retail service charges due to lower overdraft occurrences.
Corporate banking revenue of $120 million increased 20 percent from the third quarter of 2014 and 27 percent from the fourth quarter of 2013. The sequential
increase was due to higher syndication fees, business lending fees, and foreign exchange fees, partially offset by a decrease in institutional sales revenue. The year-over-year increase was driven by higher syndication fees, lease remarketing fees,
letter of credit fees, and foreign exchange fees, partially offset by a decrease in institutional sales revenue.
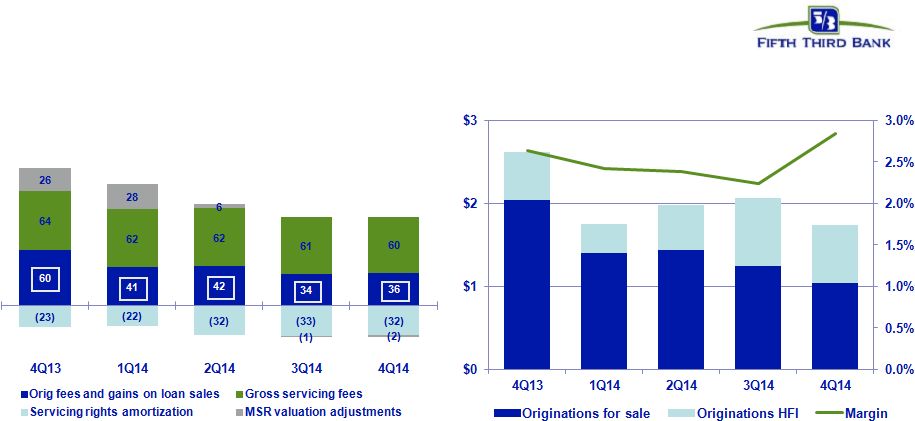
Mortgage banking net revenue was $61
million in the fourth quarter of 2014, flat from the third quarter of 2014 and a 51 percent decrease from the fourth quarter of 2013. Fourth quarter 2014 originations were $1.7 billion, compared with $2.1 billion in the previous quarter and $2.6
billion in the fourth quarter of 2013. Fourth quarter 2014 originations resulted in gains of $36 million on mortgages sold, compared with gains of $34 million during the previous quarter and $60 million during the fourth quarter of 2013. The
sequential increase was driven by higher gain on sale margins, partially offset by lower production. The decrease from the prior year reflected lower production, including Fifth Third’s exit from the broker channel, partially offset by higher
gain on sale margins. Mortgage servicing fees were $60 million this quarter, $61 million in the third quarter of 2014, and $64 million in the fourth quarter of 2013. Mortgage banking net revenue is also affected by net servicing asset valuation
adjustments, which include mortgage servicing rights (MSR) amortization and MSR valuation adjustments (including mark-to-market adjustments on free-standing derivatives used to economically hedge the MSR portfolio). These net servicing asset
valuation adjustments were negative $34 million in the fourth quarter of 2014 (reflecting MSR amortization of $32 million and MSR valuation adjustments of negative $2 million); negative $34 million in the third quarter of 2014 (MSR
amortization of $33 million and MSR valuation adjustments of negative $1 million); and positive $3 million in the fourth quarter of 2013 (MSR amortization of $23 million and MSR valuation adjustments of positive $26 million). The mortgage servicing
asset, net of the valuation reserve, was $856 million at quarter-end on a servicing portfolio of $65 billion.
Investment advisory revenue of $100 million
decreased 2 percent from the third quarter and increased 2 percent year-over-year. The sequential decline reflected a decrease in personal specialty and insurance fees relative to elevated levels in the third quarter, as well as a decrease in
securities and brokerage fees due to a continued shift from transaction-based fees to recurring revenue streams. The year-over-year increase reflected an increase in personal asset management fees due to market-related growth, partially offset by a
decrease in securities and brokerage fees.
9
Card and processing revenue of $76 million in the fourth quarter of 2014 increased 2 percent sequentially and
increased 7 percent from the fourth quarter of 2013. The sequential and year-over-year increases reflect an increase in the number of actively used cards and an increase in customer spend volume.
Other noninterest income totaled $150 million in the fourth quarter of 2014, compared with $33 million in the previous quarter and $170 million in the fourth
quarter of 2013. As previously described, the results included the impact of Vantiv warrant valuation adjustments and charges related to the valuation of the Visa total return swap. Excluding these items, other noninterest income of $113 million
increased approximately $24 million, or 27 percent, from the third quarter of 2014 and increased approximately $16 million, or 16 percent, from the fourth quarter of 2013. The sequential and year-over-year increases were primarily due to payments
received from Vantiv pursuant to the tax receivable agreement of $23 million in the fourth quarter of 2014 and $9 million in the fourth quarter of 2013.
Net gains on investment securities were $4 million in the fourth quarter of 2014, compared with $3 million in the previous quarter and $2 million in the
fourth quarter of 2013.
Noninterest Expense
|
|
|
|
|
|
|
|
|
|
|
|
|
|
|
|
|
|
|
|
|
|
|
|
|
|
|
|
|
| |
|
For the Three Months Ended |
|
|
% Change |
|
| |
|
December
2014 |
|
|
September
2014 |
|
|
June
2014 |
|
|
March
2014 |
|
|
December
2013 |
|
|
Seq |
|
|
Yr/Yr |
|
| Noninterest Expense ($ in millions) |
|
|
|
|
|
|
|
|
|
|
|
|
|
|
|
|
|
|
|
|
|
|
|
|
|
|
|
|
| Salaries, wages and incentives |
|
$ |
366 |
|
|
$ |
357 |
|
|
$ |
368 |
|
|
$ |
359 |
|
|
$ |
388 |
|
|
|
3 |
% |
|
|
(6 |
%) |
| Employee benefits |
|
|
79 |
|
|
|
75 |
|
|
|
79 |
|
|
|
101 |
|
|
|
78 |
|
|
|
5 |
% |
|
|
1 |
% |
| Net occupancy expense |
|
|
77 |
|
|
|
78 |
|
|
|
79 |
|
|
|
80 |
|
|
|
77 |
|
|
|
(1 |
%) |
|
|
— |
|
| Technology and communications |
|
|
54 |
|
|
|
53 |
|
|
|
52 |
|
|
|
53 |
|
|
|
53 |
|
|
|
2 |
% |
|
|
2 |
% |
| Equipment expense |
|
|
30 |
|
|
|
30 |
|
|
|
30 |
|
|
|
30 |
|
|
|
29 |
|
|
|
— |
|
|
|
3 |
% |
| Card and processing expense |
|
|
36 |
|
|
|
37 |
|
|
|
37 |
|
|
|
31 |
|
|
|
37 |
|
|
|
(1 |
%) |
|
|
(2 |
%) |
| Other noninterest expense |
|
|
276 |
|
|
|
258 |
|
|
|
309 |
|
|
|
296 |
|
|
|
327 |
|
|
|
7 |
% |
|
|
(16 |
%) |
|
|
|
|
|
|
|
|
|
|
|
|
|
|
|
|
|
|
|
|
|
|
|
|
|
|
|
|
|
| Total noninterest expense |
|
$ |
918 |
|
|
$ |
888 |
|
|
$ |
954 |
|
|
$ |
950 |
|
|
$ |
989 |
|
|
|
3 |
% |
|
|
(7 |
%) |
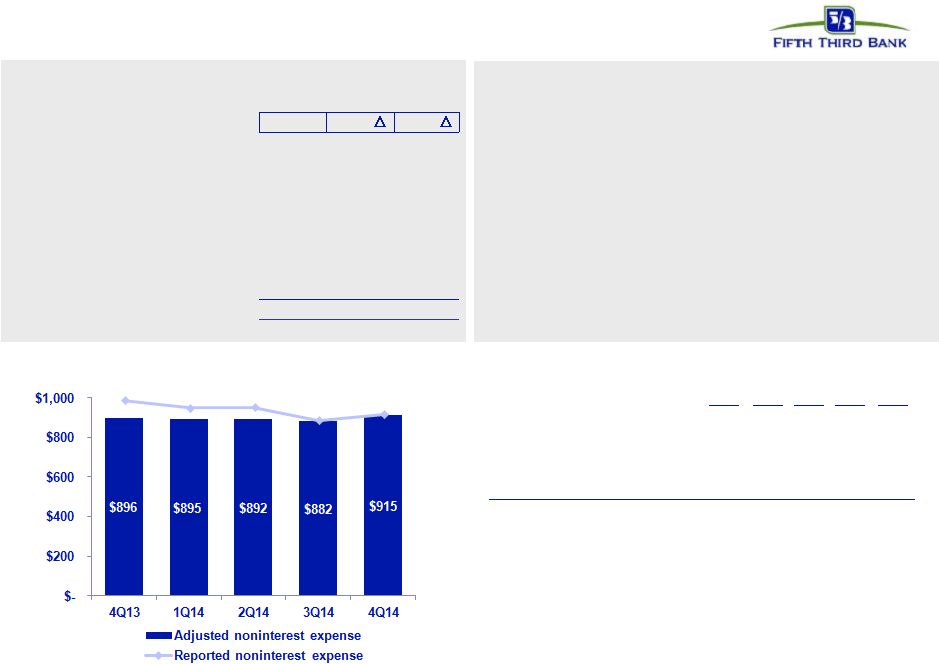
Noninterest expense of $918 million increased 3 percent compared with the third quarter of 2014 and decreased 7 percent
compared with the fourth quarter of 2013.
Fourth quarter 2014 expenses included a $3 million reversal of litigation reserves, compared with $4 million in
charges to litigation reserves in the third quarter of 2014 and $69 million in charges to litigation reserves in the fourth quarter of 2013. Fourth quarter 2014 expenses also included $6 million in severance expense compared with $2 million in the
third quarter of 2014 and $8 million in the fourth quarter of 2013. Fourth quarter of 2013 also included $8 million of debt extinguishment costs associated with the redemption of Fifth Third Capital Trust IV and an $8 million contribution to Fifth
Third Foundation. Excluding these items, noninterest expense of $915 million was up $33 million, or 4 percent, sequentially and increased $19 million, or 2 percent, year-over-year. The sequential increase reflected higher credit-related costs and
compensation-related expense. The year-over-year increase reflected increased credit-related costs, partially offset by lower compensation-related expense, primarily due to changes in our mortgage and retail staffing.
10
Credit costs related to problem assets recorded as noninterest expense totaled $33 million in the fourth quarter
of 2014, compared with $13 million in the third quarter of 2014, and a benefit of $12 million in the fourth quarter of 2013. Credit- related expenses included provision for mortgage repurchases that was an immaterial amount in the fourth quarter of
2014, compared with expense of $3 million in the third quarter of 2014. The fourth quarter of 2013 included a benefit of $26 million reflecting the reduction in the mortgage representation and warranty reserve primarily related to Fifth Third’s
settlement with Freddie Mac and corresponding expectations for future repurchase requests and file claims. (Realized mortgage repurchase losses were $2 million in the fourth quarter of 2014, compared with $3 million in the third quarter of 2014, and
$33 million in the fourth quarter of 2013.) Provision for unfunded commitments was an expense of $1 million in the current quarter, compared with a benefit of $8 million last quarter and a benefit of $5 million a year ago. Derivative valuation
adjustments related to customer credit risk were negative $10 million for the current quarter, positive $1 million in the third quarter, and positive $2 million for the year ago quarter. Other problem asset-related expenses were $17 million in the
fourth quarter, compared with $15 million in the previous quarter, and $17 million in the same period last year.
Credit Quality
|
|
|
|
|
|
|
|
|
|
|
|
|
|
|
|
|
|
|
|
|
| |
|
For the Three Months Ended |
|
| |
|
December
2014 |
|
|
September
2014 |
|
|
June
2014 |
|
|
March
2014 |
|
|
December
2013 |
|
| Total net losses charged off ($ in millions) |
|
|
|
|
|
|
|
|
|
|
|
|
|
|
|
|
|
|
|
|
| Commercial and industrial loans |
|
($ |
44 |
) |
|
($ |
50 |
) |
|
($ |
31 |
) |
|
($ |
97 |
) |
|
($ |
66 |
) |
| Commercial mortgage loans |
|
|
(10 |
) |
|
|
(5 |
) |
|
|
(9 |
) |
|
|
(3 |
) |
|
|
(8 |
) |
| Commercial construction loans |
|
|
— |
|
|
|
— |
|
|
|
(8 |
) |
|
|
(5 |
) |
|
|
(4 |
) |
| Commercial leases |
|
|
(1 |
) |
|
|
— |
|
|
|
— |
|
|
|
— |
|
|
|
— |
|
| Residential mortgage loans |
|
|
(94 |
) |
|
|
(9 |
) |
|
|
(8 |
) |
|
|
(15 |
) |
|
|
(13 |
) |
| Home equity |
|
|
(11 |
) |
|
|
(14 |
) |
|
|
(18 |
) |
|
|
(16 |
) |
|
|
(26 |
) |
| Automobile loans |
|
|
(7 |
) |
|
|
(7 |
) |
|
|
(5 |
) |
|
|
(8 |
) |
|
|
(6 |
) |
| Credit card |
|
|
(20 |
) |
|
|
(23 |
) |
|
|
(21 |
) |
|
|
(19 |
) |
|
|
(21 |
) |
| Other consumer loans and leases |
|
|
(4 |
) |
|
|
(7 |
) |
|
|
(1 |
) |
|
|
(5 |
) |
|
|
(4 |
) |
|
|
|
|
|
|
|
|
|
|
|
|
|
|
|
|
|
|
|
|
|
| Total net losses charged off |
|
|
(191 |
) |
|
|
(115 |
) |
|
|
(101 |
) |
|
|
(168 |
) |
|
|
(148 |
) |
| Total losses |
|
|
(215 |
) |
|
|
(146 |
) |
|
|
(127 |
) |
|
|
(190 |
) |
|
|
(183 |
) |
| Total recoveries |
|
|
24 |
|
|
|
31 |
|
|
|
26 |
|
|
|
22 |
|
|
|
35 |
|
|
|
|
|
|
|
|
|
|
|
|
|
|
|
|
|
|
|
|
|
|
| Total net losses charged off |
|
($ |
191 |
) |
|
($ |
115 |
) |
|
($ |
101 |
) |
|
($ |
168 |
) |
|
($ |
148 |
) |
| Ratios (annualized) |
|
|
|
|
|
|
|
|
|
|
|
|
|
|
|
|
|
|
|
|
| Net losses charged off as a percent of average loans and leases (excluding held for sale) |
|
|
0.83 |
% |
|
|
0.50 |
% |
|
|
0.45 |
% |
|
|
0.76 |
% |
|
|
0.67 |
% |
| Commercial |
|
|
0.40 |
% |
|
|
0.40 |
% |
|
|
0.35 |
% |
|
|
0.79 |
% |
|
|
0.60 |
% |
| Consumer |
|
|
1.47 |
% |
|
|
0.66 |
% |
|
|
0.60 |
% |
|
|
0.72 |
% |
|
|
0.76 |
% |
Net charge-offs were $191 million, or 83 bps of average loans on an annualized basis, in the fourth quarter of 2014 compared
with net charge-offs of $115 million, or 50 bps, in the third quarter of 2014 and $148 million, or 67 bps, in the fourth quarter of 2013. The fourth quarter of 2014 net charge-offs included $87 million (38 bps) related to the transfer of residential
mortgage loans classified as troubled debt restructurings to held-for-sale. Excluding these, net charge-offs were $104 million, or 45 bps, in the fourth quarter of 2014. For comparison purposes, the fourth quarter of 2013 included a single large
credit that was restructured which resulted in a charge-off of $43 million (19 bps).
11
Commercial net charge-offs were $55 million, or 40 bps, and were flat sequentially. C&I net charge-offs of
$44 million decreased $6 million from the previous quarter and commercial real estate net charge-offs increased $5 million from the previous quarter.
Consumer net charge-offs were $136 million, or 147 bps, up $76 million sequentially. Net charge-offs on residential mortgage loans in the portfolio were $94
million, up $85 million from the previous quarter primarily reflecting the impact of the charge-offs mentioned above. Home equity net charge-offs were $11 million, down $3 million from the third quarter of 2014, and net charge-offs in the auto
portfolio of $7 million were flat compared with the prior quarter. Net charge-offs on consumer credit card loans were $20 million, down $3 million from the third quarter. Net charge-offs on other consumer loans were $4 million, down $3 million
compared with the previous quarter.
|
|
|
|
|
|
|
|
|
|
|
|
|
|
|
|
|
|
|
|
|
| |
|
For the Three Months Ended |
|
| |
|
December
2014 |
|
|
September
2014 |
|
|
June
2014 |
|
|
March
2014 |
|
|
December
2013 |
|
| Allowance for Credit Losses ($ in millions) |
|
|
|
|
|
|
|
|
|
|
|
|
|
|
|
|
|
|
|
|
| Allowance for loan and lease losses, beginning |
|
$ |
1,414 |
|
|
$ |
1,458 |
|
|
$ |
1,483 |
|
|
$ |
1,582 |
|
|
$ |
1,677 |
|
| Total net losses charged off |
|
|
(191 |
) |
|
|
(115 |
) |
|
|
(101 |
) |
|
|
(168 |
) |
|
|
(148 |
) |
| Provision for loan and lease losses |
|
|
99 |
|
|
|
71 |
|
|
|
76 |
|
|
|
69 |
|
|
|
53 |
|
|
|
|
|
|
|
|
|
|
|
|
|
|
|
|
|
|
|
|
|
|
| Allowance for loan and lease losses, ending |
|
|
1,322 |
|
|
|
1,414 |
|
|
|
1,458 |
|
|
|
1,483 |
|
|
|
1,582 |
|
| Reserve for unfunded commitments, beginning |
|
|
134 |
|
|
|
142 |
|
|
|
153 |
|
|
|
162 |
|
|
|
167 |
|
| Provision (benefit) for unfunded commitments |
|
|
1 |
|
|
|
(8 |
) |
|
|
(11 |
) |
|
|
(9 |
) |
|
|
(5 |
) |
|
|
|
|
|
|
|
|
|
|
|
|
|
|
|
|
|
|
|
|
|
| Reserve for unfunded commitments, ending |
|
|
135 |
|
|
|
134 |
|
|
|
142 |
|
|
|
153 |
|
|
|
162 |
|
| Components of allowance for credit losses: |
|
|
|
|
|
|
|
|
|
|
|
|
|
|
|
|
|
|
|
|
| Allowance for loan and lease losses |
|
|
1,322 |
|
|
|
1,414 |
|
|
|
1,458 |
|
|
|
1,483 |
|
|
|
1,582 |
|
| Reserve for unfunded commitments |
|
|
135 |
|
|
|
134 |
|
|
|
142 |
|
|
|
153 |
|
|
|
162 |
|
|
|
|
|
|
|
|
|
|
|
|
|
|
|
|
|
|
|
|
|
|
| Total allowance for credit losses |
|
$ |
1,457 |
|
|
$ |
1,548 |
|
|
$ |
1,600 |
|
|
$ |
1,636 |
|
|
$ |
1,744 |
|
| Allowance for loan and lease losses ratio |
|
|
|
|
|
|
|
|
|
|
|
|
|
|
|
|
|
|
|
|
| As a percent of loans and leases |
|
|
1.47 |
% |
|
|
1.56 |
% |
|
|
1.61 |
% |
|
|
1.65 |
% |
|
|
1.79 |
% |
| As a percent of nonperforming loans and leases(a) |
|
|
228 |
% |
|
|
228 |
% |
|
|
228 |
% |
|
|
202 |
% |
|
|
211 |
% |
| As a percent of nonperforming assets(a) |
|
|
178 |
% |
|
|
178 |
% |
|
|
175 |
% |
|
|
157 |
% |
|
|
161 |
% |
| (a) |
Excludes nonaccrual loans and leases in loans held for sale. |
Provision for loan and lease losses
totaled $99 million in the fourth quarter of 2014 and included a $23 million impact related to the transfer of residential mortgage loans classified as troubled debt restructurings to held-for-sale. The provision increased $28 million from the third
quarter of 2014 and increased $46 million from the fourth quarter of 2013. The allowance for loan and lease losses declined $92 million sequentially reflecting a $64 million reduction related to the aforementioned transfer of loans to held-for-sale,
as well as the portfolio’s overall risk profile and charges to the allowance. The allowance represented 1.47 percent of total loans and leases outstanding as of quarter end, compared with 1.56 percent last quarter, and represented 228 percent
of nonperforming loans and leases, and 178 percent of nonperforming assets.
12
|
|
|
|
|
|
|
|
|
|
|
|
|
|
|
|
|
|
|
|
|
| |
|
As of |
|
| |
|
December
2014 |
|
|
September
2014 |
|
|
June
2014 |
|
|
March
2014 |
|
|
December
2013 |
|
| Nonperforming Assets and Delinquent Loans ($ in millions) |
|
|
|
|
|
|
|
|
|
|
|
|
|
|
|
|
|
|
|
|
| Nonaccrual portfolio loans and leases: |
|
|
|
|
|
|
|
|
|
| Commercial and industrial loans |
|
$ |
86 |
|
|
$ |
102 |
|
|
$ |
103 |
|
|
$ |
153 |
|
|
$ |
127 |
|
| Commercial mortgage loans |
|
|
64 |
|
|
|
77 |
|
|
|
86 |
|
|
|
96 |
|
|
|
90 |
|
| Commercial construction loans |
|
|
— |
|
|
|
2 |
|
|
|
3 |
|
|
|
3 |
|
|
|
10 |
|
| Commercial leases |
|
|
3 |
|
|
|
3 |
|
|
|
2 |
|
|
|
3 |
|
|
|
3 |
|
| Residential mortgage loans |
|
|
44 |
|
|
|
52 |
|
|
|
56 |
|
|
|
68 |
|
|
|
83 |
|
| Home equity |
|
|
72 |
|
|
|
69 |
|
|
|
73 |
|
|
|
75 |
|
|
|
74 |
|
| Automobile loans |
|
|
— |
|
|
|
— |
|
|
|
— |
|
|
|
— |
|
|
|
— |
|
| Other consumer loans and leases |
|
|
— |
|
|
|
— |
|
|
|
— |
|
|
|
— |
|
|
|
— |
|
|
|
|
|
|
|
|
|
|
|
|
|
|
|
|
|
|
|
|
|
|
| Total nonaccrual loans and leases (excludes restructured loans) |
|
$ |
269 |
|
|
$ |
305 |
|
|
$ |
323 |
|
|
$ |
398 |
|
|
$ |
387 |
|
| Restructured loans—commercial (nonaccrual)(c) |
|
|
214 |
|
|
|
201 |
|
|
|
202 |
|
|
|
209 |
|
|
|
228 |
|
| Restructured loans—consumer (nonaccrual) |
|
|
96 |
|
|
|
114 |
|
|
|
115 |
|
|
|
126 |
|
|
|
136 |
|
|
|
|
|
|
|
|
|
|
|
|
|
|
|
|
|
|
|
|
|
|
| Total nonaccrual portfolio loans and leases |
|
$ |
579 |
|
|
$ |
620 |
|
|
$ |
640 |
|
|
$ |
733 |
|
|
$ |
751 |
|
| Repossessed personal property |
|
|
18 |
|
|
|
19 |
|
|
|
18 |
|
|
|
6 |
|
|
|
7 |
|
| Other real estate owned(a) |
|
|
147 |
|
|
|
157 |
|
|
|
174 |
|
|
|
207 |
|
|
|
222 |
|
|
|
|
|
|
|
|
|
|
|
|
|
|
|
|
|
|
|
|
|
|
| Total nonperforming assets(b) |
|
$ |
744 |
|
|
$ |
796 |
|
|
$ |
832 |
|
|
$ |
946 |
|
|
$ |
980 |
|
| Nonaccrual loans held for sale |
|
|
24 |
|
|
|
4 |
|
|
|
5 |
|
|
|
3 |
|
|
|
6 |
|
| Restructured loans—(nonaccrual) held for sale |
|
|
15 |
|
|
|
3 |
|
|
|
— |
|
|
|
— |
|
|
|
— |
|
|
|
|
|
|
|
|
|
|
|
|
|
|
|
|
|
|
|
|
|
|
| Total nonperforming assets including loans held for sale |
|
$ |
783 |
|
|
$ |
803 |
|
|
$ |
837 |
|
|
$ |
949 |
|
|
$ |
986 |
|
|
|
|
|
|
|
|
|
|
|
|
|
|
|
|
|
|
|
|
|
|
| Restructured Consumer loans and leases (accrual) |
|
$ |
905 |
|
|
$ |
1,610 |
|
|
$ |
1,623 |
|
|
$ |
1,682 |
|
|
$ |
1,685 |
|
| Restructured Commercial loans and leases (accrual)(c) |
|
$ |
844 |
|
|
$ |
885 |
|
|
$ |
914 |
|
|
$ |
847 |
|
|
$ |
869 |
|
| Total loans and leases 90 days past due |
|
$ |
87 |
|
|
$ |
87 |
|
|
$ |
94 |
|
|
$ |
94 |
|
|
$ |
103 |
|
| Nonperforming loans and leases as a percent of portfolio loans, leases and other assets, including other real estate owned(b) |
|
|
0.64 |
% |
|
|
0.68 |
% |
|
|
0.70 |
% |
|
|
0.82 |
% |
|
|
0.84 |
% |
| Nonperforming assets as a percent of portfolio loans, leases and other assets, including other real estate owned(b) |
|
|
0.82 |
% |
|
|
0.88 |
% |
|
|
0.92 |
% |
|
|
1.05 |
% |
|
|
1.10 |
% |
| (a) |
Excludes government insured advances. |
| (b) |
Does not include nonaccrual loans held for sale. |
| (c) |
Excludes $21 million of restructured nonaccrual loans and $7 million of restructured accruing loans as of December 31, 2014, September 30, 2014, June 30, 2014, and March 31, 2014 and
excludes $21 million of restructured nonaccrual loans and $8 million of restructured accruing loans as of December 31, 2013 associated with a consolidated variable interest entity in which the Bancorp has no continuing credit risk.
|
Total nonperforming assets, including loans held-for-sale, were $783 million, a decline of $20 million, or 3 percent, from the previous
quarter. Nonperforming loans (NPLs) at quarter-end were $579 million or 0.64 percent of total loans, leases and OREO, and decreased $41 million, or 7 percent, from the previous quarter. The fourth quarter NPLs declined $24 million related to the
transfer of residential mortgage loans classified as troubled debt restructurings to held-for-sale.
Commercial NPAs were $461 million, or 0.85 percent of
commercial loans, leases and OREO, and decreased $26 million, or 5 percent, from the third quarter. Commercial NPLs were $367 million, or 0.68 percent of commercial loans and leases, and decreased $18 million from last quarter. C&I NPAs of
$246 million decreased $32 million from the prior quarter. Commercial mortgage NPAs were $195 million, up $9 million from the previous quarter. Commercial construction NPAs were $16 million, a decrease of $3 million from the previous quarter.
Commercial lease NPAs were $4 million, flat from the previous quarter. Commercial NPAs included $214 million of nonaccrual troubled debt restructurings (TDRs), compared with $201 million last quarter.
13
Consumer NPAs of $283 million, or 0.78 percent of consumer loans, leases and OREO, decreased $26 million from the
third quarter. Consumer NPLs were $212 million, or 0.59 percent of consumer loans and leases and decreased $23 million from last quarter. The declines in consumer NPAs and NPLs were driven by the residential mortgage loans moved to held-for-sale in
the fourth quarter. Residential mortgage NPAs were $126 million, $38 million lower than last quarter reflecting the aforementioned NPAs moved to held-for-sale. Home equity NPAs of $108 million increased $7 million sequentially and credit card NPAs
of $41 million were up $4 million compared with the previous quarter. Consumer nonaccrual TDRs were $96 million in the fourth quarter of 2014, compared with $114 million in the third quarter of 2014.
Fourth quarter OREO balances included in NPA balances were $147 million, down $10 million from the third quarter, and included $83 million in commercial OREO
and $64 million in consumer OREO. Repossessed personal property of $18 million decreased $1 million from the prior quarter.
Loans over 90 days past
due and still accruing were $87 million, flat from the third quarter of 2014. Commercial balances over 90 days past due were less than $1 million compared with $1 million in the prior quarter, and consumer balances 90 days past due of
$87 million were up $1 million from the previous quarter. Loans 30-89 days past due of $250 million were down $29 million from the previous quarter. Commercial balances 30-89 days past due of $16 million were down $1 million sequentially and
consumer balances 30-89 days past due of $234 million decreased $28 million from the third quarter. The above delinquencies figures exclude nonaccruals described previously.
14
Capital Position
|
|
|
|
|
|
|
|
|
|
|
|
|
|
|
|
|
|
|
|
|
| |
|
For the Three Months Ended |
|
| |
|
December
2014 |
|
|
September
2014 |
|
|
June
2014 |
|
|
March
2014 |
|
|
December
2013 |
|
| Capital Position |
|
|
|
|
|
|
|
|
|
|
|
|
|
| Average shareholders’ equity to average assets |
|
|
11.54 |
% |
|
|
11.71 |
% |
|
|
11.57 |
% |
|
|
11.53 |
% |
|
|
11.51 |
% |
| Tangible equity(a) |
|
|
9.41 |
% |
|
|
9.65 |
% |
|
|
9.77 |
% |
|
|
9.61 |
% |
|
|
9.44 |
% |
| Tangible common equity (excluding unrealized gains/losses)(a) |
|
|
8.43 |
% |
|
|
8.64 |
% |
|
|
8.74 |
% |
|
|
8.79 |
% |
|
|
8.63 |
% |
| Tangible common equity (including unrealized gains/losses)(a) |
|
|
8.71 |
% |
|
|
8.84 |
% |
|
|
9.00 |
% |
|
|
8.93 |
% |
|
|
8.69 |
% |
| Tangible common equity as a percent of risk-weighted assets (excluding unrealized gains/losses)(a)(b) |
|
|
9.70 |
% |
|
|
9.70 |
% |
|
|
9.67 |
% |
|
|
9.57 |
% |
|
|
9.52 |
% |
| Regulatory capital ratios:(c) |
|
|
|
|
|
|
|
|
|
|
|
|
|
|
|
|
|
|
|
|
| Tier I risk-based capital |
|
|
10.83 |
% |
|
|
10.83 |
% |
|
|
10.80 |
% |
|
|
10.45 |
% |
|
|
10.43 |
% |
| Total risk-based capital |
|
|
14.33 |
% |
|
|
14.34 |
% |
|
|
14.30 |
% |
|
|
14.02 |
% |
|
|
14.17 |
% |
| Tier I leverage |
|
|
9.66 |
% |
|
|
9.82 |
% |
|
|
9.86 |
% |
|
|
9.71 |
% |
|
|
9.73 |
% |
| Tier I common equity(a) |
|
|
9.65 |
% |
|
|
9.64 |
% |
|
|
9.61 |
% |
|
|
9.51 |
% |
|
|
9.45 |
% |
| Book value per share |
|
|
17.35 |
|
|
|
16.87 |
|
|
|
16.74 |
|
|
|
16.27 |
|
|
|
15.85 |
|
| Tangible book value per share(a) |
|
|
14.40 |
|
|
|
13.95 |
|
|
|
13.86 |
|
|
|
13.40 |
|
|
|
13.00 |
|
| (a) |
The tangible equity, tangible common equity, tier I common equity and tangible book value per share ratios, while not required by accounting principles generally accepted in the United States of America (U.S. GAAP),
are considered to be critical metrics with which to analyze banks. The ratios have been included herein to facilitate a greater understanding of the Bancorp’s capital structure and financial condition. See the Regulation G Non-GAAP
Reconciliation table for a reconciliation of these ratios to U.S. GAAP. |
| (b) |
Under the banking agencies risk-based capital guidelines, assets and credit equivalent amounts of derivatives and off-balance sheet exposures are assigned to broad risk categories. The aggregate dollar amount in each
risk category is multiplied by the associated risk weight of the category. The resulting weighted values are added together resulting in the Bancorp’s total risk weighted assets. |
| (c) |
Current period regulatory capital data ratios are estimated. |
Capital ratios remained strong during the
quarter, reflecting growth in retained earnings, the payment of preferred dividends, and share repurchase activity. Compared with the prior quarter, the Tier 1 common equity ratio* of 9.65 percent increased 1 bp. The tangible common equity to
tangible assets ratio* was 8.43 percent (excluding unrealized gains/losses) and 8.71 percent (including unrealized gains/losses). The Tier 1 risk-based capital ratio was 10.83 percent and was flat compared to the prior quarter. The total risk-based
capital ratio decreased 1 bps to 14.33 percent and the Leverage ratio decreased 16 bps to 9.66 percent.
Our current estimate of the pro-forma fully
phased in Tier I common equity ratio at December 31, 2014 under the final capital rule, assuming the Company elected to maintain the current treatment of AOCI components in capital, would be approximately 9.4 percent**. This would compare
with 9.7 percent* as calculated under the currently prevailing Basel I capital framework. Were Fifth Third to make the election to include AOCI components in capital, the December 31, 2014 pro forma Basel III Tier 1 common ratio would be
increased by approximately 35 bps. Fifth Third’s pro forma Tier 1 common equity ratio exceeds the minimum buffered Tier 1 common equity ratio of 7 percent, comprising a minimum of 4.5 percent plus a capital conservation buffer of 2.5 percent.
The pro forma Tier 1 common equity ratio does not include the effect of any mitigating actions the Bancorp may undertake to offset any impact of the final capital rules.
| * |
Non-GAAP measure; see Reg. G reconciliation on page 33. |
| ** |
Capital ratios estimated; presented under current U.S. capital regulations. The pro forma Basel III Tier I common equity ratio is management’s estimate based upon its current interpretation of the Basel III
Final Rule approved in July 2013. |
15
Book value per share at December 31, 2014 was $17.35 and tangible book value per share* was $14.40, compared
with the September 30, 2014 book value per share of $16.87 and tangible book value per share of $13.95.
As previously announced, Fifth Third entered
into a share repurchase agreement with a counterparty on October 20, 2014, whereby Fifth Third would purchase approximately $180 million of its outstanding common stock. This transaction reduced Fifth Third’s fourth quarter share count by
8.34 million shares on October 23, 2014. Settlement of the forward contract related to this agreement occurred on January 5, 2015 and an additional 0.79 million shares were repurchased upon completion of the agreement. In
addition, the settlement of the forward contract related to the July 21, 2014 $225 million share repurchase agreement occurred on October 14, 2014. An additional 1.90 million shares were repurchased upon completion of the agreement.
In total, the incremental impact to the average diluted share count in the fourth quarter of 2014 was approximately 10.53 million shares due to share repurchase transactions in the third and fourth quarters of 2014.
Tax Rate
The effective tax rate was 25.9 percent this
quarter compared with 26.7 percent in the third quarter of 2014 and 28.4 percent in the fourth quarter of 2013.
Other
Fifth Third Bank owns 43 million units representing a 22.8 percent interest in Vantiv Holding, LLC, convertible into shares of Vantiv, Inc., a publicly
traded firm (NYSE: VNTV). Based upon Vantiv’s closing price of $33.92 on December 31, 2014, our interest in Vantiv was valued at approximately $1.5 billion. Next month in our 10-K, we will update our disclosure of the carrying value of our
interest in Vantiv stock, which was $388 million as of September 30, 2014. The difference between the market value and the book value of Fifth Third’s interest in Vantiv’s shares is not recognized in Fifth Third’s equity or
capital. Additionally, Fifth Third has a warrant to purchase additional shares in Vantiv which is carried as a derivative asset at a fair value of $415 million as of December 31, 2014.
Conference Call
Fifth Third will host a conference call
to discuss these financial results at 9:00 a.m. (Eastern Time) today. This conference call will be webcast live by Thomson Financial and may be accessed through the Fifth Third Investor Relations website at www.53.com (click on “About
Fifth Third” then “Investor Relations”). Institutional investors can access the call via Thomson Financial’s password-protected event management site, StreetEvents (www.streetevents.com).
Those unable to listen to the live webcast may access a webcast replay through the Fifth Third Investor Relations website at the same web address.
Additionally, a telephone replay of the conference call will be available beginning approximately two hours after the conference call until Wednesday, February 4, 2015 by dialing 800-585-8367 for domestic access or 404-537-3406 for
international access (passcode 46038333#).
| * |
Non-GAAP measure; see Reg. G reconciliation on page 33. |
16
Corporate Profile
Fifth Third Bancorp is a diversified financial services company headquartered in Cincinnati, Ohio. As of December 31, 2014, the Company had $139 billion
in assets and operated 15 affiliates with 1,302 full-service Banking Centers, including 101 Bank Mart® locations, most open seven days a week, inside select grocery stores and 2,638 ATMs in
Ohio, Kentucky, Indiana, Michigan, Illinois, Florida, Tennessee, West Virginia, Pennsylvania, Missouri, Georgia and North Carolina. Fifth Third operates four main businesses: Commercial Banking, Branch Banking, Consumer Lending, and Investment
Advisors. Fifth Third also has a 22.8% interest in Vantiv Holding, LLC. Fifth Third is among the largest money managers in the Midwest and, as of December 31, 2014, had $308 billion in assets under care, of which it managed $27 billion for
individuals, corporations and not-for-profit organizations. Investor information and press releases can be viewed at www.53.com. Fifth Third’s common stock is traded on the
NASDAQ® Global Select Market under the symbol “FITB.”
Forward-Looking Statements
This news release contains statements that we believe are “forward-looking statements” within the meaning of Section 27A of the
Securities Act of 1933, as amended, and Rule 175 promulgated thereunder, and Section 21E of the Securities Exchange Act of 1934, as amended, and Rule 3b-6 promulgated thereunder. These statements relate to our financial condition, results of
operations, plans, objectives, future performance or business. They usually can be identified by the use of forward-looking language such as “will likely result,” “may,” “are expected to,” “is anticipated,”
“estimate,” “forecast,” “projected,” “intends to,” or may include other similar words or phrases such as “believes,” “plans,” “trend,” “objective,” “continue,”
“remain,” or similar expressions, or future or conditional verbs such as “will,” “would,” “should,” “could,” “might,” “can,” or similar verbs. You should not place undue reliance
on these statements, as they are subject to risks and uncertainties, including but not limited to the risk factors set forth in our most recent Annual Report on Form 10-K as updated by our Quarterly Reports on Form 10-Q. When considering these
forward-looking statements, you should keep in mind these risks and uncertainties, as well as any cautionary statements we may make. Moreover, you should treat these statements as speaking only as of the date they are made and based only on
information then actually known to us.
There are a number of important factors that could cause future results to differ materially from
historical performance and these forward-looking statements. Factors that might cause such a difference include, but are not limited to: (1) general economic conditions and weakening in the economy, specifically the real estate market, either
nationally or in the states in which Fifth Third, one or more acquired entities and/or the combined company do business, are less favorable than expected; (2) deteriorating credit quality; (3) political developments, wars or other
hostilities may disrupt or increase volatility in securities markets or other economic conditions; (4) changes in the interest rate environment reduce interest margins; (5) prepayment speeds, loan origination and sale volumes, charge-offs
and loan loss provisions; (6) Fifth Third’s ability to maintain required capital levels and adequate sources of funding and liquidity; (7) maintaining capital requirements and adequate sources of funding and liquidity may limit Fifth
Third’s operations and potential growth; (8) changes and trends in capital markets; (9) problems encountered by larger or similar financial institutions may adversely affect the banking industry and/or Fifth Third;
(10) competitive pressures among depository institutions increase significantly; (11) effects of critical accounting policies and judgments; (12) changes in accounting policies or procedures as may be required by the Financial
Accounting Standards Board (FASB) or other regulatory agencies; (13) legislative or regulatory changes or actions, or significant litigation, adversely affect Fifth Third, one or more acquired entities and/or the combined company or the
businesses in which Fifth Third, one or more acquired entities and/or the combined company are engaged, including the Dodd-Frank Wall Street Reform and Consumer Protection Act; (14) ability to maintain favorable ratings from rating agencies;
(15) fluctuation of Fifth Third’s stock price; (16) ability to attract and retain key personnel; (17) ability to receive dividends from its subsidiaries; (18) potentially dilutive effect of future acquisitions on current
shareholders’ ownership of Fifth Third; (19) effects of accounting or financial results of one or more acquired entities; (20) difficulties from Fifth Third’s investment in, relationship with, and nature of the operations of
Vantiv, LLC; (21) loss of income from any sale or potential sale of businesses that could have an adverse effect on Fifth Third’s earnings and future growth; (22) ability to secure confidential information and deliver products and
services through the use of computer systems and telecommunications networks; and (23) the impact of reputational risk created by these developments on such matters as business generation and retention, funding and liquidity.
You should refer to our periodic and current reports filed with the Securities and Exchange Commission, or “SEC,” for further information on
other factors, which could cause actual results to be significantly different from those expressed or implied by these forward-looking statements.
# # #
17
Quarterly Financial Review for December 31, 2014
Table of Contents
|
|
|
|
|
| Financial Highlights |
|
|
19-20 |
|
| Consolidated Statements of Income |
|
|
21 |
|
| Consolidated Statements of Income (Taxable Equivalent) |
|
|
22 |
|
| Consolidated Balance Sheets |
|
|
23-24 |
|
| Consolidated Statements of Changes in Equity |
|
|
25 |
|
| Average Balance Sheet and Yield Analysis |
|
|
26-28 |
|
| Summary of Loans and Leases |
|
|
29 |
|
| Regulatory Capital |
|
|
30 |
|
| Summary of Credit Loss Experience |
|
|
31 |
|
| Asset Quality |
|
|
32 |
|
| Regulation G Non-GAAP Reconciliation |
|
|
33 |
|
| Segment Presentation |
|
|
34 |
|
18
Fifth Third Bancorp and Subsidiaries
Financial Highlights
$ in millions, except per share data
(unaudited)
|
|
|
|
|
|
|
|
|
|
|
|
|
|
|
|
|
|
|
|
|
|
|
|
|
|
|
|
|
|
|
|
|
| |
|
For the Three Months Ended |
|
|
% Change |
|
|
Year to Date |
|
|
% Change |
|
| |
|
December
2014 |
|
|
September
2014 |
|
|
December
2013 |
|
|
Seq |
|
|
Yr/Yr |
|
|
December
2014 |
|
|
December
2013 |
|
|
Yr/Yr |
|
| Income Statement Data |
|
|
|
|
|
|
|
|
|
|
|
|
|
|
|
|
|
|
|
|
|
|
|
|
|
|
|
|
|
|
|
|
| Net interest income(a) |
|
$ |
888 |
|
|
$ |
908 |
|
|
$ |
905 |
|
|
|
(2 |
%) |
|
|
(2 |
%) |
|
$ |
3,600 |
|
|
$ |
3,581 |
|
|
|
1 |
% |
| Noninterest income |
|
|
653 |
|
|
|
520 |
|
|
|
703 |
|
|
|
26 |
% |
|
|
(7 |
%) |
|
|
2,473 |
|
|
|
3,227 |
|
|
|
(23 |
%) |
| Total revenue(a) |
|
|
1,541 |
|
|
|
1,428 |
|
|
|
1,608 |
|
|
|
8 |
% |
|
|
(4 |
%) |
|
|
6,073 |
|
|
|
6,808 |
|
|
|
(11 |
%) |
| Provision for loan and lease losses |
|
|
99 |
|
|
|
71 |
|
|
|
53 |
|
|
|
40 |
% |
|
|
87 |
% |
|
|
315 |
|
|
|
229 |
|
|
|
38 |
% |
| Noninterest expense |
|
|
918 |
|
|
|
888 |
|
|
|
989 |
|
|
|
3 |
% |
|
|
(7 |
%) |
|
|
3,709 |
|
|
|
3,961 |
|
|
|
(6 |
%) |
| Net income attributable to Bancorp |
|
|
385 |
|
|
|
340 |
|
|
|
402 |
|
|
|
13 |
% |
|
|
(4 |
%) |
|
|
1,481 |
|
|
|
1,836 |
|
|
|
(19 |
%) |
| Net income available to common shareholders |
|
|
362 |
|
|
|
328 |
|
|
|
383 |
|
|
|
10 |
% |
|
|
(6 |
%) |
|
|
1,414 |
|
|
|
1,799 |
|
|
|
(21 |
%) |
| Common Share Data |
|
|
|
|
|
|
|
|
|
|
|
|
|
|
|
|
|
|
|
|
|
|
|
|
|
|
|
|
|
|
|
|
| Earnings per share, basic |
|
$ |
0.44 |
|
|
$ |
0.39 |
|
|
$ |
0.44 |
|
|
|
13 |
% |
|
|
— |
|
|
$ |
1.68 |
|
|
$ |
2.05 |
|
|
|
(18 |
%) |
| Earnings per share, diluted |
|
|
0.43 |
|
|
|
0.39 |
|
|
|
0.43 |
|
|
|
10 |
% |
|
|
— |
|
|
|
1.66 |
|
|
|
2.02 |
|
|
|
(17 |
%) |
| Cash dividends per common share |
|
|
0.13 |
|
|
|
0.13 |
|
|
|
0.12 |
|
|
|
— |
|
|
|
8 |
% |
|
|
0.51 |
|
|
|
0.47 |
|
|
|
9 |
% |
| Book value per share |
|
|
17.35 |
|
|
|
16.87 |
|
|
|
15.85 |
|
|
|
3 |
% |
|
|
9 |
% |
|
|
17.35 |
|
|
|
15.85 |
|
|
|
9 |
% |
| Market price per share |
|
|
20.38 |
|
|
|
20.02 |
|
|
|
21.03 |
|
|
|
2 |
% |
|
|
(3 |
%) |
|
|
20.38 |
|
|
|
21.03 |
|
|
|
(3 |
%) |
| Common shares outstanding (in thousands) |
|
|
824,047 |
|
|
|
834,262 |
|
|
|
855,306 |
|
|
|
(1 |
%) |
|
|
(4 |
%) |
|
|
824,047 |
|
|
|
855,306 |
|
|
|
(4 |
%) |
| Average common shares outstanding (in thousands): |
|
|
|
|
|
|
|
|
|
|
|
|
|
|
|
|
|
|
|
|
|
|
|
|
|
|
|
|
|
|
|
|
| Basic |
|
|
819,057 |
|
|
|
829,392 |
|
|
|
868,077 |
|
|
|
(1 |
%) |
|
|
(6 |
%) |
|
|
833,116 |
|
|
|
869,463 |
|
|
|
(4 |
%) |
| Diluted |
|
|
827,831 |
|
|
|
838,324 |
|
|
|
877,511 |
|
|
|
(1 |
%) |
|
|
(6 |
%) |
|
|
842,967 |
|
|
|
894,736 |
|
|
|
(6 |
%) |
| Market capitalization |
|
$ |
16,790 |
|
|
$ |
16,702 |
|
|
$ |
17,987 |
|
|
|
1 |
% |
|
|
(7 |
%) |
|
$ |
16,790 |
|
|
$ |
17,987 |
|
|
|
(7 |
%) |
| Financial Ratios |
|
|
|
|
|
|
|
|
|
|
|
|
|
|
|
|
|
|
|
|
|
|
|
|
|
|
|
|
|
|
|
|
| Return on average assets |
|
|
1.13 |
% |
|
|
1.02 |
% |
|
|
1.24 |
% |
|
|
10 |
% |
|
|
(10 |
%) |
|
|
1.12 |
% |
|
|
1.48 |
% |
|
|
(24 |
%) |
| Return on average common equity |
|
|
10.0 |
% |
|
|
9.2 |
% |
|
|
10.8 |
% |
|
|
9 |
% |
|
|
(7 |
%) |
|
|
10.0 |
% |
|
|
13.1 |
% |
|
|
(24 |
%) |
| Return on average tangible common equity(b)(j) |
|
|
12.1 |
% |
|
|
11.1 |
% |
|
|
13.1 |
% |
|
|
9 |
% |
|
|
(8 |
%) |
|
|
12.2 |
% |
|
|
16.0 |
% |
|
|
(24 |
%) |
| Noninterest income as a percent of total revenue |
|
|
42 |
% |
|
|
36 |
% |
|
|
44 |
% |
|
|
16 |
% |
|
|
(3 |
%) |
|
|
41 |
% |
|
|
47 |
% |
|
|
(14 |
%) |
| Average Bancorp shareholders’ equity as a percent of average assets |
|
|
11.54 |
% |
|
|
11.71 |
% |
|
|
11.51 |
% |
|
|
(1 |
%) |
|
|
— |
|
|
|
11.59 |
% |
|
|
11.56 |
% |
|
|
— |
|
| Tangible common equity(c)(d)(j) |
|
|
8.43 |
% |
|
|
8.64 |
% |
|
|
8.63 |
% |
|
|
(2 |
%) |
|
|
(2 |
%) |
|
|
8.43 |
% |
|
|
8.63 |
% |
|
|
(2 |
%) |
| Net interest margin(a) |
|
|
2.96 |
% |
|
|
3.10 |
% |
|
|
3.21 |
% |
|
|
(5 |
%) |
|
|
(8 |
%) |
|
|
3.10 |
% |
|
|
3.32 |
% |
|
|
(6 |
%) |
| Efficiency(a) |
|
|
59.6 |
% |
|
|
62.1 |
% |
|
|
61.5 |
% |
|
|
(4 |
%) |
|
|
(3 |
%) |
|
|
61.1 |
% |
|
|
58.2 |
% |
|
|
5 |
% |
| Effective tax rate |
|
|
25.9 |
% |
|
|
26.7 |
% |
|
|
28.4 |
% |
|
|
(3 |
%) |
|
|
(9 |
%) |
|
|
26.9 |
% |
|
|
29.7 |
% |
|
|
(10 |
%) |
| Credit Quality |
|
|
|
|
|
|
|
|
|
|
|
|
|
|
|
|
|
|
|
|
|
|
|
|
|
|
|
|
|
|
|
|
| Net losses charged off |
|
$ |
191 |
|
|
$ |
115 |
|
|
$ |
148 |
|
|
|
67 |
% |
|
|
29 |
% |
|
$ |
575 |
|
|
$ |
501 |
|
|
|
15 |
% |
| Net losses charged off as a percent of average loans and leases |
|
|
0.83 |
% |
|
|
0.50 |
% |
|
|
0.67 |
% |
|
|
66 |
% |
|
|
25 |
% |
|
|
0.64 |
% |
|
|
0.58 |
% |
|
|
10 |
% |
| Allowance for loan and lease losses as a percent of portfolio loans and leases |
|
|
1.47 |
% |
|
|
1.56 |
% |
|
|
1.79 |
% |
|
|
(6 |
%) |
|
|
(18 |
%) |
|
|
1.47 |
% |
|
|
1.79 |
% |
|
|
(18 |
%) |
| Allowance for credit losses as a percent of portfolio loans and leases |
|
|
1.62 |
% |
|
|
1.71 |
% |
|
|
1.97 |
% |
|
|
(5 |
%) |
|
|
(18 |
%) |
|
|
1.62 |
% |
|
|
1.97 |
% |
|
|
(18 |
%) |
| Nonperforming assets as a percent of portfolio loans, leases and other assets, including other real estate owned(e) |
|
|
0.82 |
% |
|
|
0.88 |
% |
|
|
1.10 |
% |
|
|
(6 |
%) |
|
|
(25 |
%) |
|
|
0.82 |
% |
|
|
1.10 |
% |
|
|
(25 |
%) |
| Average Balances |
|
|
|
|
|
|
|
|
|
|
|
|
|
|
|
|
|
|
|
|
|
|
|
|
|
|
|
|
|
|
|
|
| Loans and leases, including held for sale |
|
$ |
91,581 |
|
|
$ |
91,428 |
|
|
$ |
88,865 |
|
|
|
— |
|
|
|
3 |
% |
|
$ |
91,127 |
|
|
$ |
89,093 |
|
|
|
2 |
% |
| Total securities and other short-term investments |
|
|
27,604 |
|
|
|
24,927 |
|
|
|
23,043 |
|
|
|
11 |
% |
|
|
20 |
% |
|
|
24,866 |
|
|
|
18,861 |
|
|
|
32 |
% |
| Total assets |
|
|
135,580 |
|
|
|
132,220 |
|
|
|
128,179 |
|
|
|
3 |
% |
|
|
6 |
% |
|
|
131,943 |
|
|
|
123,732 |
|
|
|
7 |
% |
| Transaction deposits(f) |
|
|
92,414 |
|
|
|
89,360 |
|
|
|
85,740 |
|
|
|
3 |
% |
|
|
8 |
% |
|
|
89,715 |
|
|
|
82,915 |
|
|
|
8 |
% |
| Core deposits(g) |
|
|
96,350 |
|
|
|
93,160 |
|
|
|
89,269 |
|
|
|
3 |
% |
|
|
8 |
% |
|
|
93,477 |
|
|
|
86,675 |
|
|
|
8 |
% |
| Wholesale funding(h) |
|
|
19,495 |
|
|
|
19,787 |
|
|
|
19,069 |
|
|
|
(1 |
%) |
|
|
2 |
% |
|
|
19,188 |
|
|
|
17,797 |
|
|
|
8 |
% |
| Bancorp shareholders’ equity |
|
|
15,644 |
|
|
|
15,486 |
|
|
|
14,757 |
|
|
|
1 |
% |
|
|
6 |
% |
|
|
15,290 |
|
|
|
14,302 |
|
|
|
7 |
% |
| Regulatory Capital Ratios(i) |
|
|
|
|
|
|
|
|
|
|
|
|
|
|
|
|
|
|
|
|
|
|
|
|
|
|
|
|
|
|
|
|
| Tier I risk-based capital |
|
|
10.83 |
% |
|
|
10.83 |
% |
|
|
10.43 |
% |
|
|
— |
|
|
|
4 |
% |
|
|
10.83 |
% |
|
|
10.43 |
% |
|
|
4 |
% |
| Total risk-based capital |
|
|
14.33 |
% |
|
|
14.34 |
% |
|
|
14.17 |
% |
|
|
— |
|
|
|
1 |
% |
|
|
14.33 |
% |
|
|
14.17 |
% |
|
|
1 |
% |
| Tier I leverage |
|
|
9.66 |
% |
|
|
9.82 |
% |
|
|
9.73 |
% |
|
|
(2 |
%) |
|
|
— |
|
|
|
9.66 |
% |
|
|
9.73 |
% |
|
|
— |
|
| Tier I common equity(d)(j) |
|
|
9.65 |
% |
|
|
9.64 |
% |
|
|
9.45 |
% |
|
|
— |
|
|
|
2 |
% |
|
|
9.65 |
% |
|
|
9.45 |
% |
|
|
2 |
% |
| Operations |
|
|
|
|
|
|
|
|
|
|
|
|
|
|
|
|
|
|
|
|
|
|
|
|
|
|
|
|
|
|
|
|
| Banking centers |
|
|
1,302 |
|
|
|
1,308 |
|
|
|
1,320 |
|
|
|
— |
|
|
|
(1 |
%) |
|
|
1,302 |
|
|
|
1,320 |
|
|
|
(1 |
%) |
| ATMs |
|
|
2,638 |
|
|
|
2,639 |
|
|
|
2,586 |
|
|
|
— |
|
|
|
2 |
% |
|
|
2,638 |
|
|
|
2,586 |
|
|
|
2 |
% |
| Full-time equivalent employees |
|
|
18,351 |
|
|
|
18,503 |
|
|
|
19,446 |
|
|
|
(1 |
%) |
|
|
(6 |
%) |
|
|
18,351 |
|
|
|
19,446 |
|
|
|
(6 |
%) |
| (a) |
Presented on a fully taxable equivalent basis. |
| (b) |
The return on average tangible common equity is calculated as tangible net income available to common shareholders excluding tax effected amortization of intangibles) divided by average tangible common equity
(average common equity less goodwill and intangible assets). |
| (c) |
The tangible common equity ratio is calculated as tangible common equity (shareholders’ equity less preferred stock, goodwill, intangible assets and accumulated other comprehensive income divided by tangible
assets (total assets less goodwill, intangible assets and accumulated other comprehensive income). |
| (d) |
The tangible common equity and tier I common equity ratios, while not required by U.S. GAAP, are considered to be important metrics with which to analyze a bank’s position. The ratios have been included herein
to facilitate a greater understanding of the Bancorp’s capital structure and financial condition. |
| (e) |
Excludes nonaccrual loans held for sale. |
| (f) |
Includes demand, interest checking, savings, money market and foreign office deposits of commercial customers. |
| (g) |
Includes transaction deposits plus other time deposits. |
| (h) |
Includes certificates $100,000 and over, other deposits, federal funds purchased, short-term borrowings and long-term debt. |
| (i) |
Current period regulatory capital ratios are estimates. |
| (j) |
Non-GAAP measure; see Reg. G reconciliation on page 33. |
19
Fifth Third Bancorp and Subsidiaries
Financial Highlights
$ in millions, except per share data
(unaudited)
|
|
|
|
|
|
|
|
|
|
|
|
|
|
|
|
|
|
|
|
|
| |
|
For the Three Months Ended |
|
| |
|
December
2014 |
|
|
September
2014 |
|
|
June
2014 |
|
|
March
2014 |
|
|
December
2013 |
|
| Income Statement Data |
|
|
|
|
|
|
|
|
|
|
|
|
|
|
|
|
|
|
|
|
| Net interest income(a) |
|
$ |
888 |
|
|
$ |
908 |
|
|
$ |
905 |
|
|
$ |
898 |
|
|
$ |
905 |
|
| Noninterest income |
|
|
653 |
|
|
|
520 |
|
|
|
736 |
|
|
|
564 |
|
|
|
703 |
|
| Total revenue(a) |
|
|
1,541 |
|
|
|
1,428 |
|
|
|
1,641 |
|
|
|
1,462 |
|
|
|
1,608 |
|
| Provision for loan and lease losses |
|
|
99 |
|
|
|
71 |
|
|
|
76 |
|
|
|
69 |
|
|
|
53 |
|
| Noninterest expense |
|
|
918 |
|
|
|
888 |
|
|
|
954 |
|
|
|
950 |
|
|
|
989 |
|
| Net income attributable to Bancorp |
|
|
385 |
|
|
|
340 |
|
|
|
439 |
|
|
|
318 |
|
|
|
402 |
|
| Net income available to common shareholders |
|
|
362 |
|
|
|
328 |
|
|
|
416 |
|
|
|
309 |
|
|
|
383 |
|
| Common Share Data |
|
|
|
|
|
|
|
|
|
|
|
|
|
|
|
|
|
|
|
|
| Earnings per share, basic |
|
$ |
0.44 |
|
|
$ |
0.39 |
|
|
$ |
0.49 |
|
|
$ |
0.36 |
|
|
$ |
0.44 |
|
| Earnings per share, diluted |
|
|
0.43 |
|
|
|
0.39 |
|
|
|
0.49 |
|
|
|
0.36 |
|
|
|
0.43 |
|
| Cash dividends per common share |
|
|
0.13 |
|
|
|
0.13 |
|
|
|
0.13 |
|
|
|
0.12 |
|
|
|
0.12 |
|
| Book value per share |
|
|
17.35 |
|
|
|
16.87 |
|
|
|
16.74 |
|
|
|
16.27 |
|
|
|
15.85 |
|
| Market price per share |
|
|
20.38 |
|
|
|
20.02 |
|
|
|
21.35 |
|
|
|
22.96 |
|
|
|
21.03 |
|
| Common shares outstanding (in thousands) |
|
|
824,047 |
|
|
|
834,262 |
|
|
|
844,489 |
|
|
|
847,569 |
|
|
|
855,306 |
|
| Average common shares outstanding (in thousands): |
|
|
|
|
|
|
|
|
|
|
|
|
|
|
|
|
|
|
|
|
| Basic |
|
|
819,057 |
|
|
|
829,392 |
|
|
|
838,492 |
|
|
|
845,860 |
|
|
|
868,077 |
|
| Diluted |
|
|
827,831 |
|
|
|
838,324 |
|
|
|
848,245 |
|
|
|
857,924 |
|
|
|
877,511 |
|
| Market capitalization |
|
$ |
16,790 |
|
|
$ |
16,702 |
|
|
$ |
18,030 |
|
|
$ |
19,456 |
|
|
$ |
17,987 |
|
| Financial Ratios |
|
|
|
|
|
|
|
|
|
|
|
|
|
|
|
|
|
|
|
|
| Return on average assets |
|
|
1.13 |
% |
|
|
1.02 |
% |
|
|
1.34 |
% |
|
|
1.00 |
% |
|
|
1.24 |
% |
| Return on average common equity |
|
|
10.0 |
% |
|
|
9.2 |
% |
|
|
11.9 |
% |
|
|
9.0 |
% |
|
|
10.8 |
% |
| Return on average tangible common equity(b)(j) |
|
|
12.1 |
% |
|
|
11.1 |
% |
|
|
14.4 |
% |
|
|
11.0 |
% |
|
|
13.1 |
% |
| Noninterest income as a percent of total revenue |
|
|
42 |
% |
|
|
36 |
% |
|
|
45 |
% |
|
|
39 |
% |
|
|
44 |
% |
| Average Bancorp shareholders’ equity as a percent of average assets |
|
|
11.54 |
% |
|
|
11.71 |
% |
|
|
11.57 |
% |
|
|
11.53 |
% |
|
|
11.51 |
% |
| Tangible common equity(c)(d)(j) |
|
|
8.43 |
% |
|
|
8.64 |
% |
|
|
8.74 |
% |
|
|
8.79 |
% |
|
|
8.63 |
% |
| Net interest margin(a) |
|
|
2.96 |
% |
|
|
3.10 |
% |
|
|
3.15 |
% |
|
|
3.22 |
% |
|
|
3.21 |
% |
| Efficiency(a) |
|
|
59.6 |
% |
|
|
62.1 |
% |
|
|
58.2 |
% |
|
|
64.9 |
% |
|
|
61.5 |
% |
| Effective tax rate |
|
|
25.9 |
% |
|
|
26.7 |
% |
|
|
27.6 |
% |
|
|
27.3 |
% |
|
|
28.4 |
% |
| Credit Quality |
|
|
|
|
|
|
|
|
|
|
|
|
|
|
|
|
|
|
|
|
| Net losses charged off |
|
$ |
191 |
|
|
$ |
115 |
|
|
$ |
101 |
|
|
$ |
168 |
|
|
$ |
148 |
|
| Net losses charged off as a percent of average loans and leases |
|
|
0.83 |
% |
|
|
0.50 |
% |
|
|
0.45 |
% |
|
|
0.76 |
% |
|
|
0.67 |
% |
| Allowance for loan and lease losses as a percent of portfolio loans and leases |
|
|
1.47 |
% |
|
|
1.56 |
% |
|
|
1.61 |
% |
|
|
1.65 |
% |
|
|
1.79 |
% |
| Allowance for credit losses as a percent of portfolio loans and leases |
|
|
1.62 |
% |
|
|
1.71 |
% |
|
|
1.77 |
% |
|
|
1.82 |
% |
|
|
1.97 |
% |
| Nonperforming assets as a percent of portfolio loans, leases and other assets, including other real estate owned(e) |
|
|
0.82 |
% |
|
|
0.88 |
% |
|
|
0.92 |
% |
|
|
1.05 |
% |
|
|
1.10 |
% |
| Average Balances |
|
|
|
|
|
|
|
|
|
|
|
|
|
|
|
|
|
|
|
|
| Loans and leases, including held for sale |
|
$ |
91,581 |
|
|
$ |
91,428 |
|
|
$ |
91,241 |
|
|
$ |
90,238 |
|
|
$ |
88,865 |
|
| Total securities and other short-term investments |
|
|
27,604 |
|
|
|
24,927 |
|
|
|
23,940 |
|
|
|
22,940 |
|
|
|
23,043 |
|
| Total assets |
|
|
135,580 |
|
|
|
132,220 |
|
|
|
130,965 |
|
|
|
128,930 |
|
|
|
128,179 |
|
| Transaction deposits(f) |
|
|
92,414 |
|
|
|
89,360 |
|
|
|
89,148 |
|
|
|
87,896 |
|
|
|
85,740 |
|
| Core deposits(g) |
|
|
96,350 |
|
|
|
93,160 |
|
|
|
92,841 |
|
|
|
91,512 |
|
|
|
89,269 |
|
| Wholesale funding(h) |
|
|
19,495 |
|
|
|
19,787 |
|
|
|
19,204 |
|
|
|
18,244 |
|
|
|
19,069 |
|
| Bancorp shareholders’ equity |
|
|
15,644 |
|
|
|
15,486 |
|
|
|
15,157 |
|
|
|
14,862 |
|
|
|
14,757 |
|
| Regulatory Capital Ratios(i) |
|
|
|
|
|
|
|
|
|
|
|
|
|
|
|
|
|
|
|
|
| Tier I risk-based capital |
|
|
10.83 |
% |
|
|
10.83 |
% |
|
|
10.80 |
% |
|
|
10.45 |
% |
|
|
10.43 |
% |
| Total risk-based capital |
|
|
14.33 |
% |
|
|
14.34 |
% |
|
|
14.30 |
% |
|
|
14.02 |
% |
|
|
14.17 |
% |
| Tier I leverage |
|
|
9.66 |
% |
|
|
9.82 |
% |
|
|
9.86 |
% |
|
|
9.71 |
% |
|
|
9.73 |
% |
| Tier I common equity(d)(j) |
|
|
9.65 |
% |
|
|
9.64 |
% |
|
|
9.61 |
% |
|
|
9.51 |
% |
|
|
9.45 |
% |
| Operations |
|
|
|
|
|
|
|
|
|
|
|
|
|
|
|
|
|
|
|
|
| Banking centers |
|
|
1,302 |
|
|
|
1,308 |
|
|
|
1,309 |
|
|
|
1,311 |
|
|
|
1,320 |
|
| ATMs |
|
|
2,638 |
|
|
|
2,639 |
|
|
|
2,619 |
|
|
|
2,614 |
|
|
|
2,586 |
|
| Full-time equivalent employees |
|
|
18,351 |
|
|
|
18,503 |
|
|
|
18,732 |
|
|
|
19,080 |
|
|
|
19,446 |
|
| (a) |
Presented on a fully taxable equivalent basis. |
| (b) |
The return on average tangible common equity is calculated as tangible net income available to common shareholders excluding tax effected amortization of intangibles) divided by average tangible common equity
(average common equity less goodwill and intangible assets). |
| (c) |
The tangible common equity ratio is calculated as tangible common equity (shareholders’ equity less preferred stock, goodwill, intangible assets and accumulated other comprehensive income divided by tangible
assets (total assets less goodwill, intangible assets and accumulated other comprehensive income). |
| (d) |
The tangible common equity and tier I common equity ratios, while not required by U.S. GAAP, are considered to be important metrics with which to analyze a bank’s position. The ratios have been included herein
to facilitate a greater understanding of the Bancorp’s capital structure and financial condition. |
| (e) |
Excludes nonaccrual loans held for sale. |
| (f) |
Includes demand, interest checking, savings, money market and foreign office deposits of commercial customers. |
| (g) |
Includes transaction deposits plus other time deposits. |
| (h) |
Includes certificates $100,000 and over, other deposits, federal funds purchased, short-term borrowings and long-term debt. |
| (i) |
Current period regulatory capital ratios are estimates. |
| (j) |
Non-GAAP measure; see Reg. G reconciliation on page 33. |
20
Fifth Third Bancorp and Subsidiaries
Consolidated Statements of Income
$ in millions
(unaudited)
|
|
|
|
|
|
|
|
|
|
|
|
|
|
|
|
|
|
|
|
|
|
|
|
|
|
|
|
|
|
|
|
|
| |
|
For the Three Months Ended |
|
|
% Change |
|
|
Year to Date |
|
|
% Change |
|
| |
|
December
2014 |
|
|
September
2014 |
|
|
December
2013 |
|
|
Seq |
|
|
Yr/Yr |
|
|
December
2014 |
|
|
December
2013 |
|
|
Yr/Yr |
|
| Interest Income |
|
|
|
|
|
|
|
|
|
|
|
|
|
|
|
|
|
|
|
|
|
|
|
|
|
|
|
|
|
|
|
|
| Interest and fees on loans and leases |
|
$ |
823 |
|
|
$ |
827 |
|
|
$ |
845 |
|
|
|
(1 |
%) |
|
|
(3 |
%) |
|
|
3,298 |
|
|
|
3,447 |
|
|
|
(4 |
%) |
| Interest on securities |
|
|
185 |
|
|
|
189 |
|
|
|
154 |
|
|
|
(2 |
%) |
|
|
20 |
% |
|
|
724 |
|
|
|
520 |
|
|
|
39 |
% |
| Interest on other short-term investments |
|
|
3 |
|
|
|
2 |
|
|
|
3 |
|
|
|
NM |
|
|
|
13 |
% |
|
|
8 |
|
|
|
6 |
|
|
|
30 |
% |
|
|
|
|
|
|
|
|
|
|
|
|
|
|
|
|
|
|
|
|
|
|
|
|
|
|
|
|
|
|
|
|
|
| Total interest income |
|
|
1,011 |
|
|
|
1,018 |
|
|
|
1,002 |
|
|
|
(1 |
%) |
|
|
1 |
% |
|
|
4,030 |
|
|
|
3,973 |
|
|
|
1 |
% |
| Interest Expense |
|
|
|
|
|
|
|
|
|
|
|
|
|
|
|
|
|
|
|
|
|
|
|
|
|
|
|
|
|
|
|
|
| Interest on deposits |
|
|
54 |
|
|
|
51 |
|
|
|
48 |
|
|
|
7 |
% |
|
|
15 |
% |
|
|
202 |
|
|
|
202 |
|
|
|
— |
|
| Interest on other short-term borrowings |
|
|
— |
|
|
|
1 |
|
|
|
1 |
|
|
|
(33 |
%) |
|
|
(56 |
%) |
|
|
2 |
|
|
|
6 |
|
|
|
(61 |
%) |
| Interest on long-term debt |
|
|
74 |
|
|
|
63 |
|
|
|
53 |
|
|
|
14 |
% |
|
|
36 |
% |
|
|
247 |
|
|
|
204 |
|
|
|
21 |
% |
|
|
|
|
|
|
|
|
|
|
|
|
|
|
|
|
|
|
|
|
|
|
|
|
|
|
|
|
|
|
|
|
|
| Total interest expense |
|
|
128 |
|
|
|
115 |
|
|
|
102 |
|
|
|
11 |
% |
|
|
25 |
% |
|
|
451 |
|
|
|
412 |
|
|
|
9 |
% |
|
|
|
|
|
|
|
|
|
|
|
|
|
|
|
|
|
|
|
|
|
|
|
|
|
|
|
|
|
|
|
|
|
| Net Interest Income |
|
|
883 |
|
|
|
903 |
|
|
|
900 |
|
|
|
(2 |
%) |
|
|
(2 |
%) |
|
|
3,579 |
|
|
|
3,561 |
|
|
|
1 |
% |
| Provision for loan and lease losses |
|
|
99 |
|
|
|
71 |
|
|
|
53 |
|
|
|
40 |
% |
|
|
87 |
% |
|
|
315 |
|
|
|
229 |
|
|
|
38 |
% |
|
|
|
|
|
|
|
|
|
|
|
|
|
|
|
|
|
|
|
|
|
|
|
|
|
|
|
|
|
|
|
|
|
| Net interest income after provision for loan and lease losses |
|
|
784 |
|
|
|
832 |
|
|
|
847 |
|
|
|
(6 |
%) |
|
|
(7 |
%) |
|
|
3,264 |
|
|
|
3,332 |
|
|
|
(2 |
%) |
| Noninterest Income |
|
|
|
|
|
|
|
|
|
|
|
|
|
|
|
|
|
|
|
|
|
|
|
|
|
|
|
|
|
|
|
|
| Service charges on deposits |
|
|
142 |
|
|
|
145 |
|
|
|
142 |
|
|
|
(2 |
%) |
|
|
— |
|
|
|
560 |
|
|
|
549 |
|
|
|
2 |
% |
| Corporate banking revenue |
|
|
120 |
|
|
|
100 |
|
|
|
94 |
|
|
|
20 |
% |
|
|
27 |
% |
|
|
430 |
|
|
|
400 |
|
|
|
7 |
% |
| Mortgage banking net revenue |
|
|
61 |
|
|
|
61 |
|
|
|
126 |
|
|
|
— |
|
|
|
(51 |
%) |
|
|
310 |
|
|
|
700 |
|
|
|
(56 |
%) |
| Investment advisory revenue |
|
|
100 |
|
|
|
103 |
|
|
|
98 |
|
|
|
(2 |
%) |
|
|
2 |
% |
|
|
407 |
|
|
|
393 |
|
|
|
4 |
% |
| Card and processing revenue |
|
|
76 |
|
|
|
75 |
|
|
|
71 |
|
|
|
2 |
% |
|
|
7 |
% |
|
|
295 |
|
|
|
272 |
|
|
|
8 |
% |
| Other noninterest income |
|
|
150 |
|
|
|
33 |
|
|
|
170 |
|
|
|
NM |
|
|
|
(13 |
%) |
|
|
450 |
|
|
|
879 |
|
|
|
(49 |
%) |
| Securities gains, net |
|
|
4 |
|
|
|
3 |
|
|
|
2 |
|
|
|
15 |
% |
|
|
NM |
|
|
|
21 |
|
|
|
21 |
|
|
|
4 |
% |
| Securities gains, net—non-qualifying hedges on mortgage servicing rights |
|
|
— |
|
|
|
— |
|
|
|
— |
|
|
|
— |
|
|
|
— |
|
|
|
— |
|
|
|
13 |
|
|
|
(100 |
%) |
|
|
|
|
|
|
|
|
|
|
|
|
|
|
|
|
|
|
|
|
|
|
|
|
|
|
|
|
|
|
|
|
|
| Total noninterest income |
|
|
653 |
|
|
|
520 |
|
|
|
703 |
|
|
|
26 |
% |
|
|
(7 |
%) |
|
|
2,473 |
|
|
|
3,227 |
|
|
|
(23 |
%) |
| Noninterest Expense |
|
|
|
|
|
|
|
|
|
|
|
|
|
|
|
|
|
|
|
|
|
|
|
|
|
|
|
|
|
|
|
|
| Salaries, wages and incentives |
|
|
366 |
|
|
|
357 |
|
|
|
388 |
|
|
|
3 |
% |
|
|
(6 |
%) |
|
|
1,449 |
|
|
|
1,581 |
|
|
|
(8 |
%) |
| Employee benefits |
|
|
79 |
|
|
|
75 |
|
|
|
78 |
|
|
|
5 |
% |
|
|
1 |
% |
|
|
334 |
|
|
|
357 |
|
|
|
(7 |
%) |
| Net occupancy expense |
|
|
77 |
|
|
|
78 |
|
|
|
77 |
|
|
|
(1 |
%) |
|
|
— |
|
|
|
313 |
|
|
|
307 |
|
|
|
2 |
% |
| Technology and communications |
|
|
54 |
|
|
|
53 |
|
|
|
53 |
|
|
|
2 |
% |
|
|
2 |
% |
|
|
212 |
|
|
|
204 |
|
|
|
4 |
% |
| Equipment expense |
|
|
30 |
|
|
|
30 |
|
|
|
29 |
|
|
|
— |
|
|
|
3 |
% |
|
|
121 |
|
|
|
114 |
|
|
|
6 |
% |
| Card and processing expense |
|
|
36 |
|
|
|
37 |
|
|
|
37 |
|
|
|
(1 |
%) |
|
|
(2 |
%) |
|
|
141 |
|
|
|
134 |
|
|
|
5 |
% |
| Other noninterest expense |
|
|
276 |
|
|
|
258 |
|
|
|
327 |
|
|
|
7 |
% |
|
|
(16 |
%) |
|
|
1,139 |
|
|
|
1,264 |
|
|
|
(10 |
%) |
|
|
|
|
|
|
|
|
|
|
|
|
|
|
|
|
|
|
|
|
|
|
|
|
|
|
|
|
|
|
|
|
|
| Total noninterest expense |
|
|
918 |
|
|
|
888 |
|
|
|
989 |
|
|
|
3 |
% |
|
|
(7 |
%) |
|
|
3,709 |
|
|
|
3,961 |
|
|
|
(6 |
%) |
| Income before income taxes |
|
|
519 |
|
|
|
464 |
|
|
|
561 |
|
|
|
11 |
% |
|
|
(8 |
%) |
|
|
2,028 |
|
|
|
2,598 |
|
|
|
(22 |
%) |
| Applicable income tax expense |
|
|
134 |
|
|
|
124 |
|
|
|
159 |
|
|
|
8 |
% |
|
|
(16 |
%) |
|
|
545 |
|
|
|
772 |
|
|
|
(29 |
%) |
|
|
|
|
|
|
|
|
|
|
|
|
|
|
|
|
|
|
|
|
|
|
|
|
|
|
|
|
|
|
|
|
|
| Net Income |
|
|
385 |
|
|
|
340 |
|
|
|
402 |
|
|
|
13 |
% |
|
|
(4 |
%) |
|
|
1,483 |
|
|
|
1,826 |
|
|
|
(19 |
%) |
| Less: Net income attributable to noncontrolling interests |
|
|
— |
|
|
|
— |
|
|
|
— |
|
|
|
NM |
|
|
|
NM |
|
|
|
2 |
|
|
|
(10 |
) |
|
|
NM |
|
|
|
|
|
|
|
|
|
|
|
|
|
|
|
|
|
|
|
|
|
|
|
|
|
|
|
|
|
|
|
|
|
|
| Net income attributable to Bancorp |
|
|
385 |
|
|
|
340 |
|
|
|
402 |
|
|
|
13 |
% |
|
|
(4 |
%) |
|
|
1,481 |
|
|
|
1,836 |
|
|
|
(19 |
%) |
| Dividends on preferred stock |
|
|
23 |
|
|
|
12 |
|
|
|
19 |
|
|
|
87 |
% |
|
|
19 |
% |
|
|
67 |
|
|
|
37 |
|
|
|
82 |
% |
|
|
|
|
|
|
|
|
|
|
|
|
|
|
|
|
|
|
|
|
|
|
|
|
|
|
|
|
|
|
|
|
|
| Net income available to common shareholders |
|
$ |
362 |
|
|
$ |
328 |
|
|
$ |
383 |
|
|
|
10 |
% |
|
|
(6 |
%) |
|
|
1,414 |
|
|
|
1,799 |
|
|
|
(21 |
%) |
|
|
|
|
|
|
|
|
|
|
|
|
|
|
|
|
|
|
|
|
|
|
|
|
|
|
|
|
|
|
|
|
|
21
Fifth Third Bancorp and Subsidiaries
Consolidated Statements of Income (Taxable Equivalent)
$ in
millions
(unaudited)
|
|
|
|
|
|
|
|
|
|
|
|
|
|
|
|
|
|
|
|
|
| |
|
For the Three Months Ended |
|
| |
|
December
2014 |
|
|
September
2014 |
|
|
June
2014 |
|
|
March
2014 |
|
|
December
2013 |
|
| Interest Income |
|
|
|
|
|
|
|
|
|
|
|
|
|
|
|
|
|
|
|
|
| Interest and fees on loans and leases |
|
$ |
823 |
|
|
$ |
827 |
|
|
$ |
826 |
|
|
$ |
823 |
|
|
$ |
845 |
|
| Interest on securities |
|
|
185 |
|
|
|
189 |
|
|
|
181 |
|
|
|
168 |
|
|
|
154 |
|
| Interest on other short-term investments |
|
|
3 |
|
|
|
2 |
|
|
|
1 |
|
|
|
2 |
|
|
|
3 |
|
|
|
|
|
|
|
|
|
|
|
|
|
|
|
|
|
|
|
|
|
|
| Total interest income |
|
|
1,011 |
|
|
|
1,018 |
|
|
|
1,008 |
|
|
|
993 |
|
|
|
1,002 |
|
| Taxable equivalent adjustment |
|
|
5 |
|
|
|
5 |
|
|
|
5 |
|
|
|
5 |
|
|
|
5 |
|
|
|
|
|
|
|
|
|
|
|
|
|
|
|
|
|
|
|
|
|
|
| Total interest income (taxable equivalent) |
|
|
1,016 |
|
|
|
1,023 |
|
|
|
1,013 |
|
|
|
998 |
|
|
|
1,007 |
|
| Interest Expense |
|
|
|
|
|
|
|
|
|
|
|
|
|
|
|
|
|
|
|
|
| Interest on deposits |
|
|
54 |
|
|
|
51 |
|
|
|
49 |
|
|
|
48 |
|
|
|
48 |
|
| Interest on other short-term borrowings |
|
|
— |
|
|
|
1 |
|
|
|
1 |
|
|
|
1 |
|
|
|
1 |
|
| Interest on long-term debt |
|
|
74 |
|
|
|
63 |
|
|
|
58 |
|
|
|
51 |
|
|
|
53 |
|
|
|
|
|
|
|
|
|
|
|
|
|
|
|
|
|
|
|
|
|
|
| Total interest expense |
|
|
128 |
|
|
|
115 |
|
|
|
108 |
|
|
|
100 |
|
|
|
102 |
|
|
|
|
|
|
|
|
|
|
|
|
|
|
|
|
|
|
|
|
|
|
| Net Interest Income (taxable equivalent) |
|
|
888 |
|
|
|
908 |
|
|
|
905 |
|
|
|
898 |
|
|
|
905 |
|
| Provision for loan and lease losses |
|
|
99 |
|
|
|
71 |
|
|
|
76 |
|
|
|
69 |
|
|
|
53 |
|
|
|
|
|
|
|
|
|
|
|
|
|
|
|
|
|
|
|
|
|
|
| Net interest income (taxable equivalent) after provision for loan and lease losses |
|
|
789 |
|
|
|
837 |
|
|
|
829 |
|
|
|
829 |
|
|
|
852 |
|
| Noninterest Income |
|
|
|
|
|
|
|
|
|
|
|
|
|
|
|
|
|
|
|
|
| Service charges on deposits |
|
|
142 |
|
|
|
145 |
|
|
|
139 |
|
|
|
133 |
|
|
|
142 |
|
| Corporate banking revenue |
|
|
120 |
|
|
|
100 |
|
|
|
107 |
|
|
|
104 |
|
|
|
94 |
|
| Mortgage banking net revenue |
|
|
61 |
|
|
|
61 |
|
|
|
78 |
|
|
|
109 |
|
|
|
126 |
|
| Investment advisory revenue |
|
|
100 |
|
|
|
103 |
|
|
|
102 |
|
|
|
102 |
|
|
|
98 |
|
| Card and processing revenue |
|
|
76 |
|
|
|
75 |
|
|
|
76 |
|
|
|
68 |
|
|
|
71 |
|
| Other noninterest income |
|
|
150 |
|
|
|
33 |
|
|
|
226 |
|
|
|
41 |
|
|
|
170 |
|
| Securities gains, net |
|
|
4 |
|
|
|
3 |
|
|
|
8 |
|
|
|
7 |
|
|
|
2 |
|
| Securities gains, net—non-qualifying hedges on mortgage servicing rights |
|
|
— |
|
|
|
— |
|
|
|
— |
|
|
|
— |
|
|
|
— |
|
|
|
|
|
|
|
|
|
|
|
|
|
|
|
|
|
|
|
|
|
|
| Total noninterest income |
|
|
653 |
|
|
|
520 |
|
|
|
736 |
|
|
|
564 |
|
|
|
703 |
|
| Noninterest Expense |
|
|
|
|
|
|
|
|
|
|
|
|
|
|
|
|
|
|
|
|
| Salaries, wages and incentives |
|
|
366 |
|
|
|
357 |
|
|
|
368 |
|
|
|
359 |
|
|
|
388 |
|
| Employee benefits |
|
|
79 |
|
|
|
75 |
|
|
|
79 |
|
|
|
101 |
|
|
|
78 |
|
| Net occupancy expense |
|
|
77 |
|
|
|
78 |
|
|
|
79 |
|
|
|
80 |
|
|
|
77 |
|
| Technology and communications |
|
|
54 |
|
|
|
53 |
|
|
|
52 |
|
|
|
53 |
|
|
|
53 |
|
| Equipment expense |
|
|
30 |
|
|
|
30 |
|
|
|
30 |
|
|
|
30 |
|
|
|
29 |
|
| Card and processing expense |
|
|
36 |
|
|
|
37 |
|
|
|
37 |
|
|
|
31 |
|
|
|
37 |
|
| Other noninterest expense |
|
|
276 |
|
|
|
258 |
|
|
|
309 |
|
|
|
296 |
|
|
|
327 |
|
|
|
|
|
|
|
|
|
|
|
|
|
|
|
|
|
|
|
|
|
|
| Total noninterest expense |
|
|
918 |
|
|
|
888 |
|
|
|
954 |
|
|
|
950 |
|
|
|
989 |
|
|
|
|
|
|
|
|
|
|
|
|
|
|
|
|
|
|
|
|
|
|
| Income before income taxes (taxable equivalent) |
|
|
524 |
|
|
|
469 |
|
|
|
611 |
|
|
|
443 |
|
|
|
566 |
|
| Taxable equivalent adjustment |
|
|
5 |
|
|
|
5 |
|
|
|
5 |
|
|
|
5 |
|
|
|
5 |
|
|
|
|
|
|
|
|
|
|
|
|
|
|
|
|
|
|
|
|
|
|
| Income before income taxes |
|
|
519 |
|
|
|
464 |
|
|
|
606 |
|
|
|
438 |
|
|
|
561 |
|
| Applicable income tax expense |
|
|
134 |
|
|
|
124 |
|
|
|
167 |
|
|
|
119 |
|
|
|
159 |
|
|
|
|
|
|
|
|
|
|
|
|
|
|
|
|
|
|
|
|
|
|
| Net Income |
|
|
385 |
|
|
|
340 |
|
|
|
439 |
|
|
|
319 |
|
|
|
402 |
|
| Less: Net Income attributable to noncontrolling interests |
|
|
— |
|
|
|
— |
|
|
|
— |
|
|
|
1 |
|
|
|
— |
|
|
|
|
|
|
|
|
|
|
|
|
|
|
|
|
|
|
|
|
|
|
| Net income attributable to Bancorp |
|
|
385 |
|
|
|
340 |
|
|
|
439 |
|
|
|
318 |
|
|
|
402 |
|
| Dividends on preferred stock |
|
|
23 |
|
|
|
12 |
|
|
|
23 |
|
|
|
9 |
|
|
|
19 |
|
|
|
|
|
|
|
|
|
|
|
|
|
|
|
|
|
|
|
|
|
|
| Net income available to common shareholders |
|
$ |
362 |
|
|
$ |
328 |
|
|
$ |
416 |
|
|
$ |
309 |
|
|
$ |
383 |
|
|
|
|
|
|
|
|
|
|
|
|
|
|
|
|
|
|
|
|
|
|
22
Fifth Third Bancorp and Subsidiaries
Consolidated Balance Sheets
$ in millions, except per share data
(unaudited)
|
|
|
|
|
|
|
|
|
|
|
|
|
|
|
|
|
|
|
|
|
| |
|
As of |
|
|
% Change |
|
| |
|
December
2014 |
|
|
September
2014 |
|
|
December
2013 |
|
|
Seq |
|
|
Yr/Yr |
|
| Assets |
|
|
|
|
|
|
|
|
|
|
|
|
|
|
|
|
|
|
|
|
| Cash and due from banks |
|
$ |
3,091 |
|
|
$ |
3,125 |
|
|
$ |
3,178 |
|
|
|
(1 |
%) |
|
|
(3 |
%) |
| Available-for-sale and other securities(a) |
|
|
22,408 |
|
|
|
22,912 |
|
|
|
18,597 |
|
|
|
(2 |
%) |
|
|
20 |
% |
| Held-to-maturity securities(b) |
|
|
187 |
|
|
|
191 |
|
|
|
208 |
|
|
|
(2 |
%) |
|
|
(10 |
%) |
| Trading securities |
|
|
360 |
|
|
|
389 |
|
|
|
343 |
|
|
|
(8 |
%) |
|
|
5 |
% |
| Other short-term investments |
|
|
7,914 |
|
|
|
3,637 |
|
|
|
5,116 |
|
|
|
NM |
|
|
|
55 |
% |
| Loans held for sale |
|
|
1,261 |
|
|
|
641 |
|
|
|
944 |
|
|
|
97 |
% |
|
|
34 |
% |
| Portfolio loans and leases: |
|
|
|
|
|
|
|
|
|
|
|
|
|
|
|
|
|
|
|
|
| Commercial and industrial loans |
|
|
40,765 |
|
|
|
41,072 |
|
|
|
39,316 |
|
|
|
(1 |
%) |
|
|
4 |
% |
| Commercial mortgage loans |
|
|
7,399 |
|
|
|
7,564 |
|
|
|
8,066 |
|
|
|
(2 |
%) |
|
|
(8 |
%) |
| Commercial construction loans |
|
|
2,069 |
|
|
|
1,702 |
|
|
|
1,039 |
|
|
|
22 |
% |
|
|
99 |
% |
| Commercial leases |
|
|
3,720 |
|
|
|
3,554 |
|
|
|
3,625 |
|
|
|
5 |
% |
|
|
3 |
% |
| Residential mortgage loans |
|
|
12,389 |
|
|
|
12,941 |
|
|
|
12,680 |
|
|
|
(4 |
%) |
|
|
(2 |
%) |
| Home equity |
|
|
8,886 |
|
|
|
8,987 |
|
|
|
9,246 |
|
|
|
(1 |
%) |
|
|
(4 |
%) |
| Automobile loans |
|
|
12,037 |
|
|
|
12,121 |
|
|
|
11,984 |
|
|
|
(1 |
%) |
|
|
— |
|
| Credit card |
|
|
2,401 |
|
|
|
2,317 |
|
|
|
2,294 |
|
|
|
4 |
% |
|
|
5 |
% |
| Other consumer loans and leases |
|
|
418 |
|
|
|
366 |
|
|
|
364 |
|
|
|
14 |
% |
|
|
15 |
% |
|
|
|
|
|
|
|
|
|
|
|
|
|
|
|
|
|
|
|
|
|
| Portfolio loans and leases |
|
|
90,084 |
|
|
|
90,624 |
|
|
|
88,614 |
|
|
|
(1 |
%) |
|
|
2 |
% |
| Allowance for loan and lease losses |
|
|
(1,322 |
) |
|
|
(1,414 |
) |
|
|
(1,582 |
) |
|
|
(7 |
%) |
|
|
(16 |
%) |
|
|
|
|
|
|
|
|
|
|
|
|
|
|
|
|
|
|
|
|
|
| Portfolio loans and leases, net |
|
|
88,762 |
|
|
|
89,210 |
|
|
|
87,032 |
|
|
|
(1 |
%) |
|
|
2 |
% |
| Bank premises and equipment |
|
|
2,465 |
|
|
|
2,467 |
|
|
|
2,531 |
|
|
|
— |
|
|
|
(3 |
%) |
| Operating lease equipment |
|
|
728 |
|
|
|
732 |
|
|
|
730 |
|
|
|
(1 |
%) |
|
|
— |
|
| Goodwill |
|
|
2,416 |
|
|
|
2,416 |
|
|
|
2,416 |
|
|
|
— |
|
|
|
— |
|
| Intangible assets |
|
|
15 |
|
|
|
16 |
|
|
|
19 |
|
|
|
(7 |
%) |
|
|
(24 |
%) |
| Servicing rights |
|
|
858 |
|
|
|
935 |
|
|
|
971 |
|
|
|
(8 |
%) |
|
|
(12 |
%) |
| Other assets |
|
|
8,241 |
|
|
|
7,517 |
|
|
|
8,358 |
|
|
|
10 |
% |
|
|
(1 |
%) |
|
|
|
|
|
|
|
|
|
|
|
|
|
|
|
|
|
|
|
|
|
| Total assets |
|
$ |
138,706 |
|
|
$ |
134,188 |
|
|
$ |
130,443 |
|
|
|
3 |
% |
|
|
6 |
% |
|
|
|
|
|
|
|
|
|
|
|
|
|
|
|
|
|
|
|
|
|
| Liabilities |
|
|
|
|
|
|
|
|
|
|
|
|
|
|
|
|
|
|
|
|
| Deposits: |
|
|
|
|
|
|
|
|
|
|
|
|
|
|
|
|
|
|
|
|
| Demand |
|
$ |
34,809 |
|
|
$ |
32,258 |
|
|
$ |
32,634 |
|
|
|
8 |
% |
|
|
7 |
% |
| Interest checking |
|
|
26,800 |
|
|
|
24,930 |
|
|
|
25,875 |
|
|
|
7 |
% |
|
|
4 |
% |
| Savings |
|
|
15,051 |
|
|
|
15,355 |
|
|
|
17,045 |
|
|
|
(2 |
%) |
|
|
(12 |
%) |
| Money market |
|
|
17,083 |
|
|
|
16,199 |
|
|
|
11,644 |
|
|
|
5 |
% |
|
|
47 |
% |
| Foreign office |
|
|
1,114 |
|
|
|
1,577 |
|
|
|
1,976 |
|
|
|
(29 |
%) |
|
|
(44 |
%) |
| Other time |
|
|
3,960 |
|
|
|
3,856 |
|
|
|
3,530 |
|
|
|
3 |
% |
|
|
12 |
% |
| Certificates—$100,000 and over |
|
|
2,895 |
|
|
|
3,117 |
|
|
|
6,571 |
|
|
|
(7 |
%) |
|
|
(56 |
%) |
| Other |
|
|
— |
|
|
|
— |
|
|
|
— |
|
|
|
NM |
|
|
|
NM |
|
|
|
|
|
|
|
|
|
|
|
|
|
|
|
|
|
|
|
|
|
|
| Total deposits |
|
|
101,712 |
|
|
|
97,292 |
|
|
|
99,275 |
|
|
|
5 |
% |
|
|
2 |
% |
| Federal funds purchased |
|
|
144 |
|
|
|
148 |
|
|
|
284 |
|
|
|
(2 |
%) |
|
|
(49 |
%) |
| Other short-term borrowings |
|
|
1,556 |
|
|
|
2,730 |
|
|
|
1,380 |
|
|
|
(43 |
%) |
|
|
13 |
% |
| Accrued taxes, interest and expenses |
|
|
2,020 |
|
|
|
1,706 |
|
|
|
1,758 |
|
|
|
18 |
% |
|
|
15 |
% |
| Other liabilities |
|
|
2,642 |
|
|
|
2,533 |
|
|
|
3,487 |
|
|
|
4 |
% |
|
|
(24 |
%) |
| Long-term debt |
|
|
14,967 |
|
|
|
14,336 |
|
|
|
9,633 |
|
|
|
4 |
% |
|
|
55 |
% |
|
|
|
|
|
|
|
|
|
|
|
|
|
|
|
|
|
|
|
|
|
| Total liabilities |
|
|
123,041 |
|
|
|
118,745 |
|
|
|
115,817 |
|
|
|
4 |
% |
|
|
6 |
% |
| Equity |
|
|
|
|
|
|
|
|
|
|
|
|
|
|
|
|
|
|
|
|
| Common stock(c) |
|
|
2,051 |
|
|
|
2,051 |
|
|
|
2,051 |
|
|
|
— |
|
|
|
— |
|
| Preferred stock |
|
|
1,331 |
|
|
|
1,331 |
|
|
|
1,034 |
|
|
|
— |
|
|
|
29 |
% |
| Capital surplus |
|
|
2,646 |
|
|
|
2,621 |
|
|
|
2,561 |
|
|
|
1 |
% |
|
|
3 |
% |
| Retained earnings |
|
|
11,141 |
|
|
|
10,886 |
|
|
|
10,156 |
|
|
|
2 |
% |
|
|
10 |
% |
| Accumulated other comprehensive income |
|
|
429 |
|
|
|
301 |
|
|
|
82 |
|
|
|
42 |
% |
|
|
NM |
|
| Treasury stock |
|
|
(1,972 |
) |
|
|
(1,786 |
) |
|
|
(1,295 |
) |
|
|
10 |
% |
|
|
52 |
% |
|
|
|
|
|
|
|
|
|
|
|
|
|
|
|
|
|
|
|
|
|
| Total Bancorp shareholders’ equity |
|
|
15,626 |
|
|
|
15,404 |
|
|
|
14,589 |
|
|
|
1 |
% |
|
|
7 |
% |
| Noncontrolling interests |
|
|
39 |
|
|
|
39 |
|
|
|
37 |
|
|
|
— |
|
|
|
3 |
% |
|
|
|
|
|
|
|
|
|
|
|
|
|
|
|
|
|
|
|
|
|
| Total Equity |
|
|
15,665 |
|
|
|
15,443 |
|
|
|
14,626 |
|
|
|
1 |
% |
|
|
7 |
% |
|
|
|
|
|
|
|
|
|
|
|
|
|
|
|
|
|
|
|
|
|
| Total liabilities and equity |
|
$ |
138,706 |
|
|
$ |
134,188 |
|
|
$ |
130,443 |
|
|
|
3 |
% |
|
|
6 |
% |
|
|
|
|
|
|
|
|
|
|
|
|
|
|
|
|
|
|
|
|
|
| (a) Amortized cost |
|
$ |
21,677 |
|
|
$ |
22,392 |
|
|
$ |
18,409 |
|
|
|
(3 |
%) |
|
|
18 |
% |
| (b) Market values |
|
|
187 |
|
|
|
191 |
|
|
|
208 |
|
|
|
(2 |
%) |
|
|
(10 |
%) |
| (c) Common shares, stated value $2.22 per share (in thousands): |
|
|
|
|
|
|
|
|
|
|
|
|
|
|
|
|
|
|
|
|
| Authorized |
|
|
2,000,000 |
|
|
|
2,000,000 |
|
|
|
2,000,000 |
|
|
|
— |
|
|
|
— |
|
| Outstanding, excluding treasury |
|
|
824,047 |
|
|
|
834,262 |
|
|
|
855,306 |
|
|
|
(1 |
%) |
|
|
(4 |
%) |
| Treasury |
|
|
99,846 |
|
|
|
89,631 |
|
|
|
68,587 |
|
|
|
11 |
% |
|
|
46 |
% |
23
Fifth Third Bancorp and Subsidiaries
Consolidated Balance Sheets
$ in millions, except per share data
(unaudited)
|
|
|
|
|
|
|
|
|
|
|
|
|
|
|
|
|
|
|
|
|
| |
|
As of |
|
| |
|
December
2014 |
|
|
September
2014 |
|
|
June
2014 |
|
|
March
2014 |
|
|
December
2013 |
|
| Assets |
|
|
|
|
|
|
|
|
|
|
|
|
|
|
|
|
|
|
|
|
| Cash and due from banks |
|
$ |
3,091 |
|
|
$ |
3,125 |
|
|
$ |
3,312 |
|
|
$ |
3,153 |
|
|
$ |
3,178 |
|
| Available-for-sale and other securities(a) |
|
|
22,408 |
|
|
|
22,912 |
|
|
|
22,814 |
|
|
|
20,749 |
|
|
|
18,597 |
|
| Held-to-maturity securities(b) |
|
|
187 |
|
|
|
191 |
|
|
|
194 |
|
|
|
195 |
|
|
|
208 |
|
| Trading securities |
|
|
360 |
|
|
|
389 |
|
|
|
361 |
|
|
|
347 |
|
|
|
343 |
|
| Other short-term investments |
|
|
7,914 |
|
|
|
3,637 |
|
|
|
2,386 |
|
|
|
2,202 |
|
|
|
5,116 |
|
| Loans held for sale |
|
|
1,261 |
|
|
|
641 |
|
|
|
682 |
|
|
|
780 |
|
|
|
944 |
|
| Portfolio loans and leases: |
|
|
|
|
|
|
|
|
|
|
|
|
|
|
|
|
|
|
|
|
| Commercial and industrial loans |
|
|
40,765 |
|
|
|
41,072 |
|
|
|
41,299 |
|
|
|
40,591 |
|
|
|
39,316 |
|
| Commercial mortgage loans |
|
|
7,399 |
|
|
|
7,564 |
|
|
|
7,805 |
|
|
|
7,958 |
|
|
|
8,066 |
|
| Commercial construction loans |
|
|
2,069 |
|
|
|
1,702 |
|
|
|
1,424 |
|
|
|
1,218 |
|
|
|
1,039 |
|
| Commercial leases |
|
|
3,720 |
|
|
|
3,554 |
|
|
|
3,567 |
|
|
|
3,577 |
|
|
|
3,625 |
|
| Residential mortgage loans |
|
|
12,389 |
|
|
|
12,941 |
|
|
|
12,652 |
|
|
|
12,626 |
|
|
|
12,680 |
|
| Home equity |
|
|
8,886 |
|
|
|
8,987 |
|
|
|
9,056 |
|
|
|
9,125 |
|
|
|
9,246 |
|
| Automobile loans |
|
|
12,037 |
|
|
|
12,121 |
|
|
|
12,050 |
|
|
|
12,088 |
|
|
|
11,984 |
|
| Credit card |
|
|
2,401 |
|
|
|
2,317 |
|
|
|
2,261 |
|
|
|
2,177 |
|
|
|
2,294 |
|
| Other consumer loans and leases |
|
|
418 |
|
|
|
366 |
|
|
|
370 |
|
|
|
345 |
|
|
|
364 |
|
|
|
|
|
|
|
|
|
|
|
|
|
|
|
|
|
|
|
|
|
|
| Portfolio loans and leases |
|
|
90,084 |
|
|
|
90,624 |
|
|
|
90,484 |
|
|
|
89,705 |
|
|
|
88,614 |
|
| Allowance for loan and lease losses |
|
|
(1,322 |
) |
|
|
(1,414 |
) |
|
|
(1,458 |
) |
|
|
(1,483 |
) |
|
|
(1,582 |
) |
|
|
|
|
|
|
|
|
|
|
|
|
|
|
|
|
|
|
|
|
|
| Portfolio loans and leases, net |
|
|
88,762 |
|
|
|
89,210 |
|
|
|
89,026 |
|
|
|
88,222 |
|
|
|
87,032 |
|
| Bank premises and equipment |
|
|
2,465 |
|
|
|
2,467 |
|
|
|
2,491 |
|
|
|
2,528 |
|
|
|
2,531 |
|
| Operating lease equipment |
|
|
728 |
|
|
|
732 |
|
|
|
667 |
|
|
|
714 |
|
|
|
730 |
|
| Goodwill |
|
|
2,416 |
|
|
|
2,416 |
|
|
|
2,416 |
|
|
|
2,416 |
|
|
|
2,416 |
|
| Intangible assets |
|
|
15 |
|
|
|
16 |
|
|
|
17 |
|
|
|
18 |
|
|
|
19 |
|
| Servicing rights |
|
|
858 |
|
|
|
935 |
|
|
|
931 |
|
|
|
975 |
|
|
|
971 |
|
| Other assets |
|
|
8,241 |
|
|
|
7,517 |
|
|
|
7,265 |
|
|
|
7,355 |
|
|
|
8,358 |
|
|
|
|
|
|
|
|
|
|
|
|
|
|
|
|
|
|
|
|
|
|
| Total assets |
|
$ |
138,706 |
|
|
$ |
134,188 |
|
|
$ |
132,562 |
|
|
$ |
129,654 |
|
|
$ |
130,443 |
|
|
|
|
|
|
|
|
|
|
|
|
|
|
|
|
|
|
|
|
|
|
| Liabilities |
|
|
|
|
|
|
|
|
|
|
|
|
|
|
|
|
|
|
|
|
| Deposits: |
|
|
|
|
|
|
|
|
|
|
|
|
|
|
|
|
|
|
|
|
| Demand |
|
$ |
34,809 |
|
|
$ |
32,258 |
|
|
$ |
32,140 |
|
|
$ |
31,234 |
|
|
$ |
32,634 |
|
| Interest checking |
|
|
26,800 |
|
|
|
24,930 |
|
|
|
24,744 |
|
|
|
25,472 |
|
|
|
25,875 |
|
| Savings |
|
|
15,051 |
|
|
|
15,355 |
|
|
|
16,087 |
|
|
|
16,867 |
|
|
|
17,045 |
|
| Money market |
|
|
17,083 |
|
|
|
16,199 |
|
|
|
14,216 |
|
|
|
13,208 |
|
|
|
11,644 |
|
| Foreign office |
|
|
1,114 |
|
|
|
1,577 |
|
|
|
1,418 |
|
|
|
1,922 |
|
|
|
1,976 |
|
| Other time |
|
|
3,960 |
|
|
|
3,856 |
|
|
|
3,724 |
|
|
|
3,660 |
|
|
|
3,530 |
|
| Certificates—$100,000 and over |
|
|
2,895 |
|
|
|
3,117 |
|
|
|
3,623 |
|
|
|
4,511 |
|
|
|
6,571 |
|
| Other |
|
|
— |
|
|
|
— |
|
|
|
— |
|
|
|
— |
|
|
|
— |
|
|
|
|
|
|
|
|
|
|
|
|
|
|
|
|
|
|
|
|
|
|
| Total deposits |
|
|
101,712 |
|
|
|
97,292 |
|
|
|
95,952 |
|
|
|
96,874 |
|
|
|
99,275 |
|
| Federal funds purchased |
|
|
144 |
|
|
|
148 |
|
|
|
153 |
|
|
|
268 |
|
|
|
284 |
|
| Other short-term borrowings |
|
|
1,556 |
|
|
|
2,730 |
|
|
|
3,146 |
|
|
|
2,717 |
|
|
|
1,380 |
|
| Accrued taxes, interest and expenses |
|
|
2,020 |
|
|
|
1,706 |
|
|
|
1,824 |
|
|
|
1,669 |
|
|
|
1,758 |
|
| Other liabilities |
|
|
2,642 |
|
|
|
2,533 |
|
|
|
2,018 |
|
|
|
2,029 |
|
|
|
3,487 |
|
| Long-term debt |
|
|
14,967 |
|
|
|
14,336 |
|
|
|
13,961 |
|
|
|
11,233 |
|
|
|
9,633 |
|
|
|
|
|
|
|
|
|
|
|
|
|
|
|
|
|
|
|
|
|
|
| Total liabilities |
|
|
123,041 |
|
|
|
118,745 |
|
|
|
117,054 |
|
|
|
114,790 |
|
|
|
115,817 |
|
| Equity |
|
|
|
|
|
|
|
|
|
|
|
|
|
|
|
|
|
|
|
|
| Common stock(c) |
|
|
2,051 |
|
|
|
2,051 |
|
|
|
2,051 |
|
|
|
2,051 |
|
|
|
2,051 |
|
| Preferred stock |
|
|
1,331 |
|
|
|
1,331 |
|
|
|
1,331 |
|
|
|
1,034 |
|
|
|
1,034 |
|
| Capital surplus |
|
|
2,646 |
|
|
|
2,621 |
|
|
|
2,613 |
|
|
|
2,674 |
|
|
|
2,561 |
|
| Retained earnings |
|
|
11,141 |
|
|
|
10,886 |
|
|
|
10,666 |
|
|
|
10,363 |
|
|
|
10,156 |
|
| Accumulated other comprehensive income |
|
|
429 |
|
|
|
301 |
|
|
|
382 |
|
|
|
196 |
|
|
|
82 |
|
| Treasury stock |
|
|
(1,972 |
) |
|
|
(1,786 |
) |
|
|
(1,574 |
) |
|
|
(1,492 |
) |
|
|
(1,295 |
) |
|
|
|
|
|
|
|
|
|
|
|
|
|
|
|
|
|
|
|
|
|
| Total Bancorp shareholders’ equity |
|
|
15,626 |
|
|
|
15,404 |
|
|
|
15,469 |
|
|
|
14,826 |
|
|
|
14,589 |
|
| Noncontrolling interests |
|
|
39 |
|
|
|
39 |
|
|
|
39 |
|
|
|
38 |
|
|
|
37 |
|
|
|
|
|
|
|
|
|
|
|
|
|
|
|
|
|
|
|
|
|
|
| Total Equity |
|
|
15,665 |
|
|
|
15,443 |
|
|
|
15,508 |
|
|
|
14,864 |
|
|
|
14,626 |
|
|
|
|
|
|
|
|
|
|
|
|
|
|
|
|
|
|
|
|
|
|
| Total liabilities and equity |
|
$ |
138,706 |
|
|
$ |
134,188 |
|
|
$ |
132,562 |
|
|
$ |
129,654 |
|
|
$ |
130,443 |
|
|
|
|
|
|
|
|
|
|
|
|
|
|
|
|
|
|
|
|
|
|
| (a) Amortized cost |
|
$ |
21,677 |
|
|
$ |
22,392 |
|
|
$ |
22,184 |
|
|
$ |
20,393 |
|
|
$ |
18,409 |
|
| (b) Market values |
|
|
187 |
|
|
|
191 |
|
|
|
194 |
|
|
|
195 |
|
|
|
208 |
|
| (c) Common shares, stated value $2.22 per share (in thousands): |
|
|
|
|
|
|
|
|
|
|
|
|
|
|
|
|
|
|
|
|
| Authorized |
|
|
2,000,000 |
|
|
|
2,000,000 |
|
|
|
2,000,000 |
|
|
|
2,000,000 |
|
|
|
2,000,000 |
|
| Outstanding, excluding treasury |
|
|
824,047 |
|
|
|
834,262 |
|
|
|
844,489 |
|
|
|
847,569 |
|
|
|
855,306 |
|
| Treasury |
|
|
99,846 |
|
|
|
89,631 |
|
|
|
79,404 |
|
|
|
76,324 |
|
|
|
68,587 |
|
24
Fifth Third Bancorp and Subsidiaries
Consolidated Statements of Changes in Equity
$ in millions
(unaudited)
|
|
|
|
|
|
|
|
|
|
|
|
|
|
|
|
|
| |
|
For the Three Months Ended |
|
|
Year to Date |
|
| |
|
December
2014 |
|
|
December
2013 |
|
|
December
2014 |
|
|
December
2013 |
|
| Total equity, beginning |
|
$ |
15,443 |
|
|
$ |
14,680 |
|
|
$ |
14,626 |
|
|
$ |
13,764 |
|
| Net income attributable to Bancorp |
|
|
385 |
|
|
|
402 |
|
|
|
1,481 |
|
|
|
1,836 |
|
| Other comprehensive income, net of tax: |
|
|
|
|
|
|
|
|
|
|
|
|
|
|
|
|
| Change in unrealized gains and (losses): |
|
|
|
|
|
|
|
|
|
|
|
|
|
|
|
|
| Available-for-sale securities |
|
|
137 |
|
|
|
(147 |
) |
|
|
354 |
|
|
|
(291 |
) |
| Qualifying cash flow hedges |
|
|
11 |
|
|
|
(18 |
) |
|
|
10 |
|
|
|
(37 |
) |
| Change in accumulated other comprehensive income related to employee benefit plans |
|
|
(20 |
) |
|
|
29 |
|
|
|
(17 |
) |
|
|
35 |
|
|
|
|
|
|
|
|
|
|
|
|
|
|
|
|
|
|
| Comprehensive income |
|
|
513 |
|
|
|
266 |
|
|
|
1,828 |
|
|
|
1,543 |
|
| Cash dividends declared: |
|
|
|
|
|
|
|
|
|
|
|
|
|
|
|
|
| Common stock |
|
|
(107 |
) |
|
|
(103 |
) |
|
|
(427 |
) |
|
|
(407 |
) |
| Preferred stock |
|
|
(23 |
) |
|
|
(19 |
) |
|
|
(67 |
) |
|
|
(37 |
) |
| Impact of stock transactions under stock compensation plans, net |
|
|
19 |
|
|
|
17 |
|
|
|
60 |
|
|
|
60 |
|
| Shares acquired for treasury |
|
|
(180 |
) |
|
|
(656 |
) |
|
|
(654 |
) |
|
|
(1,320 |
) |
| Issuance of preferred stock |
|
|
— |
|
|
|
442 |
|
|
|
297 |
|
|
|
1,035 |
|
| Noncontrolling interest |
|
|
— |
|
|
|
(1 |
) |
|
|
2 |
|
|
|
(11 |
) |
| Other |
|
|
— |
|
|
|
— |
|
|
|
— |
|
|
|
(1 |
) |
|
|
|
|
|
|
|
|
|
|
|
|
|
|
|
|
|
| Total equity, ending |
|
$ |
15,665 |
|
|
$ |
14,626 |
|
|
$ |
15,665 |
|
|
$ |
14,626 |
|
|
|
|
|
|
|
|
|
|
|
|
|
|
|
|
|
|
25
Fifth Third Bancorp and Subsidiaries
Average Balance Sheet and Yield Analysis
$ in millions, except
share data
(unaudited)
|
|
|
|
|
|
|
|
|
|
|
|
|
|
|
|
|
|
|
|
|
| |
|
For the Three Months Ended |
|
|
% Change |
|
| |
|
December
2014 |
|
|
September
2014 |
|
|
December
2013 |
|
|
Seq |
|
|
Yr/Yr |
|
| Assets |
|
|
|
|
|
|
|
|
|
|
|
|
|
|
|
|
|
|
|
|
| Interest-earning assets: |
|
|
|
|
|
|
|
|
|
|
|
|
|
|
|
|
|
|
|
|
| Commercial and industrial loans |
|
$ |
41,313 |
|
|
$ |
41,525 |
|
|
$ |
38,846 |
|
|
|
(1 |
%) |
|
|
6 |
% |
| Commercial mortgage loans |
|
|
7,482 |
|
|
|
7,637 |
|
|
|
8,051 |
|
|
|
(2 |
%) |
|
|
(7 |
%) |
| Commercial construction loans |
|
|
1,911 |
|
|
|
1,565 |
|
|
|
955 |
|
|
|
22 |
% |
|
|
NM |
|
| Commercial leases |
|
|
3,601 |
|
|
|
3,576 |
|
|
|
3,579 |
|
|
|
1 |
% |
|
|
1 |
% |
| Residential mortgage loans |
|
|
13,526 |
|
|
|
13,342 |
|
|
|
13,544 |
|
|
|
1 |
% |
|
|
— |
|
| Home equity |
|
|
8,937 |
|
|
|
9,009 |
|
|
|
9,296 |
|
|
|
(1 |
%) |
|
|
(4 |
%) |
| Automobile loans |
|
|
12,073 |
|
|
|
12,105 |
|
|
|
12,019 |
|
|
|
— |
|
|
|
— |
|
| Credit card |
|
|
2,324 |
|
|
|
2,295 |
|
|
|
2,202 |
|
|
|
1 |
% |
|
|
6 |
% |
| Other consumer loans and leases |
|
|
414 |
|
|
|
374 |
|
|
|
373 |
|
|
|
11 |
% |
|
|
11 |
% |
| Taxable securities |
|
|
22,364 |
|
|
|
22,594 |
|
|
|
18,383 |
|
|
|
(1 |
%) |
|
|
22 |
% |
| Tax exempt securities |
|
|
64 |
|
|
|
50 |
|
|
|
48 |
|
|
|
27 |
% |
|
|
32 |
% |
| Other short-term investments |
|
|
5,176 |
|
|
|
2,283 |
|
|
|
4,612 |
|
|
|
NM |
|
|
|
12 |
% |
|
|
|
|
|
|
|
|
|
|
|
|
|
|
|
|
|
|
|
|
|
| Total interest-earning assets |
|
|
119,185 |
|
|
|
116,355 |
|
|
|
111,908 |
|
|
|
2 |
% |
|
|
7 |
% |
| Cash and due from banks |
|
|
3,008 |
|
|
|
2,862 |
|
|
|
2,956 |
|
|
|
5 |
% |
|
|
2 |
% |
| Other assets |
|
|
14,800 |
|
|
|
14,461 |
|
|
|
14,986 |
|
|
|
2 |
% |
|
|
(1 |
%) |
| Allowance for loan and lease losses |
|
|
(1,413 |
) |
|
|
(1,458 |
) |
|
|
(1,671 |
) |
|
|
(3 |
%) |
|
|
(15 |
%) |
|
|
|
|
|
|
|
|
|
|
|
|
|
|
|
|
|
|
|
|
|
| Total assets |
|
$ |
135,580 |
|
|
$ |
132,220 |
|
|
$ |
128,179 |
|
|
|
3 |
% |
|
|
6 |
% |
|
|
|
|
|
|
|
|
|
|
|
|
|
|
|
|
|
|
|
|
|
| Liabilities |
|
|
|
|
|
|
|
|
|
|
|
|
|
|
|
|
|
|
|
|
| Interest-bearing liabilities: |
|
|
|
|
|
|
|
|
|
|
|
|
|
|
|
|
|
|
|
|
| Interest checking |
|
$ |
25,478 |
|
|
$ |
24,926 |
|
|
$ |
24,650 |
|
|
|
2 |
% |
|
|
3 |
% |
| Savings |
|
|
15,173 |
|
|
|
15,759 |
|
|
|
17,323 |
|
|
|
(4 |
%) |
|
|
(12 |
%) |
| Money market |
|
|
17,023 |
|
|
|
15,222 |
|
|
|
11,285 |
|
|
|
12 |
% |
|
|
51 |
% |
| Foreign office |
|
|
1,439 |
|
|
|
1,663 |
|
|
|
1,717 |
|
|
|
(13 |
%) |
|
|
(16 |
%) |
| Other time |
|
|
3,936 |
|
|
|
3,800 |
|
|
|
3,529 |
|
|
|
4 |
% |
|
|
12 |
% |
| Certificates—$100,000 and over |
|
|
2,998 |
|
|
|
3,339 |
|
|
|
7,456 |
|
|
|
(10 |
%) |
|
|
(60 |
%) |
| Other |
|
|
— |
|
|
|
— |
|
|
|
— |
|
|
|
NM |
|
|
|
NM |
|
| Federal funds purchased |
|
|
161 |
|
|
|
520 |
|
|
|
301 |
|
|
|
(69 |
%) |
|
|
(47 |
%) |
| Other short-term borrowings |
|
|
1,481 |
|
|
|
1,973 |
|
|
|
2,177 |
|
|
|
(25 |
%) |
|
|
(32 |
%) |
| Long-term debt |
|
|
14,855 |
|
|
|
13,955 |
|
|
|
9,135 |
|
|
|
6 |
% |
|
|
63 |
% |
|
|
|
|
|
|
|
|
|
|
|
|
|
|
|
|
|
|
|
|
|
| Total interest-bearing liabilities |
|
|
82,544 |
|
|
|
81,157 |
|
|
|
77,573 |
|
|
|
2 |
% |
|
|
6 |
% |
| Demand deposits |
|
|
33,301 |
|
|
|
31,790 |
|
|
|
30,765 |
|
|
|
5 |
% |
|
|
8 |
% |
| Other liabilities |
|
|
4,052 |
|
|
|
3,749 |
|
|
|
5,045 |
|
|
|
8 |
% |
|
|
(20 |
%) |
|
|
|
|
|
|
|
|
|
|
|
|
|
|
|
|
|
|
|
|
|
| Total liabilities |
|
|
119,897 |
|
|
|
116,696 |
|
|
|
113,383 |
|
|
|
3 |
% |
|
|
6 |
% |
| Equity |
|
|
15,683 |
|
|
|
15,524 |
|
|
|
14,796 |
|
|
|
1 |
% |
|
|
6 |
% |
|
|
|
|
|
|
|
|
|
|
|
|
|
|
|
|
|
|
|
|
|
| Total liabilities and equity |
|
$ |
135,580 |
|
|
$ |
132,220 |
|
|
$ |
128,179 |
|
|
|
3 |
% |
|
|
6 |
% |
|
|
|
|
|
|
|
|
|
|
|
|
|
|
|
|
|
|
|
|
|
| Yield Analysis |
|
|
|
|
|
|
|
|
|
|
|
|
|
|
|
|
|
|
|
|
| Interest-earning assets: |
|
|
|
|
|
|
|
|
|
|
|
|
|
|
|
|
|
|
|
|
| Commercial and industrial loans |
|
|
3.21 |
% |
|
|
3.25 |
% |
|
|
3.46 |
% |
|
|
|
|
|
|
|
|
| Commercial mortgage loans |
|
|
3.28 |
% |
|
|
3.34 |
% |
|
|
3.53 |
% |
|
|
|
|
|
|
|
|
| Commercial construction loans |
|
|
3.30 |
% |
|
|
3.49 |
% |
|
|
3.46 |
% |
|
|
|
|
|
|
|
|
| Commercial leases |
|
|
2.96 |
% |
|
|
2.96 |
% |
|
|
3.10 |
% |
|
|
|
|
|
|
|
|
| Residential mortgage loans |
|
|
3.80 |
% |
|
|
3.84 |
% |
|
|
3.88 |
% |
|
|
|
|
|
|
|
|
| Home equity |
|
|
3.68 |
% |
|
|
3.69 |
% |
|
|
3.62 |
% |
|
|
|
|
|
|
|
|
| Automobile loans |
|
|
2.73 |
% |
|
|
2.72 |
% |
|
|
2.96 |
% |
|
|
|
|
|
|
|
|
| Credit card |
|
|
10.08 |
% |
|
|
9.87 |
% |
|
|
9.90 |
% |
|
|
|
|
|
|
|
|
| Other consumer loans and leases |
|
|
31.97 |
% |
|
|
36.98 |
% |
|
|
43.19 |
% |
|
|
|
|
|
|
|
|
|
|
|
|
|
|
|
|
|
|
|
|
|
|
|
|
|
|
|
|
|
| Total loans and leases |
|
|
3.58 |
% |
|
|
3.61 |
% |
|
|
3.79 |
% |
|
|
|
|
|
|
|
|
| Taxable securities |
|
|
3.28 |
% |
|
|
3.32 |
% |
|
|
3.32 |
% |
|
|
|
|
|
|
|
|
| Tax exempt securities |
|
|
4.42 |
% |
|
|
5.34 |
% |
|
|
5.65 |
% |
|
|
|
|
|
|
|
|
| Other short-term investments |
|
|
0.26 |
% |
|
|
0.26 |
% |
|
|
0.26 |
% |
|
|
|
|
|
|
|
|
|
|
|
|
|
|
|
|
|
|
|
|
|
|
|
|
|
|
|
|
|
| Total interest-earning assets |
|
|
3.38 |
% |
|
|
3.49 |
% |
|
|
3.57 |
% |
|
|
|
|
|
|
|
|
| Interest-bearing liabilities: |
|
|
|
|
|
|
|
|
|
|
|
|
|
|
|
|
|
|
|
|
| Interest checking |
|
|
0.22 |
% |
|
|
0.22 |
% |
|
|
0.22 |
% |
|
|
|
|
|
|
|
|
| Savings |
|
|
0.08 |
% |
|
|
0.09 |
% |
|
|
0.11 |
% |
|
|
|
|
|
|
|
|
| Money market |
|
|
0.39 |
% |
|
|
0.37 |
% |
|
|
0.26 |
% |
|
|
|
|
|
|
|
|
| Foreign office |
|
|
0.30 |
% |
|
|
0.29 |
% |
|
|
0.27 |
% |
|
|
|
|
|
|
|
|
| Other time |
|
|
1.14 |
% |
|
|
1.07 |
% |
|
|
0.98 |
% |
|
|
|
|
|
|
|
|
| Certificates—$100,000 and over |
|
|
1.05 |
% |
|
|
0.96 |
% |
|
|
0.64 |
% |
|
|
|
|
|
|
|
|
| Other |
|
|
0.00 |
% |
|
|
0.00 |
% |
|
|
0.05 |
% |
|
|
|
|
|
|
|
|
| Federal funds purchased |
|
|
0.10 |
% |
|
|
0.09 |
% |
|
|
0.14 |
% |
|
|
|
|
|
|
|
|
| Other short-term borrowings |
|
|
0.10 |
% |
|
|
0.10 |
% |
|
|
0.15 |
% |
|
|
|
|
|
|
|
|
| Long-term debt |
|
|
1.94 |
% |
|
|
1.80 |
% |
|
|
2.32 |
% |
|
|
|
|
|
|
|
|
|
|
|
|
|
|
|
|
|
|
|
|
|
|
|
|
|
|
|
|
|
| Total interest-bearing liabilities |
|
|
0.61 |
% |
|
|
0.56 |
% |
|
|
0.52 |
% |
|
|
|
|
|
|
|
|
| Ratios: |
|
|
|
|
|
|
|
|
|
|
|
|
|
|
|
|
|
|
|
|
| Net interest margin (taxable equivalent) |
|
|
2.96 |
% |
|
|
3.10 |
% |
|
|
3.21 |
% |
|
|
|
|
|
|
|
|
| Net interest rate spread (taxable equivalent) |
|
|
2.77 |
% |
|
|
2.93 |
% |
|
|
3.05 |
% |
|
|
|
|
|
|
|
|
| Interest-bearing liabilities to interest-earning assets |
|
|
69.26 |
% |
|
|
69.75 |
% |
|
|
69.32 |
% |
|
|
|
|
|
|
|
|
26
Fifth Third Bancorp and Subsidiaries
Average Balance Sheet and Yield Analysis
$ in millions, except
share data
(unaudited)
|
|
|
|
|
|
|
|
|
|
|
|
|
| |
|
Year to Date |
|
|
% Change |
|
| |
|
December
2014 |
|
|
December
2013 |
|
|
Yr/Yr |
|
| Assets |
|
|
|
|
|
|
|
|
|
|
|
|
| Interest-earning assets: |
|
|
|
|
|
|
|
|
|
|
|
|
| Commercial and industrial loans |
|
$ |
41,178 |
|
|
$ |
37,770 |
|
|
|
9 |
% |
| Commercial mortgage loans |
|
|
7,745 |
|
|
|
8,481 |
|
|
|
(9 |
%) |
| Commercial construction loans |
|
|
1,492 |
|
|
|
793 |
|
|
|
88 |
% |
| Commercial leases |
|
|
3,585 |
|
|
|
3,565 |
|
|
|
1 |
% |
| Residential mortgage loans |
|
|
13,344 |
|
|
|
14,428 |
|
|
|
(8 |
%) |
| Home equity |
|
|
9,059 |
|
|
|
9,554 |
|
|
|
(5 |
%) |
| Automobile loans |
|
|
12,068 |
|
|
|
12,021 |
|
|
|
— |
|
| Credit card |
|
|
2,271 |
|
|
|
2,121 |
|
|
|
7 |
% |
| Other consumer loans and leases |
|
|
385 |
|
|
|
360 |
|
|
|
7 |
% |
| Taxable securities |
|
|
21,770 |
|
|
|
16,395 |
|
|
|
33 |
% |
| Tax exempt securities |
|
|
53 |
|
|
|
49 |
|
|
|
8 |
% |
| Other short-term investments |
|
|
3,043 |
|
|
|
2,417 |
|
|
|
26 |
% |
|
|
|
|
|
|
|
|
|
|
|
|
|
| Total interest-earning assets |
|
|
115,993 |
|
|
|
107,954 |
|
|
|
7 |
% |
| Cash and due from banks |
|
|
2,892 |
|
|
|
2,482 |
|
|
|
17 |
% |
| Other assets |
|
|
14,539 |
|
|
|
15,053 |
|
|
|
(3 |
%) |
| Allowance for loan and lease losses |
|
|
(1,481 |
) |
|
|
(1,757 |
) |
|
|
(16 |
%) |
|
|
|
|
|
|
|
|
|
|
|
|
|
| Total assets |
|
|
131,943 |
|
|
|
123,732 |
|
|
|
7 |
% |
|
|
|
|
|
|
|
|
|
|
|
|
|
| Liabilities |
|
|
|
|
|
|
|
|
|
|
|
|
| Interest-bearing liabilities: |
|
|
|
|
|
|
|
|
|
|
|
|
| Interest checking |
|
|
25,382 |
|
|
|
23,582 |
|
|
|
8 |
% |
| Savings |
|
|
16,080 |
|
|
|
18,440 |
|
|
|
(13 |
%) |
| Money market |
|
|
14,670 |
|
|
|
9,467 |
|
|
|
55 |
% |
| Foreign office |
|
|
1,828 |
|
|
|
1,501 |
|
|
|
22 |
% |
| Other time |
|
|
3,762 |
|
|
|
3,760 |
|
|
|
— |
|
| Certificates—$100,000 and over |
|
|
3,929 |
|
|
|
6,339 |
|
|
|
(38 |
%) |
| Other |
|
|
— |
|
|
|
17 |
|
|
|
(100 |
%) |
| Federal funds purchased |
|
|
458 |
|
|
|
503 |
|
|
|
(9 |
%) |
| Other short-term borrowings |
|
|
1,873 |
|
|
|
3,024 |
|
|
|
(38 |
%) |
| Long-term debt |
|
|
12,928 |
|
|
|
7,914 |
|
|
|
63 |
% |
|
|
|
|
|
|
|
|
|
|
|
|
|
| Total interest-bearing liabilities |
|
|
80,910 |
|
|
|
74,547 |
|
|
|
9 |
% |
| Demand deposits |
|
|
31,755 |
|
|
|
29,925 |
|
|
|
6 |
% |
| Other liabilities |
|
|
3,950 |
|
|
|
4,917 |
|
|
|
(20 |
%) |
|
|
|
|
|
|
|
|
|
|
|
|
|
| Total liabilities |
|
|
116,615 |
|
|
|
109,389 |
|
|
|
7 |
% |
| Equity |
|
|
15,328 |
|
|
|
14,343 |
|
|
|
7 |
% |
|
|
|
|
|
|
|
|
|
|
|
|
|
| Total liabilities and equity |
|
|
131,943 |
|
|
|
123,732 |
|
|
|
7 |
% |
|
|
|
|
|
|
|
|
|
|
|
|
|
| Yield Analysis |
|
|
|
|
|
|
|
|
|
|
|
|
| Interest-earning assets: |
|
|
|
|
|
|
|
|
|
|
|
|
| Commercial and industrial loans |
|
|
3.27 |
% |
|
|
3.60 |
% |
|
|
(9 |
%) |
| Commercial mortgage loans |
|
|
3.36 |
% |
|
|
3.60 |
% |
|
|
(7 |
%) |
| Commercial construction loans |
|
|
3.44 |
% |
|
|
3.45 |
% |
|
|
— |
|
| Commercial leases |
|
|
3.01 |
% |
|
|
3.26 |
% |
|
|
(8 |
%) |
| Residential mortgage loans |
|
|
3.88 |
% |
|
|
3.91 |
% |
|
|
(1 |
%) |
| Home equity |
|
|
3.71 |
% |
|
|
3.71 |
% |
|
|
— |
|
| Automobile loans |
|
|
2.77 |
% |
|
|
3.10 |
% |
|
|
(11 |
%) |
| Credit card |
|
|
9.98 |
% |
|
|
9.87 |
% |
|
|
1 |
% |
| Other consumer loans and leases |
|
|
35.99 |
% |
|
|
42.93 |
% |
|
|
(16 |
%) |
|
|
|
|
|
|
|
|
|
|
|
|
|
| Total loans and leases |
|
|
3.64 |
% |
|
|
3.89 |
% |
|
|
(6 |
%) |
| Taxable securities |
|
|
3.32 |
% |
|
|
3.16 |
% |
|
|
5 |
% |
| Tax exempt securities |
|
|
4.94 |
% |
|
|
5.29 |
% |
|
|
(7 |
%) |
| Other short-term investments |
|
|
0.26 |
% |
|
|
0.26 |
% |
|
|
3 |
% |
|
|
|
|
|
|
|
|
|
|
|
|
|
| Total interest-earning assets |
|
|
3.49 |
% |
|
|
3.70 |
% |
|
|
(6 |
%) |
| Interest-bearing liabilities: |
|
|
|
|
|
|
|
|
|
|
|
|
| Interest checking |
|
|
0.22 |
% |
|
|
0.23 |
% |
|
|
|
|
| Savings |
|
|
0.10 |
% |
|
|
0.12 |
% |
|
|
|
|
| Money market |
|
|
0.35 |
% |
|
|
0.25 |
% |
|
|
|
|
| Foreign office |
|
|
0.29 |
% |
|
|
0.28 |
% |
|
|
|
|
| Other time |
|
|
1.06 |
% |
|
|
1.33 |
% |
|
|
|
|
| Certificates—$100,000 and over |
|
|
0.85 |
% |
|
|
0.78 |
% |
|
|
|
|
| Other |
|
|
0.02 |
% |
|
|
0.11 |
% |
|
|
|
|
| Federal funds purchased |
|
|
0.09 |
% |
|
|
0.12 |
% |
|
|
|
|
| Other short-term borrowings |
|
|
0.10 |
% |
|
|
0.18 |
% |
|
|
|
|
| Long-term debt |
|
|
1.91 |
% |
|
|
2.58 |
% |
|
|
|
|
|
|
|
|
|
|
|
|
|
|
|
|
|
| Total interest-bearing liabilities |
|
|
0.56 |
% |
|
|
0.55 |
% |
|
|
|
|
| Ratios: |
|
|
|
|
|
|
|
|
|
|
|
|
| Net interest margin (taxable equivalent) |
|
|
3.10 |
% |
|
|
3.32 |
% |
|
|
|
|
| Net interest rate spread (taxable equivalent) |
|
|
2.94 |
% |
|
|
3.15 |
% |
|
|
|
|
| Interest-bearing liabilities to interest-earning assets |
|
|
69.75 |
% |
|
|
69.05 |
% |
|
|
|
|
27
Fifth Third Bancorp and Subsidiaries
Average Balance Sheet and Yield Analysis
$ in millions, except
share data
(unaudited)
|
|
|
|
|
|
|
|
|
|
|
|
|
|
|
|
|
|
|
|
|
| |
|
For the Three Months Ended |
|
| |
|
December
2014 |
|
|
September
2014 |
|
|
June
2014 |
|
|
March
2014 |
|
|
December
2013 |
|
| Assets |
|
|
|
|
|
|
|
|
|
|
|
|
|
|
|
|
|
|
|
|
| Interest-earning assets: |
|
|
|
|
|
|
|
|
|
|
|
|
|
|
|
|
|
|
|
|
| Commercial and industrial loans |
|
$ |
41,313 |
|
|
$ |
41,525 |
|
|
$ |
41,451 |
|
|
$ |
40,409 |
|
|
$ |
38,846 |
|
| Commercial mortgage loans |
|
|
7,482 |
|
|
|
7,637 |
|
|
|
7,886 |
|
|
|
7,983 |
|
|
|
8,051 |
|
| Commercial construction loans |
|
|
1,911 |
|
|
|
1,565 |
|
|
|
1,364 |
|
|
|
1,118 |
|
|
|
955 |
|
| Commercial leases |
|
|
3,601 |
|
|
|
3,576 |
|
|
|
3,556 |
|
|
|
3,607 |
|
|
|
3,579 |
|
| Residential mortgage loans |
|
|
13,526 |
|
|
|
13,342 |
|
|
|
13,202 |
|
|
|
13,304 |
|
|
|
13,544 |
|
| Home equity |
|
|
8,937 |
|
|
|
9,009 |
|
|
|
9,101 |
|
|
|
9,194 |
|
|
|
9,296 |
|
| Automobile loans |
|
|
12,073 |
|
|
|
12,105 |
|
|
|
12,070 |
|
|
|
12,023 |
|
|
|
12,019 |
|
| Credit card |
|
|
2,324 |
|
|
|
2,295 |
|
|
|
2,232 |
|
|
|
2,230 |
|
|
|
2,202 |
|
| Other consumer loans and leases |
|
|
414 |
|
|
|
374 |
|
|
|
379 |
|
|
|
370 |
|
|
|
373 |
|
| Taxable securities |
|
|
22,364 |
|
|
|
22,594 |
|
|
|
21,706 |
|
|
|
20,385 |
|
|
|
18,383 |
|
| Tax exempt securities |
|
|
64 |
|
|
|
50 |
|
|
|
52 |
|
|
|
46 |
|
|
|
48 |
|
| Other short-term investments |
|
|
5,176 |
|
|
|
2,283 |
|
|
|
2,182 |
|
|
|
2,509 |
|
|
|
4,612 |
|
|
|
|
|
|
|
|
|
|
|
|
|
|
|
|
|
|
|
|
|
|
| Total interest-earning assets |
|
|
119,185 |
|
|
|
116,355 |
|
|
|
115,181 |
|
|
|
113,178 |
|
|
|
111,908 |
|
| Cash and due from banks |
|
|
3,008 |
|
|
|
2,862 |
|
|
|
2,847 |
|
|
|
2,850 |
|
|
|
2,956 |
|
| Other assets |
|
|
14,800 |
|
|
|
14,461 |
|
|
|
14,417 |
|
|
|
14,478 |
|
|
|
14,986 |
|
| Allowance for loan and lease losses |
|
|
(1,413 |
) |
|
|
(1,458 |
) |
|
|
(1,480 |
) |
|
|
(1,576 |
) |
|
|
(1,671 |
) |
|
|
|
|
|
|
|
|
|
|
|
|
|
|
|
|
|
|
|
|
|
| Total assets |
|
$ |
135,580 |
|
|
$ |
132,220 |
|
|
$ |
130,965 |
|
|
$ |
128,930 |
|
|
$ |
128,179 |
|
|
|
|
|
|
|
|
|
|
|
|
|
|
|
|
|
|
|
|
|
|
| Liabilities |
|
|
|
|
|
|
|
|
|
|
|
|
|
|
|
|
|
|
|
|
| Interest-bearing liabilities: |
|
|
|
|
|
|
|
|
|
|
|
|
|
|
|
|
|
|
|
|
| Interest checking |
|
$ |
25,478 |
|
|
$ |
24,926 |
|
|
$ |
25,222 |
|
|
$ |
25,911 |
|
|
$ |
24,650 |
|
| Savings |
|
|
15,173 |
|
|
|
15,759 |
|
|
|
16,509 |
|
|
|
16,903 |
|
|
|
17,323 |
|
| Money market |
|
|
17,023 |
|
|
|
15,222 |
|
|
|
13,942 |
|
|
|
12,439 |
|
|
|
11,285 |
|
| Foreign office |
|
|
1,439 |
|
|
|
1,663 |
|
|
|
2,200 |
|
|
|
2,017 |
|
|
|
1,717 |
|
| Other time |
|
|
3,936 |
|
|
|
3,800 |
|
|
|
3,693 |
|
|
|
3,616 |
|
|
|
3,529 |
|
| Certificates—$100,000 and over |
|
|
2,998 |
|
|
|
3,339 |
|
|
|
3,840 |
|
|
|
5,576 |
|
|
|
7,456 |
|
| Other |
|
|
— |
|
|
|
— |
|
|
|
— |
|
|
|
— |
|
|
|
— |
|
| Federal funds purchased |
|
|
161 |
|
|
|
520 |
|
|
|
606 |
|
|
|
547 |
|
|
|
301 |
|
| Other short-term borrowings |
|
|
1,481 |
|
|
|
1,973 |
|
|
|
2,234 |
|
|
|
1,808 |
|
|
|
2,177 |
|
| Long-term debt |
|
|
14,855 |
|
|
|
13,955 |
|
|
|
12,524 |
|
|
|
10,313 |
|
|
|
9,135 |
|
|
|
|
|
|
|
|
|
|
|
|
|
|
|
|
|
|
|
|
|
|
| Total interest-bearing liabilities |
|
|
82,544 |
|
|
|
81,157 |
|
|
|
80,770 |
|
|
|
79,130 |
|
|
|
77,573 |
|
| Demand deposits |
|
|
33,301 |
|
|
|
31,790 |
|
|
|
31,275 |
|
|
|
30,626 |
|
|
|
30,765 |
|
| Other liabilities |
|
|
4,052 |
|
|
|
3,749 |
|
|
|
3,724 |
|
|
|
4,274 |
|
|
|
5,045 |
|
|
|
|
|
|
|
|
|
|
|
|
|
|
|
|
|
|
|
|
|
|
| Total liabilities |
|
|
119,897 |
|
|
|
116,696 |
|
|
|
115,769 |
|
|
|
114,030 |
|
|
|
113,383 |
|
| Equity |
|
|
15,683 |
|
|
|
15,524 |
|
|
|
15,196 |
|
|
|
14,900 |
|
|
|
14,796 |
|
|
|
|
|
|
|
|
|
|
|
|
|
|
|
|
|
|
|
|
|
|
| Total liabilities and equity |
|
$ |
135,580 |
|
|
$ |
132,220 |
|
|
$ |
130,965 |
|
|
$ |
128,930 |
|
|
$ |
128,179 |
|
|
|
|
|
|
|
|
|
|
|
|
|
|
|
|
|
|
|
|
|
|
| Yield Analysis |
|
|
|
|
|
|
|
|
|
|
|
|
|
|
|
|
|
|
|
|
| Interest-earning assets: |
|
|
|
|
|
|
|
|
|
|
|
|
|
|
|
|
|
|
|
|
| Commercial and industrial loans |
|
|
3.21 |
% |
|
|
3.25 |
% |
|
|
3.27 |
% |
|
|
3.35 |
% |
|
|
3.46 |
% |
| Commercial mortgage loans |
|
|
3.28 |
% |
|
|
3.34 |
% |
|
|
3.39 |
% |
|
|
3.43 |
% |
|
|
3.53 |
% |
| Commercial construction loans |
|
|
3.30 |
% |
|
|
3.49 |
% |
|
|
3.54 |
% |
|
|
3.48 |
% |
|
|
3.46 |
% |
| Commercial leases |
|
|
2.96 |
% |
|
|
2.96 |
% |
|
|
3.04 |
% |
|
|
3.09 |
% |
|
|
3.10 |
% |
| Residential mortgage loans |
|
|
3.80 |
% |
|
|
3.84 |
% |
|
|
3.93 |
% |
|
|
3.94 |
% |
|
|
3.88 |
% |
| Home equity |
|
|
3.68 |
% |
|
|
3.69 |
% |
|
|
3.71 |
% |
|
|
3.74 |
% |
|
|
3.62 |
% |
| Automobile loans |
|
|
2.73 |
% |
|
|
2.72 |
% |
|
|
2.77 |
% |
|
|
2.86 |
% |
|
|
2.96 |
% |
| Credit card |
|
|
10.08 |
% |
|
|
9.87 |
% |
|
|
10.06 |
% |
|
|
9.90 |
% |
|
|
9.90 |
% |
| Other consumer loans and leases |
|
|
31.97 |
% |
|
|
36.98 |
% |
|
|
35.63 |
% |
|
|
39.93 |
% |
|
|
43.19 |
% |
|
|
|
|
|
|
|
|
|
|
|
|
|
|
|
|
|
|
|
|
|
| Total loans and leases |
|
|
3.58 |
% |
|
|
3.61 |
% |
|
|
3.65 |
% |
|
|
3.72 |
% |
|
|
3.79 |
% |
| Taxable securities |
|
|
3.28 |
% |
|
|
3.32 |
% |
|
|
3.34 |
% |
|
|
3.33 |
% |
|
|
3.32 |
% |
| Tax exempt securities |
|
|
4.42 |
% |
|
|
5.34 |
% |
|
|
4.69 |
% |
|
|
5.51 |
% |
|
|
5.65 |
% |
| Other short-term investments |
|
|
0.26 |
% |
|
|
0.26 |
% |
|
|
0.28 |
% |
|
|
0.26 |
% |
|
|
0.26 |
% |
|
|
|
|
|
|
|
|
|
|
|
|
|
|
|
|
|
|
|
|
|
| Total interest-earning assets |
|
|
3.38 |
% |
|
|
3.49 |
% |
|
|
3.53 |
% |
|
|
3.58 |
% |
|
|
3.57 |
% |
| Interest-bearing liabilities: |
|
|
|
|
|
|
|
|
|
|
|
|
|
|
|
|
|
|
|
|
| Interest checking |
|
|
0.22 |
% |
|
|
0.22 |
% |
|
|
0.22 |
% |
|
|
0.23 |
% |
|
|
0.22 |
% |
| Savings |
|
|
0.08 |
% |
|
|
0.09 |
% |
|
|
0.11 |
% |
|
|
0.11 |
% |
|
|
0.11 |
% |
| Money market |
|
|
0.39 |
% |
|
|
0.37 |
% |
|
|
0.33 |
% |
|
|
0.28 |
% |
|
|
0.26 |
% |
| Foreign office |
|
|
0.30 |
% |
|
|
0.29 |
% |
|
|
0.29 |
% |
|
|
0.29 |
% |
|
|
0.27 |
% |
| Other time |
|
|
1.14 |
% |
|
|
1.07 |
% |
|
|
1.03 |
% |
|
|
0.99 |
% |
|
|
0.98 |
% |
| Certificates—$100,000 and over |
|
|
1.05 |
% |
|
|
0.96 |
% |
|
|
0.83 |
% |
|
|
0.70 |
% |
|
|
0.64 |
% |
| Other |
|
|
0.00 |
% |
|
|
0.00 |
% |
|
|
0.00 |
% |
|
|
0.05 |
% |
|
|
0.05 |
% |
| Federal funds purchased |
|
|
0.10 |
% |
|
|
0.09 |
% |
|
|
0.10 |
% |
|
|
0.10 |
% |
|
|
0.14 |
% |
| Other short-term borrowings |
|
|
0.10 |
% |
|
|
0.10 |
% |
|
|
0.10 |
% |
|
|
0.10 |
% |
|
|
0.15 |
% |
| Long-term debt |
|
|
1.94 |
% |
|
|
1.80 |
% |
|
|
1.89 |
% |
|
|
2.04 |
% |
|
|
2.32 |
% |
|
|
|
|
|
|
|
|
|
|
|
|
|
|
|
|
|
|
|
|
|
| Total interest-bearing liabilities |
|
|
0.61 |
% |
|
|
0.56 |
% |
|
|
0.54 |
% |
|
|
0.51 |
% |
|
|
0.52 |
% |
| Ratios: |
|
|
|
|
|
|
|
|
|
|
|
|
|
|
|
|
|
|
|
|
| Net interest margin (taxable equivalent) |
|
|
2.96 |
% |
|
|
3.10 |
% |
|
|
3.15 |
% |
|
|
3.22 |
% |
|
|
3.21 |
% |
| Net interest rate spread (taxable equivalent) |
|
|
2.77 |
% |
|
|
2.93 |
% |
|
|
2.99 |
% |
|
|
3.07 |
% |
|
|
3.05 |
% |
| Interest-bearing liabilities to interest-earning assets |
|
|
69.26 |
% |
|
|
69.75 |
% |
|
|
70.12 |
% |
|
|
69.92 |
% |
|
|
69.32 |
% |
28
Fifth Third Bancorp and Subsidiaries
Summary of Loans and Leases
$ in millions
(unaudited)
|
|
|
|
|
|
|
|
|
|
|
|
|
|
|
|
|
|
|
|
|
| |
|
For the Three Months Ended |
|
| |
|
December
2014 |
|
|
September
2014 |
|
|
June
2014 |
|
|
March
2014 |
|
|
December
2013 |
|
| Average Loans and Leases |
|
|
|
|
|
|
|
|
|
|
|
|
|
|
|
|
|
|
|
|
| Commercial: |
|
|
|
|
|
|
|
|
|
|
|
|
|
|
|
|
|
|
|
|
| Commercial and industrial loans |
|
$ |
41,277 |
|
|
$ |
41,477 |
|
|
$ |
41,374 |
|
|
$ |
40,377 |
|
|
$ |
38,835 |
|
| Commercial mortgage loans |
|
|
7,480 |
|
|
|
7,633 |
|
|
|
7,885 |
|
|
|
7,981 |
|
|
|
8,047 |
|
| Commercial construction loans |
|
|
1,909 |
|
|
|
1,563 |
|
|
|
1,362 |
|
|
|
1,116 |
|
|
|
952 |
|
| Commercial leases |
|
|
3,600 |
|
|
|
3,571 |
|
|
|
3,555 |
|
|
|
3,607 |
|
|
|
3,578 |
|
|
|
|
|
|
|
|
|
|
|
|
|
|
|
|
|
|
|
|
|
|
| Subtotal—commercial |
|
|
54,266 |
|
|
|
54,244 |
|
|
|
54,176 |
|
|
|
53,081 |
|
|
|
51,412 |
|
| Consumer: |
|
|
|
|
|
|
|
|
|
|
|
|
|
|
|
|
|
|
|
|
| Residential mortgage loans |
|
|
13,046 |
|
|
|
12,785 |
|
|
|
12,611 |
|
|
|
12,659 |
|
|
|
12,609 |
|
| Home equity |
|
|
8,937 |
|
|
|
9,009 |
|
|
|
9,101 |
|
|
|
9,194 |
|
|
|
9,296 |
|
| Automobile loans |
|
|
12,073 |
|
|
|
12,105 |
|
|
|
12,070 |
|
|
|
12,023 |
|
|
|
12,019 |
|
| Credit card |
|
|
2,324 |
|
|
|
2,295 |
|
|
|
2,232 |
|
|
|
2,230 |
|
|
|
2,202 |
|
| Other consumer loans and leases |
|
|
395 |
|
|
|
361 |
|
|
|
359 |
|
|
|
343 |
|
|
|
357 |
|
|
|
|
|
|
|
|
|
|
|
|
|
|
|
|
|
|
|
|
|
|
| Subtotal—consumer |
|
|
36,775 |
|
|
|
36,555 |
|
|
|
36,373 |
|
|
|
36,449 |
|
|
|
36,483 |
|
|
|
|
|
|
|
|
|
|
|
|
|
|
|
|
|
|
|
|
|
|
| Total average loans and leases (excluding held for sale) |
|
$ |
91,041 |
|
|
$ |
90,799 |
|
|
$ |
90,549 |
|
|
$ |
89,530 |
|
|
$ |
87,895 |
|
|
|
|
|
|
|
|
|
|
|
|
|
|
|
|
|
|
|
|
|
|
| Average loans held for sale |
|
|
540 |
|
|
|
629 |
|
|
|
692 |
|
|
|
708 |
|
|
|
970 |
|
| End of Period Loans and Leases |
|
|
|
|
|
|
|
|
|
|
|
|
|
|
|
|
|
|
|
|
| Commercial: |
|
|
|
|
|
|
|
|
|
|
|
|
|
|
|
|
|
|
|
|
| Commercial and industrial loans |
|
$ |
40,765 |
|
|
$ |
41,072 |
|
|
$ |
41,299 |
|
|
$ |
40,591 |
|
|
$ |
39,316 |
|
| Commercial mortgage loans |
|
|
7,399 |
|
|
|
7,564 |
|
|
|
7,805 |
|
|
|
7,958 |
|
|
|
8,066 |
|
| Commercial construction loans |
|
|
2,069 |
|
|
|
1,702 |
|
|
|
1,424 |
|
|
|
1,218 |
|
|
|
1,039 |
|
| Commercial leases |
|
|
3,720 |
|
|
|
3,554 |
|
|
|
3,567 |
|
|
|
3,577 |
|
|
|
3,625 |
|
|
|
|
|
|
|
|
|
|
|
|
|
|
|
|
|
|
|
|
|
|
| Subtotal—commercial |
|
|
53,953 |
|
|
|
53,892 |
|
|
|
54,095 |
|
|
|
53,344 |
|
|
|
52,046 |
|
| Consumer: |
|
|
|
|
|
|
|
|
|
|
|
|
|
|
|
|
|
|
|
|
| Residential mortgage loans |
|
|
12,389 |
|
|
|
12,941 |
|
|
|
12,652 |
|
|
|
12,626 |
|
|
|
12,680 |
|
| Home equity |
|
|
8,886 |
|
|
|
8,987 |
|
|
|
9,056 |
|
|
|
9,125 |
|
|
|
9,246 |
|
| Automobile loans |
|
|
12,037 |
|
|
|
12,121 |
|
|
|
12,050 |
|
|
|
12,088 |
|
|
|
11,984 |
|
| Credit card |
|
|
2,401 |
|
|
|
2,317 |
|
|
|
2,261 |
|
|
|
2,177 |
|
|
|
2,294 |
|
| Other consumer loans and leases |
|
|
418 |
|
|
|
366 |
|
|
|
370 |
|
|
|
345 |
|
|
|
364 |
|
|
|
|
|
|
|
|
|
|
|
|
|
|
|
|
|
|
|
|
|
|
| Subtotal—consumer |
|
|
36,131 |
|
|
|
36,732 |
|
|
|
36,389 |
|
|
|
36,361 |
|
|
|
36,568 |
|
|
|
|
|
|
|
|
|
|
|
|
|
|
|
|
|
|
|
|
|
|
| Total portfolio loans and leases |
|
$ |
90,084 |
|
|
$ |
90,624 |
|
|
$ |
90,484 |
|
|
$ |
89,705 |
|
|
$ |
88,614 |
|
|
|
|
|
|
|
|
|
|
|
|
|
|
|
|
|
|
|
|
|
|
| Core business activity |
|
|
590 |
|
|
|
634 |
|
|
|
677 |
|
|
|
776 |
|
|
|
938 |
|
| Portfolio management activity |
|
|
671 |
|
|
|
7 |
|
|
|
5 |
|
|
|
4 |
|
|
|
6 |
|
|
|
|
|
|
|
|
|
|
|
|
|
|
|
|
|
|
|
|
|
|
| Total loans held for sale |
|
|
1,261 |
|
|
|
641 |
|
|
|
682 |
|
|
|
780 |
|
|
|
944 |
|
| Operating lease equipment |
|
|
728 |
|
|
|
732 |
|
|
|
667 |
|
|
|
714 |
|
|
|
730 |
|
| Loans and Leases Serviced for Others:(a) |
|
|
|
|
|
|
|
|
|
|
|
|
|
|
|
|
|
|
|
|
| Commercial and industrial loans |
|
|
637 |
|
|
|
620 |
|
|
|
649 |
|
|
|
702 |
|
|
|
685 |
|
| Commercial mortgage loans |
|
|
270 |
|
|
|
274 |
|
|
|
277 |
|
|
|
280 |
|
|
|
274 |
|
| Commercial construction loans |
|
|
20 |
|
|
|
22 |
|
|
|
39 |
|
|
|
35 |
|
|
|
43 |
|
| Commercial leases |
|
|
283 |
|
|
|
267 |
|
|
|
235 |
|
|
|
223 |
|
|
|
227 |
|
| Residential mortgage loans |
|
|
65,413 |
|
|
|
66,808 |
|
|
|
68,085 |
|
|
|
68,909 |
|
|
|
69,159 |
|
| Automobile loans |
|
|
232 |
|
|
|
263 |
|
|
|
297 |
|
|
|
334 |
|
|
|
370 |
|
|
|
|
|
|
|
|
|
|
|
|
|
|
|
|
|
|
|
|
|
|
| Total loans and leases serviced for others |
|
|
66,855 |
|
|
|
68,254 |
|
|
|
69,582 |
|
|
|
70,483 |
|
|
|
70,758 |
|
|
|
|
|
|
|
|
|
|
|
|
|
|
|
|
|
|
|
|
|
|
| Total loans and leases serviced |
|
$ |
158,928 |
|
|
$ |
160,251 |
|
|
$ |
161,415 |
|
|
$ |
161,682 |
|
|
$ |
161,046 |
|
|
|
|
|
|
|
|
|
|
|
|
|
|
|
|
|
|
|
|
|
|
| (a) |
Fifth Third sells certain loans and leases and obtains servicing responsibilities |
29
Fifth Third Bancorp and Subsidiaries
Regulatory Capital(a)
$ in millions
(unaudited)
|
|
|
|
|
|
|
|
|
|
|
|
|
|
|
|
|
|
|
|
|
| |
|
As of |
|
| |
|
December
2014 |
|
|
September
2014 |
|
|
June
2014 |
|
|
March
2014 |
|
|
December
2013 |
|
| Tier I capital: |
|
|
|
|
|
|
|
|
|
|
|
|
|
|
|
|
|
|
|
|
| Bancorp shareholders’ equity |
|
|
15,626 |
|
|
|
15,404 |
|
|
|
15,469 |
|
|
|
14,826 |
|
|
|
14,589 |
|
| Goodwill and certain other intangibles |
|
|
(2,476 |
) |
|
|
(2,484 |
) |
|
|
(2,484 |
) |
|
|
(2,490 |
) |
|
|
(2,492 |
) |
| Unrealized (gains) losses |
|
|
(429 |
) |
|
|
(301 |
) |
|
|
(382 |
) |
|
|
(196 |
) |
|
|
(82 |
) |
| Qualifying trust preferred securities |
|
|
60 |
|
|
|
60 |
|
|
|
60 |
|
|
|
60 |
|
|
|
60 |
|
| Other |
|
|
(17 |
) |
|
|
(18 |
) |
|
|
(19 |
) |
|
|
(18 |
) |
|
|
19 |
|
|
|
|
|
|
|
|
|
|
|
|
|
|
|
|
|
|
|
|
|
|
| Total tier I capital |
|
|
12,764 |
|
|
|
12,661 |
|
|
|
12,644 |
|
|
|
12,182 |
|
|
|
12,094 |
|
| Total risk-based capital: |
|
|
|
|
|
|
|
|
|
|
|
|
|
|
|
|
|
|
|
|
| Tier I capital |
|
|
12,764 |
|
|
|
12,661 |
|
|
|
12,644 |
|
|
|
12,182 |
|
|
|
12,094 |
|
| Qualifying allowance for credit losses |
|
|
1,475 |
|
|
|
1,466 |
|
|
|
1,466 |
|
|
|
1,461 |
|
|
|
1,454 |
|
| Qualifying subordinated notes |
|
|
2,657 |
|
|
|
2,637 |
|
|
|
2,635 |
|
|
|
2,713 |
|
|
|
2,883 |
|
|
|
|
|
|
|
|
|
|
|
|
|
|
|
|
|
|
|
|
|
|
| Total risk-based capital |
|
|
16,896 |
|
|
|
16,764 |
|
|
|
16,745 |
|
|
|
16,356 |
|
|
|
16,431 |
|
|
|
|
|
|
|
|
|
|
|
|
|
|
|
|
|
|
|
|
|
|
| Risk-weighted assets(b) |
|
|
117,887 |
|
|
|
116,917 |
|
|
|
117,117 |
|
|
|
116,622 |
|
|
|
115,969 |
|
| Ratios: |
|
|
|
|
|
|
|
|
|
|
|
|
|
|
|
|
|
|
|
|
| Average shareholders’ equity to average assets |
|
|
11.54 |
% |
|
|
11.71 |
% |
|
|
11.57 |
% |
|
|
11.53 |
% |
|
|
11.51 |
% |
| Regulatory capital: |
|
|
|
|
|
|
|
|
|
|
|
|
|
|
|
|
|
|
|
|
| Fifth Third Bancorp |
|
|
|
|
|
|
|
|
|
|
|
|
|
|
|
|
|
|
|
|
| Tier I risk-based capital |
|
|
10.83 |
% |
|
|
10.83 |
% |
|
|
10.80 |
% |
|
|
10.45 |
% |
|
|
10.43 |
% |
| Total risk-based capital |
|
|
14.33 |
% |
|
|
14.34 |
% |
|
|
14.30 |
% |
|
|
14.02 |
% |
|
|
14.17 |
% |
| Tier I leverage |
|
|
9.66 |
% |
|
|
9.82 |
% |
|
|
9.86 |
% |
|
|
9.71 |
% |
|
|
9.73 |
% |
| Tier I common equity(c) |
|
|
9.65 |
% |
|
|
9.64 |
% |
|
|
9.61 |
% |
|
|
9.51 |
% |
|
|
9.45 |
% |
| Fifth Third Bank |
|
|
|
|
|
|
|
|
|
|
|
|
|
|
|
|
|
|
|
|
| Tier I risk-based capital |
|
|
11.85 |
% |
|
|
11.87 |
% |
|
|
11.79 |
% |
|
|
11.65 |
% |
|
|
11.59 |
% |
| Total risk-based capital |
|
|
13.10 |
% |
|
|
13.12 |
% |
|
|
13.04 |
% |
|
|
12.91 |
% |
|
|
12.94 |
% |
| Tier I leverage |
|
|
10.58 |
% |
|
|
10.77 |
% |
|
|
10.77 |
% |
|
|
10.84 |
% |
|
|
10.83 |
% |
| (a) |
Current period regulatory capital data and ratios are estimated. |
| (b) |
Under the banking agencies’ risk-based capital guidelines, assets and credit equivalent amounts of derivatives and off-balance sheet exposures are assigned to broad risk categories. The aggregate dollar amount
in category is multiplied by the associated risk weight of the category. The resulting weighted values are added together resulting in the Bancorp’s total risk weighted assets. |
| (c) |
The tier I common equity ratio while not required by U.S. GAAP, is considered to be an important metric with which to analyze a bank’s position. The ratio has been included herein to facilitate a greater
understanding of the Bancorp’s capital structure and financial condition. |
30
Fifth Third Bancorp and Subsidiaries
Summary of Credit Loss Experience
$ in millions
(unaudited)
|
|
|
|
|
|
|
|
|
|
|
|
|
|
|
|
|
|
|
|
|
| |
|
For the Three Months Ended |
|
| |
|
December
2014 |
|
|
September
2014 |
|
|
June
2014 |
|
|
March
2014 |
|
|
December
2013 |
|
| Average loans and leases (excluding held for sale): |
|
|
|
|
|
|
|
|
|
|
|
|
|
|
|
|
|
|
|
|
| Commercial and industrial loans |
|
$ |
41,277 |
|
|
$ |
41,477 |
|
|
$ |
41,374 |
|
|
$ |
40,377 |
|
|
$ |
38,835 |
|
| Commercial mortgage loans |
|
|
7,480 |
|
|
|
7,633 |
|
|
|
7,885 |
|
|
|
7,981 |
|
|
|
8,047 |
|
| Commercial construction loans |
|
|
1,909 |
|
|
|
1,563 |
|
|
|
1,362 |
|
|
|
1,116 |
|
|
|
952 |
|
| Commercial leases |
|
|
3,600 |
|
|
|
3,571 |
|
|
|
3,555 |
|
|
|
3,607 |
|
|
|
3,578 |
|
| Residential mortgage loans |
|
|
13,046 |
|
|
|
12,785 |
|
|
|
12,611 |
|
|
|
12,659 |
|
|
|
12,609 |
|
| Home equity |
|
|
8,937 |
|
|
|
9,009 |
|
|
|
9,101 |
|
|
|
9,194 |
|
|
|
9,296 |
|
| Automobile loans |
|
|
12,073 |
|
|
|
12,105 |
|
|
|
12,070 |
|
|
|
12,023 |
|
|
|
12,019 |
|
| Credit card |
|
|
2,324 |
|
|
|
2,295 |
|
|
|
2,232 |
|
|
|
2,230 |
|
|
|
2,202 |
|
| Other consumer loans and leases |
|
|
395 |
|
|
|
361 |
|
|
|
359 |
|
|
|
343 |
|
|
|
357 |
|
|
|
|
|
|
|
|
|
|
|
|
|
|
|
|
|
|
|
|
|
|
| Total average loans and leases (excluding held for sale) |
|
$ |
91,041 |
|
|
$ |
90,799 |
|
|
$ |
90,549 |
|
|
$ |
89,530 |
|
|
$ |
87,895 |
|
|
|
|
|
|
|
|
|
|
|
|
|
|
|
|
|
|
|
|
|
|
| Losses charged off: |
|
|
|
|
|
|
|
|
|
|
|
|
|
|
|
|
|
|
|
|
| Commercial and industrial loans |
|
|
($50 |
) |
|
|
($62 |
) |
|
|
($36 |
) |
|
|
($100 |
) |
|
|
($78 |
) |
| Commercial mortgage loans |
|
|
(12 |
) |
|
|
(10 |
) |
|
|
(11 |
) |
|
|
(5 |
) |
|
|
(13 |
) |
| Commercial construction loans |
|
|
— |
|
|
|
— |
|
|
|
(8 |
) |
|
|
(5 |
) |
|
|
(4 |
) |
| Commercial leases |
|
|
(1 |
) |
|
|
— |
|
|
|
— |
|
|
|
— |
|
|
|
— |
|
| Residential mortgage loans |
|
|
(97 |
) |
|
|
(12 |
) |
|
|
(11 |
) |
|
|
(19 |
) |
|
|
(15 |
) |
| Home equity |
|
|
(15 |
) |
|
|
(18 |
) |
|
|
(22 |
) |
|
|
(20 |
) |
|
|
(30 |
) |
| Automobile loans |
|
|
(11 |
) |
|
|
(11 |
) |
|
|
(10 |
) |
|
|
(12 |
) |
|
|
(11 |
) |
| Credit card |
|
|
(23 |
) |
|
|
(26 |
) |
|
|
(24 |
) |
|
|
(22 |
) |
|
|
(24 |
) |
| Other consumer loans and leases |
|
|
(6 |
) |
|
|
(7 |
) |
|
|
(5 |
) |
|
|
(7 |
) |
|
|
(8 |
) |
|
|
|
|
|
|
|
|
|
|
|
|
|
|
|
|
|
|
|
|
|
| Total losses |
|
|
(215 |
) |
|
|
(146 |
) |
|
|
(127 |
) |
|
|
(190 |
) |
|
|
(183 |
) |
| Recoveries of losses previously charged off: |
|
|
|
|
|
|
|
|
|
|
|
|
|
|
|
|
|
|
|
|
| Commercial and industrial loans |
|
|
6 |
|
|
|
12 |
|
|
|
5 |
|
|
|
3 |
|
|
|
12 |
|
| Commercial mortgage loans |
|
|
2 |
|
|
|
5 |
|
|
|
2 |
|
|
|
2 |
|
|
|
5 |
|
| Commercial construction loans |
|
|
— |
|
|
|
— |
|
|
|
— |
|
|
|
— |
|
|
|
— |
|
| Commercial leases |
|
|
— |
|
|
|
— |
|
|
|
— |
|
|
|
— |
|
|
|
— |
|
| Residential mortgage loans |
|
|
3 |
|
|
|
3 |
|
|
|
3 |
|
|
|
4 |
|
|
|
2 |
|
| Home equity |
|
|
4 |
|
|
|
4 |
|
|
|
4 |
|
|
|
4 |
|
|
|
4 |
|
| Automobile loans |
|
|
4 |
|
|
|
4 |
|
|
|
5 |
|
|
|
4 |
|
|
|
5 |
|
| Credit card |
|
|
3 |
|
|
|
3 |
|
|
|
3 |
|
|
|
3 |
|
|
|
3 |
|
| Other consumer loans and leases |
|
|
2 |
|
|
|
— |
|
|
|
4 |
|
|
|
2 |
|
|
|
4 |
|
|
|
|
|
|
|
|
|
|
|
|
|
|
|
|
|
|
|
|
|
|
| Total recoveries |
|
|
24 |
|
|
|
31 |
|
|
|
26 |
|
|
|
22 |
|
|
|
35 |
|
| Net losses charged off: |
|
|
|
|
|
|
|
|
|
|
|
|
|
|
|
|
|
|
|
|
| Commercial and industrial loans |
|
|
(44 |
) |
|
|
(50 |
) |
|
|
(31 |
) |
|
|
(97 |
) |
|
|
(66 |
) |
| Commercial mortgage loans |
|
|
(10 |
) |
|
|
(5 |
) |
|
|
(9 |
) |
|
|
(3 |
) |
|
|
(8 |
) |
| Commercial construction loans |
|
|
— |
|
|
|
— |
|
|
|
(8 |
) |
|
|
(5 |
) |
|
|
(4 |
) |
| Commercial leases |
|
|
(1 |
) |
|
|
— |
|
|
|
— |
|
|
|
— |
|
|
|
— |
|
| Residential mortgage loans |
|
|
(94 |
) |
|
|
(9 |
) |
|
|
(8 |
) |
|
|
(15 |
) |
|
|
(13 |
) |
| Home equity |
|
|
(11 |
) |
|
|
(14 |
) |
|
|
(18 |
) |
|
|
(16 |
) |
|
|
(26 |
) |
| Automobile loans |
|
|
(7 |
) |
|
|
(7 |
) |
|
|
(5 |
) |
|
|
(8 |
) |
|
|
(6 |
) |
| Credit card |
|
|
(20 |
) |
|
|
(23 |
) |
|
|
(21 |
) |
|
|
(19 |
) |
|
|
(21 |
) |
| Other consumer loans and leases |
|
|
(4 |
) |
|
|
(7 |
) |
|
|
(1 |
) |
|
|
(5 |
) |
|
|
(4 |
) |
|
|
|
|
|
|
|
|
|
|
|
|
|
|
|
|
|
|
|
|
|
| Total net losses charged off |
|
|
($191 |
) |
|
|
($115 |
) |
|
|
($101 |
) |
|
|
($168 |
) |
|
|
($148 |
) |
|
|
|
|
|
|
|
|
|
|
|
|
|
|
|
|
|
|
|
|
|
| Net charge-off ratios: |
|
|
|
|
|
|
|
|
|
|
|
|
|
|
|
|
|
|
|
|
| Commercial and industrial loans |
|
|
0.43 |
% |
|
|
0.48 |
% |
|
|
0.30 |
% |
|
|
0.97 |
% |
|
|
0.67 |
% |
| Commercial mortgage loans |
|
|
0.53 |
% |
|
|
0.24 |
% |
|
|
0.44 |
% |
|
|
0.16 |
% |
|
|
0.40 |
% |
| Commercial construction loans |
|
|
(0.01 |
%) |
|
|
(0.11 |
%) |
|
|
2.26 |
% |
|
|
1.66 |
% |
|
|
1.65 |
% |
| Commercial leases |
|
|
0.06 |
% |
|
|
0.00 |
% |
|
|
0.00 |
% |
|
|
(0.03 |
%) |
|
|
(0.01 |
%) |
| Residential mortgage loans |
|
|
2.87 |
% |
|
|
0.28 |
% |
|
|
0.24 |
% |
|
|
0.49 |
% |
|
|
0.39 |
% |
| Home equity |
|
|
0.47 |
% |
|
|
0.63 |
% |
|
|
0.80 |
% |
|
|
0.72 |
% |
|
|
1.09 |
% |
| Automobile loans |
|
|
0.22 |
% |
|
|
0.24 |
% |
|
|
0.15 |
% |
|
|
0.29 |
% |
|
|
0.20 |
% |
| Credit card |
|
|
3.40 |
% |
|
|
3.89 |
% |
|
|
3.71 |
% |
|
|
3.41 |
% |
|
|
3.69 |
% |
| Other consumer loans and leases |
|
|
4.57 |
% |
|
|
8.13 |
% |
|
|
4.08 |
% |
|
|
6.58 |
% |
|
|
6.03 |
% |
|
|
|
|
|
|
|
|
|
|
|
|
|
|
|
|
|
|
|
|
|
| Total net charge-off ratio |
|
|
0.83 |
% |
|
|
0.50 |
% |
|
|
0.45 |
% |
|
|
0.76 |
% |
|
|
0.67 |
% |
|
|
|
|
|
|
|
|
|
|
|
|
|
|
|
|
|
|
|
|
|
31
Fifth Third Bancorp and Subsidiaries
Asset Quality
$ in millions
(unaudited)
|
|
|
|
|
|
|
|
|
|
|
|
|
|
|
|
|
|
|
|
|
| |
|
For the Three Months Ended |
|
| |
|
December
2014 |
|
|
September
2014 |
|
|
June
2014 |
|
|
March
2014 |
|
|
December
2013 |
|
| Allowance for Credit Losses |
|
|
|
|
|
|
|
|
|
|
|
|
|
|
|
|
|
|
|
|
| Allowance for loan and lease losses, beginning |
|
$ |
1,414 |
|
|
$ |
1,458 |
|
|
$ |
1,483 |
|
|
$ |
1,582 |
|
|
$ |
1,677 |
|
| Total net losses charged off |
|
|
(191 |
) |
|
|
(115 |
) |
|
|
(101 |
) |
|
|
(168 |
) |
|
|
(148 |
) |
| Provision for loan and lease losses |
|
|
99 |
|
|
|
71 |
|
|
|
76 |
|
|
|
69 |
|
|
|
53 |
|
|
|
|
|
|
|
|
|
|
|
|
|
|
|
|
|
|
|
|
|
|
| Allowance for loan and lease losses, ending |
|
$ |
1,322 |
|
|
$ |
1,414 |
|
|
$ |
1,458 |
|
|
$ |
1,483 |
|
|
$ |
1,582 |
|
| Reserve for unfunded commitments, beginning |
|
$ |
134 |
|
|
$ |
142 |
|
|
$ |
153 |
|
|
$ |
162 |
|
|
$ |
167 |
|
| Provision (benefit) for unfunded commitments |
|
|
1 |
|
|
|
(8 |
) |
|
|
(11 |
) |
|
|
(9 |
) |
|
|
(5 |
) |
|
|
|
|
|
|
|
|
|
|
|
|
|
|
|
|
|
|
|
|
|
| Reserve for unfunded commitments, ending |
|
$ |
135 |
|
|
$ |
134 |
|
|
$ |
142 |
|
|
$ |
153 |
|
|
$ |
162 |
|
|
|
|
|
|
|
|
|
|
|
|
|
|
|
|
|
|
|
|
|
|
| Components of allowance for credit losses: |
|
|
|
|
|
|
|
|
|
|
|
|
|
|
|
|
|
|
|
|
| Allowance for loan and lease losses |
|
$ |
1,322 |
|
|
$ |
1,414 |
|
|
$ |
1,458 |
|
|
$ |
1,483 |
|
|
$ |
1,582 |
|
| Reserve for unfunded commitments |
|
|
135 |
|
|
|
134 |
|
|
|
142 |
|
|
|
153 |
|
|
|
162 |
|
|
|
|
|
|
|
|
|
|
|
|
|
|
|
|
|
|
|
|
|
|
| Total allowance for credit losses |
|
$ |
1,457 |
|
|
$ |
1,548 |
|
|
$ |
1,600 |
|
|
$ |
1,636 |
|
|
$ |
1,744 |
|
|
|
|
|
|
|
|
|
|
|
|
|
|
|
|
|
|
|
|
|
|
| Nonperforming Assets and Delinquent Loans |
|
|
|
|
|
|
|
|
|
|
|
|
|
|
|
|
|
|
|
|
| Nonaccrual portfolio loans and leases: |
|
|
|
|
|
|
|
|
|
|
|
|
|
|
|
|
|
|
|
|
| Commercial and industrial loans |
|
$ |
86 |
|
|
$ |
102 |
|
|
$ |
103 |
|
|
$ |
153 |
|
|
$ |
127 |
|
| Commercial mortgage loans |
|
|
64 |
|
|
|
77 |
|
|
|
86 |
|
|
|
96 |
|
|
|
90 |
|
| Commercial construction loans |
|
|
— |
|
|
|
2 |
|
|
|
3 |
|
|
|
3 |
|
|
|
10 |
|
| Commercial leases |
|
|
3 |
|
|
|
3 |
|
|
|
2 |
|
|
|
3 |
|
|
|
3 |
|
| Residential mortgage loans |
|
|
44 |
|
|
|
52 |
|
|
|
56 |
|
|
|
68 |
|
|
|
83 |
|
| Home equity |
|
|
72 |
|
|
|
69 |
|
|
|
73 |
|
|
|
75 |
|
|
|
74 |
|
| Automobile loans |
|
|
— |
|
|
|
— |
|
|
|
— |
|
|
|
— |
|
|
|
— |
|
| Other consumer loans and leases |
|
|
— |
|
|
|
— |
|
|
|
— |
|
|
|
— |
|
|
|
— |
|
|
|
|
|
|
|
|
|
|
|
|
|
|
|
|
|
|
|
|
|
|
| Total nonaccrual portfolio loans and leases (excludes restructured loans) |
|
|
269 |
|
|
|
305 |
|
|
|
323 |
|
|
|
398 |
|
|
|
387 |
|
| Restructured loans—commercial (nonaccrual) |
|
|
214 |
|
|
|
201 |
|
|
|
202 |
|
|
|
209 |
|
|
|
228 |
|
| Restructured loans—consumer (nonaccrual) |
|
|
96 |
|
|
|
114 |
|
|
|
115 |
|
|
|
126 |
|
|
|
136 |
|
|
|
|
|
|
|
|
|
|
|
|
|
|
|
|
|
|
|
|
|
|
| Total nonaccrual portfolio loans and leases |
|
|
579 |
|
|
|
620 |
|
|
|
640 |
|
|
|
733 |
|
|
|
751 |
|
| Repossessed property |
|
|
18 |
|
|
|
19 |
|
|
|
18 |
|
|
|
6 |
|
|
|
7 |
|
| Other real estate owned(b) |
|
|
147 |
|
|
|
157 |
|
|
|
174 |
|
|
|
207 |
|
|
|
222 |
|
|
|
|
|
|
|
|
|
|
|
|
|
|
|
|
|
|
|
|
|
|
| Total nonperforming assets(a) |
|
|
744 |
|
|
|
796 |
|
|
|
832 |
|
|
|
946 |
|
|
|
980 |
|
| Nonaccrual loans held for sale |
|
|
24 |
|
|
|
4 |
|
|
|
5 |
|
|
|
3 |
|
|
|
6 |
|
| Restructured loans—(nonaccrual) held for sale |
|
|
15 |
|
|
|
3 |
|
|
|
— |
|
|
|
— |
|
|
|
— |
|
|
|
|
|
|
|
|
|
|
|
|
|
|
|
|
|
|
|
|
|
|
| Total nonperforming assets including loans held for sale |
|
$ |
783 |
|
|
$ |
803 |
|
|
$ |
837 |
|
|
$ |
949 |
|
|
$ |
986 |
|
|
|
|
|
|
|
|
|
|
|
|
|
|
|
|
|
|
|
|
|
|
| Restructured portfolio consumer loans and leases (accrual) |
|
$ |
905 |
|
|
$ |
1,610 |
|
|
$ |
1,623 |
|
|
$ |
1,682 |
|
|
$ |
1,685 |
|
| Restructured portfolio commercial loans and leases (accrual) |
|
$ |
844 |
|
|
$ |
885 |
|
|
$ |
914 |
|
|
$ |
847 |
|
|
$ |
869 |
|
| Ninety days past due loans and leases: |
|
|
|
|
|
|
|
|
|
|
|
|
|
|
|
|
|
|
|
|
| Commercial and industrial loans |
|
$ |
— |
|
|
$ |
— |
|
|
$ |
— |
|
|
$ |
1 |
|
|
$ |
— |
|
| Commercial mortgage loans |
|
|
— |
|
|
|
1 |
|
|
|
— |
|
|
|
— |
|
|
|
— |
|
| Commercial construction loans |
|
|
— |
|
|
|
— |
|
|
|
— |
|
|
|
— |
|
|
|
— |
|
| Commercial leases |
|
|
— |
|
|
|
— |
|
|
|
— |
|
|
|
— |
|
|
|
— |
|
|
|
|
|
|
|
|
|
|
|
|
|
|
|
|
|
|
|
|
|
|
| Total commercial loans and leases |
|
|
— |
|
|
|
1 |
|
|
|
— |
|
|
|
1 |
|
|
|
— |
|
|
|
|
|
|
|
|
|
|
|
|
|
|
|
|
|
|
|
|
|
|
| Residential mortgage loans |
|
|
56 |
|
|
|
57 |
|
|
|
60 |
|
|
|
56 |
|
|
|
66 |
|
| Home equity |
|
|
— |
|
|
|
— |
|
|
|
— |
|
|
|
— |
|
|
|
— |
|
| Automobile loans |
|
|
8 |
|
|
|
8 |
|
|
|
8 |
|
|
|
7 |
|
|
|
8 |
|
| Credit card |
|
|
23 |
|
|
|
21 |
|
|
|
26 |
|
|
|
30 |
|
|
|
29 |
|
| Other consumer loans and leases |
|
|
— |
|
|
|
— |
|
|
|
— |
|
|
|
— |
|
|
|
— |
|
|
|
|
|
|
|
|
|
|
|
|
|
|
|
|
|
|
|
|
|
|
| Total consumer loans and leases |
|
|
87 |
|
|
|
86 |
|
|
|
94 |
|
|
|
93 |
|
|
|
103 |
|
|
|
|
|
|
|
|
|
|
|
|
|
|
|
|
|
|
|
|
|
|
| Total ninety days past due loans and leases(c) |
|
$ |
87 |
|
|
$ |
87 |
|
|
$ |
94 |
|
|
$ |
94 |
|
|
$ |
103 |
|
|
|
|
|
|
|
|
|
|
|
|
|
|
|
|
|
|
|
|
|
|
| Ratios |
|
|
|
|
|
|
|
|
|
|
|
|
|
|
|
|
|
|
|
|
| Net losses charged off as a percent of average loans and leases |
|
|
0.83 |
% |
|
|
0.50 |
% |
|
|
0.45 |
% |
|
|
0.76 |
% |
|
|
0.67 |
% |
| Allowance for loan and lease losses: |
|
|
|
|
|
|
|
|
|
|
|
|
|
|
|
|
|
|
|
|
| As a percent of portfolio loans and leases |
|
|
1.47 |
% |
|
|
1.56 |
% |
|
|
1.61 |
% |
|
|
1.65 |
% |
|
|
1.79 |
% |
| As a percent of nonperforming loans and leases(a) |
|
|
228 |
% |
|
|
228 |
% |
|
|
228 |
% |
|
|
202 |
% |
|
|
211 |
% |
| As a percent of nonperforming assets(a) |
|
|
178 |
% |
|
|
178 |
% |
|
|
175 |
% |
|
|
157 |
% |
|
|
161 |
% |
| Nonperforming loans and leases as a percent of portfolio loans, leases and other assets , including other real estate owned(a) |
|
|
0.64 |
% |
|
|
0.68 |
% |
|
|
0.70 |
% |
|
|
0.82 |
% |
|
|
0.84 |
% |
| Nonperforming assets as a percent of portfolio loans, leases and other assets, including other real estate owned(a) |
|
|
0.82 |
% |
|
|
0.88 |
% |
|
|
0.92 |
% |
|
|
1.05 |
% |
|
|
1.10 |
% |
| Nonperforming assets as a percent of total loans, leases and other assets, including other real estate owned |
|
|
0.86 |
% |
|
|
0.88 |
% |
|
|
0.92 |
% |
|
|
1.05 |
% |
|
|
1.10 |
% |
| Allowance for credit losses as a percent of nonperforming assets |
|
|
196 |
% |
|
|
195 |
% |
|
|
192 |
% |
|
|
173 |
% |
|
|
178 |
% |
| (a) |
Does not include nonaccrual loans held for sale |
| (b) |
Excludes OREO related to government insured loans |
| (c) |
Does not include loans held for sale |
32
Fifth Third Bancorp and Subsidiaries
Regulation G Non-GAAP Reconciliation
$ and shares in millions
(unaudited)
|
|
|
|
|
|
|
|
|
|
|
|
|
|
|
|
|
|
|
|
|
| |
|
For the Three Months Ended |
|
| |
|
December
2014 |
|
|
September
2014 |
|
|
June
2014 |
|
|
March
2014 |
|
|
December
2013 |
|
| Income before income taxes (U.S. GAAP) |
|
$ |
519 |
|
|
$ |
464 |
|
|
$ |
606 |
|
|
$ |
438 |
|
|
$ |
561 |
|
| Add: Provision expense (U.S. GAAP) |
|
|
99 |
|
|
|
71 |
|
|
|
76 |
|
|
|
69 |
|
|
|
53 |
|
|
|
|
|
|
|
|
|
|
|
|
|
|
|
|
|
|
|
|
|
|
| Pre-provision net revenue |
|
|
618 |
|
|
|
535 |
|
|
|
682 |
|
|
|
507 |
|
|
|
614 |
|
| Net income available to common shareholders (U.S. GAAP) |
|
|
362 |
|
|
|
328 |
|
|
|
416 |
|
|
|
309 |
|
|
|
383 |
|
| Add: Intangible amortization, net of tax |
|
|
1 |
|
|
|
1 |
|
|
|
1 |
|
|
|
1 |
|
|
|
1 |
|
|
|
|
|
|
|
|
|
|
|
|
|
|
|
|
|
|
|
|
|
|
| Tangible net income available to common shareholders |
|
|
363 |
|
|
|
329 |
|
|
|
417 |
|
|
|
310 |
|
|
|
384 |
|
| Tangible net income available to common shareholders (annualized) (a) |
|
|
1,440 |
|
|
|
1,305 |
|
|
|
1,673 |
|
|
|
1,257 |
|
|
|
1,523 |
|
| Average Bancorp shareholders’ equity (U.S. GAAP) |
|
|
15,644 |
|
|
|
15,486 |
|
|
|
15,157 |
|
|
|
14,862 |
|
|
|
14,757 |
|
| Less: Average preferred stock |
|
|
(1,331 |
) |
|
|
(1,331 |
) |
|
|
(1,119 |
) |
|
|
(1,034 |
) |
|
|
(703 |
) |
| Average goodwill |
|
|
(2,416 |
) |
|
|
(2,416 |
) |
|
|
(2,416 |
) |
|
|
(2,416 |
) |
|
|
(2,416 |
) |
| Average intangible assets and other servicing rights |
|
|
(17 |
) |
|
|
(16 |
) |
|
|
(17 |
) |
|
|
(19 |
) |
|
|
(20 |
) |
|
|
|
|
|
|
|
|
|
|
|
|
|
|
|
|
|
|
|
|
|
| Average tangible common equity (b) |
|
|
11,880 |
|
|
|
11,723 |
|
|
|
11,605 |
|
|
|
11,393 |
|
|
|
11,618 |
|
| Total Bancorp shareholders’ equity (U.S. GAAP) |
|
|
15,626 |
|
|
|
15,404 |
|
|
|
15,469 |
|
|
|
14,826 |
|
|
|
14,589 |
|
| Less: Preferred stock |
|
|
(1,331 |
) |
|
|
(1,331 |
) |
|
|
(1,331 |
) |
|
|
(1,034 |
) |
|
|
(1,034 |
) |
| Goodwill |
|
|
(2,416 |
) |
|
|
(2,416 |
) |
|
|
(2,416 |
) |
|
|
(2,416 |
) |
|
|
(2,416 |
) |
| Intangible assets and other servicing rights |
|
|
(16 |
) |
|
|
(16 |
) |
|
|
(17 |
) |
|
|
(18 |
) |
|
|
(19 |
) |
|
|
|
|
|
|
|
|
|
|
|
|
|
|
|
|
|
|
|
|
|
| Tangible common equity, including unrealized gains / losses (c) |
|
|
11,863 |
|
|
|
11,641 |
|
|
|
11,705 |
|
|
|
11,358 |
|
|
|
11,120 |
|
| Less: Accumulated other comprehensive income |
|
|
(429 |
) |
|
|
(301 |
) |
|
|
(382 |
) |
|
|
(196 |
) |
|
|
(82 |
) |
|
|
|
|
|
|
|
|
|
|
|
|
|
|
|
|
|
|
|
|
|
| Tangible common equity, excluding unrealized gains / losses (d) |
|
|
11,434 |
|
|
|
11,340 |
|
|
|
11,323 |
|
|
|
11,162 |
|
|
|
11,038 |
|
| Add: Preferred stock |
|
|
1,331 |
|
|
|
1,331 |
|
|
|
1,331 |
|
|
|
1,034 |
|
|
|
1,034 |
|
|
|
|
|
|
|
|
|
|
|
|
|
|
|
|
|
|
|
|
|
|
| Tangible equity (e) |
|
|
12,765 |
|
|
|
12,671 |
|
|
|
12,654 |
|
|
|
12,196 |
|
|
|
12,072 |
|
| Total assets (U.S. GAAP) |
|
|
138,706 |
|
|
|
134,188 |
|
|
|
132,562 |
|
|
|
129,654 |
|
|
|
130,443 |
|
| Less: Goodwill |
|
|
(2,416 |
) |
|
|
(2,416 |
) |
|
|
(2,416 |
) |
|
|
(2,416 |
) |
|
|
(2,416 |
) |
| Intangible assets and other servicing rights |
|
|
(16 |
) |
|
|
(16 |
) |
|
|
(17 |
) |
|
|
(18 |
) |
|
|
(19 |
) |
|
|
|
|
|
|
|
|
|
|
|
|
|
|
|
|
|
|
|
|
|
| Tangible assets, including unrealized gains / losses (f) |
|
|
136,274 |
|
|
|
131,756 |
|
|
|
130,129 |
|
|
|
127,220 |
|
|
|
128,008 |
|
| Less: Accumulated other comprehensive income / loss, before tax |
|
|
(660 |
) |
|
|
(463 |
) |
|
|
(588 |
) |
|
|
(302 |
) |
|
|
(126 |
) |
|
|
|
|
|
|
|
|
|
|
|
|
|
|
|
|
|
|
|
|
|
| Tangible assets, excluding unrealized gains / losses (g) |
|
|
135,614 |
|
|
|
131,293 |
|
|
|
129,541 |
|
|
|
126,918 |
|
|
|
127,882 |
|
| Total Bancorp shareholders’ equity (U.S. GAAP) |
|
|
15,626 |
|
|
|
15,404 |
|
|
|
15,469 |
|
|
|
14,826 |
|
|
|
14,589 |
|
| Goodwill and certain other intangibles |
|
|
(2,476 |
) |
|
|
(2,484 |
) |
|
|
(2,484 |
) |
|
|
(2,490 |
) |
|
|
(2,492 |
) |
| Unrealized gains |
|
|
(429 |
) |
|
|
(301 |
) |
|
|
(382 |
) |
|
|
(196 |
) |
|
|
(82 |
) |
| Qualifying trust preferred securities |
|
|
60 |
|
|
|
60 |
|
|
|
60 |
|
|
|
60 |
|
|
|
60 |
|
| Other |
|
|
(17 |
) |
|
|
(18 |
) |
|
|
(19 |
) |
|
|
(18 |
) |
|
|
19 |
|
|
|
|
|
|
|
|
|
|
|
|
|
|
|
|
|
|
|
|
|
|
| Tier I capital |
|
|
12,764 |
|
|
|
12,661 |
|
|
|
12,644 |
|
|
|
12,182 |
|
|
|
12,094 |
|
| Less: Preferred stock |
|
|
(1,331 |
) |
|
|
(1,331 |
) |
|
|
(1,331 |
) |
|
|
(1,034 |
) |
|
|
(1,034 |
) |
| Qualifying trust preferred securities |
|
|
(60 |
) |
|
|
(60 |
) |
|
|
(60 |
) |
|
|
(60 |
) |
|
|
(60 |
) |
| Qualifying noncontrolling interests in consolidated subsidiaries |
|
|
(1 |
) |
|
|
(1 |
) |
|
|
(1 |
) |
|
|
(1 |
) |
|
|
(37 |
) |
|
|
|
|
|
|
|
|
|
|
|
|
|
|
|
|
|
|
|
|
|
| Tier I common equity (h) |
|
|
11,372 |
|
|
|
11,269 |
|
|
|
11,252 |
|
|
|
11,087 |
|
|
|
10,963 |
|
| Common shares outstanding (i) |
|
|
824 |
|
|
|
834 |
|
|
|
844 |
|
|
|
848 |
|
|
|
855 |
|
| Risk-weighted assets, determined in accordance with |
|
|
|
|
|
|
|
|
|
|
|
|
|
|
|
|
|
| prescribed regulatory requirements (j) |
|
|
117,887 |
|
|
|
116,917 |
|
|
|
117,117 |
|
|
|
116,622 |
|
|
|
115,969 |
|
| Ratios: |
|
|
|
|
|
|
|
|
|
|
|
|
|
|
|
|
|
| Return on average tangible common equity (a) / (b) |
|
|
12.1 |
% |
|
|
11.1 |
% |
|
|
14.4 |
% |
|
|
11.0 |
% |
|
|
13.1 |
% |
| Tangible equity (e) / (g) |
|
|
9.41 |
% |
|
|
9.65 |
% |
|
|
9.77 |
% |
|
|
9.61 |
% |
|
|
9.44 |
% |
| Tangible common equity (excluding unrealized gains/losses) (d) / (g) |
|
|
8.43 |
% |
|
|
8.64 |
% |
|
|
8.74 |
% |
|
|
8.79 |
% |
|
|
8.63 |
% |
| Tangible common equity (including unrealized gains/losses) (c) / (f) |
|
|
8.71 |
% |
|
|
8.84 |
% |
|
|
9.00 |
% |
|
|
8.93 |
% |
|
|
8.69 |
% |
| Tangible common equity as a percent of risk-weighted assets (excluding unrealized gains/losses) (d) / (j) |
|
|
9.70 |
% |
|
|
9.70 |
% |
|
|
9.67 |
% |
|
|
9.57 |
% |
|
|
9.52 |
% |
| Tangible book value per share (c) / (i) |
|
$ |
14.40 |
|
|
$ |
13.95 |
|
|
$ |
13.86 |
|
|
$ |
13.40 |
|
|
$ |
13.00 |
|
| Tier I common equity (h) / (j) |
|
|
9.65 |
% |
|
|
9.64 |
% |
|
|
9.61 |
% |
|
|
9.51 |
% |
|
|
9.45 |
% |
|
|
|
|
|
| Basel III-Estimated Tier I common equity ratio
|
|
|
|
|
|
|
|
|
|
|
|
|
|
|
|
|
|
| |
|
December
2014 |
|
|
September
2014 |
|
|
June
2014 |
|
|
March
2014 |
|
|
December
2013 |
|
| Tier I common equity (Basel I) |
|
|
11,372 |
|
|
|
11,269 |
|
|
|
11,252 |
|
|
|
11,087 |
|
|
|
10,963 |
|
| Add: Adjustment related to capital components |
|
|
84 |
|
|
|
99 |
|
|
|
96 |
|
|
|
99 |
|
|
|
82 |
|
|
|
|
|
|
|
|
|
|
|
|
|
|
|
|
|
|
|
|
|
|
| Estimated Tier I common equity under final Basel III rules without AOCI (opt
out)(k) |
|
|
11,456 |
|
|
|
11,368 |
|
|
|
11,348 |
|
|
|
11,186 |
|
|
|
11,045 |
|
| Add: Adjustment related to AOCI |
|
|
429 |
|
|
|
301 |
|
|
|
382 |
|
|
|
196 |
|
|
|
82 |
|
|
|
|
|
|
|
|
|
|
|
|
|
|
|
|
|
|
|
|
|
|
| Estimated Tier I common equity under final Basel III rules with AOCI (non opt
out)(l) |
|
|
11,885 |
|
|
|
11,669 |
|
|
|
11,730 |
|
|
|
11,382 |
|
|
|
11,127 |
|
|
|
|
|
|
|
|
|
|
|
|
|
|
|
|
|
|
|
|
|
|
| Estimated risk-weighted assets under final Basel III rules (m) |
|
|
122,027 |
|
|
|
121,219 |
|
|
|
122,465 |
|
|
|
122,659 |
|
|
|
122,074 |
|
|
|
|
|
|
|
|
|
|
|
|
|
|
|
|
|
|
|
|
|
|
| Estimated Tier I common equity ratio under final Basel III rules (opt out) (k) / (m) |
|
|
9.39 |
% |
|
|
9.38 |
% |
|
|
9.27 |
% |
|
|
9.12 |
% |
|
|
9.05 |
% |
| Estimated Tier I common equity ratio under final Basel III rules (non opt out) (l) / (m) |
|
|
9.74 |
% |
|
|
9.63 |
% |
|
|
9.58 |
% |
|
|
9.28 |
% |
|
|
9.12 |
% |
| (k)(l) |
Under the final Basel III rules, non-advanced approach banks are permitted to make a one-time election to opt out of the requirement to include AOCI in Tier I common equity. Other adjustments include mortgage
servicing rights and deferred tax assets subject to threshold limitations and deferred tax liabilities related to intangible assets. |
| (m) |
Key differences under Basel III in the calculation of risk-weighted assets compared to Basel I include: (1) Risk weighting for commitments under 1 year; (2) Higher risk weighting for exposures to
securitizations, past due loans, foreign banks and certain commercial real estate; (3) Higher risk weighting for mortgage servicing rights and deferred tax assets that are under certain thresholds as a percent of Tier I capital; and
(4) Derivatives are differentiated between exchange clearing and over-the-counter and the 50% risk-weight cap is removed. |
33
Fifth Third Bancorp and Subsidiaries
Segment Presentation
$ in millions
(unaudited)
|
|
|
|
|
|
|
|
|
|
|
|
|
|
|
|
|
|
|
|
|
|
|
|
|
| For the three months ended December 31, 2014 |
|
Commercial
Banking |
|
|
Branch
Banking |
|
|
Consumer
Lending |
|
|
Investment
Advisors |
|
|
Other/
Eliminations |
|
|
Total |
|
| Net interest income(a) |
|
$ |
427 |
|
|
$ |
395 |
|
|
$ |
64 |
|
|
$ |
31 |
|
|
($ |
29 |
) |
|
$ |
888 |
|
| Provision for loan and lease losses |
|
|
(49 |
) |
|
|
(40 |
) |
|
|
(101 |
) |
|
|
(1 |
) |
|
|
92 |
|
|
|
(99 |
) |
|
|
|
|
|
|
|
|
|
|
|
|
|
|
|
|
|
|
|
|
|
|
|
|
|
| Net interest income after provision for loan and lease losses |
|
|
378 |
|
|
|
355 |
|
|
|
(37 |
) |
|
|
30 |
|
|
|
63 |
|
|
|
789 |
|
| Total noninterest income |
|
|
239 |
|
|
|
186 |
|
|
|
69 |
|
|
|
102 |
|
|
|
57 |
|
|
|
653 |
|
| Total noninterest expense |
|
|
(331 |
) |
|
|
(385 |
) |
|
|
(107 |
) |
|
|
(111 |
) |
|
|
16 |
|
|
|
(918 |
) |
|
|
|
|
|
|
|
|
|
|
|
|
|
|
|
|
|
|
|
|
|
|
|
|
|
| Net income before taxes |
|
|
286 |
|
|
|
156 |
|
|
|
(75 |
) |
|
|
21 |
|
|
|
136 |
|
|
|
524 |
|
| Applicable income taxes(a) |
|
|
(58 |
) |
|
|
(55 |
) |
|
|
26 |
|
|
|
(7 |
) |
|
|
(45 |
) |
|
|
(139 |
) |
|
|
|
|
|
|
|
|
|
|
|
|
|
|
|
|
|
|
|
|
|
|
|
|
|
| Net income |
|
|
228 |
|
|
|
101 |
|
|
|
(49 |
) |
|
|
14 |
|
|
|
91 |
|
|
|
385 |
|
| Net income attributable to noncontrolling interest |
|
|
— |
|
|
|
— |
|
|
|
— |
|
|
|
— |
|
|
|
— |
|
|
|
— |
|
|
|
|
|
|
|
|
|
|
|
|
|
|
|
|
|
|
|
|
|
|
|
|
|
|
| Net income attributable to Bancorp |
|
|
228 |
|
|
|
101 |
|
|
|
(49 |
) |
|
|
14 |
|
|
|
91 |
|
|
|
385 |
|
| Dividends on preferred stock |
|
|
— |
|
|
|
— |
|
|
|
— |
|
|
|
— |
|
|
|
23 |
|
|
|
23 |
|
|
|
|
|
|
|
|
|
|
|
|
|
|
|
|
|
|
|
|
|
|
|
|
|
|
| Net income available to common shareholders |
|
$ |
228 |
|
|
$ |
101 |
|
|
($ |
49 |
) |
|
$ |
14 |
|
|
$ |
68 |
|
|
$ |
362 |
|
|
|
|
|
|
|
|
|
|
|
|
|
|
|
|
|
|
|
|
|
|
|
|
|
|
|
|
|
|
|
|
|
| For the three months ended September 30, 2014 |
|
Commercial
Banking |
|
|
Branch
Banking |
|
|
Consumer
Lending |
|
|
Investment
Advisors |
|
|
Other/
Eliminations |
|
|
Total |
|
| Net interest income(a) |
|
$ |
423 |
|
|
$ |
389 |
|
|
$ |
64 |
|
|
$ |
30 |
|
|
$ |
2 |
|
|
$ |
908 |
|
| Provision for loan and lease losses |
|
|
(47 |
) |
|
|
(50 |
) |
|
|
(17 |
) |
|
|
(1 |
) |
|
|
44 |
|
|
|
(71 |
) |
|
|
|
|
|
|
|
|
|
|
|
|
|
|
|
|
|
|
|
|
|
|
|
|
|
| Net interest income after provision for loan and lease losses |
|
|
376 |
|
|
|
339 |
|
|
|
47 |
|
|
|
29 |
|
|
|
46 |
|
|
|
837 |
|
| Total noninterest income |
|
|
218 |
|
|
|
194 |
|
|
|
70 |
|
|
|
102 |
|
|
|
(64 |
) |
|
|
520 |
|
| Total noninterest expense |
|
|
(322 |
) |
|
|
(393 |
) |
|
|
(115 |
) |
|
|
(111 |
) |
|
|
53 |
|
|
|
(888 |
) |
|
|
|
|
|
|
|
|
|
|
|
|
|
|
|
|
|
|
|
|
|
|
|
|
|
| Net income before taxes |
|
|
272 |
|
|
|
140 |
|
|
|
2 |
|
|
|
20 |
|
|
|
35 |
|
|
|
469 |
|
| Applicable income taxes(a) |
|
|
(55 |
) |
|
|
(49 |
) |
|
|
(1 |
) |
|
|
(7 |
) |
|
|
(17 |
) |
|
|
(129 |
) |
|
|
|
|
|
|
|
|
|
|
|
|
|
|
|
|
|
|
|
|
|
|
|
|
|
| Net income |
|
|
217 |
|
|
|
91 |
|
|
|
1 |
|
|
|
13 |
|
|
|
18 |
|
|
|
340 |
|
| Net income attributable to noncontrolling interest |
|
|
— |
|
|
|
— |
|
|
|
— |
|
|
|
— |
|
|
|
— |
|
|
|
— |
|
|
|
|
|
|
|
|
|
|
|
|
|
|
|
|
|
|
|
|
|
|
|
|
|
|
| Net income attributable to Bancorp |
|
|
217 |
|
|
|
91 |
|
|
|
1 |
|
|
|
13 |
|
|
|
18 |
|
|
|
340 |
|
| Dividends on preferred stock |
|
|
— |
|
|
|
— |
|
|
|
— |
|
|
|
— |
|
|
|
12 |
|
|
|
12 |
|
|
|
|
|
|
|
|
|
|
|
|
|
|
|
|
|
|
|
|
|
|
|
|
|
|
| Net income available to common shareholders |
|
$ |
217 |
|
|
$ |
91 |
|
|
$ |
1 |
|
|
$ |
13 |
|
|
$ |
6 |
|
|
$ |
328 |
|
|
|
|
|
|
|
|
|
|
|
|
|
|
|
|
|
|
|
|
|
|
|
|
|
|
|
|
|
|
|
|
|
| For the three months ended June 30, 2014 |
|
Commercial
Banking |
|
|
Branch
Banking |
|
|
Consumer
Lending |
|
|
Investment
Advisors |
|
|
Other/
Eliminations |
|
|
Total |
|
| Net interest income(a) |
|
$ |
414 |
|
|
$ |
377 |
|
|
$ |
65 |
|
|
$ |
29 |
|
|
$ |
20 |
|
|
$ |
905 |
|
| Provision for loan and lease losses |
|
|
(40 |
) |
|
|
(47 |
) |
|
|
(13 |
) |
|
|
(1 |
) |
|
|
25 |
|
|
|
(76 |
) |
|
|
|
|
|
|
|
|
|
|
|
|
|
|
|
|
|
|
|
|
|
|
|
|
|
| Net interest income after provision for loan and lease losses |
|
|
374 |
|
|
|
330 |
|
|
|
52 |
|
|
|
28 |
|
|
|
45 |
|
|
|
829 |
|
| Total noninterest income |
|
|
219 |
|
|
|
170 |
|
|
|
89 |
|
|
|
101 |
|
|
|
157 |
|
|
|
736 |
|
| Total noninterest expense |
|
|
(330 |
) |
|
|
(384 |
) |
|
|
(164 |
) |
|
|
(111 |
) |
|
|
35 |
|
|
|
(954 |
) |
|
|
|
|
|
|
|
|
|
|
|
|
|
|
|
|
|
|
|
|
|
|
|
|
|
| Net income before taxes |
|
|
263 |
|
|
|
116 |
|
|
|
(23 |
) |
|
|
18 |
|
|
|
237 |
|
|
|
611 |
|
| Applicable income taxes(a) |
|
|
(49 |
) |
|
|
(41 |
) |
|
|
8 |
|
|
|
(6 |
) |
|
|
(84 |
) |
|
|
(172 |
) |
|
|
|
|
|
|
|
|
|
|
|
|
|
|
|
|
|
|
|
|
|
|
|
|
|
| Net income |
|
|
214 |
|
|
|
75 |
|
|
|
(15 |
) |
|
|
12 |
|
|
|
153 |
|
|
|
439 |
|
| Net income attributable to noncontrolling interest |
|
|
— |
|
|
|
— |
|
|
|
— |
|
|
|
— |
|
|
|
— |
|
|
|
— |
|
|
|
|
|
|
|
|
|
|
|
|
|
|
|
|
|
|
|
|
|
|
|
|
|
|
| Net income attributable to Bancorp |
|
|
214 |
|
|
|
75 |
|
|
|
(15 |
) |
|
|
12 |
|
|
|
153 |
|
|
|
439 |
|
| Dividends on preferred stock |
|
|
— |
|
|
|
— |
|
|
|
— |
|
|
|
— |
|
|
|
23 |
|
|
|
23 |
|
|
|
|
|
|
|
|
|
|
|
|
|
|
|
|
|
|
|
|
|
|
|
|
|
|
| Net income available to common shareholders |
|
$ |
214 |
|
|
$ |
75 |
|
|
($ |
15 |
) |
|
$ |
12 |
|
|
$ |
130 |
|
|
$ |
416 |
|
|
|
|
|
|
|
|
|
|
|
|
|
|
|
|
|
|
|
|
|
|
|
|
|
|
|
|
|
|
|
|
|
| For the three months ended March 31, 2014 |
|
Commercial
Banking |
|
|
Branch
Banking |
|
|
Consumer
Lending |
|
|
Investment
Advisors |
|
|
Other/
Eliminations |
|
|
Total |
|
| Net interest income(a) |
|
$ |
409 |
|
|
$ |
385 |
|
|
$ |
64 |
|
|
$ |
32 |
|
|
$ |
8 |
|
|
$ |
898 |
|
| Provision for loan and lease losses |
|
|
(97 |
) |
|
|
(45 |
) |
|
|
(25 |
) |
|
|
— |
|
|
|
98 |
|
|
|
(69 |
) |
|
|
|
|
|
|
|
|
|
|
|
|
|
|
|
|
|
|
|
|
|
|
|
|
|
| Net interest income after provision for loan and lease losses |
|
|
312 |
|
|
|
340 |
|
|
|
39 |
|
|
|
32 |
|
|
|
106 |
|
|
|
829 |
|
| Total noninterest income |
|
|
210 |
|
|
|
172 |
|
|
|
118 |
|
|
|
103 |
|
|
|
(39 |
) |
|
|
564 |
|
| Total noninterest expense |
|
|
(334 |
) |
|
|
(390 |
) |
|
|
(166 |
) |
|
|
(110 |
) |
|
|
50 |
|
|
|
(950 |
) |
|
|
|
|
|
|
|
|
|
|
|
|
|
|
|
|
|
|
|
|
|
|
|
|
|
| Net income before taxes |
|
|
188 |
|
|
|
122 |
|
|
|
(9 |
) |
|
|
25 |
|
|
|
117 |
|
|
|
443 |
|
| Applicable income taxes(a) |
|
|
(24 |
) |
|
|
(42 |
) |
|
|
3 |
|
|
|
(8 |
) |
|
|
(53 |
) |
|
|
(124 |
) |
|
|
|
|
|
|
|
|
|
|
|
|
|
|
|
|
|
|
|
|
|
|
|
|
|
| Net income |
|
|
164 |
|
|
|
80 |
|
|
|
(6 |
) |
|
|
17 |
|
|
|
64 |
|
|
|
319 |
|
| Net income attributable to noncontrolling interest |
|
|
— |
|
|
|
— |
|
|
|
— |
|
|
|
— |
|
|
|
1 |
|
|
|
1 |
|
|
|
|
|
|
|
|
|
|
|
|
|
|
|
|
|
|
|
|
|
|
|
|
|
|
| Net income attributable to Bancorp |
|
|
164 |
|
|
|
80 |
|
|
|
(6 |
) |
|
|
17 |
|
|
|
63 |
|
|
|
318 |
|
| Dividends on preferred stock |
|
|
— |
|
|
|
— |
|
|
|
— |
|
|
|
— |
|
|
|
9 |
|
|
|
9 |
|
|
|
|
|
|
|
|
|
|
|
|
|
|
|
|
|
|
|
|
|
|
|
|
|
|
| Net income available to common shareholders |
|
$ |
164 |
|
|
$ |
80 |
|
|
($ |
6 |
) |
|
$ |
17 |
|
|
$ |
54 |
|
|
$ |
309 |
|
|
|
|
|
|
|
|
|
|
|
|
|
|
|
|
|
|
|
|
|
|
|
|
|
|
|
|
|
|
|
|
|
| For the three months ended December 31,
2013(b) |
|
Commercial
Banking |
|
|
Branch
Banking |
|
|
Consumer
Lending |
|
|
Investment
Advisors |
|
|
Other/
Eliminations |
|
|
Total |
|
| Net interest income(a) |
|
$ |
426 |
|
|
$ |
354 |
|
|
$ |
66 |
|
|
$ |
45 |
|
|
$ |
14 |
|
|
$ |
905 |
|
| Provision for loan and lease losses |
|
|
(73 |
) |
|
|
(54 |
) |
|
|
(21 |
) |
|
|
— |
|
|
|
95 |
|
|
|
(53 |
) |
|
|
|
|
|
|
|
|
|
|
|
|
|
|
|
|
|
|
|
|
|
|
|
|
|
| Net interest income after provision for loan and lease losses |
|
|
353 |
|
|
|
300 |
|
|
|
45 |
|
|
|
45 |
|
|
|
109 |
|
|
|
852 |
|
| Total noninterest income |
|
|
201 |
|
|
|
187 |
|
|
|
133 |
|
|
|
100 |
|
|
|
82 |
|
|
|
703 |
|
| Total noninterest expense |
|
|
(323 |
) |
|
|
(397 |
) |
|
|
(130 |
) |
|
|
(108 |
) |
|
|
(31 |
) |
|
|
(989 |
) |
|
|
|
|
|
|
|
|
|
|
|
|
|
|
|
|
|
|
|
|
|
|
|
|
|
| Net income before taxes |
|
|
231 |
|
|
|
90 |
|
|
|
48 |
|
|
|
37 |
|
|
|
160 |
|
|
|
566 |
|
| Applicable income taxes(a) |
|
|
(42 |
) |
|
|
(32 |
) |
|
|
(16 |
) |
|
|
(13 |
) |
|
|
(61 |
) |
|
|
(164 |
) |
|
|
|
|
|
|
|
|
|
|
|
|
|
|
|
|
|
|
|
|
|
|
|
|
|
| Net income |
|
|
189 |
|
|
|
58 |
|
|
|
32 |
|
|
|
24 |
|
|
|
99 |
|
|
|
402 |
|
| Net income attributable to noncontrolling interest |
|
|
— |
|
|
|
— |
|
|
|
— |
|
|
|
— |
|
|
|
— |
|
|
|
— |
|
|
|
|
|
|
|
|
|
|
|
|
|
|
|
|
|
|
|
|
|
|
|
|
|
|
| Net income attributable to Bancorp |
|
|
189 |
|
|
|
58 |
|
|
|
32 |
|
|
|
24 |
|
|
|
99 |
|
|
|
402 |
|
| Dividends on preferred stock |
|
|
— |
|
|
|
— |
|
|
|
— |
|
|
|
— |
|
|
|
19 |
|
|
|
19 |
|
|
|
|
|
|
|
|
|
|
|
|
|
|
|
|
|
|
|
|
|
|
|
|
|
|
| Net income available to common shareholders |
|
$ |
189 |
|
|
$ |
58 |
|
|
$ |
32 |
|
|
$ |
24 |
|
|
$ |
80 |
|
|
$ |
383 |
|
|
|
|
|
|
|
|
|
|
|
|
|
|
|
|
|
|
|
|
|
|
|
|
|
|
| (a) |
Includes taxable equivalent adjustments of $5 million from the three months ended December 31, 2014, $5 million for the three months ended September 30, 2014, $5 million for the three months ended
June 30, 2014, $5 million for the three months ended March 31, 2014 and $5 million for the three months ended December 31, 2013. |
| (b) |
Prior period balances have been adjusted for changes in the structure of the reporting units. |
34