EX-99.1
Exhibit 99.1

News Release
|
|
|
|
|
| CONTACTS: |
|
Jim Eglseder (Investors) |
|
FOR IMMEDIATE RELEASE |
|
|
(513) 534-8424 |
|
January 20, 2012 |
|
|
Rich Rosen, CFA (Investors) |
|
|
|
|
(513) 534-3307 |
|
|
|
|
Debra DeCourcy, APR (Media) |
|
|
|
|
(513) 534-4153 |
|
|
FIFTH THIRD BANCORP ANNOUNCES 2011 NET INCOME OF $1.3 BILLION
Fourth quarter net income of $314 million, earnings per diluted share of $0.33
| • |
|
4Q11 net income available to common shareholders of $305 million, or $0.33 per diluted common share, vs. $373 million, or $0.40 per share, in 3Q11 and
$270 million, or $0.33 per share in 4Q10 |
| |
• |
|
4Q11 return on assets of 1.1% |
| |
• |
|
4Q11 return on average common equity of 9.5%; return on average tangible common equity* of 11.9% |
| |
• |
|
Full year EPS of $1.18, up 87% compared with 2010; 2011 included $153 million, or $0.17 per share, of TARP discount accretion recorded in 1Q11
|
| • |
|
Pre-provision net revenue (PPNR)* of $473 million reflected: |
| |
• |
|
Net interest income (FTE) of $920 million, up 2% sequentially; net interest margin 3.67%; period end portfolio loans up 2% sequentially driven by 5%
growth in C&I loans |
| |
• |
|
Noninterest income of $550 million compared with $665 million in the prior quarter; decline largely due to $54 million charge to a swap liability
related to our previous sale of class B Visa shares, about $30 million lower debit interchange revenue due to change in debit interchange regulations, $22 million lower mortgage banking revenue, and $21 million lower net investment securities gains
|
| |
• |
|
Noninterest expense of $993 million, up 5% sequentially, driven by a $14 million litigation reserve charge related to card association membership and
higher compensation and benefits expense which included a $10 million sequential increase largely due to the impact of a higher stock price on long term equity awards, $6 million in pension settlement expense, and the effect of higher loan volumes
|
| • |
|
Credit trends remain favorable |
| |
• |
|
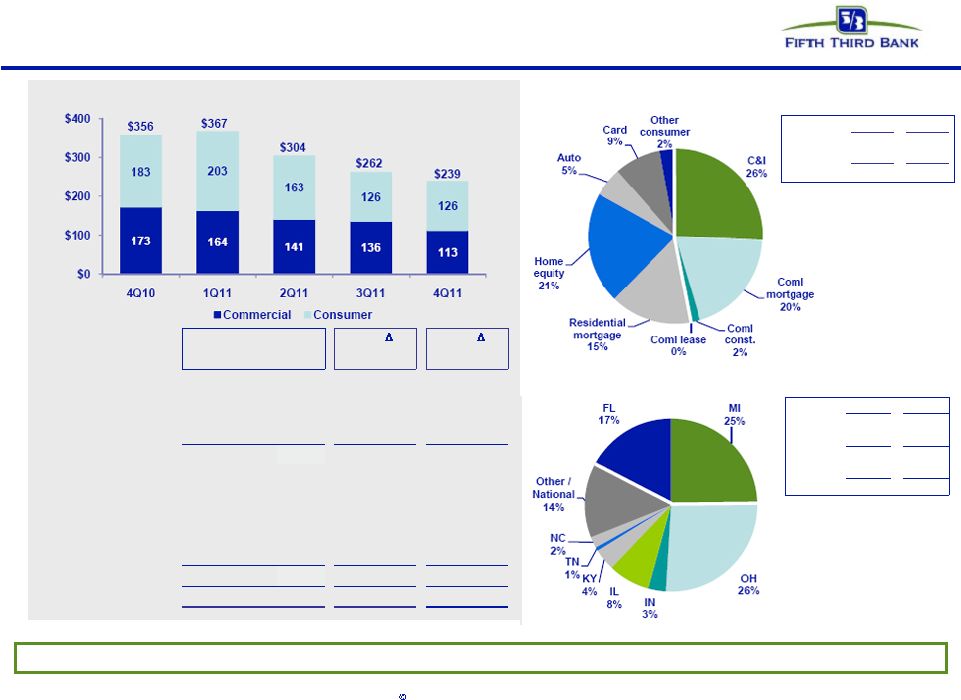
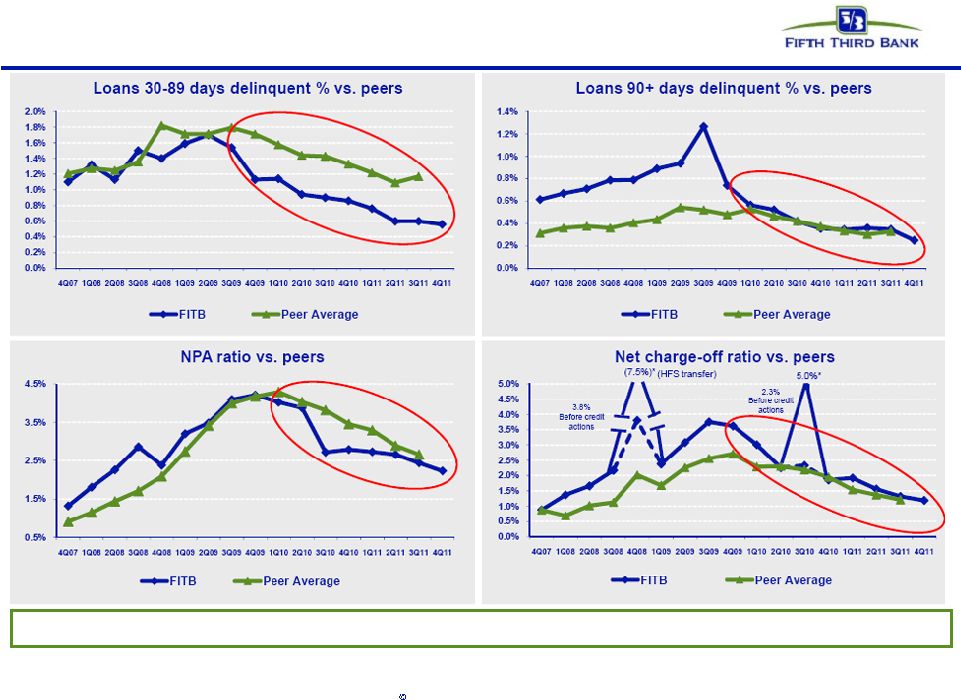
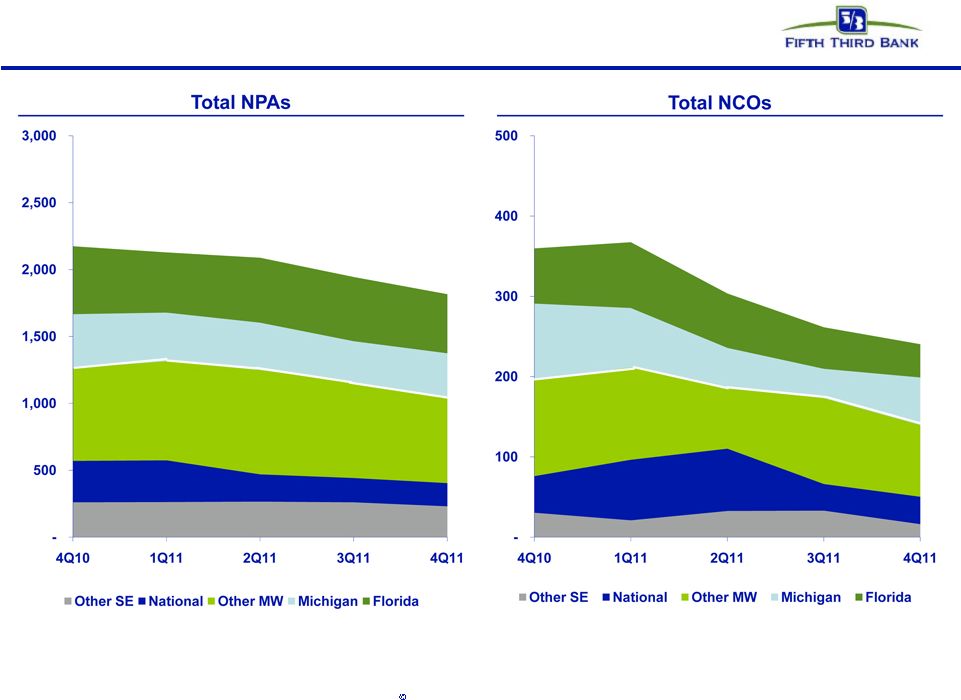
4Q11 net charge-offs of $239 million (1.19% of loans and leases), versus 3Q11 NCOs of $262 million and 4Q10 NCOs of $356 million; lowest NCO level
since 4Q07; 4Q11 provision expense of $55 million compared with 3Q11 provision of $87 million and 4Q10 provision of $166 million |
| |
• |
|
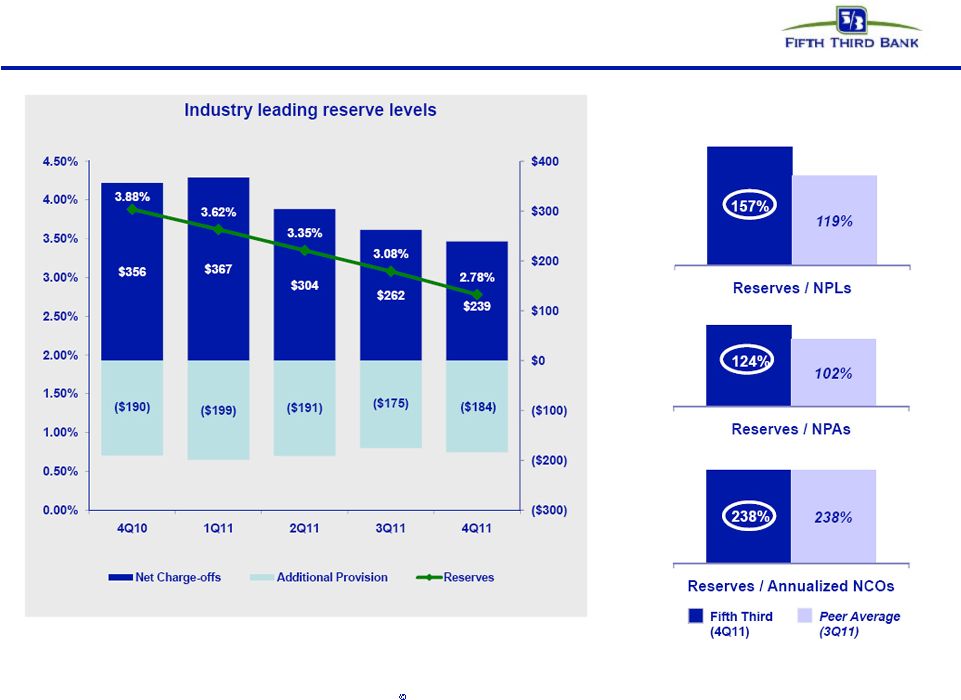
Loan loss allowance declined $184 million, similar to 3Q11 and 4Q10, due to improvement in credit results; allowance to loan ratio of 2.78%, 124% of
nonperforming assets, 157% of nonperforming loans and leases, and 2.4 times 4Q11 annualized net charge-offs |
| |
• |
|
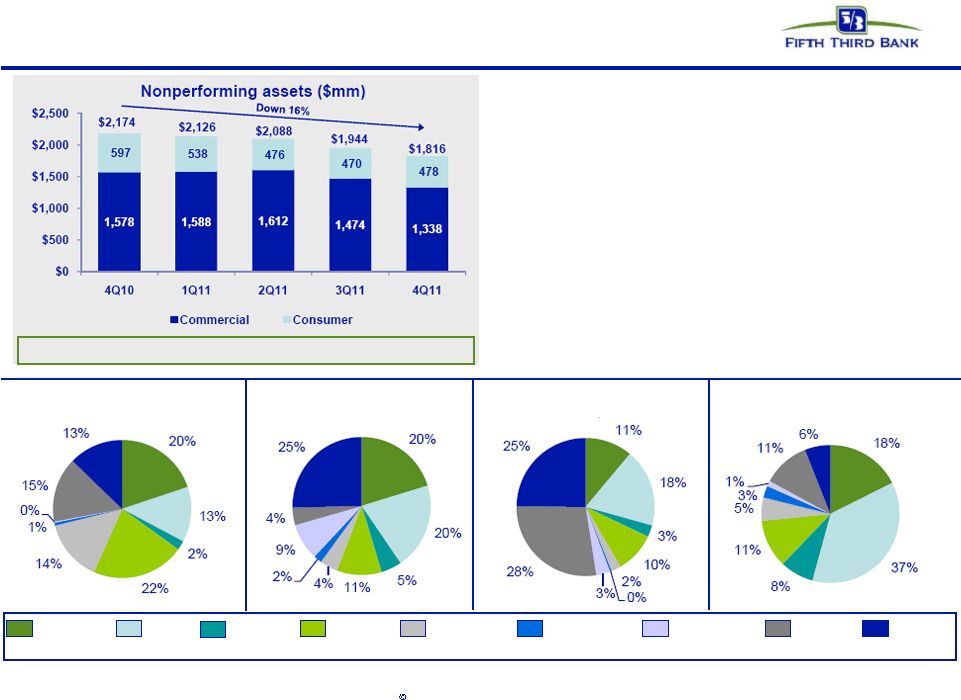
Total nonperforming assets of $2.0 billion including held-for-sale declined $187 million or 9% sequentially; nonperforming assets excluding
held-for-sale of $1.8 billion declined $128 million or 7%; lowest levels since 1Q08 |
| |
• |
|
NPA ratio of 2.23% down 21 bps from 3Q11, NPL ratio of 1.76% down 17 bps from 3Q11; gross NPL inflows of $396 million down 5% sequentially
|
| |
• |
|
Total delinquencies (includes 30-89 days past dues and over 90 days past dues) down 13% sequentially |
| |
• |
|
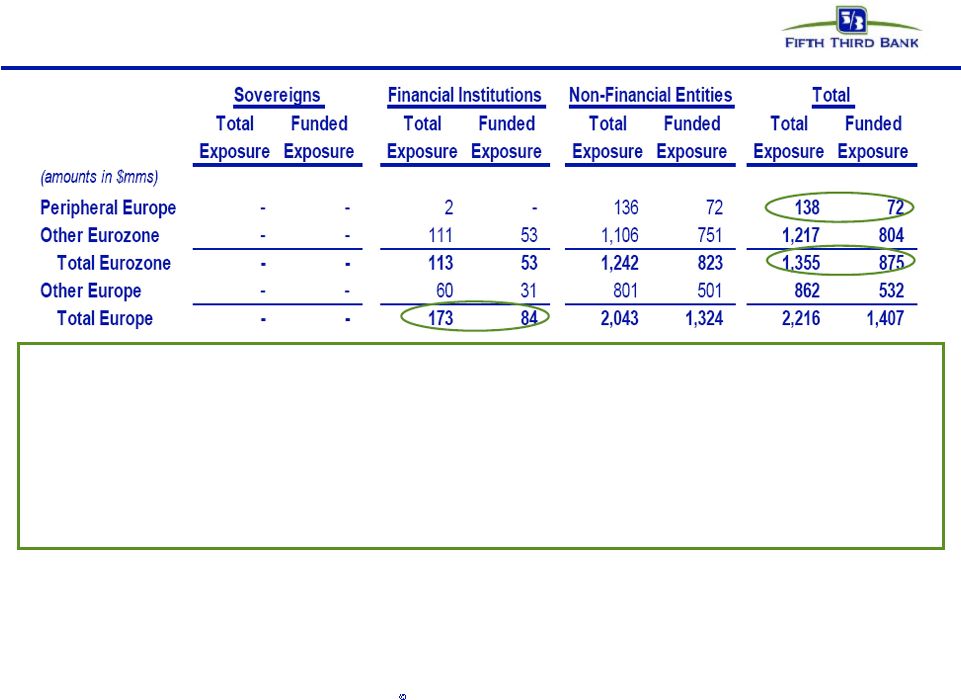
No direct European sovereign exposure; total exposure to European peripheral borrowers less than $0.2 billion; total exposure to European banks less
than $0.2 billion** |
| • |
|
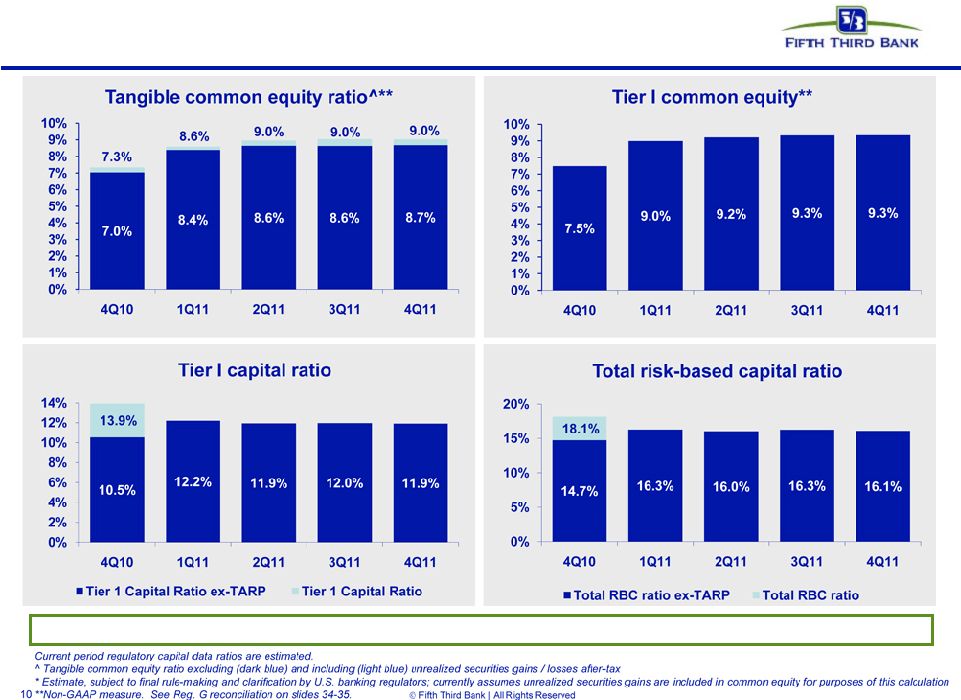
Strong capital ratios; exceed fully phased-in Basel III proposed standards |
| |
• |
|
Tier 1 common ratio 9.34%*, up 1 bp sequentially (pro forma*** ~9.7% on a fully-phased in Basel III-adjusted basis, estimated among highest of large
cap U.S. banks) |
| |
• |
|
Tier 1 capital ratio 11.91%, Total capital ratio 16.08%, Leverage ratio 11.10% |
| |
• |
|
Tangible common equity ratio* of 8.68% excluding unrealized gains/losses; 9.04% including unrealized gains/losses |
| • |
|
Book value per share of $13.92, tangible book value per share* of $11.25 |
| |
• |
|
Tangible book value per share growth 2% from 3Q11, 13% from 4Q10 |
| * |
Non-GAAP measure; See Reg. G reconciliation on page 33 |
| ** |
“European” includes non-Eurozone countries; “European peripheral” includes Greece, Ireland, Italy, Portugal, Spain |
| *** |
Current estimate (non-GAAP), subject to final rule-making and clarification by U.S. banking regulators; currently assumes unrealized securities gains are included in
common equity for purposes of this calculation |
Fifth Third Bancorp (Nasdaq: FITB) today reported full year 2011 net income of $1.3 billion, compared with
net income of $753 million in 2010. After preferred dividends, 2011 net income available to common shareholders was $1.1 billion, or $1.18 per diluted share, compared with 2010 net income available to common shareholders of $503 million, or $0.63
per diluted share. Preferred dividends in the first quarter of 2011 included $153 million, or $0.17 per diluted share, of discount accretion primarily related to the repayment of TARP preferred stock, as well as $15 million, or $0.02 per diluted
share, of contractual dividend payments on the TARP preferred stock. TARP preferred dividends in 2010 were $215 million, or $0.27 per diluted share, including $170 million of contractual dividend payments and $45 million of discount accretion.
Fourth quarter 2011 net income was $314 million, compared with net income of $381 million in the third quarter of 2011 and net income of $333
million in the fourth quarter of 2010. After preferred dividends, fourth quarter 2011 net income available to common shareholders was $305 million or $0.33 per diluted share, compared with third quarter net income of $373 million or $0.40 per
diluted share, and net income of $270 million or $0.33 per diluted share in the fourth quarter of 2010.
As previously announced, fourth
quarter 2011 results included a $54 million pre-tax charge to noninterest income related to changes in the fair value of a swap liability that Fifth Third entered into in conjunction with its sale of Class B Visa shares in 2009 (compared with a $17
million charge in the third quarter of 2011 and a $5 million charge in the fourth quarter of 2010) and a $14 million charge in noninterest expense to increase litigation reserves associated with bankcard association membership. Fourth quarter 2011
results also included $10 million in positive valuation adjustments on Vantiv LLC puts and warrants compared with $3 million in positive valuation adjustments in both the third quarter of 2011 and the fourth quarter of 2010, and investment
securities gains of $5 million compared with gains of $26 million in the third quarter of 2011 and gains of $21 million in the fourth quarter of 2010. Third quarter 2011 results also included $28 million of expense related to the termination of
certain FHLB borrowings and hedging transactions. Fourth quarter 2010 results also included a $17 million charge related to the early extinguishment of $1.0 billion in FHLB borrowings.
2
Earnings Highlights
|
|
|
|
|
|
|
|
|
|
|
|
|
|
|
|
|
|
|
|
|
|
|
|
|
|
|
|
|
| |
|
For the Three Months Ended |
|
|
% Change |
|
| |
|
December
2011 |
|
|
September
2011 |
|
|
June
2011 |
|
|
March
2011 |
|
|
December
2010 |
|
|
Seq |
|
|
Yr/Yr |
|
| Earnings ($ in millions) |
|
|
|
|
|
|
|
|
|
|
|
|
|
|
|
|
|
|
|
|
|
|
|
|
|
|
|
|
| Net income attributable to Bancorp |
|
$ |
314 |
|
|
$ |
381 |
|
|
$ |
337 |
|
|
$ |
265 |
|
|
$ |
333 |
|
|
|
(18 |
%) |
|
|
(6 |
%) |
| Net income available to common shareholders |
|
$ |
305 |
|
|
$ |
373 |
|
|
$ |
328 |
|
|
$ |
88 |
|
|
$ |
270 |
|
|
|
(18 |
%) |
|
|
13 |
% |
|
|
|
|
|
|
|
|
| Common Share Data |
|
|
|
|
|
|
|
|
|
|
|
|
|
|
|
|
|
|
|
|
|
|
|
|
|
|
|
|
| Earnings per share, basic |
|
|
0.33 |
|
|
|
0.41 |
|
|
|
0.36 |
|
|
|
0.10 |
|
|
|
0.34 |
|
|
|
(20 |
%) |
|
|
(3 |
%) |
| Earnings per share, diluted |
|
|
0.33 |
|
|
|
0.40 |
|
|
|
0.35 |
|
|
|
0.10 |
|
|
|
0.33 |
|
|
|
(18 |
%) |
|
|
— |
|
| Cash dividends per common share |
|
|
0.08 |
|
|
|
0.08 |
|
|
|
0.06 |
|
|
|
0.06 |
|
|
|
0.01 |
|
|
|
— |
|
|
|
700 |
% |
|
|
|
|
|
|
|
|
| Financial Ratios |
|
|
|
|
|
|
|
|
|
|
|
|
|
|
|
|
|
|
|
|
|
|
|
|
|
|
|
|
| Return on average assets |
|
|
1.08 |
% |
|
|
1.34 |
% |
|
|
1.22 |
% |
|
|
0.97 |
% |
|
|
1.18 |
% |
|
|
(19 |
%) |
|
|
(8 |
%) |
| Return on average common equity |
|
|
9.5 |
|
|
|
11.9 |
|
|
|
11.0 |
|
|
|
3.1 |
|
|
|
10.4 |
|
|
|
(20 |
%) |
|
|
(9 |
%) |
| Return on average tangible common equity |
|
|
11.9 |
|
|
|
14.9 |
|
|
|
14.0 |
|
|
|
4.2 |
|
|
|
13.9 |
|
|
|
(20 |
%) |
|
|
(14 |
%) |
| Tier I capital |
|
|
11.91 |
|
|
|
11.96 |
|
|
|
11.93 |
|
|
|
12.20 |
|
|
|
13.89 |
|
|
|
— |
|
|
|
(14 |
%) |
| Tier I common equity |
|
|
9.34 |
|
|
|
9.33 |
|
|
|
9.20 |
|
|
|
8.99 |
|
|
|
7.48 |
|
|
|
— |
|
|
|
25 |
% |
| Net interest margin (a) |
|
|
3.67 |
|
|
|
3.65 |
|
|
|
3.62 |
|
|
|
3.71 |
|
|
|
3.75 |
|
|
|
1 |
% |
|
|
(2 |
%) |
| Efficiency (a) |
|
|
67.5 |
|
|
|
60.4 |
|
|
|
59.1 |
|
|
|
62.5 |
|
|
|
62.6 |
|
|
|
12 |
% |
|
|
8 |
% |
| Common shares outstanding (in thousands) |
|
|
919,804 |
|
|
|
919,779 |
|
|
|
919,818 |
|
|
|
918,728 |
|
|
|
796,273 |
|
|
|
— |
|
|
|
16 |
% |
| Average common shares outstanding (in thousands): |
|
|
|
|
|
|
|
|
|
|
|
|
|
|
|
|
|
|
|
|
|
|
|
|
|
|
|
|
| Basic |
|
|
914,997 |
|
|
|
914,947 |
|
|
|
914,601 |
|
|
|
880,830 |
|
|
|
791,072 |
|
|
|
— |
|
|
|
16 |
% |
| Diluted |
|
|
956,349 |
|
|
|
955,490 |
|
|
|
955,478 |
|
|
|
894,841 |
|
|
|
836,225 |
|
|
|
— |
|
|
|
14 |
% |
| (a) |
Presented on a fully taxable equivalent basis |
“Fifth Third’s 2011 results clearly demonstrated continued improvement, with net income available to common shareholders more than doubling
compared with last year,” said Kevin T. Kabat, president and CEO of Fifth Third Bancorp. “We’re growing our loan portfolio, credit trends continued to improve, and we continue to maintain a strong capital position.
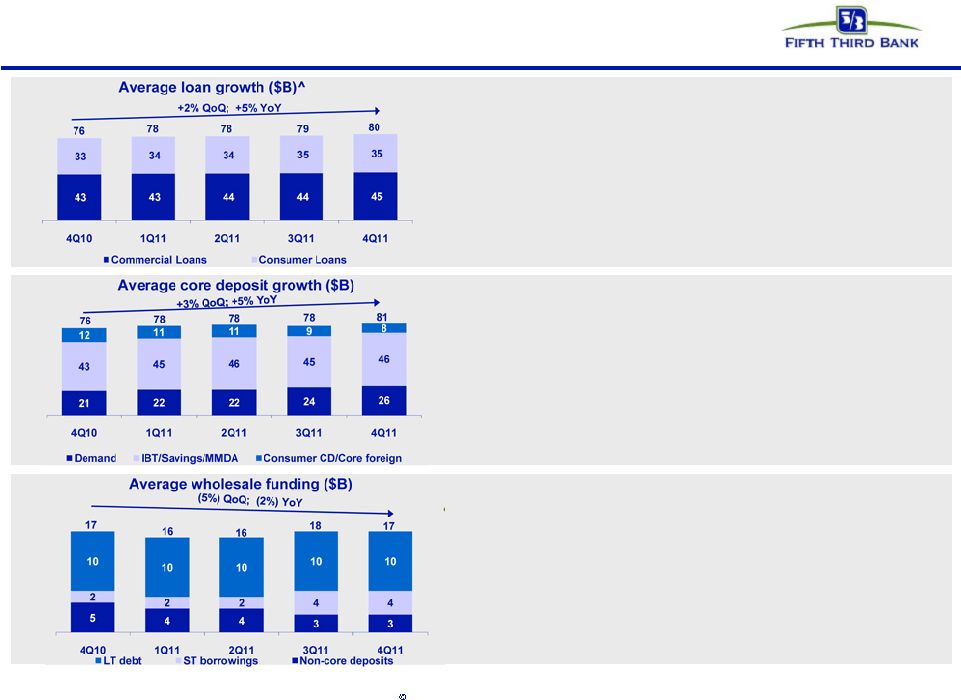
“Throughout 2011, we have seen solid expansion of the loan portfolio through our lending activities, although demand remained relatively soft, with
total loan growth of 5 percent from a year ago. The fourth quarter saw a significant pick-up in demand and loan growth, with end of period total loan growth of 2 percent, including 5 percent in C&I lending which continues to be a strength for
us.
“Growth in loans, along with continued runoff in excess CD balances, drove an expansion in net interest income and net interest
margin, which were up sequentially by 2 percent and 2 basis points, respectively. Noninterest income trends reflected the impact of several fourth quarter developments, including the implementation of new debit interchange regulations, a charge
related to our previous sale of Visa, Inc. shares, and lower mortgage banking revenue relative to last quarter’s strong results. Fourth quarter expenses were elevated due to a litigation reserve charge related to bankcard association membership
and higher compensation expense, which included several unusual items as well as the impact of strong loan production volumes, particularly mortgages, on incentives and fulfillment costs.
“Credit trends continued to be favorable, with net charge-offs down 9 percent sequentially to 1.19 percent of loans and leases, the lowest since 2007. Nonperforming assets (excluding held-for-sale)
declined 7 percent sequentially, and delinquency trends remain consistent with pre-crisis levels.
3
“While regulatory headwinds remain for the industry, as we look to 2012, we believe Fifth Third Bank is
well-positioned to continue to outperform other banking competitors.”
Income Statement Highlights
|
|
|
|
|
|
|
|
|
|
|
|
|
|
|
|
|
|
|
|
|
|
|
|
|
|
|
|
|
| |
|
For the Three Months Ended |
|
|
% Change |
|
| |
|
December
2011 |
|
|
September
2011 |
|
|
June
2011 |
|
|
March
2011 |
|
|
December
2010 |
|
|
Seq |
|
|
Yr/Yr |
|
| Condensed Statements of Income ($ in millions) |
|
|
|
|
|
|
|
|
|
|
|
|
|
|
|
|
|
|
|
|
|
|
|
|
|
|
|
|
| Net interest income (taxable equivalent) |
|
$ |
920 |
|
|
$ |
902 |
|
|
$ |
869 |
|
|
$ |
884 |
|
|
$ |
919 |
|
|
|
2 |
% |
|
|
— |
|
| Provision for loan and lease losses |
|
|
55 |
|
|
|
87 |
|
|
|
113 |
|
|
|
168 |
|
|
|
166 |
|
|
|
(36 |
%) |
|
|
(67 |
%) |
| Total noninterest income |
|
|
550 |
|
|
|
665 |
|
|
|
656 |
|
|
|
584 |
|
|
|
656 |
|
|
|
(17 |
%) |
|
|
(16 |
%) |
| Total noninterest expense |
|
|
993 |
|
|
|
946 |
|
|
|
901 |
|
|
|
918 |
|
|
|
987 |
|
|
|
5 |
% |
|
|
1 |
% |
|
|
|
|
|
|
|
|
|
|
|
|
|
|
|
|
|
|
|
|
|
|
|
|
|
|
|
|
|
| Income before income taxes (taxable equivalent) |
|
|
422 |
|
|
|
534 |
|
|
|
511 |
|
|
|
382 |
|
|
|
422 |
|
|
|
(21 |
%) |
|
|
— |
|
|
|
|
|
|
|
|
|
|
|
|
|
|
|
|
|
|
|
|
|
|
|
|
|
|
|
|
|
|
| Taxable equivalent adjustment |
|
|
4 |
|
|
|
4 |
|
|
|
5 |
|
|
|
5 |
|
|
|
5 |
|
|
|
— |
|
|
|
(20 |
%) |
| Applicable income taxes |
|
|
104 |
|
|
|
149 |
|
|
|
169 |
|
|
|
112 |
|
|
|
83 |
|
|
|
(30 |
%) |
|
|
25 |
% |
|
|
|
|
|
|
|
|
|
|
|
|
|
|
|
|
|
|
|
|
|
|
|
|
|
|
|
|
|
| Net income |
|
|
314 |
|
|
|
381 |
|
|
|
337 |
|
|
|
265 |
|
|
|
334 |
|
|
|
(18 |
%) |
|
|
(6 |
%) |
| Less: Net income attributable to noncontrolling interest |
|
|
— |
|
|
|
— |
|
|
|
— |
|
|
|
— |
|
|
|
1 |
|
|
|
— |
|
|
|
— |
|
|
|
|
|
|
|
|
|
|
|
|
|
|
|
|
|
|
|
|
|
|
|
|
|
|
|
|
|
|
| Net income attributable to Bancorp |
|
|
314 |
|
|
|
381 |
|
|
|
337 |
|
|
|
265 |
|
|
|
333 |
|
|
|
(18 |
%) |
|
|
(6 |
%) |
| Dividends on preferred stock |
|
|
9 |
|
|
|
8 |
|
|
|
9 |
|
|
|
177 |
|
|
|
63 |
|
|
|
13 |
% |
|
|
(86 |
%) |
|
|
|
|
|
|
|
|
|
|
|
|
|
|
|
|
|
|
|
|
|
|
|
|
|
|
|
|
|
| Net income available to common shareholders |
|
|
305 |
|
|
|
373 |
|
|
|
328 |
|
|
|
88 |
|
|
|
270 |
|
|
|
(18 |
%) |
|
|
13 |
% |
|
|
|
|
|
|
|
|
|
|
|
|
|
|
|
|
|
|
|
|
|
|
|
|
|
|
|
|
|
| Earnings per share, diluted |
|
$ |
0.33 |
|
|
$ |
0.40 |
|
|
$ |
0.35 |
|
|
$ |
0.10 |
|
|
$ |
0.33 |
|
|
|
(18 |
%) |
|
|
— |
|
|
|
|
|
|
|
|
|
| Net Interest Income |
|
|
|
|
|
|
|
|
|
|
|
|
|
|
|
|
|
|
|
|
|
|
|
|
|
|
|
|
|
|
|
| |
|
For the Three Months Ended |
|
|
% Change |
|
| |
|
December
2011 |
|
|
September
2011 |
|
|
June
2011 |
|
|
March
2011 |
|
|
December
2010 |
|
|
Seq |
|
|
Yr/Yr |
|
| Interest Income ($ in millions) |
|
|
|
|
|
|
|
|
|
|
|
|
|
|
|
|
|
|
|
|
|
|
|
|
|
|
|
|
| Total interest income (taxable equivalent) |
|
$ |
1,061 |
|
|
$ |
1,059 |
|
|
$ |
1,050 |
|
|
$ |
1,065 |
|
|
$ |
1,109 |
|
|
|
— |
|
|
|
(4 |
%) |
| Total interest expense |
|
|
141 |
|
|
|
157 |
|
|
|
181 |
|
|
|
181 |
|
|
|
190 |
|
|
|
(10 |
%) |
|
|
(26 |
%) |
|
|
|
|
|
|
|
|
|
|
|
|
|
|
|
|
|
|
|
|
|
|
|
|
|
|
|
|
|
| Net interest income (taxable equivalent) |
|
$ |
920 |
|
|
$ |
902 |
|
|
$ |
869 |
|
|
$ |
884 |
|
|
$ |
919 |
|
|
|
2 |
% |
|
|
— |
|
|
|
|
|
|
|
|
|
|
|
|
|
|
|
|
|
|
|
|
|
|
|
|
|
|
|
|
|
|
| Average Yield |
|
|
|
|
|
|
|
|
|
|
|
|
|
|
|
|
|
|
|
|
|
|
|
|
|
|
|
|
| Yield on interest-earning assets (taxable equivalent) |
|
|
4.23 |
% |
|
|
4.28 |
% |
|
|
4.37 |
% |
|
|
4.47 |
% |
|
|
4.52 |
% |
|
|
(1 |
%) |
|
|
(6 |
%) |
| Yield on interest-bearing liabilities |
|
|
0.79 |
% |
|
|
0.86 |
% |
|
|
1.00 |
% |
|
|
1.02 |
% |
|
|
1.04 |
% |
|
|
(8 |
%) |
|
|
(24 |
%) |
|
|
|
|
|
|
|
|
|
|
|
|
|
|
|
|
|
|
|
|
|
|
|
|
|
|
|
|
|
| Net interest rate spread (taxable equivalent) |
|
|
3.44 |
% |
|
|
3.42 |
% |
|
|
3.37 |
% |
|
|
3.45 |
% |
|
|
3.48 |
% |
|
|
1 |
% |
|
|
(1 |
%) |
|
|
|
|
|
|
|
|
|
|
|
|
|
|
|
|
|
|
|
|
|
|
|
|
|
|
|
|
|
| Net interest margin (taxable equivalent) |
|
|
3.67 |
% |
|
|
3. 65 |
% |
|
|
3.62 |
% |
|
|
3.71 |
% |
|
|
3.75 |
% |
|
|
1 |
% |
|
|
(2 |
%) |
|
|
|
|
|
|
|
|
| Average Balances ($ in millions) |
|
|
|
|
|
|
|
|
|
|
|
|
|
|
|
|
|
|
|
|
|
|
|
|
|
|
|
|
| Loans and leases, including held for sale |
|
$ |
82,278 |
|
|
$ |
80,013 |
|
|
$ |
79,153 |
|
|
$ |
79,379 |
|
|
$ |
79,148 |
|
|
|
3 |
% |
|
|
4 |
% |
| Total securities and other short-term investments |
|
|
17,243 |
|
|
|
18,142 |
|
|
|
17,192 |
|
|
|
17,290 |
|
|
|
18,066 |
|
|
|
(5 |
%) |
|
|
(5 |
%) |
| Total interest-earning assets |
|
|
99,521 |
|
|
|
98,155 |
|
|
|
96,345 |
|
|
|
96,669 |
|
|
|
97,214 |
|
|
|
1 |
% |
|
|
2 |
% |
| Total interest-bearing liabilities |
|
|
71,467 |
|
|
|
72,473 |
|
|
|
72,503 |
|
|
|
72,372 |
|
|
|
72,657 |
|
|
|
(1 |
%) |
|
|
(2 |
%) |
| Bancorp shareholders’ equity |
|
|
13,147 |
|
|
|
12,841 |
|
|
|
12,365 |
|
|
|
13,052 |
|
|
|
14,007 |
|
|
|
2 |
% |
|
|
(6 |
%) |
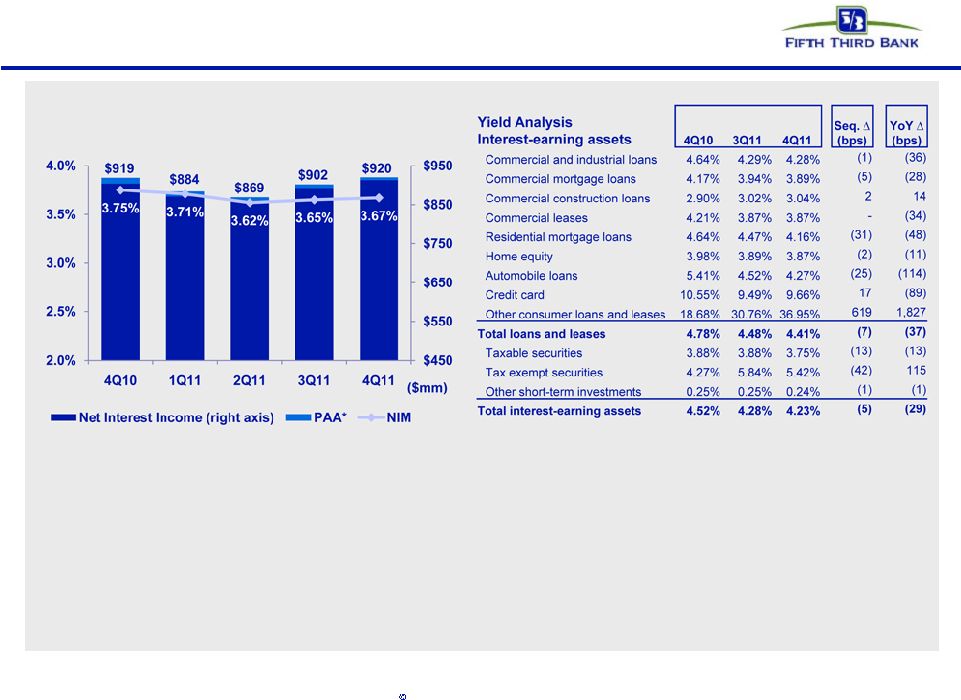
Net interest income of $920 million on a fully taxable equivalent basis increased $18 million from the third quarter of
2011. Interest income increased $2 million and interest expense declined $16 million. Interest income results reflected a $12 million increase from loans and $10 million reduction from securities. Those trends were driven by loan growth, which more
than offset the effect of lower securities balances, lower reinvestment rates on securities given the current interest rate environment, and lower yields on loans. Interest expense improvements were driven by lower deposit costs, including the $16
million impact of continued run-off of high-rate CDs and their replacement into lower yielding products, as well as the benefit from FHLB debt termination and swap redemptions in the third quarter of 2011. These effects were partially offset by
increased expense as a result of hedge ineffectiveness in the fourth quarter of 2011 due to changes in the interest rate environment.
4
The net interest margin was 3.67 percent, an increase of 2 bps from 3.65 percent in the previous quarter.
The increase reflected the net effect of the factors mentioned in the net interest income discussion, with net certificate of deposit (CD) runoff contributing approximately 7 bps to the margin and loan growth contributing 2 bps, while lower loan
yields reduced the margin by approximately 5 bps while increased hedge ineffectiveness reduced the margin by 2 bps.
Compared with the fourth
quarter of 2010, net interest income increased $1 million and the net interest margin decreased 8 bps, which was largely the result of lower loan and investment securities yields, partially offset by higher average loan balances, run-off in
higher-priced CDs, and mix shift to lower cost deposit products.
Securities
Average securities and other short-term investments were $17.2 billion in the fourth quarter of 2011 compared with $18.1 billion in the previous quarter and $18.1 billion in the fourth quarter of 2010.
The decline was related to lower reinvestment of portfolio cash flows and lower short-term investment balances due to the repayment of FHLB borrowings entered into during the debt ceiling crisis.
Loans
|
|
|
|
|
|
|
|
|
|
|
|
|
|
|
|
|
|
|
|
|
|
|
|
|
|
|
|
|
| |
|
For the Three Months Ended |
|
|
% Change |
|
| |
|
December
2011 |
|
|
September
2011 |
|
|
June
2011 |
|
|
March
2011 |
|
|
December
2010 |
|
|
Seq |
|
|
Yr/Yr |
|
| Average Portfolio Loans and Leases ($ in millions) |
|
|
|
|
|
|
|
|
|
|
|
|
|
|
|
|
|
|
|
|
|
|
|
|
|
|
|
|
| Commercial: |
|
|
|
|
|
|
|
|
|
|
|
|
|
|
|
|
|
|
|
|
|
|
|
|
|
|
|
|
| Commercial and industrial loans |
|
$ |
29,891 |
|
|
$ |
28,777 |
|
|
$ |
27,909 |
|
|
$ |
27,331 |
|
|
$ |
26,338 |
|
|
|
4 |
% |
|
|
13 |
% |
| Commercial mortgage |
|
|
10,262 |
|
|
|
10,050 |
|
|
|
10,394 |
|
|
|
10,685 |
|
|
|
10,985 |
|
|
|
2 |
% |
|
|
(7 |
%) |
| Commercial construction |
|
|
1,132 |
|
|
|
1,752 |
|
|
|
1,918 |
|
|
|
2,030 |
|
|
|
2,171 |
|
|
|
(35 |
%) |
|
|
(48 |
%) |
| Commercial leases |
|
|
3,351 |
|
|
|
3,300 |
|
|
|
3,349 |
|
|
|
3,364 |
|
|
|
3,314 |
|
|
|
2 |
% |
|
|
1 |
% |
|
|
|
|
|
|
|
|
|
|
|
|
|
|
|
|
|
|
|
|
|
|
|
|
|
|
|
|
|
| Subtotal - commercial loans and leases |
|
|
44,636 |
|
|
|
43,879 |
|
|
|
43,570 |
|
|
|
43,410 |
|
|
|
42,808 |
|
|
|
2 |
% |
|
|
4 |
% |
|
|
|
|
|
|
|
|
|
|
|
|
|
|
|
|
|
|
|
|
|
|
|
|
|
|
|
|
|
| Consumer: |
|
|
|
|
|
|
|
|
|
|
|
|
|
|
|
|
|
|
|
|
|
|
|
|
|
|
|
|
| Residential mortgage loans |
|
|
10,464 |
|
|
|
10,006 |
|
|
|
9,654 |
|
|
|
9,282 |
|
|
|
8,382 |
|
|
|
5 |
% |
|
|
25 |
% |
| Home equity |
|
|
10,810 |
|
|
|
10,985 |
|
|
|
11,144 |
|
|
|
11,376 |
|
|
|
11,655 |
|
|
|
(2 |
%) |
|
|
(7 |
%) |
| Automobile loans |
|
|
11,696 |
|
|
|
11,445 |
|
|
|
11,188 |
|
|
|
11,070 |
|
|
|
10,825 |
|
|
|
2 |
% |
|
|
8 |
% |
| Credit card |
|
|
1,906 |
|
|
|
1,864 |
|
|
|
1,834 |
|
|
|
1,852 |
|
|
|
1,844 |
|
|
|
2 |
% |
|
|
3 |
% |
| Other consumer loans and leases |
|
|
402 |
|
|
|
441 |
|
|
|
547 |
|
|
|
646 |
|
|
|
722 |
|
|
|
(9 |
%) |
|
|
(44 |
%) |
|
|
|
|
|
|
|
|
|
|
|
|
|
|
|
|
|
|
|
|
|
|
|
|
|
|
|
|
|
| Subtotal - consumer loans and leases |
|
|
35,278 |
|
|
|
34,741 |
|
|
|
34,367 |
|
|
|
34,226 |
|
|
|
33,428 |
|
|
|
2 |
% |
|
|
6 |
% |
|
|
|
|
|
|
|
|
|
|
|
|
|
|
|
|
|
|
|
|
|
|
|
|
|
|
|
|
|
| Total average loans and leases (excluding held for sale) |
|
$ |
79,914 |
|
|
$ |
78,620 |
|
|
$ |
77,937 |
|
|
$ |
77,636 |
|
|
$ |
76,236 |
|
|
|
2 |
% |
|
|
5 |
% |
|
|
|
|
|
|
|
|
| Average loans held for sale |
|
|
2,364 |
|
|
|
1,393 |
|
|
|
1,216 |
|
|
|
1,743 |
|
|
|
2,912 |
|
|
|
70 |
% |
|
|
(19 |
%) |
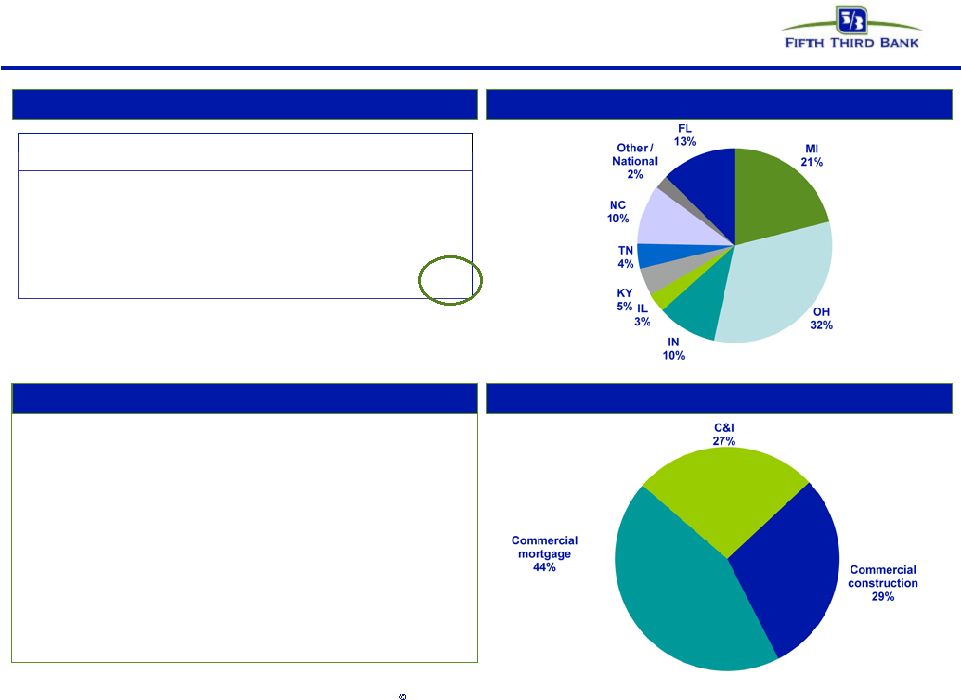
Average and end of period loan and lease balances (excluding loans held-for-sale) were up 2 percent sequentially and 5
percent from the fourth quarter of 2010.
Average commercial portfolio loan and lease balances were up $757 million sequentially, or 2
percent, and increased $1.8 billion, or 4 percent, from the fourth quarter of 2010. Average C&I loans increased 4 percent sequentially and 13 percent compared with the fourth quarter of 2010. Average commercial mortgage and commercial
construction loan balances declined by a combined 3 percent sequentially and 13 percent from the same period the previous year, reflecting continued low customer demand and current underwriting standards. Commercial line usage, on an end of period
basis, was 32 percent of committed lines in the fourth
5
quarter versus 33 percent in both the third quarter of 2011 and the fourth quarter of 2010. The decline was
primarily due to an increase in committed lines accompanied with relatively stable usage.
Average consumer portfolio loan and lease balances
were up $537 million sequentially, or 2 percent, and increased $1.9 billion, or 6 percent, from the fourth quarter of 2010. Average residential mortgage loans increased 5 percent sequentially, reflecting stronger originations during the quarter as
rates remained at historically low levels, as well as the continued retention of certain branch originated shorter-term fixed-rate residential mortgages which totaled $476 million on an end of period basis in the fourth quarter. Compared with the
fourth quarter of 2010, average residential mortgage loans increased 25 percent and reflected the previously mentioned retention of mortgages. Average auto loans increased 2 percent sequentially and 8 percent year-over-year as loan origination
volumes more than offset pay-downs. The growth outlined above was partially offset by lower home equity loan balances, which declined 2 percent sequentially and 7 percent year-over-year due to lower demand and production.
Average loans held-for-sale of $2.4 billion increased $971 million from third quarter levels primarily due to the high level of mortgage refinancing
activity during the quarter. Compared with the fourth quarter of 2010, average loans held-for-sale decreased $548 million due to the effect of elevated mortgage refinancing activity in 2010 in the fourth quarter 2010 mortgage loan warehouse.
Deposits
|
|
|
|
|
|
|
|
|
|
|
|
|
|
|
|
|
|
|
|
|
|
|
|
|
|
|
|
|
| |
|
For the Three Months Ended |
|
|
% Change |
|
| |
|
December
2011 |
|
|
September
2011 |
|
|
June
2011 |
|
|
March
2011 |
|
|
December
2010 |
|
|
Seq |
|
|
Yr/Yr |
|
| Average Deposits ($ in millions) |
|
|
|
|
|
|
|
|
|
|
|
|
|
|
|
|
|
|
|
|
|
|
|
|
|
|
|
|
| Demand deposits |
|
$ |
26,069 |
|
|
$ |
23,677 |
|
|
$ |
22,174 |
|
|
$ |
21,582 |
|
|
$ |
21,066 |
|
|
|
10 |
% |
|
|
24 |
% |
| Interest checking |
|
|
19,263 |
|
|
|
18,322 |
|
|
|
18,701 |
|
|
|
18,539 |
|
|
|
17,578 |
|
|
|
5 |
% |
|
|
10 |
% |
| Savings |
|
|
21,715 |
|
|
|
21,747 |
|
|
|
21,817 |
|
|
|
21,324 |
|
|
|
20,602 |
|
|
|
— |
|
|
|
5 |
% |
| Money market |
|
|
5,255 |
|
|
|
5,213 |
|
|
|
5,009 |
|
|
|
5,136 |
|
|
|
4,985 |
|
|
|
1 |
% |
|
|
5 |
% |
| Foreign office (a) |
|
|
3,325 |
|
|
|
3,255 |
|
|
|
3,805 |
|
|
|
3,580 |
|
|
|
3,733 |
|
|
|
2 |
% |
|
|
(11 |
%) |
|
|
|
|
|
|
|
|
|
|
|
|
|
|
|
|
|
|
|
|
|
|
|
|
|
|
|
|
|
| Subtotal - Transaction deposits |
|
|
75,627 |
|
|
|
72,214 |
|
|
|
71,506 |
|
|
|
70,161 |
|
|
|
67,964 |
|
|
|
5 |
% |
|
|
11 |
% |
| Other time |
|
|
4,960 |
|
|
|
6,008 |
|
|
|
6,738 |
|
|
|
7,363 |
|
|
|
8,490 |
|
|
|
(17 |
%) |
|
|
(42 |
%) |
|
|
|
|
|
|
|
|
|
|
|
|
|
|
|
|
|
|
|
|
|
|
|
|
|
|
|
|
|
| Subtotal - Core deposits |
|
|
80,587 |
|
|
|
78,222 |
|
|
|
78,244 |
|
|
|
77,524 |
|
|
|
76,454 |
|
|
|
3 |
% |
|
|
5 |
% |
| Certificates - $100,000 and over |
|
|
3,085 |
|
|
|
3,376 |
|
|
|
3,955 |
|
|
|
4,226 |
|
|
|
4,858 |
|
|
|
(9 |
%) |
|
|
(36 |
%) |
| Other |
|
|
16 |
|
|
|
7 |
|
|
|
2 |
|
|
|
1 |
|
|
|
9 |
|
|
|
147 |
% |
|
|
92 |
% |
|
|
|
|
|
|
|
|
|
|
|
|
|
|
|
|
|
|
|
|
|
|
|
|
|
|
|
|
|
| Total deposits |
|
$ |
83,688 |
|
|
$ |
81,605 |
|
|
$ |
82,201 |
|
|
$ |
81,751 |
|
|
$ |
81,321 |
|
|
|
3 |
% |
|
|
3 |
% |
|
|
|
|
|
|
|
|
|
|
|
|
|
|
|
|
|
|
|
|
|
|
|
|
|
|
|
|
|
| (a) |
Includes commercial customer Eurodollar sweep balances for which the Bancorp pays rates comparable to other commercial deposit accounts. |
Average core deposits increased 3 percent sequentially and 5 percent from the fourth quarter of 2010, as transaction deposit growth was partially offset
by continued runoff of other time deposits. Average transaction deposits, excluding other time deposits, increased 5 percent from the third quarter of 2011 primarily driven by higher demand deposit account (DDA) and interest checking balances.
Year-over-year growth of 11 percent was driven by higher DDA, interest checking, savings, and money market account balances.
Retail average
transaction deposits increased 3 percent sequentially and reflected higher DDA, interest checking, and money market account balances. Growth of 12 percent from the fourth quarter of 2010 reflected higher balances across all transaction deposit
account categories. Consumer CDs included in core
6
deposits declined 17 percent sequentially and 42 percent year-over-year, driven by maturities of higher-rate
CDs and customer reluctance to purchase longer CD maturities given the current low rate environment.
Commercial average transaction deposits
increased 9 percent sequentially and 11 percent from the previous year driven by higher average account balances. Sequential growth reflected seasonally higher inflows to DDAs and interest checking during the quarter, partially offset by lower money
market account balances. Year-over-year growth also reflected higher inflows to DDAs and interest checking, partially offset by lower foreign office deposits and money market account balances. Average public funds balances were $5.4 billion compared
with $5.4 billion in the third quarter of 2011 and $5.1 billion in the fourth quarter of 2010.
Noninterest Income
|
|
|
|
|
|
|
|
|
|
|
|
|
|
|
|
|
|
|
|
|
|
|
|
|
|
|
|
|
| |
|
For the Three Months Ended |
|
|
% Change |
|
| |
|
December
2011 |
|
|
September
2011 |
|
|
June
2011 |
|
|
March
2011 |
|
|
December
2010 |
|
|
Seq |
|
|
Yr/Yr |
|
| Noninterest Income ($ in millions) |
|
|
|
|
|
|
|
|
|
|
|
|
|
|
|
|
|
|
|
|
|
|
|
|
|
|
|
|
| Service charges on deposits |
|
$ |
136 |
|
|
$ |
134 |
|
|
$ |
126 |
|
|
$ |
124 |
|
|
$ |
140 |
|
|
|
1 |
% |
|
|
(3 |
%) |
| Corporate banking revenue |
|
|
82 |
|
|
|
87 |
|
|
|
95 |
|
|
|
86 |
|
|
|
103 |
|
|
|
(5 |
%) |
|
|
(20 |
%) |
| Mortgage banking net revenue |
|
|
156 |
|
|
|
178 |
|
|
|
162 |
|
|
|
102 |
|
|
|
149 |
|
|
|
(12 |
%) |
|
|
5 |
% |
| Investment advisory revenue |
|
|
90 |
|
|
|
92 |
|
|
|
95 |
|
|
|
98 |
|
|
|
93 |
|
|
|
(2 |
%) |
|
|
(3 |
%) |
| Card and processing revenue |
|
|
60 |
|
|
|
78 |
|
|
|
89 |
|
|
|
80 |
|
|
|
81 |
|
|
|
(24 |
%) |
|
|
(26 |
%) |
| Other noninterest income |
|
|
24 |
|
|
|
64 |
|
|
|
83 |
|
|
|
81 |
|
|
|
55 |
|
|
|
(63 |
%) |
|
|
(57 |
%) |
| Securities gains, net |
|
|
5 |
|
|
|
26 |
|
|
|
6 |
|
|
|
8 |
|
|
|
21 |
|
|
|
(81 |
%) |
|
|
(76 |
%) |
| Securities gains, net - non-qualifying hedgeson mortgage servicing rights |
|
|
(3 |
) |
|
|
6 |
|
|
|
— |
|
|
|
5 |
|
|
|
14 |
|
|
|
NM |
|
|
|
NM |
|
|
|
|
|
|
|
|
|
|
|
|
|
|
|
|
|
|
|
|
|
|
|
|
|
|
|
|
|
|
| Total noninterest income |
|
$ |
550 |
|
|
$ |
665 |
|
|
$ |
656 |
|
|
$ |
584 |
|
|
$ |
656 |
|
|
|
(17 |
%) |
|
|
(16 |
%) |
NM: Not Meaningful
Noninterest income of $550
million decreased $115 million sequentially, or 17 percent, and declined $106 million, or 16 percent, compared with year ago results. The sequential decline was primarily driven by lower mortgage banking net revenue, the impact of new debit
interchange regulation on interchange revenue, lower net securities gains, and the effect of valuation adjustments on the Visa total return swap.
Fourth quarter 2011 noninterest income results included a $54 million charge related to the increase in fair value of the liability related to the total return swap entered into as part of the 2009 sale
of Visa, Inc. Class B shares; this compares with a $17 million charge in the third quarter of 2011 and a $5 million charge in the fourth quarter of 2010. Fourth quarter 2011 results also included a $10 million positive valuation adjustment on
warrants and puts related to the 2009 sale of a 51 percent interest in our processing business, compared with $3 million in positive valuation adjustments on these instruments in both the third quarter of 2011 and the fourth quarter of 2010.
Excluding these items, as well as investment securities gains in all periods, noninterest income decreased $64 million, or 10 percent, from the previous quarter. On a year-over-year basis, noninterest income, excluding the items mentioned above,
decreased $48 million, or 8 percent, primarily due to lower debit interchange revenue and mortgage banking revenue.
Service charges on
deposits of $136 million increased 1 percent from the third quarter and decreased 3 percent compared with the same quarter last year. Retail service charges were flat sequentially. Compared
7
with the fourth quarter of 2010, retail service charges declined 7 percent largely due to the implementation of new overdraft regulations and overdraft policies. Commercial service charges
increased 2 percent sequentially due to reductions in earnings credit rates and account growth and were consistent with results from a year ago.
Corporate banking revenue of $82 million decreased 5 percent from the third quarter of 2011 and decreased 20 percent from the same period last year. The sequential decline was primarily driven by lower
foreign exchange, interest rate derivative, and lease related fees. The year-over-year decline was driven by these factors as well as strong syndication fees and institutional sales revenue results in the fourth quarter of 2010.
Mortgage banking net revenue was $156 million in the fourth quarter of 2011, a 12 percent decrease from the third quarter of 2011 and a 5 percent
increase from the fourth quarter of 2010. Fourth quarter 2011 originations were $7.1 billion, compared with $4.5 billion in the previous quarter and $7.4 billion in the fourth quarter of 2010. Fourth quarter 2011 originations resulted in gains of
$152 million on mortgages sold compared with gains of $119 million during the previous quarter and $158 million during the fourth quarter of 2010. Mortgage servicing fees this quarter were $58 million, compared with $59 million in both the third
quarter of 2011 and the fourth quarter of 2010. Mortgage banking net revenue is also affected by net servicing asset value adjustments, which include mortgage servicing rights (MSR) amortization and MSR valuation adjustments (including
mark-to-market adjustments on free-standing derivatives used to economically hedge the MSR portfolio). These net servicing asset valuation adjustments were negative $54 million in the fourth quarter of 2011 (reflecting MSR amortization of $47
million and MSR valuation adjustments of negative $7 million); net zero in the third quarter of 2011 (MSR amortization of $34 million and MSR valuation adjustments of positive $34 million); and negative $67 million in the fourth quarter of 2010 (MSR
amortization of $47 million and MSR valuation adjustments of negative $20 million). The mortgage-servicing asset, net of the valuation reserve, was $681 million at year end on a servicing portfolio of $57 billion.
Net losses on securities held as non-qualifying hedges for the MSR portfolio were $3 million in the fourth quarter of 2011, compared with net gains of $6
million in the third quarter of 2011 and $14 million in the fourth quarter of 2010.
Investment advisory revenue of $90 million decreased 2
percent sequentially and 3 percent from the fourth quarter of 2010. Sequential and year-over-year declines were driven by lower securities and brokerage revenue, institutional trust fees, and mutual fund fees largely due to fluctuations in equity
and bond markets, partially offset by higher private client service revenue due to increased production.
Card and processing revenue was $60
million in the fourth quarter of 2011, a decrease of 24 percent sequentially and 26 percent from the fourth quarter of 2010. The sequential and year-over-year declines were
8
driven by the approximately $30 million impact of the recently enacted debit interchange legislation,
partially offset by increased transaction volumes and initial mitigation activity.
Other noninterest income totaled $24 million in the fourth
quarter of 2011, compared with $64 million in the previous quarter and $55 million in the fourth quarter of 2010. Other noninterest income includes changes in income related to the valuation of the total return swap entered into as part of the 2009
sale of Visa, Inc. Class B shares, revenue from our equity interest in the processing business, and effects of the valuation of warrants and puts related to the processing business sale. For periods ending December 31,
2011, September 30, 2011, and December 31, 2010, reductions in income related to the Visa, Inc. total return swap were $54 million, $17 million, and $5 million, respectively; revenue from our processing business equity interest was
$25 million, $17 million, and $8 million, respectively; and warrant/put valuation adjustments were a benefit of $10 million, $3 million, and $3 million, respectively. Excluding these items, other noninterest income decreased $18 million from the
previous quarter and $6 million from the fourth quarter of 2010.
Net credit-related costs recognized in other noninterest income were $33
million in the fourth quarter of 2011 versus $25 million last quarter and $34 million in the fourth quarter of 2010. Fourth quarter 2011 results included $9 million of net gains on sales of commercial loans held-for-sale and $18 million of fair
value charges on commercial loans held-for-sale, as well as $22 million of losses on other real estate owned (OREO). Third quarter 2011 results included $3 million of net gains on sales of commercial loans held-for-sale and $6 million of fair value
charges on commercial loans held-for-sale, as well as $21 million of losses on OREO. Fourth quarter 2010 results included net losses of $21 million on the sale of loans held-for-sale, $35 million of fair value charges on commercial loans
held-for-sale, and $19 million of losses on OREO.
Net gains on investment securities were $5 million in the fourth quarter of 2011, compared
with investment securities gains of $26 million in the previous quarter and $21 million in the fourth quarter of 2010.
Noninterest Expense
|
|
|
|
|
|
|
|
|
|
|
|
|
|
|
|
|
|
|
|
|
|
|
|
|
|
|
|
|
| |
|
For the Three Months Ended |
|
|
% Change |
|
| |
|
December
2011 |
|
|
September
2011 |
|
|
June
2011 |
|
|
March
2011 |
|
|
December
2010 |
|
|
Seq |
|
|
Yr/Yr |
|
| Noninterest Expense ($ in millions) |
|
|
|
|
|
|
|
|
|
|
|
|
|
|
|
|
|
|
|
|
|
|
|
|
|
|
|
|
| Salaries, wages and incentives |
|
$ |
393 |
|
|
$ |
369 |
|
|
$ |
365 |
|
|
$ |
351 |
|
|
$ |
385 |
|
|
|
7 |
% |
|
|
2 |
% |
| Employee benefits |
|
|
84 |
|
|
|
70 |
|
|
|
79 |
|
|
|
97 |
|
|
|
73 |
|
|
|
21 |
% |
|
|
16 |
% |
| Net occupancy expense |
|
|
79 |
|
|
|
75 |
|
|
|
75 |
|
|
|
77 |
|
|
|
76 |
|
|
|
5 |
% |
|
|
4 |
% |
| Technology and communications |
|
|
48 |
|
|
|
48 |
|
|
|
48 |
|
|
|
45 |
|
|
|
52 |
|
|
|
— |
|
|
|
(8 |
%) |
| Equipment expense |
|
|
27 |
|
|
|
28 |
|
|
|
28 |
|
|
|
29 |
|
|
|
32 |
|
|
|
(3 |
%) |
|
|
(13 |
%) |
| Card and processing expense |
|
|
28 |
|
|
|
34 |
|
|
|
29 |
|
|
|
29 |
|
|
|
26 |
|
|
|
(17 |
%) |
|
|
9 |
% |
| Other noninterest expense |
|
|
334 |
|
|
|
322 |
|
|
|
277 |
|
|
|
290 |
|
|
|
343 |
|
|
|
4 |
% |
|
|
(3 |
%) |
|
|
|
|
|
|
|
|
|
|
|
|
|
|
|
|
|
|
|
|
|
|
|
|
|
|
|
|
|
| Total noninterest expense |
|
$ |
993 |
|
|
$ |
946 |
|
|
$ |
901 |
|
|
$ |
918 |
|
|
$ |
987 |
|
|
|
5 |
% |
|
|
1 |
% |
|
|
|
|
|
|
|
|
|
|
|
|
|
|
|
|
|
|
|
|
|
|
|
|
|
|
|
|
|
Noninterest expense of $993 million increased 5 percent from the third quarter of 2011 and increased 1 percent from the
fourth quarter of 2010. Fourth quarter 2011 expenses included a $14 million addition to litigation reserves related to bankcard association membership and $5 million in other litigation reserve additions. Third quarter 2011 expenses included $28
million of costs related to the termination of certain
9
FHLB borrowings and hedging transactions. Fourth quarter 2010 included $17 million of expenses related to the termination of $1 billion in FHLB funding. Excluding these items, noninterest expense
increased 6 percent from the third quarter of 2011 and was flat compared with the fourth quarter of 2010, driven by higher compensation and benefits expense, with the former driven by higher loan volume fulfillment costs and incentives, particularly
mortgage, as well as the effect of a higher stock price on long term equity awards, and the latter driven by $6 million of annual pension settlement expense.
Credit costs related to problem assets recorded as noninterest expense totaled $44 million in the fourth quarter of 2011, compared with $45 million in the third quarter of 2011 and $52 million in the
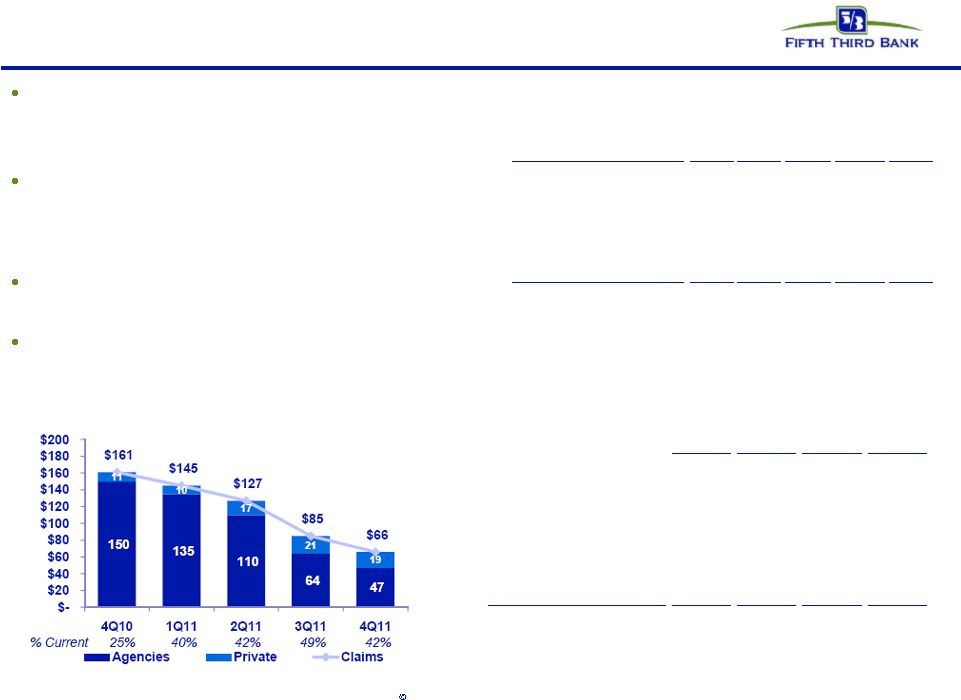
fourth quarter of 2010. Fourth quarter credit-related expenses included provisioning for mortgage repurchases of $18 million, compared with $19 million in the third quarter and $20 million a year ago. (Realized mortgage repurchase losses were $17
million in the fourth quarter of 2011, compared with $31 million last quarter and $23 million in the fourth quarter of 2010.) Provision for unfunded commitments was a benefit of $6 million in the current quarter, compared with a benefit of $10
million last quarter and a benefit of $4 million a year ago. Derivative valuation adjustments related to customer credit risk were a positive $5 million this quarter versus $4 million in expense last quarter and positive $1 million a year ago. OREO
expense was $8 million this quarter, compared with $7 million last quarter and $11 million a year ago. Other problem asset-related expenses were $28 million in the fourth quarter, compared with $25 million the previous quarter and $27 million in the
same period last year.
Credit Quality
|
|
|
|
|
|
|
|
|
|
|
|
|
|
|
|
|
|
|
|
|
| |
|
For the Three Months Ended |
|
| |
|
December
2011 |
|
|
September
2011 |
|
|
June
2011 |
|
|
March
2011 |
|
|
December
2010 |
|
| Total net losses charged off ($ in millions) |
|
|
|
|
|
|
|
|
|
|
|
|
|
|
|
|
|
|
|
|
| Commercial and industrial loans |
|
($ |
62 |
) |
|
($ |
55 |
) |
|
($ |
76 |
) |
|
($ |
83 |
) |
|
($ |
85 |
) |
| Commercial mortgage loans |
|
|
(47 |
) |
|
|
(47 |
) |
|
|
(47 |
) |
|
|
(54 |
) |
|
|
(80 |
) |
| Commercial construction loans |
|
|
(4 |
) |
|
|
(35 |
) |
|
|
(20 |
) |
|
|
(26 |
) |
|
|
(11 |
) |
| Commercial leases |
|
|
— |
|
|
|
1 |
|
|
|
2 |
|
|
|
(1 |
) |
|
|
3 |
|
| Residential mortgage loans |
|
|
(36 |
) |
|
|
(36 |
) |
|
|
(36 |
) |
|
|
(65 |
) |
|
|
(62 |
) |
| Home equity |
|
|
(50 |
) |
|
|
(53 |
) |
|
|
(54 |
) |
|
|
(63 |
) |
|
|
(65 |
) |
| Automobile loans |
|
|
(13 |
) |
|
|
(12 |
) |
|
|
(8 |
) |
|
|
(20 |
) |
|
|
(19 |
) |
| Credit card |
|
|
(21 |
) |
|
|
(18 |
) |
|
|
(28 |
) |
|
|
(31 |
) |
|
|
(33 |
) |
| Other consumer loans and leases |
|
|
(6 |
) |
|
|
(7 |
) |
|
|
(37 |
) |
|
|
(24 |
) |
|
|
(4 |
) |
|
|
|
|
|
|
|
|
|
|
|
|
|
|
|
|
|
|
|
|
|
| Total net losses charged off |
|
|
(239 |
) |
|
|
(262 |
) |
|
|
(304 |
) |
|
|
(367 |
) |
|
|
(356 |
) |
|
|
|
|
|
|
| Total losses |
|
|
(280 |
) |
|
|
(294 |
) |
|
|
(343 |
) |
|
|
(397 |
) |
|
|
(399 |
) |
| Total recoveries |
|
|
41 |
|
|
|
32 |
|
|
|
39 |
|
|
|
30 |
|
|
|
43 |
|
|
|
|
|
|
|
|
|
|
|
|
|
|
|
|
|
|
|
|
|
|
| Total net losses charged off |
|
($ |
239 |
) |
|
($ |
262 |
) |
|
($ |
304 |
) |
|
($ |
367 |
) |
|
($ |
356 |
) |
| Ratios (annualized) |
|
|
|
|
|
|
|
|
|
|
|
|
|
|
|
|
|
|
|
|
| Net losses charged off as a percent of average loans and leases (excluding held for sale) |
|
|
1.19 |
% |
|
|
1.32 |
% |
|
|
1.56 |
% |
|
|
1.92 |
% |
|
|
1.86 |
% |
| Commercial |
|
|
1.00 |
% |
|
|
1.23 |
% |
|
|
1.30 |
% |
|
|
1.52 |
% |
|
|
1.59 |
% |
| Consumer |
|
|
1.43 |
% |
|
|
1.43 |
% |
|
|
1.89 |
% |
|
|
2.43 |
% |
|
|
2.20 |
% |
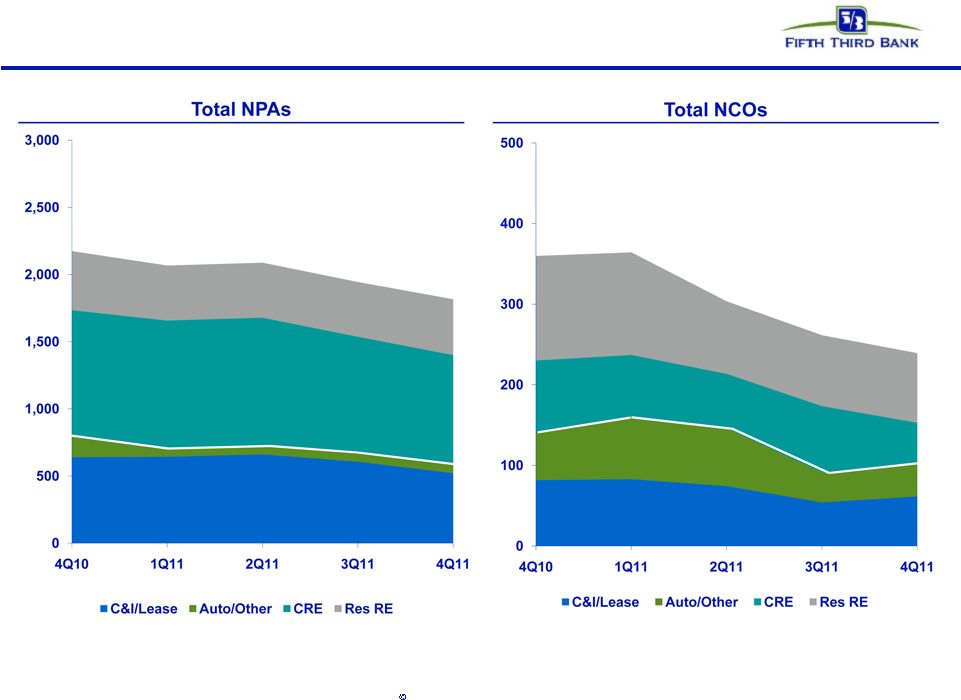
Net charge-offs were $239 million in the fourth quarter of 2011, or 119 bps of average loans on an annualized basis. Net
charge-offs were 9 percent lower than third quarter 2011 net charge-offs of $262 million, and 33 percent lower than fourth quarter 2010 net charge-offs of $356 million.
10
Commercial net charge-offs were $113 million, or 100 bps, down $23 million versus $136 million, or 123 bps,
in the third quarter. C&I net losses were $62 million compared with net losses of $55 million in the previous quarter. Commercial mortgage net losses totaled $47 million, unchanged from the third quarter. Commercial construction net losses were
$4 million, compared with net losses of $35 million in the prior quarter. Net losses on residential builder and developer portfolio loans across the C&I and commercial real estate categories totaled $2 million. Originations of homebuilder /
developer loans were suspended in 2007 and the remaining portfolio balance is $512 million, down from a peak of $3.3 billion in the second quarter of 2008.
Consumer net charge-offs were $126 million, or 143 bps, flat sequentially. Net charge-offs on residential mortgage loans in the portfolio were $36 million, unchanged from the previous quarter. Home equity
net charge-offs were $50 million, versus $53 million in the third quarter. Net losses on brokered home equity loans represented 34 percent of third quarter home equity losses; such loans are 14 percent of the total home equity portfolio. The home
equity portfolio included $1.5 billion of brokered loans, down from a peak of $2.6 billion in 2007; originations of these loans were discontinued in 2007. Net charge-offs in the auto portfolio of $13 million increased $1 million seasonally from the
prior quarter. Net losses on consumer credit card loans were $21 million, up $3 million from the previous quarter. Net charge-offs in other consumer loans were $6 million, down $1 million from the previous quarter.
|
|
|
|
|
|
|
|
|
|
|
|
|
|
|
|
|
|
|
|
|
| |
|
For the Three Months Ended |
|
| |
|
December
2011 |
|
|
September
2011 |
|
|
June
2011 |
|
|
March
2011 |
|
|
December
2010 |
|
| Allowance for Credit Losses ($ in millions) |
|
|
|
|
|
|
|
|
|
|
|
|
|
|
|
|
|
|
|
|
| Allowance for loan and lease losses, beginning |
|
$ |
2,439 |
|
|
$ |
2,614 |
|
|
$ |
2,805 |
|
|
$ |
3,004 |
|
|
$ |
3,194 |
|
| Total net losses charged off |
|
|
(239 |
) |
|
|
(262 |
) |
|
|
(304 |
) |
|
|
(367 |
) |
|
|
(356 |
) |
| Provision for loan and lease losses |
|
|
55 |
|
|
|
87 |
|
|
|
113 |
|
|
|
168 |
|
|
|
166 |
|
|
|
|
|
|
|
|
|
|
|
|
|
|
|
|
|
|
|
|
|
|
| Allowance for loan and lease losses, ending |
|
|
2,255 |
|
|
|
2,439 |
|
|
|
2,614 |
|
|
|
2,805 |
|
|
|
3,004 |
|
|
|
|
|
|
|
| Reserve for unfunded commitments, beginning |
|
|
187 |
|
|
|
197 |
|
|
|
211 |
|
|
|
227 |
|
|
|
231 |
|
| Provision for unfunded commitments |
|
|
(6 |
) |
|
|
(10 |
) |
|
|
(14 |
) |
|
|
(16 |
) |
|
|
(4 |
) |
|
|
|
|
|
|
|
|
|
|
|
|
|
|
|
|
|
|
|
|
|
| Reserve for unfunded commitments, ending |
|
|
181 |
|
|
|
187 |
|
|
|
197 |
|
|
|
211 |
|
|
|
227 |
|
|
|
|
|
|
|
| Components of allowance for credit losses: |
|
|
|
|
|
|
|
|
|
|
|
|
|
|
|
|
|
|
|
|
| Allowance for loan and lease losses |
|
|
2,255 |
|
|
|
2,439 |
|
|
|
2,614 |
|
|
|
2,805 |
|
|
|
3,004 |
|
| Reserve for unfunded commitments |
|
|
181 |
|
|
|
187 |
|
|
|
197 |
|
|
|
211 |
|
|
|
227 |
|
|
|
|
|
|
|
|
|
|
|
|
|
|
|
|
|
|
|
|
|
|
| Total allowance for credit losses |
|
$ |
2,436 |
|
|
$ |
2,626 |
|
|
$ |
2,811 |
|
|
$ |
3,016 |
|
|
$ |
3,231 |
|
| Allowance for loan and lease losses ratio |
|
|
|
|
|
|
|
|
|
|
|
|
|
|
|
|
|
|
|
|
| As a percent of loans and leases |
|
|
2.78 |
% |
|
|
3.08 |
% |
|
|
3.35 |
% |
|
|
3.62 |
% |
|
|
3.88 |
% |
| As a percent of nonperforming loans and leases (a) |
|
|
157 |
% |
|
|
158 |
% |
|
|
160 |
% |
|
|
170 |
% |
|
|
179 |
% |
| As a percent of nonperforming assets (a) |
|
|
124 |
% |
|
|
125 |
% |
|
|
125 |
% |
|
|
132 |
% |
|
|
138 |
% |
| (a) |
Excludes non accrual loans and leases in loans held for sale |
Provision for loan and lease losses totaled $55 million in the fourth quarter of 2011, down $32 million from the third quarter of 2011 and down $111 million from the fourth quarter of 2010. The allowance
for loan and lease losses declined $184 million, reflecting continued improvement in credit trends, a similar reduction to that recorded in recent quarters. This allowance represented 2.78 percent of total loans and leases outstanding as of year
end, compared with 3.08 percent last quarter, and represented 157 percent of nonperforming loans and leases, 124 percent of nonperforming assets, and 238 percent of third quarter annualized net charge-offs.
11
|
|
|
|
|
|
|
|
|
|
|
|
|
|
|
|
|
|
|
|
|
| |
|
|
|
|
|
|
|
As of |
|
|
|
|
| |
|
December
2011 |
|
|
September
2011 |
|
|
June
2011 |
|
|
March
2011 |
|
|
December
2010 |
|
| Nonperforming Assets and Delinquent Loans ($ in millions) |
|
|
|
|
|
|
|
|
|
|
|
|
|
|
|
|
|
|
|
|
| Nonaccrual portfolio loans and leases: |
|
|
|
|
|
|
|
|
|
|
|
|
|
|
|
|
|
|
|
|
| Commercial and industrial loans (a) |
|
$ |
408 |
|
|
$ |
449 |
|
|
$ |
485 |
|
|
$ |
477 |
|
|
$ |
473 |
|
| Commercial mortgage loans |
|
|
358 |
|
|
|
353 |
|
|
|
417 |
|
|
|
415 |
|
|
|
407 |
|
| Commercial construction loans |
|
|
123 |
|
|
|
151 |
|
|
|
147 |
|
|
|
159 |
|
|
|
182 |
|
| Commercial leases |
|
|
9 |
|
|
|
13 |
|
|
|
16 |
|
|
|
11 |
|
|
|
11 |
|
| Residential mortgage loans |
|
|
134 |
|
|
|
142 |
|
|
|
145 |
|
|
|
140 |
|
|
|
152 |
|
| Home equity |
|
|
25 |
|
|
|
25 |
|
|
|
26 |
|
|
|
24 |
|
|
|
23 |
|
| Automobile loans |
|
|
— |
|
|
|
— |
|
|
|
1 |
|
|
|
1 |
|
|
|
1 |
|
| Other consumer loans and leases (a) |
|
|
1 |
|
|
|
1 |
|
|
|
3 |
|
|
|
60 |
|
|
|
84 |
|
|
|
|
|
|
|
|
|
|
|
|
|
|
|
|
|
|
|
|
|
|
| Total nonaccrual loans and leases |
|
$ |
1,058 |
|
|
$ |
1,134 |
|
|
$ |
1,240 |
|
|
$ |
1,287 |
|
|
$ |
1,333 |
|
| Restructured loans and leases - commercial (nonaccrual) |
|
|
160 |
|
|
|
189 |
|
|
|
188 |
|
|
|
149 |
|
|
|
141 |
|
| Restructured loans and leases - consumer (nonaccrual) |
|
|
220 |
|
|
|
215 |
|
|
|
211 |
|
|
|
209 |
|
|
|
206 |
|
|
|
|
|
|
|
|
|
|
|
|
|
|
|
|
|
|
|
|
|
|
| Total nonperforming loans and leases |
|
$ |
1,438 |
|
|
$ |
1,538 |
|
|
$ |
1,639 |
|
|
$ |
1,645 |
|
|
$ |
1,680 |
|
| Repossessed personal property |
|
|
14 |
|
|
|
17 |
|
|
|
15 |
|
|
|
20 |
|
|
|
27 |
|
| Other real estate owned (b) |
|
|
364 |
|
|
|
389 |
|
|
|
434 |
|
|
|
461 |
|
|
|
467 |
|
|
|
|
|
|
|
|
|
|
|
|
|
|
|
|
|
|
|
|
|
|
| Total nonperforming assets (c) |
|
$ |
1,816 |
|
|
$ |
1,944 |
|
|
$ |
2,088 |
|
|
$ |
2,126 |
|
|
$ |
2,174 |
|
| Nonaccrual loans held for sale |
|
|
131 |
|
|
|
171 |
|
|
|
147 |
|
|
|
184 |
|
|
|
247 |
|
| Restructured loans - commercial (nonaccrual) held for sale |
|
|
7 |
|
|
|
26 |
|
|
|
29 |
|
|
|
32 |
|
|
|
47 |
|
|
|
|
|
|
|
|
|
|
|
|
|
|
|
|
|
|
|
|
|
|
| Total nonperforming assets including loans held for sale |
|
$ |
1,954 |
|
|
$ |
2,141 |
|
|
$ |
2,264 |
|
|
$ |
2,342 |
|
|
$ |
2,468 |
|
|
|
|
|
|
|
|
|
|
|
|
|
|
|
|
|
|
|
|
|
|
| Restructured Consumer loans and leases (accrual) |
|
$ |
1,612 |
|
|
$ |
1,601 |
|
|
$ |
1,593 |
|
|
$ |
1,573 |
|
|
$ |
1,560 |
|
| Restructured Commercial loans and leases (accrual) |
|
$ |
390 |
|
|
$ |
349 |
|
|
$ |
266 |
|
|
$ |
243 |
|
|
$ |
228 |
|
|
|
|
|
|
|
| Total loans and leases 90 days past due |
|
$ |
200 |
|
|
$ |
274 |
|
|
$ |
279 |
|
|
$ |
266 |
|
|
$ |
274 |
|
| Nonperforming loans and leases as a percent of portfolio loans, leases and other assets, including other real estate owned
(c) |
|
|
1.76 |
% |
|
|
1.93 |
% |
|
|
2.09 |
% |
|
|
2.11 |
% |
|
|
2.15 |
% |
| Nonperforming assets as a percent of portfolio loans, leases and other assets, including other real estate owned
(c) |
|
|
2.23 |
% |
|
|
2.44 |
% |
|
|
2.66 |
% |
|
|
2.73 |
% |
|
|
2.79 |
% |
| (a) |
Nonaccrual loans and leases at December 31, 2010 reflect a reclassification of $84 million in nonperforming loans from commercial and industrial loans to other
consumer loans and leases which occurred after the Bancorp's Form 8-K was filed on January 19, 2011. This reclassification was primarily a result of the determination that consumer loans obtained in the foreclosure of a commercial loan were
more appropriately categorized as other consumer loans and leases in accordance with regulatory guidelines. |
| (b) |
Excludes government insured advances. |
| (c) |
Does not include nonaccrual loans held-for-sale. |
Total nonperforming assets, including loans held-for-sale, were $2.0 billion, a decline of $187 million, or 9 percent, from the previous quarter.
Nonperforming assets held-for-investment (NPAs) at year end were $1.8 billion or 2.23 percent of total loans, leases and OREO, and decreased $128 million, or 7 percent, from the previous quarter. Nonperforming loans held-for-investment (NPLs) at
year end were $1.4 billion or 1.76 percent of total loans, leases and OREO, and decreased $100 million or 7 percent from the third quarter.
Commercial portfolio NPAs at year end were $1.3 billion, or 2.92 percent of commercial loans, leases and OREO, and decreased $136 million, or 9 percent,
from the third quarter. Commercial portfolio NPLs were $1.1 billion, or 2.31 percent of commercial loans and leases, and decreased $96 million from last quarter. Commercial construction portfolio NPAs were $179 million, a decline of $58 million from
the previous quarter. Commercial mortgage portfolio NPAs were $637 million, up $7 million from the prior quarter. Commercial real estate loans in Michigan and Florida represented 46 percent of commercial real estate NPAs and 38 percent of our total
commercial real estate portfolio. C&I portfolio NPAs of $509 million decreased $79 million from the previous quarter. Within the overall commercial loan portfolio, residential real estate builder and developer portfolio NPAs of $155 million
declined $52 million from the third quarter, of which $53 million were commercial construction assets, $88 million were commercial mortgage assets and $14 million were C&I assets. Commercial portfolio NPAs included $160 million of nonaccrual
troubled debt restructurings (TDRs), compared with $189 million last quarter.
12
Consumer portfolio NPAs of $478 million, or 1.34 percent of consumer loans, leases and OREO, increased $8
million from the third quarter. Consumer portfolio NPLs were $379 million, or 1.06 percent of consumer loans and leases, and decreased $4 million from last quarter. Of consumer NPAs, $416 million were in residential real estate portfolios.
Residential mortgage NPAs were $350 million, $13 million higher than last quarter, with Florida representing 45 percent of residential mortgage NPAs and 16 percent of total residential mortgage loans. Home equity NPAs of $66 million were down $4
million compared with last quarter. Credit card NPAs increased $2 million from the previous quarter to $48 million. Other consumer NPAs were $1 million. Consumer nonaccrual TDRs were $220 million in the fourth quarter of 2011, compared with $215
million in the third quarter.
Fourth quarter OREO balances included in portfolio NPA balances described above were $364 million, down $25
million from $389 million in the third quarter, and included $277 million in commercial OREO and $87 million in consumer OREO. Repossessed personal property of $14 million consisted largely of autos.
Loans still accruing over 90 days past due were $200 million, down $74 million, or 27 percent, from the third quarter of 2011. Commercial balances 90
days past due of $8 million decreased $55 million sequentially. Consumer balances 90 days past due of $192 million were down $19 million from the previous quarter. Loans 30-89 days past due of $452 million decreased $22 million, or 5 percent, from
the previous quarter. Commercial balances 30-89 days past due of $98 million were down $37 million sequentially and consumer balances 30-89 days past due of $354 million increased $15 million from the third quarter.
At year-end, we held $138 million of commercial nonaccrual loans for sale, compared with $197 million at the end of the third quarter. During the quarter
we sold approximately $31 million of non-accrual held-for-sale loans; we transferred approximately $3 million of non-accrual commercial loans from the portfolio to loans held-for-sale, and we transferred approximately $5 million of loans from loans
held-for-sale to OREO. We recorded negative valuation adjustments of $18 million on held-for-sale loans and we recorded net gains of $8 million on loans that were sold or settled during the quarter.
13
Capital Position
|
|
|
|
|
|
|
|
|
|
|
|
|
|
|
|
|
|
|
|
|
| |
|
For the Three Months Ended |
|
| |
|
December
2011 |
|
|
September
2011 |
|
|
June
2011 |
|
|
March
2011 |
|
|
December
2010 |
|
| Capital Position |
|
|
|
|
|
|
|
|
|
|
|
|
|
|
|
|
|
|
|
|
| Average shareholders’ equity to average assets |
|
|
11.41 |
% |
|
|
11.33 |
% |
|
|
11.12 |
% |
|
|
11.77 |
% |
|
|
12.52 |
% |
| Tangible equity (a) |
|
|
9.03 |
% |
|
|
8.98 |
% |
|
|
9.01 |
% |
|
|
8.76 |
% |
|
|
10.42 |
% |
| Tangible common equity (excluding unrealized gains/losses) (a) |
|
|
8.68 |
% |
|
|
8.63 |
% |
|
|
8.64 |
% |
|
|
8.39 |
% |
|
|
7.04 |
% |
| Tangible common equity (including unrealized gains/losses) (a) |
|
|
9.04 |
% |
|
|
9.04 |
% |
|
|
8.96 |
% |
|
|
8.60 |
% |
|
|
7.30 |
% |
| Tangible common equity as a percent of risk-weighted assets (excluding unrealized gains/losses) (a) (b) |
|
|
9.41 |
% |
|
|
9.39 |
% |
|
|
9.28 |
% |
|
|
9.09 |
% |
|
|
7.56 |
% |
|
|
|
|
|
|
| Regulatory capital ratios: (c) |
|
|
|
|
|
|
|
|
|
|
|
|
|
|
|
|
|
|
|
|
| Tier I capital |
|
|
11.91 |
% |
|
|
11.96 |
% |
|
|
11.93 |
% |
|
|
12.20 |
% |
|
|
13.89 |
% |
| Total risk-based capital |
|
|
16.08 |
% |
|
|
16.25 |
% |
|
|
16.03 |
% |
|
|
16.27 |
% |
|
|
18.08 |
% |
| Tier I leverage |
|
|
11.10 |
% |
|
|
11.08 |
% |
|
|
11.03 |
% |
|
|
11.21 |
% |
|
|
12.79 |
% |
| Tier I common equity (a) |
|
|
9.34 |
% |
|
|
9.33 |
% |
|
|
9.20 |
% |
|
|
8.99 |
% |
|
|
7.48 |
% |
| Book value per share |
|
|
13.92 |
|
|
|
13.73 |
|
|
|
13.23 |
|
|
|
12.80 |
|
|
|
13.06 |
|
| Tangible book value per share (a) |
|
|
11.25 |
|
|
|
11.05 |
|
|
|
10.55 |
|
|
|
10.11 |
|
|
|
9.94 |
|
| (a) |
The tangible equity, tangible common equity, tier I common equity and tangible book value per share ratios, while not required by accounting principles generally
accepted in the United States of America (U.S. GAAP), are considered to be critical metrics with which to analyze banks. The ratios have been included herein to facilitate a greater understanding of the Bancorp’s capital structure and financial
condition. See the Regulation G Non-GAAP Reconciliation table for a reconciliation of these ratios to U.S. GAAP. |
| (b) |
Under the banking agencies risk-based capital guidelines, assets and credit equivalent amounts of derivatives and off-balance sheet exposures are assigned to broad risk
categories. The aggregate dollar amount in each risk category is multiplied by the associated risk weight of the category. The resulting weighted values are added together resulting in the Bancorp’s total risk weighted assets.
|
| (c) |
Current period regulatory capital data ratios are estimated. |
Capital ratios remained strong during the quarter and reflected the effect of growth in retained earnings as well as in assets. Compared with the prior quarter, the Tier 1 common equity ratio* increased 1
bp to 9.34 percent. The tangible common equity to tangible assets ratio* was 8.68 percent (excluding unrealized gains/losses) and 9.04 percent (including unrealized gains/losses). The Tier 1 capital ratio decreased 5 bps to 11.91 percent and the
Total capital ratio decreased 17 bps to 16.08 percent; and the Leverage ratio increased 2 bps to 11.10 percent. In addition to the effect of retained earnings and asset growth, the Tier 1, Total, and Leverage capital ratios also reflected the
redemption of $25 million in TruPS during the quarter;
Book value per share at December 31, 2011 was $13.92 and tangible book value per
share* was $11.25, compared with September 30, 2011 book value per share of $13.73 and tangible book value per share* of $11.05.
The
Basel Committee has proposed new capital rules for Internationally Active banks, known as “Basel III.” Fifth Third is subject to U.S. bank regulations for capital, which have not yet been issued in response to the Basel proposals. Fifth
Third’s capital levels exceed current U.S. “well-capitalized” standards and proposed Basel III capital standards, and we expect Fifth Third’s capital levels to continue to exceed U.S. “well-capitalized” standards
including the adoption of U.S. rules that incorporate changes contemplated under Basel III and/or the Dodd-Frank Act.
| * |
Non-GAAP measure; See Reg. G reconciliation on page 33 |
14
Fifth Third’s Tier 1 and Total capital levels at December 31, 2011 included $2.2 billion of TruPS,
or 2.1 percent of risk weighted assets. During the quarter, the Bancorp redeemed at par $25 million of its TruPS. Under the Dodd-Frank financial reform legislation, these TruPS are intended to be phased out of Tier 1 capital over three years
beginning in 2013. The Basel Committee also issued proposals that would include a phase-out of these securities, although over a longer period. We will continue to evaluate the role of these types of securities in our capital structure, based on
regulatory developments. To the extent these types of securities remain outstanding during and after the phase-in period, they would be expected to continue to be included in Total capital, subject to prevailing U.S. capital standards. The Basel
Committee has also proposed adjustments to definitions of capital, including what is to be included in the definition of Tier 1 common, and to risk weightings applied to certain types of assets. We do not currently expect these proposed adjustments,
if adopted into U.S. banking regulations, to negatively affect Fifth Third’s Tier 1 common capital levels and for any potentially positive effect to be modest.
Fifth Third is one of 31 large U.S. Bank Holding Companies (BHCs) subject to the Federal Reserve’s (FRB) Capital Plans Rule which was issued November 22, 2011. Under this rule, we are required
to submit our annual capital plan to the Federal Reserve, for its objection or non-objection. Fifth Third submitted its capital plan on January 9, 2012, as required. The submitted plans included an evaluation of results under four required
macroeconomic scenarios: a baseline and stress scenario determined by the firms, and a baseline and stress scenario provided by the Federal Reserve. As required, the plan also included those capital actions Fifth Third intends to pursue or
contemplate during the period covered by the FRB’s response, which is 2012 and the first quarter of 2013. Our plan for the covered period included the possibility that we would increase our common dividend and would initiate common share
repurchases, although any such actions would be based on the FRB’s non-objection, environmental conditions, earnings results, our capital position, and other factors, as well as approval by the Fifth Third Board of Directors, at the time. The
Federal Reserve has indicated to the BHCs that it will issue its response on or before March 15, 2012. We expect to manage our capital structure over time – including the components represented by common equity and non-common equity –
to adapt to and reflect the effect of legislation, changes in U.S. bank capital regulations that reflect international capital rules developments, regulatory expectations, and our goals for capital levels and capital composition as appropriate given
any changes in rules.
Other
Fifth Third Bank owns a 49 percent interest in Vantiv, LLC, formerly Fifth Third Processing Solutions, LLC. (Advent International owns the remaining 51
percent interest.) The 49 percent interest is recorded on Fifth Third’s balance sheet as an equity method investment with a book value of $576 million. Additionally, Fifth Third has a warrant to purchase additional shares in Vantiv which is
carried as a derivative asset at a fair market value of $111 million, and Advent has a contingent put option to sell shares in Vantiv to Fifth Third which is carried as a derivative liability at a fair market value of $1 million.
15
Conference Call
Fifth Third will host a conference call to discuss these financial results at 9:00 a.m. (Eastern Time) today. This conference call will be webcast live by Thomson Financial and may be accessed through the
Fifth Third Investor Relations website at www.53.com (click on “About Fifth Third” then “Investor Relations”). The webcast also is being distributed over Thomson Financial’s Investor Distribution Network to both
institutional and individual investors. Individual investors can listen to the call through Thomson Financial’s individual investor center at www.earnings.com or by visiting any of the investor sites in Thomson Financial’s Individual
Investor Network. Institutional investors can access the call via Thomson Financial’s password-protected event management site, StreetEvents (www.streetevents.com).
Those unable to listen to the live webcast may access a webcast replay or podcast through the Fifth Third Investor Relations website at the same web address. Additionally, a telephone replay of the
conference call will be available beginning approximately two hours after the conference call until Friday,
February 3rd by dialing 800-585-8367 for domestic
access and 404-537-3406 for international access (passcode 32053529#).
Corporate Profile
Fifth Third Bancorp is a diversified financial services company headquartered in Cincinnati, Ohio. As of December 31, 2011, the Company had $117
billion in assets and operated 15 affiliates with 1,316 full-service Banking Centers, including 104 Bank Mart® locations open seven days a week inside select grocery stores and 2,425 ATMs in Ohio, Kentucky, Indiana, Michigan, Illinois, Florida,
Tennessee, West Virginia, Pennsylvania, Missouri, Georgia and North Carolina. Fifth Third operates four main businesses: Commercial Banking, Branch Banking, Consumer Lending, and Investment Advisors. Fifth Third also has a 49% interest in Vantiv,
LLC, formerly Fifth Third Processing Solutions, LLC. Fifth Third is among the largest money managers in the Midwest and, as of December 31, 2011, had $282 billion in assets under care, of which it managed $24 billion for individuals,
corporations and not-for-profit organizations. Investor information and press releases can be viewed at www.53.com. Fifth Third’s common stock is traded on the NASDAQ® National Global Select Market under the symbol
“FITB.”
Forward-Looking Statements
This news release contains statements that we believe are “forward-looking statements” within the meaning of Section 27A of the Securities Act of 1933, as amended, and Rule 175
promulgated thereunder, and Section 21E of the Securities Exchange Act of 1934, as amended, and Rule 3b-6 promulgated thereunder. These statements relate to our financial condition, results of operations, plans, objectives, future performance
or business. They usually can be identified by the use of forward-looking language such as “will likely result,” “may,” “are expected to,” “is anticipated,” “estimate,” “forecast,”
“projected,” “intends to,” or may include other similar words or phrases such as “believes,” “plans,” “trend,” “objective,” “continue,” “remain,” or similar expressions,
or future or conditional verbs such as “will,” “would,” “should,” “could,” “might,” “can,” or similar verbs. You should not place undue reliance on these statements, as they are subject to
risks and uncertainties, including but not limited to the risk factors set forth in our most recent Annual Report on Form 10-K. When considering these forward-looking statements, you should keep in mind these risks and uncertainties, as well as any
cautionary statements we may make. Moreover, you should treat these statements as speaking only as of the date they are made and based only on information then actually known to us.
There are a number of important factors that could cause future results to differ materially from historical performance and these forward-looking statements. Factors that might cause such a difference
include, but are not limited to: (1) general economic conditions and weakening in the economy, specifically the real estate market, either nationally or in the states in which Fifth Third, one or more acquired entities and/or the combined
company do business, are less favorable than expected; (2) deteriorating credit quality; (3) political developments, wars or other hostilities may disrupt or increase volatility in securities markets or other economic conditions;
(4) changes in the interest rate environment reduce interest margins; (5) prepayment speeds, loan origination and sale volumes, charge-offs and loan loss provisions; (6) Fifth Third’s ability to maintain required capital levels
and adequate sources of funding and liquidity; (7) maintaining capital requirements may limit Fifth Third’s operations and potential growth; (8) changes and trends in capital markets; (9) problems encountered by larger or similar
financial institutions may adversely affect the banking industry and/or Fifth Third; (10) competitive
16
pressures among depository institutions increase significantly; (11) effects of critical accounting policies and judgments; (12) changes in accounting policies or procedures as may be
required by the Financial Accounting Standards Board (FASB) or other regulatory agencies; (13) legislative or regulatory changes or actions, or significant litigation, adversely affect Fifth Third, one or more acquired entities and/or the
combined company or the businesses in which Fifth Third, one or more acquired entities and/or the combined company are engaged, including the Dodd-Frank Wall Street Reform and Consumer Protection Act; (14) ability to maintain favorable ratings
from rating agencies; (15) fluctuation of Fifth Third’s stock price; (16) ability to attract and retain key personnel; (17) ability to receive dividends from its subsidiaries; (18) potentially dilutive effect of future
acquisitions on current shareholders’ ownership of Fifth Third; (19) effects of accounting or financial results of one or more acquired entities; (20) difficulties in separating Vantiv, LLC, formerly Fifth Third Processing Solutions
from Fifth Third; (21) loss of income from any sale or potential sale of businesses that could have an adverse effect on Fifth Third’s earnings and future growth; (22) ability to secure confidential information through the use of
computer systems and telecommunications networks; and (23) the impact of reputational risk created by these developments on such matters as business generation and retention, funding and liquidity.
You should refer to our periodic and current reports filed with the Securities and Exchange Commission, or “SEC,” for further information on
other factors, which could cause actual results to be significantly different from those expressed or implied by these forward-looking statements.
# # #
17
Quarterly Financial Review for December 31, 2011
Table of Contents
|
|
|
|
|
| Financial Highlights |
|
|
19-20 |
|
| Consolidated Statements of Income |
|
|
21 |
|
| Consolidated Statements of Income (Taxable Equivalent) |
|
|
22 |
|
| Consolidated Balance Sheets |
|
|
23-24 |
|
| Consolidated Statements of Changes in Equity |
|
|
25 |
|
| Average Balance Sheet and Yield Analysis |
|
|
26-28 |
|
| Summary of Loans and Leases |
|
|
29 |
|
| Regulatory Capital |
|
|
30 |
|
| Summary of Credit Loss Experience |
|
|
31 |
|
| Asset Quality |
|
|
32 |
|
| Regulation G Non-GAAP Reconciliation |
|
|
33 |
|
| Segment Presentation |
|
|
34 |
|
18
Fifth Third Bancorp and Subsidiaries
Financial Highlights
$ in millions, except per share data
(unaudited)
|
|
|
|
|
|
|
|
|
|
|
|
|
|
|
|
|
|
|
|
|
|
|
|
|
|
|
|
|
|
|
|
|
| |
|
For the Three Months Ended |
|
|
% Change |
|
|
Year to Date |
|
|
% Change |
|
| |
|
December
2011 |
|
|
September
2011 |
|
|
December
2010 |
|
|
Seq |
|
|
Yr/Yr |
|
|
December
2011 |
|
|
December
2010 |
|
|
Yr/Yr |
|
| Income Statement Data |
|
|
|
|
|
|
|
|
|
|
|
|
|
|
|
|
|
|
|
|
|
|
|
|
|
|
|
|
|
|
|
|
| Net interest income (a) |
|
$ |
920 |
|
|
$ |
902 |
|
|
$ |
919 |
|
|
|
2 |
% |
|
|
— |
|
|
$ |
3,575 |
|
|
$ |
3,622 |
|
|
|
(1 |
%) |
| Noninterest income |
|
|
550 |
|
|
|
665 |
|
|
|
656 |
|
|
|
(17 |
%) |
|
|
(16 |
%) |
|
|
2,455 |
|
|
|
2,729 |
|
|
|
(10 |
%) |
| Total revenue (a) |
|
|
1,470 |
|
|
|
1,567 |
|
|
|
1,575 |
|
|
|
(6 |
%) |
|
|
(7 |
%) |
|
|
6,030 |
|
|
|
6,351 |
|
|
|
(5 |
%) |
| Provision for loan and lease losses |
|
|
55 |
|
|
|
87 |
|
|
|
166 |
|
|
|
(36 |
%) |
|
|
(67 |
%) |
|
|
423 |
|
|
|
1,538 |
|
|
|
(73 |
%) |
| Noninterest expense |
|
|
993 |
|
|
|
946 |
|
|
|
987 |
|
|
|
5 |
% |
|
|
1 |
% |
|
|
3,758 |
|
|
|
3,855 |
|
|
|
(3 |
%) |
| Net income attributable to Bancorp |
|
|
314 |
|
|
|
381 |
|
|
|
333 |
|
|
|
(18 |
%) |
|
|
(6 |
%) |
|
|
1,297 |
|
|
|
753 |
|
|
|
72 |
% |
| Net income available to common shareholders |
|
|
305 |
|
|
|
373 |
|
|
|
270 |
|
|
|
(18 |
%) |
|
|
13 |
% |
|
|
1,094 |
|
|
|
503 |
|
|
|
118 |
% |
|
|
|
|
|
|
|
|
|
| Common Share Data |
|
|
|
|
|
|
|
|
|
|
|
|
|
|
|
|
|
|
|
|
|
|
|
|
|
|
|
|
|
|
|
|
| Earnings per share, basic |
|
$ |
0.33 |
|
|
$ |
0.41 |
|
|
$ |
0.34 |
|
|
|
(20 |
%) |
|
|
(3 |
%) |
|
$ |
1.20 |
|
|
$ |
0.63 |
|
|
|
90 |
% |
| Earnings per share, diluted |
|
|
0.33 |
|
|
|
0.40 |
|
|
|
0.33 |
|
|
|
(18 |
%) |
|
|
— |
|
|
|
1.18 |
|
|
|
0.63 |
|
|
|
87 |
% |
| Cash dividends per common share |
|
|
0.08 |
|
|
|
0.08 |
|
|
|
0.01 |
|
|
|
— |
|
|
|
700 |
% |
|
|
0.28 |
|
|
|
0.04 |
|
|
|
600 |
% |
| Book value per share |
|
|
13.92 |
|
|
|
13.73 |
|
|
|
13.06 |
|
|
|
1 |
% |
|
|
7 |
% |
|
|
13.92 |
|
|
|
13.06 |
|
|
|
7 |
% |
| Market price per share |
|
|
12.72 |
|
|
|
10.10 |
|
|
|
14.68 |
|
|
|
26 |
% |
|
|
(13 |
%) |
|
|
12.72 |
|
|
|
14.68 |
|
|
|
(13 |
%) |
| Common shares outstanding (in thousands) |
|
|
919,804 |
|
|
|
919,779 |
|
|
|
796,273 |
|
|
|
— |
|
|
|
16 |
% |
|
|
919,804 |
|
|
|
796,273 |
|
|
|
16 |
% |
| Average common shares outstanding (in thousands): |
|
|
|
|
|
|
|
|
|
|
|
|
|
|
|
|
|
|
|
|
|
|
|
|
|
|
|
|
|
|
|
|
| Basic |
|
|
914,997 |
|
|
|
914,947 |
|
|
|
791,072 |
|
|
|
— |
|
|
|
16 |
% |
|
|
906,461 |
|
|
|
790,852 |
|
|
|
15 |
% |
| Diluted |
|
|
956,349 |
|
|
|
955,490 |
|
|
|
836,225 |
|
|
|
— |
|
|
|
14 |
% |
|
|
949,534 |
|
|
|
799,381 |
|
|
|
19 |
% |
| Market capitalization |
|
$ |
11,700 |
|
|
$ |
9,290 |
|
|
$ |
11,689 |
|
|
|
26 |
% |
|
|
— |
|
|
$ |
11,700 |
|
|
$ |
11,689 |
|
|
|
— |
|
|
|
|
|
|
|
|
|
|
| Financial Ratios |
|
|
|
|
|
|
|
|
|
|
|
|
|
|
|
|
|
|
|
|
|
|
|
|
|
|
|
|
|
|
|
|
| Return on assets |
|
|
1.08 |
% |
|
|
1.34 |
% |
|
|
1.18 |
% |
|
|
(19 |
%) |
|
|
(8 |
%) |
|
|
1.15 |
% |
|
|
0.67 |
% |
|
|
72 |
% |
| Return on average common equity |
|
|
9.5 |
% |
|
|
11.9 |
% |
|
|
10.4 |
% |
|
|
(20 |
%) |
|
|
(9 |
%) |
|
|
9.0 |
% |
|
|
5.0 |
% |
|
|
80 |
% |
| Return on average tangible common equity (b) |
|
|
11.9 |
% |
|
|
14.9 |
% |
|
|
13.9 |
% |
|
|
(20 |
%) |
|
|
(14 |
%) |
|
|
11.4 |
% |
|
|
7.0 |
% |
|
|
63 |
% |
| Noninterest income as a percent of total revenue |
|
|
37 |
% |
|
|
42 |
% |
|
|
42 |
% |
|
|
(12 |
%) |
|
|
(12 |
%) |
|
|
41 |
% |
|
|
43 |
% |
|
|
(5 |
%) |
| Average equity as a percent of average assets |
|
|
11.41 |
% |
|
|
11.33 |
% |
|
|
12.52 |
% |
|
|
1 |
% |
|
|
(9 |
%) |
|
|
11.41 |
% |
|
|
12.22 |
% |
|
|
(7 |
%) |
| Tangible common equity (c) (d) |
|
|
8.68 |
% |
|
|
8.63 |
% |
|
|
7.04 |
% |
|
|
1 |
% |
|
|
23 |
% |
|
|
8.68 |
% |
|
|
7.04 |
% |
|
|
23 |
% |
| Net interest margin (a) |
|
|
3.67 |
% |
|
|
3.65 |
% |
|
|
3.75 |
% |
|
|
1 |
% |
|
|
(2 |
%) |
|
|
3.66 |
% |
|
|
3.66 |
% |
|
|
— |
|
| Efficiency (a) |
|
|
67.5 |
% |
|
|
60.4 |
% |
|
|
62.6 |
% |
|
|
12 |
% |
|
|
8 |
% |
|
|
62.3 |
% |
|
|
60.7 |
% |
|
|
3 |
% |
| Effective tax rate |
|
|
24.9 |
% |
|
|
27.9 |
% |
|
|
20.0 |
% |
|
|
(11 |
%) |
|
|
25 |
% |
|
|
29.1 |
% |
|
|
19.8 |
% |
|
|
47 |
% |
|
|
|
|
|
|
|
|
|
| Credit Quality |
|
|
|
|
|
|
|
|
|
|
|
|
|
|
|
|
|
|
|
|
|
|
|
|
|
|
|
|
|
|
|
|
| Net losses charged off |
|
$ |
239 |
|
|
$ |
262 |
|
|
$ |
356 |
|
|
|
(9 |
%) |
|
|
(33 |
%) |
|
$ |
1,172 |
|
|
$ |
2,328 |
|
|
|
(49 |
%) |
| Net losses charged off as a percent of average loans and leases |
|
|
1.19 |
% |
|
|
1.32 |
% |
|
|
1.86 |
% |
|
|
(10 |
%) |
|
|
(36 |
%) |
|
|
1.49 |
% |
|
|
3.02 |
% |
|
|
(51 |
%) |
| Allowance for loan and lease losses as a percent of loans and leases |
|
|
2.78 |
% |
|
|
3.08 |
% |
|
|
3.88 |
% |
|
|
(10 |
%) |
|
|
(28 |
%) |
|
|
2.78 |
% |
|
|
3.88 |
% |
|
|
(28 |
%) |
| Allowance for credit losses as a percent of loans and leases |
|
|
3.01 |
% |
|
|
3.32 |
% |
|
|
4.17 |
% |
|
|
(9 |
%) |
|
|
(28 |
%) |
|
|
3.01 |
% |
|
|
4.17 |
% |
|
|
(28 |
%) |
| Nonperforming assets as a percent of loans, leases and other assets, including other real estate owned (e) |
|
|
2.23 |
% |
|
|
2.44 |
% |
|
|
2.79 |
% |
|
|
(9 |
%) |
|
|
(20 |
%) |
|
|
2.23 |
% |
|
|
2.79 |
% |
|
|
(20 |
%) |
|
|
|
|
|
|
|
|
|
| Average Balances |
|
|
|
|
|
|
|
|
|
|
|
|
|
|
|
|
|
|
|
|
|
|
|
|
|
|
|
|
|
|
|
|
| Loans and leases, including held for sale |
|
$ |
82,278 |
|
|
$ |
80,013 |
|
|
$ |
79,148 |
|
|
|
3 |
% |
|
|
4 |
% |
|
$ |
80,214 |
|
|
$ |
79,232 |
|
|
|
1 |
% |
| Total securities and other
short-term investments |
|
|
17,243 |
|
|
|
18,142 |
|
|
|
18,066 |
|
|
|
(5 |
%) |
|
|
(5 |
%) |
|
|
17,468 |
|
|
|
19,699 |
|
|
|
(11 |
%) |
| Total assets |
|
|
115,268 |
|
|
|
113,295 |
|
|
|
111,858 |
|
|
|
2 |
% |
|
|
3 |
% |
|
|
112,666 |
|
|
|
112,434 |
|
|
|
— |
|
| Transaction deposits (f) |
|
|
75,627 |
|
|
|
72,214 |
|
|
|
67,964 |
|
|
|
5 |
% |
|
|
11 |
% |
|
|
72,392 |
|
|
|
65,662 |
|
|
|
10 |
% |
| Core deposits (g) |
|
|
80,587 |
|
|
|
78,222 |
|
|
|
76,454 |
|
|
|
3 |
% |
|
|
5 |
% |
|
|
78,652 |
|
|
|
76,188 |
|
|
|
3 |
% |
| Wholesale funding (h) |
|
|
17,081 |
|
|
|
17,932 |
|
|
|
17,269 |
|
|
|
(5 |
%) |
|
|
(1 |
%) |
|
|
16,973 |
|
|
|
18,917 |
|
|
|
(10 |
%) |
| Bancorp shareholders’ equity |
|
|
13,147 |
|
|
|
12,841 |
|
|
|
14,007 |
|
|
|
2 |
% |
|
|
(6 |
%) |
|
|
12,851 |
|
|
|
13,737 |
|
|
|
(6 |
%) |
|
|
|
|
|
|
|
|
|
| Regulatory Capital Ratios (i) |
|
|
|
|
|
|
|
|
|
|
|
|
|
|
|
|
|
|
|
|
|
|
|
|
|
|
|
|
|
|
|
|
| Tier I capital |
|
|
11.91 |
% |
|
|
11.96 |
% |
|
|
13.89 |
% |
|
|
— |
|
|
|
(14 |
%) |
|
|
11.91 |
% |
|
|
13.89 |
% |
|
|
(14 |
%) |
| Total risk-based capital |
|
|
16.08 |
% |
|
|
16.25 |
% |
|
|
18.08 |
% |
|
|
(1 |
%) |
|
|
(11 |
%) |
|
|
16.08 |
% |
|
|
18.08 |
% |
|
|
(11 |
%) |
| Tier I leverage |
|
|
11.10 |
% |
|
|
11.08 |
% |
|
|
12.79 |
% |
|
|
— |
|
|
|
(13 |
%) |
|
|
11.10 |
% |
|
|
12.79 |
% |
|
|
(13 |
%) |
| Tier I common equity (d) |
|
|
9.34 |
% |
|
|
9.33 |
% |
|
|
7.48 |
% |
|
|
— |
|
|
|
25 |
% |
|
|
9.34 |
% |
|
|
7.48 |
% |
|
|
25 |
% |
|
|
|
|
|
|
|
|
|
| Operations |
|
|
|
|
|
|
|
|
|
|
|
|
|
|
|
|
|
|
|
|
|
|
|
|
|
|
|
|
|
|
|
|
| Banking centers |
|
|
1,316 |
|
|
|
1,314 |
|
|
|
1,312 |
|
|
|
— |
|
|
|
— |
|
|
|
1,316 |
|
|
|
1,312 |
|
|
|
— |
|
| ATMs |
|
|
2,425 |
|
|
|
2,437 |
|
|
|
2,445 |
|
|
|
— |
|
|
|
(1 |
%) |
|
|
2,425 |
|
|
|
2,445 |
|
|
|
(1 |
%) |
| Full-time equivalent employees |
|
|
21,334 |
|
|
|
21,172 |
|
|
|
20,838 |
|
|
|
1 |
% |
|
|
2 |
% |
|
|
21,334 |
|
|
|
20,838 |
|
|
|
2 |
% |
| (a) |
Presented on a fully taxable equivalent basis |
| (b) |
The return on average tangible common equity is calculated as tangible net income available to common shareholders (net income available to common shareholders
excluding tax effected amortization of intangibles) divided by average tangible common equity, (average common equity less goodwill and intangible assets). |
| (c) |
The tangible common equity ratio is calculated as tangible common equity (shareholders’ equity less preferred stock, goodwill, intangible assets and accumulated
other comprehensive income) divided by tangible assets (total assets less goodwill, intangible assets and accumulated other comprehensive income.) |
| (d) |
The tangible common equity and tier I common equity ratios, while not required by U.S. GAAP, are considered to be important metrics with which to analyze a bank’s
position. The ratios have been included herein to facilitate a greater understanding of the Bancorp’s capital structure and financial condition. |
| (e) |
Excludes nonaccrual loans held for sale |
| (f) |
Includes demand, interest checking, savings, money market and foreign office deposits of commercial customers |
| (g) |
Includes transaction deposits plus other time deposits |
| (h) |
Includes certificates $100,000 and over, other deposits, federal funds purchased, short-term borrowings and long-term debt |
| (i) |
Current period regulatory capital ratios are estimates |
19
Fifth Third Bancorp and Subsidiaries
Financial Highlights
$ in millions, except per share data
(unaudited)
|
|
|
|
|
|
|
|
|
|
|
|
|
|
|
|
|
|
|
|
|
| |
|
For the Three Months Ended |
|
| |
|
December
2011 |
|
|
September
2011 |
|
|
June
2011 |
|
|
March
2011 |
|
|
December
2010 |
|
| Income Statement Data |
|
|
|
|
|
|
|
|
|
|
|
|
|
|
|
|
|
|
|
|
| Net interest income (a) |
|
$ |
920 |
|
|
$ |
902 |
|
|
$ |
869 |
|
|
$ |
884 |
|
|
$ |
919 |
|
| Noninterest income |
|
|
550 |
|
|
|
665 |
|
|
|
656 |
|
|
|
584 |
|
|
|
656 |
|
| Total revenue (a) |
|
|
1,470 |
|
|
|
1,567 |
|
|
|
1,525 |
|
|
|
1,468 |
|
|
|
1,575 |
|
| Provision for loan and lease losses |
|
|
55 |
|
|
|
87 |
|
|
|
113 |
|
|
|
168 |
|
|
|
166 |
|
| Noninterest expense |
|
|
993 |
|
|
|
946 |
|
|
|
901 |
|
|
|
918 |
|
|
|
987 |
|
| Net income attributable to Bancorp |
|
|
314 |
|
|
|
381 |
|
|
|
337 |
|
|
|
265 |
|
|
|
333 |
|
| Net income available to common shareholders |
|
|
305 |
|
|
|
373 |
|
|
|
328 |
|
|
|
88 |
|
|
|
270 |
|
|
|
|
|
|
|
| Common Share Data |
|
|
|
|
|
|
|
|
|
|
|
|
|
|
|
|
|
|
|
|
| Earnings per share, basic |
|
$ |
0.33 |
|
|
$ |
0.41 |
|
|
$ |
0.36 |
|
|
$ |
0.10 |
|
|
$ |
0.34 |
|
| Earnings per share, diluted |
|
|
0.33 |
|
|
|
0.40 |
|
|
|
0.35 |
|
|
|
0.10 |
|
|
|
0.33 |
|
| Cash dividends per common share |
|
|
0.08 |
|
|
|
0.08 |
|
|
|
0.06 |
|
|
|
0.06 |
|
|
|
0.01 |
|
| Book value per share |
|
|
13.92 |
|
|
|
13.73 |
|
|
|
13.23 |
|
|
|
12.80 |
|
|
|
13.06 |
|
| Market price per share |
|
|
12.72 |
|
|
|
10.10 |
|
|
|
12.75 |
|
|
|
13.89 |
|
|
|
14.68 |
|
| Common shares outstanding (in thousands) |
|
|
919,804 |
|
|
|
919,779 |
|
|
|
919,818 |
|
|
|
918,728 |
|
|
|
796,273 |
|
| Average common shares outstanding (in thousands): |
|
|
|
|
|
|
|
|
|
|
|
|
|
|
|
|
|
|
|
|
| Basic |
|
|
914,997 |
|
|
|
914,947 |
|
|
|
914,601 |
|
|
|
880,830 |
|
|
|
791 ,072 |
|
| Diluted |
|
|
956,349 |
|
|
|
955,490 |
|
|
|
955,478 |
|
|
|
894,841 |
|
|
|
836,225 |
|
| Market capitalization |
|
$ |
11,700 |
|
|
$ |
9,290 |
|
|
$ |
11,728 |
|
|
$ |
12,761 |
|
|
$ |
11,689 |
|
|
|
|
|
|
|
|
Financial Ratios |
|
|
|
|
|
|
|
|
|
|
|
|
|
|
|
|
|
|
|
|
| Return on assets |
|
|
1.08 |
% |
|
|
1.34 |
% |
|
|
1.22 |
% |
|
|
0.97 |
% |
|
|
1.18 |
% |
| Return on average common equity |
|
|
9.5 |
% |
|
|
11.9 |
% |
|
|
11.0 |
% |
|
|
3.1 |
% |
|
|
10.4 |
% |
| Return on average tangible common equity (b) |
|
|
11.9 |
% |
|
|
14.9 |
% |
|
|
14.0 |
% |
|
|
4.2 |
% |
|
|
13.9 |
% |
| Noninterest income as a percent of total revenue |
|
|
37 |
% |
|
|
42 |
% |
|
|
43 |
% |
|
|
40 |
% |
|
|
42 |
% |
| Average equity as a percent of average assets |
|
|
11.41 |
% |
|
|
11.33 |
% |
|
|
11.12 |
% |
|
|
11.77 |
% |
|
|
12.52 |
% |
| Tangible common equity (c) (d) |
|
|
8.68 |
% |
|
|
8.63 |
% |
|
|
8.64 |
% |
|
|
8.39 |
% |
|
|
7.04 |
% |
| Net interest margin (a) |
|
|
3.67 |
% |
|
|
3.65 |
% |
|
|
3.62 |
% |
|
|
3.71 |
% |
|
|
3.75 |
% |
| Efficiency (a) |
|
|
67.5 |
% |
|
|
60.4 |
% |
|
|
59.1 |
% |
|
|
62.5 |
% |
|
|
62.6 |
% |
| Effective tax rate |
|
|
24.9 |
% |
|
|
27.9 |
% |
|
|
33.3 |
% |
|
|
29.7 |
% |
|
|
20.0 |
% |
|
|
|
|
|
|
| Credit Quality |
|
|
|
|
|
|
|
|
|
|
|
|
|
|
|
|
|
|
|
|
| Net losses charged off |
|
$ |
239 |
|
|
$ |
262 |
|
|
$ |
304 |
|
|
$ |
367 |
|
|
$ |
356 |
|
| Net losses charged off as a percent of average loans and leases |
|
|
1.19 |
% |
|
|
1.32 |
% |
|
|
1.56 |
% |
|
|
1.92 |
% |
|
|
1.86 |
% |
| Allowance for loan and lease losses as a percent of loans and leases |
|
|
2.78 |
% |
|
|
3.08 |
% |
|
|
3.35 |
% |
|
|
3.62 |
% |
|
|
3.88 |
% |
| Allowance for credit losses as a percent of loans and leases |
|
|
3.01 |
% |
|
|
3.32 |
% |
|
|
3.61 |
% |
|
|
3.89 |
% |
|
|
4.17 |
% |
| Nonperforming assets as a percent of loans, leases and other assets, including other real estate owned (e) |
|
|
2.23 |
% |
|
|
2.44 |
% |
|
|
2.66 |
% |
|
|
2.73 |
% |
|
|
2.79 |
% |
|
|
|
|
|
|
| Average Balances |
|
|
|
|
|
|
|
|
|
|
|
|
|
|
|
|
|
|
|
|
| Loans and leases, including held for sale |
|
$ |
82,278 |
|
|
$ |
80,013 |
|
|
$ |
79,153 |
|
|
$ |
79,379 |
|
|
$ |
79,148 |
|
| Total securities and other short-term investments |
|
|
17,243 |
|
|
|
18,142 |
|
|
|
17,192 |
|
|
|
17,290 |
|
|
|
18,066 |
|
| Total assets |
|
|
115,268 |
|
|
|
113,295 |
|
|
|
111,200 |
|
|
|
110,844 |
|
|
|
111,858 |
|
| Transaction deposits (f) |
|
|
75,627 |
|
|
|
72,214 |
|
|
|
71,506 |
|
|
|
70,161 |
|
|
|
67,964 |
|
| Core deposits (g) |
|
|
80,587 |
|
|
|
78,222 |
|
|
|
78,244 |
|
|
|
77,524 |
|
|
|
76,454 |
|
| Wholesale funding (h) |
|
|
17,081 |
|
|
|
17,932 |
|
|
|
16,433 |
|
|
|
16,430 |
|
|
|
17,269 |
|
| Bancorp shareholders’ equity |
|
|
13,147 |
|
|
|
12,841 |
|
|
|
12,365 |
|
|
|
13,052 |
|
|
|
14,007 |
|
|
|
|
|
|
|
| Regulatory Capital Ratios (i) |
|
|
|
|
|
|
|
|
|
|
|
|
|
|
|
|
|
|
|
|
| Tier I capital |
|
|
11.91 |
% |
|
|
11.96 |
% |
|
|
11.93 |
% |
|
|
12.20 |
% |
|
|
13.89 |
% |
| Total risk-based capital |
|
|
16.08 |
% |
|
|
16.25 |
% |
|
|
16.03 |
% |
|
|
16.27 |
% |
|
|
18.08 |
% |
| Tier I leverage |
|
|
11.10 |
% |
|
|
11.08 |
% |
|
|
11.03 |
% |
|
|
11.21 |
% |
|
|
12.79 |
% |
| Tier I common equity (d) |
|
|
9.34 |
% |
|
|
9.33 |
% |
|
|
9.20 |
% |
|
|
8.99 |
% |
|
|
7.48 |
% |
|
|
|
|
|
|
| Operations |
|
|
|
|
|
|
|
|
|
|
|
|
|
|
|
|
|
|
|
|
| Banking centers |
|
|
1,316 |
|
|
|
1,314 |
|
|
|
1,316 |
|
|
|
1,310 |
|
|
|
1,312 |
|
| ATMs |
|
|
2,425 |
|
|
|
2,437 |
|
|
|
2,456 |
|
|
|
2,453 |
|
|
|
2,445 |
|
|
:Full-time equivalent employees |
|
|
21,334 |
|
|
|
21,172 |
|
|
|
20,953 |
|
|
|
20,837 |
|
|
|
20,838 |
|
| (a) |
Presented on a fully taxable equivalent basis |
| (b) |
The return on average tangible common equity is calculated as tangible net income available to common shareholders (net income available to common shareholders
excluding tax effected amortization of intangibles) divided by average tangible common equity, (average common equity less goodwill and intangible assets). |
| (c) |
The tangible common equity ratio is calculated as tangible common equity (shareholders’ equity less preferred stock, goodwill, intangible assets and accumulated
other comprehensive income) divided by tangible assets (total assets less goodwill, intangible assets and accumulated other comprehensive income.) |
| (d) |
The tangible common equity and tier I common equity ratios, while not required by U.S. GAAP, are considered to be important metrics with which to analyze a bank’s
position. The ratios have been included herein to facilitate a greater understanding of the Bancorp’s capital structure and financial condition. |
| (e) |
Excludes nonaccrual loans held for sale |
| (f) |
Includes demand, interest checking, savings, money market and foreign office deposits of commercial customers |
| (g) |
Includes transaction deposits plus other time deposits |
| (h) |
Includes certificates $100,000 and over, other deposits, federal funds purchased, short-term borrowings and long-term debt |
| (i) |
Current period regulatory capital ratios are estimates |
20
Fifth Third Bancorp and Subsidiaries
Consolidated Statements of Income
$ in millions
(unaudited)
|
|
|
|
|
|
|
|
|
|
|
|
|
|
|
|
|
|
|
|
|
|
|
|
|
|
|
|
|
|
|
|
|
| |
|
For the Three Months Ended |
|
|
% Change |
|
|
Year to Date |
|
|
% Change |
|
| |
|
December
2011 |
|
|
September
2011 |
|
|
December
2010 |
|
|
Seq |
|
|
Yr/Yr |
|
|
December
2011 |
|
|
December
2010 |
|
|
Yr/Yr |
|
| Interest Income |
|
|
|
|
|
|
|
|
|
|
|
|
|
|
|
|
|
|
|
|
|
|
|
|
|
|
|
|
|
|
|
|
| Interest and fees on loans and leases |
|
$ |
911 |
|
|
$ |
899 |
|
|
$ |
950 |
|
|
|
1 |
% |
|
|
(4 |
%) |
|
$ |
3,613 |
|
|
$ |
3,823 |
|
|
|
(6 |
%) |
| Interest on securities |
|
|
145 |
|
|
|
155 |
|
|
|
152 |
|
|
|
(7 |
%) |
|
|
(5 |
%) |
|
|
600 |
|
|
|
658 |
|
|
|
(9 |
%) |
| Interest on other short-term investments |
|
|
1 |
|
|
|
1 |
|
|
|
2 |
|
|
|
— |
|
|
|
(50 |
%) |
|
|
5 |
|
|
|
8 |
|
|
|
(39 |
%) |
|
|
|
|
|
|
|
|
|
|
|
|
|
|
|
|
|
|
|
|
|
|
|
|
|
|
|
|
|
|
|
|
|
| Total interest income |
|
|
1,057 |
|
|
|
1,055 |
|
|
|
1,104 |
|
|
|
— |
|
|
|
(4 |
%) |
|
|
4,218 |
|
|
|
4,489 |
|
|
|
(6 |
%) |
|
|
|
|
|
|
|
|
|
| Interest Expense |
|
|
|
|
|
|
|
|
|
|
|
|
|
|
|
|
|
|
|
|
|
|
|
|
|
|
|
|
|
|
|
|
| Interest on deposits |
|
|
65 |
|
|
|
84 |
|
|
|
118 |
|
|
|
(22 |
%) |
|
|
(45 |
%) |
|
|
352 |
|
|
|
591 |
|
|
|
(41 |
%) |
| Interest on short-term borrowings |
|
|
1 |
|
|
|
1 |
|
|
|
1 |
|
|
|
— |
|
|
|
— |
|
|
|
4 |
|
|
|
4 |
|
|
|
— |
|
| Interest on long-term debt |
|
|
75 |
|
|
|
72 |
|
|
|
71 |
|
|
|
4 |
% |
|
|
6 |
% |
|
|
305 |
|
|
|
290 |
|
|
|
5 |
% |
|
|
|
|
|
|
|
|
|
|
|
|
|
|
|
|
|
|
|
|
|
|
|
|
|
|
|
|
|
|
|
|
|
| Total interest expense |
|
|
141 |
|
|
|
157 |
|
|
|
190 |
|
|
|
(10 |
%) |
|
|
(26 |
%) |
|
|
661 |
|
|
|
885 |
|
|
|
(25 |
%) |
|
|
|
|
|
|
|
|
|
|
|
|
|
|
|
|
|
|
|
|
|
|
|
|
|
|
|
|
|
|
|
|
|
| Net Interest Income |
|
|
916 |
|
|
|
898 |
|
|
|
914 |
|
|
|
2 |
% |
|
|
— |
|
|
|
3,557 |
|
|
|
3,604 |
|
|
|
(1 |
%) |
|
|
|
|
|
|
|
|
|
| Provision for loan and lease losses |
|
|
55 |
|
|
|
87 |
|
|
|
166 |
|
|
|
(36 |
%) |
|
|
(67 |
%) |
|
|
423 |
|
|
|
1,538 |
|
|
|
(73 |
%) |
|
|
|
|
|
|
|
|
|
|
|
|
|
|
|
|
|
|
|
|
|
|
|
|
|
|
|
|
|
|
|
|
|
| Net interest income after provision for loan and lease losses |
|
|
861 |
|
|
|
811 |
|
|
|
748 |
|
|
|
6 |
% |
|
|
15 |
% |
|
|
3,134 |
|
|
|
2,066 |
|
|
|
52 |
% |
|
|
|
|
|
|
|
|
|
| Noninterest Income |
|
|
|
|
|
|
|
|
|
|
|
|
|
|
|
|
|
|
|
|
|
|
|
|
|
|
|
|
|
|
|
|
| Service charges on deposits |
|
|
136 |
|
|
|
134 |
|
|
|
140 |
|
|
|
1 |
% |
|
|
(3 |
%) |
|
|
520 |
|
|
|
574 |
|
|
|
(9 |
%) |
| Corporate banking revenue |
|
|
82 |
|
|
|
87 |
|
|
|
103 |
|
|
|
(5 |
%) |
|
|
(20 |
%) |
|
|
350 |
|
|
|
364 |
|
|
|
(4 |
%) |
| Mortgage banking net revenue |
|
|
156 |
|
|
|
178 |
|
|
|
149 |
|
|
|
(12 |
%) |
|
|
5 |
% |
|
|
597 |
|
|
|
647 |
|
|
|
(8 |
%) |
| Investment advisory revenue |
|
|
90 |
|
|
|
92 |
|
|
|
93 |
|
|
|
(2 |
%) |
|
|
(3 |
%) |
|
|
375 |
|
|
|
361 |
|
|
|
4 |
% |
| Card and processing revenue |
|
|
60 |
|
|
|
78 |
|
|
|
81 |
|
|
|
(24 |
%) |
|
|
(26 |
%) |
|
|
308 |
|
|
|
316 |
|
|
|
(3 |
%) |
| Other noninterest income |
|
|
24 |
|
|
|
64 |
|
|
|
55 |
|
|
|
(63 |
%) |
|
|
(57 |
%) |
|
|
250 |
|
|
|
406 |
|
|
|
(38 |
%) |
| Securities gains, net |
|
|
5 |
|
|
|
26 |
|
|
|
21 |
|
|
|
(81 |
%) |
|
|
(76 |
%) |
|
|
46 |
|
|
|
47 |
|
|
|
(2 |
%) |
| Securities gains, net - non-qualifying hedges on mortgage servicing rights |
|
|
(3 |
) |
|
|
6 |
|
|
|
14 |
|
|
|
NM |
|
|
|
NM |
|
|
|
9 |
|
|
|
14 |
|
|
|
(36 |
%) |
|
|
|
|
|
|
|
|
|
|
|
|
|
|
|
|
|
|
|
|
|
|
|
|
|
|
|
|
|
|
|
|
|
| Total noninterest income |
|
|
550 |
|
|
|
665 |
|
|
|
656 |
|
|
|
(17 |
%) |
|
|
(16 |
%) |
|
|
2,455 |
|
|
|
2,729 |
|
|
|
(10 |
%) |
|
|
|
|
|
|
|
|
|
| Noninterest Expense |
|
|
|
|
|
|
|
|
|
|
|
|
|
|
|
|
|
|
|
|
|
|
|
|
|
|
|
|
|
|
|
|
| Salaries, wages and incentives |
|
|
393 |
|
|
|
369 |
|
|
|
385 |
|
|
|
7 |
% |
|
|
2 |
% |
|
|
1,478 |
|
|
|
1,430 |
|
|
|
3 |
% |
| Employee benefits |
|
|
84 |
|
|
|
70 |
|
|
|
73 |
|
|
|
21 |
% |
|
|
16 |
% |
|
|
330 |
|
|
|
314 |
|
|
|
5 |
% |
| Net occupancy expense |
|
|
79 |
|
|
|
75 |
|
|
|
76 |
|
|
|
5 |
% |
|
|
4 |
% |
|
|
305 |
|
|
|
298 |
|
|
|
2 |
% |
| Technology and communications |
|
|
48 |
|
|
|
48 |
|
|
|
52 |
|
|
|
— |
|
|
|
(8 |
%) |
|
|
188 |
|
|
|
189 |
|
|
|
(1 |
%) |
| Equipment expense |
|
|
27 |
|
|
|
28 |
|
|
|
32 |
|
|
|
(3 |
%) |
|
|
(13 |
%) |
|
|
113 |
|
|
|
122 |
|
|
|
(8 |
%) |
| Card and processing expense |
|
|
28 |
|
|
|
34 |
|
|
|
26 |
|
|
|
(17 |
%) |
|
|
9 |
% |
|
|
120 |
|
|
|
108 |
|
|
|
12 |
% |
| Other noninterest expense |
|
|
334 |
|
|
|
322 |
|
|
|
343 |
|
|
|
4 |
% |
|
|
(3 |
%) |
|
|
1,224 |
|
|
|
1,394 |
|
|
|
(12 |
%) |
|
|
|
|
|
|
|
|
|
|
|
|
|
|
|
|
|
|
|
|
|
|
|
|
|
|
|
|
|
|
|
|
|
| Total noninterest expense |
|
|
993 |
|
|
|
946 |
|
|
|
987 |
|
|
|
5 |
% |
|
|
1 |
% |
|
|
3,758 |
|
|
|
3,855 |
|
|
|
(3 |
%) |
|
|
|
|
|
|
|
|
|
| Income before income taxes |
|
|
418 |
|
|
|
530 |
|
|
|
417 |
|
|
|
(21 |
%) |
|
|
_ |
|
|
|
1,831 |
|
|
|
940 |
|
|
|
95 |
% |
| Applicable income taxes |
|
|
104 |
|
|
|
149 |
|
|
|
83 |
|
|
|
(30 |
%) |
|
|
25 |
% |
|
|
533 |
|
|
|
187 |
|
|
|
185 |
% |
|
|
|
|
|
|
|
|
|
|
|
|
|
|
|
|
|
|
|
|
|
|
|
|
|
|
|
|
|
|
|
|
|
| Net Income |
|
|
314 |
|
|
|
381 |
|
|
|
334 |
|
|
|
(18 |
%) |
|
|
(6 |
%) |
|
|
1,298 |
|
|
|
753 |
|
|
|
72 |
% |
| Less: Net income attributable to noncontrolling interest |
|
|
— |
|
|
|
— |
|
|
|
1 |
|
|
|
— |
|
|
|
(100 |
%) |
|
|
1 |
|
|
|
— |
|
|
|
100 |
% |
|
|
|
|
|
|
|
|
|
|
|
|
|
|
|
|
|
|
|
|
|
|
|
|
|
|
|
|
|
|
|
|
|
| Net income attributable to Bancorp |
|
|
314 |
|
|
|
381 |
|
|
|
333 |
|
|
|
(18 |
%) |
|
|
(6 |
%) |
|
|
1,297 |
|
|
|
753 |
|
|
|
72 |
% |
| Dividends on preferred stock |
|
|
9 |
|
|
|
8 |
|
|
|
63 |
|
|
|
13 |
% |
|
|
(86 |
%) |
|
|
203 |
|
|
|
250 |
|
|
|
(19 |
%) |
|
|
|
|
|
|
|
|
|
|
|
|
|
|
|
|
|
|
|
|
|
|
|
|
|
|
|
|
|
|
|
|
|
| Net income available to common shareholders |
|
$ |
305 |
|
|
$ |
373 |
|
|
$ |
270 |
|
|
|
(18 |
%) |
|
|
13 |
% |
|
$ |
1,094 |
|
|
$ |
503 |
|
|
|
118 |
% |
|
|
|
|
|
|
|
|
|
|
|
|
|
|
|
|
|
|
|
|
|
|
|
|
|
|
|
|
|
|
|
|
|
21
Fifth Third Bancorp and Subsidiaries
Consolidated Statements of Income (Taxable Equivalent)
$ in millions
(unaudited)
|
|
|
|
|
|
|
|
|
|
|
|
|
|
|
|
|
|
|
|
|
| |
|
For the Three Months Ended |
|
| |
|
December
2011 |
|
|
September
2011 |
|
|
June
2011 |
|
|
March
2011 |
|
|
December
2010 |
|
| Interest Income |
|
|
|
|
|
|
|
|
|
|
|
|
|
|
|
|
|
|
|
|
| Interest and fees on loans and leases |
|
$ |
911 |
|
|
$ |
899 |
|
|
$ |
893 |
|
|
$ |
910 |
|
|
$ |
950 |
|
| Interest on securities |
|
|
145 |
|
|
|
155 |
|
|
|
151 |
|
|
|
149 |
|
|
|
152 |
|
| Interest on other short-term investments |
|
|
1 |
|
|
|
1 |
|
|
|
1 |
|
|
|
1 |
|
|
|
2 |
|
|
|
|
|
|
|
|
|
|
|
|
|
|
|
|
|
|
|
|
|
|
| Total interest income |
|
|
1,057 |
|
|
|
1,055 |
|
|
|
1,045 |
|
|
|
1,060 |
|
|
|
1,104 |
|
| Taxable equivalent adjustment |
|
|
4 |
|
|
|
4 |
|
|
|
5 |
|
|
|
5 |
|
|
|
5 |
|
|
|
|
|
|
|
|
|
|
|
|
|
|
|
|
|
|
|
|
|
|
| Total interest income (taxable equivalent) |
|
|
1,061 |
|
|
|
1,059 |
|
|
|
1,050 |
|
|
|
1,065 |
|
|
|
1,109 |
|
|
|
|
|
|
|
| Interest Expense |
|
|
|
|
|
|
|
|
|
|
|
|
|
|
|
|
|
|
|
|
| Interest on deposits |
|
|
65 |
|
|
|
84 |
|
|
|
97 |
|
|
|
106 |
|
|
|
118 |
|
| Interest on short-term borrowings |
|
|
1 |
|
|
|
1 |
|
|
|
1 |
|
|
|
1 |
|
|
|
1 |
|
| Interest on long-term debt |
|
|
75 |
|
|
|
72 |
|
|
|
83 |
|
|
|
74 |
|
|
|
71 |
|
|
|
|
|
|
|
|
|
|
|
|
|
|
|
|
|
|
|
|
|
|
| Total interest expense |
|
|
141 |
|
|
|
157 |
|
|
|
181 |
|
|
|
181 |
|
|
|
190 |
|
|
|
|
|
|
|
|
|
|
|
|
|
|
|
|
|
|
|
|
|
|
| Net interest income (taxable equivalent) |
|
|
920 |
|
|
|
902 |
|
|
|
869 |
|
|
|
884 |
|
|
|
919 |
|
|
|
|
|
|
|
| Provision for loan and lease losses |
|
|
55 |
|
|
|
87 |
|
|
|
113 |
|
|
|
168 |
|
|
|
166 |
|
|
|
|
|
|
|
|
|
|
|
|
|
|
|
|
|
|
|
|
|
|
| Net interest income (taxable equivalent) after provision for loan and lease losses |
|
|
865 |
|
|
|
815 |
|
|
|
756 |
|
|
|
716 |
|
|
|
753 |
|
|
|
|
|
|
|
| Noninterest Income |
|
|
|
|
|
|
|
|
|
|
|
|
|
|
|
|
|
|
|
|
| Service charges on deposits |
|
|
136 |
|
|
|
134 |
|
|
|
126 |
|
|
|
124 |
|
|
|
140 |
|
| Corporate banking revenue |
|
|
82 |
|
|
|
87 |
|
|
|
95 |
|
|
|
86 |
|
|
|
103 |
|
| Mortgage banking net revenue |
|
|
156 |
|
|
|
178 |
|
|
|
162 |
|
|
|
102 |
|
|
|
149 |
|
| Investment advisory revenue |
|
|
90 |
|
|
|
92 |
|
|
|
95 |
|
|
|
98 |
|
|
|
93 |
|
| Card and processing revenue |
|
|
60 |
|
|
|
78 |
|
|
|
89 |
|
|
|
80 |
|
|
|
81 |
|
| Other noninterest income |
|
|
24 |
|
|
|
64 |
|
|
|
83 |
|
|
|
81 |
|
|
|
55 |
|
| Securities gains, net |
|
|
5 |
|
|
|
26 |
|
|
|
6 |
|
|
|
8 |
|
|
|
21 |
|
| Securities gains, net - non-qualifying hedges on mortgage servicing rights |
|
|
(3 |
) |
|
|
6 |
|
|
|
— |
|
|
|
5 |
|
|
|
14 |
|
|
|
|
|
|
|
|
|
|
|
|
|
|
|
|
|
|
|
|
|
|
| Total noninterest income |
|
|
550 |
|
|
|
665 |
|
|
|
656 |
|
|
|
584 |
|
|
|
656 |
|
|
|
|
|
|
|
| Noninterest Expense |
|
|
|
|
|
|
|
|
|
|
|
|
|
|
|
|
|
|
|
|
| Salaries, wages and incentives |
|
|
393 |
|
|
|
369 |
|
|
|
365 |
|
|
|
351 |
|
|
|
385 |
|
| Employee benefits |
|
|
84 |
|
|
|
70 |
|
|
|
79 |
|
|
|
97 |
|
|
|
73 |
|
| Net occupancy expense |
|
|
79 |
|
|
|
75 |
|
|
|
75 |
|
|
|
77 |
|
|
|
76 |
|
| Technology and communications |
|
|
48 |
|
|
|
48 |
|
|
|
48 |
|
|
|
45 |
|
|
|
52 |
|
| Equipment expense |
|
|
27 |
|
|
|
28 |
|
|
|
28 |
|
|
|
29 |
|
|
|
32 |
|
| Card and processing expense |
|
|
28 |
|
|
|
34 |
|
|
|
29 |
|
|
|
29 |
|
|
|
26 |
|
| Other noninterest expense |
|
|
334 |
|
|
|
322 |
|
|
|
277 |
|
|
|
290 |
|
|
|
343 |
|
|
|
|
|
|
|
|
|
|
|
|
|
|
|
|
|
|
|
|
|
|
| Total noninterest expense |
|
|
993 |
|
|
|
946 |
|
|
|
901 |
|
|
|
918 |
|
|
|
987 |
|
|
|
|
|
|
|
|
|
|
|
|
|
|
|
|
|
|
|
|
|
|
| Income before income taxes (taxable equivalent) |
|
|
422 |
|
|
|
534 |
|
|
|
511 |
|
|
|
382 |
|
|
|
422 |
|
| Taxable equivalent adjustment |
|
|
4 |
|
|
|
4 |
|
|
|
5 |
|
|
|
5 |
|
|
|
5 |
|
|
|
|
|
|
|
|
|
|
|
|
|
|
|
|
|
|
|
|
|
|
| Income before income taxes |
|
|
418 |
|
|
|
530 |
|
|
|
506 |
|
|
|
377 |
|
|
|
417 |
|
| Applicable income taxes |
|
|
104 |
|
|
|
149 |
|
|
|
169 |
|
|
|
112 |
|
|
|
83 |
|
|
|
|
|
|
|
|
|
|
|
|
|
|
|
|
|
|
|
|
|
|
| Net Income |
|
|
314 |
|
|
|
381 |
|
|
|
337 |
|
|
|
265 |
|
|
|
334 |
|
| Less: Net Income attributable to noncontrolling interest |
|
|
— |
|
|
|
— |
|
|
|
— |
|
|
|
— |
|
|
|
1 |
|
|
|
|
|
|
|
|
|
|
|
|
|
|
|
|
|
|
|
|
|
|
| Net income attributable to Bancorp |
|
|
314 |
|
|
|
381 |
|
|
|
337 |
|
|
|
265 |
|
|
|
333 |
|
| Dividends on preferred stock |
|
|
9 |
|
|
|
8 |
|
|
|
9 |
|
|
|
177 |
|
|
|
63 |
|
|
|
|
|
|
|
|
|
|
|
|
|
|
|
|
|
|
|
|
|
|
| Net income available to common shareholders |
|
$ |
305 |
|
|
$ |
373 |
|
|
$ |
328 |
|
|
$ |
88 |
|
|
$ |
270 |
|
|
|
|
|
|
|
|
|
|
|
|
|
|
|
|
|
|
|
|
|
|
22
Fifth Third Bancorp and Subsidiaries
Consolidated Balance Sheets
$ in millions, except per share data
(unaudited)
|
|
|
|
|
|
|
|
|
|
|
|
|
|
|
|
|
|
|
|
|
| |
|
As of |
|
|
% Change |
|
| |
December
2011 |
|
|
September
2011 |
|
|
December
2010 |
|
|
Seq |
|
|
Yr/Yr |
|
| Assets |
|
|
|
|
|
|
|
|
|
|
|
|
|
|
|
|
|
|
|
|
| Cash and due from banks |
|
$ |
2,663 |
|
|
$ |
2,348 |
|
|
$ |
2,159 |
|
|
|
13 |
% |
|
|
23 |
% |
| Available-for-sale and other securities (a) |
|
|
15,362 |
|
|
|
16,227 |
|
|
|
15,414 |
|
|
|
(5 |
%) |
|
|
— |
|
| Held-to-maturity securities (b) |
|
|
322 |
|
|
|
337 |
|
|
|
353 |
|
|
|
(5 |
%) |
|
|
(9 |
%) |
| Trading securities |
|
|
177 |
|
|
|
189 |
|
|
|
294 |
|
|
|
(6 |
%) |
|
|
(40 |
%) |
| Other short-term investments |
|
|
1,781 |
|
|
|
2,028 |
|
|
|
1,515 |
|
|
|
(12 |
%) |
|
|
18 |
% |
| Loans held for sale |
|
|
2,954 |
|
|
|
1,840 |
|
|
|
2,216 |
|
|
|
61 |
% |
|
|
33 |
% |
| Portfolio loans and leases: |
|
|
|
|
|
|
|
|
|
|
|
|
|
|
|
|
|
|
|
|
| Commercial and industrial loans |
|
|
30,783 |
|
|
|
29,258 |
|
|
|
27,191 |
|
|
|
5 |
% |
|
|
13 |
% |
| Commercial mortgage loans |
|
|
10,138 |
|
|
|
10,330 |
|
|
|
10,845 |
|
|
|
(2 |
%) |
|
|
(7 |
%) |
| Commercial construction loans |
|
|
1,020 |
|
|
|
1,213 |
|
|
|
2,048 |
|
|
|
(16 |
%) |
|
|
(50 |
%) |
| Commercial leases |
|
|
3,531 |
|
|
|
3,368 |
|
|
|
3,378 |
|
|
|
5 |
% |
|
|
5 |
% |
| Residential mortgage loans |
|
|
10,672 |
|
|
|
10,249 |
|
|
|
8,956 |
|
|
|
4 |
% |
|
|
19 |
% |
| Home equity |
|
|
10,719 |
|
|
|
10,920 |
|
|
|
11,513 |
|
|
|
(2 |
%) |
|
|
(7 |
%) |
| Automobile loans |
|
|
11,827 |
|
|
|
11,593 |
|
|
|
10,983 |
|
|
|
2 |
% |
|
|
8 |
% |
| Credit card |
|
|
1,978 |
|
|
|
1,878 |
|
|
|
1,896 |
|
|
|
5 |
% |
|
|
4 |
% |
| Other consumer loans and leases |
|
|
350 |
|
|
|
407 |
|
|
|
681 |
|
|
|
(14 |
%) |
|
|
(49 |
%) |
|
|
|
|
|
|
|
|
|
|
|
|
|
|
|
|
|
|
|
|
|
| Portfolio loans and leases |
|
|
81,018 |
|
|
|
79,216 |
|
|
|
77,491 |
|
|
|
2 |
% |
|
|
5 |
% |
| Allowance for loan and lease losses |
|
|
(2,255 |
) |
|
|
(2,439 |
) |
|
|
(3,004 |
) |
|
|
(8 |
%) |
|
|
(25 |
%) |
|
|
|
|
|
|
|
|
|
|
|
|
|
|
|
|
|
|
|
|
|
| Portfolio loans and leases, net |
|
|
78,763 |
|
|
|
76,777 |
|
|
|
74,487 |
|
|
|
3 |
% |
|
|
6 |
% |
| Bank premises and equipment |
|
|
2,447 |
|
|
|
2,410 |
|
|
|
2,389 |
|
|
|
2 |
% |
|
|
2 |
% |
| Operating lease equipment |
|
|
497 |
|
|
|
462 |
|
|
|
479 |
|
|
|
8 |
% |
|
|
4 |
% |
| Goodwill |
|
|
2,417 |
|
|
|
2,417 |
|
|
|
2,417 |
|
|
|
— |
|
|
|
— |
|
| Intangible assets |
|
|
40 |
|
|
|
45 |
|
|
|
62 |
|
|
|
(10 |
%) |
|
|
(36 |
%) |
| Servicing rights |
|
|
681 |
|
|
|
662 |
|
|
|
822 |
|
|
|
3 |
% |
|
|
(17 |
%) |
| Other assets |
|
|
8,863 |
|
|
|
9,163 |
|
|
|
8,400 |
|
|
|
(3 |
%) |
|
|
6 |
% |
|
|
|
|
|
|
|
|
|
|
|
|
|
|
|
|
|
|
|
|
|
| Total assets |
|
$ |
116,967 |
|
|
$ |
114,905 |
|
|
$ |
111,007 |
|
|
|
2 |
% |
|
|
5 |
% |
|
|
|
|
|
|
|
|
|
|
|
|
|
|
|
|
|
|
|
|
|
| Liabilities |
|
|
|
|
|
|
|
|
|
|
|
|
|
|
|
|
|
|
|
|
| Deposits: |
|
|
|
|
|
|
|
|
|
|
|
|
|
|
|
|
|
|
|
|
| Demand |
|
$ |
27,600 |
|
|
$ |
24,547 |
|
|
$ |
21,413 |
|
|
|
12 |
% |
|
|
29 |
% |
| Interest checking |
|
|
20,392 |
|
|
|
18,616 |
|
|
|
18,560 |
|
|
|
10 |
% |
|
|
10 |
% |
| Savings |
|
|
21,756 |
|
|
|
21,673 |
|
|
|
20,903 |
|
|
|
— |
|
|
|
4 |
% |
| Money market |
|
|
4,989 |
|
|
|
5,448 |
|
|
|
5,035 |
|
|
|
(8 |
%) |
|
|
(1 |
%) |
| Foreign office |
|
|
3,250 |
|
|
|
3,139 |
|
|
|
3,721 |
|
|
|
4 |
% |
|
|
(13 |
%) |
| Other time |
|
|
4,638 |
|
|
|
5,439 |
|
|
|
7,728 |
|
|
|
(15 |
%) |
|
|
(40 |
%) |
| Certificates - $100,000 and over |
|
|
3,039 |
|
|
|
3,092 |
|
|
|
4,287 |
|
|
|
(2 |
%) |
|
|
(29 |
%) |
| Other |
|
|
46 |
|
|
|
93 |
|
|
|
1 |
|
|
|
(51 |
%) |
|
|
NM |
|
|
|
|
|
|
|
|
|
|
|
|
|
|
|
|
|
|
|
|
|
|
| Total deposits |
|
|
85,710 |
|
|
|
82,047 |
|
|
|
81,648 |
|
|
|
4 |
% |
|
|
5 |
% |
| Federal funds purchased |
|
|
346 |
|
|
|
427 |
|
|
|
279 |
|
|
|
(19 |
%) |
|
|
24 |
% |
| Other short-term borrowings |
|
|
3,239 |
|
|
|
4,894 |
|
|
|
1,574 |
|
|
|
(34 |
%) |
|
|
106 |
% |
| Accrued taxes, interest and expenses |
|
|
1,469 |
|
|
|
1,307 |
|
|
|
889 |
|
|
|
12 |
% |
|
|
65 |
% |
| Other liabilities |
|
|
3,270 |
|
|
|
3,372 |
|
|
|
2,979 |
|
|
|
(3 |
%) |
|
|
10 |
% |
| Long-term debt |
|
|
9,682 |
|
|
|
9,800 |
|
|
|
9,558 |
|
|
|
(1 |
%) |
|
|
1 |
% |
|
|
|
|
|
|
|
|
|
|
|
|
|
|
|
|
|
|
|
|
|
| Total liabilities |
|
|
103,716 |
|
|
|
101,847 |
|
|
|
96,927 |
|
|
|
2 |
% |
|
|
7 |
% |
| Equity |
|
|
|
|
|
|
|
|
|
|
|
|
|
|
|
|
|
|
|
|
| Common stock |
|
|
2,051 |
|
|
|
2,051 |
|
|
|
1,779 |
|
|
|
— |
|
|
|
15 |
% |
| Preferred stock |
|
|
398 |
|
|
|
398 |
|
|
|
3,654 |
|
|
|
— |
|
|
|
(89 |
%) |
| Capital surplus |
|
|
2,792 |
|
|
|
2,780 |
|
|
|
1,715 |
|
|
|
— |
|
|
|
63 |
% |
| Retained earnings |
|
|
7,554 |
|
|
|
7,323 |
|
|
|
6,719 |
|
|
|
3 |
% |
|
|
12 |
% |
| Accumulated other comprehensive income |
|
|
470 |
|
|
|
542 |
|
|
|
314 |
|
|
|
(13 |
%) |
|
|
50 |
% |
| Treasury stock |
|
|
(64 |
) |
|
|
(65 |
) |
|
|
(130 |
) |
|
|
(2 |
%) |
|
|
(51 |
%) |
|
|
|
|
|
|
|
|
|
|
|
|
|
|
|
|
|
|
|
|
|
| Total Bancorp shareholders’ equity |
|
|
13,201 |
|
|
|
13,029 |
|
|
|
14,051 |
|
|
|
1 |
% |
|
|
(6 |
%) |
| Noncontrolling interest |
|
|
50 |
|
|
|
29 |
|
|
|
29 |
|
|
|
72 |
% |
|
|
69 |
% |
|
|
|
|
|
|
|
|
|
|
|
|
|
|
|
|
|
|
|
|
|
| Total Equity |
|
|
13,251 |
|
|
|
13,058 |
|
|
|
14,080 |
|
|
|
1 |
% |
|
|
(6 |
%) |
|
|
|
|
|
|
|
|
|
|
|
|
|
|
|
|
|
|
|
|
|
| Total liabilities and equity |
|
$ |
116,967 |
|
|
$ |
114,905 |
|
|
$ |
111 ,007 |
|
|
|
2 |
% |
|
|
5 |
% |
|
|
|
|
|
|
|
|
|
|
|
|
|
|
|
|
|
|
|
|
|
| (a) Amortized cost |
|
$ |
14,614 |
|
|
$ |
15,427 |
|
|
$ |
14,919 |
|
|
|
(5 |
%) |
|
|
(2 |
%) |
| (b) Market values |
|
|
322 |
|
|
|
337 |
|
|
|
353 |
|
|
|
(5 |
%) |
|
|
(9 |
%) |
| (c) Common shares, stated value $2.22 per share (in thousands): |
|
|
|
|
|
|
|
|
|
|
|
|
|
|
|
|
|
| Authorized |
|
|
2,000,000 |
|
|
|
2,000,000 |
|
|
|
2,000,000 |
|
|
|
— |
|
|
|
— |
|
| Outstanding, excluding treasury |
|
|
919,804 |
|
|
|
919,779 |
|
|
|
796,273 |
|
|
|
— |
|
|
|
16 |
% |
| Treasury |
|
|
4,088 |
|
|
|
4,114 |
|
|
|
5,232 |
|
|
|
(1 |
%) |
|
|
(22 |
%) |
23
Fifth Third Bancorp and Subsidiaries
Consolidated Balance Sheets
$ in millions, except per share data
(unaudited)
|
|
|
|
|
|
|
|
|
|
|
|
|
|
|
|
|
|
|
|
|
| |
|
As of |
|
| |
|
December
2011 |
|
|
September
2011 |
|
|
June
2011 |
|
|
March
2011 |
|
|
December
2010 |
|
| Assets |
|
|
|
|
|
|
|
|
|
|
|
|
|
|
|
|
|
|
|
|
| Cash and due from banks |
|
$ |
2,663 |
|
|
$ |
2,348 |
|
|
$ |
2,380 |
|
|
$ |
2,121 |
|
|
$ |
2,159 |
|
| Available-for-sale and other securities (a) |
|
|
15,362 |
|
|
|
16,227 |
|
|
|
15,502 |
|
|
|
15,135 |
|
|
|
15,414 |
|
| Held-to-maturity securities (b) |
|
|
322 |
|
|
|
337 |
|
|
|
344 |
|
|
|
346 |
|
|
|
353 |
|
| Trading securities |
|
|
177 |
|
|
|
189 |
|
|
|
217 |
|
|
|
216 |
|
|
|
294 |
|
| Other short-term investments |
|
|
1,781 |
|
|
|
2,028 |
|
|
|
1,370 |
|
|
|
2,481 |
|
|
|
1,515 |
|
| Loans held for sale |
|
|
2,954 |
|
|
|
1,840 |
|
|
|
1,185 |
|
|
|
1,291 |
|
|
|
2,216 |
|
| Portfolio loans and leases: |
|
|
|
|
|
|
|
|
|
|
|
|
|
|
|
|
|
|
|
|
| Commercial and industrial loans |
|
|
30,783 |
|
|
|
29,258 |
|
|
|
28,099 |
|
|
|
27,344 |
|
|
|
27,191 |
|
| Commercial mortgage loans |
|
|
10,138 |
|
|
|
10,330 |
|
|
|
10,233 |
|
|
|
10,510 |
|
|
|
10,845 |
|
| Commercial construction loans |
|
|
1,020 |
|
|
|
1,213 |
|
|
|
1,778 |
|
|
|
1,980 |
|
|
|
2,048 |
|
| Commercial leases |
|
|
3,531 |
|
|
|
3,368 |
|
|
|
3,326 |
|
|
|
3,367 |
|
|
|
3,378 |
|
| Residential mortgage loans |
|
|
10,672 |
|
|
|
10,249 |
|
|
|
9,849 |
|
|
|
9,530 |
|
|
|
8,956 |
|
| Home equity |
|
|
10,719 |
|
|
|
10,920 |
|
|
|
11,048 |
|
|
|
11,222 |
|
|
|
11,513 |
|
| Automobile loans |
|
|
11,827 |
|
|
|
11,593 |
|
|
|
11,315 |
|
|
|
11,129 |
|
|
|
10,983 |
|
| Credit card |
|
|
1,978 |
|
|
|
1,878 |
|
|
|
1,856 |
|
|
|
1,821 |
|
|
|
1,896 |
|
| Other consumer loans and leases |
|
|
350 |
|
|
|
407 |
|
|
|
463 |
|
|
|
562 |
|
|
|
681 |
|
|
|
|
|
|
|
|
|
|
|
|
|
|
|
|
|
|
|
|
|
|
| Portfolio loans and leases |
|
|
81,018 |
|
|
|
79,216 |
|
|
|
77,967 |
|
|
|
77,465 |
|
|
|
77,491 |
|
| Allowance for loan and lease losses |
|
|
(2,255 |
) |
|
|
(2,439 |
) |
|
|
(2,614 |
) |
|
|
(2,805 |
) |
|
|
(3,004 |
) |
|
|
|
|
|
|
|
|
|
|
|
|
|
|
|
|
|
|
|
|
|
| Portfolio loans and leases, net |
|
|
78,763 |
|
|
|
76,777 |
|
|
|
75,353 |
|
|
|
74,660 |
|
|
|
74,487 |
|
| Bank premises and equipment |
|
|
2,447 |
|
|
|
2,410 |
|
|
|
2,395 |
|
|
|
2,389 |
|
|
|
2,389 |
|
| Operating lease equipment |
|
|
497 |
|
|
|
462 |
|
|
|
492 |
|
|
|
513 |
|
|
|
479 |
|
| Goodwill |
|
|
2,417 |
|
|
|
2,417 |
|
|
|
2,417 |
|
|
|
2,417 |
|
|
|
2,417 |
|
| Intangible assets |
|
|
40 |
|
|
|
45 |
|
|
|
49 |
|
|
|
55 |
|
|
|
62 |
|
| Servicing rights |
|
|
681 |
|
|
|
662 |
|
|
|
847 |
|
|
|
894 |
|
|
|
822 |
|
| Other assets |
|
|
8,863 |
|
|
|
9,163 |
|
|
|
8,254 |
|
|
|
7,967 |
|
|
|
8,400 |
|
|
|
|
|
|
|
|
|
|
|
|
|
|
|
|
|
|
|
|
|
|
| Total assets |
|
$ |
116,967 |
|
|
$ |
114,905 |
|
|
$ |
110,805 |
|
|
$ |
110,485 |
|
|
$ |
111,007 |
|
|
|
|
|
|
|
|
|
|
|
|
|
|
|
|
|
|
|
|
|
|
| Liabilities |
|
|
|
|
|
|
|
|
|
|
|
|
|
|
|
|
|
|
|
|
| Deposits: |
|
|
|
|
|
|
|
|
|
|
|
|
|
|
|
|
|
|
|
|
| Demand |
|
$ |
27,600 |
|
|
$ |
24,547 |
|
|
$ |
22,589 |
|
|
$ |
22,066 |
|
|
$ |
21,413 |
|
| Interest checking |
|
|
20,392 |
|
|
|
18,616 |
|
|
|
18,072 |
|
|
|
18,597 |
|
|
|
18,560 |
|
| Savings |
|
|
21,756 |
|
|
|
21,673 |
|
|
|
21,764 |
|
|
|
21,697 |
|
|
|
20,903 |
|
| Money market |
|
|
4,989 |
|
|
|
5,448 |
|
|
|
4,859 |
|
|
|
5,184 |
|
|
|
5,035 |
|
| Foreign office |
|
|
3,250 |
|
|
|
3,139 |
|
|
|
3,271 |
|
|
|
3,569 |
|
|
|
3,721 |
|
| Other time |
|
|
4,638 |
|
|
|
5,439 |
|
|
|
6,399 |
|
|
|
7,043 |
|
|
|
7,728 |
|
| Certificates - $100,000 and over |
|
|
3,039 |
|
|
|
3,092 |
|
|
|
3,642 |
|
|
|
4,160 |
|
|
|
4,287 |
|
| Other |
|
|
46 |
|
|
|
93 |
|
|
|
2 |
|
|
|
1 |
|
|
|
1 |
|
|
|
|
|
|
|
|
|
|
|
|
|
|
|
|
|
|
|
|
|
|
| Total deposits |
|
|
85,710 |
|
|
|
82,047 |
|
|
|
80,598 |
|
|
|
82,317 |
|
|
|
81,648 |
|
| Federal funds purchased |
|
|
346 |
|
|
|
427 |
|
|
|
403 |
|
|
|
332 |
|
|
|
279 |
|
| Other short-term borrowings |
|
|
3,239 |
|
|
|
4,894 |
|
|
|
2,702 |
|
|
|
1,297 |
|
|
|
1,574 |
|
| Accrued taxes, interest and expenses |
|
|
1,469 |
|
|
|
1,307 |
|
|
|
1,067 |
|
|
|
844 |
|
|
|
889 |
|
| Other liabilities |
|
|
3,270 |
|
|
|
3,372 |
|
|
|
3,282 |
|
|
|
2,948 |
|
|
|
2,979 |
|
| Long-term debt |
|
|
9,682 |
|
|
|
9,800 |
|
|
|
10,152 |
|
|
|
10,555 |
|
|
|
9,558 |
|
|
|
|
|
|
|
|
|
|
|
|
|
|
|
|
|
|
|
|
|
|
| Total liabilities |
|
|
103,716 |
|
|
|
101,847 |
|
|
|
98,204 |
|
|
|
98,293 |
|
|
|
96,927 |
|
| Equity |
|
|
|
|
|
|
|
|
|
|
|
|
|
|
|
|
|
|
|
|
| Common stock |
|
|
2,051 |
|
|
|
2,051 |
|
|
|
2,051 |
|
|
|
2,051 |
|
|
|
1,779 |
|
| Preferred stock |
|
|
398 |
|
|
|
398 |
|
|
|
398 |
|
|
|
398 |
|
|
|
3,654 |
|
| Capital surplus |
|
|
2,792 |
|
|
|
2,780 |
|
|
|
2,769 |
|
|
|
2,824 |
|
|
|
1,715 |
|
| Retained earnings |
|
|
7,554 |
|
|
|
7,323 |
|
|
|
7,024 |
|
|
|
6,752 |
|
|
|
6,719 |
|
| Accumulated other comprehensive income |
|
|
470 |
|
|
|
542 |
|
|
|
396 |
|
|
|
263 |
|
|
|
314 |
|
| Treasury stock |
|
|
(64 |
) |
|
|
(65 |
) |
|
|
(66 |
) |
|
|
(125 |
) |
|
|
(130 |
) |
|
|
|
|
|
|
|
|
|
|
|
|
|
|
|
|
|
|
|
|
|
| Total Bancorp shareholders’ equity |
|
|
13,201 |
|
|
|
13,029 |
|
|
|
12,572 |
|
|
|
12,163 |
|
|
|
14,051 |
|
| Noncontrolling interest |
|
|
50 |
|
|
|
29 |
|
|
|
29 |
|
|
|
29 |
|
|
|
29 |
|
|
|
|
|
|
|
|
|
|
|
|
|
|
|
|
|
|
|
|
|
|
| Total Equity |
|
|
13,251 |
|
|
|
13,058 |
|
|
|
12,601 |
|
|
|
12,192 |
|
|
|
14,080 |
|
|
|
|
|
|
|
|
|
|
|
|
|
|
|
|
|
|
|
|
|
|
| Total liabilities and equity |
|
$ |
116,967 |
|
|
$ |
114,905 |
|
|
$ |
110,805 |
|
|
$ |
110,485 |
|
|
$ |
111,007 |
|
|
|
|
|
|
|
|
|
|
|
|
|
|
|
|
|
|
|
|
|
|
| (a) Amortized cost |
|
$ |
14,614 |
|
|
$ |
15,427 |
|
|
$ |
14,889 |
|
|
$ |
14,707 |
|
|
$ |
14,919 |
|
| (b) Market values |
|
|
322 |
|
|
|
337 |
|
|
|
344 |
|
|
|
346 |
|
|
|
353 |
|
| (c) Common shares, stated value $2.22 per share (in thousands): |
|
|
|
|
|
|
|
|
|
|
|
|
|
| Authorized |
|
|
2,000,000 |
|
|
|
2,000,000 |
|
|
|
2,000,000 |
|
|
|
2,000,000 |
|
|
|
2,000,000 |
|
| Outstanding, excluding treasury |
|
|
919,804 |
|
|
|
919,779 |
|
|
|
919,818 |
|
|
|
918,728 |
|
|
|
796,273 |
|
| Treasury |
|
|
4,088 |
|
|
|
4,114 |
|
|
|
4,074 |
|
|
|
5,165 |
|
|
|
5,232 |
|
24
Fifth Third Bancorp and Subsidiaries
Consolidated Statements of Changes in Equity
$ in millions
(unaudited)
|
|
|
|
|
|
|
|
|
|
|
|
|
|
|
|
|
| |
|
For the Three Months Ended |
|
|
Year to Date |
|
| |
|
December
2011 |
|
|
December
2010 |
|
|
December
2011 |
|
|
December
2010 |
|
| Total equity, beginning |
|
$ |
13,058 |
|
|
$ |
13,913 |
|
|
$ |
14,080 |
|
|
$ |
13,497 |
|
| Net income attributable to Bancorp |
|
|
314 |
|
|
|
333 |
|
|
|
1,297 |
|
|
|
753 |
|
| Other comprehensive income, net of tax: |
|
|
|
|
|
|
|
|
|
|
|
|
|
|
|
|
| Change in unrealized gains and (losses): |
|
|
|
|
|
|
|
|
|
|
|
|
|
|
|
|
| Available-for-sale securities |
|
|
(34 |
) |
|
|
(112 |
) |
|
|
164 |
|
|
|
105 |
|
| Qualifying cash flow hedges |
|
|
(11 |
) |
|
|
(6 |
) |
|
|
13 |
|
|
|
(38 |
) |
| Change in accumulated other comprehensive income related to employee benefit plans |
|
|
(26 |
) |
|
|
1 |
|
|
|
(20 |
) |
|
|
6 |
|
|
|
|
|
|
|
|
|
|
|
|
|
|
|
|
|
|
| Comprehensive income |
|
|
243 |
|
|
|
216 |
|
|
|
1,454 |
|
|
|
826 |
|
| Cash dividends declared: |
|
|
|
|
|
|
|
|
|
|
|
|
|
|
|
|
| Common stock |
|
|
(74 |
) |
|
|
(8 |
) |
|
|
(258 |
) |
|
|
(32 |
) |
| Preferred stock |
|
|
(9 |
) |
|
|
(51 |
) |
|
|
(50 |
) |
|
|
(205 |
) |
| Issuance of common stock |
|
|
— |
|
|
|
— |
|
|
|
1,648 |
|
|
|
— |
|
| TARP repayment |
|
|
— |
|
|
|
— |
|
|
|
(3,408 |
) |
|
|
— |
|
| Stock-based awards exercised, including treasury shares issued |
|
|
— |
|
|
|
— |
|
|
|
1 |
|
|
|
(4 |
) |
| Loans repaid (issued) related to exercise of stock-based awards, net |
|
|
— |
|
|
|
1 |
|
|
|
1 |
|
|
|
1 |
|
| Redemption of preferred stock warrants issued under TARP CPP |
|
|
— |
|
|
|
— |
|
|
|
(280 |
) |
|
|
— |
|
| Stock-based compensation expense |
|
|
12 |
|
|
|
11 |
|
|
|
42 |
|
|
|
44 |
|
| Impact of cumulative effect of change in accounting principle |
|
|
— |
|
|
|
— |
|
|
|
— |
|
|
|
(77 |
) |
| Noncontrolling interest |
|
|
21 |
|
|
|
(1 |
) |
|
|
21 |
|
|
|
29 |
|
|
|
|
|
|
|
|
|
|
|
|
|
|
|
|
|
|
| Total equity, endinq |
|
$ |
13,251 |
|
|
$ |
14,080 |
|
|
$ |
13,251 |
|
|
$ |
14,080 |
|
|
|
|
|
|
|
|
|
|
|
|
|
|
|
|
|
|
25
Fifth Third Bancorp and Subsidiaries
Average Balance Sheet and Yield Analysis
$ in millions, except share data
(unaudited)
|
|
|
|
|
|
|
|
|
|
|
|
|
|
|
|
|
|
|
|
|
| |
|
For the Three Months Ended |
|
|
% Change |
|
| |
|
December
2011 |
|
|
September
2011 |
|
|
December
2010 |
|
|
Seq |
|
|
Yr/Yr |
|
| Assets |
|
|
|
|
|
|
|
|
|
|
|
|
|
|
|
|
|
|
|
|
| Interest-earning assets: |
|
|
|
|
|
|
|
|
|
|
|
|
|
|
|
|
|
|
|
|
| Commercial and industrial loans |
|
$ |
29,954 |
|
|
$ |
28,824 |
|
|
$ |
26,509 |
|
|
|
4 |
% |
|
|
13 |
% |
| Commercial mortgage loans |
|
|
10,350 |
|
|
|
10,140 |
|
|
|
11,276 |
|
|
|
2 |
% |
|
|
(8 |
%) |
| Commercial construction loans |
|
|
1,155 |
|
|
|
1,777 |
|
|
|
2,289 |
|
|
|
(35 |
%) |
|
|
(50 |
%) |
| Commercial leases |
|
|
3,352 |
|
|
|
3,300 |
|
|
|
3,314 |
|
|
|
2 |
% |
|
|
1 |
% |
| Residential mortgage loans |
|
|
12,638 |
|
|
|
11,224 |
|
|
|
10,693 |
|
|
|
13 |
% |
|
|
18 |
% |
| Home equity |
|
|
10,810 |
|
|
|
10,985 |
|
|
|
11,655 |
|
|
|
(2 |
%) |
|
|
(7 |
%) |
| Automobile loans |
|
|
11,696 |
|
|
|
11,445 |
|
|
|
10,825 |
|
|
|
2 |
% |
|
|
8 |
% |
| Credit card |
|
|
1,906 |
|
|
|
1,864 |
|
|
|
1,844 |
|
|
|
2 |
% |
|
|
3 |
% |
| Other consumer loans and leases |
|
|
417 |
|
|
|
454 |
|
|
|
743 |
|
|
|
(8 |
%) |
|
|
(44 |
%) |
| Taxable securities |
|
|
15,270 |
|
|
|
15,790 |
|
|
|
15,367 |
|
|
|
(3 |
%) |
|
|
(1 |
%) |
| Tax exempt securities |
|
|
58 |
|
|
|
64 |
|
|
|
268 |
|
|
|
(9 |
%) |
|
|
(78 |
%) |
| Other short-term investments |
|
|
1,915 |
|
|
|
2,288 |
|
|
|
2,431 |
|
|
|
(16 |
%) |
|
|
(21 |
%) |
|
|
|
|
|
|
|
|
|
|
|
|
|
|
|
|
|
|
|
|
|
| Total interest-earning assets |
|
|
99,521 |
|
|
|
98,155 |
|
|
|
97,214 |
|
|
|
1 |
% |
|
|
2 |
% |
| Cash and due from banks |
|
|
2,418 |
|
|
|
2,362 |
|
|
|
2,284 |
|
|
|
2 |
% |
|
|
6 |
% |
| Other assets |
|
|
15,758 |
|
|
|
15,381 |
|
|
|
15,449 |
|
|
|
2 |
% |
|
|
2 |
% |
| Allowance for loan and lease losses |
|
|
(2,429 |
) |
|
|
(2,603 |
) |
|
|
(3,089 |
) |
|
|
(7 |
%) |
|
|
(21 |
%) |
|
|
|
|
|
|
|
|
|
|
|
|
|
|
|
|
|
|
|
|
|
| Total assets |
|
$ |
115,268 |
|
|
$ |
113,295 |
|
|
$ |
111,858 |
|
|
|
2 |
% |
|
|
3 |
% |
|
|
|
|
|
|
|
|
|
|
|
|
|
|
|
|
|
|
|
|
|
| Liabilities |
|
|
|
|
|
|
|
|
|
|
|
|
|
|
|
|
|
|
|
|
| Interest-bearing liabilities: |
|
|
|
|
|
|
|
|
|
|
|
|
|
|
|
|
|
|
|
|
| Interest checking |
|
$ |
19,263 |
|
|
$ |
18,322 |
|
|
$ |
17,578 |
|
|
|
5 |
% |
|
|
10 |
% |
| Savings |
|
|
21,715 |
|
|
|
21,747 |
|
|
|
20,602 |
|
|
|
— |
|
|
|
5 |
% |
| Money market |
|
|
5,255 |
|
|
|
5,213 |
|
|
|
4,985 |
|
|
|
1 |
% |
|
|
5 |
% |
| Foreign office |
|
|
3,325 |
|
|
|
3,255 |
|
|
|
3,733 |
|
|
|
2 |
% |
|
|
(11 |
%) |
| Other time |
|
|
4,960 |
|
|
|
6,008 |
|
|
|
8,490 |
|
|
|
(17 |
%) |
|
|
(42 |
%) |
| Certificates - $100,000 and over |
|
|
3,085 |
|
|
|
3,376 |
|
|
|
4,858 |
|
|
|
(9 |
%) |
|
|
(36 |
%) |
| Other |
|
|
16 |
|
|
|
7 |
|
|
|
9 |
|
|
|
147 |
% |
|
|
92 |
% |
| Federal funds purchased |
|
|
348 |
|
|
|
376 |
|
|
|
376 |
|
|
|
(7 |
%) |
|
|
(7 |
%) |
| Other short-term borrowings |
|
|
3,793 |
|
|
|
4,033 |
|
|
|
1,728 |
|
|
|
(6 |
%) |
|
|
119 |
% |
| Long-term debt |
|
|
9,707 |
|
|
|
10,136 |
|
|
|
10,298 |
|
|
|
(4 |
%) |
|
|
(6 |
%) |
|
|
|
|
|
|
|
|
|
|
|
|
|
|
|
|
|
|
|
|
|
| Total interest-bearing liabilities |
|
|
71 ,467 |
|
|
|
72,473 |
|
|
|
72,657 |
|
|
|
(1 |
%) |
|
|
(2 |
%) |
| Demand deposits |
|
|
26,069 |
|
|
|
23,677 |
|
|
|
21,066 |
|
|
|
10 |
% |
|
|
24 |
% |
| Other liabilities |
|
|
4,536 |
|
|
|
4,275 |
|
|
|
4,099 |
|
|
|
6 |
% |
|
|
11 |
% |
|
|
|
|
|
|
|
|
|
|
|
|
|
|
|
|
|
|
|
|
|
| Total liabilities |
|
|
102,072 |
|
|
|
100,425 |
|
|
|
97,822 |
|
|
|
2 |
% |
|
|
4 |
% |
| Equity |
|
|
13,196 |
|
|
|
12,870 |
|
|
|
14,036 |
|
|
|
3 |
% |
|
|
(6 |
%) |
|
|
|
|
|
|
|
|
|
|
|
|
|
|
|
|
|
|
|
|
|
| Total liabilities and equity |
|
$ |
115,268 |
|
|
$ |
113,295 |
|
|
$ |
111,858 |
|
|
|
2 |
% |
|
|
3 |
% |
|
|
|
|
|
|
|
|
|
|
|
|
|
|
|
|
|
|
|
|
|
|
|
|
|
|
|
| Yield Analysis |
|
|
|
|
|
|
|
|
|
|
|
|
|
|
|
|
|
|
|
|
| Interest-earning assets: |
|
|
|
|
|
|
|
|
|
|
|
|
|
|
|
|
|
|
|
|
| Commercial and industrial loans |
|
|
4.28 |
% |
|
|
4.29 |
% |
|
|
4.64 |
% |
|
|
|
|
|
|
|
|
| Commercial mortgage loans |
|
|
3.89 |
% |
|
|
3.94 |
% |
|
|
4.17 |
% |
|
|
|
|
|
|
|
|
| Commercial construction loans |
|
|
3.04 |
% |
|
|
3.02 |
% |
|
|
2.90 |
% |
|
|
|
|
|
|
|
|
| Commercial leases |
|
|
3.87 |
% |
|
|
3.87 |
% |
|
|
4.21 |
% |
|
|
|
|
|
|
|
|
| Residential mortgage loans |
|
|
4.16 |
% |
|
|
4.47 |
% |
|
|
4.64 |
% |
|
|
|
|
|
|
|
|
| Home equity |
|
|
3.87 |
% |
|
|
3.89 |
% |
|
|
3.98 |
% |
|
|
|
|
|
|
|
|
| Automobile loans |
|
|
4.27 |
% |
|
|
4.52 |
% |
|
|
5.41 |
% |
|
|
|
|
|
|
|
|
| Credit card |
|
|
9.66 |
% |
|
|
9.49 |
% |
|
|
10.55 |
% |
|
|
|
|
|
|
|
|
| Other consumer loans and leases |
|
|
36.95 |
% |
|
|
30.76 |
% |
|
|
18.68 |
% |
|
|
|
|
|
|
|
|
|
|
|
|
|
|
|
|
|
|
|
|
|
|
|
| Total loans and leases |
|
|
4.41 |
% |
|
|
4.48 |
% |
|
|
4.78 |
% |
|
|
|
|
|
|
|
|
| Taxable securities |
|
|
3.75 |
% |
|
|
3.88 |
% |
|
|
3.88 |
% |
|
|
|
|
|
|
|
|
| Tax exempt securities |
|
|
5.42 |
% |
|
|
5.84 |
% |
|
|
4.27 |
% |
|
|
|
|
|
|
|
|
| Other short-term investments |
|
|
0.24 |
% |
|
|
0.25 |
% |
|
|
0.25 |
% |
|
|
|
|
|
|
|
|
|
|
|
|
|
|
|
|
|
|
|
|
|
|
|
| Total interest-earning assets |
|
|
4.23 |
% |
|
|
4.28 |
% |
|
|
4.52 |
% |
|
|
|
|
|
|
|
|
| Interest-bearing liabilities: |
|
|
|
|
|
|
|
|
|
|
|
|
|
|
|
|
|
|
|
|
| Interest checking |
|
|
0.24 |
% |
|
|
0.25 |
% |
|
|
0.28 |
% |
|
|
|
|
|
|
|
|
| Savings |
|
|
0.23 |
% |
|
|
0.25 |
% |
|
|
0.45 |
% |
|
|
|
|
|
|
|
|
| Money market |
|
|
0.22 |
% |
|
|
0.27 |
% |
|
|
0.34 |
% |
|
|
|
|
|
|
|
|
| Foreign office |
|
|
0.25 |
% |
|
|
0.26 |
% |
|
|
0.34 |
% |
|
|
|
|
|
|
|
|
| Other time |
|
|
1.77 |
% |
|
|
2.27 |
% |
|
|
2.39 |
% |
|
|
|
|
|
|
|
|
| Certificates - $100,000 and over |
|
|
1.73 |
% |
|
|
2.09 |
% |
|
|
1.94 |
% |
|
|
|
|
|
|
|
|
| Other |
|
|
0.03 |
% |
|
|
0.03 |
% |
|
|
0.26 |
% |
|
|
|
|
|
|
|
|
| Federal funds purchased |
|
|
0.10 |
% |
|
|
0.10 |
% |
|
|
0.19 |
% |
|
|
|
|
|
|
|
|
| Other short-term borrowings |
|
|
0.10 |
% |
|
|
0.10 |
% |
|
|
0.19 |
% |
|
|
|
|
|
|
|
|
| Long-term debt |
|
|
3.09 |
% |
|
|
2.85 |
% |
|
|
2.72 |
% |
|
|
|
|
|
|
|
|
|
|
|
|
|
|
|
|
|
|
|
|
|
|
|
| Total interest-bearing liabilities |
|
|
0.79 |
% |
|
|
0.86 |
% |
|
|
1.04 |
% |
|
|
|
|
|
|
|
|
| Ratios: |
|
|
|
|
|
|
|
|
|
|
|
|
|
|
|
|
|
|
|
|
| Net interest margin (taxable equivalent) |
|
|
3.67 |
% |
|
|
3.65 |
% |
|
|
3.75 |
% |
|
|
|
|
|
|
|
|
| Net interest rate spread (taxable equivalent) |
|
|
3.44 |
% |
|
|
3.42 |
% |
|
|
3.48 |
% |
|
|
|
|
|
|
|
|
| Interest-bearing liabilities to interest-earning assets |
|
|
71.81 |
% |
|
|
73.83 |
% |
|
|
74.74 |
% |
|
|
|
|
|
|
|
|
26
Fifth Third Bancorp and Subsidiaries
Average Balance Sheet and Yield Analysis
$ in millions, except share data
(unaudited)
|
|
|
|
|
|
|
|
|
|
|
|
|
| |
|
Year to Date |
|
|
% Change |
|
| |
|
December
2011 |
|
|
December
2010 |
|
|
Yr/Yr |
|
| Assets |
|
|
|
|
|
|
|
|
|
|
|
|
| Interest-earning assets: |
|
|
|
|
|
|
|
|
|
|
|
|
| Commercial and industrial loans |
|
$ |
28,546 |
|
|
$ |
26,334 |
|
|
|
8 |
% |
| Commercial mortgage loans |
|
|
10,447 |
|
|
|
11,585 |
|
|
|
(10 |
%) |
| Commercial construction loans |
|
|
1,740 |
|
|
|
3,066 |
|
|
|
(43 |
%) |
| Commercial leases |
|
|
3,341 |
|
|
|
3,343 |
|
|
|
— |
|
| Residential mortgage loans |
|
|
11,318 |
|
|
|
9,868 |
|
|
|
15 |
% |
| Home equity |
|
|
11,077 |
|
|
|
11,996 |
|
|
|
(8 |
%) |
| Automobile loans |
|
|
11,352 |
|
|
|
10,427 |
|
|
|
9 |
% |
| Credit card |
|
|
1,864 |
|
|
|
1,870 |
|
|
|
— |
|
| Other consumer loans and leases |
|
|
529 |
|
|
|
743 |
|
|
|
(29 |
%) |
| Taxable securities |
|
|
15,334 |
|
|
|
16,054 |
|
|
|
(4 |
%) |
| Tax exempt securities |
|
|
103 |
|
|
|
317 |
|
|
|
(67 |
%) |
| Other short-term investments |
|
|
2,031 |
|
|
|
3,328 |
|
|
|
(39 |
%) |
|
|
|
|
|
|
|
|
|
|
|
|
|
| Total interest-earning assets |
|
|
97,682 |
|
|
|
98,931 |
|
|
|
(1 |
%) |
| Cash and due from banks |
|
|
2,352 |
|
|
|
2,245 |
|
|
|
5 |
% |
| Other assets |
|
|
15,335 |
|
|
|
14,841 |
|
|
|
3 |
% |
| Allowance for loan and lease losses |
|
|
(2,703 |
) |
|
|
(3,583 |
) |
|
|
(25 |
%) |
|
|
|
|
|
|
|
|
|
|
|
|
|
| Total assets |
|
$ |
112,666 |
|
|
$ |
112,434 |
|
|
|
— |
|
|
|
|
|
|
|
|
|
|
|
|
|
|
| Liabilities |
|
|
|
|
|
|
|
|
|
|
|
|
| Interest-bearing liabilities: |
|
|
|
|
|
|
|
|
|
|
|
|
| Interest checking |
|
$ |
18,707 |
|
|
$ |
18,218 |
|
|
|
3 |
% |
| Savings |
|
|
21,652 |
|
|
|
19,612 |
|
|
|
10 |
% |
| Money market |
|
|
5,154 |
|
|
|
4,808 |
|
|
|
7 |
% |
| Foreign office |
|
|
3,490 |
|
|
|
3,355 |
|
|
|
4 |
% |
| Other time |
|
|
6,260 |
|
|
|
10,526 |
|
|
|
(41 |
%) |
| Certificates - $100,000 and over |
|
|
3,656 |
|
|
|
6,083 |
|
|
|
(40 |
%) |
| Other |
|
|
7 |
|
|
|
6 |
|
|
|
6 |
% |
| Federal funds purchased |
|
|
345 |
|
|
|
291 |
|
|
|
18 |
% |
| Other short-term borrowings |
|
|
2,777 |
|
|
|
1,635 |
|
|
|
70 |
% |
| Long-term debt |
|
|
10,154 |
|
|
|
10,902 |
|
|
|
(7 |
%) |
|
|
|
|
|
|
|
|
|
|
|
|
|
| Total interest-bearing liabilities |
|
|
72,202 |
|
|
|
75,436 |
|
|
|
(4 |
%) |
| Demand deposits |
|
|
23,389 |
|
|
|
19,669 |
|
|
|
19 |
% |
| Other liabilities |
|
|
4,189 |
|
|
|
3,580 |
|
|
|
17 |
% |
|
|
|
|
|
|
|
|
|
|
|
|
|
| Total liabilities |
|
|
99,780 |
|
|
|
98,685 |
|
|
|
1 |
% |
| Equity |
|
|
12,886 |
|
|
|
13,749 |
|
|
|
(6 |
%) |
|
|
|
|
|
|
|
|
|
|
|
|
|
| Total liabilities and equity |
|
$ |
112,666 |
|
|
$ |
112,434 |
|
|
|
— |
|
|
|
|
|
|
|
|
|
|
|
|
|
|
|
|
|
|
| Yield Analysis |
|
|
|
|
|
|
|
|
|
|
|
|
| Interest-earning assets: |
|
|
|
|
|
|
|
|
|
|
|
|
| Commercial and industrial loans |
|
|
4.34 |
% |
|
|
4.70 |
% |
|
|
|
|
| Commercial mortgage loans |
|
|
3.99 |
% |
|
|
4.11 |
% |
|
|
|
|
| Commercial construction loans |
|
|
3.06 |
% |
|
|
3.01 |
% |
|
|
|
|
| Commercial leases |
|
|
3.99 |
% |
|
|
4.40 |
% |
|
|
|
|
| Residential mortgage loans |
|
|
4.45 |
% |
|
|
4.84 |
% |
|
|
|
|
| Home equity |
|
|
3.91 |
% |
|
|
4.00 |
% |
|
|
|
|
| Automobile loans |
|
|
4.67 |
% |
|
|
5.83 |
% |
|
|
|
|
| Credit card |
|
|
9.86 |
% |
|
|
10.73 |
% |
|
|
|
|
| Other consumer loans and leases |
|
|
25.77 |
% |
|
|
15.58 |
% |
|
|
|
|
|
|
|
|
|
|
|
|
|
|
| Total loans and leases |
|
|
4.52 |
% |
|
|
4.84 |
% |
|
|
|
|
| Taxable securities |
|
|
3.89 |
% |
|
|
4.05 |
% |
|
|
|
|
| Tax exempt securities |
|
|
5.41 |
% |
|
|
3.92 |
% |
|
|
|
|
| Other short-term investments |
|
|
0.25 |
% |
|
|
0.25 |
% |
|
|
|
|
|
|
|
|
|
|
|
|
|
|
| Total interest-earning assets |
|
|
4.34 |
% |
|
|
4.56 |
% |
|
|
|
|
| Interest-bearing liabilities: |
|
|
|
|
|
|
|
|
|
|
|
|
| Interest checking |
|
|
0.26 |
% |
|
|
0.29 |
% |
|
|
|
|
| Savings |
|
|
0.31 |
% |
|
|
0.55 |
% |
|
|
|
|
| Money market |
|
|
0.27 |
% |
|
|
0.40 |
% |
|
|
|
|
| Foreign office |
|
|
0.28 |
% |
|
|
0.35 |
% |
|
|
|
|
| Other time |
|
|
2.23 |
% |
|
|
2.62 |
% |
|
|
|
|
| Certificates - $100,000 and over |
|
|
1.97 |
% |
|
|
2.06 |
% |
|
|
|
|
| Other |
|
|
0.03 |
% |
|
|
0.13 |
% |
|
|
|
|
| Federal funds purchased |
|
|
0.11 |
% |
|
|
0.17 |
% |
|
|
|
|
| Other short-term borrowings |
|
|
0.12 |
% |
|
|
0.21 |
% |
|
|
|
|
| Long-term debt |
|
|
3.01 |
% |
|
|
2.65 |
% |
|
|
|
|
|
|
|
|
|
|
|
|
|
|
| Total interest-bearing liabilities |
|
|
0.92 |
% |
|
|
1.17 |
% |
|
|
|
|
| Ratios: |
|
|
|
|
|
|
|
|
|
|
|
|
| Net interest margin (taxable equivalent) |
|
|
3.66 |
% |
|
|
3.66 |
% |
|
|
|
|
| Net interest rate spread (taxable equivalent) |
|
|
3.42 |
% |
|
|
3.39 |
% |
|
|
|
|
| Interest-bearing liabilities to interest-earning assets |
|
|
73.92 |
% |
|
|
76.25 |
% |
|
|
|
|
27
Fifth Third Bancorp and Subsidiaries
Average Balance Sheet and Yield Analysis
$ in millions, except share data
(unaudited)
|
|
|
|
|
|
|
|
|
|
|
|
|
|
|
|
|
|
|
|
|
| |
|
For the Three Months Ended |
|
| |
|
December
2011 |
|
|
September
2011 |
|
|
June
2011 |
|
|
March
2011 |
|
|
December
2010 |
|
| Assets |
|
|
|
|
|
|
|
|
|
|
|
|
|
|
|
|
|
|
|
|
| Interest-earning assets: |
|
|
|
|
|
|
|
|
|
|
|
|
|
|
|
|
|
|
|
|
| Commercial and industrial loans |
|
$ |
29,954 |
|
|
$ |
28,824 |
|
|
$ |
27,970 |
|
|
$ |
27,404 |
|
|
$ |
26,509 |
|
| Commercial mortgage loans |
|
|
10,350 |
|
|
|
10,140 |
|
|
|
10,491 |
|
|
|
10,816 |
|
|
|
11,276 |
|
| Commercial construction loans |
|
|
1,155 |
|
|
|
1,777 |
|
|
|
1,950 |
|
|
|
2,085 |
|
|
|
2,289 |
|
| Commercial leases |
|
|
3,352 |
|
|
|
3,300 |
|
|
|
3,349 |
|
|
|
3,364 |
|
|
|
3,314 |
|
| Residential mortgage loans |
|
|
12,638 |
|
|
|
11,224 |
|
|
|
10,655 |
|
|
|
10,736 |
|
|
|
10,693 |
|
| Home equity |
|
|
10,810 |
|
|
|
10,985 |
|
|
|
11,144 |
|
|
|
11,376 |
|
|
|
11,655 |
|
| Automobile loans |
|
|
11,696 |
|
|
|
11,445 |
|
|
|
11,188 |
|
|
|
11,070 |
|
|
|
10,825 |
|
| Credit card |
|
|
1,906 |
|
|
|
1,864 |
|
|
|
1,834 |
|
|
|
1,852 |
|
|
|
1,844 |
|
| Other consumer loans and leases |
|
|
417 |
|
|
|
454 |
|
|
|
572 |
|
|
|
676 |
|
|
|
743 |
|
| Taxable securities |
|
|
15,270 |
|
|
|
15,790 |
|
|
|
15,115 |
|
|
|
15,156 |
|
|
|
15,367 |
|
| Tax exempt securities |
|
|
58 |
|
|
|
64 |
|
|
|
96 |
|
|
|
197 |
|
|
|
268 |
|
| Other short-term investments |
|
|
1,915 |
|
|
|
2,288 |
|
|
|
1,981 |
|
|
|
1,937 |
|
|
|
2,431 |
|
|
|
|
|
|
|
|
|
|
|
|
|
|
|
|
|
|
|
|
|
|
| Total interest-earning assets |
|
|
99,521 |
|
|
|
98,155 |
|
|
|
96,345 |
|
|
|
96,669 |
|
|
|
97,214 |
|
| Cash and due from banks |
|
|
2,418 |
|
|
|
2,362 |
|
|
|
2,356 |
|
|
|
2,268 |
|
|
|
2,284 |
|
| Other assets |
|
|
15,758 |
|
|
|
15,381 |
|
|
|
15,298 |
|
|
|
14,897 |
|
|
|
15,449 |
|
| Allowance for loan and lease losses |
|
|
(2,429 |
) |
|
|
(2,603 |
) |
|
|
(2,799 |
) |
|
|
(2,990 |
) |
|
|
(3,089 |
) |
|
|
|
|
|
|
|
|
|
|
|
|
|
|
|
|
|
|
|
|
|
| Total assets |
|
$ |
115,268 |
|
|
$ |
113,295 |
|
|
$ |
111,200 |
|
|
$ |
110,844 |
|
|
$ |
111,858 |
|
|
|
|
|
|
|
|
|
|
|
|
|
|
|
|
|
|
|
|
|
|
| Liabilities |
|
|
|
|
|
|
|
|
|
|
|
|
|
|
|
|
|
|
|
|
| Interest-bearing liabilities: |
|
|
|
|
|
|
|
|
|
|
|
|
|
|
|
|
|
|
|
|
| Interest checking |
|
$ |
19,263 |
|
|
$ |
18,322 |
|
|
$ |
18,701 |
|
|
$ |
18,539 |
|
|
$ |
17,578 |
|
| Savings |
|
|
21,715 |
|
|
|
21,747 |
|
|
|
21,817 |
|
|
|
21,324 |
|
|
|
20,602 |
|
| Money market |
|
|
5,255 |
|
|
|
5,213 |
|
|
|
5,009 |
|
|
|
5,136 |
|
|
|
4,985 |
|
| Foreign office |
|
|
3,325 |
|
|
|
3,255 |
|
|
|
3,805 |
|
|
|
3,580 |
|
|
|
3,733 |
|
| Other time |
|
|
4,960 |
|
|
|
6,008 |
|
|
|
6,738 |
|
|
|
7,363 |
|
|
|
8,490 |
|
| Certificates - $100,000 and over |
|
|
3,085 |
|
|
|
3,376 |
|
|
|
3,955 |
|
|
|
4,226 |
|
|
|
4,858 |
|
| Other |
|
|
16 |
|
|
|
7 |
|
|
|
2 |
|
|
|
1 |
|
|
|
9 |
|
| Federal funds purchased |
|
|
348 |
|
|
|
376 |
|
|
|
344 |
|
|
|
310 |
|
|
|
376 |
|
| Other short-term borrowings |
|
|
3,793 |
|
|
|
4,033 |
|
|
|
1,605 |
|
|
|
1,638 |
|
|
|
1,728 |
|
| Long-term debt |
|
|
9,707 |
|
|
|
10,136 |
|
|
|
10,527 |
|
|
|
10,255 |
|
|
|
10,298 |
|
|
|
|
|
|
|
|
|
|
|
|
|
|
|
|
|
|
|
|
|
|
| Total interest-bearing liabilities |
|
|
71,467 |
|
|
|
72,473 |
|
|
|
72,503 |
|
|
|
72,372 |
|
|
|
72,657 |
|
| Demand deposits |
|
|
26,069 |
|
|
|
23,677 |
|
|
|
22,174 |
|
|
|
21,582 |
|
|
|
21,066 |
|
| Other liabilities |
|
|
4,536 |
|
|
|
4,275 |
|
|
|
4,129 |
|
|
|
3,809 |
|
|
|
4,099 |
|
|
|
|
|
|
|
|
|
|
|
|
|
|
|
|
|
|
|
|
|
|
| Total liabilities |
|
|
102,072 |
|
|
|
100,425 |
|
|
|
98,806 |
|
|
|
97,763 |
|
|
|
97,822 |
|
| Equity |
|
|
13,196 |
|
|
|
12,870 |
|
|
|
12,394 |
|
|
|
13,081 |
|
|
|
14,036 |
|
|
|
|
|
|
|
|
|
|
|
|
|
|
|
|
|
|
|
|
|
|
| Total liabilities and equity |
|
$ |
115,268 |
|
|
$ |
113,295 |
|
|
$ |
111,200 |
|
|
$ |
110,844 |
|
|
$ |
111,858 |
|
|
|
|
|
|
|
|
|
|
|
|
|
|
|
|
|
|
|
|
|
|
|
|
|
|
|
|
| Yield Analysis |
|
|
|
|
|
|
|
|
|
|
|
|
|
|
|
|
|
|
|
|
| Interest-earning assets: |
|
|
|
|
|
|
|
|
|
|
|
|
|
|
|
|
|
|
|
|
| Commercial and industrial loans |
|
|
4.28 |
% |
|
|
4.29 |
% |
|
|
4.35 |
% |
|
|
4.45 |
% |
|
|
4.64 |
% |
| Commercial mortgage loans |
|
|
3.89 |
% |
|
|
3.94 |
% |
|
|
4.00 |
% |
|
|
4.11 |
% |
|
|
4.17 |
% |
| Commercial construction loans |
|
|
3.04 |
% |
|
|
3.02 |
% |
|
|
3.01 |
% |
|
|
3.15 |
% |
|
|
2.90 |
% |
| Commercial leases |
|
|
3.87 |
% |
|
|
3.87 |
% |
|
|
4.06 |
% |
|
|
4.17 |
% |
|
|
4.21 |
% |
| Residential mortgage loans |
|
|
4.16 |
% |
|
|
4.47 |
% |
|
|
4.54 |
% |
|
|
4.67 |
% |
|
|
4.64 |
% |
| Home equity |
|
|
3.87 |
% |
|
|
3.89 |
% |
|
|
3.91 |
% |
|
|
3.96 |
% |
|
|
3.98 |
% |
| Automobile loans |
|
|
4.27 |
% |
|
|
4.52 |
% |
|
|
4.81 |
% |
|
|
5.10 |
% |
|
|
5.41 |
% |
| Credit card |
|
|
9.66 |
% |
|
|
9.49 |
% |
|
|
9.91 |
% |
|
|
10.43 |
% |
|
|
10.55 |
% |
| Other consumer loans and leases |
|
|
36.95 |
% |
|
|
30.76 |
% |
|
|
22.02 |
% |
|
|
18.54 |
% |
|
|
18.68 |
% |
|
|
|
|
|
|
|
|
|
|
|
|
|
|
|
|
|
|
|
|
|
| Total loans and leases |
|
|
4.41 |
% |
|
|
4.48 |
% |
|
|
4.54 |
% |
|
|
4.67 |
% |
|
|
4.78 |
% |
| Taxable securities |
|
|
3.75 |
% |
|
|
3.88 |
% |
|
|
3.97 |
% |
|
|
3.96 |
% |
|
|
3.88 |
% |
| Tax exempt securities |
|
|
5.42 |
% |
|
|
5.84 |
% |
|
|
6.41 |
% |
|
|
4.77 |
% |
|
|
4.27 |
% |
| Other short-term investments |
|
|
0.24 |
% |
|
|
0.25 |
% |
|
|
0.25 |
% |
|
|
0.25 |
% |
|
|
0.25 |
% |
|
|
|
|
|
|
|
|
|
|
|
|
|
|
|
|
|
|
|
|
|
| Total interest-earning assets |
|
|
4.23 |
% |
|
|
4.28 |
% |
|
|
4.37 |
% |
|
|
4.47 |
% |
|
|
4.52 |
% |
| Interest-bearing liabilities: |
|
|
|
|
|
|
|
|
|
|
|
|
|
|
|
|
|
|
|
|
| Interest checking |
|
|
0.24 |
% |
|
|
0.25 |
% |
|
|
0.26 |
% |
|
|
0.28 |
% |
|
|
0.28 |
% |
| Savings |
|
|
0.23 |
% |
|
|
0.25 |
% |
|
|
0.33 |
% |
|
|
0.43 |
% |
|
|
0.45 |
% |
| Money market |
|
|
0.22 |
% |
|
|
0.27 |
% |
|
|
0.29 |
% |
|
|
0.32 |
% |
|
|
0.34 |
% |
| Foreign office |
|
|
0.25 |
% |
|
|
0.26 |
% |
|
|
0.29 |
% |
|
|
0.31 |
% |
|
|
0.34 |
% |
| Other time |
|
|
1.77 |
% |
|
|
2.27 |
% |
|
|
2.40 |
% |
|
|
2.36 |
% |
|
|
2.39 |
% |
| Certificates - $100,000 and over |
|
|
1.73 |
% |
|
|
2.09 |
% |
|
|
2.05 |
% |
|
|
1.99 |
% |
|
|
1.94 |
% |
| Other |
|
|
0.03 |
% |
|
|
0.03 |
% |
|
|
0.02 |
% |
|
|
0.05 |
% |
|
|
0.26 |
% |
| Federal funds purchased |
|
|
0.10 |
% |
|
|
0.10 |
% |
|
|
0.11 |
% |
|
|
0.14 |
% |
|
|
0.19 |
% |
| Other short-term borrowings |
|
|
0.10 |
% |
|
|
0.10 |
% |
|
|
0.16 |
% |
|
|
0.19 |
% |
|
|
0.19 |
% |
| Long-term debt |
|
|
3.09 |
% |
|
|
2.85 |
% |
|
|
3.16 |
% |
|
|
2.95 |
% |
|
|
2.72 |
% |
|
|
|
|
|
|
|
|
|
|
|
|
|
|
|
|
|
|
|
|
|
| Total interest-bearing liabilities |
|
|
0.79 |
% |
|
|
0.86 |
% |
|
|
1.00 |
% |
|
|
1.02 |
% |
|
|
1.04 |
% |
| Ratios: |
|
|
|
|
|
|
|
|
|
|
|
|
|
|
|
|
|
|
|
|
| Net interest margin (taxable equivalent) |
|
|
3.67 |
% |
|
|
3.65 |
% |
|
|
3.62 |
% |
|
|
3.71 |
% |
|
|
3.75 |
% |
| Net interest rate spread (taxable equivalent) |
|
|
3.44 |
% |
|
|
3.42 |
% |
|
|
3.37 |
% |
|
|
3.45 |
% |
|
|
3.48 |
% |
| Interest-bearing liabilities to interest-earning assets |
|
|
71.81 |
% |
|
|
73.83 |
% |
|
|
75.25 |
% |
|
|
74.87 |
% |
|
|
74.74 |
% |
28
Fifth Third Bancorp and Subsidiaries
Summary of Loans and Leases
$ in millions
(unaudited)
|
|
|
|
|
|
|
|
|
|
|
|
|
|
|
|
|
|
|
|
|
| |
|
For the Three Months Ended |
|
| |
|
December
2011 |
|
|
September
2011 |
|
|
June
2011 |
|
|
March
2011 |
|
|
December
2010 |
|
| Average Loans and Leases |
|
|
|
|
|
|
|
|
|
|
|
|
|
|
|
|
|
|
|
|
| Commercial: |
|
|
|
|
|
|
|
|
|
|
|
|
|
|
|
|
|
|
|
|
| Commercial and industrial loans |
|
$ |
29,891 |
|
|
$ |
28,777 |
|
|
$ |
27,909 |
|
|
$ |
27,331 |
|
|
$ |
26,338 |
|
| Commercial mortgage loans |
|
|
10,262 |
|
|
|
10,050 |
|
|
|
10,394 |
|
|
|
10,685 |
|
|
|
10,985 |
|
| Commercial construction loans |
|
|
1,132 |
|
|
|
1,752 |
|
|
|
1,918 |
|
|
|
2,030 |
|
|
|
2,171 |
|
| Commercial leases |
|
|
3,351 |
|
|
|
3,300 |
|
|
|
3,349 |
|
|
|
3,364 |
|
|
|
3,314 |
|
|
|
|
|
|
|
|
|
|
|
|
|
|
|
|
|
|
|
|
|
|
| Subtotal - commercial |
|
|
44,636 |
|
|
|
43,879 |
|
|
|
43,570 |
|
|
|
43,410 |
|
|
|
42,808 |
|
| Consumer: |
|
|
|
|
|
|
|
|
|
|
|
|
|
|
|
|
|
|
|
|
| Residential mortgage loans |
|
|
10,464 |
|
|
|
10,006 |
|
|
|
9,654 |
|
|
|
9,282 |
|
|
|
8,382 |
|
| Home equity |
|
|
10,810 |
|
|
|
10,985 |
|
|
|
11,144 |
|
|
|
11,376 |
|
|
|
11,655 |
|
| Automobile loans |
|
|
11,696 |
|
|
|
11,445 |
|
|
|
11,188 |
|
|
|
11,070 |
|
|
|
10,825 |
|
| Credit card |
|
|
1,906 |
|
|
|
1,864 |
|
|
|
1,834 |
|
|
|
1,852 |
|
|
|
1,844 |
|
| Other consumer loans and leases |
|
|
402 |
|
|
|
441 |
|
|
|
547 |
|
|
|
646 |
|
|
|
722 |
|
|
|
|
|
|
|
|
|
|
|
|
|
|
|
|
|
|
|
|
|
|
| Subtotal - consumer |
|
|
35,278 |
|
|
|
34,741 |
|
|
|
34,367 |
|
|
|
34,226 |
|
|
|
33,428 |
|
|
|
|
|
|
|
|
|
|
|
|
|
|
|
|
|
|
|
|
|
|
| Total average loans and leases (excluding held for sale) |
|
$ |
79,914 |
|
|
$ |
78,620 |
|
|
$ |
77,937 |
|
|
$ |
77,636 |
|
|
$ |
76,236 |
|
|
|
|
|
|
|
|
|
|
|
|
|
|
|
|
|
|
|
|
|
|
| Average loans held for sale |
|
|
2,364 |
|
|
|
1,393 |
|
|
|
1,216 |
|
|
|
1,743 |
|
|
|
2,912 |
|
|
|
|
|
|
|
| End of Period Loans and Leases |
|
|
|
|
|
|
|
|
|
|
|
|
|
|
|
|
|
|
|
|
| Commercial: |
|
|
|
|
|
|
|
|
|
|
|
|
|
|
|
|
|
|
|
|
| Commercial and industrial loans |
|
$ |
30,783 |
|
|
$ |
29,258 |
|
|
$ |
28,099 |
|
|
$ |
27,344 |
|
|
$ |
27,191 |
|
| Commercial mortgage loans |
|
|
10,138 |
|
|
|
10,330 |
|
|
|
10,233 |
|
|
|
10,510 |
|
|
|
10,845 |
|
| Commercial construction loans |
|
|
1,020 |
|
|
|
1,213 |
|
|
|
1,778 |
|
|
|
1,980 |
|
|
|
2,048 |
|
| Commercial leases |
|
|
3,531 |
|
|
|
3,368 |
|
|
|
3,326 |
|
|
|
3,367 |
|
|
|
3,378 |
|
|
|
|
|
|
|
|
|
|
|
|
|
|
|
|
|
|
|
|
|
|
| Subtotal - commercial |
|
|
45,472 |
|
|
|
44,169 |
|
|
|
43,436 |
|
|
|
43,201 |
|
|
|
43,462 |
|
| Consumer: |
|
|
|
|
|
|
|
|
|
|
|
|
|
|
|
|
|
|
|
|
| Residential mortgage loans |
|
|
10,672 |
|
|
|
10,249 |
|
|
|
9,849 |
|
|
|
9,530 |
|
|
|
8,956 |
|
| Home equity |
|
|
10,719 |
|
|
|
10,920 |
|
|
|
11,048 |
|
|
|
11,222 |
|
|
|
11,513 |
|
| Automobile loans |
|
|
11,827 |
|
|
|
11,593 |
|
|
|
11,315 |
|
|
|
11,129 |
|
|
|
10,983 |
|
| Credit card |
|
|
1,978 |
|
|
|
1,878 |
|
|
|
1,856 |
|
|
|
1,821 |
|
|
|
1,896 |
|
| Other consumer loans and leases |
|
|
350 |
|
|
|
407 |
|
|
|
463 |
|
|
|
562 |
|
|
|
681 |
|
|
|
|
|
|
|
|
|
|
|
|
|
|
|
|
|
|
|
|
|
|
| Subtotal - consumer |
|
|
35,546 |
|
|
|
35,047 |
|
|
|
34,531 |
|
|
|
34,264 |
|
|
|
34,029 |
|
|
|
|
|
|
|
|
|
|
|
|
|
|
|
|
|
|
|
|
|
|
| Total portfolio loans and leases |
|
$ |
81,018 |
|
|
$ |
79,216 |
|
|
$ |
77,967 |
|
|
$ |
77,465 |
|
|
$ |
77,491 |
|
|
|
|
|
|
|
|
|
|
|
|
|
|
|
|
|
|
|
|
|
|
| Core business activity |
|
|
2,816 |
|
|
|
1,643 |
|
|
|
1,009 |
|
|
|
1,076 |
|
|
|
1,922 |
|
| Portfolio management activity |
|
|
138 |
|
|
|
197 |
|
|
|
176 |
|
|
|
216 |
|
|
|
294 |
|
|
|
|
|
|
|
|
|
|
|
|
|
|
|
|
|
|
|
|
|
|
| Total loans held for sale |
|
|
2,954 |
|
|
|
1,840 |
|
|
|
1,185 |
|
|
|
1,291 |
|
|
|
2,216 |
|
|
|
|
|
|
|
| Operating lease equipment |
|
|
497 |
|
|
|
462 |
|
|
|
492 |
|
|
|
513 |
|
|
|
479 |
|
|
|
|
|
|
|
| Loans and Leases Serviced for Others (a): |
|
|
|
|
|
|
|
|
|
|
|
|
|
|
|
|
|
|
|
|
| Commercial and industrial loans |
|
|
606 |
|
|
|
640 |
|
|
|
602 |
|
|
|
547 |
|
|
|
490 |
|
| Commercial mortgage loans |
|
|
286 |
|
|
|
301 |
|
|
|
304 |
|
|
|
328 |
|
|
|
337 |
|
| Commercial construction loans |
|
|
64 |
|
|
|
67 |
|
|
|
67 |
|
|
|
56 |
|
|
|
55 |
|
| Commercial leases |
|
|
166 |
|
|
|
94 |
|
|
|
104 |
|
|
|
118 |
|
|
|
125 |
|
| Residential mortgage loans |
|
|
57,126 |
|
|
|
56,483 |
|
|
|
56,026 |
|
|
|
55,447 |
|
|
|
54,234 |
|
| Home equity |
|
|
— |
|
|
|
— |
|
|
|
— |
|
|
|
— |
|
|
|
— |
|
| Automobile loans |
|
|
— |
|
|
|
— |
|
|
|
— |
|
|
|
— |
|
|
|
— |
|
| Credit card |
|
|
— |
|
|
|
— |
|
|
|
— |
|
|
|
— |
|
|
|
— |
|
| Other consumer loans and leases |
|
|
— |
|
|
|
— |
|
|
|
— |
|
|
|
— |
|
|
|
— |
|
|
|
|
|
|
|
|
|
|
|
|
|
|
|
|
|
|
|
|
|
|
| Total loans and leases serviced for others |
|
|
58,248 |
|
|
|
57,585 |
|
|
|
57,103 |
|
|
|
56,496 |
|
|
|
55,241 |
|
|
|
|
|
|
|
|
|
|
|
|
|
|
|
|
|
|
|
|
|
|
| Total loans and leases serviced |
|
$ |
142,717 |
|
|
$ |
139,103 |
|
|
$ |
136,747 |
|
|
$ |
135,765 |
|
|
$ |
135,427 |
|
|
|
|
|
|
|
|
|
|
|
|
|
|
|
|
|
|
|
|
|
|
| (a) |
Fifth Third sells certain loans and leases and obtains servicing responsibilities |
29
Fifth Third Bancorp and Subsidiaries
Regulatory Capital (a)
$ in millions
(unaudited)
|
|
|
|
|
|
|
|
|
|
|
|
|
|
|
|
|
|
|
|
|
| |
|
As of |
|
| |
|
December
2011 |
|
|
September
2011 |
|
|
June
2011 |
|
|
March
2011 |
|
|
December
2010 |
|
| Tier I capital: |
|
|
|
|
|
|
|
|
|
|
|
|
|
|
|
|
|
|
|
|
| Bancorp shareholders’ equity |
|
$ |
13,201 |
|
|
$ |
13,029 |
|
|
$ |
12,572 |
|
|
$ |
12,162 |
|
|
$ |
14,051 |
|
| Goodwill and certain other intangibles |
|
|
(2,514 |
) |
|
|
(2,514 |
) |
|
|
(2,536 |
) |
|
|
(2,546 |
) |
|
|
(2,546 |
) |
| Unrealized (gains) losses |
|
|
(470 |
) |
|
|
(542 |
) |
|
|
(396 |
) |
|
|
(263 |
) |
|
|
(314 |
) |
| Qualifying trust preferred securities |
|
|
2,248 |
|
|
|
2,273 |
|
|
|
2,312 |
|
|
|
2,763 |
|
|
|
2,763 |
|
| Other |
|
|
38 |
|
|
|
20 |
|
|
|
20 |
|
|
|
13 |
|
|
|
11 |
|
|
|
|
|
|
|
|
|
|
|
|
|
|
|
|
|
|
|
|
|
|
| Total tier I capital |
|
$ |
12,503 |
|
|
$ |
12,266 |
|
|
$ |
11,972 |
|
|
$ |
12,129 |
|
|
$ |
13,965 |
|
|
|
|
|
|
|
|
|
|
|
|
|
|
|
|
|
|
|
|
|
|
| Total risk-based capital: |
|
|
|
|
|
|
|
|
|
|
|
|
|
|
|
|
|
|
|
|
| Tier I capital |
|
$ |
12,503 |
|
|
$ |
12,266 |
|
|
$ |
11,972 |
|
|
$ |
12,129 |
|
|
$ |
13,965 |
|
| Qualifying allowance for credit losses |
|
|
1,328 |
|
|
|
1,299 |
|
|
|
1,275 |
|
|
|
1,266 |
|
|
|
1,283 |
|
| Qualifying subordinated notes |
|
|
3,054 |
|
|
|
3,098 |
|
|
|
2,837 |
|
|
|
2,780 |
|
|
|
2,930 |
|
|
|
|
|
|
|
|
|
|
|
|
|
|
|
|
|
|
|
|
|
|
| Total risk-based capital |
|
$ |
16,885 |
|
|
$ |
16,663 |
|
|
$ |
16,084 |
|
|
$ |
16,175 |
|
|
$ |
18,178 |
|
|
|
|
|
|
|
|
|
|
|
|
|
|
|
|
|
|
|
|
|
|
| Risk-weighted assets (b) |
|
$ |
104,999 |
|
|
$ |
102,562 |
|
|
$ |
100,320 |
|
|
$ |
99,392 |
|
|
$ |
100,561 |
|
|
|
|
|
|
|
| Ratios: |
|
|
|
|
|
|
|
|
|
|
|
|
|
|
|
|
|
|
|
|
| Average shareholders’ equity to average assets |
|
|
11.41 |
% |
|
|
11.33 |
% |
|
|
11.12 |
% |
|
|
11.77 |
% |
|
|
12.52 |
% |
|
|
|
|
|
|
| Regulatory capital: |
|
|
|
|
|
|
|
|
|
|
|
|
|
|
|
|
|
|
|
|
|
|
|
|
|
|
| Fifth Third Bancorp |
|
|
|
|
|
|
|
|
|
|
|
|
|
|
|
|
|
|
|
|
| Tier I capital |
|
|
11.91 |
% |
|
|
11.96 |
% |
|
|
11.93 |
% |
|
|
12.20 |
% |
|
|
13.89 |
% |
| Total risk-based capital |
|
|
16.08 |
% |
|
|
16.25 |
% |
|
|
16.03 |
% |
|
|
16.27 |
% |
|
|
18.08 |
% |
| Tier I leverage |
|
|
11.10 |
% |
|
|
11.08 |
% |
|
|
11.03 |
% |
|
|
11.21 |
% |
|
|
12.79 |
% |
| Tier I common equity |
|
|
9.34 |
% |
|
|
9.33 |
% |
|
|
9.20 |
% |
|
|
8.99 |
% |
|
|
7.48 |
% |
|
|
|
|
|
|
| Fifth Third Bank |
|
|
|
|
|
|
|
|
|
|
|
|
|
|
|
|
|
|
|
|
| Tier I capital |
|
|
12.01 |
% |
|
|
12.32 |
% |
|
|
13.26 |
% |
|
|
13.61 |
% |
|
|
13.13 |
% |
| Total risk-based capital |
|
|
13.61 |
% |
|
|
14.18 |
% |
|
|
15.13 |
% |
|
|
15.49 |
% |
|
|
15.12 |
% |
| Tier I leverage |
|
|
11.20 |
% |
|
|
11.40 |
% |
|
|
12.25 |
% |
|
|
12.49 |
% |
|
|
12.08 |
% |
| Tier I common equity |
|
|
12.01 |
% |
|
|
12.32 |
% |
|
|
13.26 |
% |
|
|
13.61 |
% |
|
|
13.13 |
% |
| (a) |
Current period regulatory capital data and ratios are estimated. |
| (b) |
Under the banking agencies’ risk-based capital guidelines, assets and credit equivalent amounts of derivatives and off-balance sheet exposures are assigned to
broad risk categories. The aggregate dollar amount in each risk category is multiplied by the associated risk weight of the category. The resulting weighted values are added together resulting in the Bancorp’s total risk weighted assets.
|
30
Fifth Third Bancorp and Subsidiaries
Summary of Credit Loss Experience
$ in millions
(unaudited)
|
|
|
|
|
|
|
|
|
|
|
|
|
|
|
|
|
|
|
|
|
| |
|
For the Three Months Ended |
|
| |
|
December
2011 |
|
|
September
2011 |
|
|
June
2011 |
|
|
March
2011 |
|
|
December
2010 |
|
| Average loans and leases (excluding held for sale): |
|
|
|
|
|
|
|
|
|
|
|
|
|
|
|
|
|
|
|
|
| Commercial and industrial loans |
|
$ |
29,891 |
|
|
$ |
28,777 |
|
|
$ |
27,909 |
|
|
$ |
27,331 |
|
|
$ |
26,338 |
|
| Commercial mortgage loans |
|
|
10,262 |
|
|
|
10,050 |
|
|
|
10,394 |
|
|
|
10,685 |
|
|
|
10,985 |
|
| Commercial construction loans |
|
|
1,132 |
|
|
|
1,752 |
|
|
|
1,918 |
|
|
|
2,030 |
|
|
|
2,171 |
|
| Commercial leases |
|
|
3,351 |
|
|
|
3,300 |
|
|
|
3,349 |
|
|
|
3,364 |
|
|
|
3,314 |
|
| Residential mortgage loans |
|
|
10,464 |
|
|
|
10,006 |
|
|
|
9,654 |
|
|
|
9,282 |
|
|
|
8,382 |
|
| Home equity |
|
|
10,810 |
|
|
|
10,985 |
|
|
|
11,144 |
|
|
|
11,376 |
|
|
|
11,655 |
|
| Automobile loans |
|
|
11,696 |
|
|
|
11 ,445 |
|
|
|
11,188 |
|
|
|
11,070 |
|
|
|
10,825 |
|
| Credit card |
|
|
1,906 |
|
|
|
1,864 |
|
|
|
1,834 |
|
|
|
1,852 |
|
|
|
1,844 |
|
| Other consumer loans and leases |
|
|
402 |
|
|
|
441 |
|
|
|
547 |
|
|
|
646 |
|
|
|
722 |
|
|
|
|
|
|
|
|
|
|
|
|
|
|
|
|
|
|
|
|
|
|
| Total average loans and leases (excluding held for sale) |
|
$ |
79,914 |
|
|
$ |
78,620 |
|
|
$ |
77,937 |
|
|
$ |
77,636 |
|
|
$ |
76,236 |
|
|
|
|
|
|
|
|
|
|
|
|
|
|
|
|
|
|
|
|
|
|
| Losses charged off: |
|
|
|
|
|
|
|
|
|
|
|
|
|
|
|
|
|
|
|
|
| Commercial and industrial loans |
|
($ |
76 |
) |
|
($ |
62 |
) |
|
($ |
86 |
) |
|
($ |
90 |
) |
|
($ |
98 |
) |
| Commercial mortgage loans |
|
|
(53 |
) |
|
|
(49 |
) |
|
|
(51 |
) |
|
|
(58 |
) |
|
|
(83 |
) |
| Commercial construction loans |
|
|
(6 |
) |
|
|
(35 |
) |
|
|
(21 |
) |
|
|
(27 |
) |
|
|
(15 |
) |
| Commercial leases |
|
|
(1 |
) |
|
|
— |
|
|
|
— |
|
|
|
(1 |
) |
|
|
(1 |
) |
| Residential mortgage loans |
|
|
(38 |
) |
|
|
(38 |
) |
|
|
(37 |
) |
|
|
(67 |
) |
|
|
(63 |
) |
| Home equity |
|
|
(54 |
) |
|
|
(56 |
) |
|
|
(58 |
) |
|
|
(66 |
) |
|
|
(68 |
) |
| Automobile loans |
|
|
(20 |
) |
|
|
(19 |
) |
|
|
(18 |
) |
|
|
(28 |
) |
|
|
(28 |
) |
| Credit card |
|
|
(25 |
) |
|
|
(26 |
) |
|
|
(31 |
) |
|
|
(33 |
) |
|
|
(35 |
) |
| Other consumer loans and leases |
|
|
(7 |
) |
|
|
(9 |
) |
|
|
(41 |
) |
|
|
(27 |
) |
|
|
(8 |
) |
|
|
|
|
|
|
|
|
|
|
|
|
|
|
|
|
|
|
|
|
|
| Total losses |
|
|
(280 |
) |
|
|
(294 |
) |
|
|
(343 |
) |
|
|
(397 |
) |
|
|
(399 |
) |
| Recoveries of losses previously charged off: |
|
|
|
|
|
|
|
|
|
|
|
|
|
|
|
|
|
|
|
|
| Commercial and industrial loans |
|
|
14 |
|
|
|
7 |
|
|
|
10 |
|
|
|
7 |
|
|
|
13 |
|
| Commercial mortgage loans |
|
|
6 |
|
|
|
2 |
|
|
|
4 |
|
|
|
4 |
|
|
|
3 |
|
| Commercial construction loans |
|
|
2 |
|
|
|
— |
|
|
|
1 |
|
|
|
1 |
|
|
|
4 |
|
| Commercial leases |
|
|
1 |
|
|
|
1 |
|
|
|
2 |
|
|
|
— |
|
|
|
4 |
|
| Residential mortgage loans |
|
|
2 |
|
|
|
2 |
|
|
|
1 |
|
|
|
2 |
|
|
|
1 |
|
| Home equity |
|
|
4 |
|
|
|
3 |
|
|
|
4 |
|
|
|
3 |
|
|
|
3 |
|
| Automobile loans |
|
|
7 |
|
|
|
7 |
|
|
|
10 |
|
|
|
8 |
|
|
|
9 |
|
| Credit card |
|
|
4 |
|
|
|
8 |
|
|
|
3 |
|
|
|
2 |
|
|
|
2 |
|
| Other consumer loans and leases |
|
|
1 |
|
|
|
2 |
|
|
|
4 |
|
|
|
3 |
|
|
|
4 |
|
|
|
|
|
|
|
|
|
|
|
|
|
|
|
|
|
|
|
|
|
|
| Total recoveries |
|
|
41 |
|
|
|
32 |
|
|
|
39 |
|
|
|
30 |
|
|
|
43 |
|
|
|
|
|
|
|
| Net losses charged off: |
|
|
|
|
|
|
|
|
|
|
|
|
|
|
|
|
|
|
|
|
| Commercial and industrial loans |
|
|
(62 |
) |
|
|
(55 |
) |
|
|
(76 |
) |
|
|
(83 |
) |
|
|
(85 |
) |
| Commercial mortgage loans |
|
|
(47 |
) |
|
|
(47 |
) |
|
|
(47 |
) |
|
|
(54 |
) |
|
|
(80 |
) |
| Commercial construction loans |
|
|
(4 |
) |
|
|
(35 |
) |
|
|
(20 |
) |
|
|
(26 |
) |
|
|
(11 |
) |
| Commercial leases |
|
|
— |
|
|
|
1 |
|
|
|
2 |
|
|
|
(1 |
) |
|
|
3 |
|
| Residential mortgage loans |
|
|
(36 |
) |
|
|
(36 |
) |
|
|
(36 |
) |
|
|
(65 |
) |
|
|
(62 |
) |
| Home equity |
|
|
(50 |
) |
|
|
(53 |
) |
|
|
(54 |
) |
|
|
(63 |
) |
|
|
(65 |
) |
| Automobile loans |
|
|
(13 |
) |
|
|
(12 |
) |
|
|
(8 |
) |
|
|
(20 |
) |
|
|
(19 |
) |
| Credit card |
|
|
(21 |
) |
|
|
(18 |
) |
|
|
(28 |
) |
|
|
(31 |
) |
|
|
(33 |
) |
| Other consumer loans and leases |
|
|
(6 |
) |
|
|
(7 |
) |
|
|
(37 |
) |
|
|
(24 |
) |
|
|
(4 |
) |
|
|
|
|
|
|
|
|
|
|
|
|
|
|
|
|
|
|
|
|
|
| Total net losses charged off |
|
($ |
239 |
) |
|
($ |
262 |
) |
|
($ |
304 |
) |
|
($ |
367 |
) |
|
($ |
356 |
) |
|
|
|
|
|
|
|
|
|
|
|
|
|
|
|
|
|
|
|
|
|
| Net charge-off Ratios: |
|
|
|
|
|
|
|
|
|
|
|
|
|
|
|
|
|
|
|
|
| Commercial and industrial loans |
|
|
0.82 |
% |
|
|
0.76 |
% |
|
|
1.10 |
% |
|
|
1.22 |
% |
|
|
1.27 |
% |
| Commercial mortgage loans |
|
|
1.82 |
% |
|
|
1.86 |
% |
|
|
1.83 |
% |
|
|
2.04 |
% |
|
|
2.86 |
% |
| Commercial construction loans |
|
|
1.37 |
% |
|
|
7.90 |
% |
|
|
4.09 |
% |
|
|
5.24 |
% |
|
|
1.88 |
% |
| Commercial leases |
|
|
(0.01 |
%) |
|
|
(0.12 |
%) |
|
|
(0.25 |
%) |
|
|
0.04 |
% |
|
|
(0.34 |
%) |
| Residential mortgage loans |
|
|
1.38 |
% |
|
|
1.41 |
% |
|
|
1.50 |
% |
|
|
2.82 |
% |
|
|
2.93 |
% |
| Home equity |
|
|
1.83 |
% |
|
|
1.89 |
% |
|
|
1.94 |
% |
|
|
2.23 |
% |
|
|
2.20 |
% |
| Automobile loans |
|
|
0.44 |
% |
|
|
0.41 |
% |
|
|
0.29 |
% |
|
|
0.73 |
% |
|
|
0.68 |
% |
| Credit card |
|
|
4.29 |
% |
|
|
3.86 |
% |
|
|
6.08 |
% |
|
|
6.60 |
% |
|
|
7.12 |
% |
| Other consumer loans and leases |
|
|
6.75 |
% |
|
|
6.67 |
% |
|
|
26.47 |
% |
|
|
17.16 |
% |
|
|
4.09 |
% |
|
|
|
|
|
|
|
|
|
|
|
|
|
|
|
|
|
|
|
|
|
| Total net charge-off ratio |
|
|
1.19 |
% |
|
|
1.32 |
% |
|
|
1.56 |
% |
|
|
1.92 |
% |
|
|
1.86 |
% |
|
|
|
|
|
|
|
|
|
|
|
|
|
|
|
|
|
|
|
|
|
31
Fifth Third Bancorp and Subsidiaries
Asset Quality
$ in millions
(unaudited)
|
|
|
|
|
|
|
|
|
|
|
|
|
|
|
|
|
|
|
|
|
| |
|
For the Three Months Ended |
|
| |
|
December
2011 |
|
|
September
2011 |
|
|
June
2011 |
|
|
March
2011 |
|
|
Decmeber
2010 |
|
| Allowance for Credit Losses |
|
|
|
|
|
|
|
|
|
|
|
|
|
|
|
|
|
|
|
|
| Allowance for loan and lease losses, beginning |
|
$ |
2,439 |
|
|
$ |
2,614 |
|
|
$ |
2,805 |
|
|
$ |
3,004 |
|
|
$ |
3,194 |
|
| Total net losses charged off |
|
|
(239 |
) |
|
|
(262 |
) |
|
|
(304 |
) |
|
|
(367 |
) |
|
|
(356 |
) |
| Provision for loan and lease losses |
|
|
55 |
|
|
|
87 |
|
|
|
113 |
|
|
|
168 |
|
|
|
166 |
|
|
|
|
|
|
|
|
|
|
|
|
|
|
|
|
|
|
|
|
|
|
| Allowance for loan and lease losses, ending |
|
$ |
2,255 |
|
|
$ |
2,439 |
|
|
$ |
2,614 |
|
|
$ |
2,805 |
|
|
$ |
3,004 |
|
|
|
|
|
|
|
| Reserve for unfunded commitments, beginning |
|
$ |
187 |
|
|
$ |
197 |
|
|
$ |
211 |
|
|
$ |
227 |
|
|
$ |
231 |
|
| Provision for unfunded commitments |
|
|
(6 |
) |
|
|
(10 |
) |
|
|
(14 |
) |
|
|
(16 |
) |
|
|
(4 |
) |
|
|
|
|
|
|
|
|
|
|
|
|
|
|
|
|
|
|
|
|
|
| Reserve for unfunded commitments, ending |
|
$ |
181 |
|
|
$ |
187 |
|
|
$ |
197 |
|
|
$ |
211 |
|
|
$ |
227 |
|
|
|
|
|
|
|
|
|
|
|
|
|
|
|
|
|
|
|
|
|
|
| Components of allowance for credit losses: |
|
|
|
|
|
|
|
|
|
|
|
|
|
|
|
|
|
|
|
|
| Allowance for loan and lease losses |
|
$ |
2,255 |
|
|
$ |
2,439 |
|
|
$ |
2,614 |
|
|
$ |
2,805 |
|
|
$ |
3,004 |
|
| Reserve for unfunded commitments |
|
|
181 |
|
|
|
187 |
|
|
|
197 |
|
|
|
211 |
|
|
|
227 |
|
|
|
|
|
|
|
|
|
|
|
|
|
|
|
|
|
|
|
|
|
|
| Total allowance for credit losses |
|
$ |
2,436 |
|
|
$ |
2,626 |
|
|
$ |
2,811 |
|
|
$ |
3,016 |
|
|
$ |
3,231 |
|
|
|
|
|
|
|
|
|
|
|
|
|
|
|
|
|
|
|
|
|
|
|
|
|
|
|
|
| Nonperforming Assets and Delinquent Loans |
|
|
|
|
|
|
|
|
|
|
|
|
|
|
|
|
|
|
|
|
| Nonaccrual portfolio loans and leases: |
|
|
|
|
|
|
|
|
|
|
|
|
|
|
|
|
|
|
|
|
| Commercial and industrial loans |
|
$ |
408 |
|
|
$ |
449 |
|
|
$ |
485 |
|
|
$ |
477 |
|
|
$ |
473 |
|
| Commercial mortgage loans |
|
|
358 |
|
|
|
353 |
|
|
|
417 |
|
|
|
415 |
|
|
|
407 |
|
| Commercial construction loans |
|
|
123 |
|
|
|
151 |
|
|
|
147 |
|
|
|
159 |
|
|
|
182 |
|
| Commercial leases |
|
|
9 |
|
|
|
13 |
|
|
|
16 |
|
|
|
11 |
|
|
|
11 |
|
| Residential mortgage loans |
|
|
134 |
|
|
|
142 |
|
|
|
145 |
|
|
|
140 |
|
|
|
152 |
|
| Home equity |
|
|
25 |
|
|
|
25 |
|
|
|
26 |
|
|
|
24 |
|
|
|
23 |
|
| Automobile loans |
|
|
— |
|
|
|
— |
|
|
|
1 |
|
|
|
1 |
|
|
|
1 |
|
| Other consumer loans and leases |
|
|
1 |
|
|
|
1 |
|
|
|
3 |
|
|
|
60 |
|
|
|
84 |
|
|
|
|
|
|
|
|
|
|
|
|
|
|
|
|
|
|
|
|
|
|
| Total nonaccrual portfolio loans and leases |
|
|
1,058 |
|
|
|
1,134 |
|
|
|
1,240 |
|
|
|
1,287 |
|
|
|
1,333 |
|
| Restructured loans and leases - commercial (non accrual) |
|
|
160 |
|
|
|
189 |
|
|
|
188 |
|
|
|
149 |
|
|
|
141 |
|
| Restructured loans and leases - consumer (non accrual) |
|
|
220 |
|
|
|
215 |
|
|
|
211 |
|
|
|
209 |
|
|
|
206 |
|
|
|
|
|
|
|
|
|
|
|
|
|
|
|
|
|
|
|
|
|
|
| Total nonperforming portfolio loans and leases |
|
|
1,438 |
|
|
|
1,538 |
|
|
|
1,639 |
|
|
|
1,645 |
|
|
|
1,680 |
|
| Repossessed property |
|
|
14 |
|
|
|
17 |
|
|
|
15 |
|
|
|
20 |
|
|
|
27 |
|
| Other real estate owned |
|
|
364 |
|
|
|
389 |
|
|
|
434 |
|
|
|
461 |
|
|
|
467 |
|
|
|
|
|
|
|
|
|
|
|
|
|
|
|
|
|
|
|
|
|
|
| Total nonperforming assets (a) |
|
|
1,816 |
|
|
|
1,944 |
|
|
|
2,088 |
|
|
|
2,126 |
|
|
|
2,174 |
|
| Nonaccrual loans held for sale |
|
|
131 |
|
|
|
171 |
|
|
|
147 |
|
|
|
184 |
|
|
|
247 |
|
| Restructured loans - commercial (non accrual) held for sale |
|
|
7 |
|
|
|
26 |
|
|
|
29 |
|
|
|
32 |
|
|
|
47 |
|
|
|
|
|
|
|
|
|
|
|
|
|
|
|
|
|
|
|
|
|
|
| Total nonperforming assets including loans held for sale |
|
$ |
1,954 |
|
|
$ |
2,141 |
|
|
$ |
2,264 |
|
|
$ |
2,342 |
|
|
$ |
2,468 |
|
|
|
|
|
|
|
|
|
|
|
|
|
|
|
|
|
|
|
|
|
|
|
|
|
|
|
|
| Restructured portfolio consumer loans and leases (accrual) |
|
$ |
1,612 |
|
|
$ |
1,601 |
|
|
$ |
1,593 |
|
|
$ |
1,573 |
|
|
$ |
1,560 |
|
| Restructured portfolio commercial loans and leases (accrual) |
|
$ |
390 |
|
|
$ |
349 |
|
|
$ |
266 |
|
|
$ |
243 |
|
|
$ |
228 |
|
|
|
|
|
|
|
| Ninety days past due loans and leases: |
|
|
|
|
|
|
|
|
|
|
|
|
|
|
|
|
|
|
|
|
| Commercial and industrial loans |
|
$ |
4 |
|
|
$ |
9 |
|
|
$ |
7 |
|
|
$ |
8 |
|
|
$ |
16 |
|
| Commercial mortgage loans |
|
|
3 |
|
|
|
10 |
|
|
|
12 |
|
|
|
8 |
|
|
|
11 |
|
| Commercial construction loans |
|
|
1 |
|
|
|
43 |
|
|
|
48 |
|
|
|
23 |
|
|
|
3 |
|
| Commercial leases |
|
|
— |
|
|
|
1 |
|
|
|
1 |
|
|
|
— |
|
|
|
— |
|
|
|
|
|
|
|
|
|
|
|
|
|
|
|
|
|
|
|
|
|
|
| Total commercial loans and leases |
|
|
8 |
|
|
|
63 |
|
|
|
68 |
|
|
|
39 |
|
|
|
30 |
|
|
|
|
|
|
|
|
|
|
|
|
|
|
|
|
|
|
|
|
|
|
| Residential mortgage loans |
|
|
79 |
|
|
|
91 |
|
|
|
87 |
|
|
|
98 |
|
|
|
100 |
|
| Home equity |
|
|
74 |
|
|
|
83 |
|
|
|
84 |
|
|
|
84 |
|
|
|
89 |
|
| Automobile loans |
|
|
9 |
|
|
|
9 |
|
|
|
10 |
|
|
|
9 |
|
|
|
13 |
|
| Credit card |
|
|
30 |
|
|
|
28 |
|
|
|
30 |
|
|
|
36 |
|
|
|
42 |
|
| Other consumer loans and leases |
|
|
— |
|
|
|
— |
|
|
|
— |
|
|
|
— |
|
|
|
— |
|
|
|
|
|
|
|
|
|
|
|
|
|
|
|
|
|
|
|
|
|
|
| Total consumer loans and leases |
|
|
192 |
|
|
|
211 |
|
|
|
211 |
|
|
|
227 |
|
|
|
244 |
|
|
|
|
|
|
|
|
|
|
|
|
|
|
|
|
|
|
|
|
|
|
| Total ninety days past due loans and leases |
|
$ |
200 |
|
|
$ |
274 |
|
|
$ |
279 |
|
|
$ |
266 |
|
|
$ |
274 |
|
|
|
|
|
|
|
|
|
|
|
|
|
|
|
|
|
|
|
|
|
|
|
|
|
|
|
|
| Ratios |
|
|
|
|
|
|
|
|
|
|
|
|
|
|
|
|
|
|
|
|
| Net losses charged off as a percent of average loans and leases |
|
|
1.19 |
% |
|
|
1.32 |
% |
|
|
1.56 |
% |
|
|
1.92 |
% |
|
|
1.86 |
% |
| Allowance for loan and lease losses: |
|
|
|
|
|
|
|
|
|
|
|
|
|
|
|
|
|
|
|
|
| As a percent of loans and leases |
|
|
2.78 |
% |
|
|
3.08 |
% |
|
|
3.35 |
% |
|
|
3.62 |
% |
|
|
3.88 |
% |
| As a percent of nonperforming loans and leases (a) |
|
|
157 |
% |
|
|
158 |
% |
|
|
160 |
% |
|
|
170 |
% |
|
|
179 |
% |
| As a percent of nonperforming assets (a) |
|
|
124 |
% |
|
|
125 |
% |
|
|
125 |
% |
|
|
132 |
% |
|
|
138 |
% |
| Nonperforming loans and leases as a percent of portfolio loans, leases and other assets, including other real estate owned
(a) |
|
|
1.76 |
% |
|
|
1.93 |
% |
|
|
2.09 |
% |
|
|
2.11 |
% |
|
|
2.15 |
% |
| Nonperforming assets as a percent of portfolio loans, leases and other assets, including other real estate owned
(a) |
|
|
2.23 |
% |
|
|
2.44 |
% |
|
|
2.66 |
% |
|
|
2.73 |
% |
|
|
2.79 |
% |
| Nonperforming assets as a percent of total loans, leases and other assets, including other real estate owned |
|
|
2.32 |
% |
|
|
2.64 |
% |
|
|
2.84 |
% |
|
|
2.96 |
% |
|
|
3.08 |
% |
| (a) |
Does not include nonaccrual loans held for sale |
32
Fifth Third Bancorp and Subsidiaries
Regulation G Non-GAAP Reconcilation
$ and shares in millions
(unaudited)
|
|
|
|
|
|
|
|
|
|
|
|
|
|
|
|
|
|
|
|
|
| |
|
For the Three Months Ended |
|
| |
|
December
2011 |
|
|
September
2011 |
|
|
June
2011 |
|
|
March
2011 |
|
|
December
2010 |
|
| Income before income taxes (U.S. GAAP) |
|
|
418 |
|
|
|
530 |
|
|
|
506 |
|
|
|
377 |
|
|
|
417 |
|
| Add: Provision expense (U.S. GAAP) |
|
|
55 |
|
|
|
87 |
|
|
|
113 |
|
|
|
168 |
|
|
|
166 |
|
|
|
|
|
|
|
|
|
|
|
|
|
|
|
|
|
|
|
|
|
|
| Pre-provision net revenue |
|
|
473 |
|
|
|
617 |
|
|
|
619 |
|
|
|
545 |
|
|
|
583 |
|
|
|
|
|
|
|
| Net income available to common shareholders (U.S. GAAP) |
|
|
305 |
|
|
|
373 |
|
|
|
328 |
|
|
|
88 |
|
|
|
270 |
|
| Add: Intangible amortization, net of tax |
|
|
3 |
|
|
|
3 |
|
|
|
4 |
|
|
|
5 |
|
|
|
7 |
|
|
|
|
|
|
|
|
|
|
|
|
|
|
|
|
|
|
|
|
|
|
| Tangible net income available to common shareholders |
|
|
308 |
|
|
|
376 |
|
|
|
332 |
|
|
|
93 |
|
|
|
277 |
|
| Tangible net income available to common shareholders (annualized) (a) |
|
|
1,222 |
|
|
|
1,492 |
|
|
|
1,332 |
|
|
|
377 |
|
|
|
1,099 |
|
|
|
|
|
|
|
| Average Bancorp shareholders’ equity (U.S. GAAP) |
|
|
13,147 |
|
|
|
12,841 |
|
|
|
12,365 |
|
|
|
13,052 |
|
|
|
14,007 |
|
| Less: Average preferred stock |
|
|
398 |
|
|
|
398 |
|
|
|
398 |
|
|
|
1,557 |
|
|
|
3,648 |
|
| Average goodwill |
|
|
2,417 |
|
|
|
2,417 |
|
|
|
2,417 |
|
|
|
2,417 |
|
|
|
2,417 |
|
| Average intangible assets |
|
|
42 |
|
|
|
47 |
|
|
|
52 |
|
|
|
59 |
|
|
|
67 |
|
|
|
|
|
|
|
|
|
|
|
|
|
|
|
|
|
|
|
|
|
|
| Average tangible common equity (b) |
|
|
10,290 |
|
|
|
9,979 |
|
|
|
9,498 |
|
|
|
9,019 |
|
|
|
7,875 |
|
|
|
|
|
|
|
| Total Bancorp shareholders’ equity (U.S. GAAP) |
|
|
13,201 |
|
|
|
13,029 |
|
|
|
12,572 |
|
|
|
12,163 |
|
|
|
14,051 |
|
| Less: Preferred stock |
|
|
(398 |
) |
|
|
(398 |
) |
|
|
(398 |
) |
|
|
(398 |
) |
|
|
(3,654 |
) |
| Goodwill |
|
|
(2,417 |
) |
|
|
(2,417 |
) |
|
|
(2,417 |
) |
|
|
(2,417 |
) |
|
|
(2,417 |
) |
| Intangible assets |
|
|
(40 |
) |
|
|
(45 |
) |
|
|
(49 |
) |
|
|
(55 |
) |
|
|
(62 |
) |
|
|
|
|
|
|
|
|
|
|
|
|
|
|
|
|
|
|
|
|
|
| Tangible common equity, including unrealized gains / losses (c) |
|
|
10,346 |
|
|
|
10,169 |
|
|
|
9,708 |
|
|
|
9,293 |
|
|
|
7,918 |
|
| Less: Accumulated other comprehensive income / loss |
|
|
(470 |
) |
|
|
(542 |
) |
|
|
(396 |
) |
|
|
(263 |
) |
|
|
(314 |
) |
|
|
|
|
|
|
|
|
|
|
|
|
|
|
|
|
|
|
|
|
|
| Tangible common equity, excluding unrealized gains / losses (d) |
|
|
9,876 |
|
|
|
9,627 |
|
|
|
9,312 |
|
|
|
9,030 |
|
|
|
7,604 |
|
| Add: Preferred stock |
|
|
398 |
|
|
|
398 |
|
|
|
398 |
|
|
|
398 |
|
|
|
3,654 |
|
|
|
|
|
|
|
|
|
|
|
|
|
|
|
|
|
|
|
|
|
|
| Tangible equity (e) |
|
|
10,274 |
|
|
|
10,025 |
|
|
|
9,710 |
|
|
|
9,428 |
|
|
|
11,258 |
|
|
|
|
|
|
|
| Total assets (U.S. GAAP) |
|
|
116,967 |
|
|
|
114,905 |
|
|
|
110,805 |
|
|
|
110,485 |
|
|
|
111,007 |
|
| Less: Goodwill |
|
|
(2,417 |
) |
|
|
(2,417 |
) |
|
|
(2,417 |
) |
|
|
(2,417 |
) |
|
|
(2,417 |
) |
| Intangible assets |
|
|
(40 |
) |
|
|
(45 |
) |
|
|
(49 |
) |
|
|
(55 |
) |
|
|
(62 |
) |
|
|
|
|
|
|
|
|
|
|
|
|
|
|
|
|
|
|
|
|
|
| Tangible assets, including unrealized gains / losses (f) |
|
|
114,510 |
|
|
|
112,443 |
|
|
|
108,339 |
|
|
|
108,013 |
|
|
|
108,528 |
|
| Less: Accumulated other comprehensive income / loss, before tax |
|
|
(723 |
) |
|
|
(834 |
) |
|
|
(609 |
) |
|
|
(405 |
) |
|
|
(483 |
) |
|
|
|
|
|
|
|
|
|
|
|
|
|
|
|
|
|
|
|
|
|
| Tangible assets, excluding unrealized gains / losses (g) |
|
|
113,787 |
|
|
|
111,609 |
|
|
|
107,730 |
|
|
|
107,608 |
|
|
|
108,045 |
|
|
|
|
|
|
|
| Total Bancorp shareholders’ equity (U.S. GAAP) |
|
|
13,201 |
|
|
|
13,029 |
|
|
|
12,572 |
|
|
|
12,163 |
|
|
|
14,051 |
|
| Goodwill and certain other intangibles |
|
|
(2,514 |
) |
|
|
(2,514 |
) |
|
|
(2,536 |
) |
|
|
(2,546 |
) |
|
|
(2,546 |
) |
| Unrealized gains |
|
|
(470 |
) |
|
|
(542 |
) |
|
|
(396 |
) |
|
|
(263 |
) |
|
|
(314 |
) |
| Qualifying trust preferred securities |
|
|
2,248 |
|
|
|
2,273 |
|
|
|
2,312 |
|
|
|
2,763 |
|
|
|
2,763 |
|
| Other |
|
|
38 |
|
|
|
20 |
|
|
|
20 |
|
|
|
12 |
|
|
|
11 |
|
|
|
|
|
|
|
|
|
|
|
|
|
|
|
|
|
|
|
|
|
|
| Tier I capital |
|
|
12,503 |
|
|
|
12,266 |
|
|
|
11,972 |
|
|
|
12,129 |
|
|
|
13,965 |
|
| Less: Preferred stock |
|
|
(398 |
) |
|
|
(398 |
) |
|
|
(398 |
) |
|
|
(398 |
) |
|
|
(3,654 |
) |
| Qualifying trust preferred securities |
|
|
(2,248 |
) |
|
|
(2,273 |
) |
|
|
(2,312 |
) |
|
|
(2,763 |
) |
|
|
(2,763 |
) |
| Qualifying noncontrolling interest in consolidated subsidiaries |
|
|
(50 |
) |
|
|
(30 |
) |
|
|
(30 |
) |
|
|
(30 |
) |
|
|
(30 |
) |
|
|
|
|
|
|
|
|
|
|
|
|
|
|
|
|
|
|
|
|
|
| Tier I common equity (h) |
|
|
9,807 |
|
|
|
9,565 |
|
|
|
9,232 |
|
|
|
8,938 |
|
|
|
7,518 |
|
| Unrealized gains |
|
|
470 |
|
|
|
542 |
|
|
|
|
|
|
|
|
|
|
|
|
|
| Disallowed deferred tax assets |
|
|
— |
|
|
|
— |
|
|
|
|
|
|
|
|
|
|
|
|
|
| Disallowed MSRs |
|
|
70 |
|
|
|
64 |
|
|
|
|
|
|
|
|
|
|
|
|
|
| Other |
|
|
12 |
|
|
|
10 |
|
|
|
|
|
|
|
|
|
|
|
|
|
| Less: 10% of individual deferred tax assets, MSRs, investment in financial entities |
|
|
— |
|
|
|
— |
|
|
|
|
|
|
|
|
|
|
|
|
|
| 15% of aggregate deferred tax assets, MSRs, investment in financial entities |
|
|
— |
|
|
|
— |
|
|
|
|
|
|
|
|
|
|
|
|
|
|
|
|
|
|
|
|
|
|
|
|
|
|
|
|
|
|
|
|
|
|
| Tier I common equity, Basel III proforma (i) |
|
|
10,359 |
|
|
|
10,181 |
|
|
|
|
|
|
|
|
|
|
|
|
|
|
|
|
|
|
|
| Common shares outstanding (j) |
|
|
920 |
|
|
|
920 |
|
|
|
920 |
|
|
|
919 |
|
|
|
796 |
|
| Risk-weighted assets, determined in accordance with prescribed regulatory requirements (k) |
|
|
104,999 |
|
|
|
102,560 |
|
|
|
100,320 |
|
|
|
99,392 |
|
|
|
100,561 |
|
| Add: Regulatory deductions not deducted from Tier 1 common equity, risk-weighted at 250% |
|
|
1,453 |
|
|
|
1,377 |
|
|
|
|
|
|
|
|
|
|
|
|
|
|
|
|
|
|
|
|
|
|
|
|
|
|
|
|
|
|
|
|
|
|
| Risk-weighted assets, Basel III proforma (I) |
|
|
106,452 |
|
|
|
103,937 |
|
|
|
|
|
|
|
|
|
|
|
|
|
|
|
|
|
|
|
| Ratios: |
|
|
|
|
|
|
|
|
|
|
|
|
|
|
|
|
|
|
|
|
| Return on average tangible common equity (a) / (b) |
|
|
11.88 |
% |
|
|
14.95 |
% |
|
|
14.02 |
% |
|
|
4.18 |
% |
|
|
13.95 |
% |
| Tangible equity (e) / (g) |
|
|
9.03 |
% |
|
|
8.98 |
% |
|
|
9.01 |
% |
|
|
8.76 |
% |
|
|
10.42 |
% |
| Tangible common equity (excluding unrealized gains/losses) (d) / (g) |
|
|
8.68 |
% |
|
|
8.63 |
% |
|
|
8.64 |
% |
|
|
8.39 |
% |
|
|
7.04 |
% |
| Tangible common equity (including unrealized gains/losses) (c) / (f) |
|
|
9.04 |
% |
|
|
9.04 |
% |
|
|
8.96 |
% |
|
|
8.60 |
% |
|
|
7.30 |
% |
| Tangible common equity as a percent of risk-weighted assets (excluding unrealized gains/losses) (d) / (k) |
|
|
9.41 |
% |
|
|
9.39 |
% |
|
|
9.28 |
% |
|
|
9.09 |
% |
|
|
7.56 |
% |
| Tangible book value per share (c) / (j) |
|
$ |
11.25 |
|
|
$ |
11.05 |
|
|
$ |
10.55 |
|
|
$ |
10.11 |
|
|
$ |
9.94 |
|
| Tier I common equity (h) / (k) |
|
|
9.34 |
% |
|
|
9.33 |
% |
|
|
9.20 |
% |
|
|
8.99 |
% |
|
|
7.48 |
% |
| Tier I common equity, Basel III proforma (i) / (I) |
|
|
9.73 |
% |
|
|
9.80 |
% |
|
|
|
|
|
|
|
|
|
|
|
|
33
Fifth Third Bancorp and Subsidiaries
Segment Presentation
$ in millions
(unaudited)
|
|
|
|
|
|
|
|
|
|
|
|
|
|
|
|
|
|
|
|
|
|
|
|
|
| For the three months ended December 31 , 201 1 |
|
Commercial
Banking |
|
|
Branch
Banking |
|
|
Consumer
Lending |
|
|
Investment
Advisors |
|
|
Other/
Eliminations |
|
|
Total |
|
| Net interest income (a) |
|
|
359 |
|
|
|
365 |
|
|
|
87 |
|
|
|
28 |
|
|
|
81 |
|
|
|
920 |
|
| Provision for loan and lease losses |
|
|
(88 |
) |
|
|
(92 |
) |
|
|
(56 |
) |
|
|
(1 |
) |
|
|
182 |
|
|
|
(55 |
) |
|
|
|
|
|
|
|
|
|
|
|
|
|
|
|
|
|
|
|
|
|
|
|
|
|
| Net interest income after provision for loan and lease losses |
|
|
271 |
|
|
|
273 |
|
|
|
31 |
|
|
|
27 |
|
|
|
263 |
|
|
|
865 |
|
| Total noninterest income |
|
|
144 |
|
|
|
205 |
|
|
|
157 |
|
|
|
88 |
|
|
|
(44 |
) |
|
|
550 |
|
| Total noninterest expense |
|
|
(270 |
) |
|
|
(387 |
) |
|
|
(171 |
) |
|
|
(104 |
) |
|
|
(61 |
) |
|
|
(993 |
) |
|
|
|
|
|
|
|
|
|
|
|
|
|
|
|
|
|
|
|
|
|
|
|
|
|
| Net income before taxes |
|
|
145 |
|
|
|
91 |
|
|
|
17 |
|
|
|
11 |
|
|
|
158 |
|
|
|
422 |
|
| Applicable income taxes (a) |
|
|
(13 |
) |
|
|
(32 |
) |
|
|
(6 |
) |
|
|
(4 |
) |
|
|
(53 |
) |
|
|
(108 |
) |
|
|
|
|
|
|
|
|
|
|
|
|
|
|
|
|
|
|
|
|
|
|
|
|
|
| Net income |
|
|
132 |
|
|
|
59 |
|
|
|
11 |
|
|
|
7 |
|
|
|
105 |
|
|
|
314 |
|
| Net income (loss) attributable to noncontrolling interest |
|
|
— |
|
|
|
— |
|
|
|
— |
|
|
|
— |
|
|
|
— |
|
|
|
|
|
|
|
|
|
|
|
|
|
|
|
|
|
|
|
|
|
|
|
|
|
|
|
|
|
|
| Net income attributable to Bancorp |
|
|
132 |
|
|
|
59 |
|
|
|
11 |
|
|
|
7 |
|
|
|
105 |
|
|
|
314 |
|
| Dividends on preferred stock |
|
|
— |
|
|
|
— |
|
|
|
— |
|
|
|
— |
|
|
|
9 |
|
|
|
9 |
|
|
|
|
|
|
|
|
|
|
|
|
|
|
|
|
|
|
|
|
|
|
|
|
|
|
| Net income available to common shareholders |
|
|
132 |
|
|
|
59 |
|
|
|
11 |
|
|
|
7 |
|
|
|
96 |
|
|
|
305 |
|
|
|
|
|
|
|
|
|
|
|
|
|
|
|
|
|
|
|
|
|
|
|
|
|
|
|
|
|
|
|
|
|
| For the three months ended September 30, 201 1 |
|
Commercial
Banking |
|
|
Branch
Banking |
|
|
Consumer
Lending |
|
|
Investment
Advisors |
|
|
Other/
Eliminations |
|
|
Total |
|
| Net interest income (a) |
|
|
345 |
|
|
|
359 |
|
|
|
85 |
|
|
|
28 |
|
|
|
85 |
|
|
|
902 |
|
| Provision for loan and lease losses |
|
|
(104 |
) |
|
|
(87 |
) |
|
|
(55 |
) |
|
|
(15 |
) |
|
|
174 |
|
|
|
(87 |
) |
|
|
|
|
|
|
|
|
|
|
|
|
|
|
|
|
|
|
|
|
|
|
|
|
|
| Net interest income after provision for loan and lease losses |
|
|
241 |
|
|
|
272 |
|
|
|
30 |
|
|
|
13 |
|
|
|
259 |
|
|
|
815 |
|
| Total noninterest income |
|
|
159 |
|
|
|
215 |
|
|
|
191 |
|
|
|
92 |
|
|
|
8 |
|
|
|
665 |
|
| Total noninterest expense |
|
|
(262 |
) |
|
|
(399 |
) |
|
|
(158 |
) |
|
|
(105 |
) |
|
|
(22 |
) |
|
|
(946 |
) |
|
|
|
|
|
|
|
|
|
|
|
|
|
|
|
|
|
|
|
|
|
|
|
|
|
| Net income (loss) before taxes |
|
|
138 |
|
|
|
88 |
|
|
|
63 |
|
|
|
— |
|
|
|
245 |
|
|
|
534 |
|
| Applicable income taxes (a) |
|
|
(10 |
) |
|
|
(31 |
) |
|
|
(22 |
) |
|
|
— |
|
|
|
(90 |
) |
|
|
(153 |
) |
|
|
|
|
|
|
|
|
|
|
|
|
|
|
|
|
|
|
|
|
|
|
|
|
|
| Net income (loss) |
|
|
128 |
|
|
|
57 |
|
|
|
41 |
|
|
|
— |
|
|
|
155 |
|
|
|
381 |
|
| Net income (loss) attributable to noncontrolling interest |
|
|
— |
|
|
|
— |
|
|
|
— |
|
|
|
— |
|
|
|
— |
|
|
|
— |
|
|
|
|
|
|
|
|
|
|
|
|
|
|
|
|
|
|
|
|
|
|
|
|
|
|
| Net income (loss) attributable to Bancorp |
|
|
128 |
|
|
|
57 |
|
|
|
41 |
|
|
|
— |
|
|
|
155 |
|
|
|
381 |
|
| Dividends on preferred stock |
|
|
— |
|
|
|
— |
|
|
|
— |
|
|
|
— |
|
|
|
8 |
|
|
|
8 |
|
|
|
|
|
|
|
|
|
|
|
|
|
|
|
|
|
|
|
|
|
|
|
|
|
|
| Net income (loss) available to common shareholders |
|
|
128 |
|
|
|
57 |
|
|
|
41 |
|
|
|
— |
|
|
|
163 |
|
|
|
373 |
|
|
|
|
|
|
|
|
|
|
|
|
|
|
|
|
|
|
|
|
|
|
|
|
|
|
|
|
|
|
|
|
|
| For the three months ended June 30, 201 1 |
|
Commercial
Banking |
|
|
Branch
Banking |
|
|
Consumer
Lending |
|
|
Investment
Advisors |
|
|
Other/
Eliminations |
|
|
Total |
|
| Net interest income (a) |
|
|
339 |
|
|
|
359 |
|
|
|
81 |
|
|
|
28 |
|
|
|
62 |
|
|
|
869 |
|
| Provision for loan and lease losses |
|
|
(147 |
) |
|
|
(98 |
) |
|
|
(55 |
) |
|
|
(4 |
) |
|
|
191 |
|
|
|
(113 |
) |
|
|
|
|
|
|
|
|
|
|
|
|
|
|
|
|
|
|
|
|
|
|
|
|
|
| Net interest income after provision for loan and lease losses |
|
|
192 |
|
|
|
261 |
|
|
|
26 |
|
|
|
24 |
|
|
|
253 |
|
|
|
756 |
|
| Total noninterest income |
|
|
163 |
|
|
|
213 |
|
|
|
167 |
|
|
|
95 |
|
|
|
18 |
|
|
|
656 |
|
| Total noninterest expense |
|
|
(280 |
) |
|
|
(393 |
) |
|
|
(147 |
) |
|
|
(104 |
) |
|
|
23 |
|
|
|
(901 |
) |
|
|
|
|
|
|
|
|
|
|
|
|
|
|
|
|
|
|
|
|
|
|
|
|
|
| Net income (loss) before taxes |
|
|
75 |
|
|
|
81 |
|
|
|
46 |
|
|
|
15 |
|
|
|
294 |
|
|
|
511 |
|
| Applicable income taxes (a) |
|
|
11 |
|
|
|
(29 |
) |
|
|
(16 |
) |
|
|
(5 |
) |
|
|
(135 |
) |
|
|
(174 |
) |
|
|
|
|
|
|
|
|
|
|
|
|
|
|
|
|
|
|
|
|
|
|
|
|
|
| Net income (loss) |
|
|
86 |
|
|
|
52 |
|
|
|
30 |
|
|
|
10 |
|
|
|
159 |
|
|
|
337 |
|
| Net income (loss) attributable to noncontrolling interest |
|
|
— |
|
|
|
— |
|
|
|
— |
|
|
|
— |
|
|
|
— |
|
|
|
— |
|
|
|
|
|
|
|
|
|
|
|
|
|
|
|
|
|
|
|
|
|
|
|
|
|
|
| Net income (loss) attributable to Bancorp |
|
|
86 |
|
|
|
52 |
|
|
|
30 |
|
|
|
— |
|
|
|
159 |
|
|
|
337 |
|
| Dividends on preferred stock |
|
|
— |
|
|
|
— |
|
|
|
— |
|
|
|
— |
|
|
|
9 |
|
|
|
9 |
|
|
|
|
|
|
|
|
|
|
|
|
|
|
|
|
|
|
|
|
|
|
|
|
|
|
| Net income (loss) available to common shareholders |
|
|
172 |
|
|
|
104 |
|
|
|
60 |
|
|
|
10 |
|
|
|
150 |
|
|
|
328 |
|
|
|
|
|
|
|
|
|
|
|
|
|
|
|
|
|
|
|
|
|
|
|
|
|
|
|
|
|
|
|
|
|
| For the three months ended March 31 , 201 1 |
|
Commercial
Banking |
|
|
Branch
Banking |
|
|
Consumer
Lending |
|
|
Investment
Advisors |
|
|
Other/
Eliminations |
|
|
Total |
|
| Net interest income (a) |
|
|
333 |
|
|
|
336 |
|
|
|
93 |
|
|
|
28 |
|
|
|
94 |
|
|
|
884 |
|
| Provision for loan and lease losses |
|
|
(152 |
) |
|
|
(113 |
) |
|
|
(97 |
) |
|
|
(5 |
) |
|
|
199 |
|
|
|
(168 |
) |
|
|
|
|
|
|
|
|
|
|
|
|
|
|
|
|
|
|
|
|
|
|
|
|
|
| Net interest income after provision for loan and lease losses |
|
|
181 |
|
|
|
223 |
|
|
|
(4 |
) |
|
|
23 |
|
|
|
293 |
|
|
|
716 |
|
| Total noninterest income |
|
|
175 |
|
|
|
201 |
|
|
|
116 |
|
|
|
98 |
|
|
|
(6 |
) |
|
|
584 |
|
| Total noninterest expense |
|
|
(274 |
) |
|
|
(392 |
) |
|
|
(157 |
) |
|
|
(107 |
) |
|
|
12 |
|
|
|
(918 |
) |
|
|
|
|
|
|
|
|
|
|
|
|
|
|
|
|
|
|
|
|
|
|
|
|
|
| Net income (loss) before taxes |
|
|
82 |
|
|
|
32 |
|
|
|
(45 |
) |
|
|
14 |
|
|
|
299 |
|
|
|
382 |
|
| Applicable income taxes (a) |
|
|
7 |
|
|
|
(11 |
) |
|
|
16 |
|
|
|
(5 |
) |
|
|
(124 |
) |
|
|
(117 |
) |
|
|
|
|
|
|
|
|
|
|
|
|
|
|
|
|
|
|
|
|
|
|
|
|
|
| Net income (loss) |
|
|
89 |
|
|
|
21 |
|
|
|
(29 |
) |
|
|
9 |
|
|
|
175 |
|
|
|
265 |
|
| Net income (loss) attributable to noncontrolling interest |
|
|
— |
|
|
|
— |
|
|
|
— |
|
|
|
— |
|
|
|
— |
|
|
|
— |
|
|
|
|
|
|
|
|
|
|
|
|
|
|
|
|
|
|
|
|
|
|
|
|
|
|
| Net income (loss) attributable to Bancorp |
|
|
89 |
|
|
|
21 |
|
|
|
(29 |
) |
|
|
9 |
|
|
|
175 |
|
|
|
265 |
|
| Dividends on preferred stock |
|
|
— |
|
|
|
— |
|
|
|
— |
|
|
|
— |
|
|
|
177 |
|
|
|
177 |
|
|
|
|
|
|
|
|
|
|
|
|
|
|
|
|
|
|
|
|
|
|
|
|
|
|
| Net income (loss) available to common shareholders |
|
|
89 |
|
|
|
21 |
|
|
|
(29 |
) |
|
|
9 |
|
|
|
(2 |
) |
|
|
88 |
|
|
|
|
|
|
|
|
|
|
|
|
|
|
|
|
|
|
|
|
|
|
|
|
|
|
|
|
|
|
|
|
|
| For the three months ended December 31 , 201 0 |
|
Commercial
Banking |
|
|
Branch
Banking |
|
|
Consumer
Lending |
|
|
Investment
Advisors |
|
|
Other/
Eliminations |
|
|
Total |
|
| Net interest income (a) |
|
|
390 |
|
|
|
360 |
|
|
|
106 |
|
|
|
29 |
|
|
|
34 |
|
|
|
919 |
|
| Provision for loan and lease losses |
|
|
(135 |
) |
|
|
(120 |
) |
|
|
(90 |
) |
|
|
(11 |
) |
|
|
190 |
|
|
|
(166 |
) |
|
|
|
|
|
|
|
|
|
|
|
|
|
|
|
|
|
|
|
|
|
|
|
|
|
| Net interest income after provision for loan and lease losses |
|
|
255 |
|
|
|
240 |
|
|
|
16 |
|
|
|
18 |
|
|
|
224 |
|
|
|
753 |
|
| Total noninterest income |
|
|
170 |
|
|
|
220 |
|
|
|
164 |
|
|
|
90 |
|
|
|
12 |
|
|
|
656 |
|
| Total noninterest expense |
|
|
(259 |
) |
|
|
(393 |
) |
|
|
(155 |
) |
|
|
(108 |
) |
|
|
(72 |
) |
|
|
(987 |
) |
|
|
|
|
|
|
|
|
|
|
|
|
|
|
|
|
|
|
|
|
|
|
|
|
|
| Net income before taxes |
|
|
166 |
|
|
|
67 |
|
|
|
25 |
|
|
|
— |
|
|
|
164 |
|
|
|
422 |
|
| Applicable income taxes (a) |
|
|
(17 |
) |
|
|
(26 |
) |
|
|
(6 |
) |
|
|
— |
|
|
|
(39 |
) |
|
|
(88 |
) |
|
|
|
|
|
|
|
|
|
|
|
|
|
|
|
|
|
|
|
|
|
|
|
|
|
| Net income |
|
|
149 |
|
|
|
41 |
|
|
|
19 |
|
|
|
— |
|
|
|
125 |
|
|
|
334 |
|
| Net income attributable to noncontrolling interest |
|
|
— |
|
|
|
— |
|
|
|
— |
|
|
|
— |
|
|
|
1 |
|
|
|
1 |
|
|
|
|
|
|
|
|
|
|
|
|
|
|
|
|
|
|
|
|
|
|
|
|
|
|
| Net income attributable to Bancorp |
|
|
149 |
|
|
|
41 |
|
|
|
19 |
|
|
|
— |
|
|
|
124 |
|
|
|
333 |
|
|
|
|
|
|
|
|
|
|
|
|
|
|
|
|
|
|
|
|
|
|
|
|
|
|
| Dividends on preferred stock |
|
|
— |
|
|
|
— |
|
|
|
— |
|
|
|
— |
|
|
|
63 |
|
|
|
63 |
|
|
|
|
|
|
|
|
|
|
|
|
|
|
|
|
|
|
|
|
|
|
|
|
|
|
| Net income available to common shareholders |
|
|
149 |
|
|
|
41 |
|
|
|
19 |
|
|
|
— |
|
|
|
61 |
|
|
|
270 |
|
|
|
|
|
|
|
|
|
|
|
|
|
|
|
|
|
|
|
|
|
|
|
|
|
|
| (a) |
Includes taxable equivalent adjustments of $4 million for the three months ended December 31 , 2011 , $4 million for the three months ended September 30, 2011 , $5
million for the three months ended June 30, 2011, $5 million for the three months ended March 31, 2011 and $5 for the three months ended December 31, 2010. |
34