 Fifth Third Bank | All Rights Reserved | Citigroup | January 30, 2007 Citigroup
Financial Services Conference Kevin Kabat, President EXHIBIT 99.1 |
 2 Fifth Third Bank | All Rights Reserved | Citigroup | January 30, 2007 Agenda Strategic focus Growth opportunities — De novos — Business banking — Middle market — Credit cards Enhancing the customer experience — Sales management — Customer service and satisfaction Summary |
 3 Fifth Third Bank | All Rights Reserved | Citigroup | January 30, 2007 Strategic focus: 2007–2009 1. Deliver growth company performance 2. Enhance the customer experience 3. Increase employee engagement 4. Institutionalize enterprise operational excellence |
 4 Fifth Third Bank | All Rights Reserved | Citigroup | January 30, 2007 Growth opportunities Retail bank • De novo – accelerate new branch openings • Small business banking – leverage existing distribution channels Commercial bank • Middle market expansion – expand products, services, and sales • Healthcare – enhance product offerings, specialized channel • Commercial new/underserved markets – targeted markets for deployment of additional bankers and teams Fifth Third Processing Solutions • Credit card – increase cardholder acquisition |
 5 Fifth Third Bank | All Rights Reserved | Citigroup | January 30, 2007 De novos: value creation Core competency: — Market segmentation analysis and predictive modeling techniques have allowed for repeatable success over the last three years De novos versus acquisitions: — Estimated industry IRRs*: – acquisitions = 12-15% – de novos = 18-20% — FITB: – de novos = 20%+ (expected branch IRR depends on market/location) * Source: Citigroup. |
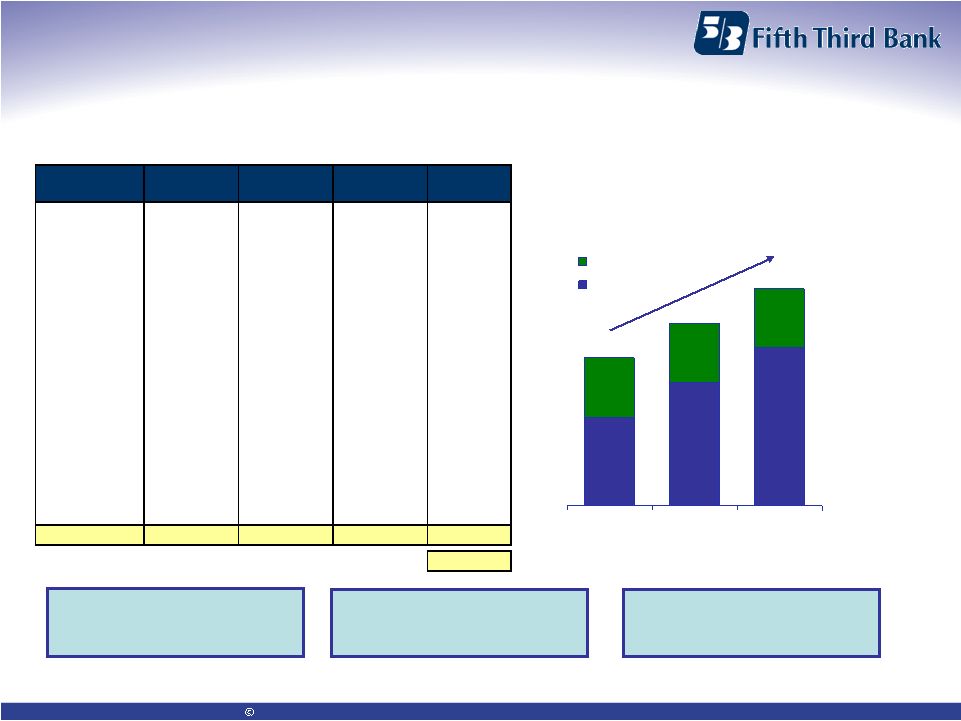
 6 Fifth Third Bank | All Rights Reserved | Citigroup | January 30, 2007 2005–2006 de novo growth performance
(full-service branches) Source: SNL. Branches opened between 6/04 and 6/05 for markets in which Fifth Third
built de novo branches; full service locations only (excludes BankMarts/in-store branches); excludes competitor branches that shrank; excludes locations with first year deposits >$30mm (i.e., relos); excludes all headquarter locations; commercial banks only. Top 10 banks by average deposit growth per new
branch, within markets
where Fifth Third opened branches between 6/04 and 6/05 Holding Company
6/06 Total Deposits 6/05 Total Deposits Number of Branches Avg. Branch Deposit Growth 05-06 Rank Fifth Third Bancorp 828,740 354,198 58 8,182 1 Regions Financial Corp. 72,575 23,545 6 8,172 2 Metropolitan Bank Group Inc. 101,986 50,479 7 7,358 3 Bank of America Corp. 219,320 97,071 17 7,191 4 National City Corp. 262,078 123,200 22 6,313 5 JPMorgan Chase & Co. 630,609 278,316 56 6,291 6 Flagstar Bancorp Inc. 194,667 114,743 13 6,148 7 LaSalle Bank Corporation 85,118 36,199 8 6,115 8 KeyCorp 97,603 29,502 12 5,675 9 Sky Financial Group Inc. 62,344 23,657 8 4,836 10 |
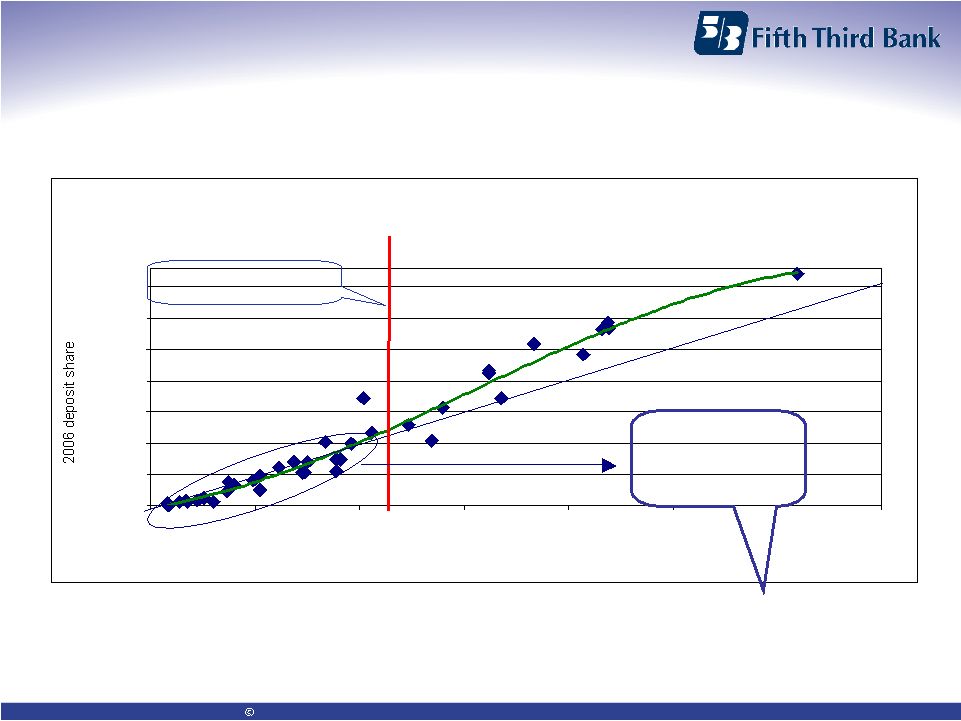 7 Fifth Third Bank | All Rights Reserved | Citigroup | January 30, 2007 Fifth Third critical mass curve, 2006 0.0% 5.0% 10.0% 15.0% 20.0% 25.0% 30.0% 35.0% 0.0% 5.0% 10.0% 15.0% 20.0% 25.0% 30.0% 35.0% Fifth Third locations as % of MSA bank locations Critical Mass Threshold = 12% Evansville Cincinnati Kalamazoo Dayton Toledo Gr Rapids Lexington Ft Myers Naples Louisville Columbus Chicago Detroit Tampa Orlando SE Florida St Louis Pittsburgh Performance threshold: achieving critical mass Source: SNL. Commercial banks only, excludes headquarters locations. Markets where 5/3 does not have critical mass Relationship: location share to deposit share 5/3 rd consistently generates more than fair share of deposits where location share >
12% |
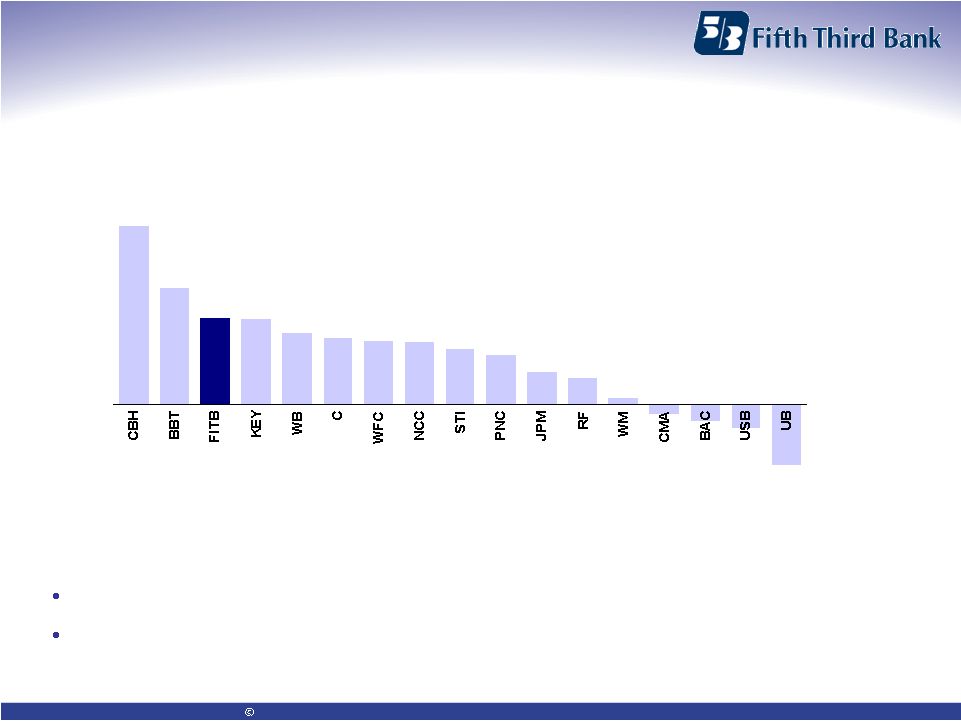 8 Fifth Third Bank | All Rights Reserved | Citigroup | January 30, 2007 15.4% 10.1% 7.5% 7.4% 6.2% 5.8% 5.5% 5.4% 4.9% 4.3% 2.9% 2.3% 0.6% -0.7% -1.4% -2.0% -5.2% Deposit gathering: overall success June 2005 to June 2006 (FDIC data) Additionally: 20 of 21* Fifth Third affiliate banks grew deposits (all 21 excluding >$1B
branches) 17 of 21* affiliates grew deposit market share (18 of 21 excluding
>$1B branches) Source: SNL Financial; FBR report, October 25, 2006.
* 19 affiliates plus Pittsburgh and St. Louis. #3 among large cap banks |
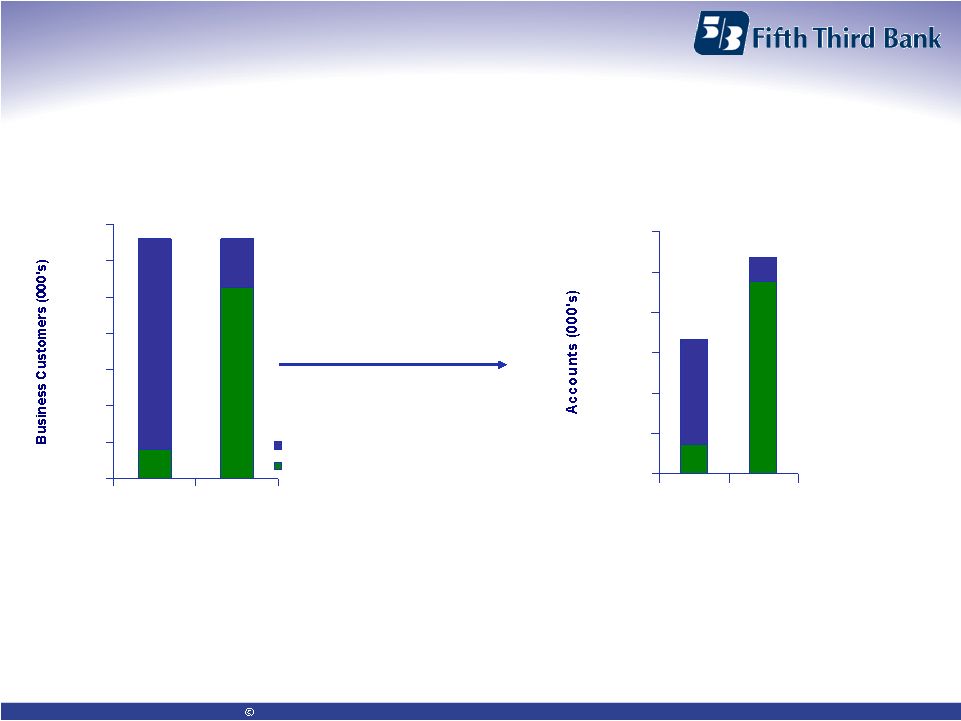 9 Fifth Third Bank | All Rights Reserved | Citigroup | January 30, 2007 Business banking: focus on the customer Business banking customers 0 50 100 150 200 250 300 350 2006 2009 unassigned to banker assigned to banker Business banking accounts 0 200 400 600 800 1000 1200 2006 2009 Assigning 80% of existing customers… …could represent a 60% increase in accounts Deploy more bankers Introduce new products Strengthen and standardize processes |
 10 Fifth Third Bank | All Rights Reserved | Citigroup | January 30, 2007 Middle market: full-service orientation 5/3 Middle Market Share 9% 13% 16% 6% 6% 6% 2006 2009 2012 lending only full-service Affiliate $10mm to $100mm $100mm to $250mm $250mm to $500mm Total Chicago 5,085 405 148 5,638 Eastern Michigan 2,164 187 60 2,411 South Florida 1,662 110 35 1,807 Northeastern Ohio 1,532 98 33 1,663 Western Michigan 1,234 74 30 1,338 Central Indiana 1,167 84 39 1,290 Tampa 867 59 27 953 St. Louis 834 76 36 946 Pittsburgh 796 66 22 884 Cincinnati 754 48 28 830 Central Florida 690 47 21 758 Central Ohio 659 59 25 743 Louisville 617 49 24 690 Tennessee 559 54 21 634 Western Ohio 500 30 15 545 Northwestern Ohio 434 34 10 478 Southern Indiana 319 27 11 357 Northern Michigan 329 20 5 354 Ohio Valley 239 24 5 268 Central Kentucky 210 20 5 235 Northern Kentucky 128 7 3 138 Total Footprint 20,779 1,578 603 22,960 Fifth Third total relationship market share 15% # of Businesses with Sales of: Convert existing accounts to full service while increasing new accounts 15% 22% Product, sales, service enhancements Healthcare specialty group Underserved/ new markets 19% |
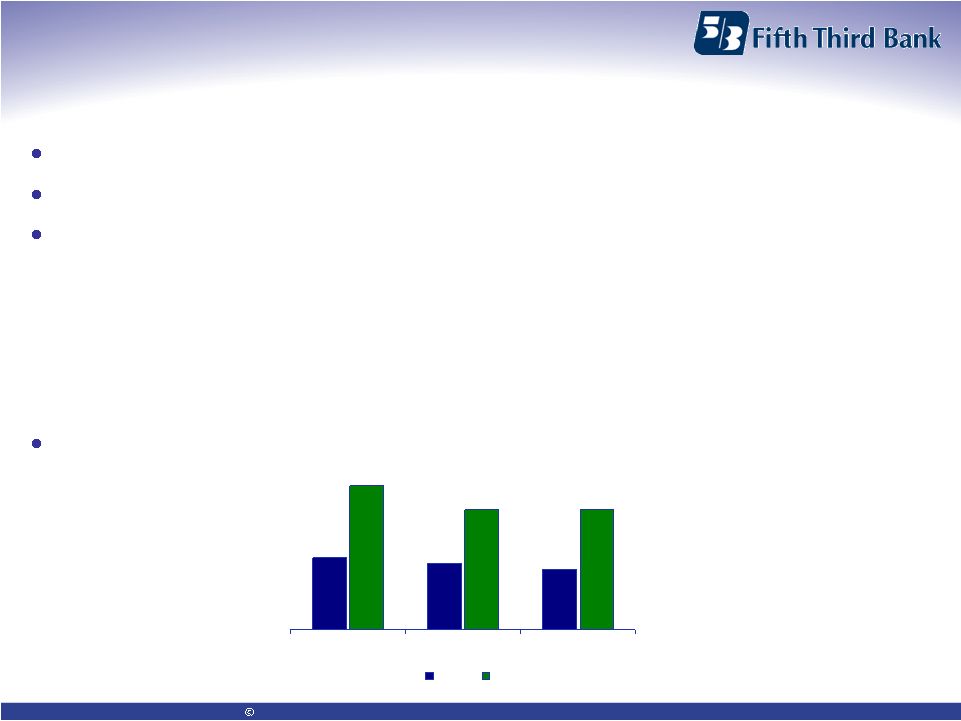 11 Fifth Third Bank | All Rights Reserved | Citigroup | January 30, 2007 Credit cards: capturing our fair share 11th largest bank, 24th largest credit card issuer We’ve underinvested in the credit card business relative to competitors Significant opportunity in high risk adjusted return business — Improve retail production by deploying sales technologies to enhance ease of sale — Move from “ultra” conservative underwriting to “conservative” underwriting (weighted average FICO from > 740 to > 720) — Optimize profitability of existing portfolio through modest investments in marketing, analytics, and human capital Goal: double assets, accounts, net income by 2009 Assets Accounts Net income 2006 2009 $1,200 $2,400 1.1 2.0 $41 $83 ($ MMs) |
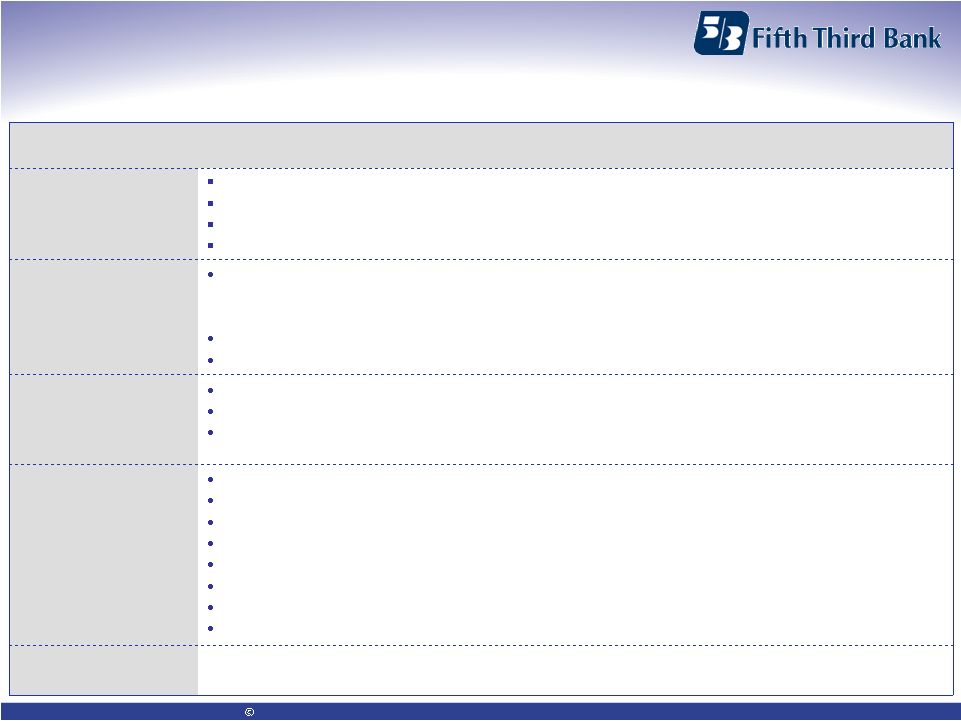 12 Fifth Third Bank | All Rights Reserved | Citigroup | January 30, 2007 Performance expectations set for each role, with incentive pay based on: — Individual sales (KPIs) — Service levels (KDIs) Managers evaluated, compensated on individual sales contribution and coaching effectiveness Incentive compensation based on profitability of sales production, income growth, and
service Consistent
sales management process Sales reporting available by individual every day Reporting: stack rankings, performance vs. job standards, tracking for incentive
comp Scorecards available for each employee – displaying rankings on all KPIs, highlighting strengths and pointing out focus areas Individual productivity reporting Elimination of non-value added activities to increase FTE capacity for sales
Re-engineer or automate for maximum sales effectiveness Consolidate in areas outside of the Financial Center Dedicated branch service personnel combined with improved back office support Reduction of non- sales activities in banking centers Consistent branded sales process across the footprint Customer profiling and needs-based product sales tied to new brand Better referral experience, personal introductions of customer to sales people Structured follow-up calls, thank you letters Tools to maximize sales effectiveness Enhanced product offerings Integrated with new brand promise Enhanced marketing and campaign process Consistent branded sales process • Split service and sales roles to maximize sales and service effectiveness • Clearly defined organizational structure and career progression plan MANAGEMENT FOCUS Role clarity PERFORMANCE THEME Reengineering retail sales management |
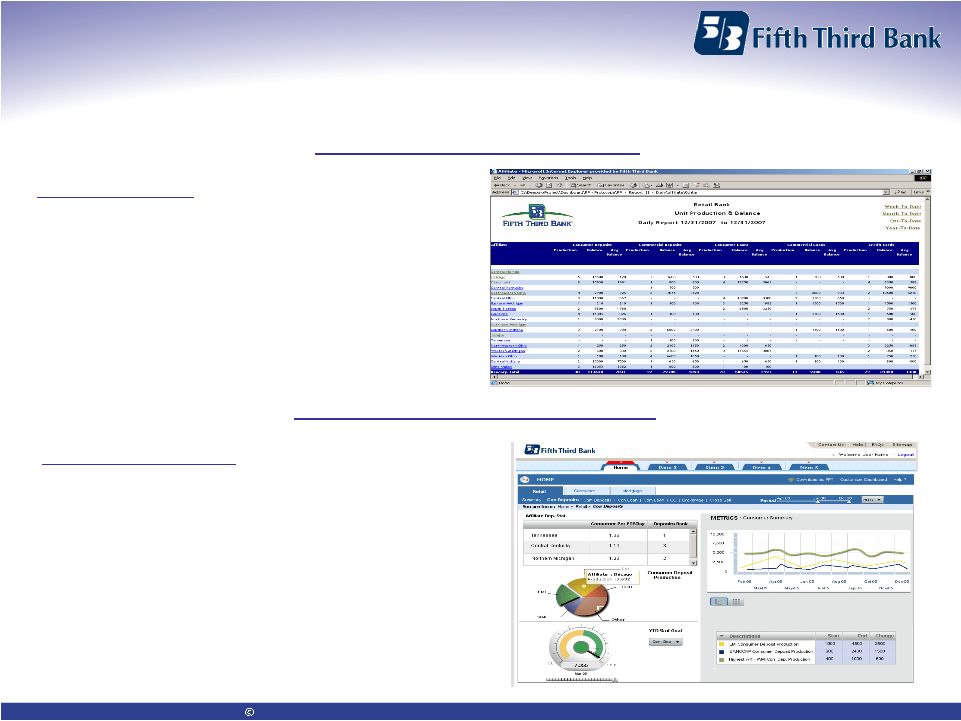 13 Fifth Third Bank | All Rights Reserved | Citigroup | January 30, 2007 Example: automated individual reporting Phase I (Jan ‘07) report style Report Highlights •Present Key Performance Metrics (KPI’s) with daily,
WTD, MTD, QTD, YTD views •Collect data supporting the KPI’s at employee level
plus rollups to bank center, affiliate, region and Bancorp levels •Enable stack ranking, forced quartile identification, and performance rating assignment Dashboard Highlights •Key Performance Metrics presented in user-friendly
dashboard •High-level rollup provides quick reference of performance trending •Drill-down functionality enables quick analysis into
problem areas •Filter functionality enables viewing performance from every perspective (e.g., Bancorp level, affiliate, branch, individual level) Phase II (2Q07) dashboard style |
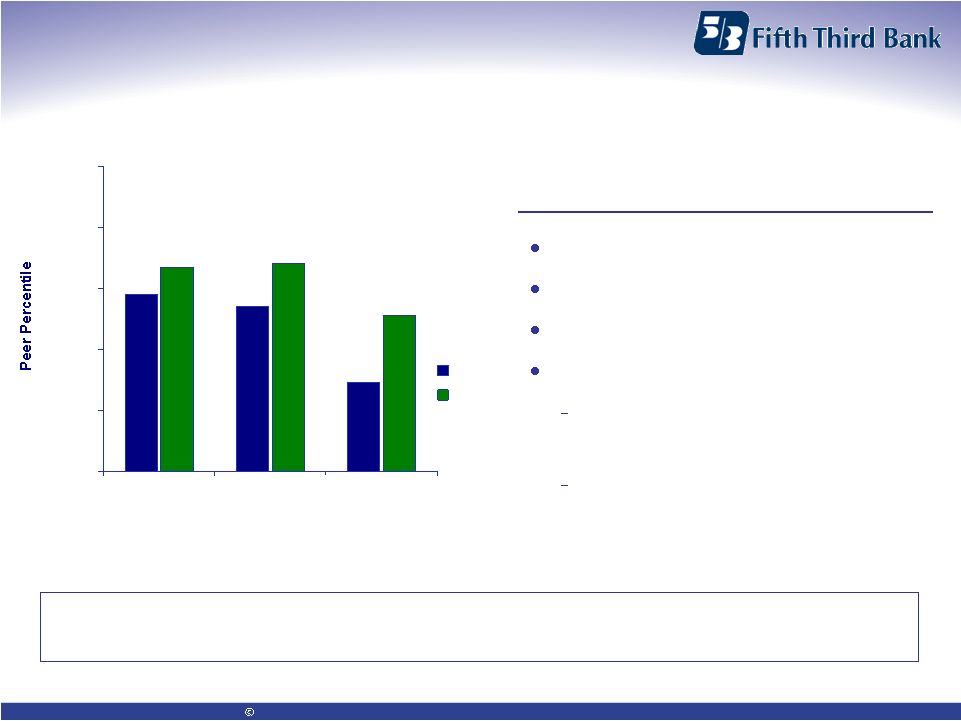 14 Fifth Third Bank | All Rights Reserved | Citigroup | January 30, 2007 Fifth Third: relative service performance 54% 29% 67% 68% 51% 58% 0% 20% 40% 60% 80% 100% Overall Satisfaction Loyalty Problem Incidence 2005 2006 45% 51% 36% 43% 27% 21% Improvements have been made by addressing fundamental process issues – but we are not where we need to be 2005-2006 Key Actions Implemented Improvements to collection process Reduced daily overdraft fees Fee waiver guidelines Recently implemented: Call center transformation improvements New overdraft notices Source : Gallup Customer Surveys: 3Q05/3Q06 Percentages within bars
= % of surveyed customers rating metric at target level or experiencing a problem Goal: 75 th percentile |
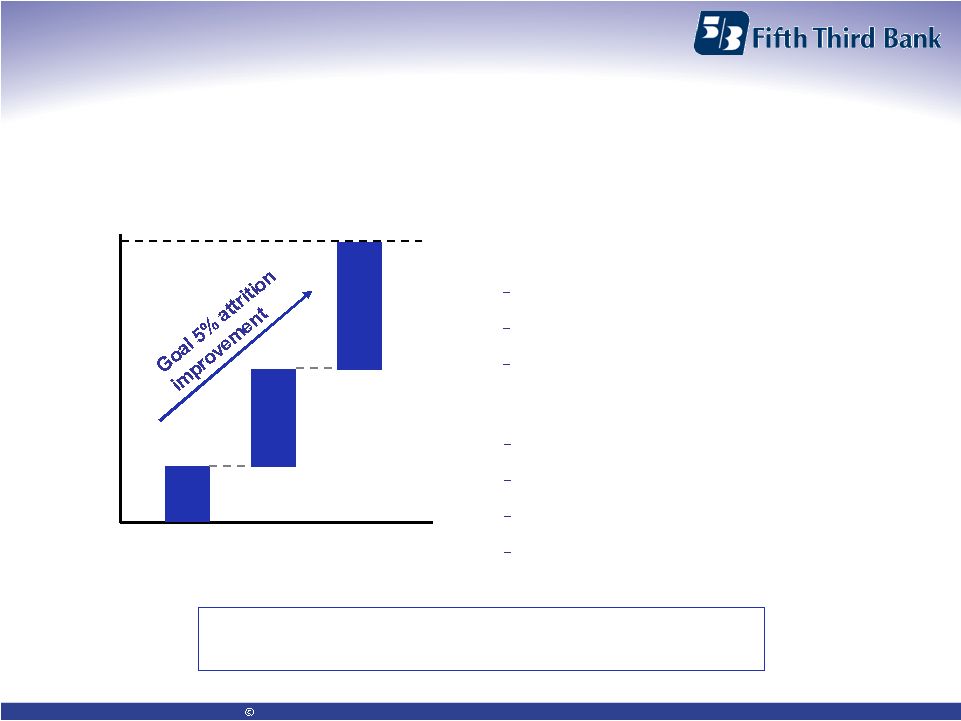 15 Fifth Third Bank | All Rights Reserved | Citigroup | January 30, 2007 Customer experience opportunity $63M of incremental net income through 2009 from reducing retail customer attrition by 5% Current Customer Experience Current retail DDA attrition 16% Advice level satisfaction 50% Ineffective problem management Fully Satisfied Customers Are 1.7x more likely to remain at 5/3 Have 6.5% more accounts Maintain larger balances (9% more) These multiples will rise with satisfaction improvement $63MM $7MM $28MM 2007 2008 2009 Cumulative net income value 1% 4% 5% One percent improvement in customer retention represents $7 million net income improvement |
 16 Fifth Third Bank | All Rights Reserved | Citigroup | January 30, 2007 Fifth Third: building a better tomorrow Balancing growth and profitability Capitalizing on strengths and developing plans to address areas of weakness Communicating clearly with investors Delivering on promises Returning to above-par performance and shareholder returns |
 17 Fifth Third Bank | All Rights Reserved | Citigroup | January 30, 2007 Cautionary statement This report may contain forward-looking statements about the Registrant and/or the
company as combined with acquired entities within the meaning of Sections 27A of the Securities Act of 1933, as amended, and Rule 175 promulgated the reunder, and 21E of the Securities Exchange Act of 1934, as amended, and Rule 3b-6 promulgated the reunder, that involve inherent risks and uncertainties. This report may contain certain forward-looking statements with
respect to the financial condition, results of operations, plans,
objectives, future performance and business of the Registrant and/or the combined company including statements preceded by, followed by or that include the words or phrases such as “believes,” “expects,” “anticipates,” “plans,” “trend,” “objective,” “continue,” “remain” or similar expressions or future or conditional verbs such as “will,”
“would,” “should,” “could,” “might,” “can,” “may” or similar expressions. There are a number of important factors that could cause future results to differ materially from historical performance and these forward-looking statements.
Factors that might cause such a difference include, but are not limited to: (1) competitive pressures among depository institutions increase significantly; (2) changes in the interest rate environment may reduce interest margins; (3) prepayment speeds, loan
origination and sale volumes, charge-offs and loan loss provisions are
inherently uncertain; (4) general economic conditions, either national or in the states in which the Registrant, one or more acquired entities and/or the combined company do business, are
less favorable than expected; (5) political developments, wars or other hostilities may disrupt or increase volatility in securities markets or other economic conditions; (6) changes and trends in the securities markets; (7) legislative or
regulatory changes or actions, or significant litigation, adversely affect
the Registrant, one or more acquired entities and/or the combined company or the businesses in which the Registrant, one or more acquired entities and/or the combined company are engaged;
(8) difficulties in combining the operations of acquired entities; (9) our
ability to maintain favorable ratings from rating agencies; and (10) the impact of reputational risk created by the developments discussed above on such matters as business generation and retention, funding and liquidity. Additional information concerning factors that could cause actual results
to differ materially from those expressed or implied in the
forward-looking statements is available in the Bancorp's Annual Report on Form 10-K for the year ended December 31, 2005, filed with the United States Securities and Exchange Commission (SEC).Copies
of this filing are available at no cost on the SEC's Web site at www.sec.gov or on the Registrant's Web site at www.53.com. The Registrant undertakes no obligation to release revisions to these forward-looking statements or reflect events or
circumstances after the date of this report. |