Exhibit 99(c)(1)
* International Lottery & Totalizator Systems, Inc. Valuation Analysis Jeff K. Davis, CFA Matt Crow, CFA, ASA November 7, 2013 DRAFT REPORT FOR DISCUSSION
* Contents of Presentation Engagement Overview Company Overview Historical Financial Statements Valuation Analysis Transaction Method Net Asset Value Method Earnings Capitalization via the ACAPM Range of Value Conclusion Guideline Transaction & Company Method Discounted Cash Flow Method

* Engagement Overview SECTION ONE
* Engagement Overview International Lottery & Totalizator Systems, Inc. (“ILTS”) is 71.3% owned by Hong Kong-based Berjaya Lottery Management Ltd. (“BLM”). Mercer Capital Management, Inc. (“Mercer”) has been retained by the special committee of the Board of Directors of ILTS to: Prepare a valuation analysis of ILTS for the possible acquisition of the 28.7% minority share interest by BLM; and Provide additional advisory services if the contemplated transaction proceeds to formal negotiations. Mercer Capital has not been informed of the valuation conclusion that was prepared by BLM’s financial advisor. Mercer Capital has no financial interest in ILTS nor has it been engaged by the Company during the past three years.
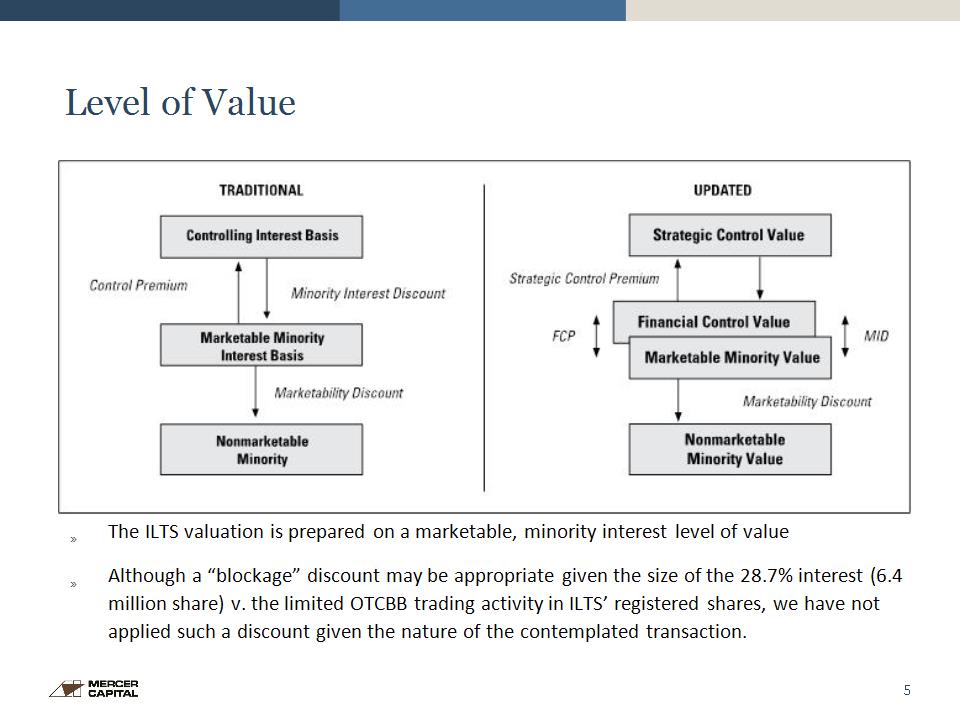
* Level of Value The ILTS valuation is prepared on a marketable, minority interest level of value Although a “blockage” discount may be appropriate given the size of the 28.7% interest (6.4 million share) v. the limited OTCBB trading activity in ILTS’ registered shares, we have not applied such a discount given the nature of the contemplated transaction.

* Company Overview SECTION Two
* Company Overview Vista, California-based ILTS was founded in 1978. An IPO occurred in 1981. The Company remains a registrant with the SEC; its shares are traded via the OCT Bulletin Board (“OTCBB”). ILTS generates revenues via the “lottery and pari-mutual” and “voting” business units. The lottery unit designs, manufactures, licenses and services computerized systems and terminals for the lottery and pari-mutual racing industries. Latest 12 month (“LTM) revenues as of July 31, 2013 were $11.8 million. The voting unit develops, manufactures, licenses and supports systems for governmental election jurisdictions via a wholly-owned subsidiary, Unisyn Voting Solutions, Inc. (“Unisyn”). LTM revenues were $3.3 million.
* Company Overview Market share for both business units is modest; competitors are significantly larger than ILTS with greater financial, manpower and technical resources. While a small firm operating in large markets has growth opportunities, management noted lotteries (188 globally) are a mature business while municipalities have curtailed voting systems expenditures due to financial constraints. ILTS employs 35 individuals, none of who have an employment agreement. Jeff Johnson, age 52, joined ILTS in 1984 and has served as President since 2007. His FY13 compensation was $181,000.
* Company Overview The gaming systems include a central computer, proprietary DataTrak software, Datamark and Intelimark point-of-sale terminals and an interfacing communication network. Over 50,000 terminals have been delivered since 1980. Unisyn has developed a certified end-to-end optical scan voting systems and a full-featured election management software that provides precinct tabulation, ballot review and audio voting capability. Unisyn’s Inkavote Plus Precinct Ballot Counter has been certified by the National Association of State Election Directors 2002 Voting Systems Standards. Also, its OpenElect digital optical scan election system has received the 2005 Voluntary Voting System Guidelines certification. The 2005 VVS certification was thought to be a significant competitive advantage when Unisyn was of the first to obtain it; however, that certification did not translate into a significant increase in voting revenues.
* Company Overview ILTS’ gaming customer base is concentrated. Large system replacement contracts typically occur every ~ten years. Affiliates of BLM are large ILTS customers: Philippine Gaming Management, Sports Toto Malaysia and Natural Avenue. LTM revenues were $6.1 million, 41% of total revenues. Ab Trav Och Galopp (Swedish racing association) LTM revenues were $3.5 million (23%). Management stated ATG was expected to be a one-time large order. ILTS voting business has existed for ~ten years, though only since FY12 has the unit gained some traction even though its products have key certifications. The voting unit has one primary customer (agent), Adkins (IA, KS & MO) that produced $3.0 million of LTM revenue, 20% of total revenue. Two other agent relationships have yet to produce orders in a FY that have exceeded $300,000. Management indicated revenues should be stable around $3 million.
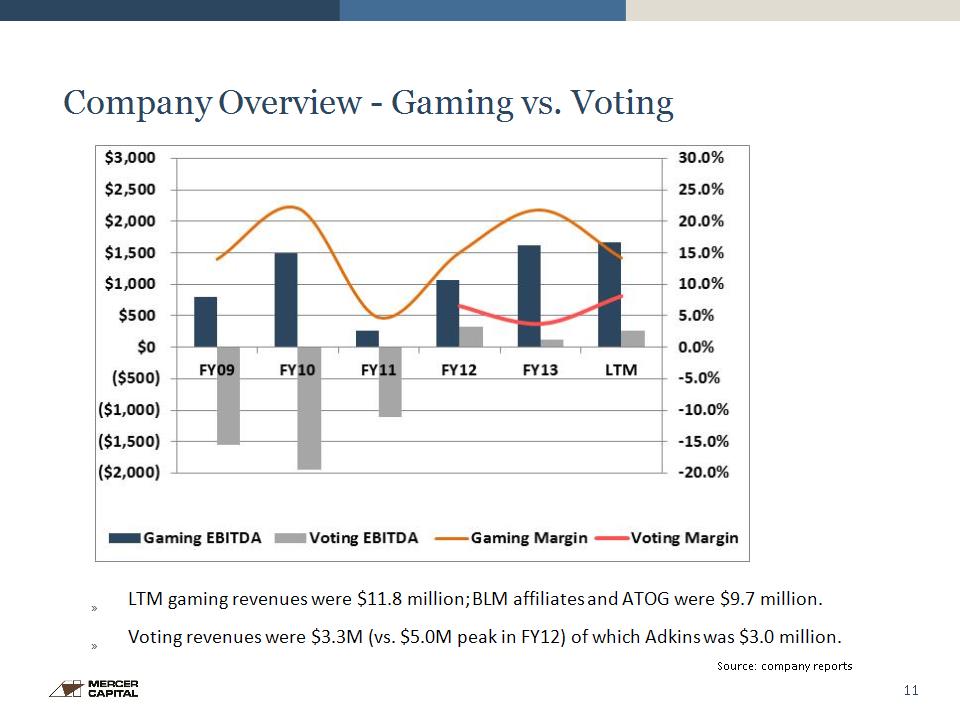
* Company Overview - Gaming vs. Voting LTM gaming revenues were $11.8 million; BLM affiliates and ATOG were $9.7 million. Voting revenues were $3.3M (vs. $5.0M peak in FY12) of which Adkins was $3.0 million. Source: company reports
* Company Overview ILTS has never paid a dividend; nor has it repurchased a material amount of shares. As of July 31, 2013, $9.1 million of shareholders’ equity consisted of $56.4 million of contributed capital and deficit retained earnings of $47.3 million. Aside from $6.5 million of capital raised via the exercise of warrants, options and the like that occurred during the 1990s, BLM funded operating losses in prior years via its capital infusion. BLM acquired 2.2 million shares (adjusted for a 1:3 reverse stock split in June 1998) for $46.1 million, or $21.00 per share, via two transactions in 1993. BLM acquired an additional 6.9 million shares in May 1999 for $5.2 million, or $0.75 per share.
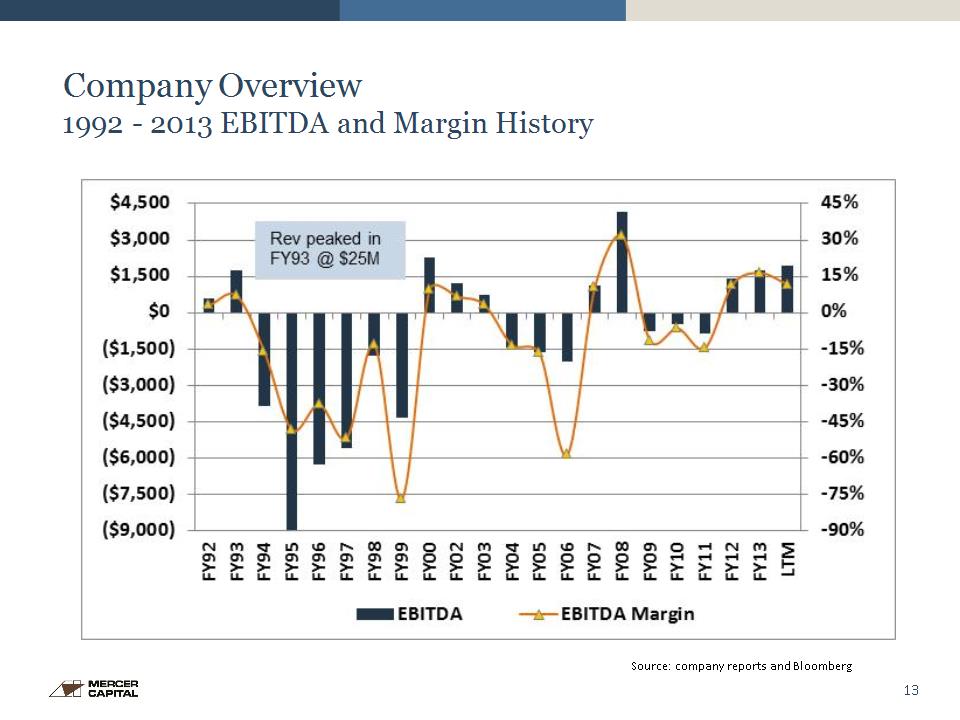
* Company Overview 1992 – 2013 EBITDA and Margin History Source: company reports and Bloomberg
* Valuation Analysis Section Three
* Valuation Process As shown in the accompanying slides, there is a significant dispersion in value between the DCF method and various measures of capitalized earning power. The delta is attributable to management’s assessment that once the current Sports Toto and ATOG contracts are completed, the only visible potential contracts of size are one each from Vietnam in FY14 and the Philippines in FY17 and FY18. As of September 30, ILTS had $7.1M of cash. Management estimated $5M is needed as an operating cushion given long periods when losses have been sustained. We added all of the cash to the indicated value of the operating company, noting that $5.1M of net working capital (A/R + inventory - A/P - accrued expense – other cur liabilities) represents future net liquidity. Rather than develop a point value, we derived a range based upon weighting the various indications of value somewhat differently. Given negotiations that may occur, a range should be more flexible in assisting the board in its deliberations.
* Transaction Method The transactions method is a market approach that develops an indication of value based upon consideration of actual transactions in the stock of a subject company. Transactions are reviewed to determine if they have occurred at arms’ length, with a reasonable degree of frequency, and within a reasonable period of time relative to the valuation date. Indications of value within the context of the transaction method can also be derived from offers to acquire a significant block or all of the subject company’s common shares. Management indicated it was not aware of BLM ever receiving an offer or expression of interest for ILTS. The transactions-based indication of value that follows was developed from OTCBB trading activity in the Company’s shares.
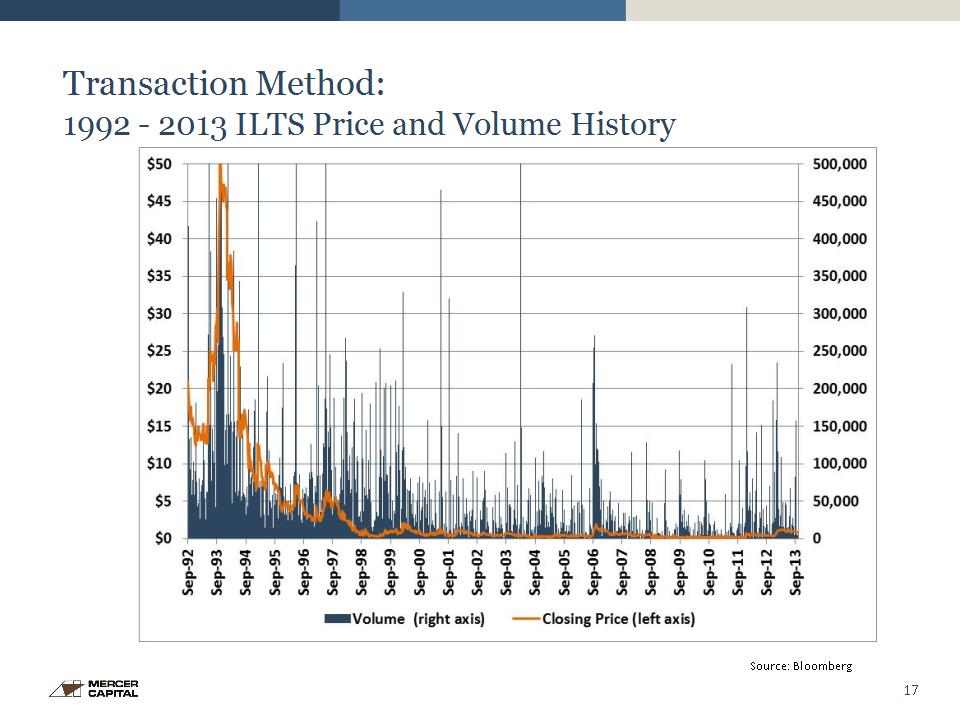
* Transaction Method: 1992 – 2013 ILTS Price and Volume History Source: Bloomberg
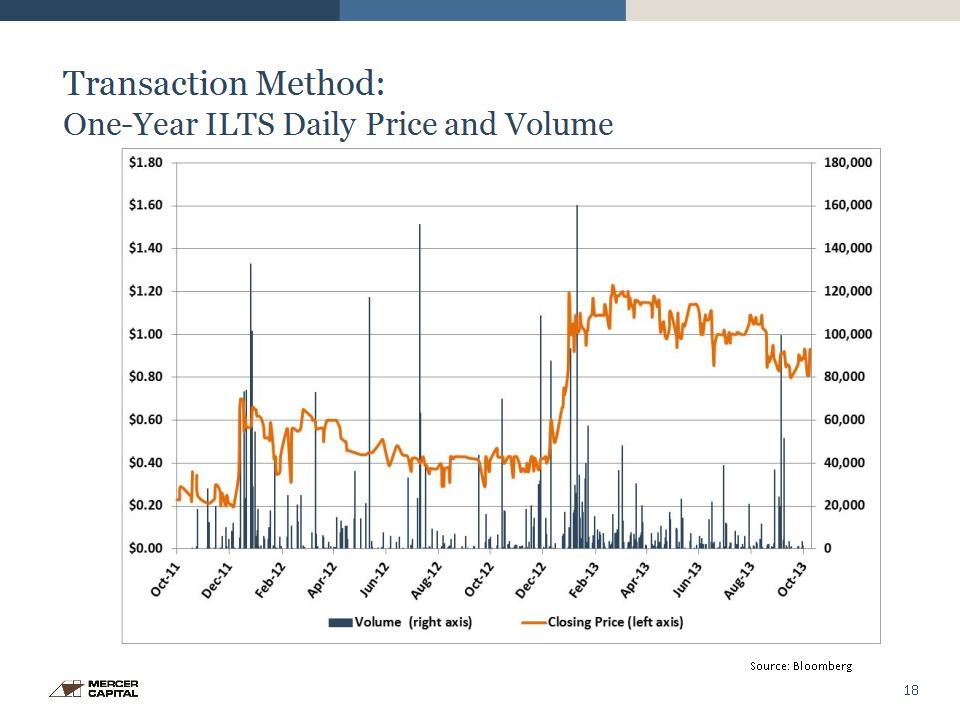
* Transaction Method: One-Year ILTS Daily Price and Volume Source: Bloomberg
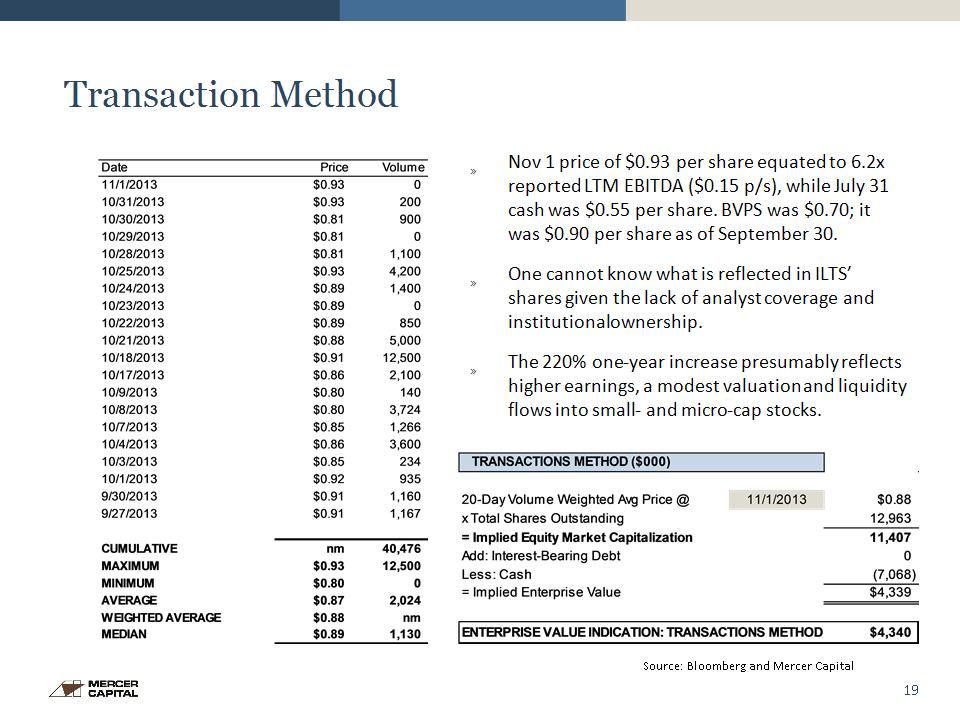
* Transaction Method Nov 1 price of $0.93 per share equated to 6.2x reported LTM EBITDA ($0.15 p/s), while July 31 cash was $0.55 per share. BVPS was $0.70; it was $0.90 per share as of September 30. One cannot know what is reflected in ILTS’ shares given the lack of analyst coverage and institutional ownership. The 220% one-year increase presumably reflects higher earnings, a modest valuation and liquidity flows into small- and micro-cap stocks. Source: Bloomberg and Mercer Capital
* Net Asset Value Method The net asset value method is an asset-based approach that develops a valuation indication in the context of a going concern by adjusting the reported book values of a subject company’s assets to their market values and subtracting its liabilities (adjusted to market value, if appropriate). The indicated value should not be interpreted as an estimate of liquidation value. Often times the NAV method is considered to be more appropriate in the valuation of asset holding companies than for operating companies such as ILTS. No adjustments to ILTS’ reported assets and liabilities were identified. The balance sheet is relatively simple, consisting of cash, receivables, payables, accrued expenses and deferred revenue and costs related to the percentage-of-completion accounting method for long-lived contracts. Also, ILTS leases its real estate from a third party.

* Net Asset Value Method: Source: Mercer Capital
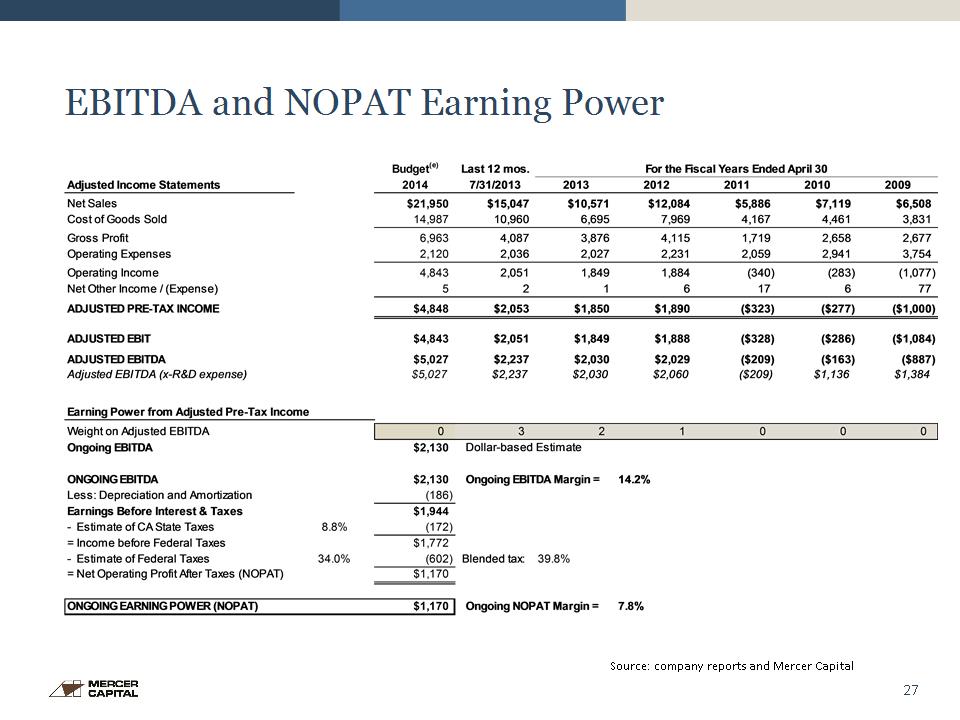
* Earning Power Development Ongoing earning power is an estimate of sustainable earnings and represents a base from which long‑term growth can be expected. Earning power in the case of ILTS has less certainty given the Company’s uneven financial performance in which periods of losses have been replaced with earnings the past two years and an expectation based upon management’s assessment that earnings will roughly double in FY14 then decline sharply in FY15. We have developed two measures of earning power in Exhibits V-2 and V-4: earnings before interest, taxes, depreciation and amortization (“EBITDA”) and net operating profit after tax (“NOPAT”), which converts EBIT to an after-tax basis (i.e., interest income and expense are excluded).
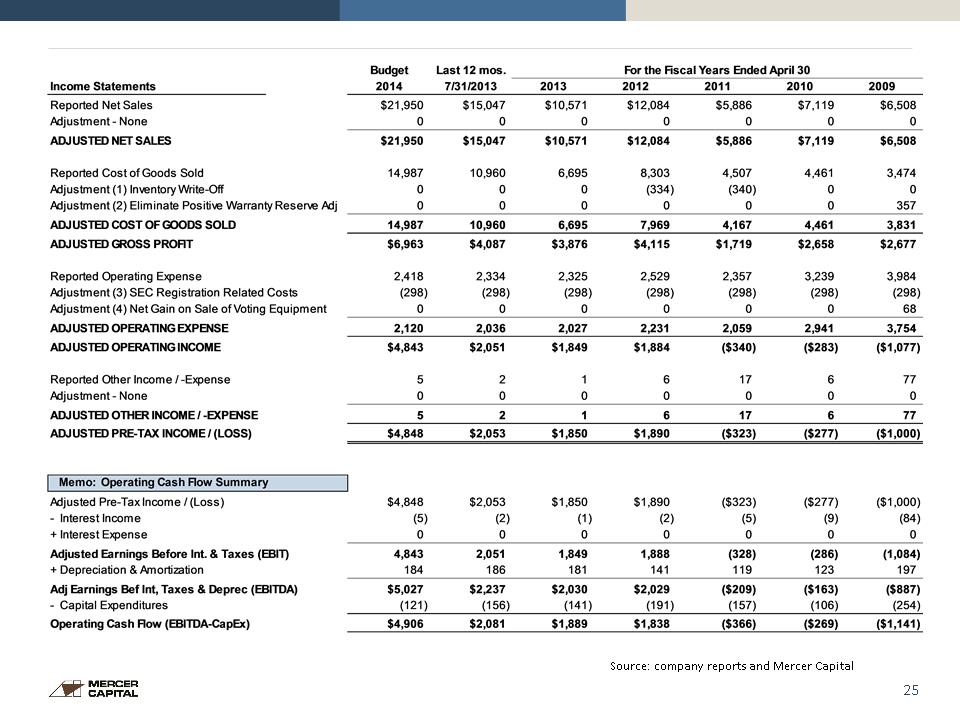
* Earning Power Development In Exhibit V-2 we have made the following adjustments: Cost of goods sold was reduced by $334,000 in FY12 and $340,000 in FY11 for inventory write-offs associated with a prior customer. Cost of goods sold was increased by $357,000 in FY09 to eliminate a non-recurring adjustment to warranty reserve that was made after the reserve associated with a specific contract expired. Management estimated the annual cost of being a registered company is $443,000. We reduced operating expenses by $298,000, assuming all but the audit-related fees of $145,000 will be eliminated. Operating expenses in FY09 were increased by $68,000 to eliminate a gain realized on the sale of voting equipment. Ongoing EBITDA and NOPAT earning power measures are developed by applying a weighted average to LTM, FY13 and FY12 adjusted earnings to reflect our view that the preponderance of earning power should be based upon current results.
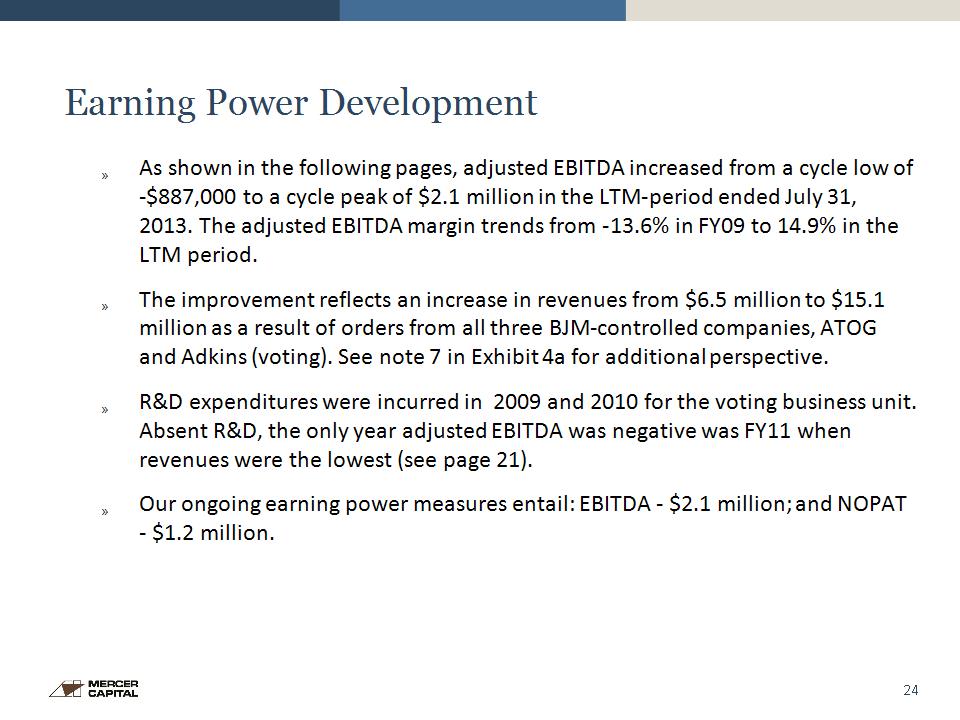
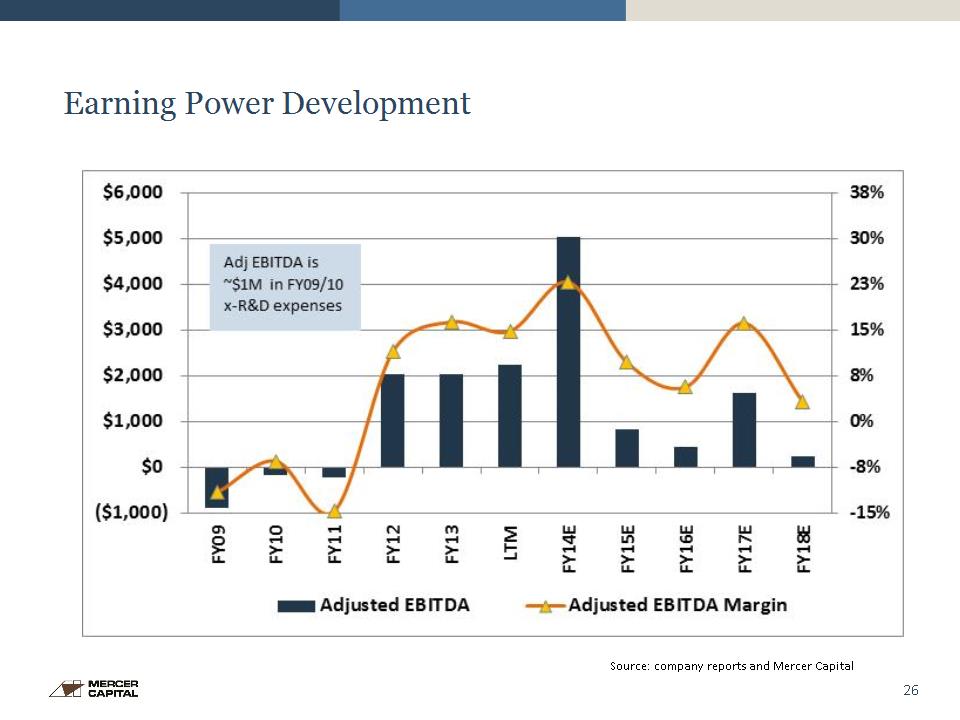
* Earning Power Development As shown in the following pages, adjusted EBITDA increased from a cycle low of -$887,000 to a cycle peak of $2.1 million in the LTM-period ended July 31, 2013. The adjusted EBITDA margin trends from -13.6% in FY09 to 14.9% in the LTM period. The improvement reflects an increase in revenues from $6.5 million to $15.1 million as a result of orders from all three BJM-controlled companies, ATOG and Adkins (voting). See note 7 in Exhibit 4a for additional perspective. R&D expenditures were incurred in 2009 and 2010 for the voting business unit. Absent R&D, the only year adjusted EBITDA was negative was FY11 when revenues were the lowest (see page 21). Our ongoing earning power measures entail: EBITDA - $2.1 million; and NOPAT - $1.2 million.
* Source: company reports and Mercer Capital
* Earning Power Development Source: company reports and Mercer Capital
* Source: company reports and Mercer Capital EBITDA and NOPAT Earning Power
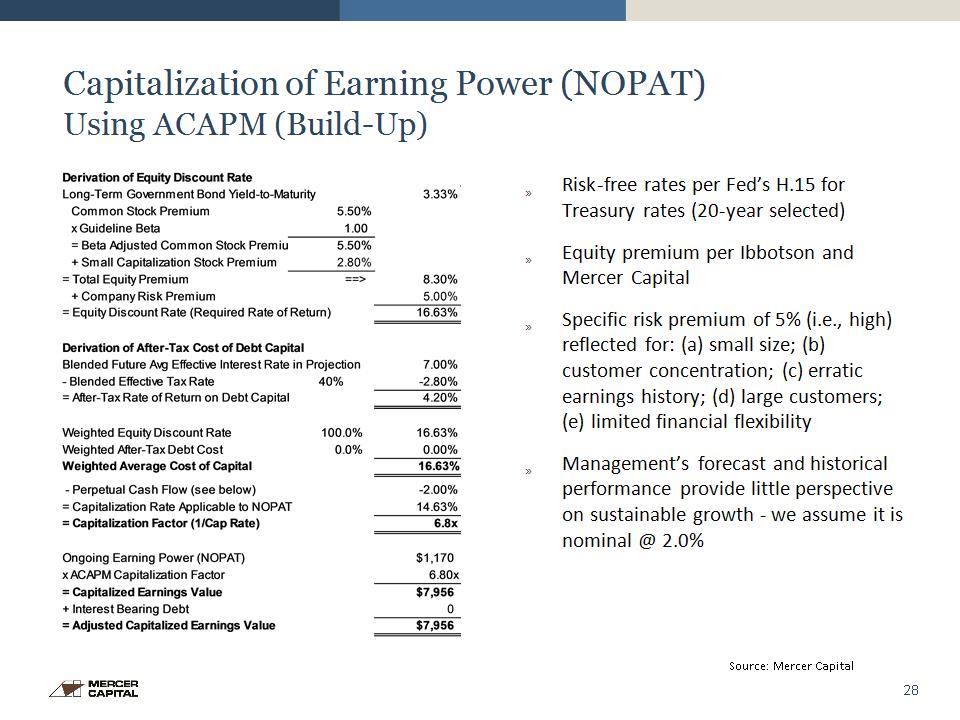
* Capitalization of Earning Power (NOPAT) Using ACAPM (Build-Up) Risk-free rates per Fed’s H.15 for Treasury rates (20-year selected) Equity premium per Ibbotson and Mercer Capital Specific risk premium of 5% (i.e., high) reflected for: (a) small size; (b) customer concentration; (c) erratic earnings history; (d) large customers; (e) limited financial flexibility Management’s forecast and historical performance provide little perspective on sustainable growth – we assume it is nominal @ 2.0% Source: Mercer Capital
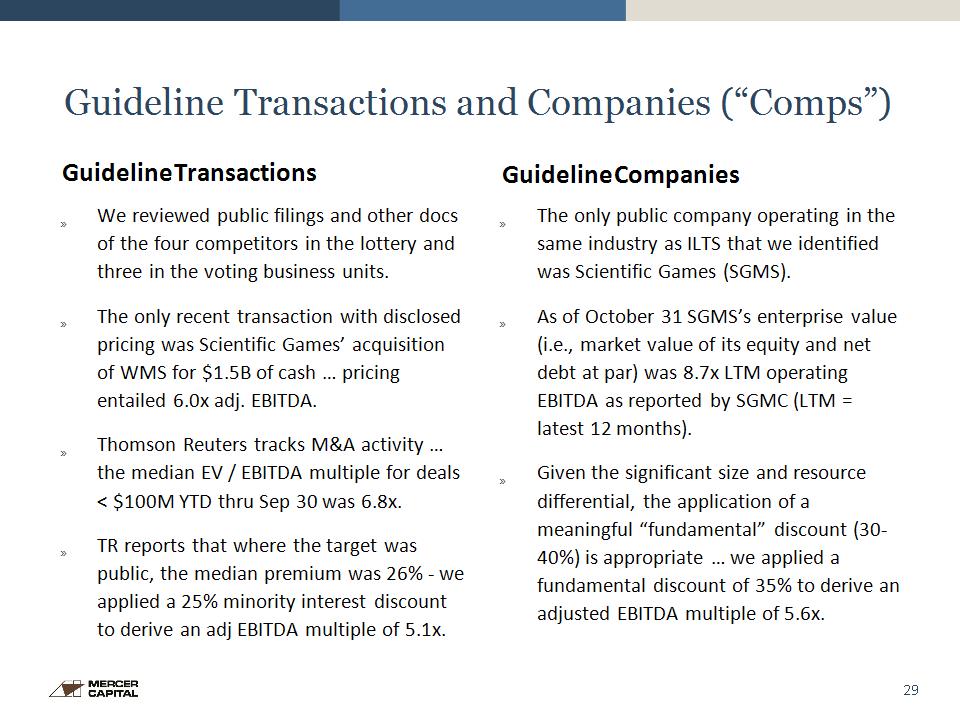
* Guideline Transactions and Companies (“Comps”) Guideline Transactions We reviewed public filings and other docs of the four competitors in the lottery and three in the voting business units. The only recent transaction with disclosed pricing was Scientific Games’ acquisition of WMS for $1.5B of cash … pricing entailed 6.0x adj. EBITDA. Thomson Reuters tracks M&A activity … the median EV / EBITDA multiple for deals < $100M YTD thru Sep 30 was 6.8x. TR reports that where the target was public, the median premium was 26% - we applied a 25% minority interest discount to derive an adj EBITDA multiple of 5.1x. Guideline Companies The only public company operating in the same industry as ILTS that we identified was Scientific Games (SGMS). As of October 31 SGMS’s enterprise value (i.e., market value of its equity and net debt at par) was 8.7x LTM operating EBITDA as reported by SGMC (LTM = latest 12 months). Given the significant size and resource differential, the application of a meaningful “fundamental” discount (30-40%) is appropriate … we applied a fundamental discount of 35% to derive an adjusted EBITDA multiple of 5.6x.
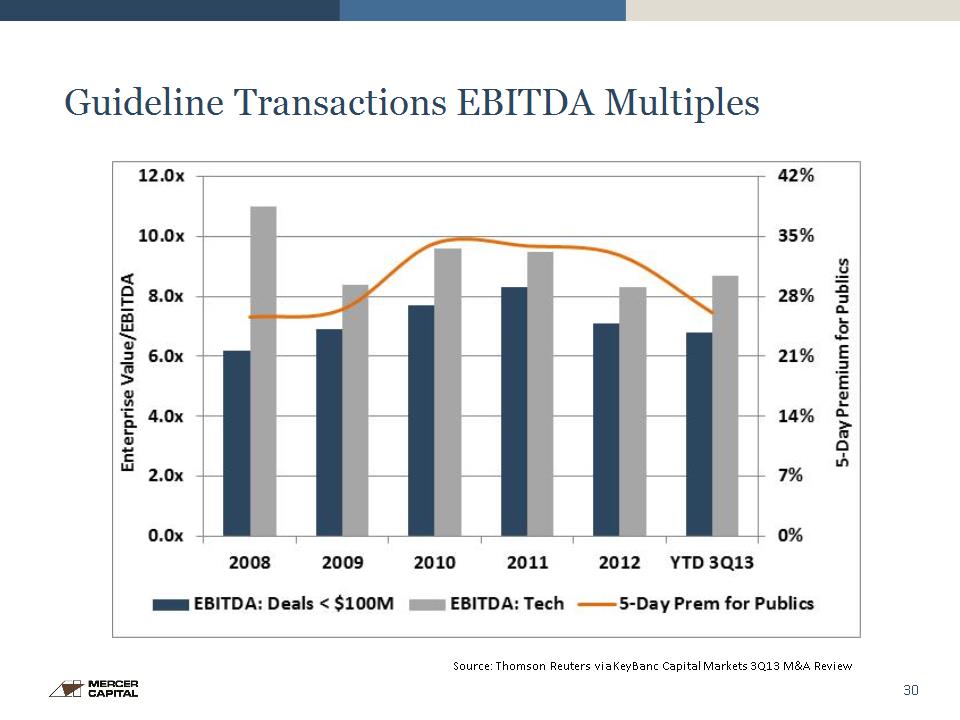
* Guideline Transactions EBITDA Multiples Source: Thomson Reuters via KeyBanc Capital Markets 3Q13 M&A Review

* Guideline Transactions and Companies (“Comps”) Source: Mercer Capital

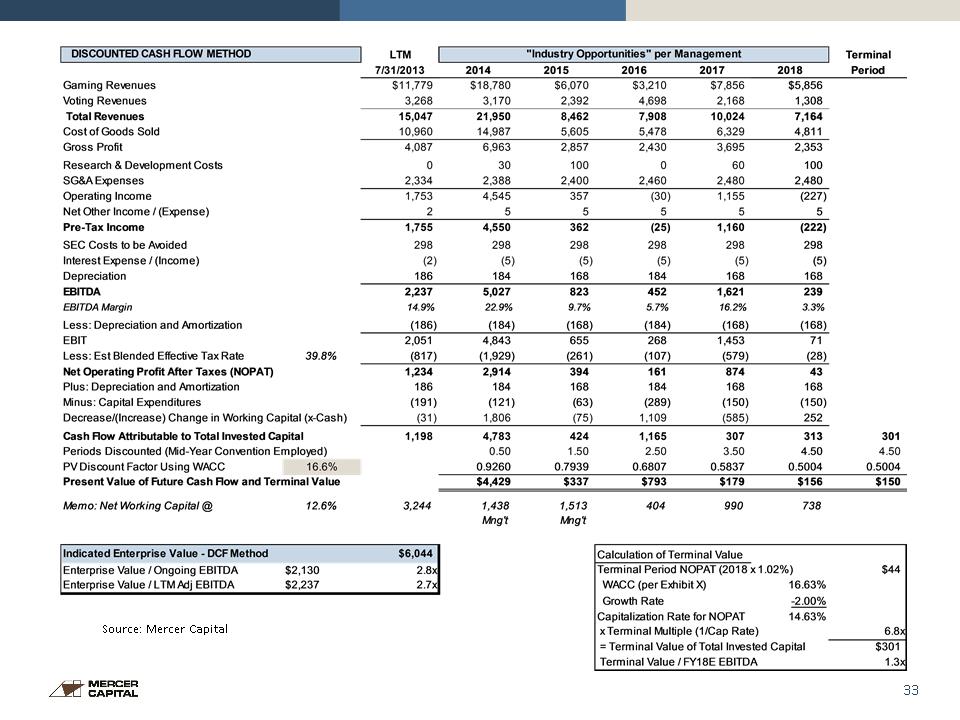
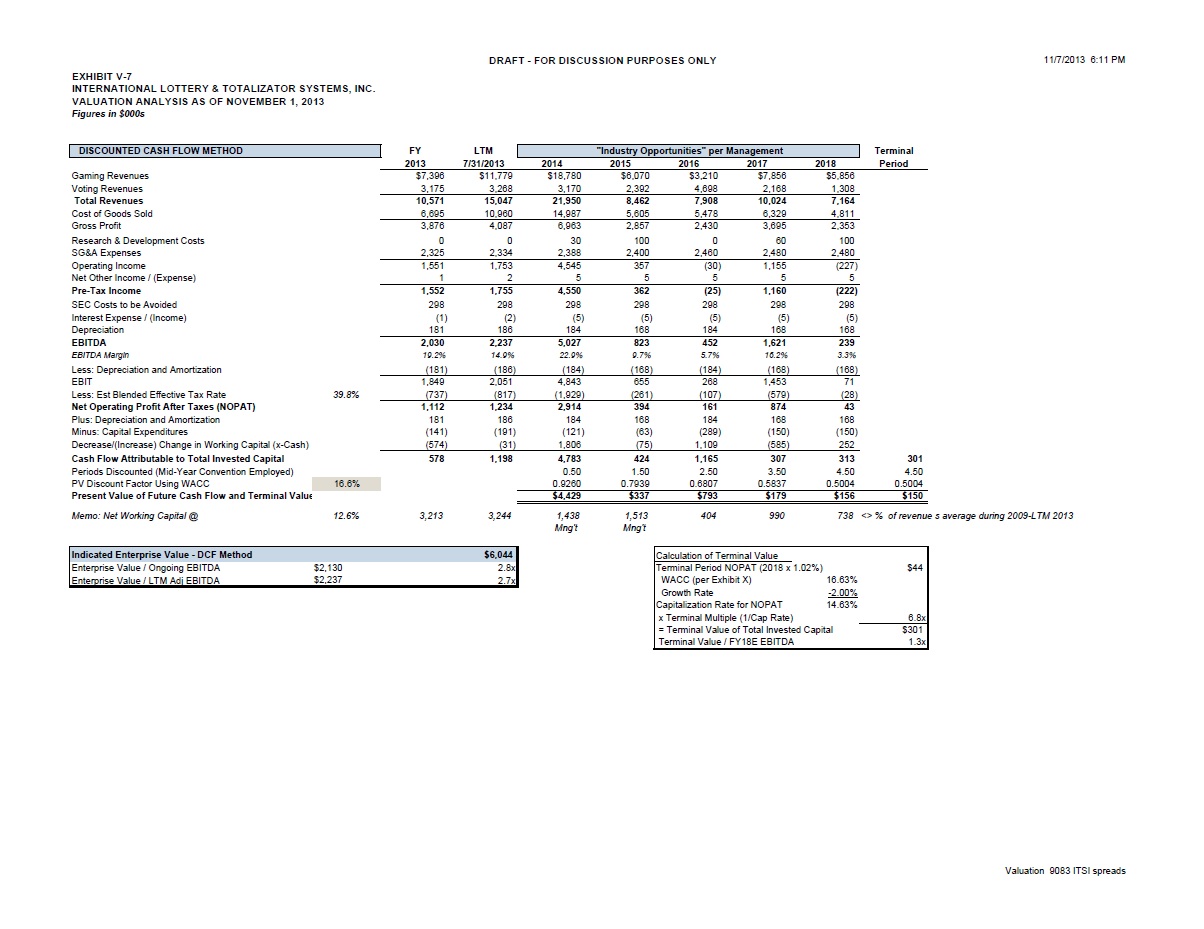
* Discounted Cash Flow Method The DCF method measures the present value of projected cash flows that accrue to shareholders. Cash flows are discounted at an appropriate required rate of return for the subject company (16.6% per above). Cash flow consists of after-tax income excluding interest income and expense (NOPAT), plus depreciation, less capital expenditures, +/- reductions/increases in net working capital. Forecasted revenue and earnings reflect management’s “industry opportunities” assessment for 2014 – 2018. We made a simplifying assumption that net working capital is equal to 13% of sales based upon the historical 2009-LTM average. The terminal value reflects the product of 2018 projected NOPAT and the assumed growth rate of 2% (to derive cash flow one year out) and the earnings multiple of 6.8x as derived above using the ACAPM.
* Source: Mercer Capital
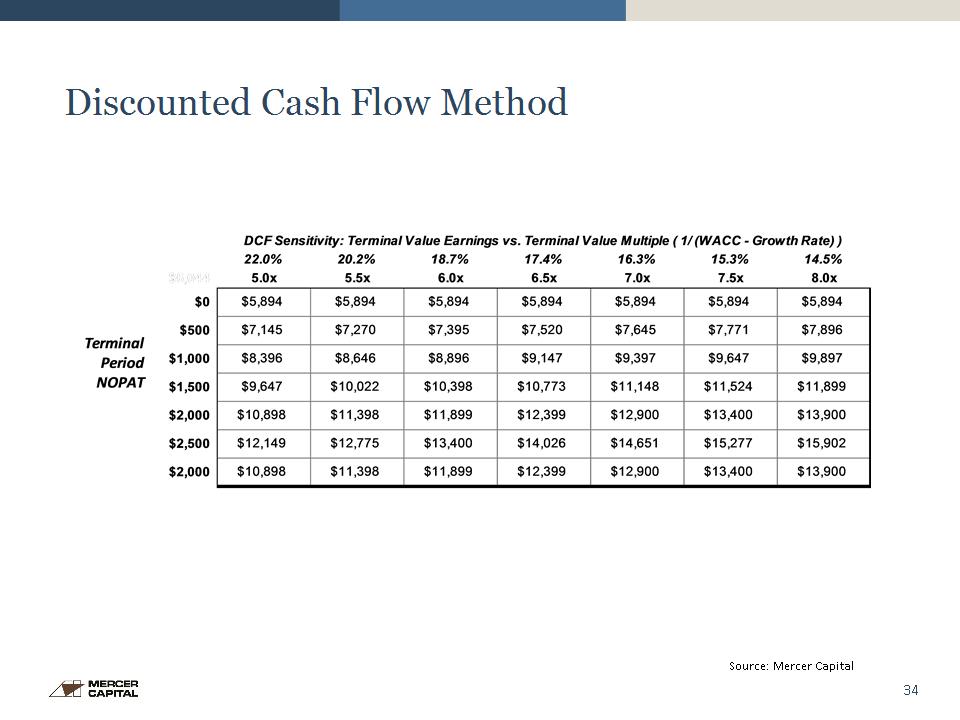
* Discounted Cash Flow Method Source: Mercer Capital
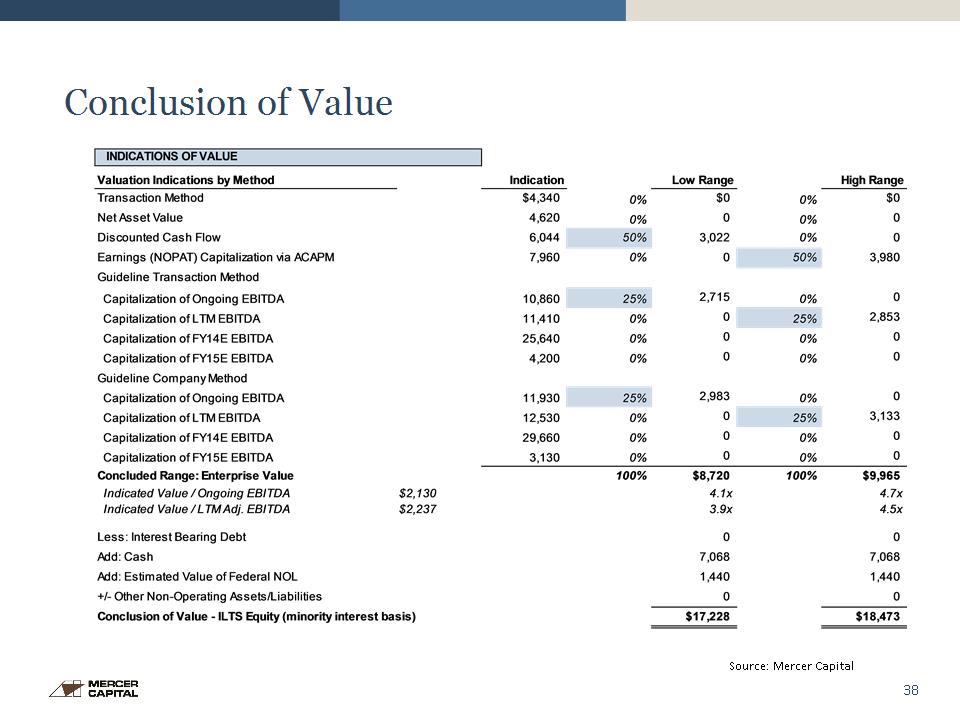
* Conclusion of Value The conclusion of value reflects a range based upon weights applied to the various indications of value. The low-end is anchored by a 50% weight applied to the DCF method, the lowest indicated value vis-à-vis other earnings based measures. Weights of 25% are applied to two measures of capitalized EBITDA. The effect is to evenly weight future performance that is expected to decline vs. today’s better performance. The high-end of the range is derived via applying a 50% weight to the ACAPM build-up method used to capitalize NOPAT (i.e., net income x-interest income and expense) and 25% each to various measures of capitalized EBITDA
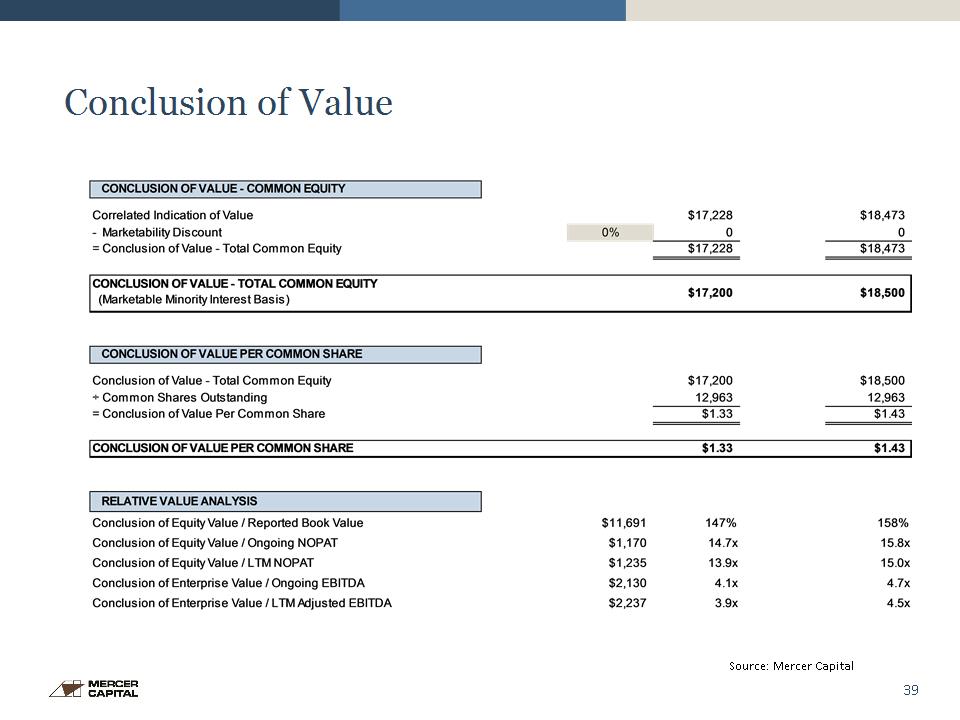
* Conclusion of Value The conclusion of value for the operating company is $8.7 million to $10.0 million, which equates to 3.9x to 4.5x LTM adjusted EBITDA. All of the indications of value are on a debt-free basis (i.e., earning measures exclude interest expense—ILTS is not levered—and interest income). Deriving an equity indication of value entails subtracting the subject’s debt and adding cash (or subtracting net debt). Management noted that ~$5 million of cash is needed to sustain ops because there can be long periods between major orders and because ILTS’ request for a line of credit was recently rejected by four banks. We note as of September 30 A/R and inventory less accrued expenses and accounts payable approximated $5 million.
* Conclusion of Value We also added $1.4 million to the value of the operating company for the estimated present value of ILTS’ Federal NOL carry-forward. The present value calculation is shown in Exhibit V-9. The $14.5 million NOL was reduced for year-to-date net income through September 30. We utilized management’s “industry opportunities” forecast to value utilization of the NOL through 2018; thereafter we assumed taxable income of $1.0 million per year. The discount rate of 20% reflects an additional premium in excess of the cost of equity capital referenced above given the long-time frame necessary to utilize the NOL. Although the subject block of shares represents a minority interest, no marketability discount was applied because a nominal market exists, the shares are registered and to do so is not reasonable in the context of a majority shareholder acquiring (or squeezing out) the minority.
* Conclusion of Value Source: Mercer Capital
* Conclusion of Value Source: Mercer Capital
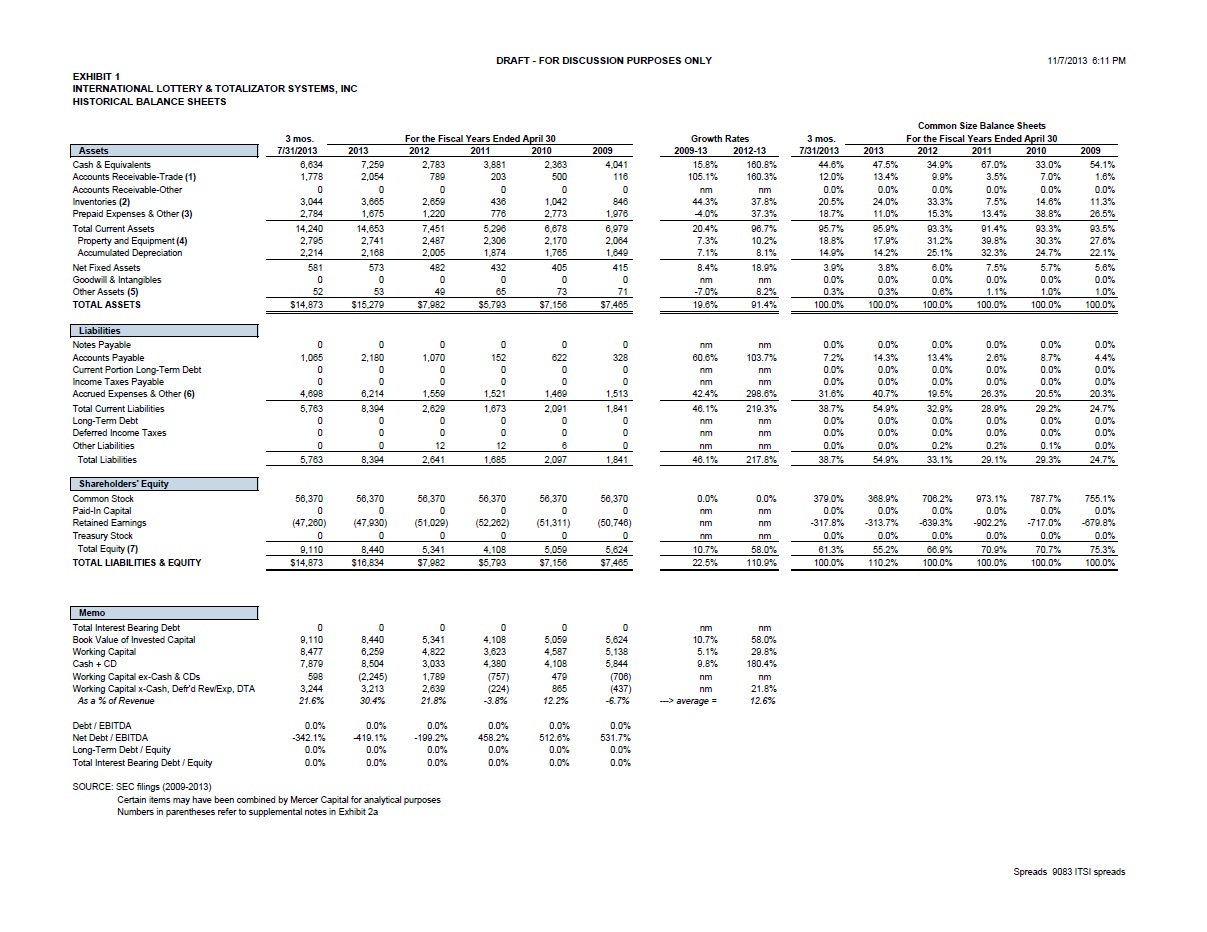
EXHIBIT 1 INTERNATIONAL LOTTERY & TOTALIZER SYSTEMS, INC. HISTORICAL BALANCE SHEETS Common Size Balance Sheets 3 mos. For the Fiscal Years Ended April 30 Growth Rates 3 mos. For the Fiscal Years Ended April 30 Assets 7/31/2013 2013 2012 2011 2010 2009 2009-13 2012-13 7/31/2013 2013 2012 2011 2010 2009 Cash & Equivalents 6,634 7,259 2,783 3,881 2,363 4,041 15.8% 160.8% 44.6% 47.5% 34.9% 67.0% 33.0% 54.1% Accounts Receivable-Trade (1) 1,778 2,054 789 203 500 116 105.1% 160.3% 12.0% 13.4% 9.9% 3.5% 7.0% 1.6% Accounts Receivable-Other 0 0 0 0 0 0 nm nm 0.0% 0.0% 0.0% 0.0% 0.0% 0.0% Inventories (2) 3,044 3,665 2,659 436 1,042 846 44.3% 37.8% 20.5% 24.0% 33.3% 7.5% 14.6% 11.3% Prepaid Expenses & Other (3) 2,784 1,675 1,220 776 2,773 1,976 -4.0% 37.3% 18.7% 11.0% 15.3% 13.4% 38.8% 26.5% Total Current Assets 14,240 14,653 7,451 5,296 6,678 6,979 20.4% 96.7% 95.7% 95.9% 93.3% 91.4% 93.3% 93.5% Property and Equipment (4) 2,795 2,741 2,487 2,306 2,170 2,064 7.3% 10.2% 18.8% 17.9% 31.2% 39.8% 30.3% 27.6% Accumulated Depreciation 2,214 2,168 2,005 1,874 1,765 1,649 7.1% 8.1% 14.9% 14.2% 25.1% 32.3% 24.7% 22.1% Net Fixed Assets 581 573 482 432 405 415 8.4% 18.9% 3.9% 3.8% 6.0% 7.5% 5.7% 5.6% Goodwill & Intangibles 0 0 0 0 0 0 nm nm 0.0% 0.0% 0.0% 0.0% 0.0% 0.0% Other Assets (5) 52 53 49 65 73 71 -7.0% 8.2% 0.3% 0.3% 0.6% 1.1% 1.0% 1.0% TOTAL ASSETS $14,873 $15,279 $7,982 $5,793 $7,156 $7,465 19.6% 91.4% 100.0% 100.0% 100.0% 100.0% 100.0% 100.0% Liabilities Notes Payable 0 0 0 0 0 0 nm nm 0.0% 0.0% 0.0% 0.0% 0.0% 0.0% Accounts Payable 1,065 2,180 1,070 152 622 328 60.6% 103.7% 7.2% 14.3% 13.4% 2.6% 8.7% 4.4% Current Portion Long-Term Debt 0 0 0 0 0 0 nm nm 0.0% 0.0% 0.0% 0.0% 0.0% 0.0% Income Taxes Payable 0 0 0 0 0 0 nm nm 0.0% 0.0% 0.0% 0.0% 0.0% 0.0% Accrued Expenses & Other (6) 4,698 6,214 1,559 1,521 1,469 1,513 42.4% 298.6% 31.6% 40.7% 19.5% 26.3% 20.5% 20.3% Total Current Liabilities 5,763 8,394 2,629 1,673 2,091 1,841 46.1% 219.3% 38.7% 54.9% 32.9% 28.9% 29.2% 24.7% Long-Term Debt 0 0 0 0 0 0 nm nm 0.0% 0.0% 0.0% 0.0% 0.0% 0.0% Deferred Income Taxes 0 0 0 0 0 0 nm nm 0.0% 0.0% 0.0% 0.0% 0.0% 0.0% Other Liabilities 0 0 12 12 6 0 nm nm 0.0% 0.0% 0.2% 0.2% 0.1% 0.0% Total Liabilities 5,763 8,394 2,641 1,685 2,097 1,841 46.1% 217.8% 38.7% 54.9% 33.1% 29.1% 29.3% 24.7% Shareholders' Equity Common Stock 56,370 56,370 56,370 56,370 56,370 56,370 0.0% 0.0% 379.0% 368.9% 706.2% 973.1% 787.7% 755.1% Paid-In Capital 0 0 0 0 0 0 nm nm 0.0% 0.0% 0.0% 0.0% 0.0% 0.0% Retained Earnings (47,260) (47,930) (51,029) (52,262) (51,311) (50,746) nm nm -317.8% -313.7% -639.3% -902.2% -717.0% -679.8% Treasury Stock 0 0 0 0 0 0 nm nm 0.0% 0.0% 0.0% 0.0% 0.0% 0.0% Total Equity (7) 9,110 8,440 5,341 4,108 5,059 5,624 10.7% 58.0% 61.3% 55.2% 66.9% 70.9% 70.7% 75.3% TOTAL LIABILITIES & EQUITY $14,873 $16,834 $7,982 $5,793 $7,156 $7,465 22.5% 110.9% 100.0% 110.2% 100.0% 100.0% 100.0% 100.0% 14,873 15,279 7,982 5,793 7,156 7,465 Memo Total Interest Bearing Debt 0 0 0 0 0 0 nm nm Book Value of Invested Capital 9,110 8,440 5,341 4,108 5,059 5,624 10.7% 58.0% Working Capital 8,477 6,259 4,822 3,623 4,587 5,138 5.1% 29.8% Cash + CD 7,879 8,504 3,033 4,380 4,108 5,844 9.8% 180.4% Working Capital ex-Cash & CDs 598 (2,245) 1,789 (757) 479 (706) nm nm Debt / EBITDA 0.0% 0.0% 0.0% 0.0% 0.0% 0.0% Net Debt / EBITDA -342.1% -419.1% -199.2% 458.2% 512.6% 531.7% Long-Term Debt / Equity 0.0% 0.0% 0.0% 0.0% 0.0% 0.0% Total Interest Bearing Debt / Equity 0.0% 0.0% 0.0% 0.0% 0.0% 0.0% SOURCE: SEC filings (2009-2013) Certain items may have been combined by Mercer Capital for analytical purposes Numbers in parentheses refer to supplemental notes in Exhibit 2a

EXHIBIT 2 INTERNATIONAL LOTTERY & TOTALIZER SYSTEMS, INC. HISTORICAL QUARTERLY BALANCE SHEETS Quarters Ended Quarter Growth Common Size Balance Sheets for the Quarters Ended Assets 7/31/2013 4/30/2013 1/31/2013 10/31/2012 7/31/2012 LQ Y/Y 7/31/2013 5/2/2013 2/1/2013 11/3/2012 8/5/2012 Cash & Equivalents 6,634 7,259 6,550 3,451 2,684 -8.6% 147.2% 44.6% 43.1% 64.5% 39.2% 33.1% Accounts Receivable-Trade (1) 1,778 2,054 905 2,978 957 -13.4% 85.8% 12.0% 12.2% 8.9% 33.9% 11.8% Accounts Receivable-Other 0 0 0 0 0 nm nm 0.0% 0.0% 0.0% 0.0% 0.0% Inventories (2) 3,044 3,665 1,570 1,535 2,109 -16.9% 44.3% 20.5% 21.8% 15.5% 17.5% 26.0% Prepaid Expenses & Other (3) 2,784 3,230 511 209 1,813 -13.8% 53.6% 18.7% 19.2% 5.0% 2.4% 22.3% Total Current Assets 14,240 16,208 9,536 8,173 7,563 -12.1% 88.3% 95.7% 96.3% 93.9% 92.9% 93.2% Property and Equipment (4) 2,795 2,741 2,687 2,662 2,551 2.0% 9.6% 18.8% 16.3% 26.5% 30.3% 31.4% Accumulated Depreciation 2,214 2,168 2,121 2,092 2,046 2.1% 8.2% 14.9% 12.9% 20.9% 23.8% 25.2% Net Fixed Assets 581 573 566 570 505 1.4% 15.0% 3.9% 3.4% 5.6% 6.5% 6.2% Goodwill & Intangibles 0 0 0 0 0 nm nm 0.0% 0.0% 0.0% 0.0% 0.0% Other Assets (5) 52 53 54 51 49 -1.9% 6.1% 0.3% 0.3% 0.5% 0.6% 0.6% TOTAL ASSETS $14,873 $16,834 $10,156 $8,794 $8,117 -11.6% 83.2% 100.0% 100.0% 100.0% 100.0% 100.0% Liabilities Notes Payable 0 0 0 0 0 nm nm 0.0% 0.0% 0.0% 0.0% 0.0% Accounts Payable 1,065 2,180 225 163 271 -51.1% 293.0% 7.2% 12.9% 2.2% 1.9% 3.3% Current Portion Long-Term Debt 0 0 0 0 0 nm nm 0.0% 0.0% 0.0% 0.0% 0.0% Income Taxes Payable 0 0 0 0 0 nm nm 0.0% 0.0% 0.0% 0.0% 0.0% Accrued Expenses & Other (6) 4,698 6,214 3,291 1,902 1,582 -24.4% 197.0% 31.6% 36.9% 32.4% 21.6% 19.5% Total Current Liabilities 5,763 8,394 3,516 2,065 1,853 -31.3% 211.0% 38.7% 49.9% 34.6% 23.5% 22.8% Long-Term Debt 0 0 0 0 0 nm nm 0.0% 0.0% 0.0% 0.0% 0.0% Deferred Income Taxes 0 0 0 0 0 nm nm 0.0% 0.0% 0.0% 0.0% 0.0% Other Liabilities 0 0 0 0 7 nm -100.0% 0.0% 0.0% 0.0% 0.0% 0.1% Total Liabilities 5,763 8,394 3,516 2,065 1,860 -31.3% 209.8% 38.7% 49.9% 34.6% 23.5% 22.9% Shareholders' Equity Common Stock 56,370 56,370 56,370 56,370 56,370 0.0% 0.0% 379.0% 334.9% 555.0% 641.0% 694.5% Paid-In Capital 0 0 0 0 0 nm nm 0.0% 0.0% 0.0% 0.0% 0.0% Retained Earnings (47,260) (47,930) (49,730) (49,641) (50,113) -1.4% -5.7% -317.8% -284.7% -489.7% -564.5% -617.4% Treasury Stock 0 0 0 0 nm nm 0.0% 0.0% 0.0% 0.0% 0.0% Total Equity (7) 9,110 8,440 6,640 6,729 6,257 7.9% 45.6% 61.3% 50.1% 65.4% 76.5% 77.1% TOTAL LIABILITIES & EQUITY $14,873 $16,834 $10,156 $8,794 $8,117 -11.6% 83.2% 100.0% 100.0% 100.0% 100.0% 100.0% 14,873 16,834 10,156 8,794 8,117 Memo Total Interest Bearing Debt 0 0 0 0 0 nm nm Book Value of Invested Capital 9,110 8,440 6,640 6,729 6,257 9.8% 7.9% Working Capital 8,477 7,814 6,020 6,108 5,710 10.4% 8.5% Cash + CD 6,634 7,259 6,550 3,451 2,684 25.4% -8.6% Working Capital ex-Cash & CDs 1,843 555 (530) 2,657 3,026 -11.7% 232.1% Debt / EBITDA 0.0% 0.0% 0.0% 0.0% 0.0% Net Debt / EBITDA -568.5% -2592.5% 14239.1% -641.4% -279.6% Long-Term Debt / Equity 0.0% 0.0% 0.0% 0.0% 0.0% Total Interest Bearing Debt / Equity 0.0% 0.0% 0.0% 0.0% 0.0%
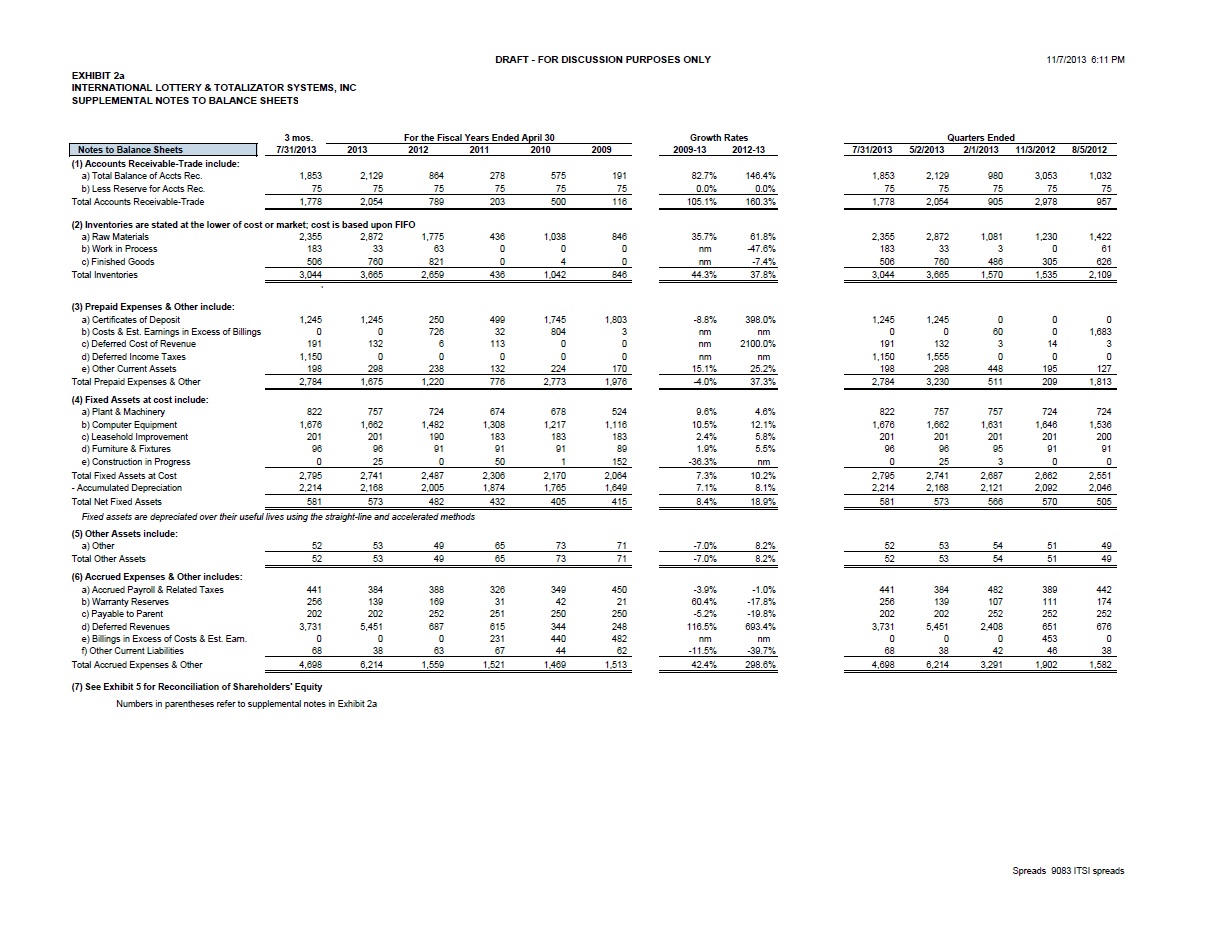
EXHIBIT 2a INTERNATIONAL LOTTERY & TOTALIZER SYSTEMS, INC. SUPPLEMENTAL NOTES TO BALANCE SHEETS 3 mos. For the Fiscal Years Ended April 30 Growth Rates Quarters Ended Notes to Balance Sheets 7/31/2013 2013 2012 2011 2010 2009 2009-13 2012-13 7/31/2013 5/2/2013 2/1/2013 11/3/2012 8/5/2012 (1) Accounts Receivable-Trade include: a) Total Balance of Accts Rec. 1,853 2,129 864 278 575 191 82.7% 146.4% 1,853 2,129 980 3,053 1,032 b) Less Reserve for Accts Rec. 75 75 75 75 75 75 0.0% 0.0% 75 75 75 75 75 Total Accounts Receivable-Trade 1,778 2,054 789 203 500 116 105.1% 160.3% 1,778 2,054 905 2,978 957 (2) Inventories are stated at the lower of cost or market; cost is based upon FIFO a) Raw Materials 2,355 2,872 1,775 436 1,038 846 35.7% 61.8% 2,355 2,872 1,081 1,230 1,422 b) Work in Process 183 33 63 0 0 0 nm -47.6% 183 33 3 0 61 c) Finished Goods 506 760 821 0 4 0 nm -7.4% 506 760 486 305 626 Total Inventories 3,044 3,665 2,659 436 1,042 846 44.3% 37.8% 3,044 3,665 1,570 1,535 2,109 ` (3) Prepaid Expenses & Other include: a) Certificates of Deposit 1,245 1,245 250 499 1,745 1,803 -8.8% 398.0% 1,245 1,245 0 0 0 b) Costs & Est. Earnings in Excess of Billings 0 0 726 32 804 3 nm nm 0 0 60 0 1,683 c) Deferred Cost of Revenue 191 132 6 113 0 0 nm 2100.0% 191 132 3 14 3 d) Deferred Income Taxes 1,150 0 0 0 0 0 nm nm 1,150 1,555 0 0 0 e) Other Current Assets 198 298 238 132 224 170 15.1% 25.2% 198 298 448 195 127 Total Prepaid Expenses & Other 2,784 1,675 1,220 776 2,773 1,976 -4.0% 37.3% 2,784 3,230 511 209 1,813 (4) Fixed Assets at cost include: a) Plant & Machinery 822 757 724 674 678 524 9.6% 4.6% 822 757 757 724 724 b) Computer Equipment 1,676 1,662 1,482 1,308 1,217 1,116 10.5% 12.1% 1,676 1,662 1,631 1,646 1,536 c) Leasehold Improvement 201 201 190 183 183 183 2.4% 5.8% 201 201 201 201 200 d) Furniture & Fixtures 96 96 91 91 91 89 1.9% 5.5% 96 96 95 91 91 e) Construction in Progress 0 25 0 50 1 152 -36.3% nm 0 25 3 0 0 Total Fixed Assets at Cost 2,795 2,741 2,487 2,306 2,170 2,064 7.3% 10.2% 2,795 2,741 2,687 2,662 2,551 - Accumulated Depreciation 2,214 2,168 2,005 1,874 1,765 1,649 7.1% 8.1% 2,214 2,168 2,121 2,092 2,046 Total Net Fixed Assets 581 573 482 432 405 415 8.4% 18.9% 581 573 566 570 505 Fixed assets are depreciated over their useful lives using the straight-line and accelerated methods (5) Other Assets include: a) Other 52 53 49 65 73 71 -7.0% 8.2% 52 53 54 51 49 Total Other Assets 52 53 49 65 73 71 -7.0% 8.2% 52 53 54 51 49 (6) Accrued Expenses & Other includes: a) Accrued Payroll & Related Taxes 441 384 388 326 349 450 -3.9% -1.0% 441 384 482 389 442 b) Warranty Reserves 256 139 169 31 42 21 60.4% -17.8% 256 139 107 111 174 c) Payable to Parent 202 202 252 251 250 250 -5.2% -19.8% 202 202 252 252 252 d) Deferred Revenues 3,731 5,451 687 615 344 248 116.5% 693.4% 3,731 5,451 2,408 651 676 e) Billings in Excess of Costs & Est. Earn. 0 0 0 231 440 482 nm nm 0 0 0 453 0 f) Other Current Liabilities 68 38 63 67 44 62 -11.5% -39.7% 68 38 42 46 38 Total Accrued Expenses & Other 4,698 6,214 1,559 1,521 1,469 1,513 42.4% 298.6% 4,698 6,214 3,291 1,902 1,582 (7) See Exhibit 5 for Reconciliation of Shareholders' Equity Numbers in parentheses refer to supplemental notes in Exhibit 2a
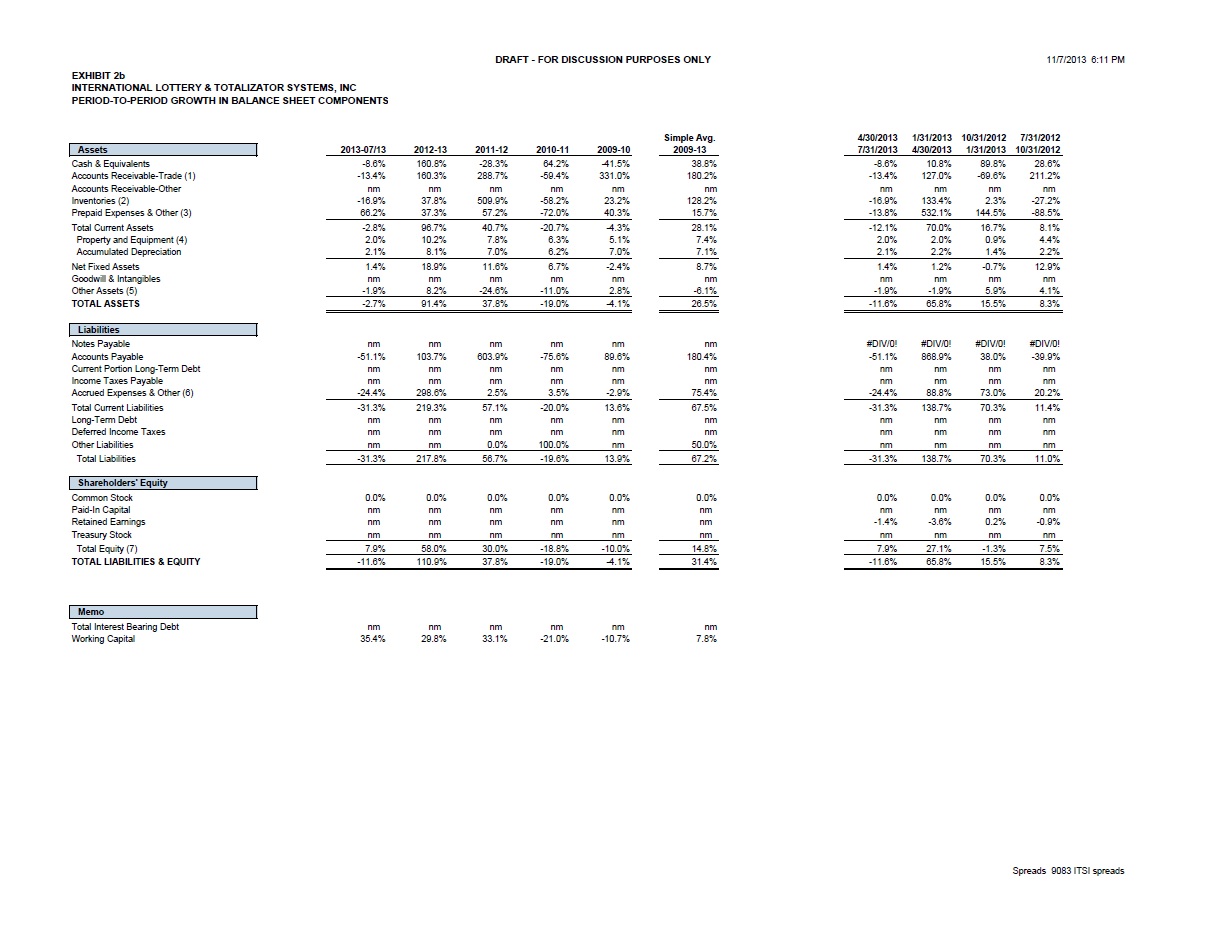
EXHIBIT 2b INTERNATIONAL LOTTERY & TOTALIZER SYSTEMS, INC. PERIOD-TO-PERIOD GROWTH IN BALANCE SHEET COMPONENTS Simple Avg. Simple Avg. 4/30/2013 1/31/2013 10/31/2012 7/31/2012 7/31/2012 Assets 2013-07/13 2012-13 2011-12 2010-11 2009-10 2009-13 7/31/2013 4/30/2013 1/31/2013 10/31/2012 7/31/2013 Cash & Equivalents -8.6% 160.8% -28.3% 64.2% -41.5% 38.8% -8.6% 10.8% 89.8% 28.6% 30.1% Accounts Receivable-Trade (1) -13.4% 160.3% 288.7% -59.4% 331.0% 180.2% -13.4% 127.0% -69.6% 211.2% 63.8% Accounts Receivable-Other nm nm nm nm nm nm #DIV/0! #DIV/0! #DIV/0! #DIV/0! #DIV/0! Inventories (2) -16.9% 37.8% 509.9% -58.2% 23.2% 128.2% -16.9% 133.4% 2.3% -27.2% 22.9% Prepaid Expenses & Other (3) 66.2% 37.3% 57.2% -72.0% 40.3% 15.7% -13.8% 532.1% 144.5% -88.5% 143.6% Total Current Assets -2.8% 96.7% 40.7% -20.7% -4.3% 28.1% -12.1% 70.0% 16.7% 8.1% 20.6% Property and Equipment (4) 2.0% 10.2% 7.8% 6.3% 5.1% 7.4% 2.0% 2.0% 0.9% 4.4% 2.3% Accumulated Depreciation 2.1% 8.1% 7.0% 6.2% 7.0% 7.1% 2.1% 2.2% 1.4% 2.2% 2.0% Net Fixed Assets 1.4% 18.9% 11.6% 6.7% -2.4% 8.7% 1.4% 1.2% -0.7% 12.9% 3.7% Goodwill & Intangibles nm nm nm nm nm nm #DIV/0! #DIV/0! #DIV/0! #DIV/0! #DIV/0! Other Assets (5) -1.9% 8.2% -24.6% -11.0% 2.8% -6.1% -1.9% -1.9% 5.9% 4.1% 1.6% TOTAL ASSETS -2.7% 91.4% 37.8% -19.0% -4.1% 26.5% -11.6% 65.8% 15.5% 8.3% 19.5% Liabilities Notes Payable nm nm nm nm nm nm #DIV/0! #DIV/0! #DIV/0! #DIV/0! #DIV/0! Accounts Payable -51.1% 103.7% 603.9% -75.6% 89.6% 180.4% -51.1% 868.9% 38.0% -39.9% 204.0% Current Portion Long-Term Debt nm nm nm nm nm nm #DIV/0! #DIV/0! #DIV/0! #DIV/0! #DIV/0! Income Taxes Payable nm nm nm nm nm nm #DIV/0! #DIV/0! #DIV/0! #DIV/0! #DIV/0! Accrued Expenses & Other (6) -24.4% 298.6% 2.5% 3.5% -2.9% 75.4% -24.4% 88.8% 73.0% 20.2% 39.4% Total Current Liabilities -31.3% 219.3% 57.1% -20.0% 13.6% 67.5% -31.3% 138.7% 70.3% 11.4% 47.3% Long-Term Debt nm nm nm nm nm nm #DIV/0! #DIV/0! #DIV/0! #DIV/0! #DIV/0! Deferred Income Taxes nm nm nm nm nm nm #DIV/0! #DIV/0! #DIV/0! #DIV/0! #DIV/0! Other Liabilities nm nm 0.0% 100.0% nm 50.0% #DIV/0! #DIV/0! #DIV/0! -100.0% #DIV/0! Total Liabilities -31.3% 217.8% 56.7% -19.6% 13.9% 67.2% -31.3% 138.7% 70.3% 11.0% 47.2% Shareholders' Equity #DIV/0! #DIV/0! #DIV/0! #DIV/0! #DIV/0! Common Stock 0.0% 0.0% 0.0% 0.0% 0.0% 0.0% 0.0% 0.0% 0.0% 0.0% 0.0% Paid-In Capital nm nm nm nm nm nm #DIV/0! #DIV/0! #DIV/0! #DIV/0! #DIV/0! Retained Earnings nm nm nm nm nm nm -1.4% -3.6% 0.2% -0.9% -1.4% Treasury Stock nm nm nm nm nm nm #DIV/0! #DIV/0! #DIV/0! #DIV/0! #DIV/0! Total Equity (7) 7.9% 58.0% 30.0% -18.8% -10.0% 14.8% 7.9% 27.1% -1.3% 7.5% 10.3% TOTAL LIABILITIES & EQUITY -11.6% 110.9% 37.8% -19.0% -4.1% 31.4% -11.6% 65.8% 15.5% 8.3% 19.5% Memo Total Interest Bearing Debt nm nm nm nm nm nm Working Capital 35.4% 29.8% 33.1% -21.0% -10.7% 7.8%
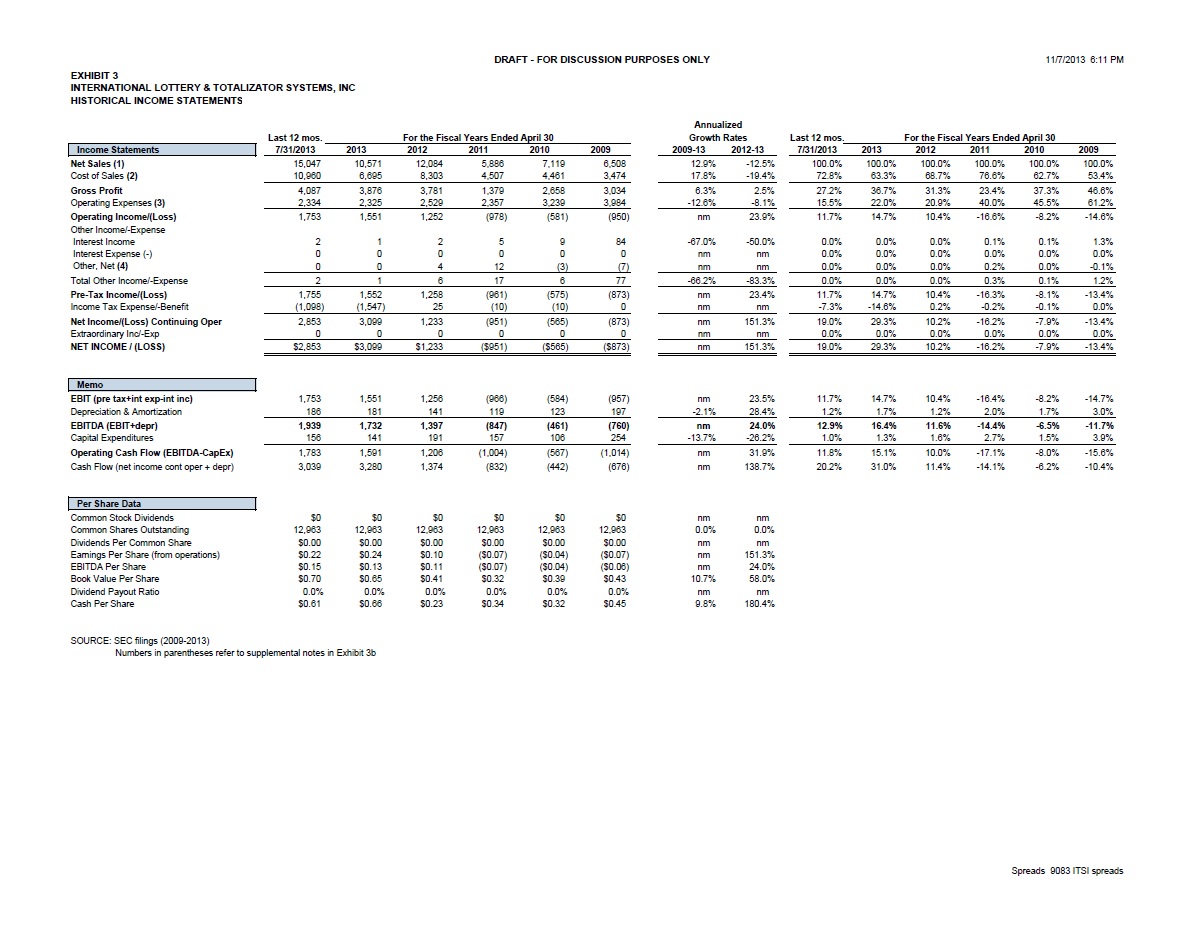
EXHIBIT 3 1 1 1 1 1 1 4 1 INTERNATIONAL LOTTERY & TOTALIZER SYSTEMS, INC. HISTORICAL INCOME STATEMENTS Annualized Last 12 mos. For the Fiscal Years Ended April 30 Growth Rates Last 12 mos. For the Fiscal Years Ended April 30 Income Statements 7/31/2013 2013 2012 2011 2010 2009 2009-13 2012-13 7/31/2013 2013 2012 2011 2010 2009 Net Sales (1) 15,047 10,571 12,084 5,886 7,119 6,508 12.9% -12.5% 100.0% 100.0% 100.0% 100.0% 100.0% 100.0% Cost of Sales (2) 10,960 6,695 8,303 4,507 4,461 3,474 17.8% -19.4% 72.8% 63.3% 68.7% 76.6% 62.7% 53.4% Gross Profit 4,087 3,876 3,781 1,379 2,658 3,034 6.3% 2.5% 27.2% 36.7% 31.3% 23.4% 37.3% 46.6% Operating Expenses (3) 2,334 2,325 2,529 2,357 3,239 3,984 -12.6% -8.1% 15.5% 22.0% 20.9% 40.0% 45.5% 61.2% Operating Income/(Loss) 1,753 1,551 1,252 (978) (581) (950) nm 23.9% 11.7% 14.7% 10.4% -16.6% -8.2% -14.6% Other Income/-Expense Interest Income 2 1 2 5 9 84 -67.0% -50.0% 0.0% 0.0% 0.0% 0.1% 0.1% 1.3% Interest Expense (-) 0 0 0 0 0 0 nm nm 0.0% 0.0% 0.0% 0.0% 0.0% 0.0% Other, Net (4) 0 0 4 12 (3) (7) nm nm 0.0% 0.0% 0.0% 0.2% 0.0% -0.1% Total Other Income/-Expense 2 1 6 17 6 77 -66.2% -83.3% 0.0% 0.0% 0.0% 0.3% 0.1% 1.2% Pre-Tax Income/(Loss) 1,755 1,552 1,258 (961) (575) (873) nm 23.4% 11.7% 14.7% 10.4% -16.3% -8.1% -13.4% Income Tax Expense/-Benefit (1,098) (1,547) 25 (10) (10) 0 nm nm -7.3% -14.6% 0.2% -0.2% -0.1% 0.0% Net Income/(Loss) Continuing Oper 2,853 3,099 1,233 (951) (565) (873) nm 151.3% 19.0% 29.3% 10.2% -16.2% -7.9% -13.4% Extraordinary Inc/-Exp 0 0 0 0 0 0 nm nm 0.0% 0.0% 0.0% 0.0% 0.0% 0.0% NET INCOME / (LOSS) $2,853 $3,099 $1,233 ($951) ($565) ($873) nm 151.3% 19.0% 29.3% 10.2% -16.2% -7.9% -13.4% Memo EBIT (pre tax+int exp-int inc) 1,753 1,551 1,256 (966) (584) (957) nm 23.5% 11.7% 14.7% 10.4% -16.4% -8.2% -14.7% Depreciation & Amortization 186 181 141 119 123 197 -2.1% 28.4% 1.2% 1.7% 1.2% 2.0% 1.7% 3.0% EBITDA (EBIT+depr) 1,939 1,732 1,397 (847) (461) (760) nm 24.0% 12.9% 16.4% 11.6% -14.4% -6.5% -11.7% Capital Expenditures 156 141 191 157 106 254 -13.7% -26.2% 1.0% 1.3% 1.6% 2.7% 1.5% 3.9% Operating Cash Flow (EBITDA-CapEx) 1,783 1,591 1,206 (1,004) (567) (1,014) nm 31.9% 11.8% 15.1% 10.0% -17.1% -8.0% -15.6% Cash Flow (net income cont oper + depr) 3,039 3,280 1,374 (832) (442) (676) nm 138.7% 20.2% 31.0% 11.4% -14.1% -6.2% -10.4% Per Share Data Common Stock Dividends $0 $0 $0 $0 $0 $0 nm nm Common Shares Outstanding 12,963 12,963 12,963 12,963 12,963 12,963 0.0% 0.0% Dividends Per Common Share $0.00 $0.00 $0.00 $0.00 $0.00 $0.00 nm nm Earnings Per Share (from operations) $0.22 $0.24 $0.10 ($0.07) ($0.04) ($0.07) nm 151.3% EBITDA Per Share $0.15 $0.13 $0.11 ($0.07) ($0.04) ($0.06) nm 24.0% Book Value Per Share $0.70 $0.65 $0.41 $0.32 $0.39 $0.43 10.7% 58.0% Dividend Payout Ratio 0.0% 0.0% 0.0% 0.0% 0.0% 0.0% nm nm Cash Per Share $0.61 $0.66 $0.23 $0.34 $0.32 $0.45 9.8% 180.4% SOURCE: SEC filings (2009-2013) Numbers in parentheses refer to supplemental notes in Exhibit 3b
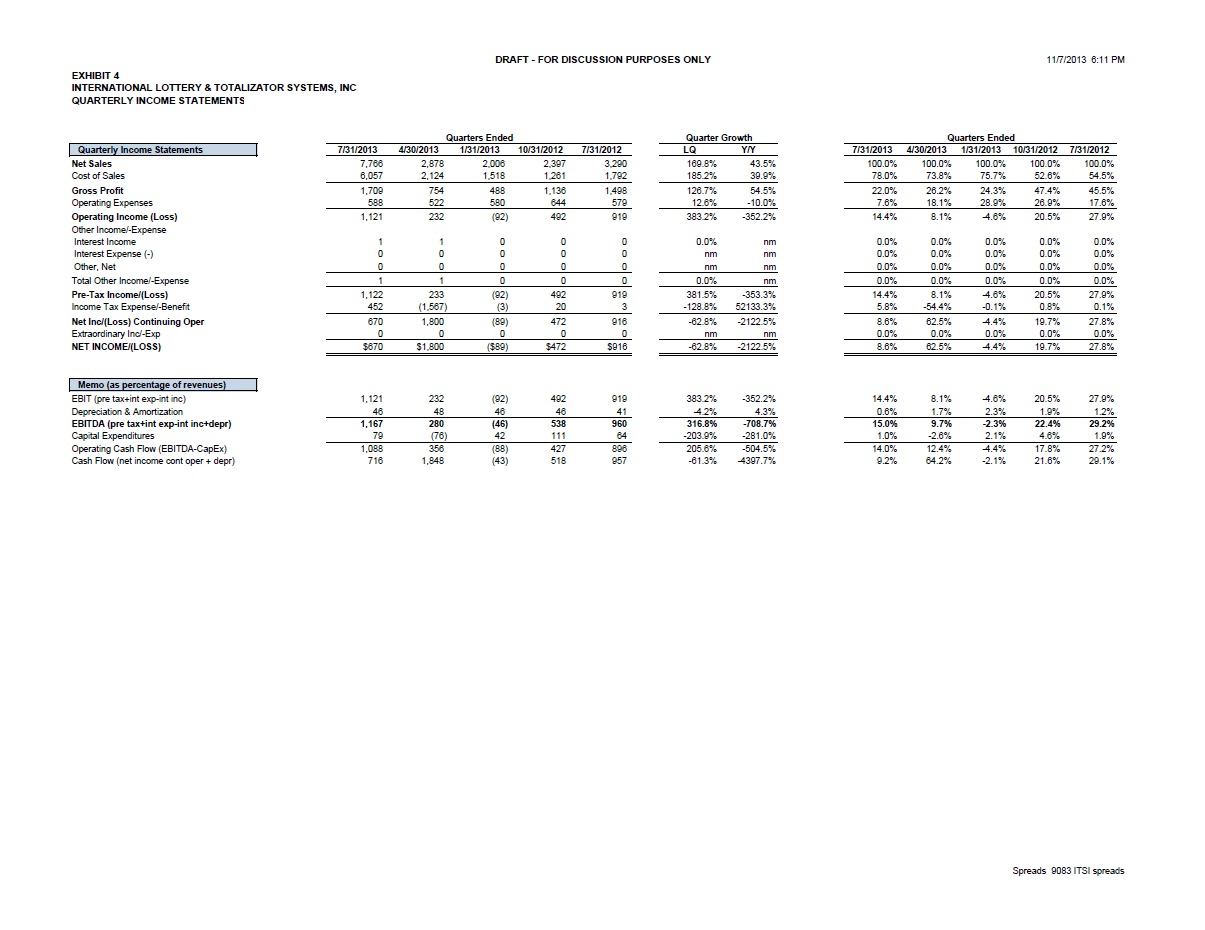
EXHIBIT 4 INTERNATIONAL LOTTERY & TOTALIZER SYSTEMS, INC. QUARTERLY INCOME STATEMENTS Quarters Ended Quarter Growth Quarters Ended Quarterly Income Statements 7/31/2013 4/30/2013 1/31/2013 10/31/2012 7/31/2012 LQ Y/Y 7/31/2013 4/30/2013 1/31/2013 10/31/2012 7/31/2012 Net Sales 7,766 2,878 2,006 2,397 3,290 169.8% 43.5% 100.0% 100.0% 100.0% 100.0% 100.0% Cost of Sales 6,057 2,124 1,518 1,261 1,792 185.2% 39.9% 78.0% 73.8% 75.7% 52.6% 54.5% Gross Profit 1,709 754 488 1,136 1,498 126.7% 54.5% 22.0% 26.2% 24.3% 47.4% 45.5% Operating Expenses 588 522 580 644 579 12.6% -10.0% 7.6% 18.1% 28.9% 26.9% 17.6% Operating Income (Loss) 1,121 232 (92) 492 919 383.2% -352.2% 14.4% 8.1% -4.6% 20.5% 27.9% Other Income/-Expense Interest Income 1 1 0 0 0 0.0% nm 0.0% 0.0% 0.0% 0.0% 0.0% Interest Expense (-) 0 0 0 0 0 nm nm 0.0% 0.0% 0.0% 0.0% 0.0% Other, Net 0 0 0 0 0 #DIV/0! #DIV/0! 0.0% 0.0% 0.0% 0.0% 0.0% Total Other Income/-Expense 1 1 0 0 0 0.0% #DIV/0! 0.0% 0.0% 0.0% 0.0% 0.0% Pre-Tax Income/(Loss) 1,122 233 (92) 492 919 381.5% -353.3% 14.4% 8.1% -4.6% 20.5% 27.9% Income Tax Expense/-Benefit 452 (1,567) (3) 20 3 -128.8% 52133.3% 5.8% -54.4% -0.1% 0.8% 0.1% Net Inc/(Loss) Continuing Oper 670 1,800 (89) 472 916 -62.8% -2122.5% 8.6% 62.5% -4.4% 19.7% 27.8% Extraordinary Inc/-Exp 0 0 0 0 0 nm nm 0.0% 0.0% 0.0% 0.0% 0.0% NET INCOME/(LOSS) $670 $1,800 ($89) $472 $916 -62.8% -2122.5% 8.6% 62.5% -4.4% 19.7% 27.8% Memo (as percentage of revenues) EBIT (pre tax+int exp-int inc) 1,121 232 (92) 492 919 383.2% -352.2% 14.4% 8.1% -4.6% 20.5% 27.9% Depreciation & Amortization 46 48 46 46 41 -4.2% 4.3% 0.6% 1.7% 2.3% 1.9% 1.2% EBITDA (pre tax+int exp-int inc+depr) 1,167 280 (46) 538 960 316.8% -708.7% 15.0% 9.7% -2.3% 22.4% 29.2% Capital Expenditures 79 (76) 42 111 64 -203.9% -281.0% 1.0% -2.6% 2.1% 4.6% 1.9% Operating Cash Flow (EBITDA-CapEx) 1,088 356 (88) 427 896 205.6% -504.5% 14.0% 12.4% -4.4% 17.8% 27.2% Cash Flow (net income cont oper + depr) 716 1,848 (43) 518 957 -61.3% -4397.7% 9.2% 64.2% -2.1% 21.6% 29.1%
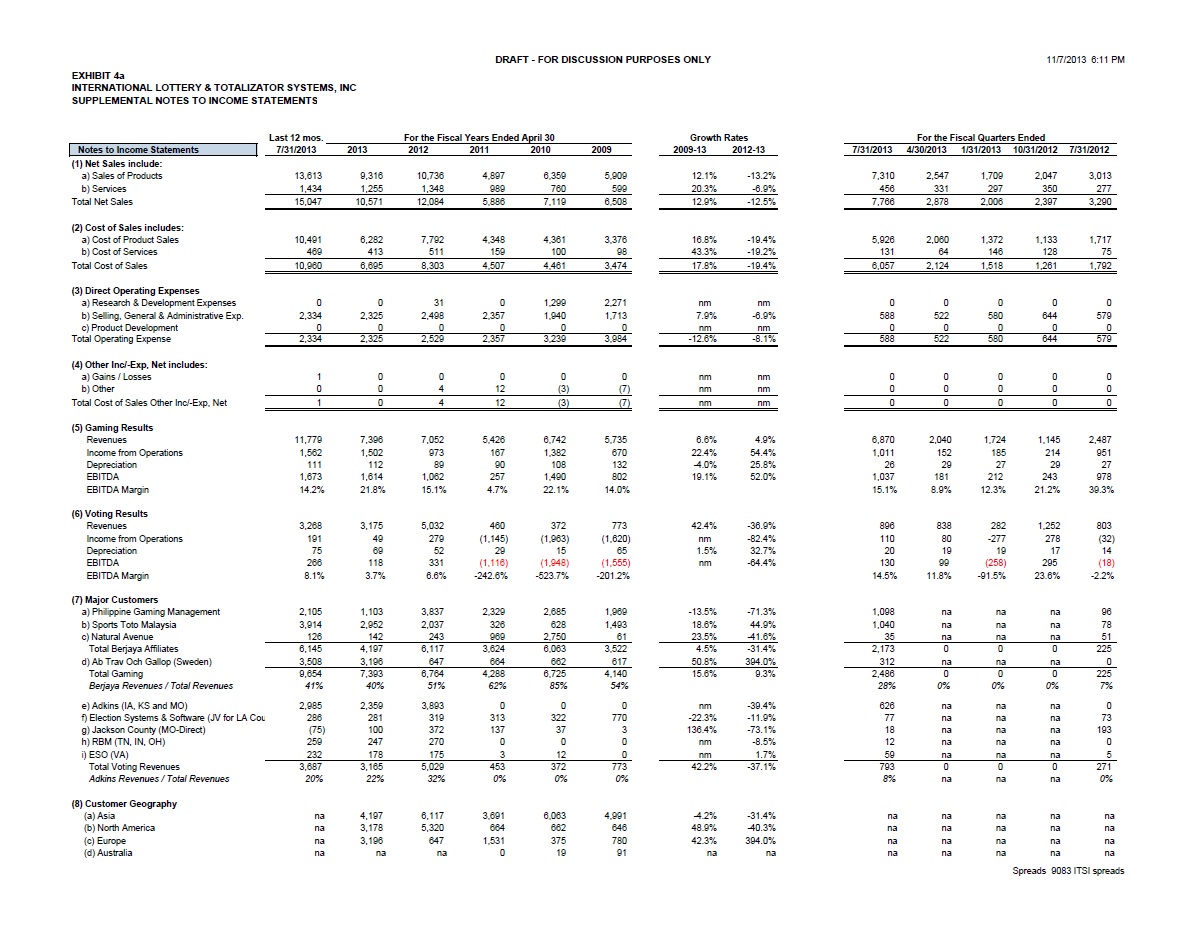
INTERNATIONAL LOTTERY & TOTALIZER SYSTEMS, INC. SUPPLEMENTAL NOTES TO INCOME STATEMENTS Annualized Last 12 mos. For the Fiscal Years Ended April 30 Growth Rates For the Fiscal Quarters Ended Notes to Income Statements 7/31/2013 2013 2012 2011 2010 2009 2009-13 2012-13 7/31/2013 4/30/2013 1/31/2013 10/31/2012 7/31/2012 (1) Net Sales include: a) Sales of Products 13,613 9,316 10,736 4,897 6,359 5,909 12.1% -13.2% 7,310 2,547 1,709 2,047 3,013 b) Services 1,434 1,255 1,348 989 760 599 20.3% -6.9% 456 331 297 350 277 Total Net Sales 15,047 10,571 12,084 5,886 7,119 6,508 12.9% -12.5% 7,766 2,878 2,006 2,397 3,290 (2) Cost of Sales includes: a) Cost of Product Sales 10,491 6,282 7,792 4,348 4,361 3,376 16.8% -19.4% 5,926 2,060 1,372 1,133 1,717 b) Cost of Services 469 413 511 159 100 98 43.3% -19.2% 131 64 146 128 75 Total Cost of Sales 10,960 6,695 8,303 4,507 4,461 3,474 17.8% -19.4% 6,057 2,124 1,518 1,261 1,792 (3) Direct Operating Expenses a) Research & Development Expenses 0 0 31 0 1,299 2,271 nm nm 0 0 0 0 0 b) Selling, General & Administrative Exp. 2,334 2,325 2,498 2,357 1,940 1,713 7.9% -6.9% 588 522 580 644 579 c) Product Development 0 0 0 0 0 0 nm nm 0 0 0 0 0 Total Operating Expense 2,334 2,325 2,529 2,357 3,239 3,984 -12.6% -8.1% 588 522 580 644 579 (4) Other Inc/-Exp, Net includes: a) Gains / Losses 1 0 0 0 0 0 nm nm 0 0 0 0 0 b) Other 0 0 4 12 (3) (7) nm nm 0 0 0 0 0 Total Cost of Sales Other Inc/-Exp, Net 1 0 4 12 (3) (7) nm nm 0 0 0 0 0 (5) Gaming Results Revenues 11,779 7,396 7,052 5,426 6,742 5,735 6.6% 4.9% 6,870 2,040 1,724 1,145 2,487 Income from Operations 1,562 1,502 973 167 1,382 670 22.4% 54.4% 1,011 152 185 214 951 Depreciation 111 112 89 90 108 132 -4.0% 25.8% 26 29 27 29 27 EBITDA 1,673 1,614 1,062 257 1,490 802 19.1% 52.0% 1,037 181 212 243 978 EBITDA Margin 14.2% 21.8% 15.1% 4.7% 22.1% 14.0% 15.1% 8.9% 12.3% 21.2% 39.3% (6) Voting Results Revenues 3,268 3,175 5,032 460 372 773 42.4% -36.9% 896 838 282 1,252 803 Income from Operations 191 49 279 (1,145) (1,963) (1,620) nm -82.4% 110 80 -277 278 (32) Depreciation 75 69 52 29 15 65 1.5% 32.7% 20 19 19 17 14 EBITDA 266 118 331 (1,116) (1,948) (1,555) nm -64.4% 130 99 (258) 295 (18) EBITDA Margin 8.1% 3.7% 6.6% -242.6% -523.7% -201.2% 14.5% 11.8% -91.5% 23.6% -2.2% (7) Major Customers a) Philippine Gaming Management 2,105 1,103 3,837 2,329 2,685 1,969 -13.5% -71.3% 1,098 na na na 96 b) Sports Toto Malaysia 3,914 2,952 2,037 326 628 1,493 18.6% 44.9% 1,040 na na na 78 c) Natural Avenue 126 142 243 969 2,750 61 23.5% -41.6% 35 na na na 51 Total Berjaya Affiliates 6,145 4,197 6,117 3,624 6,063 3,522 4.5% -31.4% 2,173 0 0 0 225 d) Ab Trav Och Galopp (Sweden) 3,508 3,196 647 664 662 617 50.8% 394.0% 312 na na na 0 Total Gaming 9,654 7,393 6,764 4,288 6,725 4,140 15.6% 9.3% 2,486 0 0 0 225 Berjaya Revenues / Total Revenues 41% 40% 51% 62% 85% 54% 28% 0% 0% 0% 7% e) Adkins (IA, KS and MO) 2,985 2,359 3,893 0 0 0 nm -39.4% 626 na na na 0 f) Election Systems & Software (JV for LA County) 286 281 319 313 322 770 -22.3% -11.9% 77 na na na 73 g) Jackson County (MO-Direct) (75) 100 372 137 37 3 136.4% -73.1% 18 na na na 193 h) RBM (TN, IN, OH) 259 247 270 0 0 0 nm -8.5% 12 na na na 0 i) ESO (VA) 232 178 175 3 12 0 nm 1.7% 59 na na na 5 Total Voting Revenues 3,687 3,165 5,029 453 372 773 42.2% -37.1% 793 0 0 0 271 Adkins Revenues / Total Revenues 20% 22% 32% 0% 0% 0% 8% na na na 0% (8) Customer Geography (a) Asia na 4,197 6,117 3,691 6,063 4,991 -4.2% -31.4% na na na na na (b) North America na 3,178 5,320 664 662 646 48.9% -40.3% na na na na na (c) Europe na 3,196 647 1,531 375 780 42.3% 394.0% na na na na na (d) Australia na na na 0 19 91 na na na na na na na
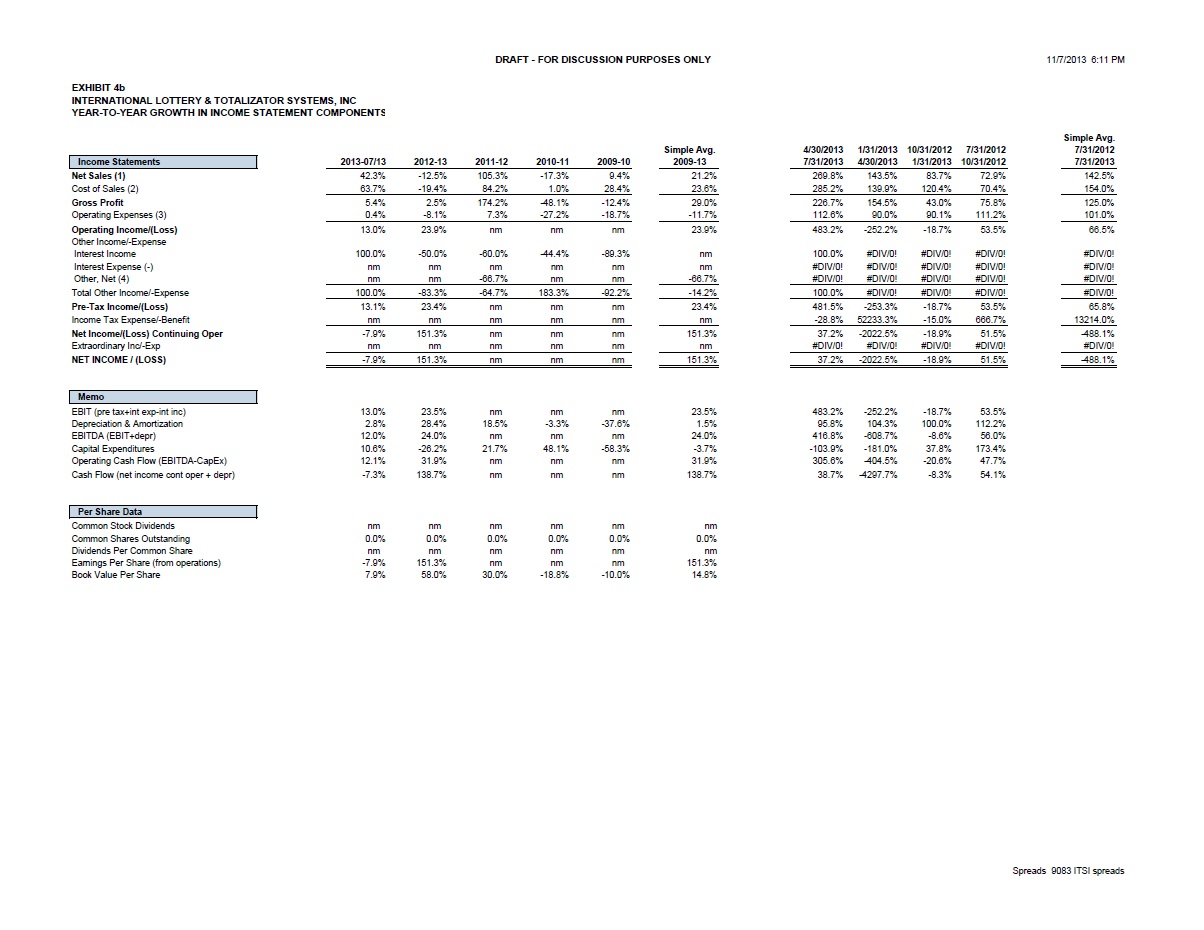
EXHIBIT 4b INTERNATIONAL LOTTERY & TOTALIZER SYSTEMS, INC. YEAR-TO-YEAR GROWTH IN INCOME STATEMENT COMPONENTS Simple Avg. Simple Avg. 4/30/2013 1/31/2013 10/31/2012 7/31/2012 7/31/2012 Income Statements 2013-07/13 2012-13 2011-12 2010-11 2009-10 2009-13 7/31/2013 4/30/2013 1/31/2013 10/31/2012 7/31/2013 Net Sales (1) 42.3% -12.5% 105.3% -17.3% 9.4% 21.2% 269.8% 143.5% 83.7% 72.9% 142.5% Cost of Sales (2) 63.7% -19.4% 84.2% 1.0% 28.4% 23.6% 285.2% 139.9% 120.4% 70.4% 154.0% Gross Profit 5.4% 2.5% 174.2% -48.1% -12.4% 29.0% 226.7% 154.5% 43.0% 75.8% 125.0% Operating Expenses (3) 0.4% -8.1% 7.3% -27.2% -18.7% -11.7% 112.6% 90.0% 90.1% 111.2% 101.0% Operating Income/(Loss) 13.0% 23.9% nm nm nm 23.9% 483.2% -252.2% -18.7% 53.5% 66.5% Other Income/-Expense Interest Income 100.0% -50.0% -60.0% -44.4% -89.3% nm 100.0% #DIV/0! #DIV/0! #DIV/0! #DIV/0! Interest Expense (-) nm nm nm nm nm nm #DIV/0! #DIV/0! #DIV/0! #DIV/0! #DIV/0! Other, Net (4) nm nm -66.7% nm nm -66.7% #DIV/0! #DIV/0! #DIV/0! #DIV/0! #DIV/0! Total Other Income/-Expense 100.0% -83.3% -64.7% 183.3% -92.2% -14.2% 100.0% #DIV/0! #DIV/0! #DIV/0! #DIV/0! Pre-Tax Income/(Loss) 13.1% 23.4% nm nm nm 23.4% 481.5% -253.3% -18.7% 53.5% 65.8% Income Tax Expense/-Benefit nm nm nm nm nm nm -28.8% 52233.3% -15.0% 666.7% 13214.0% Net Income/(Loss) Continuing Oper -7.9% 151.3% nm nm nm 151.3% 37.2% -2022.5% -18.9% 51.5% -488.1% Extraordinary Inc/-Exp nm nm nm nm nm nm #DIV/0! #DIV/0! #DIV/0! #DIV/0! #DIV/0! NET INCOME / (LOSS) -7.9% 151.3% nm nm nm 151.3% 37.2% -2022.5% -18.9% 51.5% -488.1% Memo EBIT (pre tax+int exp-int inc) 13.0% 23.5% nm nm nm 23.5% 483.2% -252.2% -18.7% 53.5% Depreciation & Amortization 2.8% 28.4% 18.5% -3.3% -37.6% 1.5% 95.8% 104.3% 100.0% 112.2% EBITDA (EBIT+depr) 12.0% 24.0% nm nm nm 24.0% 416.8% -608.7% -8.6% 56.0% Capital Expenditures 10.6% -26.2% 21.7% 48.1% -58.3% -3.7% -103.9% -181.0% 37.8% 173.4% Operating Cash Flow (EBITDA-CapEx) 12.1% 31.9% nm nm nm 31.9% 305.6% -404.5% -20.6% 47.7% Cash Flow (net income cont oper + depr) -7.3% 138.7% nm nm nm 138.7% 38.7% -4297.7% -8.3% 54.1% Per Share Data Common Stock Dividends nm nm nm nm nm nm Common Shares Outstanding 0.0% 0.0% 0.0% 0.0% 0.0% 0.0% Dividends Per Common Share nm nm nm nm nm nm Earnings Per Share (from operations) -7.9% 151.3% nm nm nm 151.3% Book Value Per Share 7.9% 58.0% 30.0% -18.8% -10.0% 14.8%
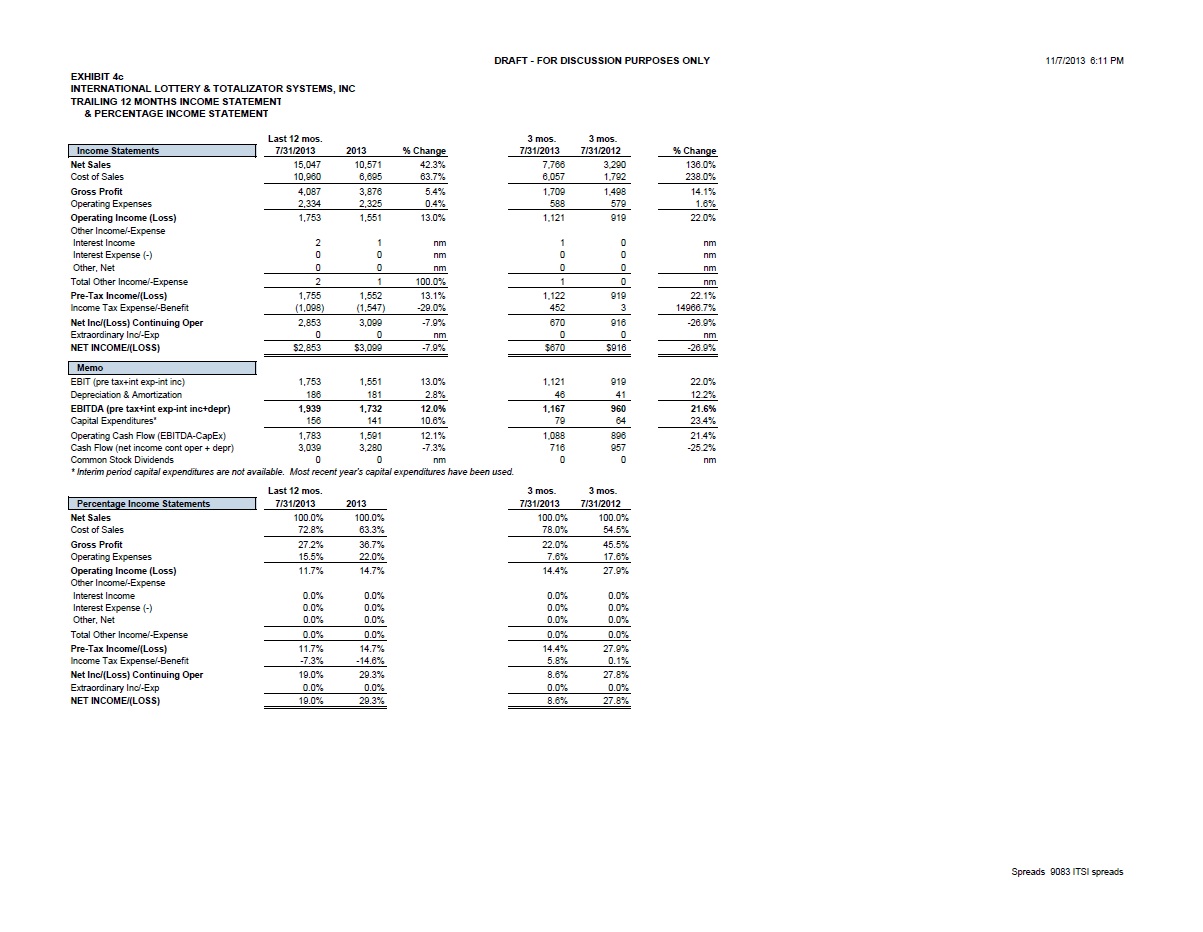
EXHIBIT 4c INTERNATIONAL LOTTERY & TOTALIZER SYSTEMS, INC. TRAILING 12 MONTHS INCOME STATEMENT & PERCENTAGE INCOME STATEMENT Last 12 mos. 3 mos. 3 mos. Income Statements 7/31/2013 2013 % Change 7/31/2013 7/31/2012 % Change Net Sales 15,047 10,571 42.3% 7,766 3,290 136.0% Cost of Sales 10,960 6,695 63.7% 6,057 1,792 238.0% Gross Profit 4,087 3,876 5.4% 1,709 1,498 14.1% Operating Expenses 2,334 2,325 0.4% 588 579 1.6% Operating Income (Loss) 1,753 1,551 13.0% 1,121 919 22.0% Other Income/-Expense Interest Income 2 1 nm 1 0 nm Interest Expense (-) 0 0 nm 0 0 nm Other, Net 0 0 #DIV/0! 0 0 nm Total Other Income/-Expense 2 1 100.0% 1 0 nm Pre-Tax Income/(Loss) 1,755 1,552 13.1% 1,122 919 22.1% Income Tax Expense/-Benefit (1,098) (1,547) -29.0% 452 3 14966.7% Net Inc/(Loss) Continuing Oper 2,853 3,099 -7.9% 670 916 -26.9% Extraordinary Inc/-Exp 0 0 nm 0 0 nm NET INCOME/(LOSS) $2,853 $3,099 -7.9% $670 $916 -26.9% Memo EBIT (pre tax+int exp-int inc) 1,753 1,551 13.0% 1,121 919 22.0% Depreciation & Amortization 186 181 2.8% 46 41 12.2% EBITDA (pre tax+int exp-int inc+depr) 1,939 1,732 12.0% 1,167 960 21.6% Capital Expenditures* 156 141 10.6% 79 64 23.4% Operating Cash Flow (EBITDA-CapEx) 1,783 1,591 12.1% 1,088 896 21.4% Cash Flow (net income cont oper + depr) 3,039 3,280 -7.3% 716 957 -25.2% Common Stock Dividends 0 0 nm 0 0 nm * Interim period capital expenditures are not available. Most recent year's capital expenditures have been used. Last 12 mos. 3 mos. 3 mos. Percentage Income Statements 7/31/2013 2013 7/31/2013 7/31/2012 Net Sales 100.0% 100.0% 100.0% 100.0% Cost of Sales 72.8% 63.3% 78.0% 54.5% Gross Profit 27.2% 36.7% 22.0% 45.5% Operating Expenses 15.5% 22.0% 7.6% 17.6% Operating Income (Loss) 11.7% 14.7% 14.4% 27.9% Other Income/-Expense Interest Income 0.0% 0.0% 0.0% 0.0% Interest Expense (-) 0.0% 0.0% 0.0% 0.0% Other, Net 0.0% 0.0% 0.0% 0.0% Total Other Income/-Expense 0.0% 0.0% 0.0% 0.0% Pre-Tax Income/(Loss) 11.7% 14.7% 14.4% 27.9% Income Tax Expense/-Benefit -7.3% -14.6% 5.8% 0.1% Net Inc/(Loss) Continuing Oper 19.0% 29.3% 8.6% 27.8% Extraordinary Inc/-Exp 0.0% 0.0% 0.0% 0.0% NET INCOME/(LOSS) 19.0% 29.3% 8.6% 27.8%
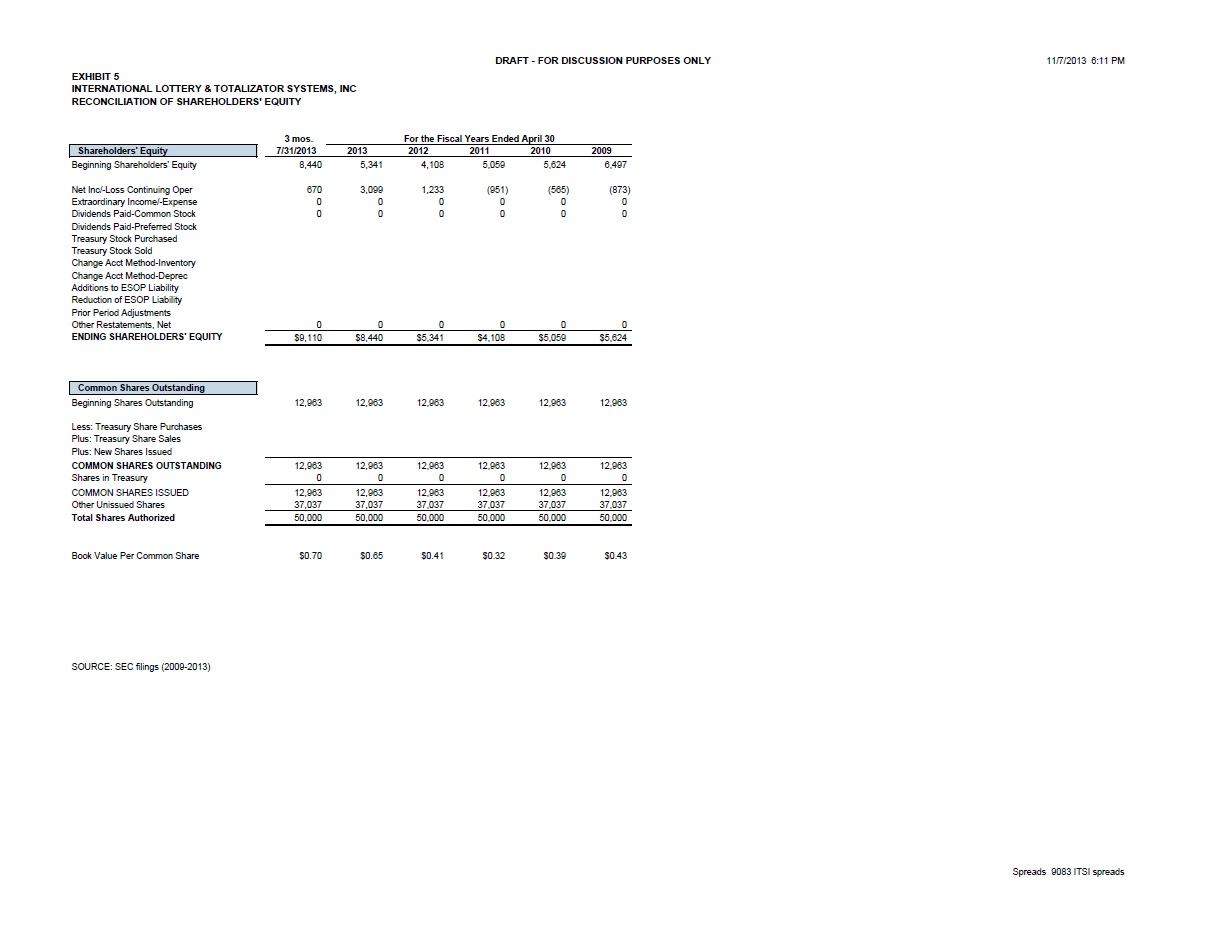
EXHIBIT 5 INTERNATIONAL LOTTERY & TOTALIZER SYSTEMS, INC. RECONCILIATION OF SHAREHOLDERS' EQUITY 3 mos. For the Fiscal Years Ended April 30 Shareholders' Equity 7/31/2013 2013 2012 2011 2010 2009 Beginning Shareholders' Equity 8,440 5,341 4,108 5,059 5,624 6,497 Net Inc/-Loss Continuing Oper 670 3,099 1,233 (951) (565) (873) Extraordinary Income/-Expense 0 0 0 0 0 0 Dividends Paid-Common Stock 0 0 0 0 0 0 Dividends Paid-Preferred Stock Treasury Stock Purchased Treasury Stock Sold Change Acct Method-Inventory Change Acct Method-Deprec Additions to ESOP Liability Reduction of ESOP Liability Prior Period Adjustments Other Restatements, Net 0 0 0 0 0 0 ENDING SHAREHOLDERS' EQUITY $9,110 $8,440 $5,341 $4,108 $5,059 $5,624 9,110 8,440 5,341 4,108 5,059 5,624 Common Shares Outstanding Beginning Shares Outstanding 12,963 12,963 12,963 12,963 12,963 12,963 Less: Treasury Share Purchases Plus: Treasury Share Sales Plus: New Shares Issued COMMON SHARES OUTSTANDING 12,963 12,963 12,963 12,963 12,963 12,963 Shares in Treasury 0 0 0 0 0 0 COMMON SHARES ISSUED 12,963 12,963 12,963 12,963 12,963 12,963 Other Unissued Shares 37,037 37,037 37,037 37,037 37,037 37,037 Total Shares Authorized 50,000 50,000 50,000 50,000 50,000 50,000 Book Value Per Common Share $0.70 $0.65 $0.41 $0.32 $0.39 $0.43 SOURCE: SEC filings (2009-2013)
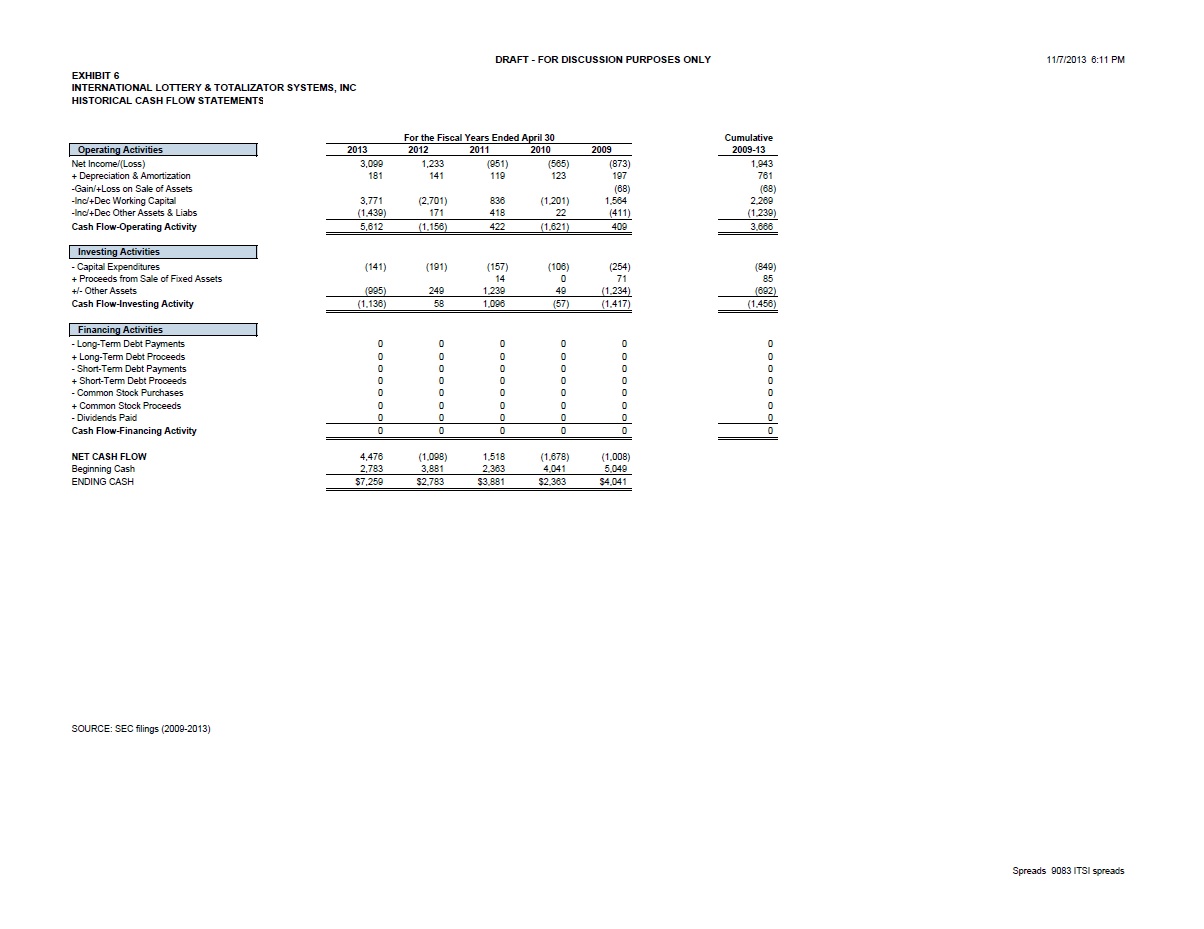
EXHIBIT 6 INTERNATIONAL LOTTERY & TOTALIZER SYSTEMS, INC. HISTORICAL CASH FLOW STATEMENTS For the Fiscal Years Ended April 30 Cumulative Operating Activities 2013 2012 2011 2010 2009 2009-13 Net Income/(Loss) 3,099 1,233 (951) (565) (873) 1,943 + Depreciation & Amortization 181 141 119 123 197 761 -Gain/+Loss on Sale of Assets (68) (68) -Inc/+Dec Working Capital 3,771 (2,701) 836 (1,201) 1,564 2,269 -Inc/+Dec Other Assets & Liabs (1,439) 171 418 22 (411) (1,239) Cash Flow-Operating Activity 5,612 (1,156) 422 (1,621) 409 3,666 Investing Activities - Capital Expenditures (141) (191) (157) (106) (254) (849) + Proceeds from Sale of Fixed Assets 14 0 71 85 +/- Other Assets (995) 249 1,239 49 (1,234) (692) Cash Flow-Investing Activity (1,136) 58 1,096 (57) (1,417) (1,456) Financing Activities - Long-Term Debt Payments 0 0 0 0 0 0 + Long-Term Debt Proceeds 0 0 0 0 0 0 - Short-Term Debt Payments 0 0 0 0 0 0 + Short-Term Debt Proceeds 0 0 0 0 0 0 - Common Stock Purchases 0 0 0 0 0 0 + Common Stock Proceeds 0 0 0 0 0 0 - Dividends Paid 0 0 0 0 0 0 Cash Flow-Financing Activity 0 0 0 0 0 0 NET CASH FLOW 4,476 (1,098) 1,518 (1,678) (1,008) Beginning Cash 2,783 3,881 2,363 4,041 5,049 ENDING CASH $7,259 $2,783 $3,881 $2,363 $4,041 7,259 2,783 3,881 2,363 4,041 SOURCE: SEC filings (2009-2013)

EXHIBIT 7 INTERNATIONAL LOTTERY & TOTALIZER SYSTEMS, INC. KEY FINANCIAL RATIOS For the Fiscal Years Ended April 30 NAICS # LIQUIDITY 7/31/2013 2013 2012 2011 2010 2009 XXXXXX Current Ratio 2.5 1.7 2.8 3.2 3.2 3.8 0.0 Acid Test Ratio 1.9 1.3 1.8 2.9 2.7 3.3 0.0 Working Capital 8,477 6,259 4,822 3,623 4,587 5,138 na Working Capital % of Sales 56.3% 59.2% 39.9% 61.6% 64.4% 78.9% 0.0% ACTIVITY Average Asset Turnover 1.0 0.9 1.8 0.9 1.0 0.8 0.0 Average Inventory Turnover 3.3 2.1 5.4 6.1 4.7 3.3 0.0 Average Fixed Asset Turnover 26.1 20.0 26.4 14.1 17.4 17.6 0.0 Average Days A/R Outstanding 46.5 49.1 15.0 21.8 15.8 19.1 0 Average Days A/P Outstanding 54.0 88.6 26.9 31.3 38.9 32.2 0 BALANCE SHEET LEVERAGE Total Liabilities / Assets 38.7% 54.9% 33.1% 29.1% 29.3% 24.7% 100.0% Total Liabilities / Equity 63.3% 99.5% 49.4% 41.0% 41.5% 32.7% #DIV/0! Long-Term Debt / Equity 0.0% 0.0% 0.0% 0.0% 0.0% 0.0% #DIV/0! Interest Bearing Debt / Equity 0.0% 0.0% 0.0% 0.0% 0.0% 0.0% #DIV/0! Interest Bearing Debt / Assets 0.0% 0.0% 0.0% 0.0% 0.0% 0.0% 0.0% Average Assets / Average Equity 171.8% 168.8% 145.8% 141.3% 136.9% 129.1% #DIV/0! INCOME STATEMENT LEVERAGE Times Int. Earned - EBIT / Int. Exp. #DIV/0! #DIV/0! #DIV/0! na na na 0.0 - EBITDA / Int. Exp. #DIV/0! #DIV/0! #DIV/0! #DIV/0! #DIV/0! #DIV/0! Return on Total Cap (EBIT / Total Cap) 19.2% 18.4% 23.5% -23.5% -11.5% -17.0% Return on Assets - Net Inc / Assets 19.2% 20.3% 15.4% -16.4% -7.9% -11.7% - EBIT / Assets 11.8% 10.2% 15.7% -16.7% -8.2% -12.8% Operating Leverage1 30.8% -187.6% nm nm nm nm Financial Leverage2 -61.0% 644.3% nm nm nm nm PERFORMANCE MEASURES Net Profit Margin 19.0% 29.3% 10.2% -16.2% -7.9% -13.4% na Operating Income / Average Assets 11.6% 13.3% 18.2% -15.1% -7.9% -12.1% 0.0% RETURN ON AVERAGE EQUITY Operating Profit Margin 11.7% 14.7% 10.4% -16.6% -8.2% -14.6% 0.0% + Non-Operating Profit Margin 0.0% 0.0% 0.0% 0.3% 0.1% 1.2% 0.0% = Pre-Tax Profit Margin 11.7% 14.7% 10.4% -16.3% -8.1% -13.4% 0.0% x 1-Effective Tax Rate 162.6% 199.7% 98.0% 99.0% 98.3% 100.0% 66.0% = Net Profit Margin 19.0% 29.3% 10.2% -16.2% -7.9% -13.4% 0.0% x Average Asset Turnover 1.0 0.9 1.8 0.9 1.0 0.8 0.0 x Total Leverage (Assets/Equity) 171.8% 168.8% 145.8% 141.3% 136.9% 129.1% #DIV/0! RETURN ON AVG. EQUITY (ROAE) 32.5% 45.0% 26.1% -20.7% -10.6% -14.4% #DIV/0! Dividend Payout Ratio 0.0% 0.0% 0.0% 0.0% 0.0% 0.0% Internal Growth Rate 32.5% 45.0% 26.1% -20.7% -10.6% -14.4%
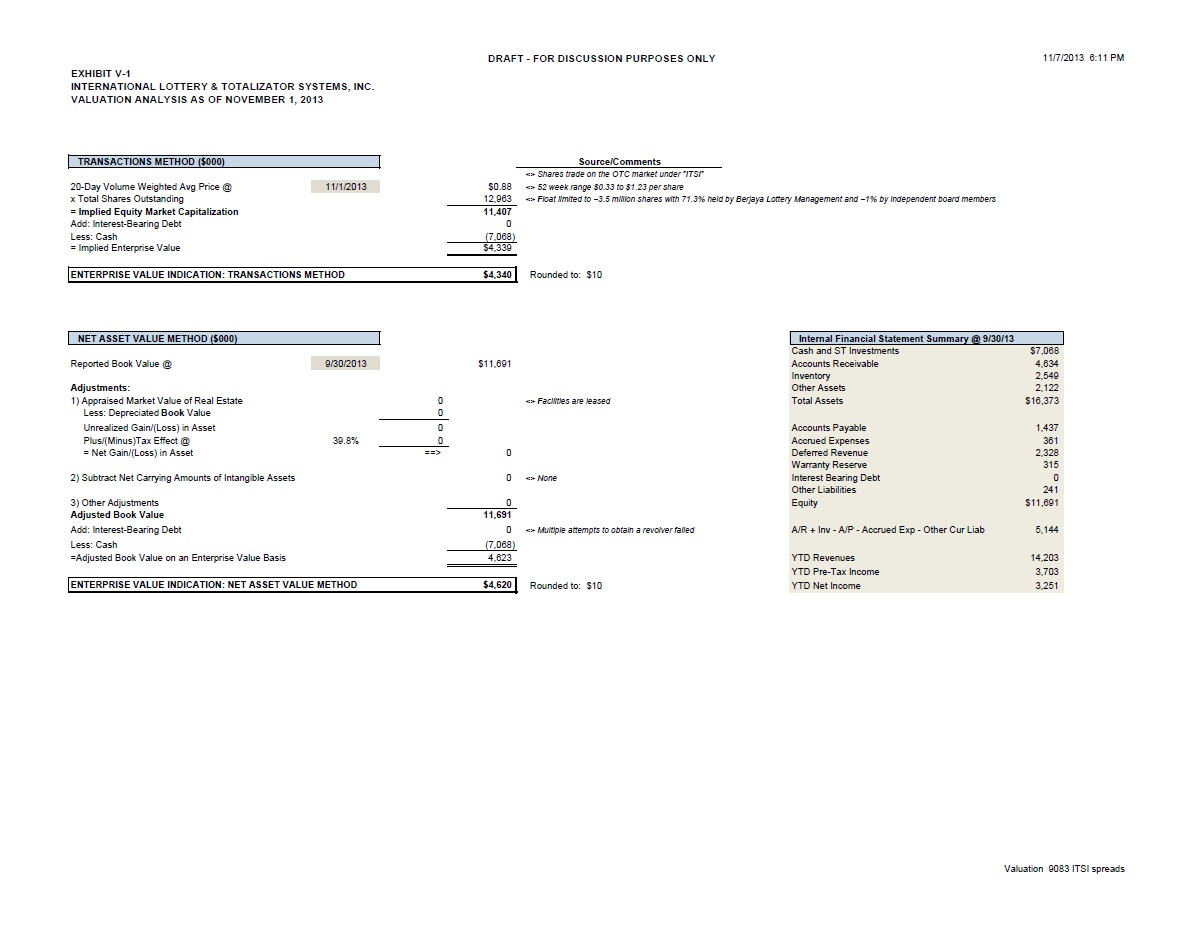
EXHIBIT V-1 INTERNATIONAL LOTTERY & TOTALIZER SYSTEMS, INC. VALUATION ANALYSIS AS OF NOVEMBER 1, 2013 TRANSACTIONS METHOD ($000) Source/Comments <> Shares trade on the OTC market under "ITSI" 20-Day Volume Weighted Avg Price @ 11/1/2013 $0.88 <> 52 week range $0.33 to $1.23 per share x Total Shares Outstanding 12,963 <> Float limited to ~3.5 million shares with 71.3% held by Berjaya Lottery Management and ~1% by independent board members = Implied Equity Market Capitalization 11,407 Add: Interest-Bearing Debt 0 Less: Cash (7,068) = Implied Enterprise Value $4,339 ENTERPRISE VALUE INDICATION: TRANSACTIONS METHOD $4,340 Rounded to: $10 NET ASSET VALUE METHOD ($000) Internal Financial Statement Summary @ 9/30/13 Cash and ST Investments $7,068 Reported Book Value @ 9/30/2013 $11,691 Accounts Receivable 4,634 Inventory 2,549 Adjustments: Other Assets 2,122 1) Appraised Market Value of Real Estate 0 <> Facilities are leased Total Assets $16,373 Less: Depreciated Book Value 0 Unrealized Gain/(Loss) in Asset 0 Accounts Payable 1,473 Plus/(Minus)Tax Effect @ 0.0% 0 Accrued Expenses 361 = Net Gain/(Loss) in Asset ==> 0 Deferred Revenue 2,328 Warranty Reserve 315 2) Subtract Net Carrying Amounts of Intangible Assets 0 <> None Interest Bearing Debt 0 Other Liabilities 205 3) Other Adjustments 0 Equity 11,691 Adjusted Book Value 11,691 Add: Interest-Bearing Debt 0 <> Multiple attempts to obtain a revolver failed A/R + Inv - A/P - Accrued Exp 5,349 Less: Cash (7,068) =Adjusted Book Value on an Enterprise Value Basis 4,623 YTD Revenues 14,203 YTD Pre-Tax Income 3,703 ENTERPRISE VALUE INDICATION: NET ASSET VALUE METHOD $4,620 Rounded to: $10 YTD Net Income 3,251
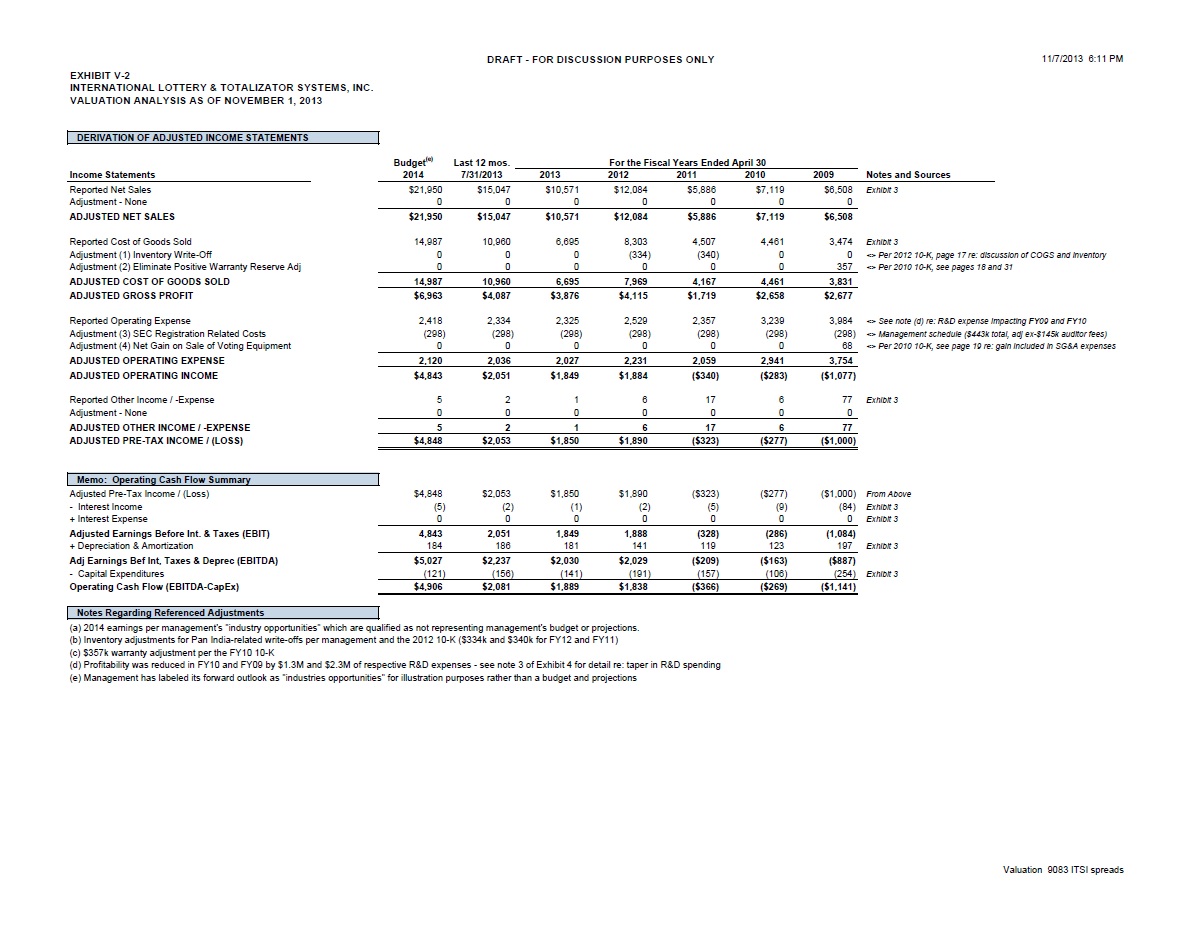
EXHIBIT V-2 INTERNATIONAL LOTTERY & TOTALIZER SYSTEMS, INC. VALUATION ANALYSIS AS OF NOVEMBER 1, 2013 DERIVATION OF ADJUSTED INCOME STATEMENTS Budget Last 12 mos. For the Fiscal Years Ended April 30 Income Statements 2014 7/31/2013 2013 2012 2011 2010 2009 Notes and Sources Reported Net Sales $21,950 $15,047 $10,571 $12,084 $5,886 $7,119 $6,508 Exhibit 3 Adjustment - None 0 0 0 0 0 0 0 ADJUSTED NET SALES $21,950 $15,047 $10,571 $12,084 $5,886 $7,119 $6,508 Reported Cost of Goods Sold 14,987 10,960 6,695 8,303 4,507 4,461 3,474 Exhibit 3 Adjustment (1) Inventory Write-Off 0 0 0 (334) (340) 0 0 <> Per 2012 10-K, page 17 re: discussion of COGS and inventory Adjustment (2) Eliminate Positive Warranty Reserve Adj 0 0 0 0 0 0 357 <> Per 2010 10-K, see pages 18 and 31 ADJUSTED COST OF GOODS SOLD 14,987 10,960 6,695 7,969 4,167 4,461 3,831 ADJUSTED GROSS PROFIT $6,963 $4,087 $3,876 $4,115 $1,719 $2,658 $2,677 Reported Operating Expense 2,418 2,334 2,325 2,529 2,357 3,239 3,984 <> See note (d) re: R&D expense impacting FY09 and FY10 Adjustment (3) SEC Registration Related Costs (298) (298) (298) (298) (298) (298) (298) <> Management schedule ($443k total, adj ex-$145k auditor fees) Adjustment (4) Net Gain on Sale of Voting Equipment 0 0 0 0 0 0 68 <> Per 2010 10-K, see page 19 re: gain included in SG&A expenses ADJUSTED OPERATING EXPENSE 2,120 2,036 2,027 2,231 2,059 2,941 3,754 ADJUSTED OPERATING INCOME $4,843 $2,051 $1,849 $1,884 ($340) ($283) ($1,077) Reported Other Income / -Expense 5 2 1 6 17 6 77 Exhibit 3 Adjustment - None 0 0 0 0 0 0 0 ADJUSTED OTHER INCOME / -EXPENSE 5 2 1 6 17 6 77 ADJUSTED PRE-TAX INCOME / (LOSS) $4,848 $2,053 $1,850 $1,890 ($323) ($277) ($1,000) Memo: Operating Cash Flow Summary Adjusted Pre-Tax Income / (Loss) $4,848 $2,053 $1,850 $1,890 ($323) ($277) ($1,000) From Above - Interest Income (5) (2) (1) (2) (5) (9) (84) Exhibit 3 + Interest Expense 0 0 0 0 0 0 0 Exhibit 3 Adjusted Earnings Before Int. & Taxes (EBIT) 4,843 2,051 1,849 1,888 (328) (286) (1,084) + Depreciation & Amortization 184 186 181 141 119 123 197 Exhibit 3 Adj Earnings Bef Int, Taxes & Deprec (EBITDA) $5,027 $2,237 $2,030 $2,029 ($209) ($163) ($887) - Capital Expenditures (121) (156) (141) (191) (157) (106) (254) Exhibit 3 Operating Cash Flow (EBITDA-CapEx) $4,906 $2,081 $1,889 $1,838 ($366) ($269) ($1,141) Notes Regarding Referenced Adjustments (a) 2014 earnings per management's "industry opportunities" which are qualified as not representing management's budget or projections. (b) Inventory adjustments for Pan India-related write-offs per management and the 2012 10-K ($334k and $340k for FY12 and FY11) (c) $394k warranty adjustment per the FY10 10-K (d) Profitability was reduced in FY10 and FY09 by $1.3M and $2.3M of respective R&D expenses
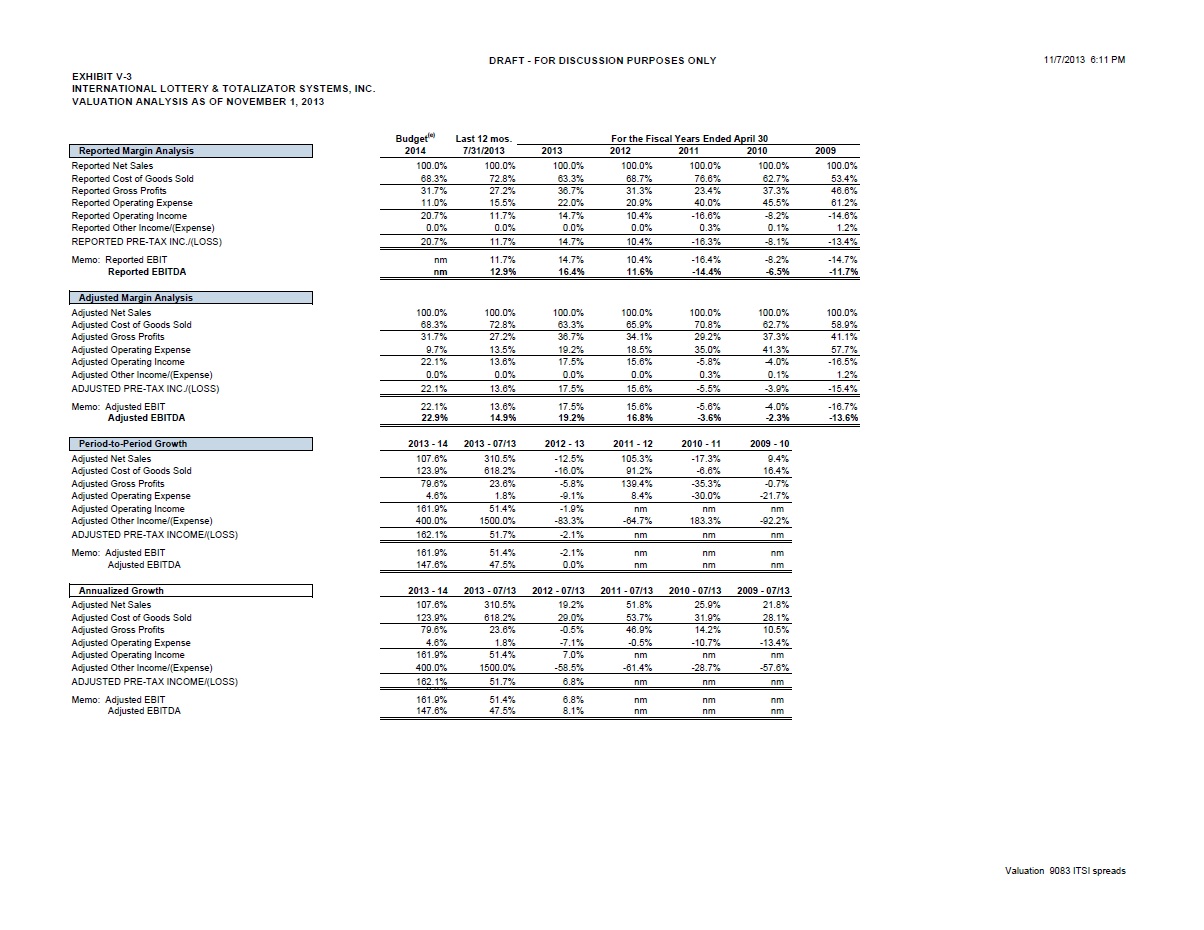
EXHIBIT V-3 INTERNATIONAL LOTTERY & TOTALIZER SYSTEMS, INC. VALUATION ANALYSIS AS OF NOVEMBER 1, 2013 Budget Last 12 mos. For the Fiscal Years Ended April 30 Reported Margin Analysis 2014 7/31/2013 2013 2012 2011 2010 2009 Reported Net Sales 100.0% 100.0% 100.0% 100.0% 100.0% 100.0% 100.0% Reported Cost of Goods Sold 68.3% 72.8% 63.3% 68.7% 76.6% 62.7% 53.4% Reported Gross Profits 31.7% 27.2% 36.7% 31.3% 23.4% 37.3% 46.6% Reported Operating Expense 11.0% 15.5% 22.0% 20.9% 40.0% 45.5% 61.2% Reported Operating Income 20.7% 11.7% 14.7% 10.4% -16.6% -8.2% -14.6% Reported Other Income/(Expense) 0.0% 0.0% 0.0% 0.0% 0.3% 0.1% 1.2% REPORTED PRE-TAX INC./(LOSS) 20.7% 11.7% 14.7% 10.4% -16.3% -8.1% -13.4% Memo: Reported EBIT nm 11.7% 14.7% 10.4% -16.4% -8.2% -14.7% Reported EBITDA nm 12.9% 16.4% 11.6% -14.4% -6.5% -11.7% Adjusted Margin Analysis Adjusted Net Sales 100.0% 100.0% 100.0% 100.0% 100.0% 100.0% 100.0% Adjusted Cost of Goods Sold 68.3% 72.8% 63.3% 65.9% 70.8% 62.7% 58.9% Adjusted Gross Profits 31.7% 27.2% 36.7% 34.1% 29.2% 37.3% 41.1% Adjusted Operating Expense 9.7% 13.5% 19.2% 18.5% 35.0% 41.3% 57.7% Adjusted Operating Income 22.1% 13.6% 17.5% 15.6% -5.8% -4.0% -16.5% Adjusted Other Income/(Expense) 0.0% 0.0% 0.0% 0.0% 0.3% 0.1% 1.2% ADJUSTED PRE-TAX INC./(LOSS) 22.1% 13.6% 17.5% 15.6% -5.5% -3.9% -15.4% Memo: Adjusted EBIT 22.1% 13.6% 17.5% 15.6% -5.6% -4.0% -16.7% Adjusted EBITDA 22.9% 14.9% 19.2% 16.8% -3.6% -2.3% -13.6% Period-to-Period Growth 2013 - 14 2013 - 07/13 2012 - 13 2011 - 12 2010 - 11 2009 - 10 Adjusted Net Sales 107.6% 310.5% -12.5% 105.3% -17.3% 9.4% Adjusted Cost of Goods Sold 123.9% 618.2% -16.0% 91.2% -6.6% 16.4% Adjusted Gross Profits 79.6% 23.6% -5.8% 139.4% -35.3% -0.7% Adjusted Operating Expense 4.6% 1.8% -9.1% 8.4% -30.0% -21.7% Adjusted Operating Income 161.9% 51.4% -1.9% nm nm nm Adjusted Other Income/(Expense) 400.0% 1500.0% -83.3% -64.7% 183.3% -92.2% ADJUSTED PRE-TAX INCOME/(LOSS) 162.1% 51.7% -2.1% nm nm nm Memo: Adjusted EBIT 161.9% 51.4% -2.1% nm nm nm Adjusted EBITDA 147.6% 47.5% 0.0% nm nm nm 0.00 0.25 1.25 2.25 3.25 4.25 Annualized Growth 2013 - 14 2013 - 07/13 2012 - 07/13 2011 - 07/13 2010 - 07/13 2009 - 07/13 Adjusted Net Sales 107.6% 310.5% 19.2% 51.8% 25.9% 21.8% Adjusted Cost of Goods Sold 123.9% 618.2% 29.0% 53.7% 31.9% 28.1% Adjusted Gross Profits 79.6% 23.6% -0.5% 46.9% 14.2% 10.5% Adjusted Operating Expense 4.6% 1.8% -7.1% -0.5% -10.7% -13.4% Adjusted Operating Income 161.9% 51.4% 7.0% nm nm nm Adjusted Other Income/(Expense) 400.0% 1500.0% -58.5% -61.4% -28.7% -57.6% ADJUSTED PRE-TAX INCOME/(LOSS) 162.1% 51.7% 6.8% nm nm nm 0.0% Memo: Adjusted EBIT 161.9% 51.4% 6.8% nm nm nm Adjusted EBITDA 147.6% 47.5% 8.1% nm nm nm
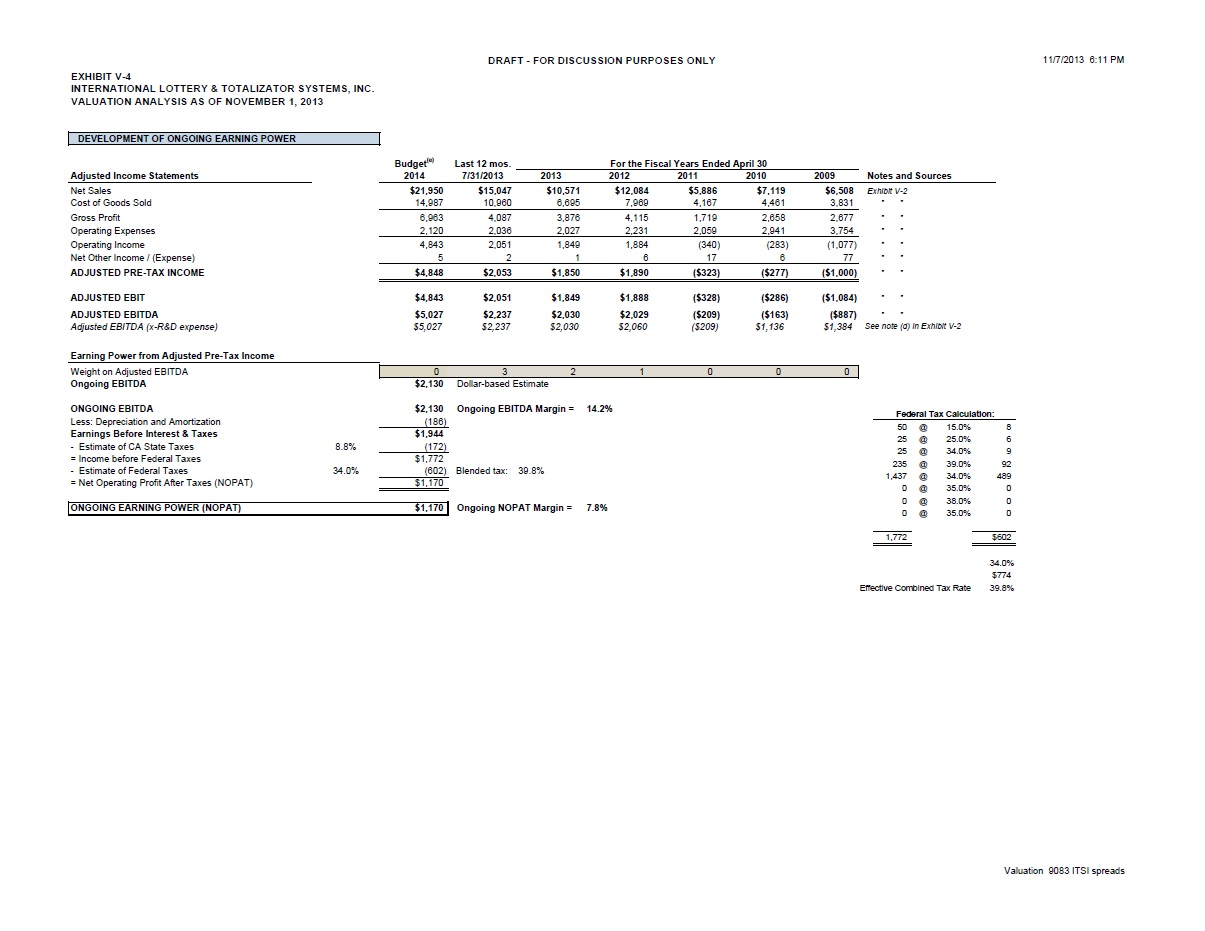
EXHIBIT V-4 INTERNATIONAL LOTTERY & TOTALIZER SYSTEMS, INC. VALUATION ANALYSIS AS OF NOVEMBER 1, 2013 DEVELOPMENT OF ONGOING EARNING POWER Mng't "Opp" Last 12 mos. For the Fiscal Years Ended April 30 Adjusted Income Statements 2014 7/31/2013 2013 2012 2011 2010 2009 Notes and Sources Net Sales $21,950 $15,047 $10,571 $12,084 $5,886 $7,119 $6,508 Exhibit V-2 Cost of Goods Sold 14,987 10,960 6,695 7,969 4,167 4,461 3,831 " " Gross Profit 6,963 4,087 3,876 4,115 1,719 2,658 2,677 " " Operating Expenses 2,120 2,036 2,027 2,231 2,059 2,941 3,754 " " Operating Income 4,843 2,051 1,849 1,884 (340) (283) (1,077) " " Net Other Income / (Expense) 5 2 1 6 17 6 77 " " ADJUSTED PRE-TAX INCOME $4,848 $2,053 $1,850 $1,890 ($323) ($277) ($1,000) " " ADJUSTED EBIT $4,843 $2,051 $1,849 $1,888 ($328) ($286) ($1,084) " " ADJUSTED EBITDA $5,027 $2,237 $2,030 $2,029 ($209) ($163) ($887) " " Adjusted EBITDA (x-R&D expense) $5,027 $2,237 $2,030 $2,060 ($209) $1,136 $1,384 Earning Power from Adjusted Pre-Tax Income Weight on Adjusted EBITDA 0 3 2 1 0 0 0 Ongoing EBITDA $2,130 Dollar-based Estimate ONGOING EBITDA $2,130 Ongoing EBITDA Margin = 14.2% Less: Depreciation and Amortization (186) Earnings Before Interest & Taxes $1,944 - Estimate of CA State Taxes 8.8% (172) = Income before Federal Taxes $1,772 - Estimate of Federal Taxes 34.0% (602) See Calculation in Tax Table = Net Operating Profit After Taxes (NOPAT) $1,170 ONGOING EARNING POWER (NOPAT) $1,170 Ongoing NOPAT Margin = 7.8%
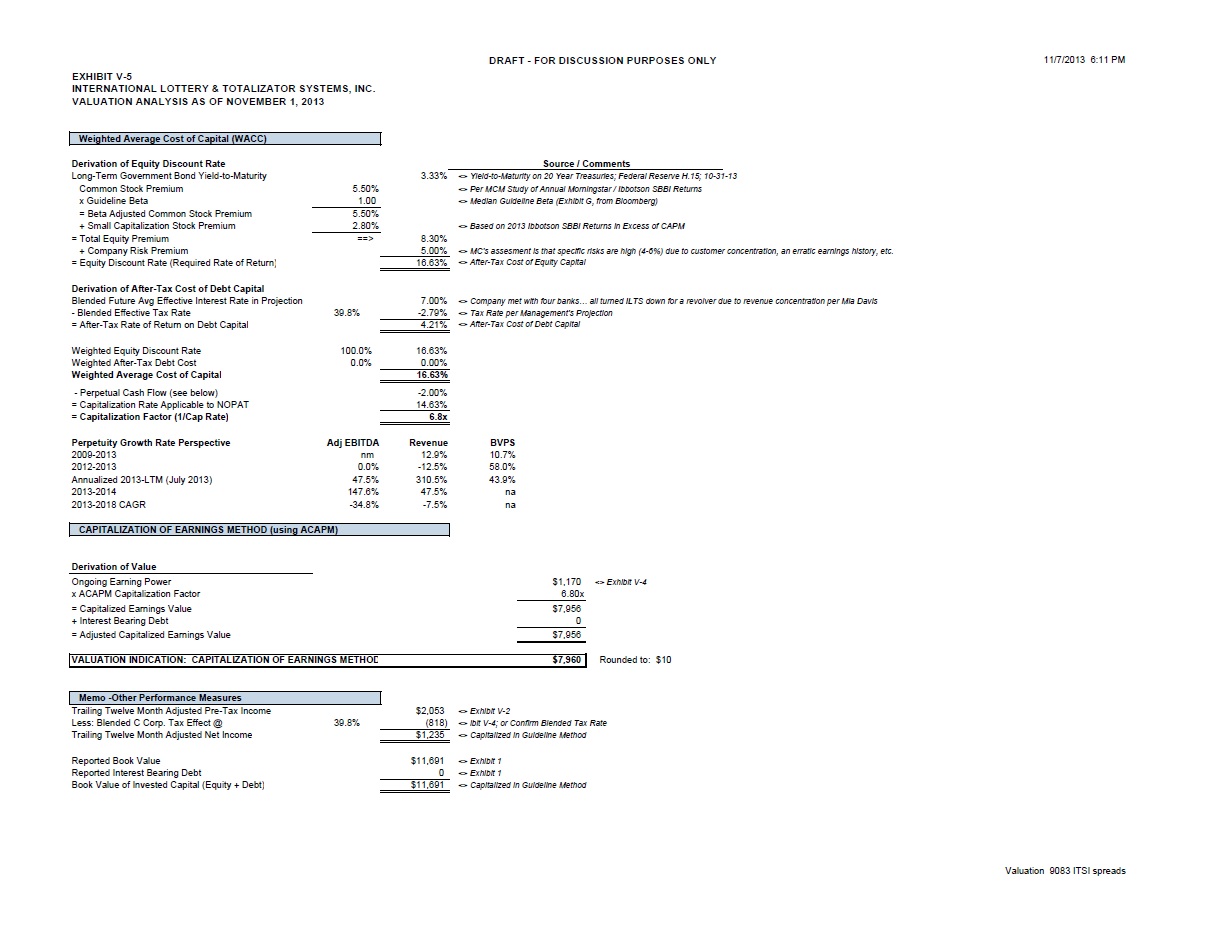
EXHIBIT V-5 INTERNATIONAL LOTTERY & TOTALIZER SYSTEMS, INC. VALUATION ANALYSIS AS OF NOVEMBER 1, 2013 Weighted Average Cost of Capital (WACC) Derivation of Equity Discount Rate Source / Comments Long-Term Government Bond Yield-to-Maturity 3.33% Yield-to-Maturity on 20 Year Treasuries; Federal Reserve H.15; 10-31-13 Common Stock Premium 5.50% Per MCM Study of Annual Morningstar / Ibbotson SBBI Returns x Guideline Beta 1.00 Median Guideline Beta (Exhibit G, from Bloomberg) = Beta Adjusted Common Stock Premium 5.50% + Small Capitalization Stock Premium 2.80% Based on 2013 Ibbotson SBBI Returns in Excess of CAPM = Total Equity Premium ==> 8.30% + Company Risk Premium 5.00% MC's assesment is that specific risks are high (4-6%) due to customer concentration = Equity Discount Rate (Required Rate of Return) 16.63% After-Tax Cost of Equity Capital Derivation of After-Tax Cost of Debt Capital Blended Future Avg Effective Interest Rate in Projection 7.00% Company met with four banks… all turned ILTS down for a revolver due to revenue concentration per Mia Davis - Blended Effective Tax Rate 39.8% -2.79% Tax Rate per Management's Projection = After-Tax Rate of Return on Debt Capital 4.21% After-Tax Cost of Debt Capital Weighted Equity Discount Rate 100.0% 16.63% Weighted After-Tax Debt Cost 0.0% 0.00% Weighted Average Cost of Capital 16.63% - Perpetual Cash Flow (see below) -2.00% = Capitalization Rate Applicable to NOPAT 14.63% = Capitalization Factor (1/Cap Rate) 6.8x Perpetuity Growth Rate Perspective Adj EBITDA Revenue BVPS 2009-2013 nm 12.9% 10.7% 2012-2013 0.0% -12.5% 58.0% Annualized 2013-LTM (July 2013) 47.5% 310.5% 43.9% 2013-2014 147.6% 47.5% na 2013-2018 CAGR -34.8% -7.5% na CAPITALIZATION OF EARNINGS METHOD (using ACAPM) Derivation of Value Ongoing Earning Power $1,170 Exhibit V-4 x ACAPM Capitalization Factor 6.80x Derived Above = Capitalized Earnings Value $7,956 + Interest Bearing Debt 0 = Adjusted Capitalized Earnings Value $7,956 VALUATION INDICATION: CAPITALIZATION OF EARNINGS METHOD $7,960 Rounded to: $10 Memo -Other Performance Measures Trailing Twelve Month Adjusted Pre-Tax Income $2,053 Exhibit V-2 Less: Blended C Corp. Tax Effect @ 39.8% (817) Exhibit V-4; or Confirm Blended Tax Rate Trailing Twelve Month Adjusted Net Income $1,236 Capitalized in Guideline Method Reported Book Value $11,691 Exhibit 1 Reported Interest Bearing Debt 0 Exhibit 1 Book Value of Invested Capital (Equity + Debt) $11,691 Capitalized in Guideline Method
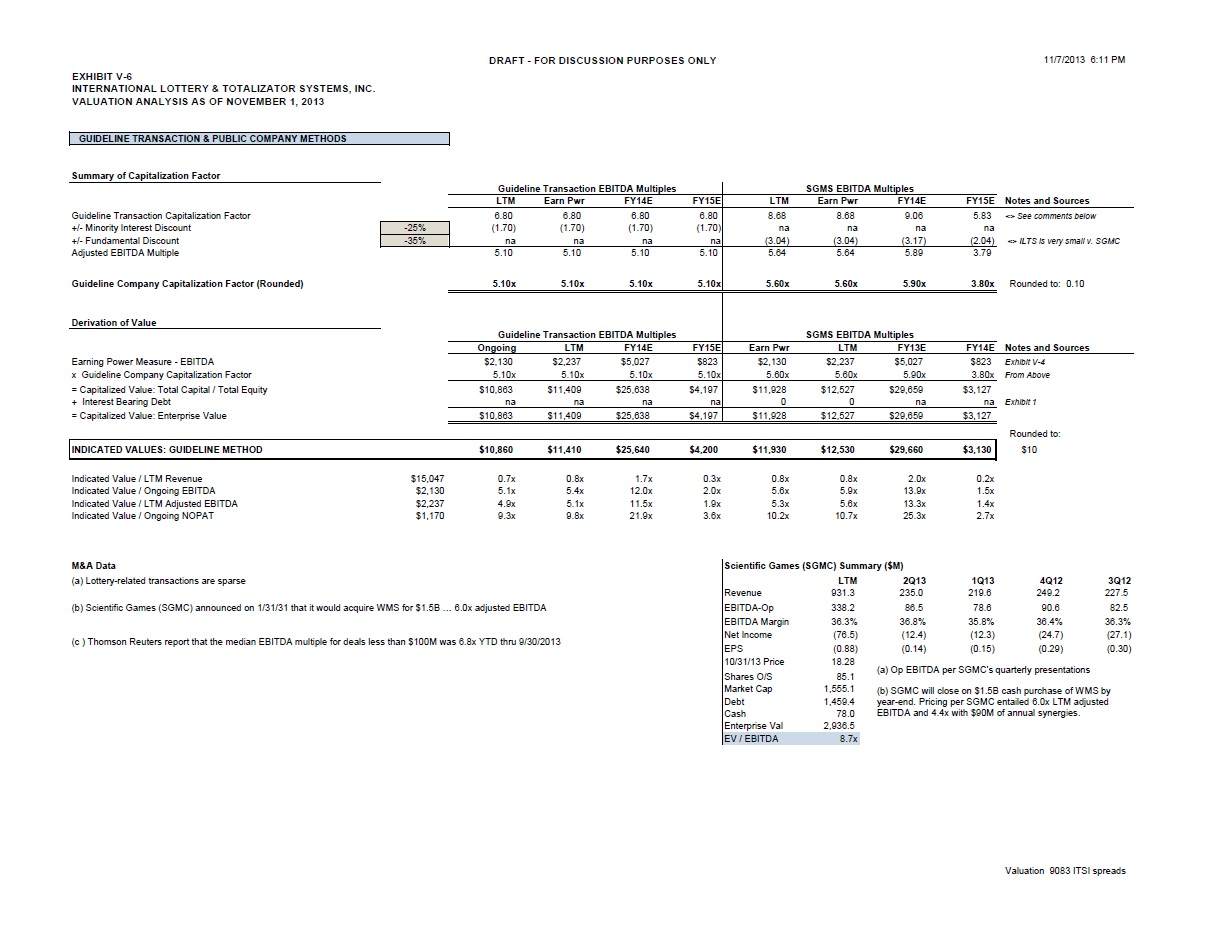
EXHIBIT V-6 INTERNATIONAL LOTTERY & TOTALIZER SYSTEMS, INC. VALUATION ANALYSIS AS OF NOVEMBER 1, 2013 GUIDELINE TRANSACTION & PUBLIC COMPANY METHODS Summary of Capitalization Factor Guideline Transaction EBITDA Multiples SGMS EBITDA Multiples LTM Earn Pwr FY14E FY15E LTM Earn Pwr FY14E FY15E Notes and Sources Guideline Transaction (M&A) Capitalization Factor 6.80 6.80 6.80 6.80 8.68 8.68 9.06 5.83 <> See comments below +/- Minority Interest Discount -25% (1.70) (1.70) (1.70) (1.70) na na na na +/- Fundamental Discount -35% na na na na (3.04) (3.04) (3.17) (2.04) <> ILTS is very small v. SGMC Adjusted EBITDA Multiple 5.10 5.10 5.10 5.10 5.64 5.64 5.89 3.79 Guideline Company Capitalization Factor (Rounded) 5.10x 5.10x 5.10x 5.10x 5.60x 5.60x 5.90x 3.80x Rounded to: 0.10 Derivation of Value Guideline Transaction EBITDA Multiples SGMS EBITDA Multiples Ongoing LTM FY14E FY15E Earn Pwr LTM FY13E FY14E Notes and Sources Earning Power Measure - EBITDA $2,130 $2,237 $5,027 $823 $2,130 $2,237 $5,027 $823 Exhibits V-1 & V-4 x Guideline Company Capitalization Factor 5.10x 5.10x 5.10x 5.10x 5.60x 5.60x 5.90x 3.80x From Above = Capitalized Value: Total Capital / Total Equity $10,863 $11,409 $25,638 $4,197 $11,928 $12,527 $29,659 $3,127 + Interest Bearing Debt na na na na 0 0 na na Exhibit 1 = Capitalized Value: Enterprise Value $10,863 $11,409 $25,638 $4,197 $11,928 $12,527 $29,659 $3,127 Rounded to: INDICATED VALUES: GUIDELINE METHOD $10,860 $11,410 $25,640 $4,200 $11,930 $12,530 $29,660 $3,130 $10 Indicated Value / LTM Revenue $15,047 0.7x 0.8x 1.7x 0.3x 0.8x 0.8x 2.0x 0.2x Indicated Value / Ongoing EBITDA $2,130 5.1x 5.4x 12.0x 2.0x 5.6x 5.9x 13.9x 1.5x Indicated Value / LTM Adjusted EBITDA $2,237 4.9x 5.1x 11.5x 1.9x 5.3x 5.6x 13.3x 1.4x Indicated Value / Ongoing NOPAT $1,170 9.3x 9.8x 21.9x 3.6x 10.2x 10.7x 25.3x 2.7x M&A Data Scientific Games (SGMC) Summary ($M) (a) Lottery-related transactions are sparse LTM 2Q13 1Q13 4Q12 3Q12 Revenue 931.3 235.0 219.6 249.2 227.5 (b) Scientific Games (SGMC) announced on 1/31/31 that it would acquire WMS for $1.5B … 6.0x adjusted EBITDA EBITDA-Op 338.2 86.5 78.6 90.6 82.5 EBITDA Margin 36.3% 36.8% 35.8% 36.4% 36.3% (c ) Thomson Reuters report that the median EBITDA multiple for deals less than $100M was 6.8x YTD thru 9/30/2013 Net Income (76.5) (12.4) (12.3) (24.7) (27.1) EPS (0.88) (0.14) (0.15) (0.29) (0.30) 10/31/13 Price 18.28 Shares O/S 85.1 Market Cap 1,555.1 Debt 1,459.4 Cash 78.0 Enterprise Val 2,936.5 EV / EBITDA 8.7x
Terminal Period
NOPAT
EXHIBIT V-7 INTERNATIONAL LOTTERY & TOTALIZER SYSTEMS, INC. VALUATION ANALYSIS AS OF NOVEMBER 1, 2013 Figures in $000s DISCOUNTED CASH FLOW METHOD FY LTM "Industry Opportunities" per Management Terminal 2013 7/31/2013 2014 2015 2016 2017 2018 Period Gaming Revenues $7,396 $11,779 $18,780 $6,070 $3,210 $7,856 $5,856 Voting Revenues 3,175 3,268 3,170 2,392 4,698 2,168 1,308 Total Revenues 10,571 15,047 21,950 8,462 7,908 10,024 7,164 Cost of Goods Sold 6,695 10,960 14,987 5,605 5,478 6,329 4,811 Gross Profit 3,876 4,087 6,963 2,857 2,430 3,695 2,353 Research & Development Costs 0 0 30 100 0 60 100 SG&A Expenses 2,325 2,334 2,388 2,400 2,460 2,480 2,480 Operating Income 1,551 1,753 4,545 357 (30) 1,155 (227) Net Other Income / (Expense) 1 2 5 5 5 5 5 Pre-Tax Income 1,552 1,755 4,550 362 (25) 1,160 (222) SEC Costs to be Avoided 298 298 298 298 298 298 298 Interest Expense / (Income) (1) (2) (5) (5) (5) (5) (5) Depreciation 181 186 184 168 184 168 168 EBITDA 2,030 2,237 5,027 823 452 1,621 239 EBITDA Margin 19.2% 14.9% 22.9% 9.7% 5.7% 16.2% 3.3% Less: Depreciation and Amortization (181) (186) (184) (168) (184) (168) (168) EBIT 1,849 2,051 4,843 655 268 1,453 71 Less: Est Blended Effective Tax Rate 39.8% (737) (817) (1,929) (261) (107) (579) (28) Net Operating Profit After Taxes (NOPAT) 1,112 1,234 2,914 394 161 874 43 Plus: Depreciation and Amortization 181 186 184 168 184 168 168 Minus: Capital Expenditures (141) (191) (121) (63) (289) (150) (150) Decrease/(Increase) Change in Working Capital (x-Cash) (574) (31) 1,806 (75) 1,109 (585) 252 Cash Flow Attributable to Total Invested Capital 578 1,198 4,783 424 1,165 307 313 298 Periods Discounted (Mid-Year Convention Employed) 0.50 1.50 2.50 3.50 4.50 4.50 PV Discount Factor Using WACC 16.6% 0.9260 0.7939 0.6807 0.5837 0.5004 0.5004 Present Value of Future Cash Flow and Terminal Value $4,429 $337 $793 $179 $156 $149 Indicated Enterprise Value - DCF Method $6,043 Calculation of Terminal Value Enterprise Value / Ongoing EBITDA $2,130 2.8x Terminal Period NOPAT (2018 x 1.02%) $44 Enterprise Value / LTM Adj EBITDA $2,237 2.7x WACC (per Exhibit X) 16.63% Growth Rate -2.00% Capitalization Rate for NOPAT 14.63% x Terminal Multiple (1/Cap Rate) 6.8x = Terminal Value of Total Invested Capital $298 Terminal Value / FY18E EBITDA 1.2x Terminal Value WACC and Multiple ( 1/ (WACC - Growth Rate) ) 22.0% 20.2% 18.7% 17.4% 16.3% 15.3% 14.5% $6,043 5.0x 5.5x 6.0x 6.5x 7.0x 7.5x 8.0x $0 $5,894 $5,894 $5,894 $5,894 $5,894 $5,894 $5,894 $500 $7,145 $7,270 $7,395 $7,520 $7,645 $7,771 $7,896 $1,000 $8,396 $8,646 $8,896 $9,147 $9,397 $9,647 $9,897 $1,500 $9,647 $10,022 $10,398 $10,773 $11,148 $11,524 $11,899 $2,000 $10,898 $11,398 $11,899 $12,399 $12,900 $13,400 $13,900 $2,500 $12,149 $12,775 $13,400 $14,026 $14,651 $15,277 $15,902 $2,000 $10,898 $11,398 $11,899 $12,399 $12,900 $13,400 $13,900
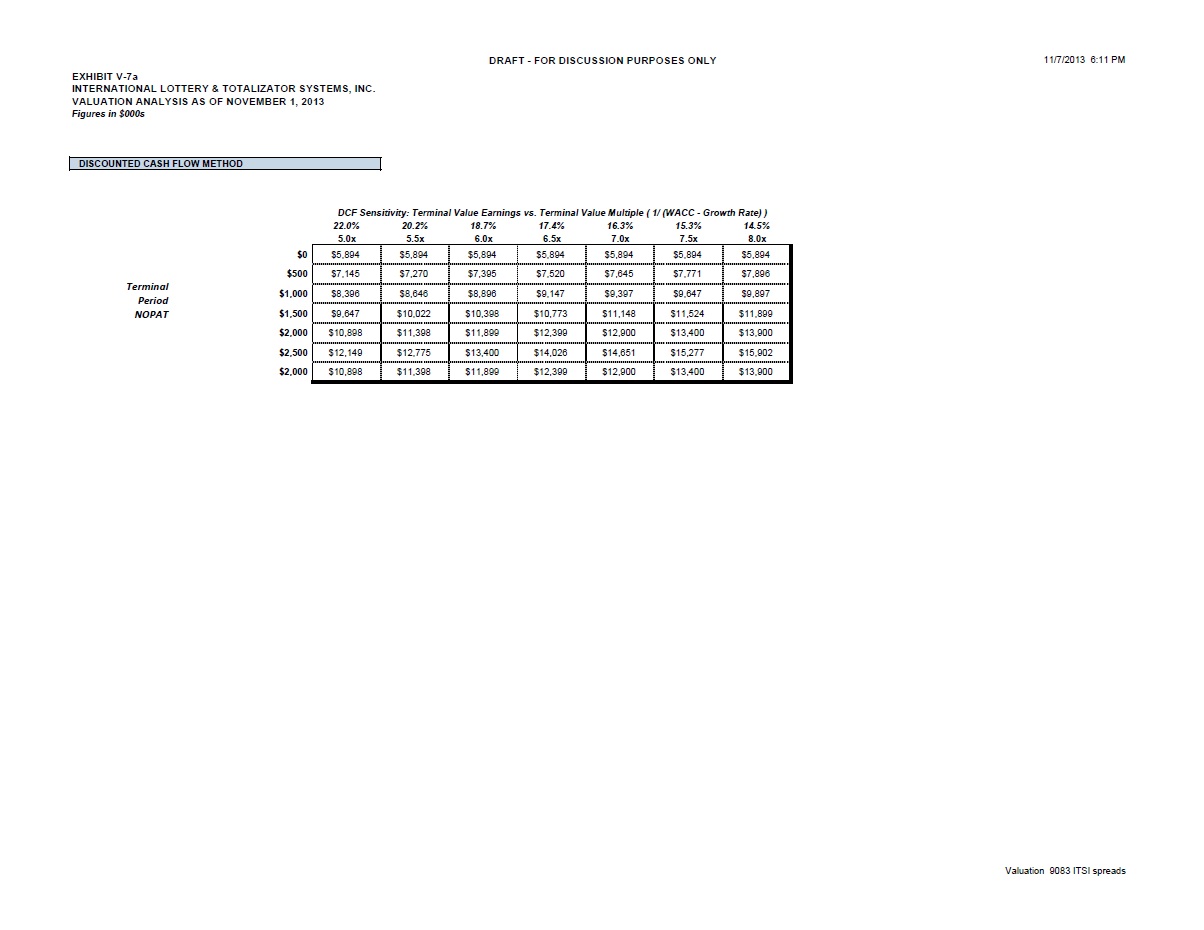
Terminal Value WACC and Multiple ( 1/ (WACC - Growth Rate) ) 22.0% 20.2% 18.7% 17.4% 16.3% 15.3% 14.5% $6,043 5.0x 5.5x 6.0x 6.5x 7.0x 7.5x 8.0x $0 $5,894 $5,894 $5,894 $5,894 $5,894 $5,894 $5,894 $500 $7,145 $7,270 $7,395 $7,520 $7,645 $7,771 $7,896 $1,000 $8,396 $8,646 $8,896 $9,147 $9,397 $9,647 $9,897 $1,500 $9,647 $10,022 $10,398 $10,773 $11,148 $11,524 $11,899 $2,000 $10,898 $11,398 $11,899 $12,399 $12,900 $13,400 $13,900 $2,500 $12,149 $12,775 $13,400 $14,026 $14,651 $15,277 $15,902 $2,000 $10,898 $11,398 $11,899 $12,399 $12,900 $13,400 $13,900
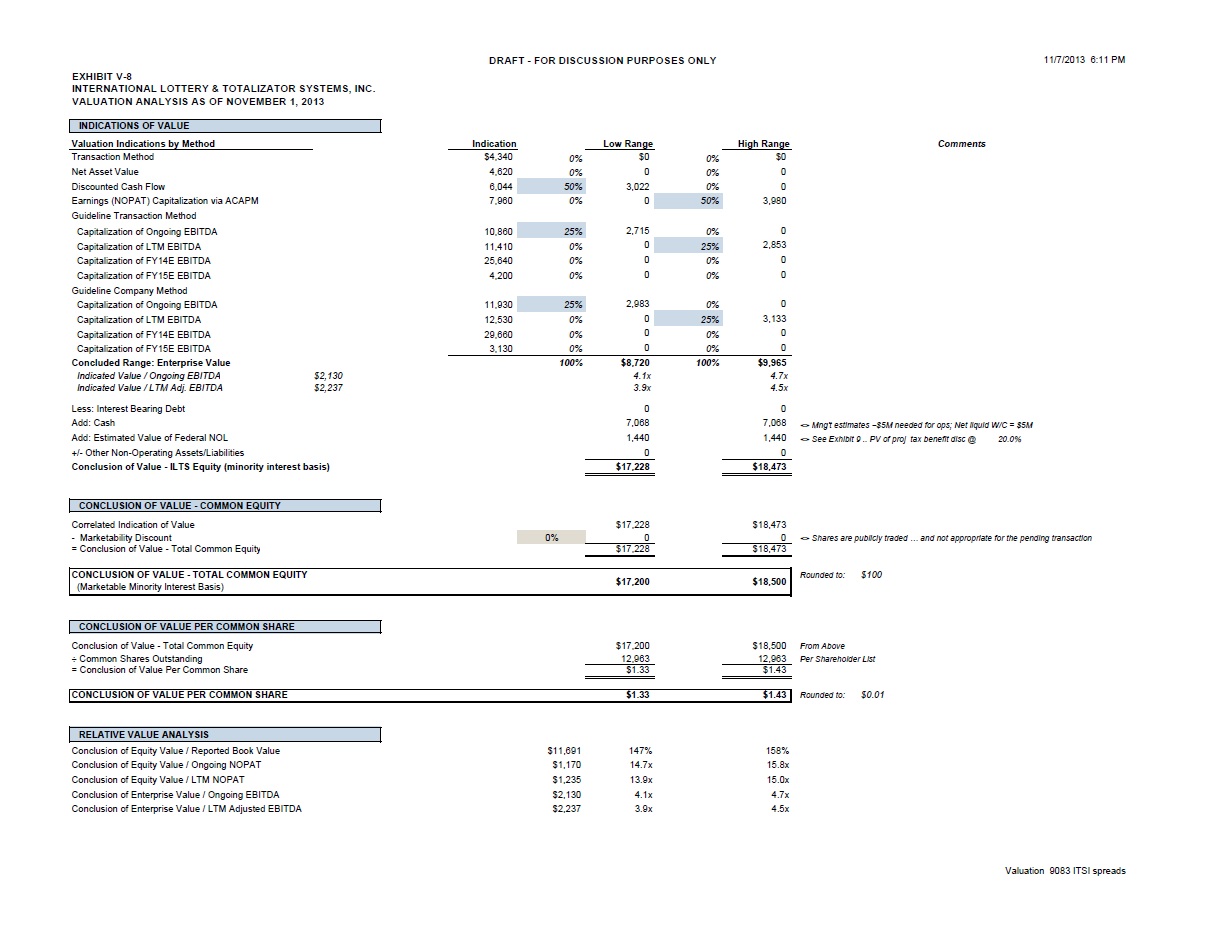
EXHIBIT V-8 INTERNATIONAL LOTTERY & TOTALIZER SYSTEMS, INC. VALUATION ANALYSIS AS OF NOVEMBER 1, 2013 INDICATIONS OF VALUE Valuation Indications by Method Indication Low Range High Range Comments Transaction Method $4,340 0% $0 0% $0 Net Asset Value 4,620 0% 0 0% 0 Discounted Cash Flow 6,043 50% 3,022 0% 0 Earnings (NOPAT) Capitalization via ACAPM 7,960 0% 0 50% 3,980 Guideline Transaction Method Capitalization of Ongoing EBITDA 10,860 25% 2,715 0% 0 Capitalization of LTM EBITDA 11,410 0% 0 25% 2,853 Capitalization of FY14E EBITDA 25,640 0% 0 0% 0 Capitalization of FY15E EBITDA 4,200 0% 0 0% 0 Guideline Company Method Capitalization of Ongoing EBITDA 11,930 25% 2,983 0% 0 Capitalization of LTM EBITDA 12,530 0% 0 25% 3,133 Capitalization of FY14E EBITDA 29,660 0% 0 0% 0 Capitalization of FY15E EBITDA 3,130 0% 0 0% 0 Concluded Range: Enterprise Value 100% $8,719 100% $9,965 Indicated Value / Ongoing EBITDA $2,130 4.1x 4.7x Indicated Value / LTM Adj. EBITDA $2,237 3.9x 4.5x Less: Interest Bearing Debt 0 0 Add: Cash 7,068 7,068 <> Management estimates ~$5M needed for operations; all cash is credited Add: Estimated Value of Federal NOL 1,440 1,440 <> PV of projected tax benefit discounted @ 20.0% +/- Other Non-Operating Assets/Liabilities 0 0 Conclusion of Value - ILTS Equity (minority interest basis) $17,227 $18,473 CONCLUSION OF VALUE - COMMON EQUITY Correlated Indication of Value $17,227 $18,473 - Marketability Discount 0% 0 0 <> Shares are publicly traded … and not appropriate for the pending transaction = Conclusion of Value - Total Common Equity $17,227 $18,473 CONCLUSION OF VALUE - TOTAL COMMON EQUITY $17,200 $18,500 Rounded to: $100 (Marketable Minority Interest Basis) CONCLUSION OF VALUE PER COMMON SHARE Conclusion of Value - Total Common Equity $17,200 $18,500 From Above ÷ Common Shares Outstanding 12,963 12,963 Per Shareholder List = Conclusion of Value Per Common Share $1.33 $1.43 CONCLUSION OF VALUE PER COMMON SHARE $1.33 $1.43 Rounded to: $0.01 RELATIVE VALUE ANALYSIS Conclusion of Equity Value / Reported Book Value $11,691 147% 158% Conclusion of Equity Value / Ongoing NOPAT $1,170 14.7x 15.8x Conclusion of Equity Value / LTM NOPAT $1,236 13.9x 15.0x Conclusion of Enterprise Value / Ongoing EBITDA $2,130 4.1x 4.7x Conclusion of Enterprise Value / LTM Adjusted EBITDA $2,237 3.9x 4.5x

EXHIBIT V-9 INTERNATIONAL LOTTERY & TOTALIZER SYSTEMS, INC. VALUATION ANALYSIS AS OF NOVEMBER 1, 2013 Value of NOL Carryforward Tax Benefit Year 1 Year 2 Year 3 Year 4 Year 5 Year 6 Year 7 Year 8 Year 9 Year 10 Year 11 Year 12 FYE 2013 Federal NOL Carryforward $14,500 Less: YTD Pre-Tax Income (3,703) Federal NOL Carryforward Balance $10,797 $9,657 $9,002 $8,734 $7,281 $7,210 $6,210 $5,210 $4,210 $3,210 $2,210 $1,210 Projected Pre-Tax Income (less YTD pretax income) 1,140 655 268 1,453 71 1,000 1,000 1,000 1,000 1,000 1,000 1,000 Effective Tax Rate 35.00% 35.00% 35.00% 35.00% 35.00% 35.00% 35.00% 35.00% 35.00% 35.00% 35.00% 35.00% Tax Benefit 399 229 94 509 25 350 350 350 350 350 350 350 Discounting Periods 0.5 1.5 2.5 3.5 4.5 5.5 6.5 7.5 8.5 9.5 10.5 11.5 Eq Discount Rate + Added Premium 20.0% 0.9129 0.7607 0.6339 0.5283 0.4402 0.3669 0.3057 0.2548 0.2123 0.1769 0.1474 0.1229 Present Value of Tax Benefit $364 $174 $59 $269 $11 $128 $107 $89 $74 $62 $52 $43 Present Value of NOL Carryforward Tax Benefit $1,440 Rounded to: $10 Memo: Ending NOL Carryforward Balance $9,657 $9,002 $8,734 $7,281 $7,210 $6,210 $5,210 $4,210 $3,210 $2,210 $1,210 $210 Memo: Assumed Avg Pre-Tax Inc after 2018 (Year 5) $1,000 Year 12 PV benefit (outside print range) $43 Year 13 PV benefit (outside print range) $8 Year 14 PV benefit (outside print range) $0 Year 15 PV benefit (outside print range) $0 Future Federal NOL Expirations <> per management schedule 2014 0 2015 0 2016 0 2017 0 2018 0 2019 3,281 2020 3,768 2021 0 2022 0 2023 0 2024 1,761 2025 1,741 2026 1,612 2027 0 2028 0 2029 1,158 2030 546 2031 584 Total $14,450