UNITED STATES
SECURITIES AND EXCHANGE COMMISSION
Washington, D.C. 20549
FORM N-CSR
CERTIFIED SHAREHOLDER REPORT OF REGISTERED
MANAGEMENT INVESTMENT COMPANIES
Investment Company Act file number 811-03221
Fidelity Charles Street Trust
(Exact name of registrant as specified in charter)
245 Summer St., Boston, MA 02210
(Address of principal executive offices) (Zip code)
Cynthia Lo Bessette, Secretary
245 Summer St.
Boston, Massachusetts 02210
(Name and address of agent for service)
Registrant's telephone number, including area code:
617-563-7000
Date of fiscal year end: | September 30 |
Date of reporting period: | March 31, 2022 |
Item 1.
Reports to Stockholders
Fidelity Asset Manager® Funds - 20%, 30%, 40%, 50%, 60%, 70%, 85%
Semi-Annual Report
March 31, 2022
Includes Fidelity and Fidelity Advisor share classes

Contents
|
Fidelity Asset Manager® 20% | |
|
Fidelity Asset Manager® 30% | |
|
Fidelity Asset Manager® 40% | |
|
Fidelity Asset Manager® 50% | |
|
Fidelity Asset Manager® 60% | |
|
Fidelity Asset Manager® 70% | |
|
Fidelity Asset Manager® 85% | |
To view a fund's proxy voting guidelines and proxy voting record for the 12-month period ended June 30, visit http://www.fidelity.com/proxyvotingresults or visit the Securities and Exchange Commission's (SEC) web site at http://www.sec.gov.
You may also call 1-800-544-8544 if you’re an individual investing directly with Fidelity, call 1-800-835-5092 if you’re a plan sponsor or participant with Fidelity as your recordkeeper or call 1-877-208-0098 on institutional accounts or if you’re an advisor or invest through one to request a free copy of the proxy voting guidelines.
Standard & Poor's, S&P and S&P 500 are registered service marks of The McGraw-Hill Companies, Inc. and have been licensed for use by Fidelity Distributors Corporation.
Other third-party marks appearing herein are the property of their respective owners.
All other marks appearing herein are registered or unregistered trademarks or service marks of FMR LLC or an affiliated company. © 2022 FMR LLC. All rights reserved.
This report and the financial statements contained herein are submitted for the general information of the shareholders of the Funds. This report is not authorized for distribution to prospective investors in the Funds unless preceded or accompanied by an effective prospectus.
A fund files its complete schedule of portfolio holdings with the SEC for the first and third quarters of each fiscal year on Form N-PORT. Forms N-PORT are available on the SEC’s web site at http://www.sec.gov. A fund's Forms N-PORT may be reviewed and copied at the SEC’s Public Reference Room in Washington, DC. Information regarding the operation of the SEC's Public Reference Room may be obtained by calling 1-800-SEC-0330.
For a complete list of a fund's portfolio holdings, view the most recent holdings listing, semiannual report, or annual report on Fidelity's web site at http://www.fidelity.com, http://www.institutional.fidelity.com, or http://www.401k.com, as applicable.
NOT FDIC INSURED •MAY LOSE VALUE •NO BANK GUARANTEE
Neither the Funds nor Fidelity Distributors Corporation is a bank.
Note to Shareholders:
Early in 2020, the outbreak and spread of COVID-19 emerged as a public health emergency that had a major influence on financial markets, primarily based on its impact on the global economy and corporate earnings. On March 11, 2020, the World Health Organization declared the COVID-19 outbreak a pandemic, citing sustained risk of further global spread. The pandemic prompted a number of measures to limit the spread of COVID-19, including travel and border restrictions, quarantines, and restrictions on large gatherings. In turn, these resulted in lower consumer activity, diminished demand for a wide range of products and services, disruption in manufacturing and supply chains, and – given the wide variability in outcomes regarding the outbreak – significant market uncertainty and volatility. To help stem the turmoil, the U.S. government took unprecedented action – in concert with the U.S. Federal Reserve and central banks around the world – to help support consumers, businesses, and the broader economy, and to limit disruption to the financial system.
In general, the overall impact of the pandemic lessened in 2021, amid a resilient economy and widespread distribution of three COVID-19 vaccines granted emergency use authorization from the U.S. Food and Drug Administration (FDA) early in the year. Still, the situation remains dynamic, and the extent and duration of its influence on financial markets and the economy is highly uncertain, due in part to a recent spike in cases based on highly contagious variants of the coronavirus.
Extreme events such as the COVID-19 crisis are exogenous shocks that can have significant adverse effects on mutual funds and their investments. Although multiple asset classes may be affected by market disruption, the duration and impact may not be the same for all types of assets. Fidelity is committed to helping you stay informed amid news about COVID-19 and during increased market volatility, and we continue to take extra steps to be responsive to customer needs. We encourage you to visit us online, where we offer ongoing updates, commentary, and analysis on the markets and our funds.
Fidelity Asset Manager® 20%
Investment Summary (Unaudited)
The information in the following tables is based on the combined investments of the Fund and its pro-rata share of the investments of Fidelity's Central Funds, other than the Commodity Strategy and Money Market Central Funds.Top Five Bond Issuers as of March 31, 2022
| (with maturities greater than one year) | % of fund's net assets |
| U.S. Treasury Obligations | 15.3 |
| Freddie Mac | 2.9 |
| Fannie Mae | 2.5 |
| Ginnie Mae | 1.7 |
| Uniform Mortgage Backed Securities | 1.7 |
| 24.1 |
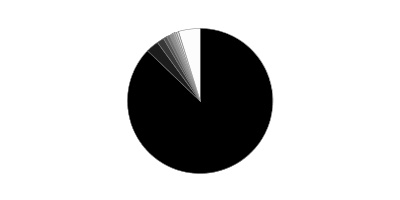
Quality Diversification (% of fund's net assets)
| As of March 31, 2022 | ||
| U.S. Government and U.S. Government Agency Obligations | 24.8% | |
| AAA,AA,A | 6.9% | |
| BBB | 9.8% | |
| BB and Below | 5.8% | |
| Not Rated | 1.7% | |
| Equities* | 26.9% | |
| Short-Term Investments and Net Other Assets | 24.1% | |
* Includes investment in Fidelity® Commodity Strategy Central Fund of 0.9%
We have used ratings from Moody's Investors Service, Inc. Where Moody's® ratings are not available, we have used S&P® ratings. All ratings are as of the date indicated and do not reflect subsequent changes.
Top Ten Stocks as of March 31, 2022
| % of fund's net assets | |
| Apple, Inc. | 1.2 |
| Microsoft Corp. | 1.2 |
| Alphabet, Inc. Class A | 0.8 |
| Amazon.com, Inc. | 0.6 |
| Meta Platforms, Inc. Class A | 0.3 |
| Prologis (REIT), Inc. | 0.3 |
| UnitedHealth Group, Inc. | 0.3 |
| Tesla, Inc. | 0.3 |
| Exxon Mobil Corp. | 0.2 |
| Taiwan Semiconductor Manufacturing Co. Ltd. | 0.2 |
| 5.4 |
Market Sectors as of March 31, 2022
| % of fund's net assets | |
| Financials | 30.4 |
| Information Technology | 6.9 |
| Consumer Discretionary | 4.1 |
| Health Care | 3.5 |
| Communication Services | 3.5 |
| Industrials | 4.3 |
| Real Estate | 3.3 |
| Energy | 2.9 |
| Consumer Staples | 2.3 |
| Utilities | 1.1 |
| Materials | 0.9 |
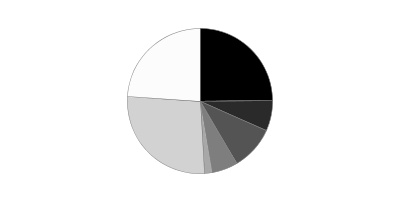
Asset Allocation (% of fund's net assets)
| As of March 31, 2022 | ||
| Stocks and Equity Futures* | 25.2% | |
| Bond Class | 48.7% | |
| Short-Term Class | 26.1% | |

* Includes investment in Fidelity® Commodity Strategy Central Fund of 0.9%
Asset allocations in the pie charts reflect the categorization of assets as defined in the Fund's prospectus in effect as of the time periods indicated above. Percentages are adjusted for the effect of future contracts and swap contracts, if applicable.
Geographic Diversification (% of fund's net assets)
| As of March 31, 2022 | ||
| United States of America | 87.1% | |
| Cayman Islands | 2.9% | |
| United Kingdom | 1.6% | |
| France | 0.8% | |
| Canada | 0.7% | |
| Switzerland | 0.7% | |
| Netherlands | 0.5% | |
| Ireland | 0.5% | |
| Japan | 0.5% | |
| Other | 4.7% | |
Percentages are based on country or territory of incorporation and are adjusted for the effect of futures contracts, if applicable.
At period end, foreign investments including the Fund's pro-rata share of the underlying Central Funds, other than the Commodity Strategy Central and Money Market Funds, was 12.9% of net assets.
Percentages in the above tables are adjusted for the effect of TBA Sale Commitments.
An unaudited holdings listing for the Fund, which presents direct holdings as well as the pro-rata share of any securities and other investments held indirectly through its investment in underlying Fidelity Central Funds, other than the Commodity Strategy and Money Market Central Funds, is available at fidelity.com and/or institutional.fidelity.com, as applicable.
Fidelity Asset Manager® 20%
Schedule of Investments March 31, 2022 (Unaudited)
Showing Percentage of Net Assets
| Equity Central Funds - 25.6% | |||
| Shares | Value | ||
| Fidelity Commodity Strategy Central Fund (a)(b) | 8,500,482 | $52,447,975 | |
| Fidelity Emerging Markets Equity Central Fund (b) | 639,833 | 137,979,924 | |
| Fidelity International Equity Central Fund (b) | 2,487,791 | 237,285,513 | |
| Fidelity Real Estate Equity Central Fund (b) | 555,648 | 84,619,579 | |
| Fidelity U.S. Equity Central Fund (b) | 9,380,093 | 1,161,724,517 | |
| TOTAL EQUITY CENTRAL FUNDS | |||
| (Cost $1,054,878,613) | 1,674,057,508 | ||
| Fixed-Income Central Funds - 47.8% | |||
| High Yield Fixed-Income Funds - 4.6% | |||
| Fidelity Emerging Markets Debt Central Fund (b) | 1,770,824 | 14,680,129 | |
| Fidelity Emerging Markets Debt Local Currency Central Fund (b) | 143,948 | 12,713,459 | |
| Fidelity Floating Rate Central Fund (b) | 2,243,237 | 223,762,934 | |
| Fidelity High Income Central Fund (b) | 458,150 | 50,698,878 | |
| TOTAL HIGH YIELD FIXED-INCOME FUNDS | 301,855,400 | ||
| Investment Grade Fixed-Income Funds - 43.2% | |||
| Fidelity Inflation-Protected Bond Index Central Fund (b) | 777,163 | 81,003,671 | |
| Fidelity International Credit Central Fund (b) | 698,482 | 65,824,937 | |
| Fidelity Investment Grade Bond Central Fund (b) | 25,019,156 | 2,679,301,447 | |
| TOTAL INVESTMENT GRADE FIXED-INCOME FUNDS | 2,826,130,055 | ||
| TOTAL FIXED-INCOME CENTRAL FUNDS | |||
| (Cost $3,050,657,538) | 3,127,985,455 | ||
| Money Market Central Funds - 25.3% | |||
| Fidelity Cash Central Fund 0.31% (c) | 370,670,334 | 370,744,468 | |
| Fidelity Money Market Central Fund 0.45% (c) | 1,256,422,226 | 1,256,170,941 | |
| Fidelity Securities Lending Cash Central Fund 0.31% (c)(d) | 27,583,192 | 27,585,950 | |
| TOTAL MONEY MARKET CENTRAL FUNDS | |||
| (Cost $1,654,738,958) | 1,654,501,359 | ||
| Principal Amount | Value | ||
| U.S. Treasury Obligations - 0.2% | |||
| U.S. Treasury Bills, yield at date of purchase 0.11% to 0.5% 4/14/22 to 6/30/22 (e) | |||
| (Cost $15,658,201) | 15,670,000 | 15,658,187 | |
| Shares | Value | ||
| Investment Companies - 1.5% | |||
| iShares 20+ Year Treasury Bond ETF (f) | |||
| (Cost $108,730,703) | 736,520 | 97,279,561 | |
| TOTAL INVESTMENT IN SECURITIES - 100.4% | |||
| (Cost $5,884,664,013) | 6,569,482,070 | ||
| NET OTHER ASSETS (LIABILITIES) - (0.4)% | (23,280,139) | ||
| NET ASSETS - 100% | $6,546,201,931 |
| Futures Contracts | |||||
| Number of contracts | Expiration Date | Notional Amount | Value | Unrealized Appreciation/(Depreciation) | |
| Purchased | |||||
| Equity Index Contracts | |||||
| ICE E-mini MSCI Emerging Markets Index Contracts (United States) | 117 | June 2022 | $6,584,175 | $502,382 | $502,382 |
| TOTAL PURCHASED FUTURES | 502,382 | ||||
| Sold | |||||
| Equity Index Contracts | |||||
| CME Micro E-mini S&P 500 Index Contracts (United States) | 719 | June 2022 | 162,880,463 | (9,278,029) | (9,278,029) |
| ICE E-mini MSCI EAFE Index Contracts (United States) | 1,729 | June 2022 | 185,383,380 | (10,751,075) | (10,751,075) |
| TOTAL SOLD FUTURES | (20,029,104) | ||||
| TOTAL FUTURES CONTRACTS | $(19,526,722) |
The notional amount of futures purchased as a percentage of Net Assets is 0.1%
The notional amount of futures sold as a percentage of Net Assets is 5.3%
For the period, the average monthly notional amount at value for futures contracts in the aggregate was $401,750,472.
Security Type Abbreviations
ETF – Exchange-Traded Fund
Legend
(a) Non-income producing
(b) Affiliated fund that is generally available only to investment companies and other accounts managed by Fidelity Investments. A complete unaudited schedule of portfolio holdings for each Fidelity Central Fund is filed with the SEC for the first and third quarters of each fiscal year on Form N-PORT and is available upon request or at the SEC's website at www.sec.gov. An unaudited holdings listing for the Fund, which presents direct holdings as well as the pro-rata share of securities and other investments held indirectly through its investment in underlying non-money market Fidelity Central Funds, other than the Commodity Strategy Central Fund, is available at fidelity.com and/or institutional.fidelity.com, as applicable. In addition, each Fidelity Central Fund's financial statements are available on the SEC's website or upon request.
(c) Affiliated fund that is generally available only to investment companies and other accounts managed by Fidelity Investments. The rate quoted is the annualized seven-day yield of the fund at period end. A complete unaudited listing of the fund's holdings as of its most recent quarter end is available upon request. In addition, each Fidelity Central Fund's financial statements are available on the SEC's website or upon request.
(d) Investment made with cash collateral received from securities on loan.
(e) Security or a portion of the security was pledged to cover margin requirements for futures contracts. At period end, the value of securities pledged amounted to $15,658,187.
(f) Security or a portion of the security is on loan at period end.
Affiliated Central Funds
Fiscal year to date information regarding the Fund's investments in Fidelity Central Funds, including the ownership percentage, is presented below.
| Fund | Value, beginning of period | Purchases | Sales Proceeds | Dividend Income | Realized Gain (loss) | Change in Unrealized appreciation (depreciation) | Value, end of period | % ownership, end of period |
| Fidelity Cash Central Fund 0.31% | $426,692,704 | $434,435,072 | $490,383,308 | $151,654 | $-- | $-- | $370,744,468 | 0.7 |
| Fidelity Commodity Strategy Central Fund | 92,939,665 | 12,224,454 | 71,797,458 | -- | 9,716,271 | 9,365,043 | 52,447,975 | 9 |
| Fidelity Emerging Markets Debt Central Fund | 14,087,986 | 4,062,494 | 1,971,559 | 340,763 | (84,594) | (1,414,198) | 14,680,129 | 0.6 |
| Fidelity Emerging Markets Debt Local Currency Central Fund | 13,637,451 | 747,450 | -- | 747,450 | -- | (1,671,442) | 12,713,459 | 14.1 |
| Fidelity Emerging Markets Equity Central Fund | 166,846,598 | 14,431,599 | 4,550,791 | 13,873,562 | 7,108,249 | (45,855,731) | 137,979,924 | 7.6 |
| Fidelity Floating Rate Central Fund | 146,201,187 | 92,106,951 | 12,120,342 | 4,115,122 | 302,300 | (2,727,162) | 223,762,934 | 7 |
| Fidelity High Income Central Fund | 82,065,669 | 6,701,619 | 35,833,360 | 1,567,801 | 1,476,947 | (3,711,997) | 50,698,878 | 2.4 |
| Fidelity Inflation-Protected Bond Index Central Fund | 168,009,085 | 28,469,486 | 103,888,802 | 12,313,144 | 4,225,276 | (15,811,374) | 81,003,671 | 12.4 |
| Fidelity International Credit Central Fund | 84,468,784 | 10,638,011 | 22,881,734 | 1,402,123 | (1,242,359) | (5,157,765) | 65,824,937 | 12.8 |
| Fidelity International Equity Central Fund | 236,560,300 | 35,926,856 | 6,970,288 | 15,580,988 | (457,862) | (27,773,493) | 237,285,513 | 6.2 |
| Fidelity Investment Grade Bond Central Fund | 2,530,110,915 | 492,693,924 | 160,075,643 | 29,892,324 | (3,566,663) | (179,861,086) | 2,679,301,447 | 7.8 |
| Fidelity Money Market Central Fund 0.45% | 1,059,257,144 | 268,787,253 | 71,627,368 | 1,303,246 | (8,222) | (237,866) | 1,256,170,941 | 74.4 |
| Fidelity Real Estate Equity Central Fund | 92,883,360 | 27,109,878 | 40,521,662 | 1,091,766 | 789,193 | 4,358,810 | 84,619,579 | 5 |
| Fidelity Securities Lending Cash Central Fund 0.31% | -- | 31,057,550 | 3,471,600 | 3,165 | -- | -- | 27,585,950 | 0.1 |
| Fidelity U.S. Equity Central Fund | 1,083,698,613 | 221,100,857 | 58,754,824 | 95,512,640 | (5,456,644) | (78,863,485) | 1,161,724,517 | 5.3 |
| $6,197,459,461 | $1,680,493,454 | $1,084,848,739 | $177,895,748 | $12,801,892 | $(349,361,746) | $6,456,544,322 |
Amounts in the income column in the above table include any capital gain distributions from underlying funds, which are presented in the corresponding line-item in the Statement of Operations, if applicable. Amount for Fidelity Securities Lending Cash Central Fund represents the income earned on investing cash collateral, less rebates paid to borrowers and any lending agent fees associated with the loan, plus any premium payments received for lending certain types of securities.
Investment Valuation
The following is a summary of the inputs used, as of March 31, 2022, involving the Fund's assets and liabilities carried at fair value. The inputs or methodology used for valuing securities may not be an indication of the risk associated with investing in those securities. For more information on valuation inputs, and their aggregation into the levels used below, please refer to the Investment Valuation section in the accompanying Notes to Financial Statements.
| Valuation Inputs at Reporting Date: | ||||
| Description | Total | Level 1 | Level 2 | Level 3 |
| Investments in Securities: | ||||
| Equity Central Funds | $1,674,057,508 | $1,674,057,508 | $-- | $-- |
| Fixed-Income Central Funds | 3,127,985,455 | 3,127,985,455 | -- | -- |
| Money Market Central Funds | 1,654,501,359 | 1,654,501,359 | -- | -- |
| U.S. Treasury Obligations | 15,658,187 | -- | 15,658,187 | -- |
| Investment Companies | 97,279,561 | 97,279,561 | -- | -- |
| Total Investments in Securities: | $6,569,482,070 | $6,553,823,883 | $15,658,187 | $-- |
| Derivative Instruments: | ||||
| Assets | ||||
| Futures Contracts | $502,382 | $502,382 | $-- | $-- |
| Total Assets | $502,382 | $502,382 | $-- | $-- |
| Liabilities | ||||
| Futures Contracts | $(20,029,104) | $(20,029,104) | $-- | $-- |
| Total Liabilities | $(20,029,104) | $(20,029,104) | $-- | $-- |
| Total Derivative Instruments: | $(19,526,722) | $(19,526,722) | $-- | $-- |
Value of Derivative Instruments
The following table is a summary of the Fund's value of derivative instruments by primary risk exposure as of March 31, 2022. For additional information on derivative instruments, please refer to the Derivative Instruments section in the accompanying Notes to Financial Statements.
| Primary Risk Exposure / Derivative Type | Value | |
| Asset | Liability | |
| Equity Risk | ||
| Futures Contracts(a) | $502,382 | $(20,029,104) |
| Total Equity Risk | 502,382 | (20,029,104) |
| Total Value of Derivatives | $502,382 | $(20,029,104) |
(a) Reflects gross cumulative appreciation (depreciation) on futures contracts as presented in the Schedule of Investments. In the Statement of Assets and Liabilities, the period end daily variation margin is included in receivable or payable for daily variation margin on futures contracts, and the net cumulative appreciation (depreciation) is included in Total accumulated earnings (loss).
See accompanying notes which are an integral part of the financial statements.
Fidelity Asset Manager® 20%
Financial Statements
Statement of Assets and Liabilities
| March 31, 2022 (Unaudited) | ||
| Assets | ||
| Investment in securities, at value (including securities loaned of $27,089,608) — See accompanying schedule: Unaffiliated issuers (cost $124,388,904) | $112,937,748 | |
| Fidelity Central Funds (cost $5,760,275,109) | 6,456,544,322 | |
| Total Investment in Securities (cost $5,884,664,013) | $6,569,482,070 | |
| Receivable for investments sold | 4,306,302 | |
| Receivable for fund shares sold | 1,137,396 | |
| Distributions receivable from Fidelity Central Funds | 67,788 | |
| Receivable for daily variation margin on futures contracts | 5,416,930 | |
| Prepaid expenses | 3,070 | |
| Total assets | 6,580,413,556 | |
| Liabilities | ||
| Payable for investments purchased | $5,503 | |
| Payable for fund shares redeemed | 3,826,418 | |
| Accrued management fee | 2,169,714 | |
| Distribution and service plan fees payable | 48,736 | |
| Other affiliated payables | 509,003 | |
| Other payables and accrued expenses | 66,301 | |
| Collateral on securities loaned | 27,585,950 | |
| Total liabilities | 34,211,625 | |
| Net Assets | $6,546,201,931 | |
| Net Assets consist of: | ||
| Paid in capital | $6,013,180,733 | |
| Total accumulated earnings (loss) | 533,021,198 | |
| Net Assets | $6,546,201,931 | |
| Net Asset Value and Maximum Offering Price | ||
| Class A: | ||
| Net Asset Value and redemption price per share ($64,588,488 ÷ 4,547,515 shares)(a) | $14.20 | |
| Maximum offering price per share (100/94.25 of $14.20) | $15.07 | |
| Class M: | ||
| Net Asset Value and redemption price per share ($30,771,548 ÷ 2,172,096 shares)(a) | $14.17 | |
| Maximum offering price per share (100/96.50 of $14.17) | $14.68 | |
| Class C: | ||
| Net Asset Value and offering price per share ($29,334,274 ÷ 2,086,716 shares)(a) | $14.06 | |
| Asset Manager 20%: | ||
| Net Asset Value, offering price and redemption price per share ($4,485,428,708 ÷ 315,233,718 shares) | $14.23 | |
| Class I: | ||
| Net Asset Value, offering price and redemption price per share ($33,192,418 ÷ 2,332,503 shares) | $14.23 | |
| Class Z: | ||
| Net Asset Value, offering price and redemption price per share ($1,902,886,495 ÷ 133,796,397 shares) | $14.22 |
(a) Redemption price per share is equal to net asset value less any applicable contingent deferred sales charge.
See accompanying notes which are an integral part of the financial statements.
Statement of Operations
| Six months ended March 31, 2022 (Unaudited) | ||
| Investment Income | ||
| Dividends | $1,050,141 | |
| Interest | 5,836 | |
| Income from Fidelity Central Funds (including $3,165 from security lending) | 60,550,787 | |
| Total income | 61,606,764 | |
| Expenses | ||
| Management fee | $13,136,073 | |
| Transfer agent fees | 2,395,452 | |
| Distribution and service plan fees | 291,431 | |
| Accounting fees | 619,304 | |
| Custodian fees and expenses | 17,733 | |
| Independent trustees' fees and expenses | 11,106 | |
| Registration fees | 106,985 | |
| Audit | 16,579 | |
| Legal | 7,160 | |
| Miscellaneous | 14,307 | |
| Total expenses before reductions | 16,616,130 | |
| Expense reductions | (53,847) | |
| Total expenses after reductions | 16,562,283 | |
| Net investment income (loss) | 45,044,481 | |
| Realized and Unrealized Gain (Loss) | ||
| Net realized gain (loss) on: | ||
| Investment securities: | ||
| Unaffiliated issuers | (4,453,555) | |
| Fidelity Central Funds | 12,801,892 | |
| Futures contracts | 41,363,246 | |
| Capital gain distributions from Fidelity Central Funds | 117,344,961 | |
| Total net realized gain (loss) | 167,056,544 | |
| Change in net unrealized appreciation (depreciation) on: | ||
| Investment securities: | ||
| Unaffiliated issuers | (5,648,365) | |
| Fidelity Central Funds | (349,361,746) | |
| Futures contracts | (38,799,853) | |
| Total change in net unrealized appreciation (depreciation) | (393,809,964) | |
| Net gain (loss) | (226,753,420) | |
| Net increase (decrease) in net assets resulting from operations | $(181,708,939) |
See accompanying notes which are an integral part of the financial statements.
Statement of Changes in Net Assets
| Six months ended March 31, 2022 (Unaudited) | Year ended September 30, 2021 | |
| Increase (Decrease) in Net Assets | ||
| Operations | ||
| Net investment income (loss) | $45,044,481 | $77,567,982 |
| Net realized gain (loss) | 167,056,544 | 40,784,860 |
| Change in net unrealized appreciation (depreciation) | (393,809,964) | 290,401,122 |
| Net increase (decrease) in net assets resulting from operations | (181,708,939) | 408,753,964 |
| Distributions to shareholders | (77,324,062) | (110,397,850) |
| Share transactions - net increase (decrease) | 444,099,673 | 531,844,334 |
| Total increase (decrease) in net assets | 185,066,672 | 830,200,448 |
| Net Assets | ||
| Beginning of period | 6,361,135,259 | 5,530,934,811 |
| End of period | $6,546,201,931 | $6,361,135,259 |
See accompanying notes which are an integral part of the financial statements.
Financial Highlights
Fidelity Asset Manager 20% Class A
| Six months ended (Unaudited) March 31, | Years endedSeptember 30, | |||||
| 2022 | 2021 | 2020 | 2019 | 2018 | 2017 | |
| Selected Per–Share Data | ||||||
| Net asset value, beginning of period | $14.74 | $14.00 | $13.51 | $13.40 | $13.55 | $13.24 |
| Income from Investment Operations | ||||||
| Net investment income (loss)A,B | .08 | .14 | .18 | .26 | .20 | .16 |
| Net realized and unrealized gain (loss) | (.47) | .82 | .62 | .36 | .11 | .37 |
| Total from investment operations | (.39) | .96 | .80 | .62 | .31 | .53 |
| Distributions from net investment income | (.11) | (.11) | (.19) | (.26) | (.19) | (.16) |
| Distributions from net realized gain | (.03) | (.12) | (.13) | (.24) | (.27) | (.07) |
| Total distributions | (.15)C | (.22)C | (.31)C | (.51)C | (.46) | (.22)C |
| Net asset value, end of period | $14.20 | $14.74 | $14.00 | $13.51 | $13.40 | $13.55 |
| Total ReturnD,E,F | (2.70)% | 6.91% | 6.04% | 4.85% | 2.36% | 4.08% |
| Ratios to Average Net AssetsB,G,H | ||||||
| Expenses before reductions | .81%I | .81% | .82% | .83% | .84% | .84% |
| Expenses net of fee waivers, if any | .81%I | .81% | .82% | .83% | .84% | .84% |
| Expenses net of all reductions | .81%I | .81% | .82% | .83% | .84% | .83% |
| Net investment income (loss) | 1.05%I | .97% | 1.34% | 1.97% | 1.49% | 1.21% |
| Supplemental Data | ||||||
| Net assets, end of period (000 omitted) | $64,588 | $62,957 | $50,633 | $45,153 | $39,089 | $39,787 |
| Portfolio turnover rateJ | 22%I | 25% | 25% | 41% | 24% | 22% |
A Calculated based on average shares outstanding during the period.
B Net investment income (loss) is affected by the timing of the declaration of dividends by any underlying mutual funds or exchange-traded funds (ETFs). Net investment income (loss) of any such underlying funds is not included in the Fund's net investment income (loss) ratio.
C Total distributions per share do not sum due to rounding.
D Total returns for periods of less than one year are not annualized.
E Total returns would have been lower if certain expenses had not been reduced during the applicable periods shown.
F Total returns do not include the effect of the sales charges.
G Fees and expenses of any underlying mutual funds or exchange-traded funds (ETFs) are not included in the Fund's expense ratio. The Fund indirectly bears its proportionate share of these expenses. For additional expense information related to investments in Fidelity Central Funds, please refer to the "Investments in Fidelity Central Funds" note found in the Notes to Financial Statements section of the most recent Annual or Semi-Annual report.
H Expense ratios reflect operating expenses of the class. Expenses before reductions do not reflect amounts reimbursed, waived, or reduced through arrangements with the investment adviser, brokerage services, or other offset arrangements, if applicable, and do not represent the amount paid by the class during periods when reimbursements, waivers or reductions occur.
I Annualized
J Amount does not include the portfolio activity of any underlying mutual funds or exchange-traded funds (ETFs).
See accompanying notes which are an integral part of the financial statements.
Fidelity Asset Manager 20% Class M
| Six months ended (Unaudited) March 31, | Years endedSeptember 30, | |||||
| 2022 | 2021 | 2020 | 2019 | 2018 | 2017 | |
| Selected Per–Share Data | ||||||
| Net asset value, beginning of period | $14.70 | $13.97 | $13.48 | $13.37 | $13.52 | $13.21 |
| Income from Investment Operations | ||||||
| Net investment income (loss)A,B | .06 | .10 | .15 | .23 | .16 | .13 |
| Net realized and unrealized gain (loss) | (.46) | .82 | .62 | .35 | .12 | .37 |
| Total from investment operations | (.40) | .92 | .77 | .58 | .28 | .50 |
| Distributions from net investment income | (.10) | (.07) | (.15) | (.23) | (.16) | (.12) |
| Distributions from net realized gain | (.03) | (.12) | (.13) | (.24) | (.27) | (.07) |
| Total distributions | (.13) | (.19) | (.28) | (.47) | (.43) | (.19) |
| Net asset value, end of period | $14.17 | $14.70 | $13.97 | $13.48 | $13.37 | $13.52 |
| Total ReturnC,D,E | (2.75)% | 6.60% | 5.79% | 4.58% | 2.10% | 3.81% |
| Ratios to Average Net AssetsB,F,G | ||||||
| Expenses before reductions | 1.06%H | 1.07% | 1.08% | 1.08% | 1.10% | 1.10% |
| Expenses net of fee waivers, if any | 1.06%H | 1.07% | 1.07% | 1.08% | 1.10% | 1.10% |
| Expenses net of all reductions | 1.06%H | 1.07% | 1.07% | 1.08% | 1.10% | 1.10% |
| Net investment income (loss) | .80%H | .72% | 1.09% | 1.72% | 1.23% | .95% |
| Supplemental Data | ||||||
| Net assets, end of period (000 omitted) | $30,772 | $31,762 | $27,366 | $25,696 | $22,133 | $22,474 |
| Portfolio turnover rateI | 22%H | 25% | 25% | 41% | 24% | 22% |
A Calculated based on average shares outstanding during the period.
B Net investment income (loss) is affected by the timing of the declaration of dividends by any underlying mutual funds or exchange-traded funds (ETFs). Net investment income (loss) of any such underlying funds is not included in the Fund's net investment income (loss) ratio.
C Total returns for periods of less than one year are not annualized.
D Total returns would have been lower if certain expenses had not been reduced during the applicable periods shown.
E Total returns do not include the effect of the sales charges.
F Fees and expenses of any underlying mutual funds or exchange-traded funds (ETFs) are not included in the Fund's expense ratio. The Fund indirectly bears its proportionate share of these expenses. For additional expense information related to investments in Fidelity Central Funds, please refer to the "Investments in Fidelity Central Funds" note found in the Notes to Financial Statements section of the most recent Annual or Semi-Annual report.
G Expense ratios reflect operating expenses of the class. Expenses before reductions do not reflect amounts reimbursed, waived, or reduced through arrangements with the investment adviser, brokerage services, or other offset arrangements, if applicable, and do not represent the amount paid by the class during periods when reimbursements, waivers or reductions occur.
H Annualized
I Amount does not include the portfolio activity of any underlying mutual funds or exchange-traded funds (ETFs).
See accompanying notes which are an integral part of the financial statements.
Fidelity Asset Manager 20% Class C
| Six months ended (Unaudited) March 31, | Years endedSeptember 30, | |||||
| 2022 | 2021 | 2020 | 2019 | 2018 | 2017 | |
| Selected Per–Share Data | ||||||
| Net asset value, beginning of period | $14.61 | $13.91 | $13.43 | $13.32 | $13.47 | $13.17 |
| Income from Investment Operations | ||||||
| Net investment income (loss)A,B | .02 | .03 | .08 | .16 | .10 | .06 |
| Net realized and unrealized gain (loss) | (.46) | .82 | .61 | .36 | .11 | .36 |
| Total from investment operations | (.44) | .85 | .69 | .52 | .21 | .42 |
| Distributions from net investment income | (.08) | (.03) | (.09) | (.16) | (.09) | (.06) |
| Distributions from net realized gain | (.03) | (.12) | (.13) | (.24) | (.27) | (.07) |
| Total distributions | (.11) | (.15) | (.21)C | (.41)C | (.36) | (.12)C |
| Net asset value, end of period | $14.06 | $14.61 | $13.91 | $13.43 | $13.32 | $13.47 |
| Total ReturnD,E,F | (3.03)% | 6.10% | 5.22% | 4.06% | 1.59% | 3.25% |
| Ratios to Average Net AssetsB,G,H | ||||||
| Expenses before reductions | 1.56%I | 1.57% | 1.58% | 1.59% | 1.59% | 1.59% |
| Expenses net of fee waivers, if any | 1.56%I | 1.57% | 1.58% | 1.59% | 1.59% | 1.59% |
| Expenses net of all reductions | 1.56%I | 1.57% | 1.58% | 1.59% | 1.59% | 1.59% |
| Net investment income (loss) | .30%I | .22% | .59% | 1.21% | .74% | .45% |
| Supplemental Data | ||||||
| Net assets, end of period (000 omitted) | $29,334 | $25,804 | $24,940 | $21,588 | $26,000 | $28,217 |
| Portfolio turnover rateJ | 22%I | 25% | 25% | 41% | 24% | 22% |
A Calculated based on average shares outstanding during the period.
B Net investment income (loss) is affected by the timing of the declaration of dividends by any underlying mutual funds or exchange-traded funds (ETFs). Net investment income (loss) of any such underlying funds is not included in the Fund's net investment income (loss) ratio.
C Total distributions per share do not sum due to rounding.
D Total returns for periods of less than one year are not annualized.
E Total returns would have been lower if certain expenses had not been reduced during the applicable periods shown.
F Total returns do not include the effect of the contingent deferred sales charge.
G Fees and expenses of any underlying mutual funds or exchange-traded funds (ETFs) are not included in the Fund's expense ratio. The Fund indirectly bears its proportionate share of these expenses. For additional expense information related to investments in Fidelity Central Funds, please refer to the "Investments in Fidelity Central Funds" note found in the Notes to Financial Statements section of the most recent Annual or Semi-Annual report.
H Expense ratios reflect operating expenses of the class. Expenses before reductions do not reflect amounts reimbursed, waived, or reduced through arrangements with the investment adviser, brokerage services, or other offset arrangements, if applicable, and do not represent the amount paid by the class during periods when reimbursements, waivers or reductions occur.
I Annualized
J Amount does not include the portfolio activity of any underlying mutual funds or exchange-traded funds (ETFs).
See accompanying notes which are an integral part of the financial statements.
Fidelity Asset Manager 20%
| Six months ended (Unaudited) March 31, | Years endedSeptember 30, | |||||
| 2022 | 2021 | 2020 | 2019 | 2018 | 2017 | |
| Selected Per–Share Data | ||||||
| Net asset value, beginning of period | $14.76 | $14.02 | $13.54 | $13.42 | $13.57 | $13.26 |
| Income from Investment Operations | ||||||
| Net investment income (loss)A,B | .10 | .19 | .23 | .30 | .24 | .20 |
| Net realized and unrealized gain (loss) | (.46) | .82 | .61 | .37 | .12 | .37 |
| Total from investment operations | (.36) | 1.01 | .84 | .67 | .36 | .57 |
| Distributions from net investment income | (.14) | (.15) | (.23) | (.31) | (.24) | (.20) |
| Distributions from net realized gain | (.03) | (.12) | (.13) | (.24) | (.27) | (.07) |
| Total distributions | (.17) | (.27) | (.36) | (.55) | (.51) | (.26)C |
| Net asset value, end of period | $14.23 | $14.76 | $14.02 | $13.54 | $13.42 | $13.57 |
| Total ReturnD,E | (2.48)% | 7.24% | 6.29% | 5.24% | 2.68% | 4.40% |
| Ratios to Average Net AssetsB,F,G | ||||||
| Expenses before reductions | .50%H | .50% | .51% | .51% | .52% | .52% |
| Expenses net of fee waivers, if any | .50%H | .50% | .50% | .51% | .52% | .52% |
| Expenses net of all reductions | .50%H | .50% | .50% | .51% | .51% | .52% |
| Net investment income (loss) | 1.36%H | 1.29% | 1.66% | 2.29% | 1.81% | 1.52% |
| Supplemental Data | ||||||
| Net assets, end of period (000 omitted) | $4,485,429 | $4,723,410 | $5,377,374 | $4,990,188 | $4,819,671 | $4,880,833 |
| Portfolio turnover rateI | 22%H | 25% | 25% | 41% | 24% | 22% |
A Calculated based on average shares outstanding during the period.
B Net investment income (loss) is affected by the timing of the declaration of dividends by any underlying mutual funds or exchange-traded funds (ETFs). Net investment income (loss) of any such underlying funds is not included in the Fund's net investment income (loss) ratio.
C Total distributions per share do not sum due to rounding.
D Total returns for periods of less than one year are not annualized.
E Total returns would have been lower if certain expenses had not been reduced during the applicable periods shown.
F Fees and expenses of any underlying mutual funds or exchange-traded funds (ETFs) are not included in the Fund's expense ratio. The Fund indirectly bears its proportionate share of these expenses. For additional expense information related to investments in Fidelity Central Funds, please refer to the "Investments in Fidelity Central Funds" note found in the Notes to Financial Statements section of the most recent Annual or Semi-Annual report.
G Expense ratios reflect operating expenses of the class. Expenses before reductions do not reflect amounts reimbursed, waived, or reduced through arrangements with the investment adviser, brokerage services, or other offset arrangements, if applicable, and do not represent the amount paid by the class during periods when reimbursements, waivers or reductions occur.
H Annualized
I Amount does not include the portfolio activity of any underlying mutual funds or exchange-traded funds (ETFs).
See accompanying notes which are an integral part of the financial statements.
Fidelity Asset Manager 20% Class I
| Six months ended (Unaudited) March 31, | Years endedSeptember 30, | |||||
| 2022 | 2021 | 2020 | 2019 | 2018 | 2017 | |
| Selected Per–Share Data | ||||||
| Net asset value, beginning of period | $14.76 | $14.02 | $13.53 | $13.41 | $13.57 | $13.26 |
| Income from Investment Operations | ||||||
| Net investment income (loss)A,B | .10 | .18 | .22 | .30 | .24 | .20 |
| Net realized and unrealized gain (loss) | (.46) | .82 | .61 | .36 | .10 | .37 |
| Total from investment operations | (.36) | 1.00 | .83 | .66 | .34 | .57 |
| Distributions from net investment income | (.13) | (.14) | (.22) | (.30) | (.23) | (.19) |
| Distributions from net realized gain | (.03) | (.12) | (.13) | (.24) | (.27) | (.07) |
| Total distributions | (.17)C | (.26) | (.34)C | (.54) | (.50) | (.26) |
| Net asset value, end of period | $14.23 | $14.76 | $14.02 | $13.53 | $13.41 | $13.57 |
| Total ReturnD,E | (2.51)% | 7.17% | 6.27% | 5.18% | 2.57% | 4.35% |
| Ratios to Average Net AssetsB,F,G | ||||||
| Expenses before reductions | .55%H | .55% | .58% | .56% | .55% | .56% |
| Expenses net of fee waivers, if any | .55%H | .55% | .57% | .56% | .55% | .56% |
| Expenses net of all reductions | .55%H | .55% | .57% | .56% | .55% | .56% |
| Net investment income (loss) | 1.32%H | 1.24% | 1.59% | 2.24% | 1.78% | 1.48% |
| Supplemental Data | ||||||
| Net assets, end of period (000 omitted) | $33,192 | $31,374 | $32,445 | $25,577 | $48,713 | $50,272 |
| Portfolio turnover rateI | 22%H | 25% | 25% | 41% | 24% | 22% |
A Calculated based on average shares outstanding during the period.
B Net investment income (loss) is affected by the timing of the declaration of dividends by any underlying mutual funds or exchange-traded funds (ETFs). Net investment income (loss) of any such underlying funds is not included in the Fund's net investment income (loss) ratio.
C Total distributions per share do not sum due to rounding.
D Total returns for periods of less than one year are not annualized.
E Total returns would have been lower if certain expenses had not been reduced during the applicable periods shown.
F Fees and expenses of any underlying mutual funds or exchange-traded funds (ETFs) are not included in the Fund's expense ratio. The Fund indirectly bears its proportionate share of these expenses. For additional expense information related to investments in Fidelity Central Funds, please refer to the "Investments in Fidelity Central Funds" note found in the Notes to Financial Statements section of the most recent Annual or Semi-Annual report.
G Expense ratios reflect operating expenses of the class. Expenses before reductions do not reflect amounts reimbursed, waived, or reduced through arrangements with the investment adviser, brokerage services, or other offset arrangements, if applicable, and do not represent the amount paid by the class during periods when reimbursements, waivers or reductions occur.
H Annualized
I Amount does not include the portfolio activity of any underlying mutual funds or exchange-traded funds (ETFs).
See accompanying notes which are an integral part of the financial statements.
Fidelity Asset Manager 20% Class Z
| Six months ended (Unaudited) March 31, | Years endedSeptember 30, | |||
| 2022 | 2021 | 2020 | 2019 A | |
| Selected Per–Share Data | ||||
| Net asset value, beginning of period | $14.76 | $14.02 | $13.53 | $13.41 |
| Income from Investment Operations | ||||
| Net investment income (loss)B,C | .10 | .19 | .23 | .30 |
| Net realized and unrealized gain (loss) | (.47) | .82 | .62 | .37 |
| Total from investment operations | (.37) | 1.01 | .85 | .67 |
| Distributions from net investment income | (.14) | (.16) | (.24) | (.31) |
| Distributions from net realized gain | (.03) | (.12) | (.13) | (.24) |
| Total distributions | (.17) | (.27)D | (.36)D | (.55) |
| Net asset value, end of period | $14.22 | $14.76 | $14.02 | $13.53 |
| Total ReturnE,F | (2.53)% | 7.27% | 6.41% | 5.27% |
| Ratios to Average Net AssetsC,G,H | ||||
| Expenses before reductions | .47%I | .47% | .48% | .48%I |
| Expenses net of fee waivers, if any | .47%I | .47% | .48% | .48%I |
| Expenses net of all reductions | .47%I | .47% | .48% | .48%I |
| Net investment income (loss) | 1.39%I | 1.31% | 1.69% | 2.32%I |
| Supplemental Data | ||||
| Net assets, end of period (000 omitted) | $1,902,886 | $1,485,829 | $18,177 | $14,613 |
| Portfolio turnover rateJ | 22%I | 25% | 25% | 41% |
A For the period October 2, 2018 (commencement of sale of shares) through September 30, 2019.
B Calculated based on average shares outstanding during the period.
C Net investment income (loss) is affected by the timing of the declaration of dividends by any underlying mutual funds or exchange-traded funds (ETFs). Net investment income (loss) of any such underlying funds is not included in the Fund's net investment income (loss) ratio.
D Total distributions per share do not sum due to rounding.
E Total returns for periods of less than one year are not annualized.
F Total returns would have been lower if certain expenses had not been reduced during the applicable periods shown.
G Fees and expenses of any underlying mutual funds or exchange-traded funds (ETFs) are not included in the Fund's expense ratio. The Fund indirectly bears its proportionate share of these expenses. For additional expense information related to investments in Fidelity Central Funds, please refer to the "Investments in Fidelity Central Funds" note found in the Notes to Financial Statements section of the most recent Annual or Semi-Annual report.
H Expense ratios reflect operating expenses of the class. Expenses before reductions do not reflect amounts reimbursed, waived, or reduced through arrangements with the investment adviser, brokerage services, or other offset arrangements, if applicable, and do not represent the amount paid by the class during periods when reimbursements, waivers or reductions occur.
I Annualized
J Amount does not include the portfolio activity of any underlying mutual funds or exchange-traded funds (ETFs).
See accompanying notes which are an integral part of the financial statements.
Fidelity Asset Manager® 30%
Investment Summary (Unaudited)
The information in the following tables is based on the combined investments of the Fund and its pro-rata share of the investments of Fidelity's Central Funds, other than the Commodity Strategy and Money Market Central Funds.Top Five Bond Issuers as of March 31, 2022
| (with maturities greater than one year) | % of fund's net assets |
| U.S. Treasury Obligations | 15.4 |
| Freddie Mac | 2.8 |
| Fannie Mae | 2.5 |
| Ginnie Mae | 1.6 |
| Uniform Mortgage Backed Securities | 1.5 |
| 23.8 |
Quality Diversification (% of fund's net assets)
| As of March 31, 2022 | ||
| U.S. Government and U.S. Government Agency Obligations | 24.8% | |
| AAA,AA,A | 6.9% | |
| BBB | 9.7% | |
| BB and Below | 5.6% | |
| Not Rated | 1.6% | |
| Equities* | 37.5% | |
| Short-Term Investments and Net Other Assets | 13.9% | |
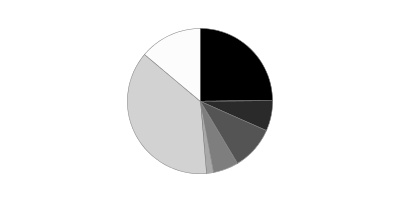
* Includes investment in Fidelity® Commodity Strategy Central Fund of 0.9%
We have used ratings from Moody's Investors Service, Inc. Where Moody's® ratings are not available, we have used S&P® ratings. All ratings are as of the date indicated and do not reflect subsequent changes.
Top Ten Stocks as of March 31, 2022
| % of fund's net assets | |
| Apple, Inc. | 1.7 |
| Microsoft Corp. | 1.6 |
| Alphabet, Inc. Class A | 1.1 |
| Amazon.com, Inc. | 0.9 |
| Meta Platforms, Inc. Class A | 0.4 |
| UnitedHealth Group, Inc. | 0.4 |
| Tesla, Inc. | 0.4 |
| Prologis (REIT), Inc. | 0.3 |
| Exxon Mobil Corp. | 0.3 |
| Taiwan Semiconductor Manufacturing Co. Ltd. | 0.3 |
| 7.4 |
Market Sectors as of March 31, 2022
| % of fund's net assets | |
| Financials | 23.6 |
| Information Technology | 9.5 |
| Consumer Discretionary | 5.2 |
| Health Care | 5.0 |
| Industrials | 4.5 |
| Communication Services | 4.0 |
| Real Estate | 3.9 |
| Energy | 3.0 |
| Consumer Staples | 3.0 |
| Materials | 1.7 |
| Utilities | 1.6 |
Asset Allocation (% of fund's net assets)
| As of March 31, 2022 | ||
| Stocks and Equity Futures* | 35.7% | |
| Bond Class | 48.4% | |
| Short-Term Class | 15.9% | |

* Includes investment in Fidelity® Commodity Strategy Central Fund of 0.9%
Asset allocations in the pie charts reflect the categorization of assets as defined in the Fund's prospectus in effect as of the time periods indicated above. Percentages are adjusted for the effect of future contracts and swap contracts, if applicable.
Geographic Diversification (% of fund's net assets)
| As of March 31, 2022 | ||
| United States of America | 83.9% | |
| Cayman Islands | 3.1% | |
| United Kingdom | 1.8% | |
| France | 1.1% | |
| Canada | 0.9% | |
| Switzerland | 0.9% | |
| Japan | 0.9% | |
| Netherlands | 0.9% | |
| Germany | 0.7% | |
| Other | 5.8% | |

Percentages are based on country or territory of incorporation and are adjusted for the effect of futures contracts, if applicable.
At period end, foreign investments including the Fund's pro-rata share of the underlying Central Funds, other than the Commodity Strategy Central and Money Market Funds, was 16.1% of net assets.
Percentages in the above tables are adjusted for the effect of TBA Sale Commitments.
An unaudited holdings listing for the Fund, which presents direct holdings as well as the pro-rata share of any securities and other investments held indirectly through its investment in underlying Fidelity Central Funds, other than the Commodity Strategy and Money Market Central Funds, is available at fidelity.com and/or institutional.fidelity.com, as applicable.
Fidelity Asset Manager® 30%
Schedule of Investments March 31, 2022 (Unaudited)
Showing Percentage of Net Assets
| Equity Central Funds - 36.1% | |||
| Shares | Value | ||
| Fidelity Commodity Strategy Central Fund (a)(b) | 3,584,110 | $22,113,959 | |
| Fidelity Emerging Markets Equity Central Fund (b) | 383,307 | 82,660,053 | |
| Fidelity International Equity Central Fund (b) | 1,645,927 | 156,988,527 | |
| Fidelity Real Estate Equity Central Fund (b) | 282,332 | 42,996,309 | |
| Fidelity U.S. Equity Central Fund (b) | 5,576,779 | 690,684,058 | |
| TOTAL EQUITY CENTRAL FUNDS | |||
| (Cost $711,233,950) | 995,442,906 | ||
| Fixed-Income Central Funds - 47.2% | |||
| High Yield Fixed-Income Funds - 4.6% | |||
| Fidelity Emerging Markets Debt Central Fund (b) | 757,419 | 6,279,006 | |
| Fidelity Emerging Markets Debt Local Currency Central Fund (b) | 66,130 | 5,840,564 | |
| Fidelity Floating Rate Central Fund (b) | 948,804 | 94,643,222 | |
| Fidelity High Income Central Fund (b) | 194,288 | 21,499,916 | |
| TOTAL HIGH YIELD FIXED-INCOME FUNDS | 128,262,708 | ||
| Investment Grade Fixed-Income Funds - 42.6% | |||
| Fidelity Inflation-Protected Bond Index Central Fund (b) | 392,267 | 40,886,010 | |
| Fidelity International Credit Central Fund (b) | 288,444 | 27,183,002 | |
| Fidelity Investment Grade Bond Central Fund (b) | 10,332,499 | 1,106,507,304 | |
| TOTAL INVESTMENT GRADE FIXED-INCOME FUNDS | 1,174,576,316 | ||
| TOTAL FIXED-INCOME CENTRAL FUNDS | |||
| (Cost $1,323,944,224) | 1,302,839,024 | ||
| Money Market Central Funds - 14.9% | |||
| Fidelity Cash Central Fund 0.31% (c) | 108,426,701 | 108,448,386 | |
| Fidelity Money Market Central Fund 0.45% (c) | 294,405,461 | 294,346,580 | |
| Fidelity Securities Lending Cash Central Fund 0.31% (c)(d) | 7,073,993 | 7,074,700 | |
| TOTAL MONEY MARKET CENTRAL FUNDS | |||
| (Cost $409,925,126) | 409,869,666 | ||
| Principal Amount | Value | ||
| U.S. Treasury Obligations - 0.3% | |||
| U.S. Treasury Bills, yield at date of purchase 0.17% to 0.5% 4/21/22 to 6/30/22 (e) | |||
| (Cost $7,413,904) | 7,420,000 | 7,413,891 | |
| Shares | Value | ||
| Investment Companies - 1.7% | |||
| iShares 20+ Year Treasury Bond ETF (f) | |||
| (Cost $54,319,385) | 360,948 | 47,674,011 | |
| TOTAL INVESTMENT IN SECURITIES - 100.2% | |||
| (Cost $2,506,836,589) | 2,763,239,498 | ||
| NET OTHER ASSETS (LIABILITIES) - (0.2)% | (5,375,195) | ||
| NET ASSETS - 100% | $2,757,864,303 |
| Futures Contracts | |||||
| Number of contracts | Expiration Date | Notional Amount | Value | Unrealized Appreciation/(Depreciation) | |
| Purchased | |||||
| Equity Index Contracts | |||||
| ICE E-mini MSCI Emerging Markets Index Contracts (United States) | 36 | June 2022 | $2,025,900 | $154,851 | $154,851 |
| TOTAL PURCHASED FUTURES | 154,851 | ||||
| Sold | |||||
| Equity Index Contracts | |||||
| CME Micro E-mini S&P 500 Index Contracts (United States) | 312 | June 2022 | 70,679,700 | (4,066,981) | (4,066,981) |
| ICE E-mini MSCI EAFE Index Contracts (United States) | 721 | June 2022 | 77,305,620 | (4,483,242) | (4,483,242) |
| TOTAL SOLD FUTURES | (8,550,223) | ||||
| TOTAL FUTURES CONTRACTS | $(8,395,372) |
The notional amount of futures purchased as a percentage of Net Assets is 0.1%
The notional amount of futures sold as a percentage of Net Assets is 5.4%
For the period, the average monthly notional amount at value for futures contracts in the aggregate was $175,982,913.
Security Type Abbreviations
ETF – Exchange-Traded Fund
Legend
(a) Non-income producing
(b) Affiliated fund that is generally available only to investment companies and other accounts managed by Fidelity Investments. A complete unaudited schedule of portfolio holdings for each Fidelity Central Fund is filed with the SEC for the first and third quarters of each fiscal year on Form N-PORT and is available upon request or at the SEC's website at www.sec.gov. An unaudited holdings listing for the Fund, which presents direct holdings as well as the pro-rata share of securities and other investments held indirectly through its investment in underlying non-money market Fidelity Central Funds, other than the Commodity Strategy Central Fund, is available at fidelity.com and/or institutional.fidelity.com, as applicable. In addition, each Fidelity Central Fund's financial statements are available on the SEC's website or upon request.
(c) Affiliated fund that is generally available only to investment companies and other accounts managed by Fidelity Investments. The rate quoted is the annualized seven-day yield of the fund at period end. A complete unaudited listing of the fund's holdings as of its most recent quarter end is available upon request. In addition, each Fidelity Central Fund's financial statements are available on the SEC's website or upon request.
(d) Investment made with cash collateral received from securities on loan.
(e) Security or a portion of the security was pledged to cover margin requirements for futures contracts. At period end, the value of securities pledged amounted to $7,413,891.
(f) Security or a portion of the security is on loan at period end.
Affiliated Central Funds
Fiscal year to date information regarding the Fund's investments in Fidelity Central Funds, including the ownership percentage, is presented below.
| Fund | Value, beginning of period | Purchases | Sales Proceeds | Dividend Income | Realized Gain (loss) | Change in Unrealized appreciation (depreciation) | Value, end of period | % ownership, end of period |
| Fidelity Cash Central Fund 0.31% | $196,597,498 | $141,602,728 | $229,751,840 | $53,050 | $-- | $-- | $108,448,386 | 0.2 |
| Fidelity Commodity Strategy Central Fund | 48,804,189 | 1,965,907 | 36,879,319 | -- | 3,214,168 | 5,009,014 | 22,113,959 | 3.8 |
| Fidelity Emerging Markets Debt Central Fund | 7,059,584 | 754,901 | 877,364 | 157,850 | (38,968) | (619,147) | 6,279,006 | 0.2 |
| Fidelity Emerging Markets Debt Local Currency Central Fund | 6,265,046 | 343,379 | -- | 343,379 | -- | (767,861) | 5,840,564 | 6.5 |
| Fidelity Emerging Markets Equity Central Fund | 99,679,753 | 9,557,416 | 3,354,919 | 8,311,519 | 4,068,615 | (27,290,812) | 82,660,053 | 4.6 |
| Fidelity Floating Rate Central Fund | 66,339,199 | 34,934,118 | 5,588,078 | 1,795,721 | 31,171 | (1,073,188) | 94,643,222 | 3 |
| Fidelity High Income Central Fund | 37,058,284 | 1,649,010 | 16,254,188 | 690,936 | 484,538 | (1,437,728) | 21,499,916 | 1 |
| Fidelity Inflation-Protected Bond Index Central Fund | 79,607,934 | 8,569,475 | 41,852,225 | 5,812,595 | 1,906,752 | (7,345,926) | 40,886,010 | 6.3 |
| Fidelity International Credit Central Fund | 36,888,078 | 2,040,350 | 9,098,873 | 597,916 | (529,879) | (2,116,674) | 27,183,002 | 5.3 |
| Fidelity International Equity Central Fund | 166,241,962 | 16,478,684 | 6,853,713 | 10,855,278 | (507,192) | (18,371,214) | 156,988,527 | 4.1 |
| Fidelity Investment Grade Bond Central Fund | 1,124,283,159 | 126,594,812 | 68,319,248 | 12,755,245 | (1,498,288) | (74,553,131) | 1,106,507,304 | 3.2 |
| Fidelity Money Market Central Fund 0.45% | 211,270,733 | 98,588,635 | 15,455,786 | 297,958 | (3,157) | (53,845) | 294,346,580 | 17.4 |
| Fidelity Real Estate Equity Central Fund | 42,196,369 | 15,506,284 | 17,232,003 | 556,652 | (576,613) | 3,102,272 | 42,996,309 | 2.6 |
| Fidelity Securities Lending Cash Central Fund 0.31% | 59,003,075 | 86,627,953 | 138,556,328 | 4,052 | -- | -- | 7,074,700 | -- |
| Fidelity U.S. Equity Central Fund | 686,091,383 | 92,663,479 | 38,444,307 | 59,634,731 | (2,773,992) | (46,852,505) | 690,684,058 | 3.2 |
| $2,867,386,246 | $637,877,131 | $628,518,191 | $101,866,882 | $3,777,155 | $(172,370,745) | $2,708,151,596 |
Amounts in the income column in the above table include any capital gain distributions from underlying funds, which are presented in the corresponding line-item in the Statement of Operations, if applicable. Amount for Fidelity Securities Lending Cash Central Fund represents the income earned on investing cash collateral, less rebates paid to borrowers and any lending agent fees associated with the loan, plus any premium payments received for lending certain types of securities.
Investment Valuation
The following is a summary of the inputs used, as of March 31, 2022, involving the Fund's assets and liabilities carried at fair value. The inputs or methodology used for valuing securities may not be an indication of the risk associated with investing in those securities. For more information on valuation inputs, and their aggregation into the levels used below, please refer to the Investment Valuation section in the accompanying Notes to Financial Statements.
| Valuation Inputs at Reporting Date: | ||||
| Description | Total | Level 1 | Level 2 | Level 3 |
| Investments in Securities: | ||||
| Equity Central Funds | $995,442,906 | $995,442,906 | $-- | $-- |
| Fixed-Income Central Funds | 1,302,839,024 | 1,302,839,024 | -- | -- |
| Money Market Central Funds | 409,869,666 | 409,869,666 | -- | -- |
| U.S. Treasury Obligations | 7,413,891 | -- | 7,413,891 | -- |
| Investment Companies | 47,674,011 | 47,674,011 | -- | -- |
| Total Investments in Securities: | $2,763,239,498 | $2,755,825,607 | $7,413,891 | $-- |
| Derivative Instruments: | ||||
| Assets | ||||
| Futures Contracts | $154,851 | $154,851 | $-- | $-- |
| Total Assets | $154,851 | $154,851 | $-- | $-- |
| Liabilities | ||||
| Futures Contracts | $(8,550,223) | $(8,550,223) | $-- | $-- |
| Total Liabilities | $(8,550,223) | $(8,550,223) | $-- | $-- |
| Total Derivative Instruments: | $(8,395,372) | $(8,395,372) | $-- | $-- |
Value of Derivative Instruments
The following table is a summary of the Fund's value of derivative instruments by primary risk exposure as of March 31, 2022. For additional information on derivative instruments, please refer to the Derivative Instruments section in the accompanying Notes to Financial Statements.
| Primary Risk Exposure / Derivative Type | Value | |
| Asset | Liability | |
| Equity Risk | ||
| Futures Contracts(a) | $154,851 | $(8,550,223) |
| Total Equity Risk | 154,851 | (8,550,223) |
| Total Value of Derivatives | $154,851 | $(8,550,223) |
(a) Reflects gross cumulative appreciation (depreciation) on futures contracts as presented in the Schedule of Investments. In the Statement of Assets and Liabilities, the period end daily variation margin is included in receivable or payable for daily variation margin on futures contracts, and the net cumulative appreciation (depreciation) is included in Total accumulated earnings (loss).
See accompanying notes which are an integral part of the financial statements.
Fidelity Asset Manager® 30%
Financial Statements
Statement of Assets and Liabilities
| March 31, 2022 (Unaudited) | ||
| Assets | ||
| Investment in securities, at value (including securities loaned of $6,947,408) — See accompanying schedule: Unaffiliated issuers (cost $61,733,289) | $55,087,902 | |
| Fidelity Central Funds (cost $2,445,103,300) | 2,708,151,596 | |
| Total Investment in Securities (cost $2,506,836,589) | $2,763,239,498 | |
| Receivable for investments sold | 2,121,269 | |
| Receivable for fund shares sold | 542,516 | |
| Distributions receivable from Fidelity Central Funds | 21,939 | |
| Receivable for daily variation margin on futures contracts | 2,309,760 | |
| Prepaid expenses | 1,348 | |
| Total assets | 2,768,236,330 | |
| Liabilities | ||
| Payable for investments purchased | $4,194 | |
| Payable for fund shares redeemed | 2,017,898 | |
| Accrued management fee | 914,544 | |
| Distribution and service plan fees payable | 53,219 | |
| Other affiliated payables | 255,723 | |
| Other payables and accrued expenses | 51,749 | |
| Collateral on securities loaned | 7,074,700 | |
| Total liabilities | 10,372,027 | |
| Net Assets | $2,757,864,303 | |
| Net Assets consist of: | ||
| Paid in capital | $2,494,535,917 | |
| Total accumulated earnings (loss) | 263,328,386 | |
| Net Assets | $2,757,864,303 | |
| Net Asset Value and Maximum Offering Price | ||
| Class A: | ||
| Net Asset Value and redemption price per share ($81,955,794 ÷ 6,676,575 shares)(a) | $12.28 | |
| Maximum offering price per share (100/94.25 of $12.28) | $13.03 | |
| Class M: | ||
| Net Asset Value and redemption price per share ($26,642,318 ÷ 2,175,502 shares)(a) | $12.25 | |
| Maximum offering price per share (100/96.50 of $12.25) | $12.69 | |
| Class C: | ||
| Net Asset Value and offering price per share ($30,416,831 ÷ 2,507,561 shares)(a) | $12.13 | |
| Asset Manager 30%: | ||
| Net Asset Value, offering price and redemption price per share ($2,050,926,587 ÷ 167,163,078 shares) | $12.27 | |
| Class I: | ||
| Net Asset Value, offering price and redemption price per share ($71,175,158 ÷ 5,802,193 shares) | $12.27 | |
| Class Z: | ||
| Net Asset Value, offering price and redemption price per share ($496,747,615 ÷ 40,494,855 shares) | $12.27 |
(a) Redemption price per share is equal to net asset value less any applicable contingent deferred sales charge.
See accompanying notes which are an integral part of the financial statements.
Statement of Operations
| Six months ended March 31, 2022 (Unaudited) | ||
| Investment Income | ||
| Dividends | $467,529 | |
| Interest | 2,787 | |
| Income from Fidelity Central Funds (including $4,052 from security lending) | 28,447,518 | |
| Total income | 28,917,834 | |
| Expenses | ||
| Management fee | $5,748,653 | |
| Transfer agent fees | 1,104,731 | |
| Distribution and service plan fees | 333,841 | |
| Accounting fees | 464,819 | |
| Custodian fees and expenses | 18,211 | |
| Independent trustees' fees and expenses | 4,881 | |
| Registration fees | 85,140 | |
| Audit | 16,579 | |
| Legal | 3,264 | |
| Miscellaneous | 6,416 | |
| Total expenses before reductions | 7,786,535 | |
| Expense reductions | (24,187) | |
| Total expenses after reductions | 7,762,348 | |
| Net investment income (loss) | 21,155,486 | |
| Realized and Unrealized Gain (Loss) | ||
| Net realized gain (loss) on: | ||
| Investment securities: | ||
| Unaffiliated issuers | (1,279,577) | |
| Fidelity Central Funds | 3,777,155 | |
| Futures contracts | 19,107,747 | |
| Capital gain distributions from Fidelity Central Funds | 73,419,364 | |
| Total net realized gain (loss) | 95,024,689 | |
| Change in net unrealized appreciation (depreciation) on: | ||
| Investment securities: | ||
| Unaffiliated issuers | (3,433,395) | |
| Fidelity Central Funds | (172,370,745) | |
| Futures contracts | (16,736,303) | |
| Total change in net unrealized appreciation (depreciation) | (192,540,443) | |
| Net gain (loss) | (97,515,754) | |
| Net increase (decrease) in net assets resulting from operations | $(76,360,268) |
See accompanying notes which are an integral part of the financial statements.
Statement of Changes in Net Assets
| Six months ended March 31, 2022 (Unaudited) | Year ended September 30, 2021 | |
| Increase (Decrease) in Net Assets | ||
| Operations | ||
| Net investment income (loss) | $21,155,486 | $34,840,431 |
| Net realized gain (loss) | 95,024,689 | 8,098,367 |
| Change in net unrealized appreciation (depreciation) | (192,540,443) | 187,987,524 |
| Net increase (decrease) in net assets resulting from operations | (76,360,268) | 230,926,322 |
| Distributions to shareholders | (40,662,108) | (45,916,472) |
| Share transactions - net increase (decrease) | (7,599,046) | 634,239,450 |
| Total increase (decrease) in net assets | (124,621,422) | 819,249,300 |
| Net Assets | ||
| Beginning of period | 2,882,485,725 | 2,063,236,425 |
| End of period | $2,757,864,303 | $2,882,485,725 |
See accompanying notes which are an integral part of the financial statements.
Financial Highlights
Fidelity Asset Manager 30% Class A
| Six months ended (Unaudited) March 31, | Years endedSeptember 30, | |||||
| 2022 | 2021 | 2020 | 2019 | 2018 | 2017 | |
| Selected Per–Share Data | ||||||
| Net asset value, beginning of period | $12.77 | $11.80 | $11.24 | $11.15 | $11.11 | $10.62 |
| Income from Investment Operations | ||||||
| Net investment income (loss)A,B | .07 | .14 | .16 | .21 | .16 | .13 |
| Net realized and unrealized gain (loss) | (.40) | 1.03 | .71 | .27 | .21 | .51 |
| Total from investment operations | (.33) | 1.17 | .87 | .48 | .37 | .64 |
| Distributions from net investment income | (.11) | (.09) | (.17) | (.21) | (.15) | (.13) |
| Distributions from net realized gain | (.04) | (.11) | (.14) | (.18) | (.18) | (.02) |
| Total distributions | (.16)C | (.20) | (.31) | (.39) | (.33) | (.15) |
| Net asset value, end of period | $12.28 | $12.77 | $11.80 | $11.24 | $11.15 | $11.11 |
| Total ReturnD,E,F | (2.65)% | 9.98% | 7.83% | 4.54% | 3.40% | 6.06% |
| Ratios to Average Net AssetsB,G,H | ||||||
| Expenses before reductions | .82%I | .82% | .82% | .82% | .84% | .85% |
| Expenses net of fee waivers, if any | .82%I | .82% | .82% | .82% | .84% | .85% |
| Expenses net of all reductions | .82%I | .82% | .82% | .82% | .84% | .85% |
| Net investment income (loss) | 1.18%I | 1.10% | 1.43% | 1.91% | 1.47% | 1.24% |
| Supplemental Data | ||||||
| Net assets, end of period (000 omitted) | $81,956 | $77,502 | $50,625 | $36,978 | $28,713 | $22,457 |
| Portfolio turnover rateJ | 20%I | 18% | 23% | 34% | 18% | 24% |
A Calculated based on average shares outstanding during the period.
B Net investment income (loss) is affected by the timing of the declaration of dividends by any underlying mutual funds or exchange-traded funds (ETFs). Net investment income (loss) of any such underlying funds is not included in the Fund's net investment income (loss) ratio.
C Total distributions per share do not sum due to rounding.
D Total returns for periods of less than one year are not annualized.
E Total returns would have been lower if certain expenses had not been reduced during the applicable periods shown.
F Total returns do not include the effect of the sales charges.
G Fees and expenses of any underlying mutual funds or exchange-traded funds (ETFs) are not included in the Fund's expense ratio. The Fund indirectly bears its proportionate share of these expenses. For additional expense information related to investments in Fidelity Central Funds, please refer to the "Investments in Fidelity Central Funds" note found in the Notes to Financial Statements section of the most recent Annual or Semi-Annual report.
H Expense ratios reflect operating expenses of the class. Expenses before reductions do not reflect amounts reimbursed, waived, or reduced through arrangements with the investment adviser, brokerage services, or other offset arrangements, if applicable, and do not represent the amount paid by the class during periods when reimbursements, waivers or reductions occur.
I Annualized
J Amount does not include the portfolio activity of any underlying mutual funds or exchange-traded funds (ETFs).
See accompanying notes which are an integral part of the financial statements.
Fidelity Asset Manager 30% Class M
| Six months ended (Unaudited) March 31, | Years endedSeptember 30, | |||||
| 2022 | 2021 | 2020 | 2019 | 2018 | 2017 | |
| Selected Per–Share Data | ||||||
| Net asset value, beginning of period | $12.75 | $11.77 | $11.22 | $11.13 | $11.10 | $10.61 |
| Income from Investment Operations | ||||||
| Net investment income (loss)A,B | .06 | .11 | .13 | .18 | .13 | .11 |
| Net realized and unrealized gain (loss) | (.42) | 1.04 | .70 | .27 | .21 | .50 |
| Total from investment operations | (.36) | 1.15 | .83 | .45 | .34 | .61 |
| Distributions from net investment income | (.10) | (.07) | (.14) | (.18) | (.13) | (.10) |
| Distributions from net realized gain | (.04) | (.11) | (.14) | (.18) | (.18) | (.02) |
| Total distributions | (.14) | (.17)C | (.28) | (.36) | (.31) | (.12) |
| Net asset value, end of period | $12.25 | $12.75 | $11.77 | $11.22 | $11.13 | $11.10 |
| Total ReturnD,E,F | (2.84)% | 9.84% | 7.49% | 4.28% | 3.08% | 5.81% |
| Ratios to Average Net AssetsB,G,H | ||||||
| Expenses before reductions | 1.07%I | 1.08% | 1.08% | 1.09% | 1.10% | 1.11% |
| Expenses net of fee waivers, if any | 1.07%I | 1.08% | 1.08% | 1.09% | 1.09% | 1.11% |
| Expenses net of all reductions | 1.07%I | 1.08% | 1.08% | 1.09% | 1.09% | 1.11% |
| Net investment income (loss) | .92%I | .84% | 1.17% | 1.64% | 1.21% | .98% |
| Supplemental Data | ||||||
| Net assets, end of period (000 omitted) | $26,642 | $26,218 | $20,329 | $16,252 | $14,473 | $13,023 |
| Portfolio turnover rateJ | 20%I | 18% | 23% | 34% | 18% | 24% |
A Calculated based on average shares outstanding during the period.
B Net investment income (loss) is affected by the timing of the declaration of dividends by any underlying mutual funds or exchange-traded funds (ETFs). Net investment income (loss) of any such underlying funds is not included in the Fund's net investment income (loss) ratio.
C Total distributions per share do not sum due to rounding.
D Total returns for periods of less than one year are not annualized.
E Total returns would have been lower if certain expenses had not been reduced during the applicable periods shown.
F Total returns do not include the effect of the sales charges.
G Fees and expenses of any underlying mutual funds or exchange-traded funds (ETFs) are not included in the Fund's expense ratio. The Fund indirectly bears its proportionate share of these expenses. For additional expense information related to investments in Fidelity Central Funds, please refer to the "Investments in Fidelity Central Funds" note found in the Notes to Financial Statements section of the most recent Annual or Semi-Annual report.
H Expense ratios reflect operating expenses of the class. Expenses before reductions do not reflect amounts reimbursed, waived, or reduced through arrangements with the investment adviser, brokerage services, or other offset arrangements, if applicable, and do not represent the amount paid by the class during periods when reimbursements, waivers or reductions occur.
I Annualized
J Amount does not include the portfolio activity of any underlying mutual funds or exchange-traded funds (ETFs).
See accompanying notes which are an integral part of the financial statements.
Fidelity Asset Manager 30% Class C
| Six months ended (Unaudited) March 31, | Years endedSeptember 30, | |||||
| 2022 | 2021 | 2020 | 2019 | 2018 | 2017 | |
| Selected Per–Share Data | ||||||
| Net asset value, beginning of period | $12.64 | $11.71 | $11.16 | $11.07 | $11.04 | $10.57 |
| Income from Investment Operations | ||||||
| Net investment income (loss)A,B | .03 | .04 | .07 | .12 | .08 | .05 |
| Net realized and unrealized gain (loss) | (.41) | 1.03 | .70 | .28 | .20 | .49 |
| Total from investment operations | (.38) | 1.07 | .77 | .40 | .28 | .54 |
| Distributions from net investment income | (.08) | (.03) | (.08) | (.12) | (.07) | (.05) |
| Distributions from net realized gain | (.04) | (.11) | (.14) | (.18) | (.18) | (.02) |
| Total distributions | (.13)C | (.14) | (.22) | (.31)C | (.25) | (.07) |
| Net asset value, end of period | $12.13 | $12.64 | $11.71 | $11.16 | $11.07 | $11.04 |
| Total ReturnD,E,F | (3.07)% | 9.17% | 7.00% | 3.77% | 2.59% | 5.16% |
| Ratios to Average Net AssetsB,G,H | ||||||
| Expenses before reductions | 1.58%I | 1.59% | 1.59% | 1.60% | 1.61% | 1.61% |
| Expenses net of fee waivers, if any | 1.58%I | 1.59% | 1.59% | 1.60% | 1.61% | 1.61% |
| Expenses net of all reductions | 1.58%I | 1.59% | 1.59% | 1.60% | 1.61% | 1.61% |
| Net investment income (loss) | .41%I | .33% | .66% | 1.13% | .70% | .47% |
| Supplemental Data | ||||||
| Net assets, end of period (000 omitted) | $30,417 | $31,949 | $27,496 | $24,224 | $24,911 | $20,979 |
| Portfolio turnover rateJ | 20%I | 18% | 23% | 34% | 18% | 24% |
A Calculated based on average shares outstanding during the period.
B Net investment income (loss) is affected by the timing of the declaration of dividends by any underlying mutual funds or exchange-traded funds (ETFs). Net investment income (loss) of any such underlying funds is not included in the Fund's net investment income (loss) ratio.
C Total distributions per share do not sum due to rounding.
D Total returns for periods of less than one year are not annualized.
E Total returns would have been lower if certain expenses had not been reduced during the applicable periods shown.
F Total returns do not include the effect of the contingent deferred sales charge.
G Fees and expenses of any underlying mutual funds or exchange-traded funds (ETFs) are not included in the Fund's expense ratio. The Fund indirectly bears its proportionate share of these expenses. For additional expense information related to investments in Fidelity Central Funds, please refer to the "Investments in Fidelity Central Funds" note found in the Notes to Financial Statements section of the most recent Annual or Semi-Annual report.
H Expense ratios reflect operating expenses of the class. Expenses before reductions do not reflect amounts reimbursed, waived, or reduced through arrangements with the investment adviser, brokerage services, or other offset arrangements, if applicable, and do not represent the amount paid by the class during periods when reimbursements, waivers or reductions occur.
I Annualized
J Amount does not include the portfolio activity of any underlying mutual funds or exchange-traded funds (ETFs).
See accompanying notes which are an integral part of the financial statements.
Fidelity Asset Manager 30%
| Six months ended (Unaudited) March 31, | Years endedSeptember 30, | |||||
| 2022 | 2021 | 2020 | 2019 | 2018 | 2017 | |
| Selected Per–Share Data | ||||||
| Net asset value, beginning of period | $12.77 | $11.79 | $11.24 | $11.15 | $11.11 | $10.63 |
| Income from Investment Operations | ||||||
| Net investment income (loss)A,B | .09 | .18 | .20 | .24 | .20 | .17 |
| Net realized and unrealized gain (loss) | (.41) | 1.04 | .69 | .27 | .21 | .49 |
| Total from investment operations | (.32) | 1.22 | .89 | .51 | .41 | .66 |
| Distributions from net investment income | (.13) | (.14) | (.20) | (.24) | (.19) | (.16) |
| Distributions from net realized gain | (.04) | (.11) | (.14) | (.18) | (.18) | (.02) |
| Total distributions | (.18)C | (.24)C | (.34) | (.42) | (.37) | (.18) |
| Net asset value, end of period | $12.27 | $12.77 | $11.79 | $11.24 | $11.15 | $11.11 |
| Total ReturnD,E | (2.58)% | 10.43% | 8.05% | 4.87% | 3.75% | 6.32% |
| Ratios to Average Net AssetsB,F,G | ||||||
| Expenses before reductions | .52%H | .52% | .52% | .53% | .53% | .54% |
| Expenses net of fee waivers, if any | .51%H | .52% | .52% | .52% | .53% | .54% |
| Expenses net of all reductions | .51%H | .52% | .52% | .52% | .53% | .53% |
| Net investment income (loss) | 1.48%H | 1.40% | 1.74% | 2.21% | 1.78% | 1.55% |
| Supplemental Data | ||||||
| Net assets, end of period (000 omitted) | $2,050,927 | $2,196,582 | $1,935,863 | $1,661,192 | $1,480,983 | $1,139,197 |
| Portfolio turnover rateI | 20%H | 18% | 23% | 34% | 18% | 24% |
A Calculated based on average shares outstanding during the period.
B Net investment income (loss) is affected by the timing of the declaration of dividends by any underlying mutual funds or exchange-traded funds (ETFs). Net investment income (loss) of any such underlying funds is not included in the Fund's net investment income (loss) ratio.
C Total distributions per share do not sum due to rounding.
D Total returns for periods of less than one year are not annualized.
E Total returns would have been lower if certain expenses had not been reduced during the applicable periods shown.
F Fees and expenses of any underlying mutual funds or exchange-traded funds (ETFs) are not included in the Fund's expense ratio. The Fund indirectly bears its proportionate share of these expenses. For additional expense information related to investments in Fidelity Central Funds, please refer to the "Investments in Fidelity Central Funds" note found in the Notes to Financial Statements section of the most recent Annual or Semi-Annual report.
G Expense ratios reflect operating expenses of the class. Expenses before reductions do not reflect amounts reimbursed, waived, or reduced through arrangements with the investment adviser, brokerage services, or other offset arrangements, if applicable, and do not represent the amount paid by the class during periods when reimbursements, waivers or reductions occur.
H Annualized
I Amount does not include the portfolio activity of any underlying mutual funds or exchange-traded funds (ETFs).
See accompanying notes which are an integral part of the financial statements.
Fidelity Asset Manager 30% Class I
| Six months ended (Unaudited) March 31, | Years endedSeptember 30, | |||||
| 2022 | 2021 | 2020 | 2019 | 2018 | 2017 | |
| Selected Per–Share Data | ||||||
| Net asset value, beginning of period | $12.77 | $11.79 | $11.24 | $11.15 | $11.11 | $10.62 |
| Income from Investment Operations | ||||||
| Net investment income (loss)A,B | .09 | .17 | .19 | .23 | .19 | .16 |
| Net realized and unrealized gain (loss) | (.41) | 1.05 | .69 | .28 | .21 | .50 |
| Total from investment operations | (.32) | 1.22 | .88 | .51 | .40 | .66 |
| Distributions from net investment income | (.13) | (.13) | (.19) | (.23) | (.18) | (.15) |
| Distributions from net realized gain | (.04) | (.11) | (.14) | (.18) | (.18) | (.02) |
| Total distributions | (.18)C | (.24) | (.33) | (.42)C | (.36) | (.17) |
| Net asset value, end of period | $12.27 | $12.77 | $11.79 | $11.24 | $11.15 | $11.11 |
| Total ReturnD,E | (2.60)% | 10.41% | 8.00% | 4.80% | 3.66% | 6.32% |
| Ratios to Average Net AssetsB,F,G | ||||||
| Expenses before reductions | .54%H | .55% | .59% | .59% | .61% | .62% |
| Expenses net of fee waivers, if any | .54%H | .54% | .59% | .59% | .61% | .62% |
| Expenses net of all reductions | .54%H | .54% | .59% | .59% | .61% | .62% |
| Net investment income (loss) | 1.45%H | 1.37% | 1.67% | 2.14% | 1.70% | 1.46% |
| Supplemental Data | ||||||
| Net assets, end of period (000 omitted) | $71,175 | $76,079 | $19,225 | $19,014 | $23,818 | $20,500 |
| Portfolio turnover rateI | 20%H | 18% | 23% | 34% | 18% | 24% |
A Calculated based on average shares outstanding during the period.
B Net investment income (loss) is affected by the timing of the declaration of dividends by any underlying mutual funds or exchange-traded funds (ETFs). Net investment income (loss) of any such underlying funds is not included in the Fund's net investment income (loss) ratio.
C Total distributions per share do not sum due to rounding.
D Total returns for periods of less than one year are not annualized.
E Total returns would have been lower if certain expenses had not been reduced during the applicable periods shown.
F Fees and expenses of any underlying mutual funds or exchange-traded funds (ETFs) are not included in the Fund's expense ratio. The Fund indirectly bears its proportionate share of these expenses. For additional expense information related to investments in Fidelity Central Funds, please refer to the "Investments in Fidelity Central Funds" note found in the Notes to Financial Statements section of the most recent Annual or Semi-Annual report.
G Expense ratios reflect operating expenses of the class. Expenses before reductions do not reflect amounts reimbursed, waived, or reduced through arrangements with the investment adviser, brokerage services, or other offset arrangements, if applicable, and do not represent the amount paid by the class during periods when reimbursements, waivers or reductions occur.
H Annualized
I Amount does not include the portfolio activity of any underlying mutual funds or exchange-traded funds (ETFs).
See accompanying notes which are an integral part of the financial statements.
Fidelity Asset Manager 30% Class Z
| Six months ended (Unaudited) March 31, | Years endedSeptember 30, | |||
| 2022 | 2021 | 2020 | 2019 A | |
| Selected Per–Share Data | ||||
| Net asset value, beginning of period | $12.77 | $11.79 | $11.24 | $11.14 |
| Income from Investment Operations | ||||
| Net investment income (loss)B,C | .10 | .18 | .20 | .24 |
| Net realized and unrealized gain (loss) | (.42) | 1.04 | .69 | .29 |
| Total from investment operations | (.32) | 1.22 | .89 | .53 |
| Distributions from net investment income | (.14) | (.14) | (.20) | (.25) |
| Distributions from net realized gain | (.04) | (.11) | (.14) | (.18) |
| Total distributions | (.18) | (.24)D | (.34) | (.43) |
| Net asset value, end of period | $12.27 | $12.77 | $11.79 | $11.24 |
| Total ReturnE,F | (2.56)% | 10.44% | 8.10% | 5.01% |
| Ratios to Average Net AssetsC,G,H | ||||
| Expenses before reductions | .49%I | .49% | .50% | .50%I |
| Expenses net of fee waivers, if any | .49%I | .49% | .49% | .50%I |
| Expenses net of all reductions | .49%I | .49% | .49% | .50%I |
| Net investment income (loss) | 1.51%I | 1.43% | 1.76% | 2.23%I |
| Supplemental Data | ||||
| Net assets, end of period (000 omitted) | $496,748 | $474,155 | $9,698 | $7,353 |
| Portfolio turnover rateJ | 20%I | 18% | 23% | 34% |
A For the period October 2, 2018 (commencement of sale of shares) through September 30, 2019.
B Calculated based on average shares outstanding during the period.
C Net investment income (loss) is affected by the timing of the declaration of dividends by any underlying mutual funds or exchange-traded funds (ETFs). Net investment income (loss) of any such underlying funds is not included in the Fund's net investment income (loss) ratio.
D Total distributions per share do not sum due to rounding.
E Total returns for periods of less than one year are not annualized.
F Total returns would have been lower if certain expenses had not been reduced during the applicable periods shown.
G Fees and expenses of any underlying mutual funds or exchange-traded funds (ETFs) are not included in the Fund's expense ratio. The Fund indirectly bears its proportionate share of these expenses. For additional expense information related to investments in Fidelity Central Funds, please refer to the "Investments in Fidelity Central Funds" note found in the Notes to Financial Statements section of the most recent Annual or Semi-Annual report.
H Expense ratios reflect operating expenses of the class. Expenses before reductions do not reflect amounts reimbursed, waived, or reduced through arrangements with the investment adviser, brokerage services, or other offset arrangements, if applicable, and do not represent the amount paid by the class during periods when reimbursements, waivers or reductions occur.
I Annualized
J Amount does not include the portfolio activity of any underlying mutual funds or exchange-traded funds (ETFs).
See accompanying notes which are an integral part of the financial statements.
Fidelity Asset Manager® 40%
Investment Summary (Unaudited)
The information in the following tables is based on the combined investments of the Fund and its pro-rata share of the investments of Fidelity's Central Funds, other than the Commodity Strategy and Money Market Central Funds.Top Five Bond Issuers as of March 31, 2022
| (with maturities greater than one year) | % of fund's net assets |
| U.S. Treasury Obligations | 13.5 |
| Freddie Mac | 2.5 |
| Fannie Mae | 2.1 |
| Ginnie Mae | 1.4 |
| Uniform Mortgage Backed Securities | 1.4 |
| 20.9 |
Quality Diversification (% of fund's net assets)
| As of March 31, 2022 | ||
| U.S. Government and U.S. Government Agency Obligations | 21.7% | |
| AAA,AA,A | 6.0% | |
| BBB | 8.4% | |
| BB and Below | 5.6% | |
| Not Rated | 1.5% | |
| Equities* | 47.4% | |
| Short-Term Investments and Net Other Assets | 9.4% | |
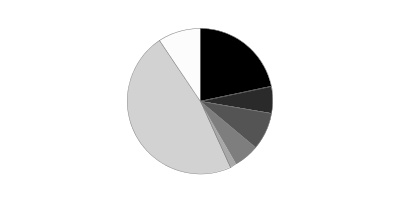
* Includes investment in Fidelity® Commodity Strategy Central Fund of 1.0%
We have used ratings from Moody's Investors Service, Inc. Where Moody's® ratings are not available, we have used S&P® ratings. All ratings are as of the date indicated and do not reflect subsequent changes.
Top Ten Stocks as of March 31, 2022
| % of fund's net assets | |
| Apple, Inc. | 2.2 |
| Microsoft Corp. | 2.1 |
| Alphabet, Inc. Class A | 1.5 |
| Amazon.com, Inc. | 1.1 |
| Meta Platforms, Inc. Class A | 0.5 |
| UnitedHealth Group, Inc. | 0.5 |
| Tesla, Inc. | 0.5 |
| Exxon Mobil Corp. | 0.4 |
| Wells Fargo & Co. | 0.4 |
| Taiwan Semiconductor Manufacturing Co. Ltd. | 0.3 |
| 9.5 |
Market Sectors as of March 31, 2022
| % of fund's net assets | |
| Financials | 18.8 |
| Information Technology | 11.6 |
| Consumer Discretionary | 6.4 |
| Health Care | 6.3 |
| Industrials | 5.6 |
| Communication Services | 4.8 |
| Real Estate | 3.7 |
| Consumer Staples | 3.4 |
| Energy | 3.0 |
| Materials | 2.0 |
| Utilities | 1.9 |
Asset Allocation (% of fund's net assets)
| As of March 31, 2022 | ||
| Stocks and Equity Futures* | 45.9% | |
| Bond Class | 43.2% | |
| Short-Term Class | 10.9% | |

* Includes investment in Fidelity® Commodity Strategy Central Fund of 1.0%
Asset allocations in the pie charts reflect the categorization of assets as defined in the Fund's prospectus in effect as of the time periods indicated above. Percentages are adjusted for the effect of future contracts and swap contracts, if applicable.
Geographic Diversification (% of fund's net assets)
| As of March 31, 2022 | ||
| United States of America | 81.7% | |
| Cayman Islands | 2.9% | |
| United Kingdom | 2.0% | |
| France | 1.4% | |
| Canada | 1.1% | |
| Japan | 1.1% | |
| Switzerland | 1.1% | |
| Netherlands | 1.1% | |
| Germany | 1.0% | |
| Other | 6.6% | |

Percentages are based on country or territory of incorporation and are adjusted for the effect of futures contracts, if applicable.
At period end, foreign investments including the Fund's pro-rata share of the underlying Central Funds, other than the Commodity Strategy Central and Money Market Funds, was 18.3% of net assets.
Percentages in the above tables are adjusted for the effect of TBA Sale Commitments.
An unaudited holdings listing for the Fund, which presents direct holdings as well as the pro-rata share of any securities and other investments held indirectly through its investment in underlying Fidelity Central Funds, other than the Commodity Strategy and Money Market Central Funds, is available at fidelity.com and/or institutional.fidelity.com, as applicable.
Fidelity Asset Manager® 40%
Schedule of Investments March 31, 2022 (Unaudited)
Showing Percentage of Net Assets
| Equity Central Funds - 46.2% | |||
| Shares | Value | ||
| Fidelity Commodity Strategy Central Fund (a)(b) | 4,368,579 | $26,954,130 | |
| Fidelity Emerging Markets Equity Central Fund (b) | 439,306 | 94,736,248 | |
| Fidelity International Equity Central Fund (b) | 2,068,259 | 197,270,507 | |
| Fidelity Real Estate Equity Central Fund (b) | 265,484 | 40,430,540 | |
| Fidelity U.S. Equity Central Fund (b) | 6,765,210 | 837,871,230 | |
| TOTAL EQUITY CENTRAL FUNDS | |||
| (Cost $809,509,977) | 1,197,262,655 | ||
| Fixed-Income Central Funds - 42.0% | |||
| High Yield Fixed-Income Funds - 4.9% | |||
| Fidelity Emerging Markets Debt Central Fund (b) | 770,274 | 6,385,568 | |
| Fidelity Emerging Markets Debt Local Currency Central Fund (b) | 61,674 | 5,447,032 | |
| Fidelity Floating Rate Central Fund (b) | 959,775 | 95,737,589 | |
| Fidelity High Income Central Fund (b) | 182,557 | 20,201,735 | |
| TOTAL HIGH YIELD FIXED-INCOME FUNDS | 127,771,924 | ||
| Investment Grade Fixed-Income Funds - 37.1% | |||
| Fidelity Inflation-Protected Bond Index Central Fund (b) | 367,448 | 38,299,074 | |
| Fidelity International Credit Central Fund (b) | 263,259 | 24,809,561 | |
| Fidelity Investment Grade Bond Central Fund (b) | 8,378,949 | 897,301,637 | |
| TOTAL INVESTMENT GRADE FIXED-INCOME FUNDS | 960,410,272 | ||
| TOTAL FIXED-INCOME CENTRAL FUNDS | |||
| (Cost $1,098,997,011) | 1,088,182,196 | ||
| Money Market Central Funds - 10.4% | |||
| Fidelity Cash Central Fund 0.31% (c) | 114,930,624 | 114,953,610 | |
| Fidelity Money Market Central Fund 0.45% (c) | 137,327,932 | 137,300,467 | |
| Fidelity Securities Lending Cash Central Fund 0.31% (c)(d) | 18,518,798 | 18,520,650 | |
| TOTAL MONEY MARKET CENTRAL FUNDS | |||
| (Cost $270,798,660) | 270,774,727 | ||
| Principal Amount | Value | ||
| U.S. Treasury Obligations - 0.3% | |||
| U.S. Treasury Bills, yield at date of purchase 0.38% to 0.5% 6/9/22 to 6/30/22 (e) | |||
| (Cost $6,774,405) | 6,780,000 | 6,774,399 | |
| Shares | Value | ||
| Investment Companies - 1.7% | |||
| iShares 20+ Year Treasury Bond ETF (f) | |||
| (Cost $50,285,013) | 336,495 | 44,444,260 | |
| TOTAL INVESTMENT IN SECURITIES - 100.6% | |||
| (Cost $2,236,365,066) | 2,607,438,237 | ||
| NET OTHER ASSETS (LIABILITIES) - (0.6)% | (16,826,349) | ||
| NET ASSETS - 100% | $2,590,611,888 |
| Futures Contracts | |||||
| Number of contracts | Expiration Date | Notional Amount | Value | Unrealized Appreciation/(Depreciation) | |
| Purchased | |||||
| Equity Index Contracts | |||||
| ICE E-mini MSCI Emerging Markets Index Contracts (United States) | 131 | June 2022 | $7,372,025 | $562,411 | $562,411 |
| TOTAL PURCHASED FUTURES | 562,411 | ||||
| Sold | |||||
| Equity Index Contracts | |||||
| CME Micro E-mini S&P 500 Index Contracts (United States) | 313 | June 2022 | 70,906,238 | (4,144,748) | (4,144,748) |
| ICE E-mini MSCI EAFE Index Contracts (United States) | 640 | June 2022 | 68,620,800 | (3,979,577) | (3,979,577) |
| TOTAL SOLD FUTURES | (8,124,325) | ||||
| TOTAL FUTURES CONTRACTS | $(7,561,914) |
The notional amount of futures purchased as a percentage of Net Assets is 0.3%
The notional amount of futures sold as a percentage of Net Assets is 5.4%
For the period, the average monthly notional amount at value for futures contracts in the aggregate was $157,866,782.
Security Type Abbreviations
ETF – Exchange-Traded Fund
Legend
(a) Non-income producing
(b) Affiliated fund that is generally available only to investment companies and other accounts managed by Fidelity Investments. A complete unaudited schedule of portfolio holdings for each Fidelity Central Fund is filed with the SEC for the first and third quarters of each fiscal year on Form N-PORT and is available upon request or at the SEC's website at www.sec.gov. An unaudited holdings listing for the Fund, which presents direct holdings as well as the pro-rata share of securities and other investments held indirectly through its investment in underlying non-money market Fidelity Central Funds, other than the Commodity Strategy Central Fund, is available at fidelity.com and/or institutional.fidelity.com, as applicable. In addition, each Fidelity Central Fund's financial statements are available on the SEC's website or upon request.
(c) Affiliated fund that is generally available only to investment companies and other accounts managed by Fidelity Investments. The rate quoted is the annualized seven-day yield of the fund at period end. A complete unaudited listing of the fund's holdings as of its most recent quarter end is available upon request. In addition, each Fidelity Central Fund's financial statements are available on the SEC's website or upon request.
(d) Investment made with cash collateral received from securities on loan.
(e) Security or a portion of the security was pledged to cover margin requirements for futures contracts. At period end, the value of securities pledged amounted to $6,774,399.
(f) Security or a portion of the security is on loan at period end.
Affiliated Central Funds
Fiscal year to date information regarding the Fund's investments in Fidelity Central Funds, including the ownership percentage, is presented below.
| Fund | Value, beginning of period | Purchases | Sales Proceeds | Dividend Income | Realized Gain (loss) | Change in Unrealized appreciation (depreciation) | Value, end of period | % ownership, end of period |
| Fidelity Cash Central Fund 0.31% | $172,801,639 | $137,045,266 | $194,893,295 | $51,708 | $-- | $-- | $114,953,610 | 0.2 |
| Fidelity Commodity Strategy Central Fund | 44,856,018 | 2,104,012 | 27,546,107 | -- | 2,153,396 | 5,386,811 | 26,954,130 | 4.6 |
| Fidelity Emerging Markets Debt Central Fund | 6,341,501 | 988,794 | 304,870 | 148,832 | (14,938) | (624,919) | 6,385,568 | 0.2 |
| Fidelity Emerging Markets Debt Local Currency Central Fund | 5,842,913 | 320,242 | -- | 320,242 | -- | (716,123) | 5,447,032 | 6 |
| Fidelity Emerging Markets Equity Central Fund | 100,526,535 | 21,064,467 | 1,974,786 | 8,441,926 | 519,433 | (25,399,401) | 94,736,248 | 5.2 |
| Fidelity Floating Rate Central Fund | 65,174,462 | 33,699,457 | 2,092,978 | 1,773,043 | (8,102) | (1,035,250) | 95,737,589 | 3 |
| Fidelity High Income Central Fund | 32,541,136 | 1,826,629 | 13,290,679 | 622,793 | 621,023 | (1,496,374) | 20,201,735 | 1 |
| Fidelity Inflation-Protected Bond Index Central Fund | 73,608,764 | 9,517,917 | 39,686,619 | 5,456,004 | 1,844,820 | (6,985,808) | 38,299,074 | 5.9 |
| Fidelity International Credit Central Fund | 31,222,097 | 2,575,899 | 6,644,026 | 519,715 | (369,557) | (1,974,852) | 24,809,561 | 4.8 |
| Fidelity International Equity Central Fund | 199,369,632 | 24,858,679 | 3,438,245 | 13,199,698 | (355,157) | (23,164,402) | 197,270,507 | 5.2 |
| Fidelity Investment Grade Bond Central Fund | 851,058,289 | 134,136,706 | 27,408,995 | 9,976,564 | (664,382) | (59,819,981) | 897,301,637 | 2.6 |
| Fidelity Money Market Central Fund 0.45% | 61,369,378 | 78,731,433 | 2,775,508 | 128,087 | (400) | (24,436) | 137,300,467 | 8.1 |
| Fidelity Real Estate Equity Central Fund | 37,253,173 | 15,136,669 | 14,170,227 | 498,067 | (785,346) | 2,996,271 | 40,430,540 | 2.4 |
| Fidelity Securities Lending Cash Central Fund 0.31% | -- | 62,693,476 | 44,172,826 | 4,452 | -- | -- | 18,520,650 | -- |
| Fidelity U.S. Equity Central Fund | 790,194,767 | 124,492,445 | 17,720,292 | 69,484,457 | (1,245,971) | (57,849,719) | 837,871,230 | 3.8 |
| $2,472,160,304 | $649,192,091 | $396,119,453 | $110,625,588 | $1,694,819 | $(170,708,183) | $2,556,219,578 |
Amounts in the income column in the above table include any capital gain distributions from underlying funds, which are presented in the corresponding line-item in the Statement of Operations, if applicable. Amount for Fidelity Securities Lending Cash Central Fund represents the income earned on investing cash collateral, less rebates paid to borrowers and any lending agent fees associated with the loan, plus any premium payments received for lending certain types of securities.
Investment Valuation
The following is a summary of the inputs used, as of March 31, 2022, involving the Fund's assets and liabilities carried at fair value. The inputs or methodology used for valuing securities may not be an indication of the risk associated with investing in those securities. For more information on valuation inputs, and their aggregation into the levels used below, please refer to the Investment Valuation section in the accompanying Notes to Financial Statements.
| Valuation Inputs at Reporting Date: | ||||
| Description | Total | Level 1 | Level 2 | Level 3 |
| Investments in Securities: | ||||
| Equity Central Funds | $1,197,262,655 | $1,197,262,655 | $-- | $-- |
| Fixed-Income Central Funds | 1,088,182,196 | 1,088,182,196 | -- | -- |
| Money Market Central Funds | 270,774,727 | 270,774,727 | -- | -- |
| U.S. Treasury Obligations | 6,774,399 | -- | 6,774,399 | -- |
| Investment Companies | 44,444,260 | 44,444,260 | -- | -- |
| Total Investments in Securities: | $2,607,438,237 | $2,600,663,838 | $6,774,399 | $-- |
| Derivative Instruments: | ||||
| Assets | ||||
| Futures Contracts | $562,411 | $562,411 | $-- | $-- |
| Total Assets | $562,411 | $562,411 | $-- | $-- |
| Liabilities | ||||
| Futures Contracts | $(8,124,325) | $(8,124,325) | $-- | $-- |
| Total Liabilities | $(8,124,325) | $(8,124,325) | $-- | $-- |
| Total Derivative Instruments: | $(7,561,914) | $(7,561,914) | $-- | $-- |
Value of Derivative Instruments
The following table is a summary of the Fund's value of derivative instruments by primary risk exposure as of March 31, 2022. For additional information on derivative instruments, please refer to the Derivative Instruments section in the accompanying Notes to Financial Statements.
| Primary Risk Exposure / Derivative Type | Value | |
| Asset | Liability | |
| Equity Risk | ||
| Futures Contracts(a) | $562,411 | $(8,124,325) |
| Total Equity Risk | 562,411 | (8,124,325) |
| Total Value of Derivatives | $562,411 | $(8,124,325) |
(a) Reflects gross cumulative appreciation (depreciation) on futures contracts as presented in the Schedule of Investments. In the Statement of Assets and Liabilities, the period end daily variation margin is included in receivable or payable for daily variation margin on futures contracts, and the net cumulative appreciation (depreciation) is included in Total accumulated earnings (loss).
See accompanying notes which are an integral part of the financial statements.
Fidelity Asset Manager® 40%
Financial Statements
Statement of Assets and Liabilities
| March 31, 2022 (Unaudited) | ||
| Assets | ||
| Investment in securities, at value (including securities loaned of $18,187,416) — See accompanying schedule: Unaffiliated issuers (cost $57,059,418) | $51,218,659 | |
| Fidelity Central Funds (cost $2,179,305,648) | 2,556,219,578 | |
| Total Investment in Securities (cost $2,236,365,066) | $2,607,438,237 | |
| Receivable for investments sold | 429,015 | |
| Receivable for fund shares sold | 946,889 | |
| Distributions receivable from Fidelity Central Funds | 24,899 | |
| Receivable for daily variation margin on futures contracts | 2,083,577 | |
| Prepaid expenses | 1,219 | |
| Total assets | 2,610,923,836 | |
| Liabilities | ||
| Payable for investments purchased | $17,380 | |
| Payable for fund shares redeemed | 591,606 | |
| Accrued management fee | 851,989 | |
| Distribution and service plan fees payable | 43,831 | |
| Other affiliated payables | 237,903 | |
| Other payables and accrued expenses | 48,589 | |
| Collateral on securities loaned | 18,520,650 | |
| Total liabilities | 20,311,948 | |
| Net Assets | $2,590,611,888 | |
| Net Assets consist of: | ||
| Paid in capital | $2,201,736,622 | |
| Total accumulated earnings (loss) | 388,875,266 | |
| Net Assets | $2,590,611,888 | |
| Net Asset Value and Maximum Offering Price | ||
| Class A: | ||
| Net Asset Value and redemption price per share ($80,792,942 ÷ 6,088,285 shares)(a) | $13.27 | |
| Maximum offering price per share (100/94.25 of $13.27) | $14.08 | |
| Class M: | ||
| Net Asset Value and redemption price per share ($14,631,103 ÷ 1,104,297 shares)(a) | $13.25 | |
| Maximum offering price per share (100/96.50 of $13.25) | $13.73 | |
| Class C: | ||
| Net Asset Value and offering price per share ($25,736,673 ÷ 1,950,682 shares)(a) | $13.19 | |
| Asset Manager 40%: | ||
| Net Asset Value, offering price and redemption price per share ($1,840,359,931 ÷ 138,667,703 shares) | $13.27 | |
| Class I: | ||
| Net Asset Value, offering price and redemption price per share ($39,937,498 ÷ 3,008,603 shares) | $13.27 | |
| Class Z: | ||
| Net Asset Value, offering price and redemption price per share ($589,153,741 ÷ 44,391,951 shares) | $13.27 |
(a) Redemption price per share is equal to net asset value less any applicable contingent deferred sales charge.
See accompanying notes which are an integral part of the financial statements.
Statement of Operations
| Six months ended March 31, 2022 (Unaudited) | ||
| Investment Income | ||
| Dividends | $463,428 | |
| Interest | 2,517 | |
| Income from Fidelity Central Funds (including $4,452 from security lending) | 25,999,104 | |
| Total income | 26,465,049 | |
| Expenses | ||
| Management fee | $5,214,606 | |
| Transfer agent fees | 995,035 | |
| Distribution and service plan fees | 270,268 | |
| Accounting fees | 424,281 | |
| Custodian fees and expenses | 18,641 | |
| Independent trustees' fees and expenses | 4,410 | |
| Registration fees | 84,509 | |
| Audit | 16,579 | |
| Legal | 2,895 | |
| Miscellaneous | 5,766 | |
| Total expenses before reductions | 7,036,990 | |
| Expense reductions | (21,613) | |
| Total expenses after reductions | 7,015,377 | |
| Net investment income (loss) | 19,449,672 | |
| Realized and Unrealized Gain (Loss) | ||
| Net realized gain (loss) on: | ||
| Investment securities: | ||
| Unaffiliated issuers | (1,734,223) | |
| Fidelity Central Funds | 1,694,819 | |
| Futures contracts | 16,486,006 | |
| Capital gain distributions from Fidelity Central Funds | 84,626,484 | |
| Total net realized gain (loss) | 101,073,086 | |
| Change in net unrealized appreciation (depreciation) on: | ||
| Investment securities: | ||
| Unaffiliated issuers | (2,805,589) | |
| Fidelity Central Funds | (170,708,183) | |
| Futures contracts | (14,815,435) | |
| Total change in net unrealized appreciation (depreciation) | (188,329,207) | |
| Net gain (loss) | (87,256,121) | |
| Net increase (decrease) in net assets resulting from operations | $(67,806,449) |
See accompanying notes which are an integral part of the financial statements.
Statement of Changes in Net Assets
| Six months ended March 31, 2022 (Unaudited) | Year ended September 30, 2021 | |
| Increase (Decrease) in Net Assets | ||
| Operations | ||
| Net investment income (loss) | $19,449,672 | $32,164,552 |
| Net realized gain (loss) | 101,073,086 | 15,629,051 |
| Change in net unrealized appreciation (depreciation) | (188,329,207) | 235,383,463 |
| Net increase (decrease) in net assets resulting from operations | (67,806,449) | 283,177,066 |
| Distributions to shareholders | (49,618,664) | (50,101,011) |
| Share transactions - net increase (decrease) | 163,810,832 | 273,381,795 |
| Total increase (decrease) in net assets | 46,385,719 | 506,457,850 |
| Net Assets | ||
| Beginning of period | 2,544,226,169 | 2,037,768,319 |
| End of period | $2,590,611,888 | $2,544,226,169 |
See accompanying notes which are an integral part of the financial statements.
Financial Highlights
Fidelity Asset Manager 40% Class A
| Six months ended (Unaudited) March 31, | Years endedSeptember 30, | |||||
| 2022 | 2021 | 2020 | 2019 | 2018 | 2017 | |
| Selected Per–Share Data | ||||||
| Net asset value, beginning of period | $13.85 | $12.49 | $11.82 | $11.87 | $11.67 | $10.95 |
| Income from Investment Operations | ||||||
| Net investment income (loss)A,B | .08 | .15 | .17 | .21 | .17 | .14 |
| Net realized and unrealized gain (loss) | (.42) | 1.47 | .88 | .21 | .36 | .73 |
| Total from investment operations | (.34) | 1.62 | 1.05 | .42 | .53 | .87 |
| Distributions from net investment income | (.13) | (.12) | (.17) | (.21) | (.15) | (.13) |
| Distributions from net realized gain | (.11) | (.13) | (.21) | (.27) | (.18) | (.02) |
| Total distributions | (.24) | (.26)C | (.38) | (.47)C | (.33) | (.15) |
| Net asset value, end of period | $13.27 | $13.85 | $12.49 | $11.82 | $11.87 | $11.67 |
| Total ReturnD,E,F | (2.53)% | 13.06% | 9.06% | 3.90% | 4.62% | 8.01% |
| Ratios to Average Net AssetsB,G,H | ||||||
| Expenses before reductions | .82%I | .82% | .83% | .83% | .84% | .84% |
| Expenses net of fee waivers, if any | .82%I | .82% | .83% | .83% | .84% | .84% |
| Expenses net of all reductions | .82%I | .82% | .83% | .83% | .84% | .84% |
| Net investment income (loss) | 1.19%I | 1.08% | 1.43% | 1.79% | 1.41% | 1.21% |
| Supplemental Data | ||||||
| Net assets, end of period (000 omitted) | $80,793 | $74,272 | $48,985 | $42,490 | $38,073 | $36,200 |
| Portfolio turnover rateJ | 14%I | 22% | 24% | 36% | 17% | 20% |
A Calculated based on average shares outstanding during the period.
B Net investment income (loss) is affected by the timing of the declaration of dividends by any underlying mutual funds or exchange-traded funds (ETFs). Net investment income (loss) of any such underlying funds is not included in the Fund's net investment income (loss) ratio.
C Total distributions per share do not sum due to rounding.
D Total returns for periods of less than one year are not annualized.
E Total returns would have been lower if certain expenses had not been reduced during the applicable periods shown.
F Total returns do not include the effect of the sales charges.
G Fees and expenses of any underlying mutual funds or exchange-traded funds (ETFs) are not included in the Fund's expense ratio. The Fund indirectly bears its proportionate share of these expenses. For additional expense information related to investments in Fidelity Central Funds, please refer to the "Investments in Fidelity Central Funds" note found in the Notes to Financial Statements section of the most recent Annual or Semi-Annual report.
H Expense ratios reflect operating expenses of the class. Expenses before reductions do not reflect amounts reimbursed, waived, or reduced through arrangements with the investment adviser, brokerage services, or other offset arrangements, if applicable, and do not represent the amount paid by the class during periods when reimbursements, waivers or reductions occur.
I Annualized
J Amount does not include the portfolio activity of any underlying mutual funds or exchange-traded funds (ETFs).
See accompanying notes which are an integral part of the financial statements.
Fidelity Asset Manager 40% Class M
| Six months ended (Unaudited) March 31, | Years endedSeptember 30, | |||||
| 2022 | 2021 | 2020 | 2019 | 2018 | 2017 | |
| Selected Per–Share Data | ||||||
| Net asset value, beginning of period | $13.83 | $12.47 | $11.80 | $11.85 | $11.65 | $10.93 |
| Income from Investment Operations | ||||||
| Net investment income (loss)A,B | .07 | .11 | .14 | .18 | .13 | .11 |
| Net realized and unrealized gain (loss) | (.43) | 1.47 | .88 | .21 | .37 | .73 |
| Total from investment operations | (.36) | 1.58 | 1.02 | .39 | .50 | .84 |
| Distributions from net investment income | (.11) | (.09) | (.14) | (.17) | (.12) | (.10) |
| Distributions from net realized gain | (.11) | (.13) | (.21) | (.27) | (.18) | (.02) |
| Total distributions | (.22) | (.22) | (.35) | (.44) | (.30) | (.12) |
| Net asset value, end of period | $13.25 | $13.83 | $12.47 | $11.80 | $11.85 | $11.65 |
| Total ReturnC,D,E | (2.66)% | 12.80% | 8.80% | 3.61% | 4.35% | 7.75% |
| Ratios to Average Net AssetsB,F,G | ||||||
| Expenses before reductions | 1.06%H | 1.06% | 1.08% | 1.09% | 1.10% | 1.12% |
| Expenses net of fee waivers, if any | 1.06%H | 1.06% | 1.08% | 1.09% | 1.10% | 1.11% |
| Expenses net of all reductions | 1.06%H | 1.06% | 1.08% | 1.09% | 1.10% | 1.11% |
| Net investment income (loss) | .95%H | .84% | 1.17% | 1.53% | 1.14% | .94% |
| Supplemental Data | ||||||
| Net assets, end of period (000 omitted) | $14,631 | $14,809 | $11,898 | $10,913 | $12,318 | $11,665 |
| Portfolio turnover rateI | 14%H | 22% | 24% | 36% | 17% | 20% |
A Calculated based on average shares outstanding during the period.
B Net investment income (loss) is affected by the timing of the declaration of dividends by any underlying mutual funds or exchange-traded funds (ETFs). Net investment income (loss) of any such underlying funds is not included in the Fund's net investment income (loss) ratio.
C Total returns for periods of less than one year are not annualized.
D Total returns would have been lower if certain expenses had not been reduced during the applicable periods shown.
E Total returns do not include the effect of the sales charges.
F Fees and expenses of any underlying mutual funds or exchange-traded funds (ETFs) are not included in the Fund's expense ratio. The Fund indirectly bears its proportionate share of these expenses. For additional expense information related to investments in Fidelity Central Funds, please refer to the "Investments in Fidelity Central Funds" note found in the Notes to Financial Statements section of the most recent Annual or Semi-Annual report.
G Expense ratios reflect operating expenses of the class. Expenses before reductions do not reflect amounts reimbursed, waived, or reduced through arrangements with the investment adviser, brokerage services, or other offset arrangements, if applicable, and do not represent the amount paid by the class during periods when reimbursements, waivers or reductions occur.
H Annualized
I Amount does not include the portfolio activity of any underlying mutual funds or exchange-traded funds (ETFs).
See accompanying notes which are an integral part of the financial statements.
Fidelity Asset Manager 40% Class C
| Six months ended (Unaudited) March 31, | Years endedSeptember 30, | |||||
| 2022 | 2021 | 2020 | 2019 | 2018 | 2017 | |
| Selected Per–Share Data | ||||||
| Net asset value, beginning of period | $13.77 | $12.42 | $11.75 | $11.80 | $11.61 | $10.90 |
| Income from Investment Operations | ||||||
| Net investment income (loss)A,B | .03 | .04 | .08 | .12 | .08 | .05 |
| Net realized and unrealized gain (loss) | (.42) | 1.47 | .88 | .21 | .35 | .73 |
| Total from investment operations | (.39) | 1.51 | .96 | .33 | .43 | .78 |
| Distributions from net investment income | (.07) | (.03) | (.08) | (.12) | (.06) | (.05) |
| Distributions from net realized gain | (.11) | (.13) | (.21) | (.27) | (.18) | (.02) |
| Total distributions | (.19)C | (.16) | (.29) | (.38)C | (.24) | (.07) |
| Net asset value, end of period | $13.19 | $13.77 | $12.42 | $11.75 | $11.80 | $11.61 |
| Total ReturnD,E,F | (2.93)% | 12.24% | 8.25% | 3.11% | 3.77% | 7.16% |
| Ratios to Average Net AssetsB,G,H | ||||||
| Expenses before reductions | 1.59%I | 1.59% | 1.59% | 1.60% | 1.60% | 1.61% |
| Expenses net of fee waivers, if any | 1.59%I | 1.59% | 1.59% | 1.60% | 1.60% | 1.61% |
| Expenses net of all reductions | 1.59%I | 1.59% | 1.59% | 1.60% | 1.60% | 1.61% |
| Net investment income (loss) | .43%I | .31% | .66% | 1.03% | .64% | .45% |
| Supplemental Data | ||||||
| Net assets, end of period (000 omitted) | $25,737 | $26,841 | $23,974 | $24,834 | $25,656 | $23,354 |
| Portfolio turnover rateJ | 14%I | 22% | 24% | 36% | 17% | 20% |
A Calculated based on average shares outstanding during the period.
B Net investment income (loss) is affected by the timing of the declaration of dividends by any underlying mutual funds or exchange-traded funds (ETFs). Net investment income (loss) of any such underlying funds is not included in the Fund's net investment income (loss) ratio.
C Total distributions per share do not sum due to rounding.
D Total returns for periods of less than one year are not annualized.
E Total returns would have been lower if certain expenses had not been reduced during the applicable periods shown.
F Total returns do not include the effect of the contingent deferred sales charge.
G Fees and expenses of any underlying mutual funds or exchange-traded funds (ETFs) are not included in the Fund's expense ratio. The Fund indirectly bears its proportionate share of these expenses. For additional expense information related to investments in Fidelity Central Funds, please refer to the "Investments in Fidelity Central Funds" note found in the Notes to Financial Statements section of the most recent Annual or Semi-Annual report.
H Expense ratios reflect operating expenses of the class. Expenses before reductions do not reflect amounts reimbursed, waived, or reduced through arrangements with the investment adviser, brokerage services, or other offset arrangements, if applicable, and do not represent the amount paid by the class during periods when reimbursements, waivers or reductions occur.
I Annualized
J Amount does not include the portfolio activity of any underlying mutual funds or exchange-traded funds (ETFs).
See accompanying notes which are an integral part of the financial statements.
Fidelity Asset Manager 40%
| Six months ended (Unaudited) March 31, | Years endedSeptember 30, | |||||
| 2022 | 2021 | 2020 | 2019 | 2018 | 2017 | |
| Selected Per–Share Data | ||||||
| Net asset value, beginning of period | $13.85 | $12.49 | $11.82 | $11.87 | $11.67 | $10.95 |
| Income from Investment Operations | ||||||
| Net investment income (loss)A,B | .10 | .19 | .21 | .24 | .20 | .17 |
| Net realized and unrealized gain (loss) | (.42) | 1.46 | .88 | .22 | .37 | .73 |
| Total from investment operations | (.32) | 1.65 | 1.09 | .46 | .57 | .90 |
| Distributions from net investment income | (.15) | (.16) | (.21) | (.24) | (.19) | (.16) |
| Distributions from net realized gain | (.11) | (.13) | (.21) | (.27) | (.18) | (.02) |
| Total distributions | (.26) | (.29) | (.42) | (.51) | (.37) | (.18) |
| Net asset value, end of period | $13.27 | $13.85 | $12.49 | $11.82 | $11.87 | $11.67 |
| Total ReturnC,D | (2.38)% | 13.38% | 9.41% | 4.23% | 4.95% | 8.35% |
| Ratios to Average Net AssetsB,E,F | ||||||
| Expenses before reductions | .52%G | .52% | .52% | .52% | .53% | .54% |
| Expenses net of fee waivers, if any | .52%G | .51% | .52% | .52% | .53% | .54% |
| Expenses net of all reductions | .52%G | .51% | .52% | .52% | .53% | .53% |
| Net investment income (loss) | 1.50%G | 1.39% | 1.73% | 2.10% | 1.71% | 1.52% |
| Supplemental Data | ||||||
| Net assets, end of period (000 omitted) | $1,840,360 | $1,829,755 | $1,911,787 | $1,704,998 | $1,577,393 | $1,344,514 |
| Portfolio turnover rateH | 14%G | 22% | 24% | 36% | 17% | 20% |
A Calculated based on average shares outstanding during the period.
B Net investment income (loss) is affected by the timing of the declaration of dividends by any underlying mutual funds or exchange-traded funds (ETFs). Net investment income (loss) of any such underlying funds is not included in the Fund's net investment income (loss) ratio.
C Total returns for periods of less than one year are not annualized.
D Total returns would have been lower if certain expenses had not been reduced during the applicable periods shown.
E Fees and expenses of any underlying mutual funds or exchange-traded funds (ETFs) are not included in the Fund's expense ratio. The Fund indirectly bears its proportionate share of these expenses. For additional expense information related to investments in Fidelity Central Funds, please refer to the "Investments in Fidelity Central Funds" note found in the Notes to Financial Statements section of the most recent Annual or Semi-Annual report.
F Expense ratios reflect operating expenses of the class. Expenses before reductions do not reflect amounts reimbursed, waived, or reduced through arrangements with the investment adviser, brokerage services, or other offset arrangements, if applicable, and do not represent the amount paid by the class during periods when reimbursements, waivers or reductions occur.
G Annualized
H Amount does not include the portfolio activity of any underlying mutual funds or exchange-traded funds (ETFs).
See accompanying notes which are an integral part of the financial statements.
Fidelity Asset Manager 40% Class I
| Six months ended (Unaudited) March 31, | Years endedSeptember 30, | |||||
| 2022 | 2021 | 2020 | 2019 | 2018 | 2017 | |
| Selected Per–Share Data | ||||||
| Net asset value, beginning of period | $13.86 | $12.49 | $11.82 | $11.87 | $11.67 | $10.95 |
| Income from Investment Operations | ||||||
| Net investment income (loss)A,B | .10 | .18 | .20 | .24 | .20 | .17 |
| Net realized and unrealized gain (loss) | (.43) | 1.48 | .88 | .21 | .36 | .73 |
| Total from investment operations | (.33) | 1.66 | 1.08 | .45 | .56 | .90 |
| Distributions from net investment income | (.15) | (.16) | (.20) | (.24) | (.18) | (.16) |
| Distributions from net realized gain | (.11) | (.13) | (.21) | (.27) | (.18) | (.02) |
| Total distributions | (.26) | (.29) | (.41) | (.50)C | (.36) | (.18) |
| Net asset value, end of period | $13.27 | $13.86 | $12.49 | $11.82 | $11.87 | $11.67 |
| Total ReturnD,E | (2.47)% | 13.42% | 9.35% | 4.18% | 4.91% | 8.32% |
| Ratios to Average Net AssetsB,F,G | ||||||
| Expenses before reductions | .57%H | .57% | .56% | .56% | .56% | .56% |
| Expenses net of fee waivers, if any | .56%H | .56% | .56% | .56% | .56% | .56% |
| Expenses net of all reductions | .56%H | .56% | .56% | .56% | .56% | .56% |
| Net investment income (loss) | 1.45%H | 1.34% | 1.69% | 2.06% | 1.68% | 1.49% |
| Supplemental Data | ||||||
| Net assets, end of period (000 omitted) | $39,937 | $42,310 | $28,708 | $25,014 | $29,180 | $20,025 |
| Portfolio turnover rateI | 14%H | 22% | 24% | 36% | 17% | 20% |
A Calculated based on average shares outstanding during the period.
B Net investment income (loss) is affected by the timing of the declaration of dividends by any underlying mutual funds or exchange-traded funds (ETFs). Net investment income (loss) of any such underlying funds is not included in the Fund's net investment income (loss) ratio.
C Total distributions per share do not sum due to rounding.
D Total returns for periods of less than one year are not annualized.
E Total returns would have been lower if certain expenses had not been reduced during the applicable periods shown.
F Fees and expenses of any underlying mutual funds or exchange-traded funds (ETFs) are not included in the Fund's expense ratio. The Fund indirectly bears its proportionate share of these expenses. For additional expense information related to investments in Fidelity Central Funds, please refer to the "Investments in Fidelity Central Funds" note found in the Notes to Financial Statements section of the most recent Annual or Semi-Annual report.
G Expense ratios reflect operating expenses of the class. Expenses before reductions do not reflect amounts reimbursed, waived, or reduced through arrangements with the investment adviser, brokerage services, or other offset arrangements, if applicable, and do not represent the amount paid by the class during periods when reimbursements, waivers or reductions occur.
H Annualized
I Amount does not include the portfolio activity of any underlying mutual funds or exchange-traded funds (ETFs).
See accompanying notes which are an integral part of the financial statements.
Fidelity Asset Manager 40% Class Z
| Six months ended (Unaudited) March 31, | Years endedSeptember 30, | |||
| 2022 | 2021 | 2020 | 2019 A | |
| Selected Per–Share Data | ||||
| Net asset value, beginning of period | $13.86 | $12.49 | $11.82 | $11.86 |
| Income from Investment Operations | ||||
| Net investment income (loss)B,C | .10 | .19 | .21 | .24 |
| Net realized and unrealized gain (loss) | (.42) | 1.48 | .88 | .23 |
| Total from investment operations | (.32) | 1.67 | 1.09 | .47 |
| Distributions from net investment income | (.15) | (.17) | (.22) | (.24) |
| Distributions from net realized gain | (.11) | (.13) | (.21) | (.27) |
| Total distributions | (.27)D | (.30) | (.42)D | (.51) |
| Net asset value, end of period | $13.27 | $13.86 | $12.49 | $11.82 |
| Total ReturnE,F | (2.42)% | 13.49% | 9.45% | 4.34% |
| Ratios to Average Net AssetsC,G,H | ||||
| Expenses before reductions | .49%I | .49% | .50% | .50%I |
| Expenses net of fee waivers, if any | .49%I | .49% | .49% | .50%I |
| Expenses net of all reductions | .49%I | .49% | .49% | .50%I |
| Net investment income (loss) | 1.53%I | 1.41% | 1.76% | 2.12%I |
| Supplemental Data | ||||
| Net assets, end of period (000 omitted) | $589,154 | $556,238 | $12,416 | $6,431 |
| Portfolio turnover rateJ | 14%I | 22% | 24% | 36% |
A For the period October 2, 2018 (commencement of sale of shares) through September 30, 2019.
B Calculated based on average shares outstanding during the period.
C Net investment income (loss) is affected by the timing of the declaration of dividends by any underlying mutual funds or exchange-traded funds (ETFs). Net investment income (loss) of any such underlying funds is not included in the Fund's net investment income (loss) ratio.
D Total distributions per share do not sum due to rounding.
E Total returns for periods of less than one year are not annualized.
F Total returns would have been lower if certain expenses had not been reduced during the applicable periods shown.
G Fees and expenses of any underlying mutual funds or exchange-traded funds (ETFs) are not included in the Fund's expense ratio. The Fund indirectly bears its proportionate share of these expenses. For additional expense information related to investments in Fidelity Central Funds, please refer to the "Investments in Fidelity Central Funds" note found in the Notes to Financial Statements section of the most recent Annual or Semi-Annual report.
H Expense ratios reflect operating expenses of the class. Expenses before reductions do not reflect amounts reimbursed, waived, or reduced through arrangements with the investment adviser, brokerage services, or other offset arrangements, if applicable, and do not represent the amount paid by the class during periods when reimbursements, waivers or reductions occur.
I Annualized
J Amount does not include the portfolio activity of any underlying mutual funds or exchange-traded funds (ETFs).
See accompanying notes which are an integral part of the financial statements.
Fidelity Asset Manager® 50%
Investment Summary (Unaudited)
The information in the following tables is based on the combined investments of the Fund and its pro-rata share of the investments of Fidelity's Central Funds, other than the Commodity Strategy and Money Market Central Funds.Top Ten Stocks as of March 31, 2022
| % of fund's net assets | |
| Apple, Inc. | 2.7 |
| Microsoft Corp. | 2.6 |
| Alphabet, Inc. Class A | 1.8 |
| Amazon.com, Inc. | 1.4 |
| Meta Platforms, Inc. Class A | 0.6 |
| UnitedHealth Group, Inc. | 0.6 |
| Tesla, Inc. | 0.6 |
| Exxon Mobil Corp. | 0.5 |
| Wells Fargo & Co. | 0.4 |
| Taiwan Semiconductor Manufacturing Co. Ltd. | 0.4 |
| 11.6 |
Market Sectors as of March 31, 2022
| % of fund's net assets | |
| Information Technology | 13.9 |
| Financials | 13.4 |
| Consumer Discretionary | 7.7 |
| Health Care | 7.0 |
| Industrials | 7.0 |
| Communication Services | 5.5 |
| Real Estate | 3.9 |
| Consumer Staples | 3.8 |
| Energy | 3.2 |
| Materials | 2.6 |
| Utilities | 2.1 |
Top Five Bond Issuers as of March 31, 2022
| (with maturities greater than one year) | % of fund's net assets |
| U.S. Treasury Obligations | 12.0 |
| Freddie Mac | 2.1 |
| Fannie Mae | 1.8 |
| Ginnie Mae | 1.2 |
| Uniform Mortgage Backed Securities | 1.2 |
| 18.3 |
Quality Diversification (% of fund's net assets)
| As of March 31, 2022 | ||
| U.S. Government and U.S. Government Agency Obligations | 18.9% | |
| AAA,AA,A | 4.8% | |
| BBB | 7.3% | |
| BB and Below | 5.4% | |
| Not Rated | 1.3% | |
| Equities* | 58.2% | |
| Short-Term Investments and Net Other Assets | 4.1% | |
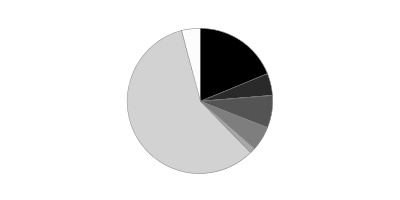
* Includes investment in Fidelity® Commodity Strategy Central Fund of 1.1%
We have used ratings from Moody's Investors Service, Inc. Where Moody's® ratings are not available, we have used S&P® ratings. All ratings are as of the date indicated and do not reflect subsequent changes.
Asset Allocation (% of fund's net assets)
| As of March 31, 2022 | ||
| Stocks and Equity Futures* | 56.3% | |
| Bond Class | 38.4% | |
| Short-Term Class | 5.3% | |

* Includes investment in Fidelity® Commodity Strategy Central Fund of 1.1%
Asset allocations in the pie charts reflect the categorization of assets as defined in the Fund's prospectus in effect as of the time periods indicated above. Percentages are adjusted for the effect of future contracts and swap contracts, if applicable.
Geographic Diversification (% of fund's net assets)
| As of March 31, 2022 | ||
| United States of America | 78.9% | |
| Cayman Islands | 2.7% | |
| United Kingdom | 2.1% | |
| France | 1.6% | |
| Canada | 1.5% | |
| Japan | 1.3% | |
| Switzerland | 1.3% | |
| Netherlands | 1.1% | |
| Germany | 1.1% | |
| Other | 8.4% | |

Percentages are based on country or territory of incorporation and are adjusted for the effect of futures contracts, if applicable.
At period end, foreign investments including the Fund's pro-rata share of the underlying Central Funds, other than the Commodity Strategy Central and Money Market Funds, was 21.1% of net assets.
Percentages in the above tables are adjusted for the effect of TBA Sale Commitments.
An unaudited holdings listing for the Fund, which presents direct holdings as well as the pro-rata share of any securities and other investments held indirectly through its investment in underlying Fidelity Central Funds, other than the Commodity Strategy and Money Market Central Funds, is available at fidelity.com and/or institutional.fidelity.com, as applicable.
Fidelity Asset Manager® 50%
Schedule of Investments March 31, 2022 (Unaudited)
Showing Percentage of Net Assets
| Equity Central Funds - 56.7% | |||
| Shares | Value | ||
| Fidelity Commodity Strategy Central Fund (a)(b) | 18,935,800 | $116,833,885 | |
| Fidelity Emerging Markets Equity Central Fund (b) | 2,297,301 | 495,412,949 | |
| Fidelity International Equity Central Fund (b) | 11,127,353 | 1,061,326,968 | |
| Fidelity Real Estate Equity Central Fund (b) | 1,141,985 | 173,912,866 | |
| Fidelity U.S. Equity Central Fund (b) | 36,077,736 | 4,468,227,587 | |
| TOTAL EQUITY CENTRAL FUNDS | |||
| (Cost $3,409,421,021) | 6,315,714,255 | ||
| Fixed-Income Central Funds - 36.8% | |||
| High Yield Fixed-Income Funds - 5.0% | |||
| Fidelity Emerging Markets Debt Central Fund (b) | 3,169,930 | 26,278,721 | |
| Fidelity Emerging Markets Debt Local Currency Central Fund (b) | 296,753 | 26,209,267 | |
| Fidelity Floating Rate Central Fund (b) | 4,138,864 | 412,851,677 | |
| Fidelity High Income Central Fund (b) | 787,092 | 87,099,548 | |
| TOTAL HIGH YIELD FIXED-INCOME FUNDS | 552,439,213 | ||
| Investment Grade Fixed-Income Funds - 31.8% | |||
| Fidelity Inflation-Protected Bond Index Central Fund (b) | 2,098,256 | 218,701,203 | |
| Fidelity International Credit Central Fund (b) | 1,412,705 | 133,133,325 | |
| Fidelity Investment Grade Bond Central Fund (b) | 29,826,031 | 3,194,069,616 | |
| TOTAL INVESTMENT GRADE FIXED-INCOME FUNDS | 3,545,904,144 | ||
| TOTAL FIXED-INCOME CENTRAL FUNDS | |||
| (Cost $3,968,440,169) | 4,098,343,357 | ||
| Money Market Central Funds - 4.8% | |||
| Fidelity Cash Central Fund 0.31% (c) | 465,730,688 | 465,823,834 | |
| Fidelity Securities Lending Cash Central Fund 0.31% (c)(d) | 72,568,943 | 72,576,200 | |
| TOTAL MONEY MARKET CENTRAL FUNDS | |||
| (Cost $538,400,034) | 538,400,034 | ||
| Principal Amount | Value | ||
| U.S. Treasury Obligations - 0.3% | |||
| U.S. Treasury Bills, yield at date of purchase 0.11% to 0.5% 4/14/22 to 6/30/22 (e) | |||
| (Cost $30,080,209) | 30,100,000 | 30,079,857 | |
| Shares | Value | ||
| Investment Companies - 2.0% | |||
| iShares 20+ Year Treasury Bond ETF (f) | |||
| (Cost $251,988,662) | 1,651,973 | 218,192,595 | |
| TOTAL INVESTMENT IN SECURITIES - 100.6% | |||
| (Cost $8,198,330,095) | 11,200,730,098 | ||
| NET OTHER ASSETS (LIABILITIES) - (0.6)% | (64,772,007) | ||
| NET ASSETS - 100% | $11,135,958,091 |
| Futures Contracts | |||||
| Number of contracts | Expiration Date | Notional Amount | Value | Unrealized Appreciation/(Depreciation) | |
| Purchased | |||||
| Equity Index Contracts | |||||
| ICE E-mini MSCI Emerging Markets Index Contracts (United States) | 649 | June 2022 | $36,522,475 | $2,787,030 | $2,787,030 |
| TOTAL PURCHASED FUTURES | 2,787,030 | ||||
| Sold | |||||
| Equity Index Contracts | |||||
| CME Micro E-mini S&P 500 Index Contracts (United States) | 1,695 | June 2022 | 383,981,063 | (23,742,419) | (23,742,419) |
| ICE E-mini MSCI EAFE Index Contracts (United States) | 2,571 | June 2022 | 275,662,620 | (15,986,706) | (15,986,706) |
| TOTAL SOLD FUTURES | ( 39,729,125) | ||||
| TOTAL FUTURES CONTRACTS | $(36,942,095) |
The notional amount of futures purchased as a percentage of Net Assets is 0.3%
The notional amount of futures sold as a percentage of Net Assets is 5.9%
For the period, the average monthly notional amount at value for futures contracts in the aggregate was $729,741,277.
Security Type Abbreviations
ETF – Exchange-Traded Fund
Legend
(a) Non-income producing
(b) Affiliated fund that is generally available only to investment companies and other accounts managed by Fidelity Investments. A complete unaudited schedule of portfolio holdings for each Fidelity Central Fund is filed with the SEC for the first and third quarters of each fiscal year on Form N-PORT and is available upon request or at the SEC's website at www.sec.gov. An unaudited holdings listing for the Fund, which presents direct holdings as well as the pro-rata share of securities and other investments held indirectly through its investment in underlying non-money market Fidelity Central Funds, other than the Commodity Strategy Central Fund, is available at fidelity.com and/or institutional.fidelity.com, as applicable. In addition, each Fidelity Central Fund's financial statements are available on the SEC's website or upon request.
(c) Affiliated fund that is generally available only to investment companies and other accounts managed by Fidelity Investments. The rate quoted is the annualized seven-day yield of the fund at period end. A complete unaudited listing of the fund's holdings as of its most recent quarter end is available upon request. In addition, each Fidelity Central Fund's financial statements are available on the SEC's website or upon request.
(d) Investment made with cash collateral received from securities on loan.
(e) Security or a portion of the security was pledged to cover margin requirements for futures contracts. At period end, the value of securities pledged amounted to $30,079,857.
(f) Security or a portion of the security is on loan at period end.
Affiliated Central Funds
Fiscal year to date information regarding the Fund's investments in Fidelity Central Funds, including the ownership percentage, is presented below.
| Fund | Value, beginning of period | Purchases | Sales Proceeds | Dividend Income | Realized Gain (loss) | Change in Unrealized appreciation (depreciation) | Value, end of period | % ownership, end of period |
| Fidelity Cash Central Fund 0.31% | $497,004,218 | $551,119,643 | $582,300,027 | $199,592 | $-- | $-- | $465,823,834 | 0.9 |
| Fidelity Commodity Strategy Central Fund | 203,430,858 | 12,906,436 | 136,670,913 | -- | 14,956,081 | 22,211,423 | 116,833,885 | 20.1 |
| Fidelity Emerging Markets Debt Central Fund | 29,269,078 | 1,804,661 | 2,093,965 | 644,705 | (91,259) | (2,609,794) | 26,278,721 | 1 |
| Fidelity Emerging Markets Debt Local Currency Central Fund | 28,114,112 | 1,540,895 | -- | 1,540,896 | -- | (3,445,740) | 26,209,267 | 29.1 |
| Fidelity Emerging Markets Equity Central Fund | 538,230,654 | 103,131,516 | 14,846,462 | 44,711,601 | 6,457,693 | (137,560,452) | 495,412,949 | 27.5 |
| Fidelity Floating Rate Central Fund | 296,621,522 | 135,180,801 | 14,419,368 | 7,806,805 | 86,195 | (4,617,473) | 412,851,677 | 12.9 |
| Fidelity High Income Central Fund | 147,447,680 | 4,419,760 | 60,953,646 | 2,756,025 | 4,538,156 | (8,352,402) | 87,099,548 | 4.2 |
| Fidelity Inflation-Protected Bond Index Central Fund | 376,774,319 | 34,400,427 | 166,304,526 | 27,688,794 | 9,891,739 | (36,060,756) | 218,701,203 | 33.5 |
| Fidelity International Credit Central Fund | 169,783,968 | 6,200,047 | 30,515,117 | 2,780,997 | (1,638,572) | (10,697,001) | 133,133,325 | 25.9 |
| Fidelity International Equity Central Fund | 1,128,936,237 | 94,156,203 | 34,142,813 | 73,260,716 | (2,662,746) | (124,959,913) | 1,061,326,968 | 27.9 |
| Fidelity Investment Grade Bond Central Fund | 3,201,552,831 | 352,149,091 | 144,069,912 | 36,151,293 | (2,821,622) | (212,740,772) | 3,194,069,616 | 9.4 |
| Fidelity Real Estate Equity Central Fund | 169,174,490 | 58,342,195 | 63,813,390 | 2,215,069 | (2,871,995) | 13,081,566 | 173,912,866 | 10.3 |
| Fidelity Securities Lending Cash Central Fund 0.31% | 193,692,650 | 995,888,250 | 1,117,004,700 | 123,522 | -- | -- | 72,576,200 | 0.2 |
| Fidelity U.S. Equity Central Fund | 4,440,221,868 | 494,913,816 | 150,775,620 | 382,086,900 | (9,689,657) | (306,442,820) | 4,468,227,587 | 20.5 |
| $11,420,254,485 | $2,846,153,741 | $2,517,910,459 | $581,966,915 | $16,154,013 | $(812,194,134) | $10,952,457,646 |
Amounts in the income column in the above table include any capital gain distributions from underlying funds, which are presented in the corresponding line-item in the Statement of Operations, if applicable. Amount for Fidelity Securities Lending Cash Central Fund represents the income earned on investing cash collateral, less rebates paid to borrowers and any lending agent fees associated with the loan, plus any premium payments received for lending certain types of securities.
Investment Valuation
The following is a summary of the inputs used, as of March 31, 2022, involving the Fund's assets and liabilities carried at fair value. The inputs or methodology used for valuing securities may not be an indication of the risk associated with investing in those securities. For more information on valuation inputs, and their aggregation into the levels used below, please refer to the Investment Valuation section in the accompanying Notes to Financial Statements.
| Valuation Inputs at Reporting Date: | ||||
| Description | Total | Level 1 | Level 2 | Level 3 |
| Investments in Securities: | ||||
| Equity Central Funds | $6,315,714,255 | $6,315,714,255 | $-- | $-- |
| Fixed-Income Central Funds | 4,098,343,357 | 4,098,343,357 | -- | -- |
| Money Market Central Funds | 538,400,034 | 538,400,034 | -- | -- |
| U.S. Treasury Obligations | 30,079,857 | -- | 30,079,857 | -- |
| Investment Companies | 218,192,595 | 218,192,595 | -- | -- |
| Total Investments in Securities: | $11,200,730,098 | $11,170,650,241 | $30,079,857 | $-- |
| Derivative Instruments: | ||||
| Assets | ||||
| Futures Contracts | $2,787,030 | $2,787,030 | $-- | $-- |
| Total Assets | $2,787,030 | $2,787,030 | $-- | $-- |
| Liabilities | ||||
| Futures Contracts | $(39,729,125) | $(39,729,125) | $-- | $-- |
| Total Liabilities | $(39,729,125) | $(39,729,125) | $-- | $-- |
| Total Derivative Instruments: | $(36,942,095) | $(36,942,095) | $-- | $-- |
Value of Derivative Instruments
The following table is a summary of the Fund's value of derivative instruments by primary risk exposure as of March 31, 2022. For additional information on derivative instruments, please refer to the Derivative Instruments section in the accompanying Notes to Financial Statements.
| Primary Risk Exposure / Derivative Type | Value | |
| Asset | Liability | |
| Equity Risk | ||
| Futures Contracts(a) | $2,787,030 | $(39,729,125) |
| Total Equity Risk | 2,787,030 | (39,729,125) |
| Total Value of Derivatives | $2,787,030 | $(39,729,125) |
(a) Reflects gross cumulative appreciation (depreciation) on futures contracts as presented in the Schedule of Investments. In the Statement of Assets and Liabilities, the period end daily variation margin is included in receivable or payable for daily variation margin on futures contracts, and the net cumulative appreciation (depreciation) is included in Total accumulated earnings (loss).
See accompanying notes which are an integral part of the financial statements.
Fidelity Asset Manager® 50%
Financial Statements
Statement of Assets and Liabilities
| March 31, 2022 (Unaudited) | ||
| Assets | ||
| Investment in securities, at value (including securities loaned of $71,270,368) — See accompanying schedule: Unaffiliated issuers (cost $282,068,871) | $248,272,452 | |
| Fidelity Central Funds (cost $7,916,261,224) | 10,952,457,646 | |
| Total Investment in Securities (cost $8,198,330,095) | $11,200,730,098 | |
| Receivable for investments sold | 6,220,206 | |
| Receivable for fund shares sold | 1,218,376 | |
| Distributions receivable from Fidelity Central Funds | 110,547 | |
| Receivable for daily variation margin on futures contracts | 9,696,343 | |
| Prepaid expenses | 5,698 | |
| Other receivables | 202,999 | |
| Total assets | 11,218,184,267 | |
| Liabilities | ||
| Payable for investments purchased | $3,191 | |
| Payable for fund shares redeemed | 3,876,548 | |
| Accrued management fee | 4,366,391 | |
| Distribution and service plan fees payable | 87,325 | |
| Other affiliated payables | 1,088,044 | |
| Other payables and accrued expenses | 228,477 | |
| Collateral on securities loaned | 72,576,200 | |
| Total liabilities | 82,226,176 | |
| Net Assets | $11,135,958,091 | |
| Net Assets consist of: | ||
| Paid in capital | $8,502,738,324 | |
| Total accumulated earnings (loss) | 2,633,219,767 | |
| Net Assets | $11,135,958,091 | |
| Net Asset Value and Maximum Offering Price | ||
| Class A: | ||
| Net Asset Value and redemption price per share ($135,154,781 ÷ 6,448,729 shares)(a) | $20.96 | |
| Maximum offering price per share (100/94.25 of $20.96) | $22.24 | |
| Class M: | ||
| Net Asset Value and redemption price per share ($58,176,725 ÷ 2,779,331 shares)(a) | $20.93 | |
| Maximum offering price per share (100/96.50 of $20.93) | $21.69 | |
| Class C: | ||
| Net Asset Value and offering price per share ($42,894,875 ÷ 2,067,919 shares)(a) | $20.74 | |
| Asset Manager 50%: | ||
| Net Asset Value, offering price and redemption price per share ($8,780,831,862 ÷ 416,905,345 shares) | $21.06 | |
| Class I: | ||
| Net Asset Value, offering price and redemption price per share ($79,267,411 ÷ 3,771,312 shares) | $21.02 | |
| Class Z: | ||
| Net Asset Value, offering price and redemption price per share ($2,039,632,437 ÷ 97,099,927 shares) | $21.01 |
(a) Redemption price per share is equal to net asset value less any applicable contingent deferred sales charge.
See accompanying notes which are an integral part of the financial statements.
Statement of Operations
| Six months ended March 31, 2022 (Unaudited) | ||
| Investment Income | ||
| Dividends | $2,164,710 | |
| Interest | 7,907 | |
| Income from Fidelity Central Funds (including $123,522 from security lending) | 117,885,259 | |
| Total income | 120,057,876 | |
| Expenses | ||
| Management fee | $27,478,917 | |
| Transfer agent fees | 5,675,568 | |
| Distribution and service plan fees | 568,964 | |
| Accounting fees | 818,376 | |
| Custodian fees and expenses | 20,743 | |
| Independent trustees' fees and expenses | 19,870 | |
| Registration fees | 80,577 | |
| Audit | 16,579 | |
| Legal | 13,162 | |
| Miscellaneous | 25,930 | |
| Total expenses before reductions | 34,718,686 | |
| Expense reductions | (179,808) | |
| Total expenses after reductions | 34,538,878 | |
| Net investment income (loss) | 85,518,998 | |
| Realized and Unrealized Gain (Loss) | ||
| Net realized gain (loss) on: | ||
| Investment securities: | ||
| Unaffiliated issuers | (6,234,080) | |
| Fidelity Central Funds | 16,154,013 | |
| Futures contracts | 71,679,935 | |
| Capital gain distributions from Fidelity Central Funds | 464,081,656 | |
| Total net realized gain (loss) | 545,681,524 | |
| Change in net unrealized appreciation (depreciation) on: | ||
| Investment securities: | ||
| Unaffiliated issuers | (15,624,780) | |
| Fidelity Central Funds | (812,194,134) | |
| Futures contracts | (69,788,324) | |
| Total change in net unrealized appreciation (depreciation) | (897,607,238) | |
| Net gain (loss) | (351,925,714) | |
| Net increase (decrease) in net assets resulting from operations | $(266,406,716) |
See accompanying notes which are an integral part of the financial statements.
Statement of Changes in Net Assets
| Six months ended March 31, 2022 (Unaudited) | Year ended September 30, 2021 | |
| Increase (Decrease) in Net Assets | ||
| Operations | ||
| Net investment income (loss) | $85,518,998 | $135,978,511 |
| Net realized gain (loss) | 545,681,524 | 148,769,411 |
| Change in net unrealized appreciation (depreciation) | (897,607,238) | 1,307,268,084 |
| Net increase (decrease) in net assets resulting from operations | (266,406,716) | 1,592,016,006 |
| Distributions to shareholders | (293,728,185) | (238,862,306) |
| Share transactions - net increase (decrease) | 142,224,333 | 534,736,459 |
| Total increase (decrease) in net assets | (417,910,568) | 1,887,890,159 |
| Net Assets | ||
| Beginning of period | 11,553,868,659 | 9,665,978,500 |
| End of period | $11,135,958,091 | $11,553,868,659 |
See accompanying notes which are an integral part of the financial statements.
Financial Highlights
Fidelity Asset Manager 50% Class A
| Six months ended (Unaudited) March 31, | Years endedSeptember 30, | |||||
| 2022 | 2021 | 2020 | 2019 | 2018 | 2017 | |
| Selected Per–Share Data | ||||||
| Net asset value, beginning of period | $21.98 | $19.33 | $18.22 | $18.58 | $18.29 | $16.91 |
| Income from Investment Operations | ||||||
| Net investment income (loss)A,B | .13 | .20 | .24 | .28 | .23 | .19 |
| Net realized and unrealized gain (loss) | (.63) | 2.86 | 1.57 | .20 | .80 | 1.46 |
| Total from investment operations | (.50) | 3.06 | 1.81 | .48 | 1.03 | 1.65 |
| Distributions from net investment income | (.21) | (.17) | (.25) | (.29) | (.21) | (.18) |
| Distributions from net realized gain | (.31) | (.24) | (.45) | (.55) | (.53) | (.09) |
| Total distributions | (.52) | (.41) | (.70) | (.84) | (.74) | (.27) |
| Net asset value, end of period | $20.96 | $21.98 | $19.33 | $18.22 | $18.58 | $18.29 |
| Total ReturnC,D,E | (2.38)% | 15.99% | 10.15% | 3.07% | 5.74% | 9.90% |
| Ratios to Average Net AssetsB,F,G | ||||||
| Expenses before reductions | .90%H | .91% | .93% | .94% | .94% | .96% |
| Expenses net of fee waivers, if any | .90%H | .91% | .92% | .94% | .94% | .96% |
| Expenses net of all reductions | .90%H | .91% | .92% | .94% | .94% | .95% |
| Net investment income (loss) | 1.17%H | .94% | 1.32% | 1.57% | 1.24% | 1.08% |
| Supplemental Data | ||||||
| Net assets, end of period (000 omitted) | $135,155 | $134,052 | $106,339 | $95,542 | $86,252 | $75,623 |
| Portfolio turnover rateI | 16%H | 17% | 24% | 37% | 15% | 20% |
A Calculated based on average shares outstanding during the period.
B Net investment income (loss) is affected by the timing of the declaration of dividends by any underlying mutual funds or exchange-traded funds (ETFs). Net investment income (loss) of any such underlying funds is not included in the Fund's net investment income (loss) ratio.
C Total returns for periods of less than one year are not annualized.
D Total returns would have been lower if certain expenses had not been reduced during the applicable periods shown.
E Total returns do not include the effect of the sales charges.
F Fees and expenses of any underlying mutual funds or exchange-traded funds (ETFs) are not included in the Fund's expense ratio. The Fund indirectly bears its proportionate share of these expenses. For additional expense information related to investments in Fidelity Central Funds, please refer to the "Investments in Fidelity Central Funds" note found in the Notes to Financial Statements section of the most recent Annual or Semi-Annual report.
G Expense ratios reflect operating expenses of the class. Expenses before reductions do not reflect amounts reimbursed, waived, or reduced through arrangements with the investment adviser, brokerage services, or other offset arrangements, if applicable, and do not represent the amount paid by the class during periods when reimbursements, waivers or reductions occur.
H Annualized
I Amount does not include the portfolio activity of any underlying mutual funds or exchange-traded funds (ETFs).
See accompanying notes which are an integral part of the financial statements.
Fidelity Asset Manager 50% Class M
| Six months ended (Unaudited) March 31, | Years endedSeptember 30, | |||||
| 2022 | 2021 | 2020 | 2019 | 2018 | 2017 | |
| Selected Per–Share Data | ||||||
| Net asset value, beginning of period | $21.95 | $19.31 | $18.20 | $18.56 | $18.27 | $16.90 |
| Income from Investment Operations | ||||||
| Net investment income (loss)A,B | .10 | .15 | .20 | .23 | .18 | .14 |
| Net realized and unrealized gain (loss) | (.62) | 2.85 | 1.57 | .21 | .80 | 1.46 |
| Total from investment operations | (.52) | 3.00 | 1.77 | .44 | .98 | 1.60 |
| Distributions from net investment income | (.19) | (.12) | (.20) | (.25) | (.16) | (.14) |
| Distributions from net realized gain | (.31) | (.24) | (.45) | (.55) | (.53) | (.09) |
| Total distributions | (.50) | (.36) | (.66)C | (.80) | (.69) | (.23) |
| Net asset value, end of period | $20.93 | $21.95 | $19.31 | $18.20 | $18.56 | $18.27 |
| Total ReturnD,E,F | (2.50)% | 15.69% | 9.89% | 2.81% | 5.48% | 9.57% |
| Ratios to Average Net AssetsB,G,H | ||||||
| Expenses before reductions | 1.14%I | 1.15% | 1.17% | 1.18% | 1.19% | 1.21% |
| Expenses net of fee waivers, if any | 1.14%I | 1.15% | 1.16% | 1.18% | 1.19% | 1.21% |
| Expenses net of all reductions | 1.14%I | 1.15% | 1.16% | 1.18% | 1.19% | 1.21% |
| Net investment income (loss) | .93%I | .70% | 1.08% | 1.33% | .99% | .83% |
| Supplemental Data | ||||||
| Net assets, end of period (000 omitted) | $58,177 | $57,507 | $45,076 | $42,658 | $41,222 | $36,209 |
| Portfolio turnover rateJ | 16%I | 17% | 24% | 37% | 15% | 20% |
A Calculated based on average shares outstanding during the period.
B Net investment income (loss) is affected by the timing of the declaration of dividends by any underlying mutual funds or exchange-traded funds (ETFs). Net investment income (loss) of any such underlying funds is not included in the Fund's net investment income (loss) ratio.
C Total distributions per share do not sum due to rounding.
D Total returns for periods of less than one year are not annualized.
E Total returns would have been lower if certain expenses had not been reduced during the applicable periods shown.
F Total returns do not include the effect of the sales charges.
G Fees and expenses of any underlying mutual funds or exchange-traded funds (ETFs) are not included in the Fund's expense ratio. The Fund indirectly bears its proportionate share of these expenses. For additional expense information related to investments in Fidelity Central Funds, please refer to the "Investments in Fidelity Central Funds" note found in the Notes to Financial Statements section of the most recent Annual or Semi-Annual report.
H Expense ratios reflect operating expenses of the class. Expenses before reductions do not reflect amounts reimbursed, waived, or reduced through arrangements with the investment adviser, brokerage services, or other offset arrangements, if applicable, and do not represent the amount paid by the class during periods when reimbursements, waivers or reductions occur.
I Annualized
J Amount does not include the portfolio activity of any underlying mutual funds or exchange-traded funds (ETFs).
See accompanying notes which are an integral part of the financial statements.
Fidelity Asset Manager 50% Class C
| Six months ended (Unaudited) March 31, | Years endedSeptember 30, | |||||
| 2022 | 2021 | 2020 | 2019 | 2018 | 2017 | |
| Selected Per–Share Data | ||||||
| Net asset value, beginning of period | $21.76 | $19.16 | $18.05 | $18.42 | $18.15 | $16.79 |
| Income from Investment Operations | ||||||
| Net investment income (loss)A,B | .04 | .04 | .10 | .14 | .09 | .05 |
| Net realized and unrealized gain (loss) | (.62) | 2.84 | 1.57 | .20 | .79 | 1.46 |
| Total from investment operations | (.58) | 2.88 | 1.67 | .34 | .88 | 1.51 |
| Distributions from net investment income | (.13) | (.04) | (.11) | (.16) | (.08) | (.06) |
| Distributions from net realized gain | (.31) | (.24) | (.45) | (.55) | (.53) | (.09) |
| Total distributions | (.44) | (.28) | (.56) | (.71) | (.61) | (.15) |
| Net asset value, end of period | $20.74 | $21.76 | $19.16 | $18.05 | $18.42 | $18.15 |
| Total ReturnC,D,E | (2.79)% | 15.12% | 9.38% | 2.25% | 4.93% | 9.07% |
| Ratios to Average Net AssetsB,F,G | ||||||
| Expenses before reductions | 1.66%H | 1.67% | 1.68% | 1.69% | 1.70% | 1.72% |
| Expenses net of fee waivers, if any | 1.66%H | 1.67% | 1.68% | 1.69% | 1.70% | 1.72% |
| Expenses net of all reductions | 1.66%H | 1.67% | 1.68% | 1.69% | 1.70% | 1.71% |
| Net investment income (loss) | .42%H | .18% | .56% | .82% | .49% | .32% |
| Supplemental Data | ||||||
| Net assets, end of period (000 omitted) | $42,895 | $51,226 | $44,990 | $46,487 | $51,337 | $41,900 |
| Portfolio turnover rateI | 16%H | 17% | 24% | 37% | 15% | 20% |
A Calculated based on average shares outstanding during the period.
B Net investment income (loss) is affected by the timing of the declaration of dividends by any underlying mutual funds or exchange-traded funds (ETFs). Net investment income (loss) of any such underlying funds is not included in the Fund's net investment income (loss) ratio.
C Total returns for periods of less than one year are not annualized.
D Total returns would have been lower if certain expenses had not been reduced during the applicable periods shown.
E Total returns do not include the effect of the contingent deferred sales charge.
F Fees and expenses of any underlying mutual funds or exchange-traded funds (ETFs) are not included in the Fund's expense ratio. The Fund indirectly bears its proportionate share of these expenses. For additional expense information related to investments in Fidelity Central Funds, please refer to the "Investments in Fidelity Central Funds" note found in the Notes to Financial Statements section of the most recent Annual or Semi-Annual report.
G Expense ratios reflect operating expenses of the class. Expenses before reductions do not reflect amounts reimbursed, waived, or reduced through arrangements with the investment adviser, brokerage services, or other offset arrangements, if applicable, and do not represent the amount paid by the class during periods when reimbursements, waivers or reductions occur.
H Annualized
I Amount does not include the portfolio activity of any underlying mutual funds or exchange-traded funds (ETFs).
See accompanying notes which are an integral part of the financial statements.
Fidelity Asset Manager 50%
| Six months ended (Unaudited) March 31, | Years endedSeptember 30, | |||||
| 2022 | 2021 | 2020 | 2019 | 2018 | 2017 | |
| Selected Per–Share Data | ||||||
| Net asset value, beginning of period | $22.09 | $19.42 | $18.30 | $18.66 | $18.37 | $16.98 |
| Income from Investment Operations | ||||||
| Net investment income (loss)A,B | .16 | .27 | .30 | .33 | .29 | .24 |
| Net realized and unrealized gain (loss) | (.63) | 2.87 | 1.58 | .21 | .80 | 1.47 |
| Total from investment operations | (.47) | 3.14 | 1.88 | .54 | 1.09 | 1.71 |
| Distributions from net investment income | (.25) | (.23) | (.30) | (.35) | (.26) | (.24) |
| Distributions from net realized gain | (.31) | (.24) | (.45) | (.55) | (.53) | (.09) |
| Total distributions | (.56) | (.47) | (.76)C | (.90) | (.80)C | (.32)C |
| Net asset value, end of period | $21.06 | $22.09 | $19.42 | $18.30 | $18.66 | $18.37 |
| Total ReturnD,E | (2.27)% | 16.36% | 10.51% | 3.37% | 6.05% | 10.26% |
| Ratios to Average Net AssetsB,F,G | ||||||
| Expenses before reductions | .60%H | .61% | .62% | .63% | .63% | .65% |
| Expenses net of fee waivers, if any | .60%H | .60% | .62% | .63% | .63% | .64% |
| Expenses net of all reductions | .60%H | .60% | .62% | .63% | .63% | .64% |
| Net investment income (loss) | 1.47%H | 1.25% | 1.63% | 1.88% | 1.55% | 1.39% |
| Supplemental Data | ||||||
| Net assets, end of period (000 omitted) | $8,780,832 | $9,274,634 | $9,387,915 | $9,026,444 | $9,140,811 | $8,324,452 |
| Portfolio turnover rateI | 16%H | 17% | 24% | 37% | 15% | 20% |
A Calculated based on average shares outstanding during the period.
B Net investment income (loss) is affected by the timing of the declaration of dividends by any underlying mutual funds or exchange-traded funds (ETFs). Net investment income (loss) of any such underlying funds is not included in the Fund's net investment income (loss) ratio.
C Total distributions per share do not sum due to rounding.
D Total returns for periods of less than one year are not annualized.
E Total returns would have been lower if certain expenses had not been reduced during the applicable periods shown.
F Fees and expenses of any underlying mutual funds or exchange-traded funds (ETFs) are not included in the Fund's expense ratio. The Fund indirectly bears its proportionate share of these expenses. For additional expense information related to investments in Fidelity Central Funds, please refer to the "Investments in Fidelity Central Funds" note found in the Notes to Financial Statements section of the most recent Annual or Semi-Annual report.
G Expense ratios reflect operating expenses of the class. Expenses before reductions do not reflect amounts reimbursed, waived, or reduced through arrangements with the investment adviser, brokerage services, or other offset arrangements, if applicable, and do not represent the amount paid by the class during periods when reimbursements, waivers or reductions occur.
H Annualized
I Amount does not include the portfolio activity of any underlying mutual funds or exchange-traded funds (ETFs).
See accompanying notes which are an integral part of the financial statements.
Fidelity Asset Manager 50% Class I
| Six months ended (Unaudited) March 31, | Years endedSeptember 30, | |||||
| 2022 | 2021 | 2020 | 2019 | 2018 | 2017 | |
| Selected Per–Share Data | ||||||
| Net asset value, beginning of period | $22.04 | $19.38 | $18.26 | $18.62 | $18.33 | $16.95 |
| Income from Investment Operations | ||||||
| Net investment income (loss)A,B | .16 | .26 | .29 | .33 | .28 | .24 |
| Net realized and unrealized gain (loss) | (.63) | 2.87 | 1.58 | .20 | .80 | 1.46 |
| Total from investment operations | (.47) | 3.13 | 1.87 | .53 | 1.08 | 1.70 |
| Distributions from net investment income | (.24) | (.23) | (.30) | (.34) | (.26) | (.23) |
| Distributions from net realized gain | (.31) | (.24) | (.45) | (.55) | (.53) | (.09) |
| Total distributions | (.55) | (.47) | (.75) | (.89) | (.79) | (.32) |
| Net asset value, end of period | $21.02 | $22.04 | $19.38 | $18.26 | $18.62 | $18.33 |
| Total ReturnC,D | (2.24)% | 16.30% | 10.49% | 3.33% | 6.02% | 10.17% |
| Ratios to Average Net AssetsB,E,F | ||||||
| Expenses before reductions | .63%G | .64% | .65% | .66% | .67% | .68% |
| Expenses net of fee waivers, if any | .63%G | .64% | .65% | .66% | .67% | .68% |
| Expenses net of all reductions | .63%G | .64% | .65% | .66% | .67% | .68% |
| Net investment income (loss) | 1.44%G | 1.21% | 1.59% | 1.85% | 1.52% | 1.35% |
| Supplemental Data | ||||||
| Net assets, end of period (000 omitted) | $79,267 | $81,320 | $55,021 | $62,141 | $75,904 | $42,497 |
| Portfolio turnover rateH | 16%G | 17% | 24% | 37% | 15% | 20% |
A Calculated based on average shares outstanding during the period.
B Net investment income (loss) is affected by the timing of the declaration of dividends by any underlying mutual funds or exchange-traded funds (ETFs). Net investment income (loss) of any such underlying funds is not included in the Fund's net investment income (loss) ratio.
C Total returns for periods of less than one year are not annualized.
D Total returns would have been lower if certain expenses had not been reduced during the applicable periods shown.
E Fees and expenses of any underlying mutual funds or exchange-traded funds (ETFs) are not included in the Fund's expense ratio. The Fund indirectly bears its proportionate share of these expenses. For additional expense information related to investments in Fidelity Central Funds, please refer to the "Investments in Fidelity Central Funds" note found in the Notes to Financial Statements section of the most recent Annual or Semi-Annual report.
F Expense ratios reflect operating expenses of the class. Expenses before reductions do not reflect amounts reimbursed, waived, or reduced through arrangements with the investment adviser, brokerage services, or other offset arrangements, if applicable, and do not represent the amount paid by the class during periods when reimbursements, waivers or reductions occur.
G Annualized
H Amount does not include the portfolio activity of any underlying mutual funds or exchange-traded funds (ETFs).
See accompanying notes which are an integral part of the financial statements.
Fidelity Asset Manager 50% Class Z
| Six months ended (Unaudited) March 31, | Years endedSeptember 30, | |||
| 2022 | 2021 | 2020 | 2019 A | |
| Selected Per–Share Data | ||||
| Net asset value, beginning of period | $22.03 | $19.37 | $18.26 | $18.59 |
| Income from Investment Operations | ||||
| Net investment income (loss)B,C | .17 | .28 | .31 | .35 |
| Net realized and unrealized gain (loss) | (.62) | 2.87 | 1.57 | .23 |
| Total from investment operations | (.45) | 3.15 | 1.88 | .58 |
| Distributions from net investment income | (.26) | (.25) | (.32) | (.36) |
| Distributions from net realized gain | (.31) | (.24) | (.45) | (.55) |
| Total distributions | (.57) | (.49) | (.77) | (.91) |
| Net asset value, end of period | $21.01 | $22.03 | $19.37 | $18.26 |
| Total ReturnD,E | (2.18)% | 16.43% | 10.56% | 3.61% |
| Ratios to Average Net AssetsC,F,G | ||||
| Expenses before reductions | .53%H | .54% | .55% | .55%H |
| Expenses net of fee waivers, if any | .53%H | .54% | .54% | .55%H |
| Expenses net of all reductions | .53%H | .54% | .54% | .55%H |
| Net investment income (loss) | 1.54%H | 1.32% | 1.70% | 1.96%H |
| Supplemental Data | ||||
| Net assets, end of period (000 omitted) | $2,039,632 | $1,955,130 | $26,638 | $20,968 |
| Portfolio turnover rateI | 16%H | 17% | 24% | 37% |
A For the period October 2, 2018 (commencement of sale of shares) through September 30, 2019.
B Calculated based on average shares outstanding during the period.
C Net investment income (loss) is affected by the timing of the declaration of dividends by any underlying mutual funds or exchange-traded funds (ETFs). Net investment income (loss) of any such underlying funds is not included in the Fund's net investment income (loss) ratio.
D Total returns for periods of less than one year are not annualized.
E Total returns would have been lower if certain expenses had not been reduced during the applicable periods shown.
F Fees and expenses of any underlying mutual funds or exchange-traded funds (ETFs) are not included in the Fund's expense ratio. The Fund indirectly bears its proportionate share of these expenses. For additional expense information related to investments in Fidelity Central Funds, please refer to the "Investments in Fidelity Central Funds" note found in the Notes to Financial Statements section of the most recent Annual or Semi-Annual report.
G Expense ratios reflect operating expenses of the class. Expenses before reductions do not reflect amounts reimbursed, waived, or reduced through arrangements with the investment adviser, brokerage services, or other offset arrangements, if applicable, and do not represent the amount paid by the class during periods when reimbursements, waivers or reductions occur.
H Annualized
I Amount does not include the portfolio activity of any underlying mutual funds or exchange-traded funds (ETFs).
See accompanying notes which are an integral part of the financial statements.
Fidelity Asset Manager® 60%
Investment Summary (Unaudited)
The information in the following tables is based on the combined investments of the Fund and its pro-rata share of the investments of Fidelity's Central Funds, other than the Commodity Strategy and Money Market Central Funds.Top Ten Stocks as of March 31, 2022
| % of fund's net assets | |
| Apple, Inc. | 3.1 |
| Microsoft Corp. | 3.0 |
| Alphabet, Inc. Class A | 2.1 |
| Amazon.com, Inc. | 1.6 |
| Meta Platforms, Inc. Class A | 0.7 |
| UnitedHealth Group, Inc. | 0.6 |
| Tesla, Inc. | 0.6 |
| Exxon Mobil Corp. | 0.6 |
| Wells Fargo & Co. | 0.5 |
| Taiwan Semiconductor Manufacturing Co. Ltd. | 0.5 |
| 13.3 |
Market Sectors as of March 31, 2022
| % of fund's net assets | |
| Information Technology | 16.0 |
| Financials | 15.6 |
| Consumer Discretionary | 8.3 |
| Health Care | 8.3 |
| Industrials | 7.9 |
| Communication Services | 5.8 |
| Consumer Staples | 4.3 |
| Real Estate | 4.3 |
| Energy | 3.4 |
| Materials | 3.0 |
| Utilities | 2.1 |
Quality Diversification (% of fund's net assets)
| As of March 31, 2022 | ||
| U.S. Government and U.S. Government Agency Obligations | 15.5% | |
| AAA,AA,A | 4.0% | |
| BBB | 5.9% | |
| BB and Below | 5.1% | |
| Not Rated | 1.2% | |
| Equities* | 66.9% | |
| Short-Term Investments and Net Other Assets | 1.4% | |
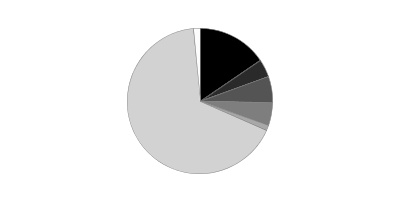
* Includes investment in Fidelity® Commodity Strategy Central Fund of 1.5%
We have used ratings from Moody's Investors Service, Inc. Where Moody's® ratings are not available, we have used S&P® ratings. All ratings are as of the date indicated and do not reflect subsequent changes.
Asset Allocation (% of fund's net assets)
| As of March 31, 2022 | ||
| Stocks and Equity Futures* | 65.1% | |
| Bond Class | 32.8% | |
| Short-Term Class | 2.1% | |

* Includes investment in Fidelity® Commodity Strategy Central Fund of 1.5%
Asset allocations in the pie charts reflect the categorization of assets as defined in the Fund's prospectus in effect as of the time periods indicated above. Percentages are adjusted for the effect of future contracts and swap contracts, if applicable.
Geographic Diversification (% of fund's net assets)
| As of March 31, 2022 | ||
| United States of America | 76.8% | |
| United Kingdom | 2.4% | |
| Cayman Islands | 2.4% | |
| France | 1.8% | |
| Canada | 1.8% | |
| Japan | 1.6% | |
| Switzerland | 1.3% | |
| Netherlands | 1.3% | |
| Germany | 1.3% | |
| Other | 9.3% | |

Percentages are based on country or territory of incorporation and are adjusted for the effect of futures contracts, if applicable.
At period end, foreign investments including the Fund's pro-rata share of the underlying Central Funds, other than the Commodity Strategy Central and Money Market Funds, was 23.2% of net assets.
Percentages in the above tables are adjusted for the effect of TBA Sale Commitments.
An unaudited holdings listing for the Fund, which presents direct holdings as well as the pro-rata share of any securities and other investments held indirectly through its investment in underlying Fidelity Central Funds, other than the Commodity Strategy and Money Market Central Funds, is available at fidelity.com and/or institutional.fidelity.com, as applicable.
Fidelity Asset Manager® 60%
Schedule of Investments March 31, 2022 (Unaudited)
Showing Percentage of Net Assets
| Equity Central Funds - 65.4% | |||
| Shares | Value | ||
| Fidelity Commodity Strategy Central Fund (a)(b) | 10,915,520 | $67,348,760 | |
| Fidelity Emerging Markets Equity Central Fund (b) | 1,061,266 | 228,861,972 | |
| Fidelity International Equity Central Fund (b) | 5,050,726 | 481,738,210 | |
| Fidelity Real Estate Equity Central Fund (b) | 447,686 | 68,178,101 | |
| Fidelity U.S. Equity Central Fund (b) | 16,220,936 | 2,008,962,873 | |
| TOTAL EQUITY CENTRAL FUNDS | |||
| (Cost $1,930,166,572) | 2,855,089,916 | ||
| Fixed-Income Central Funds - 31.1% | |||
| High Yield Fixed-Income Funds - 5.0% | |||
| Fidelity Emerging Markets Debt Central Fund (b) | 1,400,303 | 11,608,514 | |
| Fidelity Emerging Markets Debt Local Currency Central Fund (b) | 112,452 | 9,931,754 | |
| Fidelity Floating Rate Central Fund (b) | 1,622,163 | 161,810,759 | |
| Fidelity High Income Central Fund (b) | 308,375 | 34,124,736 | |
| TOTAL HIGH YIELD FIXED-INCOME FUNDS | 217,475,763 | ||
| Investment Grade Fixed-Income Funds - 26.1% | |||
| Fidelity Inflation-Protected Bond Index Central Fund (b) | 820,388 | 85,509,060 | |
| Fidelity International Credit Central Fund (b) | 566,820 | 53,417,152 | |
| Fidelity Investment Grade Bond Central Fund (b) | 9,350,138 | 1,001,306,329 | |
| TOTAL INVESTMENT GRADE FIXED-INCOME FUNDS | 1,140,232,541 | ||
| TOTAL FIXED-INCOME CENTRAL FUNDS | |||
| (Cost $1,360,158,365) | 1,357,708,304 | ||
| Money Market Central Funds - 2.8% | |||
| Fidelity Cash Central Fund 0.31% (c) | 56,527,781 | 56,539,087 | |
| Fidelity Securities Lending Cash Central Fund 0.31% (c)(d) | 65,831,167 | 65,837,750 | |
| TOTAL MONEY MARKET CENTRAL FUNDS | |||
| (Cost $122,376,837) | 122,376,837 | ||
| Principal Amount | Value | ||
| U.S. Treasury Obligations - 0.2% | |||
| U.S. Treasury Bills, yield at date of purchase 0.11% to 0.5% 4/14/22 to 6/30/22 (e) | |||
| (Cost $7,367,960) | 7,370,000 | 7,367,947 | |
| Shares | Value | ||
| Investment Companies - 2.0% | |||
| iShares 20+ Year Treasury Bond ETF (f) | |||
| (Cost $97,281,954) | 644,657 | 85,146,296 | |
| TOTAL INVESTMENT IN SECURITIES - 101.5% | |||
| (Cost $3,517,351,688) | 4,427,689,300 | ||
| NET OTHER ASSETS (LIABILITIES) - (1.5)% | (64,001,867) | ||
| NET ASSETS - 100% | $4,363,687,433 |
| Futures Contracts | |||||
| Number of contracts | Expiration Date | Notional Amount | Value | Unrealized Appreciation/(Depreciation) | |
| Purchased | |||||
| Equity Index Contracts | |||||
| ICE E-mini MSCI Emerging Markets Index Contracts (United States) | 297 | June 2022 | $16,713,675 | $1,275,210 | $1,275,210 |
| TOTAL PURCHASED FUTURES | 1,275,210 | ||||
| Sold | |||||
| Equity Index Contracts | |||||
| CME Micro E-mini S&P 500 Index Contracts (United States) | 389 | June 2022 | 88,123,088 | (4,645,289) | (4,645,289) |
| ICE E-mini MSCI EAFE Index Contracts (United States) | 851 | June 2022 | 91,244,220 | (5,291,593) | (5,291,593) |
| TOTAL SOLD FUTURES | (9,936,882) | ||||
| TOTAL FUTURES CONTRACTS | $(8,661,672) |
The notional amount of futures purchased as a percentage of Net Assets is 0.4%
The notional amount of futures sold as a percentage of Net Assets is 4.1%
For the period, the average monthly notional amount at value for futures contracts in the aggregate was $226,187,125.
Security Type Abbreviations
ETF – Exchange-Traded Fund
Legend
(a) Non-income producing
(b) Affiliated fund that is generally available only to investment companies and other accounts managed by Fidelity Investments. A complete unaudited schedule of portfolio holdings for each Fidelity Central Fund is filed with the SEC for the first and third quarters of each fiscal year on Form N-PORT and is available upon request or at the SEC's website at www.sec.gov. An unaudited holdings listing for the Fund, which presents direct holdings as well as the pro-rata share of securities and other investments held indirectly through its investment in underlying non-money market Fidelity Central Funds, other than the Commodity Strategy Central Fund, is available at fidelity.com and/or institutional.fidelity.com, as applicable. In addition, each Fidelity Central Fund's financial statements are available on the SEC's website or upon request.
(c) Affiliated fund that is generally available only to investment companies and other accounts managed by Fidelity Investments. The rate quoted is the annualized seven-day yield of the fund at period end. A complete unaudited listing of the fund's holdings as of its most recent quarter end is available upon request. In addition, each Fidelity Central Fund's financial statements are available on the SEC's website or upon request.
(d) Investment made with cash collateral received from securities on loan.
(e) Security or a portion of the security was pledged to cover margin requirements for futures contracts. At period end, the value of securities pledged amounted to $7,367,947.
(f) Security or a portion of the security is on loan at period end.
Affiliated Central Funds
Fiscal year to date information regarding the Fund's investments in Fidelity Central Funds, including the ownership percentage, is presented below.
| Fund | Value, beginning of period | Purchases | Sales Proceeds | Dividend Income | Realized Gain (loss) | Change in Unrealized appreciation (depreciation) | Value, end of period | % ownership, end of period |
| Fidelity Cash Central Fund 0.31% | $13,410,720 | $187,923,693 | $144,795,326 | $18,392 | $-- | $-- | $56,539,087 | 0.1 |
| Fidelity Commodity Strategy Central Fund | 83,949,527 | 7,032,797 | 40,507,001 | -- | 5,050,680 | 11,822,757 | 67,348,760 | 11.6 |
| Fidelity Emerging Markets Debt Central Fund | 11,414,065 | 2,049,542 | 694,817 | 268,762 | (42,280) | (1,117,996) | 11,608,514 | 0.4 |
| Fidelity Emerging Markets Debt Local Currency Central Fund | 10,653,577 | 583,908 | -- | 583,908 | -- | (1,305,731) | 9,931,754 | 11 |
| Fidelity Emerging Markets Equity Central Fund | 234,454,964 | 72,150,371 | 20,179,534 | 18,665,717 | 5,605,724 | (63,169,553) | 228,861,972 | 12.7 |
| Fidelity Floating Rate Central Fund | 108,883,104 | 59,550,571 | 4,882,912 | 2,982,458 | (69,833) | (1,670,171) | 161,810,759 | 5 |
| Fidelity High Income Central Fund | 53,808,126 | 3,688,027 | 21,899,055 | 1,042,923 | 1,678,644 | (3,151,006) | 34,124,736 | 1.6 |
| Fidelity Inflation-Protected Bond Index Central Fund | 133,048,713 | 19,558,050 | 57,688,823 | 9,968,985 | (876,922) | (8,531,958) | 85,509,060 | 13.1 |
| Fidelity International Credit Central Fund | 64,982,674 | 6,150,874 | 12,779,498 | 1,093,267 | (734,487) | (4,202,411) | 53,417,152 | 10.4 |
| Fidelity International Equity Central Fund | 439,305,209 | 112,058,559 | 13,405,999 | 29,173,278 | (1,579,547) | (54,640,012) | 481,738,210 | 12.6 |
| Fidelity Investment Grade Bond Central Fund | 930,743,696 | 186,105,439 | 49,283,651 | 10,955,772 | (544,374) | (65,714,781) | 1,001,306,329 | 2.9 |
| Fidelity Real Estate Equity Central Fund | 62,092,953 | 26,679,204 | 24,250,395 | 832,242 | (1,361,211) | 5,017,550 | 68,178,101 | 4.1 |
| Fidelity Securities Lending Cash Central Fund 0.31% | 115,178,950 | 461,652,110 | 510,993,310 | 81,313 | -- | -- | 65,837,750 | 0.1 |
| Fidelity U.S. Equity Central Fund | 1,957,199,900 | 313,892,210 | 124,633,796 | 166,184,593 | (2,260,441) | (135,235,000) | 2,008,962,873 | 9.2 |
| $4,219,126,178 | $1,459,075,355 | $1,025,994,117 | $241,851,610 | $4,865,953 | $(321,898,312) | $4,335,175,057 |
Amounts in the income column in the above table include any capital gain distributions from underlying funds, which are presented in the corresponding line-item in the Statement of Operations, if applicable. Amount for Fidelity Securities Lending Cash Central Fund represents the income earned on investing cash collateral, less rebates paid to borrowers and any lending agent fees associated with the loan, plus any premium payments received for lending certain types of securities.
Investment Valuation
The following is a summary of the inputs used, as of March 31, 2022, involving the Fund's assets and liabilities carried at fair value. The inputs or methodology used for valuing securities may not be an indication of the risk associated with investing in those securities. For more information on valuation inputs, and their aggregation into the levels used below, please refer to the Investment Valuation section in the accompanying Notes to Financial Statements.
| Valuation Inputs at Reporting Date: | ||||
| Description | Total | Level 1 | Level 2 | Level 3 |
| Investments in Securities: | ||||
| Equity Central Funds | $2,855,089,916 | $2,855,089,916 | $-- | $-- |
| Fixed-Income Central Funds | 1,357,708,304 | 1,357,708,304 | -- | -- |
| Money Market Central Funds | 122,376,837 | 122,376,837 | -- | -- |
| U.S. Treasury Obligations | 7,367,947 | -- | 7,367,947 | -- |
| Investment Companies | 85,146,296 | 85,146,296 | -- | -- |
| Total Investments in Securities: | $4,427,689,300 | $4,420,321,353 | $7,367,947 | $-- |
| Derivative Instruments: | ||||
| Assets | ||||
| Futures Contracts | $1,275,210 | $1,275,210 | $-- | $-- |
| Total Assets | $1,275,210 | $1,275,210 | $-- | $-- |
| Liabilities | ||||
| Futures Contracts | $(9,936,882) | $(9,936,882) | $-- | $-- |
| Total Liabilities | $(9,936,882) | $(9,936,882) | $-- | $-- |
| Total Derivative Instruments: | $(8,661,672) | $(8,661,672) | $-- | $-- |
Value of Derivative Instruments
The following table is a summary of the Fund's value of derivative instruments by primary risk exposure as of March 31, 2022. For additional information on derivative instruments, please refer to the Derivative Instruments section in the accompanying Notes to Financial Statements.
| Primary Risk Exposure / Derivative Type | Value | |
| Asset | Liability | |
| Equity Risk | ||
| Futures Contracts(a) | $1,275,210 | $(9,936,882) |
| Total Equity Risk | 1,275,210 | (9,936,882) |
| Total Value of Derivatives | $1,275,210 | $(9,936,882) |
(a) Reflects gross cumulative appreciation (depreciation) on futures contracts as presented in the Schedule of Investments. In the Statement of Assets and Liabilities, the period end daily variation margin is included in receivable or payable for daily variation margin on futures contracts, and the net cumulative appreciation (depreciation) is included in Total accumulated earnings (loss).
See accompanying notes which are an integral part of the financial statements.
Fidelity Asset Manager® 60%
Financial Statements
Statement of Assets and Liabilities
| March 31, 2022 (Unaudited) | ||
| Assets | ||
| Investment in securities, at value (including securities loaned of $64,653,160) — See accompanying schedule: Unaffiliated issuers (cost $104,649,914) | $92,514,243 | |
| Fidelity Central Funds (cost $3,412,701,774) | 4,335,175,057 | |
| Total Investment in Securities (cost $3,517,351,688) | $4,427,689,300 | |
| Receivable for investments sold | 997,755 | |
| Receivable for fund shares sold | 2,971,163 | |
| Dividends receivable | 20,948 | |
| Distributions receivable from Fidelity Central Funds | 26,176 | |
| Receivable for daily variation margin on futures contracts | 2,580,430 | |
| Prepaid expenses | 2,068 | |
| Other receivables | 2,575 | |
| Total assets | 4,434,290,415 | |
| Liabilities | ||
| Payable for investments purchased | $28,932 | |
| Payable for fund shares redeemed | 2,250,345 | |
| Distributions payable | 8 | |
| Accrued management fee | 1,879,271 | |
| Distribution and service plan fees payable | 95,145 | |
| Other affiliated payables | 450,310 | |
| Other payables and accrued expenses | 61,221 | |
| Collateral on securities loaned | 65,837,750 | |
| Total liabilities | 70,602,982 | |
| Net Assets | $4,363,687,433 | |
| Net Assets consist of: | ||
| Paid in capital | $3,438,215,872 | |
| Total accumulated earnings (loss) | 925,471,561 | |
| Net Assets | $4,363,687,433 | |
| Net Asset Value and Maximum Offering Price | ||
| Class A: | ||
| Net Asset Value and redemption price per share ($167,999,377 ÷ 11,059,959 shares)(a) | $15.19 | |
| Maximum offering price per share (100/94.25 of $15.19) | $16.12 | |
| Class M: | ||
| Net Asset Value and redemption price per share ($53,271,390 ÷ 3,525,714 shares)(a) | $15.11 | |
| Maximum offering price per share (100/96.50 of $15.11) | $15.66 | |
| Class C: | ||
| Net Asset Value and offering price per share ($46,556,141 ÷ 3,118,761 shares)(a) | $14.93 | |
| Asset Manager 60%: | ||
| Net Asset Value, offering price and redemption price per share ($2,407,942,408 ÷ 157,684,542 shares) | $15.27 | |
| Class I: | ||
| Net Asset Value, offering price and redemption price per share ($113,237,987 ÷ 7,412,169 shares) | $15.28 | |
| Class Z: | ||
| Net Asset Value, offering price and redemption price per share ($1,574,680,130 ÷ 103,191,382 shares) | $15.26 |
(a) Redemption price per share is equal to net asset value less any applicable contingent deferred sales charge.
See accompanying notes which are an integral part of the financial statements.
Statement of Operations
| Six months ended March 31, 2022 (Unaudited) | ||
| Investment Income | ||
| Dividends | $857,835 | |
| Interest | 11,600 | |
| Income from Fidelity Central Funds (including $81,313 from security lending) | 43,501,186 | |
| Total income | 44,370,621 | |
| Expenses | ||
| Management fee | $11,566,789 | |
| Transfer agent fees | 1,949,152 | |
| Distribution and service plan fees | 622,060 | |
| Accounting fees | 671,231 | |
| Custodian fees and expenses | 17,461 | |
| Independent trustees' fees and expenses | 7,407 | |
| Registration fees | 81,175 | |
| Audit | 16,579 | |
| Legal | 8,994 | |
| Miscellaneous | 9,689 | |
| Total expenses before reductions | 14,950,537 | |
| Expense reductions | (67,035) | |
| Total expenses after reductions | 14,883,502 | |
| Net investment income (loss) | 29,487,119 | |
| Realized and Unrealized Gain (Loss) | ||
| Net realized gain (loss) on: | ||
| Investment securities: | ||
| Unaffiliated issuers | (2,856,533) | |
| Fidelity Central Funds | 4,865,953 | |
| Foreign currency transactions | 172 | |
| Futures contracts | 15,664,779 | |
| Capital gain distributions from Fidelity Central Funds | 198,350,424 | |
| Total net realized gain (loss) | 216,024,795 | |
| Change in net unrealized appreciation (depreciation) on: | ||
| Investment securities: | ||
| Unaffiliated issuers | (5,711,485) | |
| Fidelity Central Funds | (321,898,312) | |
| Assets and liabilities in foreign currencies | (1,396) | |
| Futures contracts | (19,059,133) | |
| Total change in net unrealized appreciation (depreciation) | (346,670,326) | |
| Net gain (loss) | (130,645,531) | |
| Net increase (decrease) in net assets resulting from operations | $(101,158,412) |
See accompanying notes which are an integral part of the financial statements.
Statement of Changes in Net Assets
| Six months ended March 31, 2022 (Unaudited) | Year ended September 30, 2021 | |
| Increase (Decrease) in Net Assets | ||
| Operations | ||
| Net investment income (loss) | $29,487,119 | $43,948,895 |
| Net realized gain (loss) | 216,024,795 | 22,518,281 |
| Change in net unrealized appreciation (depreciation) | (346,670,326) | 582,212,450 |
| Net increase (decrease) in net assets resulting from operations | (101,158,412) | 648,679,626 |
| Distributions to shareholders | (114,158,802) | (68,041,389) |
| Share transactions - net increase (decrease) | 346,476,197 | 387,357,243 |
| Total increase (decrease) in net assets | 131,158,983 | 967,995,480 |
| Net Assets | ||
| Beginning of period | 4,232,528,450 | 3,264,532,970 |
| End of period | $4,363,687,433 | $4,232,528,450 |
See accompanying notes which are an integral part of the financial statements.
Financial Highlights
Fidelity Asset Manager 60% Class A
| Six months ended (Unaudited) March 31, | Years endedSeptember 30, | |||||
| 2022 | 2021 | 2020 | 2019 | 2018 | 2017 | |
| Selected Per–Share Data | ||||||
| Net asset value, beginning of period | $15.88 | $13.57 | $12.68 | $12.92 | $12.42 | $11.24 |
| Income from Investment Operations | ||||||
| Net investment income (loss)A,B | .08 | .13 | .15 | .17 | .14 | .11 |
| Net realized and unrealized gain (loss) | (.40) | 2.42 | 1.24 | .06 | .69 | 1.21 |
| Total from investment operations | (.32) | 2.55 | 1.39 | .23 | .83 | 1.32 |
| Distributions from net investment income | (.18) | (.12) | (.17) | (.15) | (.11) | (.12) |
| Distributions from net realized gain | (.19) | (.12) | (.33) | (.32) | (.22) | (.02) |
| Total distributions | (.37) | (.24) | (.50) | (.47) | (.33) | (.14) |
| Net asset value, end of period | $15.19 | $15.88 | $13.57 | $12.68 | $12.92 | $12.42 |
| Total ReturnC,D,E | (2.17)% | 18.90% | 11.13% | 2.24% | 6.80% | 11.86% |
| Ratios to Average Net AssetsB,F,G | ||||||
| Expenses before reductions | .98%H | .99% | 1.00% | 1.02% | 1.02% | 1.03% |
| Expenses net of fee waivers, if any | .98%H | .99% | 1.00% | 1.01% | 1.01% | 1.03% |
| Expenses net of all reductions | .98%H | .99% | 1.00% | 1.01% | 1.01% | 1.02% |
| Net investment income (loss) | 1.03%H | .84% | 1.19% | 1.40% | 1.12% | .98% |
| Supplemental Data | ||||||
| Net assets, end of period (000 omitted) | $167,999 | $167,442 | $129,967 | $128,269 | $130,729 | $59,049 |
| Portfolio turnover rateI | 18%H | 19% | 29% | 39% | 18%J | 18% |
A Calculated based on average shares outstanding during the period.
B Net investment income (loss) is affected by the timing of the declaration of dividends by any underlying mutual funds or exchange-traded funds (ETFs). Net investment income (loss) of any such underlying funds is not included in the Fund's net investment income (loss) ratio.
C Total returns for periods of less than one year are not annualized.
D Total returns would have been lower if certain expenses had not been reduced during the applicable periods shown.
E Total returns do not include the effect of the sales charges.
F Fees and expenses of any underlying mutual funds or exchange-traded funds (ETFs) are not included in the Fund's expense ratio. The Fund indirectly bears its proportionate share of these expenses. For additional expense information related to investments in Fidelity Central Funds, please refer to the "Investments in Fidelity Central Funds" note found in the Notes to Financial Statements section of the most recent Annual or Semi-Annual report.
G Expense ratios reflect operating expenses of the class. Expenses before reductions do not reflect amounts reimbursed, waived, or reduced through arrangements with the investment adviser, brokerage services, or other offset arrangements, if applicable, and do not represent the amount paid by the class during periods when reimbursements, waivers or reductions occur.
H Annualized
I Amount does not include the portfolio activity of any underlying mutual funds or exchange-traded funds (ETFs).
J The portfolio turnover rate does not include the assets acquired in the merger.
See accompanying notes which are an integral part of the financial statements.
Fidelity Asset Manager 60% Class M
| Six months ended (Unaudited) March 31, | Years endedSeptember 30, | |||||
| 2022 | 2021 | 2020 | 2019 | 2018 | 2017 | |
| Selected Per–Share Data | ||||||
| Net asset value, beginning of period | $15.78 | $13.48 | $12.60 | $12.84 | $12.34 | $11.17 |
| Income from Investment Operations | ||||||
| Net investment income (loss)A,B | .06 | .09 | .12 | .14 | .11 | .09 |
| Net realized and unrealized gain (loss) | (.41) | 2.41 | 1.22 | .06 | .70 | 1.19 |
| Total from investment operations | (.35) | 2.50 | 1.34 | .20 | .81 | 1.28 |
| Distributions from net investment income | (.13) | (.08) | (.13) | (.12) | (.08) | (.09) |
| Distributions from net realized gain | (.19) | (.12) | (.33) | (.32) | (.22) | (.02) |
| Total distributions | (.32) | (.20) | (.46) | (.44) | (.31)C | (.11) |
| Net asset value, end of period | $15.11 | $15.78 | $13.48 | $12.60 | $12.84 | $12.34 |
| Total ReturnD,E,F | (2.32)% | 18.67% | 10.83% | 2.01% | 6.60% | 11.58% |
| Ratios to Average Net AssetsB,G,H | ||||||
| Expenses before reductions | 1.23%I | 1.24% | 1.26% | 1.28% | 1.28% | 1.28% |
| Expenses net of fee waivers, if any | 1.22%I | 1.24% | 1.25% | 1.25% | 1.26% | 1.28% |
| Expenses net of all reductions | 1.22%I | 1.24% | 1.25% | 1.25% | 1.26% | 1.27% |
| Net investment income (loss) | .79%I | .59% | .94% | 1.15% | .87% | .73% |
| Supplemental Data | ||||||
| Net assets, end of period (000 omitted) | $53,271 | $54,174 | $49,060 | $49,997 | $55,343 | $20,860 |
| Portfolio turnover rateJ | 18%I | 19% | 29% | 39% | 18%K | 18% |
A Calculated based on average shares outstanding during the period.
B Net investment income (loss) is affected by the timing of the declaration of dividends by any underlying mutual funds or exchange-traded funds (ETFs). Net investment income (loss) of any such underlying funds is not included in the Fund's net investment income (loss) ratio.
C Total distributions per share do not sum due to rounding.
D Total returns for periods of less than one year are not annualized.
E Total returns would have been lower if certain expenses had not been reduced during the applicable periods shown.
F Total returns do not include the effect of the sales charges.
G Fees and expenses of any underlying mutual funds or exchange-traded funds (ETFs) are not included in the Fund's expense ratio. The Fund indirectly bears its proportionate share of these expenses. For additional expense information related to investments in Fidelity Central Funds, please refer to the "Investments in Fidelity Central Funds" note found in the Notes to Financial Statements section of the most recent Annual or Semi-Annual report.
H Expense ratios reflect operating expenses of the class. Expenses before reductions do not reflect amounts reimbursed, waived, or reduced through arrangements with the investment adviser, brokerage services, or other offset arrangements, if applicable, and do not represent the amount paid by the class during periods when reimbursements, waivers or reductions occur.
I Annualized
J Amount does not include the portfolio activity of any underlying mutual funds or exchange-traded funds (ETFs).
K The portfolio turnover rate does not include the assets acquired in the merger.
See accompanying notes which are an integral part of the financial statements.
Fidelity Asset Manager 60% Class C
| Six months ended (Unaudited) March 31, | Years endedSeptember 30, | |||||
| 2022 | 2021 | 2020 | 2019 | 2018 | 2017 | |
| Selected Per–Share Data | ||||||
| Net asset value, beginning of period | $15.55 | $13.29 | $12.42 | $12.67 | $12.18 | $11.04 |
| Income from Investment Operations | ||||||
| Net investment income (loss)A,B | .02 | .01 | .05 | .08 | .05 | .03 |
| Net realized and unrealized gain (loss) | (.41) | 2.38 | 1.21 | .06 | .69 | 1.17 |
| Total from investment operations | (.39) | 2.39 | 1.26 | .14 | .74 | 1.20 |
| Distributions from net investment income | (.04) | –C | (.06) | (.07) | (.02) | (.04) |
| Distributions from net realized gain | (.19) | (.12) | (.33) | (.32) | (.22) | (.02) |
| Total distributions | (.23) | (.13)D | (.39) | (.39) | (.25)D | (.06) |
| Net asset value, end of period | $14.93 | $15.55 | $13.29 | $12.42 | $12.67 | $12.18 |
| Total ReturnE,F,G | (2.57)% | 18.02% | 10.29% | 1.47% | 6.09% | 10.94% |
| Ratios to Average Net AssetsB,H,I | ||||||
| Expenses before reductions | 1.75%J | 1.77% | 1.79% | 1.81% | 1.79% | 1.78% |
| Expenses net of fee waivers, if any | 1.74%J | 1.77% | 1.76% | 1.76% | 1.76% | 1.78% |
| Expenses net of all reductions | 1.74%J | 1.77% | 1.76% | 1.76% | 1.76% | 1.78% |
| Net investment income (loss) | .27%J | .06% | .42% | .64% | .37% | .23% |
| Supplemental Data | ||||||
| Net assets, end of period (000 omitted) | $46,556 | $55,262 | $61,950 | $67,955 | $86,887 | $37,384 |
| Portfolio turnover rateK | 18%J | 19% | 29% | 39% | 18%L | 18% |
A Calculated based on average shares outstanding during the period.
B Net investment income (loss) is affected by the timing of the declaration of dividends by any underlying mutual funds or exchange-traded funds (ETFs). Net investment income (loss) of any such underlying funds is not included in the Fund's net investment income (loss) ratio.
C Amount represents less than $.005 per share.
D Total distributions per share do not sum due to rounding.
E Total returns for periods of less than one year are not annualized.
F Total returns would have been lower if certain expenses had not been reduced during the applicable periods shown.
G Total returns do not include the effect of the contingent deferred sales charge.
H Fees and expenses of any underlying mutual funds or exchange-traded funds (ETFs) are not included in the Fund's expense ratio. The Fund indirectly bears its proportionate share of these expenses. For additional expense information related to investments in Fidelity Central Funds, please refer to the "Investments in Fidelity Central Funds" note found in the Notes to Financial Statements section of the most recent Annual or Semi-Annual report.
I Expense ratios reflect operating expenses of the class. Expenses before reductions do not reflect amounts reimbursed, waived, or reduced through arrangements with the investment adviser, brokerage services, or other offset arrangements, if applicable, and do not represent the amount paid by the class during periods when reimbursements, waivers or reductions occur.
J Annualized
K Amount does not include the portfolio activity of any underlying mutual funds or exchange-traded funds (ETFs).
L The portfolio turnover rate does not include the assets acquired in the merger.
See accompanying notes which are an integral part of the financial statements.
Fidelity Asset Manager 60%
| Six months ended (Unaudited) March 31, | Years endedSeptember 30, | |||||
| 2022 | 2021 | 2020 | 2019 | 2018 | 2017 | |
| Selected Per–Share Data | ||||||
| Net asset value, beginning of period | $15.98 | $13.65 | $12.75 | $12.98 | $12.47 | $11.29 |
| Income from Investment Operations | ||||||
| Net investment income (loss)A,B | .11 | .18 | .19 | .21 | .18 | .15 |
| Net realized and unrealized gain (loss) | (.41) | 2.43 | 1.25 | .06 | .70 | 1.21 |
| Total from investment operations | (.30) | 2.61 | 1.44 | .27 | .88 | 1.36 |
| Distributions from net investment income | (.22) | (.16) | (.21) | (.18) | (.15) | (.15) |
| Distributions from net realized gain | (.19) | (.12) | (.33) | (.32) | (.22) | (.02) |
| Total distributions | (.41) | (.28) | (.54) | (.50) | (.37) | (.18)C |
| Net asset value, end of period | $15.27 | $15.98 | $13.65 | $12.75 | $12.98 | $12.47 |
| Total ReturnD,E | (2.03)% | 19.28% | 11.50% | 2.60% | 7.17% | 12.19% |
| Ratios to Average Net AssetsB,F,G | ||||||
| Expenses before reductions | .67%H | .67% | .69% | .70% | .70% | .71% |
| Expenses net of fee waivers, if any | .66%H | .67% | .68% | .69% | .70% | .71% |
| Expenses net of all reductions | .66%H | .67% | .68% | .69% | .70% | .71% |
| Net investment income (loss) | 1.35%H | 1.15% | 1.51% | 1.71% | 1.44% | 1.30% |
| Supplemental Data | ||||||
| Net assets, end of period (000 omitted) | $2,407,942 | $2,427,382 | $2,950,010 | $2,727,092 | $2,679,353 | $1,821,025 |
| Portfolio turnover rateI | 18%H | 19% | 29% | 39% | 18%J | 18% |
A Calculated based on average shares outstanding during the period.
B Net investment income (loss) is affected by the timing of the declaration of dividends by any underlying mutual funds or exchange-traded funds (ETFs). Net investment income (loss) of any such underlying funds is not included in the Fund's net investment income (loss) ratio.
C Total distributions per share do not sum due to rounding.
D Total returns for periods of less than one year are not annualized.
E Total returns would have been lower if certain expenses had not been reduced during the applicable periods shown.
F Fees and expenses of any underlying mutual funds or exchange-traded funds (ETFs) are not included in the Fund's expense ratio. The Fund indirectly bears its proportionate share of these expenses. For additional expense information related to investments in Fidelity Central Funds, please refer to the "Investments in Fidelity Central Funds" note found in the Notes to Financial Statements section of the most recent Annual or Semi-Annual report.
G Expense ratios reflect operating expenses of the class. Expenses before reductions do not reflect amounts reimbursed, waived, or reduced through arrangements with the investment adviser, brokerage services, or other offset arrangements, if applicable, and do not represent the amount paid by the class during periods when reimbursements, waivers or reductions occur.
H Annualized
I Amount does not include the portfolio activity of any underlying mutual funds or exchange-traded funds (ETFs).
J The portfolio turnover rate does not include the assets acquired in the merger.
See accompanying notes which are an integral part of the financial statements.
Fidelity Asset Manager 60% Class I
| Six months ended (Unaudited) March 31, | Years endedSeptember 30, | |||||
| 2022 | 2021 | 2020 | 2019 | 2018 | 2017 | |
| Selected Per–Share Data | ||||||
| Net asset value, beginning of period | $15.99 | $13.66 | $12.76 | $12.99 | $12.48 | $11.30 |
| Income from Investment Operations | ||||||
| Net investment income (loss)A,B | .10 | .17 | .19 | .21 | .18 | .15 |
| Net realized and unrealized gain (loss) | (.40) | 2.43 | 1.24 | .05 | .70 | 1.20 |
| Total from investment operations | (.30) | 2.60 | 1.43 | .26 | .88 | 1.35 |
| Distributions from net investment income | (.22) | (.15) | (.20) | (.17) | (.14) | (.15) |
| Distributions from net realized gain | (.19) | (.12) | (.33) | (.32) | (.22) | (.02) |
| Total distributions | (.41) | (.27) | (.53) | (.49) | (.37)C | (.17) |
| Net asset value, end of period | $15.28 | $15.99 | $13.66 | $12.76 | $12.99 | $12.48 |
| Total ReturnD,E | (2.05)% | 19.20% | 11.44% | 2.56% | 7.12% | 12.16% |
| Ratios to Average Net AssetsB,F,G | ||||||
| Expenses before reductions | .73%H | .74% | .74% | .75% | .75% | .75% |
| Expenses net of fee waivers, if any | .73%H | .74% | .73% | .73% | .74% | .74% |
| Expenses net of all reductions | .73%H | .74% | .73% | .73% | .74% | .74% |
| Net investment income (loss) | 1.28%H | 1.09% | 1.46% | 1.67% | 1.39% | 1.26% |
| Supplemental Data | ||||||
| Net assets, end of period (000 omitted) | $113,238 | $115,782 | $51,429 | $55,379 | $63,604 | $26,423 |
| Portfolio turnover rateI | 18%H | 19% | 29% | 39% | 18%J | 18% |
A Calculated based on average shares outstanding during the period.
B Net investment income (loss) is affected by the timing of the declaration of dividends by any underlying mutual funds or exchange-traded funds (ETFs). Net investment income (loss) of any such underlying funds is not included in the Fund's net investment income (loss) ratio.
C Total distributions per share do not sum due to rounding.
D Total returns for periods of less than one year are not annualized.
E Total returns would have been lower if certain expenses had not been reduced during the applicable periods shown.
F Fees and expenses of any underlying mutual funds or exchange-traded funds (ETFs) are not included in the Fund's expense ratio. The Fund indirectly bears its proportionate share of these expenses. For additional expense information related to investments in Fidelity Central Funds, please refer to the "Investments in Fidelity Central Funds" note found in the Notes to Financial Statements section of the most recent Annual or Semi-Annual report.
G Expense ratios reflect operating expenses of the class. Expenses before reductions do not reflect amounts reimbursed, waived, or reduced through arrangements with the investment adviser, brokerage services, or other offset arrangements, if applicable, and do not represent the amount paid by the class during periods when reimbursements, waivers or reductions occur.
H Annualized
I Amount does not include the portfolio activity of any underlying mutual funds or exchange-traded funds (ETFs).
J The portfolio turnover rate does not include the assets acquired in the merger.
See accompanying notes which are an integral part of the financial statements.
Fidelity Asset Manager 60% Class Z
| Six months ended (Unaudited) March 31, | Years endedSeptember 30, | |||
| 2022 | 2021 | 2020 | 2019 A | |
| Selected Per–Share Data | ||||
| Net asset value, beginning of period | $15.98 | $13.65 | $12.76 | $12.97 |
| Income from Investment Operations | ||||
| Net investment income (loss)B,C | .11 | .19 | .20 | .22 |
| Net realized and unrealized gain (loss) | (.40) | 2.43 | 1.24 | .08 |
| Total from investment operations | (.29) | 2.62 | 1.44 | .30 |
| Distributions from net investment income | (.24) | (.17) | (.22) | (.19) |
| Distributions from net realized gain | (.19) | (.12) | (.33) | (.32) |
| Total distributions | (.43) | (.29) | (.55) | (.51) |
| Net asset value, end of period | $15.26 | $15.98 | $13.65 | $12.76 |
| Total ReturnD,E | (1.98)% | 19.35% | 11.50% | 2.86% |
| Ratios to Average Net AssetsC,F,G | ||||
| Expenses before reductions | .60%H | .61% | .62% | .63%H |
| Expenses net of fee waivers, if any | .60%H | .61% | .62% | .63%H |
| Expenses net of all reductions | .60%H | .61% | .62% | .63%H |
| Net investment income (loss) | 1.41%H | 1.22% | 1.57% | 1.77%H |
| Supplemental Data | ||||
| Net assets, end of period (000 omitted) | $1,574,680 | $1,412,486 | $22,117 | $19,124 |
| Portfolio turnover rateI | 18%H | 19% | 29% | 39% |
A For the period October 2, 2018 (commencement of sale of shares) through September 30, 2019.
B Calculated based on average shares outstanding during the period.
C Net investment income (loss) is affected by the timing of the declaration of dividends by any underlying mutual funds or exchange-traded funds (ETFs). Net investment income (loss) of any such underlying funds is not included in the Fund's net investment income (loss) ratio.
D Total returns for periods of less than one year are not annualized.
E Total returns would have been lower if certain expenses had not been reduced during the applicable periods shown.
F Fees and expenses of any underlying mutual funds or exchange-traded funds (ETFs) are not included in the Fund's expense ratio. The Fund indirectly bears its proportionate share of these expenses. For additional expense information related to investments in Fidelity Central Funds, please refer to the "Investments in Fidelity Central Funds" note found in the Notes to Financial Statements section of the most recent Annual or Semi-Annual report.
G Expense ratios reflect operating expenses of the class. Expenses before reductions do not reflect amounts reimbursed, waived, or reduced through arrangements with the investment adviser, brokerage services, or other offset arrangements, if applicable, and do not represent the amount paid by the class during periods when reimbursements, waivers or reductions occur.
H Annualized
I Amount does not include the portfolio activity of any underlying mutual funds or exchange-traded funds (ETFs).
See accompanying notes which are an integral part of the financial statements.
Fidelity Asset Manager® 70%
Investment Summary (Unaudited)
The information in the following tables is based on the combined investments of the Fund and its pro-rata share of the investments of Fidelity's Central Funds, other than the Commodity Strategy and Money Market Central Funds.Top Ten Stocks as of March 31, 2022
| % of fund's net assets | |
| Apple, Inc. | 3.6 |
| Microsoft Corp. | 3.5 |
| Alphabet, Inc. Class A | 2.4 |
| Amazon.com, Inc. | 1.9 |
| Meta Platforms, Inc. Class A | 0.8 |
| UnitedHealth Group, Inc. | 0.7 |
| Tesla, Inc. | 0.7 |
| Exxon Mobil Corp. | 0.7 |
| Wells Fargo & Co. | 0.6 |
| Taiwan Semiconductor Manufacturing Co. Ltd. | 0.6 |
| 15.5 |
Market Sectors as of March 31, 2022
| % of fund's net assets | |
| Information Technology | 17.8 |
| Financials | 15.5 |
| Consumer Discretionary | 9.7 |
| Health Care | 9.3 |
| Industrials | 9.3 |
| Communication Services | 6.2 |
| Consumer Staples | 4.5 |
| Real Estate | 4.4 |
| Energy | 3.5 |
| Materials | 3.5 |
| Utilities | 2.0 |
Quality Diversification (% of fund's net assets)
| As of March 31, 2022 | ||
| U.S. Government and U.S. Government Agency Obligations | 8.9% | |
| AAA,AA,A | 2.2% | |
| BBB | 3.2% | |
| BB and Below | 5.0% | |
| Not Rated | 0.9% | |
| Equities* | 77.5% | |
| Short-Term Investments and Net Other Assets | 2.3% | |
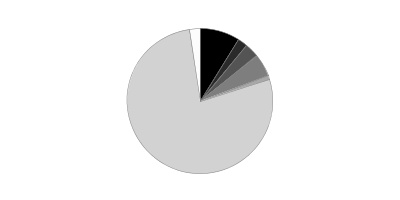
* Includes investment in Fidelity® Commodity Strategy Central Fund of 1.6%
We have used ratings from Moody's Investors Service, Inc. Where Moody's® ratings are not available, we have used S&P® ratings. All ratings are as of the date indicated and do not reflect subsequent changes.
Asset Allocation (% of fund's net assets)
| As of March 31, 2022 | ||
| Stocks and Equity Futures* | 75.5% | |
| Bond Class | 22.4% | |
| Short-Term Class | 2.1% | |

* Includes investment in Fidelity® Commodity Strategy Central Fund of 1.6%
Asset allocations in the pie charts reflect the categorization of assets as defined in the Fund's prospectus in effect as of the time periods indicated above. Percentages are adjusted for the effect of future contracts and swap contracts, if applicable.
Geographic Diversification (% of fund's net assets)
| As of March 31, 2022 | ||
| United States of America | 74.7% | |
| United Kingdom | 2.6% | |
| France | 2.2% | |
| Cayman Islands | 2.1% | |
| Japan | 2.1% | |
| Canada | 1.9% | |
| Switzerland | 1.5% | |
| Netherlands | 1.5% | |
| Germany | 1.4% | |
| Other | 10.0% | |

Percentages are based on country or territory of incorporation and are adjusted for the effect of futures contracts, if applicable.
At period end, foreign investments including the Fund's pro-rata share of the underlying Central Funds, other than the Commodity Strategy Central and Money Market Funds, was 25.3% of net assets.
Percentages in the above tables are adjusted for the effect of TBA Sale Commitments.
An unaudited holdings listing for the Fund, which presents direct holdings as well as the pro-rata share of any securities and other investments held indirectly through its investment in underlying Fidelity Central Funds, other than the Commodity Strategy and Money Market Central Funds, is available at fidelity.com and/or institutional.fidelity.com, as applicable.
Fidelity Asset Manager® 70%
Schedule of Investments March 31, 2022 (Unaudited)
Showing Percentage of Net Assets
| Equity Central Funds - 75.9% | |||
| Shares | Value | ||
| Fidelity Commodity Strategy Central Fund (a)(b) | 17,328,148 | $106,914,675 | |
| Fidelity Emerging Markets Equity Central Fund (b) | 1,940,939 | 418,563,590 | |
| Fidelity International Equity Central Fund (b) | 9,513,522 | 907,399,745 | |
| Fidelity Real Estate Equity Central Fund (b) | 710,414 | 108,188,943 | |
| Fidelity U.S. Equity Central Fund (b) | 30,023,558 | 3,718,417,715 | |
| TOTAL EQUITY CENTRAL FUNDS | |||
| (Cost $2,955,800,734) | 5,259,484,668 | ||
| Fixed-Income Central Funds - 20.4% | |||
| High Yield Fixed-Income Funds - 5.5% | |||
| Fidelity Emerging Markets Debt Central Fund (b) | 4,049,243 | 33,568,224 | |
| Fidelity Emerging Markets Debt Local Currency Central Fund (b) | 190,625 | 16,835,994 | |
| Fidelity Floating Rate Central Fund (b) | 2,756,609 | 274,971,698 | |
| Fidelity High Income Central Fund (b) | 489,523 | 54,170,641 | |
| TOTAL HIGH YIELD FIXED-INCOME FUNDS | 379,546,557 | ||
| Investment Grade Fixed-Income Funds - 14.9% | |||
| Fidelity Inflation-Protected Bond Index Central Fund (b) | 1,296,550 | 135,139,367 | |
| Fidelity International Credit Central Fund (b) | 915,454 | 86,272,348 | |
| Fidelity Investment Grade Bond Central Fund (b) | 7,623,411 | 816,391,032 | |
| TOTAL INVESTMENT GRADE FIXED-INCOME FUNDS | 1,037,802,747 | ||
| TOTAL FIXED-INCOME CENTRAL FUNDS | |||
| (Cost $1,398,899,105) | 1,417,349,304 | ||
| Money Market Central Funds - 3.5% | |||
| Fidelity Cash Central Fund 0.31% (c) | 90,135,674 | 90,153,701 | |
| Fidelity Securities Lending Cash Central Fund 0.31% (c)(d) | 153,570,193 | 153,585,550 | |
| TOTAL MONEY MARKET CENTRAL FUNDS | |||
| (Cost $243,739,251) | 243,739,251 | ||
| Principal Amount | Value | ||
| U.S. Treasury Obligations - 0.2% | |||
| U.S. Treasury Bills, yield at date of purchase 0.11% to 0.33% 4/14/22 to 6/2/22 (e) | |||
| (Cost $13,403,488) | 13,410,000 | 13,403,531 | |
| Shares | Value | ||
| Investment Companies - 2.2% | |||
| iShares 20+ Year Treasury Bond ETF (f) | |||
| (Cost $172,525,073) | 1,141,913 | 150,823,873 | |
| TOTAL INVESTMENT IN SECURITIES - 102.2% | |||
| (Cost $4,784,367,651) | 7,084,800,627 | ||
| NET OTHER ASSETS (LIABILITIES) - (2.2)% | (149,962,231) | ||
| NET ASSETS - 100% | $6,934,838,396 |
| Futures Contracts | |||||
| Number of contracts | Expiration Date | Notional Amount | Value | Unrealized Appreciation/(Depreciation) | |
| Purchased | |||||
| Equity Index Contracts | |||||
| ICE E-mini MSCI Emerging Markets Index Contracts (United States) | 511 | June 2022 | $28,756,525 | $2,194,339 | $2,194,339 |
| TOTAL PURCHASED FUTURES | 2,194,339 | ||||
| Sold | |||||
| Equity Index Contracts | |||||
| CME Micro E-mini S&P 500 Index Contracts (United States) | 753 | June 2022 | 170,582,738 | (9,651,111) | (9,651,111) |
| ICE E-mini MSCI EAFE Index Contracts (United States) | 1,341 | June 2022 | 143,782,020 | (8,338,457) | (8,338,457) |
| TOTAL SOLD FUTURES | (17,989,568) | ||||
| TOTAL FUTURES CONTRACTS | $(15,795,229) |
The notional amount of futures purchased as a percentage of Net Assets is 0.4%
The notional amount of futures sold as a percentage of Net Assets is 4.5%
For the period, the average monthly notional amount at value for futures contracts in the aggregate was $363,256,856.
Security Type Abbreviations
ETF – Exchange-Traded Fund
Legend
(a) Non-income producing
(b) Affiliated fund that is generally available only to investment companies and other accounts managed by Fidelity Investments. A complete unaudited schedule of portfolio holdings for each Fidelity Central Fund is filed with the SEC for the first and third quarters of each fiscal year on Form N-PORT and is available upon request or at the SEC's website at www.sec.gov. An unaudited holdings listing for the Fund, which presents direct holdings as well as the pro-rata share of securities and other investments held indirectly through its investment in underlying non-money market Fidelity Central Funds, other than the Commodity Strategy Central Fund, is available at fidelity.com and/or institutional.fidelity.com, as applicable. In addition, each Fidelity Central Fund's financial statements are available on the SEC's website or upon request.
(c) Affiliated fund that is generally available only to investment companies and other accounts managed by Fidelity Investments. The rate quoted is the annualized seven-day yield of the fund at period end. A complete unaudited listing of the fund's holdings as of its most recent quarter end is available upon request. In addition, each Fidelity Central Fund's financial statements are available on the SEC's website or upon request.
(d) Investment made with cash collateral received from securities on loan.
(e) Security or a portion of the security was pledged to cover margin requirements for futures contracts. At period end, the value of securities pledged amounted to $13,247,542.
(f) Security or a portion of the security is on loan at period end.
Affiliated Central Funds
Fiscal year to date information regarding the Fund's investments in Fidelity Central Funds, including the ownership percentage, is presented below.
| Fund | Value, beginning of period | Purchases | Sales Proceeds | Dividend Income | Realized Gain (loss) | Change in Unrealized appreciation (depreciation) | Value, end of period | % ownership, end of period |
| Fidelity Cash Central Fund 0.31% | $20,555,054 | $326,736,807 | $257,138,160 | $28,464 | $-- | $-- | $90,153,701 | 0.2 |
| Fidelity Commodity Strategy Central Fund | 141,565,485 | 4,474,666 | 67,787,959 | -- | 10,357,211 | 18,305,272 | 106,914,675 | 18.4 |
| Fidelity Emerging Markets Debt Central Fund | 35,129,152 | 2,800,600 | 1,016,694 | 791,214 | (26,164) | (3,318,670) | 33,568,224 | 1.3 |
| Fidelity Emerging Markets Debt Local Currency Central Fund | 18,059,605 | 989,822 | -- | 989,822 | -- | (2,213,433) | 16,835,994 | 18.7 |
| Fidelity Emerging Markets Equity Central Fund | 413,104,612 | 133,294,348 | 24,614,691 | 33,085,056 | 994,979 | (104,215,658) | 418,563,590 | 23.2 |
| Fidelity Floating Rate Central Fund | 195,295,531 | 87,904,839 | 5,249,617 | 5,135,952 | (67,811) | (2,911,244) | 274,971,698 | 8.6 |
| Fidelity High Income Central Fund | 87,403,456 | 3,795,136 | 34,689,036 | 1,670,109 | 3,166,052 | (5,504,967) | 54,170,641 | 2.6 |
| Fidelity Inflation-Protected Bond Index Central Fund | 225,481,046 | 25,078,841 | 99,650,351 | 16,677,082 | (846,506) | (14,923,663) | 135,139,367 | 20.7 |
| Fidelity International Credit Central Fund | 109,606,414 | 6,028,005 | 21,298,032 | 1,802,593 | (1,212,676) | (6,851,363) | 86,272,348 | 16.8 |
| Fidelity International Equity Central Fund | 880,481,939 | 151,616,506 | 18,783,403 | 57,493,556 | (1,446,765) | (104,468,532) | 907,399,745 | 23.8 |
| Fidelity Investment Grade Bond Central Fund | 799,177,138 | 156,265,779 | 86,536,216 | 8,846,808 | (1,163,100) | (51,352,569) | 816,391,032 | 2.4 |
| Fidelity Real Estate Equity Central Fund | 101,239,394 | 38,615,444 | 37,756,708 | 1,340,919 | (2,002,035) | 8,092,848 | 108,188,943 | 6.4 |
| Fidelity Securities Lending Cash Central Fund 0.31% | 188,347,475 | 817,437,919 | 852,199,844 | 142,104 | -- | -- | 153,585,550 | 0.3 |
| Fidelity U.S. Equity Central Fund | 3,658,367,869 | 448,250,316 | 134,404,439 | 310,419,395 | (762,914) | (253,033,117) | 3,718,417,715 | 17.1 |
| $6,873,814,170 | $2,203,289,028 | $1,641,125,150 | $438,423,074 | $6,990,271 | $(522,395,096) | $6,920,573,223 |
Amounts in the income column in the above table include any capital gain distributions from underlying funds, which are presented in the corresponding line-item in the Statement of Operations, if applicable. Amount for Fidelity Securities Lending Cash Central Fund represents the income earned on investing cash collateral, less rebates paid to borrowers and any lending agent fees associated with the loan, plus any premium payments received for lending certain types of securities.
Investment Valuation
The following is a summary of the inputs used, as of March 31, 2022, involving the Fund's assets and liabilities carried at fair value. The inputs or methodology used for valuing securities may not be an indication of the risk associated with investing in those securities. For more information on valuation inputs, and their aggregation into the levels used below, please refer to the Investment Valuation section in the accompanying Notes to Financial Statements.
| Valuation Inputs at Reporting Date: | ||||
| Description | Total | Level 1 | Level 2 | Level 3 |
| Investments in Securities: | ||||
| Equity Central Funds | $5,259,484,668 | $5,259,484,668 | $-- | $-- |
| Fixed-Income Central Funds | 1,417,349,304 | 1,417,349,304 | -- | -- |
| Money Market Central Funds | 243,739,251 | 243,739,251 | -- | -- |
| U.S. Treasury Obligations | 13,403,531 | -- | 13,403,531 | -- |
| Investment Companies | 150,823,873 | 150,823,873 | -- | -- |
| Total Investments in Securities: | $7,084,800,627 | $7,071,397,096 | $13,403,531 | $-- |
| Derivative Instruments: | ||||
| Assets | ||||
| Futures Contracts | $2,194,339 | $2,194,339 | $-- | $-- |
| Total Assets | $2,194,339 | $2,194,339 | $-- | $-- |
| Liabilities | ||||
| Futures Contracts | $(17,989,568) | $(17,989,568) | $-- | $-- |
| Total Liabilities | $(17,989,568) | $(17,989,568) | $-- | $-- |
| Total Derivative Instruments: | $(15,795,229) | $(15,795,229) | $-- | $-- |
Value of Derivative Instruments
The following table is a summary of the Fund's value of derivative instruments by primary risk exposure as of March 31, 2022. For additional information on derivative instruments, please refer to the Derivative Instruments section in the accompanying Notes to Financial Statements.
| Primary Risk Exposure / Derivative Type | Value | |
| Asset | Liability | |
| Equity Risk | ||
| Futures Contracts(a) | $2,194,339 | $(17,989,568) |
| Total Equity Risk | 2,194,339 | (17,989,568) |
| Total Value of Derivatives | $2,194,339 | $(17,989,568) |
(a) Reflects gross cumulative appreciation (depreciation) on futures contracts as presented in the Schedule of Investments. In the Statement of Assets and Liabilities, the period end daily variation margin is included in receivable or payable for daily variation margin on futures contracts, and the net cumulative appreciation (depreciation) is included in Total accumulated earnings (loss).
See accompanying notes which are an integral part of the financial statements.
Fidelity Asset Manager® 70%
Financial Statements
Statement of Assets and Liabilities
| March 31, 2022 (Unaudited) | ||
| Assets | ||
| Investment in securities, at value (including securities loaned of $150,822,152) — See accompanying schedule: Unaffiliated issuers (cost $185,928,561) | $164,227,404 | |
| Fidelity Central Funds (cost $4,598,439,090) | 6,920,573,223 | |
| Total Investment in Securities (cost $4,784,367,651) | $7,084,800,627 | |
| Receivable for investments sold | 2,647,135 | |
| Receivable for fund shares sold | 1,509,096 | |
| Distributions receivable from Fidelity Central Funds | 42,985 | |
| Receivable for daily variation margin on futures contracts | 4,486,828 | |
| Prepaid expenses | 3,395 | |
| Other receivables | 21,627 | |
| Total assets | 7,093,511,693 | |
| Liabilities | ||
| Payable for investments purchased | $40,656 | |
| Payable for fund shares redeemed | 1,231,619 | |
| Accrued management fee | 2,974,485 | |
| Distribution and service plan fees payable | 108,342 | |
| Other affiliated payables | 670,892 | |
| Other payables and accrued expenses | 61,753 | |
| Collateral on securities loaned | 153,585,550 | |
| Total liabilities | 158,673,297 | |
| Net Assets | $6,934,838,396 | |
| Net Assets consist of: | ||
| Paid in capital | $4,787,485,221 | |
| Total accumulated earnings (loss) | 2,147,353,175 | |
| Net Assets | $6,934,838,396 | |
| Net Asset Value and Maximum Offering Price | ||
| Class A: | ||
| Net Asset Value and redemption price per share ($217,264,692 ÷ 7,992,629 shares)(a) | $27.18 | |
| Maximum offering price per share (100/94.25 of $27.18) | $28.84 | |
| Class M: | ||
| Net Asset Value and redemption price per share ($80,555,344 ÷ 2,963,655 shares)(a) | $27.18 | |
| Maximum offering price per share (100/96.50 of $27.18) | $28.17 | |
| Class C: | ||
| Net Asset Value and offering price per share ($38,041,313 ÷ 1,403,958 shares)(a) | $27.10 | |
| Asset Manager 70%: | ||
| Net Asset Value, offering price and redemption price per share ($4,397,304,981 ÷ 161,394,472 shares) | $27.25 | |
| Class I: | ||
| Net Asset Value, offering price and redemption price per share ($53,590,337 ÷ 1,965,567 shares) | $27.26 | |
| Class Z: | ||
| Net Asset Value, offering price and redemption price per share ($2,148,081,729 ÷ 78,960,989 shares) | $27.20 |
(a) Redemption price per share is equal to net asset value less any applicable contingent deferred sales charge.
See accompanying notes which are an integral part of the financial statements.
Statement of Operations
| Six months ended March 31, 2022 (Unaudited) | ||
| Investment Income | ||
| Dividends | $1,434,171 | |
| Interest | 8,550 | |
| Income from Fidelity Central Funds (including $142,104 from security lending) | 67,304,233 | |
| Total income | 68,746,954 | |
| Expenses | ||
| Management fee | $18,507,317 | |
| Transfer agent fees | 3,210,382 | |
| Distribution and service plan fees | 690,704 | |
| Accounting fees | 725,524 | |
| Custodian fees and expenses | 19,588 | |
| Independent trustees' fees and expenses | 11,989 | |
| Registration fees | 88,250 | |
| Audit | 16,579 | |
| Legal | 7,943 | |
| Miscellaneous | 15,666 | |
| Total expenses before reductions | 23,293,942 | |
| Expense reductions | (108,446) | |
| Total expenses after reductions | 23,185,496 | |
| Net investment income (loss) | 45,561,458 | |
| Realized and Unrealized Gain (Loss) | ||
| Net realized gain (loss) on: | ||
| Investment securities: | ||
| Unaffiliated issuers | (3,549,942) | |
| Fidelity Central Funds | 6,990,271 | |
| Futures contracts | 26,935,080 | |
| Capital gain distributions from Fidelity Central Funds | 371,118,841 | |
| Total net realized gain (loss) | 401,494,250 | |
| Change in net unrealized appreciation (depreciation) on: | ||
| Investment securities: | ||
| Unaffiliated issuers | (11,316,434) | |
| Fidelity Central Funds | (522,395,096) | |
| Futures contracts | (31,884,137) | |
| Total change in net unrealized appreciation (depreciation) | (565,595,667) | |
| Net gain (loss) | (164,101,417) | |
| Net increase (decrease) in net assets resulting from operations | $(118,539,959) |
See accompanying notes which are an integral part of the financial statements.
Statement of Changes in Net Assets
| Six months ended March 31, 2022 (Unaudited) | Year ended September 30, 2021 | |
| Increase (Decrease) in Net Assets | ||
| Operations | ||
| Net investment income (loss) | $45,561,458 | $67,667,355 |
| Net realized gain (loss) | 401,494,250 | 48,272,489 |
| Change in net unrealized appreciation (depreciation) | (565,595,667) | 1,129,788,023 |
| Net increase (decrease) in net assets resulting from operations | (118,539,959) | 1,245,727,867 |
| Distributions to shareholders | (197,081,541) | (133,509,657) |
| Share transactions - net increase (decrease) | 355,532,756 | 222,902,213 |
| Total increase (decrease) in net assets | 39,911,256 | 1,335,120,423 |
| Net Assets | ||
| Beginning of period | 6,894,927,140 | 5,559,806,717 |
| End of period | $6,934,838,396 | $6,894,927,140 |
See accompanying notes which are an integral part of the financial statements.
Financial Highlights
Fidelity Asset Manager 70% Class A
| Six months ended (Unaudited) March 31, | Years endedSeptember 30, | |||||
| 2022 | 2021 | 2020 | 2019 | 2018 | 2017 | |
| Selected Per–Share Data | ||||||
| Net asset value, beginning of period | $28.33 | $23.67 | $22.21 | $23.27 | $22.26 | $19.78 |
| Income from Investment Operations | ||||||
| Net investment income (loss)A,B | .14 | .21 | .25 | .27 | .23 | .19 |
| Net realized and unrealized gain (loss) | (.58) | 4.95 | 2.32 | (.17) | 1.59 | 2.53 |
| Total from investment operations | (.44) | 5.16 | 2.57 | .10 | 1.82 | 2.72 |
| Distributions from net investment income | (.31) | (.18) | (.28) | (.25) | (.19) | (.20) |
| Distributions from net realized gain | (.40) | (.32) | (.83) | (.91) | (.62) | (.04) |
| Total distributions | (.71) | (.50) | (1.11) | (1.16) | (.81) | (.24) |
| Net asset value, end of period | $27.18 | $28.33 | $23.67 | $22.21 | $23.27 | $22.26 |
| Total ReturnC,D,E | (1.69)% | 21.99% | 11.81% | 1.16% | 8.31% | 13.89% |
| Ratios to Average Net AssetsB,F,G | ||||||
| Expenses before reductions | .96%H | .96% | .99% | 1.00% | 1.00% | 1.02% |
| Expenses net of fee waivers, if any | .95%H | .96% | .98% | 1.00% | 1.00% | 1.01% |
| Expenses net of all reductions | .95%H | .96% | .98% | 1.00% | 1.00% | 1.01% |
| Net investment income (loss) | 1.00%H | .76% | 1.11% | 1.25% | .99% | .90% |
| Supplemental Data | ||||||
| Net assets, end of period (000 omitted) | $217,265 | $219,595 | $179,404 | $166,280 | $155,622 | $146,562 |
| Portfolio turnover rateI | 16%H | 20% | 27% | 41% | 21% | 19% |
A Calculated based on average shares outstanding during the period.
B Net investment income (loss) is affected by the timing of the declaration of dividends by any underlying mutual funds or exchange-traded funds (ETFs). Net investment income (loss) of any such underlying funds is not included in the Fund's net investment income (loss) ratio.
C Total returns for periods of less than one year are not annualized.
D Total returns would have been lower if certain expenses had not been reduced during the applicable periods shown.
E Total returns do not include the effect of the sales charges.
F Fees and expenses of any underlying mutual funds or exchange-traded funds (ETFs) are not included in the Fund's expense ratio. The Fund indirectly bears its proportionate share of these expenses. For additional expense information related to investments in Fidelity Central Funds, please refer to the "Investments in Fidelity Central Funds" note found in the Notes to Financial Statements section of the most recent Annual or Semi-Annual report.
G Expense ratios reflect operating expenses of the class. Expenses before reductions do not reflect amounts reimbursed, waived, or reduced through arrangements with the investment adviser, brokerage services, or other offset arrangements, if applicable, and do not represent the amount paid by the class during periods when reimbursements, waivers or reductions occur.
H Annualized
I Amount does not include the portfolio activity of any underlying mutual funds or exchange-traded funds (ETFs).
See accompanying notes which are an integral part of the financial statements.
Fidelity Asset Manager 70% Class M
| Six months ended (Unaudited) March 31, | Years endedSeptember 30, | |||||
| 2022 | 2021 | 2020 | 2019 | 2018 | 2017 | |
| Selected Per–Share Data | ||||||
| Net asset value, beginning of period | $28.30 | $23.65 | $22.19 | $23.24 | $22.25 | $19.77 |
| Income from Investment Operations | ||||||
| Net investment income (loss)A,B | .11 | .14 | .19 | .22 | .17 | .13 |
| Net realized and unrealized gain (loss) | (.59) | 4.96 | 2.33 | (.17) | 1.58 | 2.54 |
| Total from investment operations | (.48) | 5.10 | 2.52 | .05 | 1.75 | 2.67 |
| Distributions from net investment income | (.24) | (.13) | (.23) | (.19) | (.14) | (.15) |
| Distributions from net realized gain | (.40) | (.32) | (.83) | (.91) | (.62) | (.04) |
| Total distributions | (.64) | (.45) | (1.06) | (1.10) | (.76) | (.19) |
| Net asset value, end of period | $27.18 | $28.30 | $23.65 | $22.19 | $23.24 | $22.25 |
| Total ReturnC,D,E | (1.82)% | 21.71% | 11.56% | .90% | 7.99% | 13.63% |
| Ratios to Average Net AssetsB,F,G | ||||||
| Expenses before reductions | 1.20%H | 1.21% | 1.23% | 1.24% | 1.25% | 1.27% |
| Expenses net of fee waivers, if any | 1.20%H | 1.21% | 1.23% | 1.24% | 1.25% | 1.27% |
| Expenses net of all reductions | 1.20%H | 1.21% | 1.23% | 1.24% | 1.25% | 1.27% |
| Net investment income (loss) | .75%H | .51% | .87% | 1.01% | .74% | .64% |
| Supplemental Data | ||||||
| Net assets, end of period (000 omitted) | $80,555 | $80,784 | $69,250 | $63,064 | $61,587 | $53,245 |
| Portfolio turnover rateI | 16%H | 20% | 27% | 41% | 21% | 19% |
A Calculated based on average shares outstanding during the period.
B Net investment income (loss) is affected by the timing of the declaration of dividends by any underlying mutual funds or exchange-traded funds (ETFs). Net investment income (loss) of any such underlying funds is not included in the Fund's net investment income (loss) ratio.
C Total returns for periods of less than one year are not annualized.
D Total returns would have been lower if certain expenses had not been reduced during the applicable periods shown.
E Total returns do not include the effect of the sales charges.
F Fees and expenses of any underlying mutual funds or exchange-traded funds (ETFs) are not included in the Fund's expense ratio. The Fund indirectly bears its proportionate share of these expenses. For additional expense information related to investments in Fidelity Central Funds, please refer to the "Investments in Fidelity Central Funds" note found in the Notes to Financial Statements section of the most recent Annual or Semi-Annual report.
G Expense ratios reflect operating expenses of the class. Expenses before reductions do not reflect amounts reimbursed, waived, or reduced through arrangements with the investment adviser, brokerage services, or other offset arrangements, if applicable, and do not represent the amount paid by the class during periods when reimbursements, waivers or reductions occur.
H Annualized
I Amount does not include the portfolio activity of any underlying mutual funds or exchange-traded funds (ETFs).
See accompanying notes which are an integral part of the financial statements.
Fidelity Asset Manager 70% Class C
| Six months ended (Unaudited) March 31, | Years endedSeptember 30, | |||||
| 2022 | 2021 | 2020 | 2019 | 2018 | 2017 | |
| Selected Per–Share Data | ||||||
| Net asset value, beginning of period | $28.12 | $23.50 | $22.03 | $23.06 | $22.08 | $19.63 |
| Income from Investment Operations | ||||||
| Net investment income (loss)A,B | .03 | –C | .08 | .11 | .05 | .03 |
| Net realized and unrealized gain (loss) | (.58) | 4.94 | 2.30 | (.15) | 1.57 | 2.51 |
| Total from investment operations | (.55) | 4.94 | 2.38 | (.04) | 1.62 | 2.54 |
| Distributions from net investment income | (.07) | – | (.08) | (.07) | (.03) | (.05) |
| Distributions from net realized gain | (.40) | (.32) | (.83) | (.91) | (.62) | (.04) |
| Total distributions | (.47) | (.32) | (.91) | (.99)D | (.64)D | (.09) |
| Net asset value, end of period | $27.10 | $28.12 | $23.50 | $22.03 | $23.06 | $22.08 |
| Total ReturnE,F,G | (2.06)% | 21.12% | 10.98% | .42% | 7.46% | 13.00% |
| Ratios to Average Net AssetsB,H,I | ||||||
| Expenses before reductions | 1.71%J | 1.72% | 1.74% | 1.75% | 1.75% | 1.77% |
| Expenses net of fee waivers, if any | 1.71%J | 1.72% | 1.74% | 1.75% | 1.75% | 1.77% |
| Expenses net of all reductions | 1.71%J | 1.72% | 1.74% | 1.75% | 1.75% | 1.77% |
| Net investment income (loss) | .24%J | - %K | .36% | .50% | .24% | .14% |
| Supplemental Data | ||||||
| Net assets, end of period (000 omitted) | $38,041 | $44,170 | $40,240 | $42,547 | $63,398 | $59,046 |
| Portfolio turnover rateL | 16%J | 20% | 27% | 41% | 21% | 19% |
A Calculated based on average shares outstanding during the period.
B Net investment income (loss) is affected by the timing of the declaration of dividends by any underlying mutual funds or exchange-traded funds (ETFs). Net investment income (loss) of any such underlying funds is not included in the Fund's net investment income (loss) ratio.
C Amount represents less than $.005 per share.
D Total distributions per share do not sum due to rounding.
E Total returns for periods of less than one year are not annualized.
F Total returns would have been lower if certain expenses had not been reduced during the applicable periods shown.
G Total returns do not include the effect of the contingent deferred sales charge.
H Fees and expenses of any underlying mutual funds or exchange-traded funds (ETFs) are not included in the Fund's expense ratio. The Fund indirectly bears its proportionate share of these expenses. For additional expense information related to investments in Fidelity Central Funds, please refer to the "Investments in Fidelity Central Funds" note found in the Notes to Financial Statements section of the most recent Annual or Semi-Annual report.
I Expense ratios reflect operating expenses of the class. Expenses before reductions do not reflect amounts reimbursed, waived, or reduced through arrangements with the investment adviser, brokerage services, or other offset arrangements, if applicable, and do not represent the amount paid by the class during periods when reimbursements, waivers or reductions occur.
J Annualized
K Amount represents less than .005%.
L Amount does not include the portfolio activity of any underlying mutual funds or exchange-traded funds (ETFs).
See accompanying notes which are an integral part of the financial statements.
Fidelity Asset Manager 70%
| Six months ended (Unaudited) March 31, | Years endedSeptember 30, | |||||
| 2022 | 2021 | 2020 | 2019 | 2018 | 2017 | |
| Selected Per–Share Data | ||||||
| Net asset value, beginning of period | $28.43 | $23.74 | $22.27 | $23.33 | $22.33 | $19.84 |
| Income from Investment Operations | ||||||
| Net investment income (loss)A,B | .18 | .29 | .32 | .34 | .30 | .25 |
| Net realized and unrealized gain (loss) | (.57) | 4.97 | 2.33 | (.17) | 1.58 | 2.54 |
| Total from investment operations | (.39) | 5.26 | 2.65 | .17 | 1.88 | 2.79 |
| Distributions from net investment income | (.39) | (.26) | (.35) | (.31) | (.26) | (.26) |
| Distributions from net realized gain | (.40) | (.32) | (.83) | (.91) | (.62) | (.04) |
| Total distributions | (.79) | (.57)C | (1.18) | (1.23)C | (.88) | (.30) |
| Net asset value, end of period | $27.25 | $28.43 | $23.74 | $22.27 | $23.33 | $22.33 |
| Total ReturnD,E | (1.53)% | 22.39% | 12.14% | 1.51% | 8.57% | 14.25% |
| Ratios to Average Net AssetsB,F,G | ||||||
| Expenses before reductions | .66%H | .66% | .68% | .69% | .69% | .71% |
| Expenses net of fee waivers, if any | .66%H | .66% | .68% | .69% | .69% | .71% |
| Expenses net of all reductions | .66%H | .66% | .68% | .69% | .69% | .70% |
| Net investment income (loss) | 1.29%H | 1.06% | 1.42% | 1.56% | 1.30% | 1.20% |
| Supplemental Data | ||||||
| Net assets, end of period (000 omitted) | $4,397,305 | $4,523,497 | $5,203,794 | $4,893,270 | $5,088,118 | $4,673,798 |
| Portfolio turnover rateI | 16%H | 20% | 27% | 41% | 21% | 19% |
A Calculated based on average shares outstanding during the period.
B Net investment income (loss) is affected by the timing of the declaration of dividends by any underlying mutual funds or exchange-traded funds (ETFs). Net investment income (loss) of any such underlying funds is not included in the Fund's net investment income (loss) ratio.
C Total distributions per share do not sum due to rounding.
D Total returns for periods of less than one year are not annualized.
E Total returns would have been lower if certain expenses had not been reduced during the applicable periods shown.
F Fees and expenses of any underlying mutual funds or exchange-traded funds (ETFs) are not included in the Fund's expense ratio. The Fund indirectly bears its proportionate share of these expenses. For additional expense information related to investments in Fidelity Central Funds, please refer to the "Investments in Fidelity Central Funds" note found in the Notes to Financial Statements section of the most recent Annual or Semi-Annual report.
G Expense ratios reflect operating expenses of the class. Expenses before reductions do not reflect amounts reimbursed, waived, or reduced through arrangements with the investment adviser, brokerage services, or other offset arrangements, if applicable, and do not represent the amount paid by the class during periods when reimbursements, waivers or reductions occur.
H Annualized
I Amount does not include the portfolio activity of any underlying mutual funds or exchange-traded funds (ETFs).
See accompanying notes which are an integral part of the financial statements.
Fidelity Asset Manager 70% Class I
| Six months ended (Unaudited) March 31, | Years endedSeptember 30, | |||||
| 2022 | 2021 | 2020 | 2019 | 2018 | 2017 | |
| Selected Per–Share Data | ||||||
| Net asset value, beginning of period | $28.46 | $23.75 | $22.27 | $23.33 | $22.33 | $19.85 |
| Income from Investment Operations | ||||||
| Net investment income (loss)A,B | .18 | .28 | .31 | .33 | .29 | .24 |
| Net realized and unrealized gain (loss) | (.59) | 4.98 | 2.34 | (.17) | 1.58 | 2.54 |
| Total from investment operations | (.41) | 5.26 | 2.65 | .16 | 1.87 | 2.78 |
| Distributions from net investment income | (.39) | (.24) | (.34) | (.30) | (.25) | (.26) |
| Distributions from net realized gain | (.40) | (.32) | (.83) | (.91) | (.62) | (.04) |
| Total distributions | (.79) | (.55)C | (1.17) | (1.22)C | (.87) | (.30) |
| Net asset value, end of period | $27.26 | $28.46 | $23.75 | $22.27 | $23.33 | $22.33 |
| Total ReturnD,E | (1.59)% | 22.37% | 12.14% | 1.46% | 8.53% | 14.22% |
| Ratios to Average Net AssetsB,F,G | ||||||
| Expenses before reductions | .69%H | .69% | .71% | .72% | .72% | .74% |
| Expenses net of fee waivers, if any | .68%H | .69% | .71% | .72% | .72% | .74% |
| Expenses net of all reductions | .68%H | .69% | .71% | .72% | .72% | .73% |
| Net investment income (loss) | 1.26%H | 1.03% | 1.39% | 1.53% | 1.27% | 1.17% |
| Supplemental Data | ||||||
| Net assets, end of period (000 omitted) | $53,590 | $54,440 | $38,396 | $68,475 | $74,682 | $79,461 |
| Portfolio turnover rateI | 16%H | 20% | 27% | 41% | 21% | 19% |
A Calculated based on average shares outstanding during the period.
B Net investment income (loss) is affected by the timing of the declaration of dividends by any underlying mutual funds or exchange-traded funds (ETFs). Net investment income (loss) of any such underlying funds is not included in the Fund's net investment income (loss) ratio.
C Total distributions per share do not sum due to rounding.
D Total returns for periods of less than one year are not annualized.
E Total returns would have been lower if certain expenses had not been reduced during the applicable periods shown.
F Fees and expenses of any underlying mutual funds or exchange-traded funds (ETFs) are not included in the Fund's expense ratio. The Fund indirectly bears its proportionate share of these expenses. For additional expense information related to investments in Fidelity Central Funds, please refer to the "Investments in Fidelity Central Funds" note found in the Notes to Financial Statements section of the most recent Annual or Semi-Annual report.
G Expense ratios reflect operating expenses of the class. Expenses before reductions do not reflect amounts reimbursed, waived, or reduced through arrangements with the investment adviser, brokerage services, or other offset arrangements, if applicable, and do not represent the amount paid by the class during periods when reimbursements, waivers or reductions occur.
H Annualized
I Amount does not include the portfolio activity of any underlying mutual funds or exchange-traded funds (ETFs).
See accompanying notes which are an integral part of the financial statements.
Fidelity Asset Manager 70% Class Z
| Six months ended (Unaudited) March 31, | Years endedSeptember 30, | |||
| 2022 | 2021 | 2020 | 2019 A | |
| Selected Per–Share Data | ||||
| Net asset value, beginning of period | $28.41 | $23.72 | $22.26 | $23.29 |
| Income from Investment Operations | ||||
| Net investment income (loss)B,C | .19 | .32 | .33 | .35 |
| Net realized and unrealized gain (loss) | (.57) | 4.96 | 2.33 | (.13) |
| Total from investment operations | (.38) | 5.28 | 2.66 | .22 |
| Distributions from net investment income | (.42) | (.27) | (.37) | (.34) |
| Distributions from net realized gain | (.40) | (.32) | (.83) | (.91) |
| Total distributions | (.83)D | (.59) | (1.20) | (1.25) |
| Net asset value, end of period | $27.20 | $28.41 | $23.72 | $22.26 |
| Total ReturnE,F | (1.52)% | 22.48% | 12.21% | 1.78% |
| Ratios to Average Net AssetsC,G,H | ||||
| Expenses before reductions | .59%I | .59% | .61% | .62%I |
| Expenses net of fee waivers, if any | .59%I | .59% | .60% | .61%I |
| Expenses net of all reductions | .59%I | .59% | .60% | .61%I |
| Net investment income (loss) | 1.36%I | 1.13% | 1.49% | 1.64%I |
| Supplemental Data | ||||
| Net assets, end of period (000 omitted) | $2,148,082 | $1,972,441 | $28,723 | $24,876 |
| Portfolio turnover rateJ | 16%I | 20% | 27% | 41% |
A For the period October 2, 2018 (commencement of sale of shares) through September 30, 2019.
B Calculated based on average shares outstanding during the period.
C Net investment income (loss) is affected by the timing of the declaration of dividends by any underlying mutual funds or exchange-traded funds (ETFs). Net investment income (loss) of any such underlying funds is not included in the Fund's net investment income (loss) ratio.
D Total distributions per share do not sum due to rounding.
E Total returns for periods of less than one year are not annualized.
F Total returns would have been lower if certain expenses had not been reduced during the applicable periods shown.
G Fees and expenses of any underlying mutual funds or exchange-traded funds (ETFs) are not included in the Fund's expense ratio. The Fund indirectly bears its proportionate share of these expenses. For additional expense information related to investments in Fidelity Central Funds, please refer to the "Investments in Fidelity Central Funds" note found in the Notes to Financial Statements section of the most recent Annual or Semi-Annual report.
H Expense ratios reflect operating expenses of the class. Expenses before reductions do not reflect amounts reimbursed, waived, or reduced through arrangements with the investment adviser, brokerage services, or other offset arrangements, if applicable, and do not represent the amount paid by the class during periods when reimbursements, waivers or reductions occur.
I Annualized
J Amount does not include the portfolio activity of any underlying mutual funds or exchange-traded funds (ETFs).
See accompanying notes which are an integral part of the financial statements.
Fidelity Asset Manager® 85%
Investment Summary (Unaudited)
The information in the following tables is based on the combined investments of the Fund and its pro-rata share of the investments of Fidelity's Central Funds, other than the Commodity Strategy and Money Market Central Funds.Top Ten Stocks as of March 31, 2022
| % of fund's net assets | |
| Apple, Inc. | 4.3 |
| Microsoft Corp. | 4.1 |
| Alphabet, Inc. Class A | 2.8 |
| Amazon.com, Inc. | 2.2 |
| Fidelity Floating Rate Central Fund | 1.3 |
| Meta Platforms, Inc. Class A | 1.0 |
| UnitedHealth Group, Inc. | 0.9 |
| Tesla, Inc. | 0.9 |
| Exxon Mobil Corp. | 0.8 |
| Wells Fargo & Co. | 0.7 |
| 19.0 |
Market Sectors as of March 31, 2022
| % of fund's net assets | |
| Information Technology | 20.1 |
| Financials | 17.5 |
| Health Care | 9.7 |
| Consumer Discretionary | 9.6 |
| Industrials | 9.4 |
| Communication Services | 6.8 |
| Consumer Staples | 5.2 |
| Real Estate | 4.7 |
| Energy | 3.7 |
| Materials | 3.6 |
| Utilities | 2.1 |
Quality Diversification (% of fund's net assets)
| As of March 31, 2022 | ||
| U.S. Government and U.S. Government Agency Obligations | 2.5% | |
| AAA,AA,A | 0.5% | |
| BBB | 1.2% | |
| BB and Below | 0.9% | |
| Not Rated | 0.2% | |
| Equities* | 92.2% | |
| Short-Term Investments and Net Other Assets | 2.5% | |
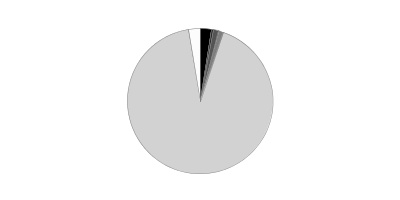
* Includes investment in Fidelity® Commodity Strategy Central Fund of 1.8%
We have used ratings from Moody's Investors Service, Inc. Where Moody's® ratings are not available, we have used S&P® ratings. All ratings are as of the date indicated and do not reflect subsequent changes.
Asset Allocation (% of fund's net assets)
| As of March 31, 2022 | ||
| Stocks and Equity Futures* | 89.4% | |
| Bond Class | 9.1% | |
| Short-Term Class | 1.5% | |

* Includes investment in Fidelity® Commodity Strategy Central Fund of 1.8%
Asset allocations in the pie charts reflect the categorization of assets as defined in the Fund's prospectus in effect as of the time periods indicated above. Percentages are adjusted for the effect of future contracts and swap contracts, if applicable.
Geographic Diversification (% of fund's net assets)
| As of March 31, 2022 | ||
| United States of America | 71.7% | |
| United Kingdom | 2.8% | |
| France | 2.7% | |
| Japan | 2.5% | |
| Canada | 2.3% | |
| Switzerland | 1.9% | |
| Cayman Islands | 1.9% | |
| Netherlands | 1.8% | |
| Germany | 1.6% | |
| Other | 10.8% | |

Percentages are based on country or territory of incorporation and are adjusted for the effect of futures contracts, if applicable.
At period end, foreign investments including the Fund's pro-rata share of the underlying Central Funds, other than the Commodity Strategy Central and Money Market Funds, was 28.3% of net assets.
Percentages in the above tables are adjusted for the effect of TBA Sale Commitments.
An unaudited holdings listing for the Fund, which presents direct holdings as well as the pro-rata share of any securities and other investments held indirectly through its investment in underlying Fidelity Central Funds, other than the Commodity Strategy and Money Market Central Funds, is available at fidelity.com and/or institutional.fidelity.com, as applicable.
Fidelity Asset Manager® 85%
Schedule of Investments March 31, 2022 (Unaudited)
Showing Percentage of Net Assets
| Equity Central Funds - 89.9% | |||
| Shares | Value | ||
| Fidelity Commodity Strategy Central Fund (a)(b) | 11,446,188 | $70,622,983 | |
| Fidelity Emerging Markets Equity Central Fund (b) | 1,298,684 | 280,061,138 | |
| Fidelity International Equity Central Fund (b) | 6,565,519 | 626,219,157 | |
| Fidelity Real Estate Equity Central Fund (b) | 472,663 | 71,981,834 | |
| Fidelity U.S. Equity Central Fund (b) | 20,194,495 | 2,501,088,204 | |
| TOTAL EQUITY CENTRAL FUNDS | |||
| (Cost $2,324,544,298) | 3,549,973,316 | ||
| Fixed-Income Central Funds - 6.8% | |||
| High Yield Fixed-Income Funds - 2.0% | |||
| Fidelity Emerging Markets Debt Central Fund (b) | 1,866,161 | 15,470,474 | |
| Fidelity Emerging Markets Debt Local Currency Central Fund (b) | 108,414 | 9,575,084 | |
| Fidelity Floating Rate Central Fund (b) | 518,116 | 51,682,079 | |
| TOTAL HIGH YIELD FIXED-INCOME FUNDS | 76,727,637 | ||
| Investment Grade Fixed-Income Funds - 4.8% | |||
| Fidelity Inflation-Protected Bond Index Central Fund (b) | 184,552 | 19,235,885 | |
| Fidelity International Credit Central Fund (b) | 532,721 | 50,203,629 | |
| Fidelity Investment Grade Bond Central Fund (b) | 1,137,169 | 121,779,422 | |
| TOTAL INVESTMENT GRADE FIXED-INCOME FUNDS | 191,218,936 | ||
| TOTAL FIXED-INCOME CENTRAL FUNDS | |||
| (Cost $276,143,382) | 267,946,573 | ||
| Money Market Central Funds - 3.1% | |||
| Fidelity Cash Central Fund 0.31% (c) | 43,481,427 | 43,490,123 | |
| Fidelity Securities Lending Cash Central Fund 0.31% (c)(d) | 81,293,489 | 81,301,619 | |
| TOTAL MONEY MARKET CENTRAL FUNDS | |||
| (Cost $124,791,742) | 124,791,742 | ||
| Principal Amount | Value | ||
| U.S. Treasury Obligations - 0.1% | |||
| U.S. Treasury Bills, yield at date of purchase 0.11% to 0.33% 4/14/22 to 6/2/22 (e) | |||
| (Cost $3,148,466) | 3,150,000 | 3,148,459 | |
| Shares | Value | ||
| Investment Companies - 2.1% | |||
| iShares 20+ Year Treasury Bond ETF (f) | |||
| (Cost $97,906,552) | 643,877 | 85,043,272 | |
| TOTAL INVESTMENT IN SECURITIES - 102.0% | |||
| (Cost $2,826,534,440) | 4,030,903,362 | ||
| NET OTHER ASSETS (LIABILITIES) - (2.0)% | (80,580,013) | ||
| NET ASSETS - 100% | $3,950,323,349 |
| Futures Contracts | |||||
| Number of contracts | Expiration Date | Notional Amount | Value | Unrealized Appreciation/(Depreciation) | |
| Purchased | |||||
| Equity Index Contracts | |||||
| ICE E-mini MSCI Emerging Markets Index Contracts (United States) | 323 | June 2022 | $18,176,825 | $1,387,192 | $1,387,192 |
| TOTAL PURCHASED FUTURES | 1,387,192 | ||||
| Sold | |||||
| Equity Index Contracts | |||||
| CME Micro E-mini S&P 500 Index Contracts (United States) | 44 | June 2022 | 9,967,650 | 140,603 | 140,603 |
| ICE E-mini MSCI EAFE Index Contracts (United States) | 773 | June 2022 | 82,881,060 | (4,806,582) | (4,806,582) |
| TOTAL SOLD FUTURES | (4,665,979) | ||||
| TOTAL FUTURES CONTRACTS | $(3,278,787) |
The notional amount of futures purchased as a percentage of Net Assets is 0.5%
The notional amount of futures sold as a percentage of Net Assets is 2.4%
For the period, the average monthly notional amount at value for futures contracts in the aggregate was $122,591,993.
Security Type Abbreviations
ETF – Exchange-Traded Fund
Legend
(a) Non-income producing
(b) Affiliated fund that is generally available only to investment companies and other accounts managed by Fidelity Investments. A complete unaudited schedule of portfolio holdings for each Fidelity Central Fund is filed with the SEC for the first and third quarters of each fiscal year on Form N-PORT and is available upon request or at the SEC's website at www.sec.gov. An unaudited holdings listing for the Fund, which presents direct holdings as well as the pro-rata share of securities and other investments held indirectly through its investment in underlying non-money market Fidelity Central Funds, other than the Commodity Strategy Central Fund, is available at fidelity.com and/or institutional.fidelity.com, as applicable. In addition, each Fidelity Central Fund's financial statements are available on the SEC's website or upon request.
(c) Affiliated fund that is generally available only to investment companies and other accounts managed by Fidelity Investments. The rate quoted is the annualized seven-day yield of the fund at period end. A complete unaudited listing of the fund's holdings as of its most recent quarter end is available upon request. In addition, each Fidelity Central Fund's financial statements are available on the SEC's website or upon request.
(d) Investment made with cash collateral received from securities on loan.
(e) Security or a portion of the security was pledged to cover margin requirements for futures contracts. At period end, the value of securities pledged amounted to $2,887,606.
(f) Security or a portion of the security is on loan at period end.
Affiliated Central Funds
Fiscal year to date information regarding the Fund's investments in Fidelity Central Funds, including the ownership percentage, is presented below.
| Fund | Value, beginning of period | Purchases | Sales Proceeds | Dividend Income | Realized Gain (loss) | Change in Unrealized appreciation (depreciation) | Value, end of period | % ownership, end of period |
| Fidelity Cash Central Fund 0.31% | $11,907,906 | $132,438,964 | $100,856,747 | $13,741 | $-- | $-- | $43,490,123 | 0.1 |
| Fidelity Commodity Strategy Central Fund | 81,265,451 | 5,298,203 | 34,459,729 | -- | 6,071,223 | 12,447,835 | 70,622,983 | 12.1 |
| Fidelity Emerging Markets Debt Central Fund | 15,339,531 | 2,341,846 | 697,775 | 354,152 | (22,895) | (1,490,233) | 15,470,474 | 0.6 |
| Fidelity Emerging Markets Debt Local Currency Central Fund | 10,270,984 | 562,939 | -- | 562,939 | -- | (1,258,839) | 9,575,084 | 10.6 |
| Fidelity Emerging Markets Equity Central Fund | 278,335,206 | 90,161,584 | 19,245,065 | 22,313,388 | 1,978,309 | (71,168,896) | 280,061,138 | 15.5 |
| Fidelity Floating Rate Central Fund | -- | 52,983,972 | 686,382 | 423,377 | (4,791) | (610,720) | 51,682,079 | 1.6 |
| Fidelity High Income Central Fund | 58,170,351 | 3,087,074 | 60,698,962 | 865,139 | 6,723,758 | (7,282,221) | -- | -- |
| Fidelity Inflation-Protected Bond Index Central Fund | 65,939,974 | 8,188,776 | 51,033,560 | 4,454,225 | 1,209,040 | (5,068,345) | 19,235,885 | 2.9 |
| Fidelity International Credit Central Fund | 62,861,437 | 5,554,553 | 13,517,782 | 1,042,012 | (775,737) | (3,918,842) | 50,203,629 | 9.8 |
| Fidelity International Equity Central Fund | 586,111,212 | 127,783,588 | 15,389,781 | 38,543,864 | (906,113) | (71,379,749) | 626,219,157 | 16.4 |
| Fidelity Investment Grade Bond Central Fund | 42,718,442 | 98,069,071 | 13,041,573 | 831,916 | (237,662) | (5,728,856) | 121,779,422 | 0.4 |
| Fidelity Real Estate Equity Central Fund | 65,331,143 | 24,490,265 | 21,925,255 | 844,001 | (1,172,144) | 5,257,825 | 71,981,834 | 4.3 |
| Fidelity Securities Lending Cash Central Fund 0.31% | 110,511,125 | 570,881,427 | 600,090,933 | 128,538 | -- | -- | 81,301,619 | 0.2 |
| Fidelity U.S. Equity Central Fund | 2,403,201,360 | 378,773,021 | 113,051,932 | 204,518,251 | (1,557,111) | (166,277,134) | 2,501,088,204 | 11.5 |
| $3,791,964,122 | $1,500,615,283 | $1,044,695,476 | $274,895,543 | $11,305,877 | $(316,478,175) | $3,942,711,631 |
Amounts in the income column in the above table include any capital gain distributions from underlying funds, which are presented in the corresponding line-item in the Statement of Operations, if applicable. Amount for Fidelity Securities Lending Cash Central Fund represents the income earned on investing cash collateral, less rebates paid to borrowers and any lending agent fees associated with the loan, plus any premium payments received for lending certain types of securities.
Investment Valuation
The following is a summary of the inputs used, as of March 31, 2022, involving the Fund's assets and liabilities carried at fair value. The inputs or methodology used for valuing securities may not be an indication of the risk associated with investing in those securities. For more information on valuation inputs, and their aggregation into the levels used below, please refer to the Investment Valuation section in the accompanying Notes to Financial Statements.
| Valuation Inputs at Reporting Date: | ||||
| Description | Total | Level 1 | Level 2 | Level 3 |
| Investments in Securities: | ||||
| Equity Central Funds | $3,549,973,316 | $3,549,973,316 | $-- | $-- |
| Fixed-Income Central Funds | 267,946,573 | 267,946,573 | -- | -- |
| Money Market Central Funds | 124,791,742 | 124,791,742 | -- | -- |
| U.S. Treasury Obligations | 3,148,459 | -- | 3,148,459 | -- |
| Investment Companies | 85,043,272 | 85,043,272 | -- | -- |
| Total Investments in Securities: | $4,030,903,362 | $4,027,754,903 | $3,148,459 | $-- |
| Derivative Instruments: | ||||
| Assets | ||||
| Futures Contracts | $1,527,795 | $1,527,795 | $-- | $-- |
| Total Assets | $1,527,795 | $1,527,795 | $-- | $-- |
| Liabilities | ||||
| Futures Contracts | $(4,806,582) | $(4,806,582) | $-- | $-- |
| Total Liabilities | $(4,806,582) | $(4,806,582) | $-- | $-- |
| Total Derivative Instruments: | $(3,278,787) | $(3,278,787) | $-- | $-- |
Value of Derivative Instruments
The following table is a summary of the Fund's value of derivative instruments by primary risk exposure as of March 31, 2022. For additional information on derivative instruments, please refer to the Derivative Instruments section in the accompanying Notes to Financial Statements.
| Primary Risk Exposure / Derivative Type | Value | |
| Asset | Liability | |
| Equity Risk | ||
| Futures Contracts(a) | $1,527,795 | $(4,806,582) |
| Total Equity Risk | 1,527,795 | (4,806,582) |
| Total Value of Derivatives | $1,527,795 | $(4,806,582) |
(a) Reflects gross cumulative appreciation (depreciation) on futures contracts as presented in the Schedule of Investments. In the Statement of Assets and Liabilities, the period end daily variation margin is included in receivable or payable for daily variation margin on futures contracts, and the net cumulative appreciation (depreciation) is included in Total accumulated earnings (loss).
See accompanying notes which are an integral part of the financial statements.
Fidelity Asset Manager® 85%
Financial Statements
Statement of Assets and Liabilities
| March 31, 2022 (Unaudited) | ||
| Assets | ||
| Investment in securities, at value (including securities loaned of $79,838,794) — See accompanying schedule: Unaffiliated issuers (cost $101,055,018) | $88,191,731 | |
| Fidelity Central Funds (cost $2,725,479,422) | 3,942,711,631 | |
| Total Investment in Securities (cost $2,826,534,440) | $4,030,903,362 | |
| Receivable for investments sold | 1,577,016 | |
| Receivable for fund shares sold | 1,353,031 | |
| Distributions receivable from Fidelity Central Funds | 22,912 | |
| Receivable for daily variation margin on futures contracts | 1,281,860 | |
| Prepaid expenses | 1,867 | |
| Total assets | 4,035,140,048 | |
| Liabilities | ||
| Payable for investments purchased | $22,493 | |
| Payable for fund shares redeemed | 1,249,376 | |
| Distributions payable | 6 | |
| Accrued management fee | 1,678,566 | |
| Distribution and service plan fees payable | 99,955 | |
| Other affiliated payables | 414,355 | |
| Other payables and accrued expenses | 50,329 | |
| Collateral on securities loaned | 81,301,619 | |
| Total liabilities | 84,816,699 | |
| Net Assets | $3,950,323,349 | |
| Net Assets consist of: | ||
| Paid in capital | $2,756,764,133 | |
| Total accumulated earnings (loss) | 1,193,559,216 | |
| Net Assets | $3,950,323,349 | |
| Net Asset Value and Maximum Offering Price | ||
| Class A: | ||
| Net Asset Value and redemption price per share ($198,633,995 ÷ 8,027,238 shares)(a) | $24.74 | |
| Maximum offering price per share (100/94.25 of $24.74) | $26.25 | |
| Class M: | ||
| Net Asset Value and redemption price per share ($53,965,423 ÷ 2,197,250 shares)(a) | $24.56 | |
| Maximum offering price per share (100/96.50 of $24.56) | $25.45 | |
| Class C: | ||
| Net Asset Value and offering price per share ($46,341,841 ÷ 1,907,544 shares)(a) | $24.29 | |
| Asset Manager 85%: | ||
| Net Asset Value, offering price and redemption price per share ($2,172,988,897 ÷ 86,816,781 shares) | $25.03 | |
| Class I: | ||
| Net Asset Value, offering price and redemption price per share ($61,327,574 ÷ 2,457,578 shares) | $24.95 | |
| Class Z: | ||
| Net Asset Value, offering price and redemption price per share ($1,417,065,619 ÷ 56,929,378 shares) | $24.89 |
(a) Redemption price per share is equal to net asset value less any applicable contingent deferred sales charge.
See accompanying notes which are an integral part of the financial statements.
Statement of Operations
| Six months ended March 31, 2022 (Unaudited) | ||
| Investment Income | ||
| Dividends | $851,553 | |
| Interest | 1,332 | |
| Income from Fidelity Central Funds (including $128,538 from security lending) | 31,007,713 | |
| Total income | 31,860,598 | |
| Expenses | ||
| Management fee | $10,386,043 | |
| Transfer agent fees | 1,901,057 | |
| Distribution and service plan fees | 635,295 | |
| Accounting fees | 519,245 | |
| Custodian fees and expenses | 16,962 | |
| Independent trustees' fees and expenses | 6,655 | |
| Registration fees | 67,680 | |
| Audit | 16,579 | |
| Legal | 4,433 | |
| Miscellaneous | 8,768 | |
| Total expenses before reductions | 13,562,717 | |
| Expense reductions | (60,476) | |
| Total expenses after reductions | 13,502,241 | |
| Net investment income (loss) | 18,358,357 | |
| Realized and Unrealized Gain (Loss) | ||
| Net realized gain (loss) on: | ||
| Investment securities: | ||
| Unaffiliated issuers | (2,647,797) | |
| Fidelity Central Funds | 11,305,877 | |
| Futures contracts | 7,586,276 | |
| Capital gain distributions from Fidelity Central Funds | 243,887,830 | |
| Total net realized gain (loss) | 260,132,186 | |
| Change in net unrealized appreciation (depreciation) on: | ||
| Investment securities: | ||
| Unaffiliated issuers | (5,867,958) | |
| Fidelity Central Funds | (316,478,175) | |
| Futures contracts | (9,098,129) | |
| Total change in net unrealized appreciation (depreciation) | (331,444,262) | |
| Net gain (loss) | (71,312,076) | |
| Net increase (decrease) in net assets resulting from operations | $(52,953,719) |
See accompanying notes which are an integral part of the financial statements.
Statement of Changes in Net Assets
| Six months ended March 31, 2022 (Unaudited) | Year ended September 30, 2021 | |
| Increase (Decrease) in Net Assets | ||
| Operations | ||
| Net investment income (loss) | $18,358,357 | $31,404,420 |
| Net realized gain (loss) | 260,132,186 | 39,122,970 |
| Change in net unrealized appreciation (depreciation) | (331,444,262) | 698,273,718 |
| Net increase (decrease) in net assets resulting from operations | (52,953,719) | 768,801,108 |
| Distributions to shareholders | (128,057,101) | (62,299,659) |
| Share transactions - net increase (decrease) | 329,201,555 | 290,321,267 |
| Total increase (decrease) in net assets | 148,190,735 | 996,822,716 |
| Net Assets | ||
| Beginning of period | 3,802,132,614 | 2,805,309,898 |
| End of period | $3,950,323,349 | $3,802,132,614 |
See accompanying notes which are an integral part of the financial statements.
Financial Highlights
Fidelity Asset Manager 85% Class A
| Six months ended (Unaudited) March 31, | Years endedSeptember 30, | |||||
| 2022 | 2021 | 2020 | 2019 | 2018 | 2017 | |
| Selected Per–Share Data | ||||||
| Net asset value, beginning of period | $25.79 | $20.73 | $19.30 | $20.36 | $19.02 | $16.45 |
| Income from Investment Operations | ||||||
| Net investment income (loss)A,B | .08 | .16 | .19 | .20 | .16 | .13 |
| Net realized and unrealized gain (loss) | (.35) | 5.31 | 2.29 | (.37) | 1.77 | 2.61 |
| Total from investment operations | (.27) | 5.47 | 2.48 | (.17) | 1.93 | 2.74 |
| Distributions from net investment income | (.24) | (.13) | (.22) | (.17) | (.14) | (.13) |
| Distributions from net realized gain | (.54) | (.28) | (.84) | (.72) | (.45) | (.05) |
| Total distributions | (.78) | (.41) | (1.05)C | (.89) | (.59) | (.17)C |
| Net asset value, end of period | $24.74 | $25.79 | $20.73 | $19.30 | $20.36 | $19.02 |
| Total ReturnD,E,F | (1.24)% | 26.59% | 13.11% | (.11)% | 10.29% | 16.83% |
| Ratios to Average Net AssetsB,G,H | ||||||
| Expenses before reductions | .97%I | .98% | 1.00% | 1.01% | 1.02% | 1.04% |
| Expenses net of fee waivers, if any | .96%I | .98% | .99% | 1.01% | 1.02% | 1.04% |
| Expenses net of all reductions | .96%I | .98% | .99% | 1.01% | 1.02% | 1.03% |
| Net investment income (loss) | .64%I | .64% | .97% | 1.06% | .80% | .74% |
| Supplemental Data | ||||||
| Net assets, end of period (000 omitted) | $198,634 | $191,715 | $143,117 | $125,168 | $115,447 | $92,868 |
| Portfolio turnover rateJ | 18%I | 18% | 41% | 47% | 24% | 23% |
A Calculated based on average shares outstanding during the period.
B Net investment income (loss) is affected by the timing of the declaration of dividends by any underlying mutual funds or exchange-traded funds (ETFs). Net investment income (loss) of any such underlying funds is not included in the Fund's net investment income (loss) ratio.
C Total distributions per share do not sum due to rounding.
D Total returns for periods of less than one year are not annualized.
E Total returns would have been lower if certain expenses had not been reduced during the applicable periods shown.
F Total returns do not include the effect of the sales charges.
G Fees and expenses of any underlying mutual funds or exchange-traded funds (ETFs) are not included in the Fund's expense ratio. The Fund indirectly bears its proportionate share of these expenses. For additional expense information related to investments in Fidelity Central Funds, please refer to the "Investments in Fidelity Central Funds" note found in the Notes to Financial Statements section of the most recent Annual or Semi-Annual report.
H Expense ratios reflect operating expenses of the class. Expenses before reductions do not reflect amounts reimbursed, waived, or reduced through arrangements with the investment adviser, brokerage services, or other offset arrangements, if applicable, and do not represent the amount paid by the class during periods when reimbursements, waivers or reductions occur.
I Annualized
J Amount does not include the portfolio activity of any underlying mutual funds or exchange-traded funds (ETFs).
See accompanying notes which are an integral part of the financial statements.
Fidelity Asset Manager 85% Class M
| Six months ended (Unaudited) March 31, | Years endedSeptember 30, | |||||
| 2022 | 2021 | 2020 | 2019 | 2018 | 2017 | |
| Selected Per–Share Data | ||||||
| Net asset value, beginning of period | $25.58 | $20.57 | $19.17 | $20.22 | $18.91 | $16.34 |
| Income from Investment Operations | ||||||
| Net investment income (loss)A,B | .05 | .09 | .14 | .15 | .10 | .08 |
| Net realized and unrealized gain (loss) | (.35) | 5.28 | 2.27 | (.36) | 1.75 | 2.61 |
| Total from investment operations | (.30) | 5.37 | 2.41 | (.21) | 1.85 | 2.69 |
| Distributions from net investment income | (.18) | (.08) | (.18) | (.13) | (.09) | (.07) |
| Distributions from net realized gain | (.54) | (.28) | (.84) | (.72) | (.45) | (.05) |
| Total distributions | (.72) | (.36) | (1.01)C | (.84)C | (.54) | (.12) |
| Net asset value, end of period | $24.56 | $25.58 | $20.57 | $19.17 | $20.22 | $18.91 |
| Total ReturnD,E,F | (1.37)% | 26.30% | 12.81% | (.35)% | 9.94% | 16.54% |
| Ratios to Average Net AssetsB,G,H | ||||||
| Expenses before reductions | 1.21%I | 1.23% | 1.25% | 1.27% | 1.29% | 1.31% |
| Expenses net of fee waivers, if any | 1.21%I | 1.23% | 1.25% | 1.27% | 1.29% | 1.31% |
| Expenses net of all reductions | 1.21%I | 1.23% | 1.25% | 1.27% | 1.29% | 1.31% |
| Net investment income (loss) | .40%I | .39% | .72% | .80% | .53% | .46% |
| Supplemental Data | ||||||
| Net assets, end of period (000 omitted) | $53,965 | $54,864 | $40,604 | $33,611 | $31,371 | $24,207 |
| Portfolio turnover rateJ | 18%I | 18% | 41% | 47% | 24% | 23% |
A Calculated based on average shares outstanding during the period.
B Net investment income (loss) is affected by the timing of the declaration of dividends by any underlying mutual funds or exchange-traded funds (ETFs). Net investment income (loss) of any such underlying funds is not included in the Fund's net investment income (loss) ratio.
C Total distributions per share do not sum due to rounding.
D Total returns for periods of less than one year are not annualized.
E Total returns would have been lower if certain expenses had not been reduced during the applicable periods shown.
F Total returns do not include the effect of the sales charges.
G Fees and expenses of any underlying mutual funds or exchange-traded funds (ETFs) are not included in the Fund's expense ratio. The Fund indirectly bears its proportionate share of these expenses. For additional expense information related to investments in Fidelity Central Funds, please refer to the "Investments in Fidelity Central Funds" note found in the Notes to Financial Statements section of the most recent Annual or Semi-Annual report.
H Expense ratios reflect operating expenses of the class. Expenses before reductions do not reflect amounts reimbursed, waived, or reduced through arrangements with the investment adviser, brokerage services, or other offset arrangements, if applicable, and do not represent the amount paid by the class during periods when reimbursements, waivers or reductions occur.
I Annualized
J Amount does not include the portfolio activity of any underlying mutual funds or exchange-traded funds (ETFs).
See accompanying notes which are an integral part of the financial statements.
Fidelity Asset Manager 85% Class C
| Six months ended (Unaudited) March 31, | Years endedSeptember 30, | |||||
| 2022 | 2021 | 2020 | 2019 | 2018 | 2017 | |
| Selected Per–Share Data | ||||||
| Net asset value, beginning of period | $25.24 | $20.31 | $18.92 | $19.95 | $18.65 | $16.14 |
| Income from Investment Operations | ||||||
| Net investment income (loss)A,B | (.01) | (.03) | .04 | .06 | .01 | –C |
| Net realized and unrealized gain (loss) | (.37) | 5.21 | 2.24 | (.35) | 1.74 | 2.56 |
| Total from investment operations | (.38) | 5.18 | 2.28 | (.29) | 1.75 | 2.56 |
| Distributions from net investment income | (.03) | – | (.06) | (.02) | –C | (.01) |
| Distributions from net realized gain | (.54) | (.25) | (.84) | (.72) | (.45) | (.05) |
| Total distributions | (.57) | (.25) | (.89)D | (.74) | (.45) | (.05)D |
| Net asset value, end of period | $24.29 | $25.24 | $20.31 | $18.92 | $19.95 | $18.65 |
| Total ReturnE,F,G | (1.65)% | 25.65% | 12.25% | (.88)% | 9.51% | 15.94% |
| Ratios to Average Net AssetsB,H,I | ||||||
| Expenses before reductions | 1.73%J | 1.74% | 1.76% | 1.77% | 1.77% | 1.79% |
| Expenses net of fee waivers, if any | 1.73%J | 1.74% | 1.76% | 1.77% | 1.77% | 1.79% |
| Expenses net of all reductions | 1.73%J | 1.74% | 1.76% | 1.77% | 1.77% | 1.78% |
| Net investment income (loss) | (.12)%J | (.13)% | .21% | .30% | .05% | (.01)% |
| Supplemental Data | ||||||
| Net assets, end of period (000 omitted) | $46,342 | $49,896 | $44,510 | $40,909 | $50,588 | $44,313 |
| Portfolio turnover rateK | 18%J | 18% | 41% | 47% | 24% | 23% |
A Calculated based on average shares outstanding during the period.
B Net investment income (loss) is affected by the timing of the declaration of dividends by any underlying mutual funds or exchange-traded funds (ETFs). Net investment income (loss) of any such underlying funds is not included in the Fund's net investment income (loss) ratio.
C Amount represents less than $.005 per share.
D Total distributions per share do not sum due to rounding.
E Total returns for periods of less than one year are not annualized.
F Total returns would have been lower if certain expenses had not been reduced during the applicable periods shown.
G Total returns do not include the effect of the contingent deferred sales charge.
H Fees and expenses of any underlying mutual funds or exchange-traded funds (ETFs) are not included in the Fund's expense ratio. The Fund indirectly bears its proportionate share of these expenses. For additional expense information related to investments in Fidelity Central Funds, please refer to the "Investments in Fidelity Central Funds" note found in the Notes to Financial Statements section of the most recent Annual or Semi-Annual report.
I Expense ratios reflect operating expenses of the class. Expenses before reductions do not reflect amounts reimbursed, waived, or reduced through arrangements with the investment adviser, brokerage services, or other offset arrangements, if applicable, and do not represent the amount paid by the class during periods when reimbursements, waivers or reductions occur.
J Annualized
K Amount does not include the portfolio activity of any underlying mutual funds or exchange-traded funds (ETFs).
See accompanying notes which are an integral part of the financial statements.
Fidelity Asset Manager 85%
| Six months ended (Unaudited) March 31, | Years endedSeptember 30, | |||||
| 2022 | 2021 | 2020 | 2019 | 2018 | 2017 | |
| Selected Per–Share Data | ||||||
| Net asset value, beginning of period | $26.10 | $20.96 | $19.50 | $20.56 | $19.20 | $16.60 |
| Income from Investment Operations | ||||||
| Net investment income (loss)A,B | .12 | .23 | .25 | .26 | .22 | .19 |
| Net realized and unrealized gain (loss) | (.35) | 5.38 | 2.32 | (.38) | 1.78 | 2.63 |
| Total from investment operations | (.23) | 5.61 | 2.57 | (.12) | 2.00 | 2.82 |
| Distributions from net investment income | (.30) | (.19) | (.27) | (.23) | (.19) | (.17) |
| Distributions from net realized gain | (.54) | (.28) | (.84) | (.72) | (.45) | (.05) |
| Total distributions | (.84) | (.47) | (1.11) | (.94)C | (.64) | (.22) |
| Net asset value, end of period | $25.03 | $26.10 | $20.96 | $19.50 | $20.56 | $19.20 |
| Total ReturnD,E | (1.08)% | 27.00% | 13.44% | .21% | 10.62% | 17.20% |
| Ratios to Average Net AssetsB,F,G | ||||||
| Expenses before reductions | .68%H | .68% | .69% | .71% | .71% | .73% |
| Expenses net of fee waivers, if any | .67%H | .68% | .69% | .71% | .71% | .73% |
| Expenses net of all reductions | .67%H | .68% | .69% | .71% | .71% | .73% |
| Net investment income (loss) | .93%H | .94% | 1.28% | 1.36% | 1.11% | 1.05% |
| Supplemental Data | ||||||
| Net assets, end of period (000 omitted) | $2,172,989 | $2,185,948 | $2,520,790 | $2,278,919 | $2,377,705 | $1,832,601 |
| Portfolio turnover rateI | 18%H | 18% | 41% | 47% | 24% | 23% |
A Calculated based on average shares outstanding during the period.
B Net investment income (loss) is affected by the timing of the declaration of dividends by any underlying mutual funds or exchange-traded funds (ETFs). Net investment income (loss) of any such underlying funds is not included in the Fund's net investment income (loss) ratio.
C Total distributions per share do not sum due to rounding.
D Total returns for periods of less than one year are not annualized.
E Total returns would have been lower if certain expenses had not been reduced during the applicable periods shown.
F Fees and expenses of any underlying mutual funds or exchange-traded funds (ETFs) are not included in the Fund's expense ratio. The Fund indirectly bears its proportionate share of these expenses. For additional expense information related to investments in Fidelity Central Funds, please refer to the "Investments in Fidelity Central Funds" note found in the Notes to Financial Statements section of the most recent Annual or Semi-Annual report.
G Expense ratios reflect operating expenses of the class. Expenses before reductions do not reflect amounts reimbursed, waived, or reduced through arrangements with the investment adviser, brokerage services, or other offset arrangements, if applicable, and do not represent the amount paid by the class during periods when reimbursements, waivers or reductions occur.
H Annualized
I Amount does not include the portfolio activity of any underlying mutual funds or exchange-traded funds (ETFs).
See accompanying notes which are an integral part of the financial statements.
Fidelity Asset Manager 85% Class I
| Six months ended (Unaudited) March 31, | Years endedSeptember 30, | |||||
| 2022 | 2021 | 2020 | 2019 | 2018 | 2017 | |
| Selected Per–Share Data | ||||||
| Net asset value, beginning of period | $26.03 | $20.91 | $19.45 | $20.50 | $19.15 | $16.55 |
| Income from Investment Operations | ||||||
| Net investment income (loss)A,B | .12 | .22 | .24 | .25 | .21 | .18 |
| Net realized and unrealized gain (loss) | (.36) | 5.36 | 2.32 | (.37) | 1.78 | 2.63 |
| Total from investment operations | (.24) | 5.58 | 2.56 | (.12) | 1.99 | 2.81 |
| Distributions from net investment income | (.30) | (.18) | (.26) | (.21) | (.19) | (.16) |
| Distributions from net realized gain | (.54) | (.28) | (.84) | (.72) | (.45) | (.05) |
| Total distributions | (.84) | (.46) | (1.10) | (.93) | (.64) | (.21) |
| Net asset value, end of period | $24.95 | $26.03 | $20.91 | $19.45 | $20.50 | $19.15 |
| Total ReturnC,D | (1.12)% | 26.93% | 13.40% | .15% | 10.58% | 17.16% |
| Ratios to Average Net AssetsB,E,F | ||||||
| Expenses before reductions | .71%G | .71% | .73% | .74% | .75% | .76% |
| Expenses net of fee waivers, if any | .70%G | .71% | .72% | .74% | .75% | .76% |
| Expenses net of all reductions | .70%G | .71% | .72% | .74% | .75% | .75% |
| Net investment income (loss) | .90%G | .90% | 1.25% | 1.33% | 1.07% | 1.02% |
| Supplemental Data | ||||||
| Net assets, end of period (000 omitted) | $61,328 | $60,989 | $31,606 | $39,115 | $54,135 | $38,765 |
| Portfolio turnover rateH | 18%G | 18% | 41% | 47% | 24% | 23% |
A Calculated based on average shares outstanding during the period.
B Net investment income (loss) is affected by the timing of the declaration of dividends by any underlying mutual funds or exchange-traded funds (ETFs). Net investment income (loss) of any such underlying funds is not included in the Fund's net investment income (loss) ratio.
C Total returns for periods of less than one year are not annualized.
D Total returns would have been lower if certain expenses had not been reduced during the applicable periods shown.
E Fees and expenses of any underlying mutual funds or exchange-traded funds (ETFs) are not included in the Fund's expense ratio. The Fund indirectly bears its proportionate share of these expenses. For additional expense information related to investments in Fidelity Central Funds, please refer to the "Investments in Fidelity Central Funds" note found in the Notes to Financial Statements section of the most recent Annual or Semi-Annual report.
F Expense ratios reflect operating expenses of the class. Expenses before reductions do not reflect amounts reimbursed, waived, or reduced through arrangements with the investment adviser, brokerage services, or other offset arrangements, if applicable, and do not represent the amount paid by the class during periods when reimbursements, waivers or reductions occur.
G Annualized
H Amount does not include the portfolio activity of any underlying mutual funds or exchange-traded funds (ETFs).
See accompanying notes which are an integral part of the financial statements.
Fidelity Asset Manager 85% Class Z
| Six months ended (Unaudited) March 31, | Years endedSeptember 30, | |||
| 2022 | 2021 | 2020 | 2019 A | |
| Selected Per–Share Data | ||||
| Net asset value, beginning of period | $25.99 | $20.87 | $19.43 | $20.45 |
| Income from Investment Operations | ||||
| Net investment income (loss)B,C | .13 | .26 | .26 | .27 |
| Net realized and unrealized gain (loss) | (.35) | 5.34 | 2.31 | (.32) |
| Total from investment operations | (.22) | 5.60 | 2.57 | (.05) |
| Distributions from net investment income | (.34) | (.21) | (.30) | (.25) |
| Distributions from net realized gain | (.54) | (.28) | (.84) | (.72) |
| Total distributions | (.88) | (.48)D | (1.13)D | (.97) |
| Net asset value, end of period | $24.89 | $25.99 | $20.87 | $19.43 |
| Total ReturnE,F | (1.07)% | 27.11% | 13.50% | .54% |
| Ratios to Average Net AssetsC,G,H | ||||
| Expenses before reductions | .60%I | .60% | .61% | .62%I |
| Expenses net of fee waivers, if any | .59%I | .60% | .61% | .62%I |
| Expenses net of all reductions | .59%I | .60% | .61% | .62%I |
| Net investment income (loss) | 1.01%I | 1.01% | 1.36% | 1.45%I |
| Supplemental Data | ||||
| Net assets, end of period (000 omitted) | $1,417,066 | $1,258,721 | $24,683 | $23,286 |
| Portfolio turnover rateJ | 18%I | 18% | 41% | 47% |
A For the period October 2, 2018 (commencement of sale of shares) through September 30, 2019.
B Calculated based on average shares outstanding during the period.
C Net investment income (loss) is affected by the timing of the declaration of dividends by any underlying mutual funds or exchange-traded funds (ETFs). Net investment income (loss) of any such underlying funds is not included in the Fund's net investment income (loss) ratio.
D Total distributions per share do not sum due to rounding.
E Total returns for periods of less than one year are not annualized.
F Total returns would have been lower if certain expenses had not been reduced during the applicable periods shown.
G Fees and expenses of any underlying mutual funds or exchange-traded funds (ETFs) are not included in the Fund's expense ratio. The Fund indirectly bears its proportionate share of these expenses. For additional expense information related to investments in Fidelity Central Funds, please refer to the "Investments in Fidelity Central Funds" note found in the Notes to Financial Statements section of the most recent Annual or Semi-Annual report.
H Expense ratios reflect operating expenses of the class. Expenses before reductions do not reflect amounts reimbursed, waived, or reduced through arrangements with the investment adviser, brokerage services, or other offset arrangements, if applicable, and do not represent the amount paid by the class during periods when reimbursements, waivers or reductions occur.
I Annualized
J Amount does not include the portfolio activity of any underlying mutual funds or exchange-traded funds (ETFs).
See accompanying notes which are an integral part of the financial statements.
Notes to Financial Statements (Unaudited)
For the period ended March 31, 2022
1. Organization.
Fidelity Asset Manager 20%, Fidelity Asset Manager 30%, Fidelity Asset Manager 40%, Fidelity Asset Manager 50%, Fidelity Asset Manager 60%, Fidelity Asset Manager 70% and Fidelity Asset Manager 85% (the Funds) are funds of Fidelity Charles Street Trust (the Trust). The Trust is registered under the Investment Company Act of 1940, as amended (the 1940 Act), as an open-end management investment company organized as a Massachusetts business trust. Each Fund is authorized to issue an unlimited number of shares. Each Fund offers Class A, Class M, Class C, Asset Manager, Class I and Class Z shares, each of which has equal rights as to assets and voting privileges. Each class has exclusive voting rights with respect to matters that affect that class. Class C shares will automatically convert to Class A shares after a holding period of eight years from the initial date of purchase, with certain exceptions.
2. Investments in Fidelity Central Funds.
Funds may invest in Fidelity Central Funds, which are open-end investment companies generally available only to other investment companies and accounts managed by the investment adviser and its affiliates. The Schedule of Investments lists any Fidelity Central Funds held as an investment as of period end, but does not include the underlying holdings of each Fidelity Central Fund. An investing fund indirectly bears its proportionate share of the expenses of the underlying Fidelity Central Funds.
Based on its investment objective, each Fidelity Central Fund may invest or participate in various investment vehicles or strategies that are similar to those of the investing fund. These strategies are consistent with the investment objectives of the investing fund and may involve certain economic risks which may cause a decline in value of each of the Fidelity Central Funds and thus a decline in the value of the investing fund.
| Fidelity Central Fund | Investment Manager | Investment Objective | Investment Practices | Expense Ratio(a) |
| Fidelity Commodity Strategy Central Fund | Geode Capital Management, LLC (Geode) | Seeks to provide investment returns that correspond to the performance of the commodities market. | Investment in commodity-related investments through a wholly-owned subsidiary organized under the laws of the Cayman Islands Futures | Less than .005% |
| Fidelity Emerging Markets Debt Central Fund | Fidelity Management & Research Company LLC (FMR) | Seeks high total return by normally investing in debt securities of issuers in emerging markets and other debt investments that are tied economically to emerging markets. | Foreign Securities Restricted Securities | Less than .005% |
| Fidelity Emerging Markets Equity Central Fund | Fidelity Management & Research Company LLC (FMR) | Seeks capital appreciation by investing primarily in equity securities of issuers in emerging markets. | Foreign Securities Futures | .02% |
| Fidelity International Equity Central Fund | Fidelity Management & Research Company LLC (FMR) | Seeks capital appreciation by investing primarily in non-U.S. based common stocks, including securities of issuers located in emerging markets. | Foreign Securities Futures | Less than .005% |
| Fidelity Floating Rate Central Fund | Fidelity Management & Research Company LLC (FMR) | Seeks a high level of income by normally investing in floating rate loans and other floating rate securities. | Foreign Securities Loans & Direct Debt Instruments Restricted Securities | Less than .005% |
| Fidelity High Income Central Fund | Fidelity Management & Research Company LLC (FMR) | Seeks a high level of income and may also seek capital appreciation by investing primarily in debt securities, preferred stocks, and convertible securities, with an emphasis on lower-quality debt securities. | Delayed Delivery & When Issued Securities Loans & Direct Debt Instruments Restricted Securities | .01% |
| Fidelity Inflation-Protected Bond Index Central Fund | Fidelity Management & Research Company LLC (FMR) | Seeks to provide investment results that correspond to the performance of the inflation-protected United States Treasury market, and may invest in derivatives. | Less than .005% | |
| Fidelity Investment Grade Bond Central Fund | Fidelity Management & Research Company LLC (FMR) | Seeks a high level of income by normally investing in investment–grade debt securities. | Delayed Delivery & When Issued Securities Futures Restricted Securities Swaps | Less than .005% |
| Fidelity Real Estate Equity Central Fund | Fidelity Management & Research Company LLC (FMR) | Seeks above-average income and long-term capital growth by investing primarily in equity securities of issuers in the real estate industry. | Restricted Securities | Less than .005% |
| Fidelity International Credit Central Fund | Fidelity Management & Research Company LLC (FMR) | Seeks a high level of current income by normally investing in debt securities of foreign issuers, including debt securities of issuers located in emerging markets. Foreign currency exposure is hedged utilizing foreign currency contracts. | Foreign Securities Forward Foreign Currency Contracts Futures Options Restricted Securities Swaps | Less than .005% |
| Fidelity U.S. Equity Central Fund | Fidelity Management & Research Company LLC (FMR) | Seeks capital appreciation by investing primarily in common stocks, allocated across different market sectors. | Foreign Securities Futures Restricted Securities | Less than .005% |
| Fidelity Emerging Markets Debt Local Currency Central Fund | Fidelity Management & Research Company LLC (FMR) | Seeks high total return by normally investing in debt securities of issuers in emerging markets and other debt investments that are tied economically to emerging markets and denominated in the local currency of the issuer. | Foreign Securities Restricted Securities | .03% |
| Fidelity Money Market Central Funds | Fidelity Management & Research Company LLC (FMR) | Each fund seeks to obtain a high level of current income consistent with the preservation of capital and liquidity. | Short-term Investments | Less than .005% |
(a) Expenses expressed as a percentage of average net assets and are as of each underlying Central Fund's most recent annual or semi-annual shareholder report.
An unaudited holdings listing for the investing fund, which presents direct holdings as well as the pro-rata share of any securities and other investments held indirectly through its investment in underlying non-money market Fidelity Central Funds, is available at fidelity.com and/or institutional.fidelity.com, as applicable. A complete unaudited list of holdings for each Fidelity Central Fund is available upon request or at the Securities and Exchange Commission website at www.sec.gov. In addition, the financial statements of the Fidelity Central Funds which contain the significant accounting policies (including investment valuation policies) of those funds, and are not covered by the Report of Independent Registered Public Accounting Firm, are available on the Securities and Exchange Commission website or upon request.
3. Significant Accounting Policies.
Each Fund is an investment company and applies the accounting and reporting guidance of the Financial Accounting Standards Board (FASB) Accounting Standards Codification Topic 946 Financial Services - Investment Companies. The financial statements have been prepared in conformity with accounting principles generally accepted in the United States of America (GAAP), which require management to make certain estimates and assumptions at the date of the financial statements. Actual results could differ from those estimates. Subsequent events, if any, through the date that the financial statements were issued have been evaluated in the preparation of the financial statements. Each Fund's Schedule of Investments lists any underlying mutual funds or exchange-traded funds (ETFs) but does not include the underlying holdings of these funds. The following summarizes the significant accounting policies of each Fund:
Investment Valuation. Investments are valued as of 4:00 p.m. Eastern time on the last calendar day of the period. The Board of Trustees (the Board) has delegated the day to day responsibility for the valuation of each Fund's investments to the Fair Value Committee (the Committee) established by each Fund's investment adviser. In accordance with valuation policies and procedures approved by the Board, each Fund attempts to obtain prices from one or more third party pricing vendors or brokers to value its investments. When current market prices, quotations or currency exchange rates are not readily available or reliable, investments will be fair valued in good faith by the Committee, in accordance with procedures adopted by the Board. Factors used in determining fair value vary by investment type and may include market or investment specific events, changes in interest rates and credit quality. The frequency with which these procedures are used cannot be predicted and they may be utilized to a significant extent. The Committee oversees each Fund's valuation policies and procedures and reports to the Board on the Committee's activities and fair value determinations. The Board monitors the appropriateness of the procedures used in valuing each Fund's investments and ratifies the fair value determinations of the Committee. Each Fund categorizes the inputs to valuation techniques used to value its investments into a disclosure hierarchy consisting of three levels as shown below:
- Level 1 – unadjusted quoted prices in active markets for identical investments
- Level 2 – other significant observable inputs (including quoted prices for similar investments, interest rates, prepayment speeds, etc.)
- Level 3 – unobservable inputs (including the Fund's own assumptions based on the best information available)
Valuation techniques used to value each Fund's investments by major category are as follows. Debt securities, including restricted securities, are valued based on evaluated prices received from third party pricing vendors or from brokers who make markets in such securities. U.S. government and government agency obligations are valued by pricing vendors who utilize matrix pricing which considers yield or price of bonds of comparable quality, coupon, maturity and type or by broker-supplied prices. When independent prices are unavailable or unreliable, debt securities may be valued utilizing pricing methodologies which consider similar factors that would be used by third party pricing vendors. Debt securities are generally categorized as Level 2 in the hierarchy but may be Level 3 depending on the circumstances.
Exchange-Traded Funds (ETFs) are valued at their last sale price or official closing price as reported by a third party pricing vendor on the primary market or exchange on which they are traded and are categorized as Level 1 in the hierarchy. In the event there were no sales during the day but the exchange reports a closing bid level, ETFs are valued at the closing bid and would be categorized as Level 1 in the hierarchy. In the event there was no closing bid, ETFs may be valued by another method that the Board believes reflects fair value in accordance with the Board's fair value pricing policies and may be categorized as Level 2 in the hierarchy.
Futures contracts are valued at the settlement price established each day by the board of trade or exchange on which they are traded and are categorized as Level 1 in the hierarchy. Investments in open-end mutual funds, including the Fidelity Central Funds, are valued at their closing net asset value (NAV) each business day and are categorized as Level 1 in the hierarchy.
Changes in valuation techniques may result in transfers in or out of an assigned level within the disclosure hierarchy. The aggregate value of investments by input level, as of March 31, 2022, is included at the end of each Fund's Schedule of Investments.
Foreign Currency. Certain Funds may use foreign currency contracts to facilitate transactions in foreign-denominated securities. Gains and losses from these transactions may arise from changes in the value of the foreign currency or if the counterparties do not perform under the contracts' terms.
Foreign-denominated assets, including investment securities, and liabilities are translated into U.S. dollars at the exchange rates at period end. Purchases and sales of investment securities, income and dividends received, and expenses denominated in foreign currencies are translated into U.S. dollars at the exchange rate in effect on the transaction date.
The effects of exchange rate fluctuations on investments are included with the net realized and unrealized gain (loss) on investment securities. Other foreign currency transactions resulting in realized and unrealized gain (loss) are disclosed separately.
Investment Transactions and Income. For financial reporting purposes, the Funds' investment holdings and NAV include trades executed through the end of the last business day of the period. The NAV per share for processing shareholder transactions is calculated as of the close of business of the New York Stock Exchange (NYSE), normally 4:00 p.m. Eastern time and includes trades executed through the end of the prior business day. Gains and losses on securities sold are determined on the basis of identified cost and for certain Funds include proceeds received from litigation. Commissions paid to certain brokers with whom the investment adviser, or its affiliates, places trades on behalf of a fund include an amount in addition to trade execution, which may be rebated back to a fund. Any such rebates are included in net realized gain (loss) on investments in the Statement of Operations. Dividend income is recorded on the ex-dividend date, except for certain dividends from foreign securities where the ex-dividend date may have passed, which are recorded as soon as the Funds are informed of the ex-dividend date. Non-cash dividends included in dividend income, if any, are recorded at the fair market value of the securities received. Income and capital gain distributions from Fidelity Central Funds, if any, are recorded on the ex-dividend date. Certain distributions received by the Funds represent a return of capital or capital gain. The Funds determine the components of these distributions subsequent to the ex-dividend date, based upon receipt of tax filings or other correspondence relating to the underlying investment. These distributions are recorded as a reduction of cost of investments and/or as a realized gain. Interest income is accrued as earned and includes coupon interest and amortization of premium and accretion of discount on debt securities as applicable. Investment income is recorded net of foreign taxes withheld where recovery of such taxes is uncertain. Debt obligations may be placed on non-accrual status and related interest income may be reduced by ceasing current accruals and writing off interest receivables when the collection of all or a portion of interest has become doubtful based on consistently applied procedures. A debt obligation is removed from non-accrual status when the issuer resumes interest payments or when collectability of interest is reasonably assured.
Class Allocations and Expenses. Investment income, realized and unrealized capital gains and losses, common expenses of a fund, and certain fund-level expense reductions, if any, are allocated daily on a pro-rata basis to each class based on the relative net assets of each class to the total net assets of a fund. Each class differs with respect to transfer agent and distribution and service plan fees incurred, as applicable. Certain expense reductions may also differ by class, if applicable. For the reporting period, the allocated portion of income and expenses to each class as a percent of its average net assets may vary due to the timing of recording these transactions in relation to fluctuating net assets of the classes. Expenses directly attributable to a fund are charged to that fund. Expenses attributable to more than one fund are allocated among the respective funds on the basis of relative net assets or other appropriate methods. Expenses included in the accompanying financial statements reflect the expenses of that fund and do not include any expenses associated with any underlying mutual funds or exchange-traded funds. Although not included in a fund's expenses, a fund indirectly bears its proportionate share of these expenses through the net asset value of each underlying mutual fund or exchange-traded fund. Expense estimates are accrued in the period to which they relate and adjustments are made when actual amounts are known.
Deferred Trustee Compensation. Under a Deferred Compensation Plan (the Plan) for certain Funds, certain independent Trustees have elected to defer receipt of a portion of their annual compensation. Deferred amounts are invested in affiliated mutual funds, are marked-to-market and remain in a fund until distributed in accordance with the Plan. The investment of deferred amounts and the offsetting payable to the Trustees presented below are included in the accompanying Statement of Assets and Liabilities in other receivables and other payables and accrued expenses, as applicable.
| Fidelity Asset Manager 50% | 202,999 |
| Fidelity Asset Manager 70% | 21,627 |
Income Tax Information and Distributions to Shareholders. Each year, each Fund intends to qualify as a regulated investment company under Subchapter M of the Internal Revenue Code, including distributing substantially all of its taxable income and realized gains. As a result, no provision for U.S. Federal income taxes is required. Each Fund files a U.S. federal tax return, in addition to state and local tax returns as required. Each Fund's federal income tax returns are subject to examination by the Internal Revenue Service (IRS) for a period of three fiscal years after they are filed. State and local tax returns may be subject to examination for an additional fiscal year depending on the jurisdiction. Foreign taxes are provided for based on each Fund's understanding of the tax rules and rates that exist in the foreign markets in which it invests.
Distributions are declared and recorded on the ex-dividend date. Income and capital gain distributions are declared separately for each class. Income and capital gain distributions are determined in accordance with income tax regulations, which may differ from GAAP.
Capital accounts within the financial statements are adjusted for permanent book-tax differences. These adjustments have no impact on net assets or the results of operations. Capital accounts are not adjusted for temporary book-tax differences which will reverse in a subsequent period.
Book-tax differences are primarily due to the short-term gain distributions from the underlying mutual funds or exchange-traded funds (ETFs), futures contracts, foreign currency transactions, deferred Trustees compensation, capital loss carryforwards and losses deferred due to wash sales.
As of period end, the cost and unrealized appreciation (depreciation) in securities, and derivatives if applicable, for federal income tax purposes were as follows for each Fund:
| Tax cost | Gross unrealized appreciation | Gross unrealized depreciation | Net unrealized appreciation (depreciation) | |
| Fidelity Asset Manager 20% | $6,133,045,189 | $539,243,138 | $(122,332,979) | $416,910,159 |
| Fidelity Asset Manager 30% | 2,560,749,598 | 264,976,100 | (70,881,572) | 194,094,528 |
| Fidelity Asset Manager 40% | 2,294,680,211 | 362,551,568 | (57,355,456) | 305,196,112 |
| Fidelity Asset Manager 50% | 8,989,581,215 | 2,368,944,287 | (194,737,499) | 2,174,206,788 |
| Fidelity Asset Manager 60% | 3,671,496,075 | 844,430,053 | (96,898,500) | 747,531,553 |
| Fidelity Asset Manager 70% | 5,255,347,199 | 1,934,692,593 | (121,034,394) | 1,813,658,199 |
| Fidelity Asset Manager 85% | 3,055,308,171 | 1,069,673,864 | (97,357,460) | 972,316,404 |
Capital loss carryforwards are only available to offset future capital gains of the Funds to the extent provided by regulations and may be limited. The capital loss carryforward information presented below, including any applicable limitation, is estimated as of prior fiscal period end and is subject to adjustment.
| No expiration | ||
| Short-term | Total capital loss carryforward | |
| Fidelity Asset Manager 20% | $(21,726,301) | $(21,726,301) |
| Fidelity Asset Manager 30% | (6,678,935) | (6,678,935) |
4. Derivative Instruments.
Risk Exposures and the Use of Derivative Instruments. The Funds' investment objective allows the Funds to enter into various types of derivative contracts, including futures contracts. Derivatives are investments whose value is primarily derived from underlying assets, indices or reference rates and may be transacted on an exchange or over-the-counter (OTC). Derivatives may involve a future commitment to buy or sell a specified asset based on specified terms, to exchange future cash flows at periodic intervals based on a notional principal amount, or for one party to make one or more payments upon the occurrence of specified events in exchange for periodic payments from the other party.
The Funds used derivatives to increase returns and to manage exposure to certain risks as defined below. The success of any strategy involving derivatives depends on analysis of numerous economic factors, and if the strategies for investment do not work as intended, the Funds may not achieve their objectives.
The Funds' use of derivatives increased or decreased their exposure to the following risk:
| Equity Risk | Equity risk relates to the fluctuations in the value of financial instruments as a result of changes in market prices (other than those arising from interest rate risk or foreign exchange risk), whether caused by factors specific to an individual investment, its issuer, or all factors affecting all instruments traded in a market or market segment. |
The Funds are also exposed to additional risks from investing in derivatives, such as liquidity risk and counterparty credit risk. Liquidity risk is the risk that the Funds will be unable to close out the derivative in the open market in a timely manner. Counterparty credit risk is the risk that the counterparty will not be able to fulfill its obligation to the Funds. Counterparty credit risk related to exchange-traded futures contracts may be mitigated by the protection provided by the exchange on which they trade.
Investing in derivatives may involve greater risks than investing in the underlying assets directly and, to varying degrees, may involve risk of loss in excess of any initial investment and collateral received and amounts recognized in the Statement of Assets and Liabilities. In addition, there may be the risk that the change in value of the derivative contract does not correspond to the change in value of the underlying instrument.
Futures Contracts. A futures contract is an agreement between two parties to buy or sell a specified underlying instrument for a fixed price at a specified future date. The Funds used futures contracts to manage their exposure to the stock market.
Upon entering into a futures contract, a fund is required to deposit either cash or securities (initial margin) with a clearing broker in an amount equal to a certain percentage of the face value of the contract. Futures contracts are marked-to-market daily and subsequent daily payments (variation margin) are made or received by a fund depending on the daily fluctuations in the value of the futures contracts and are recorded as unrealized appreciation or (depreciation). This receivable and/or payable, if any, is included in daily variation margin on futures contracts in the Statement of Assets and Liabilities. Realized gain or (loss) is recorded upon the expiration or closing of a futures contract. The net realized gain (loss) and change in net unrealized appreciation (depreciation) on futures contracts during the period is presented in the Statement of Operations.
Any open futures contracts at period end are presented in the Schedule of Investments under the caption "Futures Contracts". The notional amount at value reflects each contract's exposure to the underlying instrument or index at period end. Securities deposited to meet initial margin requirements are identified in the Schedule of Investments.
5. Purchases and Sales of Investments.
Purchases and sales of securities, other than short-term securities, U.S. government securities and in-kind transactions, as applicable, are noted in the table below.
| Purchases ($) | Sales ($) | |
| Fidelity Asset Manager 20% | 946,213,560 | 549,024,558 |
| Fidelity Asset Manager 30% | 311,057,836 | 253,359,802 |
| Fidelity Asset Manager 40% | 370,721,924 | 165,770,122 |
| Fidelity Asset Manager 50% | 1,313,470,942 | 872,899,559 |
| Fidelity Asset Manager 60% | 809,499,538 | 389,363,673 |
| Fidelity Asset Manager 70% | 1,074,057,387 | 565,635,959 |
| Fidelity Asset Manager 85% | 797,294,912 | 361,307,494 |
6. Fees and Other Transactions with Affiliates.
Management Fee. Fidelity Management & Research Company LLC (the investment adviser) and its affiliates provide the Funds with investment management related services for which the Funds pay a monthly management fee. The management fee is the sum of an individual fund fee rate and an annualized group fee rate. The individual fund fee rate is applied to each Fund's average net assets. The group fee rate is based upon the monthly average net assets of a group of registered investment companies with which the investment adviser has management contracts. The group fee rate decreases as assets under management increase and increases as assets under management decrease. For the reporting period, each Fund's annualized management fee rate expressed as a percentage of each Fund's average net assets was as follows:
| Individual Rate | Group Rate | Total | |
| Fidelity Asset Manager 20% | .30% | .10% | .40% |
| Fidelity Asset Manager 30% | .30% | .10% | .40% |
| Fidelity Asset Manager 40% | .30% | .10% | .40% |
| Fidelity Asset Manager 50% | .25% | .22% | .47% |
| Fidelity Asset Manager 60% | .30% | .22% | .52% |
| Fidelity Asset Manager 70% | .30% | .22% | .52% |
| Fidelity Asset Manager 85% | .30% | .22% | .52% |
The investment adviser pays a portion of the management fees received from the Fund to the Fidelity Central Funds' investment advisers, who are also affiliates, for managing the assets of the Fidelity Central Funds.
Distribution and Service Plan Fees. In accordance with Rule 12b-1 of the 1940 Act, each Fund has adopted separate Distribution and Service Plans for each class of shares. Certain classes pay Fidelity Distributors Company LLC (FDC), an affiliate of the investment adviser, separate Distribution and Service Fees, each of which is based on an annual percentage of each class' average net assets. In addition, FDC may pay financial intermediaries for selling shares of each Fund and providing shareholder support services. For the period, the Distribution and Service Fee rates, total fees and amounts retained by FDC were as follows:
| Distribution Fee | Service Fee | Total Fees | Retained by FDC | |
| Fidelity Asset Manager 20% | ||||
| Class A | -% | .25% | $79,355 | $4,683 |
| Class M | .25% | .25% | 79,168 | 509 |
| Class C | .75% | .25% | 132,908 | 37,566 |
| $291,431 | $42,758 | |||
| Fidelity Asset Manager 30% | ||||
| Class A | -% | .25% | $101,945 | $8,769 |
| Class M | .25% | .25% | 67,584 | 137 |
| Class C | .75% | .25% | 164,312 | 53,997 |
| $333,841 | $62,903 | |||
| Fidelity Asset Manager 40% | ||||
| Class A | -% | .25% | $97,545 | $1,943 |
| Class M | .25% | .25% | 37,074 | 129 |
| Class C | .75% | .25% | 135,649 | 32,832 |
| $270,268 | $34,904 | |||
| Fidelity Asset Manager 50% | ||||
| Class A | -% | .25% | $170,644 | $5,829 |
| Class M | .25% | .25% | 148,714 | 347 |
| Class C | .75% | .25% | 249,606 | 74,512 |
| $568,964 | $80,688 | |||
| Fidelity Asset Manager 60% | ||||
| Class A | -% | .25% | $212,775 | $4,370 |
| Class M | .25% | .25% | 135,824 | 314 |
| Class C | .75% | .25% | 273,461 | 57,877 |
| $622,060 | $62,561 | |||
| Fidelity Asset Manager 70% | ||||
| Class A | -% | .25% | $277,759 | $2,990 |
| Class M | .25% | .25% | 204,974 | 1,527 |
| Class C | .75% | .25% | 207,971 | 38,395 |
| $690,704 | $42,912 | |||
| Fidelity Asset Manager 85% | ||||
| Class A | -% | .25% | $247,919 | $3,379 |
| Class M | .25% | .25% | 139,520 | 523 |
| Class C | .75% | .25% | 247,856 | 46,939 |
| $635,295 | $50,841 |
Sales Load. FDC may receive a front-end sales charge of up to 5.75% for selling Class A shares and 3.50% for selling Class M shares, some of which is paid to financial intermediaries for selling shares of each Fund. Depending on the holding period, FDC may receive contingent deferred sales charges levied on Class A, Class M and Class C redemptions. The deferred sales charges are 1.00% for Class C shares, 1.00% for certain purchases of Class A shares and .25% for certain purchases of Class M shares.
For the period, sales charge amounts retained by FDC were as follows:
| Retained by FDC | |
| Fidelity Asset Manager 20% | |
| Class A | $12,776 |
| Class M | 1,115 |
| Class C(a) | 850 |
| $14,741 | |
| Fidelity Asset Manager 30% | |
| Class A | $18,042 |
| Class M | 2,000 |
| Class C(a) | 34 |
| $20,076 | |
| Fidelity Asset Manager 40% | |
| Class A | $19,030 |
| Class M | 2,681 |
| Class C(a) | 658 |
| $22,369 | |
| Fidelity Asset Manager 50% | |
| Class A | $22,912 |
| Class M | 7,179 |
| Class C(a) | 280 |
| $30,371 | |
| Fidelity Asset Manager 60% | |
| Class A | $26,341 |
| Class M | 5,333 |
| Class C(a) | 1,571 |
| $33,245 | |
| Fidelity Asset Manager 70% | |
| Class A | $48,877 |
| Class M | 5,769 |
| Class C(a) | 1,378 |
| $56,024 | |
| Fidelity Asset Manager 85% | |
| Class A | $90,175 |
| Class M | 4,450 |
| Class C(a) | 549 |
| $95,174 |
(a) When Class C shares are initially sold, FDC pays commissions from its own resources to financial intermediaries through which the sales are made.
Transfer Agent Fees. Fidelity Investments Institutional Operations Company LLC (FIIOC), an affiliate of the investment adviser, is the transfer, dividend disbursing and shareholder servicing agent for each class of the Funds. FIIOC receives account fees and asset-based fees that vary according to the account size and type of account of the shareholders of the respective classes of each Fund, except for Class Z. FIIOC receives an asset-based fee of Class Z's average net assets. FIIOC pays for typesetting, printing and mailing of shareholder reports, except proxy statements. For the period, transfer agent fees for each class were as follows:
| Amount | % of Class-Level Average Net Assets(a) | |
| Fidelity Asset Manager 20% | ||
| Class A | $44,521 | .14 |
| Class M | 22,554 | .14 |
| Class C | 18,830 | .14 |
| Asset Manager 20% | 1,842,887 | .08 |
| Class I | 19,349 | .13 |
| Class Z | 447,311 | .05 |
| $2,395,452 | ||
| Fidelity Asset Manager 30% | ||
| Class A | $54,024 | .13 |
| Class M | 18,461 | .14 |
| Class C | 23,943 | .15 |
| Asset Manager 30% | 845,712 | .08 |
| Class I | 39,282 | .10 |
| Class Z | 123,309 | .05 |
| $1,104,731 | ||
| Fidelity Asset Manager 40% | ||
| Class A | $52,518 | .13 |
| Class M | 9,163 | .12 |
| Class C | 19,975 | .15 |
| Asset Manager 40% | 740,105 | .08 |
| Class I | 27,035 | .13 |
| Class Z | 146,239 | .05 |
| $995,035 | ||
| Fidelity Asset Manager 50% | ||
| Class A | $108,875 | .16 |
| Class M | 45,387 | .15 |
| Class C | 41,530 | .17 |
| Asset Manager 50% | 5,012,525 | .11 |
| Class I | 58,541 | .14 |
| Class Z | 408,710 | .04 |
| $5,675,568 | ||
| Fidelity Asset Manager 60% | ||
| Class A | $145,665 | .17 |
| Class M | 44,604 | .16 |
| Class C | 50,486 | .18 |
| Asset Manager 60% | 1,303,109 | .11 |
| Class I | 99,133 | .17 |
| Class Z | 306,155 | .04 |
| $1,949,152 | ||
| Fidelity Asset Manager 70% | ||
| Class A | $173,236 | .16 |
| Class M | 62,806 | .15 |
| Class C | 33,903 | .16 |
| Asset Manager 70% | 2,482,323 | .11 |
| Class I | 38,344 | .14 |
| Class Z | 419,770 | .04 |
| $3,210,382 | ||
| Fidelity Asset Manager 85% | ||
| Class A | $159,311 | .16 |
| Class M | 44,140 | .16 |
| Class C | 42,744 | .17 |
| Asset Manager 85% | 1,335,023 | .12 |
| Class I | 47,097 | .15 |
| Class Z | 272,742 | .04 |
| $1,901,057 |
(a) Annualized
Accounting Fees. Fidelity Service Company, Inc. (FSC), an affiliate of the investment adviser, maintains each Fund's accounting records. The accounting fee is based on the level of average net assets for each month. For the period, the fees were equivalent to the following annualized rates:
| % of Average Net Assets | |
| Fidelity Asset Manager 20% | .02 |
| Fidelity Asset Manager 30% | .03 |
| Fidelity Asset Manager 40% | .03 |
| Fidelity Asset Manager 50% | .01 |
| Fidelity Asset Manager 60% | .03 |
| Fidelity Asset Manager 70% | .02 |
| Fidelity Asset Manager 85% | .03 |
Interfund Trades. Funds may purchase from or sell securities to other Fidelity Funds under procedures adopted by the Board. The procedures have been designed to ensure these interfund trades are executed in accordance with Rule 17a-7 of the 1940 Act. Any interfund trades are included within the respective purchases and sales amounts shown in the Purchases and Sales of Investments note. During the period there were no interfund trades.
7. Committed Line of Credit.
Certain Funds participate with other funds managed by the investment adviser or an affiliate in a $4.25 billion credit facility (the "line of credit") to be utilized for temporary or emergency purposes to fund shareholder redemptions or for other short-term liquidity purposes. The participating funds have agreed to pay commitment fees on their pro-rata portion of the line of credit, which are reflected in Miscellaneous expenses on the Statement of Operations, and are listed below. During the period, there were no borrowings on this line of credit.
| Amount | |
| Fidelity Asset Manager 20% | $7,999 |
| Fidelity Asset Manager 30% | 3,517 |
| Fidelity Asset Manager 40% | 3,173 |
| Fidelity Asset Manager 50% | 14,217 |
| Fidelity Asset Manager 60% | 5,329 |
| Fidelity Asset Manager 70% | 8,599 |
| Fidelity Asset Manager 85% | 4,790 |
8. Security Lending.
Funds lend portfolio securities from time to time in order to earn additional income. Lending agents are used, including National Financial Services (NFS), an affiliate of the investment adviser. Pursuant to a securities lending agreement, NFS will receive a fee, which is capped at 9.9% of a fund's daily lending revenue, for its services as lending agent. A fund may lend securities to certain qualified borrowers, including NFS. On the settlement date of the loan, a fund receives collateral (in the form of U.S. Treasury obligations, letters of credit and/or cash) against the loaned securities and maintains collateral in an amount not less than 100% of the market value of the loaned securities during the period of the loan. The market value of the loaned securities is determined at the close of business of a fund and any additional required collateral is delivered to a fund on the next business day. A fund or borrower may terminate the loan at any time, and if the borrower defaults on its obligation to return the securities loaned because of insolvency or other reasons, a fund may apply collateral received from the borrower against the obligation. A fund may experience delays and costs in recovering the securities loaned. Any cash collateral received is invested in the Fidelity Securities Lending Cash Central Fund. Any loaned securities are identified as such in the Schedule of Investments, and the value of loaned securities and cash collateral at period end, as applicable, are presented in the Statement of Assets and Liabilities. Security lending income represents the income earned on investing cash collateral, less rebates paid to borrowers and any lending agent fees associated with the loan, plus any premium payments received for lending certain types of securities. Security lending income is presented in the Statement of Operations as a component of income from Fidelity Central Funds. Affiliated security lending activity, if any, was as follows:
| Total Security Lending Fees Paid to NFS | Security Lending Income From Securities Loaned to NFS | Value of Securities Loaned to NFS at Period End | |
| Fidelity Asset Manager 20% | $355 | $– | $– |
| Fidelity Asset Manager 30% | $374 | $– | $– |
| Fidelity Asset Manager 40% | $490 | $– | $– |
| Fidelity Asset Manager 50% | $13,249 | $504 | $– |
| Fidelity Asset Manager 60% | $8,708 | $– | $– |
| Fidelity Asset Manager 70% | $15,278 | $– | $– |
| Fidelity Asset Manager 85% | $13,817 | $– | $– |
9. Expense Reductions.
Through arrangements with each applicable Fund's custodian, credits realized as a result of certain uninvested cash balances were used to reduce each applicable Fund's or class' expenses. All of the applicable expense reductions are noted in the table below.
| Custodian credits | |
| Fidelity Asset Manager 30% | 13 |
In addition, during the period the investment adviser or an affiliate reimbursed and/or waived a portion of fund-level operating expenses as follows:
| Fund-Level Amount | |
| Fidelity Asset Manager 20% | $53,847 |
| Fidelity Asset Manager 30% | 24,174 |
| Fidelity Asset Manager 40% | 21,613 |
| Fidelity Asset Manager 50% | 179,808 |
| Fidelity Asset Manager 60% | 67,035 |
| Fidelity Asset Manager 70% | 108,446 |
| Fidelity Asset Manager 85% | 60,476 |
10. Distributions to Shareholders.
Distributions to shareholders of each class were as follows:
| Six months ended March 31, 2022 | Year ended September 30, 2021 |
|
| Fidelity Asset Manager 20% | ||
| Distributions to shareholders | ||
| Class A | $630,572 | $837,710 |
| Class M | 283,510 | 382,796 |
| Class C | 198,698 | 269,006 |
| Asset Manager 20% | 54,570,308 | 107,336,888 |
| Class I | 343,354 | 563,077 |
| Class Z | 21,297,620 | 1,008,373 |
| Total | $77,324,062 | $110,397,850 |
| Fidelity Asset Manager 30% | ||
| Distributions to shareholders | ||
| Class A | $1,011,065 | $976,110 |
| Class M | 305,860 | 317,690 |
| Class C | 340,107 | 341,803 |
| Asset Manager 30% | 30,912,052 | 42,858,581 |
| Class I | 1,038,707 | 972,524 |
| Class Z | 7,054,317 | 449,764 |
| Total | $40,662,108 | $45,916,472 |
| Fidelity Asset Manager 40% | ||
| Distributions to shareholders | ||
| Class A | $1,316,316 | $1,065,869 |
| Class M | 237,037 | 227,841 |
| Class C | 367,077 | 314,970 |
| Asset Manager 40% | 35,606,654 | 47,443,443 |
| Class I | 811,404 | 713,626 |
| Class Z | 11,280,176 | 335,262 |
| Total | $49,618,664 | $50,101,011 |
| Fidelity Asset Manager 50% | ||
| Distributions to shareholders | ||
| Class A | $3,267,856 | $2,268,334 |
| Class M | 1,345,600 | 853,349 |
| Class C | 1,034,511 | 664,806 |
| Asset Manager 50% | 232,686,581 | 232,851,579 |
| Class I | 2,061,277 | 1,452,214 |
| Class Z | 53,332,360 | 772,024 |
| Total | $293,728,185 | $238,862,306 |
| Fidelity Asset Manager 60% | ||
| Distributions to shareholders | ||
| Class A | $3,902,281 | $2,286,809 |
| Class M | 1,101,083 | 719,093 |
| Class C | 858,414 | 569,166 |
| Asset Manager 60% | 63,251,257 | 62,927,677 |
| Class I | 2,945,047 | 1,019,088 |
| Class Z | 42,100,720 | 519,556 |
| Total | $114,158,802 | $68,041,389 |
| Fidelity Asset Manager 70% | ||
| Distributions to shareholders | ||
| Class A | $5,556,535 | $3,734,070 |
| Class M | 1,832,295 | 1,294,808 |
| Class C | 693,159 | 533,593 |
| Asset Manager 70% | 125,547,326 | 126,288,593 |
| Class I | 1,586,971 | 904,646 |
| Class Z | 61,865,255 | 753,947 |
| Total | $197,081,541 | $133,509,657 |
| Fidelity Asset Manager 85% | ||
| Distributions to shareholders | ||
| Class A | $5,950,158 | $2,783,068 |
| Class M | 1,556,477 | 719,809 |
| Class C | 1,116,460 | 554,369 |
| Asset Manager 85% | 70,669,724 | 56,843,347 |
| Class I | 1,988,931 | 710,567 |
| Class Z | 46,775,351 | 688,499 |
| Total | $128,057,101 | $62,299,659 |
11. Share Transactions.
Share transactions for each class were as follows and may contain in-kind transactions, automatic conversions between classes or exchanges between affiliated funds:
| Shares | Shares | Dollars | Dollars | |
| Six months ended March 31, 2022 | Year ended September 30, 2021 | Six months ended March 31, 2022 | Year ended September 30, 2021 | |
| Fidelity Asset Manager 20% | ||||
| Class A | ||||
| Shares sold | 728,141 | 1,409,862 | $10,563,597 | $20,525,022 |
| Reinvestment of distributions | 41,188 | 55,957 | 607,834 | 808,902 |
| Shares redeemed | (493,523) | (810,830) | (7,198,895) | (11,795,848) |
| Net increase (decrease) | 275,806 | 654,989 | $3,972,536 | $9,538,076 |
| Class M | ||||
| Shares sold | 159,921 | 558,634 | $2,342,262 | $8,091,782 |
| Reinvestment of distributions | 19,240 | 26,555 | 283,510 | 382,658 |
| Shares redeemed | (167,391) | (384,144) | (2,436,960) | (5,548,452) |
| Net increase (decrease) | 11,770 | 201,045 | $188,812 | $2,925,988 |
| Class C | ||||
| Shares sold | 599,450 | 637,012 | $8,555,926 | $9,198,338 |
| Reinvestment of distributions | 13,397 | 18,553 | 196,198 | 266,184 |
| Shares redeemed | (292,628) | (682,217) | (4,197,881) | (9,867,826) |
| Net increase (decrease) | 320,219 | (26,652) | $4,554,243 | $(403,304) |
| Asset Manager 20% | ||||
| Shares sold | 23,423,330 | 107,249,052 | $342,839,951 | $1,560,247,397 |
| Reinvestment of distributions | 3,539,228 | 7,210,903 | 52,262,125 | 104,440,467 |
| Shares redeemed | (31,641,813) | (177,973,422) | (460,316,717) | (2,614,200,710) |
| Net increase (decrease) | (4,679,255) | (63,513,467) | $(65,214,641) | $(949,512,846) |
| Class I | ||||
| Shares sold | 670,887 | 671,098 | $9,618,202 | $9,748,929 |
| Reinvestment of distributions | 21,222 | 35,454 | 313,460 | 513,297 |
| Shares redeemed | (484,556) | (895,288) | (7,053,364) | (12,913,072) |
| Net increase (decrease) | 207,553 | (188,736) | $2,878,298 | $(2,650,846) |
| Class Z | ||||
| Shares sold | 51,384,241 | 101,945,954 | $761,765,851 | $1,509,849,889 |
| Reinvestment of distributions | 1,442,269 | 67,015 | 21,285,234 | 992,235 |
| Shares redeemed | (19,711,199) | (2,628,530) | (285,330,660) | (38,894,858) |
| Net increase (decrease) | 33,115,311 | 99,384,439 | $497,720,425 | $1,471,947,266 |
| Fidelity Asset Manager 30% | ||||
| Class A | ||||
| Shares sold | 1,043,370 | 2,800,538 | $13,234,107 | $35,048,255 |
| Reinvestment of distributions | 77,287 | 77,276 | 991,956 | 957,581 |
| Shares redeemed | (510,913) | (1,102,737) | (6,429,672) | (13,804,416) |
| Net increase (decrease) | 609,744 | 1,775,077 | $7,796,391 | $22,201,420 |
| Class M | ||||
| Shares sold | 325,054 | 694,150 | $4,087,026 | $8,620,882 |
| Reinvestment of distributions | 23,851 | 25,714 | 305,622 | 317,531 |
| Shares redeemed | (230,146) | (389,654) | (2,872,399) | (4,837,403) |
| Net increase (decrease) | 118,759 | 330,210 | $1,520,249 | $4,101,010 |
| Class C | ||||
| Shares sold | 469,344 | 998,087 | $5,935,202 | $12,422,127 |
| Reinvestment of distributions | 26,750 | 27,832 | 340,086 | 341,618 |
| Shares redeemed | (515,424) | (847,536) | (6,395,649) | (10,576,289) |
| Net increase (decrease) | (19,330) | 178,383 | $(120,361) | $2,187,456 |
| Asset Manager 30% | ||||
| Shares sold | 18,681,044 | 76,766,661 | $237,205,659 | $960,259,120 |
| Reinvestment of distributions | 2,292,835 | 3,370,680 | 29,378,531 | 41,798,020 |
| Shares redeemed | (25,836,053) | (72,264,103) | (324,755,042) | (914,889,932) |
| Net increase (decrease) | (4,862,174) | 7,873,238 | $(58,170,852) | $87,167,208 |
| Class I | ||||
| Shares sold | 674,480 | 5,085,054 | $8,619,053 | $62,585,505 |
| Reinvestment of distributions | 77,805 | 73,881 | 996,980 | 919,186 |
| Shares redeemed | (909,917) | (829,597) | (11,555,548) | (10,427,641) |
| Net increase (decrease) | (157,632) | 4,329,338 | $(1,939,515) | $53,077,050 |
| Class Z | ||||
| Shares sold | 7,911,042 | 36,977,243 | $100,726,595 | $473,855,717 |
| Reinvestment of distributions | 548,077 | 33,117 | 7,020,861 | 420,638 |
| Shares redeemed | (5,102,889) | (694,355) | (64,432,414) | (8,771,049) |
| Net increase (decrease) | 3,356,230 | 36,316,005 | $43,315,042 | $465,505,306 |
| Fidelity Asset Manager 40% | ||||
| Class A | ||||
| Shares sold | 1,012,061 | 2,172,803 | $13,909,352 | $29,467,562 |
| Reinvestment of distributions | 94,301 | 80,557 | 1,314,710 | 1,064,210 |
| Shares redeemed | (380,264) | (813,427) | (5,211,976) | (10,951,692) |
| Net increase (decrease) | 726,098 | 1,439,933 | $10,012,086 | $19,580,080 |
| Class M | ||||
| Shares sold | 87,114 | 316,004 | $1,182,401 | $4,210,428 |
| Reinvestment of distributions | 16,720 | 17,123 | 232,818 | 225,512 |
| Shares redeemed | (70,472) | (216,477) | (965,435) | (2,893,801) |
| Net increase (decrease) | 33,362 | 116,650 | $449,784 | $1,542,139 |
| Class C | ||||
| Shares sold | 308,391 | 620,597 | $4,201,247 | $8,365,005 |
| Reinvestment of distributions | 26,399 | 24,054 | 366,681 | 314,795 |
| Shares redeemed | (333,287) | (625,285) | (4,479,036) | (8,420,275) |
| Net increase (decrease) | 1,503 | 19,366 | $88,892 | $259,525 |
| Asset Manager 40% | ||||
| Shares sold | 20,186,507 | 49,346,392 | $277,682,288 | $662,187,189 |
| Reinvestment of distributions | 2,424,426 | 3,505,470 | 33,778,649 | 46,249,344 |
| Shares redeemed | (16,024,022) | (73,870,028) | (217,819,251) | (1,010,979,291) |
| Net increase (decrease) | 6,586,911 | (21,018,166) | $93,641,686 | $(302,542,758) |
| Class I | ||||
| Shares sold | 358,097 | 1,340,421 | $4,933,426 | $18,032,782 |
| Reinvestment of distributions | 46,357 | 39,815 | 645,881 | 526,774 |
| Shares redeemed | (449,314) | (624,933) | (6,083,993) | (8,420,268) |
| Net increase (decrease) | (44,860) | 755,303 | $(504,686) | $10,139,288 |
| Class Z | ||||
| Shares sold | 6,214,247 | 39,890,662 | $86,690,054 | $554,502,858 |
| Reinvestment of distributions | 807,476 | 21,755 | 11,250,417 | 287,316 |
| Shares redeemed | (2,776,263) | (760,032) | (37,817,401) | (10,386,653) |
| Net increase (decrease) | 4,245,460 | 39,152,385 | $60,123,070 | $544,403,521 |
| Fidelity Asset Manager 50% | ||||
| Class A | ||||
| Shares sold | 676,817 | 1,735,044 | $14,725,293 | $37,114,915 |
| Reinvestment of distributions | 143,146 | 105,783 | 3,168,534 | 2,187,174 |
| Shares redeemed | (469,992) | (1,243,847) | (10,238,708) | (26,303,885) |
| Net increase (decrease) | 349,971 | 596,980 | $7,655,119 | $12,998,204 |
| Class M | ||||
| Shares sold | 294,949 | 620,472 | $6,427,868 | $13,320,812 |
| Reinvestment of distributions | 60,772 | 41,325 | 1,344,200 | 852,402 |
| Shares redeemed | (195,795) | (377,078) | (4,199,801) | (7,944,146) |
| Net increase (decrease) | 159,926 | 284,719 | $3,572,267 | $6,229,068 |
| Class C | ||||
| Shares sold | 273,835 | 867,292 | $5,958,256 | $18,434,084 |
| Reinvestment of distributions | 46,549 | 32,241 | 1,021,893 | 658,029 |
| Shares redeemed | (606,927) | (893,765) | (12,894,239) | (18,925,427) |
| Net increase (decrease) | (286,543) | 5,768 | $(5,914,090) | $166,686 |
| Asset Manager 50% | ||||
| Shares sold | 18,796,201 | 69,869,536 | $411,663,350 | $1,491,366,178 |
| Reinvestment of distributions | 9,985,991 | 10,850,793 | 221,928,993 | 225,413,018 |
| Shares redeemed | (31,811,805) | (144,280,839) | (691,105,656) | (3,152,432,199) |
| Net increase (decrease) | (3,029,613) | (63,560,510) | $(57,513,313) | $(1,435,653,003) |
| Class I | ||||
| Shares sold | 364,006 | 1,508,275 | $7,956,969 | $32,108,492 |
| Reinvestment of distributions | 85,349 | 65,522 | 1,892,581 | 1,360,839 |
| Shares redeemed | (367,342) | (723,599) | (7,940,497) | (15,491,377) |
| Net increase (decrease) | 82,013 | 850,198 | $1,909,053 | $17,977,954 |
| Class Z | ||||
| Shares sold | 12,855,685 | 88,585,647 | $285,791,948 | $1,959,813,298 |
| Reinvestment of distributions | 2,405,639 | 36,311 | 53,301,109 | 753,741 |
| Shares redeemed | (6,904,192) | (1,254,422) | (146,577,760) | (27,549,489) |
| Net increase (decrease) | 8,357,132 | 87,367,536 | $192,515,297 | $1,933,017,550 |
| Fidelity Asset Manager 60% | ||||
| Class A | ||||
| Shares sold | 1,056,476 | 2,576,353 | $16,619,823 | $39,561,007 |
| Reinvestment of distributions | 238,708 | 153,084 | 3,845,582 | 2,257,993 |
| Shares redeemed | (778,178) | (1,764,656) | (12,243,974) | (26,775,672) |
| Net increase (decrease) | 517,006 | 964,781 | $8,221,431 | $15,043,328 |
| Class M | ||||
| Shares sold | 212,025 | 350,985 | $3,324,381 | $5,257,743 |
| Reinvestment of distributions | 68,230 | 48,692 | 1,094,411 | 714,799 |
| Shares redeemed | (188,248) | (605,123) | (2,957,116) | (9,098,889) |
| Net increase (decrease) | 92,007 | (205,446) | $1,461,676 | $(3,126,347) |
| Class C | ||||
| Shares sold | 602,288 | 752,644 | $9,477,067 | $11,405,646 |
| Reinvestment of distributions | 53,957 | 39,111 | 856,301 | 568,286 |
| Shares redeemed | (1,092,364) | (1,898,971) | (16,635,026) | (28,628,413) |
| Net increase (decrease) | (436,119) | (1,107,216) | $(6,301,658) | $(16,654,481) |
| Asset Manager 60% | ||||
| Shares sold | 15,626,959 | 49,043,133 | $248,791,738 | $746,664,588 |
| Reinvestment of distributions | 3,711,829 | 4,173,302 | 60,094,504 | 61,806,601 |
| Shares redeemed | (13,555,097) | (117,469,809) | (212,956,125) | (1,862,009,145) |
| Net increase (decrease) | 5,783,691 | (64,253,374) | $95,930,117 | $(1,053,537,956) |
| Class I | ||||
| Shares sold | 679,236 | 4,674,380 | $10,848,713 | $70,927,602 |
| Reinvestment of distributions | 178,293 | 66,358 | 2,888,342 | 984,091 |
| Shares redeemed | (686,703) | (1,265,248) | (10,841,057) | (19,250,969) |
| Net increase (decrease) | 170,826 | 3,475,490 | $2,895,998 | $52,660,724 |
| Class Z | ||||
| Shares sold | 19,014,778 | 87,984,873 | $305,465,290 | $1,412,659,027 |
| Reinvestment of distributions | 2,601,636 | 34,565 | 42,068,451 | 511,914 |
| Shares redeemed | (6,799,073) | (1,265,816) | (103,265,108) | (20,198,966) |
| Net increase (decrease) | 14,817,341 | 86,753,622 | $244,268,633 | $1,392,971,975 |
| Fidelity Asset Manager 70% | ||||
| Class A | ||||
| Shares sold | 652,954 | 1,249,396 | $18,323,594 | $34,124,683 |
| Reinvestment of distributions | 185,884 | 138,527 | 5,366,481 | 3,600,309 |
| Shares redeemed | (596,308) | (1,218,159) | (16,763,160) | (33,079,028) |
| Net increase (decrease) | 242,530 | 169,764 | $6,926,915 | $4,645,964 |
| Class M | ||||
| Shares sold | 261,898 | 455,346 | $7,343,817 | $12,421,408 |
| Reinvestment of distributions | 62,819 | 49,325 | 1,814,208 | 1,282,461 |
| Shares redeemed | (215,735) | (578,608) | (6,055,272) | (15,606,649) |
| Net increase (decrease) | 108,982 | (73,937) | $3,102,753 | $(1,902,780) |
| Class C | ||||
| Shares sold | 118,270 | 401,246 | $3,322,164 | $10,806,897 |
| Reinvestment of distributions | 24,031 | 20,534 | 692,811 | 532,444 |
| Shares redeemed | (309,375) | (563,210) | (8,702,701) | (15,314,143) |
| Net increase (decrease) | (167,074) | (141,430) | $(4,687,726) | $(3,974,802) |
| Asset Manager 70% | ||||
| Shares sold | 8,225,866 | 29,062,137 | $232,962,633 | $782,822,143 |
| Reinvestment of distributions | 4,176,392 | 4,763,655 | 120,739,485 | 123,902,670 |
| Shares redeemed | (10,121,644) | (93,927,866) | (285,022,571) | (2,638,189,734) |
| Net increase (decrease) | 2,280,614 | (60,102,074) | $68,679,547 | $(1,731,464,921) |
| Class I | ||||
| Shares sold | 356,602 | 685,284 | $10,255,534 | $18,718,545 |
| Reinvestment of distributions | 52,797 | 33,387 | 1,527,414 | 869,411 |
| Shares redeemed | (357,021) | (422,350) | (9,994,669) | (11,476,894) |
| Net increase (decrease) | 52,378 | 296,321 | $1,788,279 | $8,111,062 |
| Class Z | ||||
| Shares sold | 10,170,195 | 68,823,019 | $295,658,477 | $1,964,573,275 |
| Reinvestment of distributions | 2,141,090 | 27,803 | 61,791,848 | 722,611 |
| Shares redeemed | (2,775,484) | (636,437) | (77,727,337) | (17,808,196) |
| Net increase (decrease) | 9,535,801 | 68,214,385 | $279,722,988 | $1,947,487,690 |
| Fidelity Asset Manager 85% | ||||
| Class A | ||||
| Shares sold | 962,011 | 1,836,311 | $24,753,512 | $44,972,144 |
| Reinvestment of distributions | 223,610 | 119,112 | 5,909,999 | 2,768,163 |
| Shares redeemed | (590,668) | (1,426,937) | (15,161,607) | (34,185,112) |
| Net increase (decrease) | 594,953 | 528,486 | $15,501,904 | $13,555,195 |
| Class M | ||||
| Shares sold | 203,225 | 493,185 | $5,208,147 | $12,127,724 |
| Reinvestment of distributions | 59,085 | 31,053 | 1,550,980 | 717,004 |
| Shares redeemed | (209,887) | (353,312) | (5,351,175) | (8,698,800) |
| Net increase (decrease) | 52,423 | 170,926 | $1,407,952 | $4,145,928 |
| Class C | ||||
| Shares sold | 186,628 | 443,474 | $4,686,783 | $10,727,159 |
| Reinvestment of distributions | 42,825 | 24,209 | 1,113,453 | 553,652 |
| Shares redeemed | (299,092) | (682,340) | (7,465,624) | (16,514,402) |
| Net increase (decrease) | (69,639) | (214,657) | $(1,665,388) | $(5,233,591) |
| Asset Manager 85% | ||||
| Shares sold | 6,597,201 | 25,599,439 | $172,147,153 | $624,540,614 |
| Reinvestment of distributions | 2,550,056 | 2,385,538 | 68,112,000 | 55,988,578 |
| Shares redeemed | (6,071,569) | (64,484,368) | (157,467,357) | (1,657,361,685) |
| Net increase (decrease) | 3,075,688 | (36,499,391) | $82,791,796 | $(976,832,493) |
| Class I | ||||
| Shares sold | 296,075 | 1,314,277 | $7,514,555 | $31,751,799 |
| Reinvestment of distributions | 73,939 | 29,937 | 1,969,001 | 700,817 |
| Shares redeemed | (255,156) | (512,938) | (6,475,576) | (12,471,546) |
| Net increase (decrease) | 114,858 | 831,276 | $3,007,980 | $19,981,070 |
| Class Z | ||||
| Shares sold | 10,254,701 | 48,003,708 | $271,355,161 | $1,254,209,883 |
| Reinvestment of distributions | 1,760,616 | 28,510 | 46,761,952 | 665,713 |
| Shares redeemed | (3,520,758) | (779,911) | (89,959,802) | (20,170,438) |
| Net increase (decrease) | 8,494,559 | 47,252,307 | $228,157,311 | $1,234,705,158 |
12. Other.
A fund's organizational documents provide former and current trustees and officers with a limited indemnification against liabilities arising in connection with the performance of their duties to the fund. In the normal course of business, a fund may also enter into contracts that provide general indemnifications. A fund's maximum exposure under these arrangements is unknown as this would be dependent on future claims that may be made against a fund. The risk of material loss from such claims is considered remote.
At the end of the period, a shareholder of record owned more than 25% of the total outstanding shares as follows:
| Fund | % of shares held |
| Fidelity Asset Manager 20% | 29% |
| Fidelity Asset Manager 60% | 35% |
| Fidelity Asset Manager 70% | 30% |
| Fidelity Asset Manager 85% | 35% |
13. Coronavirus (COVID-19) Pandemic.
An outbreak of COVID-19 first detected in China during December 2019 has since spread globally and was declared a pandemic by the World Health Organization during March 2020. Developments that disrupt global economies and financial markets, such as the COVID-19 pandemic, may magnify factors that affect the Funds' performance.
Shareholder Expense Example
As a shareholder, you incur two types of costs: (1) transaction costs, which may include sales charges (loads) on purchase payments or redemption proceeds, as applicable and (2) ongoing costs, which generally include management fees, distribution and/or service (12b-1) fees and other Fund expenses. This Example is intended to help you understand your ongoing costs (in dollars) of investing in a fund and to compare these costs with the ongoing costs of investing in other mutual funds.
The Example is based on an investment of $1,000 invested at the beginning of the period and held for the entire period (October 1, 2021 to March 31, 2022).
Actual Expenses
The first line of the accompanying table provides information about actual account values and actual expenses. You may use the information in this line, together with the amount you invested, to estimate the expenses that you paid over the period. Simply divide your account value by $1,000.00 (for example, an $8,600 account value divided by $1,000.00 = 8.6), then multiply the result by the number in the first line for a class/Fund under the heading entitled "Expenses Paid During Period" to estimate the expenses you paid on your account during this period. If any fund is a shareholder of any underlying mutual funds or exchange-traded funds (ETFs) (the Underlying Funds), such fund indirectly bears its proportional share of the expenses of the Underlying Funds in addition to the direct expenses incurred presented in the table. These fees and expenses are not included in the annualized expense ratio used to calculate the expense estimate in the table below.
Hypothetical Example for Comparison Purposes
The second line of the accompanying table provides information about hypothetical account values and hypothetical expenses based on the actual expense ratio and an assumed rate of return of 5% per year before expenses, which is not the actual return. The hypothetical account values and expenses may not be used to estimate the actual ending account balance or expenses you paid for the period. You may use this information to compare the ongoing costs of investing in the Fund and other funds. To do so, compare this 5% hypothetical example with the 5% hypothetical examples that appear in the shareholder reports of the other funds. If any fund is a shareholder of any Underlying Funds, such fund indirectly bears its proportional share of the expenses of the Underlying Funds in addition to the direct expenses as presented in the table. These fees and expenses are not included in the annualized expense ratio used to calculate the expense estimate in the table below.
Please note that the expenses shown in the table are meant to highlight your ongoing costs only and do not reflect any transaction costs. Therefore, the second line of the table is useful in comparing ongoing costs only, and will not help you determine the relative total costs of owning different funds. In addition, if these transactional costs were included, your costs would have been higher.
| Annualized Expense Ratio-A | Beginning Account Value October 1, 2021 | Ending Account Value March 31, 2022 | Expenses Paid During Period-B October 1, 2021 to March 31, 2022 |
|
| Fidelity Asset Manager 20% | ||||
| Class A | .81% | |||
| Actual | $1,000.00 | $973.00 | $3.98 | |
| Hypothetical-C | $1,000.00 | $1,020.89 | $4.08 | |
| Class M | 1.06% | |||
| Actual | $1,000.00 | $972.50 | $5.21 | |
| Hypothetical-C | $1,000.00 | $1,019.65 | $5.34 | |
| Class C | 1.56% | |||
| Actual | $1,000.00 | $969.70 | $7.66 | |
| Hypothetical-C | $1,000.00 | $1,017.15 | $7.85 | |
| Asset Manager 20% | .50% | |||
| Actual | $1,000.00 | $975.20 | $2.46 | |
| Hypothetical-C | $1,000.00 | $1,022.44 | $2.52 | |
| Class I | .55% | |||
| Actual | $1,000.00 | $974.90 | $2.71 | |
| Hypothetical-C | $1,000.00 | $1,022.19 | $2.77 | |
| Class Z | .47% | |||
| Actual | $1,000.00 | $974.70 | $2.31 | |
| Hypothetical-C | $1,000.00 | $1,022.59 | $2.37 | |
| Fidelity Asset Manager 30% | ||||
| Class A | .82% | |||
| Actual | $1,000.00 | $973.50 | $4.03 | |
| Hypothetical-C | $1,000.00 | $1,020.84 | $4.13 | |
| Class M | 1.07% | |||
| Actual | $1,000.00 | $971.60 | $5.26 | |
| Hypothetical-C | $1,000.00 | $1,019.60 | $5.39 | |
| Class C | 1.58% | |||
| Actual | $1,000.00 | $969.30 | $7.76 | |
| Hypothetical-C | $1,000.00 | $1,017.05 | $7.95 | |
| Asset Manager 30% | .51% | |||
| Actual | $1,000.00 | $974.20 | $2.51 | |
| Hypothetical-C | $1,000.00 | $1,022.39 | $2.57 | |
| Class I | .54% | |||
| Actual | $1,000.00 | $974.00 | $2.66 | |
| Hypothetical-C | $1,000.00 | $1,022.24 | $2.72 | |
| Class Z | .49% | |||
| Actual | $1,000.00 | $974.40 | $2.41 | |
| Hypothetical-C | $1,000.00 | $1,022.49 | $2.47 | |
| Fidelity Asset Manager 40% | ||||
| Class A | .82% | |||
| Actual | $1,000.00 | $974.70 | $4.04 | |
| Hypothetical-C | $1,000.00 | $1,020.84 | $4.13 | |
| Class M | 1.06% | |||
| Actual | $1,000.00 | $973.40 | $5.22 | |
| Hypothetical-C | $1,000.00 | $1,019.65 | $5.34 | |
| Class C | 1.59% | |||
| Actual | $1,000.00 | $970.70 | $7.81 | |
| Hypothetical-C | $1,000.00 | $1,017.00 | $8.00 | |
| Asset Manager 40% | .52% | |||
| Actual | $1,000.00 | $976.20 | $2.56 | |
| Hypothetical-C | $1,000.00 | $1,022.34 | $2.62 | |
| Class I | .56% | |||
| Actual | $1,000.00 | $975.30 | $2.76 | |
| Hypothetical-C | $1,000.00 | $1,022.14 | $2.82 | |
| Class Z | .49% | |||
| Actual | $1,000.00 | $975.80 | $2.41 | |
| Hypothetical-C | $1,000.00 | $1,022.49 | $2.47 | |
| Fidelity Asset Manager 50% | ||||
| Class A | .90% | |||
| Actual | $1,000.00 | $976.20 | $4.43 | |
| Hypothetical-C | $1,000.00 | $1,020.44 | $4.53 | |
| Class M | 1.14% | |||
| Actual | $1,000.00 | $975.00 | $5.61 | |
| Hypothetical-C | $1,000.00 | $1,019.25 | $5.74 | |
| Class C | 1.66% | |||
| Actual | $1,000.00 | $972.10 | $8.16 | |
| Hypothetical-C | $1,000.00 | $1,016.65 | $8.35 | |
| Asset Manager 50% | .60% | |||
| Actual | $1,000.00 | $977.30 | $2.96 | |
| Hypothetical-C | $1,000.00 | $1,021.94 | $3.02 | |
| Class I | .63% | |||
| Actual | $1,000.00 | $977.60 | $3.11 | |
| Hypothetical-C | $1,000.00 | $1,021.79 | $3.18 | |
| Class Z | .53% | |||
| Actual | $1,000.00 | $978.20 | $2.61 | |
| Hypothetical-C | $1,000.00 | $1,022.29 | $2.67 | |
| Fidelity Asset Manager 60% | ||||
| Class A | .98% | |||
| Actual | $1,000.00 | $978.30 | $4.83 | |
| Hypothetical-C | $1,000.00 | $1,020.04 | $4.94 | |
| Class M | 1.22% | |||
| Actual | $1,000.00 | $976.80 | $6.01 | |
| Hypothetical-C | $1,000.00 | $1,018.85 | $6.14 | |
| Class C | 1.74% | |||
| Actual | $1,000.00 | $974.30 | $8.56 | |
| Hypothetical-C | $1,000.00 | $1,016.26 | $8.75 | |
| Asset Manager 60% | .66% | |||
| Actual | $1,000.00 | $979.70 | $3.26 | |
| Hypothetical-C | $1,000.00 | $1,021.64 | $3.33 | |
| Class I | .73% | |||
| Actual | $1,000.00 | $979.50 | $3.60 | |
| Hypothetical-C | $1,000.00 | $1,021.29 | $3.68 | |
| Class Z | .60% | |||
| Actual | $1,000.00 | $980.20 | $2.96 | |
| Hypothetical-C | $1,000.00 | $1,021.94 | $3.02 | |
| Fidelity Asset Manager 70% | ||||
| Class A | .95% | |||
| Actual | $1,000.00 | $983.10 | $4.70 | |
| Hypothetical-C | $1,000.00 | $1,020.19 | $4.78 | |
| Class M | 1.20% | |||
| Actual | $1,000.00 | $981.80 | $5.93 | |
| Hypothetical-C | $1,000.00 | $1,018.95 | $6.04 | |
| Class C | 1.71% | |||
| Actual | $1,000.00 | $979.40 | $8.44 | |
| Hypothetical-C | $1,000.00 | $1,016.40 | $8.60 | |
| Asset Manager 70% | .66% | |||
| Actual | $1,000.00 | $984.70 | $3.27 | |
| Hypothetical-C | $1,000.00 | $1,021.64 | $3.33 | |
| Class I | .68% | |||
| Actual | $1,000.00 | $984.10 | $3.36 | |
| Hypothetical-C | $1,000.00 | $1,021.54 | $3.43 | |
| Class Z | .59% | |||
| Actual | $1,000.00 | $984.80 | $2.92 | |
| Hypothetical-C | $1,000.00 | $1,021.99 | $2.97 | |
| Fidelity Asset Manager 85% | ||||
| Class A | .96% | |||
| Actual | $1,000.00 | $987.60 | $4.76 | |
| Hypothetical-C | $1,000.00 | $1,020.14 | $4.84 | |
| Class M | 1.21% | |||
| Actual | $1,000.00 | $986.30 | $5.99 | |
| Hypothetical-C | $1,000.00 | $1,018.90 | $6.09 | |
| Class C | 1.73% | |||
| Actual | $1,000.00 | $983.50 | $8.56 | |
| Hypothetical-C | $1,000.00 | $1,016.31 | $8.70 | |
| Asset Manager 85% | .67% | |||
| Actual | $1,000.00 | $989.20 | $3.32 | |
| Hypothetical-C | $1,000.00 | $1,021.59 | $3.38 | |
| Class I | .70% | |||
| Actual | $1,000.00 | $988.80 | $3.47 | |
| Hypothetical-C | $1,000.00 | $1,021.44 | $3.53 | |
| Class Z | .59% | |||
| Actual | $1,000.00 | $989.30 | $2.93 | |
| Hypothetical-C | $1,000.00 | $1,021.99 | $2.97 |
A Annualized expense ratio reflects expenses net of applicable fee waivers.
B Expenses are equal to the annualized expense ratio, multiplied by the average account value over the period, multiplied by 182/ 365 (to reflect the one-half year period). The fees and expenses of any Underlying Funds are not included in each annualized expense ratio.
C 5% return per year before expenses
Liquidity Risk Management Program
The Securities and Exchange Commission adopted Rule 22e-4 under the Investment Company Act of 1940 (the Liquidity Rule) to promote effective liquidity risk management throughout the open-end investment company industry, thereby reducing the risk that funds will be unable to meet their redemption obligations and mitigating dilution of the interests of fund shareholders.
The Funds have adopted and implemented a liquidity risk management program pursuant to the Liquidity Rule (the Program) effective December 1, 2018. The Program is reasonably designed to assess and manage each Fund’s liquidity risk and to comply with the requirements of the Liquidity Rule. Each Fund’s Board of Trustees (the Board) has designated each Fund’s investment adviser as administrator of the Program. The Fidelity advisers have established a Liquidity Risk Management Committee (the LRM Committee) to manage the Program for each of the Fidelity Funds. The LRM Committee monitors the adequacy and effectiveness of implementation of the Program and on a periodic basis assesses each Fund’s liquidity risk based on a variety of factors including (1) the Fund’s investment strategy, (2) portfolio liquidity and cash flow projections during normal and reasonably foreseeable stressed conditions, (3) shareholder redemptions, (4) borrowings and other funding sources and (5) in the case of exchange-traded funds, certain additional factors including the effect of the Fund’s prices and spreads, market participants, and basket compositions on the overall liquidity of the Fund’s portfolio, as applicable.
In accordance with the Program, each of the Fund’s portfolio investments is classified into one of four liquidity categories described below based on a determination of a reasonable expectation for how long it would take to convert the investment to cash (or sell or dispose of the investment) without significantly changing its market value.
- Highly liquid investments – cash or convertible to cash within three business days or less
- Moderately liquid investments – convertible to cash in three to seven calendar days
- Less liquid investments – can be sold or disposed of, but not settled, within seven calendar days
- Illiquid investments – cannot be sold or disposed of within seven calendar days
Liquidity classification determinations take into account a variety of factors including various market, trading and investment-specific considerations, as well as market depth, and generally utilize analysis from a third-party liquidity metrics service.
The Liquidity Rule places a 15% limit on a fund’s illiquid investments and requires funds that do not primarily hold assets that are highly liquid investments to determine and maintain a minimum percentage of the fund’s net assets to be invested in highly liquid investments (highly liquid investment minimum or HLIM). The Program includes provisions reasonably designed to comply with the 15% limit on illiquid investments and for determining, periodically reviewing and complying with the HLIM requirement as applicable.
At a recent meeting of the Fund’s Board of Trustees, the LRM Committee provided a written report to the Board pertaining to the operation, adequacy, and effectiveness of implementation of the Program for the annual period from December 1, 2020 through November 30, 2021. The report concluded that the Program has been implemented and is operating effectively and is reasonably designed to assess and manage the Fund’s liquidity risk.
![]()
AR-SANN-0522
1.878280.114
Fidelity® Health Savings Fund
Semi-Annual Report
March 31, 2022
Contents
To view a fund's proxy voting guidelines and proxy voting record for the 12-month period ended June 30, visit http://www.fidelity.com/proxyvotingresults or visit the Securities and Exchange Commission's (SEC) web site at http://www.sec.gov.
You may also call 1-800-544-8544 if you’re an individual investing directly with Fidelity, call 1-800-835-5092 if you’re a plan sponsor or participant with Fidelity as your recordkeeper or call 1-877-208-0098 on institutional accounts or if you’re an advisor or invest through one to request a free copy of the proxy voting guidelines.
Standard & Poor's, S&P and S&P 500 are registered service marks of The McGraw-Hill Companies, Inc. and have been licensed for use by Fidelity Distributors Corporation.
Other third-party marks appearing herein are the property of their respective owners.
All other marks appearing herein are registered or unregistered trademarks or service marks of FMR LLC or an affiliated company. © 2022 FMR LLC. All rights reserved.
This report and the financial statements contained herein are submitted for the general information of the shareholders of the Fund. This report is not authorized for distribution to prospective investors in the Fund unless preceded or accompanied by an effective prospectus.
A fund files its complete schedule of portfolio holdings with the SEC for the first and third quarters of each fiscal year on Form N-PORT. Forms N-PORT are available on the SEC’s web site at http://www.sec.gov. A fund's Forms N-PORT may be reviewed and copied at the SEC’s Public Reference Room in Washington, DC. Information regarding the operation of the SEC's Public Reference Room may be obtained by calling 1-800-SEC-0330.
For a complete list of a fund's portfolio holdings, view the most recent holdings listing, semiannual report, or annual report on Fidelity's web site at http://www.fidelity.com, http://www.institutional.fidelity.com, or http://www.401k.com, as applicable.
NOT FDIC INSURED •MAY LOSE VALUE •NO BANK GUARANTEE
Neither the Fund nor Fidelity Distributors Corporation is a bank.
Note to Shareholders:
Early in 2020, the outbreak and spread of COVID-19 emerged as a public health emergency that had a major influence on financial markets, primarily based on its impact on the global economy and corporate earnings. On March 11, 2020, the World Health Organization declared the COVID-19 outbreak a pandemic, citing sustained risk of further global spread. The pandemic prompted a number of measures to limit the spread of COVID-19, including travel and border restrictions, quarantines, and restrictions on large gatherings. In turn, these resulted in lower consumer activity, diminished demand for a wide range of products and services, disruption in manufacturing and supply chains, and – given the wide variability in outcomes regarding the outbreak – significant market uncertainty and volatility. To help stem the turmoil, the U.S. government took unprecedented action – in concert with the U.S. Federal Reserve and central banks around the world – to help support consumers, businesses, and the broader economy, and to limit disruption to the financial system.
In general, the overall impact of the pandemic lessened in 2021, amid a resilient economy and widespread distribution of three COVID-19 vaccines granted emergency use authorization from the U.S. Food and Drug Administration (FDA) early in the year. Still, the situation remains dynamic, and the extent and duration of its influence on financial markets and the economy is highly uncertain, due in part to a recent spike in cases based on highly contagious variants of the coronavirus.
Extreme events such as the COVID-19 crisis are exogenous shocks that can have significant adverse effects on mutual funds and their investments. Although multiple asset classes may be affected by market disruption, the duration and impact may not be the same for all types of assets. Fidelity is committed to helping you stay informed amid news about COVID-19 and during increased market volatility, and we continue to take extra steps to be responsive to customer needs. We encourage you to visit us online, where we offer ongoing updates, commentary, and analysis on the markets and our funds.
Investment Summary (Unaudited)
The information in the following tables is based on the combined investments of the Fund and its pro-rata share of the investments of Fidelity's Central Funds, other than the Commodity Strategy and Money Market Central Funds.Top Ten Holdings as of March 31, 2022
| % of fund's net assets | |
| Fidelity International Bond Index Fund | 21.7 |
| Fidelity Long-Term Treasury Bond Index Fund | 9.6 |
| Apple, Inc. | 1.3 |
| Microsoft Corp. | 1.3 |
| Alphabet, Inc. Class A | 0.9 |
| Amazon.com, Inc. | 0.7 |
| Taiwan Semiconductor Manufacturing Co. Ltd. | 0.3 |
| Prologis (REIT), Inc. | 0.3 |
| Meta Platforms, Inc. Class A | 0.3 |
| UnitedHealth Group, Inc. | 0.3 |
| 36.7 |
Market Sectors as of March 31, 2022
| % of fund's net assets | |
| Information Technology | 7.5 |
| Financials | 6.7 |
| Industrials | 4.5 |
| Consumer Discretionary | 4.1 |
| Energy | 3.7 |
| Communication Services | 3.6 |
| Health Care | 3.3 |
| Real Estate | 2.6 |
| Consumer Staples | 2.3 |
| Materials | 1.6 |
| Utilities | 1.0 |
Quality Diversification (% of fund's net assets)
| As of March 31, 2022 | ||
| U.S. Government and U.S. Government Agency Obligations | 20.3% | |
| AAA,AA,A | 4.0% | |
| BBB | 3.8% | |
| BB and Below | 9.2% | |
| Not Rated | 1.5% | |
| Equities* | 59.9% | |
| Short-Term Investments and Net Other Assets | 1.3% | |
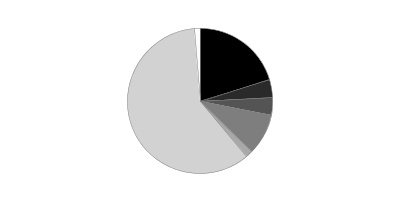
* Includes investment in Fidelity® Commodity Strategy Central Fund of 1.1%
We have used ratings from Moody's Investors Service, Inc. Where Moody's® ratings are not available, we have used S&P® ratings. All ratings are as of the date indicated and do not reflect subsequent changes.
Asset Allocation (% of fund's net assets)
| As of March 31, 2022 | ||
| Stocks and Equity Futures* | 28.6% | |
| Bonds | 66.1% | |
| Convertible Securities | 0.1% | |
| Other Investments | 4.0% | |
| Short-Term Investments and Net Other Assets (Liabilities) | 1.2% | |
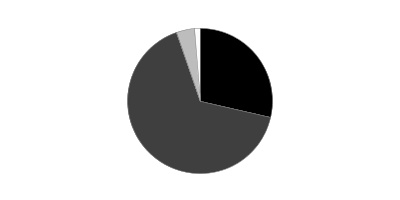
* Includes investment in Fidelity® Commodity Strategy Central Fund of 1.1%
Geographic Diversification (% of fund's net assets)
| As of March 31, 2022 | ||
| United States of America | 82.1% | |
| Cayman Islands | 2.1% | |
| United Kingdom | 1.2% | |
| Mexico | 1.2% | |
| Canada | 0.6% | |
| Netherlands | 0.9% | |
| France | 0.6% | |
| India | 0.5% | |
| Japan | 0.5% | |
| Other | 10.3% | |

Percentages are based on country or territory of incorporation and are adjusted for the effect of futures contracts, if applicable.
An unaudited holdings listing for the Fund, which presents direct holdings as well as the pro-rata share of any securities and other investments held indirectly through its investment in underlying Fidelity Central Funds, other than the Commodity Strategy Central and Money Market Funds, is available at fidelity.com and/or institutional.fidelity.com, as applicable.
At period end, foreign investments including the Fund's pro-rata share of the underlying Central Funds, other than the Commodity Strategy Central and Money Market Funds, was 17.9% of net assets.
Schedule of Investments March 31, 2022 (Unaudited)
Showing Percentage of Net Assets
| Equity Central Funds - 28.8% | |||
| Shares | Value | ||
| Fidelity Commodity Strategy Central Fund (a)(b) | 74,316 | $458,532 | |
| Fidelity Emerging Markets Equity Central Fund (b) | 6,665 | 1,437,280 | |
| Fidelity International Equity Central Fund (b) | 15,442 | 1,472,902 | |
| Fidelity Real Estate Equity Central Fund (b) | 4,398 | 669,706 | |
| Fidelity U.S. Equity Central Fund (a)(b) | 66,354 | 8,217,948 | |
| TOTAL EQUITY CENTRAL FUNDS | |||
| (Cost $11,998,183) | 12,256,368 | ||
| Fixed-Income Central Funds - 39.7% | |||
| High Yield Fixed-Income Funds - 14.5% | |||
| Fidelity Emerging Markets Debt Central Fund (b) | 485,120 | 4,021,645 | |
| Fidelity Emerging Markets Debt Local Currency Central Fund (b) | 767 | 67,753 | |
| Fidelity Floating Rate Central Fund (b) | 15,939 | 1,589,893 | |
| Fidelity High Income Central Fund (b) | 4,452 | 492,616 | |
| TOTAL HIGH YIELD FIXED-INCOME FUNDS | 6,171,907 | ||
| Investment Grade Fixed-Income Funds - 25.2% | |||
| Fidelity Inflation-Protected Bond Index Central Fund (b) | 52,954 | 5,519,372 | |
| Fidelity Investment Grade Bond Central Fund (b) | 48,951 | 5,242,160 | |
| TOTAL INVESTMENT GRADE FIXED-INCOME FUNDS | 10,761,532 | ||
| TOTAL FIXED-INCOME CENTRAL FUNDS | |||
| (Cost $17,880,332) | 16,933,439 | ||
| Money Market Central Funds - 0.2% | |||
| Fidelity Cash Central Fund 0.31% (c) | |||
| (Cost $79,668) | 79,652 | 79,668 | |
| Fixed-Income Funds - 31.3% | |||
| Fidelity International Bond Index Fund (d) | 971,530 | 9,248,970 | |
| Fidelity Long-Term Treasury Bond Index Fund (d) | 311,697 | 4,108,166 | |
| TOTAL FIXED-INCOME FUNDS | |||
| (Cost $14,383,783) | 13,357,136 | ||
| TOTAL INVESTMENT IN SECURITIES - 100.0% | |||
| (Cost $44,341,966) | 42,626,611 | ||
| NET OTHER ASSETS (LIABILITIES) - 0.0% | 1,731 | ||
| NET ASSETS - 100% | $42,628,342 |
Legend
(a) Non-income producing
(b) Affiliated fund that is generally available only to investment companies and other accounts managed by Fidelity Investments. A complete unaudited schedule of portfolio holdings for each Fidelity Central Fund is filed with the SEC for the first and third quarters of each fiscal year on Form N-PORT and is available upon request or at the SEC's website at www.sec.gov. An unaudited holdings listing for the Fund, which presents direct holdings as well as the pro-rata share of securities and other investments held indirectly through its investment in underlying non-money market Fidelity Central Funds, other than the Commodity Strategy Central Fund, is available at fidelity.com and/or institutional.fidelity.com, as applicable. In addition, each Fidelity Central Fund's financial statements are available on the SEC's website or upon request.
(c) Affiliated fund that is generally available only to investment companies and other accounts managed by Fidelity Investments. The rate quoted is the annualized seven-day yield of the fund at period end. A complete unaudited listing of the fund's holdings as of its most recent quarter end is available upon request. In addition, each Fidelity Central Fund's financial statements are available on the SEC's website or upon request.
(d) Affiliated Fund
Affiliated Central Funds
Fiscal year to date information regarding the Fund's investments in Fidelity Central Funds, including the ownership percentage, is presented below.
| Fund | Value, beginning of period | Purchases | Sales Proceeds | Dividend Income | Realized Gain/Loss | Change in Unrealized appreciation (depreciation) | Value, end of period | % ownership, end of period |
| Fidelity Cash Central Fund 0.31% | $412,124 | $240,489 | $572,945 | $36 | $-- | $-- | $79,668 | 0.0% |
| Fidelity Commodity Strategy Central Fund | 570,091 | 198,704 | 444,537 | -- | 38,955 | 95,319 | 458,532 | 0.1% |
| Fidelity Emerging Markets Debt Central Fund | 3,112,477 | 1,308,106 | 44,922 | 82,274 | (1,688) | (352,328) | 4,021,645 | 0.2% |
| Fidelity Emerging Markets Debt Local Currency Central Fund | 72,677 | 3,984 | -- | 3,983 | -- | (8,908) | 67,753 | 0.1% |
| Fidelity Emerging Markets Equity Central Fund | 432,005 | 1,303,270 | 100,172 | 32,821 | 92,290 | (290,113) | 1,437,280 | 0.1% |
| Fidelity Floating Rate Central Fund | 859,984 | 752,777 | 6,874 | 26,718 | (43) | (15,951) | 1,589,893 | 0.0% |
| Fidelity High Income Central Fund | 535,809 | 136,192 | 159,990 | 12,894 | 20 | (19,415) | 492,616 | 0.0% |
| Fidelity Inflation-Protected Bond Index Central Fund | 4,822,631 | 1,884,670 | 735,858 | 438,383 | (24,592) | (427,479) | 5,519,372 | 0.8% |
| Fidelity International Equity Central Fund | 1,712,393 | 1,088,829 | 1,091,529 | 134,890 | (85,595) | (151,196) | 1,472,902 | 0.0% |
| Fidelity Investment Grade Bond Central Fund | 3,496,949 | 2,432,419 | 381,208 | 47,583 | (8,701) | (297,299) | 5,242,160 | 0.0% |
| Fidelity Real Estate Equity Central Fund | 491,863 | 351,555 | 205,340 | 7,290 | (10,348) | 41,976 | 669,706 | 0.0% |
| Fidelity U.S. Equity Central Fund | 5,794,947 | 3,454,668 | 517,434 | 589,116 | (42,471) | (471,762) | 8,217,948 | 0.0% |
| Total | $22,313,950 | $13,155,663 | $4,260,809 | $1,375,988 | $(42,173) | $(1,897,156) | $29,269,475 |
Amounts in the income column in the above table include any capital gain distributions from underlying funds, which are presented in the corresponding line-item in the Statement of Operations, if applicable.
Affiliated Underlying Funds
Fiscal year to date information regarding the Fund's investments in affiliated Underlying Funds is presented below. Exchanges between classes of the same affiliated Underlying Funds may occur. If an underlying Fund changes its name, the name presented below is the name in effect at period end.
| Affiliate | Value, beginning of period | Purchases | Sales Proceeds | Dividend Income | Realized Gain (loss) | Change in Unrealized appreciation (depreciation) | Value, end of period |
| Fidelity International Bond Index Fund | $7,467,781 | $2,634,025 | $385,752 | $22,934 | $(7,146) | $(459,938) | $9,248,970 |
| Fidelity Long-Term Treasury Bond Index Fund | 3,516,985 | 1,286,574 | 294,434 | 58,120 | (3,511) | (397,448) | 4,108,166 |
| Total | $10,984,766 | $3,920,599 | $680,186 | $81,054 | $(10,657) | $(857,386) | $13,357,136 |
Amounts in the income column in the above table include any capital gain distributions from underlying funds, which are presented in the corresponding line-item in the Statement of Operations, if applicable.
Investment Valuation
The following is a summary of the inputs used, as of March 31, 2022, involving the Fund's assets and liabilities carried at fair value. The inputs or methodology used for valuing securities may not be an indication of the risk associated with investing in those securities. For more information on valuation inputs, and their aggregation into the levels used below, please refer to the Investment Valuation section in the accompanying Notes to Financial Statements.
| Valuation Inputs at Reporting Date: | ||||
| Description | Total | Level 1 | Level 2 | Level 3 |
| Investments in Securities: | ||||
| Equity Central Funds | $12,256,368 | $12,256,368 | $-- | $-- |
| Fixed-Income Central Funds | 16,933,439 | 16,933,439 | -- | -- |
| Money Market Central Funds | 79,668 | 79,668 | -- | -- |
| Fixed-Income Funds | 13,357,136 | 13,357,136 | -- | -- |
| Total Investments in Securities: | $42,626,611 | $42,626,611 | $-- | $-- |
See accompanying notes which are an integral part of the financial statements.
Financial Statements
Statement of Assets and Liabilities
| March 31, 2022 (Unaudited) | ||
| Assets | ||
| Investment in securities, at value — See accompanying schedule: | ||
| Fidelity Central Funds (cost $29,958,183) | $29,269,475 | |
| Other affiliated issuers (cost $14,383,783) | 13,357,136 | |
| Total Investment in Securities (cost $44,341,966) | $42,626,611 | |
| Cash | 2,120 | |
| Receivable for fund shares sold | 112,309 | |
| Distributions receivable from Fidelity Central Funds | 11 | |
| Total assets | 42,741,051 | |
| Liabilities | ||
| Payable for investments purchased | $89,686 | |
| Payable for fund shares redeemed | 9,179 | |
| Accrued management fee | 13,844 | |
| Total liabilities | 112,709 | |
| Net Assets | $42,628,342 | |
| Net Assets consist of: | ||
| Paid in capital | $43,755,146 | |
| Total accumulated earnings (loss) | (1,126,804) | |
| Net Assets | $42,628,342 | |
| Net Asset Value and Maximum Offering Price | ||
| Fidelity Health Savings Fund: | ||
| Net Asset Value, offering price and redemption price per share ($20,190,928 ÷ 1,902,773 shares) | $10.61 | |
| Class K: | ||
| Net Asset Value, offering price and redemption price per share ($22,437,414 ÷ 2,114,353 shares) | $10.61 |
See accompanying notes which are an integral part of the financial statements.
Statement of Operations
| Six months ended March 31, 2022 (Unaudited) | ||
| Investment Income | ||
| Dividends: | ||
| Affiliated issuers | $65,184 | |
| Income from Fidelity Central Funds | 580,802 | |
| Total income | 645,986 | |
| Expenses | ||
| Management fee | $78,048 | |
| Independent trustees' fees and expenses | 58 | |
| Total expenses before reductions | 78,106 | |
| Expense reductions | (2) | |
| Total expenses after reductions | 78,104 | |
| Net investment income (loss) | 567,882 | |
| Realized and Unrealized Gain (Loss) | ||
| Net realized gain (loss) on: | ||
| Investment securities: | ||
| Unaffiliated issuers | (23,791) | |
| Fidelity Central Funds | (42,173) | |
| Other affiliated issuers | (10,657) | |
| Capital gain distributions from underlying funds: | ||
| Affiliated issuers | 811,056 | |
| Total net realized gain (loss) | 734,435 | |
| Change in net unrealized appreciation (depreciation) on: | ||
| Investment securities: | ||
| Unaffiliated issuers | 25,834 | |
| Fidelity Central Funds | (1,897,156) | |
| Other affiliated issuers | (857,386) | |
| Total change in net unrealized appreciation (depreciation) | (2,728,708) | |
| Net gain (loss) | (1,994,273) | |
| Net increase (decrease) in net assets resulting from operations | $(1,426,391) |
See accompanying notes which are an integral part of the financial statements.
Statement of Changes in Net Assets
| Six months ended March 31, 2022 (Unaudited) | Year ended September 30, 2021 | |
| Increase (Decrease) in Net Assets | ||
| Operations | ||
| Net investment income (loss) | $567,882 | $309,505 |
| Net realized gain (loss) | 734,435 | 139,352 |
| Change in net unrealized appreciation (depreciation) | (2,728,708) | 771,817 |
| Net increase (decrease) in net assets resulting from operations | (1,426,391) | 1,220,674 |
| Distributions to shareholders | (886,365) | (272,227) |
| Share transactions - net increase (decrease) | 11,445,747 | 24,915,306 |
| Total increase (decrease) in net assets | 9,132,991 | 25,863,753 |
| Net Assets | ||
| Beginning of period | 33,495,351 | 7,631,598 |
| End of period | $42,628,342 | $33,495,351 |
See accompanying notes which are an integral part of the financial statements.
Financial Highlights
Fidelity Health Savings Fund
| Six months ended (Unaudited) March 31, | Years endedSeptember 30, | ||
| 2022 | 2021 | 2020 A | |
| Selected Per–Share Data | |||
| Net asset value, beginning of period | $11.21 | $10.48 | $10.00 |
| Income from Investment Operations | |||
| Net investment income (loss)B,C | .16 | .16 | .08 |
| Net realized and unrealized gain (loss) | (.50) | .76 | .46 |
| Total from investment operations | (.34) | .92 | .54 |
| Distributions from net investment income | (.19) | (.11) | (.06) |
| Distributions from net realized gain | (.07) | (.08) | – |
| Total distributions | (.26) | (.19) | (.06) |
| Net asset value, end of period | $10.61 | $11.21 | $10.48 |
| Total ReturnD,E | (3.19)% | 8.81% | 5.41% |
| Ratios to Average Net AssetsC,F,G | |||
| Expenses before reductions | .45%H | .45% | .45%H |
| Expenses net of fee waivers, if any | .45%H | .45% | .45%H |
| Expenses net of all reductions | .45%H | .45% | .45%H |
| Net investment income (loss) | 2.85%H | 1.48% | 1.36%H |
| Supplemental Data | |||
| Net assets, end of period (000 omitted) | $20,191 | $16,668 | $4,324 |
| Portfolio turnover rateI | 22%H | 31% | 43%H |
A For the period March 2, 2020 (commencement of operations) through September 30, 2020.
B Calculated based on average shares outstanding during the period.
C Net investment income (loss) is affected by the timing of the declaration of dividends by any underlying mutual funds or exchange-traded funds (ETFs). Net investment income (loss) of any such underlying funds is not included in the Fund's net investment income (loss) ratio.
D Total returns for periods of less than one year are not annualized.
E Total returns would have been lower if certain expenses had not been reduced during the applicable periods shown.
F Fees and expenses of any underlying mutual funds or exchange-traded funds (ETFs) are not included in the Fund's expense ratio. The Fund indirectly bears its proportionate share of these expenses. For additional expense information related to investments in Fidelity Central Funds, please refer to the "Investments in Fidelity Central Funds" note found in the Notes to Financial Statements section of the most recent Annual or Semi-Annual report.
G Expense ratios reflect operating expenses of the class. Expenses before reductions do not reflect amounts reimbursed, waived, or reduced through arrangements with the investment adviser, brokerage services, or other offset arrangements, if applicable, and do not represent the amount paid by the class during periods when reimbursements, waivers or reductions occur.
H Annualized
I Amount does not include the portfolio activity of any underlying mutual funds or exchange-traded funds (ETFs).
See accompanying notes which are an integral part of the financial statements.
Fidelity Health Savings Fund Class K
| Six months ended (Unaudited) March 31, | Years endedSeptember 30, | ||
| 2022 | 2021 | 2020 A | |
| Selected Per–Share Data | |||
| Net asset value, beginning of period | $11.21 | $10.48 | $10.00 |
| Income from Investment Operations | |||
| Net investment income (loss)B,C | .16 | .18 | .09 |
| Net realized and unrealized gain (loss) | (.50) | .75 | .45 |
| Total from investment operations | (.34) | .93 | .54 |
| Distributions from net investment income | (.20) | (.12) | (.06) |
| Distributions from net realized gain | (.07) | (.08) | – |
| Total distributions | (.26)D | (.20) | (.06) |
| Net asset value, end of period | $10.61 | $11.21 | $10.48 |
| Total ReturnE,F | (3.13)% | 8.92% | 5.45% |
| Ratios to Average Net AssetsC,G,H | |||
| Expenses before reductions | .35%I | .35% | .35%I |
| Expenses net of fee waivers, if any | .35%I | .35% | .35%I |
| Expenses net of all reductions | .35%I | .35% | .35%I |
| Net investment income (loss) | 2.95%I | 1.58% | 1.46%I |
| Supplemental Data | |||
| Net assets, end of period (000 omitted) | $22,437 | $16,827 | $3,308 |
| Portfolio turnover rateJ | 22%I | 31% | 43%I |
A For the period March 2, 2020 (commencement of operations) through September 30, 2020.
B Calculated based on average shares outstanding during the period.
C Net investment income (loss) is affected by the timing of the declaration of dividends by any underlying mutual funds or exchange-traded funds (ETFs). Net investment income (loss) of any such underlying funds is not included in the Fund's net investment income (loss) ratio.
D Total distributions per share do not sum due to rounding.
E Total returns for periods of less than one year are not annualized.
F Total returns would have been lower if certain expenses had not been reduced during the applicable periods shown.
G Fees and expenses of any underlying mutual funds or exchange-traded funds (ETFs) are not included in the Fund's expense ratio. The Fund indirectly bears its proportionate share of these expenses. For additional expense information related to investments in Fidelity Central Funds, please refer to the "Investments in Fidelity Central Funds" note found in the Notes to Financial Statements section of the most recent Annual or Semi-Annual report.
H Expense ratios reflect operating expenses of the class. Expenses before reductions do not reflect amounts reimbursed, waived, or reduced through arrangements with the investment adviser, brokerage services, or other offset arrangements, if applicable, and do not represent the amount paid by the class during periods when reimbursements, waivers or reductions occur.
I Annualized
J Amount does not include the portfolio activity of any underlying mutual funds or exchange-traded funds (ETFs).
See accompanying notes which are an integral part of the financial statements.
Notes to Financial Statements (Unaudited)
For the period ended March 31, 2022
1. Organization.
Fidelity Health Savings Fund (the Fund) is a fund of Fidelity Charles Street Trust (the Trust) and is authorized to issue an unlimited number of shares. The Trust is registered under the Investment Company Act of 1940, as amended (the 1940 Act), as an open-end management investment company organized as a Massachusetts business trust. The Fund offers Health Savings Fund and Class K shares, each of which has equal rights as to assets and voting privileges. Each class has exclusive voting rights with respect to matters that affect that class. Shares are available only to certain Fidelity health savings accounts.
2. Investments in Fidelity Central Funds.
Funds may invest in Fidelity Central Funds, which are open-end investment companies generally available only to other investment companies and accounts managed by the investment adviser and its affiliates. The Schedule of Investments lists any Fidelity Central Funds held as an investment as of period end, but does not include the underlying holdings of each Fidelity Central Fund. An investing fund indirectly bears its proportionate share of the expenses of the underlying Fidelity Central Funds.
Based on its investment objective, each Fidelity Central Fund may invest or participate in various investment vehicles or strategies that are similar to those of the investing fund. These strategies are consistent with the investment objectives of the investing fund and may involve certain economic risks which may cause a decline in value of each of the Fidelity Central Funds and thus a decline in the value of the investing fund.
| Fidelity Central Fund | Investment Manager | Investment Objective | Investment Practices | Expense Ratio(a) |
| Fidelity Commodity Strategy Central Fund | Geode Capital Management, LLC (Geode) | Seeks to provide investment returns that correspond to the performance of the commodities market. | Investment in commodity-related investments through a wholly-owned subsidiary organized under the laws of the Cayman Islands Futures | Less than .005% |
| Fidelity Emerging Markets Debt Central Fund | Fidelity Management & Research Company LLC (FMR) | Seeks high total return by normally investing in debt securities of issuers in emerging markets and other debt investments that are tied economically to emerging markets. | Foreign Securities Restricted Securities | Less than .005% |
| Fidelity Emerging Markets Equity Central Fund | Fidelity Management & Research Company LLC (FMR) | Seeks capital appreciation by investing primarily in equity securities of issuers in emerging markets. | Foreign Securities Futures | .02% |
| Fidelity International Equity Central Fund | Fidelity Management & Research Company LLC (FMR) | Seeks capital appreciation by investing primarily in non-U.S. based common stocks, including securities of issuers located in emerging markets. | Foreign Securities Futures | Less than .005% |
| Fidelity Floating Rate Central Fund | Fidelity Management & Research Company LLC (FMR) | Seeks a high level of income by normally investing in floating rate loans and other floating rate securities. | Foreign Securities Loans & Direct Debt Instruments Restricted Securities | Less than .005% |
| Fidelity High Income Central Fund | Fidelity Management & Research Company LLC (FMR) | Seeks a high level of income and may also seek capital appreciation by investing primarily in debt securities, preferred stocks, and convertible securities, with an emphasis on lower-quality debt securities. | Delayed Delivery & When Issued Securities Loans & Direct Debt Instruments Restricted Securities | .01% |
| Fidelity Inflation-Protected Bond Index Central Fund | Fidelity Management & Research Company LLC (FMR) | Seeks to provide investment results that correspond to the performance of the inflation-protected United States Treasury market, and may invest in derivatives. | Less than .005% | |
| Fidelity Investment Grade Bond Central Fund | Fidelity Management & Research Company LLC (FMR) | Seeks a high level of income by normally investing in investment–grade debt securities. | Delayed Delivery & When Issued Securities Futures Restricted Securities Swaps | Less than .005% |
| Fidelity Real Estate Equity Central Fund | Fidelity Management & Research Company LLC (FMR) | Seeks above-average income and long-term capital growth by investing primarily in equity securities of issuers in the real estate industry. | Restricted Securities | Less than .005% |
| Fidelity U.S. Equity Central Fund | Fidelity Management & Research Company LLC (FMR) | Seeks capital appreciation by investing primarily in common stocks, allocated across different market sectors. | Foreign Securities Futures Restricted Securities | Less than .005% |
| Fidelity Emerging Markets Debt Local Currency Central Fund | Fidelity Management & Research Company LLC (FMR) | Seeks high total return by normally investing in debt securities of issuers in emerging markets and other debt investments that are tied economically to emerging markets and denominated in the local currency of the issuer. | Foreign Securities Restricted Securities | .03% |
| Fidelity Money Market Central Funds | Fidelity Management & Research Company LLC (FMR) | Each fund seeks to obtain a high level of current income consistent with the preservation of capital and liquidity. | Short-term Investments | Less than .005% |
(a) Expenses expressed as a percentage of average net assets and are as of each underlying Central Fund's most recent annual or semi-annual shareholder report.
An unaudited holdings listing for the investing fund, which presents direct holdings as well as the pro-rata share of any securities and other investments held indirectly through its investment in underlying non-money market Fidelity Central Funds, is available at fidelity.com and/or institutional.fidelity.com, as applicable. A complete unaudited list of holdings for each Fidelity Central Fund is available upon request or at the Securities and Exchange Commission website at www.sec.gov. In addition, the financial statements of the Fidelity Central Funds which contain the significant accounting policies (including investment valuation policies) of those funds, and are not covered by the Report of Independent Registered Public Accounting Firm, are available on the Securities and Exchange Commission website or upon request.
3. Significant Accounting Policies.
The Fund is an investment company and applies the accounting and reporting guidance of the Financial Accounting Standards Board (FASB) Accounting Standards Codification Topic 946 Financial Services - Investment Companies. The financial statements have been prepared in conformity with accounting principles generally accepted in the United States of America (GAAP), which require management to make certain estimates and assumptions at the date of the financial statements. Actual results could differ from those estimates. Subsequent events, if any, through the date that the financial statements were issued have been evaluated in the preparation of the financial statements. The Fund's Schedule of Investments lists any underlying mutual funds or exchange-traded funds (ETFs) but does not include the underlying holdings of these funds. The following summarizes the significant accounting policies of the Fund:
Investment Valuation. Investments are valued as of 4:00 p.m. Eastern time on the last calendar day of the period. The Board of Trustees (the Board) has delegated the day to day responsibility for the valuation of the Fund's investments to the Fair Value Committee (the Committee) established by the the Fund's investment adviser. In accordance with valuation policies and procedures approved by the Board, the Fund attempts to obtain prices from one or more third party pricing vendors or brokers to value its investments. When current market prices, quotations or currency exchange rates are not readily available or reliable, investments will be fair valued in good faith by the Committee, in accordance with procedures adopted by the Board. Factors used in determining fair value vary by investment type and may include market or investment specific events. The frequency with which these procedures are used cannot be predicted and they may be utilized to a significant extent. The Committee oversees the Fund's valuation policies and procedures and reports to the Board on the Committee's activities and fair value determinations. The Board monitors the appropriateness of the procedures used in valuing the Fund's investments and ratifies the fair value determinations of the Committee. The Fund categorizes the inputs to valuation techniques used to value its investments into a disclosure hierarchy consisting of three levels as shown below:
- Level 1 – unadjusted quoted prices in active markets for identical investments
- Level 2 – other significant observable inputs (including quoted prices for similar investments, interest rates, prepayment speeds, etc.)
- Level 3 – unobservable inputs (including the Fund's own assumptions based on the best information available)
Valuation techniques used to value the Fund's investments by major category are as follows. Investments in open-end mutual funds are valued at their closing net asset value (NAV) each business day and are categorized as Level 1 in the hierarchy. The aggregate value of investments by input level as of March 31, 2022 is included at the end of the Fund's Schedule of Investments.
Investment Transactions and Income. For financial reporting purposes, the Fund's investment holdings and NAV include trades executed through the end of the last business day of the period. The NAV per share for processing shareholder transactions is calculated as of the close of business of the New York Stock Exchange (NYSE), normally 4:00 p.m. Eastern time and includes trades executed through the end of the prior business day. Gains and losses on securities sold are determined on the basis of identified cost. Income and capital gain distributions from any underlying mutual funds or exchange-traded funds (ETFs) are recorded on the ex-dividend date.
Class Allocations and Expenses. Investment income, realized and unrealized capital gains and losses, common expenses of a fund, and certain fund-level expense reductions, if any, are allocated daily on a pro-rata basis to each class based on the relative net assets of each class to the total net assets of a fund. Each class differs with respect to transfer agent and distribution and service plan fees incurred, as applicable. Certain expense reductions may also differ by class, if applicable. For the reporting period, the allocated portion of income and expenses to each class as a percent of its average net assets may vary due to the timing of recording these transactions in relation to fluctuating net assets of the classes. Expenses directly attributable to a fund are charged to that fund. Expenses attributable to more than one fund are allocated among the respective funds on the basis of relative net assets or other appropriate methods. Expenses included in the accompanying financial statements reflect the expenses of that fund and do not include any expenses associated with any underlying mutual funds or exchange-traded funds. Although not included in a fund's expenses, a fund indirectly bears its proportionate share of these expenses through the net asset value of each underlying mutual fund or exchange-traded fund. Expense estimates are accrued in the period to which they relate and adjustments are made when actual amounts are known.
Income Tax Information and Distributions to Shareholders. Each year, the Fund intends to qualify as a regulated investment company under Subchapter M of the Internal Revenue Code, including distributing substantially all of its taxable income and realized gains. As a result, no provision for U.S. Federal income taxes is required. The Fund files a U.S. federal tax return, in addition to state and local tax returns as required. The Fund's federal income tax returns are subject to examination by the Internal Revenue Service (IRS) for a period of three fiscal years after they are filed. State and local tax returns may be subject to examination for an additional fiscal year depending on the jurisdiction.
Distributions are declared and recorded on the ex-dividend date. Income and capital gain distributions are declared separately for each class. Income and capital gain distributions are determined in accordance with income tax regulations, which may differ from GAAP.
Capital accounts within the financial statements are adjusted for permanent book-tax differences. These adjustments have no impact on net assets or the results of operations. Capital accounts are not adjusted for temporary book-tax differences which will reverse in a subsequent period.
Book-tax differences are primarily due to the short-term gain distributions from the underlying mutual funds or exchange-traded funds (ETFs) and losses deferred due to wash sales.
As of period end, the cost and unrealized appreciation (depreciation) in securities, and derivatives if applicable, for federal income tax purposes were as follows:
| Gross unrealized appreciation | $772,408 |
| Gross unrealized depreciation | (2,675,078) |
| Net unrealized appreciation (depreciation) | $(1,902,670) |
| Tax cost | $44,529,281 |
4. Purchases and Sales of Investments.
Purchases and sales of securities, other than short-term securities and in-kind transactions, as applicable, are noted in the table below.
| Purchases ($) | Sales ($) | |
| Fidelity Health Savings Fund | 16,497,181 | 4,298,793 |
5. Fees and Other Transactions with Affiliates.
Management Fee. Fidelity Management & Research Company LLC (the investment adviser) and its affiliates provide the Fund with investment management related services for which each class of the Fund pays a monthly management fee. Under the management contract, the investment adviser pays all other operating expenses, except the compensation of the independent Trustees and certain miscellaneous expenses such as proxy and shareholder meeting expenses. During the period, the management fee for each class of the Fund was as follows:
| Annual % of Class-Level Average Net Assets | |
| Fidelity Health Savings Fund | .45% |
| Class K | .35% |
Interfund Trades. Funds may purchase from or sell securities to other Fidelity Funds under procedures adopted by the Board. The procedures have been designed to ensure these interfund trades are executed in accordance with Rule 17a-7 of the 1940 Act. Any interfund trades are included within the respective purchases and sales amounts shown in the Purchases and Sales of Investments note. During the period there were no interfund trades.
6. Committed Line of Credit.
Certain Funds participate with other funds managed by the investment adviser or an affiliate in a $4.25 billion credit facility (the "line of credit") to be utilized for temporary or emergency purposes to fund shareholder redemptions or for other short-term liquidity purposes. The commitment fees on the pro-rata portion of the line of credit are borne by the investment adviser. During the period, there were no borrowings on this line of credit.
7. Expense Reductions.
Through arrangements with the Fund's custodian, credits realized as a result of certain uninvested cash balances were used to reduce the Fund's expenses. During the period, custodian credits reduced the Fund's expenses by $2.
8. Distributions to Shareholders.
Distributions to shareholders of each class were as follows:
| Six months ended March 31, 2022 | Year ended September 30, 2021 |
|
| Fidelity Health Savings Fund | ||
| Distributions to shareholders | ||
| Fidelity Health Savings Fund | $430,373 | $139,713 |
| Class K | 455,992 | 132,514 |
| Total | $886,365 | $272,227 |
9. Share Transactions.
Share transactions for each class were as follows and may contain in-kind transactions, automatic conversions between classes or exchanges between affiliated funds:
| Shares | Shares | Dollars | Dollars | |
| Six months ended March 31, 2022 | Year ended September 30, 2021 | Six months ended March 31, 2022 | Year ended September 30, 2021 | |
| Fidelity Health Savings Fund | ||||
| Fidelity Health Savings Fund | ||||
| Shares sold | 522,721 | 1,320,256 | $5,811,281 | $14,576,955 |
| Reinvestment of distributions | 37,912 | 12,630 | 424,743 | 138,741 |
| Shares redeemed | (144,728) | (258,681) | (1,592,938) | (2,879,082) |
| Net increase (decrease) | 415,905 | 1,074,205 | $4,643,086 | $11,836,614 |
| Class K | ||||
| Shares sold | 693,619 | 1,379,785 | $7,674,856 | $15,252,968 |
| Reinvestment of distributions | 40,617 | 12,023 | 454,921 | 132,407 |
| Shares redeemed | (120,656) | (206,641) | (1,327,116) | (2,306,683) |
| Net increase (decrease) | 613,580 | 1,185,167 | $6,802,661 | $13,078,692 |
10. Other.
A fund's organizational documents provide former and current trustees and officers with a limited indemnification against liabilities arising in connection with the performance of their duties to the fund. In the normal course of business, a fund may also enter into contracts that provide general indemnifications. A fund's maximum exposure under these arrangements is unknown as this would be dependent on future claims that may be made against a fund. The risk of material loss from such claims is considered remote.
11. Coronavirus (COVID-19) Pandemic.
An outbreak of COVID-19 first detected in China during December 2019 has since spread globally and was declared a pandemic by the World Health Organization during March 2020. Developments that disrupt global economies and financial markets, such as the COVID-19 pandemic, may magnify factors that affect the Fund's performance.
Shareholder Expense Example
As a shareholder, you incur two types of costs: (1) transaction costs, which may include sales charges (loads) on purchase payments or redemption proceeds, as applicable and (2) ongoing costs, which generally include management fees, distribution and/or service (12b-1) fees and other Fund expenses. This Example is intended to help you understand your ongoing costs (in dollars) of investing in a fund and to compare these costs with the ongoing costs of investing in other mutual funds.
The Example is based on an investment of $1,000 invested at the beginning of the period and held for the entire period (October 1, 2021 to March 31, 2022).
Actual Expenses
The first line of the accompanying table provides information about actual account values and actual expenses. You may use the information in this line, together with the amount you invested, to estimate the expenses that you paid over the period. Simply divide your account value by $1,000.00 (for example, an $8,600 account value divided by $1,000.00 = 8.6), then multiply the result by the number in the first line for a class/Fund under the heading entitled "Expenses Paid During Period" to estimate the expenses you paid on your account during this period. If any fund is a shareholder of any underlying mutual funds or exchange-traded funds (ETFs) (the Underlying Funds), such fund indirectly bears its proportional share of the expenses of the Underlying Funds in addition to the direct expenses incurred presented in the table. These fees and expenses are not included in the annualized expense ratio used to calculate the expense estimate in the table below.
Hypothetical Example for Comparison Purposes
The second line of the accompanying table provides information about hypothetical account values and hypothetical expenses based on the actual expense ratio and an assumed rate of return of 5% per year before expenses, which is not the actual return. The hypothetical account values and expenses may not be used to estimate the actual ending account balance or expenses you paid for the period. You may use this information to compare the ongoing costs of investing in the Fund and other funds. To do so, compare this 5% hypothetical example with the 5% hypothetical examples that appear in the shareholder reports of the other funds. If any fund is a shareholder of any Underlying Funds, such fund indirectly bears its proportional share of the expenses of the Underlying Funds in addition to the direct expenses as presented in the table. These fees and expenses are not included in the annualized expense ratio used to calculate the expense estimate in the table below.
Please note that the expenses shown in the table are meant to highlight your ongoing costs only and do not reflect any transaction costs. Therefore, the second line of the table is useful in comparing ongoing costs only, and will not help you determine the relative total costs of owning different funds. In addition, if these transactional costs were included, your costs would have been higher.
| Annualized Expense Ratio-A | Beginning Account Value October 1, 2021 | Ending Account Value March 31, 2022 | Expenses Paid During Period-B October 1, 2021 to March 31, 2022 |
|
| Fidelity Health Savings Fund | ||||
| Fidelity Health Savings Fund | .45% | |||
| Actual | $1,000.00 | $968.10 | $2.21 | |
| Hypothetical-C | $1,000.00 | $1,022.69 | $2.27 | |
| Class K | .35% | |||
| Actual | $1,000.00 | $968.70 | $1.72 | |
| Hypothetical-C | $1,000.00 | $1,023.19 | $1.77 |
A Annualized expense ratio reflects expenses net of applicable fee waivers.
B Expenses are equal to the annualized expense ratio, multiplied by the average account value over the period, multiplied by 182/ 365 (to reflect the one-half year period). The fees and expenses of any Underlying Funds are not included in each annualized expense ratio.
C 5% return per year before expenses
Liquidity Risk Management Program
The Securities and Exchange Commission adopted Rule 22e-4 under the Investment Company Act of 1940 (the Liquidity Rule) to promote effective liquidity risk management throughout the open-end investment company industry, thereby reducing the risk that funds will be unable to meet their redemption obligations and mitigating dilution of the interests of fund shareholders.
The Fund has adopted and implemented a liquidity risk management program pursuant to the Liquidity Rule (the Program) effective December 1, 2018. The Program is reasonably designed to assess and manage the Fund's liquidity risk and to comply with the requirements of the Liquidity Rule. The Fund’s Board of Trustees (the Board) has designated the Fund’s investment adviser as administrator of the Program. The Fidelity advisers have established a Liquidity Risk Management Committee (the LRM Committee) to manage the Program for each of the Fidelity Funds. The LRM Committee monitors the adequacy and effectiveness of implementation of the Program and on a periodic basis assesses each Fund’s liquidity risk based on a variety of factors including (1) the Fund’s investment strategy, (2) portfolio liquidity and cash flow projections during normal and reasonably foreseeable stressed conditions, (3) shareholder redemptions, (4) borrowings and other funding sources and (5) in the case of exchange-traded funds, certain additional factors including the effect of the Fund’s prices and spreads, market participants, and basket compositions on the overall liquidity of the Fund’s portfolio, as applicable.
In accordance with the Program, each of the Fund’s portfolio investments is classified into one of four liquidity categories described below based on a determination of a reasonable expectation for how long it would take to convert the investment to cash (or sell or dispose of the investment) without significantly changing its market value.
- Highly liquid investments – cash or convertible to cash within three business days or less
- Moderately liquid investments – convertible to cash in three to seven calendar days
- Less liquid investments – can be sold or disposed of, but not settled, within seven calendar days
- Illiquid investments – cannot be sold or disposed of within seven calendar days
Liquidity classification determinations take into account a variety of factors including various market, trading and investment-specific considerations, as well as market depth, and generally utilize analysis from a third-party liquidity metrics service.
The Liquidity Rule places a 15% limit on a fund’s illiquid investments and requires funds that do not primarily hold assets that are highly liquid investments to determine and maintain a minimum percentage of the fund’s net assets to be invested in highly liquid investments (highly liquid investment minimum or HLIM). The Program includes provisions reasonably designed to comply with the 15% limit on illiquid investments and for determining, periodically reviewing and complying with the HLIM requirement as applicable.
At a recent meeting of the Fund’s Board of Trustees, the LRM Committee provided a written report to the Board pertaining to the operation, adequacy, and effectiveness of implementation of the Program for the annual period from December 1, 2020 through November 30, 2021. The report concluded that the Program has been implemented and is operating effectively and is reasonably designed to assess and manage the Fund’s liquidity risk.
![]()
HSF-SANN-0522
1.9897538.102
Fidelity® Health Savings Index Fund
Semi-Annual Report
March 31, 2022
Contents
To view a fund's proxy voting guidelines and proxy voting record for the 12-month period ended June 30, visit http://www.fidelity.com/proxyvotingresults or visit the Securities and Exchange Commission's (SEC) web site at http://www.sec.gov.
You may also call 1-800-544-8544 to request a free copy of the proxy voting guidelines.
BLOOMBERG® is a trademark and service mark of Bloomberg Finance L.P. and its affiliates (collectively “Bloomberg”). Bloomberg or Bloomberg’s licensors own all proprietary rights in the Bloomberg Indices. Neither Bloomberg nor Bloomberg’s licensors approves or endorses this material, or guarantees the accuracy or completeness of any information herein, or makes any warranty, express or implied, as to the results to be obtained therefrom and, to the maximum extent allowed by law, neither shall have any liability or responsibility for injury or damages arising in connection therewith.
Standard & Poor's, S&P and S&P 500 are registered service marks of The McGraw-Hill Companies, Inc. and have been licensed for use by Fidelity Distributors Corporation.
Other third-party marks appearing herein are the property of their respective owners.
All other marks appearing herein are registered or unregistered trademarks or service marks of FMR LLC or an affiliated company. © 2022 FMR LLC. All rights reserved.
This report and the financial statements contained herein are submitted for the general information of the shareholders of the Fund. This report is not authorized for distribution to prospective investors in the Fund unless preceded or accompanied by an effective prospectus.
A fund files its complete schedule of portfolio holdings with the SEC for the first and third quarters of each fiscal year on Form N-PORT. Forms N-PORT are available on the SEC’s web site at http://www.sec.gov. A fund's Forms N-PORT may be reviewed and copied at the SEC’s Public Reference Room in Washington, DC. Information regarding the operation of the SEC's Public Reference Room may be obtained by calling 1-800-SEC-0330.
For a complete list of a fund's portfolio holdings, view the most recent holdings listing, semiannual report, or annual report on Fidelity's web site at http://www.fidelity.com, http://www.institutional.fidelity.com, or http://www.401k.com, as applicable.
NOT FDIC INSURED •MAY LOSE VALUE •NO BANK GUARANTEE
Neither the Fund nor Fidelity Distributors Corporation is a bank.
Note to Shareholders:
Early in 2020, the outbreak and spread of COVID-19 emerged as a public health emergency that had a major influence on financial markets, primarily based on its impact on the global economy and corporate earnings. On March 11, 2020, the World Health Organization declared the COVID-19 outbreak a pandemic, citing sustained risk of further global spread. The pandemic prompted a number of measures to limit the spread of COVID-19, including travel and border restrictions, quarantines, and restrictions on large gatherings. In turn, these resulted in lower consumer activity, diminished demand for a wide range of products and services, disruption in manufacturing and supply chains, and – given the wide variability in outcomes regarding the outbreak – significant market uncertainty and volatility. To help stem the turmoil, the U.S. government took unprecedented action – in concert with the U.S. Federal Reserve and central banks around the world – to help support consumers, businesses, and the broader economy, and to limit disruption to the financial system.
In general, the overall impact of the pandemic lessened in 2021, amid a resilient economy and widespread distribution of three COVID-19 vaccines granted emergency use authorization from the U.S. Food and Drug Administration (FDA) early in the year. Still, the situation remains dynamic, and the extent and duration of its influence on financial markets and the economy is highly uncertain, due in part to a recent spike in cases based on highly contagious variants of the coronavirus.
Extreme events such as the COVID-19 crisis are exogenous shocks that can have significant adverse effects on mutual funds and their investments. Although multiple asset classes may be affected by market disruption, the duration and impact may not be the same for all types of assets. Fidelity is committed to helping you stay informed amid news about COVID-19 and during increased market volatility, and we continue to take extra steps to be responsive to customer needs. We encourage you to visit us online, where we offer ongoing updates, commentary, and analysis on the markets and our funds.
Investment Summary (Unaudited)
The information in the following tables is based on the combined investments of the Fund and its pro-rata share of the investments of Fidelity's Central Funds, other than the Money Market Central Funds.Top Ten Holdings as of March 31, 2022
| % of fund's net assets | |
| Fidelity International Bond Index Fund | 21.7 |
| Fidelity Total Market Index Fund | 19.3 |
| Fidelity U.S. Bond Index Fund | 12.4 |
| Fidelity Long-Term Treasury Bond Index Fund | 9.7 |
| iShares JPMorgan USD Emerging Markets Bond ETF | 9.2 |
| Invesco Senior Loan ETF | 3.7 |
| Fidelity International Index Fund | 3.5 |
| Fidelity Emerging Markets Index Fund | 3.4 |
| Fidelity Real Estate Index Fund | 1.5 |
| iShares iBoxx $ High Yield Corporate Bond ETF | 1.1 |
| 85.5 |
Quality Diversification (% of fund's net assets)
| As of March 31, 2022 | ||
| U.S. Government and U.S. Government Agency Obligations | 13.0% | |
| Equities | 86.8% | |
| Short-Term Investments and Net Other Assets | 0.2% | |

We have used ratings from Moody's Investors Service, Inc. Where Moody's® ratings are not available, we have used S&P® ratings. All ratings are as of the date indicated and do not reflect subsequent changes.
Asset Allocation (% of fund's net assets)
| As of March 31, 2022 | ||
| Stocks, Investment Companies and Equity Futures | 43.0% | |
| Bonds | 56.8% | |
| Short-Term Investments and Net Other Assets (Liabilities) | 0.2% | |

An unaudited holdings listing for the Fund, which presents direct holdings as well as the pro-rata share of any securities and other investments held indirectly through its investment in underlying non-money market Fidelity Central Funds, is available at fidelity.com and/or institutional.fidelity.com, as applicable.
At period end, foreign investments including the Fund's pro-rata share of the underlying Central Funds, other than the Money Market Funds, was 0.0% of net assets.
Schedule of Investments March 31, 2022 (Unaudited)
Showing Percentage of Net Assets
| Equity Funds - 28.9% | |||
| Shares | Value | ||
| Fidelity Commodity Strategy Fund (a) | 20,226 | $220,261 | |
| Fidelity Emerging Markets Index Fund (a) | 62,902 | 702,621 | |
| Fidelity International Index Fund (a) | 15,988 | 735,288 | |
| Fidelity Real Estate Index Fund (a) | 17,012 | 322,549 | |
| Fidelity Total Market Index Fund (a) | 31,552 | 3,993,195 | |
| TOTAL EQUITY FUNDS | |||
| (Cost $5,442,900) | 5,973,914 | ||
| Fixed-Income Central Funds - 13.0% | |||
| Investment Grade Fixed-Income Funds - 13.0% | |||
| Fidelity Inflation-Protected Bond Index Central Fund (b) | |||
| (Cost $2,799,510) | 25,731 | 2,681,927 | |
| Money Market Central Funds - 0.2% | |||
| Fidelity Cash Central Fund 0.31% (c) | |||
| (Cost $44,605) | 44,596 | 44,605 | |
| Investment Companies - 14.1% | |||
| Invesco Senior Loan ETF | 35,246 | 767,305 | |
| iShares iBoxx $ High Yield Corporate Bond ETF | 2,694 | 221,689 | |
| iShares JPMorgan USD Emerging Markets Bond ETF | 19,503 | 1,906,613 | |
| VanEck JP Morgan EM Local Currency Bond ETF | 1,352 | 36,490 | |
| TOTAL INVESTMENT COMPANIES | |||
| (Cost $3,183,175) | 2,932,097 | ||
| Fixed-Income Funds - 43.8% | |||
| Fidelity International Bond Index Fund (a) | 472,700 | 4,500,108 | |
| Fidelity Long-Term Treasury Bond Index Fund (a) | 151,508 | 1,996,874 | |
| Fidelity U.S. Bond Index Fund (a) | 228,990 | 2,569,266 | |
| TOTAL FIXED-INCOME FUNDS | |||
| (Cost $9,720,620) | 9,066,248 | ||
| TOTAL INVESTMENT IN SECURITIES - 100.0% | |||
| (Cost $21,190,810) | 20,698,791 | ||
| NET OTHER ASSETS (LIABILITIES) - 0.0% | 7,687 | ||
| NET ASSETS - 100% | $20,706,478 |
Security Type Abbreviations
ETF – Exchange-Traded Fund
Legend
(a) Affiliated Fund
(b) Affiliated fund that is generally available only to investment companies and other accounts managed by Fidelity Investments. A complete unaudited schedule of portfolio holdings for each Fidelity Central Fund is filed with the SEC for the first and third quarters of each fiscal year on Form N-PORT and is available upon request or at the SEC's website at www.sec.gov. An unaudited holdings listing for the Fund, which presents direct holdings as well as the pro-rata share of securities and other investments held indirectly through its investment in underlying non-money market Fidelity Central Funds, is available at fidelity.com and/or institutional.fidelity.com, as applicable. In addition, each Fidelity Central Fund's financial statements are available on the SEC's website or upon request.
(c) Affiliated fund that is generally available only to investment companies and other accounts managed by Fidelity Investments. The rate quoted is the annualized seven-day yield of the fund at period end. A complete unaudited listing of the fund's holdings as of its most recent quarter end is available upon request. In addition, each Fidelity Central Fund's financial statements are available on the SEC's website or upon request.
Affiliated Central Funds
Fiscal year to date information regarding the Fund's investments in Fidelity Central Funds, including the ownership percentage, is presented below.
| Fund | Value, beginning of period | Purchases | Sales Proceeds | Dividend Income | Realized Gain/Loss | Change in Unrealized appreciation (depreciation) | Value, end of period | % ownership, end of period |
| Fidelity Cash Central Fund 0.31% | $210,775 | $831,677 | $997,847 | $23 | $-- | $-- | $44,605 | 0.0% |
| Fidelity Inflation-Protected Bond Index Central Fund | 2,419,451 | 822,903 | 345,911 | 208,280 | (9,255) | (205,261) | 2,681,927 | 0.4% |
| Total | $2,630,226 | $1,654,580 | $1,343,758 | $208,303 | $(9,255) | $(205,261) | $2,726,532 |
Amounts in the income column in the above table include any capital gain distributions from underlying funds, which are presented in the corresponding line-item in the Statement of Operations, if applicable.
Affiliated Underlying Funds
Fiscal year to date information regarding the Fund's investments in affiliated Underlying Funds is presented below. Exchanges between classes of the same affiliated Underlying Funds may occur. If an underlying Fund changes its name, the name presented below is the name in effect at period end.
| Affiliate | Value, beginning of period | Purchases | Sales Proceeds | Dividend Income | Realized Gain (loss) | Change in Unrealized appreciation (depreciation) | Value, end of period |
| Fidelity Commodity Strategy Fund | $286,031 | $85,764 | $217,897 | $-- | $23,385 | $42,978 | $220,261 |
| Fidelity Emerging Markets Index Fund | 220,417 | 650,095 | 113,934 | 3,828 | 1,945 | (55,902) | 702,621 |
| Fidelity International Bond Index Fund | 3,740,867 | 1,154,351 | 170,095 | 11,274 | (1,949) | (223,066) | 4,500,108 |
| Fidelity International Index Fund | 865,890 | 371,601 | 439,965 | 28,690 | (19,321) | (42,917) | 735,288 |
| Fidelity Long-Term Treasury Bond Index Fund | 1,774,229 | 562,350 | 147,705 | 27,862 | (7,353) | (184,647) | 1,996,874 |
| Fidelity Real Estate Index Fund | 247,857 | 160,340 | 98,685 | 4,262 | (4,819) | 17,856 | 322,549 |
| Fidelity Total Market Index Fund | 2,916,306 | 1,327,297 | 313,443 | 36,457 | (8,959) | 71,994 | 3,993,195 |
| Fidelity U.S. Bond Index Fund | 1,797,049 | 1,461,502 | 526,931 | 24,471 | (12,646) | (149,708) | 2,569,266 |
| Total | $11,848,646 | $5,773,300 | $2,028,655 | $136,844 | $(29,717) | $(523,412) | $15,040,162 |
Amounts in the income column in the above table include any capital gain distributions from underlying funds, which are presented in the corresponding line-item in the Statement of Operations, if applicable.
Investment Valuation
The following is a summary of the inputs used, as of March 31, 2022, involving the Fund's assets and liabilities carried at fair value. The inputs or methodology used for valuing securities may not be an indication of the risk associated with investing in those securities. For more information on valuation inputs, and their aggregation into the levels used below, please refer to the Investment Valuation section in the accompanying Notes to Financial Statements.
| Valuation Inputs at Reporting Date: | ||||
| Description | Total | Level 1 | Level 2 | Level 3 |
| Investments in Securities: | ||||
| Equity Funds | $5,973,914 | $5,973,914 | $-- | $-- |
| Fixed-Income Central Funds | 2,681,927 | 2,681,927 | -- | -- |
| Money Market Central Funds | 44,605 | 44,605 | -- | -- |
| Investment Companies | 2,932,097 | 2,932,097 | -- | -- |
| Fixed-Income Funds | 9,066,248 | 9,066,248 | -- | -- |
| Total Investments in Securities: | $20,698,791 | $20,698,791 | $-- | $-- |
See accompanying notes which are an integral part of the financial statements.
Financial Statements
Statement of Assets and Liabilities
| March 31, 2022 (Unaudited) | ||
| Assets | ||
| Investment in securities, at value — See accompanying schedule: Unaffiliated issuers (cost $3,183,175) | $2,932,097 | |
| Fidelity Central Funds (cost $2,844,115) | 2,726,532 | |
| Other affiliated issuers (cost $15,163,520) | 15,040,162 | |
| Total Investment in Securities (cost $21,190,810) | $20,698,791 | |
| Cash | 9,365 | |
| Receivable for investments sold | 13,241 | |
| Receivable for fund shares sold | 12,422 | |
| Dividends receivable | 5 | |
| Distributions receivable from Fidelity Central Funds | 7 | |
| Total assets | 20,733,831 | |
| Liabilities | ||
| Payable for fund shares redeemed | $25,663 | |
| Accrued management fee | 1,690 | |
| Total liabilities | 27,353 | |
| Net Assets | $20,706,478 | |
| Net Assets consist of: | ||
| Paid in capital | $21,217,753 | |
| Total accumulated earnings (loss) | (511,275) | |
| Net Assets | $20,706,478 | |
| Net Asset Value, offering price and redemption price per share ($20,706,478 ÷ 1,969,412 shares) | $10.51 |
See accompanying notes which are an integral part of the financial statements.
Statement of Operations
| Six months ended March 31, 2022 (Unaudited) | ||
| Investment Income | ||
| Dividends: | ||
| Unaffiliated issuers | $49,944 | |
| Affiliated issuers | 76,210 | |
| Income from Fidelity Central Funds | 208,303 | |
| Total income | 334,457 | |
| Expenses | ||
| Management fee | $14,145 | |
| Independent trustees' fees and expenses | 28 | |
| Total expenses before reductions | 14,173 | |
| Expense reductions | (4,717) | |
| Total expenses after reductions | 9,456 | |
| Net investment income (loss) | 325,001 | |
| Realized and Unrealized Gain (Loss) | ||
| Net realized gain (loss) on: | ||
| Investment securities: | ||
| Unaffiliated issuers | (11,468) | |
| Fidelity Central Funds | (9,255) | |
| Other affiliated issuers | (29,717) | |
| Capital gain distributions from underlying funds: | ||
| Affiliated issuers | 60,634 | |
| Total net realized gain (loss) | 10,194 | |
| Change in net unrealized appreciation (depreciation) on: | ||
| Investment securities: | ||
| Unaffiliated issuers | (218,378) | |
| Fidelity Central Funds | (205,261) | |
| Other affiliated issuers | (523,412) | |
| Total change in net unrealized appreciation (depreciation) | (947,051) | |
| Net gain (loss) | (936,857) | |
| Net increase (decrease) in net assets resulting from operations | $(611,856) |
See accompanying notes which are an integral part of the financial statements.
Statement of Changes in Net Assets
| Six months ended March 31, 2022 (Unaudited) | Year ended September 30, 2021 | |
| Increase (Decrease) in Net Assets | ||
| Operations | ||
| Net investment income (loss) | $325,001 | $150,093 |
| Net realized gain (loss) | 10,194 | 46,059 |
| Change in net unrealized appreciation (depreciation) | (947,051) | 306,805 |
| Net increase (decrease) in net assets resulting from operations | (611,856) | 502,957 |
| Distributions to shareholders | (404,822) | (122,842) |
| Share transactions | ||
| Proceeds from sales of shares | 6,584,526 | 15,858,209 |
| Reinvestment of distributions | 402,994 | 122,520 |
| Cost of shares redeemed | (2,128,473) | (3,105,773) |
| Net increase (decrease) in net assets resulting from share transactions | 4,859,047 | 12,874,956 |
| Total increase (decrease) in net assets | 3,842,369 | 13,255,071 |
| Net Assets | ||
| Beginning of period | 16,864,109 | 3,609,038 |
| End of period | $20,706,478 | $16,864,109 |
| Other Information | ||
| Shares | ||
| Sold | 601,922 | 1,447,681 |
| Issued in reinvestment of distributions | 36,330 | 11,240 |
| Redeemed | (193,305) | (281,036) |
| Net increase (decrease) | 444,947 | 1,177,885 |
See accompanying notes which are an integral part of the financial statements.
Financial Highlights
Fidelity Health Savings Index Fund
| Six months ended (Unaudited) March 31, | Years endedSeptember 30, | ||
| 2022 | 2021 | 2020 A | |
| Selected Per–Share Data | |||
| Net asset value, beginning of period | $11.06 | $10.41 | $10.00 |
| Income from Investment Operations | |||
| Net investment income (loss)B,C | .19 | .17 | .06 |
| Net realized and unrealized gain (loss) | (.50) | .66 | .40 |
| Total from investment operations | (.31) | .83 | .46 |
| Distributions from net investment income | (.21) | (.14) | (.05) |
| Distributions from net realized gain | (.03) | (.04) | – |
| Total distributions | (.24) | (.18) | (.05) |
| Net asset value, end of period | $10.51 | $11.06 | $10.41 |
| Total ReturnD,E | (2.90)% | 7.99% | 4.58% |
| Ratios to Average Net AssetsC,F,G | |||
| Expenses before reductions | .15%H | .15% | .15%H |
| Expenses net of fee waivers, if any | .10%H | .10% | .10%H |
| Expenses net of all reductions | .10%H | .10% | .10%H |
| Net investment income (loss) | 3.45%H | 1.51% | .97%H |
| Supplemental Data | |||
| Net assets, end of period (000 omitted) | $20,706 | $16,864 | $3,609 |
| Portfolio turnover rateI | 27%H | 42% | 71%H |
A For the period March 2, 2020 (commencement of operations) through September 30, 2020.
B Calculated based on average shares outstanding during the period.
C Net investment income (loss) is affected by the timing of the declaration of dividends by any underlying mutual funds or exchange-traded funds (ETFs). Net investment income (loss) of any such underlying funds is not included in the Fund's net investment income (loss) ratio.
D Total returns for periods of less than one year are not annualized.
E Total returns would have been lower if certain expenses had not been reduced during the applicable periods shown.
F Fees and expenses of any underlying mutual funds or exchange-traded funds (ETFs) are not included in the Fund's expense ratio. The Fund indirectly bears its proportionate share of these expenses. For additional expense information related to investments in Fidelity Central Funds, please refer to the "Investments in Fidelity Central Funds" note found in the Notes to Financial Statements section of the most recent Annual or Semi-Annual report.
G Expense ratios reflect operating expenses of the class. Expenses before reductions do not reflect amounts reimbursed, waived, or reduced through arrangements with the investment adviser, brokerage services, or other offset arrangements, if applicable, and do not represent the amount paid by the class during periods when reimbursements, waivers or reductions occur.
H Annualized
I Amount does not include the portfolio activity of any underlying mutual funds or exchange-traded funds (ETFs).
See accompanying notes which are an integral part of the financial statements.
Notes to Financial Statements (Unaudited)
For the period ended March 31, 2022
1. Organization.
Fidelity Health Savings Index Fund (the Fund) is a fund of Fidelity Charles Street Trust (the Trust) and is authorized to issue an unlimited number of shares. Share transactions on the Statement of Changes in Net Assets may contain exchanges between affiliated funds. The Trust is registered under the Investment Company Act of 1940, as amended (the 1940 Act), as an open-end management investment company organized as a Massachusetts business trust. Shares are available only to certain Fidelity health savings accounts.
2. Investments in Fidelity Central Funds.
Funds may invest in Fidelity Central Funds, which are open-end investment companies generally available only to other investment companies and accounts managed by the investment adviser and its affiliates. The Schedule of Investments lists any Fidelity Central Funds held as an investment as of period end, but does not include the underlying holdings of each Fidelity Central Fund. An investing fund indirectly bears its proportionate share of the expenses of the underlying Fidelity Central Funds.
Based on its investment objective, each Fidelity Central Fund may invest or participate in various investment vehicles or strategies that are similar to those of the investing fund. These strategies are consistent with the investment objectives of the investing fund and may involve certain economic risks which may cause a decline in value of each of the Fidelity Central Funds and thus a decline in the value of the investing fund.
| Fidelity Central Fund | Investment Manager | Investment Objective | Investment Practices | Expense Ratio(a) |
| Fidelity Inflation-Protected Bond Index Central Fund | Fidelity Management & Research Company LLC (FMR) | Seeks to provide investment results that correspond to the performance of the inflation-protected United States Treasury market, and may invest in derivatives. | Less than .005% | |
| Fidelity Money Market Central Funds | Fidelity Management & Research Company LLC (FMR) | Each fund seeks to obtain a high level of current income consistent with the preservation of capital and liquidity. | Short-term Investments | Less than .005% |
(a) Expenses expressed as a percentage of average net assets and are as of each underlying Central Fund's most recent annual or semi-annual shareholder report.
An unaudited holdings listing for the investing fund, which presents direct holdings as well as the pro-rata share of any securities and other investments held indirectly through its investment in underlying non-money market Fidelity Central Funds, is available at fidelity.com and/or institutional.fidelity.com, as applicable. A complete unaudited list of holdings for each Fidelity Central Fund is available upon request or at the Securities and Exchange Commission website at www.sec.gov. In addition, the financial statements of the Fidelity Central Funds which contain the significant accounting policies (including investment valuation policies) of those funds, and are not covered by the Report of Independent Registered Public Accounting Firm, are available on the Securities and Exchange Commission website or upon request.
3. Significant Accounting Policies.
The Fund is an investment company and applies the accounting and reporting guidance of the Financial Accounting Standards Board (FASB) Accounting Standards Codification Topic 946 Financial Services - Investment Companies. The financial statements have been prepared in conformity with accounting principles generally accepted in the United States of America (GAAP), which require management to make certain estimates and assumptions at the date of the financial statements. Actual results could differ from those estimates. Subsequent events, if any, through the date that the financial statements were issued have been evaluated in the preparation of the financial statements. The Fund's Schedule of Investments lists any underlying mutual funds or exchange-traded funds (ETFs) but does not include the underlying holdings of these funds. The following summarizes the significant accounting policies of the Fund:
Investment Valuation. Investments are valued as of 4:00 p.m. Eastern time on the last calendar day of the period. The Board of Trustees (the Board) has delegated the day to day responsibility for the valuation of the Fund's investments to the Fair Value Committee (the Committee) established by the Fund's investment adviser. In accordance with valuation policies and procedures approved by the Board, the Fund attempts to obtain prices from one or more third party pricing vendors or brokers to value its investments. When current market prices, quotations or currency exchange rates are not readily available or reliable, investments will be fair valued in good faith by the Committee, in accordance with procedures adopted by the Board. Factors used in determining fair value vary by investment type and may include market or investment specific events. The frequency with which these procedures are used cannot be predicted and they may be utilized to a significant extent. The Committee oversees the Fund's valuation policies and procedures and reports to the Board on the Committee's activities and fair value determinations. The Board monitors the appropriateness of the procedures used in valuing the Fund's investments and ratifies the fair value determinations of the Committee. The Fund categorizes the inputs to valuation techniques used to value its investments into a disclosure hierarchy consisting of three levels as shown below:
- Level 1 – unadjusted quoted prices in active markets for identical investments
- Level 2 – other significant observable inputs (including quoted prices for similar investments, interest rates, prepayment speeds, etc.)
- Level 3 – unobservable inputs (including the Fund's own assumptions based on the best information available)
Valuation techniques used to value the Fund's investments by major category are as follows. Investments in open-end mutual funds are valued at their closing net asset value (NAV) each business day and are categorized as Level 1 in the hierarchy. ETFs are valued at their last sale price or official closing price as reported by a third party pricing vendor on the primary market or exchange on which they are traded and are categorized as Level 1 in the hierarchy. In the event there were no sales during the day but the exchange reports a closing bid level, ETFs are valued at the closing bid and would be categorized as Level 1 in the hierarchy. In the event there was no closing bid, ETFs may be valued by another method that the Board believes reflects fair value in accordance with the Board's fair value pricing policies and may be categorized as Level 2 in the hierarchy. The aggregate value of investments by input level as of March 31, 2022 is included at the end of the Fund's Schedule of Investments.
Investment Transactions and Income. For financial reporting purposes, the Fund's investment holdings and NAV include trades executed through the end of the last business day of the period. The NAV per share for processing shareholder transactions is calculated as of the close of business of the New York Stock Exchange (NYSE), normally 4:00 p.m. Eastern time and includes trades executed through the end of the prior business day. Gains and losses on securities sold are determined on the basis of identified cost. Income and capital gain distributions from any underlying mutual funds or exchange-traded funds (ETFs) are recorded on the ex-dividend date. Distributions from any underlying mutual funds or exchange-traded funds (ETFs) that are deemed to be return of capital are recorded as a reduction of cost of investments.
Expenses. Expenses directly attributable to a fund are charged to that fund. Expenses attributable to more than one fund are allocated among the respective funds on the basis of relative net assets or other appropriate methods. Expenses included in the accompanying financial statements reflect the expenses of that fund and do not include any expenses associated with any underlying mutual funds or exchange-traded funds. Although not included in a fund's expenses, a fund indirectly bears its proportionate share of these expenses through the net asset value of each underlying mutual fund or exchange-traded fund. Expense estimates are accrued in the period to which they relate and adjustments are made when actual amounts are known.
Income Tax Information and Distributions to Shareholders. Each year, the Fund intends to qualify as a regulated investment company under Subchapter M of the Internal Revenue Code, including distributing substantially all of its taxable income and realized gains. As a result, no provision for U.S. Federal income taxes is required. The Fund files a U.S. federal tax return, in addition to state and local tax returns as required. The Fund's federal income tax returns are subject to examination by the Internal Revenue Service (IRS) for a period of three fiscal years after they are filed. State and local tax returns may be subject to examination for an additional fiscal year depending on the jurisdiction.
Distributions are declared and recorded on the ex-dividend date. Income and capital gain distributions are determined in accordance with income tax regulations, which may differ from GAAP.
Capital accounts within the financial statements are adjusted for permanent book-tax differences. These adjustments have no impact on net assets or the results of operations. Capital accounts are not adjusted for temporary book-tax differences which will reverse in a subsequent period.
Book-tax differences are primarily due to the short-term gain distributions from the underlying mutual funds or exchange-traded funds (ETFs) and losses deferred due to wash sales.
As of period end, the cost and unrealized appreciation (depreciation) in securities, and derivatives if applicable, for federal income tax purposes were as follows:
| Gross unrealized appreciation | $594,321 |
| Gross unrealized depreciation | (1,166,174) |
| Net unrealized appreciation (depreciation) | $(571,853) |
| Tax cost | $21,270,644 |
4. Purchases and Sales of Investments.
Purchases and sales of securities, other than short-term securities and in-kind transactions, as applicable, are noted in the table below.
| Purchases ($) | Sales ($) | |
| Fidelity Health Savings Index Fund | 7,548,779 | 2,581,220 |
5. Fees and Other Transactions with Affiliates.
Management Fee. Fidelity Management & Research Company LLC (the investment adviser) and its affiliates provide the Fund with investment management related services for which the Fund pays a monthly management fee. The management fee is based on an annual rate of .15% of the Fund's average net assets. Under the management contract, the investment adviser pays all other operating expenses, except the compensation of the independent Trustees and certain miscellaneous expenses such as proxy and shareholder meeting expenses.
During the period, the investment adviser waived a portion of its management fee as described in the Expense Reductions note.
Brokerage Commissions. A portion of portfolio transactions were placed with brokerage firms which are affiliates of the investment adviser. Brokerage commissions are included in net realized gain (loss) and change in net unrealized appreciation (depreciation) in the Statement of Operations. The commissions paid to these affiliated firms were as follows:
| Amount | |
| Fidelity Health Savings Index Fund | $7 |
Interfund Trades. Funds may purchase from or sell securities to other Fidelity Funds under procedures adopted by the Board. The procedures have been designed to ensure these interfund trades are executed in accordance with Rule 17a-7 of the 1940 Act. Any interfund trades are included within the respective purchases and sales amounts shown in the Purchases and Sales of Investments note. During the period there were no interfund trades.
6. Committed Line of Credit.
Certain Funds participate with other funds managed by the investment adviser or an affiliate in a $4.25 billion credit facility (the "line of credit") to be utilized for temporary or emergency purposes to fund shareholder redemptions or for other short-term liquidity purposes. The commitment fees on the pro-rata portion of the line of credit are borne by the investment adviser. During the period, there were no borrowings on this line of credit.
7. Expense Reductions.
The investment adviser contractually agreed to waive the Fund's management fee in an amount equal to .05% of average net assets until January 31, 2023. For the period, management fees were reduced by $4,715.
Through arrangements with the Fund's custodian, credits realized as a result of certain uninvested cash balances were used to reduce the Fund's expenses by $2.
8. Other.
A fund's organizational documents provide former and current trustees and officers with a limited indemnification against liabilities arising in connection with the performance of their duties to the fund. In the normal course of business, a fund may also enter into contracts that provide general indemnifications. A fund's maximum exposure under these arrangements is unknown as this would be dependent on future claims that may be made against a fund. The risk of material loss from such claims is considered remote.
9. Coronavirus (COVID-19) Pandemic.
An outbreak of COVID-19 first detected in China during December 2019 has since spread globally and was declared a pandemic by the World Health Organization during March 2020. Developments that disrupt global economies and financial markets, such as the COVID-19 pandemic, may magnify factors that affect the Fund's performance.
Shareholder Expense Example
As a shareholder, you incur two types of costs: (1) transaction costs, which may include sales charges (loads) on purchase payments or redemption proceeds, as applicable and (2) ongoing costs, which generally include management fees, distribution and/or service (12b-1) fees and other Fund expenses. This Example is intended to help you understand your ongoing costs (in dollars) of investing in a fund and to compare these costs with the ongoing costs of investing in other mutual funds.
The Example is based on an investment of $1,000 invested at the beginning of the period and held for the entire period (October 1, 2021 to March 31, 2022).
Actual Expenses
The first line of the accompanying table provides information about actual account values and actual expenses. You may use the information in this line, together with the amount you invested, to estimate the expenses that you paid over the period. Simply divide your account value by $1,000.00 (for example, an $8,600 account value divided by $1,000.00 = 8.6), then multiply the result by the number in the first line for a class/Fund under the heading entitled "Expenses Paid During Period" to estimate the expenses you paid on your account during this period. If any fund is a shareholder of any underlying mutual funds or exchange-traded funds (ETFs) (the Underlying Funds), such fund indirectly bears its proportional share of the expenses of the Underlying Funds in addition to the direct expenses incurred presented in the table. These fees and expenses are not included in the annualized expense ratio used to calculate the expense estimate in the table below.
Hypothetical Example for Comparison Purposes
The second line of the accompanying table provides information about hypothetical account values and hypothetical expenses based on the actual expense ratio and an assumed rate of return of 5% per year before expenses, which is not the actual return. The hypothetical account values and expenses may not be used to estimate the actual ending account balance or expenses you paid for the period. You may use this information to compare the ongoing costs of investing in the Fund and other funds. To do so, compare this 5% hypothetical example with the 5% hypothetical examples that appear in the shareholder reports of the other funds. If any fund is a shareholder of any Underlying Funds, such fund indirectly bears its proportional share of the expenses of the Underlying Funds in addition to the direct expenses as presented in the table. These fees and expenses are not included in the annualized expense ratio used to calculate the expense estimate in the table below.
Please note that the expenses shown in the table are meant to highlight your ongoing costs only and do not reflect any transaction costs. Therefore, the second line of the table is useful in comparing ongoing costs only, and will not help you determine the relative total costs of owning different funds. In addition, if these transactional costs were included, your costs would have been higher.
| Annualized Expense Ratio-A | Beginning Account Value October 1, 2021 | Ending Account Value March 31, 2022 | Expenses Paid During Period-B October 1, 2021 to March 31, 2022 |
|
| Fidelity Health Savings Index Fund | .10% | |||
| Actual | $1,000.00 | $971.00 | $.49 | |
| Hypothetical-C | $1,000.00 | $1,024.43 | $.50 |
A Annualized expense ratio reflects expenses net of applicable fee waivers.
B Expenses are equal to the annualized expense ratio, multiplied by the average account value over the period, multiplied by 182/ 365 (to reflect the one-half year period). The fees and expenses of any Underlying Funds are not included in each annualized expense ratio.
C 5% return per year before expenses
Liquidity Risk Management Program
The Securities and Exchange Commission adopted Rule 22e-4 under the Investment Company Act of 1940 (the Liquidity Rule) to promote effective liquidity risk management throughout the open-end investment company industry, thereby reducing the risk that funds will be unable to meet their redemption obligations and mitigating dilution of the interests of fund shareholders.
The Fund has adopted and implemented a liquidity risk management program pursuant to the Liquidity Rule (the Program) effective December 1, 2018. The Program is reasonably designed to assess and manage the Fund’s liquidity risk and to comply with the requirements of the Liquidity Rule. The Fund’s Board of Trustees (the Board) has designated the Fund’s investment adviser as administrator of the Program. The Fidelity advisers have established a Liquidity Risk Management Committee (the LRM Committee) to manage the Program for each of the Fidelity Funds. The LRM Committee monitors the adequacy and effectiveness of implementation of the Program and on a periodic basis assesses each Fund’s liquidity risk based on a variety of factors including (1) the Fund’s investment strategy, (2) portfolio liquidity and cash flow projections during normal and reasonably foreseeable stressed conditions, (3) shareholder redemptions, (4) borrowings and other funding sources and (5) in the case of exchange-traded funds, certain additional factors including the effect of the Fund’s prices and spreads, market participants, and basket compositions on the overall liquidity of the Fund’s portfolio, as applicable.
In accordance with the Program, each of the Fund’s portfolio investments is classified into one of four liquidity categories described below based on a determination of a reasonable expectation for how long it would take to convert the investment to cash (or sell or dispose of the investment) without significantly changing its market value.
- Highly liquid investments – cash or convertible to cash within three business days or less
- Moderately liquid investments – convertible to cash in three to seven calendar days
- Less liquid investments – can be sold or disposed of, but not settled, within seven calendar days
- Illiquid investments – cannot be sold or disposed of within seven calendar days
Liquidity classification determinations take into account a variety of factors including various market, trading and investment-specific considerations, as well as market depth, and generally utilize analysis from a third-party liquidity metrics service.
The Liquidity Rule places a 15% limit on a fund’s illiquid investments and requires funds that do not primarily hold assets that are highly liquid investments to determine and maintain a minimum percentage of the fund’s net assets to be invested in highly liquid investments (highly liquid investment minimum or HLIM). The Program includes provisions reasonably designed to comply with the 15% limit on illiquid investments and for determining, periodically reviewing and complying with the HLIM requirement as applicable.
At a recent meeting of the Fund’s Board of Trustees, the LRM Committee provided a written report to the Board pertaining to the operation, adequacy, and effectiveness of implementation of the Program for the annual period from December 1, 2020 through November 30, 2021. The report concluded that the Program has been implemented and is operating effectively and is reasonably designed to assess and manage the Fund’s liquidity risk.
![]()
HSI-SANN-0522
1.9897520.102
Fidelity® Sustainable Multi-Asset Fund
Semi-Annual Report
March 31, 2022
Includes Fidelity and Fidelity Advisor share classes
Contents
|
Board Approval of Investment Advisory Contracts and Management Fees |
To view a fund's proxy voting guidelines and proxy voting record for the 12-month period ended June 30, visit http://www.fidelity.com/proxyvotingresults or visit the Securities and Exchange Commission's (SEC) web site at http://www.sec.gov.
You may also call 1-800-544-8544 if you’re an individual investing directly with Fidelity, call 1-800-835-5092 if you’re a plan sponsor or participant with Fidelity as your recordkeeper or call 1-877-208-0098 on institutional accounts or if you’re an advisor or invest through one to request a free copy of the proxy voting guidelines.
Standard & Poor's, S&P and S&P 500 are registered service marks of The McGraw-Hill Companies, Inc. and have been licensed for use by Fidelity Distributors Corporation.
Other third-party marks appearing herein are the property of their respective owners.
All other marks appearing herein are registered or unregistered trademarks or service marks of FMR LLC or an affiliated company. © 2022 FMR LLC. All rights reserved.
This report and the financial statements contained herein are submitted for the general information of the shareholders of the Fund. This report is not authorized for distribution to prospective investors in the Fund unless preceded or accompanied by an effective prospectus.
A fund files its complete schedule of portfolio holdings with the SEC for the first and third quarters of each fiscal year on Form N-PORT. Forms N-PORT are available on the SEC’s web site at http://www.sec.gov. A fund's Forms N-PORT may be reviewed and copied at the SEC’s Public Reference Room in Washington, DC. Information regarding the operation of the SEC's Public Reference Room may be obtained by calling 1-800-SEC-0330.
For a complete list of a fund's portfolio holdings, view the most recent holdings listing, semiannual report, or annual report on Fidelity's web site at http://www.fidelity.com, http://www.institutional.fidelity.com, or http://www.401k.com, as applicable.
NOT FDIC INSURED •MAY LOSE VALUE •NO BANK GUARANTEE
Neither the Fund nor Fidelity Distributors Corporation is a bank.
Note to Shareholders:
Early in 2020, the outbreak and spread of COVID-19 emerged as a public health emergency that had a major influence on financial markets, primarily based on its impact on the global economy and corporate earnings. On March 11, 2020, the World Health Organization declared the COVID-19 outbreak a pandemic, citing sustained risk of further global spread. The pandemic prompted a number of measures to limit the spread of COVID-19, including travel and border restrictions, quarantines, and restrictions on large gatherings. In turn, these resulted in lower consumer activity, diminished demand for a wide range of products and services, disruption in manufacturing and supply chains, and – given the wide variability in outcomes regarding the outbreak – significant market uncertainty and volatility. To help stem the turmoil, the U.S. government took unprecedented action – in concert with the U.S. Federal Reserve and central banks around the world – to help support consumers, businesses, and the broader economy, and to limit disruption to the financial system.
In general, the overall impact of the pandemic lessened in 2021, amid a resilient economy and widespread distribution of three COVID-19 vaccines granted emergency use authorization from the U.S. Food and Drug Administration (FDA) early in the year. Still, the situation remains dynamic, and the extent and duration of its influence on financial markets and the economy is highly uncertain, due in part to a recent spike in cases based on highly contagious variants of the coronavirus.
Extreme events such as the COVID-19 crisis are exogenous shocks that can have significant adverse effects on mutual funds and their investments. Although multiple asset classes may be affected by market disruption, the duration and impact may not be the same for all types of assets. Fidelity is committed to helping you stay informed amid news about COVID-19 and during increased market volatility, and we continue to take extra steps to be responsive to customer needs. We encourage you to visit us online, where we offer ongoing updates, commentary, and analysis on the markets and our funds.
Investment Summary (Unaudited)
Top Holdings as of March 31, 2022
| % of fund's net assets | |
| Fidelity U.S. Sustainability Index Fund | 25.1 |
| Fidelity Sustainability Bond Index Fund | 20.0 |
| Fidelity Sustainable International Equity Fund | 17.7 |
| Fidelity Sustainable U.S. Equity Fund | 10.8 |
| Fidelity Sustainable Emerging Markets Equity Fund | 10.7 |
| Fidelity International Sustainability Index Fund | 6.9 |
| Fidelity Inflation-Protected Bond Index Fund | 4.8 |
| Fidelity Long-Term Treasury Bond Index Fund | 4.0 |
| 100.0 |
Asset Allocation (% of fund's net assets)
| Period end | ||
| Domestic Equity Funds | 35.9% | |
| International Equity Funds | 35.3% | |
| Bond Funds | 28.8% | |

Schedule of Investments March 31, 2022 (Unaudited)
Showing Percentage of Net Assets
| Domestic Equity Funds - 35.9% | |||
| Shares | Value | ||
| Fidelity Sustainable U.S. Equity Fund (a) | 22,308 | $230,662 | |
| Fidelity U.S. Sustainability Index Fund (a) | 27,003 | 538,708 | |
| TOTAL DOMESTIC EQUITY FUNDS | |||
| (Cost $754,676) | 769,370 | ||
| International Equity Funds - 35.3% | |||
| Fidelity International Sustainability Index Fund (a) | 12,207 | 149,168 | |
| Fidelity Sustainable Emerging Markets Equity Fund (a) | 25,764 | 229,303 | |
| Fidelity Sustainable International Equity Fund (a) | 40,776 | 378,404 | |
| TOTAL INTERNATIONAL EQUITY FUNDS | |||
| (Cost $779,733) | 756,875 | ||
| Bond Funds - 28.8% | |||
| Fidelity Inflation-Protected Bond Index Fund (a) | 9,410 | 101,820 | |
| Fidelity Long-Term Treasury Bond Index Fund (a) | 6,566 | 86,544 | |
| Fidelity Sustainability Bond Index Fund (a) | 42,639 | 427,674 | |
| TOTAL BOND FUNDS | |||
| (Cost $625,774) | 616,038 | ||
| TOTAL INVESTMENT IN SECURITIES - 100.0% | |||
| (Cost $2,160,183) | 2,142,283 | ||
| NET OTHER ASSETS (LIABILITIES) - 0.0% | (297) | ||
| NET ASSETS - 100% | $2,141,986 |
Legend
(a) Affiliated Fund
Affiliated Central Funds
Fiscal year to date information regarding the Fund's investments in Fidelity Central Funds, including the ownership percentage, is presented below.
| Fund | Value, beginning of period | Purchases | Sales Proceeds | Dividend Income | Realized Gain/Loss | Change in Unrealized appreciation (depreciation) | Value, end of period | % ownership, end of period |
| Fidelity Cash Central Fund 0.31% | $-- | $100,000 | $100,000 | $-- | $-- | $-- | $-- | 0.0% |
| Total | $-- | $100,000 | $100,000 | $-- | $-- | $-- | $-- |
Amounts in the income column in the above table include any capital gain distributions from underlying funds, which are presented in the corresponding line-item in the Statement of Operations, if applicable.
Affiliated Underlying Funds
Fiscal year to date information regarding the Fund's investments in affiliated Underlying Funds is presented below. Exchanges between classes of the same affiliated Underlying Funds may occur. If an underlying Fund changes its name, the name presented below is the name in effect at period end.
| Affiliate | Value, beginning of period | Purchases | Sales Proceeds | Dividend Income | Realized Gain (loss) | Change in Unrealized appreciation (depreciation) | Value, end of period |
| Fidelity Inflation-Protected Bond Index Fund | $-- | $107,405 | $5,432 | $-- | $(3) | $(150) | $101,820 |
| Fidelity International Sustainability Index Fund | -- | 152,214 | 1 | -- | -- | (3,045) | 149,168 |
| Fidelity Long-Term Treasury Bond Index Fund | -- | 90,325 | 1,572 | 157 | 19 | (2,228) | 86,544 |
| Fidelity Sustainability Bond Index Fund | -- | 440,523 | 5,525 | 567 | 34 | (7,358) | 427,674 |
| Fidelity Sustainable Emerging Markets Equity Fund | -- | 245,759 | 3,831 | -- | (474) | (12,151) | 229,303 |
| Fidelity Sustainable International Equity Fund | -- | 386,066 | 2 | -- | -- | (7,660) | 378,404 |
| Fidelity Sustainable U.S. Equity Fund | -- | 246,694 | 19,381 | -- | (40) | 3,389 | 230,662 |
| Fidelity U.S. Sustainability Index Fund | -- | 573,809 | 46,627 | -- | 223 | 11,303 | 538,708 |
| Total | $-- | $2,242,795 | $82,371 | $724 | $(241) | $(17,900) | $2,142,283 |
Amounts in the income column in the above table include any capital gain distributions from underlying funds, which are presented in the corresponding line-item in the Statement of Operations, if applicable.
Investment Valuation
The following is a summary of the inputs used, as of March 31, 2022, involving the Fund's assets and liabilities carried at fair value. The inputs or methodology used for valuing securities may not be an indication of the risk associated with investing in those securities. For more information on valuation inputs, and their aggregation into the levels used below, please refer to the Investment Valuation section in the accompanying Notes to Financial Statements.
| Valuation Inputs at Reporting Date: | ||||
| Description | Total | Level 1 | Level 2 | Level 3 |
| Investments in Securities: | ||||
| Domestic Equity Funds | $769,370 | $769,370 | $-- | $-- |
| International Equity Funds | 756,875 | 756,875 | -- | -- |
| Bond Funds | 616,038 | 616,038 | -- | -- |
| Total Investments in Securities: | $2,142,283 | $2,142,283 | $-- | $-- |
See accompanying notes which are an integral part of the financial statements.
Financial Statements
Statement of Assets and Liabilities
| March 31, 2022 (Unaudited) | ||
| Assets | ||
| Investment in securities, at value (cost $2,160,183) — See accompanying schedule | $2,142,283 | |
| Receivable for investments sold | 71,966 | |
| Receivable for fund shares sold | 20,811 | |
| Total assets | 2,235,060 | |
| Liabilities | ||
| Payable for investments purchased | $67,866 | |
| Payable for fund shares redeemed | 24,846 | |
| Accrued management fee | 84 | |
| Distribution and service plan fees payable | 278 | |
| Total liabilities | 93,074 | |
| Net Assets | $2,141,986 | |
| Net Assets consist of: | ||
| Paid in capital | $2,159,972 | |
| Total accumulated earnings (loss) | (17,986) | |
| Net Assets | $2,141,986 | |
| Net Asset Value and Maximum Offering Price | ||
| Class A: | ||
| Net Asset Value and redemption price per share ($194,508 ÷ 20,055 shares)(a) | $9.70 | |
| Maximum offering price per share (100/94.25 of $9.70) | $10.29 | |
| Class M: | ||
| Net Asset Value and redemption price per share ($193,911 ÷ 20,000 shares)(a) | $9.70 | |
| Maximum offering price per share (100/96.50 of $9.70) | $10.05 | |
| Class C: | ||
| Net Asset Value and offering price per share ($213,780 ÷ 22,064 shares)(a) | $9.69 | |
| Fidelity Sustainable Multi-Asset Fund: | ||
| Net Asset Value, offering price and redemption price per share ($1,294,411 ÷ 133,419 shares) | $9.70 | |
| Class I: | ||
| Net Asset Value, offering price and redemption price per share ($245,376 ÷ 25,291 shares) | $9.70 |
(a) Redemption price per share is equal to net asset value less any applicable contingent deferred sales charge.
See accompanying notes which are an integral part of the financial statements.
Statement of Operations
| For the period February 10, 2022 (commencement of operations) through March 31, 2022 (Unaudited) |
||
| Investment Income | ||
| Dividends (including $724 earned from affiliated issuers) | $724 | |
| Expenses | ||
| Management fee | $192 | |
| Distribution and service plan fees | 458 | |
| Total expenses before reductions | 650 | |
| Expense reductions | (81) | |
| Total expenses after reductions | 569 | |
| Net investment income (loss) | 155 | |
| Realized and Unrealized Gain (Loss) | ||
| Realized gain (loss) on sale of underlying fund shares | (241) | |
| Total net realized gain (loss) | (241) | |
| Change in net unrealized appreciation (depreciation) on investment securities | (17,900) | |
| Net gain (loss) | (18,141) | |
| Net increase (decrease) in net assets resulting from operations | $(17,986) |
See accompanying notes which are an integral part of the financial statements.
Statement of Changes in Net Assets
| For the period February 10, 2022 (commencement of operations) through March 31, 2022 (Unaudited) |
|
| Increase (Decrease) in Net Assets | |
| Operations | |
| Net investment income (loss) | $155 |
| Net realized gain (loss) | (241) |
| Change in net unrealized appreciation (depreciation) | (17,900) |
| Net increase (decrease) in net assets resulting from operations | (17,986) |
| Share transactions - net increase (decrease) | 2,159,972 |
| Total increase (decrease) in net assets | 2,141,986 |
| Net Assets | |
| Beginning of period | – |
| End of period | $2,141,986 |
See accompanying notes which are an integral part of the financial statements.
Financial Highlights
Fidelity Sustainable Multi-Asset Fund Class A
| Six months ended (Unaudited) March 31, | |
| 2022 A | |
| Selected Per–Share Data | |
| Net asset value, beginning of period | $10.00 |
| Income from Investment Operations | |
| Net investment income (loss)B,C | –D |
| Net realized and unrealized gain (loss) | (.30) |
| Total from investment operations | (.30) |
| Net asset value, end of period | $9.70 |
| Total ReturnE,F | (3.00)% |
| Ratios to Average Net AssetsC,G,H | |
| Expenses before reductions | .34%I,J |
| Expenses net of fee waivers, if any | .30%I |
| Expenses net of all reductions | .30%I |
| Net investment income (loss) | .06%I |
| Supplemental Data | |
| Net assets, end of period (000 omitted) | $195 |
| Portfolio turnover rateK | 5%L |
A For the period February 10, 2022 (commencement of operations) through March 31, 2022.
B Calculated based on average shares outstanding during the period.
C Net investment income (loss) is affected by the timing of the declaration of dividends by any underlying mutual funds or exchange-traded funds (ETFs). Net investment income (loss) of any such underlying funds is not included in the Fund's net investment income (loss) ratio.
D Amount represents less than $.005 per share.
E Total returns for periods of less than one year are not annualized.
F Total returns do not include the effect of the sales charges.
G Fees and expenses of any underlying mutual funds or exchange-traded funds (ETFs) are not included in the Fund's expense ratio. The Fund indirectly bears its proportionate share of these expenses.
H Expense ratios reflect operating expenses of the class. Expenses before reductions do not reflect amounts reimbursed, waived, or reduced through arrangements with the investment adviser, brokerage services, or other offset arrangements, if applicable, and do not represent the amount paid by the class during periods when reimbursements, waivers or reductions occur.
I Annualized
J On certain classes, the size and fluctuation of net assets and expense amounts may cause ratios to differ from contractual rates.
K Amount does not include the portfolio activity of any underlying mutual funds or exchange-traded funds (ETFs).
L Amount not annualized.
See accompanying notes which are an integral part of the financial statements.
Fidelity Sustainable Multi-Asset Fund Class M
| Six months ended (Unaudited) March 31, | |
| 2022 A | |
| Selected Per–Share Data | |
| Net asset value, beginning of period | $10.00 |
| Income from Investment Operations | |
| Net investment income (loss)B,C | –D |
| Net realized and unrealized gain (loss) | (.30) |
| Total from investment operations | (.30) |
| Net asset value, end of period | $9.70 |
| Total ReturnE,F | (3.00)% |
| Ratios to Average Net AssetsC,G,H | |
| Expenses before reductions | .59%I,J |
| Expenses net of fee waivers, if any | .55%I |
| Expenses net of all reductions | .55%I |
| Net investment income (loss) | (.19)%I |
| Supplemental Data | |
| Net assets, end of period (000 omitted) | $194 |
| Portfolio turnover rateK | 5%L |
A For the period February 10, 2022 (commencement of operations) through March 31, 2022.
B Calculated based on average shares outstanding during the period.
C Net investment income (loss) is affected by the timing of the declaration of dividends by any underlying mutual funds or exchange-traded funds (ETFs). Net investment income (loss) of any such underlying funds is not included in the Fund's net investment income (loss) ratio.
D Amount represents less than $.005 per share.
E Total returns for periods of less than one year are not annualized.
F Total returns do not include the effect of the sales charges.
G Fees and expenses of any underlying mutual funds or exchange-traded funds (ETFs) are not included in the Fund's expense ratio. The Fund indirectly bears its proportionate share of these expenses.
H Expense ratios reflect operating expenses of the class. Expenses before reductions do not reflect amounts reimbursed, waived, or reduced through arrangements with the investment adviser, brokerage services, or other offset arrangements, if applicable, and do not represent the amount paid by the class during periods when reimbursements, waivers or reductions occur.
I Annualized
J On certain classes, the size and fluctuation of net assets and expense amounts may cause ratios to differ from contractual rates.
K Amount does not include the portfolio activity of any underlying mutual funds or exchange-traded funds (ETFs).
L Amount not annualized.
See accompanying notes which are an integral part of the financial statements.
Fidelity Sustainable Multi-Asset Fund Class C
| Six months ended (Unaudited) March 31, | |
| 2022 A | |
| Selected Per–Share Data | |
| Net asset value, beginning of period | $10.00 |
| Income from Investment Operations | |
| Net investment income (loss)B,C | (.01) |
| Net realized and unrealized gain (loss) | (.30) |
| Total from investment operations | (.31) |
| Net asset value, end of period | $9.69 |
| Total ReturnD,E | (3.10)% |
| Ratios to Average Net AssetsC,F,G | |
| Expenses before reductions | 1.08%H,I |
| Expenses net of fee waivers, if any | 1.05%H |
| Expenses net of all reductions | 1.05%H |
| Net investment income (loss) | (.69)%H |
| Supplemental Data | |
| Net assets, end of period (000 omitted) | $214 |
| Portfolio turnover rateJ | 5%K |
A For the period February 10, 2022 (commencement of operations) through March 31, 2022.
B Calculated based on average shares outstanding during the period.
C Net investment income (loss) is affected by the timing of the declaration of dividends by any underlying mutual funds or exchange-traded funds (ETFs). Net investment income (loss) of any such underlying funds is not included in the Fund's net investment income (loss) ratio.
D Total returns for periods of less than one year are not annualized.
E Total returns do not include the effect of the contingent deferred sales charge.
F Fees and expenses of any underlying mutual funds or exchange-traded funds (ETFs) are not included in the Fund's expense ratio. The Fund indirectly bears its proportionate share of these expenses.
G Expense ratios reflect operating expenses of the class. Expenses before reductions do not reflect amounts reimbursed, waived, or reduced through arrangements with the investment adviser, brokerage services, or other offset arrangements, if applicable, and do not represent the amount paid by the class during periods when reimbursements, waivers or reductions occur.
H Annualized
I On certain classes, the size and fluctuation of net assets and expense amounts may cause ratios to differ from contractual rates.
J Amount does not include the portfolio activity of any underlying mutual funds or exchange-traded funds (ETFs).
K Amount not annualized.
See accompanying notes which are an integral part of the financial statements.
Fidelity Sustainable Multi-Asset Fund
| Six months ended (Unaudited) March 31, | |
| 2022 A | |
| Selected Per–Share Data | |
| Net asset value, beginning of period | $10.00 |
| Income from Investment Operations | |
| Net investment income (loss)B,C | –D |
| Net realized and unrealized gain (loss) | (.30) |
| Total from investment operations | (.30) |
| Net asset value, end of period | $9.70 |
| Total ReturnE | (3.00)% |
| Ratios to Average Net AssetsC,F,G | |
| Expenses before reductions | .09%H,I |
| Expenses net of fee waivers, if any | .05%H |
| Expenses net of all reductions | .05%H |
| Net investment income (loss) | .31%H |
| Supplemental Data | |
| Net assets, end of period (000 omitted) | $1,294 |
| Portfolio turnover rateJ | 5%K |
A For the period February 10, 2022 (commencement of operations) through March 31, 2022.
B Calculated based on average shares outstanding during the period.
C Net investment income (loss) is affected by the timing of the declaration of dividends by any underlying mutual funds or exchange-traded funds (ETFs). Net investment income (loss) of any such underlying funds is not included in the Fund's net investment income (loss) ratio.
D Amount represents less than $.005 per share.
E Total returns for periods of less than one year are not annualized.
F Fees and expenses of any underlying mutual funds or exchange-traded funds (ETFs) are not included in the Fund's expense ratio. The Fund indirectly bears its proportionate share of these expenses.
G Expense ratios reflect operating expenses of the class. Expenses before reductions do not reflect amounts reimbursed, waived, or reduced through arrangements with the investment adviser, brokerage services, or other offset arrangements, if applicable, and do not represent the amount paid by the class during periods when reimbursements, waivers or reductions occur.
H Annualized
I On certain classes, the size and fluctuation of net assets and expense amounts may cause ratios to differ from contractual rates.
J Amount does not include the portfolio activity of any underlying mutual funds or exchange-traded funds (ETFs).
K Amount not annualized.
See accompanying notes which are an integral part of the financial statements.
Fidelity Sustainable Multi-Asset Fund Class I
| Six months ended (Unaudited) March 31, | |
| 2022 A | |
| Selected Per–Share Data | |
| Net asset value, beginning of period | $10.00 |
| Income from Investment Operations | |
| Net investment income (loss)B,C | –D |
| Net realized and unrealized gain (loss) | (.30) |
| Total from investment operations | (.30) |
| Net asset value, end of period | $9.70 |
| Total ReturnE | (3.00)% |
| Ratios to Average Net AssetsC,F,G | |
| Expenses before reductions | .10%H |
| Expenses net of fee waivers, if any | .05%H |
| Expenses net of all reductions | .05%H |
| Net investment income (loss) | .31%H |
| Supplemental Data | |
| Net assets, end of period (000 omitted) | $245 |
| Portfolio turnover rateI | 5%J |
A For the period February 10, 2022 (commencement of operations) through March 31, 2022.
B Calculated based on average shares outstanding during the period.
C Net investment income (loss) is affected by the timing of the declaration of dividends by any underlying mutual funds or exchange-traded funds (ETFs). Net investment income (loss) of any such underlying funds is not included in the Fund's net investment income (loss) ratio.
D Amount represents less than $.005 per share.
E Total returns for periods of less than one year are not annualized.
F Fees and expenses of any underlying mutual funds or exchange-traded funds (ETFs) are not included in the Fund's expense ratio. The Fund indirectly bears its proportionate share of these expenses.
G Expense ratios reflect operating expenses of the class. Expenses before reductions do not reflect amounts reimbursed, waived, or reduced through arrangements with the investment adviser, brokerage services, or other offset arrangements, if applicable, and do not represent the amount paid by the class during periods when reimbursements, waivers or reductions occur.
H Annualized
I Amount does not include the portfolio activity of any underlying mutual funds or exchange-traded funds (ETFs).
J Amount not annualized.
See accompanying notes which are an integral part of the financial statements.
Notes to Financial Statements (Unaudited)
For the period ended March 31, 2022
1. Organization.
Fidelity Sustainable Multi-Asset Fund (the Fund) is a fund of Fidelity Charles Street Trust (the Trust) and is authorized to issue an unlimited number of shares. The Trust is registered under the Investment Company Act of 1940, as amended (the 1940 Act), as an open-end management investment company organized as a Massachusetts business trust. The fund offers Class A, Class M, Class C, Sustainable Multi-Asset and Class I shares, each of which has equal rights as to assets and voting privileges. Each class has exclusive voting rights with respect to matters that affect that class. Class C shares will automatically convert to Class A shares after a holding period of eight years from the initial date of purchase, with certain exceptions. Application of FMR's environmental, social, and governance (ESG) ratings process and/or its sustainable investing exclusion criteria may affect the Fund's exposure to certain issuers, sectors, regions, and countries and may affect the Fund's performance depending on whether certain investments are in or out of favor. The criteria related to the Fund's ESG ratings process and/or adherence to its sustainable investing exclusion criteria may result in the Fund forgoing opportunities to buy certain securities when it might otherwise be advantageous to do so, or selling securities for ESG reasons when it might be otherwise disadvantageous for it to do so. As a result, the Fund's performance may at times be better or worse than the performance of funds that do not use ESG or sustainability criteria. There are significant differences in interpretations of what it means for an issuer to have positive ESG factors. While the investment adviser believes its definitions are reasonable, the portfolio decisions it makes may differ with other investors' or advisers' views.
2. Significant Accounting Policies.
The Fund is an investment company and applies the accounting and reporting guidance of the Financial Accounting Standards Board (FASB) Accounting Standards Codification Topic 946 Financial Services - Investment Companies. The financial statements have been prepared in conformity with accounting principles generally accepted in the United States of America (GAAP), which require management to make certain estimates and assumptions at the date of the financial statements. Actual results could differ from those estimates. Subsequent events, if any, through the date that the financial statements were issued have been evaluated in the preparation of the financial statements. The Fund's Schedule of Investments lists any underlying mutual funds or exchange-traded funds (ETFs) but does not include the underlying holdings of these funds. The following summarizes the significant accounting policies of the Fund:
Investment Valuation. Investments are valued as of 4:00 p.m. Eastern time on the last calendar day of the period. The frequency with which these procedures are used cannot be predicted and they may be utilized to a significant extent. The Committee oversees the Fund's valuation policies and procedures and reports to the Board on the Committee's activities and fair value determinations. The Board monitors the appropriateness of the procedures used in valuing the Fund's investments and ratifies the fair value determinations of the Committee. The Fund categorizes the inputs to valuation techniques used to value its investments into a disclosure hierarchy consisting of three levels as shown below:
- Level 1 – unadjusted quoted prices in active markets for identical investments
- Level 2 – other significant observable inputs (including quoted prices for similar investments, interest rates, prepayment speeds, etc.)
- Level 3 – unobservable inputs (including the Fund's own assumptions based on the best information available)
Valuation techniques used to value the Fund's investments by major category are as follows. Investments in open-end mutual funds are valued at their closing net asset value (NAV) each business day and are categorized as Level 1 in the hierarchy. The aggregate value of investments by input level as of March 31, 2022 is included at the end of the Fund's Schedule of Investments.
Investment Transactions and Income. For financial reporting purposes, the Fund's investment holdings and NAV include trades executed through the end of the last business day of the period. The NAV per share for processing shareholder transactions is calculated as of the close of business of the New York Stock Exchange (NYSE), normally 4:00 p.m. Eastern time and includes trades executed through the end of the prior business day. Gains and losses on securities sold are determined on the basis of identified cost. Income and capital gain distributions from any underlying mutual funds or exchange-traded funds (ETFs) are recorded on the ex-dividend date.
Class Allocations and Expenses. Investment income, realized and unrealized capital gains and losses, common expenses of a fund, and certain fund-level expense reductions, if any, are allocated daily on a pro-rata basis to each class based on the relative net assets of each class to the total net assets of a fund. Each class differs with respect to transfer agent and distribution and service plan fees incurred, as applicable. Certain expense reductions may also differ by class, if applicable. For the reporting period, the allocated portion of income and expenses to each class as a percent of its average net assets may vary due to the timing of recording these transactions in relation to fluctuating net assets of the classes. Expenses directly attributable to a fund are charged to that fund. Expenses attributable to more than one fund are allocated among the respective funds on the basis of relative net assets or other appropriate methods. Expenses included in the accompanying financial statements reflect the expenses of that fund and do not include any expenses associated with any underlying mutual funds or exchange-traded funds. Although not included in a fund's expenses, a fund indirectly bears its proportionate share of these expenses through the net asset value of each underlying mutual fund or exchange-traded fund. Expense estimates are accrued in the period to which they relate and adjustments are made when actual amounts are known.
Income Tax Information and Distributions to Shareholders. Each year, the Fund intends to qualify as a regulated investment company under Subchapter M of the Internal Revenue Code, including distributing substantially all of its taxable income and realized gains. As a result, no provision for U.S. Federal income taxes is required. The Fund files a U.S. federal tax return, in addition to state and local tax returns as required. The Fund's federal income tax returns are subject to examination by the Internal Revenue Service (IRS) for a period of three fiscal years after they are filed. State and local tax returns may be subject to examination for an additional fiscal year depending on the jurisdiction.
Distributions are declared and recorded on the ex-dividend date. Income and capital gain distributions are declared separately for each class. Income and capital gain distributions are determined in accordance with income tax regulations, which may differ from GAAP.
Capital accounts within the financial statements are adjusted for permanent book-tax differences. These adjustments have no impact on net assets or the results of operations. Capital accounts are not adjusted for temporary book-tax differences which will reverse in a subsequent period.
As of period end, the cost and unrealized appreciation (depreciation) in securities, and derivatives if applicable, for federal income tax purposes were as follows:
| Gross unrealized appreciation | $22,722 |
| Gross unrealized depreciation | (40,626) |
| Net unrealized appreciation (depreciation) | $(17,904) |
| Tax cost | $2,160,187 |
3. Purchases and Sales of Investments.
Purchases and sales of securities, other than short-term securities and in-kind transactions, as applicable, are noted in the table below.
| Purchases ($) | Sales ($) | |
| Fidelity Sustainable Multi-Asset Fund | 2,242,795 | 82,371 |
4. Fees and Other Transactions with Affiliates.
Management Fee. Fidelity Management & Research Company LLC (the investment adviser) and its affiliates provide the Fund with investment management related services for which each class of the Fund pays a monthly management fee. Under the management contract, the investment adviser pays all other operating expenses, except the compensation of the independent Trustees and certain miscellaneous expenses such as proxy and shareholder meeting expenses. During the period, the management fee for each class of the Fund was as follows:
| Annual % of Class-Level Average Net Assets | |
| Class A | .10% |
| Class M | .10% |
| Class C | .10% |
| Fidelity Sustainable Multi-Asset Fund | .10% |
| Class I | .10% |
Distribution and Service Plan Fees. In accordance with Rule 12b-1 of the 1940 Act, the Fund has adopted separate Distribution and Service Plans for each class of shares. Certain classes pay Fidelity Distributors Company LLC (FDC), an affiliate of the investment adviser, separate Distribution and Service Fees, each of which is based on an annual percentage of each class' average net assets. In addition, FDC may pay financial intermediaries for selling shares of the Fund and providing shareholder support services. For the period, the Distribution and Service Fee rates, total fees and amounts retained by FDC were as follows:
| Distribution Fee | Service Fee | Total Fees | Retained by FDC | |
| Class A | -% | .25% | $66 | $66 |
| Class M | .25% | .25% | 131 | 132 |
| Class C | .75% | .25% | 261 | 261 |
| $458 | $459 |
Sales Load. FDC may receive a front-end sales charge of up to 5.75% for selling Class A shares and 3.50% for selling Class M shares, some of which is paid to financial intermediaries for selling shares of the Fund. Depending on the holding period, FDC may receive contingent deferred sales charges levied on Class A, Class M and Class C redemptions. The deferred sales charges are 1.00% for Class C shares, 1.00% for certain purchases of Class A shares and .25% for certain purchases of Class M shares. For the period, there were no sales charge amounts retained by FDC.
Interfund Trades. Funds may purchase from or sell securities to other Fidelity Funds under procedures adopted by the Board. The procedures have been designed to ensure these interfund trades are executed in accordance with Rule 17a-7 of the 1940 Act. Any interfund trades are included within the respective purchases and sales amounts shown in the Purchases and Sales of Investments note. During the period there were no interfund trades.
5. Expense Reductions.
The investment adviser contractually agreed to reimburse expenses of each class to the extent annual operating expenses exceeded certain levels of class-level average net assets as noted in the table below. This reimbursement will remain in place through January 31, 2024. Some expenses, for example the compensation of the independent Trustees, and certain miscellaneous expenses such as proxy and shareholder meeting expenses, are excluded from this reimbursement.
The following classes were in reimbursement during the period:
| Expense Limitations | Reimbursement | |
| Class A | .30% | $11 |
| Class M | .55% | 10 |
| Class C | 1.05% | 7 |
| Fidelity Sustainable Multi-Asset Fund | .05% | 39 |
| Class I | .05% | 14 |
| $81 |
6. Share Transactions.
Share transactions for each class were as follows and may contain in-kind transactions, automatic conversions between classes or exchanges between affiliated funds:
| Shares | Dollars | |
| Six months ended March 31, 2022(a) | Six months ended March 31, 2022(a) | |
| Fidelity Sustainable Multi-Asset Fund | ||
| Class A | ||
| Shares sold | 20,055 | $200,529 |
| Net increase (decrease) | 20,055 | $200,529 |
| Class M | ||
| Shares sold | 20,000 | $200,000 |
| Net increase (decrease) | 20,000 | $200,000 |
| Class C | ||
| Shares sold | 22,064 | $220,000 |
| Net increase (decrease) | 22,064 | $220,000 |
| Fidelity Sustainable Multi-Asset Fund | ||
| Shares sold | 135,992 | $1,314,398 |
| Shares redeemed | (2,573) | (24,955) |
| Net increase (decrease) | 133,419 | $1,289,443 |
| Class I | ||
| Shares sold | 25,291 | $250,000 |
| Net increase (decrease) | 25,291 | $250,000 |
(a) For the period February 10, 2022 (commencement of operations) through March 31, 2022.
7. Other.
A fund's organizational documents provide former and current trustees and officers with a limited indemnification against liabilities arising in connection with the performance of their duties to the fund. In the normal course of business, a fund may also enter into contracts that provide general indemnifications. A fund's maximum exposure under these arrangements is unknown as this would be dependent on future claims that may be made against a fund. The risk of material loss from such claims is considered remote.
Funds do not invest in underlying mutual funds for the purpose of exercising management or control; however, investments by funds within their principal investment strategies may represent a significant portion of the underlying mutual fund's net assets. At the end of the period, certain Funds were the owners of record of 10% or more of the total outstanding shares of the following underlying mutual funds as shown below.
| Fund | Affiliated % |
| Fidelity Sustainable International Equity Fund | 15% |
In addition, at the end of the period the investment adviser or its affiliates were owners of record of more than 10% of the outstanding shares of the following Funds:
| Fund | Affiliated % |
| Fidelity Sustainable Multi-Asset Fund | 45% |
8. Coronavirus (COVID-19) Pandemic.
An outbreak of COVID-19 first detected in China during December 2019 has since spread globally and was declared a pandemic by the World Health Organization during March 2020. Developments that disrupt global economies and financial markets, such as the COVID-19 pandemic, may magnify factors that affect the Fund's performance.
Shareholder Expense Example
As a shareholder, you incur two types of costs: (1) transaction costs, which may include sales charges (loads) on purchase payments or redemption proceeds, as applicable and (2) ongoing costs, which generally include management fees, distribution and/or service (12b-1) fees and other Fund expenses. This Example is intended to help you understand your ongoing costs (in dollars) of investing in a fund and to compare these costs with the ongoing costs of investing in other mutual funds.
The actual expense Example is based on an investment of $1,000 invested at the beginning of the period and held for the entire period (February 10, 2022 to March 31, 2022). The hypothetical expense Example is based on an investment of $1,000 invested for the one-half year period (October 1, 2021 to March 31, 2022).
Actual Expenses
The first line of the accompanying table provides information about actual account values and actual expenses. You may use the information in this line, together with the amount you invested, to estimate the expenses that you paid over the period. Simply divide your account value by $1,000.00 (for example, an $8,600 account value divided by $1,000.00 = 8.6), then multiply the result by the number in the first line for a class/Fund under the heading entitled "Expenses Paid During Period" to estimate the expenses you paid on your account during this period. If any fund is a shareholder of any underlying mutual funds or exchange-traded funds (ETFs) (the Underlying Funds), such fund indirectly bears its proportional share of the expenses of the Underlying Funds in addition to the direct expenses incurred presented in the table. These fees and expenses are not included in the annualized expense ratio used to calculate the expense estimate in the table below.
Hypothetical Example for Comparison Purposes
The second line of the accompanying table provides information about hypothetical account values and hypothetical expenses based on the actual expense ratio and an assumed rate of return of 5% per year before expenses, which is not the actual return. The hypothetical account values and expenses may not be used to estimate the actual ending account balance or expenses you paid for the period. You may use this information to compare the ongoing costs of investing in the Fund and other funds. To do so, compare this 5% hypothetical example with the 5% hypothetical examples that appear in the shareholder reports of the other funds. If any fund is a shareholder of any Underlying Funds, such fund indirectly bears its proportional share of the expenses of the Underlying Funds in addition to the direct expenses as presented in the table. These fees and expenses are not included in the annualized expense ratio used to calculate the expense estimate in the table below.
Please note that the expenses shown in the table are meant to highlight your ongoing costs only and do not reflect any transaction costs. Therefore, the second line of the table is useful in comparing ongoing costs only, and will not help you determine the relative total costs of owning different funds. In addition, if these transactional costs were included, your costs would have been higher.
| Annualized Expense Ratio-A | Beginning Account Value | Ending Account Value March 31, 2022 | Expenses Paid During Period |
|
| Fidelity Sustainable Multi-Asset Fund | ||||
| Class A | .30% | |||
| Actual | $1,000.00 | $970.00 | $.40-B | |
| Hypothetical-C | $1,000.00 | $1,023.44 | $1.51-D | |
| Class M | .55% | |||
| Actual | $1,000.00 | $970.00 | $.74-B | |
| Hypothetical-C | $1,000.00 | $1,022.19 | $2.77-D | |
| Class C | 1.05% | |||
| Actual | $1,000.00 | $969.00 | $1.42-B | |
| Hypothetical-C | $1,000.00 | $1,019.70 | $5.29-D | |
| Fidelity Sustainable Multi-Asset Fund | .05% | |||
| Actual | $1,000.00 | $970.00 | $.07-B | |
| Hypothetical-C | $1,000.00 | $1,024.68 | $.25-D | |
| Class I | .05% | |||
| Actual | $1,000.00 | $970.00 | $.07-B | |
| Hypothetical-C | $1,000.00 | $1,024.68 | $.25-D |
A Annualized expense ratio reflects expenses net of applicable fee waivers.
B Actual expenses are equal to the annualized expense ratio, multiplied by the average account value over the period, multiplied by 50/365 (to reflect the period February 10, 2022 to March 31, 2022).
C 5% return per year before expenses
D Hypothetical expenses are equal to the annualized expense ratio, multiplied by the average account value over the period, multiplied by 182/365 (to reflect the one-half year period).
Board Approval of Investment Advisory Contracts and Management Fees
Fidelity Sustainable Multi-Asset Fund
At its November 2021 meeting, the Board of Trustees, including the Independent Trustees (together, the Board), voted to approve the management contract (the Advisory Contract) with Fidelity Management & Research Company LLC (FMR) for the fund. The Board, assisted by the advice of fund counsel and Independent Trustees' counsel, considered a broad range of information. Nature, Extent, and Quality of Services Provided. The Board considered Fidelity's staffing as it relates to the fund, including the backgrounds of investment personnel of FMR, which the Board is familiar with through its supervision of other Fidelity asset allocation funds, and also considered the fund's investment objective, strategies, and related investment philosophy. The Board considered the structure of the investment personnel compensation program and whether this structure provides appropriate incentives to act in the best interests of the fund. The Board also considered the steps Fidelity had taken to ensure the continued provision of high quality services to the Fidelity funds during the COVID-19 pandemic, including the expansion of staff in client facing positions to maintain service levels in periods of high volumes and volatility. Resources Dedicated to Investment Management and Support Services. The Board reviewed the general qualifications and capabilities of Fidelity’s investment staff, including its size, education, experience, and resources, as well as Fidelity’s approach to recruiting, training, managing, and compensating investment personnel. The Board noted the resources devoted to Fidelity’s global investment organization and that Fidelity’s analysts have extensive resources, tools and capabilities that allow them to conduct sophisticated quantitative and fundamental analysis, as well as credit analysis of issuers, counterparties and guarantors. Further, the Board considered that Fidelity’s investment professionals have sufficient access to global information and data so as to provide competitive investment results over time, and that those professionals also have access to sophisticated tools that permit them to assess portfolio construction and risk and performance attribution characteristics continuously, as well as to transmit new information and research conclusions rapidly around the world. Additionally, in its deliberations, the Board considered Fidelity’s risk management, compliance, cybersecurity and technology and operations capabilities and resources, which are integral parts of the investment management process. Shareholder and Administrative Services. The Board considered (i) the nature, extent, quality, and cost of advisory, administrative, and shareholder services to be performed by Fidelity under the Advisory Contract and under separate agreements covering transfer agency and pricing and bookkeeping services for the fund; (ii) the nature and extent of the supervision of third party service providers, principally custodians, subcustodians, and pricing vendors; and (iii) the resources devoted to, and the record of compliance with, the Fidelity funds' compliance policies and proceduresThe Board noted that the growth of fund assets over time across the complex allows Fidelity to reinvest in the development of services designed to enhance the value and convenience of the Fidelity funds as investment vehicles. These services include 24-hour access to account information and market information over the Internet and through telephone representatives, investor education materials and asset allocation tools. The Board also considered that it reviews customer service metrics such as telephone response times, continuity of services on the website and metrics addressing services at Fidelity Investor Centers. Investment Performance. The fund is a new fund and therefore had no historical performance for the Board to review at the time it approved the fund's Advisory Contract. The Board considered FMR's strength in managing asset allocation funds, which the Board is familiar with through its supervision of other Fidelity funds.Based on its review, the Board concluded that the nature, extent, and quality of services to be provided to the fund under the Advisory Contract should benefit the shareholders of the fund. Competitiveness of Management Fee and Total Expense Ratio. In reviewing the Advisory Contract, the Board considered the fund’s proposed class-level management fee rate out of which FMR will pay all operating expenses of the fund, with certain limited exceptions, and the projected total expense ratio of each class of the fund. The Board noted that the fund’s proposed management fee rate is below the median fee rate of funds with similar Lipper investment objective categories and comparable investment mandates, regardless of whether their management fee structures are comparable. The Board considered that the fund has a unitary fee that covers expenses beyond the management fee whereas the majority of competitive funds do not have unitary fees. The Board also considered that after the effect of the contractual expense arrangement discussed below, which unless renewed by the Board expires on January 31, 2024, the projected total expense ratio of each class of the fund is below the median of those funds and classes used by the Board for management fee comparisons that have a similar sales load structure, with the competitors’ total net expenses including acquired fund fees and expenses.The Board considered that the proposed contractual arrangements for the fund oblige FMR to pay all "class-level" expenses of each class of the fund to the extent necessary to limit total operating expenses, with certain exceptions, to an amount specified in the applicable expense contract. This contractual arrangement may not be amended to increase the fees or expenses payable by each class of the fund except by a vote of a majority of the Board of Trustees of the fund.Based on its review, the Board concluded that the management fee and the projected total expense ratio of each class of the fund were reasonable in light of the services that the fund and its shareholders will receive and the other factors considered. Costs of the Services and Profitability. The fund is a new fund and therefore no revenue, cost, or profitability data was available for the Board to review at the time it approved the Advisory Contract. In connection with its future renewal of the fund's Advisory Contract, the Board will consider the revenues earned and the expenses incurred by Fidelity in conducting the business of developing, marketing, distributing, managing, administering and servicing the fund and servicing the fund's shareholders. Economies of Scale. The Board will consider economies of scale when there is operating experience to permit assessment thereof. It noted that, notwithstanding the entrepreneurial risk associated with a new fund, the management fee was at a level normally associated, by comparison with competitors, with very high fund net assets, and Fidelity asserted to the Board that the level of the fee anticipated economies of scale at lower asset levels even before, if ever, economies of scale are achieved. The Board also noted that the fund and its shareholders would have access to the very considerable number and variety of services available through Fidelity and its affiliates.Based on its evaluation of all of the conclusions noted above, and after considering all factors it believed relevant, the Board concluded that the advisory fee arrangements are fair and reasonable, and that the fund's Advisory Contract should be approved.
![]()
MAF-SANN-0522
1.9904617.100
Moderate with Income Allocation Fund
Balanced Allocation Fund
Growth Allocation Fund
Aggressive Growth Allocation Fund
Semi-Annual Report
March 31, 2022
Contents
|
Moderate with Income Allocation Fund | |
|
Balanced Allocation Fund | |
|
Growth Allocation Fund | |
|
Aggressive Growth Allocation Fund | |
|
Board Approval of Investment Advisory Contracts and Management Fees |
To view a fund's proxy voting guidelines and proxy voting record for the 12-month period ended June 30, visit http://www.fidelity.com/proxyvotingresults or visit the Securities and Exchange Commission's (SEC) web site at http://www.sec.gov.
You may also call 1-800-835-5092 to request a free copy of the proxy voting guidelines.
Standard & Poor's, S&P and S&P 500 are registered service marks of The McGraw-Hill Companies, Inc. and have been licensed for use by Fidelity Distributors Corporation.
Other third-party marks appearing herein are the property of their respective owners.
All other marks appearing herein are registered or unregistered trademarks or service marks of FMR LLC or an affiliated company. © 2022 FMR LLC. All rights reserved.
This report and the financial statements contained herein are submitted for the general information of the shareholders of the Funds. This report is not authorized for distribution to prospective investors in the Funds unless preceded or accompanied by an effective prospectus.
A fund files its complete schedule of portfolio holdings with the SEC for the first and third quarters of each fiscal year on Form N-PORT. Forms N-PORT are available on the SEC’s web site at http://www.sec.gov. A fund's Forms N-PORT may be reviewed and copied at the SEC’s Public Reference Room in Washington, DC. Information regarding the operation of the SEC's Public Reference Room may be obtained by calling 1-800-SEC-0330.
For a complete list of a fund's portfolio holdings, view the most recent holdings listing, semiannual report, or annual report on Fidelity's web site at http://www.fidelity.com, http://www.institutional.fidelity.com, or http://www.401k.com, as applicable.
NOT FDIC INSURED •MAY LOSE VALUE •NO BANK GUARANTEE
Neither the Funds nor Fidelity Distributors Corporation is a bank.
Note to Shareholders:
Early in 2020, the outbreak and spread of COVID-19 emerged as a public health emergency that had a major influence on financial markets, primarily based on its impact on the global economy and corporate earnings. On March 11, 2020, the World Health Organization declared the COVID-19 outbreak a pandemic, citing sustained risk of further global spread. The pandemic prompted a number of measures to limit the spread of COVID-19, including travel and border restrictions, quarantines, and restrictions on large gatherings. In turn, these resulted in lower consumer activity, diminished demand for a wide range of products and services, disruption in manufacturing and supply chains, and – given the wide variability in outcomes regarding the outbreak – significant market uncertainty and volatility. To help stem the turmoil, the U.S. government took unprecedented action – in concert with the U.S. Federal Reserve and central banks around the world – to help support consumers, businesses, and the broader economy, and to limit disruption to the financial system.
In general, the overall impact of the pandemic lessened in 2021, amid a resilient economy and widespread distribution of three COVID-19 vaccines granted emergency use authorization from the U.S. Food and Drug Administration (FDA) early in the year. Still, the situation remains dynamic, and the extent and duration of its influence on financial markets and the economy is highly uncertain, due in part to a recent spike in cases based on highly contagious variants of the coronavirus.
Extreme events such as the COVID-19 crisis are exogenous shocks that can have significant adverse effects on mutual funds and their investments. Although multiple asset classes may be affected by market disruption, the duration and impact may not be the same for all types of assets. Fidelity is committed to helping you stay informed amid news about COVID-19 and during increased market volatility, and we continue to take extra steps to be responsive to customer needs. We encourage you to visit us online, where we offer ongoing updates, commentary, and analysis on the markets and our funds.
Moderate with Income Allocation Fund
Investment Summary (Unaudited)
The information in the following tables is based on the direct investments of the Fund.Top Holdings as of March 31, 2022
| % of fund's net assets | |
| Fidelity U.S. Bond Index Fund | 50.0 |
| Fidelity Total Market Index Fund | 21.0 |
| Fidelity Short-Term Bond Index Fund | 20.0 |
| Fidelity Total International Index Fund | 9.0 |
| 100.0 |
Asset Allocation (% of fund's net assets)
| Period end | ||
| Domestic Equity Funds | 21.0% | |
| International Equity Funds | 9.0% | |
| Bond Funds | 70.0% | |

Moderate with Income Allocation Fund
Schedule of Investments March 31, 2022 (Unaudited)
Showing Percentage of Net Assets
| Domestic Equity Funds - 21.0% | |||
| Shares | Value | ||
| Fidelity Total Market Index Fund (a) | |||
| (Cost $25,559) | 202 | 25,550 | |
| International Equity Funds - 9.0% | |||
| Fidelity Total International Index Fund (a) | |||
| (Cost $11,462) | 814 | 10,950 | |
| Bond Funds - 70.0% | |||
| Fidelity Short-Term Bond Index Fund (a) | 2,491 | 24,333 | |
| Fidelity U.S. Bond Index Fund (a) | 5,422 | 60,832 | |
| TOTAL BOND FUNDS | |||
| (Cost $87,442) | 85,165 | ||
| TOTAL INVESTMENT IN SECURITIES - 100.0% | |||
| (Cost $124,463) | 121,665 | ||
| NET OTHER ASSETS (LIABILITIES) - 0.0% | 0 | ||
| NET ASSETS - 100% | $121,665 |
Legend
(a) Affiliated Fund
Affiliated Central Funds
Fiscal year to date information regarding the Fund's investments in Fidelity Central Funds, including the ownership percentage, is presented below.
| Fund | Value, beginning of period | Purchases | Sales Proceeds | Dividend Income | Realized Gain/Loss | Change in Unrealized appreciation (depreciation) | Value, end of period | % ownership, end of period |
| Fidelity Cash Central Fund 0.31% | $-- | $100,000 | $100,000 | $-- | $-- | $-- | $-- | 0.0% |
| Total | $-- | $100,000 | $100,000 | $-- | $-- | $-- | $-- |
Amounts in the income column in the above table include any capital gain distributions from underlying funds, which are presented in the corresponding line-item in the Statement of Operations, if applicable.
Affiliated Underlying Funds
Fiscal year to date information regarding the Fund's investments in affiliated Underlying Funds is presented below. Exchanges between classes of the same affiliated Underlying Funds may occur. If an underlying Fund changes its name, the name presented below is the name in effect at period end.
| Affiliate | Value, beginning of period | Purchases | Sales Proceeds | Dividend Income | Realized Gain (loss) | Change in Unrealized appreciation (depreciation) | Value, end of period |
| Fidelity Short-Term Bond Index Fund | $-- | $25,100 | $292 | $24 | $-- | $(475) | $24,333 |
| Fidelity Total International Index Fund | -- | 11,545 | 78 | -- | (5) | (512) | 10,950 |
| Fidelity Total Market Index Fund | -- | 26,738 | 1,161 | -- | (17) | (10) | 25,550 |
| Fidelity U.S. Bond Index Fund | -- | 63,333 | 699 | 154 | (1) | (1,801) | 60,832 |
| Total | $-- | $126,716 | $2,230 | $178 | $(23) | $(2,798) | $121,665 |
Amounts in the income column in the above table include any capital gain distributions from underlying funds, which are presented in the corresponding line-item in the Statement of Operations, if applicable.
Investment Valuation
The following is a summary of the inputs used, as of March 31, 2022, involving the Fund's assets and liabilities carried at fair value. The inputs or methodology used for valuing securities may not be an indication of the risk associated with investing in those securities. For more information on valuation inputs, and their aggregation into the levels used below, please refer to the Investment Valuation section in the accompanying Notes to Financial Statements.
| Valuation Inputs at Reporting Date: | ||||
| Description | Total | Level 1 | Level 2 | Level 3 |
| Investments in Securities: | ||||
| Domestic Equity Funds | $25,550 | $25,550 | $-- | $-- |
| International Equity Funds | 10,950 | 10,950 | -- | -- |
| Bond Funds | 85,165 | 85,165 | -- | -- |
| Total Investments in Securities: | $121,665 | $121,665 | $-- | $-- |
See accompanying notes which are an integral part of the financial statements.
Moderate with Income Allocation Fund
Financial Statements
Statement of Assets and Liabilities
| March 31, 2022 (Unaudited) | ||
| Assets | ||
| Investment in securities, at value (cost $124,463) — See accompanying schedule | $121,665 | |
| Receivable for investments sold | 1,237 | |
| Total assets | 122,902 | |
| Liabilities | ||
| Payable for investments purchased | $1,237 | |
| Total liabilities | 1,237 | |
| Net Assets | $121,665 | |
| Net Assets consist of: | ||
| Paid in capital | $124,345 | |
| Total accumulated earnings (loss) | (2,680) | |
| Net Assets | $121,665 | |
| Net Asset Value, offering price and redemption price per share ($121,665 ÷ 12,484 shares) | $9.75 |
See accompanying notes which are an integral part of the financial statements.
Statement of Operations
| For the period February 9, 2022 (commencement of operations) through March 31, 2022 (Unaudited) |
||
| Investment Income | ||
| Dividends (including $178 earned from affiliated issuers) | $178 | |
| Expenses | ||
| Management fee | $16 | |
| Total expenses before reductions | 16 | |
| Expense reductions | (16) | |
| Net investment income (loss) | 178 | |
| Realized and Unrealized Gain (Loss) | ||
| Realized gain (loss) on sale of underlying fund shares | (23) | |
| Total net realized gain (loss) | (23) | |
| Change in net unrealized appreciation (depreciation) on investment securities | (2,798) | |
| Net gain (loss) | (2,821) | |
| Net increase (decrease) in net assets resulting from operations | $(2,643) |
See accompanying notes which are an integral part of the financial statements.
Statement of Changes in Net Assets
| For the period February 9, 2022 (commencement of operations) through March 31, 2022 (Unaudited) |
|
| Increase (Decrease) in Net Assets | |
| Operations | |
| Net investment income (loss) | $178 |
| Net realized gain (loss) | (23) |
| Change in net unrealized appreciation (depreciation) | (2,798) |
| Net increase (decrease) in net assets resulting from operations | (2,643) |
| Distributions to shareholders | (37) |
| Share transactions | |
| Proceeds from sales of shares | 124,313 |
| Reinvestment of distributions | 37 |
| Cost of shares redeemed | (5) |
| Net increase (decrease) in net assets resulting from share transactions | 124,345 |
| Total increase (decrease) in net assets | 121,665 |
| Net Assets | |
| Beginning of period | – |
| End of period | $121,665 |
| Other Information | |
| Shares | |
| Sold | 12,481 |
| Issued in reinvestment of distributions | 4 |
| Redeemed | (1) |
| Net increase (decrease) | 12,484 |
See accompanying notes which are an integral part of the financial statements.
Financial Highlights
Moderate with Income Allocation Fund
| Six months ended (Unaudited) March 31, | |
| 2022 A | |
| Selected Per–Share Data | |
| Net asset value, beginning of period | $10.00 |
| Income from Investment Operations | |
| Net investment income (loss)B,C | .02 |
| Net realized and unrealized gain (loss) | (.27) |
| Total from investment operations | (.25) |
| Distributions from net investment income | –D |
| Total distributions | –D |
| Net asset value, end of period | $9.75 |
| Total ReturnE,F | (2.47)% |
| Ratios to Average Net AssetsC,G,H | |
| Expenses before reductions | .10%I |
| Expenses net of fee waivers, if any | - %I |
| Expenses net of all reductions | - %I |
| Net investment income (loss) | 1.11%I |
| Supplemental Data | |
| Net assets, end of period (000 omitted) | $122 |
| Portfolio turnover rateJ | 2%K |
A For the period February 9, 2022 (commencement of operations) through March 31, 2022.
B Calculated based on average shares outstanding during the period.
C Net investment income (loss) is affected by the timing of the declaration of dividends by any underlying mutual funds or exchange-traded funds (ETFs). Net investment income (loss) of any such underlying funds is not included in the Fund's net investment income (loss) ratio.
D Amount represents less than $.005 per share.
E Total returns for periods of less than one year are not annualized.
F Total returns would have been lower if certain expenses had not been reduced during the applicable periods shown.
G Fees and expenses of any underlying mutual funds or exchange-traded funds (ETFs) are not included in the Fund's expense ratio. The Fund indirectly bears its proportionate share of these expenses.
H Expense ratios reflect operating expenses of the class. Expenses before reductions do not reflect amounts reimbursed, waived, or reduced through arrangements with the investment adviser, brokerage services, or other offset arrangements, if applicable, and do not represent the amount paid by the class during periods when reimbursements, waivers or reductions occur.
I Annualized
J Amount does not include the portfolio activity of any underlying mutual funds or exchange-traded funds (ETFs).
K Amount not annualized.
See accompanying notes which are an integral part of the financial statements.
Balanced Allocation Fund
Investment Summary (Unaudited)
The information in the following tables is based on the direct investments of the Fund.Top Holdings as of March 31, 2022
| % of fund's net assets | |
| Fidelity U.S. Bond Index Fund | 40.0 |
| Fidelity Total Market Index Fund | 35.0 |
| Fidelity Total International Index Fund | 15.0 |
| Fidelity Short-Term Bond Index Fund | 10.0 |
| 100.0 |
Asset Allocation (% of fund's net assets)
| Period end | ||
| Domestic Equity Funds | 35.0% | |
| International Equity Funds | 15.0% | |
| Bond Funds | 50.0% | |

Balanced Allocation Fund
Schedule of Investments March 31, 2022 (Unaudited)
Showing Percentage of Net Assets
| Domestic Equity Funds - 35.0% | |||
| Shares | Value | ||
| Fidelity Total Market Index Fund (a) | |||
| (Cost $63,074) | 504 | 63,806 | |
| International Equity Funds - 15.0% | |||
| Fidelity Total International Index Fund (a) | |||
| (Cost $28,234) | 2,033 | 27,346 | |
| Bond Funds - 50.0% | |||
| Fidelity Short-Term Bond Index Fund (a) | 1,866 | 18,230 | |
| Fidelity U.S. Bond Index Fund (a) | 6,499 | 72,922 | |
| TOTAL BOND FUNDS | |||
| (Cost $93,303) | 91,152 | ||
| TOTAL INVESTMENT IN SECURITIES - 100.0% | |||
| (Cost $184,611) | 182,304 | ||
| NET OTHER ASSETS (LIABILITIES) - 0.0% | 1 | ||
| NET ASSETS - 100% | $182,305 |
Legend
(a) Affiliated Fund
Affiliated Central Funds
Fiscal year to date information regarding the Fund's investments in Fidelity Central Funds, including the ownership percentage, is presented below.
| Fund | Value, beginning of period | Purchases | Sales Proceeds | Dividend Income | Realized Gain/Loss | Change in Unrealized appreciation (depreciation) | Value, end of period | % ownership, end of period |
| Fidelity Cash Central Fund 0.31% | $-- | $100,000 | $100,000 | $-- | $-- | $-- | $-- | 0.0% |
| Total | $-- | $100,000 | $100,000 | $-- | $-- | $-- | $-- |
Amounts in the income column in the above table include any capital gain distributions from underlying funds, which are presented in the corresponding line-item in the Statement of Operations, if applicable.
Affiliated Underlying Funds
Fiscal year to date information regarding the Fund's investments in affiliated Underlying Funds is presented below. Exchanges between classes of the same affiliated Underlying Funds may occur. If an underlying Fund changes its name, the name presented below is the name in effect at period end.
| Affiliate | Value, beginning of period | Purchases | Sales Proceeds | Dividend Income | Realized Gain (loss) | Change in Unrealized appreciation (depreciation) | Value, end of period |
| Fidelity Short-Term Bond Index Fund | $-- | $18,783 | $240 | $15 | $-- | $(313) | $18,230 |
| Fidelity Total International Index Fund | -- | 28,276 | 40 | -- | (2) | (888) | 27,346 |
| Fidelity Total Market Index Fund | -- | 65,137 | 2,039 | -- | (25) | 733 | 63,806 |
| Fidelity U.S. Bond Index Fund | -- | 75,741 | 978 | 156 | (2) | (1,839) | 72,922 |
| Total | $-- | $187,937 | $3,297 | $171 | $(29) | $(2,307) | $182,304 |
Amounts in the income column in the above table include any capital gain distributions from underlying funds, which are presented in the corresponding line-item in the Statement of Operations, if applicable.
Investment Valuation
The following is a summary of the inputs used, as of March 31, 2022, involving the Fund's assets and liabilities carried at fair value. The inputs or methodology used for valuing securities may not be an indication of the risk associated with investing in those securities. For more information on valuation inputs, and their aggregation into the levels used below, please refer to the Investment Valuation section in the accompanying Notes to Financial Statements.
| Valuation Inputs at Reporting Date: | ||||
| Description | Total | Level 1 | Level 2 | Level 3 |
| Investments in Securities: | ||||
| Domestic Equity Funds | $63,806 | $63,806 | $-- | $-- |
| International Equity Funds | 27,346 | 27,346 | -- | -- |
| Bond Funds | 91,152 | 91,152 | -- | -- |
| Total Investments in Securities: | $182,304 | $182,304 | $-- | $-- |
See accompanying notes which are an integral part of the financial statements.
Balanced Allocation Fund
Financial Statements
Statement of Assets and Liabilities
| March 31, 2022 (Unaudited) | ||
| Assets | ||
| Investment in securities, at value (cost $184,611) — See accompanying schedule | $182,304 | |
| Receivable for investments sold | 2,079 | |
| Receivable for fund shares sold | 179 | |
| Total assets | 184,562 | |
| Liabilities | ||
| Payable for investments purchased | $2,257 | |
| Total liabilities | 2,257 | |
| Net Assets | $182,305 | |
| Net Assets consist of: | ||
| Paid in capital | $184,470 | |
| Total accumulated earnings (loss) | (2,165) | |
| Net Assets | $182,305 | |
| Net Asset Value, offering price and redemption price per share ($182,305 ÷ 18,703 shares) | $9.75 |
See accompanying notes which are an integral part of the financial statements.
Statement of Operations
| For the period February 9, 2022 (commencement of operations) through March 31, 2022 (Unaudited) |
||
| Investment Income | ||
| Dividends (including $171 earned from affiliated issuers) | $171 | |
| Expenses | ||
| Management fee | $20 | |
| Total expenses before reductions | 20 | |
| Expense reductions | (20) | |
| Net investment income (loss) | 171 | |
| Realized and Unrealized Gain (Loss) | ||
| Realized gain (loss) on sale of underlying fund shares | (29) | |
| Total net realized gain (loss) | (29) | |
| Change in net unrealized appreciation (depreciation) on investment securities | (2,307) | |
| Net gain (loss) | (2,336) | |
| Net increase (decrease) in net assets resulting from operations | $(2,165) |
See accompanying notes which are an integral part of the financial statements.
Statement of Changes in Net Assets
| For the period February 9, 2022 (commencement of operations) through March 31, 2022 (Unaudited) |
|
| Increase (Decrease) in Net Assets | |
| Operations | |
| Net investment income (loss) | $171 |
| Net realized gain (loss) | (29) |
| Change in net unrealized appreciation (depreciation) | (2,307) |
| Net increase (decrease) in net assets resulting from operations | (2,165) |
| Share transactions | |
| Proceeds from sales of shares | 186,475 |
| Cost of shares redeemed | (2,005) |
| Net increase (decrease) in net assets resulting from share transactions | 184,470 |
| Total increase (decrease) in net assets | 182,305 |
| Net Assets | |
| Beginning of period | – |
| End of period | $182,305 |
| Other Information | |
| Shares | |
| Sold | 18,909 |
| Redeemed | (206) |
| Net increase (decrease) | 18,703 |
See accompanying notes which are an integral part of the financial statements.
Financial Highlights
Balanced Allocation Fund
| Six months ended (Unaudited) March 31, | |
| 2022 A | |
| Selected Per–Share Data | |
| Net asset value, beginning of period | $10.00 |
| Income from Investment Operations | |
| Net investment income (loss)B,C | .01 |
| Net realized and unrealized gain (loss) | (.26) |
| Total from investment operations | (.25) |
| Net asset value, end of period | $9.75 |
| Total ReturnD,E | (2.50)% |
| Ratios to Average Net AssetsC,F,G | |
| Expenses before reductions | .10%H |
| Expenses net of fee waivers, if any | - %H |
| Expenses net of all reductions | - %H |
| Net investment income (loss) | .84%H |
| Supplemental Data | |
| Net assets, end of period (000 omitted) | $182 |
| Portfolio turnover rateI | 2%J |
A For the period February 9, 2022 (commencement of operations) through March 31, 2022.
B Calculated based on average shares outstanding during the period.
C Net investment income (loss) is affected by the timing of the declaration of dividends by any underlying mutual funds or exchange-traded funds (ETFs). Net investment income (loss) of any such underlying funds is not included in the Fund's net investment income (loss) ratio.
D Total returns for periods of less than one year are not annualized.
E Total returns would have been lower if certain expenses had not been reduced during the applicable periods shown.
F Fees and expenses of any underlying mutual funds or exchange-traded funds (ETFs) are not included in the Fund's expense ratio. The Fund indirectly bears its proportionate share of these expenses.
G Expense ratios reflect operating expenses of the class. Expenses before reductions do not reflect amounts reimbursed, waived, or reduced through arrangements with the investment adviser, brokerage services, or other offset arrangements, if applicable, and do not represent the amount paid by the class during periods when reimbursements, waivers or reductions occur.
H Annualized
I Amount does not include the portfolio activity of any underlying mutual funds or exchange-traded funds (ETFs).
J Amount not annualized.
See accompanying notes which are an integral part of the financial statements.
Growth Allocation Fund
Investment Summary (Unaudited)
The information in the following tables is based on the direct investments of the Fund.Top Holdings as of March 31, 2022
| % of fund's net assets | |
| Fidelity Total Market Index Fund | 49.0 |
| Fidelity U.S. Bond Index Fund | 25.0 |
| Fidelity Total International Index Fund | 21.0 |
| Fidelity Short-Term Bond Index Fund | 5.0 |
| 100.0 |
Asset Allocation (% of fund's net assets)
| Period end | ||
| Domestic Equity Funds | 49.0% | |
| International Equity Funds | 21.0% | |
| Bond Funds | 30.0% | |

Growth Allocation Fund
Schedule of Investments March 31, 2022 (Unaudited)
Showing Percentage of Net Assets
| Domestic Equity Funds - 49.0% | |||
| Shares | Value | ||
| Fidelity Total Market Index Fund (a) | |||
| (Cost $152,927) | 1,238 | 156,713 | |
| International Equity Funds - 21.0% | |||
| Fidelity Total International Index Fund (a) | |||
| (Cost $68,244) | 4,993 | 67,162 | |
| Bond Funds - 30.0% | |||
| Fidelity Short-Term Bond Index Fund (a) | 1,637 | 15,991 | |
| Fidelity U.S. Bond Index Fund (a) | 7,126 | 79,955 | |
| TOTAL BOND FUNDS | |||
| (Cost $98,105) | 95,946 | ||
| TOTAL INVESTMENT IN SECURITIES - 100.0% | |||
| (Cost $319,276) | 319,821 | ||
| NET OTHER ASSETS (LIABILITIES) - 0.0% | 1 | ||
| NET ASSETS - 100% | $319,822 |
Legend
(a) Affiliated Fund
Affiliated Central Funds
Fiscal year to date information regarding the Fund's investments in Fidelity Central Funds, including the ownership percentage, is presented below.
| Fund | Value, beginning of period | Purchases | Sales Proceeds | Dividend Income | Realized Gain/Loss | Change in Unrealized appreciation (depreciation) | Value, end of period | % ownership, end of period |
| Fidelity Cash Central Fund 0.31% | $-- | $100,000 | $100,000 | $-- | $-- | $-- | $-- | 0.0% |
| Total | $-- | $100,000 | $100,000 | $-- | $-- | $-- | $-- |
Amounts in the income column in the above table include any capital gain distributions from underlying funds, which are presented in the corresponding line-item in the Statement of Operations, if applicable.
Affiliated Underlying Funds
Fiscal year to date information regarding the Fund's investments in affiliated Underlying Funds is presented below. Exchanges between classes of the same affiliated Underlying Funds may occur. If an underlying Fund changes its name, the name presented below is the name in effect at period end.
| Affiliate | Value, beginning of period | Purchases | Sales Proceeds | Dividend Income | Realized Gain (loss) | Change in Unrealized appreciation (depreciation) | Value, end of period |
| Fidelity Short-Term Bond Index Fund | $-- | $16,335 | $79 | $12 | $-- | $(265) | $15,991 |
| Fidelity Total International Index Fund | -- | 68,245 | 1 | -- | -- | (1,082) | 67,162 |
| Fidelity Total Market Index Fund | -- | 156,444 | 3,474 | -- | (43) | 3,786 | 156,713 |
| Fidelity U.S. Bond Index Fund | -- | 82,301 | 452 | 146 | (1) | (1,894) | 79,955 |
| Total | $-- | $323,325 | $4,006 | $158 | $(44) | $545 | $319,821 |
Amounts in the income column in the above table include any capital gain distributions from underlying funds, which are presented in the corresponding line-item in the Statement of Operations, if applicable.
Investment Valuation
The following is a summary of the inputs used, as of March 31, 2022, involving the Fund's assets and liabilities carried at fair value. The inputs or methodology used for valuing securities may not be an indication of the risk associated with investing in those securities. For more information on valuation inputs, and their aggregation into the levels used below, please refer to the Investment Valuation section in the accompanying Notes to Financial Statements.
| Valuation Inputs at Reporting Date: | ||||
| Description | Total | Level 1 | Level 2 | Level 3 |
| Investments in Securities: | ||||
| Domestic Equity Funds | $156,713 | $156,713 | $-- | $-- |
| International Equity Funds | 67,162 | 67,162 | -- | -- |
| Bond Funds | 95,946 | 95,946 | -- | -- |
| Total Investments in Securities: | $319,821 | $319,821 | $-- | $-- |
See accompanying notes which are an integral part of the financial statements.
Growth Allocation Fund
Financial Statements
Statement of Assets and Liabilities
| March 31, 2022 (Unaudited) | ||
| Assets | ||
| Investment in securities, at value (cost $319,276) — See accompanying schedule | $319,821 | |
| Receivable for investments sold | 3,472 | |
| Receivable for fund shares sold | 419 | |
| Total assets | 323,712 | |
| Liabilities | ||
| Payable for investments purchased | $3,890 | |
| Total liabilities | 3,890 | |
| Net Assets | $319,822 | |
| Net Assets consist of: | ||
| Paid in capital | $319,163 | |
| Total accumulated earnings (loss) | 659 | |
| Net Assets | $319,822 | |
| Net Asset Value, offering price and redemption price per share ($319,822 ÷ 32,808 shares) | $9.75 |
See accompanying notes which are an integral part of the financial statements.
Statement of Operations
| For the period February 9, 2022 (commencement of operations) through March 31, 2022 (Unaudited) |
||
| Investment Income | ||
| Dividends (including $158 earned from affiliated issuers) | $158 | |
| Expenses | ||
| Management fee | $30 | |
| Total expenses before reductions | 30 | |
| Expense reductions | (30) | |
| Net investment income (loss) | 158 | |
| Realized and Unrealized Gain (Loss) | ||
| Realized gain (loss) on sale of underlying fund shares | (44) | |
| Total net realized gain (loss) | (44) | |
| Change in net unrealized appreciation (depreciation) on investment securities | 545 | |
| Net gain (loss) | 501 | |
| Net increase (decrease) in net assets resulting from operations | $659 |
See accompanying notes which are an integral part of the financial statements.
Statement of Changes in Net Assets
| For the period February 9, 2022 (commencement of operations) through March 31, 2022 (Unaudited) |
|
| Increase (Decrease) in Net Assets | |
| Operations | |
| Net investment income (loss) | $158 |
| Net realized gain (loss) | (44) |
| Change in net unrealized appreciation (depreciation) | 545 |
| Net increase (decrease) in net assets resulting from operations | 659 |
| Share transactions | |
| Proceeds from sales of shares | 319,618 |
| Cost of shares redeemed | (455) |
| Net increase (decrease) in net assets resulting from share transactions | 319,163 |
| Total increase (decrease) in net assets | 319,822 |
| Net Assets | |
| Beginning of period | – |
| End of period | $319,822 |
| Other Information | |
| Shares | |
| Sold | 32,857 |
| Redeemed | (49) |
| Net increase (decrease) | 32,808 |
See accompanying notes which are an integral part of the financial statements.
Financial Highlights
Growth Allocation Fund
| Six months ended (Unaudited) March 31, | |
| 2022 A | |
| Selected Per–Share Data | |
| Net asset value, beginning of period | $10.00 |
| Income from Investment Operations | |
| Net investment income (loss)B,C | .01 |
| Net realized and unrealized gain (loss) | (.26)D |
| Total from investment operations | (.25) |
| Net asset value, end of period | $9.75 |
| Total ReturnE,F | (2.50)% |
| Ratios to Average Net AssetsC,G,H | |
| Expenses before reductions | .10%I |
| Expenses net of fee waivers, if any | - %I |
| Expenses net of all reductions | - %I |
| Net investment income (loss) | .51%I |
| Supplemental Data | |
| Net assets, end of period (000 omitted) | $320 |
| Portfolio turnover rateJ | 2%K |
A For the period February 9, 2022 (commencement of operations) through March 31, 2022.
B Calculated based on average shares outstanding during the period.
C Net investment income (loss) is affected by the timing of the declaration of dividends by any underlying mutual funds or exchange-traded funds (ETFs). Net investment income (loss) of any such underlying funds is not included in the Fund's net investment income (loss) ratio.
D The amount shown for a share outstanding does not correspond with the aggregate net gain (loss) on investments for the period due to the timing of sales and repurchases of shares in relation to fluctuating market values of the investments of the Fund.
E Total returns for periods of less than one year are not annualized.
F Total returns would have been lower if certain expenses had not been reduced during the applicable periods shown.
G Fees and expenses of any underlying mutual funds or exchange-traded funds (ETFs) are not included in the Fund's expense ratio. The Fund indirectly bears its proportionate share of these expenses.
H Expense ratios reflect operating expenses of the class. Expenses before reductions do not reflect amounts reimbursed, waived, or reduced through arrangements with the investment adviser, brokerage services, or other offset arrangements, if applicable, and do not represent the amount paid by the class during periods when reimbursements, waivers or reductions occur.
I Annualized
J Amount does not include the portfolio activity of any underlying mutual funds or exchange-traded funds (ETFs).
K Amount not annualized.
See accompanying notes which are an integral part of the financial statements.
Aggressive Growth Allocation Fund
Investment Summary (Unaudited)
The information in the following tables is based on the direct investments of the Fund.Top Holdings as of March 31, 2022
| % of fund's net assets | |
| Fidelity Total Market Index Fund | 60.0 |
| Fidelity Total International Index Fund | 25.0 |
| Fidelity U.S. Bond Index Fund | 15.0 |
| 100.0 |
Asset Allocation (% of Portfolio's net assets)
Asset Allocation (% of fund's net assets)
| Period end | ||
| Domestic Equity Funds | 60.0% | |
| International Equity Funds | 25.0% | |
| Bond Funds | 15.0% | |

Aggressive Growth Allocation Fund
Schedule of Investments March 31, 2022 (Unaudited)
Showing Percentage of Net Assets
| Domestic Equity Funds - 60.0% | |||
| Shares | Value | ||
| Fidelity Total Market Index Fund (a) | |||
| (Cost $161,972) | 1,308 | 165,497 | |
| International Equity Funds - 25.0% | |||
| Fidelity Total International Index Fund (a) | |||
| (Cost $70,092) | 5,127 | 68,957 | |
| Bond Funds - 15.0% | |||
| Fidelity U.S. Bond Index Fund (a) | |||
| (Cost $42,291) | 3,688 | 41,374 | |
| TOTAL INVESTMENT IN SECURITIES - 100.0% | |||
| (Cost $274,355) | 275,828 | ||
| NET OTHER ASSETS (LIABILITIES) - 0.0% | 0 | ||
| NET ASSETS - 100% | $275,828 |
Legend
(a) Affiliated Fund
Affiliated Central Funds
Fiscal year to date information regarding the Fund's investments in Fidelity Central Funds, including the ownership percentage, is presented below.
| Fund | Value, beginning of period | Purchases | Sales Proceeds | Dividend Income | Realized Gain/Loss | Change in Unrealized appreciation (depreciation) | Value, end of period | % ownership, end of period |
| Fidelity Cash Central Fund 0.31% | $-- | $100,000 | $100,000 | $-- | $-- | $-- | $-- | 0.0% |
| Total | $-- | $100,000 | $100,000 | $-- | $-- | $-- | $-- |
Amounts in the income column in the above table include any capital gain distributions from underlying funds, which are presented in the corresponding line-item in the Statement of Operations, if applicable.
Affiliated Underlying Funds
Fiscal year to date information regarding the Fund's investments in affiliated Underlying Funds is presented below. Exchanges between classes of the same affiliated Underlying Funds may occur. If an underlying Fund changes its name, the name presented below is the name in effect at period end.
| Affiliate | Value, beginning of period | Purchases | Sales Proceeds | Dividend Income | Realized Gain (loss) | Change in Unrealized appreciation (depreciation) | Value, end of period |
| Fidelity Total International Index Fund | $-- | $70,092 | $-- | $-- | $-- | $(1,135) | $68,957 |
| Fidelity Total Market Index Fund | -- | 161,972 | -- | -- | -- | 3,525 | 165,497 |
| Fidelity U.S. Bond Index Fund | -- | 42,872 | 580 | 75 | (1) | (917) | 41,374 |
| Total | $-- | $274,936 | $580 | $75 | $(1) | $1,473 | $275,828 |
Amounts in the income column in the above table include any capital gain distributions from underlying funds, which are presented in the corresponding line-item in the Statement of Operations, if applicable.
Investment Valuation
The following is a summary of the inputs used, as of March 31, 2022, involving the Fund's assets and liabilities carried at fair value. The inputs or methodology used for valuing securities may not be an indication of the risk associated with investing in those securities. For more information on valuation inputs, and their aggregation into the levels used below, please refer to the Investment Valuation section in the accompanying Notes to Financial Statements.
| Valuation Inputs at Reporting Date: | ||||
| Description | Total | Level 1 | Level 2 | Level 3 |
| Investments in Securities: | ||||
| Domestic Equity Funds | $165,497 | $165,497 | $-- | $-- |
| International Equity Funds | 68,957 | 68,957 | -- | -- |
| Bond Funds | 41,374 | 41,374 | -- | -- |
| Total Investments in Securities: | $275,828 | $275,828 | $-- | $-- |
See accompanying notes which are an integral part of the financial statements.
Aggressive Growth Allocation Fund
Financial Statements
Statement of Assets and Liabilities
| March 31, 2022 (Unaudited) | ||
| Assets | ||
| Investment in securities, at value (cost $274,355) — See accompanying schedule | $275,828 | |
| Receivable for fund shares sold | 6,715 | |
| Total assets | 282,543 | |
| Liabilities | ||
| Payable for investments purchased | $6,615 | |
| Payable for fund shares redeemed | 100 | |
| Total liabilities | 6,715 | |
| Net Assets | $275,828 | |
| Net Assets consist of: | ||
| Paid in capital | $274,281 | |
| Total accumulated earnings (loss) | 1,547 | |
| Net Assets | $275,828 | |
| Net Asset Value, offering price and redemption price per share ($275,828 ÷ 28,287 shares) | $9.75 |
See accompanying notes which are an integral part of the financial statements.
Statement of Operations
| For the period February 9, 2022 (commencement of operations) through March 31, 2022 (Unaudited) |
||
| Investment Income | ||
| Dividends (including $75 earned from affiliated issuers) | $75 | |
| Expenses | ||
| Management fee | $26 | |
| Total expenses before reductions | 26 | |
| Expense reductions | (26) | |
| Net investment income (loss) | 75 | |
| Realized and Unrealized Gain (Loss) | ||
| Realized gain (loss) on sale of underlying fund shares | (1) | |
| Total net realized gain (loss) | (1) | |
| Change in net unrealized appreciation (depreciation) on investment securities | 1,473 | |
| Net gain (loss) | 1,472 | |
| Net increase (decrease) in net assets resulting from operations | $1,547 |
See accompanying notes which are an integral part of the financial statements.
Statement of Changes in Net Assets
| For the period February 9, 2022 (commencement of operations) through March 31, 2022 (Unaudited) |
|
| Increase (Decrease) in Net Assets | |
| Operations | |
| Net investment income (loss) | $75 |
| Net realized gain (loss) | (1) |
| Change in net unrealized appreciation (depreciation) | 1,473 |
| Net increase (decrease) in net assets resulting from operations | 1,547 |
| Share transactions | |
| Proceeds from sales of shares | 274,386 |
| Cost of shares redeemed | (105) |
| Net increase (decrease) in net assets resulting from share transactions | 274,281 |
| Total increase (decrease) in net assets | 275,828 |
| Net Assets | |
| Beginning of period | – |
| End of period | $275,828 |
| Other Information | |
| Shares | |
| Sold | 28,298 |
| Redeemed | (11) |
| Net increase (decrease) | 28,287 |
See accompanying notes which are an integral part of the financial statements.
Financial Highlights
Aggressive Growth Allocation Fund
| Six months ended (Unaudited) March 31, | |
| 2022 A | |
| Selected Per–Share Data | |
| Net asset value, beginning of period | $10.00 |
| Income from Investment Operations | |
| Net investment income (loss)B,C | –D |
| Net realized and unrealized gain (loss) | (.25)E |
| Total from investment operations | (.25) |
| Net asset value, end of period | $9.75 |
| Total ReturnF,G | (2.50)% |
| Ratios to Average Net AssetsC,H,I | |
| Expenses before reductions | .10%J |
| Expenses net of fee waivers, if any | - %J |
| Expenses net of all reductions | - %J |
| Net investment income (loss) | .28%J |
| Supplemental Data | |
| Net assets, end of period (000 omitted) | $276 |
| Portfolio turnover rateK | 0%L,M |
A For the period February 9, 2022 (commencement of operations) through March 31, 2022.
B Calculated based on average shares outstanding during the period.
C Net investment income (loss) is affected by the timing of the declaration of dividends by any underlying mutual funds or exchange-traded funds (ETFs). Net investment income (loss) of any such underlying funds is not included in the Fund's net investment income (loss) ratio.
D Amount represents less than $.005 per share.
E The amount shown for a share outstanding does not correspond with the aggregate net gain (loss) on investments for the period due to the timing of sales and repurchases of shares in relation to fluctuating market values of the investments of the Fund.
F Total returns for periods of less than one year are not annualized.
G Total returns would have been lower if certain expenses had not been reduced during the applicable periods shown.
H Fees and expenses of any underlying mutual funds or exchange-traded funds (ETFs) are not included in the Fund's expense ratio. The Fund indirectly bears its proportionate share of these expenses.
I Expense ratios reflect operating expenses of the class. Expenses before reductions do not reflect amounts reimbursed, waived, or reduced through arrangements with the investment adviser, brokerage services, or other offset arrangements, if applicable, and do not represent the amount paid by the class during periods when reimbursements, waivers or reductions occur.
J Annualized
K Amount does not include the portfolio activity of any underlying mutual funds or exchange-traded funds (ETFs).
L Amount not annualized.
M Amount represents less than .005%.
See accompanying notes which are an integral part of the financial statements.
Notes to Financial Statements (Unaudited)
For the period ended March 31, 2022
1. Organization.
Moderate with Income Allocation Fund, Balanced Allocation Fund, Growth Allocation Fund and Aggressive Growth Allocation Fund (the Funds) are funds of Fidelity Charles Street Trust (the Trust). Each Fund is authorized to issue an unlimited number of shares. Shares are available only to certain health savings accounts that are made available through Raytheon. Share transactions on the Statement of Changes in Net Assets may contain exchanges between affiliated funds. The Trust is registered under the Investment Company Act of 1940, as amended (the 1940 Act), as an open-end management investment company organized as a Massachusetts business trust.
2. Significant Accounting Policies.
Each Fund is an investment company and applies the accounting and reporting guidance of the Financial Accounting Standards Board (FASB) Accounting Standards Codification Topic 946 Financial Services - Investment Companies. The financial statements have been prepared in conformity with accounting principles generally accepted in the United States of America (GAAP), which require management to make certain estimates and assumptions at the date of the financial statements. Actual results could differ from those estimates. Subsequent events, if any, through the date that the financial statements were issued have been evaluated in the preparation of the financial statements. Each Fund's Schedule of Investments lists any underlying mutual funds or exchange-traded funds (ETFs) but does not include the underlying holdings of these funds. The following summarizes the significant accounting policies of each Fund:
Investment Valuation. Investments are valued as of 4:00 p.m. Eastern time on the last calendar day of the period. The frequency with which these procedures are used cannot be predicted and they may be utilized to a significant extent. The Committee oversees each Fund's valuation policies and procedures and reports to the Board on the Committee's activities and fair value determinations. The Board monitors the appropriateness of the procedures used in valuing each Fund's investments and ratifies the fair value determinations of the Committee. Each Fund categorizes the inputs to valuation techniques used to value its investments into a disclosure hierarchy consisting of three levels as shown below:
- Level 1 – unadjusted quoted prices in active markets for identical investments
- Level 2 – other significant observable inputs (including quoted prices for similar investments, interest rates, prepayment speeds, etc.)
- Level 3 – unobservable inputs (including the Fund's own assumptions based on the best information available)
Valuation techniques used to value each Fund's investments by major category are as follows. Investments in open-end mutual funds are valued at their closing net asset value (NAV) each business day and are categorized as Level 1 in the hierarchy. The aggregate value of investments by input level as of March 31, 2022 is included at the end of each Fund's Schedule of Investments.
Investment Transactions and Income. For financial reporting purposes, the Funds' investment holdings and NAV include trades executed through the end of the last business day of the period. The NAV per share for processing shareholder transactions is calculated as of the close of business of the New York Stock Exchange (NYSE), normally 4:00 p.m. Eastern time and includes trades executed through the end of the prior business day. Gains and losses on securities sold are determined on the basis of identified cost. Income and capital gain distributions from any underlying mutual funds or exchange-traded funds (ETFs) are recorded on the ex-dividend date.
Expenses. Expenses directly attributable to a fund are charged to that fund. Expenses attributable to more than one fund are allocated among the respective funds on the basis of relative net assets or other appropriate methods. Expenses included in the accompanying financial statements reflect the expenses of that fund and do not include any expenses associated with any underlying mutual funds or exchange-traded funds. Although not included in a fund's expenses, a fund indirectly bears its proportionate share of these expenses through the net asset value of each underlying mutual fund or exchange-traded fund. Expense estimates are accrued in the period to which they relate and adjustments are made when actual amounts are known.
Income Tax Information and Distributions to Shareholders. Each year, each Fund intends to qualify as a regulated investment company under Subchapter M of the Internal Revenue Code, including distributing substantially all of its taxable income and realized gains. As a result, no provision for U.S. Federal income taxes is required. Each Fund files a U.S. federal tax return, in addition to state and local tax returns as required. Each Fund's federal income tax returns are subject to examination by the Internal Revenue Service (IRS) for a period of three fiscal years after they are filed. State and local tax returns may be subject to examination for an additional fiscal year depending on the jurisdiction.
Distributions are declared and recorded on the ex-dividend date. Income and capital gain distributions are determined in accordance with income tax regulations, which may differ from GAAP.
Capital accounts within the financial statements are adjusted for permanent book-tax differences. These adjustments have no impact on net assets or the results of operations. Capital accounts are not adjusted for temporary book-tax differences which will reverse in a subsequent period.
As of period end, the cost and unrealized appreciation (depreciation) in securities, and derivatives if applicable, for federal income tax purposes were as follows for each Fund:
| Tax cost | Gross unrealized appreciation | Gross unrealized depreciation | Net unrealized appreciation (depreciation) | |
| Moderate with Income Allocation Fund | $124,464 | $249 | $(3,048) | $(2,799) |
| Balanced Allocation Fund | 184,613 | 1,258 | (3,567) | (2,309) |
| Growth Allocation Fund | 319,277 | 4,915 | (4,371) | 544 |
| Aggressive Growth Allocation Fund | 274,356 | 4,994 | (3,522) | 1,472 |
3. Purchases and Sales of Investments.
Purchases and sales of securities, other than short-term securities and in-kind transactions, as applicable, are noted in the table below.
| Purchases ($) | Sales ($) | |
| Moderate with Income Allocation Fund | 126,716 | 2,230 |
| Balanced Allocation Fund | 187,937 | 3,297 |
| Growth Allocation Fund | 323,325 | 4,006 |
| Aggressive Growth Allocation Fund | 274,936 | 580 |
4. Fees and Other Transactions with Affiliates.
Management Fee. Fidelity Management & Research Company LLC (the investment adviser) provides the Funds with investment management related services. For these services each Fund pays a monthly management fee to the investment adviser. The management fee is based on an annual rate of .10% of each Fund's average net assets. Under the management contract, the investment adviser pays all other operating expenses, except the compensation of the independent Trustees and certain miscellaneous expenses such as proxy and shareholder meeting expenses.
During the period, the investment adviser waived its management as described in the Expense Reductions note.
Interfund Trades. Funds may purchase from or sell securities to other Fidelity Funds under procedures adopted by the Board. The procedures have been designed to ensure these interfund trades are executed in accordance with Rule 17a-7 of the 1940 Act. Any interfund trades are included within the respective purchases and sales amounts shown in the Purchases and Sales of Investments note. During the period there were no interfund trades.
5. Expense Reductions.
The investment adviser contractually agreed to waive each Fund's management fee in an amount equal to .10% of average net assets until January 31, 2026. For the period, management fees were reduced by the following amounts:
| Management Fee Waiver | |
| Moderate with Income Allocation Fund | $16 |
| Balanced Allocation Fund | $20 |
| Growth Allocation Fund | $30 |
| Aggressive Growth Allocation Fund | $26 |
6. Other.
A fund's organizational documents provide former and current trustees and officers with a limited indemnification against liabilities arising in connection with the performance of their duties to the fund. In the normal course of business, a fund may also enter into contracts that provide general indemnifications. A fund's maximum exposure under these arrangements is unknown as this would be dependent on future claims that may be made against a fund. The risk of material loss from such claims is considered remote.
At the end of the period, the investment adviser or its affiliates were owners of record of more than 10% of the outstanding shares as follows:
| Fund | Affiliated % |
| Aggressive Growth Allocation Fund | 36% |
| Balanced Allocation Fund | 54% |
| Growth Allocation Fund | 31% |
| Moderate with Income Allocation Fund | 80% |
7. Coronavirus (COVID-19) Pandemic.
An outbreak of COVID-19 first detected in China during December 2019 has since spread globally and was declared a pandemic by the World Health Organization during March 2020. Developments that disrupt global economies and financial markets, such as the COVID-19 pandemic, may magnify factors that affect the Funds' performance.
Shareholder Expense Example
As a shareholder, you incur two types of costs: (1) transaction costs, which may include sales charges (loads) on purchase payments or redemption proceeds, as applicable and (2) ongoing costs, which generally include management fees, distribution and/or service (12b-1) fees and other Fund expenses. This Example is intended to help you understand your ongoing costs (in dollars) of investing in a fund and to compare these costs with the ongoing costs of investing in other mutual funds.
The actual expense Example is based on an investment of $1,000 invested at the beginning of the period and held for the entire period (February 9, 2022 to March 31, 2022). The hypothetical expense Example is based on an investment of $1,000 invested for the one-half year period (October 1, 2021 to March 31, 2022).
Actual Expenses
The first line of the accompanying table provides information about actual account values and actual expenses. You may use the information in this line, together with the amount you invested, to estimate the expenses that you paid over the period. Simply divide your account value by $1,000.00 (for example, an $8,600 account value divided by $1,000.00 = 8.6), then multiply the result by the number in the first line for a class/Fund under the heading entitled "Expenses Paid During Period" to estimate the expenses you paid on your account during this period. If any fund is a shareholder of any underlying mutual funds or exchange-traded funds (ETFs) (the Underlying Funds), such fund indirectly bears its proportional share of the expenses of the Underlying Funds in addition to the direct expenses incurred presented in the table. These fees and expenses are not included in the annualized expense ratio used to calculate the expense estimate in the table below.
Hypothetical Example for Comparison Purposes
The second line of the accompanying table provides information about hypothetical account values and hypothetical expenses based on the actual expense ratio and an assumed rate of return of 5% per year before expenses, which is not the actual return. The hypothetical account values and expenses may not be used to estimate the actual ending account balance or expenses you paid for the period. You may use this information to compare the ongoing costs of investing in the Fund and other funds. To do so, compare this 5% hypothetical example with the 5% hypothetical examples that appear in the shareholder reports of the other funds. If any fund is a shareholder of any Underlying Funds, such fund indirectly bears its proportional share of the expenses of the Underlying Funds in addition to the direct expenses as presented in the table. These fees and expenses are not included in the annualized expense ratio used to calculate the expense estimate in the table below.
Please note that the expenses shown in the table are meant to highlight your ongoing costs only and do not reflect any transaction costs. Therefore, the second line of the table is useful in comparing ongoing costs only, and will not help you determine the relative total costs of owning different funds. In addition, if these transactional costs were included, your costs would have been higher.
| Annualized Expense Ratio--A,B- | Beginning Account Value | Ending Account Value March 31, 2022 | Expenses Paid During Period-C |
|
| Moderate with Income Allocation Fund | - % | |||
| Actual | $1,000.00 | $975.30 | $--D | |
| Hypothetical-E | $1,000.00 | $1,024.93 | $--F | |
| Balanced Allocation Fund | - % | |||
| Actual | $1,000.00 | $975.00 | $--D | |
| Hypothetical-E | $1,000.00 | $1,024.93 | $--F | |
| Growth Allocation Fund | - % | |||
| Actual | $1,000.00 | $975.00 | $--D | |
| Hypothetical-E | $1,000.00 | $1,024.93 | $--F | |
| Aggressive Growth Allocation Fund | - % | |||
| Actual | $1,000.00 | $975.00 | $--D | |
| Hypothetical-E | $1,000.00 | $1,024.93 | $--F |
A Annualized expense ratio reflects expenses net of applicable fee waivers.
B Amount represents less than .005%
C Amount represents less than $.005
D Actual expenses are equal to the annualized expense ratio, multiplied by the average account value over the period, multiplied by 51/365 (to reflect the period February 9, 2022 to March 31, 2022).
E 5% return per year before expenses
F Hypothetical expenses are equal to the annualized expense ratio, multiplied by the average account value over the period, multiplied by 182/365 (to reflect the one-half year period).
Board Approval of Investment Advisory Contracts and Management Fees
Moderate with Income Allocation Fund
Balanced Allocation Fund
Growth Allocation Fund
Aggressive Growth Allocation Fund
![]()
HSA-SANN-0522
1.9904653.100
Item 2.
Code of Ethics
Not applicable.
Item 3.
Audit Committee Financial Expert
Not applicable.
Item 4.
Principal Accountant Fees and Services
Not applicable.
Item 5.
Audit Committee of Listed Registrants
Not applicable.
Item 6.
Investments
(a)
Not applicable.
(b)
Not applicable
Item 7.
Disclosure of Proxy Voting Policies and Procedures for Closed-End Management Investment Companies
Not applicable.
Item 8.
Portfolio Managers of Closed-End Management Investment Companies
Not applicable.
Item 9.
Purchase of Equity Securities by Closed-End Management Investment Company and Affiliated Purchasers
Not applicable.
Item 10.
Submission of Matters to a Vote of Security Holders
There were no material changes to the procedures by which shareholders may recommend nominees to the Fidelity Charles Street Trust’s Board of Trustees.
Item 11.
Controls and Procedures
(a)(i) The President and Treasurer and the Chief Financial Officer have concluded that the Fidelity Charles Street Trust’s (the “Trust”) disclosure controls and procedures (as
defined in Rule 30a-3(c) under the Investment Company Act) provide reasonable assurances that material information relating to the Trust is made known to them by the appropriate persons, based on their evaluation of these controls and procedures as of a date within 90 days of the filing date of this report.
(a)(ii) There was no change in the Trust’s internal control over financial reporting (as defined in Rule 30a-3(d) under the Investment Company Act) that occurred during the period covered by this report that has materially affected, or is reasonably likely to materially affect, the Trust’s internal control over financial reporting.
Item 12.
Disclosure of Securities Lending Activities for Closed-End Management
Investment Companies
Not applicable.
Item 13.
Exhibits
| (a) | (1) | Not applicable. |
| (a) | (2) | |
| (a) | (3) | Not applicable. |
| (b) | |
SIGNATURES
Pursuant to the requirements of the Securities Exchange Act of 1934 and the Investment Company Act of 1940, the registrant has duly caused this report to be signed on its behalf by the undersigned, thereunto duly authorized.
Fidelity Charles Street Trust
| By: | /s/Laura M. Del Prato |
| | Laura M. Del Prato |
| | President and Treasurer |
| | |
| Date: | May 19, 2022 |
Pursuant to the requirements of the Securities Exchange Act of 1934 and the Investment Company Act of 1940, this report has been signed below by the following persons on behalf of the registrant and in the capacities and on the dates indicated.
| By: | /s/Laura M. Del Prato |
| | Laura M. Del Prato |
| | President and Treasurer |
| | |
| Date: | May 19, 2022 |
| By: | /s/John J. Burke III |
| | John J. Burke III |
| | Chief Financial Officer |
| | |
| Date: | May 19, 2022 |