UNITED STATES
SECURITIES AND EXCHANGE COMMISSION
Washington, D.C. 20549
FORM N-CSR
CERTIFIED SHAREHOLDER REPORT OF REGISTERED
MANAGEMENT INVESTMENT COMPANIES
Investment Company Act file number 811-3221
Fidelity Charles Street Trust
(Exact name of registrant as specified in charter)
245 Summer St., Boston, MA 02210
(Address of principal executive offices) (Zip code)
Marc Bryant, Secretary
245 Summer St.
Boston, Massachusetts 02210
(Name and address of agent for service)
Registrant's telephone number, including area code:
617-563-7000
Date of fiscal year end: | October 31 |
Date of reporting period: | April 30, 2017 |
Item 1.
Reports to Stockholders
|
Fidelity® Global Balanced Fund Semi-Annual Report April 30, 2017 |
 |
Contents
To view a fund's proxy voting guidelines and proxy voting record for the 12-month period ended June 30, visit http://www.fidelity.com/proxyvotingresults or visit the Securities and Exchange Commission's (SEC) web site at http://www.sec.gov.
You may also call 1-800-544-8544 to request a free copy of the proxy voting guidelines.
Standard & Poor's, S&P and S&P 500 are registered service marks of The McGraw-Hill Companies, Inc. and have been licensed for use by Fidelity Distributors Corporation.
Other third-party marks appearing herein are the property of their respective owners.
All other marks appearing herein are registered or unregistered trademarks or service marks of FMR LLC or an affiliated company. © 2017 FMR LLC. All rights reserved.
This report and the financial statements contained herein are submitted for the general information of the shareholders of the Fund. This report is not authorized for distribution to prospective investors in the Fund unless preceded or accompanied by an effective prospectus.
A fund files its complete schedule of portfolio holdings with the SEC for the first and third quarters of each fiscal year on Form N-Q. Forms N-Q are available on the SEC’s web site at http://www.sec.gov. A fund's Forms N-Q may be reviewed and copied at the SEC’s Public Reference Room in Washington, DC. Information regarding the operation of the SEC's Public Reference Room may be obtained by calling 1-800-SEC-0330.
For a complete list of a fund's portfolio holdings, view the most recent holdings listing, semiannual report, or annual report on Fidelity's web site at http://www.fidelity.com, http://www.institutional.fidelity.com, or http://www.401k.com, as applicable.
NOT FDIC INSURED •MAY LOSE VALUE •NO BANK GUARANTEE
Neither the Fund nor Fidelity Distributors Corporation is a bank.
Investment Summary (Unaudited)
The information in the following tables is based on the combined investments of the Fund and its pro-rata share of the investments of Fidelity's Central Funds, other than the Commodity Strategy and Money Market Central Funds.Geographic Diversification (% of fund's net assets)
| As of April 30, 2017 | ||
| United States of America* | 46.7% | |
| Japan | 13.5% | |
| Germany | 6.6% | |
| United Kingdom | 4.9% | |
| France | 3.6% | |
| Netherlands | 3.5% | |
| Italy | 3.4% | |
| Canada | 3.1% | |
| Sweden | 2.2% | |
| Other | 12.5% | |

* Includes Short-Term investments and Net Other Assets (Liabilities).
Percentages are based on country or territory of incorporation and are adjusted for the effect of futures contracts, if applicable.
| As of October 31, 2016 | ||
| United States of America* | 46.2% | |
| Japan | 12.4% | |
| United Kingdom | 6.0% | |
| Germany | 4.9% | |
| Netherlands | 4.0% | |
| Canada | 3.4% | |
| France | 3.2% | |
| Ireland | 3.1% | |
| Italy | 1.8% | |
| Other | 15.0% | |

* Includes Short-Term investments and Net Other Assets (Liabilities).
Percentages are based on country or territory of incorporation and are adjusted for the effect of futures contracts, if applicable.
Asset Allocation as of April 30, 2017
| % of fund's net assets | % of fund's net assets 6 months ago | |
| Stocks | 61.4(a) | 58.4(b) |
| Bonds | 32.1 | 35.2 |
| Other Investments | 5.2 | 3.8 |
| Short-Term Investments and Net Other Assets (Liabilities) | 1.3 | 2.6 |
(a) Includes investment in Fidelity® Commodity Strategy Central Fund of 0.9%
(b) Includes investment in Fidelity® Commodity Strategy Central Fund of 0.8%
Top Five Stocks as of April 30, 2017
| % of fund's net assets | % of fund's net assets 6 months ago | |
| Apple, Inc. (United States of America) | 1.5 | 1.4 |
| Bank of America Corp. (United States of America) | 1.5 | 0.0 |
| Adobe Systems, Inc. (United States of America) | 1.5 | 2.0 |
| adidas AG (Germany) | 1.4 | 0.9 |
| Alphabet, Inc. Class A (United States of America) | 1.3 | 2.1 |
| 7.2 |
Top Five Bond Issuers as of April 30, 2017
| (with maturities greater than one year) | % of fund's net assets | % of fund's net assets 6 months ago |
| U.S. Treasury Obligations | 10.9 | 8.9 |
| Japan Government | 7.4 | 9.0 |
| German Federal Republic | 2.8 | 0.5 |
| Buoni del Tesoro Poliennali | 2.2 | 0.9 |
| United Kingdom, Great Britain and Northern Ireland | 1.7 | 1.0 |
| 25.0 |
Market Sectors as of April 30, 2017
| % of fund's net assets | % of fund's net assets 6 months ago | |
| Financials | 14.9 | 19.4 |
| Information Technology | 13.1 | 15.5 |
| Industrials | 8.9 | 7.2 |
| Consumer Discretionary | 8.2 | 7.2 |
| Health Care | 8.1 | 6.4 |
| Consumer Staples | 3.9 | 4.0 |
| Materials | 2.5 | 1.4 |
| Real Estate | 1.5 | 1.7 |
| Energy | 1.2 | 4.1 |
| Telecommunication Services | 1.0 | 0.9 |
An unaudited holdings listing for the Fund, which presents direct holdings as well as the pro-rata share of any securities and other investments held indirectly through its investment in underlying Fidelity Central Funds, other than the Commodity Strategy and Money Market Central Funds, is available at fidelity.com and/or institutional.fidelity.com, as applicable.
Percentages shown as 0.0% may reflect amounts less than 0.05%.
Investments April 30, 2017
Showing Percentage of Net Assets
| Common Stocks - 58.2% | |||
| Shares | Value | ||
| Australia - 1.6% | |||
| Abacus Property Group unit | 76,981 | $198,870 | |
| Aconex Ltd. (a)(b) | 32,588 | 107,124 | |
| Amcor Ltd. | 26,234 | 308,608 | |
| Arena (REIT) unit | 143,670 | 229,146 | |
| Asaleo Care Ltd. | 146,907 | 197,457 | |
| Aub Group Ltd. | 26,882 | 242,759 | |
| Australia & New Zealand Banking Group Ltd. | 32,716 | 802,546 | |
| Bapcor Ltd. | 54,957 | 215,224 | |
| Beacon Lighting Group Ltd. | 169,462 | 228,408 | |
| BHP Billiton Ltd. | 19,288 | 343,403 | |
| Blue Sky Alternative Investments Ltd. | 40,677 | 243,672 | |
| Commonwealth Bank of Australia | 17,868 | 1,169,373 | |
| Corporate Travel Management Ltd. | 14,207 | 216,594 | |
| CSL Ltd. | 7,169 | 711,548 | |
| Hansen Technologies Ltd. | 76,548 | 206,349 | |
| HUB24 Ltd. (a) | 42,498 | 155,930 | |
| Magellan Financial Group Ltd. | 12,364 | 218,307 | |
| NIB Holdings Ltd. | 64,014 | 287,602 | |
| realestate.com.au Ltd. | 6,630 | 305,270 | |
| Reliance Worldwide Corp. Ltd. | 86,194 | 196,853 | |
| SpeedCast International Ltd. | 22,354 | 63,774 | |
| Sydney Airport unit | 50,488 | 260,479 | |
| Vita Group Ltd. | 57,133 | 97,113 | |
| Woodside Petroleum Ltd. | 13,325 | 321,084 | |
| TOTAL AUSTRALIA | 7,327,493 | ||
| Austria - 0.1% | |||
| ams AG | 7,000 | 450,251 | |
| Bailiwick of Jersey - 0.3% | |||
| Randgold Resources Ltd. | 802 | 70,549 | |
| Shire PLC | 21,400 | 1,261,718 | |
| Wizz Air Holdings PLC (a) | 7,000 | 160,022 | |
| TOTAL BAILIWICK OF JERSEY | 1,492,289 | ||
| Bermuda - 1.4% | |||
| Axovant Sciences Ltd. (a) | 1,000 | 24,240 | |
| Dairy Farm International Holdings Ltd. | 25,200 | 224,280 | |
| Hongkong Land Holdings Ltd. | 38,300 | 295,293 | |
| IHS Markit Ltd. (a) | 77,200 | 3,350,480 | |
| PAX Global Technology Ltd. | 180,000 | 111,540 | |
| Vostok Emerging Finance Ltd. (depository receipt) (a) | 3,274,986 | 606,390 | |
| Vostok New Ventures Ltd. (depositary receipt) (a) | 229,461 | 1,787,544 | |
| TOTAL BERMUDA | 6,399,767 | ||
| Canada - 2.5% | |||
| Agnico Eagle Mines Ltd. (Canada) | 2,170 | 103,727 | |
| Agrium, Inc. | 2,230 | 209,302 | |
| Alimentation Couche-Tard, Inc. Class B (sub. vtg.) | 4,830 | 222,136 | |
| Allied Properties (REIT) | 2,760 | 74,062 | |
| ARC Resources Ltd. | 5,090 | 66,820 | |
| AutoCanada, Inc. | 1,870 | 32,166 | |
| Bank of Nova Scotia | 3,150 | 175,101 | |
| Barrick Gold Corp. | 3,940 | 65,866 | |
| Brookfield Asset Management, Inc. Class A | 1,400 | 51,752 | |
| Canadian Energy Services & Technology Corp. | 11,070 | 52,307 | |
| Canadian National Railway Co. | 3,820 | 276,121 | |
| Canadian Natural Resources Ltd. | 5,850 | 186,336 | |
| Canadian Pacific Railway Ltd. | 1,720 | 263,547 | |
| CCL Industries, Inc. Class B | 370 | 85,653 | |
| Cenovus Energy, Inc. | 7,940 | 79,164 | |
| CGI Group, Inc. Class A (sub. vtg.) (a) | 3,280 | 158,299 | |
| CI Financial Corp. | 3,850 | 75,305 | |
| Cogeco Communications, Inc. | 1,210 | 69,238 | |
| Constellation Software, Inc. | 220 | 100,621 | |
| Corus Entertainment, Inc. Class B (non-vtg.) | 3,890 | 38,186 | |
| Detour Gold Corp. (a) | 2,930 | 37,026 | |
| Empire Co. Ltd. Class A (non-vtg.) | 2,700 | 41,596 | |
| Enbridge, Inc. | 8,950 | 370,969 | |
| Fairfax India Holdings Corp. (a) | 1,300 | 18,057 | |
| First Quantum Minerals Ltd. | 198,000 | 1,887,096 | |
| Franco-Nevada Corp. | 2,000 | 136,024 | |
| Freshii, Inc. | 1,800 | 16,351 | |
| George Weston Ltd. | 2,210 | 198,472 | |
| Goldcorp, Inc. | 2,060 | 28,703 | |
| Hydro One Ltd. | 3,520 | 61,991 | |
| Imperial Oil Ltd. | 2,540 | 73,890 | |
| Intact Financial Corp. | 1,480 | 101,384 | |
| Jean Coutu Group, Inc. Class A (sub. vtg.) | 2,620 | 42,878 | |
| Lundin Mining Corp. | 16,450 | 87,730 | |
| Magna International, Inc. Class A (sub. vtg.) | 900 | 37,594 | |
| Manulife Financial Corp. | 18,160 | 318,487 | |
| Metro, Inc. Class A (sub. vtg.) | 1,100 | 37,697 | |
| North West Co., Inc. | 2,870 | 67,700 | |
| NuVista Energy Ltd. (a) | 6,800 | 30,636 | |
| Open Text Corp. | 3,640 | 126,209 | |
| Parkland Fuel Corp. (a)(c)(d) | 800 | 15,665 | |
| Pason Systems, Inc. | 2,280 | 33,856 | |
| Peyto Exploration & Development Corp. | 2,550 | 46,403 | |
| Power Corp. of Canada (sub. vtg.) | 8,450 | 195,798 | |
| PrairieSky Royalty Ltd. | 71,788 | 1,564,553 | |
| Premier Gold Mines Ltd. (a) | 12,100 | 24,465 | |
| Quebecor, Inc. Class B (sub. vtg.) | 2,670 | 81,505 | |
| Raging River Exploration, Inc. (a) | 7,000 | 40,870 | |
| Rogers Communications, Inc. Class B (non-vtg.) | 6,800 | 311,792 | |
| Royal Bank of Canada (b) | 12,430 | 851,128 | |
| ShawCor Ltd. Class A | 1,960 | 49,178 | |
| Silver Wheaton Corp. | 4,420 | 88,202 | |
| Sleep Country Canada Holdings, Inc. | 1,470 | 38,025 | |
| Stantec, Inc. | 2,250 | 57,740 | |
| Suncor Energy, Inc. | 16,232 | 508,703 | |
| TELUS Corp. | 7,340 | 244,228 | |
| The Toronto-Dominion Bank | 16,420 | 772,614 | |
| TMX Group Ltd. | 1,370 | 77,400 | |
| Torex Gold Resources, Inc. (a) | 1,932 | 32,722 | |
| Toromont Industries Ltd. | 1,470 | 52,293 | |
| TransForce, Inc. | 1,890 | 41,149 | |
| Western Forest Products, Inc. | 41,310 | 65,065 | |
| WestJet Airlines Ltd. | 2,220 | 36,722 | |
| TOTAL CANADA | 11,336,275 | ||
| Cayman Islands - 0.4% | |||
| Alibaba Group Holding Ltd. sponsored ADR (a) | 2,000 | 231,000 | |
| CK Hutchison Holdings Ltd. | 37,500 | 468,367 | |
| International Housewares Retail Co. Ltd. | 981,000 | 221,970 | |
| JD.com, Inc. sponsored ADR (a) | 9,000 | 315,630 | |
| SITC International Holdings Co. Ltd. | 180,000 | 128,896 | |
| Tencent Holdings Ltd. | 10,300 | 322,733 | |
| TOTAL CAYMAN ISLANDS | 1,688,596 | ||
| China - 0.0% | |||
| Shenzhen Expressway Co. (H Shares) | 160,000 | 145,841 | |
| Denmark - 0.6% | |||
| Nets A/S (c) | 55,700 | 1,013,135 | |
| Novozymes A/S Series B | 23,100 | 997,986 | |
| Scandinavian Tobacco Group A/S | 25,376 | 442,986 | |
| TOTAL DENMARK | 2,454,107 | ||
| Finland - 0.0% | |||
| Valmet Corp. | 6,300 | 114,811 | |
| France - 1.6% | |||
| Amundi SA | 840 | 55,267 | |
| Capgemini SA | 14,100 | 1,411,720 | |
| Havas SA | 152,300 | 1,408,328 | |
| Kering SA | 300 | 92,988 | |
| Rubis | 11,200 | 1,138,031 | |
| Thales SA | 13,400 | 1,408,866 | |
| The Vicat Group | 9,400 | 668,737 | |
| Wendel SA | 9,100 | 1,275,260 | |
| TOTAL FRANCE | 7,459,197 | ||
| Germany - 3.8% | |||
| adidas AG | 32,100 | 6,430,345 | |
| Bayer AG | 400 | 49,493 | |
| Bertrandt AG (b) | 5,200 | 543,042 | |
| Brenntag AG | 9,400 | 557,434 | |
| CompuGroup Medical AG | 14,600 | 718,851 | |
| CTS Eventim AG | 37,258 | 1,435,293 | |
| Fresenius Medical Care AG & Co. KGaA | 9,700 | 861,062 | |
| LEG Immobilien AG | 17,901 | 1,537,735 | |
| MTU Aero Engines Holdings AG | 7,400 | 1,061,207 | |
| SAP AG | 32,911 | 3,296,565 | |
| Vonovia SE | 22,500 | 814,565 | |
| TOTAL GERMANY | 17,305,592 | ||
| Hong Kong - 0.4% | |||
| AIA Group Ltd. | 136,000 | 941,536 | |
| Hang Seng Bank Ltd. | 16,300 | 330,470 | |
| Power Assets Holdings Ltd. | 47,000 | 422,969 | |
| Techtronic Industries Co. Ltd. | 36,500 | 156,730 | |
| TOTAL HONG KONG | 1,851,705 | ||
| India - 0.2% | |||
| HDFC Bank Ltd. sponsored ADR | 5,000 | 398,050 | |
| Reliance Industries Ltd. | 24,750 | 537,116 | |
| TOTAL INDIA | 935,166 | ||
| Ireland - 1.3% | |||
| Accenture PLC Class A | 800 | 97,040 | |
| Alkermes PLC (a) | 51,300 | 2,988,225 | |
| CRH PLC | 1,300 | 47,351 | |
| DCC PLC (United Kingdom) | 13,000 | 1,200,521 | |
| Ryanair Holdings PLC sponsored ADR (a) | 9,082 | 834,908 | |
| United Drug PLC (United Kingdom) | 86,017 | 832,227 | |
| TOTAL IRELAND | 6,000,272 | ||
| Israel - 0.1% | |||
| Sarine Technologies Ltd. | 185,100 | 254,369 | |
| Italy - 1.0% | |||
| Banca Generali SpA | 25,500 | 733,039 | |
| Buzzi Unicem SpA | 29,300 | 753,229 | |
| Intesa Sanpaolo SpA | 251,600 | 734,446 | |
| Prada SpA | 209,800 | 984,489 | |
| UniCredit SpA | 71,600 | 1,165,229 | |
| TOTAL ITALY | 4,370,432 | ||
| Japan - 6.1% | |||
| Astellas Pharma, Inc. | 35,400 | 466,824 | |
| Bank of Kyoto Ltd. | 26,000 | 205,714 | |
| Daikin Industries Ltd. | 6,100 | 592,353 | |
| DaikyoNishikawa Corp. | 8,300 | 105,355 | |
| Daito Trust Construction Co. Ltd. | 3,300 | 485,490 | |
| Dentsu, Inc. | 10,000 | 563,355 | |
| East Japan Railway Co. | 8,600 | 767,925 | |
| Eiken Chemical Co. Ltd. | 8,300 | 227,836 | |
| Fanuc Corp. | 2,900 | 590,429 | |
| Funai Soken Holdings, Inc. | 11,400 | 219,052 | |
| Hoya Corp. | 17,800 | 850,121 | |
| Hulic Co. Ltd. | 36,100 | 340,031 | |
| Japan Meat Co. Ltd. | 24,000 | 399,372 | |
| Japan Tobacco, Inc. | 27,400 | 910,916 | |
| Kakaku.com, Inc. | 34,600 | 498,786 | |
| Kaken Pharmaceutical Co. Ltd. | 5,200 | 308,338 | |
| Kao Corp. | 13,400 | 739,028 | |
| Keyence Corp. | 2,300 | 924,333 | |
| Kubota Corp. | 30,000 | 471,765 | |
| Kyushu Railway Co. | 10,900 | 341,740 | |
| Misumi Group, Inc. | 28,600 | 541,598 | |
| Mitsubishi Pencil Co. Ltd. | 8,500 | 471,227 | |
| Mitsui Fudosan Co. Ltd. | 23,000 | 505,391 | |
| Morinaga & Co. Ltd. | 8,100 | 382,929 | |
| Murata Manufacturing Co. Ltd. | 3,600 | 482,637 | |
| Nakanishi, Inc. | 12,460 | 489,570 | |
| Nidec Corp. | 6,500 | 595,918 | |
| Nihon Parkerizing Co. Ltd. | 25,300 | 324,775 | |
| Nintendo Co. Ltd. | 3,000 | 759,197 | |
| Nitori Holdings Co. Ltd. | 6,700 | 872,097 | |
| NTT DOCOMO, Inc. | 36,700 | 888,033 | |
| Olympus Corp. | 12,300 | 473,353 | |
| Open House Co. Ltd. | 20,800 | 510,134 | |
| ORIX Corp. | 42,300 | 645,457 | |
| PALTAC Corp. | 16,700 | 492,873 | |
| Panasonic Corp. | 53,500 | 639,766 | |
| PeptiDream, Inc. (a) | 5,900 | 353,021 | |
| Rakuten, Inc. | 49,200 | 503,586 | |
| Shionogi & Co. Ltd. | 12,400 | 637,714 | |
| SK Kaken Co. Ltd. | 4,300 | 408,881 | |
| SMC Corp. | 2,100 | 591,334 | |
| SMS Co., Ltd. | 17,400 | 463,116 | |
| SoftBank Corp. | 13,400 | 1,016,426 | |
| Sosei Group Corp. (a) | 1,500 | 154,070 | |
| Start Today Co. Ltd. | 33,300 | 710,958 | |
| Subaru Corp. | 23,400 | 884,152 | |
| Sundrug Co. Ltd. | 15,200 | 533,142 | |
| The Suruga Bank Ltd. | 34,500 | 720,794 | |
| Tokyo Century Corp. | 11,600 | 399,587 | |
| Toshiba Plant Systems & Services Corp. | 19,100 | 310,637 | |
| Tsuruha Holdings, Inc. | 4,800 | 486,566 | |
| Welcia Holdings Co. Ltd. | 13,400 | 431,541 | |
| TOTAL JAPAN | 27,689,243 | ||
| Luxembourg - 0.1% | |||
| B&M European Value Retail S.A. | 33,680 | 147,007 | |
| Samsonite International SA | 61,200 | 236,433 | |
| TOTAL LUXEMBOURG | 383,440 | ||
| Malta - 0.1% | |||
| Kambi Group PLC (a) | 52,200 | 536,303 | |
| Multi-National - 0.0% | |||
| HKT Trust/HKT Ltd. unit | 115,000 | 147,107 | |
| Netherlands - 1.6% | |||
| ASML Holding NV | 1,500 | 197,775 | |
| CSM NV (exchangeable) | 18,600 | 577,438 | |
| Intertrust NV | 44,000 | 881,897 | |
| Koninklijke Philips Electronics NV | 45,600 | 1,574,681 | |
| Koninklijke Wessanen NV | 47,700 | 712,626 | |
| Unilever NV: | |||
| (Certificaten Van Aandelen) (Bearer) | 31,500 | 1,650,143 | |
| (NY Reg.)(a) | 31,000 | 1,619,440 | |
| TOTAL NETHERLANDS | 7,214,000 | ||
| New Zealand - 0.0% | |||
| Ryman Healthcare Group Ltd. | 29,354 | 173,933 | |
| Norway - 0.5% | |||
| Orkla ASA | 85,600 | 775,146 | |
| Schibsted ASA (A Shares) | 58,000 | 1,442,232 | |
| TOTAL NORWAY | 2,217,378 | ||
| Singapore - 0.6% | |||
| Broadcom Ltd. | 12,000 | 2,649,720 | |
| Wing Tai Holdings Ltd. | 109,100 | 147,585 | |
| TOTAL SINGAPORE | 2,797,305 | ||
| Spain - 0.7% | |||
| Amadeus IT Holding SA Class A | 17,700 | 954,390 | |
| CaixaBank SA | 127,500 | 578,907 | |
| Grifols SA | 30,200 | 811,072 | |
| Prosegur Cash SA | 383,400 | 977,272 | |
| TOTAL SPAIN | 3,321,641 | ||
| Sweden - 2.2% | |||
| AF AB (B Shares) | 7,700 | 162,045 | |
| Dometic Group AB | 174,400 | 1,299,538 | |
| Getinge AB (B Shares) | 119,600 | 2,337,367 | |
| Indutrade AB | 64,400 | 1,521,787 | |
| Investor AB (B Shares) | 43,342 | 1,981,323 | |
| Nobia AB | 38,600 | 399,410 | |
| Pandox AB | 42,455 | 712,752 | |
| Svenska Cellulosa AB (SCA) (B Shares) | 47,600 | 1,576,760 | |
| TOTAL SWEDEN | 9,990,982 | ||
| Switzerland - 0.9% | |||
| ABB Ltd. (Reg.) | 50,790 | 1,244,572 | |
| EDAG Engineering Group AG | 17,400 | 321,172 | |
| Panalpina Welttransport Holding AG | 8,270 | 1,094,632 | |
| Swatch Group AG (Bearer) | 3,500 | 1,401,055 | |
| TOTAL SWITZERLAND | 4,061,431 | ||
| United Kingdom - 2.7% | |||
| British American Tobacco PLC: | |||
| (United Kingdom) | 10,000 | 675,634 | |
| sponsored ADR | 41,000 | 2,789,640 | |
| Bunzl PLC | 22,985 | 716,866 | |
| Dechra Pharmaceuticals PLC | 53,400 | 1,168,866 | |
| Dialog Semiconductor PLC (a) | 400 | 18,714 | |
| Diploma PLC | 71,900 | 1,032,755 | |
| Essentra PLC | 105,000 | 736,418 | |
| Imperial Tobacco Group PLC | 893 | 43,743 | |
| International Personal Finance PLC | 298,457 | 620,431 | |
| John Wood Group PLC | 6,000 | 59,022 | |
| Micro Focus International PLC | 24,000 | 804,475 | |
| NCC Group Ltd. (b) | 797,700 | 1,472,283 | |
| Prudential PLC | 97,535 | 2,164,678 | |
| TOTAL UNITED KINGDOM | 12,303,525 | ||
| United States of America - 27.4% | |||
| Activision Blizzard, Inc. | 75,900 | 3,965,775 | |
| Adobe Systems, Inc. (a) | 49,900 | 6,673,626 | |
| Alaska Air Group, Inc. | 17,000 | 1,446,530 | |
| Alexion Pharmaceuticals, Inc. (a) | 6,600 | 843,348 | |
| Allison Transmission Holdings, Inc. | 76,400 | 2,955,152 | |
| Alphabet, Inc. Class A (a) | 6,500 | 6,009,380 | |
| Amazon.com, Inc. (a) | 3,500 | 3,237,465 | |
| American Tower Corp. | 10,400 | 1,309,776 | |
| AMETEK, Inc. | 4,000 | 228,800 | |
| Amgen, Inc. | 21,200 | 3,462,384 | |
| Amphenol Corp. Class A | 20,400 | 1,475,124 | |
| Analog Devices, Inc. | 3,000 | 228,600 | |
| Apple, Inc. | 47,600 | 6,837,740 | |
| Autodesk, Inc. (a) | 2,000 | 180,140 | |
| Autoliv, Inc. (depositary receipt) | 18,000 | 1,801,565 | |
| Bank of America Corp. | 289,000 | 6,745,260 | |
| Bio-Rad Laboratories, Inc. Class A (a) | 500 | 109,130 | |
| Boston Scientific Corp. (a) | 133,700 | 3,527,006 | |
| Burlington Stores, Inc. (a) | 1,000 | 98,920 | |
| CalAtlantic Group, Inc. | 10,000 | 362,200 | |
| Caterpillar, Inc. | 33,500 | 3,425,710 | |
| Cavium, Inc. (a) | 1,000 | 68,850 | |
| CBOE Holdings, Inc. | 50,000 | 4,120,500 | |
| Celanese Corp. Class A | 1,000 | 87,040 | |
| Charles Schwab Corp. | 24,000 | 932,400 | |
| Charter Communications, Inc. Class A (a) | 7,600 | 2,623,216 | |
| Cintas Corp. | 1,000 | 122,470 | |
| CME Group, Inc. | 2,900 | 336,951 | |
| CSX Corp. | 44,000 | 2,236,960 | |
| Cummins, Inc. | 11,000 | 1,660,340 | |
| Cypress Semiconductor Corp. | 22,000 | 308,220 | |
| Edwards Lifesciences Corp. (a) | 1,000 | 109,670 | |
| Entegris, Inc. (a) | 12,000 | 297,600 | |
| EOG Resources, Inc. | 4,700 | 434,750 | |
| Facebook, Inc. Class A (a) | 19,100 | 2,869,775 | |
| First Republic Bank | 7,000 | 647,220 | |
| FMC Corp. | 31,000 | 2,270,130 | |
| Goldman Sachs Group, Inc. | 4,000 | 895,200 | |
| Great Western Bancorp, Inc. | 1,000 | 41,200 | |
| Humana, Inc. | 11,300 | 2,508,374 | |
| Intercept Pharmaceuticals, Inc. (a) | 12,600 | 1,415,610 | |
| Intuit, Inc. | 3,300 | 413,193 | |
| Intuitive Surgical, Inc. (a) | 300 | 250,761 | |
| J.B. Hunt Transport Services, Inc. | 2,000 | 179,320 | |
| JPMorgan Chase & Co. | 36,000 | 3,132,000 | |
| KLA-Tencor Corp. | 13,000 | 1,276,860 | |
| Kulicke & Soffa Industries, Inc. (a) | 7,000 | 156,240 | |
| Lamb Weston Holdings, Inc. | 4,000 | 167,000 | |
| Lennar Corp. Class A | 14,000 | 707,000 | |
| Marriott International, Inc. Class A | 12,500 | 1,180,250 | |
| Microsemi Corp. (a) | 1,000 | 46,940 | |
| Microsoft Corp. | 79,000 | 5,408,340 | |
| Molson Coors Brewing Co. Class B | 1,500 | 143,835 | |
| Monsanto Co. | 290 | 33,817 | |
| Morgan Stanley | 30,000 | 1,301,100 | |
| MSC Industrial Direct Co., Inc. Class A | 14,000 | 1,253,420 | |
| MSCI, Inc. | 13,600 | 1,364,352 | |
| Netflix, Inc. (a) | 3,300 | 502,260 | |
| Northern Trust Corp. | 13,000 | 1,170,000 | |
| PACCAR, Inc. | 5,000 | 333,650 | |
| PayPal Holdings, Inc. (a) | 56,500 | 2,696,180 | |
| Performance Food Group Co. (a) | 27,000 | 672,300 | |
| Pioneer Natural Resources Co. | 3,100 | 536,269 | |
| Post Holdings, Inc. (a) | 9,000 | 757,710 | |
| Prestige Brands Holdings, Inc. (a) | 11,300 | 648,733 | |
| ResMed, Inc. CDI | 30,848 | 211,587 | |
| Roper Technologies, Inc. | 500 | 109,350 | |
| S&P Global, Inc. | 32,083 | 4,305,218 | |
| Sirius XM Holdings, Inc. | 26,000 | 128,700 | |
| SLM Corp. (a) | 4,000 | 50,160 | |
| SunTrust Banks, Inc. | 30,800 | 1,749,748 | |
| SVB Financial Group (a) | 12,400 | 2,181,656 | |
| T-Mobile U.S., Inc. (a) | 20,000 | 1,345,400 | |
| Terex Corp. | 6,000 | 209,880 | |
| Texas Instruments, Inc. | 9,000 | 712,620 | |
| The Walt Disney Co. | 10,500 | 1,213,800 | |
| Twenty-First Century Fox, Inc. Class B | 9,000 | 268,740 | |
| U.S. Bancorp | 9,000 | 461,520 | |
| U.S. Foods Holding Corp. | 16,000 | 451,200 | |
| Union Pacific Corp. | 13,900 | 1,556,244 | |
| United Rentals, Inc. (a) | 3,000 | 328,980 | |
| UnitedHealth Group, Inc. | 17,900 | 3,130,352 | |
| Univar, Inc. (a) | 42,800 | 1,277,580 | |
| Vertex Pharmaceuticals, Inc. (a) | 5,000 | 591,500 | |
| Visa, Inc. Class A | 13,000 | 1,185,860 | |
| TOTAL UNITED STATES OF AMERICA | 124,711,732 | ||
| TOTAL COMMON STOCKS | |||
| (Cost $223,302,796) | 265,134,183 | ||
| Nonconvertible Preferred Stocks - 0.4% | |||
| Italy - 0.2% | |||
| Buzzi Unicem SpA (Risparmio Shares) | 53,953 | 797,523 | |
| Spain - 0.2% | |||
| Grifols SA Class B | 50,700 | 1,082,183 | |
| TOTAL NONCONVERTIBLE PREFERRED STOCKS | |||
| (Cost $1,474,811) | 1,879,706 | ||
| Investment Companies - 5.2% | |||
| United States of America - 5.2% | |||
| iShares 20+ Year Treasury Bond ETF | 37,100 | 4,539,185 | |
| iShares Barclays TIPS Bond ETF | 77,660 | 8,931,677 | |
| SPDR DB International Government Inflation-Protected Bond ETF | 185,890 | 10,285,294 | |
| TOTAL INVESTMENT COMPANIES | |||
| (Cost $23,374,754) | 23,756,156 | ||
| Principal Amount(e) | Value | ||
| Nonconvertible Bonds - 2.8% | |||
| France - 0.5% | |||
| EDF SA 1.875% 10/13/36 (Reg. S) | EUR | 1,100,000 | 1,086,493 |
| Wendel SA 1% 4/20/23 (Reg. S) | EUR | 1,200,000 | 1,282,167 |
| TOTAL FRANCE | 2,368,660 | ||
| Ireland - 0.5% | |||
| Shire Acquisitions Investments Ireland DAC 2.4% 9/23/21 | 2,500,000 | 2,469,620 | |
| Netherlands - 0.3% | |||
| ABN AMRO Bank NV 2.875% 6/30/25 (Reg. S) (f) | EUR | 400,000 | 460,827 |
| Rabobank Nederland 2.5% 5/26/26 (Reg. S) (f) | EUR | 600,000 | 688,719 |
| TOTAL NETHERLANDS | 1,149,546 | ||
| United Kingdom - 0.5% | |||
| National Grid Gas Finance PLC 1.125% 9/22/21 (Reg. S) | GBP | 1,000,000 | 1,294,141 |
| Nationwide Building Society 4.125% 3/20/23 (Reg. S) (f) | EUR | 850,000 | 955,541 |
| TOTAL UNITED KINGDOM | 2,249,682 | ||
| United States of America - 1.0% | |||
| Citigroup, Inc. 1.5% 10/26/28 | EUR | 2,000,000 | 2,114,377 |
| Goldman Sachs Group, Inc. 3% 2/12/31 (Reg. S) | EUR | 1,390,000 | 1,640,340 |
| Molson Coors Brewing Co. 1.25% 7/15/24 | EUR | 600,000 | 655,550 |
| TOTAL UNITED STATES OF AMERICA | 4,410,267 | ||
| TOTAL NONCONVERTIBLE BONDS | |||
| (Cost $13,097,265) | 12,647,775 | ||
| Government Obligations - 29.3% | |||
| Canada - 0.6% | |||
| Canadian Government: | |||
| 0.5% 2/1/19 | CAD | 1,100,000 | 803,075 |
| 1% 6/1/27 | CAD | 1,150,000 | 799,992 |
| 3.5% 12/1/45 | CAD | 1,100,000 | 1,028,587 |
| TOTAL CANADA | 2,631,654 | ||
| France - 1.5% | |||
| French Government: | |||
| OAT: | |||
| 1.75% 5/25/23 | EUR | 1,400,000 | 1,678,748 |
| 3.25% 5/25/45(Reg. S) | EUR | 800,000 | 1,147,686 |
| 0.5% 5/25/26(Reg. S) | EUR | 3,700,000 | 3,964,956 |
| TOTAL FRANCE | 6,791,390 | ||
| Germany - 2.8% | |||
| German Federal Republic: | |||
| 0% 3/15/19(Reg. S) | EUR | 4,150,000 | 4,583,178 |
| 0% 10/8/21(Reg. S) | EUR | 3,200,000 | 3,560,871 |
| 0.25% 2/15/27(Reg. S) | EUR | 2,525,000 | 2,731,449 |
| 2.5% 8/15/46 | EUR | 1,300,000 | 1,911,699 |
| TOTAL GERMANY | 12,787,197 | ||
| Ireland - 0.3% | |||
| Irish Republic: | |||
| 1% 5/15/26(Reg. S) | EUR | 700,000 | 772,185 |
| 2% 2/18/45 (Reg.S) | EUR | 400,666 | 440,008 |
| TOTAL IRELAND | 1,212,193 | ||
| Italy - 2.2% | |||
| Buoni del Tesoro Poliennali: | |||
| 0.65% 11/1/20 | EUR | 7,550,000 | 8,289,186 |
| 2.7% 3/1/47 (c) | EUR | 2,000,000 | 1,925,229 |
| TOTAL ITALY | 10,214,415 | ||
| Japan - 7.4% | |||
| Japan Government: | |||
| 0.1% 6/20/26 | JPY | 280,000,000 | 2,538,298 |
| 0.4% 3/20/56 | JPY | 375,000,000 | 2,801,121 |
| 0.9% 6/20/22 | JPY | 619,800,000 | 5,859,619 |
| 1.3% 6/20/20 | JPY | 347,450,000 | 3,261,433 |
| 1.3% 3/20/21 | JPY | 702,750,000 | 6,665,581 |
| 1.7% 9/20/32 | JPY | 1,155,000,000 | 12,524,976 |
| TOTAL JAPAN | 33,651,028 | ||
| Netherlands - 1.6% | |||
| Dutch Government 0.5% 7/15/26(Reg. S) (c) | EUR | 6,550,000 | 7,209,054 |
| Spain - 0.3% | |||
| Spanish Kingdom 2.9% 10/31/46(Reg. S) (c) | EUR | 1,350,000 | 1,455,338 |
| United Kingdom - 1.7% | |||
| United Kingdom, Great Britain and Northern Ireland: | |||
| 1.25% 7/22/27(Reg. S) | GBP | 1,050,000 | 1,372,390 |
| 4% 3/7/22 | GBP | 1,550,000 | 2,361,587 |
| United Kingdom, Great Britain and Northern Ireland Treasury Indexed-Linked GILT 2.5% 7/22/65 (Reg. S) | GBP | 2,350,000 | 4,001,274 |
| TOTAL UNITED KINGDOM | 7,735,251 | ||
| United States of America - 10.9% | |||
| U.S. Treasury Bonds 2.5% 2/15/46 | 7,050,000 | 6,406,413 | |
| U.S. Treasury Notes: | |||
| 1.25% 3/31/19 | 4,450,000 | 4,449,306 | |
| 1.25% 3/31/21 | 26,750,000 | 26,322,621 | |
| 1.625% 5/15/26 | 13,250,000 | 12,555,409 | |
| TOTAL UNITED STATES OF AMERICA | 49,733,749 | ||
| TOTAL GOVERNMENT OBLIGATIONS | |||
| (Cost $140,992,426) | 133,421,269 | ||
| Shares | Value | ||
| Equity Central Funds - 2.9% | |||
| Fidelity Commodity Strategy Central Fund (g) | 694,206 | 4,422,092 | |
| Fidelity Emerging Markets Equity Central Fund (g) | 40,910 | 9,044,383 | |
| TOTAL EQUITY CENTRAL FUNDS | |||
| (Cost $12,012,201) | 13,466,475 | ||
| Money Market Funds - 1.5% | |||
| Fidelity Cash Central Fund, 0.85% (h) | 5,034,703 | 5,035,710 | |
| Fidelity Securities Lending Cash Central Fund 0.86% (h)(i) | 1,613,876 | 1,614,038 | |
| TOTAL MONEY MARKET FUNDS | |||
| (Cost $6,649,738) | 6,649,748 | ||
| TOTAL INVESTMENT PORTFOLIO - 100.3% | |||
| (Cost $420,903,991) | 456,955,312 | ||
| NET OTHER ASSETS (LIABILITIES) - (0.3)% | (1,288,085) | ||
| NET ASSETS - 100% | $455,667,227 |
Currency Abbreviations
CAD – Canadian dollar
EUR – European Monetary Unit
GBP – British pound
JPY – Japanese yen
Security Type Abbreviations
ETF – Exchange-Traded Fund
Categorizations in the Schedule of Investments are based on country or territory of incorporation.
Legend
(a) Non-income producing
(b) Security or a portion of the security is on loan at period end.
(c) Security exempt from registration under Rule 144A of the Securities Act of 1933. These securities may be resold in transactions exempt from registration, normally to qualified institutional buyers. At the end of the period, the value of these securities amounted to $11,618,421 or 2.5% of net assets.
(d) Security or a portion of the security purchased on a delayed delivery or when-issued basis.
(e) Amount is stated in United States dollars unless otherwise noted.
(f) Coupon rates for floating and adjustable rate securities reflect the rates in effect at period end.
(g) Affiliated fund that is generally available only to investment companies and other accounts managed by Fidelity Investments. A complete unaudited schedule of portfolio holdings for each Fidelity Central Fund is filed with the SEC for the first and third quarters of each fiscal year on Form N-Q and is available upon request or at the SEC's website at www.sec.gov. An unaudited holdings listing for the Fund, which presents direct holdings as well as the pro-rata share of securities and other investments held indirectly through its investment in underlying non-money market Fidelity Central Funds, other than the Commodity Strategy Central Fund, is available at fidelity.com and/or institutional.fidelity.com, as applicable. In addition, each Fidelity Central Fund's financial statements, which are not covered by the Fund's Report of Independent Registered Public Accounting Firm, are available on the SEC's website or upon request.
(h) Affiliated fund that is generally available only to investment companies and other accounts managed by Fidelity Investments. The rate quoted is the annualized seven-day yield of the fund at period end. A complete unaudited listing of the fund's holdings as of its most recent quarter end is available upon request. In addition, each Fidelity Central Fund's financial statements, which are not covered by the Fund's Report of Independent Registered Public Accounting Firm, are available on the SEC's website or upon request.
(i) Investment made with cash collateral received from securities on loan.
Affiliated Central Funds
Information regarding fiscal year to date income earned by the Fund from investments in Fidelity Central Funds is as follows:
| Fund | Income earned |
| Fidelity Cash Central Fund | $18,193 |
| Fidelity Commodity Strategy Central Fund | 10,067 |
| Fidelity Emerging Markets Equity Central Fund | 60,420 |
| Fidelity Securities Lending Cash Central Fund | 13,869 |
| Total | $102,549 |
Additional information regarding the Fund's fiscal year to date purchases and sales, including the ownership percentage, of the non Money Market Central Funds is as follows:
| Fund | Value, beginning of period | Purchases | Sales Proceeds | Value, end of period | % ownership, end of period |
| Fidelity Commodity Strategy Central Fund | $3,967,940 | $3,217,937 | $2,796,877 | $4,422,092 | 0.6% |
| Fidelity Emerging Markets Equity Central Fund | 5,590,031 | 6,343,223 | 3,721,343 | 9,044,383 | 1.6% |
| Total | $9,557,971 | $9,561,160 | $6,518,220 | $13,466,475 |
Investment Valuation
The following is a summary of the inputs used, as of April 30, 2017, involving the Fund's assets and liabilities carried at fair value. The inputs or methodology used for valuing securities may not be an indication of the risk associated with investing in those securities. For more information on valuation inputs, and their aggregation into the levels used below, please refer to the Investment Valuation section in the accompanying Notes to Financial Statements.
| Valuation Inputs at Reporting Date: | ||||
| Description | Total | Level 1 | Level 2 | Level 3 |
| Investments in Securities: | ||||
| Equities: | ||||
| Consumer Discretionary | $36,264,807 | $35,625,041 | $639,766 | $-- |
| Consumer Staples | 16,499,687 | 14,173,910 | 2,325,777 | -- |
| Energy | 5,007,591 | 4,991,926 | 15,665 | -- |
| Financials | 52,297,820 | 48,819,789 | 3,478,031 | -- |
| Health Care | 33,790,087 | 31,150,990 | 2,639,097 | -- |
| Industrials | 42,119,527 | 38,709,845 | 3,409,682 | -- |
| Information Technology | 57,669,075 | 51,878,860 | 5,790,215 | -- |
| Materials | 11,277,466 | 10,816,163 | 461,303 | -- |
| Real Estate | 6,448,078 | 6,448,078 | -- | -- |
| Telecommunication Services | 4,016,760 | 2,112,301 | 1,904,459 | -- |
| Utilities | 1,622,991 | 1,622,991 | -- | -- |
| Investment Companies | 23,756,156 | 23,756,156 | -- | -- |
| Corporate Bonds | 12,647,775 | -- | 12,647,775 | -- |
| Government Obligations | 133,421,269 | -- | 133,421,269 | -- |
| Equity Central Funds | 13,466,475 | 13,466,475 | -- | -- |
| Money Market Funds | 6,649,748 | 6,649,748 | -- | -- |
| Total Investments in Securities: | $456,955,312 | $290,222,273 | $166,733,039 | $-- |
The following is a summary of transfers between Level 1 and Level 2 for the period ended April 30, 2017. Transfers are assumed to have occurred at the beginning of the period, and are primarily attributable to the valuation techniques used for foreign equity securities, as discussed in the accompanying Notes to Financial Statements:
| Transfers | Total |
| Level 1 to Level 2 | $1,035,727 |
| Level 2 to Level 1 | $4,682,378 |
Other Information
The composition of credit quality ratings as a percentage of Total Net Assets (Unaudited) is as follows. The information is based on the combined investments of the Fund and its pro-rata share of the investments of Fidelity's Central Funds, other than the Commodity Strategy and Money Market Central Funds.
| U.S. Government and U.S. Government Agency Obligations | 10.9% |
| AAA,AA,A | 13.5% |
| BBB | 4.2% |
| Not Rated | 3.5% |
| Equities | 66.6% |
| Short-Term Investments and Net Other Assets | 1.3% |
| 100.0% |
We have used ratings from Moody's Investors Service, Inc. Where Moody's® ratings are not available, we have used S&P® ratings. All ratings are as of the date indicated and do not reflect subsequent changes.
See accompanying notes which are an integral part of the financial statements.
Financial Statements
Statement of Assets and Liabilities
| April 30, 2017 | ||
| Assets | ||
| Investment in securities, at value (including securities loaned of $1,545,701) — See accompanying schedule: Unaffiliated issuers (cost $402,242,052) | $436,839,089 | |
| Fidelity Central Funds (cost $18,661,939) | 20,116,223 | |
| Total Investments (cost $420,903,991) | $456,955,312 | |
| Receivable for investments sold | 9,927,407 | |
| Receivable for fund shares sold | 169,325 | |
| Dividends receivable | 623,911 | |
| Interest receivable | 579,335 | |
| Distributions receivable from Fidelity Central Funds | 6,750 | |
| Prepaid expenses | 326 | |
| Other receivables | 38,937 | |
| Total assets | 468,301,303 | |
| Liabilities | ||
| Payable to custodian bank | $1,385,174 | |
| Payable for investments purchased | ||
| Regular delivery | 7,736,721 | |
| Delayed delivery | 16,234 | |
| Payable for fund shares redeemed | 1,407,322 | |
| Accrued management fee | 261,844 | |
| Distribution and service plan fees payable | 34,959 | |
| Other affiliated payables | 91,211 | |
| Other payables and accrued expenses | 86,608 | |
| Collateral on securities loaned | 1,614,003 | |
| Total liabilities | 12,634,076 | |
| Net Assets | $455,667,227 | |
| Net Assets consist of: | ||
| Paid in capital | $411,392,421 | |
| Undistributed net investment income | 372,035 | |
| Accumulated undistributed net realized gain (loss) on investments and foreign currency transactions | 7,853,928 | |
| Net unrealized appreciation (depreciation) on investments and assets and liabilities in foreign currencies | 36,048,843 | |
| Net Assets | $455,667,227 | |
| Calculation of Maximum Offering Price | ||
| Class A: | ||
| Net Asset Value and redemption price per share ($39,074,497 ÷ 1,671,496 shares) | $23.38 | |
| Maximum offering price per share (100/94.25 of $23.38) | $24.81 | |
| Class M: | ||
| Net Asset Value and redemption price per share ($14,088,353 ÷ 608,792 shares) | $23.14 | |
| Maximum offering price per share (100/96.50 of $23.14) | $23.98 | |
| Class C: | ||
| Net Asset Value and offering price per share ($25,616,470 ÷ 1,133,715 shares)(a) | $22.60 | |
| Global Balanced: | ||
| Net Asset Value, offering price and redemption price per share ($371,291,212 ÷ 15,666,278 shares) | $23.70 | |
| Class I: | ||
| Net Asset Value, offering price and redemption price per share ($5,596,695 ÷ 236,836 shares) | $23.63 |
(a) Redemption price per share is equal to net asset value less any applicable contingent deferred sales charge.
See accompanying notes which are an integral part of the financial statements.
Statement of Operations
| Six months ended April 30, 2017 | ||
| Investment Income | ||
| Dividends | $2,333,662 | |
| Interest | 916,422 | |
| Income from Fidelity Central Funds | 102,549 | |
| Income before foreign taxes withheld | 3,352,633 | |
| Less foreign taxes withheld | (103,291) | |
| Total income | 3,249,342 | |
| Expenses | ||
| Management fee | $1,626,906 | |
| Transfer agent fees | 445,457 | |
| Distribution and service plan fees | 212,689 | |
| Accounting and security lending fees | 121,133 | |
| Custodian fees and expenses | 78,956 | |
| Independent trustees' fees and expenses | 970 | |
| Registration fees | 72,350 | |
| Audit | 77,388 | |
| Legal | 4,943 | |
| Miscellaneous | 1,928 | |
| Total expenses before reductions | 2,642,720 | |
| Expense reductions | (40,420) | 2,602,300 |
| Net investment income (loss) | 647,042 | |
| Realized and Unrealized Gain (Loss) | ||
| Net realized gain (loss) on: | ||
| Investment securities: | ||
| Unaffiliated issuers | 10,257,150 | |
| Fidelity Central Funds | 83,084 | |
| Foreign currency transactions | (62,112) | |
| Capital gain distributions from Fidelity Central Funds | 41,001 | |
| Total net realized gain (loss) | 10,319,123 | |
| Change in net unrealized appreciation (depreciation) on: Investment securities | 8,992,922 | |
| Assets and liabilities in foreign currencies | 29,913 | |
| Total change in net unrealized appreciation (depreciation) | 9,022,835 | |
| Net gain (loss) | 19,341,958 | |
| Net increase (decrease) in net assets resulting from operations | $19,989,000 |
See accompanying notes which are an integral part of the financial statements.
Statement of Changes in Net Assets
| Six months ended April 30, 2017 | Year ended October 31, 2016 | |
| Increase (Decrease) in Net Assets | ||
| Operations | ||
| Net investment income (loss) | $647,042 | $2,437,965 |
| Net realized gain (loss) | 10,319,123 | 555,602 |
| Change in net unrealized appreciation (depreciation) | 9,022,835 | 9,847,356 |
| Net increase (decrease) in net assets resulting from operations | 19,989,000 | 12,840,923 |
| Distributions to shareholders from net investment income | (284,906) | – |
| Distributions to shareholders from net realized gain | (1,766,054) | (15,584,739) |
| Total distributions | (2,050,960) | (15,584,739) |
| Share transactions - net increase (decrease) | (74,107,200) | (38,129,692) |
| Redemption fees | 1,172 | 6,276 |
| Total increase (decrease) in net assets | (56,167,988) | (40,867,232) |
| Net Assets | ||
| Beginning of period | 511,835,215 | 552,702,447 |
| End of period | $455,667,227 | $511,835,215 |
| Other Information | ||
| Undistributed net investment income end of period | $372,035 | $9,899 |
See accompanying notes which are an integral part of the financial statements.
Financial Highlights — Fidelity Global Balanced Fund Class A
| Six months ended April 30, | Years ended October 31, | |||||
| 2017 | 2016 | 2015 | 2014 | 2013 | 2012 | |
| Selected Per–Share Data | ||||||
| Net asset value, beginning of period | $22.43 | $22.58 | $24.65 | $26.18 | $23.45 | $22.05 |
| Income from Investment Operations | ||||||
| Net investment income (loss)A | .01 | .06 | .09 | .15 | .13 | .27 |
| Net realized and unrealized gain (loss) | 1.03 | .44 | (.45) | .49 | 3.13 | 1.41 |
| Total from investment operations | 1.04 | .50 | (.36) | .64 | 3.26 | 1.68 |
| Distributions from net investment income | (.01) | – | (.01) | (.10) | (.24) | (.19) |
| Distributions from net realized gain | (.08) | (.65) | (1.70) | (2.07) | (.29) | (.09) |
| Total distributions | (.09) | (.65) | (1.71) | (2.17) | (.53) | (.28) |
| Redemption fees added to paid in capitalA,B | – | – | – | – | – | – |
| Net asset value, end of period | $23.38 | $22.43 | $22.58 | $24.65 | $26.18 | $23.45 |
| Total ReturnC,D,E | 4.64% | 2.35% | (1.48)% | 2.69% | 14.19% | 7.74% |
| Ratios to Average Net AssetsF,G | ||||||
| Expenses before reductions | 1.31%H | 1.30% | 1.29% | 1.28% | 1.31% | 1.33% |
| Expenses net of fee waivers, if any | 1.31%H | 1.30% | 1.29% | 1.28% | 1.31% | 1.33% |
| Expenses net of all reductions | 1.29%H | 1.29% | 1.27% | 1.27% | 1.29% | 1.32% |
| Net investment income (loss) | .10%H | .27% | .41% | .58% | .55% | 1.18% |
| Supplemental Data | ||||||
| Net assets, end of period (000 omitted) | $39,074 | $41,067 | $42,165 | $47,048 | $38,972 | $26,714 |
| Portfolio turnover rateI | 164%H | 155% | 140% | 157% | 181% | 157% |
A Calculated based on average shares outstanding during the period.
B Amount represents less than $.005 per share.
C Total returns for periods of less than one year are not annualized.
D Total returns would have been lower if certain expenses had not been reduced during the applicable periods shown.
E Total returns do not include the effect of the sales charges.
F Fees and expenses of any underlying Fidelity Central Funds are not included in the Fund's expense ratio. The Fund indirectly bears its proportionate share of the expenses of any underlying Fidelity Central Funds. Based on their most recent shareholder report date, the expenses of any underlying non-money market Fidelity Central Funds ranged from .05% to .08%.
G Expense ratios reflect operating expenses of the class. Expenses before reductions do not reflect amounts reimbursed by the investment adviser or reductions from brokerage service arrangements or reductions from other expense offset arrangements and do not represent the amount paid by the class during periods when reimbursements or reductions occur. Expenses net of fee waivers reflect expenses after reimbursement by the investment adviser but prior to reductions from brokerage service arrangements or other expense offset arrangements. Expenses net of all reductions represent the net expenses paid by the class.
H Annualized
I Amount does not include the portfolio activity of any underlying Fidelity Central Funds.
See accompanying notes which are an integral part of the financial statements.
Financial Highlights — Fidelity Global Balanced Fund Class M
| Six months ended April 30, | Years ended October 31, | |||||
| 2017 | 2016 | 2015 | 2014 | 2013 | 2012 | |
| Selected Per–Share Data | ||||||
| Net asset value, beginning of period | $22.23 | $22.44 | $24.52 | $26.04 | $23.32 | $21.96 |
| Income from Investment Operations | ||||||
| Net investment income (loss)A | (.02) | –B | .03 | .08 | .07 | .21 |
| Net realized and unrealized gain (loss) | 1.01 | .44 | (.46) | .49 | 3.12 | 1.41 |
| Total from investment operations | .99 | .44 | (.43) | .57 | 3.19 | 1.62 |
| Distributions from net investment income | – | – | – | (.02) | (.18) | (.17) |
| Distributions from net realized gain | (.08) | (.65) | (1.65) | (2.07) | (.29) | (.09) |
| Total distributions | (.08) | (.65) | (1.65) | (2.09) | (.47) | (.26) |
| Redemption fees added to paid in capitalA,B | – | – | – | – | – | – |
| Net asset value, end of period | $23.14 | $22.23 | $22.44 | $24.52 | $26.04 | $23.32 |
| Total ReturnC,D,E | 4.48% | 2.08% | (1.80)% | 2.40% | 13.94% | 7.46% |
| Ratios to Average Net AssetsF,G | ||||||
| Expenses before reductions | 1.60%H | 1.58% | 1.56% | 1.55% | 1.57% | 1.58% |
| Expenses net of fee waivers, if any | 1.60%H | 1.58% | 1.56% | 1.55% | 1.57% | 1.58% |
| Expenses net of all reductions | 1.58%H | 1.57% | 1.55% | 1.55% | 1.55% | 1.57% |
| Net investment income (loss) | (.19)%H | (.01)% | .14% | .31% | .28% | .94% |
| Supplemental Data | ||||||
| Net assets, end of period (000 omitted) | $14,088 | $15,368 | $16,867 | $17,662 | $14,650 | $13,654 |
| Portfolio turnover rateI | 164%H | 155% | 140% | 157% | 181% | 157% |
A Calculated based on average shares outstanding during the period.
B Amount represents less than $.005 per share.
C Total returns for periods of less than one year are not annualized.
D Total returns would have been lower if certain expenses had not been reduced during the applicable periods shown.
E Total returns do not include the effect of the sales charges.
F Fees and expenses of any underlying Fidelity Central Funds are not included in the Fund's expense ratio. The Fund indirectly bears its proportionate share of the expenses of any underlying Fidelity Central Funds. Based on their most recent shareholder report date, the expenses of any underlying non-money market Fidelity Central Funds ranged from .05% to .08%.
G Expense ratios reflect operating expenses of the class. Expenses before reductions do not reflect amounts reimbursed by the investment adviser or reductions from brokerage service arrangements or reductions from other expense offset arrangements and do not represent the amount paid by the class during periods when reimbursements or reductions occur. Expenses net of fee waivers reflect expenses after reimbursement by the investment adviser but prior to reductions from brokerage service arrangements or other expense offset arrangements. Expenses net of all reductions represent the net expenses paid by the class.
H Annualized
I Amount does not include the portfolio activity of any underlying Fidelity Central Funds.
See accompanying notes which are an integral part of the financial statements.
Financial Highlights — Fidelity Global Balanced Fund Class C
| Six months ended April 30, | Years ended October 31, | |||||
| 2017 | 2016 | 2015 | 2014 | 2013 | 2012 | |
| Selected Per–Share Data | ||||||
| Net asset value, beginning of period | $21.76 | $22.10 | $24.17 | $25.76 | $23.09 | $21.73 |
| Income from Investment Operations | ||||||
| Net investment income (loss)A | (.08) | (.12) | (.09) | (.05) | (.06) | .09 |
| Net realized and unrealized gain (loss) | 1.00 | .43 | (.46) | .49 | 3.08 | 1.41 |
| Total from investment operations | .92 | .31 | (.55) | .44 | 3.02 | 1.50 |
| Distributions from net investment income | – | – | – | – | (.06) | (.05) |
| Distributions from net realized gain | (.08) | (.65) | (1.52) | (2.03) | (.29) | (.09) |
| Total distributions | (.08) | (.65) | (1.52) | (2.03) | (.35) | (.14) |
| Redemption fees added to paid in capitalA,B | – | – | – | – | – | – |
| Net asset value, end of period | $22.60 | $21.76 | $22.10 | $24.17 | $25.76 | $23.09 |
| Total ReturnC,D,E | 4.25% | 1.51% | (2.33)% | 1.89% | 13.27% | 6.94% |
| Ratios to Average Net AssetsF,G | ||||||
| Expenses before reductions | 2.13%H | 2.11% | 2.10% | 2.08% | 2.12% | 2.13% |
| Expenses net of fee waivers, if any | 2.13%H | 2.11% | 2.09% | 2.08% | 2.12% | 2.13% |
| Expenses net of all reductions | 2.11%H | 2.10% | 2.08% | 2.07% | 2.10% | 2.12% |
| Net investment income (loss) | (.72)%H | (.54)% | (.40)% | (.22)% | (.26)% | .39% |
| Supplemental Data | ||||||
| Net assets, end of period (000 omitted) | $25,616 | $27,401 | $28,505 | $29,809 | $20,997 | $13,797 |
| Portfolio turnover rateI | 164%H | 155% | 140% | 157% | 181% | 157% |
A Calculated based on average shares outstanding during the period.
B Amount represents less than $.005 per share.
C Total returns for periods of less than one year are not annualized.
D Total returns would have been lower if certain expenses had not been reduced during the applicable periods shown.
E Total returns do not include the effect of the contingent deferred sales charge.
F Fees and expenses of any underlying Fidelity Central Funds are not included in the Fund's expense ratio. The Fund indirectly bears its proportionate share of the expenses of any underlying Fidelity Central Funds. Based on their most recent shareholder report date, the expenses of any underlying non-money market Fidelity Central Funds ranged from .05% to .08%.
G Expense ratios reflect operating expenses of the class. Expenses before reductions do not reflect amounts reimbursed by the investment adviser or reductions from brokerage service arrangements or reductions from other expense offset arrangements and do not represent the amount paid by the class during periods when reimbursements or reductions occur. Expenses net of fee waivers reflect expenses after reimbursement by the investment adviser but prior to reductions from brokerage service arrangements or other expense offset arrangements. Expenses net of all reductions represent the net expenses paid by the class.
H Annualized
I Amount does not include the portfolio activity of any underlying Fidelity Central Funds.
See accompanying notes which are an integral part of the financial statements.
Financial Highlights — Fidelity Global Balanced Fund
| Six months ended April 30, | Years ended October 31, | |||||
| 2017 | 2016 | 2015 | 2014 | 2013 | 2012 | |
| Selected Per–Share Data | ||||||
| Net asset value, beginning of period | $22.71 | $22.79 | $24.87 | $26.38 | $23.62 | $22.18 |
| Income from Investment Operations | ||||||
| Net investment income (loss)A | .04 | .13 | .16 | .22 | .21 | .33 |
| Net realized and unrealized gain (loss) | 1.05 | .44 | (.47) | .50 | 3.14 | 1.44 |
| Total from investment operations | 1.09 | .57 | (.31) | .72 | 3.35 | 1.77 |
| Distributions from net investment income | (.02) | – | (.08) | (.16) | (.30) | (.24) |
| Distributions from net realized gain | (.08) | (.65) | (1.70) | (2.07) | (.29) | (.09) |
| Total distributions | (.10) | (.65) | (1.77)B | (2.23) | (.59) | (.33) |
| Redemption fees added to paid in capitalA,C | – | – | – | – | – | – |
| Net asset value, end of period | $23.70 | $22.71 | $22.79 | $24.87 | $26.38 | $23.62 |
| Total ReturnD,E | 4.81% | 2.64% | (1.24)% | 3.00% | 14.52% | 8.11% |
| Ratios to Average Net AssetsF,G | ||||||
| Expenses before reductions | 1.03%H | 1.01% | 1.00% | .99% | 1.02% | 1.03% |
| Expenses net of fee waivers, if any | 1.03%H | 1.01% | 1.00% | .99% | 1.02% | 1.03% |
| Expenses net of all reductions | 1.01%H | 1.00% | .99% | .99% | 1.00% | 1.02% |
| Net investment income (loss) | .38%H | .56% | .70% | .87% | .84% | 1.48% |
| Supplemental Data | ||||||
| Net assets, end of period (000 omitted) | $371,291 | $422,406 | $457,766 | $554,896 | $540,412 | $468,758 |
| Portfolio turnover rateI | 164%H | 155% | 140% | 157% | 181% | 157% |
A Calculated based on average shares outstanding during the period.
B Total distributions of $1.77 per share is comprised of distributions from net investment income of $.075 and distributions from net realized gain of $1.697 per share.
C Amount represents less than $.005 per share.
D Total returns for periods of less than one year are not annualized.
E Total returns would have been lower if certain expenses had not been reduced during the applicable periods shown.
F Fees and expenses of any underlying Fidelity Central Funds are not included in the Fund's expense ratio. The Fund indirectly bears its proportionate share of the expenses of any underlying Fidelity Central Funds. Based on their most recent shareholder report date, the expenses of any underlying non-money market Fidelity Central Funds ranged from .05% to .08%.
G Expense ratios reflect operating expenses of the class. Expenses before reductions do not reflect amounts reimbursed by the investment adviser or reductions from brokerage service arrangements or reductions from other expense offset arrangements and do not represent the amount paid by the class during periods when reimbursements or reductions occur. Expenses net of fee waivers reflect expenses after reimbursement by the investment adviser but prior to reductions from brokerage service arrangements or other expense offset arrangements. Expenses net of all reductions represent the net expenses paid by the class.
H Annualized
I Amount does not include the portfolio activity of any underlying Fidelity Central Funds.
See accompanying notes which are an integral part of the financial statements.
Financial Highlights - Fidelity Global Balanced Fund Class I
| Six months ended April 30, | Years ended October 31, | |||||
| 2017 | 2016 | 2015 | 2014 | 2013 | 2012 | |
| Selected Per–Share Data | ||||||
| Net asset value, beginning of period | $22.65 | $22.72 | $24.80 | $26.33 | $23.58 | $22.16 |
| Income from Investment Operations | ||||||
| Net investment income (loss)A | .04 | .13 | .16 | .21 | .20 | .33 |
| Net realized and unrealized gain (loss) | 1.04 | .45 | (.47) | .49 | 3.14 | 1.43 |
| Total from investment operations | 1.08 | .58 | (.31) | .70 | 3.34 | 1.76 |
| Distributions from net investment income | (.02) | – | (.07) | (.17) | (.30) | (.25) |
| Distributions from net realized gain | (.08) | (.65) | (1.70) | (2.07) | (.29) | (.09) |
| Total distributions | (.10) | (.65) | (1.77) | (2.23)B | (.59) | (.34) |
| Redemption fees added to paid in capitalA,C | – | – | – | – | – | – |
| Net asset value, end of period | $23.63 | $22.65 | $22.72 | $24.80 | $26.33 | $23.58 |
| Total ReturnD,E | 4.77% | 2.69% | (1.25)% | 2.95% | 14.50% | 8.10% |
| Ratios to Average Net AssetsF,G | ||||||
| Expenses before reductions | 1.01%H | 1.00% | 1.01% | 1.02% | 1.03% | 1.04% |
| Expenses net of fee waivers, if any | 1.01%H | 1.00% | 1.01% | 1.02% | 1.03% | 1.04% |
| Expenses net of all reductions | 1.00%H | .99% | 1.00% | 1.02% | 1.01% | 1.03% |
| Net investment income (loss) | .39%H | .57% | .68% | .84% | .83% | 1.48% |
| Supplemental Data | ||||||
| Net assets, end of period (000 omitted) | $5,597 | $5,594 | $6,048 | $6,537 | $3,183 | $1,966 |
| Portfolio turnover rateI | 164%H | 155% | 140% | 157% | 181% | 157% |
A Calculated based on average shares outstanding during the period.
B Total distributions of $2.23 per share is comprised of distributions from net investment income of $.167 and distributions from net realized gain of $2.065 per share.
C Amount represents less than $.005 per share.
D Total returns for periods of less than one year are not annualized.
E Total returns would have been lower if certain expenses had not been reduced during the applicable periods shown.
F Fees and expenses of any underlying Fidelity Central Funds are not included in the Fund's expense ratio. The Fund indirectly bears its proportionate share of the expenses of any underlying Fidelity Central Funds. Based on their most recent shareholder report date, the expenses of any underlying non-money market Fidelity Central Funds ranged from .05% to .08%.
G Expense ratios reflect operating expenses of the class. Expenses before reductions do not reflect amounts reimbursed by the investment adviser or reductions from brokerage service arrangements or reductions from other expense offset arrangements and do not represent the amount paid by the class during periods when reimbursements or reductions occur. Expenses net of fee waivers reflect expenses after reimbursement by the investment adviser but prior to reductions from brokerage service arrangements or other expense offset arrangements. Expenses net of all reductions represent the net expenses paid by the class.
H Annualized
I Amount does not include the portfolio activity of any underlying Fidelity Central Funds.
See accompanying notes which are an integral part of the financial statements.
Notes to Financial Statements
For the period ended April 30, 2017
1. Organization.
Fidelity Global Balanced Fund (the Fund) is a fund of Fidelity Charles Street Trust (the Trust) and is authorized to issue an unlimited number of shares. The Trust is registered under the Investment Company Act of 1940, as amended (the 1940 Act), as an open-end management investment company organized as a Massachusetts business trust. The Fund offers Class A, Class M (formerly Class T), Class C, Global Balanced and Class I shares, each of which has equal rights as to assets and voting privileges. Each class has exclusive voting rights with respect to matters that affect that class.
After the close of business on June 24, 2016, all outstanding Class B shares were converted to Class A shares. All prior fiscal period dollar and share amounts for Class B presented in the Notes to Financial Statements are for the period November 1, 2015 through June 24, 2016.
2. Investments in Fidelity Central Funds.
The Fund invests in Fidelity Central Funds, which are open-end investment companies generally available only to other investment companies and accounts managed by the investment adviser and its affiliates. The Fund's Schedule of Investments lists each of the Fidelity Central Funds held as of period end, if any, as an investment of the Fund, but does not include the underlying holdings of each Fidelity Central Fund. As an Investing Fund, the Fund indirectly bears its proportionate share of the expenses of the underlying Fidelity Central Funds.
Based on its investment objective, each Fidelity Central Fund may invest or participate in various investment vehicles or strategies that are similar to those of the Fund. These strategies are consistent with the investment objectives of the Fund and may involve certain economic risks which may cause a decline in value of each of the Fidelity Central Funds and thus a decline in the value of the Fund. The Money Market Central Funds seek preservation of capital and current income and are managed by Fidelity Investments Money Management, Inc. (FIMM), an affiliate of the investment adviser. Annualized expenses of the Money Market Central Funds as of their most recent shareholder report date are less than .005%. The following summarizes the Fund's investment in each non-money market Fidelity Central Fund.
| Fidelity Central Fund | Investment Manager | Investment Objective | Investment Practices | Expense Ratio(a) |
| Fidelity Commodity Strategy Central Fund | Geode Capital Management, LLC (Geode) | Seeks to provide investment returns that correspond to the performance of the commodities market. | Investment in commodity-related investments through a wholly-owned subsidiary organized under the laws of the Cayman Islands Futures | .05% |
| Fidelity Emerging Markets Equity Central Fund | FMR Co., Inc. (FMRC) | Seeks capital appreciation by investing primarily in equity securities of issuers in emerging markets. | Foreign Securities Futures | .08% |
(a) Expenses expressed as a percentage of average net assets and are as of each underlying Central Fund's most recent annual or semi-annual shareholder report.
An unaudited holdings listing for the Fund, which presents direct holdings as well as the pro-rata share of any securities and other investments held indirectly through its investment in underlying non-money market Fidelity Central Funds, is available at fidelity.com and/or institutional.fidelity.com, as applicable. A complete unaudited list of holdings for each Fidelity Central Fund is available upon request or at the Securities and Exchange Commission (the SEC) website at www.sec.gov. In addition, the financial statements of the Fidelity Central Funds which contain the significant accounting policies (including investment valuation policies) of those funds, which are not covered by the Fund's Report of Independent Registered Public Accounting Firm, are available on the SEC website or upon request.
3. Significant Accounting Policies.
The Fund is an investment company and applies the accounting and reporting guidance of the Financial Accounting Standards Board (FASB) Accounting Standards Codification Topic 946 Financial Services – Investments Companies. The financial statements have been prepared in conformity with accounting principles generally accepted in the United States of America (GAAP), which require management to make certain estimates and assumptions at the date of the financial statements. Actual results could differ from those estimates. Subsequent events, if any, through the date that the financial statements were issued have been evaluated in the preparation of the financial statements. The following summarizes the significant accounting policies of the Fund:
Investment Valuation. Investments are valued as of 4:00 p.m. Eastern time on the last calendar day of the period. The Board of Trustees (the Board) has delegated the day to day responsibility for the valuation of the Fund's investments to the Fair Value Committee (the Committee) established by the Fund's investment adviser. In accordance with valuation policies and procedures approved by the Board, the Fund attempts to obtain prices from one or more third party pricing vendors or brokers to value its investments. When current market prices, quotations or currency exchange rates are not readily available or reliable, investments will be fair valued in good faith by the Committee, in accordance with procedures adopted by the Board. Factors used in determining fair value vary by investment type and may include market or investment specific events, changes in interest rates and credit quality. The frequency with which these procedures are used cannot be predicted and they may be utilized to a significant extent. The Committee oversees the Fund's valuation policies and procedures and reports to the Board on the Committee's activities and fair value determinations. The Board monitors the appropriateness of the procedures used in valuing the Fund's investments and ratifies the fair value determinations of the Committee.
The Fund categorizes the inputs to valuation techniques used to value its investments into a disclosure hierarchy consisting of three levels as shown below:
- Level 1 – quoted prices in active markets for identical investments
- Level 2 – other significant observable inputs (including quoted prices for similar investments, interest rates, prepayment speeds, etc.)
- Level 3 – unobservable inputs (including the Fund's own assumptions based on the best information available)
Valuation techniques used to value the Fund's investments by major category are as follows:
Equity securities, including restricted securities, for which market quotations are readily available, are valued at the last reported sale price or official closing price as reported by a third party pricing vendor on the primary market or exchange on which they are traded and are categorized as Level 1 in the hierarchy. In the event there were no sales during the day or closing prices are not available, securities are valued at the last quoted bid price or may be valued using the last available price and are generally categorized as Level 2 in the hierarchy. For foreign equity securities, when market or security specific events arise, comparisons to the valuation of American Depositary Receipts (ADRs), futures contracts, Exchange-Traded Funds (ETFs) and certain indexes as well as quoted prices for similar securities may be used and would be categorized as Level 2 in the hierarchy. Utilizing these techniques may result in transfers between Level 1 and Level 2. For equity securities, including restricted securities, where observable inputs are limited, assumptions about market activity and risk are used and these securities may be categorized as Level 3 in the hierarchy.
Debt securities, including restricted securities, are valued based on evaluated prices received from third party pricing vendors or from brokers who make markets in such securities. Corporate bonds, foreign government and government agency obligations and U.S. government and government agency obligations are valued by pricing vendors who utilize matrix pricing which considers yield or price of bonds of comparable quality, coupon, maturity and type or by broker-supplied prices. When independent prices are unavailable or unreliable, debt securities may be valued utilizing pricing methodologies which consider similar factors that would be used by third party pricing vendors. Debt securities are generally categorized as Level 2 in the hierarchy but may be Level 3 depending on the circumstances. ETFs are valued at their last sale price or official closing price as reported by a third party pricing vendor on the primary market or exchange on which they are traded and are categorized as Level 1 in the hierarchy. In the event there were no sales during the day but the exchange reports a closing bid level, ETFs are valued at the closing bid and would be categorized as Level 1 in the hierarchy. In the event there was no closing bid, ETFs may be valued by another method that the Board believes reflects fair value in accordance with the Board's fair value pricing policies and may be categorized as Level 2 in the hierarchy.
Investments in open-end mutual funds, including the Fidelity Central Funds, are valued at their closing net asset value (NAV) each business day and are categorized as Level 1 in the hierarchy.
Changes in valuation techniques may result in transfers in or out of an assigned level within the disclosure hierarchy. The aggregate value of investments by input level as of April 30, 2017, including information on transfers between Levels 1 and 2, is included at the end of the Fund's Schedule of Investments.
Foreign Currency. The Fund may use foreign currency contracts to facilitate transactions in foreign-denominated securities. Gains and losses from these transactions may arise from changes in the value of the foreign currency or if the counterparties do not perform under the contracts' terms.
Foreign-denominated assets, including investment securities, and liabilities are translated into U.S. dollars at the exchange rates at period end. Purchases and sales of investment securities, income and dividends received and expenses denominated in foreign currencies are translated into U.S. dollars at the exchange rate in effect on the transaction date.
The effects of exchange rate fluctuations on investments are included with the net realized and unrealized gain (loss) on investment securities. Other foreign currency transactions resulting in realized and unrealized gain (loss) are disclosed separately.
Investment Transactions and Income. For financial reporting purposes, the Fund's investment holdings and NAV include trades executed through the end of the last business day of the period. The NAV per share for processing shareholder transactions is calculated as of the close of business of the New York Stock Exchange (NYSE), normally 4:00 p.m. Eastern time and includes trades executed through the end of the prior business day. Gains and losses on securities sold are determined on the basis of identified cost and may include proceeds received from litigation. Dividend income is recorded on the ex-dividend date, except for certain dividends from foreign securities where the ex-dividend date may have passed, which are recorded as soon as the Fund is informed of the ex-dividend date. Non-cash dividends included in dividend income, if any, are recorded at the fair market value of the securities received. Income and capital gain distributions from Fidelity Central Funds, if any, are recorded on the ex-dividend date. Certain distributions received by the Fund represent a return of capital or capital gain. The Fund determines the components of these distributions subsequent to the ex-dividend date, based upon receipt of tax filings or other correspondence relating to the underlying investment. These distributions are recorded as a reduction of cost of investments and/or as a realized gain. Interest income is accrued as earned and includes coupon interest and amortization of premium and accretion of discount on debt securities as applicable. Investment income is recorded net of foreign taxes withheld where recovery of such taxes is uncertain. Debt obligations may be placed on non-accrual status and related interest income may be reduced by ceasing current accruals and writing off interest receivables when the collection of all or a portion of interest has become doubtful based on consistently applied procedures. A debt obligation is removed from non-accrual status when the issuer resumes interest payments or when collectability of interest is reasonably assured.
Class Allocations and Expenses. Investment income, realized and unrealized capital gains and losses, common expenses of the Fund, and certain fund-level expense reductions, if any, are allocated daily on a pro-rata basis to each class based on the relative net assets of each class to the total net assets of the Fund. Each class differs with respect to transfer agent and distribution and service plan fees incurred. Certain expense reductions may also differ by class. For the reporting period, the allocated portion of income and expenses to each class as a percent of its average net assets may vary due to the timing of recording these transactions in relation to fluctuating net assets of the classes. Expenses directly attributable to a fund are charged to that fund. Expenses attributable to more than one fund are allocated among the respective funds on the basis of relative net assets or other appropriate methods. Expense estimates are accrued in the period to which they relate and adjustments are made when actual amounts are known.
Income Tax Information and Distributions to Shareholders. Each year, the Fund intends to qualify as a regulated investment company under Subchapter M of the Internal Revenue Code, including distributing substantially all of its taxable income and realized gains. As a result, no provision for U.S. Federal income taxes is required. The Fund files a U.S. federal tax return, in addition to state and local tax returns as required. The Fund's federal income tax returns are subject to examination by the Internal Revenue Service (IRS) for a period of three fiscal years after they are filed. State and local tax returns may be subject to examination for an additional fiscal year depending on the jurisdiction. Foreign taxes are provided for based on the Fund's understanding of the tax rules and rates that exist in the foreign markets in which it invests.
Distributions are declared and recorded on the ex-dividend date. Income dividends and capital gain distributions are declared separately for each class. Income and capital gain distributions are determined in accordance with income tax regulations, which may differ from GAAP.
Capital accounts within the financial statements are adjusted for permanent book-tax differences. These adjustments have no impact on net assets or the results of operations. Capital accounts are not adjusted for temporary book-tax differences which will reverse in a subsequent period.
Book-tax differences are primarily due to foreign currency transactions, passive foreign investment companies (PFIC), market discount, partnerships (including allocations from Fidelity Central Funds), deferred trustees compensation, net operating losses, losses deferred due to wash sales and excise tax regulations.
The federal tax cost of investment securities and unrealized appreciation (depreciation) as of period end were as follows:
| Gross unrealized appreciation | $50,353,565 |
| Gross unrealized depreciation | (15,186,393) |
| Net unrealized appreciation (depreciation) on securities | $35,167,172 |
| Tax cost | $421,788,140 |
Short-Term Trading (Redemption) Fees. Shares held by investors in the Fund less than 30 days may have been subject to a redemption fee equal to 1.00% of the NAV of shares redeemed. All redemption fees, which reduce the proceeds of the shareholder redemption, are retained by the Fund and accounted for as an addition to paid in capital. In November 2016, the Board of Trustees approved the elimination of these redemption fees effective December 12, 2016.
Delayed Delivery Transactions and When-Issued Securities. During the period, the Fund transacted in securities on a delayed delivery or when-issued basis. Payment and delivery may take place after the customary settlement period for that security. The price of the underlying securities and the date when the securities will be delivered and paid for are fixed at the time the transaction is negotiated. The securities purchased on a delayed delivery or when-issued basis are identified as such in the Fund's Schedule of Investments. The Fund may receive compensation for interest forgone in the purchase of a delayed delivery or when-issued security. With respect to purchase commitments, the Fund identifies securities as segregated in its records with a value at least equal to the amount of the commitment. Losses may arise due to changes in the value of the underlying securities or if the counterparty does not perform under the contract's terms, or if the issuer does not issue the securities due to political, economic, or other factors.
Restricted Securities. The Fund may invest in securities that are subject to legal or contractual restrictions on resale. These securities generally may be resold in transactions exempt from registration or to the public if the securities are registered. Disposal of these securities may involve time-consuming negotiations and expense, and prompt sale at an acceptable price may be difficult. Information regarding restricted securities is included at the end of the Fund's Schedule of Investments.
New Accounting Pronouncement. In March 2017, the Financial Accounting Standards Board (FASB) issued an Accounting Standards Update (ASU), ASU 2017-08, which amends the amortization period for certain callable debt securities that are held at a premium. The amendment requires the premium to be amortized to the earliest call date. The amendments do not require an accounting change for securities held at a discount. The ASU is effective for annual periods beginning after December 15, 2019. Management is currently evaluating the potential impact of these changes to the financial statements.
4. Purchases and Sales of Investments.
Purchases and sales of securities (including the Equity Central Funds), other than short-term securities and U.S. government securities, aggregated $364,773,583 and $437,930,506, respectively.
5. Fees and Other Transactions with Affiliates.
Management Fee. Fidelity Management & Research Company (the investment adviser) and its affiliates provide the Fund with investment management related services for which the Fund pays a monthly management fee. The management fee is the sum of an individual fund fee rate that is based on an annual rate of .45% of the Fund's average net assets and an annualized group fee rate that averaged .25% during the period. The group fee rate is based upon the average net assets of all the mutual funds advised by the investment adviser, including any mutual funds previously advised by the investment adviser that are currently advised by Fidelity SelectCo, LLC, an affiliate of the investment adviser. The group fee rate decreases as assets under management increase and increases as assets under management decrease. For the reporting period, the total annualized management fee rate was .70% of the Fund's average net assets.
Distribution and Service Plan Fees. In accordance with Rule 12b-1 of the 1940 Act, the Fund has adopted separate Distribution and Service Plans for each class of shares. Certain classes pay Fidelity Distributors Corporation (FDC), an affiliate of the investment adviser, separate Distribution and Service Fees, each of which is based on an annual percentage of each class' average net assets. In addition, FDC may pay financial intermediaries for selling shares of the Fund and providing shareholder support services. For the period, the Distribution and Service Fee rates, total fees and amounts retained by FDC were as follows:
| Distribution Fee | Service Fee | Total Fees | Retained by FDC |
|
| Class A | -% | .25% | $49,118 | $445 |
| Class M | .25% | .25% | 35,688 | 478 |
| Class C | .75% | .25% | 127,883 | 13,474 |
| $212,689 | $14,397 |
Sales Load. FDC may receive a front-end sales charge of up to 5.75% for selling Class A shares and 3.50% for selling Class M shares, some of which is paid to financial intermediaries for selling shares of the Fund. Depending on the holding period, FDC may receive contingent deferred sales charges levied on Class A, Class M, and Class C redemptions. The deferred sales charges are 1.00% for Class C shares, 1.00% for certain purchases of Class A shares and .25% for certain purchases of Class M shares.
For the period, sales charge amounts retained by FDC were as follows:
| Retained by FDC |
|
| Class A | $5,068 |
| Class M | 1,391 |
| Class C(a) | 1,258 |
| $7,717 |
(a) When Class C shares are initially sold, FDC pays commissions from its own resources to financial intermediaries through which the sales are made.
Transfer Agent Fees. Fidelity Investments Institutional Operations Company, Inc., (FIIOC), an affiliate of the investment adviser, is the transfer, dividend disbursing and shareholder servicing agent for each class of the Fund. FIIOC receives account fees and asset-based fees that vary according to the account size and type of account of the shareholders of the respective classes of the Fund. FIIOC pays for typesetting, printing and mailing of shareholder reports, except proxy statements.
For the period, transfer agent fees for each class were as follows:
| Amount | % of Class-Level Average Net Assets(a) |
|
| Class A | $41,858 | .21 |
| Class M | 17,943 | .25 |
| Class C | 36,049 | .28 |
| Global Balanced | 345,369 | .18 |
| Class I | 4,238 | .16 |
| $445,457 |
(a) Annualized
Accounting and Security Lending Fees. Fidelity Service Company, Inc. (FSC), an affiliate of the investment adviser, maintains the Fund's accounting records. The accounting fee is based on the level of average net assets for each month. Under a separate contract, FSC administers the security lending program. The security lending fee is based on the number and duration of lending transactions.
Brokerage Commissions. The Fund placed a portion of its portfolio transactions with brokerage firms which are affiliates of the investment adviser. Brokerage commissions are included in net realized gain (loss) and change in net unrealized appreciation (depreciation) in the Statement of Operations. The commissions paid to these affiliated firms were $2,647 for the period.
Interfund Trades. The Fund may purchase from or sell securities to other Fidelity Funds under procedures adopted by the Board. The procedures have been designed to ensure these interfund trades are executed in accordance with Rule 17a-7 of the 1940 Act. Interfund trades are included within the respective purchases and sales amounts shown in the Purchases and Sales of Investments note.
6. Committed Line of Credit.
The Fund participates with other funds managed by the investment adviser or an affiliate in a $4.25 billion credit facility (the "line of credit") to be utilized for temporary or emergency purposes to fund shareholder redemptions or for other short-term liquidity purposes. The Fund has agreed to pay commitment fees on its pro-rata portion of the line of credit, which amounted to $815 and is reflected in Miscellaneous expenses on the Statement of Operations. During the period, the Fund did not borrow on this line of credit.
7. Security Lending.
The Fund lends portfolio securities through a lending agent from time to time in order to earn additional income. For equity securities, a lending agent is used and may loan securities to certain qualified borrowers, including Fidelity Capital Markets (FCM), a broker-dealer affiliated with the Fund. On the settlement date of the loan, the Fund receives collateral (in the form of U.S. Treasury obligations, letters of credit and/or cash) against the loaned securities and maintains collateral in an amount not less than 100% of the market value of the loaned securities during the period of the loan. The market value of the loaned securities is determined at the close of business of the Fund and any additional required collateral is delivered to the Fund on the next business day. The Fund or borrower may terminate the loan at any time, and if the borrower defaults on its obligation to return the securities loaned because of insolvency or other reasons, the Fund may apply collateral received from the borrower against the obligation. The Fund may experience delays and costs in recovering the securities loaned. Any cash collateral received is invested in the Fidelity Securities Lending Cash Central Fund. The value of loaned securities and cash collateral at period end are disclosed on the Fund's Statement of Assets and Liabilities. At period end, there were no security loans outstanding with FCM. Security lending income represents the income earned on investing cash collateral, less rebates paid to borrowers and any lending agent fees associated with the loan, plus any premium payments received for lending certain types of securities. Security lending income is presented in the Statement of Operations as a component of income from Fidelity Central Funds. Total security lending income during the period amounted to $13,869, including $590 from securities loaned to FCM.
8. Expense Reductions.
Commissions paid to certain brokers with whom the investment adviser, or its affiliates, places trades on behalf of the Fund include an amount in addition to trade execution, which may be rebated back to the Fund to offset certain expenses. This amount totaled $38,237 for the period.
In addition, during the period the investment adviser reimbursed and/or waived a portion of fund-level operating expenses in the amount of $2,183.
9. Distributions to Shareholders.
Distributions to shareholders of each class were as follows:
| Six months ended April 30, 2017 | Year ended October 31, 2016 | |
| From net investment income | ||
| Class A | $9,024 | $– |
| Global Balanced | 272,384 | – |
| Class I | 3,498 | – |
| Total | $284,906 | $– |
| From net realized gain | ||
| Class A | $144,388 | $1,198,713 |
| Class M | 54,135 | 472,741 |
| Class B | – | 38,199 |
| Class C | 96,163 | 844,073 |
| Global Balanced | 1,452,714 | 12,857,308 |
| Class I | 18,654 | 173,705 |
| Total | $1,766,054 | $15,584,739 |
10. Share Transactions.
Share transactions for each class were as follows and may contain automatic conversions between classes or exchanges between affiliated funds:
| Shares | Shares | Dollars | Dollars | |
| Six months ended April 30, 2017 | Year ended October 31, 2016 | Six months ended April 30, 2017 | Year ended October 31, 2016 | |
| Class A | ||||
| Shares sold | 98,235 | 315,518 | $2,194,801 | $6,953,190 |
| Reinvestment of distributions | 6,737 | 52,986 | 147,954 | 1,141,851 |
| Shares redeemed | (264,615) | (405,081) | (5,918,844) | (9,020,050) |
| Net increase (decrease) | (159,643) | (36,577) | $(3,576,089) | $(925,009) |
| Class M | ||||
| Shares sold | 34,648 | 72,280 | $767,629 | $1,589,041 |
| Reinvestment of distributions | 2,470 | 21,845 | 53,752 | 467,928 |
| Shares redeemed | (119,671) | (154,320) | (2,634,989) | (3,396,160) |
| Net increase (decrease) | (82,553) | (60,195) | $(1,813,608) | $(1,339,191) |
| Class B | ||||
| Shares sold | – | 48 | $– | $1,021 |
| Reinvestment of distributions | – | 1,741 | – | 37,184 |
| Shares redeemed | – | (62,152) | $– | $(1,356,722) |
| Net increase (decrease) | – | (60,363) | $– | $(1,318,517) |
| Class C | ||||
| Shares sold | 79,792 | 227,726 | $1,726,054 | $4,917,879 |
| Reinvestment of distributions | 4,316 | 37,381 | 91,889 | 787,624 |
| Shares redeemed | (209,424) | (295,837) | (4,514,525) | (6,357,105) |
| Net increase (decrease) | (125,316) | (30,730) | $(2,696,582) | $(651,602) |
| Global Balanced | ||||
| Shares sold | 590,963 | 2,114,763 | $13,354,659 | $47,490,820 |
| Reinvestment of distributions | 73,780 | 560,214 | 1,640,873 | 12,195,855 |
| Shares redeemed | (3,595,122) | (4,162,916) | (80,805,299) | (93,142,954) |
| Net increase (decrease) | (2,930,379) | (1,487,939) | $(65,809,767) | $(33,456,279) |
| Class I | ||||
| Shares sold | 72,250 | 69,161 | $1,638,061 | $1,567,504 |
| Reinvestment of distributions | 910 | 6,856 | 20,184 | 148,834 |
| Shares redeemed | (83,321) | (95,184) | (1,869,399) | (2,155,432) |
| Net increase (decrease) | (10,161) | (19,167) | $(211,154) | $(439,094) |
11. Other.
The Fund's organizational documents provide former and current trustees and officers with a limited indemnification against liabilities arising in connection with the performance of their duties to the Fund. In the normal course of business, the Fund may also enter into contracts that provide general indemnifications. The Fund's maximum exposure under these arrangements is unknown as this would be dependent on future claims that may be made against the Fund. The risk of material loss from such claims is considered remote.
Report of Independent Registered Public Accounting Firm
To the Trustees of Fidelity Charles Street Trust and Shareholders of Fidelity Global Balanced Fund:
In our opinion, the accompanying statement of assets and liabilities, including the schedule of investments, and the related statements of operations and of changes in net assets and the financial highlights present fairly, in all material respects, the financial position of Fidelity Global Balanced Fund (a fund of Fidelity Charles Street Trust) as of April 30, 2017, the results of its operations, changes in its net assets, and financial highlights for each of the periods indicated, in conformity with accounting principles generally accepted in the United States of America. These financial statements and financial highlights (hereafter referred to as “financial statements”) are the responsibility of the Fidelity Global Balanced Fund’s management. Our responsibility is to express an opinion on these financial statements based on our audits. We conducted our audits of these financial statements in accordance with the standards of the Public Company Accounting Oversight Board (United States). Those standards require that we plan and perform the audit to obtain reasonable assurance about whether the financial statements are free of material misstatement. An audit includes examining, on a test basis, evidence supporting the amounts and disclosures in the financial statements, assessing the accounting principles used and significant estimates made by management, and evaluating the overall financial statement presentation. Our procedures included confirmation of securities owned as of April 30, 2017 by correspondence with the custodian and brokers; when replies were not received from brokers, we performed other auditing procedures. We believe that our audits provide a reasonable basis for our opinion.
PricewaterhouseCoopers LLP
Boston, Massachusetts
June 19, 2017
Shareholder Expense Example
As a shareholder of the Fund, you incur two types of costs: (1) transaction costs, including sales charges (loads) on purchase payments or redemption proceeds, redemption fees and (2) ongoing costs, including management fees, distribution and/or service (12b-1) fees and other Fund expenses. This Example is intended to help you understand your ongoing costs (in dollars) of investing in the Fund and to compare these costs with the ongoing costs of investing in other mutual funds.
The Example is based on an investment of $1,000 invested at the beginning of the period and held for the entire period (November 1, 2016 to April 30, 2017).
Actual Expenses
The first line of the accompanying table for each class of the Fund provides information about actual account values and actual expenses. You may use the information in this line, together with the amount you invested, to estimate the expenses that you paid over the period. Simply divide your account value by $1,000.00 (for example, an $8,600 account value divided by $1,000.00 = 8.6), then multiply the result by the number in the first line for a class of the Fund under the heading entitled "Expenses Paid During Period" to estimate the expenses you paid on your account during this period. A small balance maintenance fee of $12.00 that is charged once a year may apply for certain accounts with a value of less than $2,000. This fee is not included in the table below. If it was, the estimate of expenses you paid during the period would be higher, and your ending account value lower, by this amount. In addition, the Fund, as a shareholder in the underlying Fidelity Central Funds, will indirectly bear its pro-rata share of the fees and expenses incurred by the underlying Fidelity Central Funds. These fees and expenses are not included in the Fund's annualized expense ratio used to calculate the expense estimate in the table below.
Hypothetical Example for Comparison Purposes
The second line of the accompanying table for each class of the Fund provides information about hypothetical account values and hypothetical expenses based on a Class' actual expense ratio and an assumed rate of return of 5% per year before expenses, which is not the Class' actual return. The hypothetical account values and expenses may not be used to estimate the actual ending account balance or expenses you paid for the period. You may use this information to compare the ongoing costs of investing in the Fund and other funds. To do so, compare this 5% hypothetical example with the 5% hypothetical examples that appear in the shareholder reports of the other funds. A small balance maintenance fee of $12.00 that is charged once a year may apply for certain accounts with a value of less than $2,000. This fee is not included in the table below. If it was, the estimate of expenses you paid during the period would be higher, and your ending account value lower, by this amount. In addition, the Fund, as a shareholder in the underlying Fidelity Central Funds, will indirectly bear its pro-rata share of the fees and expenses incurred by the underlying Fidelity Central Funds. These fees and expenses are not included in the Fund's annualized expense ratio used to calculate the expense estimate in the table below.
Please note that the expenses shown in the table are meant to highlight your ongoing costs only and do not reflect any transaction costs. Therefore, the second line of the table is useful in comparing ongoing costs only, and will not help you determine the relative total costs of owning different funds. In addition, if these transactional costs were included, your costs would have been higher.
| Annualized Expense Ratio-A | Beginning Account Value November 1, 2016 | Ending Account Value April 30, 2017 | Expenses Paid During Period-B November 1, 2016 to April 30, 2017 |
|
| Class A | 1.31% | |||
| Actual | $1,000.00 | $1,046.40 | $6.65 | |
| Hypothetical-C | $1,000.00 | $1,018.30 | $6.56 | |
| Class M | 1.60% | |||
| Actual | $1,000.00 | $1,044.80 | $8.11 | |
| Hypothetical-C | $1,000.00 | $1,016.86 | $8.00 | |
| Class C | 2.13% | |||
| Actual | $1,000.00 | $1,042.50 | $10.79 | |
| Hypothetical-C | $1,000.00 | $1,014.23 | $10.64 | |
| Global Balanced | 1.03% | |||
| Actual | $1,000.00 | $1,048.10 | $5.23 | |
| Hypothetical-C | $1,000.00 | $1,019.69 | $5.16 | |
| Class I | 1.01% | |||
| Actual | $1,000.00 | $1,047.70 | $5.13 | |
| Hypothetical-C | $1,000.00 | $1,019.79 | $5.06 |
A Annualized expense ratio reflects expenses net of applicable fee waivers.
B Expenses are equal to each Class' annualized expense ratio, multiplied by the average account value over the period, multiplied by 181/365 (to reflect the one-half year period). In addition to the expenses noted above, the Fund also indirectly bears its proportional share of the expenses of the underlying Fidelity Central Funds. Annualized expenses of the underlying non-money market Fidelity Central Funds as of their most recent fiscal half year ranged from 0.05% to .08%.
C 5% return per year before expenses
![]()
Corporate Headquarters
245 Summer St.
Boston, MA 02210
www.fidelity.com
GBL-SANN-0617
1.848653.109
|
Fidelity Advisor® Global Balanced Fund - Semi-Annual Report April 30, 2017 Class A, Class M, Class C and Class I are classes of Fidelity® Global Balanced Fund |
|
|
Contents
To view a fund's proxy voting guidelines and proxy voting record for the 12-month period ended June 30, visit http://www.fidelity.com/proxyvotingresults or visit the Securities and Exchange Commission's (SEC) web site at http://www.sec.gov.
You may also call 1-877-208-0098 to request a free copy of the proxy voting guidelines.
Standard & Poor's, S&P and S&P 500 are registered service marks of The McGraw-Hill Companies, Inc. and have been licensed for use by Fidelity Distributors Corporation.
Other third-party marks appearing herein are the property of their respective owners.
All other marks appearing herein are registered or unregistered trademarks or service marks of FMR LLC or an affiliated company. © 2017 FMR LLC. All rights reserved.
This report and the financial statements contained herein are submitted for the general information of the shareholders of the Fund. This report is not authorized for distribution to prospective investors in the Fund unless preceded or accompanied by an effective prospectus.
A fund files its complete schedule of portfolio holdings with the SEC for the first and third quarters of each fiscal year on Form N-Q. Forms N-Q are available on the SEC’s web site at http://www.sec.gov. A fund's Forms N-Q may be reviewed and copied at the SEC’s Public Reference Room in Washington, DC. Information regarding the operation of the SEC's Public Reference Room may be obtained by calling 1-800-SEC-0330.
For a complete list of a fund's portfolio holdings, view the most recent holdings listing, semiannual report, or annual report on Fidelity's web site at http://www.fidelity.com, http://www.institutional.fidelity.com, or http://www.401k.com, as applicable.
NOT FDIC INSURED •MAY LOSE VALUE •NO BANK GUARANTEE
Neither the Fund nor Fidelity Distributors Corporation is a bank.
Investment Summary (Unaudited)
The information in the following tables is based on the combined investments of the Fund and its pro-rata share of the investments of Fidelity's Central Funds, other than the Commodity Strategy and Money Market Central Funds.Geographic Diversification (% of fund's net assets)
| As of April 30, 2017 | ||
| United States of America* | 46.7% | |
| Japan | 13.5% | |
| Germany | 6.6% | |
| United Kingdom | 4.9% | |
| France | 3.6% | |
| Netherlands | 3.5% | |
| Italy | 3.4% | |
| Canada | 3.1% | |
| Sweden | 2.2% | |
| Other | 12.5% | |
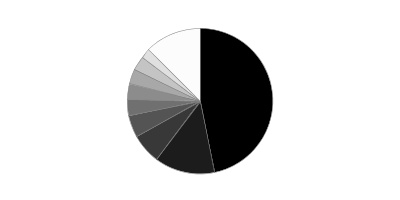
* Includes Short-Term investments and Net Other Assets (Liabilities).
Percentages are based on country or territory of incorporation and are adjusted for the effect of futures contracts, if applicable.
| As of October 31, 2016 | ||
| United States of America* | 46.2% | |
| Japan | 12.4% | |
| United Kingdom | 6.0% | |
| Germany | 4.9% | |
| Netherlands | 4.0% | |
| Canada | 3.4% | |
| France | 3.2% | |
| Ireland | 3.1% | |
| Italy | 1.8% | |
| Other | 15.0% | |
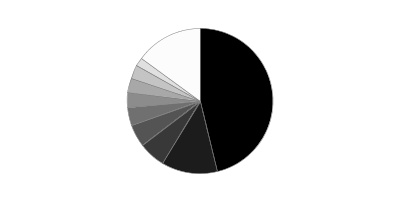
* Includes Short-Term investments and Net Other Assets (Liabilities).
Percentages are based on country or territory of incorporation and are adjusted for the effect of futures contracts, if applicable.
Asset Allocation as of April 30, 2017
| % of fund's net assets | % of fund's net assets 6 months ago | |
| Stocks | 61.4(a) | 58.4(b) |
| Bonds | 32.1 | 35.2 |
| Other Investments | 5.2 | 3.8 |
| Short-Term Investments and Net Other Assets (Liabilities) | 1.3 | 2.6 |
(a) Includes investment in Fidelity® Commodity Strategy Central Fund of 0.9%
(b) Includes investment in Fidelity® Commodity Strategy Central Fund of 0.8%
Top Five Stocks as of April 30, 2017
| % of fund's net assets | % of fund's net assets 6 months ago | |
| Apple, Inc. (United States of America) | 1.5 | 1.4 |
| Bank of America Corp. (United States of America) | 1.5 | 0.0 |
| Adobe Systems, Inc. (United States of America) | 1.5 | 2.0 |
| adidas AG (Germany) | 1.4 | 0.9 |
| Alphabet, Inc. Class A (United States of America) | 1.3 | 2.1 |
| 7.2 |
Top Five Bond Issuers as of April 30, 2017
| (with maturities greater than one year) | % of fund's net assets | % of fund's net assets 6 months ago |
| U.S. Treasury Obligations | 10.9 | 8.9 |
| Japan Government | 7.4 | 9.0 |
| German Federal Republic | 2.8 | 0.5 |
| Buoni del Tesoro Poliennali | 2.2 | 0.9 |
| United Kingdom, Great Britain and Northern Ireland | 1.7 | 1.0 |
| 25.0 |
Market Sectors as of April 30, 2017
| % of fund's net assets | % of fund's net assets 6 months ago | |
| Financials | 14.9 | 19.4 |
| Information Technology | 13.1 | 15.5 |
| Industrials | 8.9 | 7.2 |
| Consumer Discretionary | 8.2 | 7.2 |
| Health Care | 8.1 | 6.4 |
| Consumer Staples | 3.9 | 4.0 |
| Materials | 2.5 | 1.4 |
| Real Estate | 1.5 | 1.7 |
| Energy | 1.2 | 4.1 |
| Telecommunication Services | 1.0 | 0.9 |
An unaudited holdings listing for the Fund, which presents direct holdings as well as the pro-rata share of any securities and other investments held indirectly through its investment in underlying Fidelity Central Funds, other than the Commodity Strategy and Money Market Central Funds, is available at fidelity.com and/or institutional.fidelity.com, as applicable.
Percentages shown as 0.0% may reflect amounts less than 0.05%.
Investments April 30, 2017
Showing Percentage of Net Assets
| Common Stocks - 58.2% | |||
| Shares | Value | ||
| Australia - 1.6% | |||
| Abacus Property Group unit | 76,981 | $198,870 | |
| Aconex Ltd. (a)(b) | 32,588 | 107,124 | |
| Amcor Ltd. | 26,234 | 308,608 | |
| Arena (REIT) unit | 143,670 | 229,146 | |
| Asaleo Care Ltd. | 146,907 | 197,457 | |
| Aub Group Ltd. | 26,882 | 242,759 | |
| Australia & New Zealand Banking Group Ltd. | 32,716 | 802,546 | |
| Bapcor Ltd. | 54,957 | 215,224 | |
| Beacon Lighting Group Ltd. | 169,462 | 228,408 | |
| BHP Billiton Ltd. | 19,288 | 343,403 | |
| Blue Sky Alternative Investments Ltd. | 40,677 | 243,672 | |
| Commonwealth Bank of Australia | 17,868 | 1,169,373 | |
| Corporate Travel Management Ltd. | 14,207 | 216,594 | |
| CSL Ltd. | 7,169 | 711,548 | |
| Hansen Technologies Ltd. | 76,548 | 206,349 | |
| HUB24 Ltd. (a) | 42,498 | 155,930 | |
| Magellan Financial Group Ltd. | 12,364 | 218,307 | |
| NIB Holdings Ltd. | 64,014 | 287,602 | |
| realestate.com.au Ltd. | 6,630 | 305,270 | |
| Reliance Worldwide Corp. Ltd. | 86,194 | 196,853 | |
| SpeedCast International Ltd. | 22,354 | 63,774 | |
| Sydney Airport unit | 50,488 | 260,479 | |
| Vita Group Ltd. | 57,133 | 97,113 | |
| Woodside Petroleum Ltd. | 13,325 | 321,084 | |
| TOTAL AUSTRALIA | 7,327,493 | ||
| Austria - 0.1% | |||
| ams AG | 7,000 | 450,251 | |
| Bailiwick of Jersey - 0.3% | |||
| Randgold Resources Ltd. | 802 | 70,549 | |
| Shire PLC | 21,400 | 1,261,718 | |
| Wizz Air Holdings PLC (a) | 7,000 | 160,022 | |
| TOTAL BAILIWICK OF JERSEY | 1,492,289 | ||
| Bermuda - 1.4% | |||
| Axovant Sciences Ltd. (a) | 1,000 | 24,240 | |
| Dairy Farm International Holdings Ltd. | 25,200 | 224,280 | |
| Hongkong Land Holdings Ltd. | 38,300 | 295,293 | |
| IHS Markit Ltd. (a) | 77,200 | 3,350,480 | |
| PAX Global Technology Ltd. | 180,000 | 111,540 | |
| Vostok Emerging Finance Ltd. (depository receipt) (a) | 3,274,986 | 606,390 | |
| Vostok New Ventures Ltd. (depositary receipt) (a) | 229,461 | 1,787,544 | |
| TOTAL BERMUDA | 6,399,767 | ||
| Canada - 2.5% | |||
| Agnico Eagle Mines Ltd. (Canada) | 2,170 | 103,727 | |
| Agrium, Inc. | 2,230 | 209,302 | |
| Alimentation Couche-Tard, Inc. Class B (sub. vtg.) | 4,830 | 222,136 | |
| Allied Properties (REIT) | 2,760 | 74,062 | |
| ARC Resources Ltd. | 5,090 | 66,820 | |
| AutoCanada, Inc. | 1,870 | 32,166 | |
| Bank of Nova Scotia | 3,150 | 175,101 | |
| Barrick Gold Corp. | 3,940 | 65,866 | |
| Brookfield Asset Management, Inc. Class A | 1,400 | 51,752 | |
| Canadian Energy Services & Technology Corp. | 11,070 | 52,307 | |
| Canadian National Railway Co. | 3,820 | 276,121 | |
| Canadian Natural Resources Ltd. | 5,850 | 186,336 | |
| Canadian Pacific Railway Ltd. | 1,720 | 263,547 | |
| CCL Industries, Inc. Class B | 370 | 85,653 | |
| Cenovus Energy, Inc. | 7,940 | 79,164 | |
| CGI Group, Inc. Class A (sub. vtg.) (a) | 3,280 | 158,299 | |
| CI Financial Corp. | 3,850 | 75,305 | |
| Cogeco Communications, Inc. | 1,210 | 69,238 | |
| Constellation Software, Inc. | 220 | 100,621 | |
| Corus Entertainment, Inc. Class B (non-vtg.) | 3,890 | 38,186 | |
| Detour Gold Corp. (a) | 2,930 | 37,026 | |
| Empire Co. Ltd. Class A (non-vtg.) | 2,700 | 41,596 | |
| Enbridge, Inc. | 8,950 | 370,969 | |
| Fairfax India Holdings Corp. (a) | 1,300 | 18,057 | |
| First Quantum Minerals Ltd. | 198,000 | 1,887,096 | |
| Franco-Nevada Corp. | 2,000 | 136,024 | |
| Freshii, Inc. | 1,800 | 16,351 | |
| George Weston Ltd. | 2,210 | 198,472 | |
| Goldcorp, Inc. | 2,060 | 28,703 | |
| Hydro One Ltd. | 3,520 | 61,991 | |
| Imperial Oil Ltd. | 2,540 | 73,890 | |
| Intact Financial Corp. | 1,480 | 101,384 | |
| Jean Coutu Group, Inc. Class A (sub. vtg.) | 2,620 | 42,878 | |
| Lundin Mining Corp. | 16,450 | 87,730 | |
| Magna International, Inc. Class A (sub. vtg.) | 900 | 37,594 | |
| Manulife Financial Corp. | 18,160 | 318,487 | |
| Metro, Inc. Class A (sub. vtg.) | 1,100 | 37,697 | |
| North West Co., Inc. | 2,870 | 67,700 | |
| NuVista Energy Ltd. (a) | 6,800 | 30,636 | |
| Open Text Corp. | 3,640 | 126,209 | |
| Parkland Fuel Corp. (a)(c)(d) | 800 | 15,665 | |
| Pason Systems, Inc. | 2,280 | 33,856 | |
| Peyto Exploration & Development Corp. | 2,550 | 46,403 | |
| Power Corp. of Canada (sub. vtg.) | 8,450 | 195,798 | |
| PrairieSky Royalty Ltd. | 71,788 | 1,564,553 | |
| Premier Gold Mines Ltd. (a) | 12,100 | 24,465 | |
| Quebecor, Inc. Class B (sub. vtg.) | 2,670 | 81,505 | |
| Raging River Exploration, Inc. (a) | 7,000 | 40,870 | |
| Rogers Communications, Inc. Class B (non-vtg.) | 6,800 | 311,792 | |
| Royal Bank of Canada (b) | 12,430 | 851,128 | |
| ShawCor Ltd. Class A | 1,960 | 49,178 | |
| Silver Wheaton Corp. | 4,420 | 88,202 | |
| Sleep Country Canada Holdings, Inc. | 1,470 | 38,025 | |
| Stantec, Inc. | 2,250 | 57,740 | |
| Suncor Energy, Inc. | 16,232 | 508,703 | |
| TELUS Corp. | 7,340 | 244,228 | |
| The Toronto-Dominion Bank | 16,420 | 772,614 | |
| TMX Group Ltd. | 1,370 | 77,400 | |
| Torex Gold Resources, Inc. (a) | 1,932 | 32,722 | |
| Toromont Industries Ltd. | 1,470 | 52,293 | |
| TransForce, Inc. | 1,890 | 41,149 | |
| Western Forest Products, Inc. | 41,310 | 65,065 | |
| WestJet Airlines Ltd. | 2,220 | 36,722 | |
| TOTAL CANADA | 11,336,275 | ||
| Cayman Islands - 0.4% | |||
| Alibaba Group Holding Ltd. sponsored ADR (a) | 2,000 | 231,000 | |
| CK Hutchison Holdings Ltd. | 37,500 | 468,367 | |
| International Housewares Retail Co. Ltd. | 981,000 | 221,970 | |
| JD.com, Inc. sponsored ADR (a) | 9,000 | 315,630 | |
| SITC International Holdings Co. Ltd. | 180,000 | 128,896 | |
| Tencent Holdings Ltd. | 10,300 | 322,733 | |
| TOTAL CAYMAN ISLANDS | 1,688,596 | ||
| China - 0.0% | |||
| Shenzhen Expressway Co. (H Shares) | 160,000 | 145,841 | |
| Denmark - 0.6% | |||
| Nets A/S (c) | 55,700 | 1,013,135 | |
| Novozymes A/S Series B | 23,100 | 997,986 | |
| Scandinavian Tobacco Group A/S | 25,376 | 442,986 | |
| TOTAL DENMARK | 2,454,107 | ||
| Finland - 0.0% | |||
| Valmet Corp. | 6,300 | 114,811 | |
| France - 1.6% | |||
| Amundi SA | 840 | 55,267 | |
| Capgemini SA | 14,100 | 1,411,720 | |
| Havas SA | 152,300 | 1,408,328 | |
| Kering SA | 300 | 92,988 | |
| Rubis | 11,200 | 1,138,031 | |
| Thales SA | 13,400 | 1,408,866 | |
| The Vicat Group | 9,400 | 668,737 | |
| Wendel SA | 9,100 | 1,275,260 | |
| TOTAL FRANCE | 7,459,197 | ||
| Germany - 3.8% | |||
| adidas AG | 32,100 | 6,430,345 | |
| Bayer AG | 400 | 49,493 | |
| Bertrandt AG (b) | 5,200 | 543,042 | |
| Brenntag AG | 9,400 | 557,434 | |
| CompuGroup Medical AG | 14,600 | 718,851 | |
| CTS Eventim AG | 37,258 | 1,435,293 | |
| Fresenius Medical Care AG & Co. KGaA | 9,700 | 861,062 | |
| LEG Immobilien AG | 17,901 | 1,537,735 | |
| MTU Aero Engines Holdings AG | 7,400 | 1,061,207 | |
| SAP AG | 32,911 | 3,296,565 | |
| Vonovia SE | 22,500 | 814,565 | |
| TOTAL GERMANY | 17,305,592 | ||
| Hong Kong - 0.4% | |||
| AIA Group Ltd. | 136,000 | 941,536 | |
| Hang Seng Bank Ltd. | 16,300 | 330,470 | |
| Power Assets Holdings Ltd. | 47,000 | 422,969 | |
| Techtronic Industries Co. Ltd. | 36,500 | 156,730 | |
| TOTAL HONG KONG | 1,851,705 | ||
| India - 0.2% | |||
| HDFC Bank Ltd. sponsored ADR | 5,000 | 398,050 | |
| Reliance Industries Ltd. | 24,750 | 537,116 | |
| TOTAL INDIA | 935,166 | ||
| Ireland - 1.3% | |||
| Accenture PLC Class A | 800 | 97,040 | |
| Alkermes PLC (a) | 51,300 | 2,988,225 | |
| CRH PLC | 1,300 | 47,351 | |
| DCC PLC (United Kingdom) | 13,000 | 1,200,521 | |
| Ryanair Holdings PLC sponsored ADR (a) | 9,082 | 834,908 | |
| United Drug PLC (United Kingdom) | 86,017 | 832,227 | |
| TOTAL IRELAND | 6,000,272 | ||
| Israel - 0.1% | |||
| Sarine Technologies Ltd. | 185,100 | 254,369 | |
| Italy - 1.0% | |||
| Banca Generali SpA | 25,500 | 733,039 | |
| Buzzi Unicem SpA | 29,300 | 753,229 | |
| Intesa Sanpaolo SpA | 251,600 | 734,446 | |
| Prada SpA | 209,800 | 984,489 | |
| UniCredit SpA | 71,600 | 1,165,229 | |
| TOTAL ITALY | 4,370,432 | ||
| Japan - 6.1% | |||
| Astellas Pharma, Inc. | 35,400 | 466,824 | |
| Bank of Kyoto Ltd. | 26,000 | 205,714 | |
| Daikin Industries Ltd. | 6,100 | 592,353 | |
| DaikyoNishikawa Corp. | 8,300 | 105,355 | |
| Daito Trust Construction Co. Ltd. | 3,300 | 485,490 | |
| Dentsu, Inc. | 10,000 | 563,355 | |
| East Japan Railway Co. | 8,600 | 767,925 | |
| Eiken Chemical Co. Ltd. | 8,300 | 227,836 | |
| Fanuc Corp. | 2,900 | 590,429 | |
| Funai Soken Holdings, Inc. | 11,400 | 219,052 | |
| Hoya Corp. | 17,800 | 850,121 | |
| Hulic Co. Ltd. | 36,100 | 340,031 | |
| Japan Meat Co. Ltd. | 24,000 | 399,372 | |
| Japan Tobacco, Inc. | 27,400 | 910,916 | |
| Kakaku.com, Inc. | 34,600 | 498,786 | |
| Kaken Pharmaceutical Co. Ltd. | 5,200 | 308,338 | |
| Kao Corp. | 13,400 | 739,028 | |
| Keyence Corp. | 2,300 | 924,333 | |
| Kubota Corp. | 30,000 | 471,765 | |
| Kyushu Railway Co. | 10,900 | 341,740 | |
| Misumi Group, Inc. | 28,600 | 541,598 | |
| Mitsubishi Pencil Co. Ltd. | 8,500 | 471,227 | |
| Mitsui Fudosan Co. Ltd. | 23,000 | 505,391 | |
| Morinaga & Co. Ltd. | 8,100 | 382,929 | |
| Murata Manufacturing Co. Ltd. | 3,600 | 482,637 | |
| Nakanishi, Inc. | 12,460 | 489,570 | |
| Nidec Corp. | 6,500 | 595,918 | |
| Nihon Parkerizing Co. Ltd. | 25,300 | 324,775 | |
| Nintendo Co. Ltd. | 3,000 | 759,197 | |
| Nitori Holdings Co. Ltd. | 6,700 | 872,097 | |
| NTT DOCOMO, Inc. | 36,700 | 888,033 | |
| Olympus Corp. | 12,300 | 473,353 | |
| Open House Co. Ltd. | 20,800 | 510,134 | |
| ORIX Corp. | 42,300 | 645,457 | |
| PALTAC Corp. | 16,700 | 492,873 | |
| Panasonic Corp. | 53,500 | 639,766 | |
| PeptiDream, Inc. (a) | 5,900 | 353,021 | |
| Rakuten, Inc. | 49,200 | 503,586 | |
| Shionogi & Co. Ltd. | 12,400 | 637,714 | |
| SK Kaken Co. Ltd. | 4,300 | 408,881 | |
| SMC Corp. | 2,100 | 591,334 | |
| SMS Co., Ltd. | 17,400 | 463,116 | |
| SoftBank Corp. | 13,400 | 1,016,426 | |
| Sosei Group Corp. (a) | 1,500 | 154,070 | |
| Start Today Co. Ltd. | 33,300 | 710,958 | |
| Subaru Corp. | 23,400 | 884,152 | |
| Sundrug Co. Ltd. | 15,200 | 533,142 | |
| The Suruga Bank Ltd. | 34,500 | 720,794 | |
| Tokyo Century Corp. | 11,600 | 399,587 | |
| Toshiba Plant Systems & Services Corp. | 19,100 | 310,637 | |
| Tsuruha Holdings, Inc. | 4,800 | 486,566 | |
| Welcia Holdings Co. Ltd. | 13,400 | 431,541 | |
| TOTAL JAPAN | 27,689,243 | ||
| Luxembourg - 0.1% | |||
| B&M European Value Retail S.A. | 33,680 | 147,007 | |
| Samsonite International SA | 61,200 | 236,433 | |
| TOTAL LUXEMBOURG | 383,440 | ||
| Malta - 0.1% | |||
| Kambi Group PLC (a) | 52,200 | 536,303 | |
| Multi-National - 0.0% | |||
| HKT Trust/HKT Ltd. unit | 115,000 | 147,107 | |
| Netherlands - 1.6% | |||
| ASML Holding NV | 1,500 | 197,775 | |
| CSM NV (exchangeable) | 18,600 | 577,438 | |
| Intertrust NV | 44,000 | 881,897 | |
| Koninklijke Philips Electronics NV | 45,600 | 1,574,681 | |
| Koninklijke Wessanen NV | 47,700 | 712,626 | |
| Unilever NV: | |||
| (Certificaten Van Aandelen) (Bearer) | 31,500 | 1,650,143 | |
| (NY Reg.)(a) | 31,000 | 1,619,440 | |
| TOTAL NETHERLANDS | 7,214,000 | ||
| New Zealand - 0.0% | |||
| Ryman Healthcare Group Ltd. | 29,354 | 173,933 | |
| Norway - 0.5% | |||
| Orkla ASA | 85,600 | 775,146 | |
| Schibsted ASA (A Shares) | 58,000 | 1,442,232 | |
| TOTAL NORWAY | 2,217,378 | ||
| Singapore - 0.6% | |||
| Broadcom Ltd. | 12,000 | 2,649,720 | |
| Wing Tai Holdings Ltd. | 109,100 | 147,585 | |
| TOTAL SINGAPORE | 2,797,305 | ||
| Spain - 0.7% | |||
| Amadeus IT Holding SA Class A | 17,700 | 954,390 | |
| CaixaBank SA | 127,500 | 578,907 | |
| Grifols SA | 30,200 | 811,072 | |
| Prosegur Cash SA | 383,400 | 977,272 | |
| TOTAL SPAIN | 3,321,641 | ||
| Sweden - 2.2% | |||
| AF AB (B Shares) | 7,700 | 162,045 | |
| Dometic Group AB | 174,400 | 1,299,538 | |
| Getinge AB (B Shares) | 119,600 | 2,337,367 | |
| Indutrade AB | 64,400 | 1,521,787 | |
| Investor AB (B Shares) | 43,342 | 1,981,323 | |
| Nobia AB | 38,600 | 399,410 | |
| Pandox AB | 42,455 | 712,752 | |
| Svenska Cellulosa AB (SCA) (B Shares) | 47,600 | 1,576,760 | |
| TOTAL SWEDEN | 9,990,982 | ||
| Switzerland - 0.9% | |||
| ABB Ltd. (Reg.) | 50,790 | 1,244,572 | |
| EDAG Engineering Group AG | 17,400 | 321,172 | |
| Panalpina Welttransport Holding AG | 8,270 | 1,094,632 | |
| Swatch Group AG (Bearer) | 3,500 | 1,401,055 | |
| TOTAL SWITZERLAND | 4,061,431 | ||
| United Kingdom - 2.7% | |||
| British American Tobacco PLC: | |||
| (United Kingdom) | 10,000 | 675,634 | |
| sponsored ADR | 41,000 | 2,789,640 | |
| Bunzl PLC | 22,985 | 716,866 | |
| Dechra Pharmaceuticals PLC | 53,400 | 1,168,866 | |
| Dialog Semiconductor PLC (a) | 400 | 18,714 | |
| Diploma PLC | 71,900 | 1,032,755 | |
| Essentra PLC | 105,000 | 736,418 | |
| Imperial Tobacco Group PLC | 893 | 43,743 | |
| International Personal Finance PLC | 298,457 | 620,431 | |
| John Wood Group PLC | 6,000 | 59,022 | |
| Micro Focus International PLC | 24,000 | 804,475 | |
| NCC Group Ltd. (b) | 797,700 | 1,472,283 | |
| Prudential PLC | 97,535 | 2,164,678 | |
| TOTAL UNITED KINGDOM | 12,303,525 | ||
| United States of America - 27.4% | |||
| Activision Blizzard, Inc. | 75,900 | 3,965,775 | |
| Adobe Systems, Inc. (a) | 49,900 | 6,673,626 | |
| Alaska Air Group, Inc. | 17,000 | 1,446,530 | |
| Alexion Pharmaceuticals, Inc. (a) | 6,600 | 843,348 | |
| Allison Transmission Holdings, Inc. | 76,400 | 2,955,152 | |
| Alphabet, Inc. Class A (a) | 6,500 | 6,009,380 | |
| Amazon.com, Inc. (a) | 3,500 | 3,237,465 | |
| American Tower Corp. | 10,400 | 1,309,776 | |
| AMETEK, Inc. | 4,000 | 228,800 | |
| Amgen, Inc. | 21,200 | 3,462,384 | |
| Amphenol Corp. Class A | 20,400 | 1,475,124 | |
| Analog Devices, Inc. | 3,000 | 228,600 | |
| Apple, Inc. | 47,600 | 6,837,740 | |
| Autodesk, Inc. (a) | 2,000 | 180,140 | |
| Autoliv, Inc. (depositary receipt) | 18,000 | 1,801,565 | |
| Bank of America Corp. | 289,000 | 6,745,260 | |
| Bio-Rad Laboratories, Inc. Class A (a) | 500 | 109,130 | |
| Boston Scientific Corp. (a) | 133,700 | 3,527,006 | |
| Burlington Stores, Inc. (a) | 1,000 | 98,920 | |
| CalAtlantic Group, Inc. | 10,000 | 362,200 | |
| Caterpillar, Inc. | 33,500 | 3,425,710 | |
| Cavium, Inc. (a) | 1,000 | 68,850 | |
| CBOE Holdings, Inc. | 50,000 | 4,120,500 | |
| Celanese Corp. Class A | 1,000 | 87,040 | |
| Charles Schwab Corp. | 24,000 | 932,400 | |
| Charter Communications, Inc. Class A (a) | 7,600 | 2,623,216 | |
| Cintas Corp. | 1,000 | 122,470 | |
| CME Group, Inc. | 2,900 | 336,951 | |
| CSX Corp. | 44,000 | 2,236,960 | |
| Cummins, Inc. | 11,000 | 1,660,340 | |
| Cypress Semiconductor Corp. | 22,000 | 308,220 | |
| Edwards Lifesciences Corp. (a) | 1,000 | 109,670 | |
| Entegris, Inc. (a) | 12,000 | 297,600 | |
| EOG Resources, Inc. | 4,700 | 434,750 | |
| Facebook, Inc. Class A (a) | 19,100 | 2,869,775 | |
| First Republic Bank | 7,000 | 647,220 | |
| FMC Corp. | 31,000 | 2,270,130 | |
| Goldman Sachs Group, Inc. | 4,000 | 895,200 | |
| Great Western Bancorp, Inc. | 1,000 | 41,200 | |
| Humana, Inc. | 11,300 | 2,508,374 | |
| Intercept Pharmaceuticals, Inc. (a) | 12,600 | 1,415,610 | |
| Intuit, Inc. | 3,300 | 413,193 | |
| Intuitive Surgical, Inc. (a) | 300 | 250,761 | |
| J.B. Hunt Transport Services, Inc. | 2,000 | 179,320 | |
| JPMorgan Chase & Co. | 36,000 | 3,132,000 | |
| KLA-Tencor Corp. | 13,000 | 1,276,860 | |
| Kulicke & Soffa Industries, Inc. (a) | 7,000 | 156,240 | |
| Lamb Weston Holdings, Inc. | 4,000 | 167,000 | |
| Lennar Corp. Class A | 14,000 | 707,000 | |
| Marriott International, Inc. Class A | 12,500 | 1,180,250 | |
| Microsemi Corp. (a) | 1,000 | 46,940 | |
| Microsoft Corp. | 79,000 | 5,408,340 | |
| Molson Coors Brewing Co. Class B | 1,500 | 143,835 | |
| Monsanto Co. | 290 | 33,817 | |
| Morgan Stanley | 30,000 | 1,301,100 | |
| MSC Industrial Direct Co., Inc. Class A | 14,000 | 1,253,420 | |
| MSCI, Inc. | 13,600 | 1,364,352 | |
| Netflix, Inc. (a) | 3,300 | 502,260 | |
| Northern Trust Corp. | 13,000 | 1,170,000 | |
| PACCAR, Inc. | 5,000 | 333,650 | |
| PayPal Holdings, Inc. (a) | 56,500 | 2,696,180 | |
| Performance Food Group Co. (a) | 27,000 | 672,300 | |
| Pioneer Natural Resources Co. | 3,100 | 536,269 | |
| Post Holdings, Inc. (a) | 9,000 | 757,710 | |
| Prestige Brands Holdings, Inc. (a) | 11,300 | 648,733 | |
| ResMed, Inc. CDI | 30,848 | 211,587 | |
| Roper Technologies, Inc. | 500 | 109,350 | |
| S&P Global, Inc. | 32,083 | 4,305,218 | |
| Sirius XM Holdings, Inc. | 26,000 | 128,700 | |
| SLM Corp. (a) | 4,000 | 50,160 | |
| SunTrust Banks, Inc. | 30,800 | 1,749,748 | |
| SVB Financial Group (a) | 12,400 | 2,181,656 | |
| T-Mobile U.S., Inc. (a) | 20,000 | 1,345,400 | |
| Terex Corp. | 6,000 | 209,880 | |
| Texas Instruments, Inc. | 9,000 | 712,620 | |
| The Walt Disney Co. | 10,500 | 1,213,800 | |
| Twenty-First Century Fox, Inc. Class B | 9,000 | 268,740 | |
| U.S. Bancorp | 9,000 | 461,520 | |
| U.S. Foods Holding Corp. | 16,000 | 451,200 | |
| Union Pacific Corp. | 13,900 | 1,556,244 | |
| United Rentals, Inc. (a) | 3,000 | 328,980 | |
| UnitedHealth Group, Inc. | 17,900 | 3,130,352 | |
| Univar, Inc. (a) | 42,800 | 1,277,580 | |
| Vertex Pharmaceuticals, Inc. (a) | 5,000 | 591,500 | |
| Visa, Inc. Class A | 13,000 | 1,185,860 | |
| TOTAL UNITED STATES OF AMERICA | 124,711,732 | ||
| TOTAL COMMON STOCKS | |||
| (Cost $223,302,796) | 265,134,183 | ||
| Nonconvertible Preferred Stocks - 0.4% | |||
| Italy - 0.2% | |||
| Buzzi Unicem SpA (Risparmio Shares) | 53,953 | 797,523 | |
| Spain - 0.2% | |||
| Grifols SA Class B | 50,700 | 1,082,183 | |
| TOTAL NONCONVERTIBLE PREFERRED STOCKS | |||
| (Cost $1,474,811) | 1,879,706 | ||
| Investment Companies - 5.2% | |||
| United States of America - 5.2% | |||
| iShares 20+ Year Treasury Bond ETF | 37,100 | 4,539,185 | |
| iShares Barclays TIPS Bond ETF | 77,660 | 8,931,677 | |
| SPDR DB International Government Inflation-Protected Bond ETF | 185,890 | 10,285,294 | |
| TOTAL INVESTMENT COMPANIES | |||
| (Cost $23,374,754) | 23,756,156 | ||
| Principal Amount(e) | Value | ||
| Nonconvertible Bonds - 2.8% | |||
| France - 0.5% | |||
| EDF SA 1.875% 10/13/36 (Reg. S) | EUR | 1,100,000 | 1,086,493 |
| Wendel SA 1% 4/20/23 (Reg. S) | EUR | 1,200,000 | 1,282,167 |
| TOTAL FRANCE | 2,368,660 | ||
| Ireland - 0.5% | |||
| Shire Acquisitions Investments Ireland DAC 2.4% 9/23/21 | 2,500,000 | 2,469,620 | |
| Netherlands - 0.3% | |||
| ABN AMRO Bank NV 2.875% 6/30/25 (Reg. S) (f) | EUR | 400,000 | 460,827 |
| Rabobank Nederland 2.5% 5/26/26 (Reg. S) (f) | EUR | 600,000 | 688,719 |
| TOTAL NETHERLANDS | 1,149,546 | ||
| United Kingdom - 0.5% | |||
| National Grid Gas Finance PLC 1.125% 9/22/21 (Reg. S) | GBP | 1,000,000 | 1,294,141 |
| Nationwide Building Society 4.125% 3/20/23 (Reg. S) (f) | EUR | 850,000 | 955,541 |
| TOTAL UNITED KINGDOM | 2,249,682 | ||
| United States of America - 1.0% | |||
| Citigroup, Inc. 1.5% 10/26/28 | EUR | 2,000,000 | 2,114,377 |
| Goldman Sachs Group, Inc. 3% 2/12/31 (Reg. S) | EUR | 1,390,000 | 1,640,340 |
| Molson Coors Brewing Co. 1.25% 7/15/24 | EUR | 600,000 | 655,550 |
| TOTAL UNITED STATES OF AMERICA | 4,410,267 | ||
| TOTAL NONCONVERTIBLE BONDS | |||
| (Cost $13,097,265) | 12,647,775 | ||
| Government Obligations - 29.3% | |||
| Canada - 0.6% | |||
| Canadian Government: | |||
| 0.5% 2/1/19 | CAD | 1,100,000 | 803,075 |
| 1% 6/1/27 | CAD | 1,150,000 | 799,992 |
| 3.5% 12/1/45 | CAD | 1,100,000 | 1,028,587 |
| TOTAL CANADA | 2,631,654 | ||
| France - 1.5% | |||
| French Government: | |||
| OAT: | |||
| 1.75% 5/25/23 | EUR | 1,400,000 | 1,678,748 |
| 3.25% 5/25/45(Reg. S) | EUR | 800,000 | 1,147,686 |
| 0.5% 5/25/26(Reg. S) | EUR | 3,700,000 | 3,964,956 |
| TOTAL FRANCE | 6,791,390 | ||
| Germany - 2.8% | |||
| German Federal Republic: | |||
| 0% 3/15/19(Reg. S) | EUR | 4,150,000 | 4,583,178 |
| 0% 10/8/21(Reg. S) | EUR | 3,200,000 | 3,560,871 |
| 0.25% 2/15/27(Reg. S) | EUR | 2,525,000 | 2,731,449 |
| 2.5% 8/15/46 | EUR | 1,300,000 | 1,911,699 |
| TOTAL GERMANY | 12,787,197 | ||
| Ireland - 0.3% | |||
| Irish Republic: | |||
| 1% 5/15/26(Reg. S) | EUR | 700,000 | 772,185 |
| 2% 2/18/45 (Reg.S) | EUR | 400,666 | 440,008 |
| TOTAL IRELAND | 1,212,193 | ||
| Italy - 2.2% | |||
| Buoni del Tesoro Poliennali: | |||
| 0.65% 11/1/20 | EUR | 7,550,000 | 8,289,186 |
| 2.7% 3/1/47 (c) | EUR | 2,000,000 | 1,925,229 |
| TOTAL ITALY | 10,214,415 | ||
| Japan - 7.4% | |||
| Japan Government: | |||
| 0.1% 6/20/26 | JPY | 280,000,000 | 2,538,298 |
| 0.4% 3/20/56 | JPY | 375,000,000 | 2,801,121 |
| 0.9% 6/20/22 | JPY | 619,800,000 | 5,859,619 |
| 1.3% 6/20/20 | JPY | 347,450,000 | 3,261,433 |
| 1.3% 3/20/21 | JPY | 702,750,000 | 6,665,581 |
| 1.7% 9/20/32 | JPY | 1,155,000,000 | 12,524,976 |
| TOTAL JAPAN | 33,651,028 | ||
| Netherlands - 1.6% | |||
| Dutch Government 0.5% 7/15/26(Reg. S) (c) | EUR | 6,550,000 | 7,209,054 |
| Spain - 0.3% | |||
| Spanish Kingdom 2.9% 10/31/46(Reg. S) (c) | EUR | 1,350,000 | 1,455,338 |
| United Kingdom - 1.7% | |||
| United Kingdom, Great Britain and Northern Ireland: | |||
| 1.25% 7/22/27(Reg. S) | GBP | 1,050,000 | 1,372,390 |
| 4% 3/7/22 | GBP | 1,550,000 | 2,361,587 |
| United Kingdom, Great Britain and Northern Ireland Treasury Indexed-Linked GILT 2.5% 7/22/65 (Reg. S) | GBP | 2,350,000 | 4,001,274 |
| TOTAL UNITED KINGDOM | 7,735,251 | ||
| United States of America - 10.9% | |||
| U.S. Treasury Bonds 2.5% 2/15/46 | 7,050,000 | 6,406,413 | |
| U.S. Treasury Notes: | |||
| 1.25% 3/31/19 | 4,450,000 | 4,449,306 | |
| 1.25% 3/31/21 | 26,750,000 | 26,322,621 | |
| 1.625% 5/15/26 | 13,250,000 | 12,555,409 | |
| TOTAL UNITED STATES OF AMERICA | 49,733,749 | ||
| TOTAL GOVERNMENT OBLIGATIONS | |||
| (Cost $140,992,426) | 133,421,269 | ||
| Shares | Value | ||
| Equity Central Funds - 2.9% | |||
| Fidelity Commodity Strategy Central Fund (g) | 694,206 | 4,422,092 | |
| Fidelity Emerging Markets Equity Central Fund (g) | 40,910 | 9,044,383 | |
| TOTAL EQUITY CENTRAL FUNDS | |||
| (Cost $12,012,201) | 13,466,475 | ||
| Money Market Funds - 1.5% | |||
| Fidelity Cash Central Fund, 0.85% (h) | 5,034,703 | 5,035,710 | |
| Fidelity Securities Lending Cash Central Fund 0.86% (h)(i) | 1,613,876 | 1,614,038 | |
| TOTAL MONEY MARKET FUNDS | |||
| (Cost $6,649,738) | 6,649,748 | ||
| TOTAL INVESTMENT PORTFOLIO - 100.3% | |||
| (Cost $420,903,991) | 456,955,312 | ||
| NET OTHER ASSETS (LIABILITIES) - (0.3)% | (1,288,085) | ||
| NET ASSETS - 100% | $455,667,227 |
Currency Abbreviations
CAD – Canadian dollar
EUR – European Monetary Unit
GBP – British pound
JPY – Japanese yen
Security Type Abbreviations
ETF – Exchange-Traded Fund
Categorizations in the Schedule of Investments are based on country or territory of incorporation.
Legend
(a) Non-income producing
(b) Security or a portion of the security is on loan at period end.
(c) Security exempt from registration under Rule 144A of the Securities Act of 1933. These securities may be resold in transactions exempt from registration, normally to qualified institutional buyers. At the end of the period, the value of these securities amounted to $11,618,421 or 2.5% of net assets.
(d) Security or a portion of the security purchased on a delayed delivery or when-issued basis.
(e) Amount is stated in United States dollars unless otherwise noted.
(f) Coupon rates for floating and adjustable rate securities reflect the rates in effect at period end.
(g) Affiliated fund that is generally available only to investment companies and other accounts managed by Fidelity Investments. A complete unaudited schedule of portfolio holdings for each Fidelity Central Fund is filed with the SEC for the first and third quarters of each fiscal year on Form N-Q and is available upon request or at the SEC's website at www.sec.gov. An unaudited holdings listing for the Fund, which presents direct holdings as well as the pro-rata share of securities and other investments held indirectly through its investment in underlying non-money market Fidelity Central Funds, other than the Commodity Strategy Central Fund, is available at fidelity.com and/or institutional.fidelity.com, as applicable. In addition, each Fidelity Central Fund's financial statements, which are not covered by the Fund's Report of Independent Registered Public Accounting Firm, are available on the SEC's website or upon request.
(h) Affiliated fund that is generally available only to investment companies and other accounts managed by Fidelity Investments. The rate quoted is the annualized seven-day yield of the fund at period end. A complete unaudited listing of the fund's holdings as of its most recent quarter end is available upon request. In addition, each Fidelity Central Fund's financial statements, which are not covered by the Fund's Report of Independent Registered Public Accounting Firm, are available on the SEC's website or upon request.
(i) Investment made with cash collateral received from securities on loan.
Affiliated Central Funds
Information regarding fiscal year to date income earned by the Fund from investments in Fidelity Central Funds is as follows:
| Fund | Income earned |
| Fidelity Cash Central Fund | $18,193 |
| Fidelity Commodity Strategy Central Fund | 10,067 |
| Fidelity Emerging Markets Equity Central Fund | 60,420 |
| Fidelity Securities Lending Cash Central Fund | 13,869 |
| Total | $102,549 |
Additional information regarding the Fund's fiscal year to date purchases and sales, including the ownership percentage, of the non Money Market Central Funds is as follows:
| Fund | Value, beginning of period | Purchases | Sales Proceeds | Value, end of period | % ownership, end of period |
| Fidelity Commodity Strategy Central Fund | $3,967,940 | $3,217,937 | $2,796,877 | $4,422,092 | 0.6% |
| Fidelity Emerging Markets Equity Central Fund | 5,590,031 | 6,343,223 | 3,721,343 | 9,044,383 | 1.6% |
| Total | $9,557,971 | $9,561,160 | $6,518,220 | $13,466,475 |
Investment Valuation
The following is a summary of the inputs used, as of April 30, 2017, involving the Fund's assets and liabilities carried at fair value. The inputs or methodology used for valuing securities may not be an indication of the risk associated with investing in those securities. For more information on valuation inputs, and their aggregation into the levels used below, please refer to the Investment Valuation section in the accompanying Notes to Financial Statements.
| Valuation Inputs at Reporting Date: | ||||
| Description | Total | Level 1 | Level 2 | Level 3 |
| Investments in Securities: | ||||
| Equities: | ||||
| Consumer Discretionary | $36,264,807 | $35,625,041 | $639,766 | $-- |
| Consumer Staples | 16,499,687 | 14,173,910 | 2,325,777 | -- |
| Energy | 5,007,591 | 4,991,926 | 15,665 | -- |
| Financials | 52,297,820 | 48,819,789 | 3,478,031 | -- |
| Health Care | 33,790,087 | 31,150,990 | 2,639,097 | -- |
| Industrials | 42,119,527 | 38,709,845 | 3,409,682 | -- |
| Information Technology | 57,669,075 | 51,878,860 | 5,790,215 | -- |
| Materials | 11,277,466 | 10,816,163 | 461,303 | -- |
| Real Estate | 6,448,078 | 6,448,078 | -- | -- |
| Telecommunication Services | 4,016,760 | 2,112,301 | 1,904,459 | -- |
| Utilities | 1,622,991 | 1,622,991 | -- | -- |
| Investment Companies | 23,756,156 | 23,756,156 | -- | -- |
| Corporate Bonds | 12,647,775 | -- | 12,647,775 | -- |
| Government Obligations | 133,421,269 | -- | 133,421,269 | -- |
| Equity Central Funds | 13,466,475 | 13,466,475 | -- | -- |
| Money Market Funds | 6,649,748 | 6,649,748 | -- | -- |
| Total Investments in Securities: | $456,955,312 | $290,222,273 | $166,733,039 | $-- |
The following is a summary of transfers between Level 1 and Level 2 for the period ended April 30, 2017. Transfers are assumed to have occurred at the beginning of the period, and are primarily attributable to the valuation techniques used for foreign equity securities, as discussed in the accompanying Notes to Financial Statements:
| Transfers | Total |
| Level 1 to Level 2 | $1,035,727 |
| Level 2 to Level 1 | $4,682,378 |
Other Information
The composition of credit quality ratings as a percentage of Total Net Assets (Unaudited) is as follows. The information is based on the combined investments of the Fund and its pro-rata share of the investments of Fidelity's Central Funds, other than the Commodity Strategy and Money Market Central Funds.
| U.S. Government and U.S. Government Agency Obligations | 10.9% |
| AAA,AA,A | 13.5% |
| BBB | 4.2% |
| Not Rated | 3.5% |
| Equities | 66.6% |
| Short-Term Investments and Net Other Assets | 1.3% |
| 100.0% |
We have used ratings from Moody's Investors Service, Inc. Where Moody's® ratings are not available, we have used S&P® ratings. All ratings are as of the date indicated and do not reflect subsequent changes.
See accompanying notes which are an integral part of the financial statements.
Financial Statements
Statement of Assets and Liabilities
| April 30, 2017 | ||
| Assets | ||
| Investment in securities, at value (including securities loaned of $1,545,701) — See accompanying schedule: Unaffiliated issuers (cost $402,242,052) | $436,839,089 | |
| Fidelity Central Funds (cost $18,661,939) | 20,116,223 | |
| Total Investments (cost $420,903,991) | $456,955,312 | |
| Receivable for investments sold | 9,927,407 | |
| Receivable for fund shares sold | 169,325 | |
| Dividends receivable | 623,911 | |
| Interest receivable | 579,335 | |
| Distributions receivable from Fidelity Central Funds | 6,750 | |
| Prepaid expenses | 326 | |
| Other receivables | 38,937 | |
| Total assets | 468,301,303 | |
| Liabilities | ||
| Payable to custodian bank | $1,385,174 | |
| Payable for investments purchased | ||
| Regular delivery | 7,736,721 | |
| Delayed delivery | 16,234 | |
| Payable for fund shares redeemed | 1,407,322 | |
| Accrued management fee | 261,844 | |
| Distribution and service plan fees payable | 34,959 | |
| Other affiliated payables | 91,211 | |
| Other payables and accrued expenses | 86,608 | |
| Collateral on securities loaned | 1,614,003 | |
| Total liabilities | 12,634,076 | |
| Net Assets | $455,667,227 | |
| Net Assets consist of: | ||
| Paid in capital | $411,392,421 | |
| Undistributed net investment income | 372,035 | |
| Accumulated undistributed net realized gain (loss) on investments and foreign currency transactions | 7,853,928 | |
| Net unrealized appreciation (depreciation) on investments and assets and liabilities in foreign currencies | 36,048,843 | |
| Net Assets | $455,667,227 | |
| Calculation of Maximum Offering Price | ||
| Class A: | ||
| Net Asset Value and redemption price per share ($39,074,497 ÷ 1,671,496 shares) | $23.38 | |
| Maximum offering price per share (100/94.25 of $23.38) | $24.81 | |
| Class M: | ||
| Net Asset Value and redemption price per share ($14,088,353 ÷ 608,792 shares) | $23.14 | |
| Maximum offering price per share (100/96.50 of $23.14) | $23.98 | |
| Class C: | ||
| Net Asset Value and offering price per share ($25,616,470 ÷ 1,133,715 shares)(a) | $22.60 | |
| Global Balanced: | ||
| Net Asset Value, offering price and redemption price per share ($371,291,212 ÷ 15,666,278 shares) | $23.70 | |
| Class I: | ||
| Net Asset Value, offering price and redemption price per share ($5,596,695 ÷ 236,836 shares) | $23.63 |
(a) Redemption price per share is equal to net asset value less any applicable contingent deferred sales charge.
See accompanying notes which are an integral part of the financial statements.
Statement of Operations
| Six months ended April 30, 2017 | ||
| Investment Income | ||
| Dividends | $2,333,662 | |
| Interest | 916,422 | |
| Income from Fidelity Central Funds | 102,549 | |
| Income before foreign taxes withheld | 3,352,633 | |
| Less foreign taxes withheld | (103,291) | |
| Total income | 3,249,342 | |
| Expenses | ||
| Management fee | $1,626,906 | |
| Transfer agent fees | 445,457 | |
| Distribution and service plan fees | 212,689 | |
| Accounting and security lending fees | 121,133 | |
| Custodian fees and expenses | 78,956 | |
| Independent trustees' fees and expenses | 970 | |
| Registration fees | 72,350 | |
| Audit | 77,388 | |
| Legal | 4,943 | |
| Miscellaneous | 1,928 | |
| Total expenses before reductions | 2,642,720 | |
| Expense reductions | (40,420) | 2,602,300 |
| Net investment income (loss) | 647,042 | |
| Realized and Unrealized Gain (Loss) | ||
| Net realized gain (loss) on: | ||
| Investment securities: | ||
| Unaffiliated issuers | 10,257,150 | |
| Fidelity Central Funds | 83,084 | |
| Foreign currency transactions | (62,112) | |
| Capital gain distributions from Fidelity Central Funds | 41,001 | |
| Total net realized gain (loss) | 10,319,123 | |
| Change in net unrealized appreciation (depreciation) on: Investment securities | 8,992,922 | |
| Assets and liabilities in foreign currencies | 29,913 | |
| Total change in net unrealized appreciation (depreciation) | 9,022,835 | |
| Net gain (loss) | 19,341,958 | |
| Net increase (decrease) in net assets resulting from operations | $19,989,000 |
See accompanying notes which are an integral part of the financial statements.
Statement of Changes in Net Assets
| Six months ended April 30, 2017 | Year ended October 31, 2016 | |
| Increase (Decrease) in Net Assets | ||
| Operations | ||
| Net investment income (loss) | $647,042 | $2,437,965 |
| Net realized gain (loss) | 10,319,123 | 555,602 |
| Change in net unrealized appreciation (depreciation) | 9,022,835 | 9,847,356 |
| Net increase (decrease) in net assets resulting from operations | 19,989,000 | 12,840,923 |
| Distributions to shareholders from net investment income | (284,906) | – |
| Distributions to shareholders from net realized gain | (1,766,054) | (15,584,739) |
| Total distributions | (2,050,960) | (15,584,739) |
| Share transactions - net increase (decrease) | (74,107,200) | (38,129,692) |
| Redemption fees | 1,172 | 6,276 |
| Total increase (decrease) in net assets | (56,167,988) | (40,867,232) |
| Net Assets | ||
| Beginning of period | 511,835,215 | 552,702,447 |
| End of period | $455,667,227 | $511,835,215 |
| Other Information | ||
| Undistributed net investment income end of period | $372,035 | $9,899 |
See accompanying notes which are an integral part of the financial statements.
Financial Highlights — Fidelity Global Balanced Fund Class A
| Six months ended April 30, | Years ended October 31, | |||||
| 2017 | 2016 | 2015 | 2014 | 2013 | 2012 | |
| Selected Per–Share Data | ||||||
| Net asset value, beginning of period | $22.43 | $22.58 | $24.65 | $26.18 | $23.45 | $22.05 |
| Income from Investment Operations | ||||||
| Net investment income (loss)A | .01 | .06 | .09 | .15 | .13 | .27 |
| Net realized and unrealized gain (loss) | 1.03 | .44 | (.45) | .49 | 3.13 | 1.41 |
| Total from investment operations | 1.04 | .50 | (.36) | .64 | 3.26 | 1.68 |
| Distributions from net investment income | (.01) | – | (.01) | (.10) | (.24) | (.19) |
| Distributions from net realized gain | (.08) | (.65) | (1.70) | (2.07) | (.29) | (.09) |
| Total distributions | (.09) | (.65) | (1.71) | (2.17) | (.53) | (.28) |
| Redemption fees added to paid in capitalA,B | – | – | – | – | – | – |
| Net asset value, end of period | $23.38 | $22.43 | $22.58 | $24.65 | $26.18 | $23.45 |
| Total ReturnC,D,E | 4.64% | 2.35% | (1.48)% | 2.69% | 14.19% | 7.74% |
| Ratios to Average Net AssetsF,G | ||||||
| Expenses before reductions | 1.31%H | 1.30% | 1.29% | 1.28% | 1.31% | 1.33% |
| Expenses net of fee waivers, if any | 1.31%H | 1.30% | 1.29% | 1.28% | 1.31% | 1.33% |
| Expenses net of all reductions | 1.29%H | 1.29% | 1.27% | 1.27% | 1.29% | 1.32% |
| Net investment income (loss) | .10%H | .27% | .41% | .58% | .55% | 1.18% |
| Supplemental Data | ||||||
| Net assets, end of period (000 omitted) | $39,074 | $41,067 | $42,165 | $47,048 | $38,972 | $26,714 |
| Portfolio turnover rateI | 164%H | 155% | 140% | 157% | 181% | 157% |
A Calculated based on average shares outstanding during the period.
B Amount represents less than $.005 per share.
C Total returns for periods of less than one year are not annualized.
D Total returns would have been lower if certain expenses had not been reduced during the applicable periods shown.
E Total returns do not include the effect of the sales charges.
F Fees and expenses of any underlying Fidelity Central Funds are not included in the Fund's expense ratio. The Fund indirectly bears its proportionate share of the expenses of any underlying Fidelity Central Funds. Based on their most recent shareholder report date, the expenses of any underlying non-money market Fidelity Central Funds ranged from .05% to .08%.
G Expense ratios reflect operating expenses of the class. Expenses before reductions do not reflect amounts reimbursed by the investment adviser or reductions from brokerage service arrangements or reductions from other expense offset arrangements and do not represent the amount paid by the class during periods when reimbursements or reductions occur. Expenses net of fee waivers reflect expenses after reimbursement by the investment adviser but prior to reductions from brokerage service arrangements or other expense offset arrangements. Expenses net of all reductions represent the net expenses paid by the class.
H Annualized
I Amount does not include the portfolio activity of any underlying Fidelity Central Funds.
See accompanying notes which are an integral part of the financial statements.
Financial Highlights — Fidelity Global Balanced Fund Class M
| Six months ended April 30, | Years ended October 31, | |||||
| 2017 | 2016 | 2015 | 2014 | 2013 | 2012 | |
| Selected Per–Share Data | ||||||
| Net asset value, beginning of period | $22.23 | $22.44 | $24.52 | $26.04 | $23.32 | $21.96 |
| Income from Investment Operations | ||||||
| Net investment income (loss)A | (.02) | –B | .03 | .08 | .07 | .21 |
| Net realized and unrealized gain (loss) | 1.01 | .44 | (.46) | .49 | 3.12 | 1.41 |
| Total from investment operations | .99 | .44 | (.43) | .57 | 3.19 | 1.62 |
| Distributions from net investment income | – | – | – | (.02) | (.18) | (.17) |
| Distributions from net realized gain | (.08) | (.65) | (1.65) | (2.07) | (.29) | (.09) |
| Total distributions | (.08) | (.65) | (1.65) | (2.09) | (.47) | (.26) |
| Redemption fees added to paid in capitalA,B | – | – | – | – | – | – |
| Net asset value, end of period | $23.14 | $22.23 | $22.44 | $24.52 | $26.04 | $23.32 |
| Total ReturnC,D,E | 4.48% | 2.08% | (1.80)% | 2.40% | 13.94% | 7.46% |
| Ratios to Average Net AssetsF,G | ||||||
| Expenses before reductions | 1.60%H | 1.58% | 1.56% | 1.55% | 1.57% | 1.58% |
| Expenses net of fee waivers, if any | 1.60%H | 1.58% | 1.56% | 1.55% | 1.57% | 1.58% |
| Expenses net of all reductions | 1.58%H | 1.57% | 1.55% | 1.55% | 1.55% | 1.57% |
| Net investment income (loss) | (.19)%H | (.01)% | .14% | .31% | .28% | .94% |
| Supplemental Data | ||||||
| Net assets, end of period (000 omitted) | $14,088 | $15,368 | $16,867 | $17,662 | $14,650 | $13,654 |
| Portfolio turnover rateI | 164%H | 155% | 140% | 157% | 181% | 157% |
A Calculated based on average shares outstanding during the period.
B Amount represents less than $.005 per share.
C Total returns for periods of less than one year are not annualized.
D Total returns would have been lower if certain expenses had not been reduced during the applicable periods shown.
E Total returns do not include the effect of the sales charges.
F Fees and expenses of any underlying Fidelity Central Funds are not included in the Fund's expense ratio. The Fund indirectly bears its proportionate share of the expenses of any underlying Fidelity Central Funds. Based on their most recent shareholder report date, the expenses of any underlying non-money market Fidelity Central Funds ranged from .05% to .08%.
G Expense ratios reflect operating expenses of the class. Expenses before reductions do not reflect amounts reimbursed by the investment adviser or reductions from brokerage service arrangements or reductions from other expense offset arrangements and do not represent the amount paid by the class during periods when reimbursements or reductions occur. Expenses net of fee waivers reflect expenses after reimbursement by the investment adviser but prior to reductions from brokerage service arrangements or other expense offset arrangements. Expenses net of all reductions represent the net expenses paid by the class.
H Annualized
I Amount does not include the portfolio activity of any underlying Fidelity Central Funds.
See accompanying notes which are an integral part of the financial statements.
Financial Highlights — Fidelity Global Balanced Fund Class C
| Six months ended April 30, | Years ended October 31, | |||||
| 2017 | 2016 | 2015 | 2014 | 2013 | 2012 | |
| Selected Per–Share Data | ||||||
| Net asset value, beginning of period | $21.76 | $22.10 | $24.17 | $25.76 | $23.09 | $21.73 |
| Income from Investment Operations | ||||||
| Net investment income (loss)A | (.08) | (.12) | (.09) | (.05) | (.06) | .09 |
| Net realized and unrealized gain (loss) | 1.00 | .43 | (.46) | .49 | 3.08 | 1.41 |
| Total from investment operations | .92 | .31 | (.55) | .44 | 3.02 | 1.50 |
| Distributions from net investment income | – | – | – | – | (.06) | (.05) |
| Distributions from net realized gain | (.08) | (.65) | (1.52) | (2.03) | (.29) | (.09) |
| Total distributions | (.08) | (.65) | (1.52) | (2.03) | (.35) | (.14) |
| Redemption fees added to paid in capitalA,B | – | – | – | – | – | – |
| Net asset value, end of period | $22.60 | $21.76 | $22.10 | $24.17 | $25.76 | $23.09 |
| Total ReturnC,D,E | 4.25% | 1.51% | (2.33)% | 1.89% | 13.27% | 6.94% |
| Ratios to Average Net AssetsF,G | ||||||
| Expenses before reductions | 2.13%H | 2.11% | 2.10% | 2.08% | 2.12% | 2.13% |
| Expenses net of fee waivers, if any | 2.13%H | 2.11% | 2.09% | 2.08% | 2.12% | 2.13% |
| Expenses net of all reductions | 2.11%H | 2.10% | 2.08% | 2.07% | 2.10% | 2.12% |
| Net investment income (loss) | (.72)%H | (.54)% | (.40)% | (.22)% | (.26)% | .39% |
| Supplemental Data | ||||||
| Net assets, end of period (000 omitted) | $25,616 | $27,401 | $28,505 | $29,809 | $20,997 | $13,797 |
| Portfolio turnover rateI | 164%H | 155% | 140% | 157% | 181% | 157% |
A Calculated based on average shares outstanding during the period.
B Amount represents less than $.005 per share.
C Total returns for periods of less than one year are not annualized.
D Total returns would have been lower if certain expenses had not been reduced during the applicable periods shown.
E Total returns do not include the effect of the contingent deferred sales charge.
F Fees and expenses of any underlying Fidelity Central Funds are not included in the Fund's expense ratio. The Fund indirectly bears its proportionate share of the expenses of any underlying Fidelity Central Funds. Based on their most recent shareholder report date, the expenses of any underlying non-money market Fidelity Central Funds ranged from .05% to .08%.
G Expense ratios reflect operating expenses of the class. Expenses before reductions do not reflect amounts reimbursed by the investment adviser or reductions from brokerage service arrangements or reductions from other expense offset arrangements and do not represent the amount paid by the class during periods when reimbursements or reductions occur. Expenses net of fee waivers reflect expenses after reimbursement by the investment adviser but prior to reductions from brokerage service arrangements or other expense offset arrangements. Expenses net of all reductions represent the net expenses paid by the class.
H Annualized
I Amount does not include the portfolio activity of any underlying Fidelity Central Funds.
See accompanying notes which are an integral part of the financial statements.
Financial Highlights — Fidelity Global Balanced Fund
| Six months ended April 30, | Years ended October 31, | |||||
| 2017 | 2016 | 2015 | 2014 | 2013 | 2012 | |
| Selected Per–Share Data | ||||||
| Net asset value, beginning of period | $22.71 | $22.79 | $24.87 | $26.38 | $23.62 | $22.18 |
| Income from Investment Operations | ||||||
| Net investment income (loss)A | .04 | .13 | .16 | .22 | .21 | .33 |
| Net realized and unrealized gain (loss) | 1.05 | .44 | (.47) | .50 | 3.14 | 1.44 |
| Total from investment operations | 1.09 | .57 | (.31) | .72 | 3.35 | 1.77 |
| Distributions from net investment income | (.02) | – | (.08) | (.16) | (.30) | (.24) |
| Distributions from net realized gain | (.08) | (.65) | (1.70) | (2.07) | (.29) | (.09) |
| Total distributions | (.10) | (.65) | (1.77)B | (2.23) | (.59) | (.33) |
| Redemption fees added to paid in capitalA,C | – | – | – | – | – | – |
| Net asset value, end of period | $23.70 | $22.71 | $22.79 | $24.87 | $26.38 | $23.62 |
| Total ReturnD,E | 4.81% | 2.64% | (1.24)% | 3.00% | 14.52% | 8.11% |
| Ratios to Average Net AssetsF,G | ||||||
| Expenses before reductions | 1.03%H | 1.01% | 1.00% | .99% | 1.02% | 1.03% |
| Expenses net of fee waivers, if any | 1.03%H | 1.01% | 1.00% | .99% | 1.02% | 1.03% |
| Expenses net of all reductions | 1.01%H | 1.00% | .99% | .99% | 1.00% | 1.02% |
| Net investment income (loss) | .38%H | .56% | .70% | .87% | .84% | 1.48% |
| Supplemental Data | ||||||
| Net assets, end of period (000 omitted) | $371,291 | $422,406 | $457,766 | $554,896 | $540,412 | $468,758 |
| Portfolio turnover rateI | 164%H | 155% | 140% | 157% | 181% | 157% |
A Calculated based on average shares outstanding during the period.
B Total distributions of $1.77 per share is comprised of distributions from net investment income of $.075 and distributions from net realized gain of $1.697 per share.
C Amount represents less than $.005 per share.
D Total returns for periods of less than one year are not annualized.
E Total returns would have been lower if certain expenses had not been reduced during the applicable periods shown.
F Fees and expenses of any underlying Fidelity Central Funds are not included in the Fund's expense ratio. The Fund indirectly bears its proportionate share of the expenses of any underlying Fidelity Central Funds. Based on their most recent shareholder report date, the expenses of any underlying non-money market Fidelity Central Funds ranged from .05% to .08%.
G Expense ratios reflect operating expenses of the class. Expenses before reductions do not reflect amounts reimbursed by the investment adviser or reductions from brokerage service arrangements or reductions from other expense offset arrangements and do not represent the amount paid by the class during periods when reimbursements or reductions occur. Expenses net of fee waivers reflect expenses after reimbursement by the investment adviser but prior to reductions from brokerage service arrangements or other expense offset arrangements. Expenses net of all reductions represent the net expenses paid by the class.
H Annualized
I Amount does not include the portfolio activity of any underlying Fidelity Central Funds.
See accompanying notes which are an integral part of the financial statements.
Financial Highlights - Fidelity Global Balanced Fund Class I
| Six months ended April 30, | Years ended October 31, | |||||
| 2017 | 2016 | 2015 | 2014 | 2013 | 2012 | |
| Selected Per–Share Data | ||||||
| Net asset value, beginning of period | $22.65 | $22.72 | $24.80 | $26.33 | $23.58 | $22.16 |
| Income from Investment Operations | ||||||
| Net investment income (loss)A | .04 | .13 | .16 | .21 | .20 | .33 |
| Net realized and unrealized gain (loss) | 1.04 | .45 | (.47) | .49 | 3.14 | 1.43 |
| Total from investment operations | 1.08 | .58 | (.31) | .70 | 3.34 | 1.76 |
| Distributions from net investment income | (.02) | – | (.07) | (.17) | (.30) | (.25) |
| Distributions from net realized gain | (.08) | (.65) | (1.70) | (2.07) | (.29) | (.09) |
| Total distributions | (.10) | (.65) | (1.77) | (2.23)B | (.59) | (.34) |
| Redemption fees added to paid in capitalA,C | – | – | – | – | – | – |
| Net asset value, end of period | $23.63 | $22.65 | $22.72 | $24.80 | $26.33 | $23.58 |
| Total ReturnD,E | 4.77% | 2.69% | (1.25)% | 2.95% | 14.50% | 8.10% |
| Ratios to Average Net AssetsF,G | ||||||
| Expenses before reductions | 1.01%H | 1.00% | 1.01% | 1.02% | 1.03% | 1.04% |
| Expenses net of fee waivers, if any | 1.01%H | 1.00% | 1.01% | 1.02% | 1.03% | 1.04% |
| Expenses net of all reductions | 1.00%H | .99% | 1.00% | 1.02% | 1.01% | 1.03% |
| Net investment income (loss) | .39%H | .57% | .68% | .84% | .83% | 1.48% |
| Supplemental Data | ||||||
| Net assets, end of period (000 omitted) | $5,597 | $5,594 | $6,048 | $6,537 | $3,183 | $1,966 |
| Portfolio turnover rateI | 164%H | 155% | 140% | 157% | 181% | 157% |
A Calculated based on average shares outstanding during the period.
B Total distributions of $2.23 per share is comprised of distributions from net investment income of $.167 and distributions from net realized gain of $2.065 per share.
C Amount represents less than $.005 per share.
D Total returns for periods of less than one year are not annualized.
E Total returns would have been lower if certain expenses had not been reduced during the applicable periods shown.
F Fees and expenses of any underlying Fidelity Central Funds are not included in the Fund's expense ratio. The Fund indirectly bears its proportionate share of the expenses of any underlying Fidelity Central Funds. Based on their most recent shareholder report date, the expenses of any underlying non-money market Fidelity Central Funds ranged from .05% to .08%.
G Expense ratios reflect operating expenses of the class. Expenses before reductions do not reflect amounts reimbursed by the investment adviser or reductions from brokerage service arrangements or reductions from other expense offset arrangements and do not represent the amount paid by the class during periods when reimbursements or reductions occur. Expenses net of fee waivers reflect expenses after reimbursement by the investment adviser but prior to reductions from brokerage service arrangements or other expense offset arrangements. Expenses net of all reductions represent the net expenses paid by the class.
H Annualized
I Amount does not include the portfolio activity of any underlying Fidelity Central Funds.
See accompanying notes which are an integral part of the financial statements.
Notes to Financial Statements
For the period ended April 30, 2017
1. Organization.
Fidelity Global Balanced Fund (the Fund) is a fund of Fidelity Charles Street Trust (the Trust) and is authorized to issue an unlimited number of shares. The Trust is registered under the Investment Company Act of 1940, as amended (the 1940 Act), as an open-end management investment company organized as a Massachusetts business trust. The Fund offers Class A, Class M (formerly Class T), Class C, Global Balanced and Class I shares, each of which has equal rights as to assets and voting privileges. Each class has exclusive voting rights with respect to matters that affect that class.
After the close of business on June 24, 2016, all outstanding Class B shares were converted to Class A shares. All prior fiscal period dollar and share amounts for Class B presented in the Notes to Financial Statements are for the period November 1, 2015 through June 24, 2016.
2. Investments in Fidelity Central Funds.
The Fund invests in Fidelity Central Funds, which are open-end investment companies generally available only to other investment companies and accounts managed by the investment adviser and its affiliates. The Fund's Schedule of Investments lists each of the Fidelity Central Funds held as of period end, if any, as an investment of the Fund, but does not include the underlying holdings of each Fidelity Central Fund. As an Investing Fund, the Fund indirectly bears its proportionate share of the expenses of the underlying Fidelity Central Funds.
Based on its investment objective, each Fidelity Central Fund may invest or participate in various investment vehicles or strategies that are similar to those of the Fund. These strategies are consistent with the investment objectives of the Fund and may involve certain economic risks which may cause a decline in value of each of the Fidelity Central Funds and thus a decline in the value of the Fund. The Money Market Central Funds seek preservation of capital and current income and are managed by Fidelity Investments Money Management, Inc. (FIMM), an affiliate of the investment adviser. Annualized expenses of the Money Market Central Funds as of their most recent shareholder report date are less than .005%. The following summarizes the Fund's investment in each non-money market Fidelity Central Fund.
| Fidelity Central Fund | Investment Manager | Investment Objective | Investment Practices | Expense Ratio(a) |
| Fidelity Commodity Strategy Central Fund | Geode Capital Management, LLC (Geode) | Seeks to provide investment returns that correspond to the performance of the commodities market. | Investment in commodity-related investments through a wholly-owned subsidiary organized under the laws of the Cayman Islands Futures | .05% |
| Fidelity Emerging Markets Equity Central Fund | FMR Co., Inc. (FMRC) | Seeks capital appreciation by investing primarily in equity securities of issuers in emerging markets. | Foreign Securities Futures | .08% |
(a) Expenses expressed as a percentage of average net assets and are as of each underlying Central Fund's most recent annual or semi-annual shareholder report.
An unaudited holdings listing for the Fund, which presents direct holdings as well as the pro-rata share of any securities and other investments held indirectly through its investment in underlying non-money market Fidelity Central Funds, is available at fidelity.com and/or institutional.fidelity.com, as applicable. A complete unaudited list of holdings for each Fidelity Central Fund is available upon request or at the Securities and Exchange Commission (the SEC) website at www.sec.gov. In addition, the financial statements of the Fidelity Central Funds which contain the significant accounting policies (including investment valuation policies) of those funds, which are not covered by the Fund's Report of Independent Registered Public Accounting Firm, are available on the SEC website or upon request.
3. Significant Accounting Policies.
The Fund is an investment company and applies the accounting and reporting guidance of the Financial Accounting Standards Board (FASB) Accounting Standards Codification Topic 946 Financial Services – Investments Companies. The financial statements have been prepared in conformity with accounting principles generally accepted in the United States of America (GAAP), which require management to make certain estimates and assumptions at the date of the financial statements. Actual results could differ from those estimates. Subsequent events, if any, through the date that the financial statements were issued have been evaluated in the preparation of the financial statements. The following summarizes the significant accounting policies of the Fund:
Investment Valuation. Investments are valued as of 4:00 p.m. Eastern time on the last calendar day of the period. The Board of Trustees (the Board) has delegated the day to day responsibility for the valuation of the Fund's investments to the Fair Value Committee (the Committee) established by the Fund's investment adviser. In accordance with valuation policies and procedures approved by the Board, the Fund attempts to obtain prices from one or more third party pricing vendors or brokers to value its investments. When current market prices, quotations or currency exchange rates are not readily available or reliable, investments will be fair valued in good faith by the Committee, in accordance with procedures adopted by the Board. Factors used in determining fair value vary by investment type and may include market or investment specific events, changes in interest rates and credit quality. The frequency with which these procedures are used cannot be predicted and they may be utilized to a significant extent. The Committee oversees the Fund's valuation policies and procedures and reports to the Board on the Committee's activities and fair value determinations. The Board monitors the appropriateness of the procedures used in valuing the Fund's investments and ratifies the fair value determinations of the Committee.
The Fund categorizes the inputs to valuation techniques used to value its investments into a disclosure hierarchy consisting of three levels as shown below:
- Level 1 – quoted prices in active markets for identical investments
- Level 2 – other significant observable inputs (including quoted prices for similar investments, interest rates, prepayment speeds, etc.)
- Level 3 – unobservable inputs (including the Fund's own assumptions based on the best information available)
Valuation techniques used to value the Fund's investments by major category are as follows:
Equity securities, including restricted securities, for which market quotations are readily available, are valued at the last reported sale price or official closing price as reported by a third party pricing vendor on the primary market or exchange on which they are traded and are categorized as Level 1 in the hierarchy. In the event there were no sales during the day or closing prices are not available, securities are valued at the last quoted bid price or may be valued using the last available price and are generally categorized as Level 2 in the hierarchy. For foreign equity securities, when market or security specific events arise, comparisons to the valuation of American Depositary Receipts (ADRs), futures contracts, Exchange-Traded Funds (ETFs) and certain indexes as well as quoted prices for similar securities may be used and would be categorized as Level 2 in the hierarchy. Utilizing these techniques may result in transfers between Level 1 and Level 2. For equity securities, including restricted securities, where observable inputs are limited, assumptions about market activity and risk are used and these securities may be categorized as Level 3 in the hierarchy.
Debt securities, including restricted securities, are valued based on evaluated prices received from third party pricing vendors or from brokers who make markets in such securities. Corporate bonds, foreign government and government agency obligations and U.S. government and government agency obligations are valued by pricing vendors who utilize matrix pricing which considers yield or price of bonds of comparable quality, coupon, maturity and type or by broker-supplied prices. When independent prices are unavailable or unreliable, debt securities may be valued utilizing pricing methodologies which consider similar factors that would be used by third party pricing vendors. Debt securities are generally categorized as Level 2 in the hierarchy but may be Level 3 depending on the circumstances. ETFs are valued at their last sale price or official closing price as reported by a third party pricing vendor on the primary market or exchange on which they are traded and are categorized as Level 1 in the hierarchy. In the event there were no sales during the day but the exchange reports a closing bid level, ETFs are valued at the closing bid and would be categorized as Level 1 in the hierarchy. In the event there was no closing bid, ETFs may be valued by another method that the Board believes reflects fair value in accordance with the Board's fair value pricing policies and may be categorized as Level 2 in the hierarchy.
Investments in open-end mutual funds, including the Fidelity Central Funds, are valued at their closing net asset value (NAV) each business day and are categorized as Level 1 in the hierarchy.
Changes in valuation techniques may result in transfers in or out of an assigned level within the disclosure hierarchy. The aggregate value of investments by input level as of April 30, 2017, including information on transfers between Levels 1 and 2, is included at the end of the Fund's Schedule of Investments.
Foreign Currency. The Fund may use foreign currency contracts to facilitate transactions in foreign-denominated securities. Gains and losses from these transactions may arise from changes in the value of the foreign currency or if the counterparties do not perform under the contracts' terms.
Foreign-denominated assets, including investment securities, and liabilities are translated into U.S. dollars at the exchange rates at period end. Purchases and sales of investment securities, income and dividends received and expenses denominated in foreign currencies are translated into U.S. dollars at the exchange rate in effect on the transaction date.
The effects of exchange rate fluctuations on investments are included with the net realized and unrealized gain (loss) on investment securities. Other foreign currency transactions resulting in realized and unrealized gain (loss) are disclosed separately.
Investment Transactions and Income. For financial reporting purposes, the Fund's investment holdings and NAV include trades executed through the end of the last business day of the period. The NAV per share for processing shareholder transactions is calculated as of the close of business of the New York Stock Exchange (NYSE), normally 4:00 p.m. Eastern time and includes trades executed through the end of the prior business day. Gains and losses on securities sold are determined on the basis of identified cost and may include proceeds received from litigation. Dividend income is recorded on the ex-dividend date, except for certain dividends from foreign securities where the ex-dividend date may have passed, which are recorded as soon as the Fund is informed of the ex-dividend date. Non-cash dividends included in dividend income, if any, are recorded at the fair market value of the securities received. Income and capital gain distributions from Fidelity Central Funds, if any, are recorded on the ex-dividend date. Certain distributions received by the Fund represent a return of capital or capital gain. The Fund determines the components of these distributions subsequent to the ex-dividend date, based upon receipt of tax filings or other correspondence relating to the underlying investment. These distributions are recorded as a reduction of cost of investments and/or as a realized gain. Interest income is accrued as earned and includes coupon interest and amortization of premium and accretion of discount on debt securities as applicable. Investment income is recorded net of foreign taxes withheld where recovery of such taxes is uncertain. Debt obligations may be placed on non-accrual status and related interest income may be reduced by ceasing current accruals and writing off interest receivables when the collection of all or a portion of interest has become doubtful based on consistently applied procedures. A debt obligation is removed from non-accrual status when the issuer resumes interest payments or when collectability of interest is reasonably assured.
Class Allocations and Expenses. Investment income, realized and unrealized capital gains and losses, common expenses of the Fund, and certain fund-level expense reductions, if any, are allocated daily on a pro-rata basis to each class based on the relative net assets of each class to the total net assets of the Fund. Each class differs with respect to transfer agent and distribution and service plan fees incurred. Certain expense reductions may also differ by class. For the reporting period, the allocated portion of income and expenses to each class as a percent of its average net assets may vary due to the timing of recording these transactions in relation to fluctuating net assets of the classes. Expenses directly attributable to a fund are charged to that fund. Expenses attributable to more than one fund are allocated among the respective funds on the basis of relative net assets or other appropriate methods. Expense estimates are accrued in the period to which they relate and adjustments are made when actual amounts are known.
Income Tax Information and Distributions to Shareholders. Each year, the Fund intends to qualify as a regulated investment company under Subchapter M of the Internal Revenue Code, including distributing substantially all of its taxable income and realized gains. As a result, no provision for U.S. Federal income taxes is required. The Fund files a U.S. federal tax return, in addition to state and local tax returns as required. The Fund's federal income tax returns are subject to examination by the Internal Revenue Service (IRS) for a period of three fiscal years after they are filed. State and local tax returns may be subject to examination for an additional fiscal year depending on the jurisdiction. Foreign taxes are provided for based on the Fund's understanding of the tax rules and rates that exist in the foreign markets in which it invests.
Distributions are declared and recorded on the ex-dividend date. Income dividends and capital gain distributions are declared separately for each class. Income and capital gain distributions are determined in accordance with income tax regulations, which may differ from GAAP.
Capital accounts within the financial statements are adjusted for permanent book-tax differences. These adjustments have no impact on net assets or the results of operations. Capital accounts are not adjusted for temporary book-tax differences which will reverse in a subsequent period.
Book-tax differences are primarily due to foreign currency transactions, passive foreign investment companies (PFIC), market discount, partnerships (including allocations from Fidelity Central Funds), deferred trustees compensation, net operating losses, losses deferred due to wash sales and excise tax regulations.
The federal tax cost of investment securities and unrealized appreciation (depreciation) as of period end were as follows:
| Gross unrealized appreciation | $50,353,565 |
| Gross unrealized depreciation | (15,186,393) |
| Net unrealized appreciation (depreciation) on securities | $35,167,172 |
| Tax cost | $421,788,140 |
Short-Term Trading (Redemption) Fees. Shares held by investors in the Fund less than 30 days may have been subject to a redemption fee equal to 1.00% of the NAV of shares redeemed. All redemption fees, which reduce the proceeds of the shareholder redemption, are retained by the Fund and accounted for as an addition to paid in capital. In November 2016, the Board of Trustees approved the elimination of these redemption fees effective December 12, 2016.
Delayed Delivery Transactions and When-Issued Securities. During the period, the Fund transacted in securities on a delayed delivery or when-issued basis. Payment and delivery may take place after the customary settlement period for that security. The price of the underlying securities and the date when the securities will be delivered and paid for are fixed at the time the transaction is negotiated. The securities purchased on a delayed delivery or when-issued basis are identified as such in the Fund's Schedule of Investments. The Fund may receive compensation for interest forgone in the purchase of a delayed delivery or when-issued security. With respect to purchase commitments, the Fund identifies securities as segregated in its records with a value at least equal to the amount of the commitment. Losses may arise due to changes in the value of the underlying securities or if the counterparty does not perform under the contract's terms, or if the issuer does not issue the securities due to political, economic, or other factors.
Restricted Securities. The Fund may invest in securities that are subject to legal or contractual restrictions on resale. These securities generally may be resold in transactions exempt from registration or to the public if the securities are registered. Disposal of these securities may involve time-consuming negotiations and expense, and prompt sale at an acceptable price may be difficult. Information regarding restricted securities is included at the end of the Fund's Schedule of Investments.
New Accounting Pronouncement. In March 2017, the Financial Accounting Standards Board (FASB) issued an Accounting Standards Update (ASU), ASU 2017-08, which amends the amortization period for certain callable debt securities that are held at a premium. The amendment requires the premium to be amortized to the earliest call date. The amendments do not require an accounting change for securities held at a discount. The ASU is effective for annual periods beginning after December 15, 2019. Management is currently evaluating the potential impact of these changes to the financial statements.
4. Purchases and Sales of Investments.
Purchases and sales of securities (including the Equity Central Funds), other than short-term securities and U.S. government securities, aggregated $364,773,583 and $437,930,506, respectively.
5. Fees and Other Transactions with Affiliates.
Management Fee. Fidelity Management & Research Company (the investment adviser) and its affiliates provide the Fund with investment management related services for which the Fund pays a monthly management fee. The management fee is the sum of an individual fund fee rate that is based on an annual rate of .45% of the Fund's average net assets and an annualized group fee rate that averaged .25% during the period. The group fee rate is based upon the average net assets of all the mutual funds advised by the investment adviser, including any mutual funds previously advised by the investment adviser that are currently advised by Fidelity SelectCo, LLC, an affiliate of the investment adviser. The group fee rate decreases as assets under management increase and increases as assets under management decrease. For the reporting period, the total annualized management fee rate was .70% of the Fund's average net assets.
Distribution and Service Plan Fees. In accordance with Rule 12b-1 of the 1940 Act, the Fund has adopted separate Distribution and Service Plans for each class of shares. Certain classes pay Fidelity Distributors Corporation (FDC), an affiliate of the investment adviser, separate Distribution and Service Fees, each of which is based on an annual percentage of each class' average net assets. In addition, FDC may pay financial intermediaries for selling shares of the Fund and providing shareholder support services. For the period, the Distribution and Service Fee rates, total fees and amounts retained by FDC were as follows:
| Distribution Fee | Service Fee | Total Fees | Retained by FDC |
|
| Class A | -% | .25% | $49,118 | $445 |
| Class M | .25% | .25% | 35,688 | 478 |
| Class C | .75% | .25% | 127,883 | 13,474 |
| $212,689 | $14,397 |
Sales Load. FDC may receive a front-end sales charge of up to 5.75% for selling Class A shares and 3.50% for selling Class M shares, some of which is paid to financial intermediaries for selling shares of the Fund. Depending on the holding period, FDC may receive contingent deferred sales charges levied on Class A, Class M, and Class C redemptions. The deferred sales charges are 1.00% for Class C shares, 1.00% for certain purchases of Class A shares and .25% for certain purchases of Class M shares.
For the period, sales charge amounts retained by FDC were as follows:
| Retained by FDC |
|
| Class A | $5,068 |
| Class M | 1,391 |
| Class C(a) | 1,258 |
| $7,717 |
(a) When Class C shares are initially sold, FDC pays commissions from its own resources to financial intermediaries through which the sales are made.
Transfer Agent Fees. Fidelity Investments Institutional Operations Company, Inc., (FIIOC), an affiliate of the investment adviser, is the transfer, dividend disbursing and shareholder servicing agent for each class of the Fund. FIIOC receives account fees and asset-based fees that vary according to the account size and type of account of the shareholders of the respective classes of the Fund. FIIOC pays for typesetting, printing and mailing of shareholder reports, except proxy statements.
For the period, transfer agent fees for each class were as follows:
| Amount | % of Class-Level Average Net Assets(a) |
|
| Class A | $41,858 | .21 |
| Class M | 17,943 | .25 |
| Class C | 36,049 | .28 |
| Global Balanced | 345,369 | .18 |
| Class I | 4,238 | .16 |
| $445,457 |
(a) Annualized
Accounting and Security Lending Fees. Fidelity Service Company, Inc. (FSC), an affiliate of the investment adviser, maintains the Fund's accounting records. The accounting fee is based on the level of average net assets for each month. Under a separate contract, FSC administers the security lending program. The security lending fee is based on the number and duration of lending transactions.
Brokerage Commissions. The Fund placed a portion of its portfolio transactions with brokerage firms which are affiliates of the investment adviser. Brokerage commissions are included in net realized gain (loss) and change in net unrealized appreciation (depreciation) in the Statement of Operations. The commissions paid to these affiliated firms were $2,647 for the period.
Interfund Trades. The Fund may purchase from or sell securities to other Fidelity Funds under procedures adopted by the Board. The procedures have been designed to ensure these interfund trades are executed in accordance with Rule 17a-7 of the 1940 Act. Interfund trades are included within the respective purchases and sales amounts shown in the Purchases and Sales of Investments note.
6. Committed Line of Credit.
The Fund participates with other funds managed by the investment adviser or an affiliate in a $4.25 billion credit facility (the "line of credit") to be utilized for temporary or emergency purposes to fund shareholder redemptions or for other short-term liquidity purposes. The Fund has agreed to pay commitment fees on its pro-rata portion of the line of credit, which amounted to $815 and is reflected in Miscellaneous expenses on the Statement of Operations. During the period, the Fund did not borrow on this line of credit.
7. Security Lending.
The Fund lends portfolio securities through a lending agent from time to time in order to earn additional income. For equity securities, a lending agent is used and may loan securities to certain qualified borrowers, including Fidelity Capital Markets (FCM), a broker-dealer affiliated with the Fund. On the settlement date of the loan, the Fund receives collateral (in the form of U.S. Treasury obligations, letters of credit and/or cash) against the loaned securities and maintains collateral in an amount not less than 100% of the market value of the loaned securities during the period of the loan. The market value of the loaned securities is determined at the close of business of the Fund and any additional required collateral is delivered to the Fund on the next business day. The Fund or borrower may terminate the loan at any time, and if the borrower defaults on its obligation to return the securities loaned because of insolvency or other reasons, the Fund may apply collateral received from the borrower against the obligation. The Fund may experience delays and costs in recovering the securities loaned. Any cash collateral received is invested in the Fidelity Securities Lending Cash Central Fund. The value of loaned securities and cash collateral at period end are disclosed on the Fund's Statement of Assets and Liabilities. At period end, there were no security loans outstanding with FCM. Security lending income represents the income earned on investing cash collateral, less rebates paid to borrowers and any lending agent fees associated with the loan, plus any premium payments received for lending certain types of securities. Security lending income is presented in the Statement of Operations as a component of income from Fidelity Central Funds. Total security lending income during the period amounted to $13,869, including $590 from securities loaned to FCM.
8. Expense Reductions.
Commissions paid to certain brokers with whom the investment adviser, or its affiliates, places trades on behalf of the Fund include an amount in addition to trade execution, which may be rebated back to the Fund to offset certain expenses. This amount totaled $38,237 for the period.
In addition, during the period the investment adviser reimbursed and/or waived a portion of fund-level operating expenses in the amount of $2,183.
9. Distributions to Shareholders.
Distributions to shareholders of each class were as follows:
| Six months ended April 30, 2017 | Year ended October 31, 2016 | |
| From net investment income | ||
| Class A | $9,024 | $– |
| Global Balanced | 272,384 | – |
| Class I | 3,498 | – |
| Total | $284,906 | $– |
| From net realized gain | ||
| Class A | $144,388 | $1,198,713 |
| Class M | 54,135 | 472,741 |
| Class B | – | 38,199 |
| Class C | 96,163 | 844,073 |
| Global Balanced | 1,452,714 | 12,857,308 |
| Class I | 18,654 | 173,705 |
| Total | $1,766,054 | $15,584,739 |
10. Share Transactions.
Share transactions for each class were as follows and may contain automatic conversions between classes or exchanges between affiliated funds:
| Shares | Shares | Dollars | Dollars | |
| Six months ended April 30, 2017 | Year ended October 31, 2016 | Six months ended April 30, 2017 | Year ended October 31, 2016 | |
| Class A | ||||
| Shares sold | 98,235 | 315,518 | $2,194,801 | $6,953,190 |
| Reinvestment of distributions | 6,737 | 52,986 | 147,954 | 1,141,851 |
| Shares redeemed | (264,615) | (405,081) | (5,918,844) | (9,020,050) |
| Net increase (decrease) | (159,643) | (36,577) | $(3,576,089) | $(925,009) |
| Class M | ||||
| Shares sold | 34,648 | 72,280 | $767,629 | $1,589,041 |
| Reinvestment of distributions | 2,470 | 21,845 | 53,752 | 467,928 |
| Shares redeemed | (119,671) | (154,320) | (2,634,989) | (3,396,160) |
| Net increase (decrease) | (82,553) | (60,195) | $(1,813,608) | $(1,339,191) |
| Class B | ||||
| Shares sold | – | 48 | $– | $1,021 |
| Reinvestment of distributions | – | 1,741 | – | 37,184 |
| Shares redeemed | – | (62,152) | $– | $(1,356,722) |
| Net increase (decrease) | – | (60,363) | $– | $(1,318,517) |
| Class C | ||||
| Shares sold | 79,792 | 227,726 | $1,726,054 | $4,917,879 |
| Reinvestment of distributions | 4,316 | 37,381 | 91,889 | 787,624 |
| Shares redeemed | (209,424) | (295,837) | (4,514,525) | (6,357,105) |
| Net increase (decrease) | (125,316) | (30,730) | $(2,696,582) | $(651,602) |
| Global Balanced | ||||
| Shares sold | 590,963 | 2,114,763 | $13,354,659 | $47,490,820 |
| Reinvestment of distributions | 73,780 | 560,214 | 1,640,873 | 12,195,855 |
| Shares redeemed | (3,595,122) | (4,162,916) | (80,805,299) | (93,142,954) |
| Net increase (decrease) | (2,930,379) | (1,487,939) | $(65,809,767) | $(33,456,279) |
| Class I | ||||
| Shares sold | 72,250 | 69,161 | $1,638,061 | $1,567,504 |
| Reinvestment of distributions | 910 | 6,856 | 20,184 | 148,834 |
| Shares redeemed | (83,321) | (95,184) | (1,869,399) | (2,155,432) |
| Net increase (decrease) | (10,161) | (19,167) | $(211,154) | $(439,094) |
11. Other.
The Fund's organizational documents provide former and current trustees and officers with a limited indemnification against liabilities arising in connection with the performance of their duties to the Fund. In the normal course of business, the Fund may also enter into contracts that provide general indemnifications. The Fund's maximum exposure under these arrangements is unknown as this would be dependent on future claims that may be made against the Fund. The risk of material loss from such claims is considered remote.
Report of Independent Registered Public Accounting Firm
To the Trustees of Fidelity Charles Street Trust and Shareholders of Fidelity Global Balanced Fund:
In our opinion, the accompanying statement of assets and liabilities, including the schedule of investments, and the related statements of operations and of changes in net assets and the financial highlights present fairly, in all material respects, the financial position of Fidelity Global Balanced Fund (a fund of Fidelity Charles Street Trust) as of April 30, 2017, the results of its operations, changes in its net assets, and financial highlights for each of the periods indicated, in conformity with accounting principles generally accepted in the United States of America. These financial statements and financial highlights (hereafter referred to as “financial statements”) are the responsibility of the Fidelity Global Balanced Fund’s management. Our responsibility is to express an opinion on these financial statements based on our audits. We conducted our audits of these financial statements in accordance with the standards of the Public Company Accounting Oversight Board (United States). Those standards require that we plan and perform the audit to obtain reasonable assurance about whether the financial statements are free of material misstatement. An audit includes examining, on a test basis, evidence supporting the amounts and disclosures in the financial statements, assessing the accounting principles used and significant estimates made by management, and evaluating the overall financial statement presentation. Our procedures included confirmation of securities owned as of April 30, 2017 by correspondence with the custodian and brokers; when replies were not received from brokers, we performed other auditing procedures. We believe that our audits provide a reasonable basis for our opinion.
PricewaterhouseCoopers LLP
Boston, Massachusetts
June 19, 2017
Shareholder Expense Example
As a shareholder of the Fund, you incur two types of costs: (1) transaction costs, including sales charges (loads) on purchase payments or redemption proceeds, redemption fees and (2) ongoing costs, including management fees, distribution and/or service (12b-1) fees and other Fund expenses. This Example is intended to help you understand your ongoing costs (in dollars) of investing in the Fund and to compare these costs with the ongoing costs of investing in other mutual funds.
The Example is based on an investment of $1,000 invested at the beginning of the period and held for the entire period (November 1, 2016 to April 30, 2017).
Actual Expenses
The first line of the accompanying table for each class of the Fund provides information about actual account values and actual expenses. You may use the information in this line, together with the amount you invested, to estimate the expenses that you paid over the period. Simply divide your account value by $1,000.00 (for example, an $8,600 account value divided by $1,000.00 = 8.6), then multiply the result by the number in the first line for a class of the Fund under the heading entitled "Expenses Paid During Period" to estimate the expenses you paid on your account during this period. A small balance maintenance fee of $12.00 that is charged once a year may apply for certain accounts with a value of less than $2,000. This fee is not included in the table below. If it was, the estimate of expenses you paid during the period would be higher, and your ending account value lower, by this amount. In addition, the Fund, as a shareholder in the underlying Fidelity Central Funds, will indirectly bear its pro-rata share of the fees and expenses incurred by the underlying Fidelity Central Funds. These fees and expenses are not included in the Fund's annualized expense ratio used to calculate the expense estimate in the table below.
Hypothetical Example for Comparison Purposes
The second line of the accompanying table for each class of the Fund provides information about hypothetical account values and hypothetical expenses based on a Class' actual expense ratio and an assumed rate of return of 5% per year before expenses, which is not the Class' actual return. The hypothetical account values and expenses may not be used to estimate the actual ending account balance or expenses you paid for the period. You may use this information to compare the ongoing costs of investing in the Fund and other funds. To do so, compare this 5% hypothetical example with the 5% hypothetical examples that appear in the shareholder reports of the other funds. A small balance maintenance fee of $12.00 that is charged once a year may apply for certain accounts with a value of less than $2,000. This fee is not included in the table below. If it was, the estimate of expenses you paid during the period would be higher, and your ending account value lower, by this amount. In addition, the Fund, as a shareholder in the underlying Fidelity Central Funds, will indirectly bear its pro-rata share of the fees and expenses incurred by the underlying Fidelity Central Funds. These fees and expenses are not included in the Fund's annualized expense ratio used to calculate the expense estimate in the table below.
Please note that the expenses shown in the table are meant to highlight your ongoing costs only and do not reflect any transaction costs. Therefore, the second line of the table is useful in comparing ongoing costs only, and will not help you determine the relative total costs of owning different funds. In addition, if these transactional costs were included, your costs would have been higher.
| Annualized Expense Ratio-A | Beginning Account Value November 1, 2016 | Ending Account Value April 30, 2017 | Expenses Paid During Period-B November 1, 2016 to April 30, 2017 |
|
| Class A | 1.31% | |||
| Actual | $1,000.00 | $1,046.40 | $6.65 | |
| Hypothetical-C | $1,000.00 | $1,018.30 | $6.56 | |
| Class M | 1.60% | |||
| Actual | $1,000.00 | $1,044.80 | $8.11 | |
| Hypothetical-C | $1,000.00 | $1,016.86 | $8.00 | |
| Class C | 2.13% | |||
| Actual | $1,000.00 | $1,042.50 | $10.79 | |
| Hypothetical-C | $1,000.00 | $1,014.23 | $10.64 | |
| Global Balanced | 1.03% | |||
| Actual | $1,000.00 | $1,048.10 | $5.23 | |
| Hypothetical-C | $1,000.00 | $1,019.69 | $5.16 | |
| Class I | 1.01% | |||
| Actual | $1,000.00 | $1,047.70 | $5.13 | |
| Hypothetical-C | $1,000.00 | $1,019.79 | $5.06 |
A Annualized expense ratio reflects expenses net of applicable fee waivers.
B Expenses are equal to each Class' annualized expense ratio, multiplied by the average account value over the period, multiplied by 181/365 (to reflect the one-half year period). In addition to the expenses noted above, the Fund also indirectly bears its proportional share of the expenses of the underlying Fidelity Central Funds. Annualized expenses of the underlying non-money market Fidelity Central Funds as of their most recent fiscal half year ranged from 0.05% to .08%.
C 5% return per year before expenses
![]()
AGBL-SANN-0617
1.883468.108
Item 2.
Code of Ethics
Not applicable.
Item 3.
Audit Committee Financial Expert
Not applicable.
Item 4.
Principal Accountant Fees and Services
Not applicable.
Item 5.
Audit Committee of Listed Registrants
Not applicable.
Item 6.
Investments
(a)
Not applicable.
(b)
Not applicable
Item 7.
Disclosure of Proxy Voting Policies and Procedures for Closed-End Management Investment Companies
Not applicable.
Item 8.
Portfolio Managers of Closed-End Management Investment Companies
Not applicable.
Item 9.
Purchase of Equity Securities by Closed-End Management Investment Company and Affiliated Purchasers
Not applicable.
Item 10.
Submission of Matters to a Vote of Security Holders
There were no material changes to the procedures by which shareholders may recommend nominees to the Fidelity Charles Street Trust’s Board of Trustees.
Item 11.
Controls and Procedures
(a)(i) The President and Treasurer and the Chief Financial Officer have concluded that the Fidelity Charles Street Trust’s (the “Trust”) disclosure controls and procedures (as
defined in Rule 30a-3(c) under the Investment Company Act) provide reasonable assurances that material information relating to the Trust is made known to them by the appropriate persons, based on their evaluation of these controls and procedures as of a date within 90 days of the filing date of this report.
(a)(ii) There was no change in the Trust’s internal control over financial reporting (as defined in Rule 30a-3(d) under the Investment Company Act) that occurred during the second fiscal quarter of the period covered by this report that has materially affected, or is reasonably likely to materially affect, the Trust’s internal control over financial reporting.
Item 12.
Exhibits
(a) | (1) | Not applicable. |
(a) | (2) | Certification pursuant to Rule 30a-2(a) under the Investment Company Act of 1940 (17 CFR 270.30a-2(a)) is filed and attached hereto as Exhibit 99.CERT. |
(a) | (3) | Not applicable. |
(b) | Certification pursuant to Rule 30a-2(b) under the Investment Company Act of 1940 (17 CFR 270.30a-2(b)) is furnished and attached hereto as Exhibit 99.906CERT. |
SIGNATURES
Pursuant to the requirements of the Securities Exchange Act of 1934 and the Investment Company Act of 1940, the registrant has duly caused this report to be signed on its behalf by the undersigned, thereunto duly authorized.
Fidelity Charles Street Trust
By: | /s/Stephanie J. Dorsey |
Stephanie J. Dorsey | |
President and Treasurer | |
Date: | June 26, 2017 |
Pursuant to the requirements of the Securities Exchange Act of 1934 and the Investment Company Act of 1940, this report has been signed below by the following persons on behalf of the registrant and in the capacities and on the dates indicated.
By: | /s/Stephanie J. Dorsey |
Stephanie J. Dorsey | |
President and Treasurer | |
Date: | June 26, 2017 |
By: | /s/Howard J. Galligan III |
Howard J. Galligan III | |
Chief Financial Officer | |
Date: | June 26, 2017 |