Fidelity® Mega Cap Stock Fund
Class/Ticker
Fidelity Advisor® Mega Cap Stock Fund Z/FZALX
Summary Prospectus
September 6, 2013

Fund Summary
Fund/Class:
Fidelity® Mega Cap Stock Fund/Fidelity Advisor® Mega Cap Stock Fund Z
Investment Objective
The fund seeks high total return through a combination of current income and capital appreciation.
Fee Table
The following table describes the fees and expenses that may be incurred when you buy and hold shares of the fund.
|
Shareholder fees |
None |
||||||
Annual class operating expenses
(expenses that you pay each year as a % of the value of your investment)
|
Management fee |
0.46% |
|
Distribution and/or Service (12b-1) fees |
None |
|
Other expensesA |
0.11% |
|
Total annual operating expenses |
0.57% |
A Based on estimated amounts for the current fiscal year.
This example helps compare the cost of investing in the fund with the cost of investing in other funds.
Let's say, hypothetically, that the annual return for shares of the fund is 5% and that your shareholder fees and the annual operating expenses for shares of the fund are exactly as described in the fee table. This example illustrates the effect of fees and expenses, but is not meant to suggest actual or expected fees and expenses or returns, all of which may vary. For every $10,000 you invested, here's how much you would pay in total expenses if you sell all of your shares at the end of each time period indicated:
|
1 year |
$ 58 |
|
3 years |
$ 183 |
|
5 years |
$ 318 |
|
10 years |
$ 714 |
Portfolio Turnover
The fund pays transaction costs, such as commissions, when it buys and sells securities (or "turns over" its portfolio). A higher portfolio turnover rate may indicate higher transaction costs and may result in higher taxes when fund shares are held in a taxable account. These costs, which are not reflected in annual operating expenses or in the example, affect the fund's performance. During the most recent fiscal year, the fund's portfolio turnover rate was 29% of the average value of its portfolio.
Summary Prospectus
Principal Investment Strategies
- Normally investing at least 80% of assets in common stocks of companies with mega market capitalizations (which, for purposes of this fund, are those companies with market capitalizations similar to companies in the Russell Top 200® Index or the S&P 100® Index).
- Investing in domestic and foreign issuers.
- Investing in either "growth" stocks or "value" stocks or both.
- Using fundamental analysis of factors such as each issuer's financial condition and industry position, as well as market and economic conditions, to select investments.
Principal Investment Risks
- Stock Market Volatility. Stock markets are volatile and can decline significantly in response to adverse issuer, political, regulatory, market, or economic developments. Different parts of the market, including different market sectors, and different types of securities can react differently to these developments.
- Foreign Exposure. Foreign markets can be more volatile than the U.S. market due to increased risks of adverse issuer, political, regulatory, market, or economic developments and can perform differently from the U.S. market.
- Issuer-Specific Changes. The value of an individual security or particular type of security can be more volatile than, and can perform differently from, the market as a whole.
An investment in the fund is not a deposit of a bank and is not insured or guaranteed by the Federal Deposit Insurance Corporation or any other government agency. You could lose money by investing in the fund.
Performance
The following information is intended to help you understand the risks of investing in the fund. The information illustrates the changes in the performance of the fund's shares from year to year and compares the performance of the fund's shares to the performance of a securities market index and an additional index over various periods of time. The indexes have characteristics relevant to the fund's investment strategies. Index descriptions appear in the Additional Index Information section of the prospectus. Past performance is not an indication of future performance.
Visit www.advisor.fidelity.com for updated return information.
Performance history will be available for Class Z after Class Z has been in operation for one calendar year.
Summary Prospectus
Fund Summary - continued
|
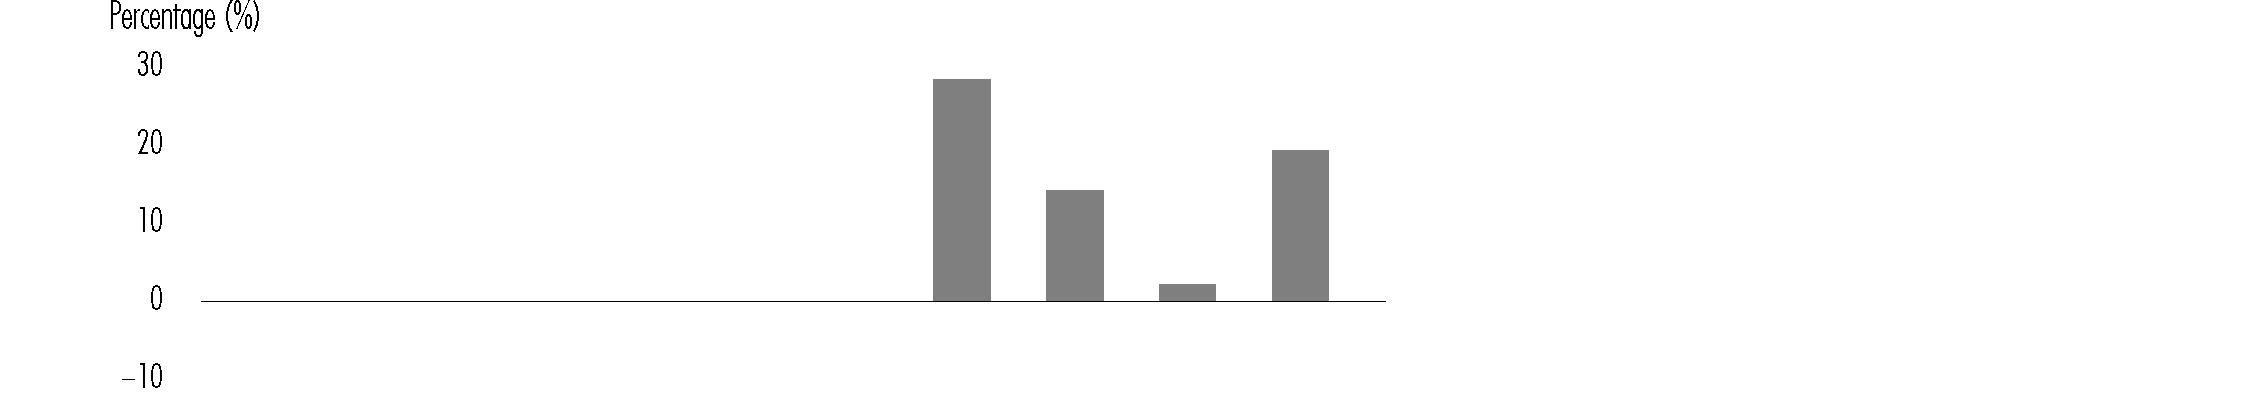
Calendar Years |
|
|
|
|
|
|
2009 |
2010 |
2011 |
2012 |
|
|
|
|
|
|
|
|
28.55% |
14.35% |
2.28% |
19.48% |
|
During the periods shown in the chart: |
Returns |
Quarter ended |
|
Highest Quarter Return |
18.36% |
June 30, 2009 |
|
Lowest Quarter Return |
-13.08% |
September 30, 2011 |
|
Year-to-Date Return |
14.25% |
June 30, 2013 |
A The returns shown above are for Institutional Class, which is not offered through this prospectus. Class Z would have substantially similar annual returns to Institutional Class because the classes are invested in the same portfolio of securities. Class Z's returns would differ from Institutional Class's returns to the extent that the classes do not have the same expenses.
|
For the periods ended |
Past 1 |
Life of |
|
Institutional ClassB |
19.48% |
3.75% |
|
S&P 500® Index |
16.00% |
3.63% |
|
Russell Top 200® Index |
16.04% |
3.24% |
A From February 5, 2008.
B The returns shown above are for Institutional Class, which is not offered through this prospectus. Class Z would have substantially similar annual returns to Institutional Class because the classes are invested in the same portfolio of securities. Class Z's returns would differ from Institutional Class's returns to the extent that the classes do not have the same expenses.
Investment Adviser
Fidelity Management & Research Company (FMR) is the fund's manager. FMR Co., Inc. (FMRC) and other investment advisers serve as sub- advisers for the fund.
Portfolio Manager(s)
Matthew Fruhan (portfolio manager) has managed the fund since April 2009.
Summary Prospectus
Purchase and Sale of Shares
Class Z shares are offered to employee benefit plans investing through an intermediary and employee benefit plans not recordkept by Fidelity. For this purpose, employee benefit plans generally include profit sharing, 401(k), and 403(b) plans, but do not include: IRAs; SIMPLE, SEP, or SARSEP plans; plans covering self-employed individuals and their employees (formerly Keogh/H.R. 10 plans); health savings accounts; or plans investing through the Fidelity Advisor 403(b) program.
Plan participants may purchase Class Z shares of the fund only if Class Z shares are eligible for sale and available through their plan. You may buy or sell shares by contacting your employee benefit plan.
The price to buy one share of Class Z is its net asset value per share (NAV). Your shares will be bought at the NAV next calculated after your order is received in proper form.
The price to sell one share of Class Z is its NAV. Your shares will be sold at the NAV next calculated after your order is received in proper form.
The fund is open for business each day the New York Stock Exchange (NYSE) is open.
|
Initial Purchase Minimum |
$5 million |
Plan participants purchasing Class Z shares available through their plan will not be subject to the initial purchase minimum. The fund may waive or lower purchase minimums in other circumstances.
Tax Information
Distributions by the fund to tax-advantaged retirement plan accounts are not taxable currently (but you may be taxed later, upon withdrawal of your investment from such account).
Payments to Broker-Dealers and Other Financial Intermediaries
The fund, FMR, Fidelity Distributors Corporation (FDC), and/or their affiliates may pay intermediaries, including retirement plan sponsors, administrators, or service-providers (who may be affiliated with FMR or FDC), for the sale of fund shares and related services. These payments may create a conflict of interest by influencing your intermediary and your investment professional to recommend the fund over another investment. Ask your investment professional or visit your intermediary's web site for more information.
Summary Prospectus
FDC is a member of the Securities Investor Protection Corporation (SIPC). You may obtain information about SIPC, including the SIPC brochure, by visiting www.sipc.org or calling SIPC at 202-371-8300.
Fidelity, Fidelity Advisor, and Fidelity Investments & Pyramid Design are registered service marks of FMR LLC. © 2013 FMR LLC. All rights reserved.
The third-party marks appearing above are the marks of their respective owners.
1.965577.101 AGIIZ-SUM-0813-01