 | Novo Nordisk Annual Report 2023 | Introducing Novo Nordisk Strategic Aspirations Risks Management Consolidated statements Additional information | 2 | ||||||||
| Management review | Consolidated statements and additional information |  | ||||||||||||||||||
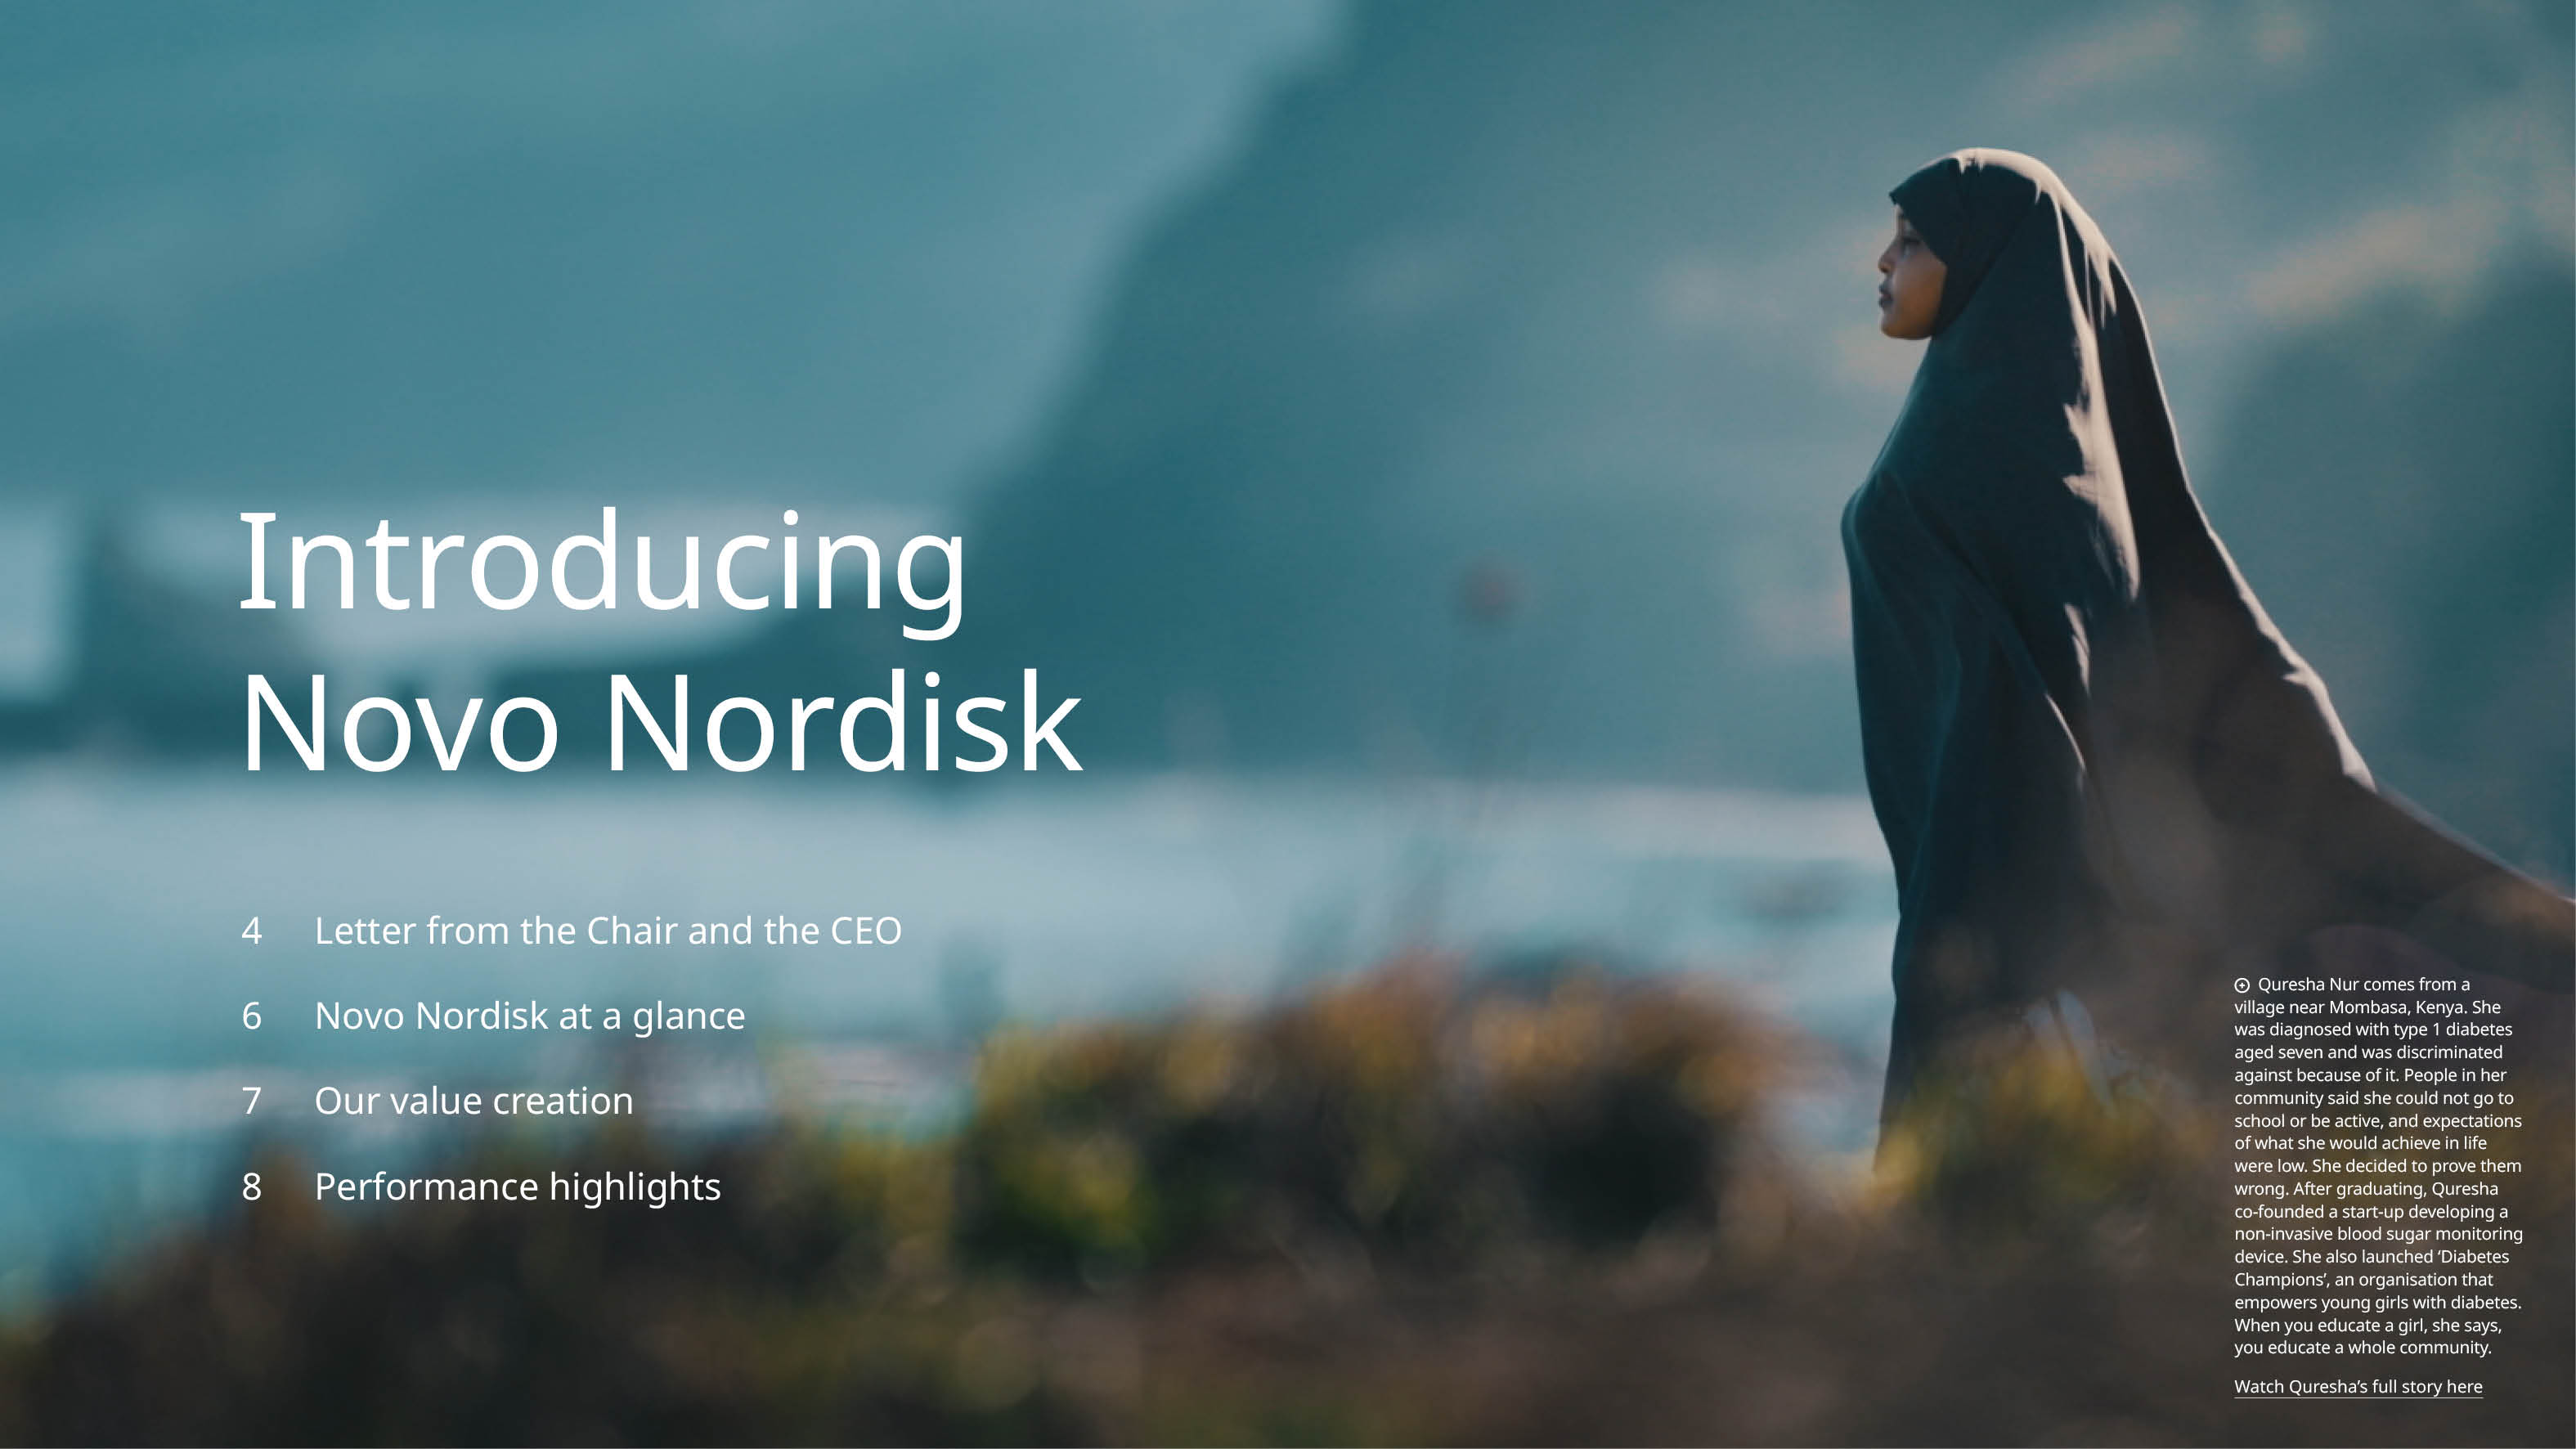
3 4 6 7 8 10 11 23 30 34 40 41 42 43 44 47 | Introducing Novo Nordisk Letter from the Chair and the CEO Novo Nordisk at a glance Our value creation Performance highlights Strategic Aspirations Purpose and sustainability Innovation and therapeutic focus Commercial execution Financials Risks Risk management Key operational risks Management Board of Directors Executive Management | 50 50 51 52 53 54 86 86 87 95 95 96 98 99 100 101 102 104 | Consolidated financial statements Income statement and Statement of comprehensive income Cash flow statement Balance sheet Equity statement Notes to the consolidated financial statements Consolidated ESG statement Statement of ESG performance Notes to the consolidated ESG statement Statements and Auditor’s Reports Statement by the Board of Directors and Executive Management Independent Auditor’s Report Independent Assurance Report on the ESG statement Additional information More information Product overview ESG initiatives Sustainability frameworks and performance | |||||||||||||||||
| Novo Nordisk Annual Report 2023 | Introducing Novo Nordisk Strategic Aspirations Risks Management Consolidated statements Additional information | 3 | ||||||||
| Novo Nordisk Annual Report 2023 | Introducing Novo Nordisk Strategic Aspirations Risks Management Consolidated statements Additional information | 4 | ||||||||
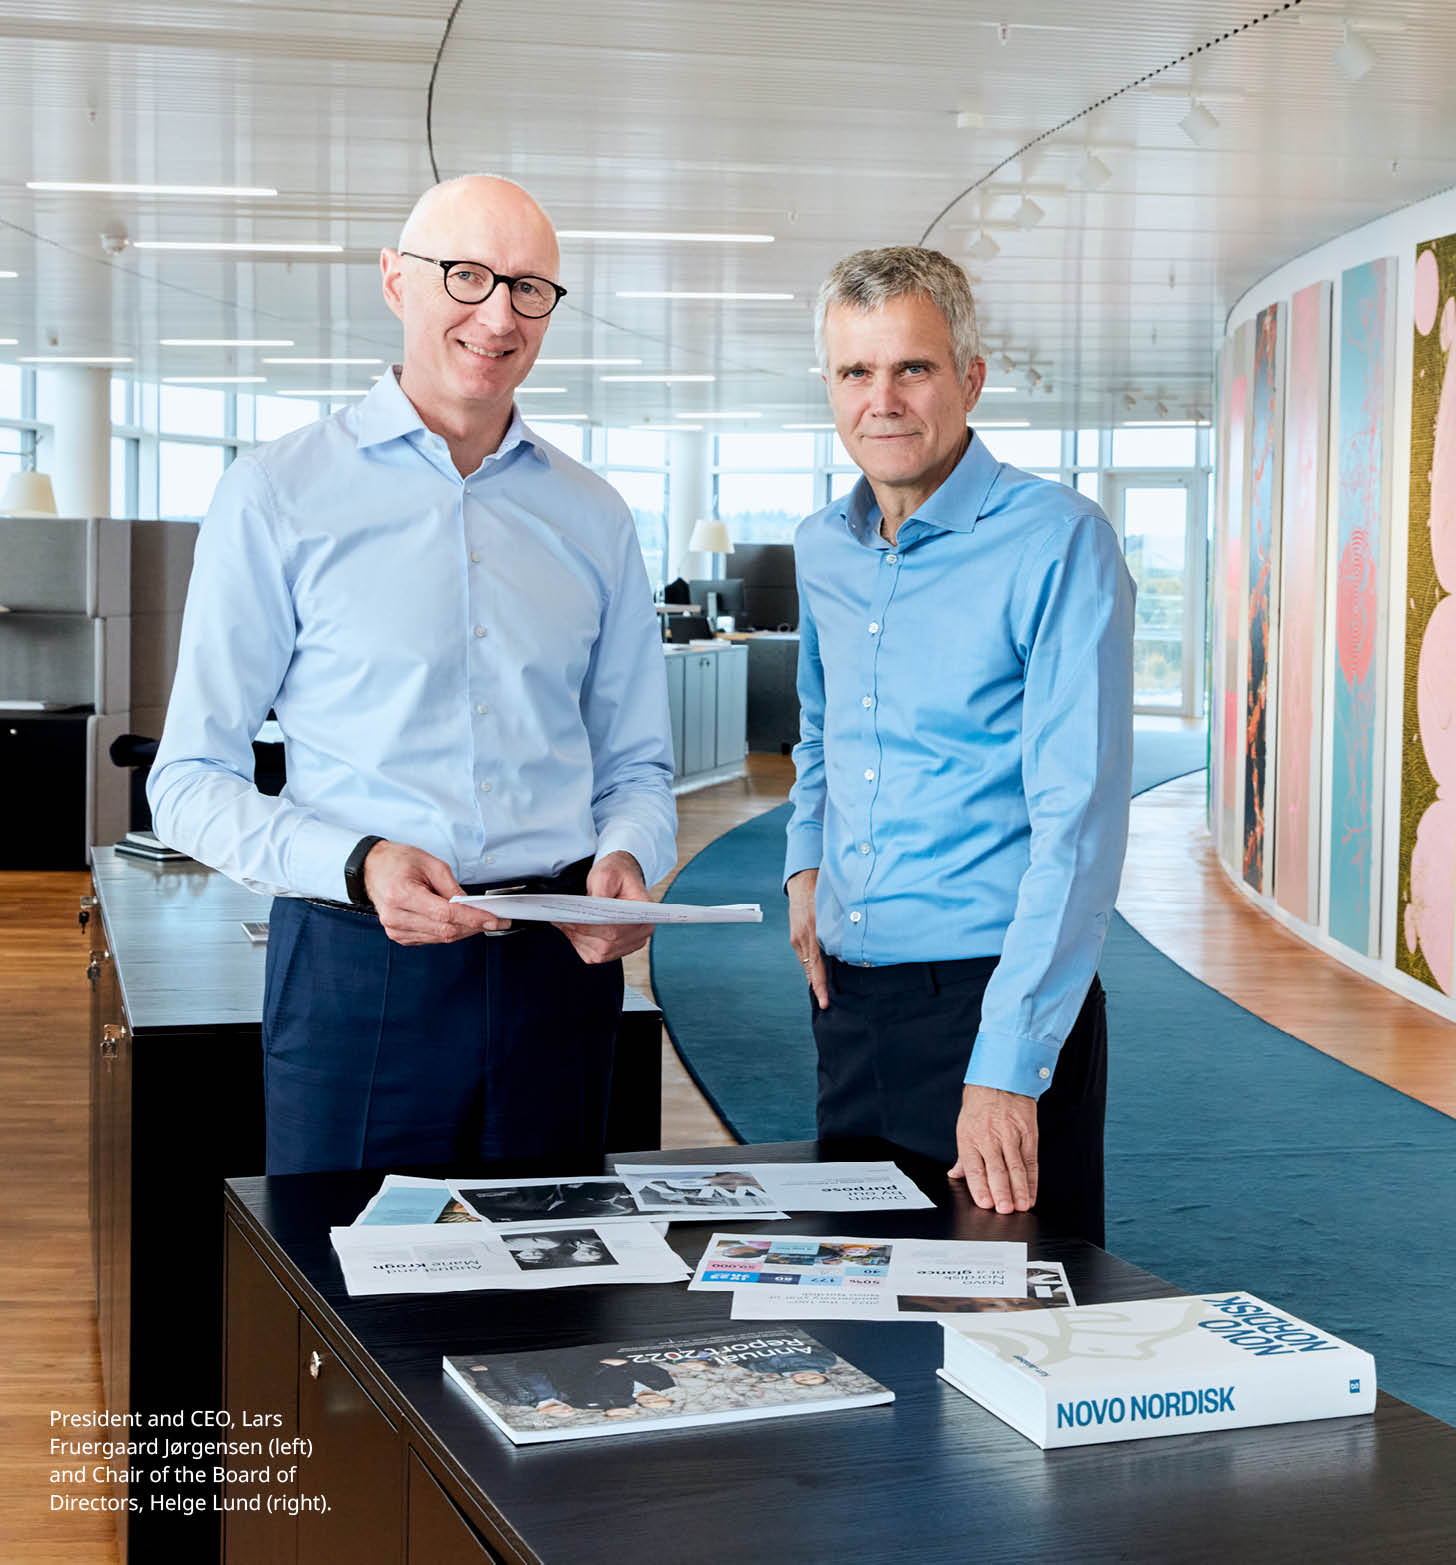 | LETTER FROM THE CHAIR AND THE CEO | |||||||||||||
| An extraordinary year of innovation, growth and impact | ||||||||||||||
| It is a rare privilege for any company to reach its centenary; and even more so to arrive at this milestone in a position of strength. As we reflect on 100 years of driving change to defeat serious chronic diseases, we nevertheless acknowledge that what got us here will not be enough to take us where we want to go. | The choices we make at this pivotal moment for our company are key to shaping our long-term vision – one that extends beyond strengthening leadership positions in our core therapy areas to becoming a driving force for improving human health worldwide. As our business continues to grow, so does our role in society. The global burden of serious chronic diseases casts a long shadow, and demands innovative, disruptive solutions that are as sustainable as they are impactful. Our core contribution to this fight remains our industry-leading therapeutic innovations, which benefited more than 40 million people living with serious chronic diseases in 2023. Yet we are also increasingly focused on prevention as we seek to understand and address the root causes of the diseases we treat. The unmet needs in type 2 diabetes and obesity are growing by the day, and the rising prevalence of these closely related threats to global health has created surging demand for our GLP-1-based therapies. This has enabled us to reach more patients than at any point in our 100-year history, contributing to strong sales growth across North America and International Operations. However, it has also increased pressure on our supply chain, resulting in periodic constraints across our portfolio as we strive to keep pace with demand. We have responded by investing heavily in expanding our production capacity with the aim of serving millions more patients worldwide. In 2023 alone, we announced investments totalling more than DKK 75 | |||||||||||||
| Novo Nordisk Annual Report 2023 | Introducing Novo Nordisk Strategic Aspirations Risks Management Consolidated statements Additional information | 5 | ||||||||


| Novo Nordisk Annual Report 2023 | Introducing Novo Nordisk Strategic Aspirations Risks Management Consolidated statements Additional information | 6 | ||||||||
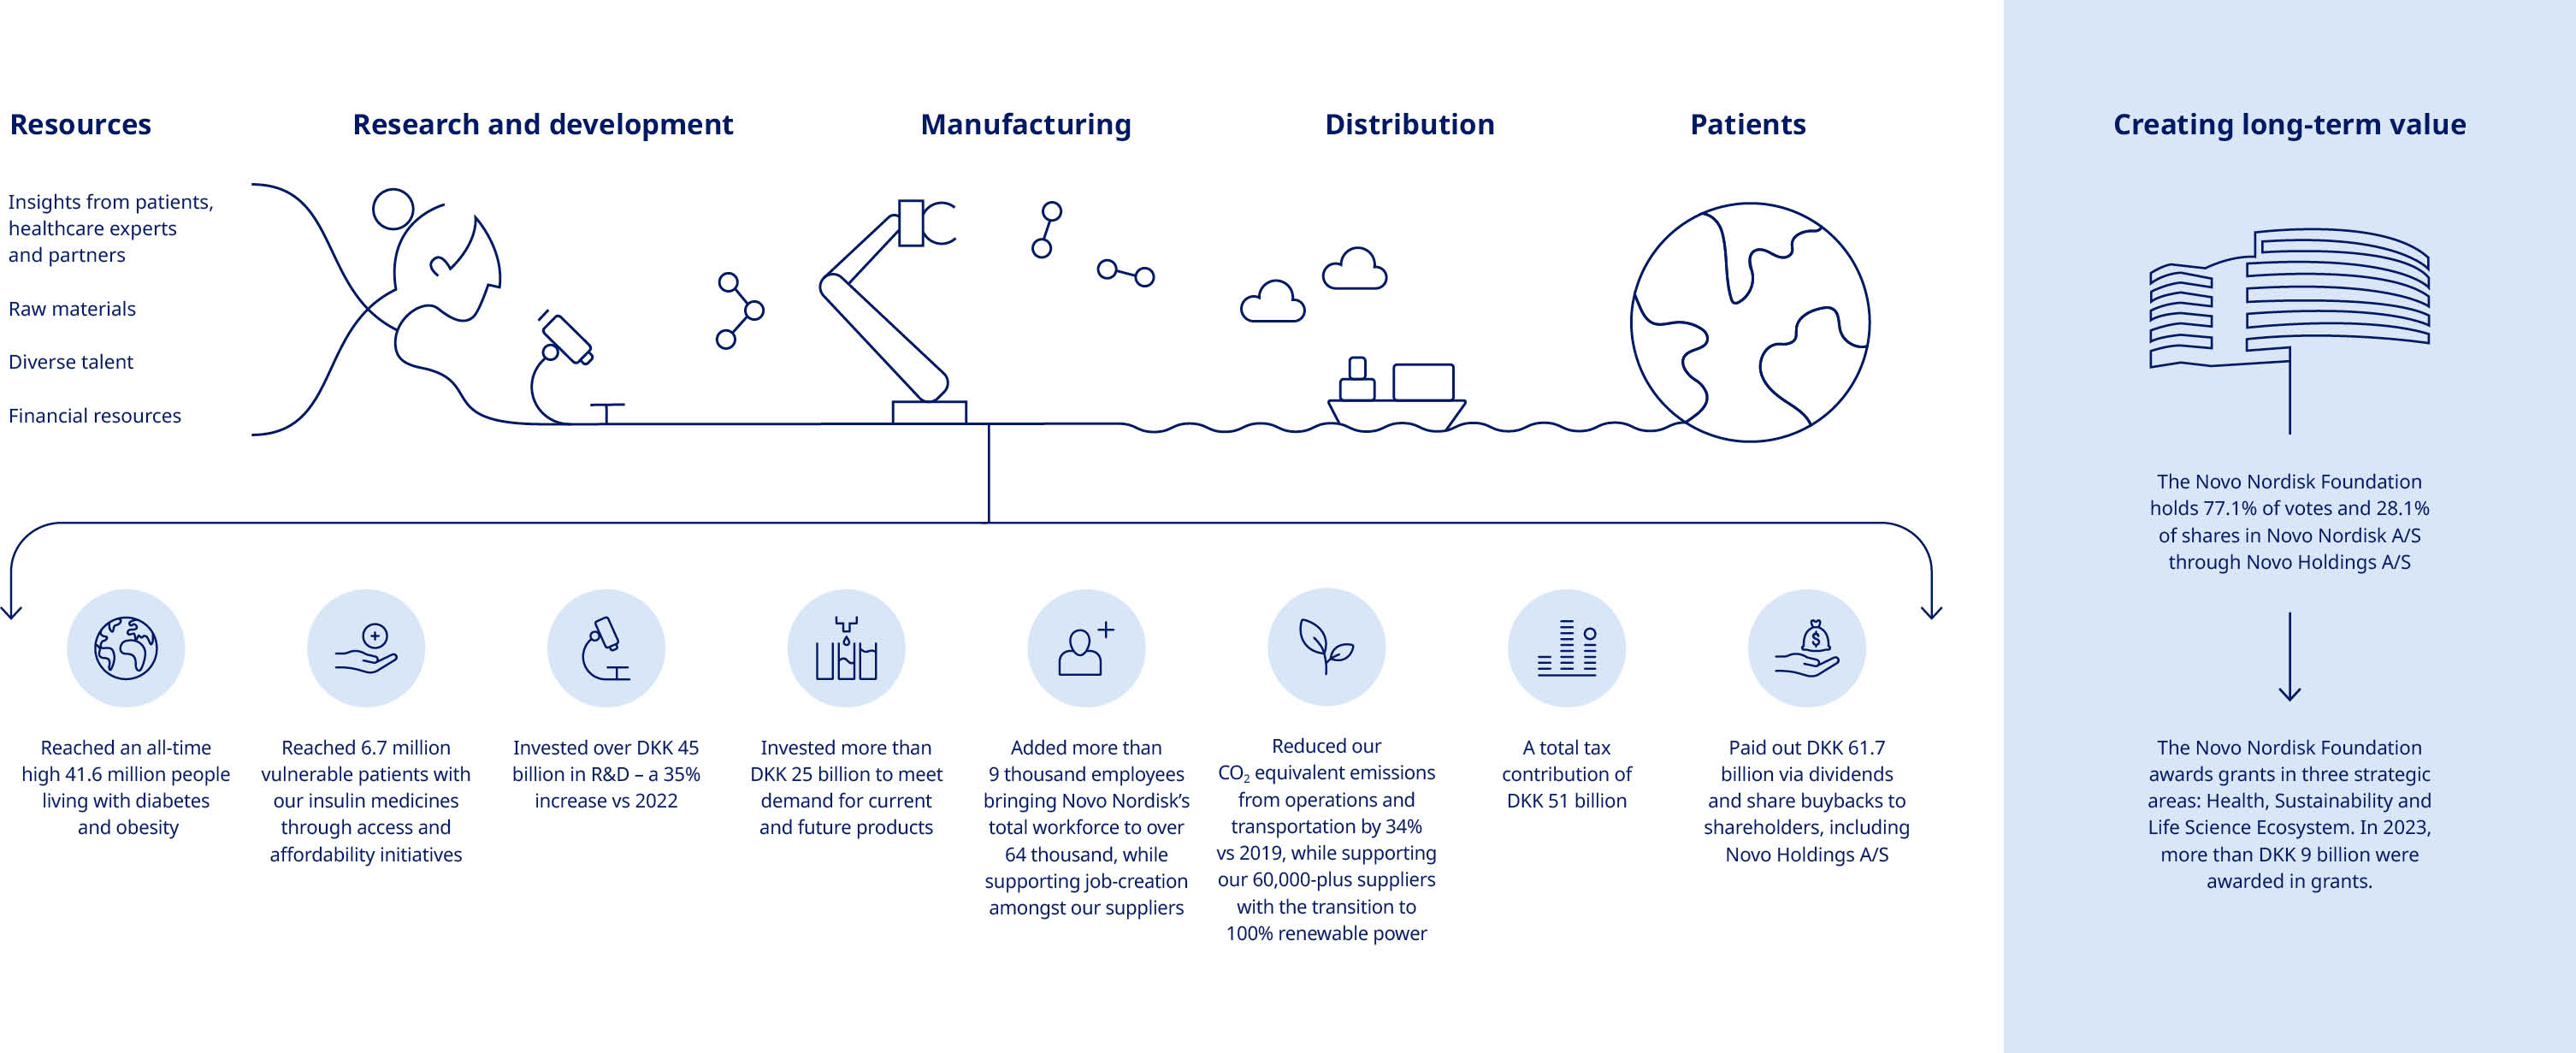
| Novo Nordisk at a glance | Our purpose and strategy Our business is built around the Novo Nordisk Way, our commitment to be a sustainable business and our clear patient-centric purpose: driving change to defeat serious chronic diseases. Our key contribution is to discover and develop innovative medicines and make them accessible to patients throughout the world. We will strengthen our leadership in diabetes and obesity, secure a leading position within rare disease and establish ourselves in cardiovascular disease (CVD). We also aim to build a presence in emerging therapy areas, such as metabolic dysfunction-associated steatohepatitis (MASH), chronic kidney disease (CKD) and Alzheimer’s disease (AD), and to move toward disease-modifying and curative therapies. | |||||||||||||||||||
| Novo Nordisk is a leading global healthcare company, founded in 1923 and headquartered in Denmark. | ||||||||||||||||||||
| 41.6 | 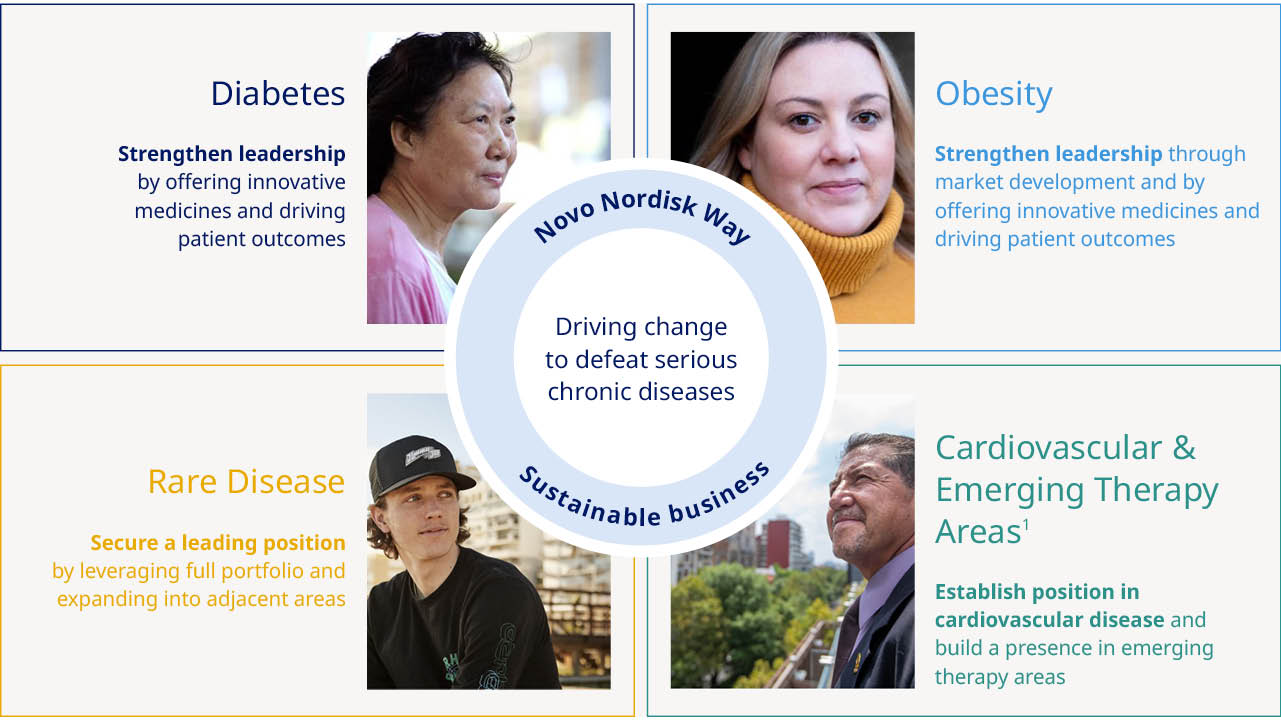 | |||||||||||||||||||
| million people living with diabetes and obesity reached | ||||||||||||||||||||
| 232,261 | 102,574 | 68,326 | ||||||||||||||||||
| DKK million in net sales | DKK million in operating profit | DKK million in free cash flow | ||||||||||||||||||
| in net sales | ||||||||||||||||||||
| 64,319 | 80 | 5 | ||||||||||||||||||
| employees worldwide | countries with affiliates | countries with R&D facilities | ||||||||||||||||||
| 1. Other Serious Chronic Disease (OSCD) has been renamed to Cardiovascular & Emerging Therapy Areas (CETA) to reflect that cardiovascular disease has been the main strategic priority within OSCD. | ||||||||||||||||||||
| Novo Nordisk Annual Report 2023 | Introducing Novo Nordisk Strategic Aspirations Risks Management Consolidated statements Additional information | 7 | ||||||||
| Novo Nordisk Annual Report 2023 | Introducing Novo Nordisk Strategic Aspirations Risks Management Consolidated statements Additional information | 8 | ||||||||
PERFORMANCE HIGHLIGHTS Our strategy execution progress | |||||||||||||||||
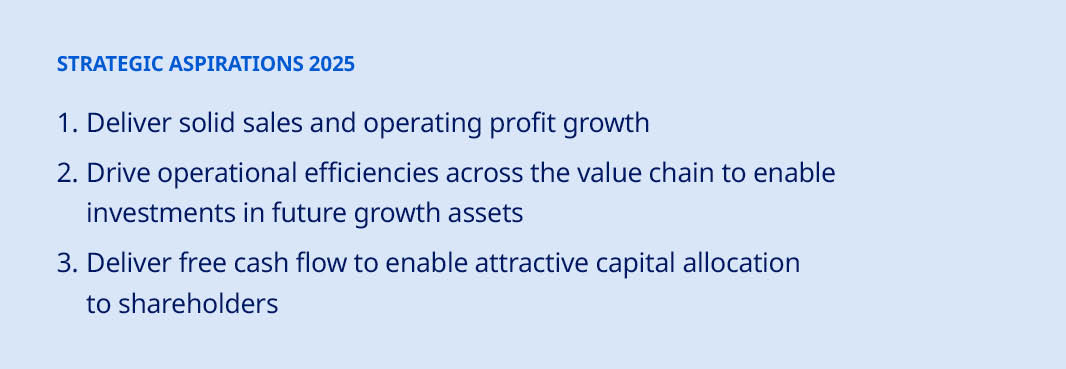
| Strategic Aspirations 2025 | Progress | ||||||||||||||||
 | Purpose and sustainability | Progress towards zero environmental impact | •Carbon emissions from operations and transportation decreased by 34% compared to 2019 (decreased by 8% compared to 2022) | ||||||||||||||
| Being respected for adding value to society | •Medical treatment provided to 40.5 million people living with diabetes •Reached more than 52,000 children in Changing Diabetes® in Children programme •Human insulin with more flexible storage without refrigeration now approved in 29 countries •Partnership with Aspen to produce human insulin for people living with diabetes in Africa | ||||||||||||||||
| Being recognised as a sustainable employer | •Share of women in senior leadership positions has increased to 41% from 39% in 2022 | ||||||||||||||||
 | Innovation and therapeutic focus | Further raise the innovation-bar for diabetes treatment | •Regulatory submission of once-weekly insulin icodec in the EU, the US and China •Successful completion of phase 3 trial with higher doses of oral semaglutide •Initiation of phase 3a trial with CagriSema in type 2 diabetes •FLOW kidney outcomes trial stopped based on interim analysis due to efficacy •Successful completion of phase 3 trial with IcoSema | ||||||||||||||
| Develop a leading portfolio of superior treatment solutions for obesity | •Successful completion of phase 3 trial with 50 mg of oral semaglutide •Successful completion of SELECT cardiovascular outcomes trial •Successful completion of STEP HFpEF phase 3 trials •Acquisition of Inversago Pharma and phase 2 trial initiated with INV-202 and phase 1 trial initiated with INV-347 •Successful completion of phase 1 trial with oral amycretin | ||||||||||||||||
| Strengthen and progress the Rare Disease pipeline | •Somapacitan approved in the US, EU and Japan for the treatment of growth hormone deficiency in children | ||||||||||||||||
| Establish presence in Cardiovascular & Emerging Therapy Areas focusing on CVD, MASH and CKD | •Phase 1 trials initiated with cell therapy treatment in heart failure and Parkinson’s disease •Acquisition of ocedurenone for the treatment of hypertension •Phase 1 trial initiated with ANGPTL3i mAb •Phase 1 trial initiated with VAP-1i in MASH | ||||||||||||||||
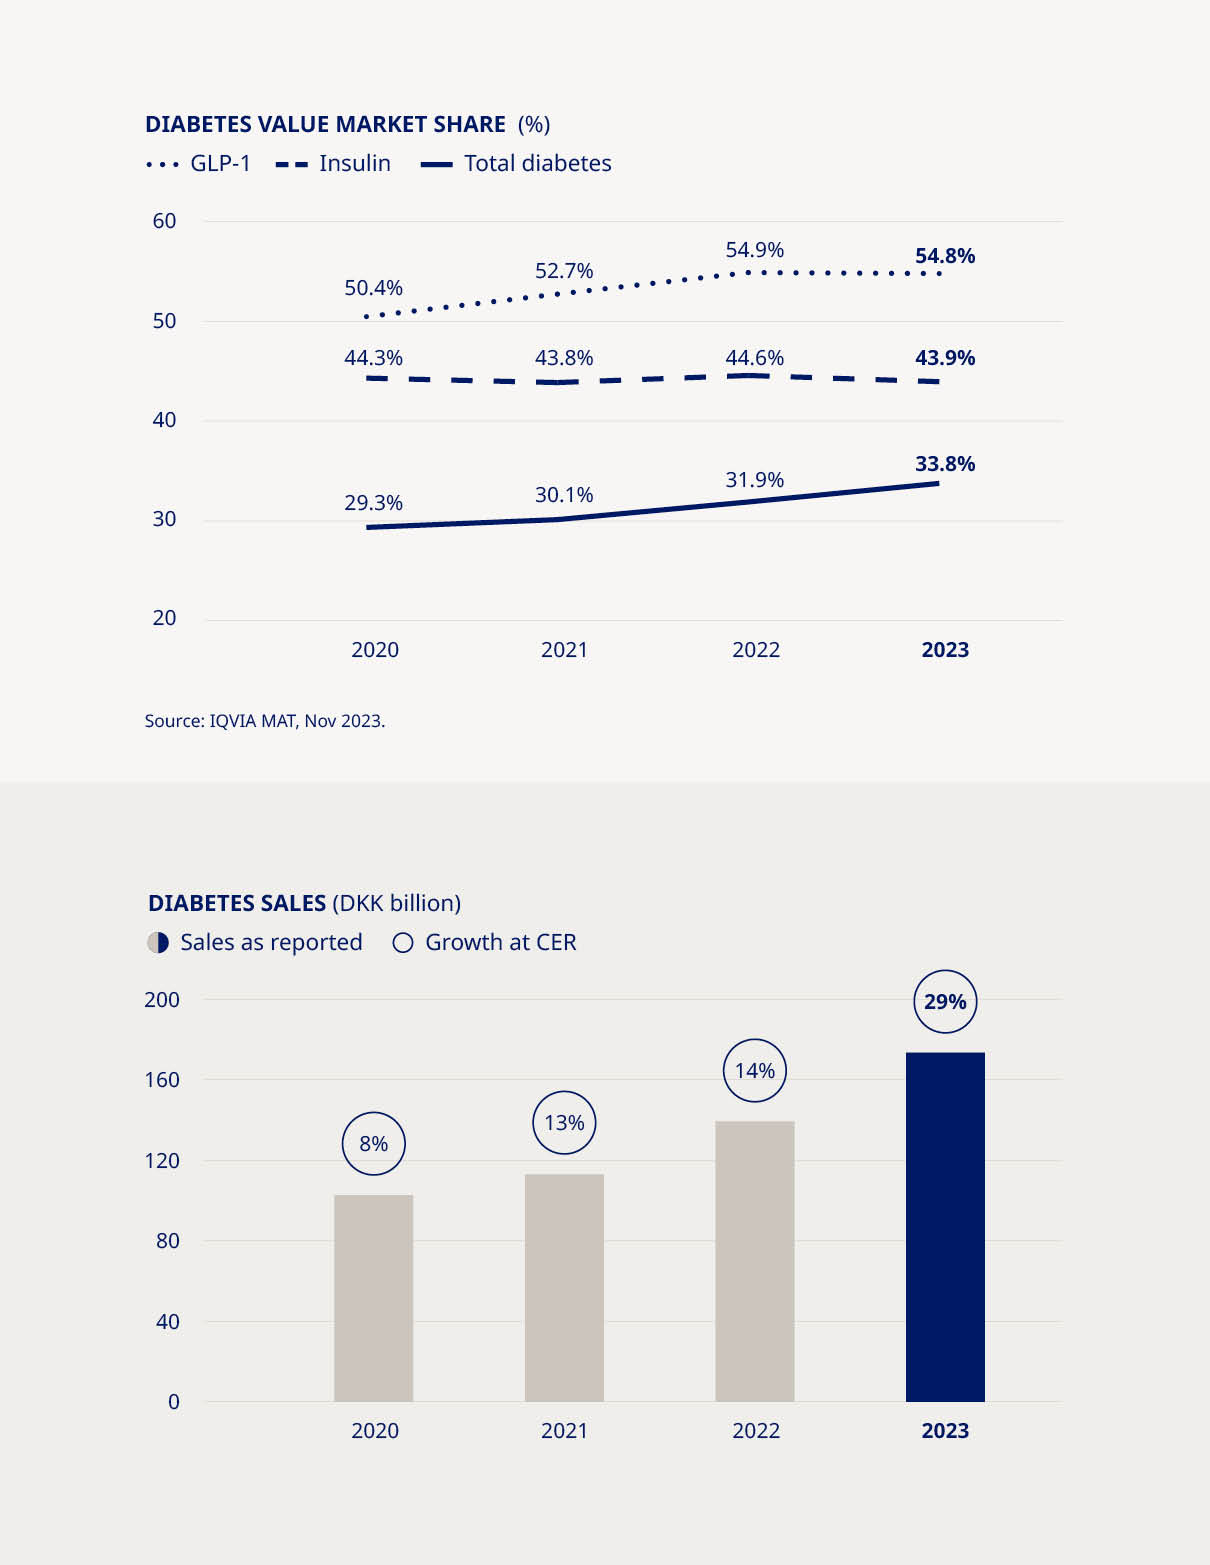
 | Commercial execution | Strengthen diabetes leadership – aim at global value market share of more than 1/3 | •Diabetes value market share increased by 1.9 percentage points to 33.8% (MAT) | ||||||||||||||
| More than DKK 25 billion in Obesity sales by 2025 | •Obesity care sales increased by 154% (CER) to DKK 41.6 billion | ||||||||||||||||
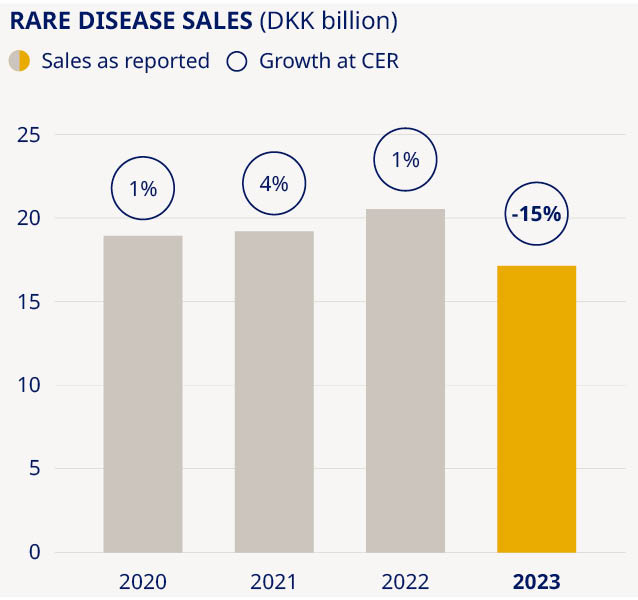
| Secure a sustained growth outlook for Rare Disease | •Rare disease sales decreased by 15% (CER) to DKK 17.2 billion | ||||||||||||||||
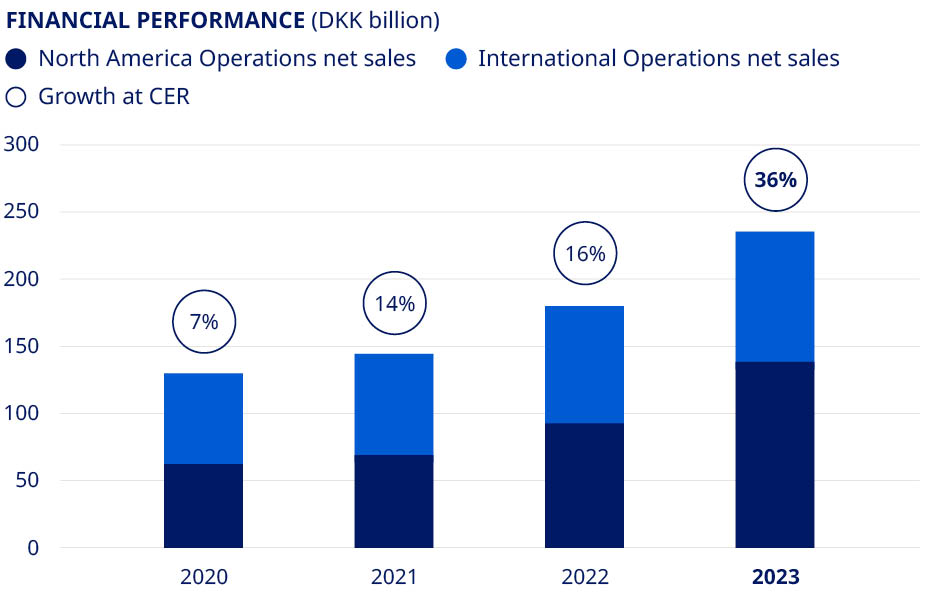
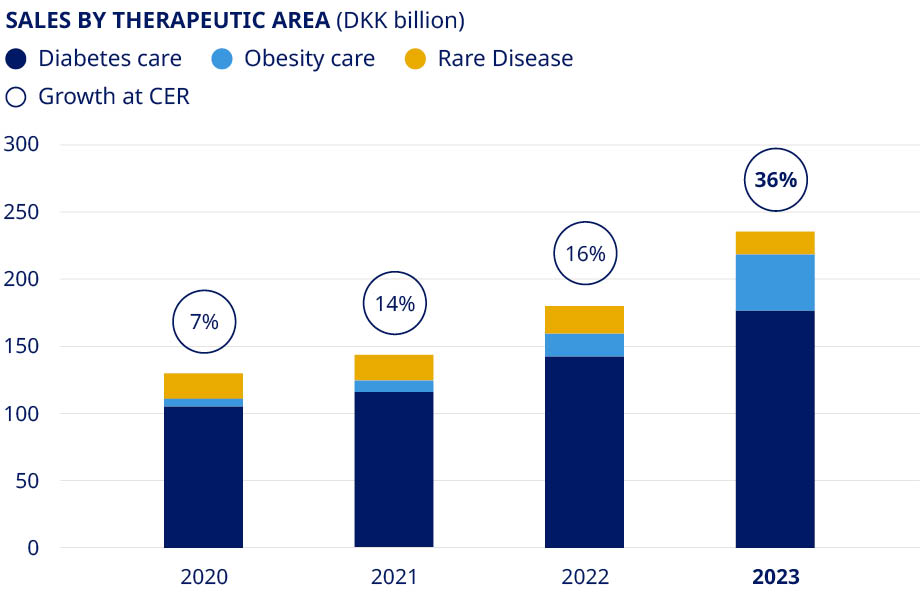
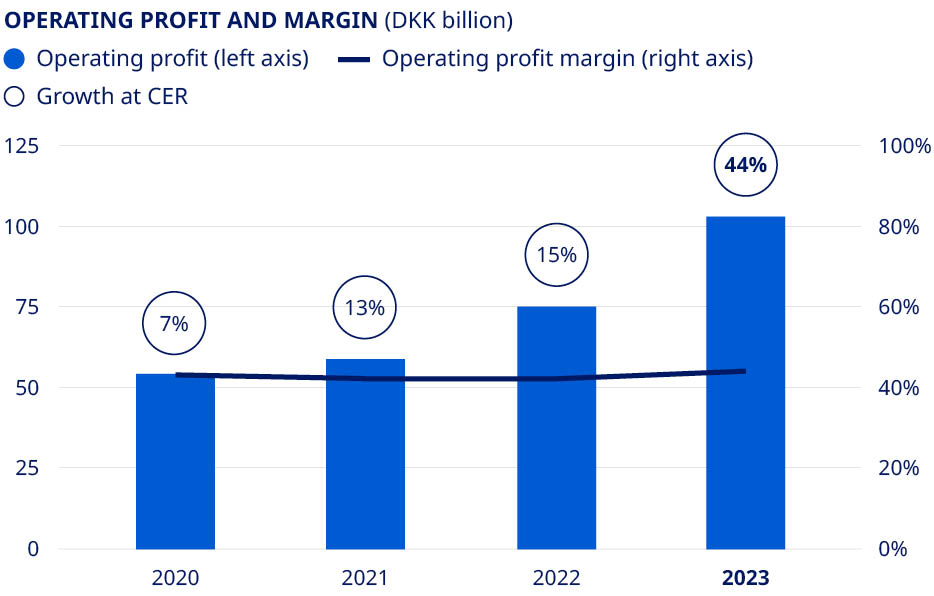
 | Financials | Deliver solid sales and operating profit growth | •Sales growth of 36% (CER) •Operating profit growth of 44% (CER) | ||||||||||||||
| Drive operational efficiencies across the value chain to enable investments in future growth assets | •Operational leverage reflecting sales growth | ||||||||||||||||
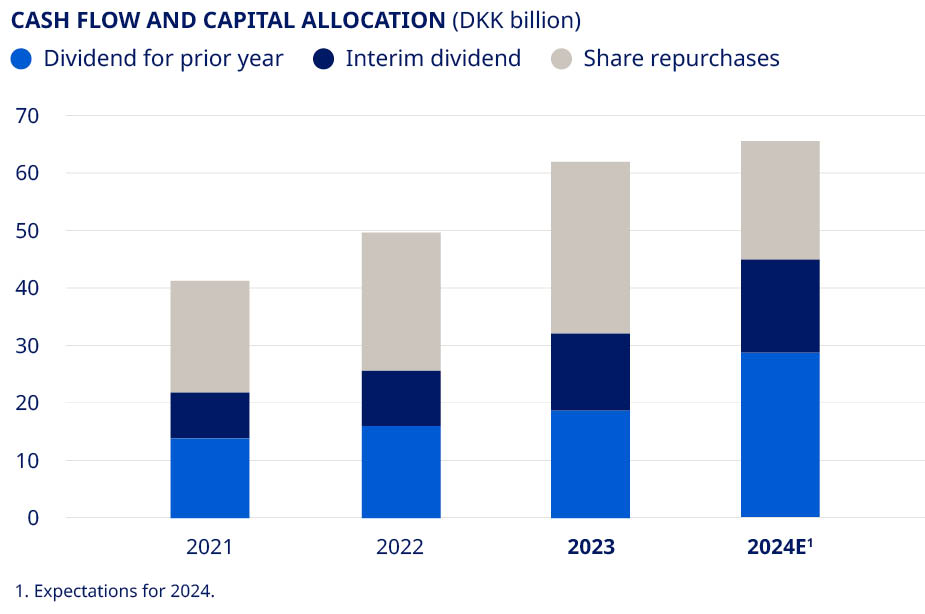
| Deliver free cash flow to enable attractive capital allocation to shareholders | •Free cash flow of DKK 68.3 billion •DKK 61.7 billion returned to shareholders | ||||||||||||||||
| Novo Nordisk Annual Report 2023 | Introducing Novo Nordisk Strategic Aspirations Risks Management Consolidated statements Additional information | 9 | ||||||||
| DKK million | 2019 | 2020 | 2021 | 2022 | 2023 | 2022-23 | ||||||||||||||||||||
| Financial performance | Change | |||||||||||||||||||||||||
| Net sales | 122,021 | 126,946 | 140,800 | 176,954 | 232,261 | 31 | % | |||||||||||||||||||
| Sales growth as reported | 9.1 | % | 4.0 | % | 10.9 | % | 25.7 | % | 31.3 | % | ||||||||||||||||
Sales growth in constant exchange rates1 | 5.6 | % | 6.7 | % | 13.8 | % | 16.4 | % | 35.6 | % | ||||||||||||||||
| Operating profit | 52,483 | 54,126 | 58,644 | 74,809 | 102,574 | 37 | % | |||||||||||||||||||
| Operating profit growth as reported | 11.1 | % | 3.1 | % | 8.3 | % | 27.6 | % | 37.1 | % | ||||||||||||||||
Operating profit growth in constant exchange rates1 | 5.6 | % | 6.8 | % | 12.7 | % | 14.6 | % | 43.7 | % | ||||||||||||||||
| Depreciation, amortisation and impairment losses | 5,661 | 5,753 | 6,025 | 7,362 | 9,413 | 28 | % | |||||||||||||||||||
EBITDA1,2,3 | 58,144 | 59,879 | 64,669 | 82,171 | 111,987 | 36 | % | |||||||||||||||||||
| Net financials | (3,930) | (996) | 436 | (5,747) | 2,100 | |||||||||||||||||||||
| Profit before income taxes | 48,553 | 53,130 | 59,080 | 69,062 | 104,674 | 52 | % | |||||||||||||||||||
Effective tax rate3 | 19.8 | % | 20.7 | % | 19.2 | % | 19.6 | % | 20.1 | % | ||||||||||||||||
| Net profit | 38,951 | 42,138 | 47,757 | 55,525 | 83,683 | 51 | % | |||||||||||||||||||
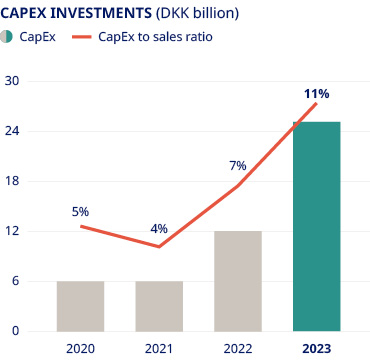
Purchase of property, plant and equipment3 | 8,932 | 5,825 | 6,335 | 12,146 | 25,806 | 112 | % | |||||||||||||||||||
Purchase of intangible assets3 | 2,299 | 16,256 | 1,050 | 2,607 | 13,090 | 402 | % | |||||||||||||||||||
| Cash used for acquisition of businesses | — | — | 18,283 | 7,075 | — | |||||||||||||||||||||
Free cash flow1 | 34,451 | 28,565 | 29,319 | 57,362 | 68,326 | 19 | % | |||||||||||||||||||
| Total assets | 125,612 | 144,922 | 194,508 | 241,257 | 314,486 | 30 | % | |||||||||||||||||||
| Equity | 57,593 | 63,325 | 70,746 | 83,486 | 106,561 | 28 | % | |||||||||||||||||||
| DKK million | 2019 | 2020 | 2021 | 2022 | 2023 | 2022-23 | ||||||||||||||||||||
| Financial ratios | Change | |||||||||||||||||||||||||
Gross margin3 | 83.5 | % | 83.5 | % | 83.2 | % | 83.9 | % | 84.6 | % | ||||||||||||||||
| Sales and distribution costs in percentage of sales | 26.1 | % | 25.9 | % | 26.3 | % | 26.1 | % | 24.4 | % | ||||||||||||||||
| Research and development costs in percentage of sales | 11.7 | % | 12.2 | % | 12.6 | % | 13.6 | % | 14.0 | % | ||||||||||||||||
Operating margin3 | 43.0 | % | 42.6 | % | 41.7 | % | 42.3 | % | 44.2 | % | ||||||||||||||||
Net profit margin3 | 31.9 | % | 33.2 | % | 33.9 | % | 31.4 | % | 36.0 | % | ||||||||||||||||
Cash to earnings1 | 88.4 | % | 67.8 | % | 61.4 | % | 103.3 | % | 81.6 | % | ||||||||||||||||
Return on invested capital1 | 98.0 | % | 82.8 | % | 69.0 | % | 73.6 | % | 88.5 | % | ||||||||||||||||
| Share performance and capital allocation | ||||||||||||||||||||||||||
Basic earnings per share/ADR in DKK3,5 | 8.21 | 9.03 | 10.40 | 12.26 | 18.67 | 52 | % | |||||||||||||||||||
Diluted earnings per share/ADR in DKK3,5 | 8.19 | 9.01 | 10.37 | 12.22 | 18.62 | 52 | % | |||||||||||||||||||
Total number of shares (million), end of year3,5 | 4,800 | 4,700 | 4,620 | 4,560 | 4,510 | (1 | %) | |||||||||||||||||||
Dividend per share in DKK3,4,5 | 4.18 | 4.55 | 5.20 | 6.20 | 9.40 | 52 | % | |||||||||||||||||||
Total dividend (DKK million)4 | 19,651 | 21,066 | 23,711 | 27,950 | 41,987 | 50 | % | |||||||||||||||||||
Dividend payout ratio3,5 | 50.5 | % | 50.0 | % | 49.6 | % | 50.3 | % | 50.2 | % | ||||||||||||||||
| Share repurchases (DKK million) | 15,334 | 16,855 | 19,447 | 24,086 | 29,924 | 24 | % | |||||||||||||||||||
Closing share price (DKK) 3,5 | 194 | 214 | 368 | 469 | 698 | 49 | % | |||||||||||||||||||
| Novo Nordisk Annual Report 2023 | Introducing Novo Nordisk Strategic Aspirations Risks Management Consolidated statements Additional information | 10 | ||||||||

| Novo Nordisk Annual Report 2023 | Introducing Novo Nordisk Strategic Aspirations Risks Management Consolidated statements Additional information | 11 | ||||||||
| Driving change for a sustainable future |  | ||||||||||||||||
In a world facing urgent societal and environmental challenges, Novo Nordisk is playing a proactive role in the fight against health inequity and climate change. Guided by our purpose of driving change to defeat serious chronic diseases and a steadfast commitment to social, environmental and financial responsibility, we are raising the bar to stay at the forefront of progressive global businesses. | Human health is under threat from a perfect storm of health inequity, climate change and biodiversity loss. As a leading healthcare company committed to serving patients across the globe, we have an important role to play in addressing these challenges. Our commitment to social responsibility and minimising our environmental impact are key to achieving our purpose and sustainability goals – and essential for our long-term success. That is why we are striving to improve access to affordable care for vulnerable patients across the globe. More than three quarters of people with diabetes, for example, live in low- and middle-income countries, and that proportion is likely to grow as global prevalence rises from an estimated 537 million adults today to a predicted 643 million by 2030. Although we are now serving more people with diabetes than ever before, expanding our reach by more than four million patients to a total of 40.5 million last year, we recognise the need to do more. Our key contribution to society remains our therapeutic innovation. However, we realise it will take more than medicine to defeat serious chronic diseases. This need is particularly acute in obesity, where medical intervention with treatments | like Wegovy® must be supplemented with prevention measures to head off a global pandemic that threatens to overwhelm healthcare systems. To this end, we have strengthened our focus on public-private partnerships and established a dedicated Transformational Prevention Unit tasked with delivering scalable commercial solutions that can help predict and pre-empt obesity. We are also stepping up efforts to reduce our environmental impact by focusing on our supply chain emissions. Having already switched our production sites to sourcing 100% renewable power in 2020, we are now focused on supporting our 60,000-plus suppliers through a similar transition, with the aim of reaching net zero emissions across our full value chain by 2045. To ensure that sustainability is integrated into Novo Nordisk’s core business, we have a series of governance measures in place that supplement the incorporation of environmental, social and financial responsibility in our Articles of Association. These include our Sustainability Advisory Council, established in 2022, which provides external input on our goals from experts in academia, public policy and patient advocacy, and an executive remuneration package directly linked to our progress on sustainability targets. | STRATEGIC ASPIRATIONS 2025 1.Progress towards zero environmental impact 2.Being respected for adding value to society 3.Being recognised as a sustainable employer For an overview of our purpose and sustainability initiatives, frameworks and performance, see the tables on pages 102-104. | ||||||||||||||
| Novo Nordisk Annual Report 2023 | Introducing Novo Nordisk Strategic Aspirations Risks Management Consolidated statements Additional information | 12 | ||||||||

| Novo Nordisk Annual Report 2023 | Introducing Novo Nordisk Strategic Aspirations Risks Management Consolidated statements Additional information | 13 | ||||||||
 | 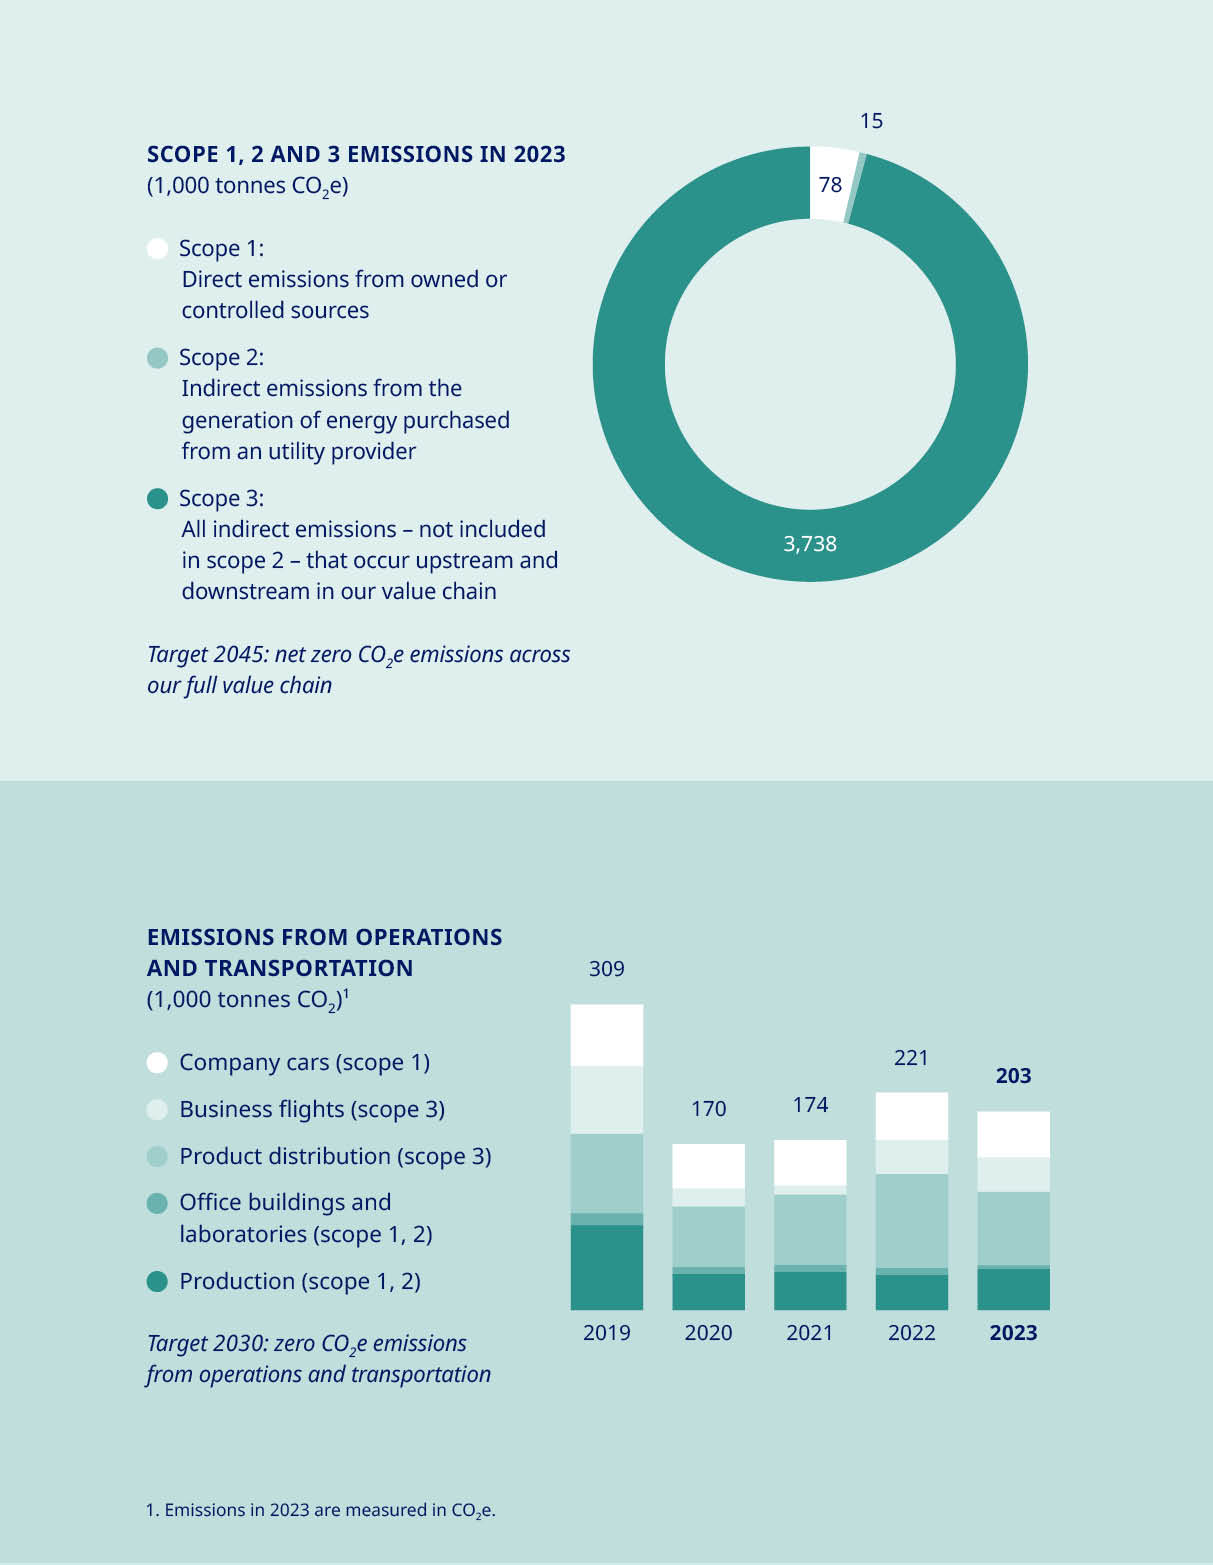 | ||||||||||
| Cutting emissions in collaboration with our suppliers | |||||||||||
According to the World Health Organization, climate change is the single biggest health threat facing humanity. We recognise that caring for our patients also means caring for our planet, and with the healthcare sector as a whole accounting for approximately 5% of global emissions, we take our environmental impact seriously. We are determined to play our part in creating a sustainable, healthy environment for the long term, and our ambition is bold and simple: to have zero environmental impact. To achieve this, one of our key tasks is to decouple the growth in our business from our CO2 equivalent (CO2e) emissions; otherwise, our carbon footprint will continue to climb as we serve increasing numbers of patients. “Focusing solely on our own activities is not enough. We must also ensure our 60,000-plus suppliers play their part in this transformation.” On this front, we have made significant progress in curbing our company’s emissions. Since 2020, all our production sites have sourced 100% renewable power and we aim to reach zero CO2e emissions from operations and transportation by 2030. | However, focusing solely on our own activities is not enough. We must also ensure our 60,000-plus suppliers play their part in this transformation, since their activities account for the majority of our total CO2e emissions – amounting to 98% in 2023. Our target is that all goods and services from suppliers will be based on 100% sourced renewable power by 2030. We are engaging with suppliers in high-impact areas to understand how we can collectively reduce emissions using novel approaches to decarbonisation. This involves working on innovative Power-to-X solutions that use renewable electricity to produce green fuels and low-carbon chemicals, or using organic waste materials to produce biofuels. Recent examples include our membership of the Sustainable Aviation Buyers Alliance (SABA) to support the expansion of sustainable aviation fuel facilities, and our partnership with global logistics firm Maersk on low-emission fuels for ocean freight. Both these investments are contributing to the global uptake of innovative green technologies. | ||||||||||
| Novo Nordisk Annual Report 2023 | Introducing Novo Nordisk Strategic Aspirations Risks Management Consolidated statements Additional information | 14 | ||||||||
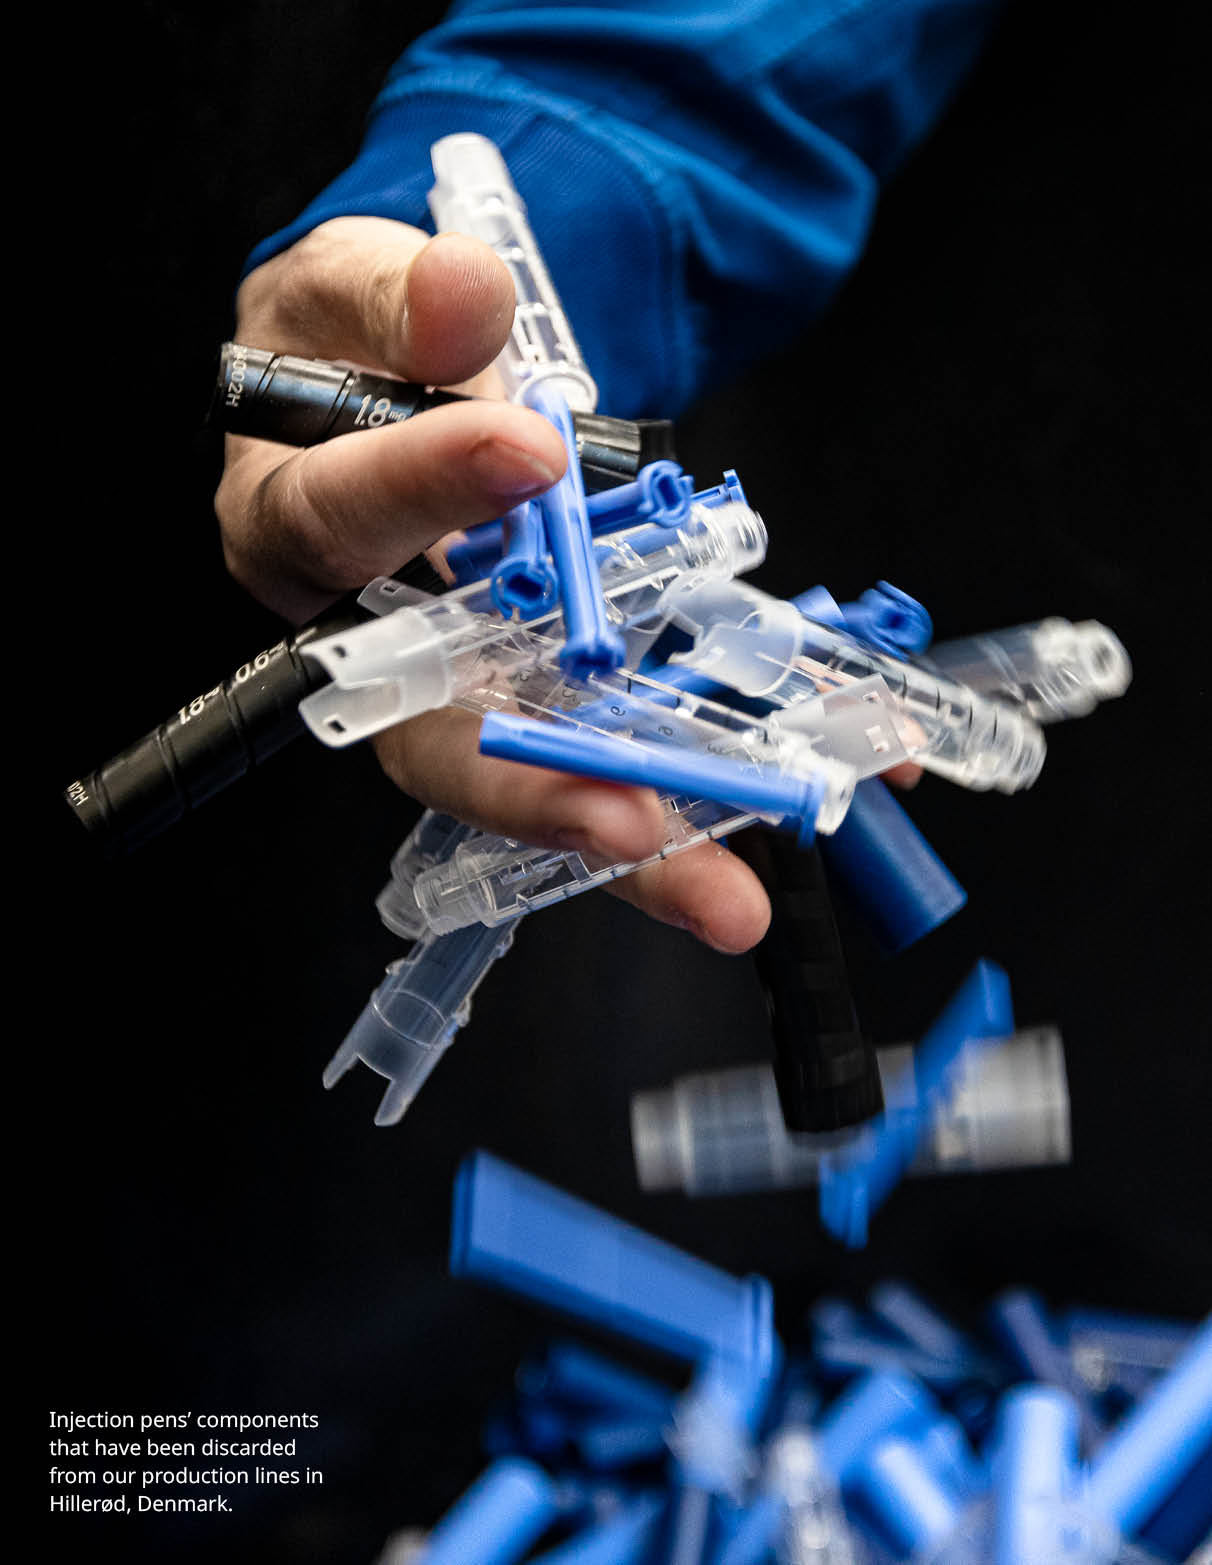 | | ||||||||||
| Reducing our plastic footprint | |||||||||||
Minimising the use of plastic derived from fossil fuels is a priority for Novo Nordisk – and a significant challenge given the rapid growth in demand for our medical injection devices. We currently manufacture more than 800 million pre-filled plastic pens every year, equivalent to some 14,000 tonnes of plastic. As the number of patients we serve continues to grow, those numbers will rise markedly unless we take decisive action. We are tackling our plastic challenge on multiple fronts, with a threefold ‘reduce-change-avoid’ approach. This includes reducing plastic consumption by converting to reusable devices, changing to the use of non-virgin-fossil plastics in our device production and harnessing recycling to avoid plastic ending up in landfill. “In 2023 we established the world’s first industry solution for recycling injection pens in Denmark.” The task is not simple. When it comes to recycling, for example, used injection pens cannot be dealt with in the same way as other household recycling because they are classified as medical waste, which most countries are not equipped to handle. To address this challenge, we have expanded a series of pioneering take-back programmes across Denmark, the UK, | France and Brazil, and in 2023 we established the world’s first industry solution for recycling injection pens in Denmark. Pharmaceutical companies Lilly, Sanofi and Merck have all joined the initiative, and we now share a goal of recycling 25% of the pens distributed by all four companies in Denmark within the first 12 months. Another important initiative involves rethinking medicine delivery by switching from disposable to reusable devices – some with an expected lifespan of up to 5 years. Over the past year, we have converted selected products in a number of countries and we expect to switch more in 2024. We are also steadily building device durability into the development of new medicines and expect that a trend from daily to once-weekly administration for many products will contribute to reduced plastic use per patient in the long term. In addition, we are exploring more sustainable ways to produce plastic. A good example is a new agreement signed by Novo Nordisk, alongside the LEGO Group, to buy e-methanol from European Energy when the world’s first large-scale production plant for the commodity starts up in Denmark in 2024. The e-methanol – made from renewable electricity, water and captured biogenic CO2 – will help us to create lower-carbon plastics for use in our medical devices. | ||||||||||
| Novo Nordisk Annual Report 2023 | Introducing Novo Nordisk Strategic Aspirations Risks Management Consolidated statements Additional information | 15 | ||||||||
 |  | ||||||||||
| Supporting more people with diabetes | |||||||||||
With the number of adults living with diabetes across the globe predicted to grow from 537 million today to 643 million by 2030, it is those in the most vulnerable settings who struggle the most to access the treatment they need. Last year, we reached more than 40.5 million people with our diabetes medicines – an increase of 4.2 million on 2022 – but we recognise the need to do more. For that reason, we are committed to improving affordability for vulnerable populations, increasing availability by strengthening supply chains and expanding the capacity to diagnose and manage diabetes worldwide. Over the past year, we reached 6.7 million people living with diabetes globally with our insulin medicines through access and affordability initiatives, and we extended support to more than 52,000 children with type 1 diabetes through our Changing Diabetes® in Children programme. In the US, we provided access to affordable insulin for 1.4 million people and supported a further 2.8 million with initiatives relating to our GLP-1-based therapies. On the African continent, we doubled down on our commitment to improve access to insulin, establishing a new partnership with South African pharmaceutical manufacturer Aspen Pharmaceuticals to increase production for distribution across the region. The partnership acknowledges the World Health Organization’s call for sustainable access to quality-assured and affordable medicine through local manufacture and aims to produce more than 60 million vials by 2026. This is equivalent to the | annual requirements of around four million people – a significant increase on the 500,000 we currently serve. Sub-Saharan Africa is currently home to an estimated 24 million adults living with diabetes. The human insulin produced by the collaboration will be distributed at low-cost as part of Novo Nordisk’s Access to Insulin commitment, which reached 2.4 million people in 2023. The programme guarantees a ceiling price of USD 3 per vial in 77 low- and middle-income countries around the world. However, increasing the availability of insulin alone is not enough. To enhance access to equitable care in Sub-Saharan Africa, we have built a business integrated model – iCARE – which is now active in 49 countries. Through public-private partnerships we aim to improve capacity to treat diabetes, increase affordability of insulin and enhance patient empowerment. Our ambition is to reach more than two million vulnerable people living with diabetes in Sub-Saharan Africa by 2030.  | ||||||||||
| Novo Nordisk Annual Report 2023 | Introducing Novo Nordisk Strategic Aspirations Risks Management Consolidated statements Additional information | 16 | ||||||||
 | | ||||||||||
| Preventing obesity, starting with children | |||||||||||
The obesity epidemic is one of the greatest threats to global health, currently impacting more than 813 million adults worldwide and responsible for five million deaths each year. In addition, obesity impacts the sustainability of health systems and economic productivity. While Novo Nordisk’s core contribution to the fight remains our therapeutic innovations, which reached more than 1.1 million people worldwide in 2023, we recognise that medicine alone will never be enough to defeat obesity. We are therefore committed to addressing the disease holistically by scaling up our focus on prevention – and nowhere is this more urgent than in childhood. More than 310 million children and adolescents are expected to be living with obesity by 2030, with those in vulnerable settings more at risk. These individuals are more likely to develop early-onset type 2 diabetes, and their weight in early life can also be a strong predictor of adult obesity and cardiometabolic disease. We believe that preventing childhood obesity is a shared societal responsibility that requires systemic change. Many of the risk factors driving the epidemic are outside of an individual’s control, reflecting rapid urbanisation and the health challenges that come in its wake, from physical inactivity to the prevalence of foods high in fats, sugar and salt. Our childhood obesity partnership with UNICEF – which was expanded in 2023 and aims to reach 10 million children across | the globe – zeroes in on exactly these key issues through policies, programmes and practices that directly impact the nutrition, wellbeing and development of children. Since its launch in 2019, the partnership has positively impacted the lives of more than 2.7 million children and caregivers across Latin America and the Caribbean. Now it is expanding its reach, bringing its proven approach to new geographies with an increased focus on driving policy change at national level and action at city level. Through local engagement and cross-sector collaboration, we are focusing on interventions with demonstrable track records. These include advocating for healthy school food regulations in Brazil, addressing unhealthy food marketing directed at children online in Mexico and trialling innovative measures to improve urban food retail environments in Indonesia. The partnership will draw upon insights from our Cities Changing Diabetes programme, now active in 47 cities globally, which over the past decade has addressed the systemic issues underpinning the rise in type 2 diabetes and obesity in urban environments. Our broader obesity prevention efforts will be boosted by our recently-established Transformational Prevention Unit, a semi-autonomous team of multi-disciplinary experts tasked with delivering high-impact, scalable and accessible solutions that can predict and pre-empt obesity and its consequences. | ||||||||||
| Novo Nordisk Annual Report 2023 | Introducing Novo Nordisk Strategic Aspirations Risks Management Consolidated statements Additional information | 17 | ||||||||
|  | |||||||||||||||||||||||||
| Empowering colleagues through diversity and inclusion | ||||||||||||||||||||||||||
Diversity and inclusion are central to our business and purpose. In our rapidly growing organisation, we aim to create an inclusive culture where all employees feel valued and are given equal opportunities to realise their potential and where, together, we better reflect the diversity of the patients and communities we serve. Encouraging diverse perspectives and promoting inclusive leadership adds value to Novo Nordisk by bringing out the best in our people, fostering new ideas and sparking innovation. Our aim is to achieve balanced gender representation across all managerial levels, with a minimum of 45% women and 45% men in senior leadership roles by the end of 2025. There is still work to be done but we are making significant progress. At the end of 2023, 41% of senior leadership positions were filled by women, compared to 39% one year earlier. Gender is only one element of diversity, and we want to build a more representative workforce across all dimensions, including ethnicity, race, age, nationality, disability status and sexual orientation – not to mention diversity of thought. We are committed to including these important parameters globally as we embed them into our people processes and the employee experience, from initial attraction and recruitment through to talent development and leadership training. | In the context of the rapid growth of our global organisation, this is no small feat. We added more than nine thousand employees to Novo Nordisk in 2023, and have gone to great lengths to sharpen our focus on onboarding and upskilling our new colleagues into their new roles, nurturing a workplace culture built upon foundational values of openness, accountability and respect. We measure our success in this regard by tracking employee engagement via a yearly all-company Evolve survey, recording an overall engagement score of 86% in 2023 – up from 85% in 2022 and placing us in the top quartile of Most Engaged Companies for the first time. | |||||||||||||||||||||||||
WOMEN IN LEADERSHIP (%) | ||||||||||||||||||||||||||
| 2019 | 2020 | 2021 | 2022 | 2023 | ||||||||||||||||||||||
| EVP/SVP | 18 | 24 | 28 | 29 | 36 | |||||||||||||||||||||
| CVP | 33 | 37 | 39 | 40 | 41 | |||||||||||||||||||||
| VP | 35 | 36 | 36 | 40 | 42 | |||||||||||||||||||||
| Senior leadership | 33 | 35 | 36 | 39 | 41 | |||||||||||||||||||||
| Director | 43 | 41 | 44 | 44 | 47 | |||||||||||||||||||||
| Manager and team lead | 40 | 42 | 43 | 45 | 46 | |||||||||||||||||||||
| All leaders | 40 | 41 | 43 | 44 | 46 | |||||||||||||||||||||
| Novo Nordisk Annual Report 2023 | Introducing Novo Nordisk Strategic Aspirations Risks Management Consolidated statements Additional information | 18 | ||||||||
| ||||||||||||||
| Statutory gender reporting under Danish law | inclusion brings value to the company, by enabling a diverse line of thought, increasing innovation and leading to better decision-making. The policy focuses on three primary drivers: mitigating bias, creating an inclusive workplace and having leaders serve as role models. Its most significant activities include yearly equal pay reviews, a global gender-neutral parental leave policy, tracking of gender representation across all managerial levels and aspirational gender diversity targets. Further reporting on diversity and inclusion is included in note 8.3 on Gender diversity, and for the Board of Directors, also in the Corporate Governance Report. Novo Nordisk’s diversity and inclusion policy is available at: www.novonordisk.com/sustainable-business/esg-portal/principles-positions-and-policies/diversity-inclusion-policy.html. Sustainable tax approach Our overall guiding principle within taxation is to have a sustainable tax approach, emphasising our business-anchored approach to managing the impact of taxes while remaining true to the Novo Nordisk values of operating our business in a responsible and transparent manner. Our legal structures are based on business-anchored considerations and substance. Consequently, we pay tax where value is generated and always respect international and domestic tax rules. As a global business, we conduct cross-border trading, which is subject to transfer pricing regulations. We apply a ‘Principal structure’ in line with OECD principles, meaning all legal entities, except for the principals, perform their functions under contract on behalf of the principals. As a result, entities contracted by the principals are being allocated an activity-based profit according to a benchmarked profit margin. The tax outcome of this operational model is reflected in the overview to the right, which shows our corporate income taxes by region. | To ensure alignment between tax authorities regarding the allocation of profit between our entities, we aim to have Advance Pricing Agreements and similar tax rulings in place for geographies representing around 70% of our revenue worldwide. Our tax policy has been approved by the Board of Directors. Read more about this at: www.novonordisk.com/sustainable-business/esg-portal/principles-positions-and-policies/tax-policy.html. In addition to corporate income taxes, we also pay other taxes. Please refer to note 8.7 on Total tax contribution for further information.  | ||||||||||||
Listed companies not having equal representation of genders on the Board of Directors are required to set a target for the share of the underrepresented gender. As of 1 January 2023, listed companies are also required to set a target and a policy for the share of the underrepresented gender in upper management1.  As of 31 December 2023, the Board of Directors is regarded as having equal gender representation and is therefore not legally required to set a gender target5. Since diversity remains important for the Board, it has maintained a voluntary 2025 target of having at least three shareholder-elected Board members who are men and three who are women. As of 31 December 2023, the share of the underrepresented gender in upper management at Novo Nordisk A/S is 42%. Accordingly, we have achieved equal gender representation as defined under the Danish companies act. However, we have not yet achieved the targeted level of 45% and therefore maintain our diversity and inclusion policy to keep making progress. This policy states our strong belief that diversity and | ||||||||||||||
| 1. Cf. the Danish Companies Act, section 139 (c). 2. Cf. the Danish Financial Statements Act. section 99(b). 3. Shareholder-elected Board members of Novo Nordisk A/S. 4. Chief executive officer and executive vice presidents employed by Novo Nordisk A/S as well as their direct reports, also employed by Novo Nordisk A/S, with leadership responsibility. 5. Cf. the Danish Companies Act, section 139(c)(1)(1). 6. Intellectual property rights based on sales from where intellectual property rights are located. 7. Production based on number of production employees in the region. 8. Sales based on location of the customer. | ||||||||||||||
| Novo Nordisk Annual Report 2023 | Introducing Novo Nordisk Strategic Aspirations Risks Management Consolidated statements Additional information | 19 | ||||||||

| Novo Nordisk Annual Report 2023 | Introducing Novo Nordisk Strategic Aspirations Risks Management Consolidated statements Additional information | 20 | ||||||||
| Novo Nordisk Annual Report 2023 | Introducing Novo Nordisk Strategic Aspirations Risks Management Consolidated statements Additional information | 21 | ||||||||
| Novo Nordisk Annual Report 2023 | Introducing Novo Nordisk Strategic Aspirations Risks Management Consolidated statements Additional information | 22 | ||||||||
EU TAXONOMY ELIGIBILITY AND ALIGNMENT1 | Turnover | CapEx | OpEx | ||||||||||||||||||||||||||||||||||||||
| 2022 | 2023 | 2022 | 2023 | 2022 | 2023 | ||||||||||||||||||||||||||||||||||||
| Environmental objective | Economic activity2 | (DKK million) | (%) | (DKK million) | (%) | (DKK million) | (%) | (DKK million) | (%) | (DKK million) | (%) | (DKK million) | (%) | ||||||||||||||||||||||||||||
| Total Turnover, CapEx, OpEx | 176,954 | 100% | 232,261 | 100% | 23,961 | 100% | 44,498 | 100% | 23,348 | 100% | 31,115 | 100% | |||||||||||||||||||||||||||||
| Taxonomy-non-eligible activities (B.) | N/A | N/A | 0 | 0% | 20,788 | 87% | 17,996 | 40% | 23,348 | 100% | 29,646 | 95% | |||||||||||||||||||||||||||||
| Climate change mitigation | 7.1. Construction of new buildings | 0 | 0% | 0 | 0% | 1,166 | 5% | 6,010 | 14% | 0 | 0% | 0 | 0% | ||||||||||||||||||||||||||||
| 7.2. Renovation of existing buildings | 0 | 0% | 0 | 0% | 2,007 | 8% | 2,406 | 5% | 0 | 0% | 0 | 0% | |||||||||||||||||||||||||||||
| Pollution prevention and control | 1.2. Manufacture of medicinal products | N/A | N/A | 232,261 | 100% | N/A | N/A | 18,086 | 41% | N/A | N/A | 1,469 | 5% | ||||||||||||||||||||||||||||
Eligible not aligned (A.2. / A.1.+ A.2.)3 | 0 | 0% | 232,261 | 100% | 3,173 | 13% | 26,502 | 60% | 0 | 0% | 1,469 | 5% | |||||||||||||||||||||||||||||
| Eligible and aligned (A.1.) | 0 | 0% | 0 | 0% | 0 | 0% | 0 | 0% | 0 | 0% | 0 | 0% | |||||||||||||||||||||||||||||
| 1. A.1., A.2., A.1.+A.2. and B. refer to Annex V to the Commission Delegated Regulation (EU) 2023/2486 of 27 June 2023. Not disclosed data are all either 0 (zero) or not applicable. 2. None of the reported economic activities are Enabling or Transitional and we do not have any economic activities substantially contributing to 'Climate Change Adaption', 'Water', 'Circular Economy' or 'Biodiversity'. 3. When allocating CapEx and OpEx to economic activities, we prioritise those that directly contribute to an environmental objective and for which specific technical screening criteria are set. Secondly, we link CapEx and OpEx associated with our primary economic activity, '1.2. Manufacture of medicinal products'. | |||||||||||||||||||||||||||||||||||||||||
| Novo Nordisk Annual Report 2023 | Introducing Novo Nordisk Strategic Aspirations Risks Management Consolidated statements Additional information | 23 | ||||||||
| Broadening our pipeline for long-term innovation |  | ||||||||||||||||
As the world grapples with the increasing impact of serious chronic diseases, Novo Nordisk is amplifying its research and development efforts to tackle these global health challenges head-on. Diseases like diabetes, obesity, cardiovascular disease and rare blood disorders pose significant threats to human health and society, demanding urgent action. | Guided by our purpose to drive change to defeat serious chronic diseases, we are broadening our pipeline of potential new treatments with an approach that is as comprehensive as it is innovative. Building on our 100-year heritage in protein and peptide engineering, we are harnessing the power of novel research technology platforms, leveraging cutting-edge data science tools and forging new strategic partnerships. This multi-faceted approach is enabling us to accelerate our research efforts and expand our footprint across multiple disease areas. As our evolution from a diabetes-focused organisation to a broader cardiometabolic-focused company continues, our attention remains on areas with the highest unmet needs – and those where we are best positioned to compete. Strengthening our leadership position in both diabetes and obesity remains our top priority, while expanding our presence in cardiovascular disease and rare blood disorders is also a key focus. We are stepping up our investment in these areas to build and maintain industry-leading pipelines, while at the same time seeking new opportunities to complement our in-house expertise with external innovation. Over the past year, this | emphasis on business development has resulted in the acquisition of biotechs including Inversago Pharma and Embark, two companies developing novel therapies with a potential application across a range of cardiometabolic diseases. To further expand our capabilities, we have established a significant presence in the Greater Boston area, a world-renowned hub for innovation and cutting-edge science and technology. Through strategic partnerships, such as those with technology firm Valo Health and the Broad Institute of MIT and Harvard, we aim to accelerate our drug discovery and development efforts, expanding our use of human data, artificial intelligence and machine learning and tapping into our partners’ innovative genetics and genomics tools. These extensive, wide-ranging efforts are already yielding positive results, including the initiation of clinical testing for cutting-edge cell therapy and siRNA (small interfering ribonucleic acid) treatments. Armed with an increasing array of novel research and development tools, we aim to move a greater number of projects into clinical testing at a faster pace, reducing the cost per project without compromising safety or quality. | STRATEGIC ASPIRATIONS 2025 1.Further raise the innovation-bar for diabetes treatment 2.Develop a leading portfolio of superior treatment solutions for obesity 3.Strengthen and progress the Rare Disease pipeline 4.Establish presence in Cardiovascular & Emerging Therapy Areas focusing on CVD, MASH and CKD | ||||||||||||||
| Novo Nordisk Annual Report 2023 | Introducing Novo Nordisk Strategic Aspirations Risks Management Consolidated statements Additional information | 24 | ||||||||
 Once-weekly insulin to set new standard in treatment |  Taking diabetes treatment to the next level with CagriSema | |||||||||||||||||||
Our company was founded on the discovery and production of insulin, and we remain committed to pushing the envelope when it comes to insulin innovation. Our investigational once-weekly insulin icodec represents the latest major step forward in insulin care, potentially changing the basal insulin experience for people living with diabetes. “If approved, insulin icodec will become the first once-weekly basal insulin option for adults with diabetes, reducing the number of weekly basal insulin injections from seven to just one.” | Insulin icodec has been filed for regulatory approval in the US, EU and China, following phase 3a trials that demonstrated superior reductions in blood glucose levels and reduced incidence of severe hypoglycaemia compared to once-daily basal insulin degludec and insulin glargine U100 in insulin-naïve people with type 2 diabetes. If approved, insulin icodec will become the first once-weekly basal insulin option for adults with diabetes, reducing the number of weekly injections from seven to just one. In the longer term, we are working on further improvements in insulin technology. This includes continuing to pursue the development of glucose-sensitive insulin, which only becomes active when the body’s glucose levels start to rise. | Our determination to raise the bar in diabetes treatment is exemplified by CagriSema, our new investigational therapy for type 2 diabetes that has now entered large-scale phase 3 clinical development. This two-in-one medicine combines semaglutide with the amylin analogue cagrilintide, offering a novel mechanism to influence the gut-brain axis with the aim of improving glycaemic control in people living with type 2 diabetes. Cagrilintide works by reducing hunger and increasing satiety signals to the brain, providing an additive effect to semaglutide. The decision to move into phase 3 development follows phase 2 results that showed a once-weekly subcutaneous injection of CagriSema reduced long-term blood glucose levels by 2.2 percentage points and outperformed its individual components in reducing body weight. CagriSema, which appears to have a safe and well-tolerated profile, previously commenced large-scale phase 3 trials in obesity in 2022, reflecting its broad potential across multiple therapy areas. | 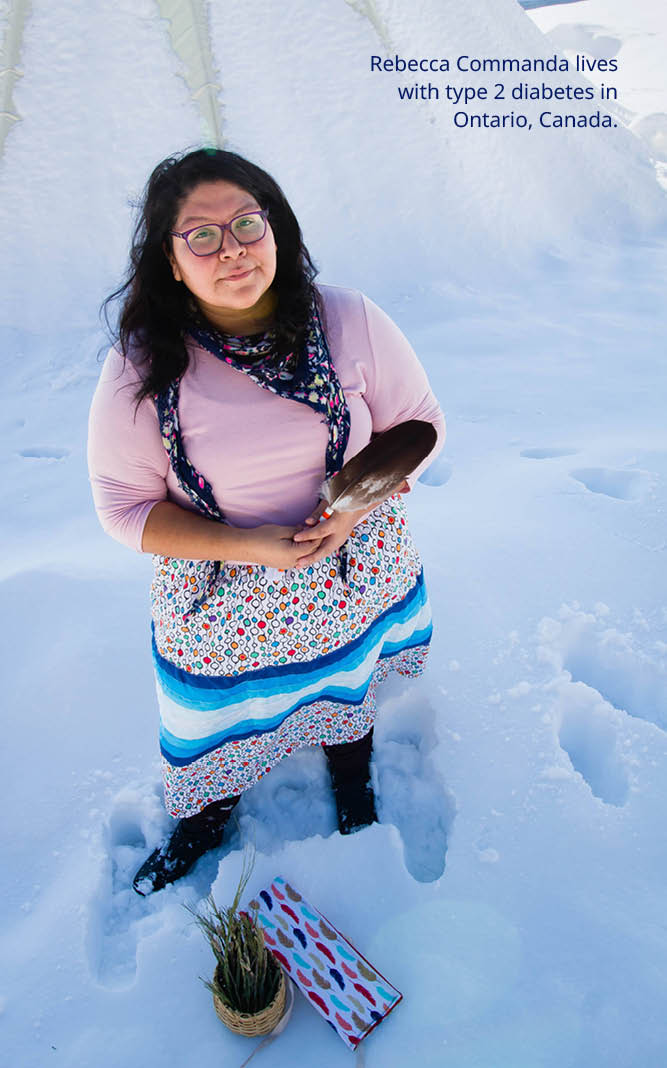 | |||||||||||||||||
| Novo Nordisk Annual Report 2023 | Introducing Novo Nordisk Strategic Aspirations Risks Management Consolidated statements Additional information | 25 | ||||||||
 |  Landmark trial underscores cardiovascular benefits of semaglutide | |||||||||||||||||||
| The success of our ground-breaking SELECT cardiovascular outcomes trial was a powerful endorsement of the efficacy and clinical importance of semaglutide as a treatment for people living with obesity and established cardiovascular disease (CVD). The study was the largest ever completed by our company, involving more than 17,500 adults aged 45 and above with obesity and established CVD but no prior history of diabetes. The findings demonstrated a 20% reduction in major adverse cardiovascular events (MACE) for trial participants treated with semaglutide 2.4 mg compared to placebo – showing that semaglutide not only helps patients lose weight but can also improve cardiovascular outcomes. The trial data showed this effect is consistent regardless of patient age, gender, ethnicity and starting BMI (body mass index), with risk reductions evident across heart attack, cardiovascular death and stroke. Importantly, the effect is seen soon after treatment initiation, suggesting that weight loss alone may not fully explain the benefits of semaglutide 2.4 mg in reducing the risk of MACE. Every year almost 21 million people die from CVD, which is the leading cause of disability and death worldwide. While cardiovascular mortality has decreased over | the past two decades, obesity-related cardiovascular deaths have increased significantly. Obesity leads to cardiovascular morbidity and mortality and is associated with risk factors such as high blood pressure and inflammation. “It is the first time that an approved weight management medicine has been shown to reduce the risk of heart attacks, strokes and cardiovascular death.” It is the first time that an approved weight management medicine has been shown to reduce the risk of heart attacks, strokes and cardiovascular death. Novo Nordisk has filed for a label update of Wegovy® in the US and EU based on these findings, and a decision is expected in 2024. The US Food and Drug Administration has granted our submission a priority review. | |||||||||||||||||||
| Novo Nordisk Annual Report 2023 | Introducing Novo Nordisk Strategic Aspirations Risks Management Consolidated statements Additional information | 26 | ||||||||
 Expanding our footprint in cardiovascular disease |  Next-generation treatments for rare blood disorders | ||||||||||||||||||||||
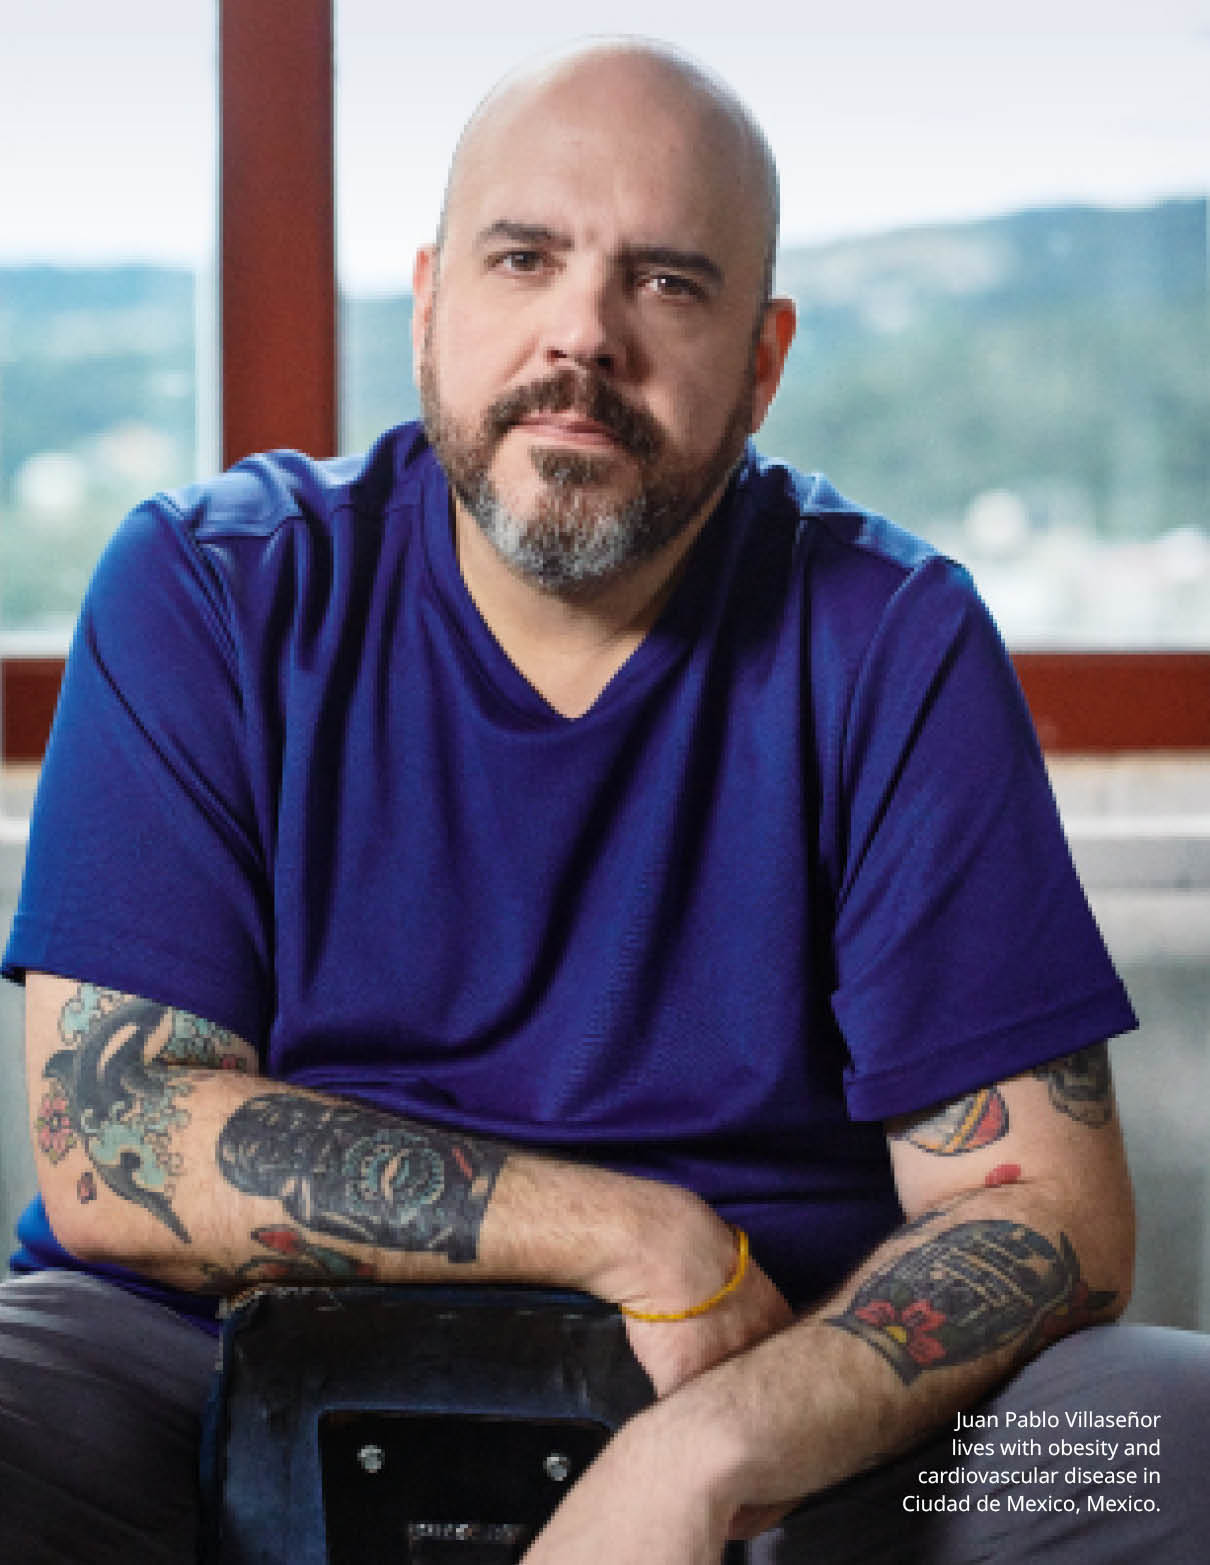
| Cardiovascular disease (CVD) represents one of the greatest health challenges of our time. Affecting an estimated 620 million people across the globe, it takes a major toll on quality of life and is currently the leading cause of death worldwide. At Novo Nordisk, we are determined to reduce the risk and burden of living with CVD, and over the past year we have taken significant steps to increase our footprint in this area of huge unmet need. In October 2023, we strengthened our CVD pipeline with the acquisition of ocedurenone in a deal worth up to USD 1.3 billion. This mature clinical candidate targets uncontrolled hypertension – a leading risk factor for cardiovascular events, heart failure, chronic kidney disease (CKD) and premature death. | To date, ocedurenone has been investigated in nine clinical trials, and is currently in phase 3 development for the treatment of uncontrolled hypertension in people with CKD. We expect to initiate further phase 3 trials in the coming years as we seek to maximise its full potential. Meanwhile, our first standalone CVD compound, ziltivekimab, is currently in phase 3 development for the treatment of atherosclerotic cardiovascular disease in people living with CKD. The ZEUS trial will include more than 6,000 patients in 38 countries, with completion expected in late-2025. | Our Rare Disease unit – comprising treatments for rare blood and endocrine disorders – has a growing pipeline of exciting products, including two potential medicines for rare blood disorders with large unmet medical needs. Mim8, our next-generation bispecific antibody for haemophilia A, is now in phase 3 development. Administered subcutaneously, it works by mimicking the function of the missing clotting factor VIII and is being tested as a treatment to prevent bleeds. The experimental once-daily oral medicine etavopivat, also in phase 3 evaluation, offers potential benefits for people with sickle cell disease (SCD), a crippling and life-threatening condition caused by misshapen red blood cells. Acquired as part of the business development deal that brought US-based Forma Therapeutics in-house in 2022, the investigational therapy is designed to modulate red blood cell health to reduce anaemia, pain, transfusions and strokes in people living with SCD. |  | ||||||||||||||||||||
| Novo Nordisk Annual Report 2023 | Introducing Novo Nordisk Strategic Aspirations Risks Management Consolidated statements Additional information | 27 | ||||||||
| Pipeline overview | |||||||||||
| |||||||||||
| Project | Indication | Description | Phase | ||||||||
Oral Semaglutide HD1 NN9924 | T2D2 | A long-acting GLP-13 analogue, 25.0 and 50.0 mg, intended for once-daily oral treatment. |  | ||||||||
| Icodec NN1436 | T1D4 and T2D | A long-acting basal insulin analogue intended for once-weekly subcutaneous treatment. | | ||||||||
| IcoSema NN1535 | T2D | A combination of GLP-1 analogue semaglutide and insulin icodec intended for once-weekly subcutaneous treatment. |  | ||||||||
| CagriSema NN9388 | T2D | A combination of amylin analogue cagrilintide and GLP-1 analogue semaglutide intended for once-weekly subcutaneous treatment. |  | ||||||||
| GELA NN9506 | T2D | A collaboration with GE Healthcare, using ultrasound for once-monthly treatment. |  | ||||||||
| Glucose-sensitive insulin NN1845 | T1D and T2D | A glucose-sensitive insulin analogue intended for once-daily subcutaneous treatment. |  | ||||||||
| Pumpsulin NN1471 | T1D | A novel insulin analogue ideal for use in closed loop pump systems. | | ||||||||
| DNA Immunotherapy NN9041 | T1D | A novel plasmid encoding pre- and pro-insulin intended for preservation of beta cell function. | | ||||||||
OW GLP-1 GIP5 NN9541 | T2D | A combination of GLP-1 and GIP co-agonist intended for once-weekly subcutaneous treatment. | | ||||||||
| OW Oral Semaglutide NN9904 | T2D | An oral version of semaglutide intended for once-weekly treatment. | | ||||||||
 | ||
| 1. HD: High Dose. 2. T2D: Type 2 diabetes. 3. GLP-1: Glucagon-like peptide-1. 4. T1D: Type 1 diabetes. 5. GIP: Gastric inhibitory polypeptide. 6. CB-1: Cannabinoid receptor-1. 7. MDS: Myelodysplastic syndromes. 8. CKD: Chronic kidney disease. 9. ASCVD: Atherosclerotic cardiovascular disease. 10. IL-6: Interleukin-6. 11. HFpEF: Heart failure with preserved ejection fraction. 12. CVD: Cardiovascular disease. 13. MASH: Metabolic dysfunction-associated steatohepatitis. | ||
| ||||||||||||||
| Project | Indication | Description | Phase | |||||||||||
| Oral Semaglutide NN9932 | Obesity | A long acting GLP-1 analogue intended for once-daily oral treatment. |  | |||||||||||
| CagriSema NN9838 | Obesity | A combination of amylin analogue cagrilintide and GLP-1 analogue semaglutide intended for once-weekly subcutaneous treatment. | | |||||||||||
| GELA NN9505 | Obesity | A collaboration with GE Healthcare, using ultrasound for once-monthly treatment. |  | |||||||||||
| INV-202 NN9440 | Obesity | A CB-16 receptor inverse agonist intended for once-daily oral treatment. | | |||||||||||
| Amycretin NN9487 | Obesity | A long-acting co-agonist of GLP-1 and amylin intended for once-weekly subcutaneous treatment or once-daily oral treatment. |  | |||||||||||
| OW GLP-1 GIP NN9541 | Obesity | A combination of GLP-1 and GIP co-agonist intended for once-weekly subcutaneous treatment. | | |||||||||||
| |||||||||||
| Project | Indication | Description | Phase | ||||||||
| Concizumab NN7415 | Haemophilia A or B w/wo inhibitors | A monoclonal antibody against tissue factor pathway inhibitor (TFPI) intended for subcutaneous prophylaxis treatment. |  | ||||||||
| Nedosiran NN7022 | Primary hyperoxaluria type 1 | An siRNA targeting lactate dehydrogenase A (LDHA) intended for once-monthly subcutaneous treatment. | | ||||||||
| Mim8 NN7769 | Haemophilia A w/wo inhibitors | A next generation FVIIIa mimetic bispecific antibody intended for subcutaneous prophylaxis of haemophilia A. |  | ||||||||
| Etavopivat NN7535 | Sickle cell disease | A second-generation small molecule PKR-activator intended for once-daily oral treatment. | | ||||||||
| Etavopivat NN7536 | Thalassemia | A second-generation small molecule PKR-activator intended for once-daily oral treatment. |  | ||||||||
| Etavopivat NN7537 | MDS7 | A second-generation small molecule PKR-activator intended for once-daily oral treatment. | | ||||||||
| NDec NN7533 | Sickle cell disease | An oral combination of decitabine and tetrahydrouridine. Project is developed in collaboration with EpiDestiny. |  | ||||||||
|||
| Project | Indication | Description | Phase | ||||||||
| Ziltivekimab NN6018 | CKD8+ ASCVD9 | A once-monthly monoclonal antibody intended for inhibition of IL-610 activity. |  | ||||||||
| Ziltivekimab NN6018 | HFpEF11 | A once-monthly monoclonal antibody intended for inhibition of IL-6 activity. |  | ||||||||
| Ocedurenone NN6023 | CVD12 | A small molecule, non-steroidal mineralocorticoid receptor antagonist (nsMRA) intended for oral treatment. | | ||||||||
| ATTR-CM NN6019 | CVD | An anti-amyloid immunotherapy intended for intravenous treatment. |  | ||||||||
| CM4HF NN9003 | CVD | An investigational cell therapy intended for restoring heart function in people with chronic heart failure. |  | ||||||||
| Anti-ANGPTL3 mAb NN6491 | CVD | An ANGPTL3 neutralising sweeping antibody intended for once-monthly subcutaneous treatment. | | ||||||||
| Semaglutide NN6535 | Alzheimer’s | A long-acting GLP-1 analogue intended for once-daily subcutaneous treatment. | | ||||||||
| Semaglutide NN9931 | MASH13 | A long-acting GLP-1 analogue intended for once-weekly subcutaneous treatment. | | ||||||||
| CagriSema NN9588 | MASH | A combination of amylin analogue cagrilintide and GLP-1 analogue semaglutide intended for once-weekly subcutaneous treatment. |  | ||||||||
| FGF21 NN9500 | MASH | A long-acting FGF21 analogue intended for once-weekly subcutaneous treatment. | | ||||||||
| LXRa NN6582 | MASH | An siRNA targeting LXRa intended for once-monthly subcutaneous treatment. |  | ||||||||
| MARC1 NN6581 | MASH | An siRNA targeting MARC1 intended for once-monthly subcutaneous treatment. | | ||||||||
| VAP-1i NN6561 | MASH | A VAP-1 inhibitor intended for once-daily oral treatment. | | ||||||||
| SC4PD NN9001 | Parkinson’s | A cryopreserved cell therapy intended for disease modifying treatment. | | ||||||||
| STAT3 NN4002 | Oncology | A GalXC-derived lipid conjugate one-time subcutaneous treatment. | | ||||||||
| Novo Nordisk Annual Report 2023 | Introducing Novo Nordisk Strategic Aspirations Risks Management Consolidated statements Additional information | 28 | ||||||||
| Novo Nordisk Annual Report 2023 | Introducing Novo Nordisk Strategic Aspirations Risks Management Consolidated statements Additional information | 29 | ||||||||
1. This overview does not include products whose sales represent less than 0.5% of Novo Nordisk’s total sales. 2. Patent status varies from country to country. The figures in the table are based on Germany. 3. Modern insulins are NovoRapid® (NovoLog®), NovoMix® 30 (NovoLog® Mix 70/30), Levemir®. 4. We have granted and pending patents covering the Victoza® formulation. These patents generally expire in November 2024, except for the US where the formulation patent expires in February 2026. 5. Patent term extension until 2027 may apply. 6. Formulation patent; active ingredient patent has expired. | ||
| Product | US | China | Japan | Europe2 | ||||||||||
Human insulin and Modern insulins3 | Expired | Expired | Expired | Expired | ||||||||||
Victoza®4 | Expired | Expired | Expired | Expired | ||||||||||
Tresiba® | 2029 | 2024 | 2027 | 2028 | ||||||||||
Ryzodeg® | 2029 | 2024 | 20245 | 2028 | ||||||||||
Xultophy® | 2029 | 2024 | 20245 | 2028 | ||||||||||
Fiasp® | 20306 | 20306 | 20306 | 20306 | ||||||||||
Ozempic® | 2032 | 2026 | 2031 | 2031 | ||||||||||
Rybelsus® | 2032 | 2026 | 2031 | 2031 | ||||||||||
| Product | US | China | Japan | Europe2 | ||||||||||
Saxenda® | Expired | Expired | Expired | Expired | ||||||||||
Wegovy® | 2032 | 2026 | 2031 | 2031 | ||||||||||
| Product | US | China | Japan | Europe2 | ||||||||||
Norditropin® (SimpleXx®) | Expired | Expired | Expired | Expired | ||||||||||
NovoSeven® | Expired | Expired | Expired | Expired | ||||||||||
NovoEight® | No patent | No patent | No patent | No patent | ||||||||||
Refixia® (REBINYN®) | 2028 | 2027 | 2032 | 2027 | ||||||||||
Esperoct® | 2032 | 2029 | 2034 | 2034 | ||||||||||
Vagifem® 10 mcg | Expired | No patent | Expired | Expired | ||||||||||
| Novo Nordisk Annual Report 2023 | Introducing Novo Nordisk Strategic Aspirations Risks Management Consolidated statements Additional information | 30 | ||||||||
| Stepping up to serve more patients in the face of unprecedented demand |  | |||||||||||||||||||
Demand for Novo Nordisk medicines is soaring, driven by a global obesity epidemic and exceptional growth in the GLP-1 market. This has resulted in a record number of people being treated with our medicines, but also supply constraints. In response, we are significantly ramping up production capacity and have introduced clear prioritisation principles to ensure broad and equitable distribution of our products. | Our centenary year has been characterised by extraordinary growth, driven by surging global demand for our medicines. Faced with these unprecedented circumstances, we have reshaped our commercial execution strategy to best serve the record number of patients who rely on our medicines. By ensuring supply for patients in the greatest need while continuing to bring innovation to people living with serious chronic diseases all over the world, we aim to balance our financial and societal responsibilities. Finding parity between the value we create and the values we aspire to has required some radical changes to normal commercial practices, along with a different mindset among sales staff. In many ways, we have rewritten the traditional rulebook for product launches by placing greater focus on the equitable distribution of limited supplies between different geographies and patient groups. Our top priority is that patients currently on Novo Nordisk medicines continue to have uninterrupted access to an appropriate treatment option. We are also focusing on introducing new treatments to new markets in a more measured way, aligned | with our unwavering commitment to deliver innovation to as many patients across the globe as possible. At the same time, we are investing heavily in new and upgraded production facilities in Denmark and other countries, increasing our capacity to meet current and future demand for our treatments and laying the foundation for sustainable long-term growth. These investments include a record DKK 42 billion expansion of our flagship production site in Kalundborg, Denmark, which is already producing half of the world’s entire supply of insulin. Outside of Denmark, we are more than doubling the production footprint of our long-established facilities in Chartres, France, with investments totalling DKK 17 billion. Both projects will include state-of-the-art, multi-product facilities to accommodate current and future products and processes. With construction under way on these major expansion projects, we strive to operate our facilities across the globe 24/7. In the past year, we have delivered more products to more patients than ever before, but such is the scale of demand that we expect periodic supply constraints to continue into 2024. | STRATEGIC ASPIRATIONS 2025 1.Strengthen diabetes leadership – aim at global value market share of more than 1/3 2.More than DKK 25 billion in Obesity sales by 2025 3.Secure a sustained growth outlook for Rare Disease | |||||||||||||||||
| Novo Nordisk Annual Report 2023 | Introducing Novo Nordisk Strategic Aspirations Risks Management Consolidated statements Additional information | 31 | ||||||||
 | Strengthening diabetes leadership with strong GLP-1-based product growth | |||||||||||||||||||
We have extended our leadership in diabetes care and increased our value market share by 1.9 percentage points to 33.8% in 2023, fuelled by strong uptake of the GLP-1-based products Ozempic® and Rybelsus® in both North America and International Operations. Ozempic® is now the world’s biggest-selling diabetes medicine. Available as a once-weekly injection, it is contributing to a major shift in treatment for type 2 diabetes. At the same time, our oral GLP-1-based therapy, Rybelsus®, is gaining ground by offering patients with type 2 diabetes an intervention without injections. Demand for these two products has grown to unprecedented levels, helping to generate record sales growth despite supply constraints and a decline in demand for the first-generation GLP-1-based product Victoza®. Although competition is increasing, Novo Nordisk remains the market leader in the GLP-1 market with a value share of 54.8%, broadly steady compared to 2022 where our value share stood at 54.9%. The high demand for our GLP-1-based medicines is partly fuelled by a growing understanding of the importance of the class among healthcare professionals, patients and payers. This includes a recognition that certain GLP-1-based therapies | are not only highly effective options for controlling blood sugar levels, but may also offer significant benefits in terms of reducing weight and cardiovascular risks – positive effects now reflected in international treatment guidelines. Despite declining sales of insulin in key markets, reflecting both pricing pressures and lower volumes in some geographies, Novo Nordisk’s insulin value market share remains little changed from 12 months earlier, at 43.9%, compared to 44.6% in 2022. Across International Operations, insulin is still an important and growing segment, although insulin sales in China have been adversely impacted since the introduction of Volume Based Procurement in mid-2022. The US has also experienced a decline in overall volumes and a decrease in realised prices due to channel / payer mix and higher rebates. Nevertheless, in a global diabetes market driven by high GLP-1 growth, we are uniquely positioned to maintain and strengthen our leadership in this sector and have already met our target of securing value market share of at least one-third by 2025. | |||||||||||||||||||
| Novo Nordisk Annual Report 2023 | Introducing Novo Nordisk Strategic Aspirations Risks Management Consolidated statements Additional information | 32 | ||||||||
Controlled launches for market-leading obesity therapy | 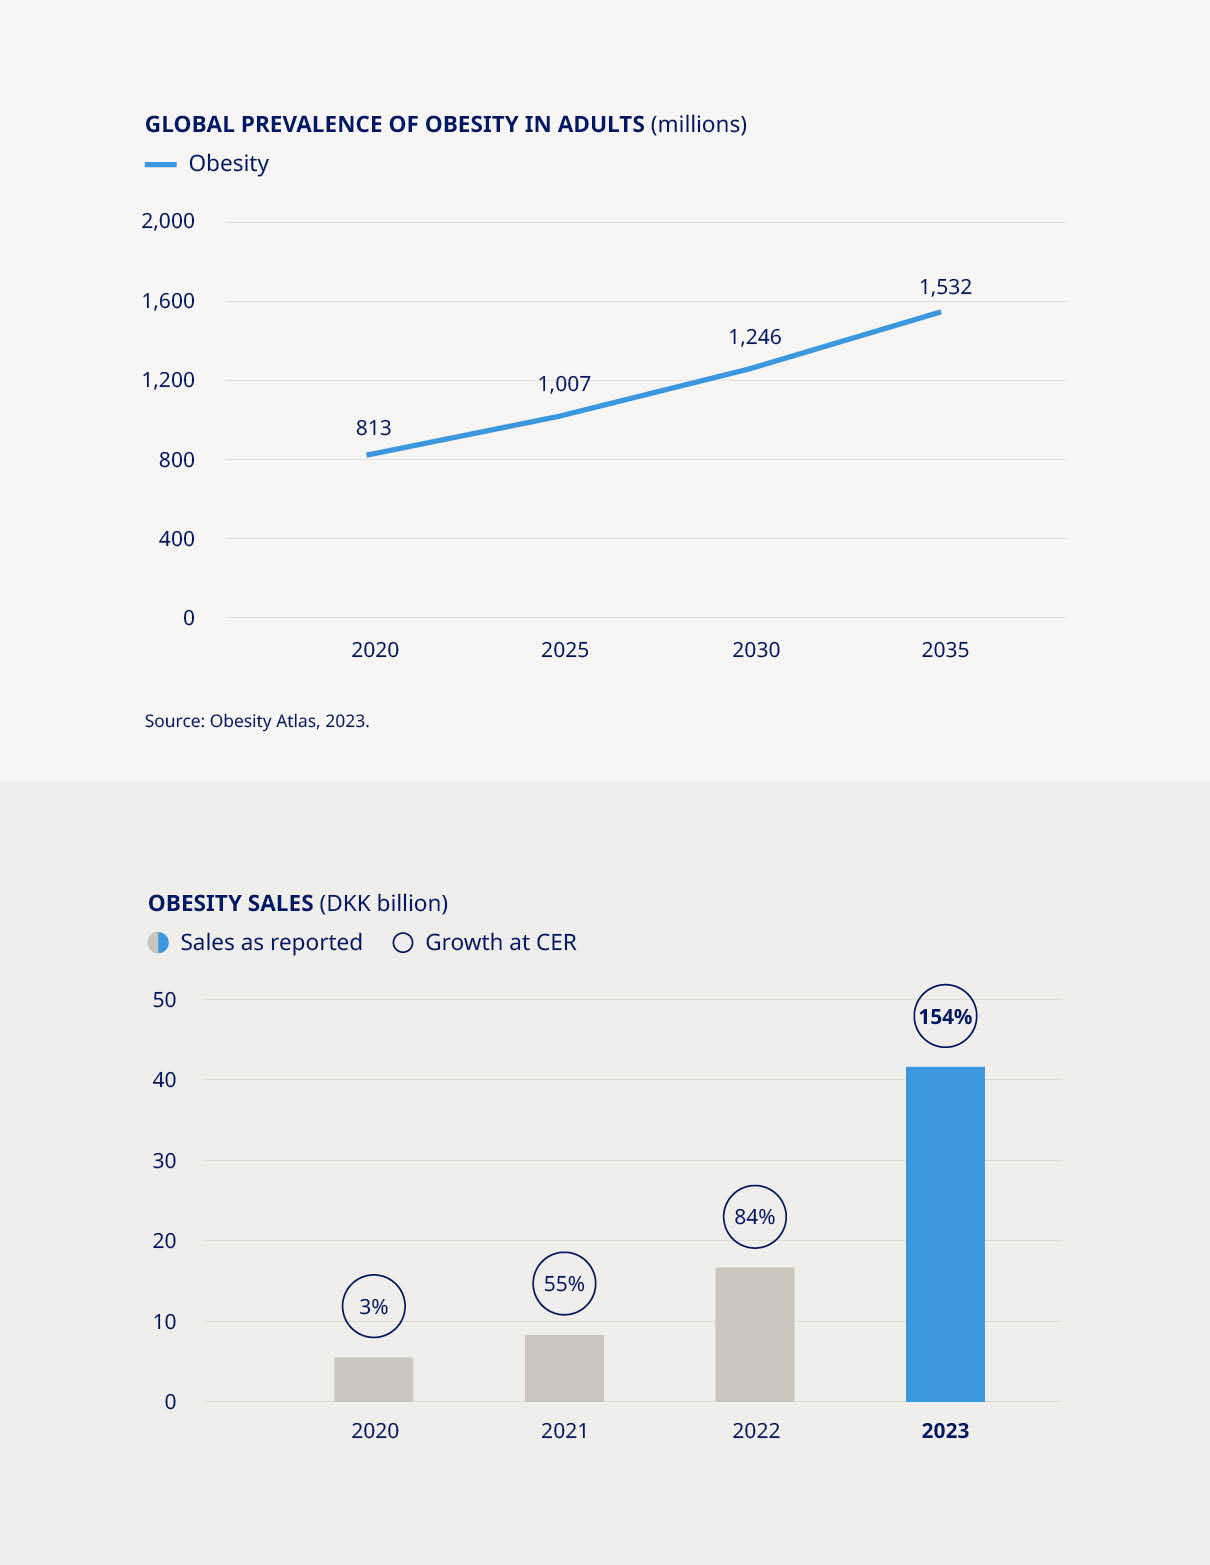 | |||||||||||||||||||
Surging demand, limited supply and unprecedented global media attention on our ground-breaking obesity treatment, Wegovy®, have brought significant challenges – as well as exciting long-term opportunities. Demand for Wegovy® is still growing strongly in the US, its first launch market, and we have taken proactive steps to conduct controlled and limited roll-outs in other major markets, with the goal of reaching the patients in greatest need of the therapy despite ongoing supply constraints. “Novo Nordisk is also reserving a share of Wegovy® supply in each new launch market for patients who cannot afford to pay for the product out of pocket.” In the UK, for example, Wegovy® is now available in specialist National Health Service weight management services for people who meet strict criteria, or else privately through a registered healthcare professional. UK physicians are being urged to prescribe responsibly and Novo Nordisk is also reserving a share of Wegovy® supply in each new launch market for patients who cannot afford to pay for the product out of pocket. | The success of Wegovy®, which builds on our experience with our first-generation GLP-1-based obesity product Saxenda®, means that Novo Nordisk has captured most of the growth and gained a clear leadership position in the obesity market. The sector remains extremely dynamic, with new players lining up to enter the space amid a growing appreciation that medicines tackling obesity have the potential to boost public health and cut long-term healthcare costs. Globally, the number of people living with obesity has almost tripled since 1975 and is set to reach over 1.2 billion adults by 2030. The causes of obesity are complex and its consequences far-reaching because, so often, it puts people on a path to other diseases – not only diabetes, but also heart and liver diseases, cancers and many more. Today, only one in 10 people living with obesity seek professional medical help – and only one in five of those receive treatment with a weight management medication. But attitudes are changing fast. The past two years have been characterised by a growing understanding among both the medical community and the public of the critical need to treat obesity, while an increasing number of people living with the disease are actively seeking support. We want to understand more about their journey and how we can continue to help them maintain their long-term progress towards better health. | |||||||||||||||||||
| Novo Nordisk Annual Report 2023 | Introducing Novo Nordisk Strategic Aspirations Risks Management Consolidated statements Additional information | 33 | ||||||||
 Targeting sustainable growth in Rare Disease |  Expanding our production capacity to meet demand | ||||||||||||||||||||||
Our Rare Disease unit had a challenging year, with sales decreasing by 15% as Norditropin®, our long-established treatment for growth disorders, was impacted by supply constraints due to a temporary reduction in manufacturing output. Sales of rare blood disorder products, meanwhile, were up 1% as a decline in NovoSeven® and NovoEight® sales was offset by growing demand for our newer haemophilia A and B therapies, Esperoct® and Refixia®. Despite the challenges encountered this year, we remain confident that our rich pipeline in rare disease can bring growth back on track. The line-up of new therapies includes significant advances in both rare blood and endocrine disorders. Next-generation treatments – including Mim8 and Alhemo® in haemophilia – will add to growth in the medium term, while accelerated internal innovation and external business development will help us to build our presence in other rare disease areas of high unmet need, such as sickle cell disease. | In the rare endocrine space, our once-weekly treatment Sogroya® offers a new opportunity for people living with growth hormone deficiency by removing the burden of daily injections and offering demonstrated efficacy. . | Tackling the supply problems that prevent us from meeting the growing demand for our products is a top priority for Novo Nordisk. We know we must do more to ramp up capacity, and our colleagues in production are working around the clock to get additional supplies onto pharmacy shelves and into the hands of patients. In the past year we have announced investments totalling more than DKK 75 billion into expanding capacity across our global network of production sites – including major expansions of our facilities in Kalundborg, Denmark, and Chartres, France, and the acquisition of a brownfield development and production site in Athlone, Ireland. There are, however, limits to how rapidly we can translate these investments into making more medicines that are ready for shipment. Pharmaceutical production must adhere to the highest possible standards, and we will never compromise on safety and quality for the sake of speed. In the meantime, we strive to operate our global manufacturing facilities 24/7 to maximise output from the current production base. | We are also thinking strategically about ways to remove bottlenecks in the supply chain. For example, we are seeking to alleviate pressure on device supplies by introducing our medicines in once-weekly rather than daily formulations, and we are exploring ways to reduce the reliance on single-use injection devices. | ||||||||||||||||||||
 |  | ||||||||||||||||||||||
| Novo Nordisk Annual Report 2023 | Introducing Novo Nordisk Strategic Aspirations Risks Management Consolidated statements Additional information | 34 | ||||||||
| Novo Nordisk Annual Report 2023 | Introducing Novo Nordisk Strategic Aspirations Risks Management Consolidated statements Additional information | 35 | ||||||||
| Novo Nordisk Annual Report 2023 | Introducing Novo Nordisk Strategic Aspirations Risks Management Consolidated statements Additional information | 36 | ||||||||
| Novo Nordisk Annual Report 2023 | Introducing Novo Nordisk Strategic Aspirations Risks Management Consolidated statements Additional information | 37 | ||||||||
| Expectations are as reported, if not otherwise stated | Expectations 31 January 2024 | ||||
| Sales growth | |||||
| at CER | 18% to 26% | ||||
| as reported | Around 1 percentage point lower than at CER | ||||
| Operating profit growth | |||||
| at CER | 21% to 29% | ||||
| as reported | Around 2 percentage points lower than at CER | ||||
| Financial items (net) | Gain of around DKK 1.3 billion | ||||
| Effective tax rate | 19% to 21% | ||||
| Capital expenditure (PP&E) | Around DKK 45 billion | ||||
| Depreciation, amortisation and impairment losses | Around DKK 10 billion | ||||
| Free cash flow (excluding impact from business development) | DKK 64-74 billion | ||||
| Novo Nordisk Annual Report 2023 | Introducing Novo Nordisk Strategic Aspirations Risks Management Consolidated statements Additional information | 38 | ||||||||
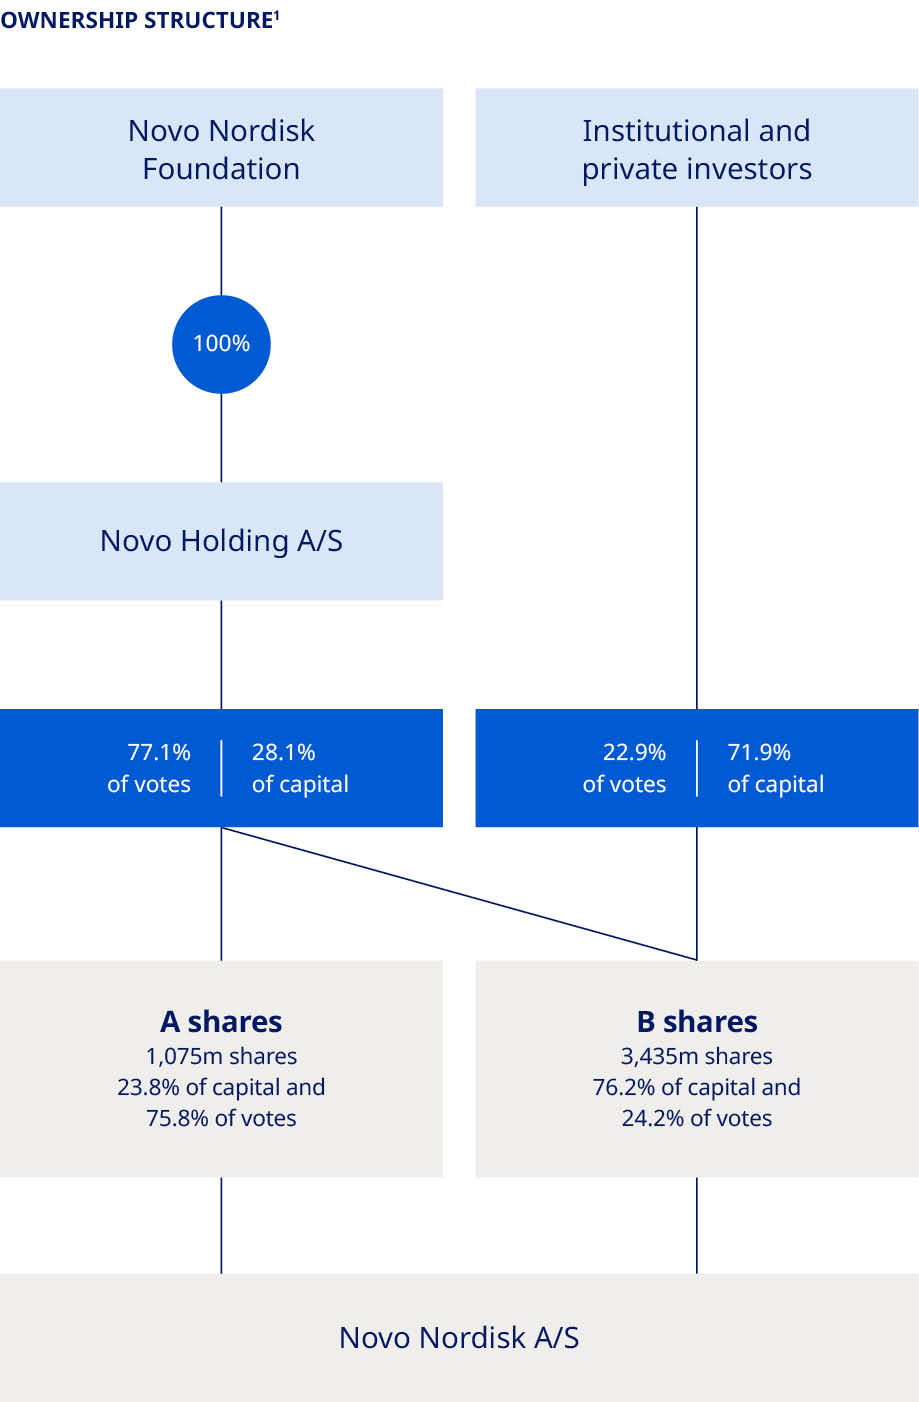
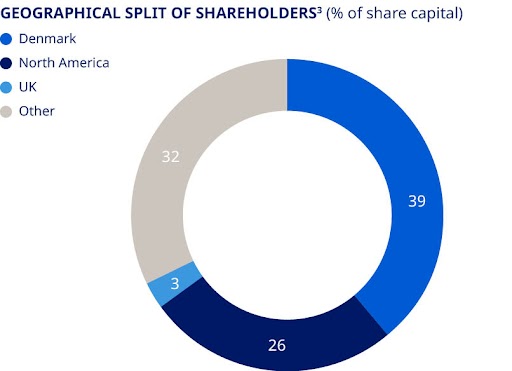
| 1. Treasury shares are included; however, voting rights of treasury shares cannot be exercised. 2. Novo Holdings A/S’s registered address is Tuborg Havnevej 19, DK-2900 Hellerup, Denmark. 3. Split of shareholders is denoted according to the location of legal deposit-owners. | ||
| Novo Nordisk Annual Report 2023 | Introducing Novo Nordisk Strategic Aspirations Risks Management Consolidated statements Additional information | 39 | ||||||||
| Novo Nordisk Annual Report 2023 | Introducing Novo Nordisk Strategic Aspirations Risks Management Consolidated statements Additional information | 40 | ||||||||
| Novo Nordisk Annual Report 2023 | Introducing Novo Nordisk Strategic Aspirations Risks Management Consolidated statements Additional information | 41 | ||||||||
| Novo Nordisk Annual Report 2023 | Introducing Novo Nordisk Strategic Aspirations Risks Management Consolidated statements Additional information | 42 | ||||||||
| Risk area | Description | Impact | Mitigating actions | 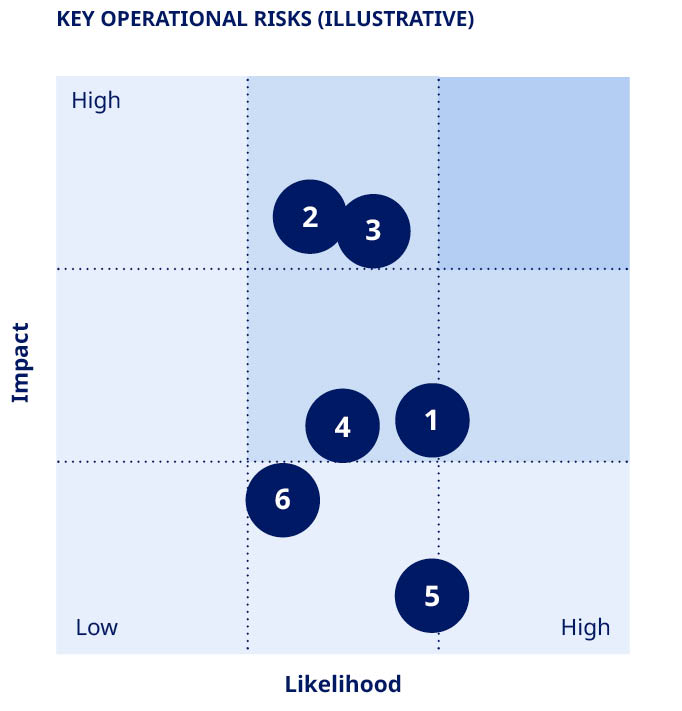 | ||||||||||||||||
 Research and Clinical Pipeline Risks | Findings in clinical activities, regulatory processes or misjudging of commercial potential, leading to delays or failure of products in the pipeline. | •Patients would not benefit from innovative treatments. •Could have an adverse impact on sales, profits and market position. | •Pre-clinical and clinical activities to demonstrate safety and efficacy. •Consultations with regulators to review pre-clinical and clinical findings and obtain guidance on development path. | |||||||||||||||||
 Product Supply, Quality and Safety Risks | Higher-than-expected demand or disruption of product supply due to, e.g. geopolitical instability or quality issues may compromise product availability, ultimately impacting patients and representing a lost commercial opportunity. In addition, there could be risks related to safety and product liability. | •Product shortages could have potential implications for patients. •Could jeopardise reputation and license to operate if regulatory compliance is not ensured. •Could have an adverse impact on sales, profits and market position. •Compromised patient safety and exposure to product liability legal proceedings. | •Significantly expanding global production with multiple facilities and safety stock to reduce supply risk. •Planning and management of supply chain. •Regular quality audits of internal units and suppliers to document GMP compliance. •Identification and correction of root causes when issues are identified. If necessary, products are recalled. | |||||||||||||||||
 Commercialisation Risks | Competitive pressures, as well as market dynamics and geopolitical, macroeconomic or healthcare crises (e.g. pandemics) leading to reduced payer ability and willingness to pay. | •Market dynamics could impact price levels and patient access. •Could have an adverse impact on sales, profits and market position. | •Innovation of novel products, clinical trial data and real-world evidence demonstrate added value of new products. •Payer negotiations to ensure improved patient access. •Increased and new access and affordability initiatives. | |||||||||||||||||
 IT Security Risks | Disruption to IT systems, such as cyber-attacks or infrastructure failure resulting in business disruption or breach of data confidentiality. | •Could limit our ability to produce and safeguard product quality. •Could compromise patients’ or other individuals’ privacy. •Could limit our ability to maintain operations or limit future business opportunities if proprietary information is lost. •Could have an adverse impact on sales, profits and market position. | •Company-wide information security awareness activities. •Continuity plans for non-availability of IT systems. •Company-wide internal audit of IT security controls. •Detection and protection mechanisms in IT systems and business processes. | |||||||||||||||||
 Financial Risks | Exchange rate fluctuations (mainly in USD, CNY, JPY and CAD), disputes with tax authorities and changes to tax legislation and interpretation. | •Could lead to tax adjustments, fines and higher-than-expected tax level. •Could have an adverse impact on sales and profits. | •Hedging for selected currencies. •Integrated treasury management. •Applicable taxes paid in jurisdictions where business activity generates profits and multi-year Advance Pricing Agreements with tax authorities. | 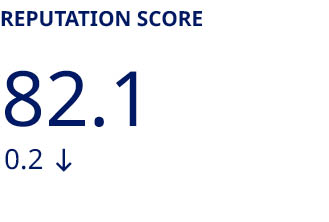 | We achieved a reputation score of 82.1 points in 2023 measured on a scale of 0-100 (0.2 down from 2022). Stable with last year, Novo Nordisk continues to lead our selected industry benchmarks. This excellent reputation score is driven by positive perceptions of our products and services, the most important reputation component, and growing appreciation from the informed general public. | |||||||||||||||
 Legal, Patents and Compliance Risks | Breach of legislation, industry codes or company policies. Competitors asserting patents against Novo Nordisk or challenging patents critical for protection of commercial product and pipeline candidates. | •Potential exposure to investigations, criminal and civil sanctions and other penalties. •Could compromise our reputation and the rights and integrity of individuals involved. •Unexpected loss of exclusivity for, or injunctions against, existing and pipeline products could have an adverse impact on future sales. •Could have an adverse impact on sales, profits and market position. | •Legal review of key activities. •Code of Conduct integrated in our business. •Compliance Hotline in place. •Internal Audit of compliance with business ethics standards. •Internal controls to minimise vulnerability to patent infringement and invalidity actions. | |||||||||||||||||
| Novo Nordisk Annual Report 2023 | Introducing Novo Nordisk Strategic Aspirations Risks Management Consolidated statements Additional information | 43 | ||||||||

| Novo Nordisk Annual Report 2023 | Introducing Novo Nordisk Strategic Aspirations Risks Management Consolidated statements Additional information | 44 | ||||||||
| Board of Directors | ||||||||||||||||||||||||||||||||
 |  |  |  |  |  | |||||||||||||||||||||||||||
Helge Lund Chair Norwegian. Born October 1962. Male. Member since 20171. Term 2024. Chair of the Nomination Committee and the Chair Committee. Positions and management duties: Chair of the board of directors and chair of the people & governance committee of BP p.l.c. Chair of the board of directors of Inkerman AS. Member of the board of directors and member of the remuneration committee of Belron SA. Member of the board of directors of P/F Tjaldur. Operating advisor to Clayton Dubilier & Rice. Member of the board of trustees of the International Crisis Group. Competencies: Global corporate leadership; healthcare and pharma industry; finance and accounting; business development, M&A and external innovation sourcing; human capital management; environmental, social and governance (ESG). | Henrik Poulsen Vice chair Danish. Born September 1967. Male. Member since 2021. Term 2024. Chair of the Remuneration Committee and member of the Audit Committee and the Chair Committee. Positions and management duties: Chair of the supervisory board, chair of the nomination committee and member of the remuneration committee of Carlsberg A/S. Chair of the board of directors and chair of the nomination & remuneration committee at Faerch A/S. Member of the board of directors of Novo Holdings A/S. Member of the supervisory board of Bertelsmann SE & Co. KGaA. Senior advisor to A.P. Møller Holding A/S. Competencies: Global corporate leadership; finance and accounting; business development, M&A and external innovation sourcing; human capital management; environmental, social and governance (ESG). | Elisabeth Dahl Christensen Danish. Born November 1965. Female. Member since 2022. Term 2026. Employee representative. Member of the Remuneration Committee. Positions and management duties: Full-time union representative at Novo Nordisk A/S. Competencies: Not mapped for employee representatives. | Laurence Debroux French. Born July 1969. Female. Member since 2019. Term 2024. Chair of the Audit Committee and member of the Remuneration Committee. Positions and management duties: Member of the board of directors, chair of the audit committee and member of the ESG committee of Exor N.V. Member of the supervisory board and member of the audit committee of Randstad N.V. Member of the board of directors of HEC Paris Business School and of Kite Insights (The Climate School). Competencies: Global corporate leadership; healthcare and pharma industry; finance and accounting; business development, M&A and external innovation sourcing; human capital management; environmental, social and governance (ESG). | Andreas Fibig German. Born February 1962. Male. Member since 2018. Term 2024. Member of the Research & Development Committee. Positions and management duties: Member of the board of directors of Indigo Agriculture Inc., Evodiabio ApS and ExlService Holdings, Inc. Honorary director of the German American Chamber of Commerce. Competencies: Global corporate leadership; healthcare and pharma industry; technology, data and digital; finance and accounting; business development, M&A and external innovation sourcing; human capital management; environmental, social and governance (ESG). | Sylvie Grégoire Canadian and American. Born November 1961. Female. Member since 2015. Term 2024. Member of the Audit Committee, the Research & Development Committee and the Nomination Committee. Positions and management duties: Co-founder and chair of the board of directors of CervoMed, Inc. Member of the board of directors and member of the nominating & corporate governance committee and the compensation & benefits committee of Revvity Inc. Member of the board of directors of F2G Ltd. Advisor to the Soffinova Telethon Fund. Competencies: Global corporate leadership; healthcare and pharma industry; medicine and science; finance and accounting; business development, M&A and external innovation sourcing; human capital management. | |||||||||||||||||||||||||||
| 1. Helge Lund was also a member of the Board of Directors for one one-year term from 2014-2015. | ||||||||||||||||||||||||||||||||
| Novo Nordisk Annual Report 2023 | Introducing Novo Nordisk Strategic Aspirations Risks Management Consolidated statements Additional information | 45 | ||||||||
| Board of Directors (continued) | ||||||||||||||||||||||||||||||||
 |  |  |  |  |  | |||||||||||||||||||||||||||
Liselotte Hyveled Danish. Born January 1966. Female. Member since 20222. Term 2026. Employee representative. Member of the Research & Development Committee. Positions and management duties: Chief patient officer and principal vice president of Patient Voice Strategy & Alliances, Novo Nordisk A/S. Competencies: Not mapped for employee representatives. | Mette Bøjer Jensen Danish. Born December 1975. Female. Member since 2018. Term 2026. Employee representative. Member of the Audit Committee. Positions and management duties: Wash & Sterilisation specialist in Product Supply, Novo Nordisk A/S. Competencies: Not mapped for employee representatives. | Kasim Kutay British. Born May 1965. Male. Member since 2017. Term 2024. Member of the Nomination Committee and the Research & Development Committee. Positions and management duties: CEO of Novo Holdings A/S. Member of the board of directors and member of the nomination and remuneration committee of Novozymes A/S. Competencies: Global corporate leadership; healthcare and pharma industry; finance and accounting; business development, M&A and external innovation sourcing; human capital management. | Christina Law Chinese. Born January 1967. Female. Member since 2022. Term 2024. Member of the Audit Committee. Positions and management duties: Group CEO of Raintree Group of Companies. Member of the board of directors of Raintree Group Limited, Raintree Investment Pte Ltd. and Air Liquide S.A. Member of the board of directors and member of the nomination and compensation committee of INSEAD Business School. Member of the board of directors of La Fondation des Champions. Competencies: Global corporate leadership; technology, data and digital; business development, M&A and external innovation sourcing; human capital management. | Martin Mackay American and British. Born April 1956. Male. Member since 2018. Term 2024. Chair of the Research & Development Committee and member of the Remuneration Committee. Positions and management duties: Co-founder and executive chairman of Rallybio LLC. Member of the board of directors and member of the science & technology committee and the finance committee of Charles River Laboratories International, Inc. Competencies: Global corporate leadership; healthcare and pharma industry; medicine and science; technology, data and digital; business development, M&A and external innovation sourcing; human capital management. | Thomas Rantzau Danish. Born March 1972. Male. Member since 2018. Term 2026. Employee representative. Member of the Nomination Committee. Positions and management duties: Lead auditor, Internal Audits, Novo Nordisk A/S. Competencies: Not mapped for employee representatives. | |||||||||||||||||||||||||||
| 2. Liselotte Hyveled was also an employee-elected member of the Board of Directors for one four-year term from 2014-2018. | ||||||||||||||||||||||||||||||||
| Novo Nordisk Annual Report 2023 | Introducing Novo Nordisk Strategic Aspirations Risks Management Consolidated statements Additional information | 46 | ||||||||
| Independence and meeting attendance overview | 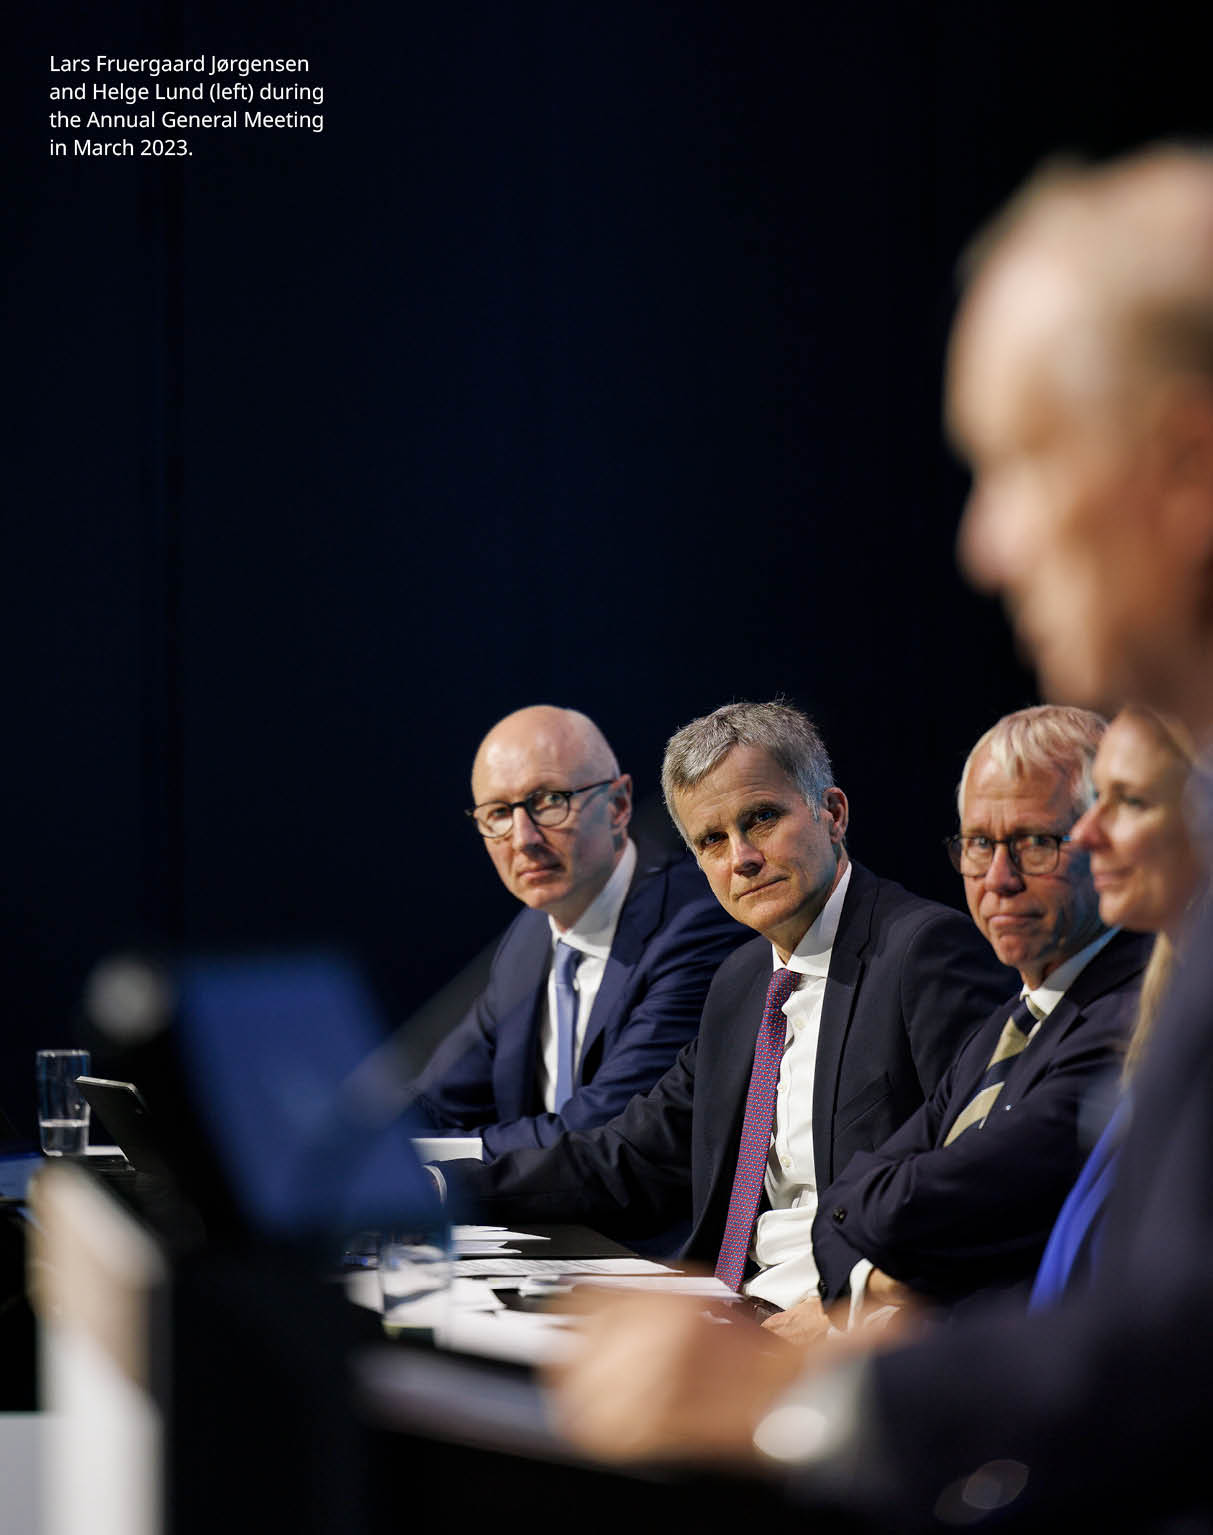 | |||||||||||||||||||||||||
Meeting attendance in 20233 | ||||||||||||||||||||||||||
| Name | Independence4 | Board of Directors | Chair Committee | Audit Committee10 | Nomination Committee | Remuneration Committee | R&D Committee | |||||||||||||||||||
| Helge Lund | Independent | 9/9 | 7/7 | 3/3 | ||||||||||||||||||||||
| Henrik Poulsen | Not independent5, 6, 7, 9 | 9/9 | 7/7 | 5/5 | 5/6 | |||||||||||||||||||||
| Elisabeth Dahl Christensen | Not independent8 | 9/9 | 6/6 | |||||||||||||||||||||||
| Laurence Debroux | Independent6, 7, 9 | 9/9 | 5/5 | 6/6 | ||||||||||||||||||||||
| Andreas Fibig | Independent | 9/9 | 4/4 | |||||||||||||||||||||||
| Sylvie Grégoire | Independent6 | 9/9 | 5/5 | 3/3 | 4/4 | |||||||||||||||||||||
| Liselotte Hyveled | Not independent8 | 8/9 | 4/4 | |||||||||||||||||||||||
| Mette Bøjer Jensen | Not independent6, 8 | 9/9 | 5/5 | |||||||||||||||||||||||
| Kasim Kutay | Not independent5 | 8/9 | 3/3 | 4/4 | ||||||||||||||||||||||
| Christina Law | Independent6 | 9/9 | 5/5 | |||||||||||||||||||||||
| Martin Mackay | Independent | 9/9 | 6/6 | 4/4 | ||||||||||||||||||||||
| Thomas Rantzau | Not independent8 | 9/9 | 3/3 | |||||||||||||||||||||||
| Board members who stepped down at the Annual General Meeting in March 2023 | ||||||||||||||||||||||||||
| Jeppe Christiansen | Not independent5 | 2/2 | 1/2 | |||||||||||||||||||||||
| 3. Number of meetings attended by each Board member out of the total number of meetings within the member’s term. 4. In accordance with recommendation 3.2.1 of the Danish Corporate Governance Recommendations as designated by Nasdaq Copenhagen. 5. Member of the board of directors or executive management of Novo Holdings A/S. 6. Pursuant to the US Securities Exchange Act, Ms Debroux, Ms Grégoire and Ms Law qualify as independent Audit Committee members, while Ms Bøjer Jensen and Mr Poulsen rely on an exemption from the independence requirements. 7. Ms Debroux and Mr Poulsen possess the qualifications within accounting and auditing required under part 8 of the Danish Act on Approved Auditors and Audit Firms. 8. Elected by employees of Novo Nordisk. 9. Designated as financial experts as defined by the US Securities and Exchange Commission (SEC). 10. Collectively, the members have relevant industry expertise. | ||||||||||||||||||||||||||
| Novo Nordisk Annual Report 2023 | Introducing Novo Nordisk Strategic Aspirations Risks Management Consolidated statements Additional information | 47 | ||||||||
| Executive Management | ||||||||||||||||||||||||||||||||
 |  |  |  |  |  | |||||||||||||||||||||||||||
Lars Fruergaard Jørgensen11 President and chief executive officer (CEO). Born November 1966. Male. Other positions and management duties: President of the European Federation of Pharmaceutical Industries and Associations (EFPIA). | Maziar Mike Doustdar Executive vice president. International Operations. Born August 1970. Male. Other positions and management duties: Member of the board of directors and the personnel and remuneration committee of Orion Corporation. | Ludovic Helfgott Executive vice president. Rare Disease. Born July 1974. Male. Other positions and management duties: President of the Novo Nordisk Haemophilia Foundation Council. | Karsten Munk Knudsen11 Executive vice president. Chief financial officer (CFO). Born December 1971. Male. Other positions and management duties: Member of the board of directors, chair of the audit committee and member of the equity & capital markets committee of Hempel A/S. Member of the board of directors and chair of the audit committee of 3Shape Holding A/S. | Doug Langa Executive vice president. North America Operations. Born October 1966. Male. Other positions and management duties: No other management positions. | Martin Holst Lange Executive vice president. Development. Born October 1970. Male. Other positions and management duties: Member of the board of directors of Pharmacosmos A/S. | |||||||||||||||||||||||||||
 |  |  |  |  | ||||||||||||||||||||||||||||
David Moore Executive vice president. Corporate Development. Born January 1974. Male. Other positions and management duties: Member of the board of directors of Naveris Inc., Radius Health Inc. and Novasenta Inc. | Tania Sabroe Executive vice president. People & Organisation. Born July 1977. Female. Other positions and management duties: No other management positions. | Marcus Schindler Executive vice president. Research & Early Development and chief scientific officer (CSO). Born September 1966. Male. Other positions and management duties: Adjunct Professor of Pharmacology at the University of Gothenburg. | Camilla Sylvest Executive vice president. Commercial Strategy & Corporate Affairs. Born November 1972. Female. Other positions and management duties: Vice chair of the board of directors of Danish Crown A/S. Member of the board of directors of Argenx SE. | Henrik Wulff Executive vice president. Product Supply, Quality & IT. Born November 1970. Male. Other positions and management duties: Member of the board of directors of Grundfos Holding A/S. | ||||||||||||||||||||||||||||
| 11. Lars Fruergaard Jørgensen and Karsten Munk Knudsen are registered as executives with the Danish Business Authority. The other members of Executive Management are not registered as executives with the Danish Business Authority. | ||||||||||||||||||||||||||||||||
| Novo Nordisk Annual Report 2023 | Introducing Novo Nordisk Strategic Aspirations Risks Management Consolidated statements Additional information | 48 | ||||||||

| Novo Nordisk Annual Report 2023 | Introducing Novo Nordisk Strategic Aspirations Risks Management Consolidated statements Additional information | 49 | ||||||||
| Consolidated financial statements | ||||||||
| Income statement and Statement of comprehensive income | 50 | |||||||
| Cash flow statement | 51 | |||||||
| Balance sheet | 52 | |||||||
| Equity statement | 53 | |||||||
| Notes to the consolidated financial statements | ||||||||
| Section 1 | ||||||||
| Basis of preparation | ||||||||
| Material accounting policies and key accounting estimates | 54 | |||||||
1.2 | Changes in accounting policies and disclosures | 54 | ||||||
| Section 2 | ||||||||
| Results for the year | ||||||||
| 2.1 | Net sales and rebates | 55 | ||||||
| 2.2 | Segment information | 56 | ||||||
| 2.3 | Research and development costs | 58 | ||||||
| 2.4 | Employee costs | 58 | ||||||
| 2.5 | Other operating income and expenses | 59 | ||||||
| 2.6 | Income taxes and deferred income taxes | 59 | ||||||
| Section 3 | ||||||||
| Operating assets and liabilities | ||||||||
| 3.1 | Intangible assets | 61 | ||||||
| 3.2 | Property, plant and equipment | 63 | ||||||
| 3.3 | Inventories | 64 | ||||||
| 3.4 | Trade receivables | 65 | ||||||
| 3.5 | Provisions and contingent liabilities | 66 | ||||||
| Section 4 | ||||||||
| Capital structure and financial items | ||||||||
| 4.1 | Earnings per share | 68 | ||||||
| 4.2 | Distribution to shareholders | 68 | ||||||
| 4.3 | Share capital, Treasury shares and Other reserves | 68 | ||||||
| 4.4 | Financial risks | 69 | ||||||
| 4.5 | Derivative financial instruments | 71 | ||||||
| 4.6 | Borrowings | 72 | ||||||
| 4.7 | Cash and cash equivalents | 73 | ||||||
| 4.8 | Cash flow statement specifications | 73 | ||||||
| 4.9 | Financial assets and liabilities | 74 | ||||||
| 4.10 | Financial income and expenses | 75 | ||||||
| Section 5 | ||||||||
| Other disclosures | ||||||||
| 5.1 | Share-based payment schemes | 76 | ||||||
| 5.2 | Commitments | 78 | ||||||
| 5.3 | Acquisition of businesses | 78 | ||||||
| 5.4 | Related party transactions | 79 | ||||||
| 5.5 | Fees to statutory auditors | 79 | ||||||
| 5.6 | General accounting policies | 80 | ||||||
| 5.7 | Companies in the Novo Nordisk Group | 81 | ||||||
| Part of the Management review (not audited) | ||||||||
| Financial definitions | 82 | |||||||
| Non-IFRS financial measures | 83 | |||||||
| Consolidated ESG statement | ||||||||
| Statement of ESG performance | 86 | |||||||
| Notes to the consolidated ESG statement | ||||||||
| Section 6 | ||||||||
| Basis of preparation | 87 | |||||||
| Section 7 | ||||||||
| Environmental performance | ||||||||
| 7.1 | Energy consumption for operations and share of renewable power for production sites | 88 | ||||||
| 7.2 | Scope 1, 2 and 3 emissions | 88 | ||||||
| 7.3 | Water consumption for production sites | 89 | ||||||
| 7.4 | Waste from production sites | 89 | ||||||
| 7.5 | Breaches of environmental regulatory limit values | 90 | ||||||
| Section 8 | ||||||||
| Social performance | ||||||||
| 8.1 | Patients reached with Novo Nordisk's Diabetes and Obesity care products | 90 | ||||||
| 8.2 | Employees | 90 | ||||||
| 8.3 | Gender diversity in leadership positions | 91 | ||||||
| 8.4 | Sustainable employer score | 91 | ||||||
| 8.5 | Health and safety | 91 | ||||||
| 8.6 | US pricing | 92 | ||||||
| 8.7 | Total tax contribution | 92 | ||||||
| 8.8 | Donations and other contributions | 92 | ||||||
| Section 9 | ||||||||
| Governance performance | ||||||||
| 9.1 | Business ethics reviews and training | 93 | ||||||
| 9.2 | Compliance Hotline | 93 | ||||||
| 9.3 | Supplier audits | 93 | ||||||
| 9.4 | Product recalls | 93 | ||||||
| 9.5 | Failed inspections | 93 | ||||||
| 9.6 | Facilitations of the Novo Nordisk Way | 94 | ||||||
| 9.7 | Company reputation | 94 | ||||||
| 9.8 | Animals purchased for research | 94 | ||||||
| Novo Nordisk Annual Report 2023 | Introducing Novo Nordisk Strategic Aspirations Risks Management Consolidated statements Additional information | 50 | ||||||||
| DKK million | Note | 2023 | 2022 | 2021 | ||||||||||||||||
| Income statement | ||||||||||||||||||||
| Net sales | 2.1, 2.2 | |||||||||||||||||||
| Cost of goods sold | 2.2 | ( | ( | ( | ||||||||||||||||
| Gross profit | ||||||||||||||||||||
| Sales and distribution costs | 2.2 | ( | ( | ( | ||||||||||||||||
| Research and development costs | 2.2, 2.3 | ( | ( | ( | ||||||||||||||||
| Administrative costs | 2.2 | ( | ( | ( | ||||||||||||||||
| Other operating income and expenses | 2.2, 2.5 | |||||||||||||||||||
| Operating profit | ||||||||||||||||||||
| Financial income | 4.10 | |||||||||||||||||||
| Financial expenses | 4.10 | ( | ( | ( | ||||||||||||||||
| Profit before income taxes | ||||||||||||||||||||
| Income taxes | 2.6 | ( | ( | ( | ||||||||||||||||
| Net profit | ||||||||||||||||||||
| Earnings per share | ||||||||||||||||||||
| Basic earnings per share (DKK) | 4.1 | |||||||||||||||||||
| Diluted earnings per share (DKK) | 4.1 | |||||||||||||||||||
| DKK million | Note | 2023 | 2022 | 2021 | ||||||||||||||||
| Statement of comprehensive income | ||||||||||||||||||||
| Net profit | ||||||||||||||||||||
| Other comprehensive income: | ||||||||||||||||||||
| Remeasurements of retirement benefit obligations | ||||||||||||||||||||
| Items that will not be reclassified subsequently to the income statement | ||||||||||||||||||||
| Exchange rate adjustments of investments in subsidiaries | 4.3 | ( | ||||||||||||||||||
| Cash flow hedges: | ||||||||||||||||||||
| Realisation of previously deferred (gains)/losses | 4.3, 4.5 | ( | ( | |||||||||||||||||
| Deferred gains/(losses) incurred during the period | 4.3, 4.5 | ( | ||||||||||||||||||
| Other items | 4.3 | ( | ||||||||||||||||||
| Income tax related to these items | 2.6, 4.3 | ( | ( | |||||||||||||||||
| Items that will be reclassified subsequently to the income statement | ( | ( | ||||||||||||||||||
| Other comprehensive income | ( | ( | ||||||||||||||||||
| Total comprehensive income | ||||||||||||||||||||
| Novo Nordisk Annual Report 2023 | Introducing Novo Nordisk Strategic Aspirations Risks Management Consolidated statements Additional information | 51 | ||||||||
| DKK million | Note | 2023 | 2022 | 2021 | ||||||||||||||||
| Cash flow statement | ||||||||||||||||||||
| Net profit | ||||||||||||||||||||
| Adjustment of non-cash items: | ||||||||||||||||||||
| Income taxes in the income statement | 2.6 | |||||||||||||||||||
| Depreciation, amortisation and impairment losses | 3.1, 3.2 | |||||||||||||||||||
| Other non-cash items | 4.8 | |||||||||||||||||||
| Change in working capital | 4.8 | ( | ( | ( | ||||||||||||||||
| Interest received | ||||||||||||||||||||
| Interest paid | ( | ( | ( | |||||||||||||||||
| Income taxes paid | 2.6 | ( | ( | ( | ||||||||||||||||
| Net cash generated from operating activities | ||||||||||||||||||||
| Purchase of intangible assets | 3.1 | ( | ( | ( | ||||||||||||||||
| Purchase of property, plant and equipment | 3.2 | ( | ( | ( | ||||||||||||||||
| Cash used for acquisition of businesses | 5.3 | ( | ( | |||||||||||||||||
| Proceeds from other financial assets | ||||||||||||||||||||
| Purchase of other financial assets | ( | ( | ( | |||||||||||||||||
| Purchase of marketable securities | ( | ( | ( | |||||||||||||||||
| Sale of marketable securities | ||||||||||||||||||||
| Dividend received from associated companies | 5.4 | |||||||||||||||||||
| Net cash used in investing activities | ( | ( | ( | |||||||||||||||||
| DKK million | Note | 2023 | 2022 | 2021 | ||||||||||||||||
| Purchase of treasury shares | 4.3 | ( | ( | ( | ||||||||||||||||
| Dividends paid | 4.2 | ( | ( | ( | ||||||||||||||||
| Proceeds from borrowings | 4.6 | |||||||||||||||||||
| Repayment of borrowings | 4.6 | ( | ( | ( | ||||||||||||||||
| Net cash used in financing activities | ( | ( | ( | |||||||||||||||||
| Net cash generated from activities | ( | |||||||||||||||||||
| Cash and cash equivalents at the beginning of the year | ||||||||||||||||||||
| Exchange gains/(losses) on cash and cash equivalents | ( | ( | ||||||||||||||||||
| Cash and cash equivalents at the end of the year | 4.7 | |||||||||||||||||||
| Novo Nordisk Annual Report 2023 | Introducing Novo Nordisk Strategic Aspirations Risks Management Consolidated statements Additional information | 52 | ||||||||
| DKK million | Note | 2023 | 2022 | ||||||||||||||
| Assets | |||||||||||||||||
| Intangible assets | 3.1 | ||||||||||||||||
| Property, plant and equipment | 3.2 | ||||||||||||||||
| Investments in associated companies | |||||||||||||||||
| Deferred income tax assets | 2.6 | ||||||||||||||||
| Other receivables and prepayments | |||||||||||||||||
| Other financial assets | |||||||||||||||||
| Total non-current assets | |||||||||||||||||
| Inventories | 3.3 | ||||||||||||||||
| Trade receivables | 3.4 | ||||||||||||||||
| Tax receivables | |||||||||||||||||
| Other receivables and prepayments | |||||||||||||||||
| Marketable securities | 4.4 | ||||||||||||||||
| Derivative financial instruments | 4.5 | ||||||||||||||||
| Cash at bank | 4.7 | ||||||||||||||||
| Total current assets | |||||||||||||||||
| Total assets | |||||||||||||||||
| DKK million | Note | 2023 | 2022 | ||||||||||||||
| Equity and liabilities | |||||||||||||||||
| Share capital | 4.3 | ||||||||||||||||
| Treasury shares | 4.3 | ( | ( | ||||||||||||||
| Retained earnings | |||||||||||||||||
| Other reserves | 4.3 | ||||||||||||||||
| Total equity | |||||||||||||||||
| Borrowings | 4.6 | ||||||||||||||||
| Deferred income tax liabilities | 2.6 | ||||||||||||||||
| Retirement benefit obligations | |||||||||||||||||
| Other liabilities | |||||||||||||||||
| Provisions | 3.5 | ||||||||||||||||
| Total non-current liabilities | |||||||||||||||||
| Borrowings | 4.6 | ||||||||||||||||
| Trade payables | |||||||||||||||||
| Tax payables | |||||||||||||||||
| Other liabilities | |||||||||||||||||
| Derivative financial instruments | 4.5 | ||||||||||||||||
| Provisions | 3.5 | ||||||||||||||||
| Total current liabilities | |||||||||||||||||
| Total liabilities | |||||||||||||||||
| Total equity and liabilities | |||||||||||||||||
| Novo Nordisk Annual Report 2023 | Introducing Novo Nordisk Strategic Aspirations Risks Management Consolidated statements Additional information | 53 | ||||||||
| 2023 | 2022 | 2021 | ||||||||||||||||||||||||||||||||||||||||||||||||||||||||||||
| DKK million | Share capital | Treasury shares | Retained earnings | Other reserves | Total | Share capital | Treasury shares | Retained earnings | Other reserves | Total | Share capital | Treasury shares | Retained earnings | Other reserves | Total | |||||||||||||||||||||||||||||||||||||||||||||||
| Balance at the beginning of the year | ( | ( | ( | ( | ( | |||||||||||||||||||||||||||||||||||||||||||||||||||||||||
| Net profit | ||||||||||||||||||||||||||||||||||||||||||||||||||||||||||||||
| Other comprehensive income | ( | ( | ( | ( | ||||||||||||||||||||||||||||||||||||||||||||||||||||||||||
| Total comprehensive income | ( | ( | ||||||||||||||||||||||||||||||||||||||||||||||||||||||||||||
Transfer of cash flow hedge reserve to intangible assets (note 4.3) | — | |||||||||||||||||||||||||||||||||||||||||||||||||||||||||||||
| Transactions with owners: | ||||||||||||||||||||||||||||||||||||||||||||||||||||||||||||||
Dividends (note 4.2) | ( | ( | ( | ( | ( | ( | ||||||||||||||||||||||||||||||||||||||||||||||||||||||||
Share-based payments (note 5.1) | ||||||||||||||||||||||||||||||||||||||||||||||||||||||||||||||
Purchase of treasury shares (note 4.3) | ( | ( | ( | ( | ( | ( | ( | ( | ( | |||||||||||||||||||||||||||||||||||||||||||||||||||||
Reduction of the B share capital (note 4.3) | ( | ( | ( | |||||||||||||||||||||||||||||||||||||||||||||||||||||||||||
| Tax related to transactions with owners | ||||||||||||||||||||||||||||||||||||||||||||||||||||||||||||||
| Balance at the end of the year | ( | ( | ( | ( | ||||||||||||||||||||||||||||||||||||||||||||||||||||||||||
| Novo Nordisk Annual Report 2023 | Introducing Novo Nordisk Strategic Aspirations Risks Management Consolidated statements Additional information | 54 | ||||||||
| Key accounting estimates | Risk | Note(s) | ||||||||||||||||||
| Estimate of US sales deductions and provisions for sales rebates | High | 2.1, 3.5 | ||||||||||||||||||
| Estimate in determining the fair value of intangible assets and assessment of impairment of intangible assets | Medium | 3.1 | ||||||||||||||||||
| Estimate regarding deferred income tax assets and provision for uncertain tax positions | Medium | 2.6 | ||||||||||||||||||
| Estimate of ongoing legal disputes, litigation and investigations | Medium | 3.5 | ||||||||||||||||||
| Novo Nordisk Annual Report 2023 | Introducing Novo Nordisk Strategic Aspirations Risks Management Consolidated statements Additional information | 55 | ||||||||
| Gross-to-net sales reconciliation | |||||||||||||||||
| DKK million | 2023 | 2022 | 2021 | ||||||||||||||
| Gross sales | |||||||||||||||||
| US Managed Care and Medicare | ( | ( | ( | ||||||||||||||
| US wholesaler charge-backs | ( | ( | ( | ||||||||||||||
| US Medicaid rebates | ( | ( | ( | ||||||||||||||
| Other US discounts and sales returns | ( | ( | ( | ||||||||||||||
| Non-US rebates, discounts and sales returns | ( | ( | ( | ||||||||||||||
| Total gross-to-net sales adjustments | ( | ( | ( | ||||||||||||||
| Net sales | |||||||||||||||||
| Provisions for sales rebates | |||||||||||||||||
| DKK million | 2023 | 2022 | 2021 | ||||||||||||||
| At the beginning of the year | |||||||||||||||||
| Additional provisions, including increases to existing provisions | |||||||||||||||||
| Amount paid during the year | ( | ( | ( | ||||||||||||||
| Adjustments, including unused amounts reversed during the year | ( | ( | ( | ||||||||||||||
| Effect of exchange rate adjustment | ( | ||||||||||||||||
| At the end of the year | |||||||||||||||||
| Novo Nordisk Annual Report 2023 | Introducing Novo Nordisk Strategic Aspirations Risks Management Consolidated statements Additional information | 56 | ||||||||
| Business segments – Key figures | |||||||||||||||||||||||||||||||||||||||||||||||
| Diabetes and Obesity care | Rare disease | Total | |||||||||||||||||||||||||||||||||||||||||||||
| DKK million | 2023 | 2022 | 2021 | 2023 | 2022 | 2021 | 2023 | 2022 | 2021 | ||||||||||||||||||||||||||||||||||||||
| Net sales | |||||||||||||||||||||||||||||||||||||||||||||||
| Cost of goods sold | ( | ( | ( | ( | ( | ( | ( | ( | ( | ||||||||||||||||||||||||||||||||||||||
| Sales and distribution costs | ( | ( | ( | ( | ( | ( | ( | ( | ( | ||||||||||||||||||||||||||||||||||||||
| Research and development costs | ( | ( | ( | ( | ( | ( | ( | ( | ( | ||||||||||||||||||||||||||||||||||||||
| Administrative costs | ( | ( | ( | ( | ( | ( | ( | ( | ( | ||||||||||||||||||||||||||||||||||||||
| Other operating income and expenses | ( | ||||||||||||||||||||||||||||||||||||||||||||||
| Segment operating profit | |||||||||||||||||||||||||||||||||||||||||||||||
| Operating margin | % | % | % | % | % | % | % | % | % | ||||||||||||||||||||||||||||||||||||||
| Depreciation, amortisation and impairment losses expensed | ( | ( | ( | ( | ( | ( | ( | ( | ( | ||||||||||||||||||||||||||||||||||||||
| Novo Nordisk Annual Report 2023 | Introducing Novo Nordisk Strategic Aspirations Risks Management Consolidated statements Additional information | 57 | ||||||||
| Net sales – Business segments and geographical areas | |||||||||||||||||||||||||||||||||||||||||||||||||||||||||||||||||
| Total International Operations | Total North America Operations | Total Novo Nordisk net sales | |||||||||||||||||||||||||||||||||||||||||||||||||||||||||||||||
| Total IO | EMEA | China | Rest of World | Total NAO | US | ||||||||||||||||||||||||||||||||||||||||||||||||||||||||||||
| DKK million | 2023 | 2022 | 2021 | 2023 | 2022 | 2021 | 2023 | 2022 | 2021 | 2023 | 2022 | 2021 | 2023 | 2022 | 2021 | 2023 | 2022 | 2021 | 2023 | 2022 | 2021 | ||||||||||||||||||||||||||||||||||||||||||||
| Diabetes and Obesity care segment: | |||||||||||||||||||||||||||||||||||||||||||||||||||||||||||||||||
Rybelsus® | |||||||||||||||||||||||||||||||||||||||||||||||||||||||||||||||||
Ozempic® | |||||||||||||||||||||||||||||||||||||||||||||||||||||||||||||||||
Victoza® | |||||||||||||||||||||||||||||||||||||||||||||||||||||||||||||||||
| Total GLP-1 | |||||||||||||||||||||||||||||||||||||||||||||||||||||||||||||||||
| Long-acting insulin | |||||||||||||||||||||||||||||||||||||||||||||||||||||||||||||||||
•of which Tresiba® | |||||||||||||||||||||||||||||||||||||||||||||||||||||||||||||||||
•of which Xultophy® | |||||||||||||||||||||||||||||||||||||||||||||||||||||||||||||||||
•of which Levemir® | |||||||||||||||||||||||||||||||||||||||||||||||||||||||||||||||||
| Premix insulin | |||||||||||||||||||||||||||||||||||||||||||||||||||||||||||||||||
•of which Ryzodeg® | |||||||||||||||||||||||||||||||||||||||||||||||||||||||||||||||||
•of which NovoMix® | |||||||||||||||||||||||||||||||||||||||||||||||||||||||||||||||||
| Fast-acting insulin | |||||||||||||||||||||||||||||||||||||||||||||||||||||||||||||||||
•of which Fiasp® | |||||||||||||||||||||||||||||||||||||||||||||||||||||||||||||||||
•of which NovoRapid® | |||||||||||||||||||||||||||||||||||||||||||||||||||||||||||||||||
| Human insulin | |||||||||||||||||||||||||||||||||||||||||||||||||||||||||||||||||
| Total insulin | |||||||||||||||||||||||||||||||||||||||||||||||||||||||||||||||||
| Other Diabetes care | |||||||||||||||||||||||||||||||||||||||||||||||||||||||||||||||||
| Total Diabetes care | |||||||||||||||||||||||||||||||||||||||||||||||||||||||||||||||||
Wegovy® | |||||||||||||||||||||||||||||||||||||||||||||||||||||||||||||||||
Saxenda® | |||||||||||||||||||||||||||||||||||||||||||||||||||||||||||||||||
| Total Obesity care | |||||||||||||||||||||||||||||||||||||||||||||||||||||||||||||||||
| Diabetes and Obesity care total | |||||||||||||||||||||||||||||||||||||||||||||||||||||||||||||||||
Rare disease segment: | |||||||||||||||||||||||||||||||||||||||||||||||||||||||||||||||||
| Rare blood disorders | |||||||||||||||||||||||||||||||||||||||||||||||||||||||||||||||||
•of which Haemophilia A | |||||||||||||||||||||||||||||||||||||||||||||||||||||||||||||||||
•of which Haemophilia B | |||||||||||||||||||||||||||||||||||||||||||||||||||||||||||||||||
•of which NovoSeven® | |||||||||||||||||||||||||||||||||||||||||||||||||||||||||||||||||
| Rare endocrine disorders | |||||||||||||||||||||||||||||||||||||||||||||||||||||||||||||||||
| Other Rare disease | |||||||||||||||||||||||||||||||||||||||||||||||||||||||||||||||||
| Rare disease total | |||||||||||||||||||||||||||||||||||||||||||||||||||||||||||||||||
| Total sales by geographical area | |||||||||||||||||||||||||||||||||||||||||||||||||||||||||||||||||
| Total sales growth as reported | % | % | % | % | % | % | % | % | % | % | % | % | % | % | % | % | % | % | % | % | % | ||||||||||||||||||||||||||||||||||||||||||||
| Novo Nordisk Annual Report 2023 | Introducing Novo Nordisk Strategic Aspirations Risks Management Consolidated statements Additional information | 58 | ||||||||
| DKK million | 2023 | 2022 | 2021 | ||||||||||||||
Employee costs (note 2.4) | |||||||||||||||||
Amortisation and impairment losses, intangible assets (note 3.1) | |||||||||||||||||
Depreciation and impairment losses, property, plant and equipment (note 3.2) | |||||||||||||||||
| Clinical trial cost | |||||||||||||||||
| Other research and development costs | |||||||||||||||||
| Total research and development costs | |||||||||||||||||
| As percentage of net sales | % | % | % | ||||||||||||||
| DKK million | 2023 | 2022 | 2021 | |||||||||||
| Wages and salaries | ||||||||||||||
Share-based payment costs (note 5.1) | ||||||||||||||
| Pensions – defined contribution plans | ||||||||||||||
| Pensions – defined benefit plans | ||||||||||||||
| Other social security contributions | ||||||||||||||
| Other employee costs | ||||||||||||||
| Total employee costs for the year | ||||||||||||||
| Employee costs capitalised as intangible assets and property, plant and equipment | ( | ( | ( | |||||||||||
| Change in employee costs capitalised as inventories | ( | ( | ( | |||||||||||
| Total employee costs in the income statement | ||||||||||||||
| Included in the income statement: | ||||||||||||||
| Cost of goods sold | ||||||||||||||
| Sales and distribution costs | ||||||||||||||
| Research and development costs | ||||||||||||||
| Administrative costs | ||||||||||||||
| Other operating income and expenses | ||||||||||||||
| Total employee costs in the income statement | ||||||||||||||
| Number | 2023 | 2022 | 2021 | ||||||||||||||
| Average number of full-time employees | |||||||||||||||||
| Year-end number of full-time employees | |||||||||||||||||
| Year-end employees (total) | |||||||||||||||||
| Novo Nordisk Annual Report 2023 | Introducing Novo Nordisk Strategic Aspirations Risks Management Consolidated statements Additional information | 59 | ||||||||
| Remuneration to Executive Management and Board of Directors | |||||||||||||||||
| DKK million | 2023 | 2022 | 2021 | ||||||||||||||
| Salary and short-term incentive | |||||||||||||||||
| Pension | |||||||||||||||||
| Benefits | |||||||||||||||||
Long-term incentive1 | |||||||||||||||||
| Severance payments | |||||||||||||||||
Executive Management in total2 | |||||||||||||||||
Fees to Board of Directors3 | |||||||||||||||||
| Total | |||||||||||||||||
1. Refer to note 5.1 for further information on share-based payment schemes. 2. Total remuneration for persons registered as members of Executive Management with the Danish Business Authority amounts to DKK | |||||||||||||||||
| Income taxes expensed | ||||||||||||||
| DKK million | 2023 | 2022 | 2021 | |||||||||||
| Current tax on profit for the year | ||||||||||||||
| Deferred tax on profit for the year | ( | ( | ( | |||||||||||
| Tax on profit for the year | ||||||||||||||
| Current tax adjustments recognised for prior years | ( | ( | ||||||||||||
| Deferred tax adjustments recognised for prior years | ( | ( | ||||||||||||
| Income taxes in the income statement | ||||||||||||||
| Tax on other comprehensive income for the year, (income)/expense | ( | |||||||||||||
| Computation of effective tax rate | ||||||||||||||||||||
| DKK million | 2023 | 2022 | 2021 | |||||||||||||||||
| Statutory corporate income tax rate in Denmark | % | % | % | |||||||||||||||||
| Deviation in foreign subsidiaries' tax rates compared to the Danish tax rate (net) | ( | %) | ( | %) | ( | %) | ||||||||||||||
| Non-taxable income less non-tax-deductible expenses (net) | ( | %) | ( | %) | ( | %) | ||||||||||||||
| Other adjustments (net) | ( | %) | ( | %) | ( | %) | ||||||||||||||
| Effective tax rate | % | % | % | |||||||||||||||||
| Income taxes paid | |||||||||||||||||
| DKK million | 2023 | 2022 | 2021 | ||||||||||||||
| Income taxes paid in Denmark for current year | |||||||||||||||||
| Income taxes paid outside Denmark for current year | |||||||||||||||||
| Income taxes paid/(repayments) relating to prior years | ( | ||||||||||||||||
| Income taxes paid | |||||||||||||||||
| Novo Nordisk Annual Report 2023 | Introducing Novo Nordisk Strategic Aspirations Risks Management Consolidated statements Additional information | 60 | ||||||||
| Development in deferred income tax assets and liabilities | |||||||||||||||||||||||||||||
| DKK million | Property, plant and equipment | Intangible assets | Inventories | Liabilities | Other | Offset within countries | Total | ||||||||||||||||||||||
| 2023 | |||||||||||||||||||||||||||||
| Net deferred tax asset/(liability) at the beginning of the year | ( | ( | |||||||||||||||||||||||||||
| Income/(charge) to the income statement | ( | ( | ( | — | |||||||||||||||||||||||||
| Income/(charge) to other comprehensive income | ( | ( | ( | — | ( | ||||||||||||||||||||||||
| Income/(charge) to equity | ( | — | ( | ||||||||||||||||||||||||||
| Additions from acquisitions | — | ||||||||||||||||||||||||||||
| Effect of exchange rate adjustment | ( | ( | — | ( | |||||||||||||||||||||||||
| Net deferred tax asset/(liability) at the end of the year | ( | ( | |||||||||||||||||||||||||||
| Classified as follows: | |||||||||||||||||||||||||||||
| Deferred tax asset at the end of the year | ( | ||||||||||||||||||||||||||||
| Deferred tax liability at the end of the year | ( | ( | ( | ( | ( | ( | |||||||||||||||||||||||
| 2022 | |||||||||||||||||||||||||||||
| Net deferred tax asset/(liability) at the beginning of the year | ( | ( | |||||||||||||||||||||||||||
| Income/(charge) to the income statement | ( | ( | — | ||||||||||||||||||||||||||
| Income/(charge) to other comprehensive income | ( | ( | ( | — | ( | ||||||||||||||||||||||||
| Income/(charge) to equity | — | ||||||||||||||||||||||||||||
Additions from acquisition of businesses (note 5.3)1 | ( | ( | |||||||||||||||||||||||||||
Effect of exchange rate adjustment1 | ( | ( | ( | — | |||||||||||||||||||||||||
Net deferred tax asset/(liability) at the end of the year1 | ( | ( | |||||||||||||||||||||||||||
| Classified as follows: | |||||||||||||||||||||||||||||
Deferred tax asset at the end of the year1 | ( | ||||||||||||||||||||||||||||
| Deferred tax liability at the end of the year | ( | ( | ( | ( | ( | ( | |||||||||||||||||||||||
1. Comparatives were restated to reflect change in the provisional valuation of net identifiable assets from a business combination completed in 2022. Reference is made to note 5.3. | |||||||||||||||||||||||||||||
| Novo Nordisk Annual Report 2023 | Introducing Novo Nordisk Strategic Aspirations Risks Management Consolidated statements Additional information | 61 | ||||||||
| Amortisation and impairment losses | |||||||||||||||||
| DKK million | 2023 | 2022 | 2021 | ||||||||||||||
| Cost of goods sold | |||||||||||||||||
| Sales and distribution costs | |||||||||||||||||
| Research and development costs | |||||||||||||||||
| Administrative costs | |||||||||||||||||
| Other operating income and expenses | |||||||||||||||||
| Total amortisation and impairment losses | |||||||||||||||||
| Total amortisation | |||||||||||||||||
| Total impairment losses | |||||||||||||||||
| DKK million | Goodwill | Intellectual property rights | Software and other intangibles | Total intangible assets | |||||||||||||||||||
| 2023 | |||||||||||||||||||||||
| Cost at the beginning of the year | |||||||||||||||||||||||
| Additions during the year | |||||||||||||||||||||||
| Disposals during the year | ( | ( | ( | ||||||||||||||||||||
| Effect of exchange rate adjustment | ( | ( | ( | ||||||||||||||||||||
| Cost at the end of the year | |||||||||||||||||||||||
| Amortisation and impairment losses at the beginning of the year | |||||||||||||||||||||||
| Amortisation for the year | — | ||||||||||||||||||||||
| Impairment losses for the year | |||||||||||||||||||||||
| Impairment losses reversed during the year | ( | ( | |||||||||||||||||||||
| Amortisation and impairment losses reversed on disposals during the year | ( | ( | ( | ||||||||||||||||||||
| Effect of exchange rate adjustment | ( | ||||||||||||||||||||||
| Amortisation and impairment losses at the end of the year | |||||||||||||||||||||||
| Carrying amount at the end of the year | |||||||||||||||||||||||
| 2022 | |||||||||||||||||||||||
| Cost at the beginning of the year | |||||||||||||||||||||||
Additions from acquisition of businesses (note 5.3)1 | |||||||||||||||||||||||
| Additions during the year | |||||||||||||||||||||||
| Disposals during the year | ( | ( | ( | ||||||||||||||||||||
Effect of exchange rate adjustment1 | ( | ||||||||||||||||||||||
Cost at the end of the year1 | |||||||||||||||||||||||
| Amortisation and impairment losses at the beginning of the year | |||||||||||||||||||||||
| Amortisation for the year | — | ||||||||||||||||||||||
| Impairment losses for the year | |||||||||||||||||||||||
| Amortisation and impairment losses reversed on disposals during the year | ( | ( | ( | ||||||||||||||||||||
| Effect of exchange rate adjustment | |||||||||||||||||||||||
| Amortisation and impairment losses at the end of the year | |||||||||||||||||||||||
Carrying amount at the end of the year1 | |||||||||||||||||||||||
| 1. Comparatives were restated to reflect change in provisional valuation of net identifiable assets from a business combination completed in 2022. Reference is made to note 5.3. | |||||||||||||||||||||||
| Novo Nordisk Annual Report 2023 | Introducing Novo Nordisk Strategic Aspirations Risks Management Consolidated statements Additional information | 62 | ||||||||
| Novo Nordisk Annual Report 2023 | Introducing Novo Nordisk Strategic Aspirations Risks Management Consolidated statements Additional information | 63 | ||||||||
| DKK million | Land and buildings | Plant and machinery | Other equipment | Assets under construction | Property, plant and equipment | ||||||||||||||||||
| 2023 | |||||||||||||||||||||||
| Cost at the beginning of the year | |||||||||||||||||||||||
| Additions during the year | |||||||||||||||||||||||
| Disposals during the year | ( | ( | ( | ( | ( | ||||||||||||||||||
| Transfer and reclassifications | ( | ||||||||||||||||||||||
| Effect of exchange rate adjustment | ( | ( | ( | ( | ( | ||||||||||||||||||
| Cost at the end of the year | |||||||||||||||||||||||
| Depreciation and impairment losses at the beginning of the year | |||||||||||||||||||||||
| Depreciation for the year | |||||||||||||||||||||||
| Impairment losses for the year | |||||||||||||||||||||||
| Depreciation and impairment losses reversed on disposals during the year | ( | ( | ( | ( | ( | ||||||||||||||||||
| Effect of exchange rate adjustment | ( | ( | ( | ( | |||||||||||||||||||
| Depreciation and impairment losses at the end of the year | |||||||||||||||||||||||
| Carrying amount at the end of the year | |||||||||||||||||||||||
| 2022 | |||||||||||||||||||||||
| Cost at the beginning of the year | |||||||||||||||||||||||
Additions from acquisition of businesses (note 5.3) | |||||||||||||||||||||||
| Additions during the year | |||||||||||||||||||||||
| Disposals during the year | ( | ( | ( | ( | ( | ||||||||||||||||||
| Transfer and reclassifications | ( | ||||||||||||||||||||||
| Effect of exchange rate adjustment | ( | ||||||||||||||||||||||
| Cost at the end of the year | |||||||||||||||||||||||
| Depreciation and impairment losses at the beginning of the year | |||||||||||||||||||||||
| Depreciation for the year | |||||||||||||||||||||||
| Impairment losses for the year | |||||||||||||||||||||||
| Depreciation and impairment losses reversed on disposals during the year | ( | ( | ( | ( | ( | ||||||||||||||||||
| Effect of exchange rate adjustment | |||||||||||||||||||||||
| Depreciation and impairment losses at the end of the year | |||||||||||||||||||||||
| Carrying amount at the end of the year | |||||||||||||||||||||||
| Novo Nordisk Annual Report 2023 | Introducing Novo Nordisk Strategic Aspirations Risks Management Consolidated statements Additional information | 64 | ||||||||
| Depreciation and impairment losses | |||||||||||||||||
| DKK million | 2023 | 2022 | 2021 | ||||||||||||||
| Cost of goods sold | |||||||||||||||||
| Sales and distribution costs | |||||||||||||||||
| Research and development costs | |||||||||||||||||
| Administrative costs | |||||||||||||||||
| Other operating income and expenses | |||||||||||||||||
| Total depreciation and impairment losses | |||||||||||||||||
| Of which related to leased assets | |||||||||||||||||
| Leased property, plant and equipment | |||||||||||
| DKK million | 2023 | 2022 | |||||||||
| Land and buildings | |||||||||||
| Other equipment | |||||||||||
| Total | |||||||||||
| DKK million | 2023 | 2022 | ||||||||||||
| Raw materials | ||||||||||||||
| Work in progress | ||||||||||||||
| Finished goods | ||||||||||||||
| Total inventories (gross) | ||||||||||||||
| Write-downs at year-end | ( | ( | ||||||||||||
| Total inventories (net) | ||||||||||||||
| Indirect production costs included in work in progress and finished goods | ||||||||||||||
| Share of total inventories (net) | % | % | ||||||||||||
| Movements in inventory write-downs: | ||||||||||||||
| Write-downs at the beginning of the year | ||||||||||||||
| Write-downs during the year | ||||||||||||||
| Utilisation of write-downs | ( | ( | ||||||||||||
| Reversal of write-downs | ( | ( | ||||||||||||
| Write-downs at the end of the year | ||||||||||||||
| Novo Nordisk Annual Report 2023 | Introducing Novo Nordisk Strategic Aspirations Risks Management Consolidated statements Additional information | 65 | ||||||||
| DKK million | Gross carrying amount | Loss allowance | Net carrying amount | ||||||||||||||
| 2023 | |||||||||||||||||
| Not yet due | ( | ||||||||||||||||
| 1-90 days | ( | ||||||||||||||||
| 91-180 days | ( | ||||||||||||||||
| 181-270 days | ( | ||||||||||||||||
| 271-360 days | ( | ||||||||||||||||
| More than 360 days past due | ( | ||||||||||||||||
| Trade receivables | ( | ||||||||||||||||
| EMEA | ( | ||||||||||||||||
| China | ( | ||||||||||||||||
| Rest of World | ( | ||||||||||||||||
| North America Operations | ( | ||||||||||||||||
| Trade receivables | ( | ||||||||||||||||
| 2022 | |||||||||||||||||
| Not yet due | ( | ||||||||||||||||
| 1-90 days | ( | ||||||||||||||||
| 91-180 days | ( | ||||||||||||||||
| 181-270 days | ( | ||||||||||||||||
| 271-360 days | ( | ||||||||||||||||
| More than 360 days past due | ( | ||||||||||||||||
| Trade receivables | ( | ||||||||||||||||
| EMEA | ( | ||||||||||||||||
| China | |||||||||||||||||
| Rest of World | ( | ||||||||||||||||
| North America Operations | ( | ||||||||||||||||
| Trade receivables | ( | ||||||||||||||||
| Movements in allowance for doubtful trade receivables | ||||||||||||||
| DKK million | 2023 | 2022 | ||||||||||||
| Carrying amount at the beginning of the year | ||||||||||||||
| Reversal of allowance on realised losses | ( | ( | ||||||||||||
| Net movement recognised in income statement | ||||||||||||||
| Effect of exchange rate adjustment | ( | ( | ||||||||||||
| Allowance at the end of the year | ||||||||||||||
| Novo Nordisk Annual Report 2023 | Introducing Novo Nordisk Strategic Aspirations Risks Management Consolidated statements Additional information | 66 | ||||||||
| DKK million | Provisions for sales rebates1 | Provisions for legal disputes | Provisions for product returns | Other provisions2 | 2023 Total | 2022 Total | ||||||||||||||||||||
| At the beginning of the year | ||||||||||||||||||||||||||
| Additional provisions, including increases to existing provisions | ||||||||||||||||||||||||||
| Amount used during the year | ( | ( | ( | ( | ( | ( | ||||||||||||||||||||
| Adjustments, including unused amounts reversed during the year | ( | ( | ( | ( | ( | |||||||||||||||||||||
| Effect of exchange rate adjustment | ( | ( | ( | ( | ||||||||||||||||||||||
| At the end of the year | ||||||||||||||||||||||||||
Non-current liabilities3 | ||||||||||||||||||||||||||
| Current liabilities | ||||||||||||||||||||||||||
1. Provisions for sales rebates are related to US Managed Care, Medicare, Medicaid, 340B Drug Pricing Program and other types of US rebates, as well as rebates in a number of European countries and Canada. 2. Other provisions consists of various types of provisions, including obligations in relation to employee benefits such as jubilee benefits. 3. For non-current liabilities, provisions for sales rebates are expected to be settled after one year, provisions for product returns will be utilised in 2024 and 2025. In the case of provisions for legal disputes, the timing of settlement cannot be determined. | ||||||||||||||||||||||||||
| Novo Nordisk Annual Report 2023 | Introducing Novo Nordisk Strategic Aspirations Risks Management Consolidated statements Additional information | 67 | ||||||||
| Novo Nordisk Annual Report 2023 | Introducing Novo Nordisk Strategic Aspirations Risks Management Consolidated statements Additional information | 68 | ||||||||
| 2023 | 2022 | 2021 | ||||||||||||||||||
| Net profit | DKK million | |||||||||||||||||||
Average number of shares outstanding1 | in million shares | |||||||||||||||||||
| Dilutive effect of average outstanding share pool | in million shares | |||||||||||||||||||
| Average number of shares outstanding, including dilutive effect of outstanding share pool | in million shares | |||||||||||||||||||
| Basic earnings per share | DKK | |||||||||||||||||||
| Diluted earnings per share | DKK | |||||||||||||||||||
1. Excluding treasury shares. For further information on the development in treasury shares, refer to note 4.3. | ||||||||||||||||||||
| DKK million | 2023 | 2022 | 2021 | |||||||||||
| Interim dividend for the year | ||||||||||||||
| Dividend for prior year | ||||||||||||||
| Share repurchases for the year | ||||||||||||||
| Total distribution for the year | ||||||||||||||
| DKK million | A shares | B shares | Total | |||||||||||
| Shares beginning of 2022 | ||||||||||||||
| Shares cancelled in 2022 | ( | ( | ||||||||||||
| Outstanding shares end of 2022 | ||||||||||||||
| Shares cancelled in 2023 | ( | ( | ||||||||||||
| Outstanding shares end of 2023 | ||||||||||||||
| Treasury shares | 2023 | 2022 | ||||||||||||||||||
| Market value (DKK million) | Number of B shares of DKK 0.10 (million) | Number of B shares of DKK 0.10 (million) | ||||||||||||||||||
| Holding at the beginning of the year | ||||||||||||||||||||
| Cancellation of treasury shares | ( | ( | ( | |||||||||||||||||
| Released allocated shares to employees | ( | ( | ( | |||||||||||||||||
| Purchase during the year | ||||||||||||||||||||
| Value adjustment | ||||||||||||||||||||
| Holding at the end of the year | ||||||||||||||||||||
| Novo Nordisk Annual Report 2023 | Introducing Novo Nordisk Strategic Aspirations Risks Management Consolidated statements Additional information | 69 | ||||||||
| Specification of Other reserves | |||||||||||||||||
| DKK million | Exchange rate adjustments | Cash flow hedges1 | Tax and other items | Total | |||||||||||||
| 2021 | |||||||||||||||||
| Reserve at the beginning of the year | ( | ( | ( | ||||||||||||||
| Other comprehensive income, net | ( | ( | |||||||||||||||
| Transferred to intangible assets | ( | ||||||||||||||||
| Reserve at the end of the year | ( | ( | ( | ||||||||||||||
| 2022 | |||||||||||||||||
| Other comprehensive income, net | ( | ||||||||||||||||
| Reserve at the end of the year | |||||||||||||||||
| 2023 | |||||||||||||||||
| Other comprehensive income, net | ( | ( | ( | ||||||||||||||
| Reserve at the end of the year | ( | ( | |||||||||||||||
1. For information on derivatives refer to note 4.5. | |||||||||||||||||
| Type | Financial risk | ||||
| Foreign exchange risk | High | ||||
| Credit risk | Low | ||||
| Interest rate risk | Low | ||||
| Liquidity risk | Low | ||||
| Key currencies | |||||||||||||||||
| USD | CNY | CAD | JPY | GBP | |||||||||||||
| Average exchange rate applied (DKK per 100) | |||||||||||||||||
| 2023 | |||||||||||||||||
| 2022 | |||||||||||||||||
| 2021 | |||||||||||||||||
| Year-end exchange rate applied (DKK per 100) | |||||||||||||||||
| 2023 | |||||||||||||||||
| 2022 | |||||||||||||||||
| 2021 | |||||||||||||||||
Sensitivity on operating profit of an immediate 5% decrease in key currencies1 | |||||||||||||||||
| DKK million | USD | CNY | CAD | JPY | GBP | ||||||||||||
| 2024 | ( | ( | ( | ( | ( | ||||||||||||
| 2023 | ( | ( | ( | ( | ( | ||||||||||||
1. An immediate | |||||||||||||||||
| Novo Nordisk Annual Report 2023 | Introducing Novo Nordisk Strategic Aspirations Risks Management Consolidated statements Additional information | 70 | ||||||||
Sensitivity of an immediate 5% decrease in currency rates on 31 December versus DKK2 | |||||||||||
| DKK million | 2023 | 2022 | |||||||||
| Sensitivity of all currencies | |||||||||||
| Income statement | ( | ( | |||||||||
| Other comprehensive income | |||||||||||
| Total | |||||||||||
| Hereof sensitivity of USD | |||||||||||
| Income statement | |||||||||||
| Other comprehensive income | |||||||||||
| Total | |||||||||||
2. An immediate | |||||||||||
| Financial contracts coverage at year end | |||||||||||||||||
| Months | USD | CNY3 | CAD | JPY | GBP | ||||||||||||
| 2023 | |||||||||||||||||
| 2022 | |||||||||||||||||
| 3. Chinese yuan traded offshore (CNH) is used to hedge Novo Nordisk's CNY currency exposure. | |||||||||||||||||
| Credit exposure for cash at bank, marketable securities and derivative financial instruments (fair value) | |||||||||||||||||||||||
| DKK million | Cash at bank | Marketable securities | Derivative financial instruments | Total | |||||||||||||||||||
| 2023 | |||||||||||||||||||||||
| AAA range | |||||||||||||||||||||||
| AA range | |||||||||||||||||||||||
| A range | |||||||||||||||||||||||
| BBB range | |||||||||||||||||||||||
| Not rated or below BBB range | |||||||||||||||||||||||
| Total | |||||||||||||||||||||||
| 2022 | |||||||||||||||||||||||
| AAA range | |||||||||||||||||||||||
| AA range | |||||||||||||||||||||||
| A range | |||||||||||||||||||||||
| BBB range | |||||||||||||||||||||||
| Not rated or below BBB range | |||||||||||||||||||||||
| Total | |||||||||||||||||||||||
| DKK million | 2023 | 2022 | 2021 | ||||||||||||||
| US | |||||||||||||||||
| Japan | |||||||||||||||||
| Novo Nordisk Annual Report 2023 | Introducing Novo Nordisk Strategic Aspirations Risks Management Consolidated statements Additional information | 71 | ||||||||
| Financial reserves | |||||||||||||||||
| DKK million | 2023 | 2022 | 2021 | ||||||||||||||
Cash and cash equivalents (note 4.7) | |||||||||||||||||
| Marketable securities | |||||||||||||||||
Undrawn committed credit facility4 | |||||||||||||||||
Borrowings (Note 4.6) | ( | ( | ( | ||||||||||||||
| Financial reserves | |||||||||||||||||
4. The undrawn committed credit facility comprises a facility EUR | |||||||||||||||||
| 2023 | 2022 | ||||||||||||||||||||||
| DKK million | Contract amount at year-end | Positive fair value at year-end | Negative fair value at year-end | Contract amount at year-end | Positive fair value at year-end | Negative fair value at year-end | |||||||||||||||||
Forward contracts USD1 | |||||||||||||||||||||||
Forward contracts CNH, CAD and JPY2 | |||||||||||||||||||||||
| Forward contracts, cash flow hedges | |||||||||||||||||||||||
Forward contracts USD1 | |||||||||||||||||||||||
Forward contracts EUR, CNH, CAD and others2 | |||||||||||||||||||||||
| Forward contracts, fair value hedges | |||||||||||||||||||||||
| Total derivative financial instruments | |||||||||||||||||||||||
| Recognised in the income statement | |||||||||||||||||||||||
| Recognised in other comprehensive income | |||||||||||||||||||||||
1. Average hedge rate for USD cash flow hedges is | |||||||||||||||||||||||
| Novo Nordisk Annual Report 2023 | Introducing Novo Nordisk Strategic Aspirations Risks Management Consolidated statements Additional information | 72 | ||||||||
| Reconciliation of liabilities arising from financing activities | Non-cash movements | ||||||||||||||||||||||||||||
| DKK million | Beginning of the year | Re-payments | Proceeds | Additions1 | Disposals | Exchange rates | Other | End of the year | |||||||||||||||||||||
2023 | |||||||||||||||||||||||||||||
| Lease liabilities | ( | ( | ( | ||||||||||||||||||||||||||
| Issued Eurobonds | |||||||||||||||||||||||||||||
| Bank overdrafts | ( | ( | ( | ||||||||||||||||||||||||||
| Total borrowings | ( | ( | ( | ||||||||||||||||||||||||||
2022 | |||||||||||||||||||||||||||||
| Lease liabilities | ( | ( | ( | ||||||||||||||||||||||||||
| Issued Eurobonds | ( | ||||||||||||||||||||||||||||
| Loans | ( | ||||||||||||||||||||||||||||
| Bank overdrafts | ( | ||||||||||||||||||||||||||||
| Total borrowings | ( | ( | |||||||||||||||||||||||||||
1. 2022 figures include additions from acquisition of business. | |||||||||||||||||||||||||||||
| Issuance of Eurobonds | Nominal value in millions | ||||||||||
| Interest | Maturity | EUR | DKK | ||||||||
| Jun 2024 | |||||||||||
| Mar 2025 | |||||||||||
| Sep 2027 | |||||||||||
| Jun 2028 | |||||||||||
| Mar 2030 | |||||||||||
| Novo Nordisk Annual Report 2023 | Introducing Novo Nordisk Strategic Aspirations Risks Management Consolidated statements Additional information | 73 | ||||||||
| Contractual undiscounted cash flows | 2023 | |||||||||||||
| DKK million | Leases | Issued Eurobonds | Bank overdrafts | Total | ||||||||||
2023 | ||||||||||||||
| Within 1 year | ||||||||||||||
| 1-3 years | ||||||||||||||
| 3-5 years | ||||||||||||||
| More than 5 years | ||||||||||||||
| Total | ||||||||||||||
| Carrying amount end of the year | ||||||||||||||
| Non-current liabilities | ||||||||||||||
| Current liabilities | ||||||||||||||
2022 | ||||||||||||||
| Within 1 year | ||||||||||||||
| 1-3 years | ||||||||||||||
| 3-5 years | ||||||||||||||
| More than 5 years | ||||||||||||||
| Total | ||||||||||||||
| Carrying amount end of the year | ||||||||||||||
| Non-current liabilities | ||||||||||||||
| Current liabilities | ||||||||||||||
| DKK million | 2023 | 2022 | 2021 | ||||||||||||||
| Cash at bank | |||||||||||||||||
Borrowings (note 4.6) | ( | ||||||||||||||||
| Cash and cash equivalents | |||||||||||||||||
| Other non-cash items | |||||||||||||||||
| DKK million | 2023 | 2022 | 2021 | ||||||||||||||
Interest income and interest expenses, net (note 4.10) | ( | ||||||||||||||||
Capital gain/(loss) on investments, net (note 4.10) | ( | ||||||||||||||||
Result of associated companies (note 4.10) | ( | ||||||||||||||||
| Other non-current receivables and prepayments | ( | ||||||||||||||||
| Other non-current liabilities | ( | ||||||||||||||||
Share-based payment costs (note 5.1) | |||||||||||||||||
Increase/(decrease) in provisions (note 3.5) and retirement benefit obligations | |||||||||||||||||
| Other | ( | ( | |||||||||||||||
| Total other non-cash items | |||||||||||||||||
| Change in working capital | |||||||||||||||||
| DKK million | 2023 | 2022 | 2021 | ||||||||||||||
| Inventories | ( | ( | ( | ||||||||||||||
| Trade receivables | ( | ( | ( | ||||||||||||||
| Other receivables and prepayments | ( | ( | ( | ||||||||||||||
| Trade payables | |||||||||||||||||
| Other liabilities | |||||||||||||||||
| Adjustment for payables related to non-current assets | ( | ( | ( | ||||||||||||||
| Adjustment related to acquisition of businesses | ( | ( | |||||||||||||||
| Change in working capital including exchange rate adjustments | ( | ( | ( | ||||||||||||||
| Exchange rate adjustments | ( | ||||||||||||||||
| Cash flow change in working capital | ( | ( | ( | ||||||||||||||
| Novo Nordisk Annual Report 2023 | Introducing Novo Nordisk Strategic Aspirations Risks Management Consolidated statements Additional information | 74 | ||||||||
| DKK million | 2023 | 2022 | ||||||||||||
| Financial assets by category | ||||||||||||||
| Other financial assets | ||||||||||||||
| Marketable securities | ||||||||||||||
| Financial assets at fair value through the income statement | ||||||||||||||
Derivative financial instruments (note 4.5) | ||||||||||||||
| Derivatives used as hedging instruments (assets) | ||||||||||||||
| Other financial assets | ||||||||||||||
| Trade receivables | ||||||||||||||
| Other receivables and prepayments (current and non-current) | ||||||||||||||
•less prepayments and VAT receivables | ( | ( | ||||||||||||
Cash at bank (note 4.7) | ||||||||||||||
| Financial assets at amortised cost | ||||||||||||||
| Trade receivables in a factoring portfolio | ||||||||||||||
| Financial assets at fair value through other comprehensive income | ||||||||||||||
| Total financial assets at the end of the year by category | ||||||||||||||
| — | ||||||||||||||
| Financial liabilities by category | ||||||||||||||
Derivative financial instruments (note 4.5) | ||||||||||||||
| Derivatives used as hedging instruments (liability) | ||||||||||||||
Borrowings (non-current) (note 4.6)1 | ||||||||||||||
Borrowings (current) (note 4.6)1 | ||||||||||||||
| Trade payables | ||||||||||||||
| Other liabilities (non-current) | ||||||||||||||
| Other liabilities (current) | ||||||||||||||
•less VAT and duties payable | ( | ( | ||||||||||||
| Financial liabilities measured at amortised cost | ||||||||||||||
| Total financial liabilities at the end of the year by category | ||||||||||||||
1. Refer to note 4.6 for a maturity analysis for non-current and current borrowings. | ||||||||||||||
| Fair value measurement hierarchy | ||||||||||||||
| DKK million | 2023 | 2022 | ||||||||||||
| Active market data (level 1) | ||||||||||||||
| Directly or indirectly observable market data (level 2) | ||||||||||||||
| Not based on observable market data (level 3) | ||||||||||||||
| Total financial assets at fair value | ||||||||||||||
| Active market data (level 1) | ||||||||||||||
| Directly or indirectly observable market data (level 2) | ||||||||||||||
| Not based on observable market data (level 3) | ||||||||||||||
| Total financial liabilities at fair value | ||||||||||||||
| Novo Nordisk Annual Report 2023 | Introducing Novo Nordisk Strategic Aspirations Risks Management Consolidated statements Additional information | 75 | ||||||||
| DKK million | 2023 | 2022 | 2021 | ||||||||||||||
| Financial income | |||||||||||||||||
Interest income1 | |||||||||||||||||
| Foreign exchange gain (net) | |||||||||||||||||
| Financial gain from forward contracts (net) | |||||||||||||||||
| Capital gain on investments | |||||||||||||||||
| Capital gain on marketable securities | |||||||||||||||||
| Result of associated companies | |||||||||||||||||
| Total financial income | |||||||||||||||||
| Financial expenses | |||||||||||||||||
| Interest expenses on debts and borrowings | |||||||||||||||||
| Foreign exchange loss (net) | |||||||||||||||||
| Financial loss from forward contracts (net) | |||||||||||||||||
| Capital loss on investments | |||||||||||||||||
| Capital loss on marketable securities | |||||||||||||||||
| Result of associated companies | |||||||||||||||||
| Other financial expenses | |||||||||||||||||
| Total financial expenses | |||||||||||||||||
1. Interest income include DKK | |||||||||||||||||
| Financial impact from forward contracts, specified | |||||||||||||||||
| DKK million | 2023 | 2022 | 2021 | ||||||||||||||
| Income/(loss) transferred from other comprehensive income | ( | ||||||||||||||||
| Realised fair value adjustment of transferred contracts | ( | ( | |||||||||||||||
Unrealised fair value adjustments of forward contracts2 | ( | ( | |||||||||||||||
| Realised foreign exchange gain/(loss) on forward contracts | |||||||||||||||||
| Financial income/(expense) from forward contracts | ( | ||||||||||||||||
| 2. Refer to note 4.5 for information on open fair value hedge contracts at 31 December. | |||||||||||||||||
| Novo Nordisk Annual Report 2023 | Introducing Novo Nordisk Strategic Aspirations Risks Management Consolidated statements Additional information | 76 | ||||||||
| Share-based payment expensed in the income statement | ||||||||||||||
| DKK million | 2023 | 2022 | 2021 | |||||||||||
| Restricted stock units to employees | ||||||||||||||
Long-term share-based incentive programme (Management Board)1 | ||||||||||||||
| Long-term share-based incentive programme (Management group below Management Board) | ||||||||||||||
| Restricted stock units to individual employees | ||||||||||||||
| Share-based payment expensed in the income statement | ||||||||||||||
1. In 2021, Novo Nordisk introduced a new share-based compensation programme with terms, which amortises the grant date valuation over | ||||||||||||||
| Novo Nordisk Annual Report 2023 | Introducing Novo Nordisk Strategic Aspirations Risks Management Consolidated statements Additional information | 77 | ||||||||
General terms and conditions of 2020-2023 programmes1 | ||||||||||||||||||||||||||||||||||||||||||||||||||||||||
| Employees' 100 year anniversary programme | Management Board | Management group below Management Board | Individual employees | |||||||||||||||||||||||||||||||||||||||||||||||||||||
| 2023 | 2023 | 2022 | 2021 | 2020 | 2023 | 2022 | 2021 | 2020 | 2023 | 2022 | 2021 | |||||||||||||||||||||||||||||||||||||||||||||
Preliminary number of shares to be allocated2 (million) | ||||||||||||||||||||||||||||||||||||||||||||||||||||||||
| Fair value per restricted stock unit at grant date (DKK) | ||||||||||||||||||||||||||||||||||||||||||||||||||||||||
| Performance and vesting period | 2023 to 2026 | 2023 to 2025 | 2022 to 2024 | 2021 to 2023 | 2020 to 2023 | 2023 to 2025 | 2022 to 2024 | 2021 to 2023 | 2020 to 2023 | 2023 to 2026 | 2022 to 2025 | 2021 to 2024 | ||||||||||||||||||||||||||||||||||||||||||||
| Allocation date | Aug 2026 | Feb 2026 | Feb 2025 | Feb 2024 | Feb 2024 | Feb 2026 | Feb 2025 | Feb 2024 | Feb 2024 | 2026 | 2025 | 2024 | ||||||||||||||||||||||||||||||||||||||||||||
| Amortisation period | ||||||||||||||||||||||||||||||||||||||||||||||||||||||||
1. As of 13 September 2023, the trading unit of the Novo Nordisk B shares listed on NASDAQ Copenhagen and ADRs listed on the New York Stock Exchange (NYSE) was changed from DKK | ||||||||||||||||||||||||||||||||||||||||||||||||||||||||
| Novo Nordisk Annual Report 2023 | Introducing Novo Nordisk Strategic Aspirations Risks Management Consolidated statements Additional information | 78 | ||||||||
Contractual obligations not recognised in the balance sheet | |||||||||||||||||
| DKK million (undiscounted) | Current | Non-current | Total | ||||||||||||||
| 2023 | |||||||||||||||||
Leases1 | |||||||||||||||||
| Research and development obligations | |||||||||||||||||
Research and development – potential milestone payments2 | |||||||||||||||||
Commercial product launch – potential milestone payments2 | |||||||||||||||||
| Purchase obligations relating to investments in property, plant and equipment | |||||||||||||||||
| Purchase obligations relating to contract manufacturers | |||||||||||||||||
| Other purchase obligations | |||||||||||||||||
| Total obligations not recognised in the balance sheet | |||||||||||||||||
| 2022 | |||||||||||||||||
Leases1 | |||||||||||||||||
| Research and development obligations | |||||||||||||||||
Research and development – potential milestone payments2 | |||||||||||||||||
Commercial product launch – potential milestone payments2 | |||||||||||||||||
| Purchase obligations relating to investments in property, plant and equipment | |||||||||||||||||
| Purchase obligations relating to contract manufacturers | |||||||||||||||||
| Other purchase obligations | |||||||||||||||||
| Total obligations not recognised in the balance sheet | |||||||||||||||||
| Fair value recognised at date of acquisition | |||||||||||
| 2022 | |||||||||||
| DKK million | Forma Therapeutics | ||||||||||
| Intellectual property rights | |||||||||||
| Other intangible assets | |||||||||||
| Financial assets | |||||||||||
| Marketable securities | |||||||||||
| Cash | |||||||||||
| Deferred tax assets (liabilities), net | ( | ||||||||||
| Other net assets | ( | ||||||||||
| Net identifiable assets acquired | |||||||||||
| Goodwill | |||||||||||
| Consideration transferred | |||||||||||
| Cash acquired | ( | ||||||||||
| Cash used for acquisition of businesses | |||||||||||
| Novo Nordisk Annual Report 2023 | Introducing Novo Nordisk Strategic Aspirations Risks Management Consolidated statements Additional information | 79 | ||||||||
| Material transactions with related parties | ||||||||||||||
| DKK million | 2023 | 2022 | 2021 | |||||||||||
| Novo Holdings A/S | ||||||||||||||
| Purchase of Novo Nordisk B shares | ||||||||||||||
| Dividend payment to Novo Holdings A/S | ||||||||||||||
| NNIT Group | ||||||||||||||
| Services provided by NNIT | ||||||||||||||
| Dividend payment from NNIT | ( | |||||||||||||
| Altasciences Group | ||||||||||||||
| Services provided by Novo Nordisk | ||||||||||||||
| Services provided by Altasciences | ||||||||||||||
| Novozymes Group | ||||||||||||||
| Services provided by Novo Nordisk | ( | ( | ( | |||||||||||
| Services provided by Novozymes | ||||||||||||||
| DKK million | 2023 | 2022 | 2021 | ||||||||||||||
Statutory audit1 | |||||||||||||||||
| Audit-related services | |||||||||||||||||
| Tax advisory services | |||||||||||||||||
| Other services | |||||||||||||||||
| Total fees to statutory auditors | |||||||||||||||||
1. 2022 statutory audit fee includes DKK | |||||||||||||||||
| Novo Nordisk Annual Report 2023 | Introducing Novo Nordisk Strategic Aspirations Risks Management Consolidated statements Additional information | 80 | ||||||||
| Novo Nordisk Annual Report 2023 | Introducing Novo Nordisk Strategic Aspirations Risks Management Consolidated statements Additional information | 81 | ||||||||
| Activity: | • | Sales and marketing | • | Production | ||||||||||
| • | Research and development | • | Services/investments | |||||||||||
| Company and country | Activity | |||||||||||||||||||
| Parent company | ||||||||||||||||||||
| Novo Nordisk A/S, Denmark | • | • | • | • | ||||||||||||||||
| Subsidiaries by geographical area | ||||||||||||||||||||
| Company and country | Percentage of shares owned | Activity | ||||||||||||||||||
| North America Operations | ||||||||||||||||||||
| Inversago Pharma Inc., Canada | • | |||||||||||||||||||
| Novo Nordisk Canada Inc., Canada | • | |||||||||||||||||||
| Novo Nordisk North America Operations A/S, Denmark | • | |||||||||||||||||||
| Novo Nordisk Inc., US | • | |||||||||||||||||||
| Novo Nordisk Pharmaceutical Industries LP, US | • | |||||||||||||||||||
| Novo Nordisk Pharmatech US, Inc., US | • | |||||||||||||||||||
| Novo Nordisk Pharma, Inc., US | • | |||||||||||||||||||
| Novo Nordisk Research Center Indianapolis, Inc., US | • | |||||||||||||||||||
| Novo Nordisk Research Center Seattle, Inc., US | • | |||||||||||||||||||
| Novo Nordisk US Bio Production, Inc., US | • | |||||||||||||||||||
| Novo Nordisk US Commercial Holdings, Inc., US | • | |||||||||||||||||||
| Novo Nordisk US Holdings Inc., US | • | |||||||||||||||||||
| Dicerna Pharmaceuticals, Inc., US | • | |||||||||||||||||||
| Emisphere Technologies, Inc., US | • | |||||||||||||||||||
| Forma Therapeutics, Inc., US | • | |||||||||||||||||||
| Region International Operations | ||||||||||||||||||||
| Novo Nordisk Pharmaceuticals A/S, Denmark | • | |||||||||||||||||||
| Novo Nordisk Pharma Operations A/S, Denmark | • | • | ||||||||||||||||||
| Novo Nordisk Region AAMEO and LATAM A/S, Denmark | • | |||||||||||||||||||
| Novo Nordisk Region Europe A/S, Denmark | • | |||||||||||||||||||
| Novo Nordisk Region Japan & Korea A/S, Denmark | • | |||||||||||||||||||
| Region EMEA | ||||||||||||||||||||
| Aldaph SpA, Algeria | • | • | ||||||||||||||||||
| Novo Nordisk Pharma GmbH, Austria | • | |||||||||||||||||||
| S.A. Novo Nordisk Pharma N.V., Belgium | • | |||||||||||||||||||
| Novo Nordisk Pharma d.o.o., Bosnia and Herzegovina | • | |||||||||||||||||||
| Novo Nordisk Pharma EAD, Bulgaria | • | |||||||||||||||||||
| Novo Nordisk Hrvatska d.o.o., Croatia | • | |||||||||||||||||||
| Novo Nordisk s.r.o., Czech Republic | • | |||||||||||||||||||
| Novo Nordisk Denmark A/S, Denmark | • | |||||||||||||||||||
| Novo Nordisk Pharmatech A/S, Denmark | • | • | ||||||||||||||||||
| Novo Nordisk Egypt LLC, Egypt | • | |||||||||||||||||||
| Novo Nordisk Egypt Pharmaceuticals Ltd., Egypt | • | |||||||||||||||||||
| Company and country | Percentage of shares owned | Activity | ||||||||||||||||||
| Novo Nordisk Estonia OÜ, Estonia | • | |||||||||||||||||||
| Novo Nordisk Farma OY, Finland | • | |||||||||||||||||||
| Biocorp Production S.A., France | • | • | ||||||||||||||||||
| Novo Nordisk, France | • | |||||||||||||||||||
| Novo Nordisk Production SAS, France | • | |||||||||||||||||||
| Novo Nordisk Pharma GmbH, Germany | • | |||||||||||||||||||
| Novo Nordisk Hellas Epe., Greece | • | |||||||||||||||||||
| Novo Nordisk Hungária Kft., Hungary | • | |||||||||||||||||||
| Novo Nordisk Limited, Ireland | • | |||||||||||||||||||
| Novo Nordisk Ltd, Israel | • | |||||||||||||||||||
| Novo Nordisk S.P.A., Italy | • | |||||||||||||||||||
| Novo Nordisk Kazakhstan LLP, Kazakhstan | • | |||||||||||||||||||
| Novo Nordisk Kenya Ltd., Kenya | • | |||||||||||||||||||
| Novo Nordisk Latvia SIA, Latvia | • | |||||||||||||||||||
| Novo Nordisk Pharma SARL, Lebanon | • | |||||||||||||||||||
| UAB Novo Nordisk Pharma, Lithuania | • | |||||||||||||||||||
| Novo Nordisk Farma dooel, North Macedonia | • | |||||||||||||||||||
| Novo Nordisk Pharma SAS, Morocco | • | |||||||||||||||||||
| Novo Nordisk B.V., Netherlands | • | |||||||||||||||||||
| Novo Nordisk Finance (Netherlands) B.V., Netherlands | • | |||||||||||||||||||
| Novo Nordisk Pharma Limited, Nigeria | • | |||||||||||||||||||
| Novo Nordisk Norway AS, Norway | • | |||||||||||||||||||
| Novo Nordisk Pharmaceutical Services Sp. z.o.o., Poland | • | |||||||||||||||||||
| Novo Nordisk Pharma Sp.z.o.o., Poland | • | |||||||||||||||||||
| Novo Nordisk Portugal, Lda., Portugal | • | |||||||||||||||||||
| Novo Nordisk Farma S.R.L., Romania | • | |||||||||||||||||||
| Novo Nordisk Limited Liability Company, Russia | • | • | ||||||||||||||||||
| Novo Nordisk Production Support LLC, Russia | • | |||||||||||||||||||
| Novo Nordisk Saudi for Trading, Saudi Arabia | • | |||||||||||||||||||
| Novo Nordisk Pharma d.o.o. Belgrade (Serbia), Serbia | • | |||||||||||||||||||
| Novo Nordisk Slovakia s.r.o., Slovakia | • | |||||||||||||||||||
| Novo Nordisk, d.o.o., Slovenia | • | |||||||||||||||||||
| Novo Nordisk (Pty) Limited, South Africa | • | |||||||||||||||||||
| Novo Nordisk Pharma S.A., Spain | • | |||||||||||||||||||
| Novo Nordisk Scandinavia AB, Sweden | • | |||||||||||||||||||
| Novo Nordisk Health Care AG, Switzerland | • | • | • | |||||||||||||||||
| Novo Nordisk Pharma AG, Switzerland | • | |||||||||||||||||||
| Novo Nordisk Tunisie SARL, Tunisia | • | |||||||||||||||||||
| Novo Nordisk Saglik Ürünleri Tic. Ltd. Sti., Turkey | • | |||||||||||||||||||
| Novo Nordisk Ukraine, LLC, Ukraine | • | |||||||||||||||||||
| Novo Nordisk Pharma Gulf FZE, United Arab Emirates | • | |||||||||||||||||||
| Novo Nordisk Holding Limited, UK | • | |||||||||||||||||||
| Novo Nordisk Limited, UK | • | |||||||||||||||||||
| Novo Nordisk Research Centre Oxford Limited, UK | • | |||||||||||||||||||
| Company and country | Percentage of shares owned | Activity | ||||||||||||||||||
| Region China | ||||||||||||||||||||
| Novo Nordisk (China) Pharmaceuticals Co. Ltd., China | • | • | ||||||||||||||||||
| Novo Nordisk (Shanghai) Pharma Trading Co., Ltd., China | • | |||||||||||||||||||
| Novo Nordisk Region China A/S, Denmark | • | |||||||||||||||||||
| Novo Nordisk Hong Kong Limited, Hong Kong | • | |||||||||||||||||||
| Novo Nordisk Pharma (Taiwan) Ltd., Taiwan | • | |||||||||||||||||||
| Beijing Novo Nordisk Pharmaceuticals Science & Technology Co., Ltd., China | • | |||||||||||||||||||
| Region Rest of World | ||||||||||||||||||||
| Novo Nordisk Pharma Argentina S.A., Argentina | • | |||||||||||||||||||
| Novo Nordisk Pharmaceuticals Pty. Ltd., Australia | • | |||||||||||||||||||
| Novo Nordisk Pharma (Private) Limited, Bangladesh | • | |||||||||||||||||||
| Novo Nordisk Produção Farmacêutica do Brasil Ltda., Brazil | • | |||||||||||||||||||
| Novo Nordisk Farmacêutica do Brasil Ltda., Brazil | • | |||||||||||||||||||
| Novo Nordisk Farmacéutica Limitada, Chile | • | |||||||||||||||||||
| Novo Nordisk Colombia SAS, Colombia | • | |||||||||||||||||||
| Novo Nordisk India Private Limited, India | • | |||||||||||||||||||
| Novo Nordisk Service Centre (India) Pvt. Ltd., India | • | |||||||||||||||||||
| PT. Novo Nordisk Indonesia, Indonesia | • | |||||||||||||||||||
| Novo Nordisk Pars, Iran | • | • | ||||||||||||||||||
| Novo Nordisk Pharma Ltd., Japan | • | • | ||||||||||||||||||
| Novo Nordisk Pharma (Malaysia) Sdn Bhd, Malaysia | • | |||||||||||||||||||
| Novo Nordisk Pharma Operations Sdn Bhd, Malaysia | • | |||||||||||||||||||
| Novo Nordisk Mexico S.A. de C.V., Mexico | • | |||||||||||||||||||
| Novo Nordisk Pharmaceuticals Ltd., New Zealand | • | |||||||||||||||||||
| Novo Nordisk Pharma (Private) Limited, Pakistan | • | |||||||||||||||||||
| Novo Nordisk Panama S.A., Panama | • | |||||||||||||||||||
| Novo Nordisk Peru S.A.C., Peru | • | |||||||||||||||||||
| Novo Nordisk Pharmaceuticals (Philippines) Inc., Philippines | • | |||||||||||||||||||
| Novo Nordisk Pharma (Singapore) Pte Ltd., Singapore | • | |||||||||||||||||||
| Novo Nordisk India Holding Pte Ltd., Singapore | • | |||||||||||||||||||
| Novo Nordisk Pharma Korea Ltd., South Korea | • | |||||||||||||||||||
| Novo Nordisk Lanka (PVT) Ltd, Sri Lanka | • | |||||||||||||||||||
| Novo Nordisk Pharma (Thailand) Ltd., Thailand | • | |||||||||||||||||||
| Novo Nordisk Vietnam Ltd., Vietnam | • | |||||||||||||||||||
| Other subsidiaries and associated companies | ||||||||||||||||||||
| Company and country | Percentage of shares owned | Activity | ||||||||||||||||||
| NNE A/S, Denmark | • | |||||||||||||||||||
| NNIT A/S, Denmark | • | |||||||||||||||||||
| CS Solar Fund XIV, LLC, US | • | |||||||||||||||||||
| Novo Nordisk Annual Report 2023 | Part of the Management review – not audited | 82 | ||||||||
| Novo Nordisk Annual Report 2023 | Part of the Management review – not audited | 83 | ||||||||
| Net sales in constant exchange rates | |||||||||||||||||
| DKK million | 2023 | 2022 | 2021 | ||||||||||||||
Net sales IFRS | 232,261 | 176,954 | 140,800 | ||||||||||||||
| Effect of exchange rate | 7,658 | (13,024) | 3,643 | ||||||||||||||
| Net sales in constant exchange rates | 239,919 | 163,930 | 144,443 | ||||||||||||||
| Net sales previous year | 176,954 | 140,800 | 126,946 | ||||||||||||||
| % increase/(decrease) in reported currencies | 31.3 | % | 25.7 | % | 10.9 | % | |||||||||||
| % increase/(decrease) in constant exchange rates | 35.6 | % | 16.4 | % | 13.8 | % | |||||||||||
| Operating profit in constant exchange rates | |||||||||||||||||
| DKK million | 2023 | 2022 | 2021 | ||||||||||||||
Operating profit IFRS | 102,574 | 74,809 | 58,644 | ||||||||||||||
| Effect of exchange rate | 4,898 | (7,578) | 2,332 | ||||||||||||||
| Operating profit in constant exchange rates | 107,472 | 67,231 | 60,976 | ||||||||||||||
| Operating profit previous year | 74,809 | 58,644 | 54,126 | ||||||||||||||
| % increase/(decrease) in reported currencies | 37.1 | % | 27.6 | % | 8.3 | % | |||||||||||
| % increase/(decrease) in constant exchange rates | 43.7 | % | 14.6 | % | 12.7 | % | |||||||||||
| EBITDA | |||||||||||||||||
| DKK million | 2023 | 2022 | 2021 | ||||||||||||||
Net profit IFRS | 83,683 | 55,525 | 47,757 | ||||||||||||||
Income taxes IFRS | 20,991 | 13,537 | 11,323 | ||||||||||||||
Financial income IFRS | (2,945) | (239) | (2,887) | ||||||||||||||
Financial expenses IFRS | 845 | 5,986 | 2,451 | ||||||||||||||
Operating profit (EBIT) IFRS | 102,574 | 74,809 | 58,644 | ||||||||||||||
| Depreciation and amortisations | 7,289 | 6,553 | 5,311 | ||||||||||||||
| Impairment losses | 2,124 | 809 | 714 | ||||||||||||||
| EBITDA | 111,987 | 82,171 | 64,669 | ||||||||||||||
| Novo Nordisk Annual Report 2023 | Part of the Management review – not audited | 84 | ||||||||
| Operating profit/equity in % | |||||||||||||||||
| DKK million | 2023 | 2022 | 2021 | ||||||||||||||
Operating profit IFRS | 102,574 | 74,809 | 58,644 | ||||||||||||||
/ Equity IFRS | 106,561 | 83,486 | 70,746 | ||||||||||||||
| Operating profit/equity in % | 96.3 | % | 89.6 | % | 82.9 | % | |||||||||||
| ROIC | |||||||||||||||||
| DKK million | 2023 | 2022 | 2021 | ||||||||||||||
| Operating profit after tax | 81,957 | 60,146 | 47,384 | ||||||||||||||
| / Average net operating assets | 92,566 | 81,744 | 68,634 | ||||||||||||||
| ROIC in % | 88.5 | % | 73.6 | % | 69.0 | % | |||||||||||
| DKK million | 2023 | 2022 | 2021 | ||||||||||||||
Operating profit IFRS | 102,574 | 74,809 | 58,644 | ||||||||||||||
| Tax on operating profit (using effective tax rate) | (20,617) | (14,663) | (11,260) | ||||||||||||||
| Operating profit after tax | 81,957 | 60,146 | 47,384 | ||||||||||||||
| DKK million | 2023 | 2022 | 2021 | ||||||||||||||
| Intangible assets | 60,406 | 50,939 | 43,171 | ||||||||||||||
| Property, plant and equipment | 90,961 | 66,671 | 55,362 | ||||||||||||||
| Deferred income tax assets | 20,380 | 13,904 | 8,672 | ||||||||||||||
| Other receivables and prepayments (non-current) | 1,430 | 206 | 267 | ||||||||||||||
| Inventories | 31,811 | 24,388 | 19,621 | ||||||||||||||
| Trade receivables | 64,770 | 50,560 | 40,643 | ||||||||||||||
| Tax receivables | 2,423 | 940 | 1,119 | ||||||||||||||
| Other receivables and prepayments (current) | 8,068 | 6,005 | 5,037 | ||||||||||||||
| Deferred income tax liabilities | (10,162) | (7,061) | (5,271) | ||||||||||||||
| Retirement benefit obligations | (742) | (762) | (1,280) | ||||||||||||||
| Other liabilities (non-current) | (189) | (100) | (360) | ||||||||||||||
| Provisions (non-current) | (6,649) | (4,590) | (4,374) | ||||||||||||||
| Trade payables | (25,606) | (15,587) | (8,870) | ||||||||||||||
| Tax payables | (7,116) | (7,091) | (3,658) | ||||||||||||||
| Other liabilities (current) | (28,705) | (23,606) | (19,600) | ||||||||||||||
| Provisions (current) | (100,478) | (70,287) | (51,520) | ||||||||||||||
| Net operating assets | 100,602 | 84,529 | 78,959 | ||||||||||||||
| Average net operating assets | 92,566 | 81,744 | 68,634 | ||||||||||||||
| DKK million | 2023 | 2022 | 2021 | ||||||||||||||
Equity IFRS | 106,561 | 83,486 | 70,746 | ||||||||||||||
| Investment in associated companies | (410) | (327) | (525) | ||||||||||||||
| Other financial assets | (1,253) | (1,016) | (916) | ||||||||||||||
| Marketable securities | (15,838) | (10,921) | (6,765) | ||||||||||||||
| Derivative financial instruments | (2,344) | (2,727) | (1,690) | ||||||||||||||
| Cash at bank | (14,392) | (12,653) | (10,720) | ||||||||||||||
| Borrowings – non-current | 20,528 | 24,318 | 12,961 | ||||||||||||||
| Borrowings – current | 6,478 | 1,466 | 13,684 | ||||||||||||||
| Derivative financial instruments | 1,272 | 2,903 | 2,184 | ||||||||||||||
| Net operating assets | 100,602 | 84,529 | 78,959 | ||||||||||||||
| Novo Nordisk Annual Report 2023 | Part of the Management review – not audited | 85 | ||||||||
| Free cash flow | |||||||||||||||||
| DKK million | 2023 | 2022 | 2021 | ||||||||||||||
Net cash generated from operating activities IFRS | 108,908 | 78,887 | 55,000 | ||||||||||||||
Net cash used in investing activities IFRS | (43,892) | (24,918) | (31,605) | ||||||||||||||
Net purchase of marketable securities IFRS | 4,758 | 2,921 | 5,937 | ||||||||||||||
Addition on marketable securities through acquisition of business IFRS | — | 1,470 | 861 | ||||||||||||||
Repayment on lease liabilities IFRS | (1,448) | (998) | (874) | ||||||||||||||
| Free cash flow | 68,326 | 57,362 | 29,319 | ||||||||||||||
| Cash flow from operating activities/net profit in % | |||||||||||||||||
| DKK million | 2023 | 2022 | 2021 | ||||||||||||||
Net cash generated from operating activities IFRS | 108,908 | 78,887 | 55,000 | ||||||||||||||
/ Net profit IFRS | 83,683 | 55,525 | 47,757 | ||||||||||||||
| Cash flow from operating activities/net profit in % | 130.1 | % | 142.1 | % | 115.2 | % | |||||||||||
| Cash to earnings | |||||||||||||||||
| DKK million | 2023 | 2022 | 2021 | ||||||||||||||
| Free cash flow | 68,326 | 57,362 | 29,319 | ||||||||||||||
/ Net profit IFRS | 83,683 | 55,525 | 47,757 | ||||||||||||||
| Cash to earnings | 81.6 | % | 103.3 | % | 61.4 | % | |||||||||||
| Novo Nordisk Annual Report 2023 | Introducing Novo Nordisk Strategic Aspirations Risks Management Consolidated statements Additional information | 86 | ||||||||
| Note | 2023 | 2022 | 2021 | |||||||||||||||||
| Environmental performance | ||||||||||||||||||||
| Energy consumption for operations (1,000 GJ) | 7.1 | 3,784 | 3,677 | 3,387 | ||||||||||||||||
| Share of renewable power for production sites | 7.1 | 100 | % | 100 | % | 100 | % | |||||||||||||
Scope 1 emissions (1,000 tonnes CO2e)1 | 7.2 | 78 | 76 | 77 | ||||||||||||||||
Scope 2 emissions (1,000 tonnes CO2e)1 | 7.2 | 15 | 16 | 16 | ||||||||||||||||
Scope 3 emissions (1,000 tonnes CO2e)1,2 | 7.2 | 3,738 | 2,418 | N/A | ||||||||||||||||
Water consumption for production sites (1,000 m3) | 7.3 | 4,150 | 3,918 | 3,488 | ||||||||||||||||
| Waste from production sites (tonnes) | 7.4 | 189,091 | 213,505 | 180,806 | ||||||||||||||||
Breaches of environmental regulatory limit values3 | 7.5 | 12 | 8 | 8 | ||||||||||||||||
| Social performance | ||||||||||||||||||||
| Patients | ||||||||||||||||||||
Patients reached with Novo Nordisk's Diabetes and Obesity care products (in millions)4 | 8.1 | 41.6 | 36.9 | 34.9 | ||||||||||||||||
•Hereof reached via the Novo Nordisk Access to Insulin Commitment (in millions) | 8.1 | 2.4 | 1.8 | 1.7 | ||||||||||||||||
Children reached through the Changing Diabetes® in Children programme (cumulative) | 8.1 | 52,249 | 41,033 | 31,846 | ||||||||||||||||
| People and employees | ||||||||||||||||||||
Year-end employees (total) | 8.2 | 64,319 | 55,185 | 48,478 | ||||||||||||||||
| Employee turnover | 8.2 | 5.5 | % | 8.2 | % | 11.0 | % | |||||||||||||
| Gender in leadership positions (ratio men:women) | 8.3 | 54:46 | 56:44 | 57:43 | ||||||||||||||||
| Gender in senior leadership positions (ratio men:women) | 8.3 | 59:41 | 61:39 | 64:36 | ||||||||||||||||
| Gender in the Board of Directors (ratio men:women) | 8.3 | 50:50 | 54:46 | 67:33 | ||||||||||||||||
| Sustainable employer score | 8.4 | 86 | % | 85 | % | 84 | % | |||||||||||||
| Frequency of occupational accidents (number per million working hours) | 8.5 | 1.5 | 1.5 | 1.3 | ||||||||||||||||
| Note | 2023 | 2022 | 2021 | |||||||||||||||||
| Social performance (continued) | ||||||||||||||||||||
| Societies | ||||||||||||||||||||
| Change in average net price across US product portfolio (% change to previous year) | 8.6 | (8.2 | %) | (10.5 | %) | (12.3 | %) | |||||||||||||
| Change in average net price across US insulin portfolio (% change to previous year) | 8.6 | (24.4 | %) | (19.5 | %) | (10.9 | %) | |||||||||||||
| Total tax contribution (DKK million) | 8.7 | 51,247 | 36,003 | 32,593 | ||||||||||||||||
| Donations and other contributions (DKK million) | 8.8 | 138 | 126 | 92 | ||||||||||||||||
| Governance performance | ||||||||||||||||||||
| Business ethics reviews | 9.1 | 40 | 35 | 37 | ||||||||||||||||
| Employees trained in business ethics | 9.1 | 99 | % | 99 | % | 98 | % | |||||||||||||
Number of substantiated cases reported via the Compliance Hotline | 9.2 | 314 | 288 | 236 | ||||||||||||||||
| Convictions for violation of anti-corruption and anti-bribery laws | 9.2 | — | — | — | ||||||||||||||||
| Supplier audits | 9.3 | 382 | 294 | 253 | ||||||||||||||||
| Product recalls | 9.4 | 2 | 3 | 1 | ||||||||||||||||
| Failed inspections | 9.5 | — | — | — | ||||||||||||||||
| Facilitations of the Novo Nordisk Way | 9.6 | 42 | 36 | 34 | ||||||||||||||||
| Company reputation (scale 0-100) | 9.7 | 82.1 | 82.3 | 82.6 | ||||||||||||||||
| Animals purchased for research | 9.8 | 56,508 | 79,750 | 47,879 | ||||||||||||||||
1. 2023 is the first year of reporting all emission categories in CO2e. Comparative figures for scope 1, 2 and part of scope 3 emissions are measured in CO2. Refer to section 7.2 for further details. 2. 2022 was the first year of full scope 3 emissions' disclosure, which in 2021 and previously was limited to business flights and product distribution. 3. The methodology for counting number of breaches has changed in 2023. Comparative figures are adjusted accordingly. 4. 2023 is the first year of reporting Obesity as part of number of patients reached. Comparative figures are adjusted accordingly. | ||||||||||||||||||||
| Novo Nordisk Annual Report 2023 | Introducing Novo Nordisk Strategic Aspirations Risks Management Consolidated statements Additional information | 87 | ||||||||
| Novo Nordisk Annual Report 2023 | Introducing Novo Nordisk Strategic Aspirations Risks Management Consolidated statements Additional information | 88 | ||||||||
| Energy consumption for operations | ||||||||||||||
| 1,000 GJ | 2023 | 2022 | 2021 | |||||||||||
| Production | 3,214 | 3,091 | 2,859 | |||||||||||
| Office buildings and laboratories | 570 | 586 | 528 | |||||||||||
| Total energy consumption | 3,784 | 3,677 | 3,387 | |||||||||||
1,000 tonnes CO2e | 2023 | 2022 | 2021 | |||||||||||
Scope 11 | 78 | 76 | 77 | |||||||||||
| – Production | 31 | 25 | 29 | |||||||||||
| – Office buildings and laboratories | 1 | 3 | 2 | |||||||||||
| – Company cars | 46 | 48 | 46 | |||||||||||
Scope 21 | 15 | 16 | 16 | |||||||||||
| – Production | 12 | 11 | 10 | |||||||||||
| – Office buildings and laboratories | 3 | 5 | 6 | |||||||||||
Scope 32 | 3,738 | 2,418 | N/A | |||||||||||
– Purchased goods and services3 | 2,067 | 1,473 | N/A | |||||||||||
– Capital goods3 | 1,315 | 614 | N/A | |||||||||||
– Fuel and energy related activities | 56 | 55 | N/A | |||||||||||
– Upstream transportation and distribution | 113 | 123 | N/A | |||||||||||
– Waste generated in operations | 6 | 5 | N/A | |||||||||||
– Business travel1,3 | 83 | 73 | N/A | |||||||||||
– Employee commuting | 43 | 35 | N/A | |||||||||||
– Downstream transportation and distribution | 52 | 37 | N/A | |||||||||||
– End-of-life treatment of sold products | 3 | 3 | N/A | |||||||||||
Total CO2e emissions | 3,831 | 2,510 | N/A | |||||||||||
1. Categories measured in CO2 in comparison periods. 2. The calculation of scope 3 emissions is substantially based on estimates and therefore inherently uncertain. 3. 2022 figures have been restated by adding 222, 137 and 18 thousand tonnes, respectively. | ||||||||||||||
| Novo Nordisk Annual Report 2023 | Introducing Novo Nordisk Strategic Aspirations Risks Management Consolidated statements Additional information | 89 | ||||||||
| Tonnes | 2023 | 2022 | 2021 | ||||||||||||||
Organic residues | 128,116 | 166,183 | 143,254 | ||||||||||||||
| Other (paper, cardboard, metals, etc.) | 19,019 | 12,820 | 7,990 | ||||||||||||||
| Total recycling | 147,135 | 179,003 | 151,244 | ||||||||||||||
| Ethanol waste | 12,521 | 14,913 | 13,232 | ||||||||||||||
| Other (various combustible waste) | 9,390 | 8,007 | 8,239 | ||||||||||||||
| Total waste with energy recovery | 21,911 | 22,920 | 21,471 | ||||||||||||||
| Water waste with no energy recovery | 141 | 356 | 5,499 | ||||||||||||||
| Other | 1,987 | 827 | 1,660 | ||||||||||||||
| Total waste with no energy recovery | 2,128 | 1,183 | 7,159 | ||||||||||||||
| Water waste with resource recovery | 7,949 | 7,379 | N/A | ||||||||||||||
| Other | 9,330 | 2,114 | N/A | ||||||||||||||
| Total waste with resource recovery | 17,279 | 9,493 | N/A | ||||||||||||||
| Total waste to landfill | 638 | 906 | 932 | ||||||||||||||
| Total waste | 189,091 | 213,505 | 180,806 | ||||||||||||||
| Novo Nordisk Annual Report 2023 | Introducing Novo Nordisk Strategic Aspirations Risks Management Consolidated statements Additional information | 90 | ||||||||
| Estimate in millions | 2023 | 2022 | 2021 | |||||||||||
Patients reached with Novo Nordisk's Diabetes care products | 40.5 | 36.3 | 34.6 | |||||||||||
Patients reached with Novo Nordisk's Obesity care products | 1.1 | 0.6 | 0.3 | |||||||||||
Total number of patients reached | 41.6 | 36.9 | 34.9 | |||||||||||
| Number of employees | ||||||||||||||
| Number | 2023 | 2022 | 2021 | |||||||||||
Year-end employees (total) | 64,319 | 55,185 | 48,478 | |||||||||||
| Year-end number of full-time employees | 63,370 | 54,393 | 47,792 | |||||||||||
| Employees by geographical area | ||||||||||||||
| Number | 2023 | 2022 | 2021 | |||||||||||
| International Operations | 56,004 | 47,935 | 42,372 | |||||||||||
Denmark | 28,692 | 22,916 | 19,150 | |||||||||||
EMEA (Europe, the Middle East and Africa), excluding Denmark | 8,808 | 7,954 | 7,530 | |||||||||||
China (Mainland China, Hong Kong, Taiwan) | 6,485 | 6,148 | 5,833 | |||||||||||
Rest of World (all other countries) | 12,019 | 10,917 | 9,859 | |||||||||||
| North America Operations | 8,315 | 7,250 | 6,106 | |||||||||||
Year-end employees (total) | 64,319 | 55,185 | 48,478 | |||||||||||
| Novo Nordisk Annual Report 2023 | Introducing Novo Nordisk Strategic Aspirations Risks Management Consolidated statements Additional information | 91 | ||||||||
| Employees by gender | ||||||||||||||
| % | 2023 | 2022 | 2021 | |||||||||||
| Male | 51 | % | 51 | % | 51 | % | ||||||||
| Female | 49 | % | 49 | % | 49 | % | ||||||||
| Other | 0 | % | 0 | % | 0 | % | ||||||||
| Not reported | 0 | % | 0 | % | 0 | % | ||||||||
| Employees by age group | ||||||||||||||
| % | 2023 | 2022 | 2021 | |||||||||||
| Under 30 years old | 17 | % | 15 | % | 14 | % | ||||||||
| 30-50 years old | 64 | % | 65 | % | 66 | % | ||||||||
| Over 50 years old | 19 | % | 20 | % | 20 | % | ||||||||
| Ratio men:women | 2023 | 2022 | 2021 | |||||||||||
| CEO, EVP, SVP | 64:36 | 71:29 | 72:28 | |||||||||||
| CVP, VP | 59:41 | 60:40 | 63:37 | |||||||||||
| Director, manager, team leader | 54:46 | 55:45 | 57:43 | |||||||||||
| Gender in leadership positions (overall) | 54:46 | 56:44 | 57:43 | |||||||||||
| Gender in senior leadership positions | 59:41 | 61:39 | 64:36 | |||||||||||
| Gender in the Board of Directors | 50:50 | 54:46 | 67:33 | |||||||||||
| Novo Nordisk Annual Report 2023 | Introducing Novo Nordisk Strategic Aspirations Risks Management Consolidated statements Additional information | 92 | ||||||||
| % change vs prior year | 2023 | 2022 | 2021 | ||||||||
| US product portfolio | |||||||||||
| List price change – Avg. | 2.8 | % | 2.4 | % | 1.6 | % | |||||
| Net price change – Avg. | (8.2 | %) | (10.5 | %) | (12.3 | %) | |||||
| US insulin portfolio | |||||||||||
| List price change – Avg. | 0.1 | % | 0.0 | % | 0.0 | % | |||||
| Net price change – Avg. | (24.4 | %) | (19.5 | %) | (10.9 | %) | |||||
| DKK million | Taxes borne | Taxes collected | 2023 | 2022 | 2021 | ||||||||||||
| Corporate income taxes paid | 25,897 | 6,080 | 31,977 | 19,097 | 18,390 | ||||||||||||
| Employment taxes | 2,666 | 13,510 | 16,176 | 13,006 | 10,840 | ||||||||||||
| Indirect taxes | 2,815 | (1,035) | 1,780 | 3,027 | 2,612 | ||||||||||||
| Other taxes | 1,314 | — | 1,314 | 873 | 751 | ||||||||||||
| Total | 32,692 | 18,555 | 51,247 | 36,003 | 32,593 | ||||||||||||
| DKK million | 2023 | 2022 | 2021 | |||||||||||
| World Diabetes Foundation (WDF) | 119 | 93 | 92 | |||||||||||
| Novo Nordisk Haemophilia Foundation (NNHF) | 19 | 33 | — | |||||||||||
| Total donations and other contributions | 138 | 126 | 92 | |||||||||||
| Novo Nordisk Annual Report 2023 | Introducing Novo Nordisk Strategic Aspirations Risks Management Consolidated statements Additional information | 93 | ||||||||
| Number | 2023 | 2022 | 2021 | |||||||||||
| Responsible sourcing audits | 24 | 14 | 16 | |||||||||||
| Quality audits | 358 | 280 | 237 | |||||||||||
| Total supplier audits | 382 | 294 | 253 | |||||||||||
| Novo Nordisk Annual Report 2023 | Introducing Novo Nordisk Strategic Aspirations Risks Management Consolidated statements Additional information | 94 | ||||||||
| Scale 0-100 | 2023 | 2022 | 2021 | |||||||||||
| People with diabetes | 81.4 | 81.3 | 81.5 | |||||||||||
| People with obesity | 77.9 | 79.4 | 79.4 | |||||||||||
| General practitioners | 82.9 | 84.0 | 84.8 | |||||||||||
| Diabetes specialists | 88.9 | 90.3 | 90.3 | |||||||||||
| Informed general public | 79.6 | 76.3 | 77.1 | |||||||||||
| Total score (average) | 82.1 | 82.3 | 82.6 | |||||||||||
| Number | 2023 | 2022 | 2021 | |||||||||||
| Mice, rats and other rodents | 54,410 | 63,760 | 35,675 | |||||||||||
| Pigs | 608 | 427 | 759 | |||||||||||
| Rabbits | 289 | 606 | 184 | |||||||||||
| Dogs | 356 | 146 | 114 | |||||||||||
| Non-human primates | 807 | 700 | 495 | |||||||||||
| Fish | 36 | 14,098 | 10,638 | |||||||||||
| Other vertebrates | 2 | 13 | 14 | |||||||||||
| Total animals purchased | 56,508 | 79,750 | 47,879 | |||||||||||
| Novo Nordisk Annual Report 2023 | Introducing Novo Nordisk Strategic Aspirations Risks Management Consolidated statements Additional information | 95 | ||||||||
| Registered Executive Management | Board of Directors | |||||||||||||||||||||||||||||||
| Lars Fruergaard Jørgensen President and CEO | Karsten Munk Knudsen CFO | Helge Lund Chair | Henrik Poulsen Vice Chair | Elisabeth Dahl Christensen | Laurence Debroux | |||||||||||||||||||||||||||
| Andreas Fibig | Sylvie Grégoire | Liselotte Hyveled | Mette Bøjer Jensen | |||||||||||||||||||||||||||||
| Kasim Kutay | Christina Law | Martin Mackay | Thomas Rantzau | |||||||||||||||||||||||||||||
| Novo Nordisk Annual Report 2023 | Introducing Novo Nordisk Strategic Aspirations Risks Management Consolidated statements Additional information | 96 | ||||||||
| Novo Nordisk Annual Report 2023 | Introducing Novo Nordisk Strategic Aspirations Risks Management Consolidated statements Additional information | 97 | ||||||||
| Novo Nordisk Annual Report 2023 | Introducing Novo Nordisk Strategic Aspirations Risks Management Consolidated statements Additional information | 98 | ||||||||
| Novo Nordisk Annual Report 2023 | Introducing Novo Nordisk Strategic Aspirations Risks Management Consolidated statements Additional information | 99 | ||||||||
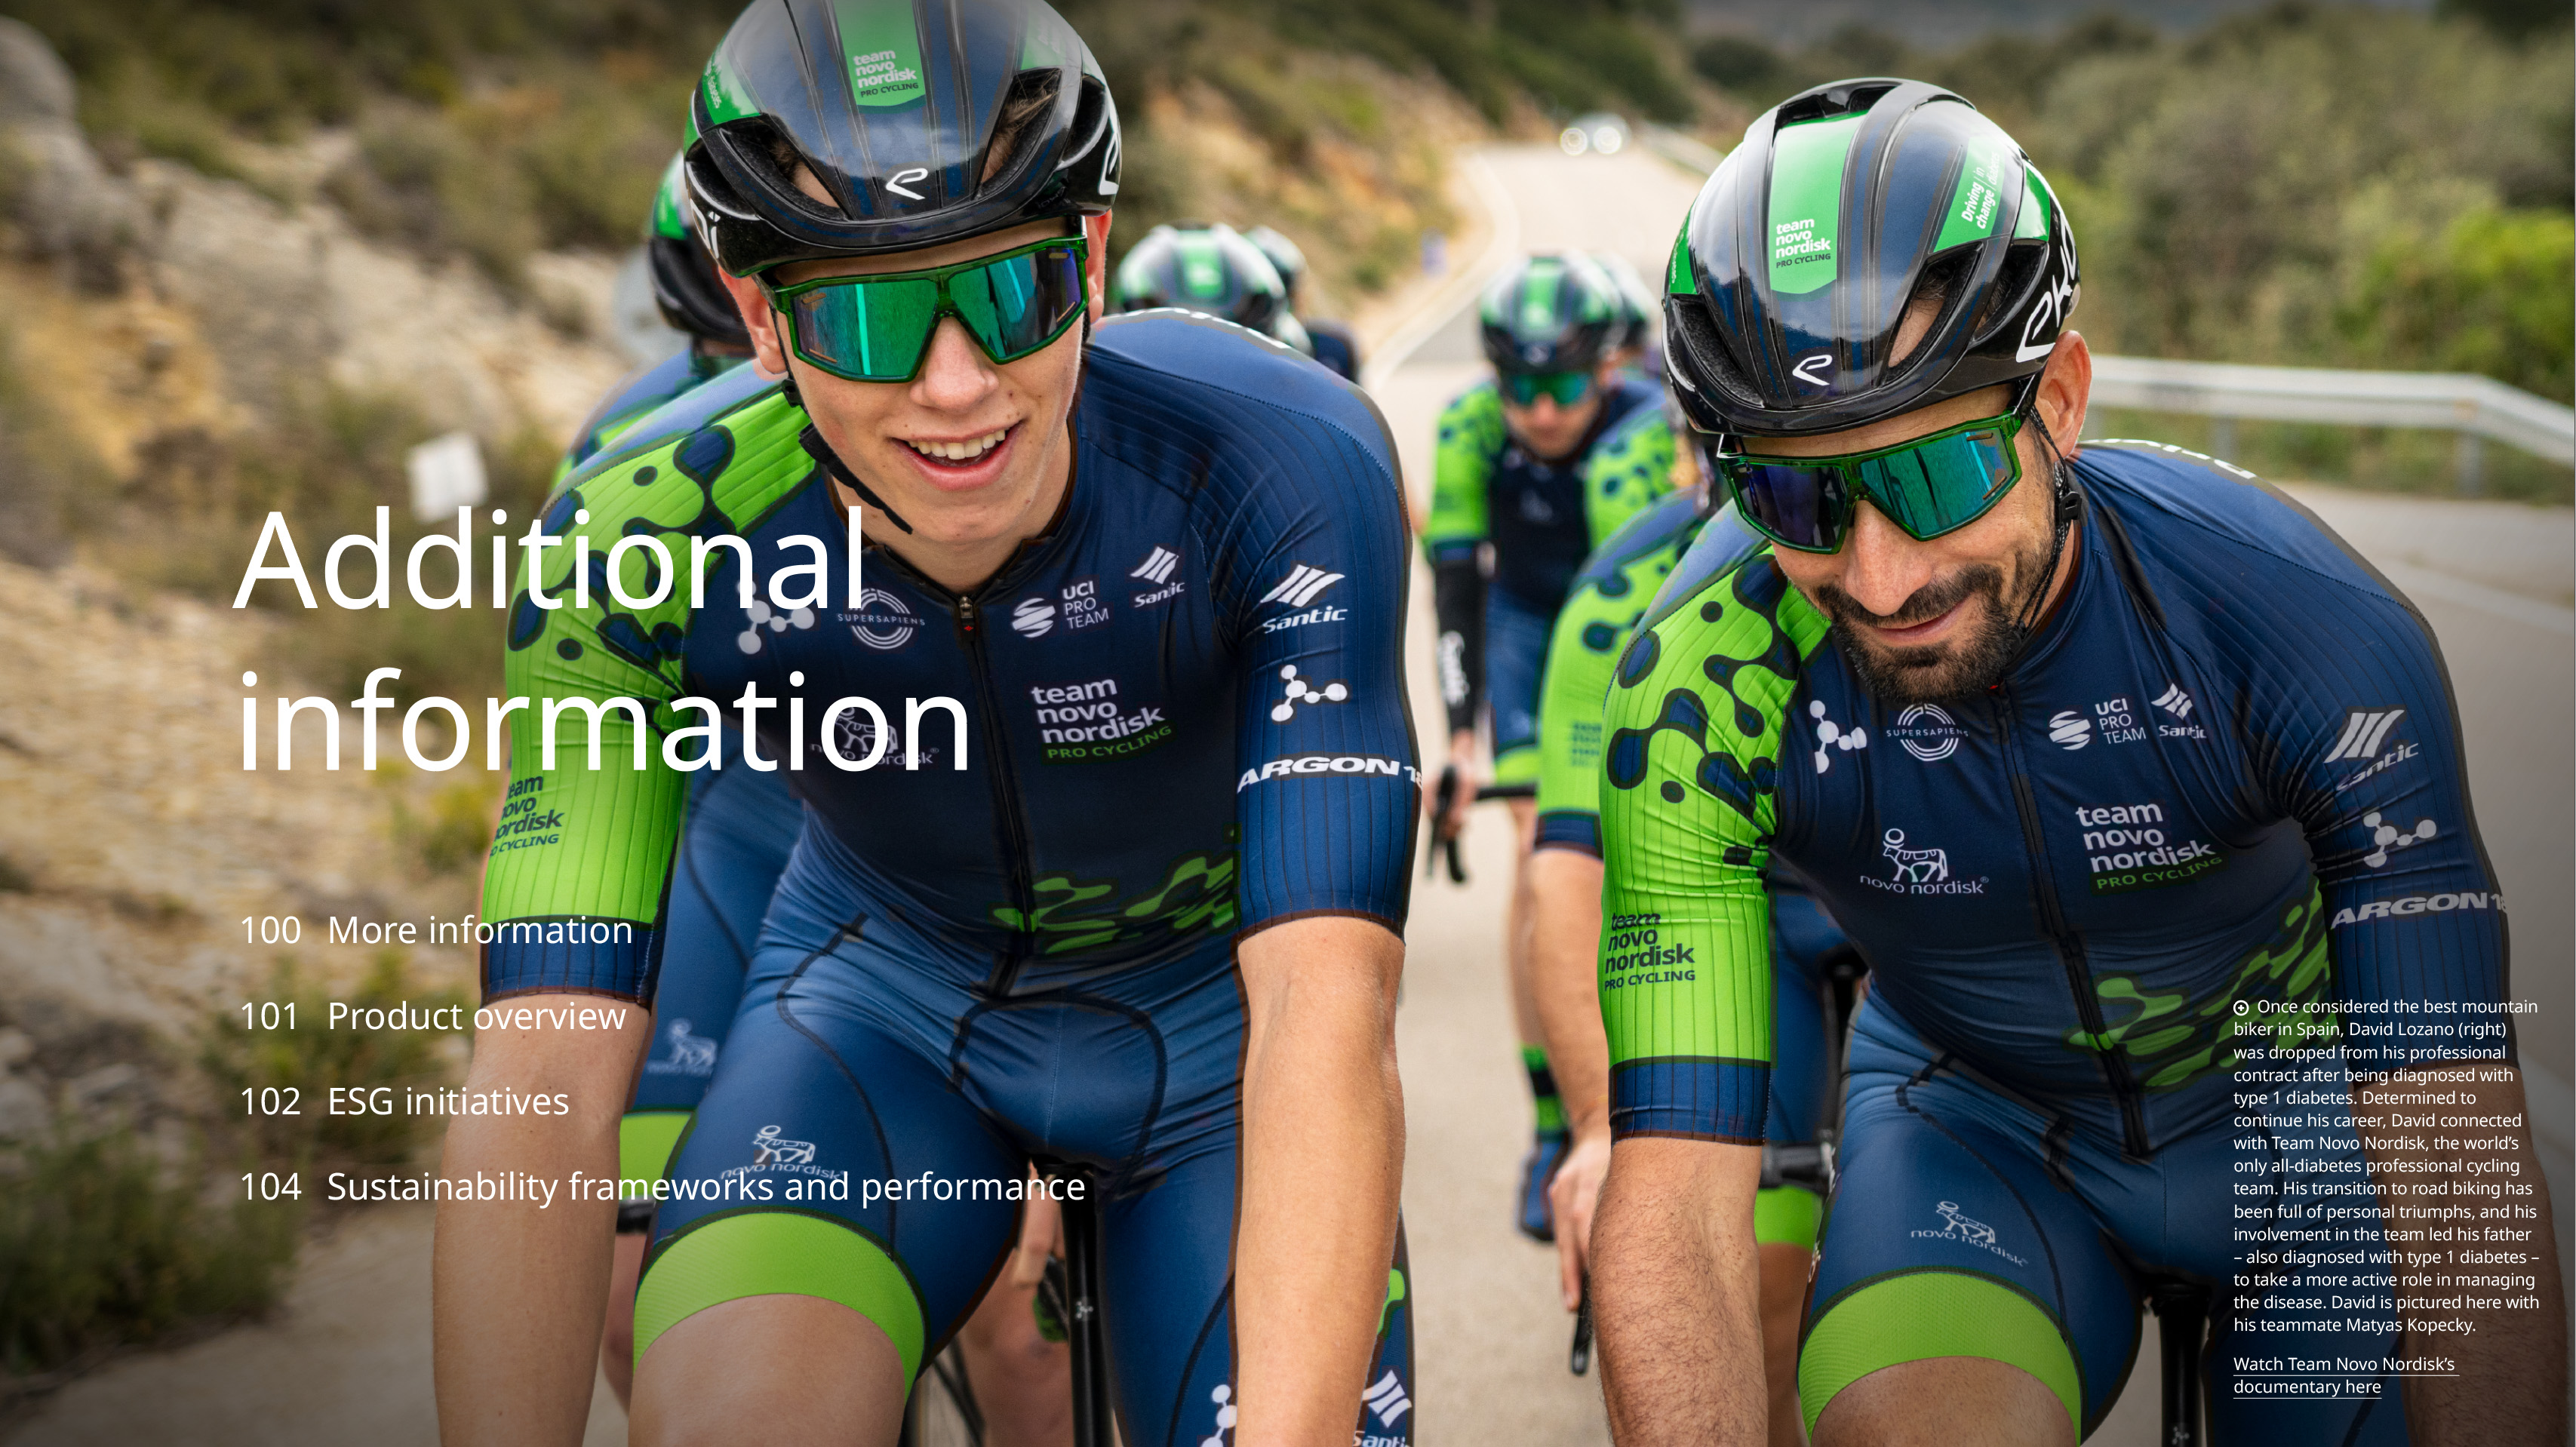
| Novo Nordisk Annual Report 2023 | Introducing Novo Nordisk Strategic Aspirations Risks Management Consolidated statements Additional information | 100 | ||||||||
| Novo Nordisk Annual Report 2023 | Introducing Novo Nordisk Strategic Aspirations Risks Management Consolidated statements Additional information | 101 | ||||||||
Product overview1 | |||||||||||
| | | |||||||||
New-generation insulin and combinations •Tresiba®, insulin degludec •Ryzodeg®, insulin degludec/insulin aspart •Fiasp®, fast-acting insulin aspart •Xultophy®2, insulin degludec/liraglutide Modern insulin •Levemir®, insulin detemir •NovoRapid®3, insulin aspart •NovoMix® 30, biphasic insulin aspart •NovoMix® 50, biphasic insulin aspart •NovoMix® 70, biphasic insulin aspart4 Human insulin •Insulatard® isophane (NPH) insulin •Actrapid®, regular human insulin •Mixtard® 30, biphasic human insulin •Mixtard® 40, biphasic human insulin4 •Mixtard® 50, biphasic human insulin Glucagon-like peptide-1 •Victoza®, liraglutide •Ozempic®, semaglutide •Rybelsus®, oral semaglutide Pre-filled delivery systems •FlexTouch®, U100, U200 •FlexPen® •InnoLet® •Ozempic®, FlexTouch® | Durable delivery systems •NovoPen® 6 •NovoPen® 5 •NovoPen® 4 •NovoPen Echo® Plus •NovoPen Echo® Other delivery systems •PumpCart®, NovoRapid® and Fiasp® cartridge to be used in pump •Penfill® cartridge •Mallya® Oral antidiabetic agents •NovoNorm®, repaglinide Glucagon •GlucaGen®, glucagon (vial and Hypokit®) •Zegalogue®, dasiglucagon Needles •NovoFine® Plus •NovoFine® •NovoTwist® •NovoFine® AutoCover® | Glucagon-like peptide-1 Saxenda®, liraglutide 3.0 mg Wegovy®, semaglutide 2.4 mg Obesity delivery systems Saxenda®, FlexTouch® Wegovy® Single Dose Device and FlexTouch® | Rare blood disorders •NovoSeven®, eptacog alfa (recombinant activated factor VII) •NovoEight®5, turoctocog alfa (recombinant factor VIII) •NovoThirteen®, catridecacog (recombinant factor XIII) •Refixia®6, nonacog beta pegol, N9-GP (recombinant factor IX) •Esperoct®, turoctocog alfa pegol, N8-GP (recombinant factor VIII) •Alhemo®, concizumab (anti-TFPI) Rare endocrine disorders •Norditropin®, somatropin (rDNA origin) •Sogroya®, somapacitan (rDNA origin) Pre-filled human growth hormone delivery systems •FlexPro® •NordiFlex® Other delivery systems •PenMate®, automatic needle inserter for NordiFlex® Hormone replacement therapies •Vagifem®7, estradiol hemihydrate •Activelle®, estradiol/norethisterone acetate •Kliogest®, estradiol/norethisterone acetate •Novofem®, estradiol/norethisterone acetate •Trisequens®, estradiol/norethisterone acetate •Estrofem®, estradiol | ||||||||
1. Products listed may not be available in all markets. 2. In the US approved under the brand name Xultophy® 100/3.6. 3. In the US called NovoLog®. 4. The global discontinuation of NovoMix® 70 and Mixtard® 40 has been communicated. 5. In the US written Novoeight®. 6. In the US approved under the name of REBINYN®. 7. In the UK also called gina®. | |||||||||||
| Novo Nordisk Annual Report 2023 | Introducing Novo Nordisk Strategic Aspirations Risks Management Consolidated statements Additional information | 102 | ||||||||
| ESG initiatives | We recognise the need to operate with proper regard to our impact on society and the environment. This table compiles some of our most significant initiatives within ESG. | ||||||||||||||||||||||||||||||||||
| Agenda | Name | Description | Reach | Ambition | 2023 Progress | ||||||||||||||||||||||||||||||
 | CO2 emissions | Purchasing renewable energy | Range of solutions helping us move towards 100% renewable energy supply. This includes Renewable Electricity Certificates (REC), Power Purchase Agreements (PPA) and on-site renewable energy solutions. | Global | Achieve zero CO2e emissions from operations by 2030. | Across Novo Nordisk, 63.2% of the energy sourced and 99.5% of the power sourced this year was renewable. At production sites, 61.3% of the energy sourced and 100% of the power sourced was renewable. | |||||||||||||||||||||||||||||
| Minimising air transportation impact | Three-fold approach to reduce CO2e emissions associated to air transportation. This includes limiting business flights, reducing air freight of our products and purchasing Sustainable Aviation Fuel (SAF). | Global | Achieve zero CO2e emissions from transportation by 2030. | We reduced CO2e emissions associated to air transportation by 32%. We entered into the Sustainable Aviation Buyers Alliance (SABA) to purchase SAF, hereby securing significant investment and scalability in SAF solutions. | |||||||||||||||||||||||||||||||
| Decarbonising supply chains | Holistic effort to decarbonise our supply chain, with over 90% of CO2e emissions coming from suppliers, by identifying and implementing levers within high-impact scope 3 categories. | Global | Set an absolute, near-term scope 3 reduction target by the end of 2024. | We started an in-depth supplier engagement programme and roadmap development. This will continue throughout 2024. | |||||||||||||||||||||||||||||||
| Sustainable Markets Initiative (SMI) | Public-private partnership, involving CEOs and leaders from healthcare organisations, that aims to decarbonise healthcare systems by reducing emissions from supply chains, patient care pathways and clinical trials. | Global | Address 3.5 million tonnes of CO2e per year across more than 100 of the members’ largest pharmaceutical suppliers. | The SMI private sector CEOs launched joint, minimum environmental targets for suppliers. | |||||||||||||||||||||||||||||||
| Plastic | Converting to reusable devices | Efforts to move away from single-use devices and convert into reusable devices that have a longer lifespan. While Novo Nordisk has manufactured reusable devices for almost 30 years, we intend to prioritise this conversion going forward. | NWE1, AU2, CN3, CA4 | Build on this year's conversions to raise the ambition level for 2024 and beyond. | We increased our efforts to shift more patients towards reusable devices in Region North West Europe, Australia, China and Canada. | |||||||||||||||||||||||||||||
| Finding fossil-free plastic alternatives | Efforts to find viable, lower-carbon alternatives to fossil-based plastic, which is present in the hundreds of millions of pens we produce every year. | Global | Replace plastic in our products with fossil-free alternatives. | We announced a partnership with the LEGO Group to buy e-methanol from European Energy and use it as a lower-carbon alternative to conventional plastics. Production of the resulting plastic is expected for 2025. | |||||||||||||||||||||||||||||||
| Recycling injection devices | Take-back scheme tasked with recycling injection pens. This includes pilot programmes in a number of countries, and the world's first industry pilot in Denmark, in collaboration with Lilly, Sanofi and Merck. | DK5, UK6, BR7, FR8 | Collect 25% of the injection pens in Denmark within the industry pilot’s first year, and achieve an 85% recycling rate by the end of 2024. | We launched the world’s first industry pilot in Denmark and are currently achieving a 50% recycling rate of the materials in the returned injection pens. | |||||||||||||||||||||||||||||||
 | Access and affordability | Access to Insulin Commitment | Commitment to provide human insulin at a ceiling price of USD 3 per vial to governments and public tenders in 77 LMIC9, as well as USD 2 per vial to selected humanitarian organisations and NGOs. | LMIC | Secure access to affordable insulin to significantly more people living with diabetes in LMIC. | An estimated 2.4 million people accessed care under this commitment. | |||||||||||||||||||||||||||||
Changing Diabetes® in Children | Public-private partnership providing comprehensive care for children and young people living with type 1 diabetes in LMIC. This includes free life-saving medicine and supplies for those up to 25 years old. | 29 countries across AF10, ME11, AS12, SA13 | Reach 100,000 vulnerable children and young people living with type 1 diabetes by 2030. | So far, we have reached 52,249 children and young people, trained 25,314 healthcare professionals and refurbished 406 clinics. | |||||||||||||||||||||||||||||||
| Thermostable insulin | Cross-functional initiative that challenges and re-evaluates the thermal stability of short- and intermediate-acting human insulin products. These are widely used in LMIC and humanitarian settings, where people with diabetes, and without access to stable cooling options, can benefit from revised storage guidance. | LMIC | Reach national approvals in the 72 countries considered for revised storage conditions. | So far, we have 29 national approvals for more flexible storage conditions. | |||||||||||||||||||||||||||||||
| iCARE | Integrated business model, driven by our regional affiliate, that uses partnerships across sub-Saharan Africa to improve access to diabetes care. It does so by establishing and strengthening four building blocks of diabetes management: capacity, affordability, reach and empowerment. | Sub-Saharan Africa | Secure access to diabetes care for vulnerable patients. | We reached 433 thousand people with diabetes and trained 3,523 healthcare professionals. | |||||||||||||||||||||||||||||||
| Africa for Africa | Commitment to significantly increase availability of insulin to people with diabetes on the African continent. It focuses on local production, and will both reduce the environmental footprint from transportation and support creation of local jobs. | Africa | Produce more than 60 million vials by 2026. | We announced a partnership with South African-based pharmaceutical manufacturer Aspen Pharmacare to increase the production of insulin for the African continent. | |||||||||||||||||||||||||||||||
| Partnering for Change | Collaboration between the International Committee of the Red Cross (ICRC), the Danish Red Cross and Novo Nordisk investigating better approaches to care for people living with non-communicable diseases (NCDs) in humanitarian crises. | LB14, IQ15 | Publish nine peer-reviewed articles on NCD care in humanitarian crises. | Six peer-reviewed articles were published, four are under review and an additional two are in the pipeline. | |||||||||||||||||||||||||||||||
| 1. NWE: North West Europe. 2. AU: Australia. 3. CN: China. 4. CA: Canada. 5. DK: Denmark. 6. UK: United Kingdom. 7. BR: Brazil. 8. FR: France. 9. LMIC: Low- and middle-income countries. 10. AF: Africa. 11. ME: Middle East. 12. AS: Asia. 13. SA: South America. 14. LB: Lebanon. 15. IQ: Iraq. | |||||||||||||||||||||||||||||||||||
| Novo Nordisk Annual Report 2023 | Introducing Novo Nordisk Strategic Aspirations Risks Management Consolidated statements Additional information | 103 | ||||||||
| ESG initiatives (continued) | We recognise the need to operate with proper regard to our impact on society and the environment. This table compiles some our most significant initiatives within ESG. | ||||||||||||||||||||||||||||||||||
| Agenda | Name | Description | Reach | Ambition | 2023 Progress | ||||||||||||||||||||||||||||||
| Access and affordability (continued) | MyInsulinRxTM | Programme allowing eligible patients to obtain a monthly supply of any combination of Novo Nordisk insulin products (up to three vials or two packs of pens) for USD 35. | US16 | Provide access to affordable insulin to those in need in the US. | We replaced My99Insulin with MyInsulinRxTM, reducing the out of pocket cost for patients from USD 99 to 35. | |||||||||||||||||||||||||||||
| Patient Assistance Program | Programme offering free diabetes medication to people in need who meet certain eligibility criteria, including annual household income at or below 400% of the government-defined poverty level. | US | Provide access to affordable diabetes medication to those in need in the US. | We provided free insulin to 63 thousand people and free GLP-1-based medicines to 162 thousand people. | |||||||||||||||||||||||||||||||
| Immediate Supply Program | Programme providing a free, one-time, short-term supply of our insulin (up to three vials or two packs of pens) to eligible patients who may be at risk of rationing. | US | Provide access to affordable insulin to those in need in the US. | Nine thousand patients had access to this programme, and we provided education on availability of our affordability offerings. | |||||||||||||||||||||||||||||||
| Copay Savings Offers | Offers reducing the cost for commercially insured patients who are exposed to higher than average copays. | US | Provide access to affordable diabetes medication to those in need in the US. | We provided USD 169 million in copay assistance for insulin and USD 599 million in copay assistance for GLP-1-based medicines. | |||||||||||||||||||||||||||||||
| Prevention | Cities Changing Diabetes | Programme bringing together a network of 47 city-based public-private partnerships that aim to prevent obesity and type 2 diabetes in vulnerable populations and children. | Global | Promote health equity, expand prevention efforts and address barriers to health for vulnerable populations and children. | Over 50 research studies were conducted, more than 250 local partnerships were created or strengthened, and over 85 local interventions on diabetes and obesity were initiated. | |||||||||||||||||||||||||||||
| Partnership with UNICEF | Collaboration aiming to prevent childhood obesity across Latin America and Asia Pacific. It uses policies, programmes and practices to directly impact the nutrition, wellbeing and development of children. | MX17, CO18, BR, ID19 | Directly impact at least 10 million children through programmatic activities by 2026. | So far, the partnership has benefitted more than 2.7 million children and caregivers across Latin America and the Caribbean through direct programmatic reach. | |||||||||||||||||||||||||||||||
| Diversity and inclusion | Global parental leave policy | Policy offering a minimum of eight weeks of paid leave within the first year of becoming a parent to all non-birthing parents globally, regardless of gender. | Global | Ensure that all employees get the opportunity to bond with their child. | Employees worldwide continue to benefit from our enhanced parental leave policy. | |||||||||||||||||||||||||||||
| Global inclusion index | Numerical indicator, included in our annual employee engagement survey, of how employees rate the state of inclusion in Novo Nordisk. It includes four statements covering psychological safety, equal opportunity, sense of belonging and valuing of diverse perspectives. | Global | Sustain progress on the state of inclusion in Novo Nordisk. | Of the more than 47,000 employees who completed the survey, 82% rated the inclusion statements favourable, compared to 78% in 2021 and 82% in 2022. | |||||||||||||||||||||||||||||||
| Yearly equal pay reviews | Equal pay reviews conducted on a yearly basis and followed by corrective actions for confirmed equal pay risk cases. | Global, excluding US | Mitigate bias in pay processes and decisions. | Out of the more than 49,000 positions covered in the pay review, we identified 0.6% with an equal pay gap and we are taking corrective actions. | |||||||||||||||||||||||||||||||
| Gender diversity targets | Two aspirational gender diversity targets that accelerate progress towards balanced gender representation and ensure leadership accountability. | Global | Achieve a balanced gender representation across all managerial levels and a minimum of 45% women and 45% men in senior leadership positions by the end of 2025. | By end of year, 46% of all leaders were women, and 41% of leaders in senior leadership positions were women, compared to 44% and 39%, respectively, at the end of 2022. | |||||||||||||||||||||||||||||||
 | Company culture | Novo Nordisk Way Facilitation | Collaborative assessment that a team of facilitators performs with selected units to evaluate their compliance with the Novo Nordisk Way. | Global | Assess all high-risk units yearly. | 42 units were assessed, one of which was deemed to not be working in accordance with the Novo Nordisk Way. The most frequent findings raised to management teams relate to ambition, empowerment, stakeholder relations, simplicity or agility. | |||||||||||||||||||||||||||||
| Ethics and compliance | Global Ethics and Compliance Framework | The Novo Nordisk Way, our OneCode and international and local standards for responsible business conduct set the foundation for ethics and compliance in Novo Nordisk. This covers anti-fraud, anti-bribery, anti-off-label promotion, transparency in dealing with healthcare professionals and organisations, protection of personal data and respect to human rights. | Global | Ensure that all Novo Nordisk employees act with integrity and in compliance with the ethics and compliance framework. | We launched OneCode, which sets expectations and guides all Novo Nordisk employees on how we act as a company and individuals. | |||||||||||||||||||||||||||||
| Annual Ethics and Compliance Training | Ethics and compliance training conducted on an annual basis and mandatory for all employees, including all new hires. | Global | Train all Novo Nordisk employees annually in ethics and compliance. | 99% of all employees completed and documented their training, with the remaining 1% missing mainly due to employees being on leave. | |||||||||||||||||||||||||||||||
| Business Ethics Reviews | Business ethics reviews performed by Group Internal Audit (GIA) in subsidiaries, production sites, vendors and headquarters to assess the level of ethics and compliance in Novo Nordisk. | Global | Complete 45 business ethics reviews in 2024. | 40 business ethics reviews were completed, compared to 35 reviews in 2022. Consolidated conclusions were reported to Executive Management and the Audit Committee. GIA assessed that the level of ethics and compliance in Novo Nordisk is sound. | |||||||||||||||||||||||||||||||
| 16. US: United States. 17. MX: Mexico. 18. CO: Colombia. 19. ID: Indonesia. | |||||||||||||||||||||||||||||||||||
| Novo Nordisk Annual Report 2023 | Introducing Novo Nordisk Strategic Aspirations Risks Management Consolidated statements Additional information | 104 | ||||||||
| Sustainability frameworks and performance | We strive to follow and adhere to international standards, recommendations and commitments set by globally recognised entities. We are also regularly assessed by independent organisations on our ESG performance. This table compiles some of the most relevant standards, recommendations and commitments we adhere to, as well as assessments we receive. | ||||||||||||||||||||||||||||||||||
| Agenda | Name | Type | Description | Scale | Result | Comment | |||||||||||||||||||||||||||||
 | Value Reporting Foundation (VRF) | Standard | The VRF (previously known as Sustainability Accounting Standards Board, and now part of the IFRS Foundation) enables organisations to provide industry-based disclosures on sustainability risks and opportunities affecting cash flows, access to finance or cost of capital in short, medium or long term. | N/A | N/A | Novo Nordisk reports on VRF in alignment with the ‘Biotechnology & Pharmaceuticals’ standard. We are fully or partially aligned with all the 25 indicators required by VRF. | |||||||||||||||||||||||||||||
| UN Sustainable Development Goals (UN SDGs) | Commitment | The UN SDGs are a set of 17 goals and 169 targets designed to achieve a sustainable future by 2030. The goals cover a range of issues, including poverty, inequality, climate change and environmental sustainability. | N/A | N/A | Novo Nordisk uses SDGs to step up sustainability, drive zero environmental impact by 2030 and improve healthcare for more people. The priority SDGs are Goal 3 (Good health and wellbeing) and Goal 12 (Responsible consumption and production). | ||||||||||||||||||||||||||||||
| UN Global Compact (UNGC) Ten Principles | Commitment | The UNGC requires companies to align strategies and operations with universal principles on human rights, labour, environment and anti-corruption, and to take actions that advance societal goals. | N/A | N/A | Novo Nordisk is committed to UNGC principles and has been an active participant since 2002. We submit the ‘Communication on Progress‘ focusing on governance, human rights, labour, environment and anti-corruption on an annual basis. | ||||||||||||||||||||||||||||||
| Morgan Stanley Capital International (MSCI) ESG Ratings | Assessment | The MSCI ESG Ratings measure an organisation's resilience to financially material ESG risks. They assess how companies manage risks compared to their peers, using a customised methodology to identify industry leaders and laggards. | CCC-AAA | AAA | Novo Nordisk maintained an AAA leadership ESG rating in line with the past six years, and is among the top 5% of pharmaceutical peers, which comprises 267 companies. | ||||||||||||||||||||||||||||||
| Sustainalytics ESG Risk Ratings | Assessment | The Sustainalytics ESG Risk Ratings measure an organisation's exposure to industry-specific, material ESG risks as well as risk management. Sustainalytics ESG Risk Ratings assess the ESG performance of more than 16,000 companies. | >40-0 | 23.1 | Novo Nordisk ranked among the top 15% of the pharmaceutical industry group, with a ranking of 139 out of 912, incurring an ESG risk rating of 23.1 (medium risk). Sustainalytics ESG Risk Ratings range from severe (>40) to negligible (0-10) risk. | ||||||||||||||||||||||||||||||
| Standard & Poor's (S&P) Scores | Assessment | The S&P Global ESG Score measures ESG performance via disclosures, media analysis, modelling approaches and company engagement. The S&P Corporate Sustainability Assessment (CSA) Score is the ESG Score without utilising modelling approaches. | 0-100 | 59 in ESG Score 53 in CSA Score | Novo Nordisk ranked in the 91st percentile within the pharma peer group with an ESG score of 59 and a CSA score of 53. | ||||||||||||||||||||||||||||||
| Corporate Knights Global 100 | Assessment | The Corporate Knights 19th annual ranking of the world’s 100 most sustainable corporations is based on an assessment of over 6,000 public companies with revenue over USD 1 billion. | 100-1 | 53 | Novo Nordisk ranked 1st within Denmark in the 'Pharmaceutical & Biotech Manufacturing Peer Group', 2nd in the healthcare sector globally and 53rd in the overall rank. | ||||||||||||||||||||||||||||||
| Taskforce on Climate-related Financial Disclosures (TCFD) | Standard | The TCFD establishes recommendations for disclosing comparable and consistent information on climate-related aspects across organisations. TCFD is specifically focused on climate governance, strategy, risk management and setting of metrics and targets. | N/A | N/A | Novo Nordisk integrates TCFD-recommended scenarios into its risk management: limiting temperature increase below 2ºC, preferably 1.5ºC as per the Paris Agreement, and a 4ºC increase scenario as high-emission alternative. We have assessed production sites on these scenarios and intend to assess the entire supply chain going forward. | |||||||||||||||||||||||||||||
| Science Based Targets initiative (SBTi) | Standard | The SBTi defines best practice in emissions reduction and net zero targets aligned with climate sciences. It also independently assesses and approves companies’ targets in accordance with its strict criteria. | N/A | N/A | Novo Nordisk has an approved near-term 2030 target in line with the 1.5 °C requirement from SBTi. Additionally, Novo Nordisk is committed to achieving net zero emissions by 2045, with an aim to be aligned with SBTi’s net zero requirements. | ||||||||||||||||||||||||||||||
| Carbon Disclosure Project (CDP) Scores | Assessment | The CDP measures environmental performance through three disclosure stages: awareness, management and leadership. The CDP Scores incentivise companies to measure and manage environmental impacts via climate change and water security questionnaires. | D- to A | A in CDP Climate A- in CDP Water | In 2022, Novo Nordisk maintained an A leadership ranking in CDP Climate and improved from a B to an A- leadership ranking in CDP Water. Scores for the 2023 CDP Climate & Water will be available at: www.cdp.net in February 2024. | ||||||||||||||||||||||||||||||
| UN Guiding Principles on Business and Human Rights (UNGPs) | Commitment | The UNGPs comprise of guidelines for states and companies to prevent, address and remedy adverse impacts on human rights in their business operations. | N/A | N/A | In accordance with the UNGPs, Novo Nordisk commits to the responsibility to respect human rights throughout own operations and value chains, as elaborated in our Human Rights Commitment. In adherence with the UN Guiding Principles Reporting Framework, Novo Nordisk annually publishes a Human Rights Report which outlines our latest work towards meeting this responsibility. Please refer to: www.novonordisk.com/sustainable-business/esg-portal/social.html. | |||||||||||||||||||||||||||||
| Access To Medicine Foundation (ATMI) Score | Assessment | The ATMI evaluates 20 of the world’s largest pharmaceutical companies on their performance on priority access-to-medicine topics. Companies are assessed based on research and development, governance of access and product delivery. | 0-5 | 2.97 | In 2022, Novo Nordisk ranked 11th, with the strongest performance in the governance of access area, where a score of 4.43 out of 5 was achieved. ATMI will release updated ranking for top 20 companies in 2024. | ||||||||||||||||||||||||||||||
| World Economic Forum (WEF) 'Good Work Framework' | Standard | The WEF 'Good Work Framework' sets out five objectives and goals: promote fair pay and social justice; provide flexibility and protection; deliver on health and well-being; drive diversity, equity and inclusion; foster employability and learning culture. | N/A | N/A | Novo Nordisk published a WEF 'Good Work Framework' case study in March 2023 titled 'Making Inclusivity a Reality'. It featured work practices and aspirational targets in D&I. | |||||||||||||||||||||||||||||
| OECD Guidelines for Multinational Enterprises on Responsible Business Conduct (OECD Guidelines) | Recommendation | The OECD Guidelines are government-backed recommendations on responsible business conduct with the purpose of fostering business contribution to sustainable development and addressing adverse impacts on people, planet and society that stem from business activities. | N/A | N/A | Novo Nordisk adheres to the OECD Guidelines on a corporate level as part of our commitment to ethical business conduct. We set expectations in line with the OECD Guidelines towards Novo Nordisk suppliers by integrating the OECD Guidelines to our Responsible Sourcing Standards. | ||||||||||||||||||||||||||||||
| Novo Nordisk Annual Report 2023 | Financial statements of the parent company | 105 | ||||||||
| DKK million | Note | 2023 | 2022 | ||||||||||||||
| Net sales | 2 | 198,078 | 142,656 | ||||||||||||||
| Cost of goods sold | 3 | (38,433) | (31,060) | ||||||||||||||
| Gross profit | 159,645 | 111,596 | |||||||||||||||
| Sales and distribution costs | 3 | (42,291) | (37,476) | ||||||||||||||
| Research and development costs | 3 | (28,731) | (19,209) | ||||||||||||||
| Administrative costs | 3 | (2,002) | (2,135) | ||||||||||||||
| Other operating income and expenses | 1,315 | 1,012 | |||||||||||||||
| Operating profit | 87,936 | 53,788 | |||||||||||||||
| Profit in subsidiaries, net of tax | 8 | 15,973 | 19,238 | ||||||||||||||
| Financial income | 4 | 3,636 | 567 | ||||||||||||||
| Financial expenses | 4 | (4,581) | (6,280) | ||||||||||||||
| Profit before income taxes | 102,964 | 67,313 | |||||||||||||||
| Income taxes | (19,557) | (11,975) | |||||||||||||||
| Net profit | 83,407 | 55,338 | |||||||||||||||
| DKK million | Note | 2023 | 2022 | ||||||||||||||
| Assets | |||||||||||||||||
| Intangible assets | 6 | 28,755 | 19,449 | ||||||||||||||
| Property, plant and equipment | 7 | 53,822 | 34,547 | ||||||||||||||
| Financial assets | 8 | 87,543 | 78,306 | ||||||||||||||
| Other receivables and prepayments | 9 | 1,238 | — | ||||||||||||||
| Total non-current assets | 171,358 | 132,302 | |||||||||||||||
| Raw materials | 8,415 | 5,659 | |||||||||||||||
| Work in progress | 16,211 | 13,657 | |||||||||||||||
| Finished goods | 4,311 | 2,975 | |||||||||||||||
| Inventories | 28,937 | 22,291 | |||||||||||||||
| Trade receivables | 2,348 | 1,877 | |||||||||||||||
| Amounts owed by affiliated companies | 30,398 | 18,192 | |||||||||||||||
| Tax receivables | 8 | 7 | |||||||||||||||
| Other receivables and prepayments | 9 | 5,494 | 3,185 | ||||||||||||||
| Receivables | 38,248 | 23,261 | |||||||||||||||
| Marketable securities | 15,838 | 10,921 | |||||||||||||||
| Derivative financial instruments | 11 | 2,344 | 2,727 | ||||||||||||||
| Cash at bank | 10,623 | 9,795 | |||||||||||||||
| Total current assets | 95,990 | 68,995 | |||||||||||||||
| Total assets | 267,348 | 201,297 | |||||||||||||||
| DKK million | Note | 2023 | 2022 | ||||||||||||||
| Equity and liabilities | |||||||||||||||||
| Share capital | 10 | 451 | 456 | ||||||||||||||
| Net revaluation reserve | 24,696 | 17,785 | |||||||||||||||
| Development costs reserve | 1,756 | 1,524 | |||||||||||||||
| Reserve for cash flow hedges and exchange rate adjustments | 1,594 | 1,045 | |||||||||||||||
| Retained earnings | 77,185 | 62,091 | |||||||||||||||
| Total equity | 105,682 | 82,901 | |||||||||||||||
| Borrowings | 12 | 16,855 | 21,199 | ||||||||||||||
| Deferred income tax liabilities | 5 | 6,282 | 2,967 | ||||||||||||||
| Other provisions | 13 | 1,280 | 1,303 | ||||||||||||||
| Total non-current liabilities | 24,417 | 25,469 | |||||||||||||||
| Borrowings | 12 | 5,072 | 169 | ||||||||||||||
| Derivative financial instruments | 11 | 1,272 | 2,903 | ||||||||||||||
| Trade payables | 6,778 | 4,782 | |||||||||||||||
| Amounts owed to affiliated companies | 108,865 | 74,059 | |||||||||||||||
| Tax payables | 3,046 | 3,115 | |||||||||||||||
| Other liabilities | 12,216 | 7,899 | |||||||||||||||
| Total current liabilities | 137,249 | 92,927 | |||||||||||||||
| Total liabilities | 161,666 | 118,396 | |||||||||||||||
| Total equity and liabilities | 267,348 | 201,297 | |||||||||||||||
| Novo Nordisk Annual Report 2023 | Financial statements of the parent company | 106 | ||||||||
| DKK million | Share capital | Net revaluation reserve | Reserve for cash flow hedges and exchange rate adjustments | Development costs reserve | Retained earnings | 2023 | 2022 | ||||||||||||||||||||||
| Balance at the beginning of the year | 456 | 17,785 | 1,045 | 1,524 | 62,091 | 82,901 | 70,469 | ||||||||||||||||||||||
| Appropriated from net profit | 33,116 | 33,116 | 29,532 | ||||||||||||||||||||||||||
| Appropriated from net profit to net revaluation reserve | 8,304 | 8,304 | (2,144) | ||||||||||||||||||||||||||
| Exchange rate adjustments of investments in subsidiaries | (1,393) | (1,393) | 2,291 | ||||||||||||||||||||||||||
| Realisation of previously deferred (gains)/losses on cash flow hedges | (998) | (998) | 1,610 | ||||||||||||||||||||||||||
| Deferred gains/(losses) on cash flow hedges incurred during the period | 1,547 | 1,547 | 998 | ||||||||||||||||||||||||||
| Development costs | 232 | (232) | — | — | |||||||||||||||||||||||||
| Other adjustments | 1,284 | 1,284 | 976 | ||||||||||||||||||||||||||
| Transactions with owners: | |||||||||||||||||||||||||||||
| Total dividend for the year | 41,987 | 41,987 | 27,950 | ||||||||||||||||||||||||||
| Interim dividends paid during the year | (13,430) | (13,430) | (9,613) | ||||||||||||||||||||||||||
| Dividends paid for prior year | (18,337) | (18,337) | (15,690) | ||||||||||||||||||||||||||
| Reduction of the B share capital | (5) | 5 | — | — | |||||||||||||||||||||||||
| Purchase of treasury shares | (29,924) | (29,924) | (24,086) | ||||||||||||||||||||||||||
| Share-based payments (note 3) | 562 | 562 | 433 | ||||||||||||||||||||||||||
| Tax related to restricted stock units | 63 | 63 | 175 | ||||||||||||||||||||||||||
| Balance at the end of the year | 451 | 24,696 | 1,594 | 1,756 | 77,185 | 105,682 | 82,901 | ||||||||||||||||||||||
| Proposed appropriation of net profit: | |||||||||||||||||||||||||||||
| Interim dividend for the year | 13,430 | 9,613 | |||||||||||||||||||||||||||
| Final dividend for the year | 28,557 | 18,337 | |||||||||||||||||||||||||||
| Appropriated to net revaluation reserve | 8,304 | (2,144) | |||||||||||||||||||||||||||
| Transferred to retained earnings | 33,116 | 29,532 | |||||||||||||||||||||||||||
| Distribution of net profit | 83,407 | 55,338 | |||||||||||||||||||||||||||
| Novo Nordisk Annual Report 2023 | Financial statements of the parent company | 107 | ||||||||
| DKK million | 2023 | 2022 | ||||||||||||
| Sales by business segment | ||||||||||||||
| Diabetes and Obesity care | 197,969 | 142,413 | ||||||||||||
| Rare disease | 109 | 243 | ||||||||||||
| Total sales | 198,078 | 142,656 | ||||||||||||
| Sales by geographical segment | ||||||||||||||
| North America Operations | 124,860 | 79,953 | ||||||||||||
| International Operations: | ||||||||||||||
| EMEA | 40,038 | 32,789 | ||||||||||||
| China | 12,800 | 14,412 | ||||||||||||
| Rest of World | 20,380 | 15,502 | ||||||||||||
| Total sales | 198,078 | 142,656 | ||||||||||||
| DKK million | 2023 | 2022 | ||||||||||||
| Wages and salaries | 19,525 | 14,656 | ||||||||||||
| Share-based payment costs | 562 | 433 | ||||||||||||
| Pensions | 1,709 | 1,281 | ||||||||||||
| Other social security contributions | 301 | 247 | ||||||||||||
| Other employee costs | 1,039 | 629 | ||||||||||||
| Total employee costs | 23,136 | 17,246 | ||||||||||||
| Average number of full-time employees | 23,754 | 19,201 | ||||||||||||
| Year-end number of full-time employees | 26,111 | 20,926 | ||||||||||||
| Novo Nordisk Annual Report 2023 | Financial statements of the parent company | 108 | ||||||||
| DKK million | 2023 | 2022 | ||||||||||||
| Interest income relating to subsidiaries | 487 | 365 | ||||||||||||
| Interest income relating to external counterparties | 936 | 170 | ||||||||||||
| Foreign exchange gain (net) | 772 | — | ||||||||||||
| Financial gain from forward contracts (net) | 1,263 | — | ||||||||||||
| Capital gain from marketable securities | 144 | — | ||||||||||||
| Other financial income | 34 | 32 | ||||||||||||
| Total financial income | 3,636 | 567 | ||||||||||||
| Interest expenses relating to subsidiaries | 4,225 | 1,150 | ||||||||||||
| Result of associated company | 38 | 4 | ||||||||||||
| Foreign exchange loss (net) | — | 2,705 | ||||||||||||
| Financial loss from forward contracts (net) | — | 1,659 | ||||||||||||
| Capital loss from marketable securities | — | 463 | ||||||||||||
| Other financial expenses | 318 | 299 | ||||||||||||
| Total financial expenses | 4,581 | 6,280 | ||||||||||||
| DKK million | 2023 | 2022 | ||||||||||||
| Net deferred tax asset/(liability) at the beginning of the year | (2,967) | 228 | ||||||||||||
| Income/(charge) to the income statement | (2,797) | (2,629) | ||||||||||||
| Income/(charge) to equity | (518) | (566) | ||||||||||||
| Net deferred tax asset/(liability) at the end of the year | (6,282) | (2,967) | ||||||||||||
| DKK million | Intellectual property rights | Software and other intangibles | 2023 | 2022 | |||||||||||||||||||
| Cost at the beginning of the year | 20,167 | 3,653 | 23,820 | 12,572 | |||||||||||||||||||
| Additions during the year | 11,347 | 490 | 11,837 | 11,399 | |||||||||||||||||||
| Disposals during the year | — | — | — | (151) | |||||||||||||||||||
| Cost at the end of the year | 31,514 | 4,143 | 35,657 | 23,820 | |||||||||||||||||||
| Amortisation at the beginning of the year | 2,672 | 1,699 | 4,371 | 3,462 | |||||||||||||||||||
| Amortisation during the year | 840 | 171 | 1,011 | 810 | |||||||||||||||||||
| Impairment losses for the year | 1,499 | 21 | 1,520 | 250 | |||||||||||||||||||
| Amortisation and impairment losses reversed on disposals during the year | — | — | — | (151) | |||||||||||||||||||
| Amortisation at the end of the year | 5,011 | 1,891 | 6,902 | 4,371 | |||||||||||||||||||
| Carrying amount at the end of the year | 26,503 | 2,252 | 28,755 | 19,449 | |||||||||||||||||||
| Intangible assets primarily relate to intellectual property rights, internally developed software and costs related to major IT projects. Intangible assets which are not yet available for use amount to DKK 19,993 million (DKK 10,007 million in 2022). | |||||||||||||||||||||||
| Novo Nordisk Annual Report 2023 | Financial statements of the parent company | 109 | ||||||||
| DKK million | Land and buildings | Plant and machinery | Other equipment | Assets under construction | 2023 | 2022 | ||||||||||||||||||||
| Cost at the beginning of the year | 23,801 | 25,384 | 4,489 | 12,018 | 65,692 | 55,995 | ||||||||||||||||||||
| Additions during the year | 822 | 219 | 150 | 21,229 | 22,420 | 10,223 | ||||||||||||||||||||
| Disposals during the year | (330) | (849) | (266) | (316) | (1,761) | (526) | ||||||||||||||||||||
| Transfer from/(to) other items | 597 | 800 | 509 | (1,906) | — | — | ||||||||||||||||||||
| Cost at the end of the year | 24,890 | 25,554 | 4,882 | 31,025 | 86,351 | 65,692 | ||||||||||||||||||||
| Depreciation and impairment losses at the beginning of the year | 11,328 | 16,918 | 2,899 | — | 31,145 | 28,988 | ||||||||||||||||||||
| Depreciation for the year | 1,142 | 1,180 | 426 | — | 2,748 | 2,597 | ||||||||||||||||||||
| Impairment losses for the year | 5 | 67 | 21 | 316 | 409 | 36 | ||||||||||||||||||||
| Depreciation reversed on disposals during the year | (326) | (855) | (276) | (316) | (1,773) | (476) | ||||||||||||||||||||
| Depreciation and impairment losses at the end of the year | 12,149 | 17,310 | 3,070 | — | 32,529 | 31,145 | ||||||||||||||||||||
| Carrying amount at the end of the year | 12,741 | 8,244 | 1,812 | 31,025 | 53,822 | 34,547 | ||||||||||||||||||||
| Of which related to leased property, plant and equipment | 1,011 | — | 72 | — | 1,083 | 580 | ||||||||||||||||||||
| Leased property, plant and equipment primarily relates to lease of office buildings, warehouses, laboratories and vehicles. | ||||||||||||||||||||||||||
| Novo Nordisk Annual Report 2023 | Financial statements of the parent company | 110 | ||||||||
| DKK million | Investments in subsidiaries | Amounts owed by affiliated companies | Investment in associated company | Other securities and investments | 2023 | 2022 | ||||||||||||||||||||
| Cost at the beginning of the year | 54,660 | 4,975 | 105 | 757 | 60,497 | 53,987 | ||||||||||||||||||||
| Investments during the year | 5,170 | 800 | 124 | 6,094 | 6,697 | |||||||||||||||||||||
| Divestments and repayments during the year | (29) | (3,328) | (63) | (3,420) | (187) | |||||||||||||||||||||
| Cost at the end of the year | 59,801 | 2,447 | 105 | 818 | 63,171 | 60,497 | ||||||||||||||||||||
| Value adjustments at the beginning of the year | 34,407 | 292 | 90 | (268) | 34,521 | 35,933 | ||||||||||||||||||||
| Profit/(loss) before tax | 18,112 | 18,112 | 19,713 | |||||||||||||||||||||||
| Share of result after tax in associated company | (38) | (38) | (4) | |||||||||||||||||||||||
| Income taxes on profit for the year | (1,332) | (1,332) | (1,596) | |||||||||||||||||||||||
| Market value adjustment | (6) | (6) | (135) | |||||||||||||||||||||||
| Dividends received | (9,127) | (9,127) | (23,305) | |||||||||||||||||||||||
| Divestments during the year | 29 | 25 | 54 | — | ||||||||||||||||||||||
| Effect of exchange rate adjustment charged to the income statement | (271) | (96) | (367) | 220 | ||||||||||||||||||||||
| Effect of exchange rate adjustment charged to equity | (2,285) | (2,285) | 1,768 | |||||||||||||||||||||||
| Other adjustments | 1,467 | 1,467 | 1,927 | |||||||||||||||||||||||
| Value adjustments at the end of the year | 41,271 | 21 | 52 | (345) | 40,999 | 34,521 | ||||||||||||||||||||
| Unrealised internal profit at the beginning of the year | (16,712) | (16,712) | (18,356) | |||||||||||||||||||||||
| Unrealised internal profit movements in the year | (807) | (807) | 1,121 | |||||||||||||||||||||||
| Effect of exchange rate adjustment charged to equity | 892 | 892 | 523 | |||||||||||||||||||||||
| Unrealised internal profit at the end of the year | (16,627) | — | — | — | (16,627) | (16,712) | ||||||||||||||||||||
| Carrying amount at the end of the year | 84,445 | 2,468 | 157 | 473 | 87,543 | 78,306 | ||||||||||||||||||||
For a list of companies in the Novo Nordisk Group, refer to note 5.7 to the consolidated financial statements. | ||||||||||||||||||||||||||
| DKK million | 2023 | 2022 | ||||||||||||
| Within 1 year | 5,072 | 169 | ||||||||||||
| 1-5 years | 12,889 | 12,627 | ||||||||||||
| More than 5 years | 3,966 | 8,572 | ||||||||||||
| Total borrowings | 21,927 | 21,368 | ||||||||||||
| Novo Nordisk Annual Report 2023 | Financial statements of the parent company | 111 | ||||||||
| DKK million | 2023 | 2022 | ||||||||||||
Statutory audit1 | 9 | 15 | ||||||||||||
| Audit-related services | 2 | 2 | ||||||||||||
| Tax advisory services | 4 | 1 | ||||||||||||
| Other services | 15 | 9 | ||||||||||||
| Total fee to statutory auditors | 30 | 27 | ||||||||||||
| 1. 2022 statutory audit fee includes DKK 6 million of additional fee related to 2021. | ||||||||||||||
| DKK million | 2023 | 2022 | ||||||||||||
| Commitments | ||||||||||||||
Leases1 | 804 | 95 | ||||||||||||
| Research and development obligations | 18,448 | 11,778 | ||||||||||||
Research and development - potential milestones2 | 25,218 | 6,727 | ||||||||||||
Commercial product launch - potential milestones2 | 11,780 | 7,746 | ||||||||||||
| Purchase obligations relating to investments in property plant and equipment | 1,072 | 232 | ||||||||||||
| Purchase obligation relating to contract manufactures | 33,107 | 13,362 | ||||||||||||
| Other purchase obligations | 2,742 | 2,533 | ||||||||||||
Guarantees given for subsidiaries3 | 35,608 | 31,858 | ||||||||||||
| Other guarantees | 993 | 127 | ||||||||||||
1. Lease commitments predominantly relate to estimated variable property taxes and low value assets. 2. Potential milestone payments are associated with uncertainty as they are linked to successful achievements in research activities; refer to note 5.2 to the consolidated financial statements. 3. Guarantees given for subsidiaries mainly relate to guarantees towards Novo Nordisk Finance (Netherlands) B.V. related to issuance of Eurobonds. | ||||||||||||||