Exhibit 99.1
First Quarter 2012 Investor Presentation
Cautionary Statements
This presentation contains certain performance measures determined by methods other than in accordance with accounting principles generally accepted in the United States of America (“GAAP”). Management of Ameris Bancorp (the “Company”) uses these non-GAAP measures in its analysis of the Company’s performance. These measures are useful when evaluating the underlying performance and efficiency of the Company’s operations and balance sheet. The Company’s management believes that these non-GAAP measures provide a greater understanding of ongoing operations, enhance comparability of results with prior periods and demonstrate the effects of significant gains and charges in the current period. The Company’s management believes that investors may use these non-GAAP financial measures to evaluate the Company’s financial performance without the impact of unusual items that may obscure trends in the Company’s underlying performance. These disclosures should not be viewed as a substitute for financial measures determined in accordance with GAAP, nor are they necessarily comparable to non-GAAP performance measures that may be presented by other companies. Tangible common equity and Tier 1 capital ratios are non-GAAP measures. The Company calculates the Tier 1 capital using current call report instructions. The Company’s management uses these measures to assess the quality of capital and believes that investors may find them useful in their evaluation of the Company. These capital measures may, or may not be necessarily comparable to similar capital measures that may be presented by other companies.
This presentation may contain statements that constitute “forward-looking statements” within the meaning of Section 27A of the Securities Act of 1933, as amended, and Section 21E of the Securities Exchange Act of 1934, as amended. The words “believe”, “estimate”, “expect”, “intend”, “anticipate” and similar expressions and variations thereof identify certain of such forward-looking statements, which speak only as of the dates which they were made. The Company undertakes no obligation to publicly update or revise any forward-looking statements, whether as a result of new information, future events or otherwise. Readers are cautioned that any such forward-looking statements are not guarantees of future performance and involve risks and uncertainties and that actual results may differ materially from those indicated in the forward-looking statements as a result of various factors. Readers are cautioned not to place undue reliance on these forward-looking statements and are referred to the Company’s periodic filings with the Securities and Exchange Commission for a summary of certain factors that may impact the Company’s results of operations and financial conditio
2
Corporate Profile
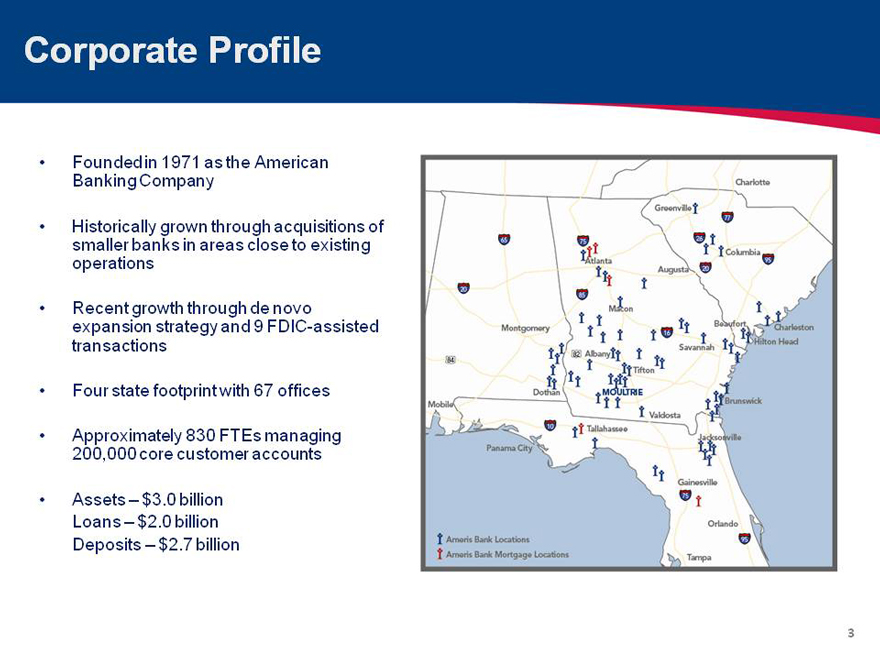
• Founded in 1971 as the American Banking Company
• Historically grown through acquisitions of smaller banks in areas close to existing operations
• Recent growth through de novo expansion strategy and 9 FDIC-assisted transactions
• Four state footprint with 67 offices
• Approximately 830 FTEs managing 200,000 core customer accounts
• Assets – $3.0 billion Loans – $2.0 billion Deposits – $2.7 billion
3
Experienced Management Team
Name, Position
Experience
(Banking / Ameris)
Previous Experience
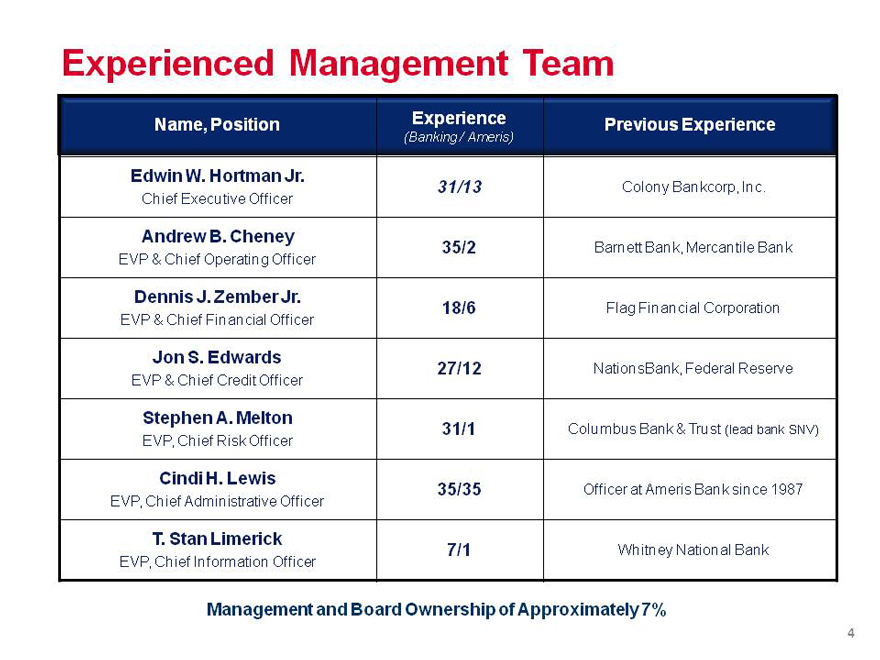
Edwin W. Hortman Jr.
Chief Executive Officer
31/13
Colony Bankcorp, Inc.
Andrew B. Cheney
EVP & Chief Operating Officer
35/2
Barnett Bank, Mercantile Bank
Dennis J. Zember Jr.
EVP & Chief Financial Officer
18/6
Flag Financial Corporation
Jon S. Edwards
EVP & Chief Credit Officer
27/12
NationsBank, Federal Reserve
Stephen A. Melton
EVP, Chief Risk Officer
31/1
Columbus Bank & Trust (lead bank SNV)
Cindi H. Lewis
EVP, Chief Administrative Officer
35/35
Officer at Ameris Bank since 1987
T. Stan Limerick
EVP, Chief Information Officer
7/1
Whitney National Bank
Management and Board Ownership of Approximately 7%
4
Current Focus
Position Ameris Bank as a Consolidator in our 4 Southeastern States.
• FDIC Assisted acquisitions – Slowing pipeline of opportunities but our markets still have majority of potential deals. Interest in both Strategic (builds market share) and Financial (builds excess TCE and T1 capital).
• Traditional M&A – Rapidly growing pipeline of opportunities in our footprint on larger, thinly capitalized institutions.
Realize the positive impacts of our Earning Strategies.
• Build momentum on growing earning assets and additional revenue opportunities.
• Build unique non-interest lines of businesses to drive non-interest income to top quartile of our peer group.
• Gain operating leverage from continued consolidation. Significantly reduce non-provision credit related costs such that strong PTPP earnings drive higher EPS.
Continue Improving Credit Quality.
• Continue to manage strategies that restore historic quality to our Balance Sheet.
• Reduce credit-related operating expenses incrementally throughout 2012.
5
First Quarter Update
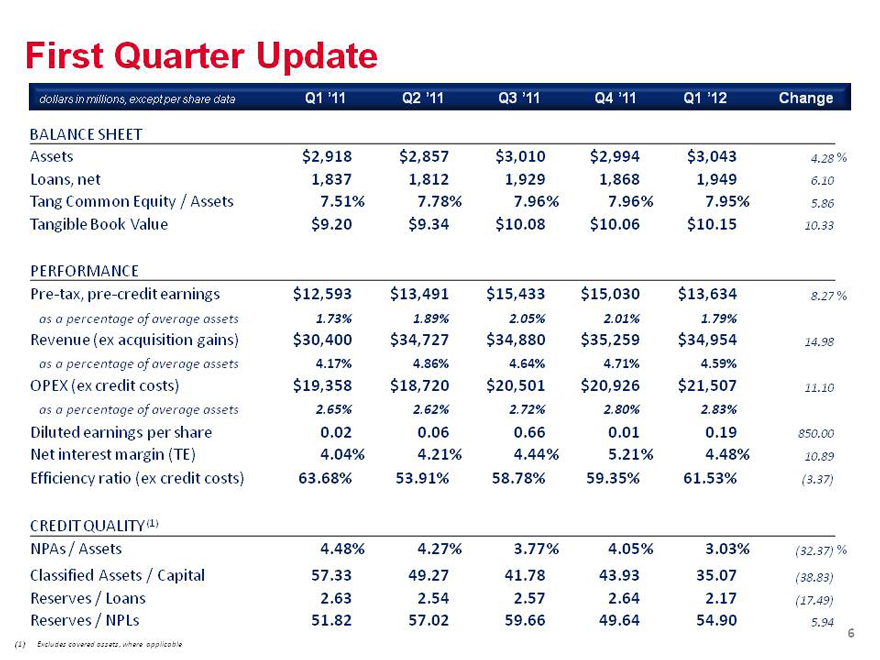
dollars in millions, except per share data Q1’11’ Q2’11’ Q3’11’ Q4’11’ Q1’12’ Change
BALANCE SHEET
Assets $2,918 $2,857 $3,010 $2,994 $3,043 4.28%
Loans, net 1,837 1,812 1,929 1,868 1,949 6.10
Tang Common Equity / Assets 7.51% 7.78% 7.96% 7.96% 7.95% 5.86
Tangible Book Value $9.20 $9.34 $10.08 $10.06 $10.15 10.33
PERFORMANCE
Pre-tax, pre-credit earnings $12,593 $13,491 $15,433 $15,030 $13,634 8.27%
as a percentage of average assets 1.73% 1.89% 2.05% 2.01% 1.79%
Revenue (ex acquisition gains) $30,400 $34,727 $34,880 $35,259 $34,954 14.98
as a percentage of average assets 4.17% 4.86% 4.64% 4.71% 4.59%
OPEX (ex credit costs) $19,358 $18,720 $20,501 $20,926 $21,507 11.10
as a percentage of average assets 2.65% 2.62% 2.72% 2.80% 2.83%
Diluted earnings per share 0.02 0.06 0.66 0.01 0.19 850.00
Net interest margin (TE) 4.04% 4.21% 4.44% 5.21% 4.48% 10.89
Efficiency ratio (ex credit costs) 63.68% 53.91% 58.78% 59.35% 61.53%(3.37)
CREDIT QUALITY (1)
NPAs / Assets 4.48% 4.27% 3.77% 4.05% 3.03%(32.37)%
Classified Assets / Capital 57.33 49.27 41.78 43.93 35.07(38.83)
Reserves / Loans 2.63 2.54 2.57 2.64 2.17(17.49)
Reserves / NPLs 51.82 57.02 59.66 49.64 54.90 5.94
(1) Excludes covered assets, where applicable
6
Earnings Growth Expansion/Remix of Earnings Assets
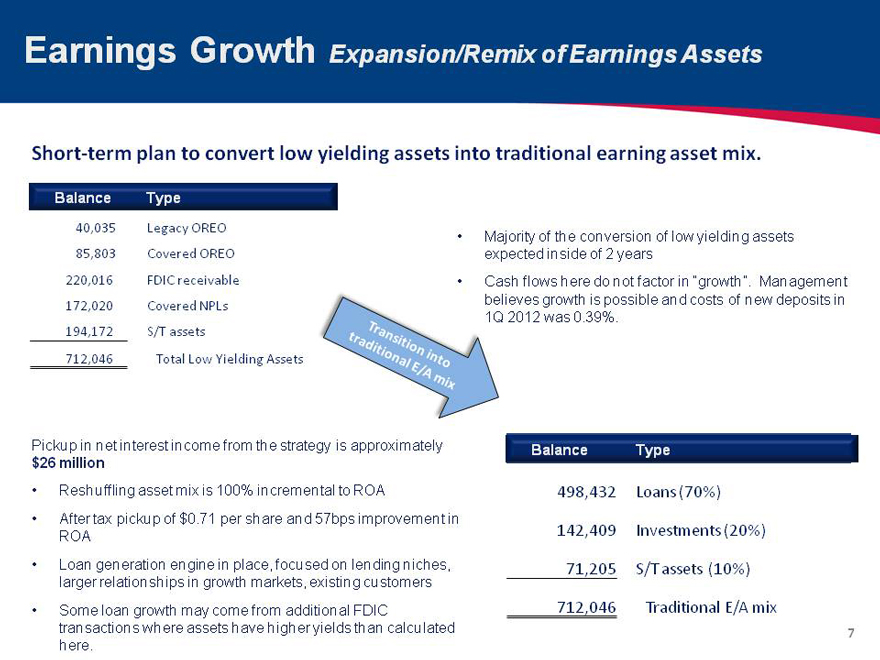
Short-term plan to convert low yielding assets into traditional earning asset mix.
Balance Type
40,035 Legacy OREO
85,803 Covered OREO
220,016 FDIC receivable
172,020 Covered NPLs
194,172 S/T assets
712,046 Total Low Yielding Assets
• Majority of the conversion of low yielding assets expected inside of 2 years
• Cash flows here do not factor in “growth”. Management believes growth is possible and costs of new deposits in
1Q 2012 was 0.39%.
Transition into traditional E/A mix
Pickup in net interest income from the strategy is approximately $26 million
• Reshuffling asset mix is 100% incremental to ROA
• After tax pickup of $0.71 per share and 57bps improvement in ROA
• Loan generation engine in place, focused on lending niches, larger relationships in growth markets, existing customers
• Some loan growth may come from additional FDIC transactions where assets have higher yields than calculated here.
Balance Type
498,432 Loans (70%)
142,409 Investments (20%)
71,205 S/T assets (10%)
712,046 Traditional E/A mix
7
Earnings Growth Non-Interest Income
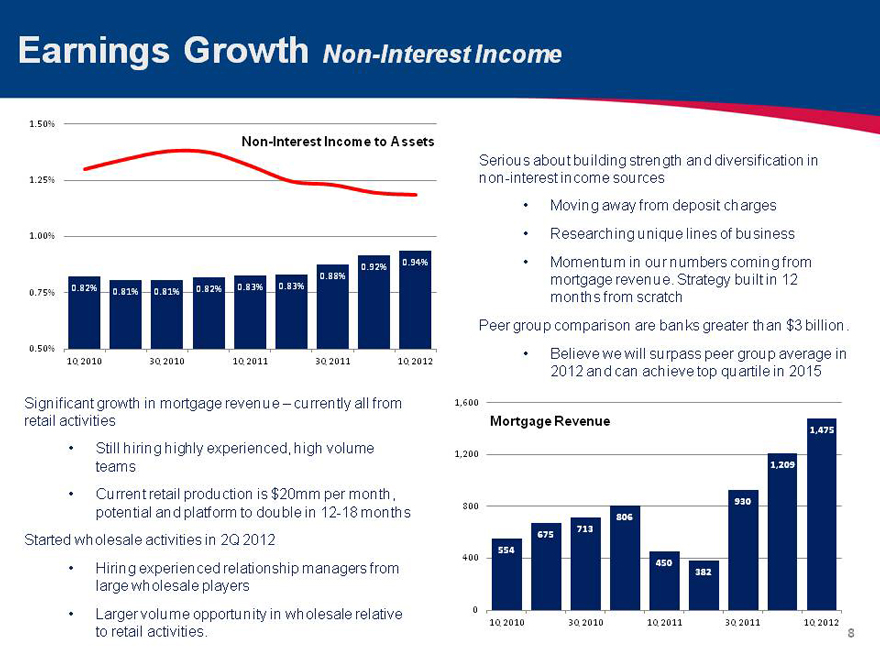
1.50%
Non-Interest Income to Assets
1.25%
1.00%
0.94%
0.88% 0.92%
0.82% 0.82% 0.83% 0.83%
0.75% 0.81% 0.81%
0.50%
1Q 2010 3Q 2010 1Q 2011 3Q 2011 1Q 2012
Serious about building strength and diversification in non-interest income sources
• Moving away from deposit charges
• Researching unique lines of business
• Momentum in our numbers coming from mortgage revenue. Strategy built in 12 months from scratch Peer group comparison are banks greater than $3 billion.
• Believe we will surpass peer group average in 2012 and can achieve top quartile in 2015
Significant growth in mortgage revenue – currently all from retail activities
• Still hiring highly experienced, high volume teams
• Current retail production is $20mm per month, potential and platform to double in 12-18 months Started wholesale activities in 2Q 2012
• Hiring experienced relationship managers from large wholesale players
• Larger volume opportunity in wholesale relative to retail activities.
1,600
Mortgage Revenue 1,475
1,200
1,209
930
800
806 713 675 554
400
450 382
0
1Q 2010 3Q 2010 1Q 2011 3Q 2011 1Q 2012
8
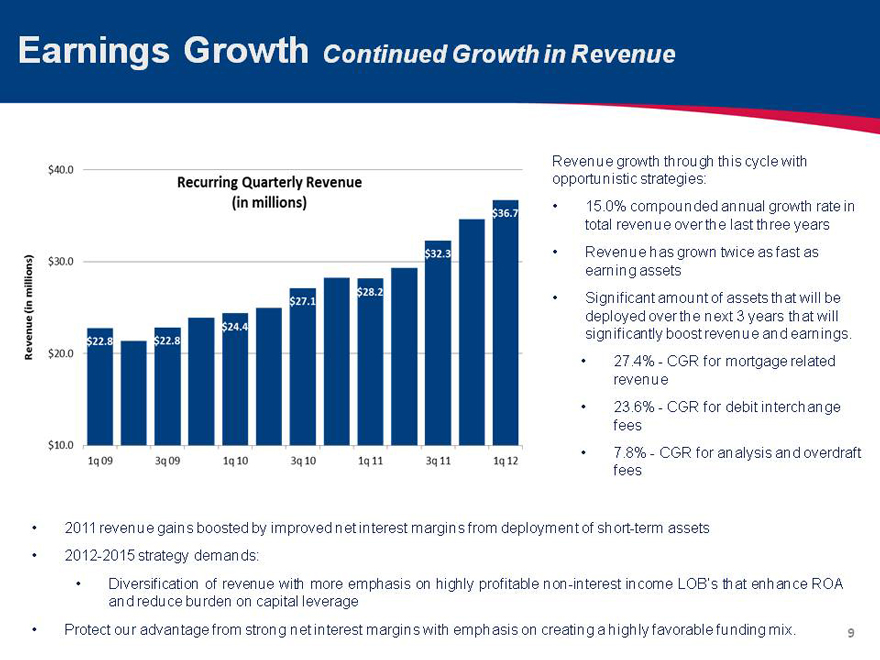
Earnings Growth Continued Growth in Revenue
Revenue growth through this cycle with opportunistic strategies:
• 15.0% compounded annual growth rate in total revenue over the last three years
• Revenue has grown twice as fast as earning assets
• Significant amount of assets that will be deployed over the next 3 years that will significantly boost revenue and earnings.
• 27.4%—CGR for mortgage related revenue
• 23.6%—CGR for debit interchange fees
• 7.8%—CGR for analysis and overdraft fees
• 2011 revenue gains boosted by improved net interest margins from deployment of short-term assets
• 2012-2015 strategy demands:
• Diversification of revenue with more emphasis on highly profitable non-interest income LOB’s that enhance ROA and reduce burden on capital leverage
• Protect our advantage from strong net interest margins with emphasis on creating a highly favorable funding mix.
9
Earnings Growth Operating Expense Leverage
5 Facts that Point To Significant Leverage in Operating Expense
SAD department fully staffed
• $5.2 million in annualized cost will trend down over the next couple years as covered and classified assets decrease.
Corporate functions can accommodate growth with very little incremental cost
• Incorporated 9 acquisitions and $1.5 billion in assets in less than 30 months with only 16 additions in staff (excluding SAD functions).
• Headed by business experts with significant experience. Understand the efficiency element of M&A
FDIC Insurance is going to decrease substantially
• $4.1 million reduction in FDIC insurance starting in January 2013 when the prepaid assessment is fully amortized.
M&A opportunities exist where primary catalyst for the deal is operating leverage
• Our M&A strategy is building in existing markets where we can leverage current management and facilities
• Our core processor contract allows for 50% reduction in processing costs in target’s d/p costs.
• Believe we can integrate targets with less than 2.00% incremental opex/assets
Non-provision credit costs are moderating quickly
• $24.7 million in 2011 and $12.7 million in 1Q 2012. Expect moderation in these costs in 2H 2012 and into 2013 as credit quality has improved to peer level.
10
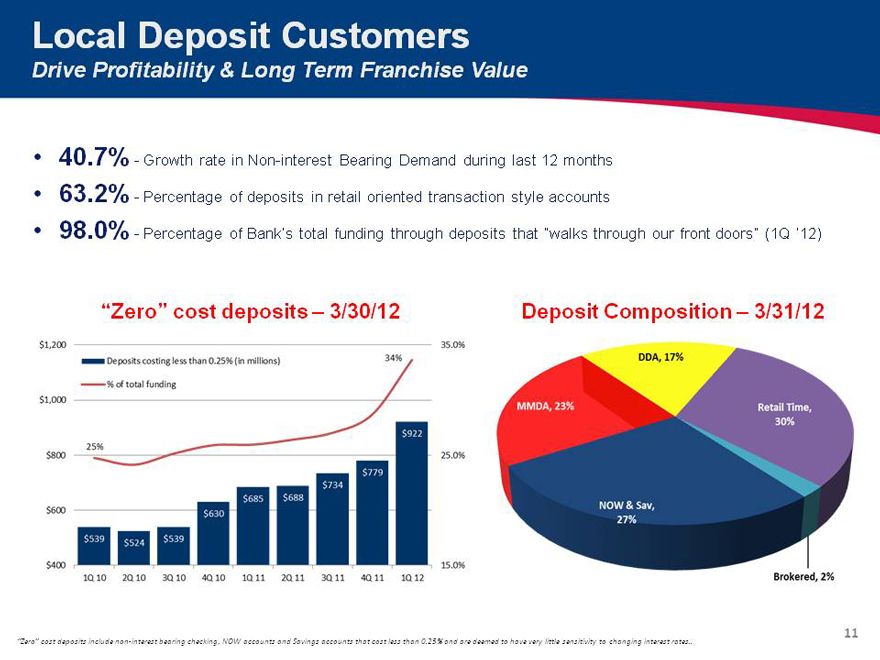
Local Deposit Customers
Drive Profitability & Long Term Franchise Value
• 40.7%—Growth rate in Non-interest Bearing Demand during last 12 months
• 63.2%—Percentage of deposits in retail oriented transaction style accounts
• 98.0%—Percentage of Bank’s total funding through deposits that “walks through our front doors” (1Q ‘12)
“Zero” cost deposits – 3/30/12
$1,200,$1,000,$800,$600,$400,1Q 10, 2Q 10, 3Q 10, 4Q 10, 1Q 11, 2Q 11, 3Q 11, 4Q 11, 1Q 12
15.0%, 25.0%, 35.0%, 34%, 25%,$539, $524, $539, $630, $585, $638, $688, $734, $779, $922
Deposits costing less than 0.25% (in millions)
% of total funding
Deposit Composition – 3/31/12
DDA,17%, MMDA,23%, NOW&Sav,27%, Retail Time,30%. Brokered,2%
“Zero” cost deposits include non-interest bearing checking, NOW accounts and Savings accounts that cost less than 0.25% and are deemed to have very little sensitivity to changing interest rates
11

Strong Core Operating Performance
Pre-Tax, Pre-Credit Earnings(1) ($000s)
$18,000 $12,000 $6,000 $- Q4 09 Q1 10 Q2’10 Q3’10 Q4’10 Q1’11 Q2’11 Q3’11 Q4’11 Q1’12
$9,588 $13,864 1.66% 1.77% 1.94% 1.95% 1.72% 1.70% 1.86% 2.01% 1.97% 1.87% 2.50% 2.00% 1.50% 1.00%
PTPP ROA
Net Interest Margin(2) (%)
4.70 4.30 3.90 3.50 Q2’10 Q3’10 Q4’10 Q1’11 Q2’11 Q3’11 Q4’11 Q1’12
4.11 4.08 4.21 4.48 3.81
ABCB Net Interest Margin UBPR Peer Group
Earnings Power
• 28.3% - Average Growth rate in PTPP (2 years) – Strong results, driven by cost containment and contribution from eight acquisitions during the eight quarters covered. Both strategies are still effective and management believes will continue to provide growth opportunity.
• 17.8% - Net reduction in normalized operating expenses (normalizes non-provision credit costs & “excess” FDIC insurance totals $24.7 million (annualized) compared to foregone compensation of $6.6 million (annualized))
(1) Credit expenses include provision, OREO losses, problem loan expense and interest reversals on non-accrual loans (2) Ameris Bank net interest margin on a fully taxable-equivalent basis, excludes H/C level TRUPs
12
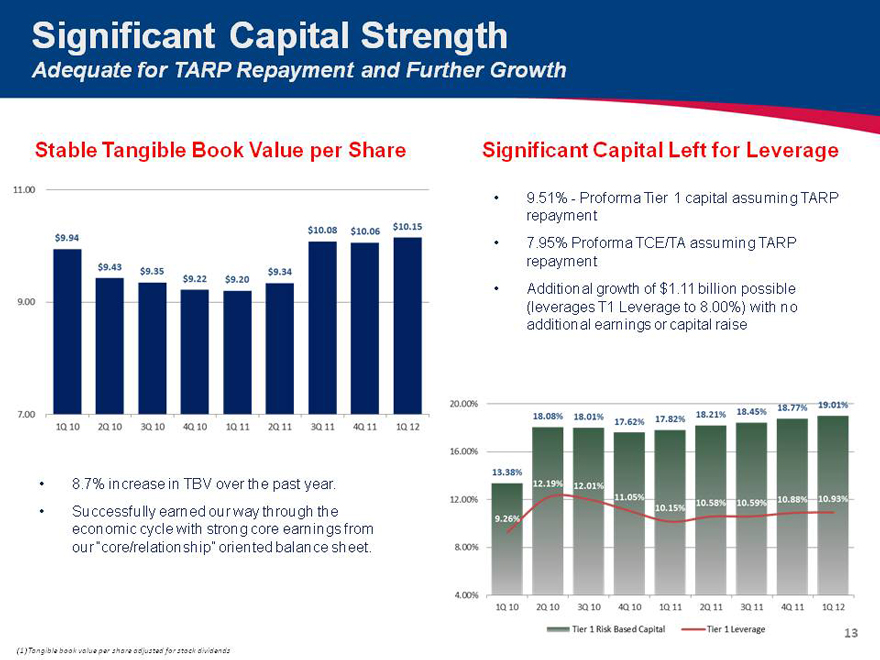
Significant Capital Strength
Adequate for TARP Repayment and Further Growth
Stable Tangible Book Value per Share
11.00 9.00 7.00 1Q 10 2Q 10 3Q 10 4Q 10 1Q 11 2Q 11 3Q 11 4Q 11 1Q 12
$9.94 $9.43 $9.35 $9.22 $9.20 $9.34 $10.08 $10.06 $10.15
Significant Capital Left for Leverage
20.00% 16.00% 12.00% 8.00% 4.00% 1Q 10 2Q 10 3Q 10 4Q 10 1Q 11 2Q 11 3Q 11 4Q 11 1Q 12
13.38% 18.08% 18.01% 17.62% 17.82% 18.21% 18.45% 18.77% 19.01%
9.26% 12.19% 12.01% 11.05% 10.15% 10.58% 10.59% 10.88% 10.93%
Tier 1 Risk Based Capital Tier 1 Leverage
• 9.51% - Proforma Tier 1 capital assuming TARP repayment
• 7.95% Proforma TCE/TA assuming TARP repayment
• Additional growth of $1.11 billion possible (leverages T1 Leverage to 8.00%) with no additional earnings or capital raise
• 8.7% increase in TBV over the past year.
• Successfully earned our way through the economic cycle with strong core earnings from our “core/relationship” oriented balance sheet.
(1) Tangible book value per share adjusted for stock dividends
13
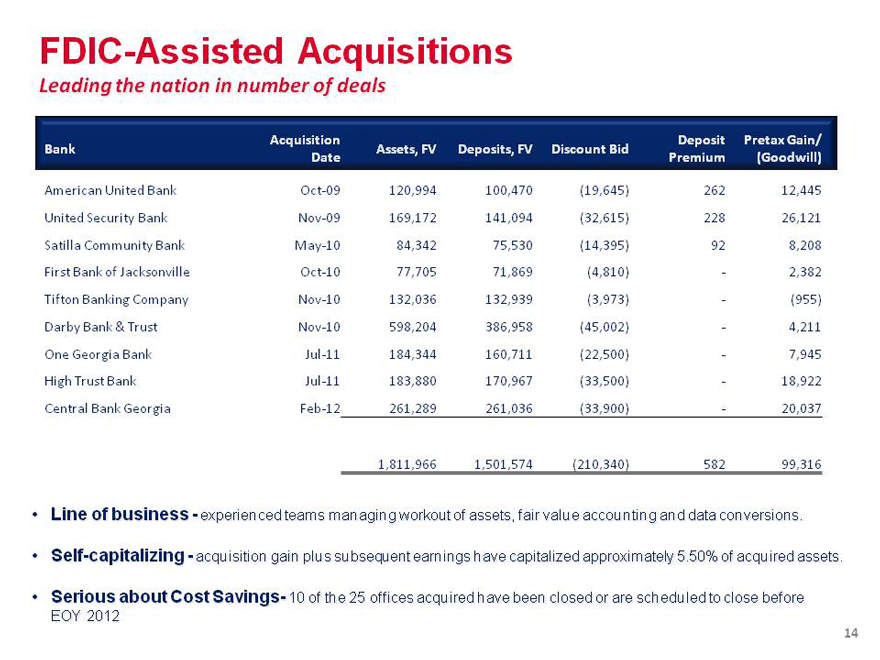
FDIC-Assisted Acquisitions
Leading the nation in number of deals
Acquisition Deposit Pretax Gain/
Bank Assets, FV Deposits, FV Discount Bid
Date Premium (Goodwill)
American United Bank Oct-09 120,994 100,470 (19,645) 262 12,445
United Security Bank Nov-09 169,172 141,094 (32,615) 228 26,121
Satilla Community Bank May-10 84,342 75,530 (14,395) 92 8,208
First Bank of Jacksonville Oct-10 77,705 71,869 (4,810) — 2,382
Tifton Banking Company Nov-10 132,036 132,939 (3,973) -(955)
Darby Bank & Trust Nov-10 598,204 386,958 (45,002) — 4,211
One Georgia Bank Jul-11 184,344 160,711 (22,500) —7,945
High Trust Bank Jul-11 183,880 170,967 (33,500) — 18,922
Central Bank Georgia Feb-12 261,289 261,036 (33,900) — 20,037
1,811,966 1,501,574 (210,340) 582 99,316
• Line of business — experienced teams managing workout of assets, fair value accounting and data conversions.
• Self-capitalizing — acquisition gain plus subsequent earnings have capitalized approximately 5.50% % of acquired assets.
• Serious about Cost Savings- 10 of the 25 offices acquired have been closed or are scheduled to close before EOY 2012
14
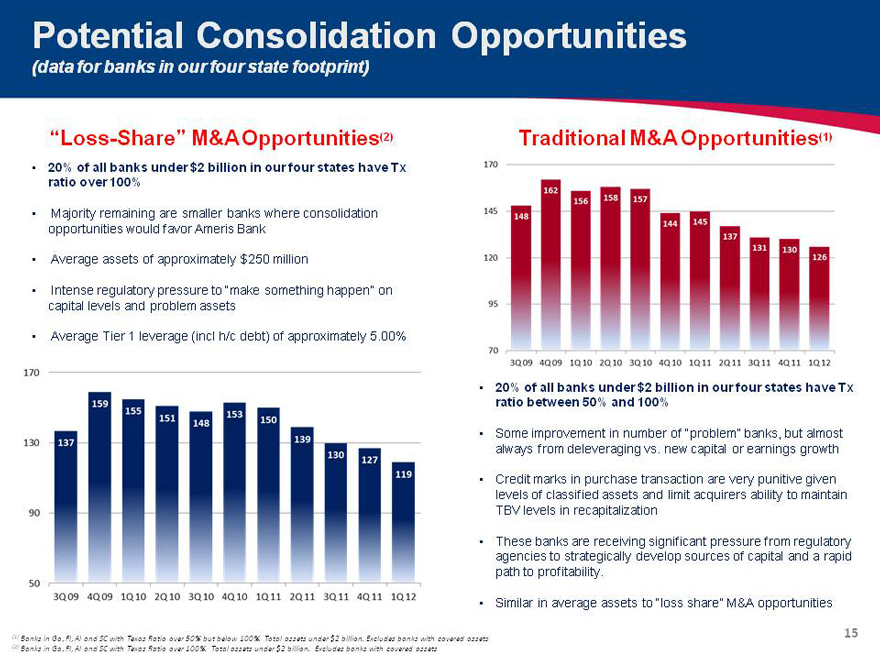
Potential Consolidation Opportunities
(data for banks in our four state footprint)
“Loss-Share” M&A Opportunities(2)
• 20% of all banks under $2 billion in our four states have Tx ratio over 100%
• Majority remaining are smaller banks where consolidation opportunities would favor Ameris Bank
• Average assets of approximately $250 million
• Intense regulatory pressure to “make something happen” on capital levels and problem assets
• Average Tier 1 leverage (incl h/c debt) of approximately 5.00%
170 130 90 50 3Q 09 4Q 09 1Q 10 2Q 10 3Q 10 4Q 10 1Q 11 2Q 11 3Q 11 4Q 11 1Q 12
137 159 155 151 148 153 150 139 130 127 119
Traditional M&A Opportunities(1)
170 145 120 95 70 3Q 09 4Q 09 1Q 10 2Q 10 3Q 10 4Q 10 1Q 11 2Q 11 3Q 11 4Q 11 1Q 12
148 162 156 158 157 144 145 137 131 130 126
• 20% of all banks under $2 billion in our four states have Tx ratio between 50% and 100%
• Some improvement in number of “problem” banks, but almost always from deleveraging vs. new capital or earnings growth
• Credit marks in purchase transaction are very punitive given levels of classified assets and limit acquirers ability to maintain TBV levels in recapitalization
• These banks are receiving significant pressure from regulatory agencies to strategically develop sources of capital and a rapid path to profitability.
• Similar in average assets to “loss share” M&A opportunities
(1) Banks in Ga, Fl, Al and SC with Texas Ratio over 50% but below 100%. Total assets under $2 billion. Excludes banks with covered assets (2) Banks in Ga, Fl, Al and SC with Texas Ratio over 100%. Total assets under $2 billion. Excludes banks with covered assets
15
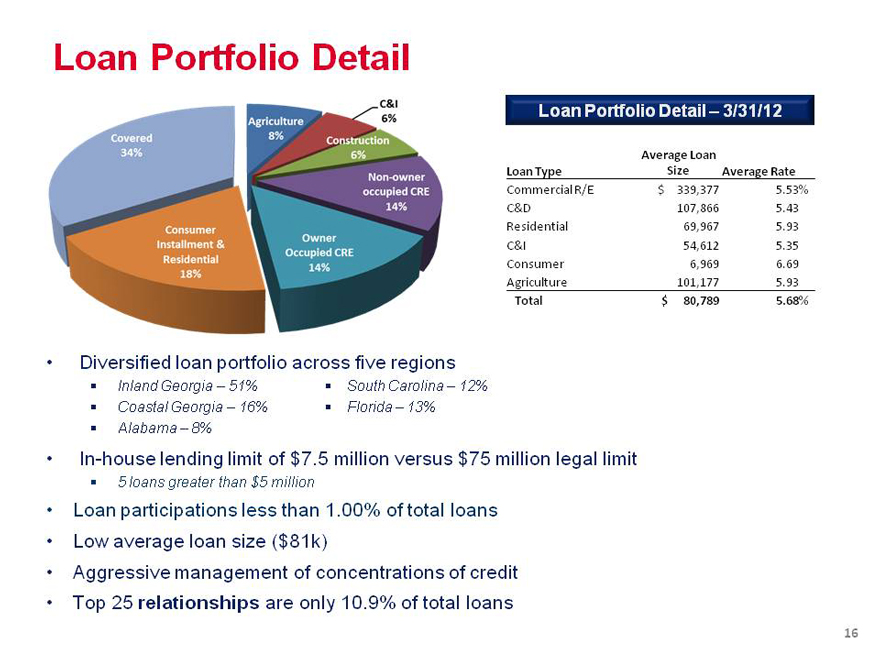
Loan Portfolio Detail
Loan Portfolio Detail – 3/31/12
Average Loan
Loan Type Size Average Rate
Commercial R/E $ 339,377 5.53%
C&D 107,866 5.43 Residential 69,967 5.93 C&I 54,612 5.35 Consumer 6,969 6.69 Agriculture 101,177 5.93
Total $ 80,789 5.68%
• Diversified loan portfolio across five regions
• Inland Georgia – 51% • South Carolina – 12% • Coastal Georgia – 16% • Florida – 13% • Alabama – 8%
• In-house lending limit of $7.5 million versus $75 million legal limit
• 5 loans greater than $5 million
• Loan participations less than 1.00% of total loans
• Low average loan size ($81k)
• Aggressive management of concentrations of credit
• Top 25 relationships are only 10.9% of total loans
Covered 34% Agriculture 8% C & I 6% Construction 6% Non-owned occupied CRE 14% Owner Occupied CRE 14% Consumer Installment & Residential 18%
16
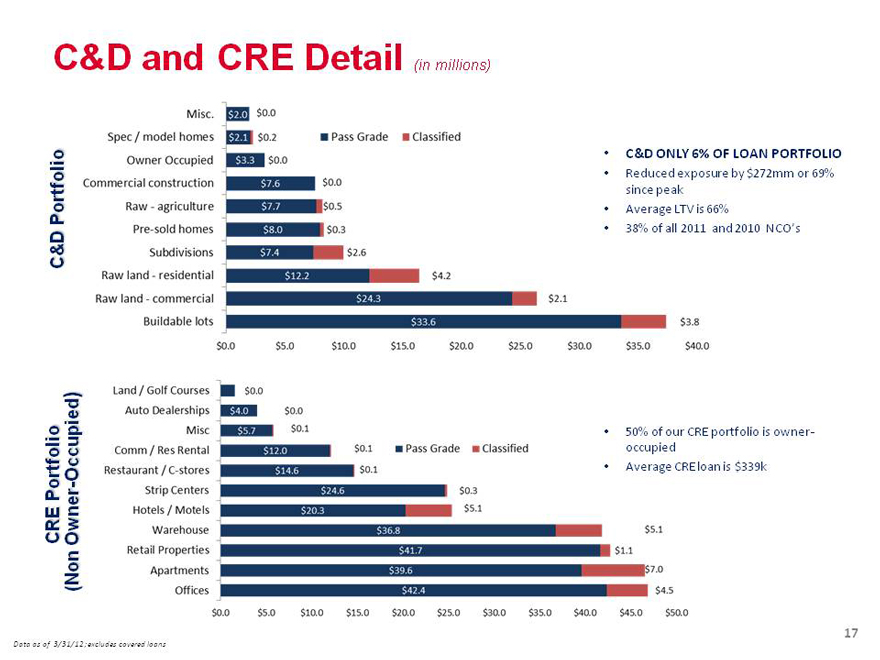
C&D and CRE Detail (in millions)
C&D Portfolio
• C&D ONLY 6% OF LOAN PORTFOLIO
• Reduced exposure by $272mm or 69% since peak
• Average LTV is 66%
• 38% of all 2011 and 2010 NCO’s
CRE Portfolio (Non Owner- Occupied)
• 50% of our CRE portfolio is owner-occupied
• Average CRE loan is $339k
Data as of 3/31/12; excludes covered loans
Misc. Spec/model homes Owner Occupied Commercial Construction Raw - agriculture
Pre-sold homes Subdivisions Raw land - residential Raw land - Commercial Buildable lots
$2.0 $0.0 $2.1 $0.2 $3.3 $0.0 $7.6 $0.0 $7.7 $0.5 $8.0 $0.3 $7.4 $2.6 $12.2 $4.2
$24.3 $2.1$33.6 $3.8
$0.0 $5.0 $10.0 $15.0 $20.0 $25.0 $30.0 $35.0 $40.0
Land/ Golf Courses Auto Dealerships Misc Comm/ Res Rental Restaurant/ C-stores Strip Centers
Hotels/ Motels Warehouse Retail Properties Apartments Offices
$0.0 $4.0 $0.0 $5.7 $0.1 $12.0 $0.1 $14.6 $0.1 $24.6 $0.3 $20.3 $5.1 $36.8 $5.1 $36.8 $5.1 $41.7 $1.1
$39.6 $7.0 $42.4 $4.5
$0.0 $5.0 $10.0 $15.0 $20.0 $25.0 $30.0 $35.0 $40.0 $45.0 $50.0
Pass Grade Classified
Pass Grade Classified
17

Credit Quality Substantial Improvement
Trends in NPA’s
OREO
• Values are appropriate for sale to end users.
• 1Q 2012 Disposal activity – More aggressive posture resulted in a $31.2 million reduction in classified assets at 63%, net of reserves.
• NPLs down 43% from their peak levels over 2 years ago.
• In-migration of new non-accrual loans reduced significantly from past levels.
Breakdown of OREO by Type
100 75 50 25 0 $90 $30 $92 $41 $88 $49 $79 $52 $68 $57 $61 $59 $59 $51 $70 $47 $52 $37
Q1’10 Q2’10 Q4’10 Q1’11 Q3’11 Q4’11 Q1’12 NPLS OREO
RRE Land, $10.20, 28%
Subdiv & lots, $6.10, 17% SFR, $1.30, 4%
CML Land $8.50, 23%
CML Properties, $10.00, 27%
AGRE Land $0.30, 1%
18
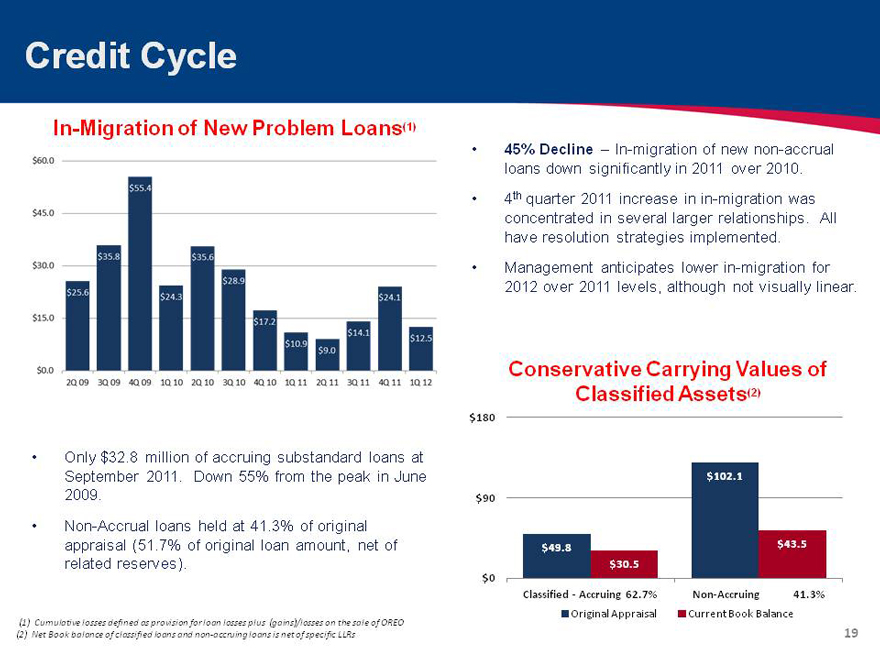
Credit Cycle
In-Migration of New Problem Loans(1)
• 45% Decline – In-migration of new non-accrual loans down significantly in 2011 over 2010.
• 4th quarter 2011 increase in in-migration was concentrated in several larger relationships. All have resolution strategies implemented.
• Management anticipates lower in-migration for
2012 over 2011 levels, although not visually linear.
• Only $32.8 million of accruing substandard loans at September 2011. Down 55% from the peak in June 2009.
• Non- Accrual loans held at 41.3% of original appraisal (51.7% of original loan amount, net of related reserves).
Conservative Carrying Values of Classified Assets(2)
$180
$102.1 $90
$49.8 $43.5
$30.5 $0
Classified—Accruing 62.7% Non-Accruing 41.3%
• Original Appraisal Current Book Balance
(1) Cumulative losses defined as provision for loan losses plus (gains)/losses on the sale of OREO (2) Net Book balance of classified loans and non-accruing loans is net of specific LLRs
19