UNITED STATES
SECURITIES AND EXCHANGE COMMISSION
Washington, D.C. 20549
FORM N-CSR
CERTIFIED SHAREHOLDER REPORT
OF
REGISTERED MANAGEMENT INVESTMENT COMPANIES
Investment Company Act file number: 811-1530
Name of Registrant: Vanguard Explorer Fund
Address of Registrant:
P.O. Box 2600
Valley Forge, PA 19482
Name and address of agent for service:
Heidi Stam, Esquire
P.O. Box 876
Valley Forge, PA 19482
Registrant’s telephone number, including area code: (610) 669-1000
Date of fiscal year end: October 31
Date of reporting period: November 1, 2010 – April 30, 2011
Item 1: Reports to Shareholders
|
|
| Vanguard Explorer™ Fund |
| Semiannual Report |
| April 30, 2011 |

|
> Vanguard Explorer Fund returned almost 25% for the six months ended April 30, 2011, a strong absolute return but below those of its comparative standards.
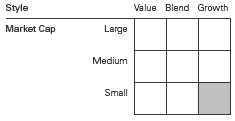
> Growth stocks generally trumped value among small and mid-sized firms, which continued to outpace their larger brethren.
> Information technology—the largest sector in the fund and its benchmark index—added the most to the fund’s total return, but lagged the sector’s result in the index.
| Contents | |
| Your Fund’s Total Returns. | 1 |
| Chairman’s Letter. | 2 |
| Advisors’ Report. | 7 |
| Fund Profile. | 12 |
| Performance Summary. | 13 |
| Financial Statements. | 14 |
| About Your Fund’s Expenses. | 27 |
| Trustees Approve Advisory Arrangements. | 29 |
| Glossary. | 31 |
Please note: The opinions expressed in this report are just that—informed opinions. They should not be considered promises or advice. Also, please keep in mind that the information and opinions cover the period through the date on the front of this report. Of course, the risks of investing in your fund are spelled out in the prospectus.
See the Glossary for definitions of investment terms used in this report.
Cover photograph: Jean Maher.
Your Fund’s Total Returns
| Six Months Ended April 30, 2011 | |
| Total | |
| Returns | |
| Vanguard Explorer Fund | |
| Investor Shares | 24.78% |
| Admiral™ Shares | 24.89 |
| Russell 2500 Growth Index | 27.08 |
| Small-Cap Growth Funds Average | 26.94 |
Small-Cap Growth Funds Average: Derived from data provided by Lipper Inc.
Admiral Shares carry lower expenses and are available to investors who meet certain account-balance requirements.
| Your Fund’s Performance at a Glance | ||||
| October 31, 2010 , Through April 30, 2011 | ||||
| Distributions Per Share | ||||
| Starting | Ending | Income | Capital | |
| Share Price | Share Price | Dividends | Gains | |
| Vanguard Explorer Fund | ||||
| Investor Shares | $66.02 | $82.26 | $0.106 | $0.000 |
| Admiral Shares | 61.50 | 76.59 | 0.189 | 0.000 |
1

Chairman’s Letter
Dear Shareholder,
Small was beautiful again in the first half of Vanguard Explorer Fund’s new fiscal year. As investors maintained a glass-half-full stance, the stocks of small and medium-sized companies held a sizable lead over their larger counterparts. Growth-oriented small-capitalization stocks, Explorer’s focus, were stronger still.
For the six months ended April 30, Explorer Fund returned almost 25%—a strong absolute performance that nevertheless trailed (by about 2 percentage points) both its Russell 2500 Growth Index benchmark and the average return of its peer group. Compared with the benchmark index, the advisors’ notable success in health care was countered by missed opportunities—especially among consumer discretionary and technology stocks.
Please note: As we previously reported, AXA Rosenberg Investment Management was removed from the fund’s advisory team last August. On February 3, 2011, AXA Rosenberg announced that it had reached a settlement with the U.S. Securities and Exchange Commission related to a coding error in its quantitative investment process. Under the terms of the settlement, AXA Rosenberg compensated clients that were harmed by the coding error, including Vanguard Explorer Fund. (Please see Note H in Notes to Financial Statements.)
2
Strong returns around the globe
The headlines were dominated by political upheaval, natural and nuclear disaster, and economic distress, but global stock markets produced outstanding returns for the six months ended April 30. The broad U.S. stock market returned more than 17%. Although rising food and gasoline prices put pressure on consumer budgets, corporate earnings growth remained strong, and the pace of new job creation bounced back from extremely depressed levels.
For U.S.-based investors, international stock markets produced a smaller but still robust six-month return above 12% in U.S. dollars. Almost half of this return reflected exchange-rate gains produced largely by strength in the euro and currencies in emerging economies.
As the economy found its footing, rates edged higher
Rising longer-term interest rates put pressure on bond prices, which led to modest bond market returns for the six-month period. The broad taxable U.S. bond market returned about 0%. The broad municipal market returned –1.68%. The rise in rates reflected both confidence that the economic recovery would prove self-sustaining and thus nudge rates higher, and anxiety that higher rates would be necessary to provide some protection from inflation. Even so, inflation expectations
| Market Barometer | |||
| Total Returns | |||
| Periods Ended April 30, 2011 | |||
| Six | One | Five Years | |
| Months | Year | (Annualized) | |
| Stocks | |||
| Russell 1000 Index (Large-caps) | 17.12% | 18.02% | 3.30% |
| Russell 2000 Index (Small-caps) | 23.73 | 22.20 | 3.89 |
| Dow Jones U.S. Total Stock Market Index | 17.28 | 18.40 | 3.65 |
| MSCI All Country World Index ex USA (International) | 12.44 | 19.73 | 3.55 |
| Bonds | |||
| Barclays Capital U.S. Aggregate Bond Index (Broad | |||
| taxable market) | 0.02% | 5.36% | 6.33% |
| Barclays Capital Municipal Bond Index (Broad | |||
| tax-exempt market) | -1.68 | 2.20 | 4.52 |
| Citigroup Three-Month U.S. Treasury Bill Index | 0.06 | 0.15 | 2.02 |
| CPI | |||
| Consumer Price Index | 2.83% | 3.16% | 2.22% |
3
remained subdued, as measured by the difference between the yields of inflation-protected and nominal U.S. Treasury bonds.
The return on short-term money market instruments such as the 3-month U.S. Treasury bill remained near 0%, consistent with the Federal Reserve Board’s target for short-term rates.
Classic growth prevailed, assisted by nuts and bolts
Vanguard Explorer Fund’s team of six investment advisory firms uses a variety of complementary investment strategies to identify high-quality, small and mid-sized companies that appear to have superior growth potential. Your advisors have tilled fertile ground since the U.S. stock market turnaround began in March 2009.
For the six months ended April 30, the fund’s holdings notched double-digit gains in nine of ten industry sectors, ranging from about 50% for energy to almost 17% for consumer discretionary stocks. The tiny utilities sector wasn’t too far behind, at 9%.
Information technology, a home to many classic “growth” stocks, remained the fund’s largest sector by far. Strength was broad and deep: A wide variety of IT holdings participated in a resurgence in consumer spending and business investment as the economic recovery
| Expense Ratios | |||
| Your Fund Compared With Its Peer Group | |||
| Investor | Admiral | Peer Group | |
| Shares | Shares | Average | |
| Explorer Fund | 0.49% | 0.32% | 1.61% |
The fund expense ratios shown are from the prospectus dated February 23, 2011, and represent estimated costs for the current fiscal year. For the six months ended April 30, 2011, the fund’s annualized expense ratios were 0.50% for Investor Shares and 0.34% for Admiral Shares. The peer-group expense ratio is derived from data provided by Lipper Inc. and captures information through year-end 2010.
Peer group: Small-Cap Growth Funds.
4
proceeded. Buoyed by chip makers—which have benefited from shorter replacement cycles for items such as computers and cell phones—and software companies, the tech sector was responsible for almost one-third of the fund’s total return.
Health care, the fund’s second-largest sector, was invigorated by the performance of biotech companies and service providers, including senior living facilities. And as the economy continued to grind into gear, industrials—especially makers of machinery as well as electrical equipment and components—provided fortification. Together, health care and industrial holdings accounted for well more than one-third of the fund’s total return.
Even with robust results in major sectors, the fund fell short of its benchmark index. Some disappointments among consumer discretionary stocks—notably clothing retailers and gaming companies—trimmed more than 1 percentage point from the fund’s overall return. The fund’s IT sector also lagged that of the benchmark: Sizable stakes in top-ten holdings Alliance Data Systems and VeriFone Systems provided a boost, but couldn’t make up for other misses. On the plus side, success in health care, notably biotech and health care providers, helped offset the slippage in tech stocks.
For more about your advisors’ strategy and the fund’s positioning during the six months, please see the Advisors’ Report that follows this letter.
Spread your investments across multiple baskets
Equity returns for the six months were again impressive—small-cap returns even more so. Of course, periods of strength are often followed by stretches of weakness, and market currents can change swiftly.
For example, as I write this letter, many investors are concerned about higher oil prices—could they derail the U.S. economic recovery, and what do they mean for inflation and short-term interest rates? After evaluating several scenarios, Vanguard’s economists concluded that benchmark U.S. crude oil prices would likely need to persist at $150 per barrel to generate another U.S. recession. And, despite higher prices for food and many commodities, slow growth in key inflation drivers—such as wages, money supply, and bank lending—suggests that high inflation appears unlikely. Our economists’ views are available at vanguard.com.
One of the ways you can try to buffer your nest egg from such shocks is to develop allocations to stock, bond, and money market funds in proportions consistent with your goals and ability to withstand the stock market’s unpredictable swings. Vanguard Explorer Fund can be
5
a useful, low-cost option in such a diversified portfolio. The fund’s multi-manager structure can help to dampen some of the volatility that often characterizes the performance of less-seasoned businesses, providing investors with a relatively more conservative source of exposure to those companies. And—even though recent results have fallen short of the benchmark return—we are confident that the fund’s carefully selected, experienced team of advisors has the potential to deliver superior results.
Thank you for entrusting your assets to Vanguard.
Sincerely,

F. William McNabb III
Chairman and Chief Executive Officer
May 13, 2011
6
Advisors’ Report
For the six months ended April 30, 2011, Vanguard Explorer Fund returned almost 25% for both share classes. Your fund is managed by six independent advisors, a strategy that enhances the fund’s diversification by providing exposure to distinct, yet complementary, investment approaches. It’s not uncommon for different advisors to have different views about individual securities or the broader investment environment.
The table following this report lists the advisors, the amount and percentage of fund assets each manages, and brief descriptions of their investment strategies. The advisors have provided the following assessment of the investment environment during the past six months and the notable successes and shortfalls in their portfolios. (Please note that the Granahan and Kalmar discussions refer to industry sectors as defined by Russell classifications, rather than by the Global Industry Classification Standard used elsewhere in this report.) These comments were prepared on May 11, 2011.
Wellington Management Company, LLP
Portfolio Manager:
Kenneth L. Abrams, Senior Vice President and Equity Portfolio Manager
Equities continued to rise as investors largely dismissed potentially unfavorable developments for economic growth, including rising commodity prices and inflation, unrest in the Middle East, the earthquake in Japan, and domestic budgetary deadlock at the federal level.
Strong corporate earnings and positive market sentiment outweighed concerns and continued to fuel gains for stocks.
Successes: Our portion of the fund benefited from strong security selection in the health care and telecommunication services sectors, with positive performance from holdings such as RehabCare and Vonage. The stock price of RehabCare, an operator of long-term care hospital and inpatient rehabilitation facilities, rose when the company agreed to be acquired by Kindred Healthcare. We subsequently exited the position. Vonage shares surged during the period, following its first positive subscriber growth in over two years. We continue to hold Vonage, which has an attractive growth outlook supported by market-share gains in international long distance, compelling new services for mobile users, and a growing base of customers outside the United States.
Shortfalls: Conversely, our stocks within the consumer discretionary and industrial sectors were the primary detractors for the period. For example, feature film company DreamWorks Animation declined following disappointing box office results at the release of its “Megamind” movie. We continue to hold DreamWorks because of its track record of producing strong content and monetizing its franchise through sequels, television specials, and live productions. U.S. Airways was also a detractor. Prior to the close of the period, we sold the position as higher fuel costs led us to reduce our exposure to airlines.
7
Granahan Investment Management, Inc.
Portfolio Manager:
Jack Granahan, CFA, Managing Partner
The stock market posted strong six-month results as it climbed a wall of worry that included rising instability in the Middle East, bank and sovereign debt issues in Europe, and rising oil and food prices in the United States as well as ongoing pressures in housing and unemployment. Instead, investors focused on the continued strength in corporate profits and increases in manufacturing. Energy stocks were particularly strong. The companies in our portfolio continued to generate strong sales and earnings growth, especially in producer durables, technology, and energy.
Successes: In terms of sectors, the portfolio benefited from strong relative performance in materials and financial services. Fronteer Gold, a gold exploration company, was acquired by Newmont Mining in our materials sector. Contributors in financial services included Waddell and Reed Financial, Cash America, and Factset Research Systems.
Individual stocks of note included Regeneron in health care, which was a strong contributor for the period on positive clinical results for its drug to treat macular degeneration. Strong stocks in technology included Verifone Systems, which provides point-of-sale electronic payment solutions; Acme Packet, a leading supplier of session border controllers for voice-over-internet communications; and Polycom, a supplier of videoconferencing systems.
Shortfalls: While we correctly underweighted the consumer discretionary sector, we held several significant detractors within the sector. One of these was WMS Gaming, a supplier of gaming products that also operates leased participation machines. Growth in casino purchases has flattened out, with recent earnings declining. We have retained our holding.
Individual detractors in other sectors included health care company Nektar, whose decision to solely handle the next phase of trials on a drug was seen as higher risk; we have retained our holding. In our technology sector, satellite imaging companies GeoEye and Digital Globe were penalized by concerns over government funding. We have added to our holdings of GeoEye.
Kalmar Investment Advisers
Portfolio Manager:
Ford B. Draper, Jr., President and Chief Investment Officer
Fears of a double-dip recession last summer prompted the Federal Reserve to implement a second round of quantitative easing, known as QE2. Since then, growing confidence in the sustainability of economic growth and rising corporate earnings have driven major stock market gains. This confirmed the bull market and allowed it to power past major geopolitical problems. Despite that, Kalmar continues to
8
emphasize “better companies” able to create their own future growth opportunities through innovation and internal initiatives. Meanwhile, stock market valuations still appear reasonable.
Successes: In a strongly rising market, all of our sector exposures contributed meaningfully to return, with our technology and producer durables holdings adding the most. Our biggest individual successes were: Cooper Cos., the international leader in specialty contact lenses; Alliance Data Systems, the provider of private label credit card, marketing, and loyalty services; Ariba, the leader in spend management software and systems; and Atmel, an improving semiconductor company with an important stake in touch screen technology.
Shortfalls: Our largest shortfalls came from: Acxiom, a business service information company that was hurt by an unexpected departure among its top management; Niko Resources, an offshore oil and gas explorer whose production temporarily slowed; and F5 Networks, a “cloud computing” networking company whose revenues slowed modestly.
Century Capital Management, LLC
Portfolio Manager:
Alexander L. Thorndike, Chief Investment Officer and Managing Partner
There remains a fragile confidence among investors that the U.S. economy can indeed sustain itself. The question still to be answered is whether private sector growth can assume a leadership role, as state and local governments grapple with budget deficits. We anticipate that corporate profit growth will remain healthy, though below the levels we experienced in 2010. We expect cost pressures to erode operating margins during the balance of 2011. Other areas of concern are the housing market, rising oil and gasoline prices, lingering issues over European debt, and an overheating of the Chinese economy.
Successes: Industrials was our best-performing sector for the period, led by Ladish and General Cable. Health care also contributed to performance, especially Brookdale Senior Living and Jazz Pharmaceuticals.
Shortfalls: Information technology and materials were our weakest-performing sectors for the period. HiSoft Technology International, Radware, and STR Holdings detracted from our performance.
Chartwell Investment Partners, L.P.
Portfolio Managers:
Edward N. Antoian, CFA, CPA, Managing Partner
John A. Heffern, Managing Partner and Senior Portfolio Manager
The global macroeconomic outlook, corporate revenue growth, and profit margins are key themes in the investment environment. They can separate winners from laggards, and we are alert to developing profit-margin pressures. Accordingly, our portfolio decisions reflect
9
our bias toward quality, leadership, defensible margins, and a pattern of successful execution.
Successes: Health care and industrials were our top-performing sectors. Strong stock selection in health services (Accretive Health) and medical specialties (Sirona Dental Systems) contributed to our results. Among industrial holdings, Baldor Electric, a manufacturer of electric motors, drives, and generators, was acquired at a 41% premium.
Shortfalls: Our holdings in IT services (NICE Systems), semiconductors (Marvell Technology Group), and computer peripherals (NetApp) underperformed for the period. Weakness in the energy sector was primarily driven by oil and gas producers (Rex Energy).
Vanguard Quantitative Equity Group
Portfolio Manager:
James D. Troyer, CFA, Principal
In the first half of this fiscal year, despite various global economic and geopolitical concerns, strong corporate earnings and better-than-expected job growth helped the U.S. equity markets to continue rising from the low point reached during the financial crisis two years ago.
While the overall performance of our portfolio is affected by the macro factors described above, it should be noted that our approach to investing focuses on a diversified mix of specific stock fundamentals. For the period, our stock selection model performed well, benefiting most from our quality signal—which measures balance sheet strength and the sustainability of earnings—as well as our market sentiment factor, which captures how investors reflect their opinions of a company through their activity in the market.
Successes: At the individual stock level, two of our best contributors were Sauer-Danfoss (+167%), and OPNET Technologies (+107%). When comparing the portfolio’s performance relative to its benchmark, we benefited from overweighting those two companies and from underweighting (for example, American Superconductor, –65%) or avoiding (for example, DreamWorks Animation, –25%) several poorly performing stocks.
Shortfalls: Unfortunately, we are not able to avoid all bad performers. Overweighted positions in iGATE (–16%) and United Continental Holdings (–21%) directly lowered performance. Also, underweighting companies that were not positively identified by the fundamentals in our model, such as Green Mountain Coffee Roasters (+103%) and Polycom (+77%), hurt overall results relative to our benchmark.
10
| Vanguard Explorer Fund Investment Advisors | |||
| Fund Assets Managed | |||
| Investment Advisor | % | $ Million | Investment Strategy |
| Wellington Management | 29 | 3,076 | Conducts research and analysis of individual |
| Company, LLP | companies to select stocks believed to have | ||
| exceptional growth potential relative to their market | |||
| valuations. Each stock is considered individually before | |||
| purchase, and company developments are continually | |||
| monitored for comparison with expectations for | |||
| growth. | |||
| Granahan Investment | 25 | 2,679 | Bases its investment process on the beliefs that |
| Management, Inc. | earnings drive stock prices and that small, dynamic | ||
| companies with exceptional growth prospects have the | |||
| greatest long-term potential. A bottom-up, fundamental | |||
| approach places companies in one of three life-cycle | |||
| categories: pioneer, core growth, and special situation. | |||
| In each, the process looks for companies with strong | |||
| earnings growth potential and leadership in their | |||
| markets. | |||
| Kalmar Investment Advisers | 21 | 2,319 | Employs a “growth with value” strategy using creative, |
| bottom-up research to uncover vigorously growing, | |||
| high-quality businesses whose stocks can also be | |||
| bought inefficiently valued. The strategy has a dual | |||
| objective of strong returns with lower risk. | |||
| Century Capital Management, | 9 | 1,024 | Employs a fundamental, bottom-up approach that |
| LLC | attempts to identify reasonably priced companies that | ||
| will grow faster than the overall market. Companies | |||
| also must have a superior return on equity, high | |||
| recurring revenues, and improving margins. | |||
| Chartwell Investment Partners, | 9 | 998 | Uses a bottom-up, fundamental, research-driven |
| L.P. | stock-selection strategy focusing on companies with | ||
| sustainable growth, strong management teams, | |||
| competitive positions, and outstanding product and | |||
| service offerings. These companies should continually | |||
| demonstrate growth in earnings per share. | |||
| Vanguard Quantitative Equity | 4 | 416 | Employs a quantitative fundamental management |
| Group | approach, using models that assess valuation, growth | ||
| prospects, management decisions, market sentiment, | |||
| and earnings quality of companies as compared with | |||
| their peers. | |||
| Cash Investments | 3 | 369 | These short-term reserves are invested by Vanguard in |
| equity index products to simulate investment in stocks. | |||
| Each advisor also may maintain a modest cash | |||
| position. | |||
11
Explorer Fund
Fund Profile
As of April 30, 2011
| Share-Class Characteristics | ||
| Investor | Admiral | |
| Shares | Shares | |
| Ticker Symbol | VEXPX | VEXRX |
| Expense Ratio1 | 0.49% | 0.32% |
| 30-Day SEC Yield | 0.01% | 0.16% |
| Portfolio Characteristics | |||
| Russell | DJ | ||
| 2500 | U.S. Total | ||
| Growth | Market | ||
| Fund | Index | Index | |
| Number of Stocks | 588 | 1,556 | 3,817 |
| Median Market Cap | $2.6B | $2.9B | $31.8B |
| Price/Earnings Ratio | 30.1x | 28.6x | 17.7x |
| Price/Book Ratio | 3.0x | 3.8x | 2.4x |
| Return on Equity | 11.3% | 13.6% | 18.9% |
| Earnings Growth Rate | 9.3% | 10.0% | 5.9% |
| Dividend Yield | 0.5% | 0.6% | 1.7% |
| Foreign Holdings | 4.1% | 0.0% | 0.0% |
| Turnover Rate | |||
| (Annualized) | 95% | — | — |
| Short-Term Reserves | 2.0% | — | — |
| Sector Diversification (% of equity exposure) | |||
| Russell | DJ | ||
| 2500 | U.S. Total | ||
| Growth | Market | ||
| Fund | Index | Index | |
| Consumer | |||
| Discretionary | 12.5% | 18.6% | 11.8% |
| Consumer Staples | 3.0 | 3.1 | 9.4 |
| Energy | 7.5 | 5.5 | 11.6 |
| Financials | 7.4 | 6.7 | 15.8 |
| Health Care | 18.4 | 16.1 | 11.1 |
| Industrials | 16.9 | 17.4 | 11.6 |
| Information | |||
| Technology | 28.0 | 24.4 | 18.5 |
| Materials | 4.2 | 6.4 | 4.5 |
| Telecommunication | |||
| Services | 1.3 | 1.5 | 2.6 |
| Utilities | 0.8 | 0.3 | 3.1 |
| Volatility Measures | ||
| DJ | ||
| U.S. Total | ||
| Russell 2500 | Market | |
| Growth Index | Index | |
| R-Squared | 1.00 | 0.94 |
| Beta | 0.95 | 1.11 |
These measures show the degree and timing of the fund’s fluctuations compared with the indexes over 36 months.
| Ten Largest Holdings (% of total net assets) | ||
| Alliance Data Systems, | Data Processing & | |
| Corp. | Outsourced | |
| Services | 0.9% | |
| VeriFone Systems Inc. | Data Processing & | |
| Outsourced | ||
| Services | 0.9 | |
| Microsemi Corp. | Semiconductors | 0.8 |
| Regeneron | ||
| Pharmaceuticals Inc. | Biotechnology | 0.7 |
| Bruker Corp. | Life Sciences Tools | |
| & Services | 0.7 | |
| Coventry Health Care | Managed Health | |
| Inc. | Care | 0.7 |
| Ariba Inc. | Systems Software | 0.7 |
| Cooper Cos Inc. | Health Care | |
| Supplies | 0.7 | |
| Polycom Inc. | Communications | |
| Equipment | 0.7 | |
| NetLogic Microsystems | ||
| Inc. | Semiconductors | 0.6 |
| Top Ten | 7.4% | |
The holdings listed exclude any temporary cash investments and equity index products.
Investment Focus
1 The expense ratios shown are from the prospectus dated February 23, 2011, and represent estimated costs for the current fiscal year. For the six months ended April 30, 2011, the annualized expense ratios were 0.50% for Investor Shares and 0.34% for Admiral Shares.
12
Explorer Fund
Performance Summary
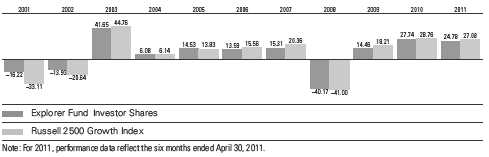
All of the returns in this report represent past performance, which is not a guarantee of future results that may be achieved by the fund. (Current performance may be lower or higher than the performance data cited. For performance data current to the most recent month-end, visit our website at vanguard.com/performance.) Note, too, that both investment returns and principal value can fluctuate widely, so an investor’s shares, when sold, could be worth more or less than their original cost. The returns shown do not reflect taxes that a shareholder would pay on fund distributions or on the sale of fund shares.
Fiscal-Year Total Returns (%): October 31, 2000, Through April 30, 2011
Average Annual Total Returns: Periods Ended March 31, 2011
This table presents returns through the latest calendar quarter—rather than through the end of the fiscal period.
Securities and Exchange Commission rules require that we provide this information.
| Inception | One | Five | Ten | |
| Date | Year | Years | Years | |
| Investor Shares | 12/11/1967 | 28.35% | 3.18% | 7.05% |
| Admiral Shares | 11/12/2001 | 28.54 | 3.36 | 7.711 |
| 1 Return since inception. |
See Financial Highlights for dividend and capital gains information.
13
Explorer Fund
Financial Statements (unaudited)
Statement of Net Assets—Investments Summary
As of April 30, 2011
This Statement summarizes the fund’s holdings by asset type. Details are reported for each of the fund’s 50 largest individual holdings and for investments that, in total for any issuer, represent more than 1% of the fund’s net assets. The total value of smaller holdings is reported as a single amount within each category.
The fund reports a complete list of its holdings in regulatory filings four times in each fiscal year, at the quarter-ends. For the second and fourth fiscal quarters, the complete listing of the fund’s holdings is available electronically on vanguard.com and on the Securities and Exchange Commission’s website (sec.gov), or you can have it mailed to you without charge by calling 800-662-7447. For the first and third fiscal quarters, the fund files the lists with the SEC on Form N-Q. Shareholders can look up the fund’s Forms N-Q on the SEC’s website. Forms N-Q may also be reviewed and copied at the SEC’s Public Reference Room (see the back cover of this report for further information).
| Market | Percentage | |||
| Value | of Net | |||
| Shares | ($000) | Assets | ||
| Common Stocks | ||||
| Consumer Discretionary | ||||
| Cinemark Holdings Inc. | 2,542,130 | 51,682 | 0.5% | |
| * | MGM Resorts International | 4,058,610 | 51,382 | 0.5% |
| Williams-Sonoma Inc. | 1,109,159 | 48,149 | 0.5% | |
| * | DreamWorks Animation SKG Inc. Class A | 1,744,780 | 46,219 | 0.4% |
| Gentex Corp. | 1,423,455 | 44,625 | 0.4% | |
| *,^,1Liz Claiborne Inc. | 5,467,710 | 34,392 | 0.3% | |
| Consumer Discretionary—Other † | 1,005,308 | 9.2% | ||
| 1,281,757 | 11.8% | |||
| Consumer Staples | ||||
| Herbalife Ltd. | 616,934 | 55,388 | 0.5% | |
| * | Smithfield Foods Inc. | 1,852,050 | 43,634 | 0.4% |
| Consumer Staples—Other † | 205,724 | 1.9% | ||
| 304,746 | 2.8% | |||
| Energy | ||||
| * | Comstock Resources Inc. | 1,463,970 | 46,935 | 0.4% |
| * | Global Industries Ltd. | 4,514,046 | 44,509 | 0.4% |
| * | Atwood Oceanics Inc. | 957,645 | 43,027 | 0.4% |
| Energy—Other † | 642,547 | 5.9% | ||
| 777,018 | 7.1% | |||
| Exchange-Traded Funds | ||||
| 2 | Vanguard Small-Cap ETF | 1,165,083 | 94,733 | 0.8% |
| ^,2 | Vanguard Small-Cap Growth ETF | 713,200 | 63,589 | 0.6% |
| Exchange-Traded Funds—Other † | 29,750 | 0.3% | ||
| 188,072 | 1.7% | |||
| Financials | ||||
| * | NASDAQ OMX Group Inc. | 1,731,810 | 46,932 | 0.4% |
| * | Affiliated Managers Group Inc. | 410,094 | 44,733 | 0.4% |
| *,1 | Sabra Healthcare REIT Inc. | 1,304,953 | 21,949 | 0.2% |
| Financials—Other † | 607,605 | 5.6% | ||
| 721,219 | 6.6% | |||
14
| Explorer Fund | ||||
| Market | Percentage | |||
| Value | of Net | |||
| Shares | ($000) | Assets | ||
| Health Care | ||||
| * | Regeneron Pharmaceuticals Inc. | 1,518,681 | 77,620 | 0.7% |
| * | Bruker Corp. | 3,912,685 | 77,236 | 0.7% |
| * | Coventry Health Care Inc. | 2,387,510 | 77,045 | 0.7% |
| Cooper Cos. Inc. | 1,010,238 | 75,667 | 0.7% | |
| * | Covance Inc. | 854,487 | 53,491 | 0.5% |
| * | Alkermes Inc. | 3,521,900 | 50,786 | 0.5% |
| * | Allscripts Healthcare Solutions Inc. | 2,279,495 | 49,100 | 0.5% |
| * | Health Management Associates Inc. Class A | 4,323,762 | 48,772 | 0.4% |
| * | Brookdale Senior Living Inc. Class A | 1,661,840 | 45,269 | 0.4% |
| * | Mettler-Toledo International Inc. | 230,375 | 43,172 | 0.4% |
| *,1 | ABIOMED Inc. | 1,990,200 | 34,590 | 0.3% |
| Health Care—Other † | 1,279,069 | 11.8% | ||
| 1,911,817 | 17.6% | |||
| Industrials | ||||
| Kennametal Inc. | 1,363,227 | 57,555 | 0.5% | |
| * | Genesee & Wyoming Inc. Class A | 922,060 | 57,149 | 0.5% |
| * | Beacon Roofing Supply Inc. | 2,284,136 | 50,982 | 0.5% |
| * | Navistar International Corp. | 725,910 | 50,465 | 0.5% |
| Con-way Inc. | 1,160,130 | 45,152 | 0.4% | |
| MSC Industrial Direct Co. Class A | 606,005 | 43,384 | 0.4% | |
| * | EnerSys | 1,132,140 | 42,897 | 0.4% |
| Belden Inc. | 1,123,800 | 42,738 | 0.4% | |
| Industrials—Other † | 1,353,028 | 12.4% | ||
| 1,743,350 | 16.0% | |||
| Information Technology | ||||
| * | Alliance Data Systems Corp. | 1,002,805 | 95,266 | 0.9% |
| * | VeriFone Systems Inc. | 1,691,320 | 92,718 | 0.9% |
| * | Microsemi Corp. | 3,562,045 | 84,064 | 0.8% |
| * | Ariba Inc. | 2,192,032 | 76,217 | 0.7% |
| * | Polycom Inc. | 1,221,770 | 73,098 | 0.7% |
| * | NetLogic Microsystems Inc. | 1,409,679 | 60,799 | 0.6% |
| *,1 | TiVo Inc. | 6,346,860 | 60,739 | 0.6% |
| * | Teradyne Inc. | 3,723,014 | 59,941 | 0.6% |
| * | Sapient Corp. | 4,482,100 | 56,586 | 0.5% |
| * | Cadence Design Systems Inc. | 5,405,950 | 56,114 | 0.5% |
| MKS Instruments Inc. | 1,965,050 | 55,768 | 0.5% | |
| * | ON Semiconductor Corp. | 5,222,299 | 54,886 | 0.5% |
| * | MICROS Systems Inc. | 1,025,101 | 53,326 | 0.5% |
| * | SunPower Corp. Class B | 2,293,996 | 49,023 | 0.4% |
| * | Trimble Navigation Ltd. | 1,021,180 | 47,832 | 0.4% |
| * | Atmel Corp. | 3,106,251 | 47,526 | 0.4% |
| * | Parametric Technology Corp. | 1,946,215 | 47,235 | 0.4% |
| Avago Technologies Ltd. | 1,381,585 | 46,228 | 0.4% | |
| * | IAC/InterActiveCorp | 1,253,326 | 45,258 | 0.4% |
| Information Technology—Other † | 1,755,803 | 16.1% | ||
| 2,918,427 | 26.8% | |||
| Materials | ||||
| ^ | Silgan Holdings Inc. | 1,065,920 | 48,883 | 0.5% |
| Materials—Other † | 374,655 | 3.4% | ||
| 423,538 | 3.9% | |||
| Telecommunication Services | ||||
| *,1 | Vonage Holdings Corp. | 11,151,189 | 57,540 | 0.5% |
| * | tw telecom inc Class A | 2,027,080 | 43,663 | 0.4% |
| Telecommunication Services—Other † | 36,102 | 0.4% | ||
| 137,305 | 1.3% | |||
15
Explorer Fund
| Market | Percentage | |||
| Value | of Net | |||
| Shares | ($000) | Assets | ||
| Utilities † | 73,485 | 0.7% | ||
| Total Common Stocks (Cost $7,651,689) | 10,480,734 | 96.3%3 | ||
| Coupon | ||||
| Temporary Cash Investments | ||||
| Money Market Fund | ||||
| 4,5 Vanguard Market Liquidity Fund | 0.179% | 448,808,769 | 448,809 | 4.1% |
| Repurchase Agreement † | 19,300 | 0.2% | ||
| 6U.S. Government and Agency Obligations † | 11,447 | 0.1% | ||
| Total Temporary Cash Investments (Cost $479,556) | 479,556 | 4.4%3 | ||
| Total Investments (Cost $8,131,245) | 10,960,290 | 100.7% | ||
| Other Assets and Liabilities | ||||
| Other Assets | 115,777 | 1.1% | ||
| Liabilities5 | (195,524) | (1.8%) | ||
| (79,747) | (0.7%) | |||
| Net Assets | 10,880,543 | 100.0% | ||
16
Explorer Fund
| At April 30, 2011, net assets consisted of: | |
| Amount | |
| ($000) | |
| Paid-in Capital | 8,571,583 |
| Overdistributed Net Investment Income | (11,970) |
| Accumulated Net Realized Losses | (512,956) |
| Unrealized Appreciation (Depreciation) | |
| Investment Securities | 2,829,045 |
| Futures Contracts | 4,838 |
| Foreign Currencies | 3 |
| Net Assets | 10,880,543 |
| Investor Shares—Net Assets | |
| Applicable to 88,811,290 outstanding $.001 par value shares of | |
| beneficial interest (unlimited authorization) | 7,305,847 |
| Net Asset Value Per Share—Investor Shares | $82.26 |
| Admiral Shares—Net Assets | |
| Applicable to 46,675,229 outstanding $.001 par value shares of | |
| beneficial interest (unlimited authorization) | 3,574,696 |
| Net Asset Value Per Share—Admiral Shares | $76.59 |
See Note A in Notes to Financial Statements.
* Non-income-producing security.
^ Part of security position is on loan to broker-dealers. The total value of securities on loan is $55,822,000.
† Represents the aggregate value, by category, of securities that are not among the 50 largest holdings and, in total for any issuer, represent 1% or less of net assets.
1 Considered an affiliated company of the fund as the fund owns more than 5% of the outstanding voting securities of such company.
2 Considered an affiliated company of the fund as the issuer is another member of The Vanguard Group.
3 The fund invests a portion of its cash reserves in equity markets through the use of index futures contracts. After giving effect to futures investments, the fund’s effective common stock and temporary cash investment positions represent 98.2% and 2.5%, respectively, of net assets.
4 Affiliated money market fund available only to Vanguard funds and certain trusts and accounts managed by Vanguard. Rate shown is the 7-day yield.
5 Includes $56,995,000 of collateral received for securities on loan.
6 Securities with a value of $7,698,000 have been segregated as initial margin for open futures contracts.
REIT—Real Estate Investment Trust.
See accompanying Notes, which are an integral part of the Financial Statements.
17
Explorer Fund
| Statement of Operations | |
| Six Months Ended | |
| April 30, 2011 | |
| ($000) | |
| Investment Income | |
| Income | |
| Dividends1,2 | 29,669 |
| Interest2 | 409 |
| Security Lending | 955 |
| Total Income | 31,033 |
| Expenses | |
| Investment Advisory Fees—Note B | |
| Basic Fee | 10,237 |
| Performance Adjustment | 205 |
| The Vanguard Group—Note C | |
| Management and Administrative—Investor Shares | 9,016 |
| Management and Administrative—Admiral Shares | 1,748 |
| Marketing and Distribution—Investor Shares | 757 |
| Marketing and Distribution—Admiral Shares | 375 |
| Custodian Fees | 112 |
| Shareholders’ Reports—Investor Shares | 46 |
| Shareholders’ Reports—Admiral Shares | 26 |
| Trustees’ Fees and Expenses | 10 |
| Total Expenses | 22,532 |
| Expenses Paid Indirectly | (210) |
| Net Expenses | 22,322 |
| Net Investment Income | 8,711 |
| Realized Net Gain (Loss) | |
| Investment Securities Sold2 | 1,069,112 |
| Futures Contracts | 30,151 |
| Foreign Currencies | (65) |
| Realized Net Gain (Loss) | 1,099,198 |
| Change in Unrealized Appreciation (Depreciation) | |
| Investment Securities | 1,116,008 |
| Futures Contracts | (191) |
| Foreign Currencies | 3 |
| Change in Unrealized Appreciation (Depreciation) | 1,115,820 |
| Net Increase (Decrease) in Net Assets Resulting from Operations | 2,223,729 |
1 Dividends are net of foreign withholding taxes of $83,000.
2 Dividend income, interest income, and realized net gain (loss) from affiliated companies of the fund were $1,244,000, $356,000, and ($1,579,000), respectively.
See accompanying Notes, which are an integral part of the Financial Statements.
18
Explorer Fund
| Statement of Changes in Net Assets | ||
| Six Months Ended | Year Ended | |
| April 30, | October 31, | |
| 2011 | 2010 | |
| ($000) | ($000) | |
| Increase (Decrease) in Net Assets | ||
| Operations | ||
| Net Investment Income | 8,711 | 21,883 |
| Realized Net Gain (Loss) | 1,099,198 | 666,088 |
| Change in Unrealized Appreciation (Depreciation) | 1,115,820 | 1,406,632 |
| Net Increase (Decrease) in Net Assets Resulting from Operations | 2,223,729 | 2,094,603 |
| Distributions | ||
| Net Investment Income | ||
| Investor Shares | (9,771) | (10,678) |
| Admiral Shares | (9,545) | (7,955) |
| Realized Capital Gain | ||
| Investor Shares | — | — |
| Admiral Shares | — | — |
| Total Distributions | (19,316) | (18,633) |
| Capital Share Transactions | ||
| Investor Shares | (470,095) | (865,430) |
| Admiral Shares | (7,094) | 13,342 |
| Net Increase (Decrease) from Capital Share Transactions | (477,189) | (852,088) |
| Total Increase (Decrease) | 1,727,224 | 1,223,882 |
| Net Assets | ||
| Beginning of Period | 9,153,319 | 7,929,437 |
| End of Period1 | 10,880,543 | 9,153,319 |
1 Net Assets—End of Period includes undistributed (overdistributed) net investment income of ($11,970,000) and ($1,300,000).
See accompanying Notes, which are an integral part of the Financial Statements.
19
Explorer Fund
Financial Highlights
| Investor Shares | ||||||
| Six Months | ||||||
| Ended | ||||||
| For a Share Outstanding | April 30, | Year Ended October 31, | ||||
| Throughout Each Period | 2011 | 2010 | 2009 | 2008 | 2007 | 2006 |
| Net Asset Value, Beginning of Period | $66.02 | $51.77 | $45.54 | $83.93 | $80.26 | $76.67 |
| Investment Operations | ||||||
| Net Investment Income | .041 | .109 | .178 | .295 | .362 | .302 |
| Net Realized and Unrealized Gain (Loss) | ||||||
| on Investments | 16.305 | 14.239 | 6.334 | (31.589) | 11.052 | 9.724 |
| Total from Investment Operations | 16.346 | 14.348 | 6.512 | (31.294) | 11.414 | 10.026 |
| Distributions | ||||||
| Dividends from Net Investment Income | (.106) | (.098) | (.282) | (.310) | (.320) | (.230) |
| Distributions from Realized Capital Gains | — | — | — | (6.786) | (7.424) | (6.206) |
| Total Distributions | (.106) | (.098) | (.282) | (7.096) | (7.744) | (6.436) |
| Net Asset Value, End of Period | $82.26 | $66.02 | $51.77 | $45.54 | $83.93 | $80.26 |
| Total Return1 | 24.78% | 27.74% | 14.46% | -40.17% | 15.31% | 13.59% |
| Ratios/Supplemental Data | ||||||
| Net Assets, End of Period (Millions) | $7,306 | $6,290 | $5,677 | $5,026 | $8,937 | $8,517 |
| Ratio of Total Expenses to | ||||||
| Average Net Assets2 | 0.50% | 0.49% | 0.54% | 0.44% | 0.41% | 0.46% |
| Ratio of Net Investment Income to | ||||||
| Average Net Assets | 0.12% | 0.19% | 0.38% | 0.40% | 0.44% | 0.36% |
| Portfolio Turnover Rate | 95%3 | 82% | 95% | 112% | 90% | 96% |
The expense ratio, net income ratio, and turnover rate for the current period have been annualized.
1 Total returns do not include account service fees that may have applied in the periods shown. Fund prospectuses provide information about any applicable account service fees.
2 Includes performance-based investment advisory fee increases (decreases) of 0.00%, (0.01%), (0.01%), (0.02%), (0.04%), and (0.03%).
3 Excludes the value of portfolio securities received or delivered as a result of in-kind purchases or redemptions of the fund’s capital shares.
See accompanying Notes, which are an integral part of the Financial Statements.
20
Explorer Fund
Financial Highlights
| Admiral Shares | ||||||
| Six Months | ||||||
| Ended | ||||||
| For a Share Outstanding | April 30, | Year Ended October 31, | ||||
| Throughout Each Period | 2011 | 2010 | 2009 | 2008 | 2007 | 2006 |
| Net Asset Value, Beginning of Period | $61.50 | $48.21 | $42.45 | $78.25 | $74.82 | $71.47 |
| Investment Operations | ||||||
| Net Investment Income | .080 | .206 | .246 | .385 | .478 | .422 |
| Net Realized and Unrealized Gain (Loss) | ||||||
| on Investments | 15.199 | 13.259 | 5.881 | (29.442) | 10.299 | 9.050 |
| Total from Investment Operations | 15.279 | 13.465 | 6.127 | (29.057) | 10.777 | 9.472 |
| Distributions | ||||||
| Dividends from Net Investment Income | (.189) | (.175) | (.367) | (.427) | (.437) | (.346) |
| Distributions from Realized Capital Gains | — | — | — | (6.316) | (6.910) | (5.776) |
| Total Distributions | (.189) | (.175) | (.367) | (6.743) | (7.347) | (6.122) |
| Net Asset Value, End of Period | $76.59 | $61.50 | $48.21 | $42.45 | $78.25 | $74.82 |
| Total Return | 24.89% | 27.98% | 14.66% | -40.07% | 15.53% | 13.79% |
| Ratios/Supplemental Data | ||||||
| Net Assets, End of Period (Millions) | $3,575 | $2,864 | $2,252 | $2,023 | $3,652 | $3,264 |
| Ratio of Total Expenses to | ||||||
| Average Net Assets1 | 0.34% | 0.32% | 0.34% | 0.26% | 0.23% | 0.28% |
| Ratio of Net Investment Income to | ||||||
| Average Net Assets | 0.28% | 0.36% | 0.58% | 0.58% | 0.62% | 0.54% |
| Portfolio Turnover Rate | 95%2 | 82% | 95% | 112% | 90% | 96% |
The expense ratio, net income ratio, and turnover rate for the current period have been annualized.
1 Includes performance-based investment advisory fee increases (decreases) of 0.00%, (0.01%), (0.01%), (0.02%), (0.04%), and (0.03%).
2 Excludes the value of portfolio securities received or delivered as a result of in-kind purchases or redemptions of the fund’s capital shares.
See accompanying Notes, which are an integral part of the Financial Statements.
21
Explorer Fund
Notes to Financial Statements
Vanguard Explorer Fund is registered under the Investment Company Act of 1940 as an open-end investment company, or mutual fund. The fund offers two classes of shares: Investor Shares and Admiral Shares. Investor Shares are available to any investor who meets the fund’s minimum purchase requirements. Admiral Shares are designed for investors who meet certain administrative, service, and account-size criteria.
A. The following significant accounting policies conform to generally accepted accounting principles for U.S. mutual funds. The fund consistently follows such policies in preparing its financial statements.
1. Security Valuation: Securities are valued as of the close of trading on the New York Stock Exchange (generally 4 p.m., Eastern time) on the valuation date. Equity securities are valued at the latest quoted sales prices or official closing prices taken from the primary market in which each security trades; such securities not traded on the valuation date are valued at the mean of the latest quoted bid and asked prices. Securities for which market quotations are not readily available, or whose values have been affected by events occurring before the fund’s pricing time but after the close of the securities’ primary markets, are valued at their fair values calculated according to procedures adopted by the board of trustees. These procedures include obtaining quotations from an independent pricing service, monitoring news to identify significant market- or security-specific events, and evaluating changes in the values of foreign market proxies (for example, ADRs, futures contracts, or exchange-traded funds), between the time the foreign markets close and the fund’s pricing time. When fair-value pricing is employed, the prices of securities used by a fund to calculate its net asset value may differ from quoted or published prices for the same securities. Investments in Vanguard Market Liquidity Fund are valued at that fund’s net asset value. Temporary cash investments acquired over 60 days to maturity are valued using the latest bid prices or using valuations based on a matrix system (which considers such factors as security prices, yields, maturities, and ratings), both as furnished by independent pricing services. Other temporary cash investments are valued at amortized cost, which approximates market value.
2. Foreign Currency: Securities and other assets and liabilities denominated in foreign currencies are translated into U.S. dollars using exchange rates obtained from an independent third party as of the fund’s pricing time on the valuation date. Realized gains (losses) and unrealized appreciation (depreciation) on investment securities include the effects of changes in exchange rates since the securities were purchased, combined with the effects of changes in security prices. Fluctuations in the value of other assets and liabilities resulting from changes in exchange rates are recorded as unrealized foreign currency gains (losses) until the assets or liabilities are settled in cash, at which time they are recorded as realized foreign currency gains (losses).
3. Futures Contracts: The fund uses index futures contracts to a limited extent, with the objective of maintaining full exposure to the stock market while maintaining liquidity. The fund may purchase or sell futures contracts to achieve a desired level of investment, whether to accommodate portfolio turnover or cash flows from capital share transactions. The primary risks associated with the use of futures contracts are imperfect correlation between changes in market values of stocks held by the fund and the prices of futures contracts, and the possibility of an illiquid market.
Futures contracts are valued at their quoted daily settlement prices. The aggregate principal amounts of the contracts are not recorded in the Statement of Net Assets. Fluctuations in the value of the contracts are recorded in the Statement of Net Assets as an asset (liability) and in the Statement of Operations as unrealized appreciation (depreciation) until the contracts are closed, when they are recorded as realized futures gains (losses).
22
Explorer Fund
4. Repurchase Agreements: The fund invests in repurchase agreements. Securities pledged as collateral for repurchase agreements are held by a custodian bank until the agreements mature. Each agreement requires that the market value of the collateral be sufficient to cover payments of interest and principal; however, in the event of default or bankruptcy by the other party to the agreement, retention of the collateral may be subject to legal proceedings.
5. Federal Income Taxes: The fund intends to continue to qualify as a regulated investment company and distribute all of its taxable income. Management has analyzed the fund’s tax positions taken for all open federal income tax years (October 31, 2007–2010), and for the period ended April 30, 2011, and has concluded that no provision for federal income tax is required in the fund’s financial statements.
6. Distributions: Distributions to shareholders are recorded on the ex-dividend date.
7. Security Lending: The fund may lend its securities to qualified institutional borrowers to earn additional income. Security loans are required to be secured at all times by collateral at least equal to the market value of securities loaned. The fund invests cash collateral received in Vanguard Market Liquidity Fund, and records a liability for the return of the collateral, during the period the securities are on loan. Security lending income represents fees charged to borrowers plus income earned on investing cash collateral, less expenses associated with the loan.
8. Other: Dividend income is recorded on the ex-dividend date. Interest income includes income distributions received from Vanguard Market Liquidity Fund and is accrued daily. Security transactions are accounted for on the date securities are bought or sold. Costs used to determine realized gains (losses) on the sale of investment securities are those of the specific securities sold.
Each class of shares has equal rights as to assets and earnings, except that each class separately bears certain class-specific expenses related to maintenance of shareholder accounts (included in Management and Administrative expenses) and shareholder reporting. Marketing and distribution expenses are allocated to each class of shares based on a method approved by the board of trustees. Income, other non-class-specific expenses, and gains and losses on investments are allocated to each class of shares based on its relative net assets.
B. Granahan Investment Management, Inc., Wellington Management Company, LLP, Kalmar Investment Advisers, Chartwell Investment Partners, L.P., and Century Capital Management, LLC, each provide investment advisory services to a portion of the fund for a fee calculated at an annual percentage rate of average net assets managed by the advisor. The basic fees of Granahan Investment Management, Inc., Kalmar Investment Advisers, Wellington Management Company, LLP and Chartwell Investment Partners, L.P are subject to quarterly adjustments based on performance for the preceding three years relative to the Russell 2500 Growth Index. The basic fee for Century Capital Management, LLC, is subject to quarterly adjustments based on performance since October 31, 2008, relative to a 50/50 blend of the Russell 2500 Index and Russell 2500 Growth Index.
The Vanguard Group provides investment advisory services to a portion of the fund on an at-cost basis; the fund paid Vanguard advisory fees of $315,000 for the six months ended April 30, 2011.
For the six months ended April 30, 2011, the aggregate investment advisory fee represented an effective annual basic rate of 0.20% of the fund’s average net assets, before an increase of $205,000 (0.00%) based on performance.
C. The Vanguard Group furnishes at cost corporate management, administrative, marketing, and distribution services. The costs of such services are allocated to the fund under methods approved by the board of trustees. The fund has committed to provide up to 0.40% of its net assets in capital
23
Explorer Fund
contributions to Vanguard. At April 30, 2011, the fund had contributed capital of $1,698,000 to Vanguard (included in Other Assets), representing 0.02% of the fund’s net assets and 0.68% of Vanguard’s capitalization. The fund’s trustees and officers are also directors and officers of Vanguard.
D. The fund has asked its investment advisors to direct certain security trades, subject to obtaining the best price and execution, to brokers who have agreed to rebate to the fund part of the commissions generated. Such rebates are used solely to reduce the fund’s management and administrative expenses. For the six months ended April 30, 2011, these arrangements reduced the fund’s expenses by $210,000 (an annual rate of 0.00% of average net assets).
E. Various inputs may be used to determine the value of the fund’s investments. These inputs are summarized in three broad levels for financial statement purposes. The inputs or methodologies used to value securities are not necessarily an indication of the risk associated with investing in those securities.
Level 1—Quoted prices in active markets for identical securities.
Level 2—Other significant observable inputs (including quoted prices for similar securities, interest rates, prepayment speeds, credit risk, etc.).
Level 3—Significant unobservable inputs (including the fund’s own assumptions used to determine the fair value of investments).
The following table summarizes the fund’s investments as of April 30, 2011, based on the inputs used to value them:
| Level 1 | Level 2 | Level 3 | |
| Investments | ($000) | ($000) | ($000) |
| Common Stocks | 10,463,645 | 17,089 | — |
| Temporary Cash Investments | 448,809 | 30,747 | — |
| Futures Contracts—Assets1 | 1,038 | — | — |
| Total | 10,913,492 | 47,836 | — |
| 1 Represents variation margin on the last day of the reporting period. |
F. At April 30, 2011, the aggregate settlement value of open futures contracts and the related unrealized appreciation (depreciation) were:
| ($000) | ||||
| Aggregate | ||||
| Number of | Settlement | Unrealized | ||
| Long (Short) | Value | Appreciation | ||
| Futures Contracts | Expiration | Contracts | Long (Short) | (Depreciation) |
| E-mini Russell 2000 Index | June 2011 | 2,121 | 183,233 | 3,607 |
| S&P MidCap 400 Index | June 2011 | 26 | 13,175 | 1,060 |
| E-mini S&P MidCap 400 Index | June 2011 | 90 | 9,122 | 171 |
Unrealized appreciation (depreciation) on open futures contracts is required to be treated as realized gain (loss) for tax purposes.
24
Explorer Fund
G. Distributions are determined on a tax basis and may differ from net investment income and realized capital gains for financial reporting purposes. Differences may be permanent or temporary. Permanent differences are reclassified among capital accounts in the financial statements to reflect their tax character. Temporary differences arise when certain items of income, expense, gain, or loss are recognized in different periods for financial statement and tax purposes; these differences will reverse at some time in the future. Differences in classification may also result from the treatment of short-term gains as ordinary income for tax purposes.
During the six months ended April 30, 2011, the fund realized net foreign currency losses of $65,000, which decreased distributable net income for tax purposes; accordingly, such losses have been reclassified from accumulated net realized losses to overdistributed net investment income.
During the six months ended April 30, 2011, the fund realized $40,256,000 of net capital gains resulting from in-kind redemptions—in which shareholders exchanged fund shares for securities held by the fund rather than for cash. Because such gains are not taxable to the fund, and are not distributed to shareholders, they have been reclassified from accumulated net realized losses to paid-in capital.
The fund’s tax-basis capital gains and losses are determined only at the end of each fiscal year. For tax purposes, at October 31, 2010, the fund had available capital loss carryforwards totaling $1,533,525,000 to offset future net capital gains of $88,551,000 through October 31, 2016, and $1,444,974,000 through October 31, 2017. The fund will use these capital losses to offset net taxable capital gains, if any, realized during the year ending October 31, 2011; should the fund realize net capital losses for the year, the losses will be added to the loss carryforward balance above.
At April 30, 2011, the cost of investment securities for tax purposes was $8,131,245,000. Net unrealized appreciation of investment securities for tax purposes was $2,829,045,000, consisting of unrealized gains of $2,946,121,000 on securities that had risen in value since their purchase and $117,076,000 in unrealized losses on securities that had fallen in value since their purchase.
H. During the six months ended April 30, 2011, the fund purchased $4,625,085,000 of investment securities and sold $5,174,959,000 of investment securities, other than temporary cash investments. Realized net gains for the six months ended April 30, 2011, include $6,566,000 received from AXA Rosenberg Investment Management, a former investment advisor to the fund, as a result of a settlement with the Securities and Exchange Commission related to a coding error in its quantitative investment process. The settlement proceeds represent 0.06% of the fund’s average net assets for the six months ended April 30, 2011.
25
Explorer Fund
I. Certain of the fund’s investments are in companies that are considered to be affiliated companies of the fund because the fund owns more than 5% of the outstanding voting securities of the company. Transactions during the period in securities of these companies were as follows:
| Current Period Transactions | |||||
| Oct. 31, 2010 | Proceeds from | April 30, 2011 | |||
| Market | Purchases | Securities | Dividend | Market | |
| Value | at Cost | Sold | Income | Value | |
| ($000) | ($000) | ($000) | ($000) | ($000) | |
| ABIOMED Inc. | 20,101 | 876 | 629 | — | 34,590 |
| Beacon Roofing Supply Inc. | 38,932 | 23,027 | 27,017 | — | NA1 |
| Liz Claiborne Inc. | NA2 | 19,012 | — | — | 34,392 |
| Sabra Healthcare REIT Inc. | NA2 | 10,733 | — | — | 21,949 |
| TiVo Inc. | NA2 | 15,896 | 10,533 | — | 60,739 |
| Vonage Holdings Corp. | NA2 | 18,415 | 2,530 | — | 57,540 |
| 59,033 | — | 209,210 | |||
1 Not applicable — At April 30, 2011, the security was still held, but the issuer was no longer an affiliated company of the fund.
2 Not applicable — At October 31, 2010, the issuer was not an affiliated company of the fund.
J. Capital share transactions for each class of shares were:
| Six Months Ended | Year Ended | |||
| April 30, 2011 | October 31, 2010 | |||
| Amount | Shares | Amount | Shares | |
| ($000) | (000) | ($000) | (000) | |
| Investor Shares | ||||
| Issued | 639,786 | 8,615 | 836,502 | 13,941 |
| Issued in Lieu of Cash Distributions | 9,647 | 133 | 10,536 | 182 |
| Redeemed | (1,119,528) | (15,204) | (1,712,468) | (28,532) |
| Net Increase (Decrease)—Investor Shares | (470,095) | (6,456) | (865,430) | (14,409) |
| Admiral Shares | ||||
| Issued | 699,579 | 10,366 | 578,617 | 10,179 |
| Issued in Lieu of Cash Distributions | 8,743 | 130 | 7,302 | 135 |
| Redeemed | (715,416) | (10,384) | (572,577) | (10,460) |
| Net Increase (Decrease)—Admiral Shares | (7,094) | 112 | 13,342 | (146) |
K. In preparing the financial statements as of April 30, 2011, management considered the impact of subsequent events for potential recognition or disclosure in these financial statements.
26
About Your Fund’s Expenses
As a shareholder of the fund, you incur ongoing costs, which include costs for portfolio management, administrative services, and shareholder reports (like this one), among others. Operating expenses, which are deducted from a fund’s gross income, directly reduce the investment return of the fund.
A fund’s expenses are expressed as a percentage of its average net assets. This figure is known as the expense ratio. The following examples are intended to help you understand the ongoing costs (in dollars) of investing in your fund and to compare these costs with those of other mutual funds. The examples are based on an investment of $1,000 made at the beginning of the period shown and held for the entire period.
The accompanying table illustrates your fund’s costs in two ways:
• Based on actual fund return. This section helps you to estimate the actual expenses that you paid over the period. The ”Ending Account Value“ shown is derived from the fund‘s actual return, and the third column shows the dollar amount that would have been paid by an investor who started with $1,000 in the fund. You may use the information here, together with the amount you invested, to estimate the expenses that you paid over the period.
To do so, simply divide your account value by $1,000 (for example, an $8,600 account value divided by $1,000 = 8.6), then multiply the result by the number given for your fund under the heading ”Expenses Paid During Period.“
• Based on hypothetical 5% yearly return. This section is intended to help you compare your fund‘s costs with those of other mutual funds. It assumes that the fund had a yearly return of 5% before expenses, but that the expense ratio is unchanged. In this case—because the return used is not the fund’s actual return—the results do not apply to your investment. The example is useful in making comparisons because the Securities and Exchange Commission requires all mutual funds to calculate expenses based on a 5% return. You can assess your fund’s costs by comparing this hypothetical example with the hypothetical examples that appear in shareholder reports of other funds.
Note that the expenses shown in the table are meant to highlight and help you compare ongoing costs only and do not reflect transaction costs incurred by the fund for buying and selling securities. Further, the expenses do not include any purchase, redemption, or account service fees described in the fund prospectus. If such fees were applied to your account, your costs would be higher. Your fund does not carry a “sales load.”
The calculations assume no shares were bought or sold during the period. Your actual costs may have been higher or lower, depending on the amount of your investment and the timing of any purchases or redemptions.
You can find more information about the fund’s expenses, including annual expense ratios, in the Financial Statements section of this report. For additional information on operating expenses and other shareholder costs, please refer to your fund’s current prospectus.
27
| Six Months Ended April 30, 2011 | |||
| Beginning | Ending | Expenses | |
| Account Value | Account Value | Paid During | |
| Explorer Fund | 10/31/2010 | 4/30/2011 | Period |
| Based on Actual Fund Return | |||
| Investor Shares | $1,000.00 | $1,247.81 | $2.79 |
| Admiral Shares | 1,000.00 | 1,248.85 | 1.90 |
| Based on Hypothetical 5% Yearly Return | |||
| Investor Shares | $1,000.00 | $1,022.32 | $2.51 |
| Admiral Shares | 1,000.00 | 1,023.11 | 1.71 |
The calculations are based on expenses incurred in the most recent six-month period. The fund’s annualized six-month expense ratios for that period are 0.50% for Investor Shares and 0.34% for Admiral Shares. The dollar amounts shown as “Expenses Paid” are equal to the annualized expense ratio multiplied by the average account value over the period, multiplied by the number of days in the most recent six-month period, then divided by the number of days in the most recent 12-month period.
28
Trustees Approve Advisory Arrangements
The board of trustees of Vanguard Explorer Fund renewed the fund’s investment advisory arrangements with Granahan Investment Management, Inc.; Kalmar Investment Advisers; The Vanguard Group, Inc. (through its Quantitative Equity Group); Chartwell Investment Partners, L.P.; and Century Capital Management, LLC, and approved amendments to the fund’s investment advisory agreement with Wellington Management Company, LLP, effective February 1, 2011. The amended agreement contains a new advisory fee schedule that increases the advisory fee paid to Wellington Management. The board determined at that time that the retention and amendment to the investment advisory agreement of the advisors was in the best interests of the fund and its shareholders.
The board based its decision upon an evaluation of each advisor’s investment staff, portfolio management process, and performance. The trustees considered the factors discussed below, among others. However, no single factor determined whether the board approved the arrangements. Rather, it was the totality of the circumstances that drove the board’s decision.
Nature, extent, and quality of services
The board considered the quality of the fund’s investment management over both the short and long term, and took into account the organizational depth and stability of each advisor. The board noted the following:
Granahan Investment Management, Inc. Founded in 1985, Granahan specializes in small-cap growth equity investing. The firm uses fundamental research to select a portfolio of 125–175 stocks with sustainable growth characteristics. The advisor achieves portfolio diversification through dedicated allocations to three categories of growth companies: core growth (40%–70% of subportfolio assets), represented by companies with strong market position, based on proprietary products or services; pioneers (15%–30%), companies with unique technology or innovations; and special value (15%–30%), companies with growth potential overlooked by the market. The firm has managed a portion of the fund since 1990.
Wellington Management Company, LLP. Founded in 1928, Wellington Management is among the nation’s oldest and most respected institutional investment managers. Using a bottom-up, fundamentally driven approach, Wellington Management invests opportunistically in a diversified portfolio of high-quality stocks. The advisor attempts to identify companies that are early in their growth cycle. The research-intensive approach is supported by the team’s deep and tenured analytical staff, which may also make use of Wellington Management’s extensive industry research capabilities. The firm has advised the fund since 1967.
Kalmar Investment Advisers. Kalmar, together with its parent company, Kalmar Investments Inc., founded in 1982, specializes in small- and mid-cap growth equity investing. Kalmar is a research-driven investment firm that is entirely focused on the management of “growth with value” small- and mid-cap equity portfolios. Kalmar believes that there is a high-reward and low-risk anomaly offered by the equity market in the stocks of solid, well-managed, rapidly growing smaller companies. Through independent fundamental research, Kalmar attempts to discover such companies, buy them at undervalued levels, and own them for the longer term. The firm has managed a portion of the fund since 2005.
The Vanguard Group, Inc. Vanguard has been managing investments for more than three decades. The Quantitative Equity Group adheres to a sound, disciplined investment management process; the team has considerable experience, stability, and depth. Vanguard has managed a portion of the fund since 1997.
29
Chartwell Investment Partners, L.P. Chartwell is an independent, employee-owned firm, founded in 1997. The firm has expertise in small- and mid-cap equity management and employs a fundamental bottom-up strategy, seeking companies with superior growth potential trading at reasonable valuations. The firm has managed a portion of the fund since 1997.
Century Capital Management, LLC. Century Capital is a Boston-based investment management boutique, owned by the investment professionals within the firm. The public equity team, led by chief investment officer Alexander L. Thorndike, oversees two mutual funds: a small-cap growth fund and a large-cap fund. The team also oversees small-cap growth and small/mid-cap growth portfolios for institutional investors. Century Capital employs a fundamental, bottom-up investment approach that seeks to identify reasonably priced companies that will grow faster than the overall market. Independent research is a core tenet. The ideal investment is a well-managed company that is reasonably valued, in a non-capital-intensive business, with established products or services, a high return on equity, high recurring revenues, and improving margins. The firm has managed a portion of the fund since 2008.
The board concluded that each advisor’s experience, stability, depth, and performance, among other factors, warranted continuation of and amendment to (as applicable) the advisory arrangements.
Investment performance
The board considered the short- and long-term performance of the fund, including any periods of outperformance or underperformance of a relevant benchmark and peer group. The board concluded that each advisor has carried out the fund’s investment strategy in disciplined fashion, and that performance results have allowed the fund to remain competitive versus its benchmark and its peer group. Information about the fund’s most recent performance can be found in the Performance Summary section of this report.
Cost
The board concluded that the fund’s expense ratio was well below the average expense ratio charged by funds in its peer group and that the fund’s advisory fee rate was also well below the peer-group average. Information about the fund’s expenses appears in the About Your Fund’s Expenses section of this report as well as in the Financial Statements section, which also includes information about the advisory fee rate.
The board did not consider profitability of Granahan, Wellington Management, Kalmar, Chartwell, and Century Capital in determining whether to approve the advisory fees, because the firms are independent of Vanguard and the advisory fees are the result of arm’s-length negotiations. The board does not conduct a profitability analysis of Vanguard because of Vanguard’s unique “at-cost” structure. Unlike most other mutual fund management companies, Vanguard is owned by the funds it oversees, and produces “profits” only in the form of reduced expenses for fund shareholders.
The benefit of economies of scale
The board concluded that the fund’s shareholders benefit from economies of scale because of breakpoints in the advisory fee schedules for Granahan, Wellington Management, Kalmar, Chartwell, and Century Capital. The breakpoints reduce the effective rate of the fees as the fund’s assets managed by each firm increase.
The board also concluded that the fund’s low-cost arrangement with Vanguard ensures that the fund will realize economies of scale as it grows, with the cost to shareholders declining as the fund’s assets managed by Vanguard increase.
The board will consider whether to renew the advisory arrangements again after a one-year period.
30
Glossary
30-Day SEC Yield. A fund’s 30-day SEC yield is derived using a formula specified by the U.S. Securities and Exchange Commission. Under the formula, data related to the fund’s security holdings in the previous 30 days are used to calculate the fund’s hypothetical net income for that period, which is then annualized and divided by the fund’s estimated average net assets over the calculation period. For the purposes of this calculation, a security’s income is based on its current market yield to maturity (in the case of bonds) or its projected dividend yield (for stocks). Because the SEC yield represents hypothetical annualized income, it will differ—at times significantly—from the fund’s actual experience. As a result, the fund’s income distributions may be higher or lower than implied by the SEC yield.
Beta. A measure of the magnitude of a fund’s past share-price fluctuations in relation to the ups and downs of a given market index. The index is assigned a beta of 1.00. Compared with a given index, a fund with a beta of 1.20 typically would have seen its share price rise or fall by 12% when the index rose or fell by 10%. For this report, beta is based on returns over the past 36 months for both the fund and the index. Note that a fund’s beta should be reviewed in conjunction with its R-squared (see definition). The lower the R-squared, the less correlation there is between the fund and the index, and the less reliable beta is as an indicator of volatility.
Dividend Yield. Dividend income earned by stocks, expressed as a percentage of the aggregate market value (or of net asset value, for a fund). The yield is determined by dividing the amount of the annual dividends by the aggregate value (or net asset value) at the end of the period. For a fund, the dividend yield is based solely on stock holdings and does not include any income produced by other investments.
Earnings Growth Rate. The average annual rate of growth in earnings over the past five years for the stocks now in a fund.
Equity Exposure. A measure that reflects a fund’s investments in stocks and stock futures. Any holdings in short-term reserves are excluded.
Expense Ratio. The percentage of a fund’s average net assets used to pay its annual administrative and advisory expenses. These expenses directly reduce returns to investors.
Foreign Holdings. The percentage of a fund represented by stocks or depositary receipts of companies based outside the United States.
Inception Date. The date on which the assets of a fund (or one of its share classes) are first invested in accordance with the fund’s investment objective. For funds with a subscription period, the inception date is the day after that period ends. Investment performance is measured from the inception date.
Median Market Cap. An indicator of the size of companies in which a fund invests; the midpoint of market capitalization (market price x shares outstanding) of a fund’s stocks, weighted by the proportion of the fund’s assets invested in each stock. Stocks representing half of the fund’s assets have market capitalizations above the median, and the rest are below it.
Price/Book Ratio. The share price of a stock divided by its net worth, or book value, per share. For a fund, the weighted average price/book ratio of the stocks it holds.
31
Price/Earnings Ratio. The ratio of a stock’s current price to its per-share earnings over the past year. For a fund, the weighted average P/E of the stocks it holds. P/E is an indicator of market expectations about corporate prospects; the higher the P/E, the greater the expectations for a company’s future growth.
R-Squared. A measure of how much of a fund’s past returns can be explained by the returns from the market in general, as measured by a given index. If a fund’s total returns were precisely synchronized with an index’s returns, its R-squared would be 1.00. If the fund’s returns bore no relationship to the index’s returns, its R-squared would be 0. For this report, R-squared is based on returns over the past 36 months for both the fund and the index.
Return on Equity. The annual average rate of return generated by a company during the past five years for each dollar of shareholder’s equity (net income divided by shareholder’s equity). For a fund, the weighted average return on equity for the companies whose stocks it holds.
Short-Term Reserves. The percentage of a fund invested in highly liquid, short-term securities that can be readily converted to cash.
Turnover Rate. An indication of the fund’s trading activity. Funds with high turnover rates incur higher transaction costs and may be more likely to distribute capital gains (which may be taxable to investors). The turnover rate excludes in-kind transactions, which have minimal impact on costs.
32
This page intentionally left blank.
This page intentionally left blank.
This page intentionally left blank.
The People Who Govern Your Fund
The trustees of your mutual fund are there to see that the fund is operated and managed in your best interests since, as a shareholder, you are a part owner of the fund. Your fund’s trustees also serve on the board of directors of The Vanguard Group, Inc., which is owned by the Vanguard funds and provides services to them on an at-cost basis.
A majority of Vanguard’s board members are independent, meaning that they have no affiliation with Vanguard or the funds they oversee, apart from the sizable personal investments they have made as private individuals. The independent board members have distinguished backgrounds in business, academia, and public service. Each of the trustees and executive officers oversees 179 Vanguard funds.
The following table provides information for each trustee and executive officer of the fund. More information about the trustees is in the Statement of Additional Information, which can be obtained, without charge, by contacting Vanguard at 800-662-7447, or online at vanguard.com.
| Interested Trustee1 | and President (2006–2008) of Rohm and Haas Co. |
| (chemicals); Director of Tyco International, Ltd. | |
| F. William McNabb III | (diversified manufacturing and services) and Hewlett- |
| Born 1957. Trustee Since July 2009. Chairman of the | Packard Co. (electronic computer manufacturing); |
| Board. Principal Occupation(s) During the Past Five | Senior Advisor at New Mountain Capital; Trustee |
| Years: Chairman of the Board of The Vanguard Group, | of The Conference Board; Member of the Board of |
| Inc., and of each of the investment companies served | Managers of Delphi Automotive LLP (automotive |
| by The Vanguard Group, since January 2010; Director | components). |
| of The Vanguard Group since 2008; Chief Executive | |
| Officer and President of The Vanguard Group and of | Amy Gutmann |
| each of the investment companies served by The | Born 1949. Trustee Since June 2006. Principal |
| Vanguard Group since 2008; Director of Vanguard | Occupation(s) During the Past Five Years: President |
| Marketing Corporation; Managing Director of The | of the University of Pennsylvania; Christopher H. |
| Vanguard Group (1995–2008). | Browne Distinguished Professor of Political Science |
| in the School of Arts and Sciences with secondary | |
| appointments at the Annenberg School for Commu- | |
| Independent Trustees | nication and the Graduate School of Education |
| of the University of Pennsylvania; Director of | |
| Emerson U. Fullwood | Carnegie Corporation of New York, Schuylkill River |
| Born 1948. Trustee Since January 2008. Principal | Development Corporation, and Greater Philadelphia |
| Occupation(s) During the Past Five Years: Executive | Chamber of Commerce; Trustee of the National |
| Chief Staff and Marketing Officer for North America | Constitution Center; Chair of the Presidential |
| and Corporate Vice President (retired 2008) of Xerox | Commission for the Study of Bioethical Issues. |
| Corporation (document management products and | |
| services); Executive in Residence and 2010 | JoAnn Heffernan Heisen |
| Distinguished Minett Professor at the Rochester | Born 1950. Trustee Since July 1998. Principal |
| Institute of Technology; Director of SPX Corporation | Occupation(s) During the Past Five Years: Corporate |
| (multi-industry manufacturing), the United Way of | Vice President and Chief Global Diversity Officer |
| Rochester, Amerigroup Corporation (managed health | (retired 2008) and Member of the Executive |
| care), the University of Rochester Medical Center, | Committee (1997–2008) of Johnson & Johnson |
| Monroe Community College Foundation, and North | (pharmaceuticals/consumer products); Director of |
| Carolina A&T University. | Skytop Lodge Corporation (hotels), the University |
| Medical Center at Princeton, the Robert Wood | |
| Rajiv L. Gupta | Johnson Foundation, and the Center for Work Life |
| Born 1945. Trustee Since December 2001.2 | Policy; Member of the Advisory Board of the |
| Principal Occupation(s) During the Past Five Years: | Maxwell School of Citizenship and Public Affairs |
| Chairman and Chief Executive Officer (retired 2009) | at Syracuse University. |
| F. Joseph Loughrey | Thomas J. Higgins | |
| Born 1949. Trustee Since October 2009. Principal | Born 1957. Chief Financial Officer Since September | |
| Occupation(s) During the Past Five Years: President | 2008. Principal Occupation(s) During the Past Five | |
| and Chief Operating Officer (retired 2009) and Vice | Years: Principal of The Vanguard Group, Inc.; Chief | |
| Chairman of the Board (2008–2009) of Cummins Inc. | Financial Officer of each of the investment companies | |
| (industrial machinery); Director of SKF AB (industrial | served by The Vanguard Group since 2008; Treasurer | |
| machinery), Hillenbrand, Inc. (specialized consumer | of each of the investment companies served by The | |
| services), the Lumina Foundation for Education, and | Vanguard Group (1998–2008). | |
| Oxfam America; Chairman of the Advisory Council | ||
| for the College of Arts and Letters and Member | Kathryn J. Hyatt | |
| of the Advisory Board to the Kellogg Institute for | Born 1955. Treasurer Since November 2008. Principal | |
| International Studies at the University of Notre Dame. | Occupation(s) During the Past Five Years: Principal | |
| of The Vanguard Group, Inc.; Treasurer of each of | ||
| André F. Perold | the investment companies served by The Vanguard | |
| Born 1952. Trustee Since December 2004. Principal | Group since 2008; Assistant Treasurer of each of the | |
| Occupation(s) During the Past Five Years: George | investment companies served by The Vanguard Group | |
| Gund Professor of Finance and Banking at the Harvard | (1988–2008). | |
| Business School; Chair of the Investment Committee | ||
| of HighVista Strategies LLC (private investment firm). | Heidi Stam | |
| Born 1956. Secretary Since July 2005. Principal | ||
| Alfred M. Rankin, Jr. | Occupation(s) During the Past Five Years: Managing | |
| Born 1941. Trustee Since January 1993. Principal | Director of The Vanguard Group, Inc., since 2006; | |
| Occupation(s) During the Past Five Years: Chairman, | General Counsel of The Vanguard Group since 2005; | |
| President, and Chief Executive Officer of NACCO | Secretary of The Vanguard Group and of each of the | |
| Industries, Inc. (forklift trucks/housewares/lignite); | investment companies served by The Vanguard Group | |
| Director of Goodrich Corporation (industrial products/ | since 2005; Director and Senior Vice President of | |
| aircraft systems and services) and the National | Vanguard Marketing Corporation since 2005; | |
| Association of Manufacturers; Chairman of the | Principal of The Vanguard Group (1997–2006). | |
| Federal Reserve Bank of Cleveland; Vice Chairman | ||
| of University Hospitals of Cleveland; President of | ||
| the Board of The Cleveland Museum of Art. | Vanguard Senior Management Team | |
| Peter F. Volanakis | R. Gregory Barton | Michael S. Miller |
| Born 1955. Trustee Since July 2009. Principal | Mortimer J. Buckley | James M. Norris |
| Occupation(s) During the Past Five Years: President | Kathleen C. Gubanich | Glenn W. Reed |
| and Chief Operating Officer (retired 2010) of Corning | Paul A. Heller | George U. Sauter |
| Incorporated (communications equipment); Director of | Martha G. King | |
| Corning Incorporated (2000–2010) and Dow Corning | ||
| (2001–2010); Overseer of the Amos Tuck School of | ||
| Business Administration at Dartmouth College. | Chairman Emeritus and Senior Advisor | |
| John J. Brennan | ||
| Executive Officers | Chairman, 1996–2009 | |
| Chief Executive Officer and President, 1996–2008 | ||
| Glenn Booraem | ||
| Born 1967. Controller Since July 2010. Principal | ||
| Occupation(s) During the Past Five Years: Principal | Founder | |
| of The Vanguard Group, Inc.; Controller of each of | ||
| the investment companies served by The Vanguard | John C. Bogle | |
| Group since 2010; Assistant Controller of each of | Chairman and Chief Executive Officer, 1974–1996 | |
| the investment companies served by The Vanguard | ||
| Group (2001–2010). | ||
1 Mr. McNabb is considered an “interested person,” as defined in the Investment Company Act of 1940, because he is an officer of the Vanguard funds.
2 December 2002 for Vanguard Equity Income Fund, Vanguard Growth Equity Fund, the Vanguard Municipal Bond Funds, and the Vanguard State Tax-Exempt Funds.

| |
| P.O. Box 2600 | |
| Valley Forge, PA 19482-2600 |
Connect with Vanguard® > vanguard.com
| Fund Information > 800-662-7447 | CFA® is a trademark owned by CFA Institute. |
| Direct Investor Account Services > 800-662-2739 | |
| Institutional Investor Services > 800-523-1036 | |
| Text Telephone for People | |
| With Hearing Impairment > 800-749-7273 | |
| This material may be used in conjunction | |
| with the offering of shares of any Vanguard | |
| fund only if preceded or accompanied by | |
| the fund’s current prospectus. | |
| All comparative mutual fund data are from Lipper Inc. or | |
| Morningstar, Inc., unless otherwise noted. | |
| You can obtain a free copy of Vanguard’s proxy voting | |
| guidelines by visiting vanguard.com/proxyreporting or by | |
| calling Vanguard at 800-662-2739. The guidelines are | |
| also available from the SEC’s website, sec.gov. In | |
| addition, you may obtain a free report on how your fund | |
| voted the proxies for securities it owned during the 12 | |
| months ended June 30. To get the report, visit either | |
| vanguard.com/proxyreporting or sec.gov. | |
| You can review and copy information about your fund at | |
| the SEC’s Public Reference Room in Washington, D.C. To | |
| find out more about this public service, call the SEC at | |
| 202-551-8090. Information about your fund is also | |
| available on the SEC’s website, and you can receive | |
| copies of this information, for a fee, by sending a | |
| request in either of two ways: via e-mail addressed to | |
| publicinfo@sec.gov or via regular mail addressed to the | |
| Public Reference Section, Securities and Exchange | |
| Commission, Washington, DC 20549-1520. | |
| © 2011 The Vanguard Group, Inc. | |
| All rights reserved. | |
| Vanguard Marketing Corporation, Distributor. | |
| Q242 062011 | |
| Vanguard® Explorer Fund | |||
| Schedule of Investments | |||
| April 30, 2011 | |||
| Market | |||
| Value | |||
| Shares | ($000) | ||
| Common Stocks (96.3%)1 | |||
| Consumer Discretionary (11.8%) | |||
| Cinemark Holdings Inc. | 2,542,130 | 51,682 | |
| * | MGM Resorts International | 4,058,610 | 51,382 |
| Williams-Sonoma Inc. | 1,109,159 | 48,149 | |
| * | DreamWorks Animation SKG Inc. Class A | 1,744,780 | 46,219 |
| Gentex Corp. | 1,423,455 | 44,625 | |
| * | Life Time Fitness Inc. | 1,034,865 | 40,484 |
| * | CarMax Inc. | 1,143,842 | 39,691 |
| Tractor Supply Co. | 606,880 | 37,548 | |
| * | LKQ Corp. | 1,455,520 | 36,708 |
| Texas Roadhouse Inc. Class A | 2,222,108 | 36,154 | |
| DeVry Inc. | 679,195 | 35,929 | |
| *,^,2 | Liz Claiborne Inc. | 5,467,710 | 34,392 |
| Aaron's Inc. | 1,162,300 | 33,463 | |
| * | G-III Apparel Group Ltd. | 718,450 | 32,230 |
| * | Bally Technologies Inc. | 793,820 | 30,951 |
| Lennar Corp. Class A | 1,583,600 | 30,073 | |
| * | Steven Madden Ltd. | 541,475 | 28,779 |
| * | Pier 1 Imports Inc. | 2,268,793 | 27,634 |
| * | DSW Inc. Class A | 563,296 | 26,745 |
| * | GameStop Corp. Class A | 1,024,945 | 26,321 |
| * | WMS Industries Inc. | 767,844 | 25,185 |
| * | Coinstar Inc. | 458,671 | 24,759 |
| * | O'Reilly Automotive Inc. | 411,011 | 24,274 |
| Service Corp. International | 2,002,130 | 23,565 | |
| * | Buffalo Wild Wings Inc. | 379,100 | 23,163 |
| Interpublic Group of Cos. Inc. | 1,512,630 | 17,773 | |
| * | Cheesecake Factory Inc. | 565,513 | 16,637 |
| * | Talbots Inc. | 2,452,590 | 13,195 |
| * | Gaylord Entertainment Co. | 365,236 | 13,101 |
| * | Ulta Salon Cosmetics & Fragrance Inc. | 245,038 | 13,034 |
| * | priceline.com Inc. | 22,148 | 12,115 |
| * | Warnaco Group Inc. | 187,962 | 12,097 |
| * | Live Nation Entertainment Inc. | 1,041,120 | 11,546 |
| * | Tempur-Pedic International Inc. | 175,165 | 10,997 |
| Sotheby's | 208,130 | 10,515 | |
| * | Urban Outfitters Inc. | 330,110 | 10,385 |
| * | K12 Inc. | 259,783 | 10,228 |
| Starwood Hotels & Resorts Worldwide Inc. | 169,050 | 10,070 | |
| Express Inc. | 453,444 | 9,790 | |
| * | Steiner Leisure Ltd. | 200,000 | 9,708 |
| * | Fossil Inc. | 99,667 | 9,546 |
| Tiffany & Co. | 131,950 | 9,163 | |
| Monro Muffler Brake Inc. | 298,825 | 9,078 | |
| * | Lululemon Athletica Inc. | 90,000 | 9,003 |
| * | BJ's Restaurants Inc. | 190,000 | 8,920 |
| Nordstrom Inc. | 172,142 | 8,185 | |
| Wyndham Worldwide Corp. | 229,855 | 7,955 | |
| * | JOS A Bank Clothiers Inc. | 150,000 | 7,863 |
| * | Domino's Pizza Inc. | 417,091 | 7,745 |
| Darden Restaurants Inc. | 163,843 | 7,696 | |
| * | SodaStream International Ltd. | 160,000 | 7,318 |
| Coach Inc. | 120,319 | 7,196 | |
| Bebe Stores Inc. | 1,059,450 | 7,120 | |
| Ross Stores Inc. | 95,737 | 7,055 | |
| * | Capella Education Co. | 134,800 | 6,686 |
| * | American Public Education Inc. | 156,200 | 6,599 |
| * | Penn National Gaming Inc. | 160,038 | 6,403 |
| * | ITT Educational Services Inc. | 82,554 | 5,922 |
| MDC Partners Inc. Class A | 344,925 | 5,736 | |
| * | Lumber Liquidators Holdings Inc. | 216,800 | 5,626 |
| * | Tenneco Inc. | 115,831 | 5,353 |
1
| Vanguard® Explorer Fund | |||
| Schedule of Investments | |||
| April 30, 2011 | |||
| Market | |||
| Value | |||
| Shares | ($000) | ||
| * | Panera Bread Co. Class A | 43,400 | 5,256 |
| * | CROCS Inc. | 246,985 | 4,967 |
| * | Pinnacle Entertainment Inc. | 351,137 | 4,874 |
| Strayer Education Inc. | 33,000 | 4,088 | |
| Group 1 Automotive Inc. | 89,397 | 3,848 | |
| PetSmart Inc. | 85,695 | 3,614 | |
| Polaris Industries Inc. | 29,879 | 3,150 | |
| * | Signet Jewelers Ltd. | 71,000 | 3,106 |
| Weight Watchers International Inc. | 39,100 | 3,040 | |
| * | Chipotle Mexican Grill Inc. Class A | 11,371 | 3,034 |
| Autoliv Inc. | 36,275 | 2,907 | |
| John Wiley & Sons Inc. Class A | 54,677 | 2,785 | |
| * | TRW Automotive Holdings Corp. | 48,706 | 2,779 |
| Foot Locker Inc. | 126,300 | 2,718 | |
| * | Dana Holding Corp. | 149,353 | 2,714 |
| * | ANN Inc. | 83,171 | 2,596 |
| * | Peet's Coffee & Tea Inc. | 53,000 | 2,463 |
| Cracker Barrel Old Country Store Inc. | 46,933 | 2,404 | |
| Finish Line Inc. Class A | 105,706 | 2,272 | |
| * | Sally Beauty Holdings Inc. | 143,937 | 2,129 |
| American Eagle Outfitters Inc. | 126,200 | 1,964 | |
| Cato Corp. Class A | 76,196 | 1,944 | |
| Brinker International Inc. | 79,099 | 1,905 | |
| * | Jack in the Box Inc. | 89,000 | 1,838 |
| Sinclair Broadcast Group Inc. Class A | 143,800 | 1,652 | |
| Family Dollar Stores Inc. | 28,475 | 1,544 | |
| * | Valassis Communications Inc. | 52,926 | 1,526 |
| * | American Axle & Manufacturing Holdings Inc. | 97,145 | 1,243 |
| * | Deckers Outdoor Corp. | 14,406 | 1,222 |
| * | Timberland Co. Class A | 25,524 | 1,153 |
| * | Belo Corp. Class A | 108,300 | 915 |
| * | Dick's Sporting Goods Inc. | 20,000 | 819 |
| Harman International Industries Inc. | 16,500 | 801 | |
| * | BorgWarner Inc. | 5,832 | 450 |
| * | DineEquity Inc. | 6,141 | 307 |
| Arbitron Inc. | 6,850 | 265 | |
| * | Krispy Kreme Doughnuts Inc. Warrants Exp. 03/02/2012 | 8,183 | 1 |
| 1,281,757 | |||
| Consumer Staples (2.8%) | |||
| Herbalife Ltd. | 616,934 | 55,388 | |
| * | Smithfield Foods Inc. | 1,852,050 | 43,634 |
| Pricesmart Inc. | 833,381 | 34,702 | |
| Nu Skin Enterprises Inc. Class A | 1,061,677 | 34,069 | |
| * | Fresh Market Inc. | 800,687 | 33,485 |
| * | Cott Corp. | 3,345,879 | 29,845 |
| * | United Natural Foods Inc. | 598,194 | 25,537 |
| * | BJ's Wholesale Club Inc. | 288,200 | 14,790 |
| * | Green Mountain Coffee Roasters Inc. | 204,000 | 13,660 |
| * | Boston Beer Co. Inc. Class A | 91,953 | 8,668 |
| Diamond Foods Inc. | 120,000 | 7,872 | |
| B&G Foods Inc. Class A | 126,090 | 2,280 | |
| Lancaster Colony Corp. | 8,220 | 502 | |
| Coca-Cola Bottling Co. Consolidated | 4,450 | 314 | |
| 304,746 | |||
| Energy (7.1%) | |||
| * | Comstock Resources Inc. | 1,463,970 | 46,935 |
| * | Global Industries Ltd. | 4,514,046 | 44,509 |
| * | Atwood Oceanics Inc. | 957,645 | 43,027 |
| Core Laboratories NV | 401,991 | 38,583 | |
| * | Hornbeck Offshore Services Inc. | 1,279,100 | 37,388 |
| * | Brigham Exploration Co. | 1,018,245 | 34,142 |
| * | Rosetta Resources Inc. | 689,840 | 31,684 |
| * | Key Energy Services Inc. | 1,732,455 | 31,531 |
| Tidewater Inc. | 503,005 | 29,934 | |
2
| Vanguard® Explorer Fund | |||
| Schedule of Investments | |||
| April 30, 2011 | |||
| Market | |||
| Value | |||
| Shares | ($000) | ||
| SM Energy Co. | 392,117 | 29,746 | |
| * | Tetra Technologies Inc. | 1,939,216 | 28,642 |
| * | Alpha Natural Resources Inc. | 483,450 | 28,122 |
| * | SandRidge Energy Inc. | 1,998,962 | 24,707 |
| * | ION Geophysical Corp. | 1,918,300 | 24,247 |
| * | Tesco Corp. | 1,225,497 | 23,052 |
| * | Clean Energy Fuels Corp. | 1,318,620 | 22,469 |
| * | Petrohawk Energy Corp. | 827,620 | 22,354 |
| Berry Petroleum Co. Class A | 405,550 | 21,547 | |
| Niko Resources Ltd. | 240,475 | 20,293 | |
| CARBO Ceramics Inc. | 121,319 | 19,525 | |
| * | Complete Production Services Inc. | 549,400 | 18,647 |
| * | Southwestern Energy Co. | 397,625 | 17,440 |
| * | Energy XXI Bermuda Ltd. | 425,350 | 15,419 |
| RPC Inc. | 524,329 | 14,183 | |
| * | Pioneer Drilling Co. | 871,250 | 13,504 |
| * | Oceaneering International Inc. | 146,270 | 12,787 |
| * | Whiting Petroleum Corp. | 179,977 | 12,508 |
| * | Oil States International Inc. | 126,779 | 10,524 |
| Patterson-UTI Energy Inc. | 307,119 | 9,554 | |
| * | Newfield Exploration Co. | 118,566 | 8,394 |
| * | Kodiak Oil & Gas Corp. | 880,588 | 6,182 |
| Cabot Oil & Gas Corp. | 100,800 | 5,673 | |
| * | Basic Energy Services Inc. | 181,300 | 5,573 |
| * | Rex Energy Corp. | 420,105 | 5,390 |
| * | International Coal Group Inc. | 428,700 | 4,729 |
| Arch Coal Inc. | 95,640 | 3,280 | |
| * | Patriot Coal Corp. | 121,550 | 3,061 |
| W&T Offshore Inc. | 82,328 | 2,207 | |
| * | Clayton Williams Energy Inc. | 23,032 | 2,086 |
| Holly Corp. | 29,273 | 1,695 | |
| * | Concho Resources Inc. | 12,381 | 1,323 |
| * | Cloud Peak Energy Inc. | 14,313 | 298 |
| * | Petroquest Energy Inc. | 14,109 | 124 |
| 777,018 | |||
| Exchange-Traded Funds (1.7%) | |||
| 3 | Vanguard Small-Cap ETF | 1,165,083 | 94,733 |
| ^,3 | Vanguard Small-Cap Growth ETF | 713,200 | 63,589 |
| iShares Russell 2000 Index Fund | 344,451 | 29,750 | |
| 188,072 | |||
| Financials (6.6%) | |||
| * | NASDAQ OMX Group Inc. | 1,731,810 | 46,932 |
| * | Affiliated Managers Group Inc. | 410,094 | 44,733 |
| SEI Investments Co. | 1,896,812 | 42,356 | |
| Cash America International Inc. | 784,198 | 37,210 | |
| Redwood Trust Inc. | 2,178,070 | 34,479 | |
| Waddell & Reed Financial Inc. Class A | 783,450 | 32,129 | |
| Lazard Ltd. Class A | 772,230 | 31,661 | |
| Evercore Partners Inc. Class A | 851,500 | 29,709 | |
| * | National Financial Partners Corp. | 1,728,254 | 27,808 |
| Och-Ziff Capital Management Group LLC Class A | 1,717,450 | 27,599 | |
| * | HFF Inc. Class A | 1,790,594 | 26,805 |
| Brown & Brown Inc. | 1,011,870 | 26,157 | |
| MFA Financial Inc. | 3,275,770 | 26,141 | |
| Jefferies Group Inc. | 1,007,563 | 24,353 | |
| MB Financial Inc. | 1,097,175 | 22,701 | |
| * | Signature Bank | 380,499 | 22,149 |
| *,2 | Sabra Healthcare REIT Inc. | 1,304,953 | 21,949 |
| PrivateBancorp Inc. Class A | 1,182,450 | 18,612 | |
| Everest Re Group Ltd. | 196,000 | 17,859 | |
| TCF Financial Corp. | 1,072,100 | 16,714 | |
| American Assets Trust Inc. | 737,000 | 16,273 | |
| * | CB Richard Ellis Group Inc. Class A | 499,666 | 13,346 |
| * | LPL Investment Holdings Inc. | 292,300 | 10,722 |
3
| Vanguard® Explorer Fund | |||
| Schedule of Investments | |||
| April 30, 2011 | |||
| Market | |||
| Value | |||
| Shares | ($000) | ||
| Platinum Underwriters Holdings Ltd. | 270,997 | 10,246 | |
| * | eHealth Inc. | 690,000 | 9,384 |
| Northwest Bancshares Inc. | 701,900 | 8,837 | |
| Valley National Bancorp | 574,200 | 8,223 | |
| * | IntercontinentalExchange Inc. | 50,794 | 6,113 |
| Marsh & McLennan Cos. Inc. | 194,043 | 5,876 | |
| Discover Financial Services | 234,264 | 5,819 | |
| Webster Financial Corp. | 266,554 | 5,736 | |
| Fifth Third Bancorp | 407,918 | 5,413 | |
| * | Nara Bancorp Inc. | 347,232 | 3,413 |
| QC Holdings Inc. | 670,000 | 3,290 | |
| First Midwest Bancorp Inc. | 204,577 | 2,680 | |
| * | Credit Acceptance Corp. | 30,503 | 2,468 |
| * | Ezcorp Inc. Class A | 75,229 | 2,369 |
| * | World Acceptance Corp. | 33,976 | 2,309 |
| Nelnet Inc. Class A | 91,976 | 2,118 | |
| * | Arch Capital Group Ltd. | 20,210 | 2,102 |
| Endurance Specialty Holdings Ltd. | 42,233 | 1,873 | |
| Rayonier Inc. | 27,518 | 1,826 | |
| Provident Financial Services Inc. | 121,042 | 1,757 | |
| Bank of the Ozarks Inc. | 38,425 | 1,711 | |
| * | Netspend Holdings Inc. | 144,000 | 1,672 |
| * | First Cash Financial Services Inc. | 37,261 | 1,462 |
| * | First Republic Bank | 45,593 | 1,429 |
| Potlatch Corp. | 33,337 | 1,290 | |
| Getty Realty Corp. | 44,841 | 1,139 | |
| Omega Healthcare Investors Inc. | 48,400 | 1,111 | |
| Universal Health Realty Income Trust | 13,000 | 560 | |
| Urstadt Biddle Properties Inc. Class A | 22,400 | 441 | |
| Digital Realty Trust Inc. | 2,565 | 155 | |
| 721,219 | |||
| Health Care (17.6%) | |||
| * | Regeneron Pharmaceuticals Inc. | 1,518,681 | 77,620 |
| * | Bruker Corp. | 3,912,685 | 77,236 |
| * | Coventry Health Care Inc. | 2,387,510 | 77,045 |
| Cooper Cos. Inc. | 1,010,238 | 75,667 | |
| * | Covance Inc. | 854,487 | 53,491 |
| * | Alkermes Inc. | 3,521,900 | 50,786 |
| * | Allscripts Healthcare Solutions Inc. | 2,279,495 | 49,100 |
| * | Health Management Associates Inc. Class A | 4,323,762 | 48,772 |
| * | Brookdale Senior Living Inc. Class A | 1,661,840 | 45,269 |
| * | Mettler-Toledo International Inc. | 230,375 | 43,172 |
| * | Bio-Rad Laboratories Inc. Class A | 321,310 | 40,202 |
| * | Seattle Genetics Inc. | 2,377,174 | 39,485 |
| PerkinElmer Inc. | 1,350,750 | 38,186 | |
| * | Elan Corp. plc ADR | 4,507,780 | 36,513 |
| * | Cubist Pharmaceuticals Inc. | 1,070,600 | 36,240 |
| * | ICON plc ADR | 1,446,695 | 35,531 |
| * | Henry Schein Inc. | 479,000 | 35,001 |
| * | ResMed Inc. | 1,087,250 | 34,672 |
| *,2 | ABIOMED Inc. | 1,990,200 | 34,590 |
| West Pharmaceutical Services Inc. | 673,650 | 31,823 | |
| * | Kindred Healthcare Inc. | 1,224,364 | 30,878 |
| * | Edwards Lifesciences Corp. | 350,200 | 30,240 |
| DENTSPLY International Inc. | 792,200 | 29,739 | |
| * | Incyte Corp. Ltd. | 1,609,020 | 29,735 |
| * | Healthspring Inc. | 707,500 | 29,354 |
| Pharmaceutical Product Development Inc. | 910,750 | 28,097 | |
| * | QIAGEN NV | 1,293,400 | 27,640 |
| * | IPC The Hospitalist Co. Inc. | 515,170 | 26,717 |
| * | Onyx Pharmaceuticals Inc. | 685,150 | 25,741 |
| * | Parexel International Corp. | 916,950 | 25,455 |
| * | BioMarin Pharmaceutical Inc. | 944,600 | 25,400 |
| * | Exelixis Inc. | 2,020,010 | 24,765 |
4
| Vanguard® Explorer Fund | |||
| Schedule of Investments | |||
| April 30, 2011 | |||
| Market | |||
| Value | |||
| Shares | ($000) | ||
| * | NxStage Medical Inc. | 1,003,804 | 24,734 |
| * | Nektar Therapeutics | 2,272,400 | 23,588 |
| * | Hospira Inc. | 404,645 | 22,955 |
| * | SXC Health Solutions Corp. | 415,559 | 22,922 |
| * | Jazz Pharmaceuticals Inc. | 678,700 | 21,657 |
| * | Cephalon Inc. | 278,000 | 21,350 |
| Quality Systems Inc. | 236,733 | 21,240 | |
| * | Salix Pharmaceuticals Ltd. | 534,239 | 20,990 |
| * | Alexion Pharmaceuticals Inc. | 215,071 | 20,838 |
| * | Volcano Corp. | 779,640 | 20,785 |
| *,^ | Cadence Pharmaceuticals Inc. | 2,197,319 | 18,633 |
| * | Momenta Pharmaceuticals Inc. | 957,900 | 18,076 |
| Warner Chilcott plc Class A | 777,600 | 17,924 | |
| Hikma Pharmaceuticals plc | 1,300,350 | 17,089 | |
| * | Targacept Inc. | 700,851 | 16,947 |
| * | MWI Veterinary Supply Inc. | 190,493 | 15,843 |
| * | Ardea Biosciences Inc. | 553,900 | 15,703 |
| * | Agilent Technologies Inc. | 294,964 | 14,722 |
| * | Amylin Pharmaceuticals Inc. | 1,092,650 | 14,532 |
| Patterson Cos. Inc. | 415,800 | 14,432 | |
| * | Sirona Dental Systems Inc. | 235,082 | 13,416 |
| * | Luminex Corp. | 665,100 | 12,896 |
| * | Align Technology Inc. | 508,200 | 12,268 |
| * | United Therapeutics Corp. | 171,170 | 11,462 |
| * | Isis Pharmaceuticals Inc. | 1,197,849 | 11,236 |
| * | Watson Pharmaceuticals Inc. | 177,100 | 10,984 |
| * | WuXi PharmaTech Cayman Inc. ADR | 608,250 | 10,705 |
| * | Par Pharmaceutical Cos. Inc. | 310,000 | 10,676 |
| * | Immunogen Inc. | 750,400 | 10,025 |
| * | Cerner Corp. | 81,061 | 9,742 |
| * | Medco Health Solutions Inc. | 159,842 | 9,483 |
| * | Catalyst Health Solutions Inc. | 153,692 | 9,154 |
| *,^ | Accretive Health Inc. | 279,567 | 7,895 |
| Invacare Corp. | 216,599 | 7,126 | |
| * | Questcor Pharmaceuticals Inc. | 338,579 | 6,941 |
| AmerisourceBergen Corp. Class A | 167,406 | 6,803 | |
| * | Cepheid Inc. | 208,289 | 6,730 |
| * | ExamWorks Group Inc. | 231,566 | 5,141 |
| * | NPS Pharmaceuticals Inc. | 480,529 | 4,983 |
| * | Skilled Healthcare Group Inc. | 387,473 | 4,696 |
| * | Medidata Solutions Inc. | 180,935 | 4,645 |
| * | Mylan Inc. | 166,363 | 4,146 |
| * | AMN Healthcare Services Inc. | 449,675 | 3,881 |
| Universal Health Services Inc. Class B | 50,261 | 2,753 | |
| Chemed Corp. | 38,106 | 2,653 | |
| * | Healthsouth Corp. | 100,182 | 2,568 |
| STERIS Corp. | 70,203 | 2,530 | |
| * | AMERIGROUP Corp. | 35,464 | 2,422 |
| * | Charles River Laboratories International Inc. | 57,400 | 2,422 |
| * | Sunrise Senior Living Inc. | 220,310 | 2,287 |
| Perrigo Co. | 24,542 | 2,218 | |
| * | Community Health Systems Inc. | 70,519 | 2,167 |
| * | Corvel Corp. | 41,339 | 2,141 |
| * | Medicines Co. | 129,454 | 2,032 |
| * | Neurocrine Biosciences Inc. | 217,222 | 1,670 |
| * | Impax Laboratories Inc. | 58,535 | 1,603 |
| * | Depomed Inc. | 168,682 | 1,489 |
| * | Emergent Biosolutions Inc. | 45,011 | 1,045 |
| PDL BioPharma Inc. | 159,205 | 1,022 | |
| * | Array Biopharma Inc. | 266,145 | 822 |
| Lincare Holdings Inc. | 23,210 | 729 | |
| * | Kinetic Concepts Inc. | 11,800 | 697 |
| * | Caliper Life Sciences Inc. | 94,467 | 632 |
| * | IDEXX Laboratories Inc. | 7,757 | 632 |
5
| Vanguard® Explorer Fund | |||
| Schedule of Investments | |||
| April 30, 2011 | |||
| Market | |||
| Value | |||
| Shares | ($000) | ||
| * | Arqule Inc. | 85,101 | 601 |
| * | Genomic Health Inc. | 12,692 | 346 |
| * | Nabi Biopharmaceuticals | 31,169 | 180 |
| 1,911,817 | |||
| Industrials (16.0%) | |||
| Kennametal Inc. | 1,363,227 | 57,555 | |
| * | Genesee & Wyoming Inc. Class A | 922,060 | 57,149 |
| * | Beacon Roofing Supply Inc. | 2,284,136 | 50,982 |
| * | Navistar International Corp. | 725,910 | 50,465 |
| Con-way Inc. | 1,160,130 | 45,152 | |
| MSC Industrial Direct Co. Class A | 606,005 | 43,384 | |
| * | EnerSys | 1,132,140 | 42,897 |
| Belden Inc. | 1,123,800 | 42,738 | |
| Flowserve Corp. | 324,320 | 41,065 | |
| Chicago Bridge & Iron Co. NV | 1,007,261 | 40,834 | |
| * | IHS Inc. Class A | 450,607 | 39,762 |
| * | BE Aerospace Inc. | 1,018,842 | 39,317 |
| Lennox International Inc. | 779,630 | 37,898 | |
| * | Middleby Corp. | 394,485 | 35,373 |
| Pentair Inc. | 870,680 | 34,967 | |
| * | Meritor Inc. | 1,995,120 | 34,336 |
| * | Swift Transportation Co. | 2,443,440 | 34,281 |
| * | Teledyne Technologies Inc. | 654,510 | 33,046 |
| * | Kansas City Southern | 543,980 | 31,611 |
| * | AerCap Holdings NV | 2,173,359 | 31,123 |
| AMETEK Inc. | 659,785 | 30,377 | |
| Trinity Industries Inc. | 817,640 | 29,599 | |
| Armstrong World Industries Inc. | 649,430 | 29,062 | |
| Knight Transportation Inc. | 1,532,025 | 27,592 | |
| United Stationers Inc. | 381,400 | 27,484 | |
| UTi Worldwide Inc. | 1,152,235 | 25,822 | |
| * | RBC Bearings Inc. | 646,194 | 25,370 |
| * | II-VI Inc. | 428,600 | 24,795 |
| * | JetBlue Airways Corp. | 4,320,050 | 24,451 |
| * | Stericycle Inc. | 263,035 | 24,010 |
| IESI-BFC Ltd. | 904,200 | 22,912 | |
| * | General Cable Corp. | 457,440 | 22,186 |
| *,^ | A123 Systems Inc. | 3,507,300 | 21,184 |
| Triumph Group Inc. | 244,800 | 21,082 | |
| Titan International Inc. | 680,700 | 21,027 | |
| Gardner Denver Inc. | 238,390 | 20,599 | |
| * | Huron Consulting Group Inc. | 696,500 | 20,059 |
| * | Corrections Corp. of America | 799,244 | 19,893 |
| * | United Rentals Inc. | 650,382 | 19,134 |
| * | AGCO Corp. | 331,250 | 19,073 |
| * | DigitalGlobe Inc. | 650,340 | 18,860 |
| Landstar System Inc. | 396,530 | 18,796 | |
| * | GeoEye Inc. | 486,420 | 18,041 |
| Interface Inc. Class A | 966,900 | 18,023 | |
| Watsco Inc. | 243,060 | 17,231 | |
| Applied Industrial Technologies Inc. | 471,547 | 16,627 | |
| ABM Industries Inc. | 619,600 | 15,069 | |
| * | TrueBlue Inc. | 1,024,810 | 14,429 |
| * | SFN Group Inc. | 1,366,879 | 14,393 |
| * | Kforce Inc. | 896,671 | 14,033 |
| Woodward Inc. | 378,300 | 14,016 | |
| * | Rush Enterprises Inc. Class A | 628,326 | 13,239 |
| Robert Half International Inc. | 418,828 | 12,703 | |
| * | CAI International Inc. | 478,500 | 12,039 |
| * | TransDigm Group Inc. | 140,225 | 11,681 |
| Donaldson Co. Inc. | 183,380 | 11,228 | |
| * | Chart Industries Inc. | 216,705 | 10,534 |
| * | Advisory Board Co. | 219,308 | 10,246 |
| Robbins & Myers Inc. | 230,093 | 10,002 | |
6
| Vanguard® Explorer Fund | |||
| Schedule of Investments | |||
| April 30, 2011 | |||
| Market | |||
| Value | |||
| Shares | ($000) | ||
| Goodrich Corp. | 111,428 | 9,847 | |
| * | Atlas Air Worldwide Holdings Inc. | 140,282 | 9,667 |
| * | Altra Holdings Inc. | 347,459 | 8,822 |
| * | Polypore International Inc. | 138,500 | 8,555 |
| * | RailAmerica Inc. | 499,275 | 8,498 |
| * | Korn/Ferry International | 375,400 | 7,775 |
| * | Babcock & Wilcox Co. | 243,073 | 7,635 |
| * | HUB Group Inc. Class A | 181,887 | 7,326 |
| * | Flow International Corp. | 1,680,618 | 7,243 |
| JB Hunt Transport Services Inc. | 149,694 | 7,137 | |
| * | Exponent Inc. | 146,582 | 6,290 |
| * | H&E Equipment Services Inc. | 254,600 | 5,067 |
| * | Clean Harbors Inc. | 50,472 | 4,971 |
| * | Greenbrier Cos. Inc. | 168,600 | 4,564 |
| Heartland Express Inc. | 222,760 | 3,843 | |
| * | United Continental Holdings Inc. | 167,643 | 3,826 |
| * | WABCO Holdings Inc. | 50,894 | 3,759 |
| Timken Co. | 60,973 | 3,438 | |
| * | Orbital Sciences Corp. | 163,567 | 3,080 |
| Waste Connections Inc. | 99,408 | 3,059 | |
| Toro Co. | 41,235 | 2,800 | |
| HEICO Corp. | 55,198 | 2,658 | |
| HEICO Corp. Class A | 73,063 | 2,598 | |
| Actuant Corp. Class A | 90,093 | 2,501 | |
| * | Sauer-Danfoss Inc. | 41,808 | 2,467 |
| Deluxe Corp. | 89,409 | 2,421 | |
| * | Trimas Corp. | 99,777 | 2,316 |
| * | Alaska Air Group Inc. | 35,062 | 2,310 |
| KBR Inc. | 59,509 | 2,283 | |
| TAL International Group Inc. | 61,588 | 2,220 | |
| * | Consolidated Graphics Inc. | 39,249 | 2,204 |
| Textainer Group Holdings Ltd. | 61,574 | 2,183 | |
| Healthcare Services Group Inc. | 121,715 | 2,162 | |
| Cubic Corp. | 38,422 | 2,078 | |
| Steelcase Inc. Class A | 167,879 | 1,939 | |
| Great Lakes Dredge & Dock Corp. | 259,928 | 1,936 | |
| Ryder System Inc. | 33,492 | 1,792 | |
| Watts Water Technologies Inc. Class A | 44,688 | 1,729 | |
| * | DXP Enterprises Inc. | 64,182 | 1,685 |
| * | Innerworkings Inc. | 152,644 | 1,369 |
| * | Hertz Global Holdings Inc. | 75,000 | 1,291 |
| Nordson Corp. | 21,182 | 1,207 | |
| Copa Holdings SA Class A | 13,000 | 756 | |
| * | Trex Co. Inc. | 14,990 | 481 |
| Werner Enterprises Inc. | 16,252 | 425 | |
| * | WESCO International Inc. | 4,861 | 301 |
| 1,743,350 | |||
| Information Technology (26.8%) | |||
| * | Alliance Data Systems Corp. | 1,002,805 | 95,266 |
| * | VeriFone Systems Inc. | 1,691,320 | 92,718 |
| * | Microsemi Corp. | 3,562,045 | 84,064 |
| * | Ariba Inc. | 2,192,032 | 76,217 |
| * | Polycom Inc. | 1,221,770 | 73,098 |
| * | Netlogic Microsystems Inc. | 1,409,679 | 60,799 |
| *,2 | TiVo Inc. | 6,346,860 | 60,739 |
| * | Teradyne Inc. | 3,723,014 | 59,941 |
| * | Sapient Corp. | 4,482,100 | 56,586 |
| * | Cadence Design Systems Inc. | 5,405,950 | 56,114 |
| MKS Instruments Inc. | 1,965,050 | 55,768 | |
| * | ON Semiconductor Corp. | 5,222,299 | 54,886 |
| * | MICROS Systems Inc. | 1,025,101 | 53,326 |
| * | SunPower Corp. Class B | 2,293,996 | 49,023 |
| * | Trimble Navigation Ltd. | 1,021,180 | 47,832 |
| * | Atmel Corp. | 3,106,251 | 47,526 |
7
| Vanguard® Explorer Fund | |||
| Schedule of Investments | |||
| April 30, 2011 | |||
| Market | |||
| Value | |||
| Shares | ($000) | ||
| * | Parametric Technology Corp. | 1,946,215 | 47,235 |
| Avago Technologies Ltd. | 1,381,585 | 46,228 | |
| * | IAC/InterActiveCorp | 1,253,326 | 45,258 |
| * | Rovi Corp. | 858,661 | 41,697 |
| * | WebMD Health Corp. | 638,141 | 36,929 |
| Jabil Circuit Inc. | 1,831,920 | 36,345 | |
| * | Celestica Inc. | 3,263,852 | 36,098 |
| * | Convergys Corp. | 2,465,430 | 35,749 |
| Maxim Integrated Products Inc. | 1,297,120 | 35,463 | |
| Power Integrations Inc. | 876,265 | 35,349 | |
| Littelfuse Inc. | 559,250 | 34,791 | |
| Factset Research Systems Inc. | 314,744 | 34,436 | |
| * | Informatica Corp. | 614,628 | 34,425 |
| * | FEI Co. | 1,056,430 | 34,292 |
| * | LSI Corp. | 4,562,030 | 33,440 |
| * | Ingram Micro Inc. | 1,719,753 | 32,211 |
| * | NICE Systems Ltd. ADR | 834,013 | 31,801 |
| * | ValueClick Inc. | 1,891,130 | 31,676 |
| * | j2 Global Communications Inc. | 1,071,950 | 31,580 |
| * | SuccessFactors Inc. | 910,248 | 31,558 |
| * | Concur Technologies Inc. | 533,513 | 30,874 |
| * | CommVault Systems Inc. | 781,970 | 30,802 |
| * | F5 Networks Inc. | 302,495 | 30,661 |
| * | Quest Software Inc. | 1,180,700 | 30,415 |
| * | QLogic Corp. | 1,606,880 | 28,892 |
| Syntel Inc. | 527,356 | 28,836 | |
| *,^ | STEC Inc. | 1,295,280 | 27,097 |
| * | Progress Software Corp. | 913,849 | 27,096 |
| ADTRAN Inc. | 652,935 | 26,947 | |
| * | Digital River Inc. | 826,635 | 26,899 |
| * | Cree Inc. | 642,600 | 26,180 |
| * | Nuance Communications Inc. | 1,163,280 | 24,080 |
| * | Genpact Ltd. | 1,486,045 | 23,910 |
| * | Euronet Worldwide Inc. | 1,268,330 | 23,781 |
| * | Verigy Ltd. | 1,642,720 | 23,754 |
| * | Cymer Inc. | 484,934 | 23,330 |
| * | VistaPrint NV | 419,550 | 22,824 |
| Comtech Telecommunications Corp. | 783,610 | 22,176 | |
| Black Box Corp. | 626,200 | 21,879 | |
| * | SolarWinds Inc. | 883,600 | 21,410 |
| * | Acxiom Corp. | 1,465,175 | 21,333 |
| * | RightNow Technologies Inc. | 582,700 | 21,082 |
| * | PMC - Sierra Inc. | 2,523,403 | 20,238 |
| * | Finisar Corp. | 703,692 | 19,767 |
| * | Salesforce.com Inc. | 140,355 | 19,453 |
| * | Varian Semiconductor Equipment Associates Inc. | 447,480 | 18,763 |
| * | CACI International Inc. Class A | 298,400 | 18,235 |
| * | Fortinet Inc. | 373,780 | 18,203 |
| * | Gartner Inc. | 417,367 | 17,909 |
| * | RF Micro Devices Inc. | 2,662,840 | 17,734 |
| * | Cypress Semiconductor Corp. | 810,967 | 17,647 |
| * | S1 Corp. | 2,553,100 | 17,540 |
| * | RADWARE Ltd. | 478,450 | 16,856 |
| National Instruments Corp. | 547,838 | 16,621 | |
| *,^ | Hollysys Automation Technologies Ltd. | 1,376,760 | 16,535 |
| * | Constant Contact Inc. | 595,200 | 16,493 |
| * | Ciena Corp. | 580,550 | 16,395 |
| * | Red Hat Inc. | 345,300 | 16,391 |
| * | Acme Packet Inc. | 185,335 | 15,311 |
| * | Sourcefire Inc. | 565,726 | 15,060 |
| * | QLIK Technologies Inc. | 452,089 | 14,494 |
| * | Hittite Microwave Corp. | 210,250 | 13,538 |
| * | Silicon Laboratories Inc. | 306,020 | 13,336 |
| FLIR Systems Inc. | 371,140 | 13,072 | |
8
| Vanguard® Explorer Fund | |||
| Schedule of Investments | |||
| April 30, 2011 | |||
| Market | |||
| Value | |||
| Shares | ($000) | ||
| * | Entropic Communications Inc. | 1,377,000 | 12,063 |
| * | Cardtronics Inc. | 528,955 | 11,240 |
| * | Diodes Inc. | 317,775 | 10,874 |
| * | SAVVIS Inc. | 265,394 | 10,446 |
| *,^ | Ancestry.com Inc. | 223,914 | 10,233 |
| * | FleetCor Technologies Inc. | 255,911 | 9,599 |
| * | LogMeIn Inc. | 215,508 | 9,282 |
| Pegasystems Inc. | 236,650 | 8,787 | |
| * | comScore Inc. | 252,007 | 7,512 |
| Anixter International Inc. | 99,611 | 7,485 | |
| * | Oclaro Inc. | 655,578 | 7,352 |
| * | Aviat Networks Inc. | 1,403,735 | 7,187 |
| * | Synchronoss Technologies Inc. | 209,977 | 6,774 |
| * | DealerTrack Holdings Inc. | 300,000 | 6,738 |
| * | Skyworks Solutions Inc. | 198,632 | 6,249 |
| * | Taleo Corp. Class A | 166,675 | 6,045 |
| * | Advent Software Inc. | 194,112 | 5,286 |
| * | DemandTec Inc. | 451,532 | 4,998 |
| * | Cognizant Technology Solutions Corp. Class A | 59,082 | 4,898 |
| * | Aruba Networks Inc. | 109,198 | 3,923 |
| * | Omnivision Technologies Inc. | 113,382 | 3,810 |
| * | TIBCO Software Inc. | 124,587 | 3,736 |
| Global Payments Inc. | 63,700 | 3,391 | |
| * | Atheros Communications Inc. | 72,000 | 3,230 |
| * | NCR Corp. | 160,934 | 3,188 |
| * | JDS Uniphase Corp. | 149,495 | 3,115 |
| * | Monolithic Power Systems Inc. | 160,000 | 2,717 |
| * | Novellus Systems Inc. | 83,654 | 2,685 |
| MAXIMUS Inc. | 33,212 | 2,657 | |
| * | Itron Inc. | 47,674 | 2,595 |
| * | Blue Coat Systems Inc. | 90,000 | 2,592 |
| DST Systems Inc. | 50,796 | 2,505 | |
| Intersil Corp. Class A | 165,495 | 2,444 | |
| * | Lattice Semiconductor Corp. | 357,040 | 2,424 |
| * | Manhattan Associates Inc. | 67,038 | 2,423 |
| Opnet Technologies Inc. | 61,366 | 2,403 | |
| * | Booz Allen Hamilton Holding Corp. | 119,941 | 2,320 |
| * | Netscout Systems Inc. | 88,294 | 2,259 |
| * | Advanced Micro Devices Inc. | 240,612 | 2,190 |
| * | Take-Two Interactive Software Inc. | 134,955 | 2,184 |
| * | Nova Measuring Instruments Ltd. | 220,000 | 2,169 |
| * | Riverbed Technology Inc. | 60,000 | 2,108 |
| * | Silicon Image Inc. | 244,313 | 2,033 |
| * | Coherent Inc. | 32,160 | 2,010 |
| * | Mentor Graphics Corp. | 125,360 | 1,849 |
| * | PROS Holdings Inc. | 110,000 | 1,725 |
| Daktronics Inc. | 156,200 | 1,676 | |
| * | Brightpoint Inc. | 149,355 | 1,511 |
| *,^ | Power-One Inc. | 171,730 | 1,418 |
| * | Websense Inc. | 51,251 | 1,322 |
| Solera Holdings Inc. | 20,513 | 1,128 | |
| * | Zebra Technologies Corp. | 18,500 | 727 |
| * | Silicon Graphics International Corp. | 35,100 | 645 |
| * | Interactive Intelligence Inc. | 15,892 | 595 |
| * | Magma Design Automation Inc. | 79,969 | 509 |
| * | Anadigics Inc. | 102,021 | 399 |
| * | Cirrus Logic Inc. | 14,743 | 244 |
| * | Ultimate Software Group Inc. | 3,694 | 207 |
| 2,918,427 | |||
| Materials (3.9%) | |||
| ^ | Silgan Holdings Inc. | 1,065,920 | 48,883 |
| Albemarle Corp. | 563,035 | 39,722 | |
| Sensient Technologies Corp. | 803,945 | 30,461 | |
| * | Ferro Corp. | 2,003,696 | 30,055 |
9
| Vanguard® Explorer Fund | |||||
| Schedule of Investments | |||||
| April 30, 2011 | |||||
| Market | |||||
| Value | |||||
| Shares | ($000) | ||||
| Olin Corp. | 1,161,660 | 29,901 | |||
| * | Graphic Packaging Holding Co. | 5,282,700 | 29,002 | ||
| Steel Dynamics Inc. | 1,536,100 | 27,942 | |||
| Schnitzer Steel Industries Inc. | 421,850 | 26,184 | |||
| Eagle Materials Inc. | 771,600 | 22,446 | |||
| CF Industries Holdings Inc. | 144,500 | 20,454 | |||
| * | Rockwood Holdings Inc. | 313,228 | 17,773 | ||
| Airgas Inc. | 219,130 | 15,219 | |||
| Arch Chemicals Inc. | 339,199 | 13,117 | |||
| Aptargroup Inc. | 220,670 | 11,574 | |||
| Balchem Corp. | 291,500 | 11,570 | |||
| * | Solutia Inc. | 394,132 | 10,385 | ||
| * | OM Group Inc. | 223,248 | 8,091 | ||
| *,^ | STR Holdings Inc. | 444,550 | 7,322 | ||
| Walter Energy Inc. | 38,256 | 5,288 | |||
| * | Crown Holdings Inc. | 94,775 | 3,545 | ||
| NewMarket Corp. | 14,873 | 2,741 | |||
| Ball Corp. | 70,590 | 2,634 | |||
| Rock-Tenn Co. Class A | 36,199 | 2,500 | |||
| Eastman Chemical Co. | 21,762 | 2,334 | |||
| * | Pilot Gold Inc. | 592,361 | 2,061 | ||
| * | Clearwater Paper Corp. | 11,206 | 879 | ||
| * | Kraton Performance Polymers Inc. | 17,500 | 808 | ||
| Ashland Inc. | 10,422 | 647 | |||
| 423,538 | |||||
| Telecommunication Services (1.3%) | |||||
| *,2 | Vonage Holdings Corp. | 11,151,189 | 57,540 | ||
| * | tw telecom inc Class A | 2,027,080 | 43,663 | ||
| * | SBA Communications Corp. Class A | 471,346 | 18,208 | ||
| * | Clearwire Corp. Class A | 2,737,810 | 13,306 | ||
| * | MetroPCS Communications Inc. | 172,059 | 2,896 | ||
| USA Mobility Inc. | 109,488 | 1,692 | |||
| 137,305 | |||||
| Utilities (0.7%) | |||||
| IDACORP Inc. | 787,800 | 30,890 | |||
| ITC Holdings Corp. | 433,030 | 30,715 | |||
| Ormat Technologies Inc. | 422,180 | 10,512 | |||
| Integrys Energy Group Inc. | 26,133 | 1,368 | |||
| 73,485 | |||||
| Total Common Stocks (Cost $7,651,689) | 10,480,734 | ||||
| Coupon | |||||
| Temporary Cash Investments (4.4%)1 | |||||
| Money Market Fund (4.1%) | |||||
| 4,5 | Vanguard Market Liquidity Fund | 0.179% | 448,808,769 | 448,809 | |
| Face | |||||
| Maturity | Amount | ||||
| Date | ($000) | ||||
| Repurchase Agreement (0.2%) | |||||
| Deutsche Bank Securities, Inc. (Dated 4/29/11, | |||||
| Repurchase Value $19,300,000, collateralized by | |||||
| Government National Mortgage Assn., 4.000%- | |||||
| 4.500%, 10/15/40-10/20/40) | 0.040% | 5/2/11 | 19,300 | 19,300 | |
| U.S. Government and Agency Obligations (0.1%) | |||||
| 6,7 | Federal Home Loan Bank Discount Notes | 0.110% | 7/15/11 | 5,000 | 4,999 |
| 6,7 | Freddie Mac Discount Notes | 0.090% | 7/5/11 | 1,300 | 1,299 |
| 6,7 | Freddie Mac Discount Notes | 0.140% | 7/6/11 | 4,150 | 4,149 |
10
| Vanguard® Explorer Fund | ||||
| Schedule of Investments | ||||
| April 30, 2011 | ||||
| Face | Market | |||
| Maturity | Amount | Value | ||
| Coupon | Date | ($000) | ($000) | |
| 6,7 Freddie Mac Discount Notes | 0.130% | 7/18/11 | 1,000 | 1,000 |
| 11,447 | ||||
| Total Temporary Cash Investments (Cost $479,556) | 479,556 | |||
| Total Investments (100.7%) (Cost $8,131,245) | 10,960,290 | |||
| Other Assets and Liabilities—Net (-0.7%)5 | (79,747) | |||
| Net Assets (100%) | 10,880,543 | |||
* Non-income-producing security.
^ Part of security position is on loan to broker-dealers. The total value of securities on loan is $55,822,000.
1 The fund invests a portion of its cash reserves in equity markets through the use of index futures contracts. After giving effect to futures
investments, the fund's effective common stock and temporary cash investment positions represent 98.2% and 2.5%, respectively, of net assets.
2 Considered an affiliated company of the fund as the fund owns more than 5% of the outstanding voting securities of such company.
3 Considered an affiliated company of the fund as the issuer is another member of The Vanguard Group.
4 Affiliated money market fund available only to Vanguard funds and certain trusts and accounts managed by Vanguard. Rate shown is the 7-day yield.
5 Includes $56,995,000 of collateral received for securities on loan.
6 The issuer operates under a congressional charter; its securities are not backed by the full faith and credit of the U.S. government.
7 Securities with a value of $7,698,000 have been segregated as initial margin for open futures contracts.
ADR—American Depositary Receipt.
REIT—Real Estate Investment Trust.
11
© 2011 The Vanguard Group. Inc.
All rights reserved.
Vanguard Marketing Corporation, Distributor.
SNA 242_062011
Item 2: Code of Ethics.
Not Applicable.
Item 3: Audit Committee Financial Expert.
Not Applicable.
Item 4: Principal Accountant Fees and Services.
Not Applicable.
Item 5: Audit Committee of Listed Registrants.
Not Applicable.
Item 6: Investments.
Not Applicable.
Item 7: Disclosure of Proxy Voting Policies and Procedures for Closed-End Management Investment Companies.
Not Applicable.
Item 8: Portfolio Managers of Closed-End Management Investment Companies.
Not Applicable.
Item 9: Purchase of Equity Securities by Closed-End Management Investment Company and Affiliated Purchasers.
Not Applicable.
Item 10: Submission of Matters to a Vote of Security Holders.
Not Applicable.
Item 11: Controls and Procedures.
(a) Disclosure Controls and Procedures. The Principal Executive and Financial Officers concluded that the Registrant's Disclosure Controls and Procedures are effective based on their evaluation of the Disclosure Controls and Procedures as of a date within 90 days of the filing date of this report.
(b) Internal Control Over Financial Reporting. There were no significant changes in Registrant’s Internal Control Over Financial Reporting or in other factors that could significantly affect this control subsequent to the date of the evaluation, including any corrective actions with regard to significant deficiencies and material weaknesses.
Item 12: Exhibits.
(a) Certifications.
Pursuant to the requirements of the Securities Exchange Act of 1934 and the Investment Company Act of 1940, the registrant has duly caused this report to be signed on its behalf by the undersigned, thereunto duly authorized.
| VANGUARD EXPLORER FUND | |
| By: | /s/ F. WILLIAM MCNABB III* |
| F. WILLIAM MCNABB III | |
| CHIEF EXECUTIVE OFFICER | |
| Date: June 16, 2011 | |
Pursuant to the requirements of the Securities Exchange Act of 1934 and the Investment Company Act of 1940, this report has been signed below by the following persons on behalf of the registrant and in the capacities and on the dates indicated.
| VANGUARD EXPLORER FUND | |
| By: | /s/ F. WILLIAM MCNABB III* |
| F. WILLIAM MCNABB III | |
| CHIEF EXECUTIVE OFFICER | |
| Date: June 16, 2011 | |
| VANGUARD EXPLORER FUND | |
| By: | /s/ THOMAS J. HIGGINS* |
| THOMAS J. HIGGINS | |
| CHIEF FINANCIAL OFFICER | |
| Date: June 16, 2011 | |
* By: /s/ Heidi Stam
Heidi Stam, pursuant to a Power of Attorney filed on April 26, 2010, see file Number 33-53683,
Incorporated by Reference.