UNITED STATES
SECURITIES AND EXCHANGE COMMISSION
WASHINGTON, D.C. 20549
FORM
(Mark one)
QUARTERLY REPORT PURSUANT TO SECTION 13 OR 15(d) OF THE SECURITIES EXCHANGE ACT OF 1934 |
For the quarterly period ended
OR
TRANSITION REPORT PURSUANT TO SECTION 13 OR 15(d) OF THE SECURITIES EXCHANGE ACT OF 1934 |
For the transition period from _________to _________
Commission File Number
(Exact name of registrant as specified in its charter) |
| ||
(State or other jurisdiction of incorporation or organization) |
| (I.R.S. Employer Identification Number) |
(Address of principal executive offices)
(
(Registrant’s telephone number, including area code)
Securities registered pursuant to Section 12(b) of the Act:
Title of each class | Trading Symbol(s) | Name of each exchange on which registered |
Indicate by check mark whether the registrant (1) has filed all reports required to be filed by Section 13 or 15(d) of the Securities Exchange Act of 1934 during the preceding 12 months (or for such shorter period that the registrant was required to file such reports), and (2) has been subject to such filing requirements for the past 90 days.
Indicate by check mark whether the registrant has submitted electronically every Interactive Data File required to be submitted pursuant to Rule 405 of Regulation S-T (§ 232.405 of this chapter) during the preceding 12 months (or for such shorter period that the registrant was required to submit such files).
Indicate by check mark whether the registrant is a large accelerated filer, an accelerated filer, a non-accelerated filer, a smaller reporting company, or an emerging growth company. See the definitions of “large accelerated filer”, “accelerated filer”, “smaller reporting company”, and “emerging growth company” in Rule 12b-2 of the Exchange Act. (Check one):
Large accelerated filer | ☐ | Accelerated filer | ☐ |
☒ | Smaller reporting company | ||
|
| Emerging growth company |
If an emerging growth company, indicate by check mark if the registrant has elected not to use the extended transition period for complying with any new or revised financial accounting standards provided pursuant to Section 13(a) of the Exchange Act. ☐
Indicate by check mark whether the registrant is a shell company (as defined in Rule 12b-2 of the Exchange Act). Yes
As of August 14, 2023, there were
KINGSTONE COMPANIES, INC.
INDEX
| 2 |
| Table of Contents |
Forward-Looking Statements
This Quarterly Report contains forward‑looking statements within the meaning of the Private Securities Litigation Reform Act of 1995. The events described in forward‑looking statements contained in this Quarterly Report may not occur. Generally, these statements relate to business plans or strategies, projected or anticipated results or other consequences of our plans or strategies, projected or anticipated results from acquisitions to be made by us, or projections involving anticipated revenues, earnings, costs or other aspects of our operating results. The words “may,” “will,” “expect,” “believe,” “anticipate,” “project,” “plan,” “intend,” “estimate,” and “continue,” and their opposites and similar expressions are intended to identify forward‑looking statements. We caution you that these statements are not guarantees of future performance or events and are subject to a number of uncertainties, risks and other influences, many of which are beyond our control, which may influence the accuracy of the statements and the projections upon which the statements are based. Factors which may cause actual results and outcomes to differ materially from those contained in the forward-looking statements include, but are not limited to the risks and uncertainties discussed in Part I, Item 1A (“Risk Factors”) of our Annual Report on Form 10-K for the year ended December 31, 2022, Part I, Item 2 of this Quarterly Report and Part II, Item 1A of this Quarterly Report.
Any one or more of these uncertainties, risks and other influences could materially affect our results of operations and whether forward‑looking statements made by us ultimately prove to be accurate. Our actual results, performance and achievements could differ materially from those expressed or implied in these forward‑looking statements. We undertake no obligation to publicly update or revise any forward‑looking statements, whether from new information, future events or otherwise except as required by law.
| 3 |
| Table of Contents |
PART I. FINANCIAL INFORMATION
Item 1. Financial Statements.
KINGSTONE COMPANIES, INC. AND SUBSIDIARIES | ||||||||
Condensed Consolidated Balance Sheets |
|
|
|
|
|
| ||
|
| June 30, |
|
| December 31, |
| ||
|
| 2023 |
|
| 2022 |
| ||
|
| (unaudited) |
|
|
|
| ||
Assets |
|
|
|
|
|
| ||
Fixed-maturity securities, held-to-maturity, at amortized cost (fair value of $ |
| $ |
|
| $ |
| ||
Fixed-maturity securities, available-for-sale, at fair value (amortized cost of$ |
|
|
|
|
|
| ||
Equity securities, at fair value (cost of $ |
|
|
|
|
|
| ||
Other investments |
|
|
|
|
|
| ||
Total investments |
|
|
|
|
|
| ||
Cash and cash equivalents |
|
|
|
|
|
| ||
Premiums receivable, net |
|
|
|
|
|
| ||
Reinsurance receivables, net |
|
|
|
|
|
| ||
Deferred policy acquisition costs |
|
|
|
|
|
| ||
Intangible assets |
|
|
|
|
|
| ||
Property and equipment, net |
|
|
|
|
|
| ||
Deferred income taxes, net |
|
|
|
|
|
| ||
Other assets |
|
|
|
|
|
| ||
Total assets |
| $ |
|
| $ |
| ||
|
|
|
|
|
|
|
|
|
Liabilities |
|
|
|
|
|
|
|
|
Loss and loss adjustment expense reserves |
| $ |
|
| $ |
| ||
Unearned premiums |
|
|
|
|
|
| ||
Advance premiums |
|
|
|
|
|
| ||
Reinsurance balances payable |
|
|
|
|
|
| ||
Deferred ceding commission revenue |
|
|
|
|
|
| ||
Accounts payable, accrued expenses and other liabilities |
|
|
|
|
|
| ||
Debt, net |
|
|
|
|
|
| ||
Total liabilities |
|
|
|
|
|
| ||
|
|
|
|
|
|
|
|
|
Commitments and Contingencies (Note 11) |
|
|
|
|
|
|
|
|
|
|
|
|
|
|
|
|
|
Stockholders' Equity |
|
|
|
|
|
|
|
|
Preferred stock, $ |
|
|
|
|
|
| ||
Common stock, $ |
|
|
|
|
|
| ||
Capital in excess of par |
|
|
|
|
|
| ||
Accumulated other comprehensive loss |
|
| ( | ) |
|
| ( | ) |
Accumulated deficit |
|
| ( | ) |
|
| ( | ) |
|
|
|
|
|
|
| ||
Treasury stock, at cost, |
|
| ( | ) |
|
| ( | ) |
Total stockholders' equity |
|
|
|
|
|
| ||
|
|
|
|
|
|
|
|
|
Total liabilities and stockholders' equity |
| $ |
|
| $ |
| ||
See accompanying notes to condensed consolidated financial statements.
| 4 |
| Table of Contents |
KINGSTONE COMPANIES, INC. AND SUBSIDIARIES | |||||||||||||||||||||
| |||||||||||||||||||||
Condensed Consolidated Statements of Operations and Comprehensive Income (Loss) (Unaudited) |
|
|
|
| |||||||||||||||||
|
| For the Three Months Ended |
|
| For the Six Months Ended |
| |||||||||||||||
|
| June 30, |
|
| June 30, |
| |||||||||||||||
|
| 2023 |
|
| 2022 |
|
| 2023 |
|
| 2022 |
| |||||||||
Revenues |
|
|
|
|
|
|
|
|
|
|
|
| |||||||||
Net premiums earned |
| $ |
|
| $ |
|
| $ |
|
| $ |
| |||||||||
Ceding commission revenue |
|
|
|
|
|
|
|
|
|
|
|
| |||||||||
Net investment income |
|
|
|
|
|
|
|
|
|
|
|
| |||||||||
Net gains (losses) on investments |
|
|
|
|
| ( | ) |
|
|
|
|
| ( | ) | |||||||
Other income |
|
|
|
|
|
|
|
|
|
|
|
| |||||||||
Total revenues |
|
|
|
|
|
|
|
|
|
|
|
| |||||||||
|
|
|
|
|
|
|
|
|
|
|
|
|
|
|
|
| |||||
Expenses |
|
|
|
|
|
|
|
|
|
|
|
|
|
|
|
| |||||
Loss and loss adjustment expenses |
|
|
|
|
|
|
|
|
|
|
|
| |||||||||
Commission expense |
|
|
|
|
|
|
|
|
|
|
|
| |||||||||
Other underwriting expenses |
|
|
|
|
|
|
|
|
|
|
|
| |||||||||
Other operating expenses |
|
|
|
|
|
|
|
|
|
|
|
| |||||||||
Depreciation and amortization |
|
|
|
|
|
|
|
|
|
|
|
| |||||||||
Interest expense |
|
|
|
|
|
|
|
|
|
|
|
| |||||||||
Total expenses |
|
|
|
|
|
|
|
|
|
|
|
| |||||||||
|
|
|
|
|
|
|
|
|
|
|
|
|
|
|
|
| |||||
Loss from operations before taxes |
|
| ( | ) |
|
| ( | ) |
|
| ( | ) |
|
| ( | ) | |||||
Income tax benefit |
|
| ( | ) |
|
| ( | ) |
|
| ( | ) |
|
| ( | ) | |||||
Net loss |
|
| ( | ) |
|
| ( | ) |
|
| ( | ) |
|
| ( | ) | |||||
|
|
|
|
|
|
|
|
|
|
|
|
|
|
|
|
| |||||
Other comprehensive (loss) income, net of tax |
|
|
|
|
|
|
|
|
|
|
|
|
|
|
|
| |||||
Gross change in unrealized (losses) gains on available-for-sale-securities |
|
| ( | ) |
|
| ( | ) |
|
|
|
|
| ( | ) | ||||||
|
|
|
|
|
|
|
|
|
|
|
|
|
|
|
|
| |||||
Reclassification adjustment for losses included in net loss |
|
|
|
|
|
|
|
|
|
|
|
| |||||||||
Net change in unrealized (losses) gains, on available-for-sale-securities |
|
| ( | ) |
|
| ( | ) |
|
|
|
|
| ( | ) | ||||||
Income tax benefit (expense) related to items of other comprehensive (loss) income |
|
|
|
|
|
|
|
| ( | ) |
|
|
| ||||||||
Other comprehensive (loss) income, net of tax |
|
| ( | ) |
|
| ( | ) |
|
|
|
|
| ( | ) | ||||||
|
|
|
|
|
|
|
|
|
|
|
|
|
|
|
|
| |||||
Comprehensive loss |
| $ | ( | ) |
| $ | ( | ) |
| $ | ( | ) |
| $ | ( | ) | |||||
|
|
|
|
|
|
|
|
|
|
|
|
|
|
|
|
| |||||
Loss per common share: |
|
|
|
|
|
|
|
|
|
|
|
|
|
|
|
| |||||
Basic |
| $ | ( | ) |
| $ | ( | ) |
| $ | ( | ) |
| $ | ( | ) | |||||
Diluted |
| $ | ( | ) |
| $ | ( | ) |
| $ | ( | ) |
| $ | ( | ) | |||||
|
|
|
|
|
|
|
|
|
|
|
|
|
|
|
|
| |||||
Weighted average common shares outstanding |
|
|
|
|
|
|
|
|
|
|
|
|
|
|
|
| |||||
Basic |
|
|
|
|
|
|
|
|
|
|
|
| |||||||||
Diluted |
|
|
|
|
|
|
|
|
|
|
|
| |||||||||
|
|
|
|
|
|
|
|
|
|
|
|
|
|
|
|
| |||||
Dividends declared and paid per common share |
| $ |
|
| $ |
|
| $ |
|
| $ |
| |||||||||
See accompanying notes to condensed consolidated financial statements.
| 5 |
| Table of Contents |
KINGSTONE COMPANIES, INC. AND SUBSIDIARIES | ||||||||||||||||||||||||||||||||||||||||
|
|
|
|
|
|
|
|
|
|
|
|
|
|
|
|
|
|
|
|
| ||||||||||||||||||||
Condensed Consolidated Statements of Stockholders' Equity (Unaudited) | ||||||||||||||||||||||||||||||||||||||||
Three months ended June 30, 2023 and 2022 | ||||||||||||||||||||||||||||||||||||||||
|
|
|
|
|
|
|
|
|
|
|
|
|
|
|
|
|
|
|
|
| ||||||||||||||||||||
|
|
|
|
|
|
|
|
|
|
|
| Accumulated |
|
|
|
|
|
|
|
|
| |||||||||||||||||||
|
|
|
|
|
|
|
|
|
| Capital |
|
| Other |
|
|
|
|
|
|
|
|
| ||||||||||||||||||
|
| Preferred Stock |
|
| Common Stock |
|
| in Excess |
|
| Comprehensive |
|
| Accumulated |
|
| Treasury Stock |
|
|
| ||||||||||||||||||||
|
| Shares |
|
| Amount |
|
| Shares |
|
| Amount |
|
| of Par |
|
| Loss |
|
| Deficit |
|
| Shares |
|
| Amount |
|
| Total |
| ||||||||||
Balance, April 1, 2022 |
|
| - |
|
| $ |
|
|
|
|
| $ |
|
| $ |
|
| $ | ( | ) |
| $ | ( | ) |
|
|
|
| $ | ( | ) |
| $ |
| ||||||
Stock-based compensation |
|
| - |
|
|
|
|
|
| - |
|
|
|
|
|
|
|
|
|
|
|
|
|
|
| - |
|
|
|
|
|
|
| |||||||
Vesting of restricted stock awards |
|
| - |
|
|
|
|
|
|
|
|
|
|
|
| ( | ) |
|
|
|
|
|
|
|
| - |
|
|
|
|
|
|
| |||||||
Shares deducted from restricted stock awards for payment of withholding taxes |
|
| - |
|
|
|
|
|
| ( | ) |
|
| ( | ) |
|
| ( | ) |
|
|
|
|
|
|
|
| - |
|
|
|
|
|
| ( | ) | ||||
Dividends |
|
| - |
|
|
|
|
|
| - |
|
|
|
|
|
|
|
|
|
|
|
| ( | ) |
|
| - |
|
|
|
|
|
| ( | ) | |||||
Net loss |
|
| - |
|
|
|
|
|
| - |
|
|
|
|
|
|
|
|
|
|
|
| ( | ) |
|
| - |
|
|
|
|
|
| ( | ) | |||||
Change in unrealized losses on available-for-sale securities, net of tax |
|
| - |
|
|
|
|
|
| - |
|
|
|
|
|
|
|
|
| ( | ) |
|
|
|
|
| - |
|
|
|
|
|
| ( | ) | |||||
Balance, June 30, 2022 |
|
| - |
|
| $ |
|
|
|
|
| $ |
|
| $ |
|
| $ | ( | ) |
| $ | ( | ) |
|
|
|
| $ | ( | ) |
| $ |
| ||||||
| ||||||||||||||||||||||||||||||||||||||||
|
|
|
|
|
|
|
|
|
|
|
|
|
|
|
|
|
|
|
|
|
| Accumulated |
|
|
|
|
|
|
|
|
|
|
|
|
|
|
|
|
| |
|
|
|
|
|
|
|
|
|
|
|
|
|
|
|
|
|
| Capital |
|
| Other |
|
|
|
|
|
|
|
|
|
|
|
|
|
|
|
|
| ||
|
| Preferred Stock |
|
| Common Stock |
|
| in Excess |
|
| Comprehensive |
|
| Accumulated |
|
| Treasury Stock |
| ||||||||||||||||||||||
|
| Shares |
|
| Amount |
|
| Shares |
|
| Amount |
|
| of Par |
|
| Loss |
|
| Deficit |
|
| Shares |
|
| Amount |
|
| Total |
| ||||||||||
Balance, April 1, 2023 |
|
| - |
|
| $ |
|
|
|
|
| $ |
|
| $ |
|
| $ | ( | ) |
| $ | ( | ) |
|
|
|
| $ | ( | ) |
| $ |
| ||||||
Stock-based compensation |
|
| - |
|
|
|
|
|
| - |
|
|
|
|
|
|
|
|
|
|
|
|
|
|
| - |
|
|
|
|
|
|
| |||||||
Vesting of restricted stock awards |
|
| - |
|
|
|
|
|
| ( | ) |
|
| ( | ) |
|
|
|
|
|
|
|
|
|
|
| - |
|
|
|
|
|
|
| ||||||
Shares deducted from restricted stock awards for payment of withholding taxes |
|
| - |
|
|
|
|
|
| ( | ) |
|
| ( | ) |
|
| ( | ) |
|
|
|
|
|
|
|
| - |
|
|
|
|
|
| ( | ) | ||||
Net loss |
|
| - |
|
|
|
|
|
| - |
|
|
|
|
|
|
|
|
|
|
|
| ( | ) |
|
| - |
|
|
|
|
|
| ( | ) | |||||
Change in unrealized gains on available-for-sale securities, net of tax |
|
| - |
|
|
|
|
|
| - |
|
|
| |
|
|
| |
|
|
| ( | ) |
|
| - |
|
|
|
|
|
|
|
|
| ( | ) | |||
Balance, June 30, 2023 |
|
| - |
|
| $ |
|
|
| 12,227,562 |
|
| $ |
|
| $ |
|
| $ | ( | ) |
| $ | ( | ) |
|
|
|
| $ | ( | ) |
| $ |
| |||||
See accompanying notes to condensed consolidated financial statements.
| 6 |
| Table of Contents |
KINGSTONE COMPANIES, INC. AND SUBSIDIARIES | ||||||||||||||||||||||||||||||||||||||||
|
|
|
|
|
|
|
|
|
|
|
|
|
|
|
|
|
|
|
|
| ||||||||||||||||||||
Condensed Consolidated Statements of Stockholders' Equity (Unaudited) | ||||||||||||||||||||||||||||||||||||||||
Six months ended June 30, 2023 and 2022 | ||||||||||||||||||||||||||||||||||||||||
|
|
|
|
|
|
|
|
|
|
|
|
|
|
|
|
|
|
|
|
| ||||||||||||||||||||
|
|
|
|
|
|
|
|
|
|
|
| Accumulated |
|
| Retained |
|
|
|
|
|
|
| ||||||||||||||||||
|
|
|
|
|
|
|
|
|
| Capital |
|
| Other |
|
| Earnings |
|
|
|
|
|
|
| |||||||||||||||||
|
| Preferred Stock |
|
| Common Stock |
|
| in Excess |
|
| Comprehensive |
|
| (Accumulated |
|
| Treasury Stock |
|
|
| ||||||||||||||||||||
|
| Shares |
|
| Amount |
|
| Shares |
|
| Amount |
|
| of Par |
|
| Income (Loss) |
|
| Deficit) |
|
| Shares |
|
| Amount |
|
| Total |
| ||||||||||
Balance, January 1, 2022 |
|
| - |
|
| $ |
|
|
|
|
| $ |
|
| $ |
|
| $ |
|
| $ |
|
|
|
|
| $ | ( | ) |
| $ |
| ||||||||
Stock-based compensation |
|
| - |
|
|
|
|
|
| - |
|
|
|
|
|
|
|
|
|
|
|
|
|
|
| - |
|
|
|
|
|
|
| |||||||
Vesting of restricted stock awards |
|
| - |
|
|
|
|
|
|
|
|
|
|
|
| ( | ) |
|
|
|
|
|
|
|
| - |
|
|
|
|
|
|
| |||||||
Shares deducted from restricted stock awards for payment of withholding taxes |
|
| - |
|
|
|
|
|
| ( | ) |
|
| ( | ) |
|
| ( | ) |
|
|
|
|
|
|
|
| - |
|
|
|
|
|
| ( | ) | ||||
Dividends |
|
| - |
|
|
|
|
|
| - |
|
|
|
|
|
|
|
|
|
|
|
| ( | ) |
|
| - |
|
|
|
|
|
| ( | ) | |||||
Net loss |
|
| - |
|
|
|
|
|
| - |
|
|
|
|
|
|
|
|
|
|
|
| ( | ) |
|
| - |
|
|
|
|
|
| ( | ) | |||||
Change in unrealized losses on available-for-sale securities, net of tax |
|
| - |
|
|
|
|
|
| - |
|
|
|
|
|
|
|
|
| ( | ) |
|
|
|
|
| - |
|
|
|
|
|
| ( | ) | |||||
Balance, June 30, 2022 |
|
| - |
|
| $ |
|
|
|
|
| $ |
|
| $ |
|
| $ | ( | ) |
| $ | ( | ) |
|
|
|
| $ | ( | ) |
| $ |
| ||||||
|
| |||||||||||||||||||||||||||||||||||||||
|
|
|
|
|
|
|
|
|
|
|
|
|
|
|
|
|
|
|
|
|
| Accumulated |
|
|
|
|
|
|
|
|
|
|
|
|
|
|
|
|
| |
|
|
|
|
|
|
|
|
|
|
|
|
|
|
|
|
|
| Capital |
|
| Other |
|
|
|
|
|
|
|
|
|
|
|
|
|
|
|
|
| ||
|
| Preferred Stock |
|
| Common Stock |
|
| in Excess |
|
| Comprehensive |
|
| Accumulated |
|
| Treasury Stock |
|
|
|
| |||||||||||||||||||
|
| Shares |
|
| Amount |
|
| Shares |
|
| Amount |
|
| of Par |
|
| Loss |
|
| Deficit |
|
| Shares |
|
| Amount |
|
| Total |
| ||||||||||
Balance, January 1, 2023 |
|
| - |
|
| $ |
|
|
|
|
| $ |
|
| $ |
|
| $ | ( | ) |
| $ | ( | ) |
|
|
|
| $ | ( | ) |
| $ |
| ||||||
Stock-based compensation |
|
| - |
|
|
|
|
|
| - |
|
|
|
|
|
|
|
|
|
|
|
|
|
|
| - |
|
|
|
|
|
|
| |||||||
Vesting of restricted stock awards |
|
| - |
|
|
|
|
|
|
|
|
|
|
|
| ( | ) |
|
|
|
|
|
|
|
| - |
|
|
|
|
|
|
| |||||||
Shares deducted from restricted stock awards for payment of withholding taxes |
|
| - |
|
|
|
|
|
| ( | ) |
|
| ( | ) |
|
| ( | ) |
|
|
|
|
|
|
|
| - |
|
|
|
|
|
| ( | ) | ||||
Net loss |
|
| - |
|
|
|
|
|
| - |
|
|
|
|
|
|
|
|
|
|
|
| ( | ) |
|
| - |
|
|
|
|
|
| ( | ) | |||||
Change in unrealized gains on available-for-sale securities, net of tax |
|
| - |
|
|
|
|
|
| - |
|
|
|
|
|
|
|
|
|
|
|
|
|
|
| - |
|
|
|
|
|
|
| |||||||
Balance, June 30, 2023 |
|
| - |
|
| $ |
|
|
|
|
| $ |
|
| $ |
|
| $ | ( | ) |
| $ | ( | ) |
|
|
|
| $ | ( | ) |
| $ |
| ||||||
See accompanying notes to condensed consolidated financial statements.
| 7 |
| Table of Contents |
KINGSTONE COMPANIES, INC. AND SUBSIDIARIES | ||||||||
|
|
|
|
| ||||
Condensed Consolidated Statements of Cash Flows (Unaudited) |
|
|
|
| ||||
Six Months ended June 30, |
| 2023 |
|
| 2022 |
| ||
|
|
|
|
|
|
| ||
Cash flows from operating activities: |
|
|
|
|
|
| ||
Net loss |
| $ | ( | ) |
| $ | ( | ) |
Adjustments to reconcile net loss to net cash flows used in operating activities: |
|
|
|
|
|
|
|
|
Net losses on investments |
|
|
|
|
|
| ||
Net unrealized (gains) losses on equity investments |
|
| ( | ) |
|
|
| |
Net unrealized (gains) losses on other investments |
|
| ( | ) |
|
|
| |
Depreciation and amortization |
|
|
|
|
|
| ||
Bad debt expense |
|
|
|
|
|
| ||
Amortization of bond premium, net |
|
| ( | ) |
|
|
| |
Amortization of discount and issuance costs on debt |
|
|
|
|
|
| ||
Stock-based compensation |
|
|
|
|
|
| ||
Deferred income tax benefit |
|
| ( | ) |
|
| ( | ) |
Decrease (increase) in operating assets: |
|
|
|
|
|
|
|
|
Premiums receivable, net |
|
|
|
|
|
| ||
Reinsurance receivables, net |
|
| ( | ) |
|
| ( | ) |
Deferred policy acquisition costs |
|
|
|
|
|
| ||
Other assets |
|
|
|
|
|
| ||
Increase (decrease) in operating liabilities: |
|
|
|
|
|
|
|
|
Loss and loss adjustment expense reserves |
|
| ( | ) |
|
|
| |
Unearned premiums |
|
| ( | ) |
|
|
| |
Advance premiums |
|
|
|
|
|
| ||
Reinsurance balances payable |
|
|
|
|
| ( | ) | |
Deferred ceding commission revenue |
|
| ( | ) |
|
|
| |
Accounts payable, accrued expenses and other liabilities |
|
| ( | ) |
|
| ( | ) |
Net cash flows used in operating activities |
|
| ( | ) |
|
| ( | ) |
|
|
|
|
|
|
|
|
|
Cash flows from investing activities: |
|
|
|
|
|
|
|
|
Purchase - fixed-maturity securities held-to-maturity |
|
|
|
|
| ( | ) | |
Purchase - fixed-maturity securities available-for-sale |
|
| ( | ) |
|
| ( | ) |
Purchase - equity securities |
|
|
|
|
| ( | ) | |
Redemption - fixed-maturity securities held-to-maturity |
|
|
|
|
|
| ||
Sale and maturity - fixed-maturity securities available-for-sale |
|
|
|
|
|
| ||
Sale - equity securities |
|
|
|
|
|
| ||
Acquisition of property and equipment |
|
| ( | ) |
|
| ( | ) |
Net cash flows provided by investing activities |
|
|
|
|
|
| ||
|
|
|
|
|
|
|
|
|
Cash flows from financing activities: |
|
|
|
|
|
|
|
|
Principal payments on equipment financing |
|
| ( | ) |
|
|
| |
Issue costs on 2022 Notes |
|
| (14,299 | ) |
|
| - |
|
Withholding taxes paid on vested restricted stock awards |
|
| ( | ) |
|
| ( | ) |
Dividends paid |
|
|
|
|
| ( | ) | |
Net cash flows used in financing activities |
|
| ( | ) |
|
| ( | ) |
See accompanying notes to condensed consolidated financial statements.
| 8 |
| Table of Contents |
KINGSTONE COMPANIES, INC. AND SUBSIDIARIES | ||||||||
|
|
|
|
| ||||
Condensed Consolidated Statements of Cash Flows (Unaudited) (Continued) |
|
|
|
| ||||
Six Months ended June 30, |
| 2023 |
|
| 2022 |
| ||
|
|
|
|
|
|
| ||
Increase (decrease) in cash and cash equivalents |
| $ |
|
| $ | ( | ) | |
Cash and cash equivalents, beginning of period |
|
|
|
|
|
| ||
Cash and cash equivalents, end of period |
| $ |
|
| $ |
| ||
|
|
|
|
|
|
|
|
|
Supplemental disclosures of cash flow information: |
|
|
|
|
|
|
|
|
Cash paid for income taxes |
| $ |
|
| $ |
| ||
Cash paid for interest |
| $ |
|
| $ |
| ||
|
|
|
|
|
|
|
|
|
Supplemental schedule of non-cash investing and financing activities: |
|
|
|
|
|
|
|
|
Other comprehensive income (loss), net of tax |
| $ |
|
| $ | ( | ) | |
See accompanying notes to condensed consolidated financial statements.
| 9 |
| Table of Contents |
KINGSTONE COMPANIES, INC. AND SUBSIDIARIES
NOTES TO CONDENSED CONSOLIDATED FINANCIAL STATEMENTS
(Unaudited)
Note 1 - Nature of Business and Basis of Presentation
Kingstone Companies, Inc. (referred to herein as "Kingstone" or the “Company” or, on a standalone basis for the parent company only, the “Holding Company”), through its wholly-owned subsidiary, Kingstone Insurance Company (“KICO”), underwrites property and casualty insurance exclusively through retail and wholesale agents and brokers. KICO is a licensed insurance company in the States of New York, New Jersey, Rhode Island, Massachusetts, Pennsylvania, Connecticut, Maine and New Hampshire. KICO is currently offering its property and casualty insurance products in New York, New Jersey, Rhode Island, Massachusetts, and Connecticut. For the three months ended June 30, 2023 and 2022,
The accompanying unaudited condensed consolidated financial statements have been prepared in accordance with U.S. generally accepted accounting principles (“GAAP”). The principles for condensed interim financial information do not require the inclusion of all the information and footnotes required by GAAP for complete financial statements. Therefore, these condensed consolidated financial statements should be read in conjunction with the consolidated financial statements as of and for the year ended December 31, 2022 and notes thereto included in the Company’s Annual Report on Form 10-K filed with the Securities and Exchange Commission (the “SEC”) on March 31, 2023. The accompanying condensed consolidated financial statements have not been audited by an independent registered public accounting firm in accordance with standards of the Public Company Accounting Oversight Board (United States) but, in the opinion of management, such financial statements include all adjustments, consisting only of normal recurring adjustments, necessary for a fair presentation of the Company’s financial position and results of operations. The results of operations for the six months ended June 30, 2023 may not be indicative of the results that may be expected for the year ending December 31, 2023.
Certain prior year balances were reclassified to conform with the current year presentation. The reclassification had no effect on the Company’s previously reported financial condition, results of operations or cash flows.
Note 2 – Accounting Policies
Use of Estimates
The preparation of financial statements in conformity with GAAP requires management to make estimates and assumptions that affect the reported amounts of assets and liabilities and disclosure of contingent assets and liabilities at the date of the consolidated financial statements and the reported amounts of revenues and expenses during the reporting period. Actual results could differ from these estimates and assumptions, which include the reserves for losses and LAE, which are subject to estimation errors due to the inherent uncertainty in projecting ultimate claim amounts that will be reported and settled over a period of many years. In addition, estimates and assumptions associated with receivables under reinsurance contracts related to contingent ceding commission revenue require judgments by management. On an ongoing basis, management reevaluates its assumptions and the methods for calculating these estimates. Actual results may differ significantly from the estimates used in preparing the condensed consolidated financial statements.
| 10 |
| Table of Contents |
Principles of Consolidation
The condensed consolidated financial statements include the accounts of Kingstone and its wholly-owned subsidiaries: (1) KICO and its wholly-owned subsidiaries, CMIC Properties, Inc. (“Properties”) and 15 Joys Lane, LLC (“15 Joys Lane”), which together own the land and building from which KICO operates, and (2) Cosi. All significant inter-company account balances and transactions have been eliminated in consolidation.
Recent Accounting Pronouncements
In June 2016, the Financial Accounting Standards Board issued Accounting Standards Update 2016-13 - Financial Instruments - Credit Losses (Topic 326): Measurement of Credit Losses on Financial Instruments (“ASU 2016-13”). This new guidance applies to reinsurance and insurance receivables and other financing receivables. For available-for-sale fixed maturity securities carried at fair value, estimated credit losses will continue to be measured at the present value of expected cash flows; however, the other than temporary impairment (“OTTI”) concept has been eliminated. Under the previous guidance, estimated credit impairments resulted in a write-down of amortized cost. Under the new guidance, estimated credit losses are recognized through an allowance and reversals of the allowance are permitted if the estimate of credit losses declines. For available-for-sale fixed maturity securities where the Company has an intent to sell, impairment will continue to result in a write-down of amortized cost. ASU 2016-13 was effective for the Company on January 1, 2023. The Company determined as of the date of adoption that the updated guidance did not have an impact on its consolidated financial statements. Below is a summary of the significant accounting policies impacted by the adoption of ASU 2016-13.
The allowance for credit losses is a valuation account that is reported as a reduction of a financial asset’s cost basis and is measured on a pool basis when similar risk characteristics exist. Management estimates the allowance using relevant available information from both internal and external sources. Historical credit loss experience provides the basis for the estimation of expected credit losses and adjustments may be made to reflect current conditions and reasonable and supportable forecasts. Adjustments to historical loss information are made for any additional factors that come to the Company’s attention. This could include significant shifts in counterparty financial strength ratings, aging of past due receivables, amounts sent to collection agencies, or other underlying portfolio changes. Amounts are considered past due when payments have not been received according to contractual terms. The Company also considers current and forecasted economic conditions, using a variety of economic metrics and forecast indices. The sensitivity of expected credit losses relative to changes to these forecasted economic conditions can vary by financial asset class. The Company considers a reasonable and supportable forecast period to be up to 24 months from the balance sheet date. After the forecast period, the Company reverts to historical credit experience. The Company uses collateral arrangements such as letters of credit and amounts held in beneficiary trusts to mitigate credit risk, which are considered in the estimate of net amount expected to be collected.
The Company has made a policy election to present accrued interest balances separately from the amortized cost basis of assets and has elected the practical expedient to exclude the accrued interest from the tabular disclosures for available-for-sale and held-to-maturity securities. The Company has elected not to estimate an allowance for credit losses on accrued interest receivable. The accrual of interest income is discontinued and the asset is placed on nonaccrual status in the quarter that payment becomes delinquent. Interest accrued but not received for assets on nonaccrual status is reversed through investment income. Interest received for assets that are on nonaccrual status is recognized as payment is received. The asset is returned to accrual status when the principal and interest amounts contractually due are brought current and future payments are expected. Interest receivable is presented as a component of other assets on the condensed consolidated balance sheet.
| 11 |
| Table of Contents |
See Note 3 and Note 6 to the condensed consolidated financial statements for additional information regarding credit losses.
The Company has determined that all other recently issued accounting pronouncements will not have a material impact on its consolidated financial position, results of operations and cash flows, or do not apply to its operations.
Note 3 - Investments
Fixed-Maturity Securities
The amortized cost, estimated fair value, and gross unrealized gains and losses on investments in fixed-maturity securities classified as available-for-sale for which an allowance for credit loss has not been recorded, as of June 30, 2023 and December 31, 2022 are summarized as follows:
|
| June 30, 2023 |
| |||||||||||||||||||||
|
| Cost or |
|
| Gross |
|
| Gross Unrealized Losses |
|
| Estimated |
|
| Net |
| |||||||||
|
| Amortized |
|
| Unrealized |
|
| Less than 12 |
|
| More than 12 |
|
| Fair |
|
| Unrealized |
| ||||||
Category |
| Cost |
|
| Gains |
|
| Months |
|
| Months |
|
| Value |
|
| Losses |
| ||||||
|
|
|
|
|
|
|
|
| ||||||||||||||||
Fixed-Maturity Securities: |
|
|
|
|
|
|
|
|
|
|
|
|
|
|
|
|
|
| ||||||
U.S. Treasury securities and obligations of U.S. government corporations and agencies (1) |
| $ |
|
| $ |
|
| $ | ( | ) |
| $ |
|
| $ |
|
| $ | ) | |||||
|
|
|
|
|
|
|
|
|
|
|
|
|
|
|
|
|
|
|
|
|
|
|
| |
Political subdivisions of States, Territories and Possessions |
|
|
|
|
|
|
|
| ( | ) |
|
| ( | ) |
|
|
|
|
| ( | ) | |||
|
|
|
|
|
|
|
|
|
|
|
|
|
|
|
|
|
|
|
|
|
|
|
|
|
Corporate and other bonds Industrial and miscellaneous |
|
|
|
|
|
|
|
| ( | ) |
|
| ( | ) |
|
|
|
|
| ( | ) | |||
|
|
|
|
|
|
|
|
|
|
|
|
|
|
|
|
|
|
|
|
|
|
|
|
|
Residential mortgage and other asset backed securities (2) |
|
|
|
|
|
|
|
| ( | ) |
|
| ( | ) |
|
|
|
|
| ( | ) | |||
Total fixed-maturity securities |
| $ |
|
| $ |
|
| $ | ( | ) |
| $ | ( | ) |
| $ |
|
| $ | ( | ) | |||
|
| December 31, 2022 |
| |||||||||||||||||||||
|
| Cost or |
|
| Gross |
|
| Gross Unrealized Losses |
|
| Estimated |
|
| Net |
| |||||||||
|
| Amortized |
|
| Unrealized |
|
| Less than 12 |
|
| More than 12 |
|
| Fair |
|
| Unrealized |
| ||||||
Category |
| Cost |
|
| Gains |
|
| Months |
|
| Months |
|
| Value |
|
| Losses |
| ||||||
|
|
|
|
|
|
|
|
| ||||||||||||||||
Fixed-Maturity Securities: |
|
|
|
|
|
|
|
|
|
|
|
|
|
|
|
|
|
| ||||||
U.S. Treasury securities and obligations of U.S. government corporations and agencies (1) |
| $ |
|
| $ |
|
| $ | ( | ) |
| $ |
|
| $ |
|
| $ | ( | ) | ||||
|
|
|
|
|
|
|
|
|
|
|
|
|
|
|
|
|
|
|
|
|
|
|
|
|
Political subdivisions of States, Territories and Possessions |
|
|
|
|
|
|
|
| ( | ) |
|
| ) |
|
|
|
|
| ( | ) | ||||
|
|
|
|
|
|
|
|
|
|
|
|
|
|
|
|
|
|
|
|
|
|
|
|
|
Corporate and other bonds Industrial and miscellaneous |
|
|
|
|
|
|
|
| ( | ) |
|
| ( | ) |
|
|
|
|
| ( | ) | |||
|
|
|
|
|
|
|
|
|
|
|
|
|
|
|
|
|
|
|
|
|
|
|
|
|
Residential mortgage and other asset backed securities (2) |
|
|
|
|
|
|
|
| ( | ) |
|
| ( | ) |
|
|
|
|
| ( | ) | |||
Total fixed-maturity securities |
| $ |
|
| $ |
|
| $ | ( | ) |
| $ | ( | ) |
| $ |
|
| $ | ( | ) | |||
| (1) | In October 2022, KICO placed certain U.S. Treasury securities to fulfill the required collateral for a sale leaseback transaction in a designated custodian account (see Note 7 – Debt - “Equipment Financing”). As of June 30, 2023 and December 31, 2022, the amount of required collateral was approximately $ |
| (2) | KICO has placed certain residential mortgage backed securities as eligible collateral in a designated custodian account related to its membership in the Federal Home Loan Bank of New York ("FHLBNY") (see Note 7 – Debt – “Federal Home Loan Bank”). The eligible collateral would be pledged to FHLBNY if KICO draws an advance from the FHLBNY credit line. As of June 30, 2023 and December 31, 2022, the estimated fair value of the eligible investments was approximately $ |
A summary of the amortized cost and estimated fair value of the Company’s investments in available-for-sale fixed-maturity securities by contractual maturity as of June 30, 2023 and December 31, 2022 is shown below:
|
| June 30, 2023 |
|
| December 31, 2022 |
| ||||||||||
|
| Amortized |
|
| Estimated |
|
| Amortized |
|
| Estimated |
| ||||
Remaining Time to Maturity |
| Cost |
|
| Fair Value |
|
| Cost |
|
| Fair Value |
| ||||
|
|
|
|
|
|
|
|
|
|
|
|
| ||||
Less than one year |
| $ |
|
| $ |
|
| $ |
|
| $ |
| ||||
One to five years |
|
|
|
|
|
|
|
|
|
|
|
| ||||
Five to ten years |
|
|
|
|
|
|
|
|
|
|
|
| ||||
More than 10 years |
|
|
|
|
|
|
|
|
|
|
|
| ||||
Residential mortgage and other asset backed securities |
|
|
|
|
|
|
|
|
|
|
|
| ||||
Total |
| $ |
|
| $ |
|
| $ |
|
| $ |
| ||||
The actual maturities may differ from contractual maturities because certain borrowers have the right to call or prepay obligations with or without penalties.
| 12 |
| Table of Contents |
Equity Securities
The cost and estimated fair value of, and gross unrealized gains and losses on, investments in equity securities as of June 30, 2023 and December 31, 2022 are as follows:
|
| June 30, 2023 |
| |||||||||||||
|
|
|
| Gross |
|
| Gross |
|
| Estimated |
| |||||
Category |
| Cost |
|
| Gains |
|
| Losses |
|
| Fair Value |
| ||||
|
|
|
|
|
|
| ||||||||||
Equity Securities: |
|
|
|
|
|
|
|
|
|
|
|
| ||||
Preferred stocks |
| $ |
|
| $ |
|
| $ | ( | ) |
| $ |
| |||
Common stocks, mutual funds, and exchange traded funds |
|
|
|
|
|
|
|
| ( | ) |
|
|
| |||
Total |
| $ |
|
| $ |
|
| $ | ( | ) |
| $ |
| |||
|
| December 31, 2022 |
| |||||||||||||
|
|
|
| Gross |
|
| Gross |
|
| Estimated |
| |||||
Category |
| Cost |
|
| Gains |
|
| Losses |
|
| Fair Value |
| ||||
|
|
|
|
|
|
| ||||||||||
Equity Securities: |
|
|
|
|
|
|
|
|
|
|
|
| ||||
Preferred stocks |
| $ |
|
| $ |
|
| $ | ( | ) |
| $ |
| |||
Common stocks, mutual funds, and exchange traded funds |
|
|
|
|
|
|
|
| ( | ) |
|
|
| |||
Total |
| $ |
|
| $ |
|
| $ | ( | ) |
| $ |
| |||
Other Investments
The cost and estimated fair value of, and gross gains on, the Company’s other investments as of June 30, 2023 and December 31, 2022 are as follows:
|
| June 30, 2023 |
|
| December 31, 2022 |
| ||||||||||||||||||
|
|
|
| Gross |
|
| Estimated |
|
|
|
| Gross |
|
| Estimated |
| ||||||||
Category |
| Cost |
|
| Gains |
|
| Fair Value |
|
| Cost |
|
| Gains |
|
| Fair Value |
| ||||||
|
|
|
|
|
|
|
|
|
|
| ||||||||||||||
Other Investments: |
|
|
|
|
|
|
|
|
|
|
|
|
|
|
|
|
|
| ||||||
Hedge fund |
| $ |
|
| $ |
|
| $ |
|
| $ |
|
| $ |
|
| $ |
| ||||||
| 13 |
| Table of Contents |
Held-to-Maturity Securities
The cost or amortized cost and estimated fair value of, and unrealized gross gains and losses on, investments in held-to-maturity fixed-maturity securities as of June 30, 2023 and December 31, 2022 are summarized as follows:
|
| June 30, 2023 |
| |||||||||||||||||||||
|
| Cost or |
|
| Gross |
|
| Gross Unrealized Losses |
|
| Estimated |
|
| Net |
| |||||||||
|
| Amortized |
|
| Unrealized |
|
| Less than 12 |
|
| More than 12 |
|
| Fair |
|
| Unrealized |
| ||||||
Category |
| Cost |
|
| Gains |
|
| Months |
|
| Months |
|
| Value |
|
| Losses |
| ||||||
|
|
|
|
|
|
|
|
| ||||||||||||||||
Held-to-Maturity Securities: |
|
|
|
|
|
|
|
|
|
|
|
|
|
|
|
|
|
| ||||||
U.S. Treasury securities |
| $ |
|
| $ |
|
| $ | ( | ) |
| $ |
|
| $ |
|
| $ | ( | ) | ||||
|
|
|
|
|
|
|
|
|
|
|
|
|
|
|
|
|
|
|
|
|
|
|
|
|
Political subdivisions of States, Territories and Possessions |
|
|
|
|
|
|
|
| ( | ) |
|
|
|
|
|
|
|
| ( | ) | ||||
|
|
|
|
|
|
|
|
|
|
|
|
|
|
|
|
|
|
|
|
|
|
|
|
|
Exchange traded debt |
|
|
|
|
|
|
|
| ( | ) |
|
|
|
|
|
|
|
| ( | ) | ||||
|
|
|
|
|
|
|
|
|
|
|
|
|
|
|
|
|
|
|
|
|
|
|
|
|
Corporate and other bonds Industrial and miscellaneous |
|
|
|
|
|
|
|
| ( | ) |
|
| ( | ) |
|
|
|
|
| ( | ) | |||
Total |
| $ |
|
| $ |
|
| $ | ( | ) |
| $ | ( | ) |
| $ |
|
| $ | ( | ) | |||
|
| December 31, 2022 |
| |||||||||||||||||||||
|
| Cost or |
|
| Gross |
|
| Gross Unrealized Losses |
|
| Estimated |
|
| Unrealized |
| |||||||||
|
| Amortized |
|
| Unrealized |
|
| Less than 12 |
|
| More than 12 |
|
| Fair |
|
| Gains/ |
| ||||||
Category |
| Cost |
|
| Gains |
|
| Months |
|
| Months |
|
| Value |
|
| (Losses) |
| ||||||
|
|
|
|
|
|
|
|
| ||||||||||||||||
Held-to-Maturity Securities: |
|
|
|
|
|
|
|
|
|
|
|
|
|
|
|
|
|
| ||||||
U.S. Treasury securities |
| $ |
|
| $ |
|
| $ | ( | ) |
| $ |
|
| $ |
|
| $ | ( | ) | ||||
|
|
|
|
|
|
|
|
|
|
|
|
|
|
|
|
|
|
|
|
|
|
|
|
|
Political subdivisions of States, Territories and Possessions |
|
|
|
|
|
|
|
|
|
|
|
|
|
|
|
|
|
| ||||||
|
|
|
|
|
|
|
|
|
|
|
|
|
|
|
|
|
|
|
|
|
|
|
|
|
Exchange traded debt |
|
|
|
|
|
|
|
| ( | ) |
|
|
|
|
|
|
|
| ( | ) | ||||
|
|
|
|
|
|
|
|
|
|
|
|
|
|
|
|
|
|
|
|
|
|
|
|
|
Corporate and other bonds Industrial and miscellaneous |
|
|
|
|
|
|
|
| ( | ) |
|
| ( | ) |
|
|
|
|
| ( | ) | |||
Total |
| $ |
|
| $ |
|
| $ | ( | ) |
| $ | ( | ) |
| $ |
|
| $ | ( | ) | |||
Held-to-maturity U.S. Treasury securities are held in trust pursuant to various states’ minimum funds requirements.
| 14 |
| Table of Contents |
A summary of the amortized cost and estimated fair value of the Company’s investments in held-to-maturity securities by contractual maturity as of June 30, 2023 and December 31, 2022 is shown below:
|
| June 30, 2023 |
|
| December 31, 2022 |
| ||||||||||
|
| Amortized |
|
| Estimated |
|
| Amortized |
|
| Estimated |
| ||||
Remaining Time to Maturity |
| Cost |
|
| Fair Value |
|
| Cost |
|
| Fair Value |
| ||||
|
|
|
|
|
|
|
|
| ||||||||
Less than one year |
| $ |
|
| $ |
|
| $ |
|
| $ |
| ||||
One to five years |
|
|
|
|
|
|
|
|
|
|
|
| ||||
Five to ten years |
|
|
|
|
|
|
|
|
|
|
|
| ||||
More than 10 years |
|
|
|
|
|
|
|
|
|
|
|
| ||||
Total |
| $ |
|
| $ |
|
| $ |
|
| $ |
| ||||
The actual maturities may differ from contractual maturities because certain borrowers have the right to call or prepay obligations with or without penalties.
Investment Income
Major categories of the Company’s net investment income are summarized as follows:
|
| Three months ended |
|
| Six months ended |
| ||||||||||
|
| June 30, |
|
| June 30, |
| ||||||||||
|
| 2023 |
|
| 2022 |
|
| 2023 |
|
| 2022 |
| ||||
|
|
|
|
|
|
|
|
|
|
|
|
| ||||
Income: |
|
|
|
|
|
|
|
|
|
|
|
| ||||
Fixed-maturity securities |
| $ |
|
| $ |
|
| $ |
|
| $ |
| ||||
Equity securities |
|
|
|
|
|
|
|
|
|
|
|
| ||||
Cash and cash equivalents |
|
|
|
|
|
|
|
|
|
|
|
| ||||
Total |
|
|
|
|
|
|
|
|
|
|
|
| ||||
Expenses: |
|
|
|
|
|
|
|
|
|
|
|
|
|
|
|
|
Investment expenses |
|
|
|
|
|
|
|
|
|
|
|
| ||||
Net investment income |
| $ |
|
| $ |
|
| $ |
|
| $ |
| ||||
Proceeds from the redemption of fixed-maturity securities held-to-maturity were $
Proceeds from the sale or maturity of fixed-maturity securities available-for-sale were $
Proceeds from the sale of equity securities were $
| 15 |
| Table of Contents |
The Company’s net gains (losses) on investments are summarized as follows:
|
| Three months ended |
|
| Six months ended |
| ||||||||||
|
| June 30, |
|
| June 30, |
| ||||||||||
|
| 2023 |
|
| 2022 |
|
| 2023 |
|
| 2022 |
| ||||
Realized Gains (Losses) |
|
|
|
|
|
|
|
|
|
|
|
| ||||
|
|
|
|
|
|
|
|
| ||||||||
Fixed-maturity securities: |
|
|
|
|
|
|
|
|
|
|
|
| ||||
Gross realized gains |
| $ |
|
| $ |
|
| $ |
|
| $ |
| ||||
Gross realized losses |
|
| ( | ) |
|
| ( | ) |
|
| ( | ) |
|
| ( | ) |
|
|
| ( | ) |
|
| ( | ) |
|
| ( | ) |
|
| ( | ) |
|
|
|
|
|
|
|
|
|
|
|
|
|
|
|
|
|
Equity securities: |
|
|
|
|
|
|
|
|
|
|
|
|
|
|
|
|
Gross realized gains |
|
|
|
|
|
|
|
|
|
|
|
| ||||
Gross realized losses |
|
|
|
|
| ( | ) |
|
|
|
|
| ( | ) | ||
|
|
|
|
|
| ( | ) |
|
|
|
|
| ( | ) | ||
|
|
|
|
|
|
|
|
|
|
|
|
|
|
|
|
|
Other Investments: |
|
|
|
|
|
|
|
|
|
|
|
|
|
|
|
|
Gross realized gains |
|
|
|
|
|
|
|
|
|
|
|
| ||||
Gross realized losses |
|
|
|
|
|
|
|
|
|
|
|
| ||||
|
|
|
|
|
|
|
|
|
|
|
|
|
|
|
|
|
Net realized losses |
|
| ( | ) |
|
| ( | ) |
|
| ( | ) |
|
| ( | ) |
|
|
|
|
|
|
|
|
|
|
|
|
|
|
|
|
|
Unrealized Gains (Losses) |
|
|
|
|
|
|
|
|
|
|
|
|
|
|
|
|
|
|
|
|
|
|
|
|
|
|
| ||||||
Equity Securities: |
|
|
|
|
|
|
|
|
|
|
|
|
|
|
|
|
Gross gains |
|
|
|
|
|
|
|
|
|
|
|
| ||||
Gross losses |
|
| ( | ) |
|
| ( | ) |
|
|
|
|
| ( | ) | |
|
|
| ( | ) |
|
| ( | ) |
|
|
|
|
| ( | ) | |
|
|
|
|
|
|
|
|
|
|
|
|
|
|
|
|
|
Other Investments: |
|
|
|
|
|
|
|
|
|
|
|
|
|
|
|
|
Gross gains |
|
|
|
|
|
|
|
|
|
|
|
| ||||
Gross losses |
|
|
|
|
| ( | ) |
|
|
|
|
| ( | ) | ||
|
|
|
|
|
| ) |
|
|
|
|
| ( | ) | |||
|
|
|
|
|
|
|
|
|
|
|
|
|
|
|
|
|
Net unrealized gains (losses) |
|
|
|
|
| ( | ) |
|
|
|
|
| ( | ) | ||
|
|
|
|
|
|
|
|
|
|
|
|
|
|
|
|
|
Net gains (losses) on investments |
| $ |
|
| $ | ( | ) |
| $ |
|
| $ | ( | ) | ||
Allowance for Credit Loss
For available-for-sale fixed maturity securities, a credit loss exists if the present value of cash flows expected to be collected is less than the amortized cost basis. The allowance for credit loss related to available-for-sale fixed maturity securities is the difference between present value of cash flows expected to be collected and the amortized cost basis, limited by the amount that the fair value is less than the amortized cost basis. The Company considers all available evidence when determining whether an investment requires a credit loss write-down or allowance to be recorded. Changes in the allowance are presented as a component of net gains (losses) on investments on the accompanying condensed consolidated statements of operations and comprehensive income (loss).
At June 30, 2023 and December 31, 2022, there were 146 and 155 fixed-maturity securities, respectively, that accounted for the gross unrealized losses. The Company determined that none of the unrealized losses were deemed to be credit losses for its portfolio of investments for the six months ended June 30, 2023 and 2022. Significant factors influencing the Company’s determination that unrealized losses were temporary included credit quality considerations, the magnitude of the unrealized losses in relation to each security’s cost, the nature of the investment and interest rate environment factors, and management’s intent and ability to hold the investment for a period of time sufficient to allow for an anticipated recovery of estimated fair value to the Company’s cost basis.
| 16 |
| Table of Contents |
The Company held available-for-sale securities with unrealized losses representing declines that were considered temporary at June 30, 2023 as follows:
|
| June 30, 2023 |
| |||||||||||||||||||||||||||||
|
| Less than 12 months |
|
| 12 months or more |
|
| Total |
| |||||||||||||||||||||||
|
| Estimated |
|
|
|
| No. of |
|
| Estimated |
|
|
|
| No. of |
|
| Estimated |
|
|
| |||||||||||
|
| Fair |
|
| Unrealized |
|
| Positions |
|
| Fair |
|
| Unrealized |
|
| Positions |
|
| Fair |
|
| Unrealized |
| ||||||||
Category |
| Value |
|
| Losses |
|
| Held |
|
| Value |
|
| Losses |
|
| Held |
|
| Value |
|
| Losses |
| ||||||||
|
|
|
|
|
|
|
|
|
|
| ||||||||||||||||||||||
Fixed-Maturity Securities: |
|
|
|
|
|
|
|
|
|
|
|
|
|
|
|
|
|
|
|
|
|
|
|
| ||||||||
U.S. Treasury securities and obligations of U.S. government corporations and agencies |
| $ |
|
| $ | ( | ) |
|
|
|
| $ |
|
|
|
|
|
|
|
| $ |
|
| $ | ( | ) | ||||||
|
|
|
|
|
|
|
|
|
|
|
|
|
|
|
|
|
|
|
|
|
|
|
|
|
|
|
|
|
|
|
|
|
Political subdivisions of States, Territories and Possessions |
|
|
|
|
| ( | ) |
|
|
|
|
|
|
|
| ) |
|
|
|
|
|
|
|
| ( | ) | ||||||
|
|
|
|
|
|
|
|
|
|
|
|
|
|
|
|
|
|
|
|
|
|
|
|
|
|
|
|
|
|
|
|
|
Corporate and other bonds industrial and miscellaneous |
|
|
|
|
| ( | ) |
|
|
|
|
|
|
|
| ( | ) |
|
|
|
|
|
|
|
| ( | ) | |||||
|
|
|
|
|
|
|
|
|
|
|
|
|
|
|
|
|
|
|
|
|
|
|
|
|
|
|
|
|
|
|
| |
Residential mortgage and other asset backed securities |
|
|
|
|
| ( | ) |
|
|
|
|
|
|
|
| ( | ) |
|
|
|
|
|
|
|
| ( | ) | |||||
|
|
|
|
|
|
|
|
|
|
|
|
|
|
|
|
|
|
|
|
|
|
|
|
|
|
|
|
|
|
|
|
|
Total fixed-maturity securities |
| $ |
|
| $ | ( | ) |
|
|
|
| $ |
|
| $ | ( | ) |
|
|
|
| $ |
|
| $ | ( | ) | |||||
| 17 |
| Table of Contents |
The Company held available-for-sale securities with unrealized losses representing declines that were considered temporary at December 31, 2022 as follows:
|
| December 31, 2022 |
| |||||||||||||||||||||||||||||
|
| Less than 12 months |
|
| 12 months or more |
|
| Total |
| |||||||||||||||||||||||
|
| Estimated |
|
|
|
| No. of |
|
| Estimated |
|
|
|
| No. of |
|
| Estimated |
|
|
| |||||||||||
|
| Fair |
|
| Unrealized |
|
| Positions |
|
| Fair |
|
| Unrealized |
|
| Positions |
|
| Fair |
|
| Unrealized |
| ||||||||
Category |
| Value |
|
| Losses |
|
| Held |
|
| Value |
|
| Losses |
|
| Held |
|
| Value |
|
| Losses |
| ||||||||
|
|
|
|
|
|
|
|
|
|
| ||||||||||||||||||||||
Fixed-Maturity Securities: |
|
|
|
|
|
|
|
|
|
|
|
|
|
|
|
|
|
|
|
|
|
|
|
| ||||||||
U.S. Treasury securities and obligations of U.S. government corporations and agencies |
| $ |
|
| $ | ( | ) |
|
|
|
| $ |
|
|
|
|
|
|
|
| $ |
|
| $ | ( | ) | ||||||
|
|
|
|
|
|
|
|
|
|
|
|
|
|
|
|
|
|
|
|
|
|
|
|
|
|
|
|
|
|
|
|
|
Political subdivisions of States, Territories and Possessions |
|
|
|
|
| ( | ) |
|
|
|
|
|
|
|
| ( | ) |
|
|
|
|
|
|
|
| ( | ) | |||||
|
|
|
|
|
|
|
|
|
|
|
|
|
|
|
|
|
|
|
|
|
|
|
|
|
|
|
|
|
|
|
| |
Corporate and other bonds industrial and miscellaneous |
|
|
|
|
| ( | ) |
|
|
|
|
|
|
|
| ( | ) |
|
|
|
|
|
|
|
| ( | ) | |||||
|
|
|
|
|
|
|
|
|
|
|
|
|
|
|
|
|
|
|
|
|
|
|
|
|
|
|
|
|
|
|
| |
Residential mortgage and other asset backed securities |
|
|
|
|
| ) |
|
|
|
|
|
|
|
| ( | ) |
|
|
|
|
|
|
|
| ( | ) | ||||||
|
|
|
|
|
|
|
|
|
|
|
|
|
|
|
|
|
|
|
|
|
|
|
|
|
|
|
|
|
|
|
| |
Total fixed-maturity securities |
| $ |
|
| $ | ( | ) |
|
|
|
| $ |
|
| $ | ( | ) |
|
|
|
| $ |
|
| $ | (20,263,141 | ) | |||||
| 18 |
| Table of Contents |
Note 4 - Fair Value Measurements
The following table presents information about the Company’s investments that are measured at fair value on a recurring basis at June 30, 2023 and December 31, 2022 indicating the fair value hierarchy of the valuation inputs the Company utilized to determine such fair value:
|
| June 30, 2023 |
| |||||||||||||
|
| Level 1 |
|
| Level 2 |
|
| Level 3 |
|
| Total |
| ||||
|
|
|
|
|
|
| ||||||||||
Fixed-maturity securities available-for-sale |
|
|
|
|
|
|
|
|
|
|
|
| ||||
U.S. Treasury securities and obligations of U.S. government corporations and agencies |
| $ |
|
| $ |
|
| $ |
|
| $ |
| ||||
|
|
|
|
|
|
|
|
|
|
|
|
|
|
|
| |
Political subdivisions of States, Territories and Possessions |
|
|
|
|
|
|
|
|
|
|
|
| ||||
|
|
|
|
|
|
|
|
|
|
|
|
|
|
|
| |
Corporate and other bonds industrial and miscellaneous |
|
|
|
|
|
|
|
|
|
|
|
| ||||
|
|
|
|
|
|
|
|
|
|
|
|
|
|
|
|
|
Residential mortgage and other asset backed securities |
|
|
|
|
|
|
|
|
|
|
|
| ||||
Total fixed maturities |
|
|
|
|
|
|
|
|
|
|
|
| ||||
Equity securities |
|
|
|
|
|
|
|
|
|
|
|
| ||||
Total investments |
| $ |
|
| $ |
|
| $ |
|
| $ |
| ||||
|
| December 31, 2022 |
| |||||||||||||
|
| Level 1 |
|
| Level 2 |
|
| Level 3 |
|
| Total |
| ||||
|
|
|
|
|
|
| ||||||||||
Fixed-maturity securities available-for-sale |
|
|
|
|
|
|
|
|
|
|
|
| ||||
U.S. Treasury securities and obligations of U.S. government corporations and agencies |
| $ |
|
| $ |
|
| $ |
|
| $ |
| ||||
|
|
|
|
|
|
|
|
|
|
|
|
|
|
|
|
|
Political subdivisions of States, Territories and Possessions |
|
|
|
|
|
|
|
|
|
|
|
| ||||
|
|
|
|
|
|
|
|
|
|
|
|
|
|
|
|
|
Corporate and other bonds industrial and miscellaneous |
|
|
|
|
|
|
|
|
|
|
|
| ||||
|
|
|
|
|
|
|
|
|
|
|
|
|
|
|
|
|
Residential mortgage and other asset backed securities |
|
|
|
|
|
|
|
|
|
|
|
| ||||
Total fixed maturities |
|
|
|
|
|
|
|
|
|
|
|
| ||||
Equity securities |
|
|
|
|
|
|
|
|
|
|
|
| ||||
Total investments |
| $ |
|
| $ |
|
| $ |
|
| $ |
| ||||
| 19 |
| Table of Contents |
The following table sets forth the Company’s investment in a hedge fund measured at Net Asset Value (“NAV”) per share as of June 30, 2023 and December 31, 2022. The Company measures this investment at fair value on a recurring basis. Fair value using NAV per share is as follows as of the dates indicated:
Category |
| June 30, 2023 |
|
| December 31, 2022 |
| ||
|
|
|
|
|
|
| ||
Other Investments |
|
|
|
|
|
| ||
Hedge fund |
| $ |
|
| $ |
| ||
The hedge fund investment is generally redeemable with at least 45 days prior written notice. The hedge fund investment is accounted for as a limited partnership by the Company. Income is earned based upon the Company’s allocated share of the partnership's changes in unrealized gains and losses to its partners. Such amounts have been recorded in the condensed consolidated statements of operations and comprehensive income (loss) within net gains (losses) on investments.
The estimated fair value and the level of the fair value hierarchy of the Company’s long-term debt as of June 30, 2023 and December 31, 2022 not measured at fair value is as follows:
|
| Level 1 |
|
| Level 2 |
|
| Level 3 |
|
| Total |
| ||||
Debt |
|
|
|
|
|
|
|
|
|
|
|
| ||||
|
|
|
|
|
|
|
|
|
|
|
|
| ||||
Senior Notes due 2024 |
| $ |
|
| $ |
|
| $ |
|
| $ |
| ||||
|
|
|
|
|
|
|
|
|
|
|
|
|
|
|
|
|
|
|
|
|
|
|
|
|
|
|
|
|
|
|
|
|
|
|
| December 31, 2022 | ||||||||||||||
|
| Level 1 |
|
| Level 2 |
|
| Level 3 |
|
| Total |
| ||||
Debt |
|
|
|
|
|
|
|
|
|
|
|
|
|
|
|
|
|
|
|
|
|
|
|
|
|
|
|
|
|
|
|
|
|
Senior Notes due 2024 |
| $ |
|
| $ |
|
| $ |
|
| $ |
| ||||
Note 5 - Fair Value of Financial Instruments and Real Estate
The estimated fair values of the Company’s financial instruments and real estate, including their fair value level as of June 30, 2023 and December 31, 2022 are as follows:
|
| June 30, 2023 |
|
| December 31, 2022 |
| ||||||||||
|
| Carrying Value |
|
| Fair Value |
|
| Carrying Value |
|
| Fair Value |
| ||||
|
|
|
|
|
|
|
|
| ||||||||
Fixed-maturity securities-held-to maturity, Level 1 |
| $ |
|
| $ |
|
| $ |
|
| $ |
| ||||
Cash and cash equivalents, Level 1 |
| $ |
|
| $ |
|
| $ |
|
| $ |
| ||||
Premiums receivable, net, Level 1 |
| $ |
|
| $ |
|
| $ |
|
| $ |
| ||||
Reinsurance receivables, net, Level 3 |
| $ |
|
| $ |
|
| $ |
|
| $ |
| ||||
Real estate, net of accumulated depreciation, Level 3 |
| $ |
|
| $ |
|
| $ |
|
| $ |
| ||||
Reinsurance balances payable, Level 3 |
| $ |
|
| $ |
|
| $ |
|
| $ |
| ||||
| 20 |
| Table of Contents |
Note 6 – Property and Casualty Insurance Activity
Premiums Earned
Premiums written, ceded and earned are as follows:
|
| Direct |
|
| Assumed |
|
| Ceded |
|
| Net |
| ||||
|
|
|
|
|
|
|
|
|
|
|
|
| ||||
Six months ended June 30, 2023 |
|
|
|
|
|
|
|
|
|
|
|
| ||||
Premiums written |
| $ |
|
| $ |
|
| $ | ( | ) |
| $ |
| |||
Change in unearned premiums |
|
|
|
|
|
|
|
| ( | ) |
|
|
| |||
Premiums earned |
| $ |
|
| $ |
|
| $ | ( | ) |
| $ |
| |||
|
|
|
|
|
|
|
|
|
|
|
|
|
|
|
|
|
Six months ended June 30, 2022 |
|
|
|
|
|
|
|
|
|
|
|
|
|
|
|
|
Premiums written |
| $ |
|
| $ |
|
| $ | ( | ) |
| $ |
| |||
Change in unearned premiums |
|
| ( | ) |
|
|
|
|
|
|
|
| ( | ) | ||
Premiums earned |
| $ |
|
| $ |
|
| $ | ( | ) |
| $ |
| |||
|
|
|
|
|
|
|
|
|
|
|
|
|
|
|
|
|
Three months ended June 30, 2023 |
|
|
|
|
|
|
|
|
|
|
|
|
|
|
|
|
Premiums written |
| $ |
|
| $ |
|
| $ | ( | ) |
| $ |
| |||
Change in unearned premiums |
|
|
|
|
|
|
|
| ( | ) |
|
|
| |||
Premiums earned |
| $ |
|
| $ |
|
| $ | ( | ) |
| $ |
| |||
|
|
|
|
|
|
|
|
|
|
|
|
|
|
|
|
|
Three months ended June 30, 2022 |
|
|
|
|
|
|
|
|
|
|
|
|
|
|
|
|
Premiums written |
| $ |
|
| $ |
|
| $ | ( | ) |
| $ |
| |||
Change in unearned premiums |
|
| ) |
|
|
|
|
|
|
|
| ( | ) | |||
Premiums earned |
| $ |
|
| $ |
|
| $ | ( | ) |
| $ |
| |||
Premium receipts in advance of the policy effective date are recorded as advance premiums. The balance of advance premiums as of June 30, 2023 and December 31, 2022 was $
| 21 |
| Table of Contents |
Loss and Loss Adjustment Expense Reserves
The following table provides a reconciliation of the beginning and ending balances for unpaid losses and loss adjustment expense (“LAE”) reserves:
|
| Six months ended |
| |||||
|
| June 30, |
| |||||
|
| 2023 |
|
| 2022 |
| ||
|
|
|
|
| ||||
Balance at beginning of period |
| $ |
|
| $ |
| ||
Less reinsurance recoverables |
|
| ( | ) |
|
| ( | ) |
Net balance, beginning of period |
|
|
|
|
|
| ||
|
|
|
|
|
|
|
|
|
Incurred related to: |
|
|
|
|
|
|
|
|
Current year |
|
|
|
|
|
| ||
Prior years |
|
| ( | ) |
|
|
| |
Total incurred |
|
|
|
|
|
| ||
|
|
|
|
|
|
|
|
|
Paid related to: |
|
|
|
|
|
|
|
|
Current year |
|
|
|
|
|
| ||
Prior years |
|
|
|
|
|
| ||
Total paid |
|
|
|
|
|
| ||
|
|
|
|
|
|
|
|
|
Net balance at end of period |
|
|
|
|
|
| ||
Add reinsurance recoverables |
|
|
|
|
|
| ||
Balance at end of period |
| $ |
|
| $ |
| ||
Incurred losses and LAE are net of reinsurance recoveries under reinsurance contracts of $
Prior year incurred loss and LAE development is based upon estimates by line of business and accident year. Prior year loss and LAE development incurred during the six months ended June 30, 2023 and 2022 was $
Loss and LAE Reserves
The reserving process for loss and LAE reserves provides for the Company’s best estimate at a particular point in time of the ultimate unpaid cost of all losses and LAE incurred, including settlement and administration of losses, and is based on facts and circumstances then known including losses that have occurred but that have not yet been reported. The process relies on standard actuarial reserving methodologies, judgments relative to estimates of ultimate claim severity and frequency, the length of time before losses will develop to their ultimate level (‘tail’ factors), and the likelihood of changes in the law or other external factors that are beyond the Company’s control. Several actuarial reserving methodologies are used to estimate required loss reserves. The process produces carried reserves set by management based upon the actuaries’ best estimate and is the cumulative combination of the best estimates made by line of business, accident year, and loss and LAE. The amount of loss and LAE reserves for individual reported claims (the “case reserve”) is determined by the claims department and changes over time as new information is gathered. Such information is critical to the review of appropriate IBNR reserves and includes a review of coverage applicability, comparative liability on the part of the insured, injury severity, property damage, replacement cost estimates, and any other information considered pertinent to estimating the exposure presented by the claim. The amounts of loss and LAE reserves for unreported claims and development on known claims (IBNR reserves) are determined using historical information aggregated by line of insurance as adjusted to current conditions. Since this process produces loss reserves set by management based upon the actuaries’ best estimate, there is no explicit or implicit provision for uncertainty in the carried loss reserves.
| 22 |
| Table of Contents |
Due to the inherent uncertainty associated with the reserving process, the ultimate liability may differ, perhaps substantially, from the original estimate. Such estimates are regularly reviewed and updated and any resulting adjustments are included in the current period’s results. Reserves are closely monitored and are recomputed periodically using the most recent information on reported claims and a variety of statistical techniques. On at least a quarterly basis, the Company reviews by line of business existing reserves, new claims, changes to existing case reserves, and paid losses with respect to the current and prior periods. Several methods are used, varying by line of business and accident year, in order to select the estimated period-end loss reserves. These methods include the following:
Paid Loss Development – historical patterns of paid loss development are used to project future paid loss emergence in order to estimate required reserves.
Incurred Loss Development – historical patterns of incurred loss development, reflecting both paid losses and changes in case reserves, are used to project future incurred loss emergence in order to estimate required reserves.
Paid Bornhuetter-Ferguson (“BF”) – an estimated loss ratio for a particular accident year is determined, and is weighted against the portion of the accident year claims that have been paid, based on historical paid loss development patterns. The estimate of required reserves assumes that the remaining unpaid portion of a particular accident year will pay out at a rate consistent with the estimated loss ratio for that year. This method can be useful for situations where an unusually high or low amount of paid losses exists at the early stages of the claims development process.
Incurred Bornhuetter-Ferguson (“BF”) - an estimated loss ratio for a particular accident year is determined, and is weighted against the portion of the accident year claims that have been reported, based on historical incurred loss development patterns. The estimate of required reserves assumes that the remaining unreported portion of a particular accident year will pay out at a rate consistent with the estimated loss ratio for that year. This method can be useful for situations where an unusually high or low amount of reported losses exists at the early stages of the claims development process.
Incremental Claim-Based Methods – historical patterns of incremental incurred losses and paid LAE during various stages of development are reviewed and assumptions are made regarding average loss and LAE development applied to remaining claims inventory. Such methods more properly reflect changes in the speed of claims closure and the relative adequacy of case reserve levels at various stages of development. These methods may provide a more accurate estimate of IBNR for lines of business with relatively few remaining open claims but for which significant recent settlement activity has occurred.
Frequency / Severity Based Methods – historical measurements of claim frequency and average paid claim size (severity) are reviewed for more mature accident years where a majority of claims have been reported and/or closed. These historical averages are trended forward to more recent periods in order to estimate ultimate losses for newer accident years that are not yet fully developed. These methods are useful for lines of business with slow and/or volatile loss development patterns, such as liability lines where information pertaining to individual cases may not be completely known for many years. The claim frequency and severity information for older periods can then be used as reasonable measures for developing a range of estimates for more recent immature periods.
| 23 |
| Table of Contents |
Management’s best estimate of required reserves is generally based on an average of the methods above, with appropriate weighting of methods based on the line of business and accident year being projected. In some cases, additional methods or historical data from industry sources are employed to supplement the projections derived from the methods listed above.
Three key assumptions that materially affect the estimate of loss reserves are the loss ratio estimate for the current accident year used in the BF methods, the loss development factor selections used in the loss development methods, and the loss severity assumptions used in the frequency / severity method described above. The loss ratio estimates used in the BF methods are selected after reviewing historical accident year loss ratios adjusted for rate changes, trend, and mix of business. The severity assumptions used in the frequency / severity method are determined by reviewing historical average claim severity for older more mature accident periods, trended forward to less mature accident periods.
The Company reviews the carried reserves levels on a regular basis as additional information becomes available and makes adjustments in the periods in which such adjustments are determined to be necessary. The Company is not aware of any claim trends that have emerged or that would cause future adverse development that have not already been contemplated in setting current carried reserves levels.
In New York State, lawsuits for negligence are subject to certain limitations and must be commenced within three years from the date of the accident or are otherwise barred. Accordingly, the Company’s exposure to unreported claims (“pure” IBNR) for accident dates of June 30, 2020 and prior is limited, although there remains the possibility of adverse development on reported claims (“case development” IBNR). In certain rare circumstances states have retroactively revised a statute of limitations. The Company is not aware of any such effort that would have a material impact on the Company’s results.
The following is information about incurred and paid claims development as of June 30, 2023, net of reinsurance, as well as the cumulative reported claims by accident year and total IBNR reserves as of June 30, 2023 included in the net incurred loss and allocated expense amounts. The historical information regarding incurred and paid claims development for the years ended December 31, 2014 to December 31, 2022 is presented as supplementary unaudited information.
| 24 |
| Table of Contents |
All Lines of Business |
|
|
|
|
|
|
|
|
|
|
|
|
|
|
|
|
|
|
|
|
|
|
|
|
|
|
|
|
|
|
| |||||||||||||||||
(in thousands, except reported claims data) |
|
|
|
|
|
|
|
|
|
|
|
|
|
|
|
|
|
|
|
|
|
|
|
|
| |||||||||||||||||||||||
|
|
|
|
|
|
|
|
|
|
|
|
|
|
|
|
|
|
|
|
|
|
|
|
|
|
|
|
|
|
|
| As of |
| |||||||||||||||
|
| Incurred Loss and Allocated Loss Adjustment Expenses, Net of Reinsurance |
|
| June 30, 2023 |
| ||||||||||||||||||||||||||||||||||||||||||
|
| For the Years Ended December 31, |
|
| Six Months Ended June 30, |
|
|
|
|
| Cumulative Number of Reported Claims by |
| ||||||||||||||||||||||||||||||||||||
Accident Year |
| 2014 |
|
| 2015 |
|
| 2016 |
|
| 2017 |
|
| 2018 |
|
| 2019 |
|
| 2020 |
|
| 2021 |
|
| 2022 |
|
|
2023 |
|
| IBNR | Accident Year |
| ||||||||||||||
|
| (Unaudited 2014 - 2022) |
|
| (Unaudited) |
|
|
|
|
|
|
| ||||||||||||||||||||||||||||||||||||
|
|
|
|
|
|
|
|
|
|
|
|
|
|
|
|
|
|
|
|
|
|
|
|
|
|
|
|
|
|
|
|
|
|
|
|
| ||||||||||||
2014 |
| $ |
|
| $ |
|
| $ |
|
| $ |
|
| $ |
|
| $ |
|
| $ |
|
| $ |
|
| $ |
|
| $ |
|
| $ |
|
|
|
| ||||||||||||
2015 |
|
|
|
|
|
|
|
|
|
|
|
|
|
|
|
|
|
|
|
|
|
|
|
|
|
|
|
|
|
|
|
|
|
|
|
|
| |||||||||||
2016 |
|
|
|
|
|
|
|
|
|
|
|
|
|
|
|
|
|
|
|
|
|
|
|
|
|
|
|
|
|
|
|
|
|
|
|
|
|
| ||||||||||
2017 |
|
|
|
|
|
|
|
|
|
|
|
|
|
|
|
|
|
|
|
|
|
|
|
|
|
|
|
|
|
|
|
|
|
|
|
|
|
|
| |||||||||
2018 |
|
|
|
|
|
|
|
|
|
|
|
|
|
|
|
|
|
|
|
|
|
|
|
|
|
|
|
|
|
|
|
|
|
|
|
|
|
|
|
| ||||||||
2019 |
|
|
|
|
|
|
|
|
|
|
|
|
|
|
|
|
|
|
|
|
|
|
|
|
|
|
|
|
|
|
|
|
|
|
|
|
|
|
|
|
| |||||||
2020 |
|
|
|
|
|
|
|
|
|
|
|
|
|
|
|
|
|
|
|
|
|
|
|
|
|
|
|
|
|
|
|
|
|
|
|
|
|
|
|
|
|
| ||||||
2021 |
|
|
|
|
|
|
|
|
|
|
|
|
|
|
|
|
|
|
|
|
|
|
|
|
|
|
|
|
|
|
|
|
|
|
|
|
|
|
|
|
|
|
| |||||
2022 |
|
|
|
|
|
|
|
|
|
|
|
|
|
|
|
|
|
|
|
|
|
|
|
|
|
|
|
|
|
|
|
|
|
|
|
|
|
|
|
|
|
|
|
| ||||
2023 |
|
|
|
|
|
|
|
|
|
|
|
|
|
|
|
|
|
|
|
|
|
|
|
|
|
|
|
|
|
|
|
|
|
|
|
|
|
|
|
|
|
|
|
|
| |||
|
|
|
|
|
|
|
|
|
|
|
|
|
|
|
|
|
|
|
|
|
|
|
|
|
|
|
|
|
|
|
|
|
| Total |
|
| $ |
|
|
|
|
|
|
|
|
| ||
All Lines of Business |
|
|
|
|
|
|
|
|
|
|
|
|
|
|
|
|
| |||||||||||||||||||||||
(in thousands) |
|
|
|
|
|
|
|
|
|
|
|
|
|
|
|
|
|
|
| |||||||||||||||||||||
|
| Cumulative Paid Loss and Allocated Loss Adjustment Expenses, Net of Reinsurance |
| |||||||||||||||||||||||||||||||||||||
|
| For the Years Ended December 31, |
|
| Six Months Ended June 30, |
| ||||||||||||||||||||||||||||||||||
Accident Year |
| 2014 |
|
| 2015 |
|
| 2016 |
|
| 2017 |
|
| 2018 |
|
| 2019 |
|
| 2020 |
|
| 2021 |
|
| 2022 |
|
| 2023 |
| ||||||||||
|
| (Unaudited 2014 - 2022) |
|
| (Unaudited) |
| ||||||||||||||||||||||||||||||||||
|
|
|
|
|
|
|
|
|
|
|
|
|
|
|
|
|
|
|
|
|
|
|
|
|
|
|
|
|
|
| ||||||||||
2014 |
| $ |
|
| $ |
|
| $ |
|
| $ |
|
| $ |
|
| $ |
|
| $ |
|
| $ |
|
| $ |
|
| $ |
| ||||||||||
2015 |
|
|
|
|
|
|
|
|
|
|
|
|
|
|
|
|
|
|
|
|
|
|
|
|
|
|
|
|
|
|
| |||||||||
2016 |
|
|
|
|
|
|
|
|
|
|
|
|
|
|
|
|
|
|
|
|
|
|
|
|
|
|
|
|
|
|
|
| ||||||||
2017 |
|
|
|
|
|
|
|
|
|
|
|
|
|
|
|
|
|
|
|
|
|
|
|
|
|
|
|
|
|
|
|
|
| |||||||
2018 |
|
|
|
|
|
|
|
|
|
|
|
|
|
|
|
|
|
|
|
|
|
|
|
|
|
|
|
|
|
|
|
|
|
| ||||||
2019 |
|
|
|
|
|
|
|
|
|
|
|
|
|
|
|
|
|
|
|
|
|
|
|
|
|
|
|
|
|
|
|
|
|
|
| |||||
2020 |
|
|
|
|
|
|
|
|
|
|
|
|
|
|
|
|
|
|
|
|
|
|
|
|
|
|
|
|
|
|
|
|
|
|
|
| ||||
2021 |
|
|
|
|
|
|
|
|
|
|
|
|
|
|
|
|
|
|
|
|
|
|
|
|
|
|
|
|
|
|
|
|
|
|
|
|
| |||
2022 |
|
|
|
|
|
|
|
|
|
|
|
|
|
|
|
|
|
|
|
|
|
|
|
|
|
|
|
|
|
|
|
|
|
|
|
|
|
| ||
2023 |
|
|
|
|
|
|
|
|
|
|
|
|
|
|
|
|
|
|
|
|
|
|
|
|
|
|
|
|
|
|
|
|
|
|
|
|
|
|
| |
|
|
|
|
|
|
|
|
|
|
|
|
|
|
|
|
|
|
|
|
|
|
|
|
|
|
|
|
|
|
|
|
|
| Total |
|
| $ |
| ||
|
|
|
|
|
|
|
|
|
|
|
|
|
|
|
|
|
|
|
|
|
|
|
|
|
|
|
|
|
|
|
|
|
|
|
|
|
|
|
|
|
Net liability for unpaid loss and allocated loss adjustment expenses for the accident years presented | $ | |||||||||||||||||||||||||||||||||||||||
All outstanding liabilities before 2014, net of reinsurance | | |||||||||||||||||||||||||||||||||||||||
Liabilities for loss and allocated loss adjustment expenses, net of reinsurance | $ | | ||||||||||||||||||||||||||||||||||||||
|
|
|
|
|
|
|
|
|
|
|
|
|
|
|
|
|
|
|
|
|
|
|
|
|
|
|
|
|
|
|
|
|
|
|
|
|
|
|
|
|
(Components may not sum to totals due to rounding) | ||||||||||||||||||||||||||||||||||||||||
| 25 |
| Table of Contents |
Reported claim counts are measured on an occurrence or per event basis. A single claim occurrence could result in more than one loss type or claimant; however, the Company counts claims at the occurrence level as a single claim regardless of the number of claimants or claim features involved.
The reconciliation of the net incurred and paid loss development tables to the loss and LAE reserves in the consolidated balance sheet is as follows:
Reconciliation of the Disclosure of Incurred and Paid Loss Development | ||||
to the Liability for Loss and LAE Reserves | ||||
|
|
|
| |
|
| As of |
| |
(in thousands) |
| June 30, 2023 |
| |
Liabilities for allocated loss and loss adjustment expenses, net of reinsurance |
| $ |
| |
Total reinsurance recoverable on unpaid losses |
|
|
| |
Unallocated loss adjustment expenses |
|
|
| |
Total gross liability for loss and LAE reserves |
| $ |
| |
|
|
|
|
|
(Components may not sum to totals due to rounding) |
|
|
|
|
Reinsurance
Effective December 31, 2021, the Company entered into a quota share reinsurance treaty for its personal lines business, which primarily consists of homeowners’ and dwelling fire policies, covering the period from December 31, 2021 through January 1, 2023 (“2021/2023 Treaty”). Upon the expiration of the 2021/2023 Treaty on January 1, 2023, the Company entered into a new quota share reinsurance treaty for its personal lines business, covering the period from January 1, 2023 through January 1, 2024 (“2023/2024 Treaty”).
The Company’s excess of loss and catastrophe reinsurance treaties expired on June 30, 2023 and the Company entered into new excess of loss and catastrophe reinsurance treaties effective July 1, 2023.
| 26 |
| Table of Contents |
|
| Treaty Period |
| |||||||||||||||||
|
|
|
|
| 2023/2024 Treaty |
|
| 2021/2023 Treaty |
| |||||||||||
|
| January 2, |
|
| July 1, |
|
| January 1, |
|
| July 1, |
|
| December 31, |
| |||||
|
| 2024 |
|
| 2023 |
|
| 2023 |
|
| 2022 |
|
| 2021 |
| |||||
|
| to |
|
| to |
|
| to |
|
| to |
|
| to |
| |||||
|
| June 30, |
|
| January 1, |
|
| June 30, |
|
| January 1, |
|
| June 30, |
| |||||
Line of Business |
| 2024 |
|
| 2024 |
|
| 2023 |
|
| 2023 |
|
| 2022 |
| |||||
|
|
|
|
|
|
|
|
|
|
|
|
|
|
|
| |||||
Personal Lines: |
|
|
|
|
|
|
|
|
|
|
|
|
|
|
| |||||
Homeowners, dwelling fire and canine legal liability Quota share treaty: |
|
|
|
|
|
|
|
|
|
|
|
|
|
|
| |||||
Percent ceded (7) |
|
| (6 | ) |
|
| % |
|
| % |
|
| % |
|
| % | ||||
Risk retained on initial $1,000,000 of losses (5) (6) (7) |
| $ |
|
| $ |
|
| $ |
|
| $ |
|
| $ |
| |||||
Losses per occurrence subject to quota share reinsurance coverage |
|
| (6 | ) |
| $ |
|
| $ |
|
| $ |
|
| $ |
| ||||
|
|
|
|
|
|
|
|
|
|
|
|
|
|
|
|
|
|
|
|
|
Expiration date |
|
| (6 | ) |
|
|
|
|
|
|
|
| ||||||||
Excess of loss coverage and facultative facility coverage (1) (5) (6) |
| $ |
|
| $ |
|
| $ |
|
| $ |
|
| $ |
| |||||
|
|
|
|
|
|
|
|
|
|
| ||||||||||
|
| $ |
|
| $ |
|
| $ |
|
| $ |
|
| $ |
| |||||
Total reinsurance coverage per occurrence (5) (6) |
| $ |
|
| $ |
|
| $ |
|
| $ |
|
| $ |
| |||||
Losses per occurrence subject to reinsurance coverage |
| $ |
|
| $ |
|
| $ |
|
| $ |
|
| $ |
| |||||
Expiration date (6) |
|
|
|
|
|
|
|
|
|
| ||||||||||
|
|
|
|
|
|
|
|
|
|
|
|
|
|
|
|
|
|
|
|
|
Catastrophe Reinsurance: |
|
|
|
|
|
|
|
|
|
|
|
|
|
|
|
|
|
|
|
|
Initial loss subject to personal lines quota share treaty (6) |
| $ |
|
| $ |
|
| $ |
|
| $ |
|
| $ |
| |||||
Risk retained per catastrophe occurrence (6) (7) (8) |
| $ |
|
| $ |
|
| $ |
|
| $ |
|
| $ |
| |||||
Catastrophe loss coverage in excess of quota share coverage (2) (6) |
| $ |
|
| $ |
|
| $ |
|
| $ |
|
| $ |
| |||||
|
|
|
|
|
|
|
|
|
|
|
|
|
|
|
|
|
|
|
|
|
Reinstatement premium protection (3) (4) |
|
|
|
|
|
|
|
|
|
| ||||||||||
| (1) | For personal lines, includes the addition of an automatic facultative facility allowing KICO to obtain homeowners single risk coverage up to $ |
| (2) | Catastrophe coverage is limited on an annual basis to two times the per occurrence amounts. Duration of 168 consecutive hours for a catastrophe occurrence from windstorm, hail, tornado, hurricane and cyclone. |
| (3) | For the period December 31, 2021 through June 30, 2022, reinstatement premium protection for $ |
| (4) | For the period July 1, 2022 through June 30, 2023, reinstatement premium protection for $ |
| (5) | For the period January 1, 2022 through January 1, 2024, underlying excess of loss treaty provides 50% reinsurance coverage for losses of $400,000 in excess of $600,000. Reduces retention to $500,000 from $700,000 under the 2021/2023 Treaty and 2023/2024 Treaty. Excludes losses from named storms. |
| (6) | Personal lines quota share (homeowners, dwelling fire and canine liability) and underlying excess of loss reinsurance will expire on January 1, 2024; reinsurance coverage in effect from January 2, 2024 through June 30, 2024 is only for excess of loss and catastrophe reinsurance treaties. |
| (7) | |
| (8) | Plus losses in excess of catastrophe coverage |
| 27 |
| Table of Contents |
|
| Treaty Year |
| |||||
|
| July 1, 2022 |
|
| July 1, 2021 |
| ||
|
| to |
|
| to |
| ||
Line of Business |
| June 30, 2023 |
|
| June 30, 2022 |
| ||
|
|
|
|
|
|
| ||
Personal Lines: |
|
|
|
|
|
| ||
Personal Umbrella |
|
|
|
|
|
| ||
Quota share treaty: |
|
|
|
|
|
| ||
Percent ceded - first $1,000,000 of coverage |
|
| % |
|
| % | ||
Percent ceded - excess of $1,000,000 dollars of coverage |
|
| % |
|
| % | ||
Risk retained |
| $ |
|
| $ |
| ||
Total reinsurance coverage per occurrence |
| $ |
|
| $ |
| ||
Losses per occurrence subject to quota share reinsurance coverage |
| $ |
|
| $ |
| ||
Expiration date |
|
|
|
| ||||
|
|
|
|
|
|
|
|
|
Commercial Lines (1) |
|
|
|
|
|
|
|
|
| (1) | Coverage on all commercial lines policies expired in September 2020; reinsurance coverage is based on treaties in effect on the date of loss. |
The Company’s reinsurance program has been structured to enable the Company to grow its premium volume while maintaining regulatory capital and other financial ratios generally within or below the expected ranges used for regulatory oversight purposes. The reinsurance program also provides income as a result of ceding commissions earned pursuant to the quota share reinsurance contracts. The Company’s participation in reinsurance arrangements does not relieve the Company of its obligations to policyholders.
Ceding Commission Revenue
The Company earned ceding commission revenue under the 2023/2024 Treaty for the three months and six months ended June 30, 2023, and under the 2021/2023 Treaty for the three months and six months ended June 30, 2022, based on a fixed provisional commission rate at which provisional ceding commissions are earned. The Company earned ceding commission revenue under its expired quota share reinsurance agreements based on: (i) a fixed provisional commission rate at which provisional ceding commissions were earned, and (ii) a continuing sliding scale of commission rates and ultimate treaty year loss ratios on the policies reinsured under each of these agreements based upon which contingent ceding commissions are earned. The sliding scale includes minimum and maximum commission rates in relation to specified ultimate loss ratios. The commission rate and contingent ceding commissions earned increase when the estimated ultimate loss ratio decreases and, conversely, the commission rate and contingent ceding commissions earned decrease when the estimated ultimate loss ratio increases.
| 28 |
| Table of Contents |
Ceding commission revenue consists of the following:
|
| Three months ended |
|
| Six months ended |
| ||||||||||
|
| June 30, |
|
| June 30, |
| ||||||||||
|
| 2023 |
|
| 2022 |
|
| 2023 |
|
| 2022 |
| ||||
|
|
|
|
|
|
|
|
| ||||||||
Provisional ceding commissions earned |
| $ |
|
| $ |
|
| $ |
|
| $ |
| ||||
Contingent ceding commissions earned |
|
|
|
|
|
|
|
|
|
|
|
| ||||
|
| $ |
|
| $ |
|
| $ |
|
| $ |
| ||||
Provisional ceding commissions are settled monthly. Balances due from reinsurers for contingent ceding commissions on quota share treaties are settled periodically based on the Loss Ratio of each treaty year that ends on June 30, for the expired treaties that were subject to contingent commissions. As discussed above, the Loss Ratios from prior years’ treaties are subject to change as incurred losses from those periods develop, resulting in an increase or decrease in the commission rate and contingent ceding commissions earned. As of June 30, 2023 and December 31, 2022, net contingent ceding commissions payable to reinsurers under all treaties was approximately $
Expected Credit Losses – Uncollectible Reinsurance
The Company reviews reinsurance receivables which relate to both amounts already billed on ceded paid losses as well as ceded reserves that will be billed when losses are paid in the future. The Company has not recorded an allowance for uncollectible reinsurance as there is no perceived credit risk. The principal credit quality indicator used in the valuation of the allowance on reinsurance receivables is the financial strength rating of the reinsurer sourced from major rating agencies. Changes in the allowance are presented as a component of other underwriting expenses on the condensed consolidated statements of operations and comprehensive income (loss).
Note 7 – Debt
Federal Home Loan Bank
In July 2017, KICO became a member of, and invested in, the Federal Home Loan Bank of New York (“FHLBNY”). KICO is required to maintain an investment in capital stock of FHLBNY. Based on redemption provisions of FHLBNY, the stock has no quoted market value and is carried at cost. At its discretion, FHLBNY may declare dividends on the stock. Management reviews for impairment based on the ultimate recoverability of the cost basis in the stock. At June 30, 2023 and December 31, 2022, no impairment has been recognized. FHLBNY members have access to a variety of flexible, low cost funding through FHLBNY’s credit products, enabling members to customize advances, which are to be fully collateralized. Eligible collateral to pledge to FHLBNY includes residential and commercial mortgage-backed securities, along with U.S. Treasury and agency securities. See Note 3 – Investments for eligible collateral held in a designated custodian account available for future advances. Advances are limited to 5% of KICO’s net admitted assets as of the previous quarter and are due and payable within one year of borrowing. KICO is currently able to borrow on an overnight basis. If KICO has collateral, based on KICO’s net admitted assets, the maximum allowable advance as of June 30, 2023 and December 31, 2022 was approximately $
| 29 |
| Table of Contents |
Debt
Debt as of June 30, 2023 and December 31, 2022 consists of the following:
|
| June 30, |
|
| December 31, |
| ||
|
| 2023 |
|
| 2022 |
| ||
|
|
|
|
|
|
| ||
2022 Notes, net |
| $ |
|
| $ |
| ||
Equipment financing |
|
|
|
|
|
| ||
Balance at end of period |
| $ |
|
| $ |
| ||
Note and Warrant Exchange
On December 9, 2022, the Company entered into a Note and Warrant Exchange Agreement (the “Exchange Agreement”) with several holders (the “Exchanging Noteholders”) of the Company’s outstanding 5.50% Senior Notes due 2022 (the “2017 Notes”). On the date of the Exchange Agreement, the Exchanging Noteholders held 2017 Notes in the aggregate principal amount of $
2022 Notes
On December 15, 2022, the Company issued $
|
| June 30, |
|
| December 31, |
| ||
|
| 2023 |
|
| 2022 |
| ||
|
|
|
|
|
|
| ||
12.0% Senior Unsecured Notes |
| $ |
|
| $ |
| ||
Warrants |
|
| ( | ) |
|
| ( | ) |
Issuance costs |
|
| ( | ) |
|
| ( | ) |
2022 Notes, net |
| $ |
|
| $ |
| ||
The Company is required to make a mandatory redemption of the 2022 Notes on December 30, 2023, in an amount such that the aggregate principal amount of the 2022 Notes to be redeemed plus accrued and unpaid interest thereon shall be equal to the amount by which the maximum Ordinary Dividend Paying Capacity of KICO (as defined below) measured as of December 15, 2023 exceeds the Company’s Holding Company Expenses (as defined below) for the calendar year ended December 31, 2023. “Ordinary Dividend Paying Capacity” means the sum, as measured on December 15, 2023, of (i) the maximum allowable amount of dividends that KICO is permitted to pay without seeking any regulatory approval in accordance with New York insurance regulations based on its statutory annual and quarterly financial statements filed with the National Association of Insurance Commissioners as of and for the thirty-six (36) month period ended September 30, 2023 plus (ii) any dividends paid by KICO to the Company during the period beginning January 1, 2023 and ending September 30, 2023. “Holding Company Expenses” means the sum of (i) cash interest expense paid or to be paid during the calendar year ended December 31, 2023 on the 2022 Notes, intercompany loans and any other indebtedness of the holding company on a stand-alone basis and (ii) other cash operating expenses, including taxes, paid or to be paid by the holding company during the calendar year ended December 31, 2023. The amount of other operating expenses paid in cash in the preceding clause (ii) shall not exceed $
| 30 |
| Table of Contents |
The 2022 Notes are unsecured obligations of the Company and are not the obligations of or guaranteed by any of the Company’s subsidiaries. The 2022 Notes rank senior in right of payment to any of the Company’s existing and future indebtedness that is by its terms expressly subordinated or junior in right of payment to the 2022 Notes. The Notes rank equally in right of payment to all of the Company’s existing and future senior indebtedness, but are effectively subordinated to any secured indebtedness to the extent of the value of the collateral securing such secured indebtedness. In addition, the 2022 Notes are structurally subordinated to the indebtedness and other obligations of the Company’s subsidiaries.
The 2022 Notes are redeemable, at the Company’s option, in whole or in part, at any time or in part from time to time, upon not less than fifteen (15) nor more than sixty (60) days’ notice, at the following redemption prices (expressed as percentages of the principal amount thereof) if redeemed during the respective period set forth below, plus, in each case, accrued and unpaid interest, if any, to the date of redemption (subject to the right of holders of record on the relevant record date to receive interest due on the relevant interest payment date):
Period: |
| Percentage |
| |
|
|
|
| |
December 30, 2022 to December 29, 2023 |
|
| % | |
December 30, 2023 to September 29, 2024 |
|
| % | |
September 30, 2024 to December 29, 2024 |
|
| % | |
As of the end of each calendar quarter, commencing with the calendar quarter ending December 31, 2022, the Company is subject to a leverage maintenance test (“Leverage Maintenance Test”), which requires that the Total Consolidated Indebtedness (as defined below) of the Company not be greater than
| 31 |
| Table of Contents |
Equipment Financing
On October 27, 2022, KICO entered into a sale leaseback transaction, whereby KICO sold $8,096,824 of fixed assets to a bank. Under GAAP, the sale leaseback transaction is recorded as equipment financing (“Financing”). The provisions of the Financing require KICO to pay a monthly payment of principal and interest at the rate of
| · | At the end of the lease, KICO may purchase the fixed assets for a purchase price of $ |
|
|
|
| · | KICO may renew the lease for 16 months at the same rental rate, which totals $ |
A provision of the Financing requires KICO to pledge collateral for the lease obligation. As of June 30, 2023 and December 31, 2022, the amount of required collateral was approximately $
Future contractual payment obligations under the Financing as of June 30, 2023 are as follows:
For the Year |
|
|
| |
Ending |
|
|
| |
December 31, |
| Total |
| |
Remainder of 2023 |
| $ |
| |
2024 |
|
|
| |
2025 |
|
|
| |
2026 |
|
|
| |
2027 |
|
|
| |
|
|
|
| |
2027 purchase price |
|
|
| |
Total |
| $ |
| |
Note 8 – Stockholders’ Equity
Dividends Declared and Paid
Dividends declared and paid on Common Stock were $-
2014 Equity Participation Plan
Effective August 12, 2014, the Company adopted the 2014 Equity Participation Plan (the “2014 Plan”) pursuant to which a maximum of
| 32 |
| Table of Contents |
Stock Options
The results of operations for the three months ended June 30, 2023 and 2022 include stock-based compensation expense for stock options totaling approximately $-
No options were granted during the six months ended June 30, 2023 and 2022. The fair value of stock options at the grant date are estimated using the Black-Scholes option-pricing model. The Black-Scholes option - pricing model was developed for use in estimating the fair value of traded options, which have no vesting restrictions and are fully transferable. In addition, option valuation models require the input of highly subjective assumptions including the expected stock price volatility. Because the Company’s stock options have characteristics significantly different from those of traded options, and because changes in the subjective input assumptions can materially affect the fair value estimate, in management's opinion, the existing models do not necessarily provide a reliable single measure of the fair value of the Company’s stock options.
A summary of stock option activity under the Company’s 2014 Plan for the six months ended June 30, 2023 is as follows:
Stock Options |
| Number of Shares |
|
| Weighted Average Exercise Price per Share |
|
| Weighted Average Remaining Contractual Term |
|
| Aggregate Intrinsic Value |
| ||||
|
|
|
|
|
|
|
|
|
|
|
|
| ||||
Outstanding at January 1, 2023 |
|
|
|
| $ |
|
|
|
|
| $ | - |
| |||
|
|
|
|
|
|
|
|
|
|
|
|
|
|
|
|
|
Granted |
|
| - |
|
| $ |
|
|
| - |
|
| $ | - |
| |
Exercised |
|
| - |
|
| $ |
|
|
| - |
|
| $ | - |
| |
Expired/Forfeited |
|
| - |
|
| $ |
|
|
| - |
|
| $ | - |
| |
|
|
|
|
|
|
|
|
|
|
|
|
|
|
|
|
|
Outstanding at June 30, 2023 |
|
|
|
| $ |
|
|
|
|
| $ | - |
| |||
|
|
|
|
|
|
|
|
|
|
|
|
|
|
|
|
|
Vested and Exercisable at June 30, 2023 |
|
|
|
| $ |
|
|
|
|
| $ |
| ||||
The aggregate intrinsic value of options outstanding and options exercisable at June 30, 2023 is calculated as the difference between the exercise price of the underlying options and the market price of the Company’s Common Stock for the options that had exercise prices that were lower than the $
Participants in the 2014 Plan may exercise their outstanding vested options, in whole or in part, by having the Company reduce the number of shares otherwise issuable by a number of shares having a fair market value equal to the exercise price of the option being exercised, or by exchanging a number of shares owned for a period of greater than one year having a fair market value equal to the exercise price of the option being exercised.
| 33 |
| Table of Contents |
As of June 30, 2023, there were no unvested options.
As of June 30, 2023, there were
Restricted Stock Awards
A summary of the restricted Common Stock activity under the 2014 Plan for six months ended June 30, 2023 is as follows:
Restricted Stock Awards |
| Shares |
|
| Weighted Average Grant Date Fair Value per Share |
|
| Aggregate Fair Value |
| |||
|
|
|
|
|
|
|
|
|
| |||
Balance at January 1, 2023 |
|
|
|
| $ |
|
| $ |
| |||
|
|
|
|
|
|
|
|
|
|
|
|
|
Granted |
|
|
|
| $ |
|
| $ |
| |||
Vested |
|
| ( | ) |
| $ |
|
| $ | ( | ) | |
Forfeited |
|
| ( | ) |
| $ |
|
| $ | ( | ) | |
|
|
|
|
|
|
|
|
|
|
|
|
|
| Balance at June 30, 2023 |
|
|
|
| $ |
|
| $ |
| |||
Fair value was calculated using the closing price of the Company’s Common Stock on the grant date. For the three months ended June 30, 2023 and 2022, stock-based compensation for these grants was approximately $
Employee Stock Purchase Plan
On June 19, 2021, the Company’s Board of Directors adopted the Kingstone Companies, Inc. Employee Stock Purchase Plan (the “ESPP”), subject to stockholder approval. Such approval was obtained on August 10, 2021. The purpose of the ESPP is to provide eligible employees of the Company with an opportunity to use payroll deductions to purchase shares of Common Stock of the Company. The maximum number of shares of Common Stock that may be purchased under the ESPP is
The initial offering period under the ESPP was from November 1, 2021 through October 31, 2022 (“2021/2022 Offering”). There is currently no offering pursuant to the ESPP subsequent to October 31, 2022. For the three months and six months ended June 30, 2022, stock-based compensation under the 2021/2022 Offering was approximately $
At the end of the 2021/2022 Offering period,
Warrants
In connection with the Exchange Agreement (see Note 7 – Debt – “Note and Warrant Exchange”), as additional consideration, on December 15, 2022, the Company issued warrants to the Exchanging Noteholders to purchase
The warrants are exercisable through December 30, 2025 at an exercise price of $
As of June 30, 2023, all warrants for the purchase of an aggregate of
No warrants were granted during the six months ended June 30, 2023 and 2022.
Note 9 – Income Taxes
The Company files a consolidated U.S. federal income tax return that includes all wholly-owned subsidiaries. State tax returns are filed on a consolidated or separate return basis depending on applicable laws. The Company records adjustments related to prior years’ taxes during the period when they are identified, generally when the tax returns are filed. The effect of these adjustments on the current and prior periods (during which the differences originated) is evaluated based upon quantitative and qualitative factors and are considered in relation to the consolidated financial statements taken as a whole for the respective periods.
Deferred tax assets and liabilities are determined using the enacted tax rates applicable to the period the temporary differences are expected to be recovered. Accordingly, the current period income tax provision can be affected by the enactment of new tax rates. The net deferred income taxes on the balance sheets reflect temporary differences between the carrying amounts of the assets and liabilities for financial reporting purposes and income tax purposes, tax effected at various rates depending on whether the temporary differences are subject to federal taxes, state taxes, or both.
| 34 |
| Table of Contents |
Significant components of the Company’s deferred tax assets and liabilities are as follows:
|
| June 30, |
|
| December 31, |
| ||
|
| 2023 |
|
| 2022 |
| ||
|
|
|
|
|
|
| ||
Deferred tax asset: |
|
|
|
|
|
| ||
Net operating loss carryovers (1) |
| $ |
|
| $ |
| ||
Claims reserve discount |
|
|
|
|
|
| ||
Unearned premium |
|
|
|
|
|
| ||
Deferred ceding commission revenue |
|
|
|
|
|
| ||
Net unrealized losses on securities |
|
|
|
|
|
| ||
Other |
|
|
|
|
|
| ||
Total deferred tax assets |
|
|
|
|
|
| ||
|
|
|
|
|
|
|
|
|
Deferred tax liability: |
|
|
|
|
|
|
|
|
Investment in KICO (2) |
|
|
|
|
|
| ||
Deferred acquisition costs |
|
|
|
|
|
| ||
Intangibles |
|
|
|
|
|
| ||
Depreciation and amortization |
|
|
|
|
|
| ||
Total deferred tax liabilities |
|
|
|
|
|
| ||
|
|
|
|
|
|
|
|
|
Net deferred income tax asset |
| $ |
|
| $ |
| ||
| (1) | The deferred tax assets from net operating loss carryovers (“NOL”) are as follows: |
|
| June 30, |
|
| December 31, |
|
| ||||
Type of NOL |
| 2023 |
|
| 2022 |
|
| Expiration | |||
|
|
|
|
|
|
|
|
| |||
Federal only, NOL from 2021 - 2023 |
| $ |
|
| $ |
|
| None | |||
|
|
|
|
|
|
|
|
|
|
| |
State only (A) |
|
|
|
|
|
|
| ||||
Valuation allowance |
|
| ( | ) |
|
| ( | ) |
|
| |
State only, net of valuation allowance |
|
|
|
|
|
|
|
| |||
|
|
|
|
|
|
|
|
|
|
| |
Total deferred tax asset from net operating loss carryovers |
| $ |
|
| $ |
|
|
| |||
(A) Kingstone generates operating losses for state purposes and has prior year NOLs available. The state NOL as of June 30, 2023 and December 31, 2022 was approximately $
| 35 |
| Table of Contents |
(2) Deferred tax liability – Investment in KICO
On July 1, 2009, the Company completed the acquisition of 100% of the issued and outstanding common stock of KICO (formerly known as Commercial Mutual Insurance Company (“CMIC”)) pursuant to the conversion of CMIC from an advance premium cooperative to a stock property and casualty insurance company. Pursuant to the plan of conversion, the Company acquired a
In assessing the valuation of deferred tax assets, the Company considers whether it is more likely than not that some portion or all of the deferred tax assets will not be realized. The ultimate realization of deferred tax assets is dependent upon the generation of future taxable income during the periods in which those temporary differences become deductible. No valuation allowance against deferred tax assets has been established, except for NOL limitations, as the Company believes it is more likely than not the deferred tax assets will be realized based on the historical taxable income of KICO, or by offset to deferred tax liabilities.
The Company had no material unrecognized tax benefit and no adjustments to liabilities or operations were required. There were no interest or penalties related to income taxes that have been accrued or recognized as of and for the six months ended June 30, 2023 and 2022. If any had been recognized these would have been reported in income tax expense.
Generally, taxing authorities may examine the Company’s tax returns for the three years from the date of filing. The Company’s tax returns for the years ended December 31, 2019 through December 31, 2021 remain subject to examination.
Note 10 – Loss Per Common Share
Basic net loss per common share is computed by dividing net loss by the weighted-average number of shares of Common Stock outstanding. Diluted loss per common share reflects, in periods in which it has a dilutive effect, the impact of common shares issuable upon exercise of stock options and warrants as well as non-vested restricted stock awards. The computation of diluted loss per common share excludes those options and warrants with an exercise price in excess of the average market price of the Company’s Common Stock during the periods presented.
The computation of diluted loss per common share excludes outstanding options, warrants and non-vested restricted stock awards in periods where the exercise of such options and warrants or vesting of such restricted stock awards would be anti-dilutive. For the three months and six months ended June 30, 2023 and 2022, no options, warrants or restricted stock awards were included in the computation of diluted loss per common share as they would have been anti-dilutive for the relevant periods and, as a result, the weighted average number of shares of Common Stock used in the calculation of diluted loss per common share has not been adjusted for the effect of such options, warrants and non-vested restricted stock awards.
| 36 |
| Table of Contents |
The reconciliation of the weighted average number of shares of Common Stock used in the calculation of basic and diluted loss per common share follows:
|
| Three months ended |
|
| Six months ended |
| ||||||||||
|
| June 30, |
|
| June 30, |
| ||||||||||
|
| 2023 |
|
| 2022 |
|
| 2023 |
|
| 2022 |
| ||||
|
|
|
|
|
|
|
|
|
|
|
|
| ||||
Weighted average number of shares outstanding |
|
|
|
|
|
|
|
|
|
|
|
| ||||
|
|
|
|
|
|
|
|
|
|
|
|
|
|
|
|
|
Effect of dilutive securities, common share equivalents: |
|
|
|
|
|
|
|
|
|
|
|
|
|
|
|
|
Stock options |
|
|
|
|
|
|
|
|
|
|
|
| ||||
Warrants |
|
| - |
|
|
| - |
|
|
| - |
|
|
| - |
|
Restricted stock awards |
|
|
|
|
|
|
|
|
|
|
|
| ||||
|
|
|
|
|
|
|
|
|
|
|
|
|
|
|
|
|
Weighted average number of shares outstanding, used for computing diluted loss per share |
|
|
|
|
|
|
|
|
|
|
|
| ||||
Note 11 - Commitments and Contingencies
Litigation
From time to time, the Company is involved in various legal proceedings in the ordinary course of business. For example, to the extent a claim is asserted by a third party in a lawsuit against one of the Company’s insureds covered by a particular policy, the Company may have a duty to defend the insured party against the claim. These claims may relate to bodily injury, property damage or other compensable injuries as set forth in the policy. Such proceedings are considered in estimating the liability for loss and LAE expenses.
Office Lease
The Company enters into lease agreements for real estate that is primarily used for office space in the ordinary course of business. These leases are accounted for as operating leases, whereby lease expense is recognized on a straight-line basis over the term of the lease.
The Company is a party to a non-cancellable operating lease, dated March 27, 2015, for its office facility for KICO located in Valley Stream, New York expiring March 31, 2024.
On July 8, 2019, the Company entered into a lease agreement for an additional office facility for Cosi located in Valley Stream, New York under a non-cancelable operating lease. The lease had a term of seven years and two months expiring December 31, 2026. During January 2022, pursuant to a mutual agreement with the landlord at a cost of $
| 37 |
| Table of Contents |
Additional information regarding the Company’s office operating leases is as follows:
| (1) | KICO rent expense is included in the condensed consolidated statements of operations and comprehensive income (loss) within other underwriting expenses. |
| (2) | Cosi rent expense is included in the condensed consolidated statements of operations and comprehensive income (loss) within other operating expenses. |
The following table presents the contractual maturities of the Company’s lease liabilities as of June 30, 2023:
|
| Three months ended |
|
| Six months ended |
| ||||||||||
|
| June 30, |
|
| June 30, |
| ||||||||||
Lease cost |
| 2023 |
|
| 2022 |
|
| 2023 |
|
| 2022 |
| ||||
|
|
|
|
|
|
|
|
|
|
|
|
| ||||
Operating lease (1) (2) |
| $ |
|
| $ |
|
| $ |
|
| $ |
| ||||
Total lease cost (1) (2) |
| $ |
|
| $ |
|
| $ |
|
| $ |
| ||||
|
|
|
|
|
|
|
|
|
|
|
|
|
|
|
|
|
Other information on operating leases |
|
|
|
|
|
|
|
|
|
|
|
|
|
|
|
|
Cash payments included in the measurement of lease liability reported in operating cash flows |
| $ |
|
| $ |
|
| $ |
|
| $ |
| ||||
Discount rate |
|
| % |
|
| % |
|
| % |
|
| % | ||||
Remaining lease term in years |
|
|
|
|
|
|
|
|
|
|
|
| ||||
| (1) | The operating lease liability is recorded in accounts payable, accrued expenses and other liabilities in the accompanying condensed consolidated balance sheets. |
The following table presents the contractual maturities of the Company’s lease liabilities as of June 30, 2023:
For the Six Months |
|
|
| |
Ending |
|
|
| |
June 30, |
| Total |
| |
Remainder of 2023 |
| $ |
| |
2024 |
|
|
| |
Total undiscounted lease payments |
|
|
| |
Less: present value adjustment |
|
|
| |
Operating lease liability (1) |
| $ |
| |
| (1) | The operating lease liability is recorded in accounts payable, accrued expenses and other liabilities in the accompanying condensed consolidated balance sheets. |
Rent expense for the three months ended June 30, 2023 and 2022 amounted to $
| 38 |
| Table of Contents |
Employment Agreements
Barry Goldstein, President, Chief Executive Officer and Executive Chairman of the Board
Employment Agreement effective as of January 1, 2020
On October 14, 2019, the Company and Barry B. Goldstein, the Company’s President, Chief Executive Officer and Executive Chairman of the Board, entered into a Second Amended and Restated Employment Agreement (the “Second Amended Goldstein Employment Agreement”). The Second Amended Goldstein Employment Agreement became effective as of January 1, 2020 and expired on December 31, 2022. The Second Amended Goldstein Employment Agreement extended the expiration date of the employment agreement in effect for Mr. Goldstein from December 31, 2021 to December 31, 2022.
Pursuant to the Second Amended Goldstein Employment Agreement, Mr. Goldstein was entitled to receive an annual base salary of $
Pursuant to the Second Amended Goldstein Employment Agreement, in January 2020, Mr. Goldstein received a grant of
| 39 |
| Table of Contents |
Employment Agreement effective as of January 1, 2023
On June 27, 2022, the Company and Mr. Goldstein entered into a third amended and restated employment agreement which took effect as of January 1, 2023, and expires on December 31, 2024 (the “Third Amended Goldstein Employment Agreement”).
Pursuant to the Third Amended Goldstein Employment Agreement, Mr. Goldstein is entitled to receive an annual base salary of $
See Note 13 – Subsequent Events-Management Succession.
Meryl Golden, Chief Operating Officer
Employment Agreement effective as of January 1, 2021
On September 16, 2019, the Company and Meryl Golden entered into an employment agreement (the “Golden Employment Agreement”) pursuant to which Ms. Golden serves as the Company’s Chief Operating Officer. Ms. Golden also serves as KICO’s President and Chief Operating Officer. The Golden Employment Agreement became effective as of September 25, 2019 (amended on December 24, 2020) and expired on December 31, 2022.
Pursuant to the Golden Employment Agreement, Ms. Golden was entitled to receive an annual salary of $
| 40 |
| Table of Contents |
Employment Agreement effective as of January 1, 2023
On June 27, 2022, the Company and Ms. Golden entered into a second amended and restated employment agreement which took effect as of January 1, 2023, and expires on December 31, 2024 (the “Second Amended Golden Employment Agreement”).
Pursuant to the Second Amended Golden Employment Agreement, Ms. Golden is entitled to receive an annual base salary of $500,000 and an annual bonus equal to 3% of the Company’s consolidated income from operations before taxes, exclusive of the Company’s consolidated net investment income (loss), net unrealized gains (losses) on equity securities and net realized gains (losses) on investments, up to a maximum of 1.25 times her base salary. In addition, pursuant to the Second Amended Golden Employment Agreement, Ms. Golden is entitled to receive a grant, under the terms of the 2014 Plan, during each of January 2023 and January 2024, under certain circumstances, of a number of shares of restricted stock determined by dividing $
See Note 13 – Subsequent Events-Management Succession.
Note 12 – Employee Benefit Plans
Employee Bonus Plan
For the six months ended June 30, 2023 and 2022 the Company did not accrue for, or pay, bonuses related to an employee bonus plan.
401(k) Plan
The Company maintains a salary reduction plan under Section 401(k) of the Internal Revenue Code (the “401(k) Plan”) for its qualified employees. The Company matches 100% of each participant’s contribution up to
| 41 |
| Table of Contents |
Deferred Compensation Plan
On June 18, 2018, the Company adopted the Kingstone Companies, Inc. Deferred Compensation Plan (the "Deferred Compensation Plan"). Effective December 22, 2022, the Company terminated the Deferred Compensation Plan. The assets of the Deferred Compensation Plan will be liquidated by making payments to Participants in full satisfaction of their interest in the Deferred Compensation Plan (“Termination Payments”), which Termination Payments will be made no earlier than December 22, 2023 and will be completed no later than December 22, 2024.
The deferred compensation liability as of June 30, 2023 and December 31, 2022 amounted to $
Note 13 – Subsequent Events
The Company has evaluated events that occurred subsequent to June 30, 2023 through the date these condensed consolidated financial statements were issued for matters that required disclosure or adjustment in these condensed consolidated financial statements.
Reinsurance
Effective July 1, 2023, the Company entered into new excess of loss and catastrophe reinsurance treaties (see Note 6 – Property and Casualty Insurance Activity - “Reinsurance”).
A.M. Best
On July 6, 2023, A.M. Best withdrew KICO’s ratings as KICO requested to no longer participate in A.M. Best’s interactive rating process.
Equity Participation Plan
On August 9, 2023, the Company’s stockholders approved an amendment to the 2014 Plan to increase the maximum number of shares of Common Stock of the Company that are authorized to be issued pursuant to the 2014 Plan to
Management Succession
On August 9, 2023, the Company announced that, effective as of October 1, 2023, Meryl Golden, the Company’s Chief Operating Officer, has been appointed to the position of President and Chief Executive Officer of the Company to succeed Barry Goldstein and that Mr. Goldstein will continue as the Chairman of the Board of the Company.
The foregoing description of the management succession does not purport to be complete and is qualified in its entirety by reference to the full texts of Amendment No. 1 to the Third Amended and Restated Employment Agreement, dated June 27, 2022, between the Company and Mr. Goldstein, and Amendment No. 2 to the Third Amended and Restated Employment Agreement, dated June 27, 2022 between KICO and Mr. Goldstein, which are filed herewith as Exhibits 10(a) and 10(b), respectively.
| 42 |
| Table of Contents |
ITEM 2. MANAGEMENT’S DISCUSSION AND ANALYSIS OF FINANCIAL CONDITION AND RESULTS OF OPERATIONS.
We offer property and casualty insurance products through our wholly owned subsidiary, Kingstone Insurance Company (“KICO”). KICO’s insureds are located primarily in downstate New York, consisting of New York City, Long Island and Westchester County, although we are writing business in New Jersey, Rhode Island, Connecticut and Massachusetts. We are licensed in the States of New York, New Jersey, Rhode Island, Connecticut, Massachusetts, Pennsylvania, Maine, and New Hampshire. For the three months and six months ended June 30, 2023, respectively, 88.6% and 87.8% of KICO’s direct written premiums came from the New York policies.
In addition, our subsidiary, Cosi Agency, Inc. (“Cosi”), a multi-state licensed general agency, receives commission revenue from KICO for the policies it places with others and pays commissions to these agencies. Cosi retains the profit between the commission revenue received and the commission expense paid (“Net Cosi Revenue”). Commission expense is reduced by Net Cosi Revenue. Cosi-related operating expenses are minimal and are included in other operating expenses. Cosi-related operating expenses are not included in our stand-alone insurance underwriting business and, accordingly, Cosi’s expenses are not included in the calculation of our combined ratio as described below.
We derive substantially all of our revenue from KICO, which includes revenues from earned premiums, ceding commissions from quota share reinsurance, net investment income generated from its portfolio, and net realized gains and losses on investment securities. All of KICO’s insurance policies are written for a one-year term. Earned premiums represent premiums received from insureds, which are recognized as revenue over the period of time that insurance coverage is provided (i.e., ratably over the one-year life of the policy). A significant period of time can elapse from the receipt of insurance premiums to the payment of insurance claims. During this time, KICO invests the premiums, earns investment income and generates net realized and unrealized investment gains and losses on investments. Our holding company earns investment income from its cash holdings.
Our expenses include the insurance underwriting expenses of KICO and other operating expenses. Insurance companies incur a significant amount of their total expenses from losses incurred by policyholders, which are referred to as claims. In settling these claims, various loss adjustment expenses (“LAE”) are incurred such as insurance adjusters’ fees and legal expenses. In addition, insurance companies incur policy acquisition costs. Policy acquisition costs include commissions paid to producers, premium taxes, and other expenses related to the underwriting process, including employees’ compensation and benefits.
Other operating expenses include our corporate expenses as a holding company. These corporate expenses include legal and auditing fees, executive employment costs, and other costs directly associated with being a public company.
Product Lines
Our product lines include the following:
Personal lines: Our largest line of business is personal lines, consisting of homeowners, dwelling fire, cooperative/condominium, renters, and personal umbrella policies.
Commercial liability: Through July 2019, we offered businessowners policies, which consist primarily of small business retail, service, and office risks, with limited property exposures. We also wrote artisan’s liability policies for small independent contractors with smaller sized workforces. In addition, we wrote special multi-peril policies for larger and more specialized businessowners risks, including those with limited residential exposures. Further, we offered commercial umbrella policies written above our supporting commercial lines policies.
| 43 |
| Table of Contents |
In May 2019, due to the poor performance of this line we placed a moratorium on new commercial lines and new commercial umbrella submissions while we further reviewed this business. In July 2019, due to the continuing poor performance of these lines, we made the decision to no longer underwrite commercial lines or commercial umbrella risks. In-force policies as of July 31, 2019 for these lines were non-renewed at the end of their annual terms. As of June 30, 2023 and December 31, 2022, there were no commercial liability policies in-force. As of June 30, 2023 and December 31, 2022, these expired policies represent approximately 16.3% and 17.9%, respectively, of loss and LAE reserves net of reinsurance recoverables. See discussion below under “Additional Financial Information”.
Livery physical damage: We write for-hire vehicle physical damage only policies for livery and car service vehicles and taxicabs. These policies insure only the physical damage portion of insurance for such vehicles, with no liability coverage included.
Other: We write canine legal liability policies and have a small participation in mandatory state joint underwriting associations.
Key Measures
We utilize the following key measures in analyzing the results of our insurance underwriting business:
Net loss ratio: The net loss ratio is a measure of the underwriting profitability of an insurance company’s business. Expressed as a percentage, this is the ratio of net losses and LAE incurred to net premiums earned.
Net underwriting expense ratio: The net underwriting expense ratio is a measure of an insurance company’s operational efficiency in administering its business. Expressed as a percentage, this is the ratio of the sum of acquisition costs (the most significant being commissions paid to our producers) and other underwriting expenses less ceding commission revenue less other income to net premiums earned.
Net combined ratio: The net combined ratio is a measure of an insurance company’s overall underwriting profit. This is the sum of the net loss and net underwriting expense ratios. If the net combined ratio is at or above 100 percent, an insurance company cannot be profitable without investment income, and may not be profitable if investment income is insufficient.
Underwriting income: Underwriting income is net pre-tax income attributable to our insurance underwriting business before investment activity. It excludes net investment income, net realized gains from investments, and depreciation and amortization (net premiums earned less expenses included in combined ratio). Underwriting income is a measure of an insurance company’s overall operating profitability before items such as investment income, depreciation and amortization, interest expense and income taxes.
| 44 |
| Table of Contents |
Critical Accounting Policies and Estimates
Our condensed consolidated financial statements include the accounts of Kingstone Companies, Inc. and all majority-owned and controlled subsidiaries. The preparation of financial statements in conformity with GAAP requires our management to make estimates and assumptions in certain circumstances that affect amounts reported in our condensed consolidated financial statements and related notes. In preparing these condensed consolidated financial statements, our management has utilized information including our past history, industry standards, and the current economic environment, and other factors, in forming its estimates and judgments of certain amounts included in the condensed consolidated financial statements, giving due consideration to materiality. It is possible that the ultimate outcome as anticipated by our management in formulating its estimates in these financial statements may not materialize. Application of the critical accounting policies involves the exercise of judgment and use of assumptions as to future uncertainties and, as a result, actual results could differ from these estimates. In addition, other companies may utilize different estimates, which may impact comparability of our results of operations to those of similar companies. See the Critical Accounting Policies and Estimates section within Item 7 “Management’s Discussion and Analysis of Financial Condition and Results of Operations” of our Annual Report on Form 10-K for the year ended December 31, 2022 for further information.
We believe that the most critical accounting policies relate to the reporting of reserves for loss and LAE, including losses that have occurred but have not been reported prior to the reporting date, amounts recoverable from third party reinsurers, deferred income taxes, allowance for credit losses of investment securities, and the valuation of warrants. See Note 2 to the consolidated financial statements in our Annual Report on Form 10-K for the year ended December 31, 2022 and Note 2 of the condensed consolidated financial statements included in this Quarterly Report for accounting policies regarding the adoption of ASU 2016-13 effective January 1, 2023.
Kingstone 2.0 (completed) and Kingstone 3.0 (underway)
Beginning in the fourth quarter of 2019, a series of strategic initiatives, coined “Kingstone 2.0” were commenced to modernize our Company. The pillars of the new strategy were as follows:
| 1. | Strengthen the management team by adding highly qualified professionals with deep domain experience and diverse backgrounds; |
|
|
|
| 2. | Reduce expenses and increase efficiency by embracing technology including converting to a new policy management system, retiring multiple legacy systems and starting up a new claims system, among other technology initiatives; |
|
|
|
| 3. | Develop and implement a new, more highly segmented product suite (Kingstone Select) which better matches rate to risk using advanced analytics and an abundance of data; and |
|
|
|
| 4. | Better manage the Company’s catastrophe exposure in order to reduce loss cost and the growth rate of our Probable Maximum Loss (“PML”) in order to mitigate the impact of the emerging “hard market” in catastrophe reinsurance. |
We announced the substantive completion of Kingstone 2.0 in late 2022 and embarked on a new strategy to optimize our in-force business, which we coined as “Kingstone 3.0”. The four pillars of this new strategy entail:
| 1. | Aggressively reducing the book of business in non-New York states, which has had a disproportionately negative impact on underwriting results, by slowing new business, re-underwriting the book, culling the agent base, reducing commissions, or other means, subject to regulatory constraints; |
|
|
|
| 2. | Adjusting pricing to stay ahead of loss trends, including inflation, by filing the maximum annual rate change that can be supported in each state and product and ensuring all policyholders are insured to value; |
|
|
|
| 3. | Tightly managing reinsurance requirements and costs, using risk selection and other underwriting capabilities to manage the growth rate of our PML; and |
|
|
|
| 4. | Continuing expense reduction focus with a goal of reducing the net expense ratio to 33% by year-end 2024. |
We believe that the actions taken will have the intended effect and will result in a return to profitability for the Company.
Consolidated Results of Operations
Six Months Ended June 30, 2023 Compared to Six Months Ended June 30, 2022
| 45 |
| Table of Contents |
The following table summarizes the changes in the results of our operations (in thousands) for the periods indicated:
|
| Six months ended June 30, |
| |||||||||||||
($ in thousands) |
| 2023 |
|
| 2022 |
|
| Change |
|
| Percent |
| ||||
Revenues |
|
|
|
|
|
|
|
|
|
|
|
| ||||
Direct written premiums |
| $ | 95,244 |
|
| $ | 92,762 |
|
| $ | 2,482 |
|
|
| 2.7 | % |
Assumed written premiums |
|
| - |
|
|
| - |
|
|
| - |
|
| na | % | |
|
|
| 95,244 |
|
|
| 92,762 |
|
|
| 2,482 |
|
|
| 2.7 | % |
Ceded written premiums |
|
|
|
|
|
|
|
|
|
|
|
|
|
|
|
|
Ceded to quota share treaties (1) |
|
| 26,622 |
|
|
| 21,949 |
|
|
| 4,673 |
|
|
| 21.3 | % |
Ceded to excess of loss treaties |
|
| 2,135 |
|
|
| 1,743 |
|
|
| 392 |
|
|
| 22.5 | % |
Ceded to catastrophe treaties |
|
| 13,936 |
|
|
| 14,126 |
|
|
| (190 | ) |
|
| (1.3 | )% |
Total ceded written premiums |
|
| 42,693 |
|
|
| 37,818 |
|
|
| 4,875 |
|
|
| 12.9 | % |
|
|
|
|
|
|
|
|
|
|
|
|
|
|
|
|
|
Net written premiums |
|
| 52,551 |
|
|
| 54,944 |
|
|
| (2,393 | ) |
|
| (4.4 | )% |
|
|
|
|
|
|
|
|
|
|
|
|
|
|
|
|
|
Change in unearned premiums |
|
|
|
|
|
|
|
|
|
|
|
|
|
|
|
|
Direct and assumed |
|
| 5,578 |
|
|
| (393 | ) |
|
| 5,971 |
|
| na | % | |
Ceded to quota share treaties (1) |
|
| (366 | ) |
|
| 25 |
|
|
| (391 | ) |
| na | % | |
Change in net unearned premiums |
|
| 5,212 |
|
|
| (368 | ) |
|
| 5,580 |
|
| na | % | |
|
|
|
|
|
|
|
|
|
|
|
|
|
|
|
|
|
Premiums earned |
|
|
|
|
|
|
|
|
|
|
|
|
|
|
|
|
Direct and assumed |
|
| 100,822 |
|
|
| 92,369 |
|
|
| 8,453 |
|
|
| 9.2 | % |
Ceded to reinsurance treaties |
|
| (43,059 | ) |
|
| (37,794 | ) |
|
| (5,265 | ) |
|
| (13.9 | )% |
Net premiums earned |
|
| 57,763 |
|
|
| 54,575 |
|
|
| 3,188 |
|
|
| 5.8 | % |
|
|
|
|
|
|
|
|
|
|
|
|
|
|
|
|
|
Ceding commission revenue (1) |
|
| 10,858 |
|
|
| 9,397 |
|
|
| 1,461 |
|
|
| 15.5 | % |
Net investment income |
|
| 2,993 |
|
|
| 1,993 |
|
|
| 1,000 |
|
|
| 50.2 | % |
Net gains (losses) on investments |
|
| 1,422 |
|
|
| (8,916 | ) |
|
| 10,338 |
|
| na | % | |
Other income |
|
| 312 |
|
|
| 480 |
|
|
| (168 | ) |
|
| (35.0 | )% |
Total revenues |
|
| 73,348 |
|
|
| 57,530 |
|
|
| 15,819 |
|
|
| 27.5 | % |
Expenses |
|
|
|
|
|
|
|
|
|
|
|
|
|
|
|
|
Loss and loss adjustment expenses |
|
|
|
|
|
|
|
|
|
|
|
|
|
|
|
|
Direct and assumed: |
|
|
|
|
|
|
|
|
|
|
|
|
|
|
|
|
Loss and loss adjustment expenses excluding the effect of catastrophes |
|
| 60,256 |
|
|
| 52,832 |
|
|
| 7,424 |
|
|
| 14.1 | % |
Losses from catastrophes (2) |
|
| 7,875 |
|
|
| 7,032 |
|
|
| 843 |
|
|
| 12.0 | % |
Total direct and assumed loss and loss adjustment expenses |
|
| 68,131 |
|
|
| 59,864 |
|
|
| 8,267 |
|
|
| 13.8 | % |
|
|
|
|
|
|
|
|
|
|
|
|
|
|
|
|
|
Ceded loss and loss adjustment expenses: |
|
|
|
|
|
|
|
|
|
|
|
|
|
|
|
|
Loss and loss adjustment expenses excluding the effect of catastrophes |
|
| 20,761 |
|
|
| 14,367 |
|
|
| 6,394 |
|
|
| 44.5 | % |
Losses from catastrophes (2) |
|
| 2,749 |
|
|
| 3,901 |
|
|
| (1,152 | ) |
|
| (29.5 | )% |
Total ceded loss and loss adjustment expenses |
|
| 23,510 |
|
|
| 18,268 |
|
|
| 5,242 |
|
|
| 28.7 | % |
|
|
|
|
|
|
|
|
|
|
|
|
|
|
|
|
|
Net loss and loss adjustment expenses: |
|
|
|
|
|
|
|
|
|
|
|
|
|
|
|
|
Loss and loss adjustment expenses excluding the effect of catastrophes |
|
| 39,494 |
|
|
| 38,465 |
|
|
| 1,029 |
|
|
| 2.7 | % |
Losses from catastrophes (2) |
|
| 5,126 |
|
|
| 3,132 |
|
|
| 1,994 |
|
|
| 63.7 | % |
Net loss and loss adjustment expenses |
|
| 44,620 |
|
|
| 41,597 |
|
|
| 3,023 |
|
|
| 7.3 | % |
|
|
|
|
|
|
|
|
|
|
|
|
|
|
|
|
|
Commission expense |
|
| 17,011 |
|
|
| 16,832 |
|
|
| 179 |
|
|
| 1.1 | % |
Other underwriting expenses |
|
| 13,555 |
|
|
| 13,441 |
|
|
| 114 |
|
|
| 0.8 | % |
Other operating expenses |
|
| 1,426 |
|
|
| 1,548 |
|
|
| (122 | ) |
|
| (7.9 | )% |
Depreciation and amortization |
|
| 1,587 |
|
|
| 1,647 |
|
|
| (60 | ) |
|
| (3.6 | )% |
Interest expense |
|
| 2,016 |
|
|
| 913 |
|
|
| 1,103 |
|
|
| 120.8 | % |
Total expenses |
|
| 80,215 |
|
|
| 75,978 |
|
|
| 4,237 |
|
|
| 5.6 | % |
|
|
|
|
|
|
|
|
|
|
|
|
|
|
|
|
|
Loss before taxes |
|
| (6,867 | ) |
|
| (18,448 | ) |
|
| 11,581 |
|
|
| 62.8 | % |
Income tax benefit |
|
| (1,290 | ) |
|
| (3,871 | ) |
|
| 2,581 |
|
|
| 66.7 | % |
Net loss |
| $ | (5,577 | ) |
| $ | (14,577 | ) |
| $ | 9,000 |
|
|
| 61.7 | % |
|
|
|
|
|
|
|
|
|
|
|
|
|
|
|
|
|
(Columns in the table above may not sum to totals due to rounding) | ||||||||||||||||
| (1) | Effective December 31, 2021, we entered into a 30% personal lines quota share treaty. |
|
|
|
| (2) | The six months ended June 30, 2023 and 2022 include catastrophe losses, which are defined as losses from an event for which a catastrophe bulletin and related serial number has been issued by the Property Claims Services (PCS) unit of the Insurance Services Office (ISO). PCS catastrophe bulletins are issued for events that cause more than $25 million in total insured losses and affect a significant number of policyholders and insurers. |
| 46 |
| Table of Contents |
|
| Six months ended June 30, |
| |||||||||||||
|
| 2023 |
|
| 2022 |
|
| Percentage Point Change |
|
| Percent Change |
| ||||
|
|
|
|
|
|
|
|
|
|
|
|
| ||||
Key ratios: |
|
|
|
|
|
|
|
|
|
|
|
| ||||
Net loss ratio |
|
| 77.2 | % |
|
| 76.2 | % |
|
| 1.0 |
|
|
| 1.3 | % |
Net underwriting expense ratio |
|
| 33.6 | % |
|
| 37.4 | % |
|
| (3.8 | ) |
|
| (10.2 | )% |
Net combined ratio |
|
| 110.8 | % |
|
| 113.6 | % |
|
| (2.8 | ) |
|
| (2.5 | )% |
Direct Written Premiums
Direct written premiums during the six months ended June 30, 2023 (“Six Months 2023”) were $95,244,000 compared to $92,762,000 during the six months ended June 30, 2022 (“Six Months 2022”). The increase of $2,482,000, or 2.7%, was primarily due to an increase in premiums from our personal lines business.
Direct written premiums from our personal lines business for Six Months 2023 were $88,182,000, an increase of $1,227,000, or 1.4%, from $86,955,000 in Six Months 2022. The 1.4% increase in premiums from our personal lines business was primarily due to rate increases offset by the decrease in premiums associated with a 8.6% decrease in policies in force as of June 30, 2023 compared to June 30, 2022. The rate increases achieved along with a decrease in policies in force is in accordance with both our Kingstone 2.0 and Kingstone 3.0 strategic plans.
Direct written premiums from our livery physical damage business for Six Months 2023 were $7,016,000, an increase of $1,289,000, or 22.5%, from $5,727,000 in Six Months 2022. The increase in livery physical damage direct written premiums was due to an increasing number of policies and an increase in the values of the autos insured.
Beginning in 2017, we started writing personal lines policies in New Jersey. Through 2019 we expanded to Rhode Island, Massachusetts and Connecticut. We refer to our New York business as our “Core” business and the business outside of New York as our “non-New York” business. Direct written premiums from our Core business were $83,639,000 in Six Months 2023 compared to $74,382,000 in Six Months 2022, an increase of $9,257,000, or 12.4%. Policies in force from our Core business decreased by 1.6% in Six Months 2023 compared to Six Months 2022. Direct written premiums from our non-New York business were $11,605,000 in Six Months 2023 down from $18,380,000 in Six Months 2022, a decrease of $6,775,000, or 36.9%. Policies in force from our non-New York business decreased by 27% in Six Months 2023 compared to Six Months 2022. The increase in our Core business and the decrease in our non-New Yok business is consistent with a key pillar of our Kingstone 3.0 strategy to reduce our non-New York business due to profitability concerns.
| 47 |
| Table of Contents |
Net Written Premiums and Net Premiums Earned
Effective December 31, 2021, we entered into a quota share reinsurance treaty for our personal lines business covering the period from December 31, 2021 through January 1, 2023 (“2021/2023 Treaty”). Upon the expiration of the 2021/2023 Treaty on January 1, 2023, we entered into a new quota share reinsurance treaty for our personal lines business, covering the period from January 1, 2023 through January 1, 2024 (“2023/2024 Treaty”). Net written premiums decreased $2,393,000, or 4.4%, to $52,551,000 in Six Months 2023 from $54,944,000 in Six Months 2022. Net written premiums include direct premiums, less the amount of written premiums ceded under our reinsurance treaties (quota share, excess of loss, and catastrophe). In Six Months 2023, our premiums ceded under quota share treaties increased by $4,673,000 in comparison to ceded premiums in Six Months 2022 (see table above). The increase in Six Months 2023 was attributable to the runoff of an 8.5% portion of the 30% 2021/2023 Treaty. The remainder of the 2021/2023 Treaty was on a cutoff basis and the new 2023/2024 Treaty was placed for 30% on January 1, 2023. Our personal lines business was subject to the 2023/2024 Treaty in Six Months 2023, and the 2021-2023 Treaty in Six Months 2022.
Excess of loss reinsurance treaties
An increase in written premiums will increase the premiums ceded under our excess of loss treaties. In Six Months 2023, our ceded excess of loss reinsurance premiums increased by $392,000 over the comparable ceded premiums for Six Months 2022. The increase was due to an increase in subject premiums and the heightened cost of coverage obtained. Effective January 1, 2022, we entered into an underlying excess of loss reinsurance treaty covering the period from January 1, 2022 through January 1, 2023. The treaty provides 50% reinsurance coverage for losses of $400,000 in excess of $600,000. Losses from named storms are excluded from the treaty. Effective January 1, 2023, the Underlying XOL Treaty was renewed covering the period from January 1, 2023 through January 1, 2024.
Catastrophe reinsurance treaties
Most of the premiums written under our personal lines policies are also subject to our catastrophe treaties. An increase in our personal lines business gives rise to more property exposure, which increases our exposure to catastrophe risk; therefore, our premiums ceded under catastrophe treaties will increase. An increase in our personal lines business results in an increase in premiums ceded under our catastrophe treaties if reinsurance rates are stable or are increasing. In accordance with our Kingstone 2.0 and Kingstone 3.0 goals, we have reduced our PML, and in the Six Months 2023, our premiums ceded under catastrophe treaties decreased by $190,000 as compared to the comparable ceded premiums in Six Months 2022, in spite of a large catastrophe reinsurance rate increase on our book effective July 1, 2022.
Net premiums earned
Net premiums earned increased $3,188,000, or 5.8%, to $57,763,000 in Six Months 2023 from $54,575,000 in Six Months 2022. The increase was due in part to the 2.7% increase in direct written premiums during Six Months 2023, but also from the increased premiums written in prior periods due to rate increases and increased replacement costs. The run-off of a portion of the 2021-2023 Treaty increased the premiums ceded and reduced the growth of net premiums earned.
| 48 |
| Table of Contents |
Ceding Commission Revenue
The following table summarizes the changes in the components of ceding commission revenue (in thousands) for the periods indicated:
|
| Six months ended June 30, |
| |||||||||||||
($ in thousands) |
| 2023 |
|
| 2022 |
|
| Change |
|
| Percent |
| ||||
|
|
|
|
|
|
|
|
|
|
|
|
| ||||
Provisional ceding commissions earned |
| $ | 10,741 |
|
| $ | 9,234 |
|
| $ | 1,507 |
|
|
| 16.3 | % |
Contingent ceding commissions earned |
|
| 117 |
|
|
| 163 |
|
|
| (46 | ) |
|
| (28.2 | )% |
|
|
|
|
|
|
|
|
|
|
|
|
|
|
|
|
|
Total ceding commission revenue |
| $ | 10,858 |
|
| $ | 9,397 |
|
| $ | 1,461 |
|
|
| 15.5 | % |
(Columns in the table above may not sum to totals due to rounding)
Ceding commission revenue was $10,858,000 in Six Months 2023 compared to $9,397,000 in Six Months 2022. The increase of $1,461,000 was due to an increase in provisional ceding commissions earned offset by a decrease in contingent ceding commissions earned. See below for a discussion of provisional ceding commissions earned and contingent ceding commissions earned.
Provisional Ceding Commissions Earned
In Six Months 2023 we earned provisional ceding commissions of $10,741,000 from personal lines earned premiums ceded under the 2023/2024 Treaty, and in Six Months 2022 we earned provisional ceding commissions of $9,234,000 from personal lines earned premiums ceded under the 2021/2023 Treaty. The increase of $1,507,000 in provisional ceding commissions earned was due to the increase premiums ceded under these treaties during Six Months 2023 compared to Six Months 2022.
Contingent Ceding Commissions Earned
The structure of the 2023/2024 Treaty and the 2021/2023 Treaty calls for a fixed provisional ceding commission with no opportunity to earn additional contingent ceding commissions. Under our prior years’ quota share treaties, we received a contingent ceding commission based on a sliding scale in relation to the losses incurred under our quota share treaties. The lower the ceded loss ratio, the more contingent commission we received.
Net Investment Income
Net investment income was $2,993,000 in Six Months 2023 compared to $1,993,000 in Six Months 2022, an increase of $1,000,000, or 50.2%. The increase in investment income is attributable to a $766,000 reversal in Six Months 2022 of prior years’ estimated accrued interest income stemming from an error in third party investment reporting. The increase was also due to higher interest rates earned on cash balances. The average yield on non-cash invested assets was 3.63% as of June 30, 2023 compared to 3.51% as of June 30, 2022.
Cash and invested assets were $175,407,000 as of June 30, 2023 compared to $193,784,000 as of June 30, 2022. The $18,377,000 decrease in cash and invested assets was primarily attributable to increased disbursements of losses in connection with higher severity and inflation’s impact on losses along with catastrophe losses incurred in 2023 and prior periods. An increase in unrealized losses on our investment portfolio also contributed to the reduction.
| 49 |
| Table of Contents |
Net Gains (Losses) on Investments
Net gains on investments were $1,422,000 in Six Months 2023 compared to net (losses) of $(8,916,000) in Six Months 2022. Unrealized gains on our equity securities and other investments in Six Months 2023 were $1,435,000, compared to net unrealized (losses) of $(8,705,000) in Six Months 2022. Realized (losses) on sales of investments were $(13,000) in Six Months 2023 compared to realized (losses) of $211,000 in Six Months 2022.
Other Income
Other income was $312,000 in Six Months 2023 compared to $480,000 in Six Months 2022, a decrease of $168,000, or 35.0%.
Net Loss and LAE
Net loss and LAE was $44,620,000 for Six Months 2023 compared to $41,597,000 for Six Months 2022. The net loss ratio was 77.2% in Six Months 2023 compared to 76.2% in Six Months 2022, an increase of 1.0 percentage point.
The following graph summarizes the changes in the components of net loss ratio for the periods indicated, along with the comparable components excluding commercial lines business:
(Percent components may not sum to totals due to rounding)
| 50 |
| Table of Contents |
For Six Months 2023, the net loss ratio was higher than for Six Months 2022 mainly due to a bigger impact from catastrophe losses.
The net catastrophe losses were $5,125,000 for Six Months 2023, which contributed 8.9 points to the loss ratio. There were two winter storm events and three wind events classified as catastrophe for Six Months 2023, including a major freezing event at the beginning of February. As a comparison, catastrophe events had a loss ratio impact of 5.7 points for Six Months 2022.
The underlying loss ratio (loss ratio excluding the impact of catastrophe and prior year development) was 68.4% for Six Months 2023, a decrease of 1.6 points from the 70.0% underlying loss ratio recorded for Six Months 2022. The underlying loss experience in Six Months 2023 was improved due to lower frequency but was offset by increasing severity resulting from an elevated number of large losses.
Prior year development was stable for Six Months 2023. There was an overall favorable development of $19,000, which had marginal impact on the loss ratio.
See table below under “Additional Financial Information” summarizing net loss ratios by line of business.
Commission Expense
Commission expense was $17,011,000 in Six Months 2023 or 16.9% of direct earned premiums. Commission expense was $16,832,000 in Six Months 2022 or 18.2% of direct earned premiums. The increase of $179,000 was primarily due to an increase in direct earned premiums of $8,453,000 to $100,822,000 but offset in part by a reduction of commission rates on our legacy policies in accordance with Kingstone 3.0 as well as the lower commission rate paid on Select products as compared to legacy products.
Other Underwriting Expenses
Other underwriting expenses were $13,555,000, or 13.4% of direct earned premiums, in Six Months 2023 compared to $13,441,000, or 14.6% of direct earned premiums, in Six Months 2022. The increase of $114,000, or 0.8%, was primarily due to increases in expenses related to our growth in direct earned premiums and salaries, partially offset by decreases in professional fees, credit card fees and policy management system fees as result of the completion of our policy management system conversion, allowing us to eliminate multiple legacy systems.
Our largest single component of other underwriting expenses is salaries and employment costs, with costs of $5,875,000 in Six Months 2023 compared to $5,066,000 in Six Months 2022. The increase of $809,000, or 16.0%, is greater than the 2.7% increase in direct written premiums. In the periods following Six Months 2022, we continued to strengthen our professional team by investing in the hiring of higher-level and higher compensated managers and staff needed to manage the business consistent with our Kingstone 2.0 and Kingstone 3.0 strategies.
| 51 |
| Table of Contents |
Our net underwriting expense ratio in Six Months 2023 was 33.6% compared to 37.4% in Six Months 2022. The following table shows the individual components of our net underwriting expense ratio for the periods indicated:
|
| Six months ended |
|
|
|
| ||||||
|
| June 30, |
|
| Percentage |
| ||||||
|
| 2023 |
|
| 2022 |
|
| Point Change |
| |||
Other underwriting expenses |
|
|
|
|
|
|
|
|
| |||
Employment costs |
|
| 10.2 | % |
|
| 9.3 | % |
|
| 0.9 |
|
Underwriting fees (inspections/surveys) |
|
| 1.7 |
|
|
| 1.8 |
|
|
| (0.1 | ) |
IT expenses |
|
| 3.1 |
|
|
| 4.2 |
|
|
| (1.1 | ) |
Professional fees |
|
| 1.0 |
|
|
| 1.6 |
|
|
| (0.6 | ) |
Other expenses |
|
| 7.5 |
|
|
| 7.7 |
|
|
| (0.2 | ) |
Total other underwriting expenses |
|
| 23.5 |
|
|
| 24.6 |
|
|
| (1.1 | ) |
|
|
|
|
|
|
|
|
|
|
|
|
|
Commission expense |
|
| 29.4 |
|
|
| 30.8 |
|
|
| (1.4 | ) |
|
|
|
|
|
|
|
|
|
|
|
|
|
Ceding commission revenue |
|
|
|
|
|
|
|
|
|
|
|
|
Provisional |
|
| (18.6 | ) |
|
| (16.9 | ) |
|
| (1.7 | ) |
Contingent |
|
| (0.2 | ) |
|
| (0.3 | ) |
|
| 0.1 |
|
Total ceding commission revenue |
|
| (18.8 | ) |
|
| (17.2 | ) |
|
| (1.6 | ) |
|
|
|
|
|
|
|
|
|
|
|
|
|
Other income |
|
| (0.5 | ) |
|
| (0.9 | ) |
|
| 0.4 |
|
|
|
|
|
|
|
|
|
|
|
|
|
|
Net underwriting expense ratio |
|
| 33.6 | % |
|
| 37.4 | % |
|
| (3.8 | ) |
(Components may not sum to totals due to rounding)
| 52 |
| Table of Contents |
Other Operating Expenses
Other operating expenses, related to the expenses of our holding company and Cosi, were $1,426,000 for Six Months 2023 compared to $1,548,000 for Six Months 2022. The following table shows a breakdown of the significant components of other operating expenses for the periods indicated:
|
| Six months ended |
|
|
|
|
| |||||||||
|
| June 30, |
|
|
|
|
| |||||||||
($ in thousands) |
| 2023 |
|
| 2022 |
|
| Change |
|
| Percent |
| ||||
|
|
|
|
|
|
|
|
|
|
|
|
| ||||
Other operating expenses |
|
|
|
|
|
|
|
|
|
|
|
| ||||
Employement costs |
| $ | 198 |
|
| $ | (96 | ) |
| $ | 294 |
|
| na | % | |
Bonuses |
|
| - |
|
|
| - |
|
|
| - |
|
| na |
| |
Equity compensation |
|
| 429 |
|
|
| 1,016 |
|
|
| (587 | ) |
|
| (57.8 | ) |
Professional |
|
| 232 |
|
|
| 147 |
|
|
| 85 |
|
|
| 57.8 |
|
Directors fees |
|
| 139 |
|
|
| 164 |
|
|
| (25 | ) |
|
| (15.2 | ) |
Insurance |
|
| 87 |
|
|
| 77 |
|
|
| 10 |
|
|
| 13.0 |
|
Other expenses |
|
| 341 |
|
|
| 240 |
|
|
| 101 |
|
|
| 42.1 |
|
Total other operating expenses |
| $ | 1,426 |
|
| $ | 1,548 |
|
| $ | (122 | ) |
|
| (7.9 | )% |
(Components may not sum to totals due to rounding)
The decrease in Six Months 2023 of $122,000, or 7.9%, as compared to Six Months 2022 was primarily due to a decrease in equity compensation, partially offset by an increase in employment costs. The increase in employment costs was due to the hiring of our new Chief Financial Officer in Six Months 2023 and fluctuations in deferred compensation liability related to changes in the underlying invested portfolio.
Depreciation and Amortization
Depreciation and amortization was $1,587,000 in Six Months 2023 compared to $1,647,000 in Six Months 2022. The decrease of $60,000, or 3.6%, in depreciation and amortization was primarily due to the completion and deployment of our customized policy management software as planned for in Kingstone 2.0, now allowing us to consolidate multiple legacy systems into one efficient system and retire those older more costly and less reliable systems. Depreciation on older assets that were retired, which had a shorter useful life, is greater than the depreciation on newly acquired assets which have a longer useful life.
Interest Expense
Interest expense in Six Months 2023 was $2,016,000 compared to $913,000 in Six Months 2022, an increase of $1,103,000 or 120.8%. In Six Months 2023, as disclosed in Note 7 to the condensed consolidated financial statements, we incurred increased interest expense in connection with the 2022 Notes, which provide for interest at the rate of 12% per annum, and the 2022 equipment financing. In Six Months 2022, we incurred interest expense in connection with the 2017 Notes, our $30.0 million issuance of long-term debt in December 2017, which provided for interest at the rate of 5.5% per annum.
Income Tax Benefit
Income tax benefit in Six Months 2023 was $1,290,000, which resulted in an effective tax benefit rate of 18.8%. Income tax benefit in Six Months 2022 was $3,871,000, which resulted in an effective tax rate of 21.0%. Loss before taxes was $6,867,000 in Six Months 2023 compared to $18,448,000 in Six Months 2022. The difference in effective tax rate is due to the effect of permanent differences in Six Months 2023 compared to Six Months 2022.
Net Loss
Net loss was $5,577,000 in Six Months 2023 compared to $14,577,000 in Six Months 2022. The decrease in net loss of $9,000,000 was due to the circumstances described above.
| 53 |
| Table of Contents |
Three Months Ended June 30, 2023 Compared to Three Months Ended June 30, 2022
The following table summarizes the changes in the results of our operations (in thousands) for the periods indicated:
|
| Three months ended June 30, |
| |||||||||||||
($ in thousands) |
| 2023 |
|
| 2022 |
|
| Change |
|
| Percent |
| ||||
Revenues |
|
|
|
|
|
|
|
|
|
|
|
| ||||
Direct written premiums |
| $ | 47,647 |
|
| $ | 49,778 |
|
| $ | (2,131 | ) |
|
| (4.3 | )% |
Assumed written premiums |
|
| - |
|
|
| - |
|
|
| - |
|
| na | % | |
|
|
| 47,647 |
|
|
| 49,778 |
|
|
| (2,131 | ) |
|
| (4.3 | )% |
Ceded written premiums |
|
|
|
|
|
|
|
|
|
|
|
|
|
|
|
|
Ceded to quota share treaties (1) |
|
| 11,034 |
|
|
| 11,803 |
|
|
| (769 | ) |
|
| (6.5 | )% |
Ceded to excess of loss treaties |
|
| 1,062 |
|
|
| 886 |
|
|
| 176 |
|
|
| 19.9 | % |
Ceded to catastrophe treaties |
|
| 6,969 |
|
|
| 7,063 |
|
|
| (94 | ) |
|
| (1.3 | )% |
Total ceded written premiums |
|
| 19,064 |
|
|
| 19,752 |
|
|
| (687 | ) |
|
| (3.5 | )% |
|
|
|
|
|
|
|
|
|
|
|
|
|
|
|
|
|
Net written premiums |
|
| 28,583 |
|
|
| 30,026 |
|
|
| (1,443 | ) |
|
| (4.8 | )% |
|
|
|
|
|
|
|
|
|
|
|
|
|
|
|
|
|
Change in unearned premiums |
|
|
|
|
|
|
|
|
|
|
|
|
|
|
|
|
Direct and assumed |
|
| 3,245 |
|
|
| (2,786 | ) |
|
| 6,031 |
|
| na | % | |
Ceded to quota share treaties (1) |
|
| (2,320 | ) |
|
| 663 |
|
|
| (2,983 | ) |
| na | % | |
Change in net unearned premiums |
|
| 925 |
|
|
| (2,123 | ) |
|
| 3,048 |
|
| na | % | |
|
|
|
|
|
|
|
|
|
|
|
|
|
|
|
|
|
Premiums earned |
|
|
|
|
|
|
|
|
|
|
|
|
|
|
|
|
Direct and assumed |
|
| 50,892 |
|
|
| 46,992 |
|
|
| 3,900 |
|
|
| 8.3 | % |
Ceded to reinsurance treaties |
|
| (21,384 | ) |
|
| (19,090 | ) |
|
| (2,294 | ) |
|
| (12.0 | )% |
Net premiums earned |
|
| 29,508 |
|
|
| 27,902 |
|
|
| 1,606 |
|
|
| 5.8 | % |
|
|
|
|
|
|
|
|
|
|
|
|
|
|
|
|
|
Ceding commission revenue (1) |
|
| 5,412 |
|
|
| 4,716 |
|
|
| 696 |
|
|
| 14.8 | % |
Net investment income |
|
| 1,451 |
|
|
| 634 |
|
|
| 817 |
|
|
| 128.9 | % |
Net gains (losses) on investments |
|
| 197 |
|
|
| (4,517 | ) |
|
| 4,714 |
|
| na | % | |
Other income |
|
| 151 |
|
|
| 245 |
|
|
| (94 | ) |
|
| (38.4 | )% |
Total revenues |
|
| 36,720 |
|
|
| 28,979 |
|
|
| 7,739 |
|
|
| 26.7 | % |
Expenses |
|
|
|
|
|
|
|
|
|
|
|
|
|
|
|
|
Loss and loss adjustment expenses |
|
|
|
|
|
|
|
|
|
|
|
|
|
|
|
|
Direct and assumed: |
|
|
|
|
|
|
|
|
|
|
|
|
|
|
|
|
Loss and loss adjustment expenses excluding the effect of catastrophes |
|
| 28,346 |
|
|
| 26,323 |
|
|
| 2,023 |
|
|
| 7.7 | % |
Losses from catastrophes (2) |
|
| 2,489 |
|
|
| 195 |
|
|
| 2,294 |
|
|
| 1,176.4 | % |
Total direct and assumed loss and loss adjustment expenses |
|
| 30,835 |
|
|
| 26,519 |
|
|
| 4,317 |
|
|
| 16.3 | % |
|
|
|
|
|
|
|
|
|
|
|
|
|
|
|
|
|
Ceded loss and loss adjustment expenses: |
|
|
|
|
|
|
|
|
|
|
|
|
|
|
|
|
Loss and loss adjustment expenses excluding the effect of catastrophes |
|
| 10,148 |
|
|
| 7,780 |
|
|
| 2,368 |
|
|
| 30.4 | % |
Losses from catastrophes (2) |
|
| 1,107 |
|
|
| 83 |
|
|
| 1,024 |
|
|
| 1,233.7 | % |
Total ceded loss and loss adjustment expenses |
|
| 11,254 |
|
|
| 7,863 |
|
|
| 3,392 |
|
|
| 43.1 | % |
|
|
|
|
|
|
|
|
|
|
|
|
|
|
|
|
|
Net loss and loss adjustment expenses: |
|
|
|
|
|
|
|
|
|
|
|
|
|
|
|
|
Loss and loss adjustment expenses excluding the effect of catastrophes |
|
| 18,198 |
|
|
| 18,544 |
|
|
| (346 | ) |
|
| (1.9 | )% |
Losses from catastrophes (2) |
|
| 1,383 |
|
|
| 112 |
|
|
| 1,271 |
|
|
| 1,134.8 | % |
Net loss and loss adjustment expenses |
|
| 19,581 |
|
|
| 18,656 |
|
|
| 925 |
|
|
| 5.0 | % |
|
|
|
|
|
|
|
|
|
|
|
|
|
|
|
|
|
Commission expense |
|
| 8,471 |
|
|
| 8,481 |
|
|
| (10 | ) |
|
| (0.1 | )% |
Other underwriting expenses |
|
| 6,684 |
|
|
| 6,625 |
|
|
| 59 |
|
|
| 0.9 | % |
Other operating expenses |
|
| 763 |
|
|
| 666 |
|
|
| 97 |
|
|
| 14.6 | % |
Depreciation and amortization |
|
| 779 |
|
|
| 877 |
|
|
| (98 | ) |
|
| (11.2 | )% |
Interest expense |
|
| 1,006 |
|
|
| 457 |
|
|
| 549 |
|
|
| 120.1 | % |
Total expenses |
|
| 37,283 |
|
|
| 35,762 |
|
|
| 1,522 |
|
|
| 4.3 | % |
|
|
|
|
|
|
|
|
|
|
|
|
|
|
|
|
|
Loss before taxes |
|
| (563 | ) |
|
| (6,782 | ) |
|
| 6,219 |
|
|
| 91.7 | % |
Income tax benefit |
|
| (41 | ) |
|
| (1,403 | ) |
|
| 1,362 |
|
|
| 97.1 | % |
Net loss |
| $ | (522 | ) |
| $ | (5,380 | ) |
| $ | 4,858 |
|
|
| 90.3 | % |
(Columns in the table above may not sum to totals due to rounding)
| 54 |
| Table of Contents |
(1) | Effective December 31, 2021, we entered into a 30% personal lines quota share treaty. |
(2) | The three months ended June 30, 2023 and 2022 include catastrophe losses, which are defined as losses from an event for which a catastrophe bulletin and related serial number has been issued by the Property Claims Services (PCS) unit of the Insurance Services Office (ISO). PCS catastrophe bulletins are issued for events that cause more than $25 million in total insured losses and affect a significant number of policyholders and insurers. |
|
| Three months ended June 30, |
| |||||||||||||
|
| 2023 |
|
| 2022 |
|
| Percentage Point Change |
|
| Percent Change |
| ||||
|
|
|
|
|
|
|
|
|
|
|
|
| ||||
Key ratios: |
|
|
|
|
|
|
|
|
|
|
|
| ||||
Net loss ratio |
|
| 66.4 | % |
|
| 66.9 | % |
|
| (0.5 | ) |
|
| (0.7 | )% |
Net underwriting expense ratio |
|
| 32.5 | % |
|
| 36.4 | % |
|
| (3.9 | ) |
|
| (10.7 | )% |
Net combined ratio |
|
| 98.9 | % |
|
| 103.3 | % |
|
| (4.4 | ) |
|
| (4.3 | )% |
Direct Written Premiums
Direct written premiums during the three months ended June 30, 2023 (“Three Months 2023”) were $47,647,000 compared to $49,778,000 during the three months ended June 30, 2022 (“Three Months 2022”). The decrease of $2,131,000, or 4.3%, was primarily due to an increase in premiums from our personal lines business, partially offset by an increase in premiums from our livery physical damage business.
Direct written premiums from our personal lines business for Three Months 2023 were $44,011,000, a decrease of $2,781,000, or 5.9%, from $46,792,000 in Three Months 2022. The 5.9% decrease in premiums from our personal lines business was primarily due to decrease in premiums associated with a 8.6% decrease in policies in force as of June 30, 2023 compared to June 30, 2022, offset by rate increases. The rate increases achieved along with a decrease in policies in force is in accordance with both our Kingstone 2.0 and Kingstone 3.0 strategic plans.
Direct written premiums from our livery physical damage business for Three Months 2023 were $3,610,000, an increase of $655,000, or 22.2%, from $2,954,000 in Three Months 2022. The increase in livery physical damage direct written premiums was due to an increasing number of policies and an increase in the values of the autos insured.
Beginning in 2017, we started writing personal lines policies in New Jersey. Through 2019 we expanded to Rhode Island, Massachusetts and Connecticut. We refer to our New York business as our “Core” business and the business outside of New York as our “non-New York” business. Direct written premiums from our Core business were $42,211,000 in Three Months 2023 compared to $39,734,000 in Three Months 2022, an increase of $2,478,000, or 6.2%. Policies in force from our Core business decreased by 1.6% in Three Months 2023 compared to Three Months 2022. Direct written premiums from our non-New York business were $5,435,000 in Three Months 2023 down from $10,044,000 in Three Months 2022, a decrease of $4,609,000, or 45.9%. Policies in force from our non-New York business decreased by 27% in Three Months 2023 compared to Three Months 2022. The increase in direct written premiums in our Core business and the decrease in our non-New Yok business is consistent with a key pillar of our Kingstone 3.0 strategy to reduce our non-New York business due to profitability concerns.
| 55 |
| Table of Contents |
Net Written Premiums and Net Premiums Earned
Effective December 31, 2021, we entered into a quota share reinsurance treaty for our personal lines business covering the period from December 31, 2021 through January 1, 2023 (“2021/2023 Treaty”). Upon the expiration of the 2021/2023 Treaty on January 1, 2023, we entered into a new quota share reinsurance treaty for our personal lines business, covering the period from January 1, 2023 through January 1, 2024 (“2023/2024 Treaty”). Net written premiums decreased $1,443,000, or 4.8%, to $28,583,000 in Three Months 2023 from $30,026,000 in Three Months 2022. Net written premiums include direct premiums, less the amount of written premiums ceded under our reinsurance treaties (quota share, excess of loss, and catastrophe). In Three Months 2023, our premiums ceded under quota share treaties decreased by $769,000 in comparison to ceded premiums in Three Months 2022 (see table above). The increase in Three Months 2023 was attributable to the runoff of an 8.5% portion of the 30% 2021/2023 Treaty, partially offset by a decrease in premiums subject to quota share treaties as a result of the decrease in direct written premiums discussed above. The remainder of the 2021/2023 Treaty was on a cutoff basis and the new 2023/2024 Treaty was placed for 30% on January 1, 2023. Our personal lines business was subject to the 2023/2024 Treaty in Three Months 2023, and the 2021-2023 Treaty in Three Months 2022.
Excess of loss reinsurance treaties
An increase in written premiums will increase the premiums ceded under our excess of loss treaties. In Three Months 2023, our ceded excess of loss reinsurance premiums increased by $176,000 over the comparable ceded premiums for Three Months 2022. The increase was due to an increase in subject premiums and the heightened cost of coverage obtained. Effective January 1, 2022, we entered into an underlying excess of loss reinsurance treaty covering the period from January 1, 2022 through January 1, 2023. The treaty provides 50% reinsurance coverage for losses of $400,000 in excess of $600,000. Losses from named storms are excluded from the treaty. Effective January 1, 2023, the Underlying XOL Treaty was renewed covering the period from January 1, 2023 through January 1, 2024.
Catastrophe reinsurance treaties
Most of the premiums written under our personal lines policies are also subject to our catastrophe treaties. An increase in our personal lines business gives rise to more property exposure, which increases our exposure to catastrophe risk; therefore, our premiums ceded under catastrophe treaties will increase. An increase in our personal lines business results in an increase in premiums ceded under our catastrophe treaties if reinsurance rates are stable or are increasing. In accordance with our Kingstone 2.0 and Kingstone 3.0 goals, we have reduced our PML, and in the Three Months 2023, our premiums ceded under catastrophe treaties decreased by $94,000 as compared to the comparable ceded premiums in Three Months 2022, in spite of a large catastrophe reinsurance rate increase on our book effective July 1, 2022.
Net premiums earned
Net premiums earned increased $1,606,000, or 5.8%, to $29,508,000 in Three Months 2023 from $27,902,000 in Three Months 2022. The increase was due to the increased premiums written in prior periods due to rate increases and increased replacement costs, offset by the 4.3% decrease in direct written premiums during Three Months 2023. In addition, the run-off of a portion of the 2021-2023 Treaty increased the premiums ceded and reduced the growth of net premiums earned.
| 56 |
| Table of Contents |
Ceding Commission Revenue
The following table summarizes the changes in the components of ceding commission revenue (in thousands) for the periods indicated:
|
| Three months ended June 30, |
| |||||||||||||
($ in thousands) |
| 2023 |
|
| 2022 |
|
| Change |
|
| Percent |
| ||||
|
|
|
|
|
|
|
|
|
|
|
|
| ||||
Provisional ceding commissions earned |
| $ | 5,294 |
|
| $ | 4,693 |
|
| $ | 601 |
|
|
| 12.8 | % |
Contingent ceding commissions earned |
|
| 118 |
|
|
| 23 |
|
|
| 95 |
|
|
| 413.0 | % |
|
|
|
|
|
|
|
|
|
|
|
|
|
|
|
|
|
Total ceding commission revenue |
| $ | 5,412 |
|
| $ | 4,716 |
|
| $ | 696 |
|
|
| 14.8 | % |
(Columns in the table above may not sum to totals due to rounding)
Ceding commission revenue was $5,412,000 in Three Months 2023 compared to $4,716,000 in Three Months 2022. The increase of $696,000 was due to an increase in provisional ceding commissions earned and an increase in contingent ceding commissions earned. See below for a discussion of provisional ceding commissions earned and contingent ceding commissions earned.
Provisional Ceding Commissions Earned
In Three Months 2023 we earned provisional ceding commissions of $5,294,000 from personal lines earned premiums ceded under the 2023/2024 Treaty, and in Three Months 2022 we earned provisional ceding commissions of $4,693,000 from personal lines earned premiums ceded under the 2021/2023 Treaty. The increase of $601,000 in provisional ceding commissions earned was due to the runoff of an 8.5% portion of the 30% 2021/2023 Treaty, partially offset by a decrease in premiums subject to quota share treaties as a result of the decrease in direct written premiums discussed above.
Contingent Ceding Commissions Earned
The structure of the 2023/2024 Treaty and the 2021/2023 Treaty calls for a fixed provisional ceding commission with no opportunity to earn additional contingent ceding commissions. Under our prior years’ quota share treaties, we received a contingent ceding commission based on a sliding scale in relation to the losses incurred under our quota share treaties. The lower the ceded loss ratio, the more contingent commission we received.
Net Investment Income
Net investment income was $1,451,000 in Three Months 2023 compared to $634,000 in Three Months 2022, an increase of $817,000, or 128.9%. The increase in investment income is attributable to a $766,000 reversal in Three Months 2022 of prior years’ estimated accrued interest income stemming from an error in third party investment reporting. The increase was also due to higher interest rates earned on cash balances. The average yield on non-cash invested assets was 3.63% as of June 30, 2023 compared to 3.51% as of June 30, 2022.
Cash and invested assets were $175,407,000 as of June 30, 2023 compared to $193,784,000 as of June 30, 2022. The $18,377,000 decrease in cash and invested assets was primarily attributable to increased disbursements of losses in connection with higher severity and inflation’s impact on losses along with catastrophe losses incurred in 2023 and prior periods. An increase in unrealized losses on our investment portfolio also contributed to the reduction.
| 57 |
| Table of Contents |
Net Gains (Losses) on Investments
Net gains on investments were $197,000 in Three Months 2023 compared to net (losses) of $(4,517,000) in Three Months 2022. Unrealized gains on our equity securities and other investments in Three Months 2023 were $207,000, compared to net unrealized (losses) of $(4,229,000) in Three Months 2022. Realized (losses) on sales of investments were $(10,000) in Three Months 2023 compared to realized (losses) of $289,000 in Three Months 2022.
Other Income
Other income was $151,000 in Three Months 2023 compared to $245,000 in Three Months 2022, a decrease of $94,000, or 38.4%.
Net Loss and LAE
Net loss and LAE was $19,581,000 for Three Months 2023 compared to $18,656,000 for Three Months 2022. The net loss ratio was 66.4% in Three Months 2023 compared to 66.9% in Three Months 2022, a decrease of 0.5 percentage point.
The following graph summarizes the changes in the components of net loss ratio for the periods indicated, along with the comparable components excluding commercial lines business:
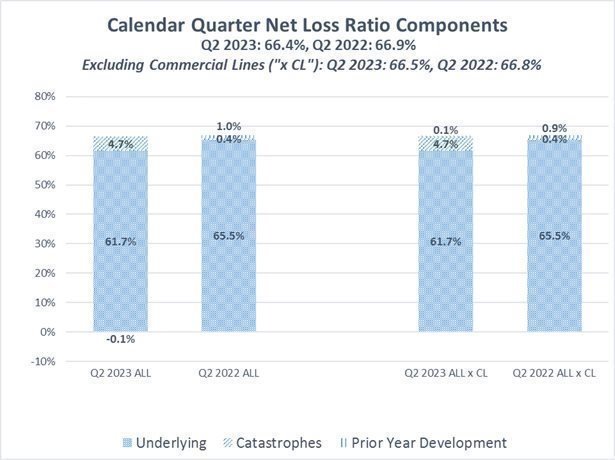
(Percent components may not sum to totals due to rounding)
| 58 |
| Table of Contents |
For Three Months 2023, the loss ratio was slightly lower than Three Months 2022. While the underlying loss ratio (loss ratio excluding the impact of catastrophe and prior year development) was improved for Three Months 2023 compared to Three Months 2022, the catastrophe loss had a bigger impact for Three Months 2023.
There were three wind events classified as catastrophe for Three Months 2023. The total net catastrophe losses for the calendar quarter were $1,383,000, which contributed 4.7 points to the loss ratio. This compares to a 0.4-point impact from catastrophe events for Three Months 2022.
The underlying loss ratio was 61.7% for Three Months 2023, a decrease of 3.8 points from the 65.5% underlying loss ratio recorded for Three Months 2022. The underlying loss experience for Three Months 2023 was improved due to lower frequency which is believed to be the result of the Company’s new product rollout as well as the Company’s active efforts to manage less profitable segments. Such improvement in loss experience was offset by an elevated number of large losses, similar to what was observed in the first three months of 2023.
Prior year development was stable for Three Months 2023. There was an overall favorable development of $16,000, which had marginal impact on the loss ratio.
See table below under “Additional Financial Information” summarizing net loss ratios by line of business.
Commission Expense
Commission expense was $8,471,000 in Three Months 2023 or 16.6% of direct earned premiums. Commission expense was $8,481,000 in Three Months 2022 or 18.0% of direct earned premiums. The decrease of $10,000 was primarily due to a reduction of commission rates on our legacy policies in accordance with Kingstone 3.0 as well as the lower commission rate paid on Select products as compared to legacy products, but offset by an increase in direct earned premiums of $3,899,000 to $50,892,000.
Other Underwriting Expenses
Other underwriting expenses were $6,684,000, or 13.1% of direct earned premiums, in Three Months 2023 compared to $6,625,000, or 14.1% of direct earned premiums, in Three Months 2022. The increase of $59,000, or 0.9%, was primarily due to increases in expenses related to our growth in direct earned premiums and salaries, partially offset by decreases in professional fees, credit card fees and policy management system fees as result of the completion of our policy management system conversion, allowing us to eliminate multiple legacy systems.
Our largest single component of other underwriting expenses is salaries and employment costs, with costs of $2,942,000 in Three Months 2023 compared to $2,518,000 in Three Months 2022. The increase of $424,000, or 16.8%, compared unfavorably to the 4.3% decrease in direct written premiums. In the periods following Three Months 2022, we continued to strengthen our professional team by investing in the hiring of higher-level and higher compensated managers and staff needed to manage the business consistent with our Kingstone 2.0 and Kingstone 3.0 strategies.
| 59 |
| Table of Contents |
Our net underwriting expense ratio in Three Months 2023 was 32.5% compared to 36.4% in Three Months 2022. The following table shows the individual components of our net underwriting expense ratio for the periods indicated:
|
| Three months ended |
|
|
|
| ||||||
|
| June 30, |
|
| Percentage |
| ||||||
|
| 2023 |
|
| 2022 |
|
| Point Change |
| |||
Other underwriting expenses |
|
|
|
|
|
|
|
|
| |||
Employment costs |
|
| 10.0 | % |
|
| 9.0 | % |
|
| 1.0 |
|
Underwriting fees (inspections/surveys) |
|
| 1.6 |
|
|
| 1.7 |
|
|
| (0.1 | ) |
IT expenses |
|
| 3.0 |
|
|
| 4.2 |
|
|
| (1.2 | ) |
Professional fees |
|
| 0.8 |
|
|
| 1.3 |
|
|
| (0.5 | ) |
Other expenses |
|
| 7.3 |
|
|
| 7.6 |
|
|
| (0.3 | ) |
Total other underwriting expenses |
|
| 22.7 |
|
|
| 23.8 |
|
|
| (1.1 | ) |
|
|
|
|
|
|
|
|
|
|
|
|
|
Commission expense |
|
| 28.7 |
|
|
| 30.4 |
|
|
| (1.7 | ) |
|
|
|
|
|
|
|
|
|
|
|
|
|
Ceding commission revenue |
|
|
|
|
|
|
|
|
|
|
|
|
Provisional |
|
| (17.9 | ) |
|
| (16.8 | ) |
|
| (1.1 | ) |
Contingent |
|
| (0.4 | ) |
|
| (0.1 | ) |
|
| (0.3 | ) |
Total ceding commission revenue |
|
| (18.3 | ) |
|
| (16.9 | ) |
|
| (1.4 | ) |
|
|
|
|
|
|
|
|
|
|
|
|
|
Other income |
|
| (0.5 | ) |
|
| (0.9 | ) |
|
| 0.4 |
|
|
|
|
|
|
|
|
|
|
|
|
|
|
Net underwriting expense ratio |
|
| 32.5 | % |
|
| 36.4 | % |
|
| (3.9 | ) |
(Components may not sum to totals due to rounding)
| 60 |
| Table of Contents |
Other Operating Expenses
Other operating expenses, related to the expenses of our holding company and Cosi, were $763,000 for Three Months 2023 compared to $666,000 for Three Months 2022. The following table shows a breakdown of the significant components of other operating expenses for the periods indicated:
|
| Three months ended |
|
|
|
|
| |||||||||
|
| June 30, |
|
|
|
|
| |||||||||
($ in thousands) |
| 2023 |
|
| 2022 |
|
| Change |
|
| Percent |
| ||||
|
|
|
|
|
|
|
|
|
|
|
|
| ||||
Other operating expenses |
|
|
|
|
|
|
|
|
|
|
|
| ||||
Employement costs |
| $ | 105 |
|
| $ | (101 | ) |
| $ | 206 |
|
| na% |
| |
Bonuses |
|
| - |
|
|
| - |
|
|
| - |
|
| na |
| |
Equity compensation |
|
| 212 |
|
|
| 486 |
|
|
| (274 | ) |
|
| (56.4 | ) |
Professional |
|
| 139 |
|
|
| 97 |
|
|
| 42 |
|
|
| 43.3 |
|
Directors fees |
|
| 69 |
|
|
| 82 |
|
|
| (13 | ) |
|
| (15.9 | ) |
Insurance |
|
| 48 |
|
|
| 37 |
|
|
| 11 |
|
|
| 29.7 |
|
Other expenses |
|
| 190 |
|
|
| 65 |
|
|
| 125 |
|
|
| 192.3 |
|
Total other operating expenses |
| $ | 763 |
|
| $ | 666 |
|
| $ | 97 |
|
|
| 14.6 | % |
(Components may not sum to totals due to rounding)
The increase in Three Months 2023 of $97,000, or 14.6%, as compared to Three Months 2022 was primarily due to an increase in employment costs attributable to the hiring of our new Chief Financial Officer in January 2023 and fluctuations in deferred compensation liability related to changes in the underlying invested portfolio. The increase was partially offset by a decrease in equity compensation.
Depreciation and Amortization
Depreciation and amortization was $779,000 in Three Months 2023 compared to $877,000 in Three Months 2022. The decrease of $98,000, or 11.2%, in depreciation and amortization was primarily due to the completion and deployment of our customized policy management software as planned for in Kingstone 2.0, now allowing us to consolidate multiple legacy systems into one efficient system and retire those older more costly and less reliable systems. Depreciation on older assets that were retired, which had a shorter useful life, is greater than the depreciation on newly acquired assets which have a longer useful life.
Interest Expense
Interest expense in Three Months 2023 was $1,006,000 compared to $457,000 in Three Months 2022, an increase of $549,000 or 120.1%. In Three Months 2023, as disclosed in Note 7 to the condensed consolidated financial statements, we incurred increased interest expense in connection with the 2022 Notes, which provide for interest at the rate of 12% per annum, and the 2022 equipment financing. In Three Months 2022, we incurred interest expense in connection with the 2017 Notes, our $30.0 million issuance of long-term debt in December 2017, which provided for interest at the rate of 5.5% per annum.
| 61 |
| Table of Contents |
Income Tax Benefit
Income tax benefit in Three Months 2023 was $41,000, which resulted in an effective tax benefit rate of 7.3%. Income tax benefit in Three Months 2022 was $1,403,000, which resulted in an effective tax rate of 20.7%. Loss before taxes was $563,000 in Three Months 2023 compared to $6,782,000 in Three Months 2022. The difference in effective tax rate is due to the effect of permanent differences in Three Months 2023 compared to Three Months 2022.
Net Loss
Net loss was $522,000 in Three Months 2023 compared to $5,380,000 in Three Months 2022. The decrease in net loss of $4,858,000 was due to the circumstances described above.
Additional Financial Information
We operate our business as one segment, property and casualty insurance. Within this segment, we offer an array of property and casualty policies to our producers. The following table summarizes gross and net written premiums, net premiums earned, and net loss and loss adjustment expenses by major product type, which were determined based primarily on similar economic characteristics and risks of loss.
|
| Three Months Ended |
|
| Six Months Ended |
| ||||||||||
|
| June 30, |
|
| June 30, |
| ||||||||||
|
| 2023 |
|
| 2022 |
|
| 2023 |
|
| 2022 |
| ||||
Gross premiums written: |
|
|
|
|
|
|
|
|
|
|
|
| ||||
Personal lines |
| $ | 44,011,176 |
|
| $ | 46,792,267 |
|
| $ | 88,182,114 |
|
| $ | 86,955,416 |
|
Livery physical damage |
|
| 3,609,832 |
|
|
| 2,953,588 |
|
|
| 7,015,500 |
|
|
| 5,726,868 |
|
Other(1) |
|
| 25,936 |
|
|
| 32,608 |
|
|
| 46,776 |
|
|
| 80,076 |
|
Total gross premiums written |
| $ | 47,646,944 |
|
| $ | 49,778,463 |
|
| $ | 95,244,390 |
|
| $ | 92,762,360 |
|
|
|
|
|
|
|
|
|
|
|
|
|
|
|
|
|
|
Net premiums written: |
|
|
|
|
|
|
|
|
|
|
|
|
|
|
|
|
Personal lines |
| $ | 24,954,271 |
|
| $ | 27,048,585 |
|
| $ | 45,505,958 |
|
| $ | 49,159,250 |
|
Livery physical damage |
|
| 3,609,832 |
|
|
| 2,953,588 |
|
|
| 7,015,500 |
|
|
| 5,726,868 |
|
Other(1) |
|
| 18,625 |
|
|
| 23,607 |
|
|
| 30,017 |
|
|
| 57,850 |
|
Total net premiums written |
| $ | 28,582,728 |
|
| $ | 30,025,780 |
|
| $ | 52,551,475 |
|
| $ | 54,943,968 |
|
|
|
|
|
|
|
|
|
|
|
|
|
|
|
|
|
|
Net premiums earned: |
|
|
|
|
|
|
|
|
|
|
|
|
|
|
|
|
Personal lines |
| $ | 26,075,876 |
|
| $ | 25,178,854 |
|
| $ | 51,094,961 |
|
| $ | 49,339,070 |
|
Livery physical damage |
|
| 3,409,779 |
|
|
| 2,687,273 |
|
|
| 6,621,613 |
|
|
| 5,161,838 |
|
Other(1) |
|
| 22,541 |
|
|
| 35,941 |
|
|
| 46,575 |
|
|
| 74,540 |
|
Total net premiums earned |
| $ | 29,508,196 |
|
| $ | 27,902,068 |
|
| $ | 57,763,149 |
|
| $ | 54,575,448 |
|
|
|
|
|
|
|
|
|
|
|
|
|
|
|
|
|
|
Net loss and loss adjustment expenses(3): |
|
|
|
|
|
|
|
|
|
|
|
|
|
|
|
|
Personal lines |
| $ | 17,925,971 |
|
| $ | 16,540,604 |
|
| $ | 40,495,580 |
|
| $ | 37,576,758 |
|
Livery physical damage |
|
| 894,026 |
|
|
| 1,180,223 |
|
|
| 2,279,167 |
|
|
| 2,010,792 |
|
Other(1) |
|
| 36 |
|
|
| (967 | ) |
|
| 151,643 |
|
|
| (24,367 | ) |
Unallocated loss adjustment expenses |
|
| 828,963 |
|
|
| 980,984 |
|
|
| 1,720,053 |
|
|
| 1,950,377 |
|
Total without commercial lines |
|
| 19,648,996 |
|
|
| 18,700,844 |
|
|
| 44,646,443 |
|
|
| 41,513,560 |
|
Commercial lines (in run-off effective July 2019)(2) |
|
| (68,294 | ) |
|
| (44,803 | ) |
|
| (26,331 | ) |
|
| 83,679 |
|
Total net loss and loss adjustment expenses |
| $ | 19,580,702 |
|
| $ | 18,656,041 |
|
| $ | 44,620,112 |
|
| $ | 41,597,239 |
|
|
|
|
|
|
|
|
|
|
|
|
|
|
|
|
|
|
Net loss ratio(3): |
|
|
|
|
|
|
|
|
|
|
|
|
|
|
|
|
Personal lines |
|
| 68.7 | % |
|
| 65.7 | % |
|
| 79.3 | % |
|
| 76.2 | % |
Livery physical damage |
|
| 26.2 | % |
|
| 43.9 | % |
|
| 34.4 | % |
|
| 39.0 | % |
Other(1) |
|
| 0.2 | % |
|
| -2.7 | % |
|
| 325.6 | % |
|
| -32.7 | % |
Total without commercial lines |
|
| 66.6 | % |
|
| 67.0 | % |
|
| 77.3 | % |
|
| 76.1 | % |
Commercial lines (in run-off effective July 2019)(2) |
| na |
|
| na |
|
| na |
|
| na |
| ||||
Total |
|
| 66.4 | % |
|
| 66.9 | % |
|
| 77.2 | % |
|
| 76.2 | % |
| 62 |
| Table of Contents |
(1) | “Other” includes, among other things, premiums and loss and loss adjustment expenses from our participation in a mandatory state joint underwriting association and loss and loss adjustment expenses from commercial auto. |
(2) | In July 2019, we decided that we will no longer underwrite Commercial Liability risks. See discussions above regarding the discontinuation of this line of business. |
(3) | See discussion above with regard to “Net Loss and LAE”, as to catastrophe losses in the three months and six months ended June 30, 2023 and 2022. |
Insurance Underwriting Business on a Standalone Basis
Our insurance underwriting business reported on a standalone basis for the periods indicated is as follows:
|
| Three Months Ended |
|
| Six Months Ended |
| ||||||||||
|
| June 30, |
|
| June 30, |
| ||||||||||
|
| 2023 |
|
| 2022 |
|
| 2023 |
|
| 2022 |
| ||||
Revenues |
|
|
|
|
|
|
|
|
|
|
|
| ||||
Net premiums earned |
| $ | 29,508,196 |
|
| $ | 27,902,068 |
|
| $ | 57,763,149 |
|
| $ | 54,575,448 |
|
Ceding commission revenue |
|
| 5,412,210 |
|
|
| 4,715,587 |
|
|
| 10,857,617 |
|
|
| 9,396,983 |
|
Net investment income |
|
| 1,451,356 |
|
|
| 634,325 |
|
|
| 2,992,848 |
|
|
| 1,993,425 |
|
Net gains (losses) on investments |
|
| 146,377 |
|
|
| (4,379,853 | ) |
|
| 1,330,625 |
|
|
| (8,731,597 | ) |
Other income |
|
| 149,245 |
|
|
| 242,620 |
|
|
| 308,071 |
|
|
| 471,127 |
|
Total revenues |
|
| 36,667,384 |
|
|
| 29,114,747 |
|
|
| 73,252,310 |
|
|
| 57,705,386 |
|
|
|
|
|
|
|
|
|
|
|
|
|
|
|
|
|
|
Expenses |
|
|
|
|
|
|
|
|
|
|
|
|
|
|
|
|
Loss and loss adjustment expenses |
|
| 19,580,702 |
|
|
| 18,656,041 |
|
|
| 44,620,112 |
|
|
| 41,597,239 |
|
Commission expense |
|
| 8,471,182 |
|
|
| 8,481,031 |
|
|
| 17,010,944 |
|
|
| 16,832,117 |
|
Other underwriting expenses |
|
| 6,683,638 |
|
|
| 6,624,997 |
|
|
| 13,555,257 |
|
|
| 13,440,946 |
|
Depreciation and amortization |
|
| 778,502 |
|
|
| 867,186 |
|
|
| 1,586,632 |
|
|
| 1,627,201 |
|
Interest expense |
|
| 110,554 |
|
|
| - |
|
|
| 225,026 |
|
|
| - |
|
Total expenses |
|
| 35,624,578 |
|
|
| 34,629,255 |
|
|
| 76,997,971 |
|
|
| 73,497,503 |
|
|
|
|
|
|
|
|
|
|
|
|
|
|
|
|
|
|
Income (loss) from operations |
|
| 1,042,806 |
|
|
| (5,514,508 | ) |
|
| (3,745,661 | ) |
|
| (15,792,117 | ) |
Income tax expense (benefit) |
|
| 277,231 |
|
|
| (1,170,035 | ) |
|
| (660,992 | ) |
|
| (3,357,294 | ) |
Net income (loss) |
| $ | 765,575 |
|
| $ | (4,344,473 | ) |
| $ | (3,084,669 | ) |
| $ | (12,434,823 | ) |
|
|
|
|
|
|
|
|
|
|
|
|
|
|
|
|
|
Key Measures: |
|
|
|
|
|
|
|
|
|
|
|
|
|
|
|
|
Net loss ratio |
|
| 66.4 | % |
|
| 66.9 | % |
|
| 77.2 | % |
|
| 76.2 | % |
Net underwriting expense ratio |
|
| 32.5 | % |
|
| 36.4 | % |
|
| 33.6 | % |
|
| 37.4 | % |
Net combined ratio |
|
| 98.9 | % |
|
| 103.3 | % |
|
| 110.8 | % |
|
| 113.6 | % |
|
|
|
|
|
|
|
|
|
|
|
|
|
|
|
|
|
Reconciliation of net underwriting expense ratio: |
|
|
|
|
|
|
|
|
|
|
|
|
|
|
|
|
Acquisition costs and other |
|
|
|
|
|
|
|
|
|
|
|
|
|
|
|
|
underwriting expenses |
| $ | 15,154,820 |
|
| $ | 15,106,028 |
|
| $ | 30,566,201 |
|
| $ | 30,273,063 |
|
Less: Ceding commission revenue |
|
| (5,412,210 | ) |
|
| (4,715,587 | ) |
|
| (10,857,617 | ) |
|
| (9,396,983 | ) |
Less: Other income |
|
| (149,245 | ) |
|
| (242,620 | ) |
|
| (308,071 | ) |
|
| (471,127 | ) |
Net underwriting expenses |
| $ | 9,593,365 |
|
| $ | 10,147,821 |
|
| $ | 19,400,513 |
|
| $ | 20,404,953 |
|
|
|
|
|
|
|
|
|
|
|
|
|
|
|
|
|
|
Net premiums earned |
| $ | 29,508,196 |
|
| $ | 27,902,068 |
|
| $ | 57,763,149 |
|
| $ | 54,575,448 |
|
|
|
|
|
|
|
|
|
|
|
|
|
|
|
|
|
|
Net Underwriting Expense Ratio |
|
| 32.5 | % |
|
| 36.4 | % |
|
| 33.6 | % |
|
| 37.4 | % |
| 63 |
| Table of Contents |
An analysis of our direct, assumed and ceded earned premiums, loss and loss adjustment expenses, and loss ratios is shown below:
|
| Direct |
|
| Assumed |
|
| Ceded |
|
| Net |
| ||||
Six months ended June 30, 2023 |
|
|
|
|
|
|
|
|
|
|
|
| ||||
Written premiums |
| $ | 95,244,390 |
|
| $ | - |
|
| $ | (42,692,915 | ) |
| $ | 52,551,475 |
|
Change in unearned premiums |
|
| 5,577,883 |
|
|
| - |
|
|
| (366,209 | ) |
|
| 5,211,674 |
|
Earned premiums |
| $ | 100,822,273 |
|
| $ | - |
|
| $ | (43,059,124 | ) |
| $ | 57,763,149 |
|
|
|
|
|
|
|
|
|
|
|
|
|
|
|
|
|
|
Loss and loss adjustment expenses excluding |
|
|
|
|
|
|
|
|
|
|
|
|
|
|
|
|
the effect of catastrophes |
| $ | 60,255,984 |
|
| $ | - |
|
| $ | (20,761,334 | ) |
| $ | 39,494,650 |
|
Catastrophe loss |
|
| 7,874,884 |
|
|
| - |
|
|
| (2,749,422 | ) |
|
| 5,125,462 |
|
Loss and loss adjustment expenses |
| $ | 68,130,868 |
|
| $ | - |
|
| $ | (23,510,756 | ) |
| $ | 44,620,112 |
|
|
|
|
|
|
|
|
|
|
|
|
|
|
|
|
|
|
Loss ratio excluding the effect of catastrophes |
|
| 59.8 | % |
|
| 0.0 | % |
|
| 48.2 | % |
|
| 68.4 | % |
Catastrophe loss |
|
| 7.8 | % |
|
| 0.0 | % |
|
| 6.4 | % |
|
| 8.9 | % |
Loss ratio |
|
| 67.6 | % |
|
| 0.0 | % |
|
| 54.6 | % |
|
| 77.2 | % |
|
|
|
|
|
|
|
|
|
|
|
|
|
|
|
|
|
Six months ended June 30, 2022 |
|
|
|
|
|
|
|
|
|
|
|
|
|
|
|
|
Written premiums |
| $ | 92,762,360 |
|
| $ | - |
|
| $ | (37,818,392 | ) |
| $ | 54,943,968 |
|
Change in unearned premiums |
|
| (393,353 | ) |
|
| - |
|
|
| 24,833 |
|
|
| (368,520 | ) |
Earned premiums |
| $ | 92,369,007 |
|
| $ | - |
|
| $ | (37,793,559 | ) |
| $ | 54,575,448 |
|
|
|
|
|
|
|
|
|
|
|
|
|
|
|
|
|
|
Loss and loss adjustment expenses excluding |
|
|
|
|
|
|
|
|
|
|
|
|
|
|
|
|
the effect of catastrophes |
| $ | 52,832,153 |
|
| $ | - |
|
| $ | (14,366,628 | ) |
| $ | 38,465,525 |
|
Catastrophe loss |
|
| 7,032,470 |
|
|
| - |
|
|
| (3,900,756 | ) |
|
| 3,131,714 |
|
Loss and loss adjustment expenses |
| $ | 59,864,623 |
|
| $ | - |
|
| $ | (18,267,384 | ) |
| $ | 41,597,239 |
|
|
|
|
|
|
|
|
|
|
|
|
|
|
|
|
|
|
Loss ratio excluding the effect of catastrophes |
|
| 57.2 | % |
|
| 0.0 | % |
|
| 38.0 | % |
|
| 70.5 | % |
Catastrophe loss |
|
| 7.6 | % |
|
| 0.0 | % |
|
| 10.3 | % |
|
| 5.7 | % |
Loss ratio |
|
| 64.8 | % |
|
| 0.0 | % |
|
| 48.3 | % |
|
| 76.2 | % |
|
|
|
|
|
|
|
|
|
|
|
|
|
|
|
|
|
Three months ended June 30, 2023 |
|
|
|
|
|
|
|
|
|
|
|
|
|
|
|
|
Written premiums |
| $ | 47,646,944 |
|
| $ | - |
|
| $ | (19,064,216 | ) |
| $ | 28,582,728 |
|
Change in unearned premiums |
|
| 3,244,999 |
|
|
| - |
|
|
| (2,319,531 | ) |
|
| 925,468 |
|
Earned premiums |
| $ | 50,891,943 |
|
| $ | - |
|
| $ | (21,383,747 | ) |
| $ | 29,508,196 |
|
|
|
|
|
|
|
|
|
|
|
|
|
|
|
|
|
|
Loss and loss adjustment expenses excluding |
|
|
|
|
|
|
|
|
|
|
|
|
|
|
|
|
the effect of catastrophes |
| $ | 28,345,979 |
|
| $ | - |
|
| $ | (10,147,791 | ) |
| $ | 18,198,188 |
|
Catastrophe loss |
|
| 2,489,053 |
|
|
| - |
|
|
| (1,106,539 | ) |
|
| 1,382,514 |
|
Loss and loss adjustment expenses |
| $ | 30,835,032 |
|
| $ | - |
|
| $ | (11,254,330 | ) |
| $ | 19,580,702 |
|
|
|
|
|
|
|
|
|
|
|
|
|
|
|
|
|
|
Loss ratio excluding the effect of catastrophes |
|
| 55.7 | % |
|
| 0.0 | % |
|
| 47.5 | % |
|
| 61.7 | % |
Catastrophe loss |
|
| 4.9 | % |
|
| 0.0 | % |
|
| 5.2 | % |
|
| 4.7 | % |
Loss ratio |
|
| 60.6 | % |
|
| 0.0 | % |
|
| 52.6 | % |
|
| 66.4 | % |
|
|
|
|
|
|
|
|
|
|
|
|
|
|
|
|
|
Three months ended June 30, 2022 |
|
|
|
|
|
|
|
|
|
|
|
|
|
|
|
|
Written premiums |
| $ | 49,778,463 |
|
| $ | - |
|
| $ | (19,752,683 | ) |
| $ | 30,025,780 |
|
Change in unearned premiums |
|
| (2,786,080 | ) |
|
| - |
|
|
| 662,368 |
|
|
| (2,123,712 | ) |
Earned premiums |
| $ | 46,992,383 |
|
| $ | - |
|
| $ | (19,090,315 | ) |
| $ | 27,902,068 |
|
|
|
|
|
|
|
|
|
|
|
|
|
|
|
|
|
|
Loss and loss adjustment expenses excluding |
|
|
|
|
|
|
|
|
|
|
|
|
|
|
|
|
the effect of catastrophes |
| $ | 26,323,489 |
|
| $ | - |
|
| $ | (7,779,738 | ) |
| $ | 18,543,751 |
|
Catastrophe loss |
|
| 195,070 |
|
|
| - |
|
|
| (82,780 | ) |
|
| 112,290 |
|
Loss and loss adjustment expenses |
| $ | 26,518,559 |
|
| $ | - |
|
| $ | (7,862,518 | ) |
| $ | 18,656,041 |
|
|
|
|
|
|
|
|
|
|
|
|
|
|
|
|
|
|
Loss ratio excluding the effect of catastrophes |
|
| 56.0 | % |
|
| 0.0 | % |
|
| 40.8 | % |
|
| 66.5 | % |
Catastrophe loss |
|
| 0.4 | % |
|
| 0.0 | % |
|
| 0.4 | % |
|
| 0.4 | % |
Loss ratio |
|
| 56.4 | % |
|
| 0.0 | % |
|
| 41.2 | % |
|
| 66.9 | % |
(Percent components may not sum to totals due to rounding)
| 64 |
| Table of Contents |
The key measures for our insurance underwriting business for the periods indicated are as follows:
|
| Three Months Ended |
|
| Six Months Ended |
| ||||||||||
|
| June 30, |
|
| June 30, |
| ||||||||||
|
| 2023 |
|
| 2022 |
|
| 2023 |
|
| 2022 |
| ||||
|
|
|
|
|
|
|
|
|
|
|
|
| ||||
Net premiums earned |
| $ | 29,508,196 |
|
| $ | 27,902,068 |
|
| $ | 57,763,149 |
|
| $ | 54,575,448 |
|
Ceding commission revenue |
|
| 5,412,210 |
|
|
| 4,715,587 |
|
|
| 10,857,617 |
|
|
| 9,396,983 |
|
Other income |
|
| 149,245 |
|
|
| 242,620 |
|
|
| 308,071 |
|
|
| 471,127 |
|
|
|
|
|
|
|
|
|
|
|
|
|
|
|
|
|
|
Loss and loss adjustment expenses (1) |
|
| 19,580,702 |
|
|
| 18,656,041 |
|
|
| 44,620,112 |
|
|
| 41,597,239 |
|
|
|
|
|
|
|
|
|
|
|
|
|
|
|
|
|
|
Acquisition costs and other underwriting expenses: |
|
|
|
|
|
|
|
|
|
|
|
|
|
|
|
|
Commission expense |
|
| 8,471,182 |
|
|
| 8,481,031 |
|
|
| 17,010,944 |
|
|
| 16,832,117 |
|
Other underwriting expenses |
|
| 6,683,638 |
|
|
| 6,624,997 |
|
|
| 13,555,257 |
|
|
| 13,440,946 |
|
Total acquisition costs and other |
|
|
|
|
|
|
|
|
|
|
|
|
|
|
|
|
underwriting expenses |
|
| 15,154,820 |
|
|
| 15,106,028 |
|
|
| 30,566,201 |
|
|
| 30,273,063 |
|
|
|
|
|
|
|
|
|
|
|
|
|
|
|
|
|
|
Underwriting gain (loss) |
| $ | 334,129 |
|
| $ | (901,794 | ) |
| $ | (6,257,476 | ) |
| $ | (7,426,744 | ) |
|
|
|
|
|
|
|
|
|
|
|
|
|
|
|
|
|
Key Measures: |
|
|
|
|
|
|
|
|
|
|
|
|
|
|
|
|
Net loss ratio excluding the effect of catastrophes |
|
| 61.7 | % |
|
| 66.5 | % |
|
| 68.4 | % |
|
| 70.5 | % |
Effect of catastrophe loss on net loss ratio (1) |
|
| 4.7 | % |
|
| 0.4 | % |
|
| 8.9 | % |
|
| 5.7 | % |
Net loss ratio |
|
| 66.4 | % |
|
| 66.9 | % |
|
| 77.2 | % |
|
| 76.2 | % |
|
|
|
|
|
|
|
|
|
|
|
|
|
|
|
|
|
Net underwriting expense ratio excluding the effect of catastrophes |
|
| 32.5 | % |
|
| 36.4 | % |
|
| 33.6 | % |
|
| 37.4 | % |
Effect of catastrophe loss on net underwriting expense ratio |
|
| 0.0 | % |
|
| 0.0 | % |
|
| 0.0 | % |
|
| 0.0 | % |
Net underwriting expense ratio |
|
| 32.5 | % |
|
| 36.4 | % |
|
| 33.6 | % |
|
| 37.4 | % |
|
|
|
|
|
|
|
|
|
|
|
|
|
|
|
|
|
Net combined ratio excluding the effect of catastrophes |
|
| 94.2 | % |
|
| 102.9 | % |
|
| 102.0 | % |
|
| 107.9 | % |
Effect of catastrophe loss on net combined ratio (1) |
|
| 4.7 | % |
|
| 0.4 | % |
|
| 8.9 | % |
|
| 5.7 | % |
Net combined ratio |
|
| 98.9 | % |
|
| 103.2 | % |
|
| 110.8 | % |
|
| 113.6 | % |
|
|
|
|
|
|
|
|
|
|
|
|
|
|
|
|
|
Reconciliation of net underwriting expense ratio: |
|
|
|
|
|
|
|
|
|
|
|
|
|
|
|
|
Acquisition costs and other underwriting expenses |
| $ | 15,154,820 |
|
| $ | 15,106,028 |
|
| $ | 30,566,201 |
|
| $ | 30,273,063 |
|
Less: Ceding commission revenue |
|
| (5,412,210 | ) |
|
| (4,715,587 | ) |
|
| (10,857,617 | ) |
|
| (9,396,983 | ) |
Less: Other income |
|
| (149,245 | ) |
|
| (242,620 | ) |
|
| (308,071 | ) |
|
| (471,127 | ) |
|
| $ | 9,593,365 |
|
| $ | 10,147,821 |
|
| $ | 19,400,513 |
|
| $ | 20,404,953 |
|
|
|
|
|
|
|
|
|
|
|
|
|
|
|
|
|
|
Net earned premium |
| $ | 29,508,196 |
|
| $ | 27,902,068 |
|
| $ | 57,763,149 |
|
| $ | 54,575,448 |
|
|
|
|
|
|
|
|
|
|
|
|
|
|
|
|
|
|
Net Underwriting Expense Ratio |
|
| 32.5 | % |
|
| 36.4 | % |
|
| 33.6 | % |
|
| 37.4 | % |
(1) | For the three months ended June 30, 2023 and 2022, includes the sum of net catastrophe losses and loss adjustment expenses of $1,382,514 and $112,290, respectively. For the six months ended June 30, 2023 and 2022, includes the sum of net catastrophe losses and loss adjustment expenses of $5,125,462 and $3,131,714, respectively. |
| 65 |
| Table of Contents |
Investments
Portfolio Summary
Fixed-Maturity Securities
The following table presents a breakdown of the amortized cost, estimated fair value, and gross unrealized gains and losses of our investments in fixed-maturity securities classified as available-for-sale for which an allowance for credit loss has not been recorded, as of June 30, 2023 and December 31, 2022:
|
| June 30, 2023 |
| |||||||||||||||||||||
|
| Cost or |
|
| Gross |
|
| Gross Unrealized Losses |
|
| Estimated |
|
| % of |
| |||||||||
|
| Amortized |
|
| Unrealized |
|
| Less than 12 |
|
| More than 12 |
|
| Fair |
|
| Estimated |
| ||||||
Category |
| Cost |
|
| Gains |
|
| Months |
|
| Months |
|
| Value |
|
| Fair Value |
| ||||||
|
|
|
|
|
|
|
|
| ||||||||||||||||
U.S. Treasury securities and obligations of U.S. government corporations and agencies (1) |
| $ | 8,192,900 |
|
| $ | 67 |
|
| $ | (59,420 | ) |
| $ | - |
|
| $ | 8,133,547 |
|
|
| 5.9 | % |
|
|
|
|
|
|
|
|
|
|
|
|
|
|
|
|
|
|
|
|
|
|
|
|
|
Political subdivisions of States, Territories and Possessions |
|
| 17,089,668 |
|
|
| - |
|
|
| (2,652 | ) |
|
| (3,489,849 | ) |
|
| 13,597,167 |
|
|
| 9.9 | % |
|
|
|
|
|
|
|
|
|
|
|
|
|
|
|
|
|
|
|
|
|
|
|
|
|
Corporate and other bonds Industrial and miscellaneous |
|
| 79,190,654 |
|
|
| - |
|
|
| (270,230 | ) |
|
| (7,511,387 | ) |
|
| 71,409,037 |
|
|
| 51.8 | % |
|
|
|
|
|
|
|
|
|
|
|
|
|
|
|
|
|
|
|
|
|
|
|
|
|
Residential mortgage and other asset backed securities (2) |
|
| 52,237,241 |
|
|
| 72,673 |
|
|
| (1,621 | ) |
|
| (7,592,927 | ) |
|
| 44,715,366 |
|
|
| 32.4 | % |
Total fixed-maturity securities |
| $ | 156,710,463 |
|
| $ | 72,740 |
|
| $ | (333,923 | ) |
| $ | (18,594,163 | ) |
| $ | 137,855,117 |
|
|
| 100.0 | % |
|
| December 31, 2022 |
| |||||||||||||||||||||
|
| Cost or |
|
| Gross |
|
| Gross Unrealized Losses |
|
| Estimated |
|
| % of |
| |||||||||
|
| Amortized |
|
| Unrealized |
|
| Less than 12 |
|
| More than 12 |
|
| Fair |
|
| Estimated |
| ||||||
Category |
| Cost |
|
| Gains |
|
| Months |
|
| Months |
|
| Value |
|
| Fair Value |
| ||||||
|
|
|
|
|
|
|
|
| ||||||||||||||||
U.S. Treasury securities and obligations of U.S. government corporations and agencies (1) |
| $ | 23,874,545 |
|
| $ | 1,479 |
|
| $ | (6,928 | ) |
| $ | - |
|
| $ | 23,869,096 |
|
|
| 15.4 | % |
|
|
|
|
|
|
|
|
|
|
|
|
|
|
|
|
|
|
|
|
|
|
|
|
|
Political subdivisions of States, Territories and Possessions |
|
| 17,108,154 |
|
|
| - |
|
|
| (2,195,273 | ) |
|
| (1,771,494 | ) |
|
| 13,141,387 |
|
|
| 8.5 | % |
|
|
|
|
|
|
|
|
|
|
|
|
|
|
|
|
|
|
|
|
|
|
|
|
|
Corporate and other bonds Industrial and miscellaneous |
|
| 80,338,464 |
|
|
| - |
|
|
| (5,796,994 | ) |
|
| (2,458,985 | ) |
|
| 72,082,485 |
|
|
| 46.6 | % |
|
|
|
|
|
|
|
|
|
|
|
|
|
|
|
|
|
|
|
|
|
|
|
|
|
Residential mortgage and other asset backed securities (2) |
|
| 53,597,264 |
|
|
| 58,398 |
|
|
| (882,664 | ) |
|
| (7,150,803 | ) |
|
| 45,622,195 |
|
|
| 29.5 | % |
Total fixed-maturity securities |
| $ | 174,918,427 |
|
| $ | 59,877 |
|
| $ | (8,881,859 | ) |
| $ | (11,381,282 | ) |
| $ | 154,715,163 |
|
|
| 100.0 | % |
(1) In October 2022, KICO placed certain U.S. Treasury securities to fulfill the required collateral for a sale leaseback transaction in a designated custodian account (see Note 7 – Debt - “Equipment Financing”). As of June 30, 2023 and December 31, 2022, the amount of required collateral was approximately $7,986,000 and $8,691,000, respectively. As of June 30, 2023 and December 31, 2022, the estimated fair value of the eligible collateral was approximately $8,134,000 and $8,691,000, respectively.
(2) KICO has placed certain residential mortgage backed securities as eligible collateral in a designated custodian account related to its membership in the Federal Home Loan Bank of New York ("FHLBNY") (see Note 7 – Debt – “Federal Home Loan Bank”). The eligible collateral would be pledged to FHLBNY if KICO draws an advance from the FHLBNY credit line. As of June 30, 2023 and December 31, 2022, the estimated fair value of the eligible investments was approximately $11,799,000 and $12,228,000, respectively. KICO will retain all rights regarding all securities if pledged as collateral. As of June 30, 2023 and December 31, 2022 there was no outstanding balance on the FHLBNY credit line.
| 66 |
| Table of Contents |
Equity Securities
The following table presents a breakdown of the cost and estimated fair value of, and gross gains and losses on, investments in equity securities as of June 30, 2023 and December 31, 2022:
|
| June 30, 2023 |
| |||||||||||||||||
|
|
|
| Gross |
|
| Gross |
|
| Estimated |
|
| % of Estimated |
| ||||||
Category |
| Cost |
|
| Gains |
|
| Losses |
|
| Fair Value |
|
| Fair Value |
| |||||
|
|
|
|
|
|
|
|
|
| |||||||||||
Equity Securities: |
|
|
|
|
|
|
|
|
|
|
|
|
|
|
| |||||
Preferred stocks |
| $ | 13,583,942 |
|
| $ | - |
|
| $ | (3,122,556 | ) |
| $ | 10,461,386 |
|
|
| 72.6 | % |
Common stocks and exchange traded funds |
|
| 4,402,841 |
|
|
| 268,887 |
|
|
| (722,632 | ) |
|
| 3,949,096 |
|
|
| 27.4 | % |
Total |
| $ | 17,986,783 |
|
| $ | 268,887 |
|
| $ | (3,845,188 | ) |
| $ | 14,410,482 |
|
|
| 100.0 | % |
|
| December 31, 2022 |
| |||||||||||||||||
|
|
|
|
| Gross |
|
| Gross |
|
| Estimated |
|
| % of Estimated |
| |||||
Category |
| Cost |
|
| Gains |
|
| Losses |
|
| Fair Value |
|
| Fair Value |
| |||||
|
|
|
|
|
|
|
|
|
|
|
| |||||||||
Equity Securities: |
|
|
|
|
|
|
|
|
|
|
|
|
|
|
| |||||
Preferred stocks |
| $ | 13,583,942 |
|
| $ | - |
|
| $ | (3,589,313 | ) |
| $ | 9,994,629 |
|
|
| 72.2 | % |
Common stocks and exchange traded funds |
|
| 4,502,758 |
|
|
| 158,635 |
|
|
| (821,632 | ) |
|
| 3,839,761 |
|
|
| 27.8 | % |
Total |
| $ | 18,086,700 |
|
| $ | 158,635 |
|
| $ | (4,410,945 | ) |
| $ | 13,834,390 |
|
|
| 100.0 | % |
Other Investments
The following table presents a breakdown of the cost and estimated fair value of, and gross gains on our other investments as of June 30, 2023 and December 31, 2022:
|
| June 30, 2023 |
|
| December 31, 2022 |
| ||||||||||||||||||
|
|
|
|
| Gross |
|
| Estimated |
|
|
|
|
| Gross |
|
| Estimated |
| ||||||
Category |
| Cost |
|
| Gains |
|
| Fair Value |
|
| Cost |
|
| Gains |
|
| Fair Value |
| ||||||
|
|
|
|
|
|
|
|
|
|
|
|
|
|
| ||||||||||
Other Investments: |
|
|
|
|
|
|
|
|
|
|
|
|
|
|
|
|
|
| ||||||
Hedge fund |
| $ | 1,987,040 |
|
| $ | 1,562,500 |
|
| $ | 3,549,540 |
|
| $ | 1,987,040 |
|
| $ | 784,612 |
|
| $ | 2,771,652 |
|
| 67 |
| Table of Contents |
Held-to-Maturity Securities
The following table presents a breakdown of the amortized cost and estimated fair value of, and gross unrealized gains and losses on, investments in held-to-maturity securities as of June 30, 2023 and December 31, 2022:
June 30, 2023 | ||||||||||||||||||||||||
Cost or | Gross | Gross Unrealized Losses | Estimated | % of | ||||||||||||||||||||
Amortized | Unrealized | Less than 12 | More than 12 | Fair | Estimated | |||||||||||||||||||
Category | Cost | Gains | Months | Months | Value | Fair Value | ||||||||||||||||||
Held-to-Maturity Securities: | ||||||||||||||||||||||||
U.S. Treasury securities | $ | 1,228,708 | $ | 27,347 | $ | (36,008 | ) | $ | - | $ | 1,220,047 | 19.5 | % | |||||||||||
Political subdivisions of States, | ||||||||||||||||||||||||
Territories and Possessions | 498,902 | - | (142 | ) | - | 498,760 | 8.0 | % | ||||||||||||||||
Exchange traded debt | 304,111 | - | (62,411 | ) | - | 241,700 | 3.9 | % | ||||||||||||||||
Corporate and other bonds | ||||||||||||||||||||||||
Industrial and miscellaneous | 5,273,310 | - | (4,554 | ) | (963,148 | ) | 4,305,608 | 68.6 | % | |||||||||||||||
Total | $ | 7,305,031 | $ | 27,347 | $ | (103,115 | ) | $ | (963,148 | ) | $ | 6,266,115 | 100.0 | % | ||||||||||
|
| December 31, 2022 |
| |||||||||||||||||||||
|
| Cost or |
|
| Gross |
|
| Gross Unrealized Losses |
|
| Estimated |
|
| % of |
| |||||||||
|
| Amortized |
|
| Unrealized |
|
| Less than 12 |
|
| More than 12 |
|
| Fair |
|
| Estimated |
| ||||||
Category |
| Cost |
|
| Gains |
|
| Months |
|
| Months |
|
| Value |
|
| Fair Value |
| ||||||
|
|
|
|
|
|
|
|
|
|
| ||||||||||||||
Held-to-Maturity Securities: |
|
|
|
|
|
|
|
|
|
|
|
|
|
|
|
|
|
| ||||||
U.S. Treasury securities |
| $ | 1,228,560 |
|
| $ | 28,400 |
|
| $ | (34,077 | ) |
| $ | - |
|
| $ | 1,222,883 |
|
|
| 18.5 | % |
|
|
|
|
|
|
|
|
|
|
|
|
|
|
|
|
|
|
|
|
|
|
|
|
|
Political subdivisions of States, |
|
|
|
|
|
|
|
|
|
|
|
|
|
|
|
|
|
|
|
|
|
|
|
|
Territories and Possessions |
|
| 498,638 |
|
|
| 2,092 |
|
|
| - |
|
|
| - |
|
|
| 500,730 |
|
|
| 7.6 | % |
|
|
|
|
|
|
|
|
|
|
|
|
|
|
|
|
|
|
|
|
|
|
|
|
|
Exchange traded debt |
|
| 304,111 |
|
|
| - |
|
|
| (29,111 | ) |
|
| - |
|
|
| 275,000 |
|
|
| 4.2 | % |
|
|
|
|
|
|
|
|
|
|
|
|
|
|
|
|
|
|
|
|
|
|
|
|
|
Corporate and other bonds |
|
|
|
|
|
|
|
|
|
|
|
|
|
|
|
|
|
|
|
|
|
|
|
|
Industrial and miscellaneous |
|
| 5,734,831 |
|
|
| 36,968 |
|
|
| (809,746 | ) |
|
| (360,278 | ) |
|
| 4,601,775 |
|
|
| 69.7 | % |
|
|
|
|
|
|
|
|
|
|
|
|
|
|
|
|
|
|
|
|
|
|
|
|
|
Total |
| $ | 7,766,140 |
|
| $ | 67,460 |
|
| $ | (872,934 | ) |
| $ | (360,278 | ) |
| $ | 6,600,388 |
|
|
| 100.0 | % |
Held-to-maturity U.S. Treasury securities are held in trust pursuant to various states’ minimum fund requirements.
| 68 |
| Table of Contents |
A summary of the amortized cost and fair value of our investments in held-to-maturity securities by contractual maturity as of June 30, 2023 and December 31, 2022 is shown below:
|
| June 30, 2023 |
|
| December 31, 2022 |
| ||||||||||
|
| Amortized |
|
| Estimated |
|
| Amortized |
|
| Estimated |
| ||||
Remaining Time to Maturity |
| Cost |
|
| Fair Value |
|
| Cost |
|
| Fair Value |
| ||||
|
|
|
|
|
|
|
|
| ||||||||
Less than one year |
| $ | 249,927 |
|
| $ | 249,473 |
|
| $ | 708,535 |
|
| $ | 743,575 |
|
One to five years |
|
| 1,120,894 |
|
|
| 1,084,744 |
|
|
| 1,120,507 |
|
|
| 1,088,522 |
|
Five to ten years |
|
| 1,408,731 |
|
|
| 1,210,185 |
|
|
| 1,402,704 |
|
|
| 1,200,720 |
|
More than 10 years |
|
| 4,525,479 |
|
|
| 3,721,713 |
|
|
| 4,534,394 |
|
|
| 3,567,571 |
|
Total |
| $ | 7,305,031 |
|
| $ | 6,266,115 |
|
| $ | 7,766,140 |
|
| $ | 6,600,388 |
|
Credit Rating of Fixed-Maturity Securities
The table below summarizes the credit quality of our available-for-sale fixed-maturity securities as of June 30, 2023 and December 31, 2022 as rated by Standard & Poor’s (or, if unavailable from Standard & Poor’s, then Moody’s, Fitch, or Kroll):
|
| June 30, 2023 |
|
| December 31, 2022 |
| ||||||||||
|
| Estimated |
|
| Percentage of |
|
| Estimated |
|
| Percentage of |
| ||||
|
| Fair |
|
| Estimated |
|
| Fair |
|
| Estimated |
| ||||
|
| Value |
|
| Fair Value |
|
| Value |
|
| Fair Value |
| ||||
|
|
|
|
|
|
|
|
| ||||||||
Rating |
|
|
|
|
|
|
|
|
|
|
|
| ||||
U.S. Treasury securities |
| $ | 8,133,548 |
|
|
| 5.9 | % |
| $ | 23,869,096 |
|
|
| 15.4 | % |
|
|
|
|
|
|
|
|
|
|
|
|
|
|
|
|
|
Corporate and municipal bonds |
|
|
|
|
|
|
|
|
|
|
|
|
|
|
|
|
AAA |
|
| 1,877,254 |
|
|
| 1.4 | % |
|
| 1,824,478 |
|
|
| 1.2 | % |
AA |
|
| 10,066,478 |
|
|
| 7.3 | % |
|
| 9,785,908 |
|
|
| 6.3 | % |
A |
|
| 32,050,700 |
|
|
| 23.4 | % |
|
| 31,099,075 |
|
|
| 20.2 | % |
BBB+ |
|
| 18,070,287 |
|
|
| 13.1 | % |
|
| 16,682,159 |
|
|
| 10.8 | % |
BBB |
|
| 21,283,056 |
|
|
| 15.4 | % |
|
| 19,664,051 |
|
|
| 12.7 | % |
BBB- |
|
| - |
|
|
| 0.0 | % |
|
| 4,516,713 |
|
|
| 2.9 | % |
Total corporate and municipal bonds |
|
| 83,347,775 |
|
|
| 60.6 | % |
|
| 83,572,384 |
|
|
| 54.1 | % |
|
|
|
|
|
|
|
|
|
|
|
|
|
|
|
|
|
Residential mortgage backed, asset backed, and other collateralized obligations |
|
|
|
|
|
|
|
|
|
|
|
|
|
|
|
|
AAA |
|
| 16,186,523 |
|
|
| 11.7 | % |
|
| 16,497,621 |
|
|
| 10.7 | % |
AA |
|
| 22,491,096 |
|
|
| 16.3 | % |
|
| 23,062,233 |
|
|
| 14.9 | % |
A |
|
| 6,808,837 |
|
|
| 4.9 | % |
|
| 6,722,902 |
|
|
| 4.3 | % |
BBB+ |
|
| 16,457 |
|
|
| 0.0 | % |
|
| - |
|
|
| 0.0 | % |
BBB |
|
| - |
|
|
| 0.0 | % |
|
| 20,067 |
|
|
| 0.0 | % |
CCC |
|
| 435,351 |
|
|
| 0.3 | % |
|
| 457,683 |
|
|
| 0.3 | % |
CC |
|
| 95,270 |
|
|
| 0.1 | % |
|
| 99,600 |
|
|
| 0.1 | % |
D |
|
| - |
|
|
| 0.0 | % |
|
| 40,474 |
|
|
| 0.0 | % |
Non rated |
|
| 340,260 |
|
|
| 0.2 | % |
|
| 373,103 |
|
|
| 0.2 | % |
Total residential mortgage backed, asset backed, and other collateralized obligations |
|
| 46,373,794 |
|
|
| 33.5 | % |
|
| 47,273,683 |
|
|
| 30.5 | % |
|
|
|
|
|
|
|
|
|
|
|
|
|
|
|
|
|
Total |
| $ | 137,855,117 |
|
|
| 100.0 | % |
| $ | 154,715,163 |
|
|
| 100.0 | % |
| 69 |
| Table of Contents |
The table below summarizes the average yield by type of fixed-maturity security as of June 30, 2023 and December 31, 2022:
Category |
| June 30, 2023 |
|
| December 31, 2022 |
| ||
|
|
|
|
|
|
| ||
U.S. Treasury securities and obligations of U.S. government corporations and agencies |
|
| 4.51 | % |
|
| 2.58 | % |
|
|
|
|
|
|
|
|
|
Political subdivisions of States, Territories and Possessions |
|
| 3.46 | % |
|
| 3.58 | % |
|
|
|
|
|
|
|
|
|
Corporate and other bonds Industrial and miscellaneous |
|
| 3.65 | % |
|
| 3.68 | % |
|
|
|
|
|
|
|
|
|
Residential mortgage backed securities |
|
| 2.86 | % |
|
| 2.70 | % |
|
|
|
|
|
|
|
|
|
Total |
|
| 3.44 | % |
|
| 3.20 | % |
The table below lists the weighted average maturity and effective duration in years on our fixed-maturity securities as of June 30, 2023 and December 31, 2022:
|
| June 30, 2023 |
|
| December 31, 2022 |
| ||
Weighted average effective maturity |
|
| 8.9 |
|
|
| 5.8 |
|
|
|
|
|
|
|
|
|
|
Weighted average final maturity |
|
| 13.3 |
|
|
| 13.5 |
|
|
|
|
|
|
|
|
|
|
Effective duration |
|
| 4.6 |
|
|
| 4.5 |
|
Fair Value Consideration
Fair value is the price that would be received to sell an asset or paid to transfer a liability in a transaction involving identical or comparable assets or liabilities between market participants (an “exit price”). The fair value hierarchy distinguishes between inputs based on market data from independent sources (“observable inputs”) and a reporting entity’s internal assumptions based upon the best information available when external market data is limited or unavailable (“unobservable inputs”). The fair value hierarchy prioritizes fair value measurements into three levels based on the nature of the inputs. Quoted prices in active markets for identical assets have the highest priority (“Level 1”), followed by observable inputs other than quoted prices including prices for similar but not identical assets or liabilities (“Level 2”), and unobservable inputs, including the reporting entity’s estimates of the assumption that market participants would use, having the lowest priority (“Level 3”). As of June 30, 2023 and December 31, 2022, 62% and 65%, respectively, of the investment portfolio recorded at fair value was priced based upon quoted market prices.
| 70 |
| Table of Contents |
The table below summarizes the gross unrealized losses of our fixed-maturity securities available-for-sale and equity securities by length of time the security has continuously been in an unrealized loss position as of June 30, 2023 and December 31, 2022:
|
| June 30, 2023 |
| |||||||||||||||||||||||||||||
|
| Less than 12 months |
|
| 12 months or more |
|
| Total |
| |||||||||||||||||||||||
|
| Estimated |
|
|
|
| No. of |
|
| Estimated |
|
|
|
| No. of |
|
| Estimated |
|
|
| |||||||||||
|
| Fair |
|
| Unrealized |
|
| Positions |
|
| Fair |
|
| Unrealized |
|
| Positions |
|
| Fair |
|
| Unrealized |
| ||||||||
Category |
| Value |
|
| Losses |
|
| Held |
|
| Value |
|
| Losses |
|
| Held |
|
| Value |
|
| Losses |
| ||||||||
|
|
|
|
|
|
|
|
|
|
| ||||||||||||||||||||||
Fixed-Maturity Securities: |
|
|
|
|
|
|
|
|
|
|
|
|
|
|
|
|
|
|
|
|
|
|
|
| ||||||||
U.S. Treasury securities and obligations of U.S. government corporations and agencies |
| $ | 5,927,580 |
|
| $ | (59,420 | ) |
|
| 1 |
|
| $ | - |
|
|
| - |
|
|
| - |
|
| $ | 5,927,580 |
|
| $ | (59,420 | ) |
|
|
|
|
|
|
|
|
|
|
|
|
|
|
|
|
|
|
|
|
|
|
|
|
|
|
|
|
|
|
|
|
|
Political subdivisions of States, Territories and Possessions |
|
| 148,703 |
|
|
| (2,652 | ) |
|
| 1 |
|
|
| 13,448,464 |
|
|
| (3,489,849 | ) |
|
| 13 |
|
|
| 13,597,167 |
|
|
| (3,492,501 | ) |
|
|
|
|
|
|
|
|
|
|
|
|
|
|
|
|
|
|
|
|
|
|
|
|
|
|
|
|
|
|
|
|
|
Corporate and other bonds industrial and miscellaneous |
|
| 6,860,908 |
|
|
| (270,230 | ) |
|
| 12 |
|
|
| 64,548,129 |
|
|
| (7,511,387 | ) |
|
| 77 |
|
|
| 71,409,037 |
|
|
| (7,781,617 | ) |
|
|
|
|
|
|
|
|
|
|
|
|
|
|
|
|
|
|
|
|
|
|
|
|
|
|
|
|
|
|
|
|
|
Residential mortgage and other asset backed securities |
|
| 101,701 |
|
|
| (1,621 | ) |
|
| 4 |
|
|
| 41,865,274 |
|
|
| (7,592,927 | ) |
|
| 38 |
|
|
| 41,966,975 |
|
|
| (7,594,548 | ) |
|
|
|
|
|
|
|
|
|
|
|
|
|
|
|
|
|
|
|
|
|
|
|
|
|
|
|
|
|
|
|
|
|
Total fixed-maturity securities |
| $ | 13,038,892 |
|
| $ | (333,923 | ) |
|
| 18 |
|
| $ | 119,861,867 |
|
| $ | (18,594,163 | ) |
|
| 128 |
|
| $ | 132,900,759 |
|
| $ | (18,928,086 | ) |
| 71 |
| Table of Contents |
|
| December 31, 2022 |
| |||||||||||||||||||||||||||||
|
| Less than 12 months |
|
| 12 months or more |
|
| Total |
| |||||||||||||||||||||||
|
| Estimated |
|
|
|
| No. of |
|
| Estimated |
|
|
|
| No. of |
|
| Estimated |
|
|
| |||||||||||
|
| Fair |
|
| Unrealized |
|
| Positions |
|
| Fair |
|
| Unrealized |
|
| Positions |
|
| Fair |
|
| Unrealized |
| ||||||||
Category |
| Value |
|
| Losses |
|
| Held |
|
| Value |
|
| Losses |
|
| Held |
|
| Value |
|
| Losses |
| ||||||||
|
|
|
|
|
|
|
|
|
|
| ||||||||||||||||||||||
Fixed-Maturity Securities: |
|
|
|
|
|
|
|
|
|
|
|
|
|
|
|
|
|
|
|
|
|
|
|
| ||||||||
U.S. Treasury securities and obligations of U.S. government corporations and agencies |
| $ | 18,918,196 |
|
| $ | (6,928 | ) |
|
| 3 |
|
| $ | - |
|
|
| - |
|
|
| - |
|
| $ | 18,918,196 |
|
| $ | (6,928 | ) |
|
|
|
|
|
|
|
|
|
|
|
|
|
|
|
|
|
|
|
|
|
|
|
|
|
|
|
|
|
|
|
|
|
Political subdivisions of States, Territories and Possessions |
|
| 7,970,633 |
|
|
| (2,195,273 | ) |
|
| 9 |
|
|
| 5,170,753 |
|
|
| (1,771,494 | ) |
|
| 5 |
|
|
| 13,141,386 |
|
|
| (3,966,767 | ) |
|
|
|
|
|
|
|
|
|
|
|
|
|
|
|
|
|
|
|
|
|
|
|
|
|
|
|
|
|
|
|
|
|
Corporate and other bonds industrial and miscellaneous |
|
| 56,910,104 |
|
|
| (5,796,994 | ) |
|
| 75 |
|
|
| 15,172,381 |
|
|
| (2,458,985 | ) |
|
| 15 |
|
|
| 72,082,485 |
|
|
| (8,255,979 | ) |
|
|
|
|
|
|
|
|
|
|
|
|
|
|
|
|
|
|
|
|
|
|
|
|
|
|
|
|
|
|
|
|
|
Residential mortgage and other asset backed securities |
|
| 10,145,880 |
|
|
| (882,664 | ) |
|
| 22 |
|
|
| 34,753,178 |
|
|
| (7,150,803 | ) |
|
| 26 |
|
|
| 44,899,058 |
|
|
| (8,033,467 | ) |
|
|
|
|
|
|
|
|
|
|
|
|
|
|
|
|
|
|
|
|
|
|
|
|
|
|
|
|
|
|
|
|
|
Total fixed-maturity securities |
| $ | 93,944,813 |
|
| $ | (8,881,859 | ) |
|
| 109 |
|
| $ | 55,096,312 |
|
| $ | (11,381,282 | ) |
|
| 46 |
|
| $ | 149,041,125 |
|
| $ | (20,263,141 | ) |
| 72 |
| Table of Contents |
There were 146 securities at June 30, 2023 that accounted for the gross unrealized loss of our fixed-maturity securities available-for-sale, none of which were deemed to be credit losses by us. There were 155 securities at December 31, 2022 that accounted for the gross unrealized loss of our fixed-maturity securities available-for-sale, none of which were deemed to be credit losses by us. Significant factors influencing our determination that unrealized losses were temporary included credit quality considerations, the magnitude of the unrealized losses in relation to each security’s cost, the nature of the investment and interest rate environment factors, management’s intent not to sell these securities and it being not more likely than not that we will be required to sell these investments before anticipated recovery of fair value to our cost basis.
Liquidity and Capital Resources
Cash Flows
The primary sources of cash flow are from our insurance underwriting subsidiary, KICO, and include direct premiums written, ceding commissions from our quota share reinsurers, loss recovery payments from our reinsurers, investment income and proceeds from the sale or maturity of investments. Funds are used by KICO for ceded premium payments to reinsurers, which are paid on a net basis after subtracting losses paid on reinsured claims and reinsurance commissions. KICO also uses funds for loss payments and loss adjustment expenses on our net business, commissions to producers, salaries and other underwriting expenses as well as to purchase investments and fixed assets.
The primary source of cash flow for our holding company are dividends received from KICO, which are subject to statutory restrictions. For the six months ended June 30, 2023, KICO paid a dividend of $1,250,000 to us. As of June 30, 2023, KICO had a negative unassigned surplus and currently will not be able to pay any distributions to us without prior regulatory approval.
KICO is a member of the Federal Home Loan Bank of New York (“FHLBNY”), which provides additional access to liquidity. Members have access to a variety of flexible, low cost funding through FHLBNY’s credit products, enabling members to customize advances. Advances are to be fully collateralized; eligible collateral to pledge to FHLBNY includes residential and commercial mortgage backed securities, along with U.S. Treasury and agency securities. See Note 3 – Investments to our condensed consolidated financial statements for eligible collateral held in a designated custodian account available for future advances. Advances are limited to 5% of KICO’s net admitted assets as of the end of the previous quarter, which is March 31, 2023, and are due and payable within 90 days of borrowing. The maximum allowable advance as of June 30, 2023, based on the net admitted assets as of March 31, 2023, was approximately $13,268,000. Available collateral as of June 30, 2023 was approximately $11,799,000. Advances are limited to 85% of the amount of available collateral. There were no borrowings under this facility during the six months ended June 30, 2023.
On December 15, 2022, we issued $19,950,000 of our 2022 Notes pursuant to the Exchange Agreement. We are required to make a mandatory redemption payment with regard to the 2022 Notes on December 30, 2023 in an amount discussed in Note 7 – Debt of the condensed consolidated financial statements included in this Quarterly Report. We are also required to make semi-annual interest payments in arrears on June 30 and December 30 of each year, commencing on June 30, 2023. The maturity date of the 2022 Notes is December 30, 2024.
| 73 |
| Table of Contents |
Cash flow and liquidity are categorized into three sources: (1) operating activities; (2) investing activities; and (3) financing activities, which are shown in the following table:
Six Months ended June 30, |
| 2023 |
|
| 2022 |
| ||
|
|
|
|
|
|
| ||
Cash flows (used in) provided by: |
|
|
|
|
|
| ||
Operating activities |
| $ | (17,009,995 | ) |
| $ | (13,716,630 | ) |
Investing activities |
|
| 17,890,127 |
|
|
| 3,857,225 |
|
Financing activities |
|
| (551,936 | ) |
|
| (1,231,065 | ) |
Net increase (decrease) in cash and cash equivalents |
|
| 328,196 |
|
|
| (11,090,470 | ) |
Cash and cash equivalents, beginning of period |
|
| 11,958,228 |
|
|
| 24,290,598 |
|
Cash and cash equivalents, end of period |
| $ | 12,286,424 |
|
| $ | 13,200,128 |
|
Net cash used in operating activities was $17,010,000 in Six Months 2023 as compared to $13,717,000 used in operating activities in Six Months 2022. The $3,293,000 increase in cash flows used in operating activities in Six Months 2023 as compared to Six Months 2022 was primarily the result of an increase in cash arising from net fluctuations in operating assets and liabilities, partially offset by net income (adjusted for non-cash items) of $412,000. The increase in cash used in operating activities is also partially offset by the payment of $13,245,000 to reinsurers in Six Months 2022 pursuant to the inception of our quota share reinsurance treaty, effective December 31, 2021. The net fluctuations in assets and liabilities are related to operating activities of KICO as affected by growth or declines in its operations, payments on claims and other changes, which are described above.
Net cash provided by investing activities was $17,890,000 in Six Months 2023 compared to $3,857,000 provided by investing activities in Six Months 2022 resulting in a $14,033,000 increase in net cash provided by investing activities. In Six Months 2023, we had net cash provided by our investment portfolio of $18,789,000, compared to $6,398,000 used in Six Months 2022. In addition, we decreased our acquisition of fixed assets by $1,642,000 in Six Months 2023 compared to Six Months 2022.
Net cash used in financing activities was $552,000 in Six Months 2023 compared to $1,231,000 used in Six Months 2022. The $679,000 decrease in net cash used in financing activities was attributable to no dividends being paid to shareholders in Six Months 2023 compared to $851,000 being paid in Six Months 2022 and a $378,000 decrease in withholding taxes paid on the vesting of restricted stock awards. The decreases in cash used in financing activities were partially offset by $536,000 of principal payments on the equipment financing in connection with KICO’s sale-leaseback transaction.
Reinsurance
Effective December 31, 2021, we entered into a quota share reinsurance treaty for our personal lines business, which primarily consists of homeowners’ and dwelling fire policies, covering the period from December 31, 2021 through January 1, 2023 (“2021/2023 Treaty”). Upon the expiration of the 2021/2023 Treaty on January 1, 2023, we entered into a new quota share reinsurance treaty for our personal lines business, covering the period from January 1, 2023 through January 1, 2024 (“2023/2024 Treaty”).
| 74 |
| Table of Contents |
We entered into new excess of loss and catastrophe reinsurance treaties effective July 1, 2023. Effective January 1, 2022, we entered into an underlying excess of loss reinsurance treaty (“Underlying XOL Treaty”) covering the period from January 1, 2022 through January 1, 2023. The Underlying XOL Treaty provides 50% reinsurance coverage for losses of $400,000 in excess of $600,000. Losses from named storms are excluded from the Underlying XOL Treaty. Effective January 1, 2023, the Underlying XOL Treaty was renewed covering the period from January 1, 2023 through January 1, 2024. Material terms for our reinsurance treaties in effect for the treaty years shown below are as follows:
|
| Treaty Period |
| |||||||||||||||||
|
|
|
| 2023/2024 Treaty |
|
| 2021/2023 Treaty |
| ||||||||||||
|
| January 2, |
|
| July 1, |
|
| January 1, |
|
| July 1, |
|
| December 31, |
| |||||
|
| 2024 |
|
| 2023 |
|
| 2023 |
|
| 2022 |
|
| 2021 |
| |||||
|
| to |
|
| to |
|
| to |
|
| to |
|
| to |
| |||||
|
| June 30, |
|
| January 1, |
|
| June 30, |
|
| January 1, |
|
| June 30, |
| |||||
Line of Business |
| 2024 |
|
| 2024 |
|
| 2023 |
|
| 2023 |
|
| 2022 |
| |||||
|
|
|
|
|
|
|
|
|
|
|
|
|
|
|
| |||||
Personal Lines: |
|
|
|
|
|
|
|
|
|
|
|
|
|
|
| |||||
Homeowners, dwelling fire and canine legal liability Quota share treaty: |
|
|
|
|
|
|
|
|
|
|
|
|
|
|
| |||||
Percent ceded (7) |
|
| (6 | ) |
|
| 30 | % |
|
| 30 | % |
|
| 30 | % |
|
| 30 | % |
|
|
|
|
|
|
|
|
|
|
|
|
|
|
|
|
|
|
|
|
|
Risk retained on initial $1,000,000 of losses (5) (6) (7) |
| $ | 1,000,000 |
|
| $ | 700,000 |
|
| $ | 700,000 |
|
| $ | 700,000 |
|
| $ | 700,000 |
|
Losses per occurrence subject to quota share reinsurance coverage |
|
| (6 | ) |
| $ | 1,000,000 |
|
| $ | 1,000,000 |
|
| $ | 1,000,000 |
|
| $ | 1,000,000 |
|
Expiration date |
|
| (6 | ) |
| January 1, 2024 |
|
| January 1, 2024 |
|
| January 1, 2023 |
|
| January 1, 2023 |
| ||||
Excess of loss coverage and facultative facility coverage (1) (5) (6) |
| $ | 8,000,000 |
|
| $ | 8,400,000 |
|
| $ | 8,400,000 |
|
| $ | 8,400,000 |
|
| $ | 8,400,000 |
|
|
| in excess of |
|
| in excess of |
|
| in excess of |
|
| in excess of |
|
| in excess of |
| |||||
|
| $ | 1,000,000 |
|
| $ | 600,000 |
|
| $ | 600,000 |
|
| $ | 600,000 |
|
| $ | 600,000 |
|
Total reinsurance coverage per occurrence (5) (6) |
| $ | 7,000,000 |
|
| $ | 8,500,000 |
|
| $ | 8,500,000 |
|
| $ | 8,500,000 |
|
| $ | 8,500,000 |
|
Losses per occurrence subject to reinsurance coverage |
| $ | 8,000,000 |
|
| $ | 8,000,000 |
|
| $ | 8,000,000 |
|
| $ | 9,000,000 |
|
| $ | 9,000,000 |
|
Expiration date (6) |
| June 30, 2024 |
|
| June 30, 2024 |
|
| June 30, 2023 |
|
| June 30, 2023 |
|
| June 30, 2022 |
| |||||
|
|
|
|
|
|
|
|
|
|
|
|
|
|
|
|
|
|
|
|
|
Catastrophe Reinsurance: |
|
|
|
|
|
|
|
|
|
|
|
|
|
|
|
|
|
|
|
|
Initial loss subject to personal lines quota share treaty (6) |
| $ | 10,000,000 |
|
| $ | 10,000,000 |
|
| $ | 10,000,000 |
|
| $ | 10,000,000 |
|
| $ | 10,000,000 |
|
Risk retained per catastrophe occurrence (6) (7) (8) |
| $ | 10,000,000 |
|
| $ | 8,750,000 |
|
| $ | 8,750,000 |
|
| $ | 7,400,000 |
|
| $ | 7,400,000 |
|
Catastrophe loss coverage in excess of quota share coverage (2) (6) |
| $ | 315,000,000 |
|
| $ | 315,000,000 |
|
| $ | 335,000,000 |
|
| $ | 335,000,000 |
|
| $ | 490,000,000 |
|
|
|
|
|
|
|
|
|
|
|
|
|
|
|
|
|
|
|
|
|
|
Reinstatement premium protection (3) (4) |
| Yes |
|
| Yes |
|
| Yes |
|
| Yes |
|
| Yes |
| |||||
(1) | For personal lines, includes the addition of an automatic facultative facility allowing KICO to obtain homeowners single risk coverage up to $9,000,000 in total insured value, which covers direct losses from $3,500,000 to $9,000,000 through June 30, 2024. |
(2) | Catastrophe coverage is limited on an annual basis to two times the per occurrence amounts. Duration of 168 consecutive hours for a catastrophe occurrence from windstorm, hail, tornado, hurricane and cyclone. |
(3) | For the period December 31, 2021 through June 30, 2022, reinstatement premium protection for $70,000,000 of catastrophe coverage in excess of $10,000,000. |
(4) | For the period July 1, 2022 through June 30, 2023, reinstatement premium protection for $9,800,000 of catastrophe coverage in excess of $10,000,000. For the period July 1, 2023 through June 30, 2024, reinstatement premium protection for $12,500,000 of catastrophe coverage in excess of $10,000,000 |
| 75 |
| Table of Contents |
(5) | For the period January 1, 2022 through January 1, 2024, underlying excess of loss treaty provides 50% reinsurance coverage for losses of $400,000 in excess of $600,000. Reduces retention to $500,000 from $700,000 under the 2021/2023 Treaty and 2022/2023 Treaty. Excludes losses from named storms. |
(6) | Personal lines quota share (homeowners, dwelling fire and canine liability) and underlying excess of loss reinsurance will expire on January 1, 2024; reinsurance coverage in effect from January 2, 2024 through June 30, 2024 is only for excess of loss and catastrophe reinsurance treaties. |
(7) | For the 2021/2023 Treaty, 4% of the 30% total of losses ceded under this treaty are excluded from a named catastrophe event. For the 2023/2024 Treaty, 17.5% of the 30% total of losses ceded under this treaty are excluded from a named catastrophe event. |
(8) | Plus losses in excess of catastrophe coverage |
|
| Treaty Year |
| |||||
Line of Business |
| July 1, 2022 to June 30, 2023 |
|
| July 1, 2021 to June 30, 2022 |
| ||
|
|
|
|
|
|
| ||
Personal Lines: |
|
|
|
|
|
| ||
Personal Umbrella |
|
|
|
|
|
| ||
Quota share treaty: |
|
|
|
|
|
| ||
Percent ceded - first $1,000,000 of coverage |
|
| 90 | % |
|
| 90 | % |
Percent ceded - excess of $1,000,000 dollars of coverage |
|
| 95 | % |
|
| 95 | % |
Risk retained |
| $ | 300,000 |
|
| $ | 300,000 |
|
Total reinsurance coverage per occurrence |
| $ | 4,700,000 |
|
| $ | 4,700,000 |
|
Losses per occurrence subject to quota share reinsurance coverage |
| $ | 5,000,000 |
|
| $ | 5,000,000 |
|
Expiration date |
| June 30, 2023 |
|
| June 30, 2022 |
| ||
Commercial Lines (1)
(1) | Coverage on all commercial lines policies expired in September 2020; reinsurance coverage is based on treaties in effect on the date of loss. |
Inflation
Premiums are established before we know the amount of losses and loss adjustment expenses or the extent to which inflation may affect such amounts. We attempt to anticipate the potential impact of inflation in establishing our reserves, especially as it relates to medical and hospital rates where historical inflation rates have exceeded the general level of inflation. Inflation in excess of the levels we have assumed could cause loss and loss adjustment expenses to be higher than we anticipated, which would require us to increase reserves and reduce earnings.
Fluctuations in rates of inflation also influence interest rates, which in turn impact the market value of our investment portfolio and yields on new investments. Operating expenses, including salaries and benefits, generally are impacted by inflation.
Six Months 2023 included continuing economic inflation, which resulted in a sustained increase in interest rates, a widening of credit spreads, lower public equity valuations, and significant financial market volatility. The higher interest rates and widening of credit spreads previously reduced the value of our fixed income securities, saw a reversal which had previously lowered our stockholders’ equity materially in prior quarters. For Six Months 2023, the continuing economic inflation impacted our loss and loss adjustment expenses as well; should these trends continue in the near-term, it would in all likelihood negatively impact our results of operations.
| 76 |
| Table of Contents |
Off-Balance Sheet Arrangements
We have no off-balance sheet arrangements that have or are reasonably likely to have a current or future effect on our financial condition, changes in financial condition, revenues or expenses, results of operations, liquidity, capital expenditures or capital resources that is material to investors.
Outlook
Our net premiums earned may be impacted by a number of factors. Net premiums earned are a function of net written premium volume. Net written premiums comprise both renewal business and new business and are recognized as earned premium over the term of the underlying policies. Net written premiums from both renewal and new business are impacted by competitive market conditions as well as general economic conditions. We have made underwriting changes to emphasize profitability over growth and have culled out the type of risks that do not generate an acceptable level of return. This action has led, and may continue to lead, to a slowdown in premium growth, particularly in new business.
Item 3. Quantitative and Qualitative Disclosures About Market Risk.
This item is not applicable to smaller reporting companies.
Item 4. Controls and Procedures.
Evaluation of Disclosure Controls and Procedures
We maintain a system of disclosure controls and procedures as defined in Rule 13a-15(e) under the Exchange Act that are designed to assure that information required to be disclosed in the reports we file or submit under the Exchange Act is recorded, processed, summarized and reported within the time periods specified in the SEC’s rules and forms, and that such information is accumulated and communicated to management, including our Chief Executive Officer and Chief Financial Officer, as appropriate, to allow timely decisions regarding required disclosures. Based on this evaluation, our Chief Executive Officer and Chief Financial Officer have concluded that, as of June 30, 2023, our disclosure controls and procedures were: (i) effective in recording, processing, summarizing, and reporting information on a timely basis that we are required to disclose in the reports that we file or submit under the Exchange Act, and (ii) effective in ensuring that information that we are required to disclose in the reports that we file or submit under the Exchange Act is accumulated and communicated to our management, including our Chief Executive Officer and Chief Financial Officer, as appropriate, to allow timely decisions regarding required disclosure.
As required by Exchange Act Rule 13a-15(b), as of the end of the period covered by this Quarterly Report, under the supervision and with the participation of our Chief Executive Officer and Chief Financial Officer, we evaluated the effectiveness of our disclosure controls and procedures. Based on this evaluation, our Chief Executive Officer and Chief Financial Officer concluded that our disclosure controls and procedures were effective as of June 30, 2023.
Changes in Internal Control over Financial Reporting
There have not been any changes in our internal control over financial reporting (as such term is defined in Rules 13a-15(f) and 15d-15(f) under the Exchange Act) during our most recently completed fiscal quarter that materially affected, or are reasonably likely to materially affect, our internal control over financial reporting.
Inherent Limitation on Effectiveness of Controls
Internal control over financial reporting is a process designed by, or under the supervision of, our Chief Executive Officer and Principal Financial Officer, and effected by the board of directors, management, and other personnel, to provide reasonable assurance regarding the reliability of financial reporting and the preparation of financial statements for external purposes in accordance with GAAP including those policies and procedures that: (i) pertain to the maintenance of records that, in reasonable detail, accurately and fairly reflect the transactions and dispositions of our assets, (ii) provide reasonable assurance that transactions are recorded as necessary to permit preparation of financial statements in accordance with GAAP and that receipts and expenditures are being made only in accordance with authorizations of our management and directors, and (iii) provide reasonable assurance regarding prevention or timely detection of unauthorized acquisition, use, or disposition of our assets that could have a material effect on the financial statements.
Because of its inherent limitations, internal control over financial reporting may not prevent or detect misstatements. Also, projections of any evaluation of effectiveness to future periods are subject to the risk that controls may become inadequate because of changes in conditions, or that the degree of compliance with policies and procedures may deteriorate.
| 77 |
| Table of Contents |
PART II. OTHER INFORMATION
Item 1. Legal Proceedings.
None.
Item 1A. Risk Factors.
For a discussion of the Company’s potential risks and uncertainties, see Part I, Item 1A— “Risk Factors” and Part II, Item 7— “Management’s Discussion and Analysis of Financial Condition and Results of Operations” in the Company’s 2022 Annual Report filed with the SEC, and Part I, Item 2—“Management’s Discussion and Analysis of Financial Condition and Results of Operations” herein, in each case as updated by the Company's periodic filings with the SEC. There have been no material changes to the risk factors disclosed in Part I, Item 1A of the Company’s 2022 Annual Report.
Item 2. Unregistered Sales of Equity Securities and Use of Proceeds.
(a) None.
(b) Not applicable.
(c) None.
Item 3. Defaults Upon Senior Securities.
None.
Item 4. Mine Safety Disclosures.
Not applicable.
Item 5. Other Information.
None.
| 78 |
| Table of Contents |
Item 6. Exhibits.
| ||
|
|
|
| ||
|
|
|
| ||
|
|
|
| ||
|
|
|
| ||
|
|
|
| ||
|
|
|
| ||
|
|
|
101.INS |
| XBRL Instance Document |
|
|
|
101.SCH |
| 101.SCH XBRL Taxonomy Extension Schema. |
|
|
|
101.CAL |
| 101.CAL XBRL Taxonomy Extension Calculation Linkbase. |
|
|
|
101.DEF |
| 101.DEF XBRL Taxonomy Extension Definition Linkbase. |
|
|
|
101.LAB |
| 101.LAB XBRL Taxonomy Extension Label Linkbase. |
|
|
|
101.PRE |
| 101.PRE XBRL Taxonomy Extension Presentation Linkbase. |
| ||
+ This exhibit will not be deemed “filed” for purposes of Section 18 of the Securities Exchange Act of 1934, as amended, or otherwise subject to the liability of that section. Such exhibit shall not be deemed incorporated into any filing under the Securities Act of 1933, as amended, or the Securities Act of 1934, as amended. | ||
| 79 |
| Table of Contents |
SIGNATURES
Pursuant to the requirements of the Securities Exchange Act of 1934, the registrant has duly caused this report to be signed on its behalf by the undersigned thereunto duly authorized.
| KINGSTONE COMPANIES, INC. |
| |
|
|
| |
Dated: August 14, 2023 | By: | /s/ Barry B. Goldstein |
|
|
| Barry B. Goldstein Chief Executive Officer |
|
|
|
|
|
Dated: August 14, 2023 | By: | /s/ Jennifer Gravelle |
|
|
| Jennifer Gravelle Chief Financial Officer |
|
| 80 |