UNITED STATES
SECURITIES AND EXCHANGE COMMISSION
Washington, D.C. 20549
FORM 10-K
ANNUAL REPORT PURSUANT TO SECTION 13 OR 15(d) OF THE SECURITIES EXCHANGE ACT OF 1934 | |
FOR THE FISCAL YEAR ENDED DECEMBER 31, 2019
TRANSITION REPORT PURSUANT TO SECTION 13 OR 15(d) OF THE SECURITIES EXCHANGE ACT OF 1934 | |
or
FOR THE TRANSITION PERIOD FROM ___________ TO __________
COMMISSION FILE NUMBER 001-03551
(Exact name of registrant as specified in its charter)
(State or other jurisdiction of incorporation or organization) | (IRS Employer Identification No.) | |
(Address of principal executive offices) | (Zip Code) | ||
Registrant's telephone number, including area code: (412 ) 553-5700
Securities registered pursuant to Section 12(b) of the Act:
Title of each class | Trading symbol(s) | Name of each exchange on which registered | ||
Securities registered pursuant to Section 12(g) of the Act: None
Indicate by check mark if the registrant is a well-known seasoned issuer, as defined in Rule 405 of the Securities Act. Yes ☒ No ☐
Indicate by check mark if the registrant is not required to file reports pursuant to Section 13 or Section 15(d) of the Act. Yes ☐ No ☒
Indicate by check mark whether the registrant: (1) has filed all reports required to be filed by Section 13 or 15(d) of the Securities Exchange Act of 1934 during the preceding 12 months (or for such shorter period that the registrant was required to file such reports), and (2) has been subject to such filing requirements for the past 90 days. Yes ☒ No ☐
Indicate by check mark whether the registrant has submitted electronically every Interactive Data File required to be submitted pursuant to Rule 405 of Regulation S-T (§ 232.405 of this chapter) during the preceding 12 months (or for such shorter period that the registrant was required to submit such files). Yes ☒ No ☐
Indicate by check mark whether the registrant is a large accelerated filer, an accelerated filer, a non-accelerated filer, smaller reporting company or an emerging growth company. See the definitions of "large accelerated filer," "accelerated filer," "smaller reporting company" and "emerging growth company" in Rule 12b-2 of the Exchange Act.
☒ | Accelerated filer | ☐ | |
Non-accelerated filer | ☐ | Smaller reporting company | |
Emerging growth company | |||
If an emerging growth company, indicate by check mark if the registrant has elected not to use the extended transition period for complying with any new or revised financial accounting standards provided pursuant to Section 13(a) of the Exchange Act. ☐
Indicate by check mark whether the registrant is a shell company (as defined in Rule 12b-2 of the Act). Yes ☐ No ☒
The aggregate market value of common stock held by non-affiliates of the registrant as of June 30, 2019: $4.0 billion
The number of shares (in thousands) of common stock outstanding as of February 18, 2020: 255,454
DOCUMENTS INCORPORATED BY REFERENCE
The Company's definitive proxy statement relating to the 2020 annual meeting of shareholders will be filed with the Securities and Exchange Commission within 120 days after the close of the Company's fiscal year ended December 31, 2019 and is incorporated by reference in Part III to the extent described therein.
Table of Contents
Page No. | ||
Glossary of Commonly Used Terms, Abbreviations and Measurements | ||
Cautionary Statements | ||
PART I | ||
Item 1. | Business | |
Item 1A. | Risk Factors | |
Item 1B. | Unresolved Staff Comments | |
Item 2. | Properties | |
Item 3. | Legal Proceedings | |
Item 4. | Mine Safety Disclosures | |
Executive Officers of the Registrant | ||
PART II | ||
Item 5. | Market for Registrant's Common Equity, Related Stockholder Matters and Issuer Purchases of Equity Securities | |
Item 6. | Selected Financial Data | |
Item 7. | Management's Discussion and Analysis of Financial Condition and Results of Operations | |
Item 7A. | Quantitative and Qualitative Disclosures About Market Risk | |
Item 8. | Financial Statements and Supplementary Data | |
Item 9. | Changes in and Disagreements with Accountants on Accounting and Financial Disclosure | |
Item 9A. | Controls and Procedures | |
Item 9B. | Other Information | |
PART III | ||
Item 10. | Directors, Executive Officers and Corporate Governance | |
Item 11. | Executive Compensation | |
Item 12. | Security Ownership of Certain Beneficial Owners and Management and Related Stockholder Matters | |
Item 13. | Certain Relationships and Related Transactions, and Director Independence | |
Item 14. | Principal Accounting Fees and Services | |
PART IV | ||
Item 15. | Exhibits and Financial Statement Schedules | |
Item 16. | Form 10-K Summary | |
Signatures | ||
2
Glossary of Commonly Used Terms, Abbreviations and Measurements
Commonly Used Terms
Appalachian Basin – the area of the United States composed of those portions of West Virginia, Pennsylvania, Ohio, Maryland, Kentucky and Virginia that lie in the Appalachian Mountains.
basis – when referring to commodity pricing, the difference between the futures price for a commodity and the corresponding sales price at various regional sales points. The differential commonly is related to factors such as product quality, location, transportation capacity availability and contract pricing.
British thermal unit – a measure of the amount of energy required to raise the temperature of one pound of water by one degree Fahrenheit.
collar – a financial arrangement that effectively establishes a price range for the underlying commodity. The producer bears the risk and benefit of fluctuation between the minimum (floor) price and the maximum (ceiling) price.
continuous accumulations – natural gas and oil resources that are pervasive throughout large areas, have ill-defined boundaries and typically lack, or are unaffected by, hydrocarbon-water contacts near the base of the accumulation.
development well – a well drilled within the proved area of an oil or gas reservoir to the depth of a stratigraphic horizon known to be productive.
exploratory well – a well drilled to find a new field or new reservoir in a field previously found to be productive of oil or gas in another reservoir. Generally, an exploratory well is any well that is not a development well, an extension well, a service well or a stratigraphic test well.
extension well – a well drilled to extend the limits of a known reservoir.
gas – all references to "gas" in this report refer to natural gas.
gross – "gross" natural gas and oil wells or "gross" acres equal the total number of wells or acres in which the Company has a working interest.
hedging – the use of derivative commodity and interest rate instruments to reduce financial exposure to commodity price and interest rate volatility.
horizontal drilling – drilling that ultimately is horizontal or near horizontal to increase the length of the well bore penetrating the target formation.
horizontal wells – wells that are drilled horizontal or near horizontal to increase the length of the well bore penetrating the target formation.
natural gas liquids (NGLs) – those hydrocarbons in natural gas that are separated from the gas as liquids through the process of absorption, condensation or other methods in gas processing plants. Natural gas liquids include primarily ethane, propane, butane and isobutane.
net – "net" natural gas and oil wells or "net" acres are determined by adding the fractional ownership working interests the Company has in gross wells or acres.
net revenue interest – the interest retained by the Company in the revenues from a well or property after giving effect to all third-party interests (equal to 100% minus all royalties on a well or property).
option – a contract that gives the buyer the right, but not the obligation, to buy or sell a specified quantity of a commodity or other instrument at a specific price within a specified period of time.
play – a proven geological formation that contains commercial amounts of hydrocarbons.
3
productive well – a well that is producing oil or gas or that is capable of production.
proved reserves – quantities of natural gas, NGLs and oil, which, by analysis of geoscience and engineering data, can be estimated with reasonable certainty to be economically producible from a given date forward, from known reservoirs and under existing economic conditions, operating methods and government regulations, prior to the time at which contracts providing the right to operate expire, unless evidence indicates that renewal is reasonably certain, regardless of whether deterministic or probabilistic methods are used for the estimation.
proved developed reserves – proved reserves that can be expected to be recovered through existing wells with existing equipment and operating methods.
proved undeveloped reserves (PUDs) – proved reserves that can be estimated with reasonable certainty to be recovered from new wells on undrilled proved acreage or from existing wells where a relatively major expenditure is required for completion.
reservoir – a porous and permeable underground formation containing a natural accumulation of producible natural gas and/or oil that is confined by impermeable rock or water barriers and is separate from other reservoirs.
service well – a well drilled or completed for the purpose of supporting production in an existing field. Specific purposes of service wells include, among other things, gas injection, water injection and salt-water disposal.
stratigraphic test well – a hole drilled for the sole purpose of gaining structural or stratigraphic information to aid in exploring for oil and gas.
well pad – an area of land that has been cleared and leveled to enable a drilling rig to operate in the exploration and development of a natural gas or oil well.
working interest – an interest that gives the owner the right to drill, produce and conduct operating activities on a property and receive a share of any production.
Abbreviations
CFTC – Commodity Futures Trading Commission |
EPA – U.S. Environmental Protection Agency |
FERC – Federal Energy Regulatory Commission |
GAAP – U.S. Generally Accepted Accounting Principles |
IRS – Internal Revenue Service |
NYMEX – New York Mercantile Exchange |
OTC – over the counter |
SEC – U.S. Securities and Exchange Commission |
4
Measurements
Bbl = barrel |
Bcf = billion cubic feet |
Bcfe = billion cubic feet of natural gas equivalents, with one barrel of NGLs and crude oil being equivalent to 6,000 cubic feet of natural gas |
Btu = one British thermal unit |
Dth = dekatherm or million British thermal units |
Mbbl = thousand barrels |
Mcf = thousand cubic feet |
Mcfe = thousand cubic feet of natural gas equivalents, with one barrel of NGLs and crude oil being equivalent to 6,000 cubic feet of natural gas |
MMbbl = million barrels |
MMBtu = million British thermal units |
MMcf = million cubic feet |
MMcfe = million cubic feet of natural gas equivalents, with one barrel of NGLs and crude oil being equivalent to 6,000 cubic feet of natural gas |
MMDth = million dekatherm |
Tcfe = trillion cubic feet of natural gas equivalents, with one barrel of NGLs and crude oil being equivalent to 6,000 cubic feet of natural gas |
5
CAUTIONARY STATEMENTS
This Annual Report on Form 10-K contains certain forward-looking statements within the meaning of Section 21E of the Securities Exchange Act of 1934, as amended, and Section 27A of the Securities Act of 1933, as amended. Statements that do not relate strictly to historical or current facts are forward-looking and are usually identified by the use of words such as "anticipate," "estimate," "could," "would," "will," "may," "forecast," "approximate," "expect," "project," "intend," "plan," "believe" and other words of similar meaning, or the negative thereof, in connection with any discussion of future operating or financial matters. Without limiting the generality of the foregoing, forward-looking statements contained in this Annual Report on Form 10-K include the matters discussed in sections "Strategy" and "Outlook" in Item 1., "Business," section "Impairment of Oil and Gas Properties" in Item 7., "Management's Discussion and Analysis of Financial Condition and Results of Operations," and the expectations of plans, strategies, objectives and growth and anticipated financial and operational performance of EQT Corporation and its subsidiaries (collectively, EQT or the Company), including guidance regarding the Company's strategy to develop its reserves; drilling plans and programs (including the number, type, depth, spacing, lateral lengths and location of wells to be drilled and the availability of capital to complete these plans and programs); projections of wells to be drilled per combo-development project; estimated reserves, including potential future downward adjustments of reserves and reserve life; total resource potential and drilling inventory duration; projected production and sales volumes and growth rates (including liquids production and sales volumes and growth rates); natural gas prices, changes in basis and the impact of commodity prices on the Company's business; potential future impairments of the Company's assets; the Company's ability to reduce its drilling and completions costs, other costs and expenses, and capital expenditures, and the timing of achieving any such reductions; infrastructure programs; the cost, capacity, and timing of obtaining regulatory approvals; the Company's ability to successfully implement and execute the executive management team's operational, organizational and technological initiatives, and achieve the anticipated results of such initiatives; the projected reduction of the Company's gathering and compression rates resulting from the Company's new consolidated gathering agreement with EQM Midstream Partners, LP, and the anticipated cost savings and other strategic benefits associated with the execution of such agreement; monetization transactions, including asset sales, joint ventures or other transactions involving the Company's assets, and the Company's planned use of the proceeds from any such monetization transactions; acquisition transactions; the projected capital efficiency savings and other operating efficiencies and synergies resulting from the Company's monetization transactions and acquisition transactions, including the Company's ability to achieve the anticipated synergies and efficiencies from its acquisition of Rice Energy Inc. and the Company's ability to achieve the anticipated operational, financial and strategic benefits of the spin-off of Equitrans Midstream Corporation (Equitrans Midstream) from the Company; the timing and structure of any dispositions of the Company's remaining retained shares of Equitrans Midstream's common stock, and the planned use of the proceeds from any such dispositions; the amount and timing of any repurchases of the Company's common stock or outstanding debt securities, including whether the Company will institute a share repurchase program; projected dividend amounts and rates; projected cash flows and free cash flow; projected capital expenditures; liquidity and financing requirements, including funding sources and availability; the Company's ability to maintain or improve its credit ratings, leverage levels and financial profile; the Company's hedging strategy; the effects of litigation, government regulation and tax position; and the expected impact of changes to tax laws. The forward-looking statements included in this Annual Report on Form 10-K involve risks and uncertainties that could cause actual results to differ materially from projected results. Accordingly, investors should not place undue reliance on forward-looking statements as a prediction of actual results. The Company has based these forward-looking statements on current expectations and assumptions about future events, taking into account all information currently known by the Company. While the Company considers these expectations and assumptions to be reasonable, they are inherently subject to significant business, economic, competitive, regulatory and other risks and uncertainties, many of which are difficult to predict and beyond the Company's control. The risks and uncertainties that may affect the operations, performance and results of the Company's business and forward-looking statements include, but are not limited to, those set forth in Item 1A., "Risk Factors" in this Annual Report on Form 10-K and the other documents the Company files from time to time with the SEC.
Any forward-looking statement speaks only as of the date on which such statement is made, and the Company does not intend to correct or update any forward-looking statement, whether as a result of new information, future events or otherwise, except as required by law.
Reserve engineering is a process of estimating underground accumulations of natural gas, NGLs and oil that cannot be measured in an exact way. The accuracy of any reserve estimate depends on the quality of available data, the interpretation of such data and price and cost assumptions made by reserve engineers. In addition, the results of drilling, testing and production activities may justify revisions of estimates that were made previously. If significant, such revisions would change the schedule of any further production and development program. Accordingly, reserve estimates may differ significantly from the quantities of natural gas, NGLs and oil that are ultimately recovered.
In reviewing any agreements incorporated by reference in or filed with this Annual Report on Form 10-K, remember such agreements are included to provide information regarding the terms of such agreements and are not intended to provide any other factual or disclosure information about the Company. The agreements may contain representations and warranties by the Company, which should not in all instances be treated as categorical statements of fact, but rather as a way of allocating the risk to one of the parties to such agreements should those statements prove to be inaccurate. The representations and warranties were intended to be relied upon solely by the applicable party to such agreement and were made only as of the date of the relevant agreement or such other date or dates as may be specified in such agreement and are subject to more recent developments. Accordingly, these representations and warranties alone may not describe the actual state of affairs of the Company or its affiliates as of the date they were made or at any other time and should not be relied upon as statements of fact.
6
PART I
Item 1. Business
General
EQT is a natural gas production company with operations focused in the Marcellus and Utica shales of the Appalachian Basin. Based on average daily sales volumes, EQT is the largest producer of natural gas in the United States. As of December 31, 2019, EQT had 17.5 Tcfe of proved natural gas, NGLs and crude oil reserves across approximately 1.3 million gross acres, including approximately 1.1 million gross acres in the Marcellus play.
Strategy
The Company is dedicated to responsibly developing its world-class asset base in the core of the Appalachian Basin. The Company believes its asset scale and contiguity of its acreage position differentiates it from its Appalachian Basin peers and that its evolution into a modern, digitally-enabled exploration and production business will continue to enhance its strategic advantage.
The Company's unique asset base supports a multi-year inventory of combo-development projects in its core acreage position, which consist of developing multiple wells and pads simultaneously. Following a change in leadership in July 2019, the Company implemented an operational strategy designed to leverage this differentiation to become the lowest cost operator in the Appalachian Basin, primarily by focusing on combo-development projects to maximize operational efficiencies. The Company believes that combo-development projects are key to delivering sustainably low well costs and higher returns on invested capital. Beyond cost benefits, combo-development projects maximize reservoir recoveries, mitigate future curtailments and maximize the capital efficiency of the Company's midstream service providers. The Company expects to drill approximately 13 to 25 wells per combo-development project, with average lateral lengths from 12,000 feet to 14,000 feet. The Company's target Pennsylvania Marcellus well cost is $730 per foot, which the Company expects to achieve in the second half of 2020.
In an effort to further the Company's operational strategy and improve the Company's leverage ratio, in the fourth quarter of 2019, the Company announced a plan to reduce its absolute debt using free cash flow and targeted proceeds from the monetization of select, non-strategic exploration and production assets, core mineral assets and the Company's remaining retained equity interest in Equitrans Midstream (the Deleveraging Plan).
2019 Highlights
• | Substantially reconstituted the Company's Board of Directors and senior leadership following the Company's July 2019 annual meeting of shareholders |
• | Successfully implemented the 100-Day Transformation Plan, a management-led initiative designed to effect operational, organizational, cultural and other changes to the Company's business that will facilitate long-term planning and prioritize combo-development projects, which are expected to (i) lower well costs, selling, general and administrative costs, land and lease acquisitions capital expenditures and other production infrastructure capital expenditures; (ii) increase drilling efficiencies (measured in horizontal feet drilled per hour); and (iii) increase free cash flow generation |
• | Reduced 2019 capital expenditures by $966 million, or 35.3%, compared to 2018 |
• | Achieved 2019 sales volumes of 1,508 Bcfe and average daily sales volumes of 4,131 MMcfe per day, a year-over-year increase of 1.4%, or 4.2% excluding sales volumes related to the 2018 Divestitures (defined herein) |
Outlook
In 2020, the Company expects to spend $1.15 billion to $1.25 billion in total capital expenditures. Planned capital expenditures will be funded by cash generated from operations and allocated as follows: approximately $0.9 billion to reserve development, approximately $150 million to land and lease acquisitions, approximately $85 million to other production infrastructure and approximately $55 million to capitalized overhead. Reserve development capital expenditures will be spent across the Company's three primary operating areas, with approximately 70% spent in Pennsylvania Marcellus, approximately 22% spent in Ohio Utica and approximately 8% spent in West Virginia Marcellus. The Company's 2020 capital expenditure program is expected to deliver sales volumes of 1,450 Bcfe to 1,500 Bcfe, which is in line with 2019 sales volumes, using approximately $500 million less capital funding than the 2019 capital expenditure program.
The Company's revenues, earnings, liquidity and ability to grow are substantially dependent on the prices it receives for, and the Company's ability to develop its reserves of, natural gas, NGLs and oil. Due to the volatility of commodity prices, the Company is unable to predict future potential movements in the market prices for natural gas, NGLs and oil at the Company's ultimate sales
7
points and, thus, cannot predict the ultimate impact of prices on its operations. Changes in natural gas, NGLs and oil prices could affect, among other things, the Company's development plans, which would increase or decrease the pace of the development and the level of the Company's reserves, as well as the Company's revenues, earnings or liquidity. Lower prices and changes in development plans could also result in non-cash impairments in the book value of the Company's oil and gas properties or other long-lived intangible assets or downward adjustments to the Company's estimated proved reserves. Any such impairments or downward adjustments to the Company's estimated reserves could potentially be material to the Company.
See "Impairment of Oil and Gas Properties" and "Critical Accounting Policies and Estimates" included in Item 7., "Management's Discussion and Analysis of Financial Condition and Results of Operations" for a discussion of the Company's accounting policies and significant assumptions related to accounting for oil and gas producing activities and the Company's accounting policies and processes related to impairment reviews for proved and unproved property and goodwill.
Segment and Geographical Information
The Company's operations consist of one reportable segment. The Company has a single, company-wide management team that administers all properties as a whole rather than by discrete operating segments. The Company measures financial performance as a single enterprise and not on an area-by-area basis. Substantially all of the Company's assets and operations are located in the Appalachian Basin.
Reserves
The following tables summarize the Company's proved natural gas, NGLs and crude oil reserves using average first-day-of-the-month closing prices for the prior twelve months and disaggregated by product and play. Substantially all of the Company's reserves reside in continuous accumulations.
December 31, 2019 | ||||||||
Natural Gas | NGLs and Crude Oil | Total | ||||||
(Bcf) | (MMbbl) | (Bcfe) | ||||||
Proved developed reserves | 11,811 | 105 | 12,444 | |||||
Proved undeveloped reserves | 4,866 | 27 | 5,025 | |||||
Total proved reserves | 16,677 | 132 | 17,469 | |||||
December 31, 2019 | ||||||||||||||
Marcellus | Upper Devonian | Ohio Utica | Other | Total | ||||||||||
(Bcfe) | ||||||||||||||
Proved developed reserves | 10,513 | 880 | 947 | 104 | 12,444 | |||||||||
Proved undeveloped reserves | 4,584 | — | 441 | — | 5,025 | |||||||||
Total proved reserves | 15,097 | 880 | 1,388 | 104 | 17,469 | |||||||||
The following table summarizes the Company's proved developed and undeveloped reserves using average first-day-of-the-month closing prices for the prior twelve months and disaggregated by state.
December 31, 2019 | |||||||||||
Pennsylvania | West Virginia | Ohio | Total | ||||||||
(Bcfe) | |||||||||||
Proved developed producing reserves | 8,100 | 2,786 | 879 | 11,765 | |||||||
Proved developed non-producing reserves | 522 | 89 | 68 | 679 | |||||||
Proved undeveloped reserves | 3,883 | 701 | 441 | 5,025 | |||||||
Total proved reserves | 12,505 | 3,576 | 1,388 | 17,469 | |||||||
Gross proved undeveloped drilling locations | 179 | 34 | 38 | 251 | |||||||
Net proved undeveloped drilling locations | 171 | 34 | 29 | 234 | |||||||
8
The Company's total proved reserves decreased by 4,348 Bcfe or 19.7% in 2019 from 2018 due to a downward revision of previously proved reserves of 4,907 Bcfe as a result of changes in the Company's development strategy and the production of 1,508 Bcfe, partly offset by extensions, discoveries and other additions of 2,068 Bcfe.
Following a change in leadership in July 2019, the Company implemented a combo-development strategy that refocused operations in the Company's core assets and is driving the execution of new development sequencing processes that emphasize efficiency and productivity. While these efforts are expected to result in an approximate 25% decrease in well costs, they negatively impact proved undeveloped reserves as a result of (i) derecognizing previously-recorded proved undeveloped reserves that are now not included in the Company's substantially revised five-year capital allocation program for purposes of the Company's reserves calculations and (ii) executing a development sequencing strategy that will result in increased probable-to-proved developed conversion.
The following table provides a rollforward of proved undeveloped reserves.
Proved Undeveloped Reserves | ||
(Bcfe) | ||
Balance at January 1, 2019 | 10,267 | |
Conversions into proved developed reserves | (2,646 | ) |
Revisions (a) | (4,508 | ) |
Extensions, discoveries and other additions (b) | 1,912 | |
Balance at December 31, 2019 | 5,025 | |
(a) | Related to proved undeveloped locations that are no longer expected to be developed within five years of initial booking as proved reserves as a result of implementation of the Company's combo-development strategy. |
(b) | Composed of (i) 1,796 Bcfe from proved undeveloped additions associated with acreage that was previously unproved but became proved due to 2019 reserve development that expanded the number of the Company's technically proven locations, implementation of, and alignment with, the Company's combo-development strategy and revisions to the Company's five-year drilling plan; and (ii) 116 Bcfe from extension of proved undeveloped reserves lateral lengths. |
As of December 31, 2019, the Company had one well with proved undeveloped reserves of 9.1 Bcfe that had remained undeveloped for more than five years. Completion activities for this well are planned for 2020.
See Note 20 to the Consolidated Financial Statements for further discussion of the preparation of, and year-over-year changes in, the Company's reserves estimate.
Based on the Company's mix of proved undeveloped and probable reserves, the Company estimates an undeveloped drilling inventory of approximately 1,565 net locations in Pennsylvania and West Virginia Marcellus. At the Company's current drilling pace, these net locations provide more than 15 years of drilling inventory based on net undeveloped Marcellus acres, average expected lateral length of 12,000 feet and well spacing of 1,000 feet. The Company believes that its change in development strategy, coupled with its undeveloped inventory located in a premier core asset base, will lead to sustainable free cash flow generation and higher returns on invested capital.
The following table summarizes the Company's capital expenditures for reserve development.
Years Ended December 31, | |||||||||||
2019 | 2018 | 2017 | |||||||||
(Millions) | |||||||||||
Marcellus (a) | $ | 1,184 | $ | 1,889 | $ | 1,134 | |||||
Utica | 193 | 360 | 50 | ||||||||
Other | — | — | 21 | ||||||||
Total | $ | 1,377 | $ | 2,249 | $ | 1,205 | |||||
(a) | Includes Upper Devonian formations. |
Lease operating costs, excluding production taxes for the years ended December 31, 2019, 2018 and 2017 was $0.06, $0.07 and $0.13, respectively.
9
Properties
The majority of the Company's acreage is held by lease or occupied under perpetual easements or other rights acquired, for the most part, without warranty of underlying land titles. Approximately 29% of the Company's total gross acres is developed.
The following table summarizes acreage disaggregated by state.
December 31, 2019 | ||||||||||||||
Pennsylvania | West Virginia (a) | Ohio | Kentucky and Virginia (a) | Total | ||||||||||
Total gross productive acreage | 216,887 | 107,368 | 45,211 | 2,235 | 371,701 | |||||||||
Total gross undeveloped acreage | 434,496 | 396,189 | 46,690 | 24,685 | 902,060 | |||||||||
Total gross acreage | 651,383 | 503,557 | 91,901 | 26,920 | 1,273,761 | |||||||||
Total net productive acreage | 214,933 | 107,804 | 31,875 | 2,163 | 356,775 | |||||||||
Total net undeveloped acreage | 398,155 | 298,788 | 32,454 | 22,344 | 751,741 | |||||||||
Total net acreage | 613,088 | 406,592 | 64,329 | 24,507 | 1,108,516 | |||||||||
Average net revenue interest of proved developed reserves | 80.7 | % | 78.3 | % | 43.8 | % | — | % | 75.3 | % | ||||
(a) | In 2018, the Company sold approximately 2.5 million non-core, net acres in the Huron play; however, the Company retained deep drilling rights across 1.5 million, 0.2 million and 0.8 million of divested acreage in Kentucky, Virginia and West Virginia, respectively. The retained deep drilling rights have been excluded from acreage totals. |
The Company has an active lease renewal program in areas targeted for development. In the event that production is not established or the Company takes no action to extend or renew the terms of its leases, 77,444, 50,145 and 52,332 of the Company's net undeveloped acreage as of December 31, 2019 will expire in the years ended December 31, 2020, 2021 and 2022, respectively.
The following tables summarize the Company's productive and in-process natural gas wells. The Company had no productive or in-process oil wells as of December 31, 2019.
December 31, 2019 | ||
Productive wells: | ||
Total gross | 3,404 | |
Total net | 3,181 | |
In-process wells: | ||
Total gross | 186 | |
Total net | 178 | |
December 31, 2019 | |||||||||||
Pennsylvania | West Virginia | Ohio | Total | ||||||||
Total gross productive wells (a) | 1,913 | 1,234 | 257 | 3,404 | |||||||
Total net productive wells | 1,865 | 1,193 | 123 | 3,181 | |||||||
(a) | Of the Company's total gross productive wells, there are 688 gross conventional wells in Pennsylvania and 623 gross conventional wells in West Virginia. There are no gross conventional wells in Ohio. |
10
The following table summarizes the net exploratory and development wells drilled. There were no net productive exploratory wells drilled during the years ended December 31, 2019, 2018 and 2017.
Years Ended December 31, | ||||||||
2019 | 2018 | 2017 | ||||||
Net exploratory wells: | ||||||||
Dry | — | — | 1 | |||||
Net development wells: | ||||||||
Productive | 145 | 210 | 149 | |||||
Dry (a) | — | 5 | 5 | |||||
(a) | Dry development wells are related primarily to non-core wells that the Company no longer plans to drill to depth or complete, acquired wells with mechanical integrity issues and wells that have been plugged and abandoned due to future mining operations or mechanical integrity issues. |
During 2019, the Company commenced drilling operations (spud) on 122 gross wells (114 net), including 89 Pennsylvania Marcellus gross wells (87 net), 6 West Virginia Marcellus gross wells (6 net) and 27 Ohio Utica gross wells (21 net). The Company's Pennsylvania and West Virginia Marcellus wells have average depths of 5,000 feet to 8,500 feet. The Company's Ohio Utica wells have average depths of 8,500 feet to 10,500 feet. The Company retains deep drilling rights on the majority of its acreage.
Sales volumes in 2019 from the Marcellus play, including the Upper Devonian play, were 1,270 Bcfe. The following table summarizes produced and sold volumes by state and reflects the effect of the Company's 2018 sale of approximately 2.5 million non-core, net acres in the Huron play and Permian Basin assets located in Texas (collectively, the 2018 Divestitures) and 2017 acquisition of Rice Energy Inc. (the Rice Merger).
Pennsylvania | West Virginia | Ohio | Other (a) | Total | ||||||||||
(MMcfe) | ||||||||||||||
Produced and sold natural gas, NGLs and oil for the years ended December 31, | ||||||||||||||
2019 | 1,001,973 | 274,378 | 231,545 | — | 1,507,896 | |||||||||
2018 | 922,033 | 323,976 | 209,428 | 32,252 | 1,487,689 | |||||||||
2017 | 456,600 | 343,199 | 24,113 | 63,608 | 887,520 | |||||||||
(a) | Primarily Kentucky and Virginia. |
Markets and Customers
Natural Gas Sales. Natural gas is a commodity and, therefore, the Company typically receives market-based pricing. The market price for natural gas in the Appalachian Basin is typically lower relative to NYMEX Henry Hub, Louisiana (the location for pricing NYMEX natural gas futures) as a result of the significant increases in the supply of natural gas in the Northeast United States in recent years. To protect cash flow from undue exposure to the risk of changing commodity prices, the Company hedges a portion of its forecasted natural gas production at, for the most part, NYMEX natural gas prices. For information on the Company's hedging strategy and its derivative instruments, refer to "Commodity Risk Management" in Item 7., "Management's Discussion and Analysis of Financial Condition and Results of Operations," Item 7A., "Quantitative and Qualitative Disclosures About Market Risk" and Note 4 to the Consolidated Financial Statements.
NGLs Sales. The Company primarily sells NGLs recovered from its natural gas production. The Company primarily contracts with MarkWest Energy Partners, L.P. (MarkWest) to process its natural gas and extract from the produced natural gas heavier hydrocarbon streams (consisting predominately of ethane, propane, isobutane, normal butane and natural gasoline). The Company also contracts with MarkWest to market a portion of the Company's NGLs. In addition, the Company has contractual arrangements with Williams Ohio Valley Midstream LLC to process its natural gas and market a portion of its NGLs.
11
Average Sales Price. The following table presents the Company's average sales price per unit of natural gas, NGLs and oil, with and without the effects of cash settled derivatives as applicable.
Years Ended December 31, | |||||||||||
2019 | 2018 | 2017 | |||||||||
Natural gas ($/Mcf): | |||||||||||
Average sales price, excluding cash settled derivatives | $ | 2.48 | $ | 3.04 | $ | 2.82 | |||||
Average sales price, including cash settled derivatives | 2.65 | 2.89 | 2.89 | ||||||||
NGLs, excluding ethane ($/Bbl): | |||||||||||
Average sales price, excluding cash settled derivatives | $ | 23.63 | $ | 37.63 | $ | 31.59 | |||||
Average sales price, including cash settled derivatives | 25.82 | 36.56 | 30.90 | ||||||||
Ethane ($/Bbl): | |||||||||||
Average sales price, excluding cash settled derivatives | $ | 6.16 | $ | 8.09 | $ | 6.32 | |||||
Average sales price, including cash settled derivatives | 7.18 | 8.09 | 6.32 | ||||||||
Oil ($/Bbl): | |||||||||||
Average sales price | $ | 40.90 | $ | 52.70 | $ | 40.70 | |||||
Natural gas, NGLs and oil ($/Mcfe): | |||||||||||
Average sales price, excluding cash settled derivatives | $ | 2.51 | $ | 3.15 | $ | 2.98 | |||||
Average sales price, including cash settled derivatives | 2.69 | 3.01 | 3.04 | ||||||||
For additional information on pricing, see "Average Realized Price Reconciliation" in Item 7., "Management's Discussion and Analysis of Financial Condition and Results of Operations."
Natural Gas Marketing. EQT Energy, LLC, the Company's indirect, wholly-owned marketing subsidiary, provides marketing services and contractual pipeline capacity management services primarily for the benefit of the Company. EQT Energy, LLC also engages in risk management and hedging activities on behalf of the Company to limit the Company's exposure to shifts in market prices.
Customers. The Company sells natural gas and NGLs to marketers, utilities and industrial customers located in the Appalachian Basin and in markets that are accessible through the Company's transportation portfolio, particularly where there is expected future demand growth, such as in the Gulf Coast, Midwest and Northeast United States and Canada. As of December 31, 2019, approximately 60% of Company sales volumes reach markets outside of Appalachia. Following the Mountain Valley Pipeline's in-service date, which is currently expected to be January 1, 2021, approximately 80% of Company sales volumes are expected to reach markets outside of Appalachia.
The Company has access to approximately 2.9 Bcf per day of firm contractual pipeline takeaway capacity and 0.6 Bcf per day of firm processing capacity. In addition, the Company is committed to an initial 1.29 Bcf per day of firm capacity on the Mountain Valley Pipeline upon its in-service date. These firm transportation and processing agreements may require minimum volume delivery commitments, which the Company expects to principally fulfill with existing proved developed and proved undeveloped reserves. The following table summarizes the Company's delivery commitments for the next five years as of December 31, 2019.
Natural Gas | NGLs | ||||
Years ended December 31, | (Bcf) | (Mbbl) | |||
2020 | 1,073 | 4,123 | |||
2021 | 833 | 1,836 | |||
2022 | 610 | 1,832 | |||
2023 | 534 | 1,825 | |||
2024 | 455 | 1,830 | |||
No single customer accounted for more than 10% of the Company's total operating revenues for 2019, 2018 and 2017.
12
Seasonality
Generally, but not always, the demand for natural gas decreases during the summer months and increases during the winter months. Seasonal anomalies such as mild winters or hot summers may also impact demand.
Competition
Other natural gas producers compete with the Company in the acquisition of properties, the search for, and development of, reserves, the production and sale of natural gas and NGLs and the securing of services, labor, equipment and transportation required to conduct operations. The Company's competitors include independent oil and gas companies, major oil and gas companies and individual producers, operators and marketing companies.
Regulation
Regulation of the Company's Operations. The Company's exploration and production operations are subject to various types of federal, state and local laws and regulations, including regulations related to the following: the location of wells; the method of drilling, well construction, well stimulation, hydraulic fracturing and casing design; water withdrawal and procurement for well stimulation purposes; well production; spill prevention plans; the use, transportation, storage and disposal of fluids and materials incidental to oil and gas operations; surface usage and the reclamation of properties upon which wells or other facilities have been located; the plugging and abandoning of wells; the calculation, reporting and disbursement of royalties and taxes; and the gathering of production in certain circumstances. These regulations, and any delays in obtaining related authorizations, may affect the costs and timing of developing the Company's natural gas resources.
The Company's operations are also subject to conservation and correlative rights regulations, including the following: regulation of the size of drilling and spacing units or field rule units; setbacks; the number of wells that may be drilled in a unit or in close proximity to other wells; drilling in the vicinity of coal mining operations and certain other structures; and the unitization or pooling of natural gas properties. Ohio and, for Utica or other deep wells, West Virginia allow the statutory pooling or unitization of tracts to facilitate development and exploration. In West Virginia, the Company must rely on voluntary pooling of lands and leases for Marcellus and Upper Devonian acreage. In 2013, the Pennsylvania legislature enacted lease integration legislation, which authorizes joint development of existing contiguous leases. In addition, state conservation and oil and gas laws generally limit the venting or flaring of natural gas. Various states also impose certain regulatory requirements to transfer wells to third parties or discontinue operations in the event of divestitures by the Company.
The Company maintains limited gathering operations that are subject to various types of federal and state environmental laws and local zoning ordinances, including the following: air permitting requirements for compressor station and dehydration units and other permitting requirements; erosion and sediment control requirements for compressor station and pipeline construction projects; waste management requirements and spill prevention plans for compressor stations; various recordkeeping and reporting requirements for air permits and waste management practices; compliance with safety regulations, including regulations by the Department of Transportation's Pipeline and Hazardous Materials Safety Administration; and siting and noise regulations for compressor stations. These regulations may increase the costs of operating existing pipelines and compressor stations and increase the costs of, and the time to develop, new or expanded pipelines and compressor stations.
In 2010, Congress adopted comprehensive financial reform legislation that established federal oversight and regulation of the OTC derivative market and entities, such as the Company, that participate in that market. The legislation, known as the Dodd-Frank Wall Street Reform and Consumer Protection Act (the Dodd-Frank Act), required the CFTC, the SEC and other regulatory agencies to promulgate rules and regulations implementing this legislation. As of the filing date of this Annual Report on Form 10-K, the CFTC had adopted and implemented many final rules that impose regulatory obligations on all market participants, including the Company, such as recordkeeping and certain reporting obligations. Other CFTC rules that may be relevant to the Company have yet to be finalized. Because significant CFTC rules relevant to natural gas hedging activities have not been adopted or implemented, it is not possible at this time to predict the full extent of the impact of the regulations on the Company's hedging program or regulatory compliance obligations. The Company has experienced increased, and anticipates additional, compliance costs and changes to current market practices as participants continue to adapt to a changing regulatory environment.
Regulators periodically review or audit the Company's compliance with applicable regulatory requirements. The Company anticipates that compliance with existing laws and regulations governing current operations will not have a material adverse effect upon its capital expenditures, earnings or competitive position. Additional proposals that affect the oil and gas industry are regularly considered by Congress, the states, regulatory agencies and the courts. The Company cannot predict when or whether any such proposals may become effective or the effect that such proposals may have on the Company.
13
The following is a summary of some of the existing laws, rules and regulations to which the Company's business operations are subject.
Natural Gas Sales and Transportation. The availability, terms and cost of transportation significantly affect sales of oil and natural gas. The interstate transportation and sale for resale of oil and natural gas is subject to federal regulation, including regulation of the terms, conditions and rates for interstate transportation, storage and various other matters, primarily by the FERC. Federal and state regulations govern the price and terms for access to oil and natural gas pipeline transportation. The FERC's regulations for interstate oil and natural gas transmission in some circumstances may also affect the intrastate transportation of oil and natural gas.
Historically, federal legislation and regulatory controls have affected the price of the natural gas the Company produces and the manner in which the Company markets its production. The FERC has jurisdiction over the transportation and sale for resale of natural gas in interstate commerce by natural gas companies under the Natural Gas Act of 1938 (NGA) and the Natural Gas Policy Act of 1978. Various federal laws enacted since 1978 have resulted in the removal of all price and non-price controls for sales of domestic natural gas sold in first sales, which include all of the Company's sales of its own production. Under the Energy Policy Act of 2005, the FERC has substantial enforcement authority to prohibit the manipulation of natural gas markets and enforce its rules and orders, including the ability to assess substantial civil penalties of over $1 million per day for each violation and disgorgement of profits associated with any violation. While the Company's production activities have not been regulated by the FERC as a natural gas company under the NGA, the Company is required to report aggregate volumes of natural gas purchased or sold at wholesale to the extent such transactions use, contribute to or may contribute to the formation of price indices. In addition, Congress may enact legislation or the FERC may adopt regulations that may subject certain of the Company's otherwise non-FERC jurisdictional facilities to further regulation. Failure to comply with those regulations in the future could subject the Company to civil penalty liability.
The CFTC also holds authority to monitor certain segments of the physical and futures energy commodities market including oil and natural gas. With regard to physical purchases and sales of natural gas and other energy commodities, and any related hedging activities that the Company undertakes, the Company is thus required to observe anti-market manipulation and disruptive trading practices laws and related regulations enforced by the FERC and/or the CFTC. The CFTC also holds substantial enforcement authority, including the ability to assess civil penalties.
The FERC also regulates interstate natural gas transportation rates and service conditions and establishes the terms under which the Company may use interstate natural gas pipeline capacity, which affects the marketing of natural gas that the Company produces, as well as the revenues the Company receives for sales of natural gas and release of its natural gas pipeline capacity. Commencing in 1985, the FERC promulgated a series of orders, regulations and rule makings that significantly fostered competition in the business of transporting and marketing gas. Today, interstate pipeline companies are required to provide nondiscriminatory transportation services to producers, marketers and other shippers, regardless of whether such shippers are affiliated with an interstate pipeline company. The FERC's initiatives have led to the development of a competitive, open access market for natural gas purchases and sales that permits all purchasers of natural gas to buy gas directly from third-party sellers other than pipelines. However, the natural gas industry historically has been very heavily regulated; therefore, the Company cannot guarantee that the less stringent regulatory approach currently pursued by the FERC and Congress will continue indefinitely into the future nor can the Company determine what effect, if any, future regulatory changes might have on the Company's natural gas-related activities.
Under the FERC's current regulatory regime, transmission services must be provided on an open-access, nondiscriminatory basis at cost-based rates or negotiated rates, both of which are subject to FERC approval. The FERC also allows jurisdictional gas pipeline companies to charge market-based rates if the transportation market at issue is sufficiently competitive. Gathering service, which occurs upstream of FERC-jurisdictional transmission services, is regulated by the states onshore and in state waters. Section 1(b) of the NGA exempts natural gas gathering facilities from regulation by the FERC as a natural gas company under the NGA. Although the FERC has set forth a general test for determining whether facilities perform a non-jurisdictional gathering function or a jurisdictional transmission function, the FERC's determinations as to the classification of facilities are done on a case-by-case basis. To the extent that the FERC issues an order that reclassifies certain jurisdictional transmission facilities as non-jurisdictional gathering facilities, and, depending on the scope of that decision, the Company's costs of transporting gas to point of sale locations may increase. The Company believes that the third-party natural gas pipelines on which its gas is gathered meet the traditional tests the FERC has used to establish a pipeline's status as a gatherer not subject to regulation as a natural gas company. However, the distinction between the FERC-regulated transmission services and federally unregulated gathering services could be subject to potential litigation, so the classification and regulation of those gathering facilities are subject to change based on future determinations by the FERC, the courts or Congress. State regulation of natural gas gathering facilities generally includes various occupational safety, environmental and, in some circumstances, nondiscriminatory-take requirements. Although such regulation has not generally been affirmatively applied by state agencies, natural gas gathering may receive greater regulatory scrutiny in the future.
14
Oil and NGLs Price Controls and Transportation Rates. Sales prices of oil and NGLs are not currently regulated and are made at market prices. The Company's sales of these commodities are, however, subject to laws and to regulations issued by the Federal Trade Commission (FTC) prohibiting manipulative or fraudulent conduct in the wholesale petroleum market. The FTC holds substantial enforcement authority under these regulations, including the ability to assess civil penalties of over $1 million per day per violation. The Company's sales of these commodities, and any related hedging activities, are also subject to CFTC oversight as discussed above.
The price the Company receives from the sale of these products may be affected by the cost of transporting the products to market. Some of the Company's transportation of oil and NGLs is through FERC-regulated interstate common carrier pipelines. Effective as of January 1, 1995, the FERC implemented regulations generally grandfathering all previously approved interstate transportation rates and establishing an indexing system for those rates by which adjustments are made annually based on the rate of inflation, subject to certain conditions and limitations. The FERC's regulation of crude oil and NGLs transportation rates may tend to increase the cost of transporting crude oil and NGLs by interstate pipelines, although the annual adjustments may result in decreased rates in a given year. Every five years, the FERC must examine the relationship between the annual change in the applicable index and the actual cost changes experienced in the oil pipeline industry. The Company is not able at this time to predict the effects of these regulations or FERC proceedings, if any, on the transportation costs associated with crude oil production from the Company's crude oil producing operations.
Environmental, Health and Safety Regulation. The business operations of the Company are also subject to numerous stringent federal, state and local environmental, health and safety laws and regulations pertaining to, among other things, the release, emission or discharge of materials into the environment; the generation, storage, transportation, handling and disposal of materials (including solid and hazardous wastes); the safety of employees and the general public; pollution; site remediation; and preservation or protection of human health and safety, natural resources, wildlife and the environment. The Company must take into account environmental, health and safety regulations in, among other things, planning, designing, constructing, operating and plugging and abandoning wells and related facilities. Violations of these laws can result in substantial administrative, civil and criminal penalties. These laws and regulations may require the acquisition of permits before drilling or other regulated activity commences, restrict the types, quantities and concentrations of various substances that can be released into the environment in connection with drilling and production, govern the sourcing and disposal of water used in the drilling and completion process, limit or prohibit drilling activities in certain areas and on certain lands lying within wilderness, wetlands, frontier and other protected areas or areas with endangered or threatened species restrictions, require some form of remedial action to prevent or mitigate pollution from former operations such as plugging abandoned wells or closing earthen pits, establish specific safety and health criteria addressing worker protection and impose substantial liabilities for pollution resulting from operations or failure to comply with applicable laws and regulations. In addition, these laws and regulations may restrict the rate of production.
Moreover, the trend has been for stricter regulation of activities that have the potential to affect the environment. Additional proposals and proceedings that affect the oil and natural gas industry are regularly considered by Congress, federal agencies, the states, local governments, and the courts. The Company cannot predict when or whether any such proposals may become effective. Therefore, the Company is unable to predict the future costs or impact of compliance. The regulatory burden on the industry increases the cost of doing business and affects profitability. The Company has established procedures, however, for the ongoing evaluation of its operations to identify potential environmental exposures and to track compliance with regulatory policies and procedures.
The following is a summary of the more significant existing environmental and occupational health and workplace safety laws and regulations, as amended from time to time, to which the Company's business operations are subject and for which compliance may have a material adverse impact on the Company's financial condition, earnings or cash flows.
Hazardous Substances and Waste Handling. The Comprehensive Environmental Response, Compensation, and Liability Act (CERCLA), also known as the "Superfund" law, and comparable state laws impose liability, without regard to fault or the legality of the original conduct, on certain classes of persons that are considered to have contributed to the release of a "hazardous substance" into the environment. These persons include the current and past owner or operator of the disposal site or the site where the release occurred and companies that disposed or arranged for the disposal of the hazardous substances at the site where the release occurred. Under CERCLA, such persons may be subject to joint and several strict liability for the costs of cleaning up the hazardous substances that have been released into the environment and for damages to natural resources, and it is not uncommon for neighboring landowners and other third parties to file claims for personal injury and property damage allegedly caused by the hazardous substances released into the environment. In addition, despite the "petroleum exclusion" of Section 101(14) of CERCLA, which currently encompasses crude oil and natural gas, the Company generates materials in the course of its operations that may be regulated as hazardous substances based on their characteristics; however, the Company is unaware of any liabilities arising under CERCLA for which the Company may be held responsible that would materially and adversely affect the Company.
15
The Resource Conservation and Recovery Act (RCRA) and analogous state laws establish detailed requirements for the generation, handling, storage, treatment and disposal of nonhazardous and hazardous solid wastes. RCRA specifically excludes drilling fluids, produced waters, and other wastes associated with the exploration, development, or production of crude oil, natural gas or geothermal energy from regulation as hazardous wastes. However, these wastes may be regulated by the EPA, or state agencies under RCRA's less stringent nonhazardous solid waste provisions, or under state laws or other federal laws. Moreover, it is possible that these particular oil and natural gas exploration, development and production wastes now classified as nonhazardous solid wastes could be classified as hazardous wastes in the future. Recently, in April 2019, following litigation and a resulting consent decree related to the EPA's requirements under RCRA to review oil and gas waste regulations, the EPA determined that revisions to the regulations were not required, concluding that any adverse effects related to oil and gas waste were more appropriately and readily addressed within the framework of existing state regulatory programs. Any changes to state programs could result in an increase in the Company's costs to manage and dispose waste, which could have a material adverse effect on the Company's results of operations and financial condition.
The Company currently owns, leases, or operates numerous properties that have been used for oil and natural gas exploration and production activities for many years. Although the Company believes that it has used operating and waste disposal practices that were standard in the industry at the time, hazardous substances, wastes, or petroleum hydrocarbons may have been released on, under or from the properties owned or leased by the Company, or on, under or from other locations, including offsite locations, where such substances have been taken for recycling or disposal. In addition, some of the Company's properties have been operated by third parties or by previous owners or operators whose treatment and disposal of hazardous substances, wastes, or petroleum hydrocarbons was not under the Company's control. The Company is able to control directly the operation of only those wells with respect to which the Company acts or has acted as operator. The failure of a prior owner or operator to comply with applicable environmental regulations may, in certain circumstances, be attributed to the Company as current owner or operator under CERCLA. These properties and the substances disposed or released on, under or from them may be subject to CERCLA, RCRA and analogous state laws. Under such laws, the Company could be required to undertake response or corrective measures, regardless of fault, which could include removal of previously disposed substances and wastes, cleanup of contaminated property or performance of remedial plugging or waste pit closure operations to prevent future contamination.
Water Discharges. The Federal Water Pollution Control Act, or the Clean Water Act (CWA), and comparable state laws impose restrictions and strict controls regarding the discharge of pollutants, including produced waters and other oil and natural gas wastes, into federal and state waters. The discharge of pollutants into regulated waters is prohibited, except in accordance with the terms of a permit issued by the EPA or a state equivalent agency. The discharge of dredge and fill material in regulated waters, including wetlands, is also prohibited, unless authorized by a permit issued by the U.S. Army Corps of Engineers (Corps). In June 2015, the EPA and the Corps issued a final rule defining the scope of the EPA's and the Corps' jurisdiction over waters of the United States (WOTUS), but several legal challenges to the rule followed, and the WOTUS rule was stayed nationwide in October 2015 pending resolution of the legal challenges. The EPA and the Corps proposed a rule in July 2017 to repeal the WOTUS rule and announced their intent to issue a new rule defining the CWA's jurisdiction. In January 2018, the U.S. Supreme Court issued a decision finding that jurisdiction to hear challenges to the WOTUS rule resides with the federal district courts, which lifted the stay and resulted in a patchwork application of the rule in some states, but not in others. In October 2019, the EPA issued a final rule repealing the WOTUS rule and the repeal rule became effective in December 2019. The repeal rule has already been challenged in federal district courts in New Mexico, New York, and South Carolina. In January 2020, the EPA and the Corps announced the final rule redefining the definition of WOTUS. The new definition narrows the scope of waters that are covered as jurisdictional under the CWA. Several groups have already announced their intention to challenge the new rule. As a result, future implementation is uncertain at this time. To the extent a stay of this rule or the implementation of a revised rule expands the scope of the CWA's jurisdiction, the Company could face increased costs and delays with respect to obtaining permits for dredge and fill activities in wetland areas, which could delay the development of the Company's natural gas and oil projects. Also, pursuant to these laws and regulations, the Company may be required to obtain and maintain approvals or permits for the discharge of wastewater or stormwater and to develop and implement spill prevention, control and countermeasure (SPCC) plans in connection with on-site storage of significant quantities of oil. These laws and any implementing regulations provide for administrative, civil and criminal penalties for any unauthorized discharges of oil and other substances in reportable quantities and may impose substantial potential liability for the costs of removal, remediation and damages.
Air Emissions. The federal Clean Air Act (CAA) and comparable state laws regulate the emission of air pollutants from many sources, such as, for example, tank batteries and compressor stations, through air emissions standards, construction and operating permitting programs and the imposition of other compliance requirements. These laws and regulations may require the Company to obtain pre‑approval for the construction or modification of certain projects or facilities expected to produce or significantly increase air emissions, obtain and strictly comply with stringent air permit requirements or use specific equipment or technologies to control emissions of certain pollutants, the costs of which could be significant. The need to obtain permits has the potential to delay the development of the Company's oil and natural gas projects. Over the next several years, the Company may be required to incur certain capital expenditures for air pollution control equipment or other air emissions-related issues. For example, although
16
all counties in which the Company operates are currently in attainment with the 2015 National Ambient Air Quality Standard (NAAQS) for ozone, these determinations may be revised in the future. Reclassification of areas or imposition of more stringent standards may make it more difficult to construct new facilities or modify existing facilities in any newly designated non-attainment areas. Compliance with more stringent standards and other environmental regulations could delay or prohibit the Company's ability to obtain permits for its operations or require the Company to install additional pollution control equipment, the costs of which could be significant.
Climate Change and Regulation of "Greenhouse Gas" Emissions. In response to findings that emissions of carbon dioxide, methane and other greenhouse gases (GHG) present an endangerment to public health and the environment, the EPA has adopted regulations under existing provisions of the CAA that, among other things, establish Prevention of Significant Deterioration (PSD) construction and Title V operating permit reviews for certain large stationary sources that are already potential major sources of certain principal, or criteria, pollutant emissions. Facilities required to obtain PSD permits for their GHG emissions are required to meet "best available control technology" standards established by the states or, in some cases, by the EPA on a case‑by‑case basis. These CAA requirements could adversely affect the Company's operations and restrict or delay the Company's ability to obtain air permits for new or modified sources. In addition, the EPA has adopted rules requiring the monitoring and reporting of GHG emissions from specified onshore and offshore oil and gas production sources in the United States on an annual basis, which include certain of the Company's operations.
In June 2016, the EPA finalized new regulations that established New Source Performance Standards (NSPS), known as Subpart OOOOa, for methane and volatile organic compounds (VOC) from new and modified oil and natural gas production and natural gas processing and transmission facilities. In September 2018, the EPA proposed amendments to the 2016 Subpart OOOOa standards that would reduce the 2016 rule's fugitive emissions monitoring requirements and expand exceptions to pneumatic pump requirements, among other changes. Various industry and environmental groups have separately challenged both the methane requirements and the EPA's attempts to delay the implementation of the rule. In addition, in April 2018, several states filed a lawsuit seeking to compel the EPA to issue methane performance standards for existing sources in the oil and natural gas source category. In November 2019, the EPA issued a proposed rulemaking to revise Subpart OOOOa to rescind the methane-specific requirements for certain oil and natural gas sources in the production and processing segments. As a result of the actions described above, the Company cannot predict with certainty the scope of any final methane regulations or the costs for complying with federal methane regulations.
At the state level, several states have proceeded with regulation targeting GHG emissions. For example, in June 2018, the Pennsylvania Department of Environmental Protection (PADEP) released revised versions of GP-5 and GP-5A, Pennsylvania's general air permits applicable to processing plants and well site operations, among other facilities. These permits apply to new or modified sources constructed on or after August 8, 2018, with emissions below certain specified thresholds. GP-5 and GP-5A impose "best available technology" (BAT) standards, which are in addition to, and in many cases more stringent than, the federal NSPS. These BAT standards include a 200 ton per year limit on methane emissions, above which a BAT requirement for methane emissions control applies. Moreover, in December 2019, the Pennsylvania Environmental Quality Board (EQB) approved a proposed rulemaking for the control of emissions of VOCs and other pollutants for existing sources. Upon publication in the Pennsylvania Bulletin, the PADEP will accept public comments on the proposed rulemaking. A final rulemaking could be submitted to and approved by the EQB in late 2020. State regulations such as these could impose increased compliance costs on the Company's operations.
While Congress has from time to time considered legislation to reduce emissions of GHGs, there has not been significant activity in the form of federal legislation in recent years. In the absence of such federal climate legislation, a number of state and regional efforts have emerged that are aimed at tracking and/or reducing GHG emissions by means of cap-and-trade programs that typically require major sources of GHG emissions, such as electric power plants, to acquire and surrender emission allowances in return for emitting GHGs. In October 2019, Pennsylvania Governor Tom Wolf signed an Executive Order directing the PADEP to draft regulations establishing a cap-and-trade program under its existing authority to regulate air emissions, with the intent of enabling Pennsylvania to join the Regional Greenhouse Gas Initiative (RGGI), a multi-state regional cap-and-trade program comprised of several Eastern U.S. states. Subsequently, legislators in the Pennsylvania General Assembly introduced a bill that, if approved, would require legislative approval by both chambers of the Pennsylvania General Assembly in order for Pennsylvania to join the RGGI. The EQB also accepted an economy-wide cap-and-trade petition for study in April 2019. The PADEP is evaluating the petition and will provide a recommendation to the EQB that could result in a state-wide cap-and-trade program across all sectors of the economy. If Pennsylvania ultimately becomes a member of the RGGI, or otherwise implements a cap-and-trade program, it could result in increased operating costs if the Company is required to purchase emission allowances in connection with its operations.
On an international level, the United States is one of almost 200 nations that, in December 2015, agreed to an international climate change agreement in Paris, France, that calls for countries to set their own GHG emissions targets and be transparent about the
17
measures each country will use to achieve its GHG emissions targets (Paris Agreement). The Paris Agreement was signed by the United States in April 2016 and entered into force on November 4, 2016; however, the Paris Agreement does not impose any binding obligations on its participants. In August 2017, the U.S. Department of State officially informed the United Nations of the United States' intent to withdraw from the Paris Agreement. The Paris Agreement provides for a four-year exit process beginning when it took effect in November 2016, which would result in an effective exit date of November 2020. The United States' adherence to the exit process and/or the terms on which the United States may reenter the Paris Agreement or a separately negotiated agreement are unclear at this time.
Although it is not possible at this time to predict how legislation or new regulations that may be adopted to address GHG emissions would impact the Company's business, any such future laws and regulations imposing reporting obligations on, or limiting emissions of GHGs from, the Company's equipment and operations could require the Company to incur costs to reduce emissions of GHGs associated with the Company's operations. Substantial limitations on GHG emissions could also adversely affect demand for the oil and natural gas the Company produces and lower the value of its reserves.
Notwithstanding potential risks related to climate change, the International Energy Agency estimates that oil and gas will continue to represent a major share of global energy use through 2040, and other private sector studies project continued growth in demand for the next two decades. However, recent activism directed at shifting funding away from companies with energy-related assets could result in limitations or restrictions on certain sources of funding for the energy sector. Moreover, activist shareholders have introduced proposals that may seek to force companies to adopt aggressive emission reduction targets or to shift away from more carbon-intensive activities. While the Company cannot predict the outcomes of such proposals, they could ultimately make it more difficult to engage in exploration and production activities.
Finally, it should be noted that a number of scientists have concluded that increasing concentrations of GHGs in the Earth's atmosphere may produce climate changes that have significant physical effects, such as increased frequency and severity of storms, floods, droughts, and other extreme climatic events; if any such effects were to occur, they have the potential to cause physical damage to the Company's assets or affect the availability of water and thus could have an adverse effect on the Company's exploration and production operations.
Hydraulic Fracturing Activities. Vast quantities of natural gas deposits exist in shale and other formations. It is customary in the Company's industry to recover natural gas from these shale formations through the use of hydraulic fracturing, combined with sophisticated horizontal drilling. Hydraulic fracturing is the process of creating or expanding cracks, or fractures, in formations underground where water, sand and other additives are pumped under high pressure into a shale gas formation. These deeper formations are geologically separated and isolated from fresh ground water supplies by overlying rock layers. The Company's well construction practices include installation of multiple layers of protective steel casing surrounded by cement that are specifically designed and installed to protect freshwater aquifers. To assess water sources near the Company's drilling locations, the Company conducts baseline and, as appropriate, post-drilling water testing at all water wells within at least 2,500 feet of the Company's drilling pads.
Hydraulic fracturing typically is regulated by state oil and natural gas agencies, but the EPA has asserted federal regulatory authority pursuant to the federal Safe Drinking Water Act (SDWA) over certain hydraulic fracturing activities involving the use of diesel fuels and issued permitting guidance in February 2014 regarding such activities. The EPA also finalized rules in June 2016 to prohibit the discharge of wastewater from hydraulic fracturing operations to publicly owned wastewater treatment plants.
Certain governmental reviews have been conducted or are underway that focus on the environmental aspects of hydraulic fracturing practices. For example, in December 2016, the EPA released its final report on the potential impacts of hydraulic fracturing on drinking water resources. The final report concluded that "water cycle" activities associated with hydraulic fracturing may impact drinking water resources "under some circumstances," noting that the following hydraulic fracturing water cycle activities and local- or regional-scale factors are more likely than others to result in more frequent or more severe impacts: water withdrawals for fracturing in times or areas of low water availability; surface spills during the management of fracturing fluids, chemicals or produced water; injection of fracturing fluids into wells with inadequate mechanical integrity; injection of fracturing fluids directly into groundwater resources; discharge of inadequately treated fracturing wastewater to surface waters; and disposal or storage of fracturing wastewater in unlined pits. Because the report did not find a direct link between hydraulic fracturing itself and contamination of groundwater resources, this years-long study report does not appear to provide any basis for further regulation of hydraulic fracturing at the federal level.
In addition, Congress has from time to time considered legislation to provide for federal regulation of hydraulic fracturing under the SDWA and to require disclosure of the chemicals used in the hydraulic fracturing process. At the state level, several states have adopted or are considering legal requirements that could impose more stringent permitting, disclosure, and well construction requirements on hydraulic fracturing activities. For example, in January 2016, the PADEP issued new rules establishing stricter
18
disposal requirements for wastes associated with hydraulic fracturing activities, which include, among other things, a requirement to obtain new permits, or closure, of centralized impoundments used for the storage of drill cuttings and waste fluids. Further, these rules include requirements relating to storage tank security, secondary containment for storage vessels, construction rules for gathering lines and horizontal drilling under streams, and temporary transport lines for freshwater and wastewater. Additionally, in January 2020, the EQB approved a well permit fee increase from $5,000 to $12,500 for all unconventional wells. Local governments also may seek to adopt ordinances within their jurisdictions regulating the time, place and manner of drilling activities in general or hydraulic fracturing activities in particular. Some states and municipalities have sought to ban hydraulic fracturing altogether. If new or more stringent federal, state, or local legal restrictions relating to the hydraulic fracturing process are adopted in areas where the Company operates, the Company could incur potentially significant added costs to comply with such requirements, experience delays or curtailment in the pursuit of exploration, development, or production activities, and perhaps even be precluded from constructing wells.
Occupational Safety and Health Act. The Company is also subject to the requirements of the federal Occupational Safety and Health Act (OSHA), as amended, and comparable state laws that regulate the protection of the health and safety of employees. In addition, OSHA's hazard communication standard, the Emergency Planning and Community Right to Know Act and implementing regulations and similar state statutes and regulations require that information be maintained about hazardous materials used or produced in the Company's operations and that this information be provided to employees, state and local government authorities, and citizens.
Endangered Species Act. The federal Endangered Species Act (ESA) provides for the protection of endangered and threatened species. Pursuant to the ESA, if a species is listed as threatened or endangered, restrictions may be imposed on activities adversely affecting that species' habitat. Similar protections are offered to migratory birds under the Migratory Bird Treaty Act. The U.S. Fish and Wildlife Service (FWS) may designate critical habitat and suitable habitat areas that it believes are necessary for survival of a threatened or endangered species. A critical habitat or suitable habitat designation could result in further material restrictions to federal land use and may materially delay or prohibit access to protected areas for natural gas and oil development. Further, the designation of previously unprotected species as threatened or endangered in areas where underlying property operations are conducted could cause the Company to incur increased costs arising from species protection measures or could result in limitations on the Company's exploration and production activities that could have an adverse impact on the Company's ability to develop and produce reserves.
See Note 16 to the Consolidated Financial Statements for a description of expenditures related to environmental matters.
Employees
The Company and its subsidiaries had 647 employees as of December 31, 2019; none are subject to a collective bargaining agreement.
Availability of Reports
The Company makes certain filings with the SEC, including its Annual Report on Form 10-K, Quarterly Reports on Form 10-Q, Current Reports on Form 8-K and all amendments and exhibits to those reports, available free of charge through its website, http://www.eqt.com, as soon as reasonably practicable after they are filed with or furnished to the SEC. Reports filed with the SEC are also available on the SEC's website, http://www.sec.gov.
Composition of Operating Revenues
The following table presents operating revenues for each class of products and services.
Years Ended December 31, | |||||||||||
2019 | 2018 | 2017 | |||||||||
(Thousands) | |||||||||||
Operating revenues: | |||||||||||
Sales of natural gas, NGLs and oil | $ | 3,791,414 | $ | 4,695,519 | $ | 2,651,318 | |||||
Gain (loss) on derivatives not designated as hedges | 616,634 | (178,591 | ) | 390,021 | |||||||
Net marketing services and other | 8,436 | 40,940 | 49,681 | ||||||||
Total operating revenues | $ | 4,416,484 | $ | 4,557,868 | $ | 3,091,020 | |||||
19
Jurisdiction and Year of Formation
The Company is a Pennsylvania corporation formed in 2008 in connection with a holding company reorganization of the former Equitable Resources, Inc.
Item 1A. Risk Factors
In addition to the other information contained in this Annual Report on Form 10-K, the following risk factors should be considered in evaluating our business and future prospects. Note that additional risks not presently known to us or that are currently considered immaterial may also have a negative impact on our business and operations. If any of the events or circumstances described below actually occurs, our business, financial condition or results of operations could suffer and the trading price of our common stock could decline.
Natural gas, NGLs and oil price volatility, or a prolonged period of low natural gas, NGLs and oil prices, may have an adverse effect upon our revenue, profitability, future rate of growth, liquidity and financial position.
Our revenue, profitability, future rate of growth, liquidity and financial position depend upon the prices for natural gas, NGLs and oil. The prices for natural gas, NGLs and oil have historically been volatile, and we expect this volatility to continue in the future. The prices are affected by a number of factors beyond our control, which include:
• | weather conditions and seasonal trends; |
• | the domestic and foreign supply of and demand for natural gas, NGLs and oil; |
• | prevailing prices on local price indexes in the areas in which we operate and expectations about future commodity prices; |
• | national and worldwide economic and political conditions; |
• | new and competing exploratory finds of natural gas, NGLs and oil; |
• | changes in U.S. exports of natural gas, NGLs and oil; |
• | the effect of energy conservation efforts; |
• | the price, availability and acceptance of alternative fuels; |
• | the availability, proximity, capacity and cost of pipelines, other transportation facilities, and gathering, processing and storage facilities and other factors that result in differentials to benchmark prices; |
• | technological advances affecting energy consumption and production; |
• | the actions of the Organization of Petroleum Exporting Countries; |
• | the level and effect of trading in commodity futures markets, including commodity price speculators and others; |
• | the cost of exploring for, developing, producing and transporting natural gas, NGLs and oil; |
• | the level of global inventories; |
• | risks associated with drilling, completion and production operations; and |
• | domestic, local and foreign governmental regulations, tariffs and taxes, including environmental and climate change regulation. |
The daily spot prices for NYMEX Henry Hub natural gas ranged from a high of $4.12 per MMBtu to a low of $1.82 per MMBtu from January 1, 2019 through December 31, 2019, and the daily spot prices for NYMEX West Texas Intermediate crude oil ranged from a high of $66.24 per barrel to a low of $46.31 per barrel during the same period. In addition, the market price for natural gas in the Appalachian Basin continues to be lower relative to NYMEX Henry Hub as a result of the significant increases in the supply of natural gas in the Northeast United States in recent years. Because our production and reserves predominantly consist of natural gas (approximately 95% of equivalent proved developed reserves), changes in natural gas prices have significantly greater impact on our financial results than oil prices. NGLs are made up of ethane, propane, isobutane, normal butane and natural gasoline, all of which have different uses and different pricing characteristics, which adds further volatility to the pricing of NGLs. Due to the volatility of commodity prices, we are unable to predict future potential movements in the market prices for natural gas, NGLs and oil at the Company's ultimate sales points and thus cannot predict the ultimate impact of prices on our operations.
Prolonged low, and/or significant or extended declines in, natural gas, NGLs and oil prices may adversely affect our revenues, operating income, cash flows and financial position, particularly if we are unable to control our development costs during periods of lower natural gas, NGLs and oil prices. Declines in prices could also adversely affect our drilling activities and the amount of natural gas, NGLs and oil that we can produce economically, which may result in our having to make significant downward adjustments to the value of our assets and could cause us to incur non-cash impairment charges to earnings. Reductions in cash flows from lower commodity prices may require us to incur additional borrowings or to reduce our capital spending, which could reduce our production and our reserves, negatively affecting our future rate of growth. Lower prices for natural gas, NGLs and oil may also adversely affect our credit ratings and result in a reduction in our borrowing capacity and access to other capital. See "Impairment of Oil and Gas Properties" in Item 7., "Management's Discussion and Analysis of Financial Condition and Results
20
of Operations" and "Natural gas, NGLs and oil price declines, and changes in our development strategy, have resulted in impairment of certain of our assets. Future declines in commodity prices, increases in operating costs or adverse changes in well performance or additional changes in our development strategy may result in additional write-downs of the carrying amounts of our assets, including long-lived intangible assets, which could materially and adversely affect our results of operations in future periods." We are also exposed to the risk of non-performance by our hedge counterparties in the event that changes, positive or negative, in natural gas prices result in our derivative contracts having a positive fair value in our favor. Further, adverse economic and market conditions could negatively affect the collectability of our trade receivables and cause our hedge counterparties to be unable to perform their obligations or to seek bankruptcy protection.
Increases in natural gas, NGLs and oil prices may be accompanied by or result in increased well drilling costs, increased production taxes, increased lease operating expenses, increased volatility in seasonal gas price spreads for our storage assets and increased end-user conservation or conversion to alternative fuels. Significant natural gas price increases may subject us to margin calls on our commodity price derivative contracts (hedging arrangements, including swap, collar and option agreements and exchange-traded instruments), which would potentially require us to post significant amounts of cash collateral with our hedge counterparties. The cash collateral provided to our hedge counterparties, which is interest-bearing, is returned to us in whole or in part upon a reduction in forward market prices, depending on the amount of such reduction, or in whole upon settlement of the related derivative contract. In addition, to the extent we have hedged our current production at prices below the current market price, we are unable to benefit fully from an increase in the price of natural gas.
Drilling for and producing natural gas and oil are high-risk and costly activities with many uncertainties. Our future financial position, cash flows and results of operations will depend on the success of our development and acquisition activities, which are subject to numerous risks beyond our control, including the risk that drilling will not result in commercially viable natural gas or oil production or that we will not recover all or any portion of our investment in such wells.
Many factors may curtail, delay or cancel our scheduled drilling projects, including the following:
• | delays imposed by or resulting from compliance with regulatory requirements, including limitations resulting from permitting, wastewater disposal, discharge of greenhouse gases, and limitations on hydraulic fracturing; |
• | shortages of or delays in obtaining equipment, rigs, materials and qualified personnel or in obtaining water for hydraulic fracturing activities; |
• | equipment failures, accidents or other unexpected operational events; |
• | lack of available gathering and water facilities or delays in construction of gathering and water facilities; |
• | lack of available capacity on interconnecting transmission pipelines; |
• | adverse weather conditions, such as flooding, droughts, freeze-offs, slips, blizzards and ice storms; |
• | issues related to compliance with environmental regulations; |
• | environmental hazards, such as natural gas leaks, oil spills, pipeline and tank ruptures, encountering naturally occurring radioactive materials, and unauthorized discharges of brine, well stimulation and completion fluids, toxic gases or other pollutants into the surface and subsurface environment; |
• | declines in natural gas, NGLs and oil market prices; |
• | limited availability of financing at acceptable terms; |
• | ongoing litigation or adverse court rulings; |
• | public opposition to our operations; |
• | title, surface access, coal mining and right of way problems; and |
• | limitations in the market for natural gas, NGLs and oil. |
Any of these risks can cause a delay in our development program or result in substantial losses, including personal injury or loss of life, damage to or destruction of property, natural resources and equipment, pollution, environmental contamination or loss of wells and other regulatory penalties.
Further, our decisions to purchase, explore or develop prospects or properties will depend in part on the evaluation of data obtained through geophysical and geological analyses, production data and engineering studies, the results of which are often inconclusive or subject to varying interpretations. For a discussion of the uncertainty involved in these processes, see "Our proved reserves are estimates that are based on many assumptions that may prove to be inaccurate. Any significant change in these underlying assumptions will greatly affect the quantities and present value of our reserves." In addition, our cost of drilling, completing and operating wells is often uncertain before drilling commences.
21
Our drilling locations are scheduled out over many years, making them susceptible to uncertainties that could materially alter the occurrence or timing of their drilling. In addition, we may not be able to raise the substantial amount of capital that would be necessary to drill our drilling locations.
Our management team has specifically identified and scheduled certain well locations as an estimation of our future multi-year drilling activities on our existing acreage. These well locations represent a significant part of our business strategy. Our ability to drill and develop these locations depends on a number of uncertainties, including natural gas, NGLs and oil prices, the availability and cost of capital, drilling and production costs, the availability of drilling services and equipment, drilling results, lease expirations, topography, gathering system and pipeline transportation costs and constraints, access to and availability of water sourcing and distribution systems, coordination with coal mining, regulatory approvals and other factors. Because of these uncertain factors, we do not know if the drilling locations we have identified will ever be drilled or if we will be able to produce natural gas, NGLs or oil from these or any other drilling locations. In addition, unless production is established within the spacing units covering the undeveloped acres on which some of the potential locations are obtained, the leases for such acreage will expire. Further, certain of the horizontal wells we intend to drill in the future may require pooling or unitization with adjacent leaseholds controlled by third parties. If these third parties are unwilling to pool or unitize such leaseholds with ours, the total locations we can drill may be limited. As such, our actual drilling activities may materially differ from those presently identified.
In addition, we will require significant additional capital over a prolonged period in order to pursue the development of these locations, and we may not be able to raise or generate the capital required to do so. Any drilling activities we are able to conduct on these potential locations may not be successful, may not increase our overall production levels and proved reserves or may result in a downward revision of our estimated proved reserves, which could have a material adverse effect on our future business and results of operations. For more information on our drilling locations, see Item 1., "Business."
The amount and timing of actual future natural gas, NGLs and oil production is difficult to predict and may vary significantly from our estimates, which may reduce our earnings.
Because the rate of production from natural gas and oil wells, and associated NGLs, generally declines as reserves are depleted, our future success depends upon our ability to develop additional oil and gas reserves that are economically recoverable and to optimize existing well production, and our failure to do so may reduce our earnings. Additionally, a failure to effectively and efficiently operate existing wells may cause production volumes to fall short of our projections. Our drilling and subsequent maintenance of wells can involve significant risks, including those related to timing, cost overruns and operational efficiency, and these risks can be affected by the availability of capital, leases, rigs, equipment, a qualified work force, and adequate capacity for the treatment and recycling or disposal of waste water generated in our operations, as well as weather conditions, natural gas, NGLs and oil price volatility, government approvals, title and property access problems, geology, equipment failure or accidents and other factors. Drilling for natural gas and oil can be unprofitable, not only from dry wells, but from productive wells that perform below expectations or do not produce sufficient revenues to return a profit. Low natural gas, NGLs and oil prices may further limit the types of reserves that we can develop and produce economically.
Except to the extent that we acquire additional properties containing proved reserves, conduct successful exploration and development activities or, through engineering studies, identify additional behind-pipe zones or secondary recovery reserves, our proved reserves will decline as reserves are produced. Future natural gas, NGLs and oil production, therefore, is highly dependent upon our level of success in acquiring or finding additional reserves that are economically recoverable. We cannot be certain that we will be able to find or acquire and develop additional reserves at an acceptable cost. Without continued successful development or acquisition activities, together with efficient operation of existing wells, our reserves and production, together with associated revenues, will decline as a result of our current reserves being depleted by production.
Our proved reserves are estimates that are based on many assumptions that may prove to be inaccurate. Any significant change in these underlying assumptions will greatly affect the quantities and present value of our reserves.
Reserve engineering is a subjective process involving estimates of underground accumulations of natural gas, NGLs and oil and assumptions concerning future prices, production levels and operating and development costs, some of which are beyond our control. These estimates and assumptions are inherently imprecise, and we may adjust our estimates of proved reserves based on changes in these estimates or assumptions. As a result, estimated quantities of proved reserves and projections of future production rates and the timing of development expenditures may prove to be inaccurate. Any significant variance from our assumptions could greatly affect our estimates of reserves, the economically recoverable quantities of natural gas, NGLs and oil, the classifications of reserves based on risk of recovery and estimates of the future net cash flows. To the extent we experience a sustained period of reduced commodity prices, there is a risk that a portion of our proved reserves could be deemed uneconomic and no longer be classified as proved. Although we believe our estimates are reasonable, actual production, revenues and costs to develop reserves will likely vary from estimates and these variances could be material. Numerous changes over time to the
22
assumptions on which our reserve estimates are based, as described above, often result in the actual quantities of natural gas, NGLs and oil we ultimately recover being different from our reserve estimates.
The standardized measure of discounted future net cash flows from our proved reserves is not the same as the current market value of our estimated natural gas, NGLs and crude oil reserves.
You should not assume that the standardized measure of discounted future net cash flows from our proved reserves is the current market value of our estimated natural gas, NGLs and crude oil reserves. In accordance with SEC requirements, we based the discounted future net cash flows from our proved reserves on the twelve-month unweighted arithmetic average of the first-day-of-the-month price for the preceding twelve months without giving effect to derivative transactions. Actual future net cash flows from our properties will be affected by factors such as the actual prices we receive for natural gas, NGLs and oil, the amount, timing and cost of actual production and changes in governmental regulations or taxation. The timing of both our production and our incurrence of expenses in connection with the development and production of oil and gas properties will affect the timing and amount of actual future net revenues from proved reserves, and thus their actual present value. In addition, the 10% discount factor we use when calculating the standardized measure may not be the most appropriate discount factor based on interest rates in effect from time to time and risks associated with our operations or the natural gas, NGLs and oil industry in general.
We are under the leadership of a substantially reconstituted Board of Directors and a new executive management team who have implemented a variety of operational, organizational, cultural and other changes to our business and reserves development strategy, and we may not be able to achieve some or all of the anticipated benefits from the transformation plan or reserves development strategy.
Our Board of Directors was substantially reconstituted at our annual meeting of shareholders on July 10, 2019 and, following that meeting, Toby Z. Rice was appointed as President and Chief Executive Officer. Thereafter, our new executive management team implemented a detailed transformation plan designed to effect operational, organizational, cultural and other changes to our business in order to lower operating costs and increase free cash flow generation through improved efficiency, well performance and the use of technology, with a primary focus on repositioning the Company to effectively execute on large-scale combo-development projects, which consist of developing multiple wells and pads simultaneously. We may not realize some or all of the anticipated strategic, financial, operational or other benefits from this transformation plan. Additionally, we cannot be certain that we will be able to successfully execute combo-development projects at the pace and scale that we project, which may delay or reduce our production and our reserves, negatively affecting our associated revenues.
Strategic determinations, including the allocation of capital and other resources to strategic opportunities, are challenging, and our failure to appropriately allocate capital and resources among our strategic opportunities may adversely affect our financial position and reduce our future prospects.
Our future prospects are dependent upon our ability to identify optimal strategies for our business. In developing our business plan, we considered allocating capital and other resources to various aspects of our business, including well development, reserve acquisitions, corporate items, leasehold maintenance and other alternatives. We also considered our likely sources of capital. Notwithstanding the determinations made in the development of our business plan, business opportunities not previously identified periodically come to our attention, including possible acquisitions and dispositions. If we fail to identify and execute optimal business strategies, including the appropriate corporate structure and appropriate rate of reserve development, or fail to optimize our capital investment and capital raising opportunities and the use of our other resources in furtherance of our business strategies, our financial position and growth rate may be adversely affected. Moreover, economic or other circumstances may change from those contemplated by our business plan, and our failure to recognize or respond to those changes may limit our ability to achieve our objectives.
We may not be able to successfully execute our plan to deleverage our business or otherwise reduce our debt level.
In the fourth quarter of 2019, we announced the Deleveraging Plan. There can be no assurance that we will be able to find attractive asset monetization opportunities or that any such transactions will be completed on our anticipated timeframe, if at all. Furthermore, our estimated value for the assets to be monetized under the Deleveraging Plan involves multiple assumptions and judgments about future events that are inherently uncertain; accordingly, there can be no assurance that the resulting net cash proceeds from asset monetization transactions will be as anticipated, even if such transactions are consummated. Some of the factors that could affect our ability to successfully execute the Deleveraging Plan include changes in the financial condition or prospects of prospective purchasers and the availability of financing to potential purchasers on reasonable terms, the number of prospective purchasers, the number of competing assets on the market, unfavorable economic conditions, industry trends and changes in laws and regulations. If we are not able to successfully execute the Deleveraging Plan or otherwise reduce absolute debt to a level we believe
23
appropriate, our credit ratings may be lowered, we may reduce or delay our planned capital expenditures or investments, and we may revise or delay our strategic plans.
Our exploration and production operations have substantial capital requirements, and we may not be able to obtain needed capital or financing on satisfactory terms.
Our business is capital intensive. We make and expect to continue to make substantial capital expenditures for the development and acquisition of natural gas, NGLs and oil reserves. We typically fund our capital expenditures with existing cash and cash generated by operations and, to the extent our capital expenditures exceed our cash resources, from borrowings under our revolving credit facility and other external sources of capital. If we do not have sufficient borrowing availability under our revolving credit facility, we may seek alternate debt or equity financing, sell assets or reduce our capital expenditures. The issuance of additional indebtedness would require that a portion of our cash flow from operations be used for the payment of interest and principal on our indebtedness, thereby reducing our ability to use cash flow from operations to fund working capital, capital expenditures and acquisitions. The actual amount and timing of our future capital expenditures may differ materially from our estimates as a result of, among other things, natural gas prices, actual drilling results, the availability of drilling rigs and other services and equipment, and regulatory, technological and competitive developments.
Our cash flow from operations and access to capital are subject to a number of variables, including:
• | our level of proved reserves and production; |
• | the level of hydrocarbons we are able to produce from existing wells; |
• | our access to, and the cost of accessing, end markets for our production; |
• | the prices at which our production is sold; |
• | our ability to acquire, locate and produce new reserves; |
• | the levels of our operating expenses; and |
• | our ability to access the public or private capital markets or borrow under our revolving credit facility. |
If our cash flows from operations or the borrowing capacity under our revolving credit facility are insufficient to fund our capital expenditures and we are unable to obtain the capital necessary for our planned capital budget or our operations, we could be required to curtail our operations and the development of our properties, which in turn could lead to a decline in our reserves and production, and could adversely affect our business, results of operations and financial position.
As of December 31, 2019, our senior notes were rated "Baa3" with a "Negative" outlook by Moody's Investors Services (Moody's), "BBB–" with a "Negative" outlook by Standard & Poor's Ratings Service (S&P) and "BBB–" with a "Negative" outlook by Fitch Ratings Service (Fitch). In January 2020, Moody's downgraded our senior notes rating to "Ba1" with a "Negative" outlook. In February 2020, S&P downgraded our senior notes rating to "BB+" with a "Negative" outlook, and Fitch downgraded our senior notes rating to "BB" with a "Negative" outlook. See Note 10 to the Consolidated Financial Statements for a discussion of the effects of the downgrades on our financial statements subsequent to December 31, 2019. Although we are not aware of any current plans of Moody's, S&P or Fitch to further downgrade its rating of our senior notes, we cannot be assured that one or more will not further downgrade or withdraw entirely their rating of our senior notes. Low prices for natural gas, NGLs and oil, an increase in the level of our indebtedness or a failure to significantly execute our Deleveraging Plan may result in Moody's, S&P or Fitch further downgrading its rating of our senior notes. If there are further downgrades to our credit rating, our access to the capital markets may be impacted, the cost of short-term debt through interest rates and fees under our lines of credit may increase, the interest rate on our Term Loan Facility and Adjustable Rate Notes (each defined in Note 10 to the Consolidated Financial Statements) will increase, the rates available on new long-term debt may increase, our pool of investors and funding sources may decrease, the borrowing costs and margin deposit requirements on our derivative instruments may increase and we may be required to provide additional credit assurances, including collateral, in support of our midstream service contracts, joint venture arrangements or construction contracts, which could adversely affect our business, results of operations and liquidity.
Risks associated with our debt and the provisions of our debt agreements could adversely affect our business, financial position and results of operations.
As of December 31, 2019, we had approximately $5,293 million of debt outstanding, and we may incur additional indebtedness in the future. Increases in our level of indebtedness may:
• | require us to use a substantial portion of our cash flow to make debt service payments, which will reduce the funds that would otherwise be available for operations and future business opportunities; |
• | limit our operating flexibility due to financial and other restrictive covenants, including restrictions on incurring additional debt, making certain investments, and paying dividends; |
24
• | place us at a competitive disadvantage compared to our competitors with lower debt service obligations; |
• | depending on the levels of our outstanding debt, limit our ability to obtain additional financing for working capital, capital expenditures, general corporate and other purposes; and |
• | increase our vulnerability to downturns in our business or the economy, including declines in prices for natural gas, NGLs and oil. |
Our debt agreements also require compliance with certain covenants. If the price that we receive for our natural gas, NGLs and oil production deteriorates from current levels or continues for an extended period, it could lead to reduced revenues, cash flow and earnings, which in turn could lead to a default due to lack of covenant compliance. For more information about our debt agreements, read "Capital Resources and Liquidity" in Item 7., "Management's Discussion and Analysis of Financial Condition and Results of Operations."
We are subject to financing and interest rate exposure risks.
Our business and operating results can be adversely affected by increases in interest rates or other increases in the cost of capital resulting from a reduction in our credit rating or otherwise. These changes could cause our cost of doing business to increase, limit our ability to pursue acquisition opportunities, reduce cash flow used for operating and capital expenditures and place us at a competitive disadvantage.
Disruptions or volatility in the financial markets may lead to a contraction in credit availability impacting our ability to finance our operations. A significant reduction in the availability of credit could materially and adversely affect our ability to implement our business strategy and achieve favorable operating results. In addition, we are exposed to credit risk related to our revolving credit facility to the extent that one or more of our lenders may be unable to provide necessary funding to us under our existing revolving line of credit if it experiences liquidity problems.
Uncertainty related to the LIBOR calculation process and potential phasing out of LIBOR after 2021 may adversely affect the market value of our current or future debt obligations.
Loans to us under our credit facility may be base rate loans or LIBOR loans. LIBOR is calculated by reference to a market for interbank lending, and it's based on increasingly fewer actual transactions. This increases the subjectivity of the LIBOR calculation process and increases the risk of manipulation. Actions by the regulators or law enforcement agencies, as well as ICE Benchmark Administration (the current administrator of LIBOR), may result in changes to the manner that LIBOR is determined or the establishment of alternative reference rates. For example, on July 27, 2017, the U.K. Financial Conduct Authority announced that it intends to stop persuading or compelling banks to submit LIBOR rates after 2021. U.S. Dollar LIBOR will likely be replaced by the Secured Overnight Financing Rate (SOFR) published by the Federal Reserve Bank of New York; however, the timing of this shift is currently unknown. SOFR is an overnight rate instead of a term rate, making SOFR an inexact replacement for LIBOR, and there is not an established process to create robust, forward-looking, SOFR term rates. Changing the benchmark rate for LIBOR loans from LIBOR to SOFR requires calculations of a spread. Industry organizations are attempting to structure the spread calculation in a manner that minimizes the possibility of value transfer between counterparties, borrowers, and lenders by the transition, but there is no assurance that the calculated spread will be fair and accurate. At this time, it is not possible to predict the effect of any such changes, any establishment of alternative reference rates or any other reforms to LIBOR that may be implemented. If LIBOR ceases to exist, we may need to renegotiate our credit facility to determine the interest rate to replace LIBOR with the new standard that is established. As such, the potential effect of any such event on our interest expense cannot yet be determined.
Derivative transactions may limit our potential gains and involve other risks.
To manage our exposure to price risk, we currently and may in the future enter into derivative arrangements, utilizing commodity derivatives with respect to a portion of our future production. Such hedges are designed to lock in prices in order to limit volatility and increase the predictability of cash flow. These transactions limit our potential gains if natural gas, NGLs and oil prices rise above the price established by the hedge. In addition, derivative transactions may expose us to the risk of financial loss in certain circumstances, including instances in which:
• | our production is less than expected; |
• | the counterparties to our derivative contracts fail to perform on their contract obligations; or |
• | an event materially impacts natural gas, NGLs or oil prices or the relationship between the hedged price index and the natural gas, NGLs or oil sales price. |
25
We cannot be certain that any derivative transaction we may enter into will adequately protect us from declines in the prices of natural gas, NGLs or oil. Furthermore, where we choose not to engage in derivative transactions in the future, we may be more adversely affected by changes in natural gas, NGLs or oil prices than our competitors who engage in derivative transactions. Lower natural gas, NGLs and oil prices may also negatively impact our ability to enter into derivative contracts at favorable prices.
Derivative transactions also expose us to a risk of financial loss if a counterparty fails to perform under a derivative contract or enters bankruptcy or encounters some other similar proceeding or liquidity constraint. In this case, we may not be able to collect all or a significant portion of amounts owed to us by the distressed entity or entities. During periods of falling commodity prices our hedge receivable positions increase, which increases our exposure. If the creditworthiness of our counterparties deteriorates and results in their nonperformance, we could incur a significant loss.
We are subject to risks associated with the operation of our wells and facilities.
Our business is subject to all of the inherent hazards and risks normally incidental to drilling for, producing, transporting and storing natural gas, NGLs and oil, such as fires, explosions, slips, landslides, blowouts, and well cratering; pipe and other equipment and system failures; delays imposed by, or resulting from, compliance with regulatory requirements; formations with abnormal or unexpected pressures; shortages of, or delays in, obtaining equipment and qualified personnel or in obtaining water for hydraulic fracturing activities; adverse weather conditions, such as freeze offs of wells and pipelines due to cold weather; issues related to compliance with environmental regulations; environmental hazards, such as natural gas leaks, oil spills, pipeline and tank ruptures, encountering naturally occurring radioactive materials, and unauthorized releases of brine, well stimulation and completion fluids, toxic gases or other pollutants into the environment, especially those that reach surface water or groundwater; inadvertent third-party damage to our assets, and natural disasters. We also face various risks or threats to the operation and security of our or third parties' facilities and infrastructure, such as processing plants, compressor stations and pipelines. Any of these risks could result in substantial losses due to personal injury and/or loss of life, severe damage to and destruction of property, equipment and natural resources, pollution or other environmental damage, loss of hydrocarbons, disruptions to our operations, regulatory investigations and penalties, suspension of our operations, repair and remediation costs, and loss of sensitive confidential information. Moreover, in the event that one or more of these hazards occur, there can be no assurance that a response will be adequate to limit or reduce damage. As a result of these risks, we are also sometimes a defendant in legal proceedings and litigation arising in the ordinary course of business. There can be no assurance that the insurance policies we maintain to limit our liability for such losses will be adequate to protect us from all material expenses related to potential future claims for personal injury and property damage or that such levels of insurance will be available in the future at economical prices or to cover all risks. In addition, pollution and environmental risks generally are not fully insurable, and we may elect not to obtain insurance for any or all of these risks if we believe that the cost of available insurance is excessive relative to the risks presented. The occurrence of an event that is not fully covered by insurance could materially adversely affect our business, results of operations, cash flows and financial position.
Cyber incidents targeting our systems or natural gas and oil industry systems and infrastructure may adversely impact our operations.
Our business and the natural gas and oil industry in general have become increasingly dependent upon digital technologies, including information systems, infrastructure and cloud applications, and the maintenance of our financial and other records has long been dependent upon such technologies. We depend on this technology to record and store data, estimate quantities of natural gas, NGLs and oil reserves, analyze and share operating data and communicate internally and externally. Computers control nearly all of the natural gas, NGLs and oil distribution systems in the U.S., which are necessary to transport our products to market.
The U.S. government has issued public warnings that indicate that energy assets might be specific targets of cyber security threats. We can provide no assurance that we will not suffer such attacks in the future. Deliberate attacks on, or unintentional events affecting, our systems or infrastructure, the systems or infrastructure of third parties or the cloud could lead to corruption or loss of our proprietary data and potentially sensitive data, delays in production or delivery of natural gas, NGLs and oil, difficulty in completing and settling transactions, challenges in maintaining our books and records, communication interruptions, environmental damage, personal injury, property damage, other operational disruptions and third-party liability. Further, as cyber incidents continue to evolve and cyber attackers become more sophisticated, we may be required to expend additional resources to continue to modify or enhance our protective measures or to investigate and remediate any vulnerability to cyber incidents. The cost to remedy an unintended dissemination of sensitive information or data may be significant. Furthermore, the continuing and evolving threat of cyber-attacks has resulted in increased regulatory focus on prevention. To the extent we face increased regulatory requirements, we may be required to expend significant additional resources to meet such requirements.
26
Failure to timely develop our leased real property could result in increased capital expenditures and/or impairment of our leases.
Mineral rights are typically owned by individuals who may enter into property leases with us to allow for the development of natural gas. Such leases expire after an initial term, typically five years, unless certain actions are taken to preserve the lease. If we cannot preserve a lease, the lease terminates. Approximately 24% of our net undeveloped acres are subject to leases that could expire over the next three years. Lack of access to capital, changes in government regulations, changes in future development plans, reduced drilling activity, or the reduction in the fair value of undeveloped properties in the areas in which we operate could impact our ability to preserve, trade, or sell our leases prior to their expiration resulting in the termination and impairment of leases for properties that we have not developed.
Capitalized costs of unproved oil and gas properties are evaluated at least annually for recoverability on a prospective basis. Indicators of potential impairment include changes brought about by economic factors, potential shifts in business strategy employed by management and historical experience. The likelihood of an impairment of unproved oil and gas properties increases as the expiration of a lease term approaches and drilling activity has not commenced. For the years ended December 31, 2019, 2018 and 2017, we recorded lease impairments and expirations of $556.4 million, $279.7 million and $7.6 million, respectively. Refer to Note 1 to the Consolidated Financial Statements.
We may incur losses as a result of title defects in the properties in which we invest.
Our inability to cure any title defects in our leases in a timely and cost-efficient manner may delay or prevent us from utilizing the associated mineral interest, which may adversely impact our ability in the future to increase production and reserves. The existence of a material title deficiency can render a lease worthless and can adversely affect our results of operations and financial position.
Substantially all of our producing properties are concentrated in the Appalachian Basin, making us vulnerable to risks associated with operating primarily in one major geographic area.
Substantially all of our producing properties are geographically concentrated in the Appalachian Basin. As a result of this concentration, we may be disproportionately exposed to the impact of regional supply and demand factors, delays or interruptions of production from wells in these areas caused by, and costs associated with, governmental regulation, state and local political activities, processing or transportation capacity constraints, market limitations, availability of equipment and personnel, water shortages or other weather-related conditions, interruption of the processing or transportation of natural gas, NGLs or oil and changes in state and local laws, judicial precedents, political regimes and regulations. Such conditions could materially adversely affect our results of operations and financial position.
In addition, a number of areas within the Appalachian Basin have historically been subject to mining operations. For example, third parties may engage in subsurface coal and other mining operations near or under our properties, which could cause subsidence or other damage to our properties, adversely impact our drilling operations or adversely impact third-party midstream activities on which we rely. In such event, our operations may be impaired or interrupted, and we may not be able to recover the costs incurred as a result of temporary shut-ins or the plugging and abandonment of any of our wells. Furthermore, the existence of mining operations near our properties could require coordination to avoid adverse impacts as a result of drilling and mining in close proximity. These restrictions on our operations, and any similar restrictions, could cause delays or interruptions or prevent us from executing our business strategy, which could materially adversely affect our results of operations and financial position.
Further, insufficient takeaway capacity in the Appalachian Basin could cause significant fluctuations in our realized natural gas prices. The Appalachian Basin has recently experienced periods in which production has surpassed local takeaway capacity, resulting in substantial discounts in the price received by producers such as us and others at times being possibly shut in. Although additional Appalachian Basin takeaway capacity has been added in recent years, the existing and expected capacity may not be sufficient to keep pace with the increased production caused by accelerated drilling in the area in the short term.
Due to the concentrated nature of our portfolio of natural gas properties, a number of our properties could experience any of the same conditions at the same time, resulting in a relatively greater impact on our results of operations than they might have on other companies that have a more diversified portfolio of properties.
27
Natural gas, NGLs and oil price declines, and changes in our development strategy, have resulted in impairment of certain of our assets. Future declines in commodity prices, increases in operating costs or adverse changes in well performance or additional changes in our development strategy may result in additional write-downs of the carrying amounts of our assets, including long-lived intangible assets, which could materially and adversely affect our results of operations in future periods.
We review the carrying values of our proved oil and gas properties and goodwill for indications of impairment when events or circumstances indicate that the remaining carrying value may not be recoverable. In addition, we evaluate goodwill for impairment at least annually. A significant amount of judgment is involved in performing these evaluations because the results are based on estimated future events and estimated future cash flows. The estimated future cash flows used to test our proved oil and gas properties for recoverability are based on proved and, if determined reasonable by management, risk-adjusted probable reserves, utilizing assumptions generally consistent with the assumptions used by our management for internal planning and budgeting purposes. Key assumptions used in our analyses, include, among other things, the intended use of the asset, the anticipated production from reserves, future market prices for natural gas, NGLs and oil, future operating costs, inflation and the anticipated proceeds that may be received upon divestiture if there is a possibility that the asset will be divested prior to the end of its useful life. Commodity pricing is estimated by using a combination of the five-year NYMEX forward strip prices and assumptions related to gas quality, locational basis adjustments and inflation. Proved oil and gas properties that have carrying amounts in excess of estimated future cash flows are written down to fair value, which is estimated by discounting the estimated future cash flows using discount rate assumptions that marketplace participants would use in their estimates of fair value. Additionally, when testing goodwill for impairment, we also consider the market value of our common stock and other valuation techniques when determining the fair value of our single reporting unit.
During the fourth quarter of 2019, there were indicators that the carrying values of certain of our properties may be impaired due to depressed natural gas prices and changes in our development strategy, including our contemplation of a potential asset monetization of certain of our non-strategic exploration and production assets. As a result of our 2019 impairment evaluation, we recorded total impairment of $1,124.4 million, of which $1,035.7 million was associated with our non-strategic assets located in the Ohio Utica and $88.7 million was associated with our Pennsylvania and West Virginia Utica assets. It is possible that we may incur additional impairment charges in future periods as a result of the above indicators or otherwise. In particular, future declines in natural gas, NGLs or oil prices, increases in operating costs or adverse changes in well performance, among other things, may result in our having to make significant future downward adjustments to our estimated proved reserves and/or could result in additional non-cash impairment charges to write-down the carrying amount of our assets, including other long-lived intangible assets, which may have a material adverse effect on our results of operations in future periods. Any impairment of our assets, including other long-lived intangible assets, would require us to take an immediate charge to earnings. Such charges could be material to our results of operations and could adversely affect our results of operations and financial position. See "Impairment of Oil and Gas Properties" in Item 7., "Management's Discussion and Analysis of Financial Condition and Results of Operations."
The unavailability or high cost of additional drilling rigs, completion services, equipment, supplies, personnel, and oilfield services could adversely affect our ability to execute our exploration and development plans within our budget and on a timely basis.
The demand for qualified and experienced field personnel to drill wells and conduct field operations, geologists, geophysicists, engineers, and other professionals in the natural gas and oil industry can fluctuate significantly, often in correlation with natural gas and oil prices, causing periodic shortages or higher costs. Historically, there have been shortages of personnel and equipment as demand for personnel and equipment has increased along with the number of wells being drilled. We cannot predict whether these conditions will exist in the future and, if so, what their timing and duration will be. Such shortages could delay or cause us to incur significant expenditures that are not provided for in our capital budget, which could materially adversely affect our business, results of operations, cash flows and financial position.
Our ability to drill for and produce natural gas and oil is dependent on the availability of adequate supplies of water for drilling and completion operations and access to water and waste disposal or recycling services at a reasonable cost and in accordance with applicable environmental rules. Restrictions on our ability to obtain water or dispose of produced water and other waste may adversely affect our results of operations, cash flows and financial position.
The hydraulic fracture stimulation process on which we depend to drill and complete natural gas and oil wells requires the use and disposal of significant quantities of water. Our ability to access sources of water and the availability of disposal alternatives to receive all of the water produced from our wells and used in hydraulic fracturing may affect our drilling and completion operations. Our inability to secure sufficient amounts of water, or to dispose of or recycle the water used in our operations, or to timely obtain water sourcing permits or other rights, could adversely affect our operations. Additionally, the imposition of new environmental initiatives and regulations could include restrictions on our ability to obtain water or dispose of waste, which would adversely affect our business and results of operations, which could result in decreased cash flows.
28
In addition, federal and state regulatory agencies recently have focused on a possible connection between the operation of injection wells used for natural gas and oil waste disposal and increased seismic activity in certain areas. In some cases, operators of injection wells in the vicinity of seismic events have been ordered to reduce injection volumes or suspend operations. Increased regulation and attention given to induced seismicity in the states where we operate could lead to restrictions on our disposal well injection volumes and increased scrutiny of and delay in obtaining new disposal well permits, which could result in increased operating costs, which could be material, or a curtailment of our operations.
The loss of key personnel could adversely affect our ability to execute our strategic, operational and financial plans.
Our operations are dependent upon key management and technical personnel, and one or more of these individuals could leave our employment. The unexpected loss of the services of one or more of these individuals could have a detrimental effect on us. In addition, the success of our operations will depend, in part, on our ability to identify, attract, develop and retain experienced personnel. There is competition within our industry for experienced technical personnel and certain other professionals, which could increase the costs associated with identifying, attracting and retaining such personnel. If we cannot identify, attract, develop and retain our technical and professional personnel or attract additional experienced technical and professional personnel, our ability to compete in our industry could be harmed.
Competition in our industry is intense, and many of our competitors have substantially greater financial resources than we do, which could adversely affect our competitive position.
Competition in the natural gas and oil industry is intense. Major and independent natural gas and oil companies actively bid for desirable oil and gas properties, as well as for the capital, equipment and labor required to operate and develop these properties. Many of our competitors have financial resources and exploration and development budgets that are substantially greater than ours. These companies may be able to pay more for exploratory projects and productive oil and gas properties and may be able to define, evaluate, bid for and purchase a greater number of properties and prospects than our financial or human resources permit. In addition, these companies may be able to expend greater resources on existing and changing processes and may also have a greater ability to continue drilling activities during periods of low natural gas and oil prices and to absorb the burden of current and future governmental regulations and taxation.
We depend on third-party midstream providers for a significant portion of our midstream services, and our failure to obtain and maintain access to the necessary infrastructure to successfully deliver natural gas, NGLs and oil to market on competitive terms may adversely affect our earnings, cash flows and results of operations.
Our delivery of natural gas, NGLs and oil depends upon the availability, proximity and capacity of pipelines, other transportation facilities and gathering and processing facilities primarily owned by third parties, and our ability to contract with these third parties at competitive rates or at all. The capacity of transmission, gathering and processing facilities may be insufficient to accommodate potential production from existing and new wells, which may result in substantial discounts in the prices we receive for our natural gas, NGLs and oil or result in the shut-in of producing wells or the delay or discontinuance of development plans for properties. Competition for access to pipeline infrastructure within the Appalachian Basin is intense, and our ability to secure access to pipeline infrastructure on favorable economic terms could affect our competitive position.
We are dependent on third-party providers to provide us with access to midstream infrastructure to get our produced natural gas, NGLs and oil to market. To the extent these services are delayed or unavailable, we would be unable to realize revenue from wells served by such facilities until suitable arrangements are made to market our production. Access to midstream assets may be unavailable due to market conditions or mechanical or other reasons. In addition, at current commodity prices, construction of new pipelines and building of such infrastructure may occur more slowly. A lack of access to needed infrastructure, or an extended interruption of access to or service from third-party pipelines and facilities for any reason, including vandalism, sabotage or cyber-attacks on such pipelines and facilities or service interruptions due to gas quality, could result in adverse consequences to us, such as delays in producing and selling our natural gas, NGLs and oil.
Finally, in order to ensure access to certain midstream facilities, we have entered into agreements that obligate us to pay demand charges to various pipeline operators. We also have commitments with third parties for processing capacity. We may be obligated to make payments under these agreements even if we do not fully use the capacity we have reserved, and these payments may be significant.
29
The substantial majority of our midstream and water services are provided by one provider, EQM Midstream Partners LP (EQM), an affiliate of Equitrans Midstream. Therefore, any regulatory, infrastructure, or other events that materially adversely affect EQM's business operations will have a disproportionately adverse effect on our business and operating results as compared to similar events experienced by our other third-party service providers. Additionally, our midstream services contracts with EQM involve significant long-term financial and other commitments on our part, which hinders our ability to diversify our slate of midstream service providers and seek better economic and other terms for the midstream services that are provided to us. We have no control over Equitrans Midstream's or EQM's business decisions and operations, and neither Equitrans Midstream nor EQM is under any obligation to adopt a business strategy that favors us.
Historically, we have received the substantial majority of our natural gas gathering, transmission and storage and water services from EQM. Additionally, on February 26, 2020, we executed a new gas gathering agreement with EQM (the New EQM Gathering Agreement), which, among other things, consolidated the majority of our prior gathering agreements with EQM into a single agreement, established a new fee structure for gathering and compression fees charged by EQM, increased our minimum volume commitments with EQM, committed certain of our remaining undedicated acreage to EQM and extended our and EQM's contractual obligations with each other to 2035. Because we have significant long-term contractual commitments with EQM, we expect to receive the majority of our midstream and water services from EQM for the foreseeable future. Therefore, any event, whether in our areas of operations or otherwise, that adversely affects EQM's operations, water assets, pipelines, other transportation facilities, gathering and processing facilities, financial condition, leverage, results of operations or cash flows will have a disproportionately adverse effect on our business and operating results as compared to similar events experienced by our other third-party service providers. Accordingly, we are subject to the business risks of EQM, including the following:
• | federal, state and local regulatory, political and legal actions that could adversely affect EQM's operations, assets and infrastructure, including potential further delays associated with obtaining regulatory approval for the construction of the Mountain Valley Pipeline and the MVP Southgate project; |
• | construction risks associated with the construction or repair of EQM's pipelines and other midstream infrastructure, such as delays caused by landowners or advocacy groups opposed to the natural gas industry, environmental hazards, adverse weather conditions, the performance of third-party contractors, the lack of available skilled labor, equipment and materials and the inability to obtain necessary rights-of-way or approvals and permits from regulatory agencies on a timely basis or at all (and maintain such rights-of-way, approvals and permits once obtained); |
• | acts of cybersecurity, sabotage or eco-terrorism that could cause significant damage or injury to EQM's personnel, assets or infrastructure or lead to extended interruptions of EQM's operations; |
• | risks associated with EQM failing to properly balance supply and demand for its services, on a short-term, seasonal and long-term basis, which could result in EQM being unable to provide its customers, including us, with sufficient access to pipeline and other midstream infrastructure and water services as needed; and |
• | risks associated with EQM's leverage and financial profile, which could result in EQM being financially deterred or prohibited from providing services to its customers, including us, on a timely basis or at all. |
In addition, many of our midstream services contracts with EQM are "firm" commitments, under which we have reserved an agreed upon amount of pipeline or storage capacity with EQM regardless of the capacity that we actually use during each month, and we are generally obligated to pay a fixed, monthly charge, at an amount agreed upon in the contract. Because these contracts involve significant long-term financial and other commitments on our part that lock us into prices at the time the contract is entered into, they could reduce our cash flow during periods of low prices for natural gas, NGLs and oil when we may have lower volumes of natural gas and NGLs and therefore less of a need for capacity and storage, or the market prices for such pipeline and storage capacity services may be lower than what we are contractually obligated to pay to EQM. Further, although the New EQM Gathering Agreement provides for a reduced fee structure for the gathering and compression fees charged by EQM, this new fee structure does not take effect until the Mountain Valley Pipeline's in-service date, which is currently expected to be January 1, 2021; however, there can be no assurance that the Mountain Valley Pipeline's in-service date will not be delayed beyond such date, which would consequently delay the effective date of the fee reductions contemplated in the New EQM Gathering Agreement. Neither Equitrans Midstream nor EQM is under any obligation to renegotiate their contracts with us in the event of a prolonged depressed commodity price environment or if the Mountain Valley Pipeline's in-service date is delayed. Our failure to obtain these services on competitive terms could materially harm our business.
Negative public perception regarding us and/or our industry could have an adverse effect on our operations.
Negative public perception regarding us and/or our industry resulting from, among other things, the explosion of natural gas transmission and gathering lines, oil spills, and concerns raised by advocacy groups or the media about hydraulic fracturing, greenhouse gas or methane emissions or fossil fuels in general, or about royalty payment and surface use issues, may lead to increased litigation and regulatory, legislative and judicial scrutiny, which may, in turn, lead to new local, state and federal laws,
30
regulations, guidelines and enforcement interpretations in safety, environmental, royalty and surface use areas. These actions may cause operational delays or restrictions, increased operating costs, additional regulatory burdens and increased risk of litigation. Moreover, governmental authorities exercise considerable discretion in the timing and scope of permit issuance and the public may engage in the permitting process, including through intervention in the courts. Negative public perception could cause the permits we need to conduct our operations to be withheld, delayed, challenged or burdened by requirements that restrict our ability to profitably conduct our business.
We are subject to complex federal, state, local and other laws and regulations that could adversely affect the cost, manner or feasibility of conducting our operations or expose us to significant liabilities.
Our operations are regulated extensively at the federal, state and local levels. Laws, regulations and other legal requirements have increased the cost to plan, design, drill, install, operate and abandon wells and related infrastructure. Our exploration and production operations are subject to various types of federal, state and local laws and regulations, including regulations related to the location of wells; the method of drilling, well construction, well stimulation, hydraulic fracturing and casing design; water withdrawal and procurement for well stimulation purposes; well production; spill prevention plans; the use, transportation, storage and disposal of water and other fluids and materials, including solid and hazardous wastes, incidental to natural gas and oil operations; surface usage and the reclamation of properties upon which wells or other facilities have been located; the plugging and abandoning of wells; the calculation, reporting and disbursement of royalties and taxes; and the gathering of production in certain circumstances.
Our operations are also subject to conservation and correlative rights regulations, including the regulation of the size of drilling and spacing units or field rule units; setbacks; the number of wells that may be drilled in a unit or in close proximity to other wells; drilling in the vicinity of coal mining operations and certain other structures; and the unitization or pooling of properties. Some states allow the statutory pooling and unitization of tracts to facilitate development and exploration, as well as joint development of existing contiguous leases. In addition, state conservation and natural gas and oil laws generally limit the venting or flaring of natural gas and may set production allowances on the amount of annual production permitted from a well.
Environmental, health and safety legal requirements govern discharges of substances into the air, ground and water; the management and disposal of hazardous substances and wastes; the clean-up of contaminated sites; groundwater quality and availability; plant and wildlife protection; locations available for drilling; environmental impact studies and assessments prior to permitting; restoration of drilling properties after drilling is completed; and work practices related to employee health and safety.
To conduct our operations in compliance with these laws and regulations, we must obtain and maintain numerous permits, approvals and certificates from various federal, state and local governmental authorities. Maintaining compliance with the laws, regulations and other legal requirements applicable to our business and any delays in obtaining related authorizations may affect the costs and timing of developing our natural gas, NGLs and oil resources. These requirements could also subject us to claims for personal injuries, property damage and other damages. In addition, our costs of compliance may increase if existing laws and regulations are revised or reinterpreted, or if new laws and regulations become applicable to our operations. Such costs could materially adversely affect our results of operations, cash flows and financial position. Our failure to comply with the laws, regulations and other legal requirements applicable to our business, even if as a result of factors beyond our control, could result in the suspension or termination of our operations and subject us to administrative, civil and criminal penalties and damages as well as corrective action costs.
In December 2017, changes to certain federal income tax laws were signed into law that impact us, including but not limited to: changes to the regular income tax rate; the elimination of the alternative minimum tax; full expensing of capital equipment; limited deductibility of interest expense; and increased limitations on deductible executive compensation. The current administration continues to debate further changes to federal income tax laws that could be enacted, which could have a material impact on us. The most significant potential tax law changes include further changes to the regular income tax rate, the expensing of intangible drilling costs or percentage depletion, and further limited deductibility of interest expense, any of which could adversely impact our current and deferred federal and state income tax liabilities. State and local taxing authorities in jurisdictions in which we operate or own assets may enact new taxes, such as the imposition of a severance tax on the extraction of natural resources in states in which we produce natural gas, NGLs and oil, or change the rates of existing taxes, which could adversely impact our earnings, cash flows and financial position.
In 2010, Congress adopted the Dodd-Frank Act, which established federal oversight and regulation of the OTC derivative market and entities, such as us, that participate in that market. The Dodd-Frank Act required the CFTC, the SEC and other regulatory agencies to promulgate rules and regulations implementing the legislation. As of the filing date of this Annual Report on Form 10-K, the CFTC had adopted and implemented many final rules that impose regulatory obligations on all market participants, including us, such as recordkeeping and certain reporting obligations. Other rules that may be relevant to us or our counterparties have yet to be finalized. Because significant rules relevant to natural gas hedging activities have not been adopted or implemented,
31
it is not possible at this time to predict the full extent of the impact of the regulations on our hedging program, including available counterparties, or regulatory compliance obligations. We have experienced increased, and anticipate additional, compliance costs and changes to current market practices as participants continue to adapt to a changing regulatory environment.
Federal, state and local legislative and regulatory initiatives relating to hydraulic fracturing and governmental reviews of such activities could result in increased costs and additional operating restrictions or delays in the completion of natural gas and oil wells, which could adversely affect our production.
We use hydraulic fracturing in the completion of our natural gas and oil wells. Hydraulic fracturing typically is regulated by state natural gas and oil commissions, but the EPA has asserted federal regulatory authority. For example, the EPA finalized rules in June 2016 to prohibit the discharge of wastewater from hydraulic fracturing operations to publicly owned wastewater treatment plants.
Certain governmental reviews have been conducted or are underway that focus on the environmental aspects of hydraulic fracturing practices. In addition, Congress has from time to time considered legislation to provide for federal regulation of hydraulic fracturing under the SDWA and to require disclosure of the chemicals used in the hydraulic fracturing process. At the state level, several states have adopted or are considering legal requirements that could impose more stringent permitting, disclosure, and well construction requirements on hydraulic fracturing activities. Local governments also may seek to adopt ordinances within their jurisdictions regulating the time, place and manner of drilling activities in general or hydraulic fracturing activities in particular. Some states and municipalities have sought to ban hydraulic fracturing altogether. If new or more stringent federal, state, or local legal restrictions relating to the hydraulic fracturing process are adopted in areas where we operate, we could incur potentially significant added costs to comply with such requirements, experience delays or curtailment in the pursuit of exploration, development, or production activities, and perhaps even be precluded from constructing wells. See "Business-Regulation-Environmental, Health and Safety Regulation" for more information.
Our operations may be exposed to significant delays, costs and liabilities as a result of environmental and occupational health and safety requirements applicable to our business activities.
We may incur significant delays, costs and liabilities as a result of environmental and occupational health and safety requirements applicable to our exploration, development and production activities. These delays, costs and liabilities could arise under a wide range of federal, state and local laws and regulations relating to protection of the environment and occupational health and workplace safety, including regulations and enforcement policies that have tended to become increasingly strict over time resulting in longer waiting periods to receive permits and other regulatory approvals. Failure to comply with these laws and regulations may result in the assessment of administrative, civil and criminal penalties, imposition of cleanup and site restoration costs and liens, and, in some instances, issuance of orders or injunctions limiting or requiring discontinuation of certain operations.
Strict, joint and several liabilities may be imposed under certain environmental laws, which could cause us to become liable for the conduct of others or for consequences of our own actions that were in compliance with all applicable laws at the time those actions were taken. In addition, claims for damages to persons or property, including natural resources, may result from the environmental and occupational health and workplace safety impacts of our operations. We have been named from time to time as a defendant in litigation related to such matters.
In addition, new or additional laws and regulations, new interpretations of existing requirements or changes in enforcement policies could impose unforeseen liabilities, significantly increase compliance costs or result in delays of, or denial of rights to conduct, our development programs. For example, in June 2015, the EPA and the Corps issued a final rule under the CWA defining the scope of the EPA's and the Corps' jurisdiction over WOTUS, but several legal challenges to the rule followed, and the WOTUS rule was stayed nationwide in October 2015 pending resolution of the legal challenges. The EPA and the Corps proposed a rule in July 2017 to repeal the WOTUS rule and announced their intent to issue a new rule defining the CWA's jurisdiction. In January 2018, the U.S. Supreme Court issued a decision finding that jurisdiction to hear challenges to the WOTUS rule resides with the federal district courts, which lifted the stay and resulted in a patchwork application of the rule in some states, but not in others. In October 2019, the EPA issued a final rule repealing the WOTUS rule and the repeal rule became effective in December 2019. The repeal rule has already been challenged in federal district courts in New Mexico, New York, and South Carolina. In January 2020, the EPA and the Corps announced the final rule redefining the definition of WOTUS. The new definition narrows the scope of waters that are covered as jurisdictional. Several groups have already announced their intention to challenge the rule. To the extent a stay of this rule or the implementation of a revised rule expands the scope of the CWA's jurisdiction, we could face increased costs and delays with respect to obtaining permits for dredge and fill activities in wetland areas. Such potential regulations or litigation could increase our operating costs, reduce our liquidity, delay or halt our operations or otherwise alter the way we conduct our business, which in turn could materially adversely affect our results of operations and financial position. Further, the discharges
32
of natural gas, NGLs, oil, and other pollutants into the air, soil or water may give rise to significant liabilities on our part to the government and third parties.
Regulations related to the protection of wildlife could adversely affect our ability to conduct drilling activities in some of the areas where we operate.
Our operations can be adversely affected by regulations designed to protect various wildlife. The designation of previously unprotected species as threatened or endangered in areas where underlying property operations are conducted could cause us to incur increased costs arising from species protection measures or could result in constraints on our exploration and production activities. This limits our ability to operate in those areas and can intensify competition during those months for drilling rigs, oilfield equipment, services, supplies and qualified personnel, which may lead to periodic shortages. These constraints and the resulting shortages or high costs could delay our operations and materially increase our operating and capital costs.
Conservation measures and technological advances could reduce demand for natural gas and oil.
Fuel conservation measures, alternative fuel requirements, increasing consumer demand for alternatives to natural gas and oil, technological advances in fuel economy and energy generation devices could reduce demand for natural gas and oil. The impact of the changing demand for natural gas and oil could adversely impact our earnings, cash flows and financial position.
Climate change laws and regulations restricting emissions of greenhouse gases could result in increased operating costs and reduced demand for the natural gas, NGLs and oil that we produce while potential physical effects of climate change could disrupt our production and cause us to incur significant costs in preparing for or responding to those effects.
In response to findings that emissions of carbon dioxide, methane and other GHGs present an endangerment to public health and the environment, the EPA has adopted regulations under existing provisions of the CAA that, among other things, establish PSD construction and Title V operating permit reviews for certain large stationary sources that are already potential major sources of certain principal, or criteria, pollutant emissions. Facilities required to obtain PSD permits for their GHG emissions also will be required to meet "best available control technology" standards that will be established by the states or, in some cases, by the EPA on a case‑by‑case basis. These EPA rulemakings could adversely affect our operations and restrict or delay our ability to obtain air permits for new or modified sources. In addition, the EPA has adopted rules requiring the monitoring and reporting of GHG emissions from specified onshore and offshore natural gas and oil production sources in the United States on an annual basis, which include certain of our operations. At the state level, several states including Pennsylvania have proceeded with regulation targeting GHG emissions. Such state regulations could impose increased compliance costs on our operations.
While Congress has from time to time considered legislation to reduce emissions of GHGs, there has not been significant activity in the form of federal legislation in recent years. In the absence of such federal climate legislation, a number of state and regional efforts have emerged that are aimed at tracking and/or reducing GHG emissions by means of cap-and-trade programs that typically require major sources of GHG emissions, such as electric power plants, to acquire and surrender emission allowances in return for emitting those GHGs. In October 2019, Pennsylvania Governor Tom Wolf signed an Executive Order directing the PADEP to draft regulations establishing a cap-and-trade program under its existing authority to regulate air emissions, with the intent of enabling Pennsylvania to join the RGGI, a multi-state regional cap-and-trade program comprised of several Eastern U.S. states. Subsequently, legislators in the Pennsylvania General Assembly introduced a bill that, if approved, would require legislative approval by both chambers of the Pennsylvania General Assembly in order for Pennsylvania to join the RGGI. If Pennsylvania ultimately becomes a member of the RGGI, or otherwise implements a cap-and-trade program, it could result in increased operating costs if we are required to purchase emission allowances in connection with our operations.
On an international level, the United States is one of almost 200 nations that, in December 2015, agreed to the Paris Agreement, which calls for countries to set their own GHG emissions targets and be transparent about the measures each country will use to achieve its GHG emissions targets. The Paris Agreement was signed by the United States in April 2016 and entered into force on November 4, 2016; however, the Paris Agreement does not impose any binding obligations on its participants. In August 2017, the U.S. Department of State officially informed the United Nations of the United States' intent to withdraw from the Paris Agreement. The Paris Agreement provides for a four-year exit process beginning when it took effect in November 2016, which would result in an effective exit date of November 2020. The United States' adherence to the exit process and/or the terms on which the United States may reenter the Paris Agreement or a separately negotiated agreement are unclear at this time.
Although it is not possible at this time to predict how legislation or new regulations that may be adopted to address GHG emissions would impact our business, any such future laws and regulations imposing reporting obligations on, or limiting emissions of GHGs from, our equipment and operations could require us to incur costs to reduce emissions of GHGs associated with our operations.
33
Substantial limitations on GHG emissions could also adversely affect demand for the natural gas, NGLs and oil we produce and lower the value of our reserves.
Further, recent activism directed at shifting funding away from companies with energy-related assets could result in limitations or restrictions on certain sources of funding for the energy sector. Moreover, activist shareholders have introduced proposals that may seek to force companies to adopt aggressive emission reduction targets or to shift away from more carbon-intensive activities. While we cannot predict the outcomes of such proposals, they could ultimately make it more difficult to engage in exploration and production activities.
Finally, it should be noted that a number of scientists have concluded that increasing concentrations of GHGs in the Earth's atmosphere may produce climate changes that have significant physical effects, such as increased frequency and severity of storms, floods, droughts, and other extreme climatic events; if any such effects were to occur, they have the potential to cause physical damage to our assets or affect the availability of water and thus could have an adverse effect on our exploration and production operations. See "Business-Regulation-Environmental, Health and Safety Regulation" for more information.
Entering into strategic transactions may expose us to various risks.
We periodically engage in acquisitions, dispositions and other strategic transactions, including joint ventures. These transactions involve various inherent risks, such as our ability to obtain the necessary regulatory and third-party approvals; the timing of and conditions imposed upon us by regulators in connection with such approvals; the assumption of potential environmental or other liabilities; and our ability to realize the benefits expected from the transactions. In addition, various factors, including prevailing market conditions, could negatively impact the benefits we receive from these transactions. Competition for transaction opportunities in our industry is intense and may increase the cost of, or cause us to refrain from, completing transactions. Joint venture arrangements may restrict our operational and corporate flexibility. Moreover, joint venture arrangements involve various risks and uncertainties, such as committing us to fund operating and/or capital expenditures, the timing and amount of which we may have little or partial control over, and our joint venture partners may not satisfy their obligations to the joint venture. Our inability to complete a transaction or to achieve our strategic or financial goals in any transaction could have significant adverse effects on our earnings, cash flows and financial position.
Acquisitions may disrupt our current plans or operations and may not be worth what we pay due to uncertainties in evaluating recoverable reserves and other expected benefits, as well as potential liabilities. We may not achieve the intended benefits of our acquisition of Rice Energy Inc.
Successful property acquisitions require an assessment of a number of factors beyond our control. These factors include estimates of recoverable reserves, exploration potential, future natural gas, NGLs and oil prices, operating costs, production taxes and potential environmental and other liabilities. These assessments are complex and inherently imprecise. Our review of the properties we acquire may not reveal all existing or potential problems. In addition, our review may not allow us to fully assess the potential deficiencies of the properties. We do not inspect every well or lease that we acquire, and even when we inspect a well or lease we may not discover structural, subsurface, or environmental problems that may exist or arise.
There may be threatened or contemplated claims against the assets or businesses we acquire related to environmental, title, regulatory, tax, contract, litigation or other matters of which we are unaware, which could materially and adversely affect our production, revenues and results of operations. We often assume certain liabilities, and we may not be entitled to contractual indemnification for pre-closing liabilities, including environmental liabilities, and our contractual indemnification may not be effective. At times, we acquire interests in properties on an "as is" basis with limited representations and warranties and limited remedies for breaches of such representations and warranties. In addition, significant acquisitions can change the nature of our operations and business if the acquired properties have substantially different operating and geological characteristics or are in different geographic locations than our existing properties.
On November 13, 2017, we completed the acquisition of Rice Energy Inc. (Rice Energy). There can be no assurance that we will be able to successfully integrate Rice Energy's assets or otherwise realize the expected benefits and synergies of the acquisition of Rice Energy.
34
Changes in our business following the completion of recent significant transactions, including the acquisition of Rice Energy and the Separation and Distribution, and the reconstitution of our Board of Directors and executive management team following our 2019 annual meeting of shareholders, may result in disruptions to our business and negatively impact our operations and our relationships with our customers and business partners.
Over the last three years we have completed multiple significant transactions, including the acquisition of Rice Energy and the Separation and Distribution (defined and discussed in Note 2 to the Consolidated Financial Statements). Additionally, our Board of Directors was substantially reconstituted at our 2019 annual meeting of shareholders followed by a change in the members of our executive management team. As a result of these events, our company and employees have experienced significant changes, including the departure of members of senior management, new leadership in significant roles, and employee re-assignments as well as a reduction in our workforce. The combination of these factors may materially adversely affect our operations. Further, uncertainty related to our business following these significant changes may lead customers and other parties to terminate or attempt to negotiate changes in their existing business relationships with us or consider entering into business relationships with parties other than us. These disruptions could materially adversely affect our results of operations, financial position and prospects.
The Separation and Distribution may subject us to future liabilities.
In November 2018, we completed the Separation and Distribution, resulting in the spin-off of Equitrans Midstream, a standalone publicly traded corporation that holds our former midstream business.
Pursuant to agreements we entered into with Equitrans Midstream in connection with the Separation, we and Equitrans Midstream are each generally responsible for the obligations and liabilities related to our respective businesses. Pursuant to those agreements, we and Equitrans Midstream each agreed to cross-indemnities principally designed to allocate financial responsibility for the obligations and liabilities of our business to us and those of Equitrans Midstream's business to it. However, third parties, including governmental agencies, could seek to hold us responsible for obligations and liabilities that Equitrans Midstream agreed to retain or assume, and there can be no assurance that the indemnification from Equitrans Midstream will be sufficient to protect us against the full amount of such obligations and liabilities, or that Equitrans Midstream will be able to fully satisfy its indemnification obligations. Additionally, if a court were to determine that the Separation or related transactions were consummated with the actual intent to hinder, delay or defraud current or future creditors or resulted in Equitrans Midstream receiving less than reasonably equivalent value when it was insolvent, or that it was rendered insolvent, inadequately capitalized or unable to pay its debts as they become due, then it is possible that the court could disregard the allocation of obligations and liabilities agreed to between us and Equitrans Midstream, impose substantial obligations and liabilities on us and void some or all of the Separation-related transactions. Any of the foregoing could adversely affect our results of operations and financial position.
If there is a later determination that the Distribution or certain related transactions are taxable for U.S. federal income tax purposes because the facts, assumptions, representations or undertakings underlying the IRS private letter ruling and/or opinion of counsel are incorrect or for any other reason, significant liabilities could be incurred by us, our shareholders or Equitrans Midstream.
In connection with the Separation and Distribution, we obtained a private letter ruling from the IRS and an opinion of outside counsel regarding the qualification of the Distribution, together with certain related transactions, as a transaction that is generally tax-free, for U.S. federal income tax purposes, under Sections 355 and 368(a)(1)(D) of the U.S. Internal Revenue Code, as amended (the Code), and certain other U.S. federal income tax matters relating to the Distribution and certain related transactions. The IRS private letter ruling and the opinion of counsel are based on and rely on, among other things, various facts and assumptions, as well as certain representations, statements and undertakings of us and Equitrans Midstream, including those relating to the past and future conduct of us and Equitrans Midstream. If any of these representations, statements or undertakings is, or becomes, inaccurate or incomplete, or if we or Equitrans Midstream breach any representations or covenants contained in any of the Separation-related agreements and documents or in any documents relating to the IRS private letter ruling and/or the opinion of counsel, we and our shareholders may not be able to rely on the IRS private letter ruling or the opinion of counsel.
Notwithstanding receipt of the IRS private letter ruling and the opinion of counsel, the IRS could determine on audit that the Distribution and/or certain related transactions should be treated as taxable transactions for U.S. federal income tax purposes if it determines that any of the representations, assumptions or undertakings upon which the IRS private letter ruling was based are false or have been violated or if it disagrees with the conclusions in the opinion of counsel that are not covered by the ruling or for other reasons, including as a result of certain significant changes in the stock ownership of us or Equitrans Midstream after the Distribution further described below. An opinion of counsel represents the judgment of such counsel and is not binding on the IRS or any court, and the IRS or a court may disagree with the conclusions in such opinion of counsel. Accordingly, notwithstanding receipt of the IRS private letter ruling and the opinion of counsel, there can be no assurance that the IRS will not assert that the Distribution and/or certain related transactions should be treated as taxable transactions or that a court would not sustain such a
35
challenge. In the event the IRS were to prevail with such challenge, we, Equitrans Midstream and our shareholders could be subject to material U.S. federal and state income tax liabilities. In connection with the Separation, we and Equitrans Midstream entered into a tax matters agreement, which described the sharing of any such liabilities between us and Equitrans Midstream.
Even if the Distribution otherwise qualifies as generally tax-free under Section 355 and Section 368(a)(1)(D) of the Code, we, but not our shareholders, would be subject to material U.S. federal and state income tax liability under Section 355(e) of the Code if one or more persons acquire, directly or indirectly, a 50% or greater interest, measured by either vote or value, in our stock or in the stock of Equitrans Midstream, excluding, for this purpose, the acquisition of stock of Equitrans Midstream by holders of our stock in the Distribution, as part of a plan or series of related transactions that includes the Distribution. Any acquisition of our stock or stock of Equitrans Midstream, or any predecessor or successor corporation, within two years before or after the Distribution generally would be presumed to be part of a plan that includes the Distribution, although the parties may be able to rebut that presumption under certain circumstances. Additionally, Equitrans Midstream is subject to certain agreements entered into with us that restrict, within two years of the Distribution, the ability of Equitrans Midstream to engage in certain corporate transactions without obtaining an advance ruling from the IRS and our prior consent. The process for determining whether an acquisition is part of a plan under these rules is complex, inherently factual in nature and subject to a comprehensive analysis of the facts and circumstances of the particular case. Notwithstanding the IRS private letter ruling or any opinion of counsel described above, we or Equitrans Midstream may cause or permit a change in ownership of our stock or stock of Equitrans Midstream sufficient to result in a material tax liability to us.
We are a significant shareholder of Equitrans Midstream and the value of our investment in Equitrans Midstream may fluctuate substantially.
Following the Separation and Distribution, we retained approximately 19.9% of the outstanding shares of Equitrans Midstream's common stock. On February 26, 2020, we entered into share purchase agreements with Equitrans Midstream to sell approximately 50% of our equity interest in Equitrans Midstream to Equitrans Midstream (the Equitrans Share Exchange) in exchange for a combination of cash and fee relief under our gathering agreements with EQM. We currently own approximately 19.9% of the outstanding shares of Equitrans Midstream's common stock; following the closing of the Equitrans Share Exchange, we will own approximately 9.95% of the outstanding shares of Equitrans Midstream's common stock. The value of our investment in Equitrans Midstream may be adversely affected by negative changes in its results of operations, cash flows and financial position, which may occur as a result of the many risks attendant with operating in the midstream industry, including loss of gathering and transportation volumes, the effect of laws and regulations on the operation of its business and development of its assets, increased competition, loss of contracted volumes, adverse rate-making decisions, policies and rulings by the FERC, pipeline safety rulemakings initiated or finalized by the Department of Transportation's Pipeline and Hazardous Materials Safety Administration, delays in the timing of, or the failure to complete, expansion projects, lack of access to capital and operating risks and hazards.
We intend to dispose of our remaining interest in Equitrans Midstream through one or more divestitures of our shares of Equitrans Midstream's common stock. However, we can offer no assurance that we will be able to complete such disposition or as to the value we will realize. The occurrence of any of these and other risks faced by Equitrans Midstream could adversely affect the value of our investment in Equitrans Midstream.
Future sales of our common stock in the public market could reduce our stock price, and any additional capital raised by us through the sale of equity or convertible securities may dilute your ownership in us.
We may sell additional shares of common stock in subsequent public offerings. We may also issue additional shares of common stock or convertible securities.
We cannot predict the size of future issuances of our common stock or securities convertible into common stock or the effect, if any, that future issuances and sales of shares of our common stock will have on the market price of our common stock. Sales of substantial amounts of our common stock, including shares issued in connection with an acquisition, or the perception that such sales could occur, may adversely affect prevailing market prices of our common stock.
See Item 7A., "Quantitative and Qualitative Disclosures About Market Risk" for further discussion of the Company's exposure to market risks, including the risks associated with the Company's use of derivative contracts to hedge commodity prices.
Item 1B. Unresolved Staff Comments
None.
36
Item 2. Properties
See Item 1., "Business" for a description of the Company's properties. The Company's corporate headquarters is located in leased office space in Pittsburgh, Pennsylvania. The Company also owns or leases office space in Pennsylvania, West Virginia, Ohio and Texas.
Item 3. Legal Proceedings
In the ordinary course of business, various legal and regulatory claims and proceedings are pending or threatened against the Company. While the amounts claimed may be substantial, the Company is unable to predict with certainty the ultimate outcome of such claims and proceedings. The Company accrues legal and other direct costs related to loss contingencies when actually incurred. The Company has established reserves it believes to be appropriate for pending matters and, after consultation with counsel and giving appropriate consideration to available insurance, the Company believes that the ultimate outcome of any matter currently pending against the Company will not materially affect the financial position, results of operations or liquidity of the Company.
Environmental Proceedings
Erosion and Sedimentation Release, Greene County, Pennsylvania. Between September 2018 and December 2018, the Company received multiple Notices of Violation (NOVs) from the PADEP relating to the Don Flamenco Pad in Greene County, Pennsylvania. The NOVs alleged violations of the Oil and Gas Act and The Clean Streams Law in connection with erosion and sedimentation controls and an unstabilized fill slope. The Company cooperated fully with the PADEP to take appropriate actions to address the erosion and sedimentation control issues and the unstabilized fill slope. The Company entered into a Consent Order and Agreement with the PADEP on January 10, 2020 and under the terms of the agreement, the Company paid a civil penalty of $151,415 in January 2020 to resolve this matter. The payment of the civil penalty did not have a material impact on the financial position, results of operations or liquidity of the Company.
Produced Water Release, Marshall County, West Virginia. On November 12, 2019, the Company received an NOV from the West Virginia Department of Environmental Protection (the WVDEP) relating to the Goshorn Pad in Marshall County, West Virginia. The NOV alleged violations of Water Pollution Control Rules in connection with a release of produced water from secondary containment at a Goshorn Pad tank battery. The Company cooperated fully with the WVDEP to take appropriate actions to address the secondary containment issues and remediation of the release. While the Company expects the WVDEP's claims to result in penalties that exceed $100,000, the Company expects that the resolution of this matter will not have a material impact on the financial position, results of operations or liquidity of the Company.
Other Legal Proceedings
Mary Farr Secrist, et al. v. EQT Production Company, et al., Circuit Court of Doddridge County, West Virginia. On May 2, 2014, royalty owners whose predecessors had entered into a 960-acre lease (the Stout Lease) and several additional leases comprising 6,356-acres (the Cities Services Lease) with EQT Production Company's predecessor, each covering acreage in Doddridge County, West Virginia, filed a complaint in the Circuit Court of Doddridge County, West Virginia. The complaint alleged that EQT Production Company and a number of related companies, including the Company, EQT Gathering, LLC, EQT Energy, LLC, and EQM Midstream Services, LLC (formerly known as EQT Midstream Services, LLC, the general partner of the Company's former midstream affiliate), underpaid on royalties for gas produced under the leases and took improper post-production deductions from the royalties paid. With respect to the Stout Lease, the plaintiffs also asserted that the Company committed a trespass by drilling on the leased property, claiming that the Company had no right under the lease to drill in the Marcellus shale formation. The plaintiffs also asserted claims for fraud, slander of title, punitive damages, pre-judgment interest and attorneys' fees. The plaintiffs sought more than $100 million in compensatory damages for the trespass claim under the Stout Lease, and approximately $20 million for insufficient royalties under both the Stout Lease and the Cities Services Lease, in addition to punitive damages and other relief. On June 27, 2018, the Court held that EQT Production Company and its marketing affiliate EQT Energy, LLC are alter egos of one another and that royalties paid under the leases should have been based on the price of gas produced under the leases when sold to unaffiliated third parties, and not on the price when the gas was sold from EQT Production Company to EQT Energy, LLC. Further, on January 14, 2019, the Court entered an Order granting the plaintiffs' motion for summary judgment and declaring that the Company did not have the right to drill in the Marcellus shale formation under the Stout Lease. The Court also ruled that seven of the Company's wells that have been producing gas under the Stout Lease are trespassing, and that a jury will determine whether the trespass was willful or innocent. On February 27, 2019, the Company filed a motion seeking permission to immediately appeal the trespass Order to the West Virginia Supreme Court; however, the motion was denied on March 25, 2019, and the Court continued the trial to September 2019. On May 28, 2019, the Court entered an Order excluding certain of the Company's costs that could have otherwise offset any damages for innocent trespass under the Stout Lease. On August 8, 2019,
37
the Company reached a settlement with the plaintiffs to resolve all claims under the Stout Lease and the Cities Services Lease for $54 million plus lease modifications to address the trespass issue and the calculation of future royalty payments under the leases. The Company paid $51 million of the settlement in October 2019 and the remaining $3 million of the settlement in January 2020. Amendments to modify the terms of the Stout Lease are in process and, when finalized, an Order to dismiss the case will be filed with the Court to formally close this matter.
Item 4. Mine Safety Disclosures
Not Applicable.
38
Information about our Executive Officers (as of February 27, 2020)
Name and Age | Current Title (Year Initially Elected an Executive Officer) | Business Experience | ||
Tony Duran (41) | Chief Information Officer (2019) | Mr. Duran was appointed as the Chief Information Officer of the Company in July 2019. Prior to joining the Company, Mr. Duran ran PH6 Labs, a technology incubator he founded, from December 2017 to July 2019. Prior to that, he served as the Chief Information Officer of Rice Energy Inc. (independent natural gas and oil company acquired by the Company in November 2017) from January 2016 to November 2017; and as the Interim Chief Information Officer of Express Energy Services (oilfield services company for well construction and well testing services) from September 2015 to December 2015. Additionally, Mr. Duran held various positions at National Oilwell Varco (multinational corporation that provides equipment and components used in oil and gas drilling and production operations, oilfield services, and supply chain integration services to the upstream oil and gas industry) from May 2002 to August 2015, where he last held the role of Assistant Chief Information Officer. | ||
Lesley Evancho (42) | Chief Human Resources Officer (2019) | Ms. Evancho was appointed as the Chief Human Resources Officer of the Company in July 2019. Prior to joining the Company, Ms. Evancho served as Vice President, Global Talent Management at Westinghouse Electric Company, LLC (nuclear power, fuel and services company) from April 2019 to July 2019; Senior Director, Human Resources at Thermo Fisher Scientific, Inc. (biotechnology product development company) from August 2018 to March 2019; Vice President, Human Resources at Edward Marc Brands (food services company) from March 2018 to August 2018; and Vice President, Human Resources at Rice Energy Inc. from April 2017 to November 2017. Additionally, Ms. Evancho served as Global Director, Talent Management at MSA Safety, Inc. (manufacturer of industrial safety equipment) from November 2011 to April 2017. | ||
Todd M. James (37) | Chief Accounting Officer (2019) | Mr. James was appointed as the Chief Accounting Officer of the Company in November 2019. Previously, Mr. James served as the Corporate Controller and Chief Accounting Officer of L.B. Foster Company (manufacturer and distributor of products and services for transportation and energy infrastructure) from April 2018 to October 2019. Prior to that he served as the Senior Director, Technical Accounting and Financial Reporting at Rice Energy Inc. from December 2014 through its acquisition by the Company in November 2017 and until February 2018. Prior to joining Rice Energy, Mr. James was a Senior Manager, Assurance at PricewaterhouseCoopers LLP (public accounting firm), where he worked from August 2005 to November 2014. | ||
William E. Jordan (39) | Executive Vice President and General Counsel (2019) | Mr. Jordan was appointed as the Executive Vice President and General Counsel of the Company in July 2019. Mr. Jordan served as an advisor to the Rice Investment Group (multi-strategy investment fund investing in all verticals of the oil and gas sectors) from May 2018 until July 2019. Prior to that, he served as the Senior Vice President, General Counsel and Corporate Secretary of Rice Energy Inc. and Senior Vice President, General Counsel and Corporate Secretary of Rice Midstream Partners LP (former midstream services affiliate of Rice Energy Inc.), in each case from January 2014 until their acquisition by the Company in November 2017. From September 2005 to December 2013, Mr. Jordan was an associate at Vinson & Elkins LLP (an international law firm) representing public and private companies in capital markets offerings and mergers and acquisitions, primarily in the oil and natural gas industry. | ||
David M. Khani (56) | Chief Financial Officer (2020) | Mr. Khani was appointed as the Chief Financial Officer of the Company in January 2020. Prior to joining the Company, Mr. Khani served as the Executive Vice President and Chief Financial Officer of CONSOL Energy (energy company primarily focused on developing coal interests), from March 2013 to December 2019; and as Vice President, Finance at CONSOL Energy from September 2011 to March 2013. In addition, Mr. Khani served as Chief Financial Officer and as a member of the Board of Directors of CONE Midstream LLC (midstream services affiliate of CONSOL Energy) from September 2014 to January 2018; as a member of the Board of Directors of CNX Coal Resources (coal mining affiliate of CONSOL Energy) from July 2015 to August 2017; and as Chief Financial Officer and as a member of the Board of Directors of CONSOL Coal Resources (coal mining affiliate of CONSOL Energy) from August 2017 to December 2019. | ||
Toby Z. Rice (38) | President and Chief Executive Officer (2019) | Mr. Rice was appointed as President and Chief Executive Officer of the Company in July 2019, when he also was elected to the Company's Board of Directors. Mr. Rice has served as a Partner at the Rice Investment Group, a multi-strategy fund investing in all verticals of the oil and gas sector, since May 2018. From October 2014 until its acquisition by the Company in November 2017, Mr. Rice was President and Chief Operating Officer of Rice Energy Inc. and served on the Board of Directors of Rice Energy Inc. from October 2013 to November 2017. Prior to that, he served in a number of positions with Rice Energy, its affiliates and predecessor entities beginning in February 2007, including as President and Chief Executive Officer of a predecessor entity from February 2008 through September 2013. Mr. Rice is the brother of Daniel J. Rice IV, a member of the Company's Board of Directors since November 2017. | ||
39
PART II
Item 5. Market for Registrant's Common Equity, Related Stockholder Matters and Issuer Purchases of Equity Securities
The Company's common stock is traded on the New York Stock Exchange under the symbol "EQT."
As of February 25, 2020, there were 2,059 shareholders of record of the Company's common stock.
The amount and timing of dividends declared and paid by the Company, if any, is subject to the discretion of the Company's Board of Directors and depends on business conditions, such as the Company's results of operations and financial condition, strategic direction and other factors. The Company's Board of Directors has the discretion to change the annual dividend rate at any time for any reason.
Recent Sales of Unregistered Securities
None.
Market Repurchases
The Company did not repurchase any equity securities registered under Section 12 of the Securities Exchange Act of 1934, as amended, during the three months ended December 31, 2019.
Stock Performance Graph
The following graph compares the most recent cumulative five-year total return provided to shareholders of the Company's common stock with the cumulative five-year total returns of the S&P 500 Index and two customized peer groups, the 2018 Self-Constructed Peer Group and 2019 Self-Constructed Peer Group, whose company composition is discussed in footnotes (a) and (b), respectively, below. An investment of $100, with reinvestment of all dividends, is assumed to have been made on December 31, 2014 and its relative performance is tracked through December 31, 2019. Historical prices prior to the Separation and Distribution have been adjusted to reflect the value of the Separation and Distribution. The stock price performance shown in the graph below is not necessarily indicative of future stock price performance.
40
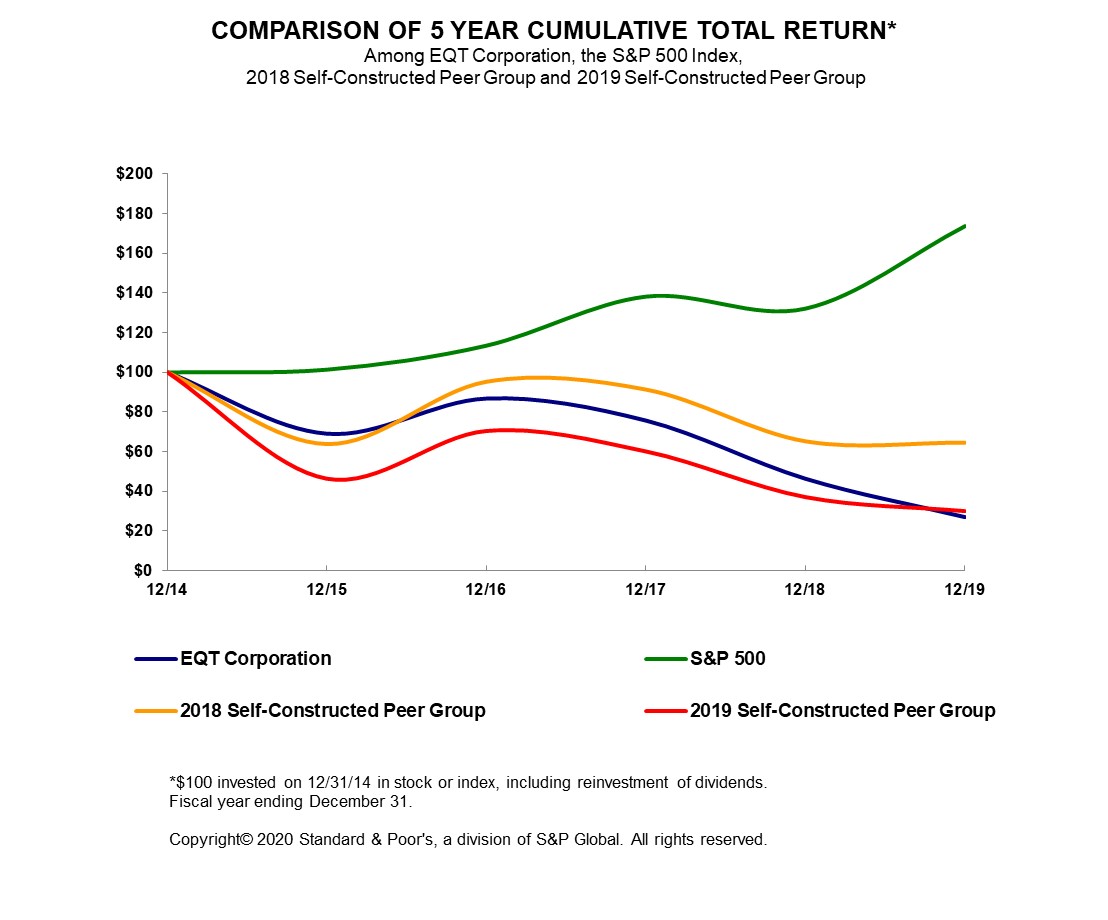
12/14 | 12/15 | 12/16 | 12/17 | 12/18 | 12/19 | ||||||||||||||||||
EQT Corporation | $ | 100.00 | $ | 68.97 | $ | 86.69 | $ | 75.59 | $ | 46.25 | $ | 26.91 | |||||||||||
S&P 500 | 100.00 | 101.38 | 113.51 | 138.29 | 132.23 | 173.86 | |||||||||||||||||
2018 Self-Constructed Peer Group (a) | 100.00 | 63.86 | 95.16 | 91.24 | 65.24 | 64.55 | |||||||||||||||||
2019 Self-Constructed Peer Group (b) | 100.00 | 46.11 | 70.23 | 59.90 | 36.78 | 29.68 | |||||||||||||||||
(a) | The 2018 Self-Constructed Peer Group includes the following seventeen companies: Antero Resources Corp., Apache Corp., Cabot Oil & Gas Corp., Chesapeake Energy Corp., Cimarex Energy Co., CNX Resources Corp., Concho Resources Inc., Continental Resources, Inc., Devon Energy Corp., Diamondback Energy, Inc., Encana Corp., EOG Resources, Inc., Hess Corp., Marathon Oil Corp., Noble Energy, Inc., Pioneer Natural Resources Co. and Range Resources Corp. Anadarko Petroleum Corp. and Newfield Exploration Co. were included in the self-constructed peer group that served as the basis for the stock performance graph in the Company's Annual Report on Form 10-K for the year ended December 31, 2018, but both entities have been excluded from the 2018 Self-Constructed Peer Group because they were acquired during 2019. |
(b) | The 2019 Self-Constructed Peer Group includes the following thirteen companies: Antero Resources Corp., Cabot Oil & Gas Corp., Chesapeake Energy Corp., Cimarex Energy Co., CNX Resources Corp., Encana Corp., Gulfport Energy Corp., Murphy Oil Corp., QEP Resources, Inc., Range Resources Corp., SM Energy Co., Southwestern Energy Co. and WPX Energy Inc. Based on recommendations and advice from Pay Governance LLC (Pay Governance), an independent compensation consultant, and in light of the Company's transformation into a pure-play upstream company following the Separation, the Management Development and Compensation Committee of the Company's Board of Directors (the Compensation Committee) refined the 2019 Self-Constructed Peer Group to include only companies whose natural gas production accounts for greater than 30% of their total production volume. In addition, the Compensation Committee considered the reduction in the Company's market capitalization that resulted from the Separation and Distribution and ultimately decided to exclude from the 2019 Self-Constructed Peer Group companies that fell outside a relative range of market capitalization size when compared to the Company post-Separation. |
41
Item 6. Selected Financial Data
The following selected financial data should be read in conjunction with Item 7., "Management's Discussion and Analysis of Financial Condition and Results of Operations" and Item 8., "Financial Statements and Supplementary Data." The following summary of operating results reflects variations from various factors, including the volatility of natural gas commodity prices, impairments, the Separation and Distribution and the 2018 Divestitures. Operating results for the years ended December 31, 2018, 2017, 2016 and 2015 have been recast to reflect the presentation of discontinued operations described in Note 2 to the Consolidated Financial Statements.
As of and for the Years Ended December 31, | |||||||||||||||||||
2019 | 2018 | 2017 | 2016 | 2015 | |||||||||||||||
(Thousands, except per share amounts) | |||||||||||||||||||
Total operating revenues | $ | 4,416,484 | $ | 4,557,868 | $ | 3,091,020 | $ | 1,387,054 | $ | 2,131,664 | |||||||||
Amounts attributable to EQT Corporation: | |||||||||||||||||||
(Loss) income from continuing operations | $ | (1,221,695 | ) | $ | (2,380,920 | ) | $ | 1,387,029 | $ | (531,493 | ) | $ | (87,274 | ) | |||||
Income from discontinued operations, net of tax | — | 136,352 | 121,500 | 78,510 | 172,445 | ||||||||||||||
Net (loss) income | $ | (1,221,695 | ) | $ | (2,244,568 | ) | $ | 1,508,529 | $ | (452,983 | ) | $ | 85,171 | ||||||
Earnings per share of common stock attributable to EQT Corporation: | |||||||||||||||||||
Basic: | |||||||||||||||||||
(Loss) income from continuing operations | $ | (4.79 | ) | $ | (9.12 | ) | $ | 7.40 | $ | (3.18 | ) | $ | (0.57 | ) | |||||
Income from discontinued operations | — | 0.52 | 0.65 | 0.47 | 1.13 | ||||||||||||||
Net (loss) income | $ | (4.79 | ) | $ | (8.60 | ) | $ | 8.05 | $ | (2.71 | ) | $ | 0.56 | ||||||
Diluted: | |||||||||||||||||||
(Loss) income from continuing operations | $ | (4.79 | ) | $ | (9.12 | ) | $ | 7.39 | $ | (3.18 | ) | $ | (0.57 | ) | |||||
Income from discontinued operations | — | 0.52 | 0.65 | 0.47 | 1.13 | ||||||||||||||
Net (loss) income | $ | (4.79 | ) | $ | (8.60 | ) | $ | 8.04 | $ | (2.71 | ) | $ | 0.56 | ||||||
Total assets | $ | 18,809,227 | $ | 20,721,344 | $ | 29,522,604 | $ | 15,472,922 | $ | 13,976,172 | |||||||||
Total long-term debt, including current portion | $ | 5,292,979 | $ | 5,497,381 | $ | 5,997,329 | $ | 2,427,020 | $ | 2,299,942 | |||||||||
Cash dividends declared per share of common stock | $ | 0.12 | $ | 0.12 | $ | 0.12 | $ | 0.12 | $ | 0.12 | |||||||||
42
Item 7. Management's Discussion and Analysis of Financial Condition and Results of Operations
The following discussion and analysis of financial condition and results of operations should be read in conjunction with the Consolidated Financial Statements and the notes thereto included in Item 8., "Financial Statements and Supplementary Data." For all periods prior to the Separation and Distribution, the results of operations of Equitrans Midstream are reflected as discontinued operations. The Statements of Consolidated Operations for the years ended December 31, 2018 and 2017 have been recast to reflect discontinued operations and include certain transportation and processing expenses in continuing operations that had previously been eliminated in consolidation. Cash flows related to Equitrans Midstream are included in the Statements of Consolidated Cash Flows for all periods prior to the Separation and Distribution. See Note 2 to the Consolidated Financial Statements for amounts attributable to discontinued operations included in the Statements of Consolidated Cash Flows and Statements of Consolidated Operations.
Consolidated Results of Operations
Loss from continuing operations for 2019 was $1,222 million, $4.79 per diluted share, an improvement of $1,159 million compared to loss from continuing operations for 2018 of $2,381 million, $9.12 per diluted share. The variance was attributable primarily to lower impairments of long-lived assets and goodwill and higher dividends received on the Company's investment in Equitrans Midstream, partly offset by lower income tax benefit and higher impairment and expiration of leases, unrealized loss on the Company's investment in Equitrans Midstream and operating revenues.
See Item 7., "Management's Discussion and Analysis of Financial Condition and Results of Operations" included in the Company's Annual Report on Form 10-K for the year ended December 31, 2018, which is incorporated herein by reference, for discussion and analysis of consolidated results of operations for the year ended December 31, 2017.
See "Sales Volumes and Revenues," "Production-Related Operating Expenses" and "Other Operating Expenses" for discussions of items affecting operating income and "Other Income Statement Items" for a discussion of other income statement items. See "Investing Activities" under "Capital Resources and Liquidity" for a discussion of capital expenditures.
Average Realized Price Reconciliation
The following table presents detailed natural gas and liquids operational information to assist in the understanding of the Company's consolidated operations, including the calculation of the Company's average realized price ($/Mcfe), which is based on adjusted operating revenues, a non-GAAP supplemental financial measure. Adjusted operating revenues is presented because it is an important measure used by the Company's management to evaluate period-to-period comparisons of earnings trends. Adjusted operating revenues should not be considered as an alternative to total operating revenues. See "Reconciliation of Non-GAAP Financial Measures" for a reconciliation of adjusted operating revenues with total operating revenues, the most directly comparable financial measure calculated in accordance with GAAP.
43
Years Ended December 31, | |||||||
2019 | 2018 | ||||||
(Thousands, unless otherwise noted) | |||||||
NATURAL GAS | |||||||
Sales volume (MMcf) | 1,435,134 | 1,386,718 | |||||
NYMEX price ($/MMBtu) (a) | $ | 2.63 | $ | 3.10 | |||
Btu uplift | 0.13 | 0.19 | |||||
Natural gas price ($/Mcf) | $ | 2.76 | $ | 3.29 | |||
Basis ($/Mcf) (b) | $ | (0.28 | ) | $ | (0.25 | ) | |
Cash settled basis swaps (not designated as hedges) ($/Mcf) | (0.04 | ) | (0.08 | ) | |||
Average differential, including cash settled basis swaps ($/Mcf) | $ | (0.32 | ) | $ | (0.33 | ) | |
Average adjusted price ($/Mcf) | $ | 2.44 | $ | 2.96 | |||
Cash settled derivatives (not designated as hedges) ($/Mcf) | 0.21 | (0.07 | ) | ||||
Average natural gas price, including cash settled derivatives ($/Mcf) | $ | 2.65 | $ | 2.89 | |||
Natural gas sales, including cash settled derivatives | $ | 3,805,977 | $ | 4,004,147 | |||
LIQUIDS | |||||||
NGLs, excluding ethane: | |||||||
Sales volume (MMcfe) (c) | 44,082 | 63,247 | |||||
Sales volume (Mbbl) | 7,348 | 10,542 | |||||
Price ($/Bbl) | $ | 23.63 | $ | 37.63 | |||
Cash settled derivatives (not designated as hedges) ($/Bbl) | 2.19 | (1.07 | ) | ||||
Average NGLs price, including cash settled derivatives ($/Bbl) | $ | 25.82 | $ | 36.56 | |||
NGLs sales | $ | 189,718 | $ | 385,364 | |||
Ethane: | |||||||
Sales volume (MMcfe) (c) | 23,748 | 33,645 | |||||
Sales volume (Mbbl) | 3,957 | 5,607 | |||||
Price ($/Bbl) | $ | 6.16 | $ | 8.09 | |||
Cash settled derivatives (not designated as hedges) ($/Bbl) | 1.02 | — | |||||
Average Ethane price, including cash settled derivatives ($/Bbl) | $ | 7.18 | $ | 8.09 | |||
Ethane sales | $ | 28,414 | $ | 45,339 | |||
Oil: | |||||||
Sales volume (MMcfe) (c) | 4,932 | 4,079 | |||||
Sales volume (Mbbl) | 822 | 680 | |||||
Price ($/Bbl) | $ | 40.90 | $ | 52.70 | |||
Oil sales | $ | 33,620 | $ | 35,825 | |||
Total liquids sales volume (MMcfe) (c) | 72,762 | 100,971 | |||||
Total liquids sales volume (Mbbl) | 12,127 | 16,829 | |||||
Total liquids sales | $ | 251,752 | $ | 466,528 | |||
TOTAL | |||||||
Total natural gas and liquids sales, including cash settled derivatives (d) | $ | 4,057,729 | $ | 4,470,675 | |||
Total sales volume (MMcfe) | 1,507,896 | 1,487,689 | |||||
Average realized price ($/Mcfe) | $ | 2.69 | $ | 3.01 | |||
(a) | The Company's volume weighted NYMEX natural gas price (actual average NYMEX natural gas price ($/MMBtu)) was $2.63 and $3.09 for the years ended December 31, 2019 and 2018, respectively. |
(b) | Basis represents the difference between the ultimate sales price for natural gas and the NYMEX natural gas price. |
(c) | NGLs, ethane and oil were converted to Mcfe at a rate of six Mcfe per barrel. |
(d) | Total natural gas and liquids sales, including cash settled derivatives, is also referred to in this report as adjusted operating revenues, a non-GAAP supplemental financial measure. |
44
Non-GAAP Financial Measures Reconciliation
The table below reconciles adjusted operating revenues, a non-GAAP supplemental financial measure, with total operating revenues, its most directly comparable financial measure calculated in accordance with GAAP. Adjusted operating revenues (also referred to as total natural gas and liquids sales, including cash settled derivatives) is presented because it is an important measure used by the Company's management to evaluate period-to-period comparisons of earnings trends. Adjusted operating revenues as presented excludes the revenue impact of changes in the fair value of derivative instruments prior to settlement and the revenue impact of net marketing services and other. Management uses adjusted operating revenues to evaluate earnings trends because the measure reflects only the impact of settled derivative contracts and, thus, excludes the impact of the often-volatile fluctuations in the fair value of derivatives prior to settlement. Adjusted operating revenues also excludes net marketing services and other because management considers these revenues to be unrelated to revenues from its natural gas and liquids production. Net marketing services and other primarily includes the cost of, and recoveries on, pipeline capacity releases and revenues for gathering services. Management further believes that adjusted operating revenues as presented provides useful information to investors for evaluating period-to-period earnings trends.
Years Ended December 31, | |||||||
2019 | 2018 | ||||||
(Thousands, unless otherwise noted) | |||||||
Total operating revenues | $ | 4,416,484 | $ | 4,557,868 | |||
Add (deduct): | |||||||
(Gain) loss on derivatives not designated as hedges | (616,634 | ) | 178,591 | ||||
Net cash settlements received (paid) on derivatives not designated as hedges | 246,639 | (225,279 | ) | ||||
Premiums received for derivatives that settled during the period | 19,676 | 435 | |||||
Net marketing services and other | (8,436 | ) | (40,940 | ) | |||
Adjusted operating revenues, a non-GAAP financial measure | $ | 4,057,729 | $ | 4,470,675 | |||
Total sales volumes (MMcfe) | 1,507,896 | 1,487,689 | |||||
Average realized price ($/Mcfe) | $ | 2.69 | $ | 3.01 | |||
Sales Volumes and Revenues
Years Ended December 31, | ||||||||||
2019 | 2018 | % | ||||||||
(Thousands, unless otherwise noted) | ||||||||||
Sales volume detail (MMcfe): | ||||||||||
Marcellus (a) | 1,270,352 | 1,229,934 | 3.3 | |||||||
Ohio Utica | 231,545 | 209,428 | 10.6 | |||||||
Other | 5,999 | 48,327 | (87.6 | ) | ||||||
Total sales volumes (b) | 1,507,896 | 1,487,689 | 1.4 | |||||||
Average daily sales volumes (MMcfe/d) | 4,131 | 4,076 | 1.3 | |||||||
Operating revenues: | ||||||||||
Sales of natural gas, NGLs and oil | $ | 3,791,414 | $ | 4,695,519 | (19.3 | ) | ||||
Gain (loss) on derivatives not designated as hedges | 616,634 | (178,591 | ) | (445.3 | ) | |||||
Net marketing services and other | 8,436 | 40,940 | (79.4 | ) | ||||||
Total operating revenues | $ | 4,416,484 | $ | 4,557,868 | (3.1 | ) | ||||
(a) | Includes Upper Devonian wells. |
(b) | NGLs, ethane and oil were converted to Mcfe at a rate of six Mcfe per barrel. |
Sales of natural gas, NGLs and oil decreased for 2019 compared to 2018 due to a lower average realized price, partly offset by a 1.4% increase in sales volumes. Excluding 2018 sales volumes related to the 2018 Divestitures (discussed in Note 7 to the
45
Consolidated Financial Statements), sales volumes increased by 4.2% in 2019. Average realized price decreased due to lower NYMEX and liquids prices and lower Btu uplift, partly offset by higher cash settled derivatives. For 2019 and 2018, the Company received $266.3 million and paid $224.8 million, respectively, of net cash settlements, including net premiums received, on derivatives not designated as hedges, which are included in average realized price but may not be included in operating revenues.
For 2019 the Company recognized a gain on derivatives not designated as hedges of $616.6 million compared to a loss of $178.6 million for 2018. The gain for 2019 was related to increases in the fair market value of the Company's NYMEX swaps and options due to decreases in NYMEX forward prices. The loss for 2018 was related primarily to settlements of NYMEX swaps and options and basis swaps, partly offset by decreases in NYMEX forward prices.
Net marketing services and other decreased for 2019 compared to 2018 as a result of fewer capacity releases at lower capacity release rates on the Tennessee Gas Pipeline and lower revenues from gathering services following the 2018 Divestitures.
Production-Related Operating Expenses
The following table presents information on the Company's production-related operating expenses.
Years Ended December 31, | ||||||||||
2019 | 2018 | % | ||||||||
(Thousands, unless otherwise noted) | ||||||||||
Per Unit ($/Mcfe): | ||||||||||
Gathering | $ | 0.56 | $ | 0.54 | 3.7 | |||||
Transmission | 0.52 | 0.49 | 6.1 | |||||||
Processing | 0.08 | 0.11 | (27.3 | ) | ||||||
Lease operating expenses (LOE), excluding production taxes | 0.06 | 0.07 | (14.3 | ) | ||||||
Production taxes | 0.05 | 0.06 | (16.7 | ) | ||||||
Exploration | — | — | — | |||||||
Selling, general and administrative | 0.17 | 0.19 | (10.5 | ) | ||||||
Production depletion | 1.01 | 1.04 | (2.9 | ) | ||||||
Operating expenses: | ||||||||||
Gathering | $ | 842,414 | $ | 801,746 | 5.1 | |||||
Transmission | 784,534 | 729,537 | 7.5 | |||||||
Processing | 125,804 | 165,718 | (24.1 | ) | ||||||
LOE, excluding production taxes | 84,501 | 100,644 | (16.0 | ) | ||||||
Production taxes | 69,284 | 95,131 | (27.2 | ) | ||||||
Exploration | 7,223 | 6,765 | 6.8 | |||||||
Selling, general and administrative | 253,006 | 284,220 | (11.0 | ) | ||||||
Production depletion | $ | 1,524,112 | $ | 1,546,136 | (1.4 | ) | ||||
Other depreciation and depletion | 14,633 | 22,902 | (36.1 | ) | ||||||
Total depreciation and depletion | $ | 1,538,745 | $ | 1,569,038 | (1.9 | ) | ||||
Transportation and processing. Gathering expense increased on an absolute and per Mcfe basis for 2019 compared to 2018 due primarily to the sales volume mix between firm and volumetric gathering contracts. Transmission expense increased on an absolute and per Mcfe basis for 2019 compared to 2018 due primarily to higher costs associated with unreleased capacity on the Tennessee Gas Pipeline, increased transmission capacity and rates contracted to move the Company's natural gas out of the Appalachian Basin and higher volumetric charges, partly offset by lower firm capacity charges following the 2018 Divestitures. Processing expense decreased on an absolute and per Mcfe basis for 2019 compared to 2018 due primarily to lower liquids sales volumes, which were driven by the 2018 Divestitures, and decreased West Virginia production.
Production. LOE decreased on an absolute and per Mcfe basis for 2019 compared to 2018 primarily as a result of the 2018 Divestitures, partly offset by higher salt water disposal costs. Excluding costs related to the 2018 Divestitures, LOE per Mcfe was $0.05 in 2018. Production taxes decreased on an absolute and per Mcfe basis for 2019 compared to 2018 due primarily to (i) lower
46
Pennsylvania impact fees as a result of less wells spud and lower pricing, (ii) lower severance taxes as a result of decreased West Virginia production and lower pricing and (iii) lower property taxes as a result of the 2018 Divestitures.
Selling, general and administrative. Selling, general and administrative expense decreased on an absolute and per Mcfe basis for 2019 compared to 2018 primarily as a result of lower personnel costs due to reductions in workforce, the $15 million charitable contribution made to the EQT Foundation in 2018 and decreased long-term incentive compensation due to changes in the fair value of awards, partly offset by increased litigation expenses. Long-term incentive compensation may fluctuate with changes in the Company's stock price and performance conditions.
Depreciation and depletion. Production depletion decreased on an absolute and per Mcfe basis for 2019 compared to 2018 due primarily to a lower depletion rate, partly offset by higher sales volumes. Other depreciation and depletion decreased as a result of the 2018 Divestitures.
Other Operating Expenses
Impairment/ loss on sale/exchange of long-lived assets. During the fourth quarter of 2019 the Company recorded impairment of long-lived assets of $1,124.4 million, of which $1,035.7 million was associated with the Company's non-strategic assets located in Ohio Utica and $88.7 million was associated with the Company's Pennsylvania and West Virginia Utica assets. The impairment was due primarily to depressed natural gas prices and changes in the Company's development strategy, including the Company's contemplation of a potential asset divestiture of certain of its non-strategic exploration and production assets. During the third quarter of 2019, the Company recorded a loss on exchange of long-lived assets of $13.9 million related to the Asset Exchange Transaction (defined and discussed in Note 6 to the Consolidated Financial Statements). For 2018, the Company recorded impairment/ loss on sale of long-lived assets of $2.7 billion related to the 2018 Divestitures. See Note 1 to the Consolidated Financial Statements for a discussion of 2019 and 2018 impairment tests and Note 7 to the Consolidated Financial Statements for a discussion of the 2018 Divestitures.
Amortization and impairment of intangible assets. During the third quarter of 2019, the Company recognized impairment of intangible assets associated with non-compete agreements for former Rice Energy Inc. executives who are now employees of the Company. The impairment resulted in decreased amortization in the second half of 2019.
Impairment of goodwill. During the fourth quarter of 2018, the Company recognized impairment of goodwill because the Company's single reporting unit's fair value was below its carrying value. See Note 1 to the Consolidated Financial Statements for further discussion of the 2018 goodwill impairment test.
Impairment and expiration of leases. Impairment and expiration of leases increased from $556.4 million for 2019 compared to $279.7 million for 2018 due primarily to impairment of leases located in non-strategic development areas that are not expected to be developed due to changes in the Company's development strategy, which includes a renewed focus on a refined core operating footprint. To a lesser extent, impairment increased due to lease expirations, a majority of which were related to leases acquired in 2017 and 2016.
Proxy, transaction and reorganization. Proxy, transaction and reorganization expense increased for 2019 compared to 2018 due primarily to reductions in workforce and other strategic alignment initiatives, which resulted in severance and other termination benefits of $74.1 million and contract termination fees of $22.1 million, as well as proxy costs recognized in the first half of 2019 of $19.3 million. Prior period transaction costs were related to the Rice Merger (discussed in Note 8 to the Consolidated Financial Statements).
Other Income Statement Items
The Company's investment in Equitrans Midstream is recorded at fair value, which is calculated by multiplying the closing stock price of Equitrans Midstream's common stock by the number of shares of Equitrans Midstream's common stock owned by the Company. Changes in fair value are recorded in unrealized loss on investment in Equitrans Midstream Corporation in the Statements of Consolidated Operations. The Company's investment in Equitrans Midstream fluctuates with changes in Equitrans Midstream's stock price, which was $13.36 and $20.02 as of December 31, 2019 and 2018, respectively.
Dividend and other income increased due to dividends received on the Company's investment in Equitrans Midstream during the year ended December 31, 2019.
47
Interest expense decreased for 2019 compared to 2018 due to repayment of the $700 million aggregate principal amount of the Company's 8.125% senior notes that matured on June 1, 2019 and decreased borrowings under the Company's credit facility, partly offset by interest incurred on borrowings under the Term Loan Facility.
See Note 9 to the Consolidated Financial Statements for a discussion of income tax benefit.
Outlook
See Item 1., "Business."
Impairment of Oil and Gas Properties
See "Critical Accounting Policies and Estimates" and Note 1 to the Consolidated Financial Statements for a discussion of the Company's accounting policies and significant assumptions related to impairment of the Company's oil and gas properties.
See Item 1A., "Risk Factors – Natural gas, NGLs and oil price declines, and changes in our development strategy, have resulted in impairment of certain of our assets. Future declines in commodity prices, increases in operating costs or adverse changes in well performance or additional changes in our development strategy may result in additional write-downs of the carrying amounts of our assets, including long-lived intangible assets, which could materially and adversely affect our results of operations in future periods."
Capital Resources and Liquidity
The Statements of Consolidated Cash Flows for the years ended December 31, 2018 and 2017 have not been restated for discontinued operations; therefore, the following discussion of operating, investing and financing activities includes cash flows of both continuing and discontinued operations through the Separation and Distribution. See Note 2 to the Consolidated Financial Statements for amounts attributable to discontinued operations included in the Statements of Consolidated Cash Flows.
Although the Company cannot provide any assurance, it believes cash flows from operating activities and availability under the revolving credit facility should be sufficient to meet the Company's cash requirements inclusive of, but not limited to, normal operating needs, debt service obligations, planned capital expenditures and commitments for at least the next twelve months.
See Item 7., "Management's Discussion and Analysis of Financial Condition and Results of Operations" included in the Company's Annual Report on Form 10-K for the year ended December 31, 2018, which is incorporated herein by reference, for discussion and analysis of operating, investing and financing activities for the year ended December 31, 2017.
Operating Activities
Net cash flows provided by operating activities were $1,852 million for 2019 compared to $2,976 million for 2018. The decrease was driven by cash provided by discontinued operations included in 2018 and lower cash operating revenues, partly offset by favorable timing of working capital payments and dividends received on the Company's investment in Equitrans Midstream.
The Company's cash flows from operating activities will be affected by movements in the market price for commodities. The Company is unable to predict such movements outside of the current market view as reflected in forward strip pricing. Refer to Item 1A., "Risk Factors – Natural gas, NGLs and oil price volatility, or a prolonged period of low natural gas, NGLs and oil prices, may have an adverse effect upon our revenue, profitability, future rate of growth, liquidity and financial position." for further information.
Investing Activities
Net cash flows used in investing activities were $1,601 million for 2019 compared to $3,979 million for 2018. The decrease was due primarily to lower capital expenditures as a result of the Company's change in strategic focus from production growth to capital efficiency and cash used for capital expenditures and capital contributions by discontinued operations included in 2018, partly offset by proceeds received from asset sales in 2018.
48
Capital Expenditures
Years Ended December 31, | |||||||
2019 | 2018 | ||||||
(Millions) | |||||||
Reserve development | $ | 1,377 | $ | 2,249 | |||
Land and lease | 195 | 276 | |||||
Capitalized overhead | 77 | 130 | |||||
Capitalized interest | 24 | 29 | |||||
Other production infrastructure | 97 | 48 | |||||
Other corporate items | 3 | 7 | |||||
Total capital expenditures from continuing operations | 1,773 | 2,739 | |||||
Midstream infrastructure (a) | — | 733 | |||||
Total capital expenditures | 1,773 | 3,472 | |||||
(Deduct) add non-cash items (b) | (171 | ) | 260 | ||||
Total cash capital expenditures | $ | 1,602 | $ | 3,732 | |||
(a) | Midstream infrastructure capital expenditures are presented as discontinued operations. See Note 2 to the Consolidated Financial Statements. |
(b) | Represents the net impact of non-cash capital expenditures, including capitalized share-based compensation costs and the effect of timing of receivables from working interest partners and accrued capital expenditures. The impact of accrued capital expenditures includes the reversal of the prior period accrual as well as the current period estimate. The year ended December 31, 2018 included $14.4 million of measurement period adjustments for 2017 acquisitions. |
Financing Activities
Net cash flows used in financing activities were $249 million for 2019 compared to net cash flows provided by financing activities of $859 million for 2018. For 2019, the primary uses of financing cash flows were net repayments of debt and credit facility borrowings, and the primary source of financing cash flows was net proceeds from borrowings on the Term Loan Facility. For 2018, the primary source of financing cash flows was net proceeds from a debt offering by EQM Midstream Partners, LP (EQM), the Company's former midstream affiliate, and the primary uses of financing cash flows were the repurchase and retirement of common stock, distributions to noncontrolling interests, net repayments of credit facility borrowings, EQM's acquisition of 25% ownership interest in Strike Force Midstream LLC, net cash transferred in connection with the Separation and Distribution, cash paid for dividends and taxes on share-based incentive awards.
On February 4, 2020, the Company's Board of Directors declared a quarterly cash dividend of three cents per share, payable March 1, 2020 to the Company's shareholders of record at the close of business on February 14, 2020.
On January 21, 2020, the Company issued $1.0 billion aggregate principal amount of 6.125% senior notes due February 1, 2025 and $750 million aggregate principal amount of 7.000% senior notes due February 1, 2030 (together, the Adjustable Rate Notes). The Company used the net proceeds from the Adjustable Rate Notes to repay $500 million aggregate principal amount of the Company's floating rate notes and $500 million aggregate principal amount of the Company's 2.50% senior notes and expects to use the remaining proceeds to repay or redeem other outstanding indebtedness, which may include all or a portion of the Company's outstanding 4.875% senior notes due November 15, 2021. The Adjustable Rate Notes have covenants that are consistent with the Company's existing senior unsecured notes, with an additional interest rate adjustment provision that provides for adjustments to its interest rates based on credit ratings assigned by Moody's, S&P and Fitch to the Adjustable Rate Notes. As a result of the S&P and Fitch downgrades of the Company's senior notes credit rating (discussed in section "Security Ratings and Financing Triggers"), the interest rate on the 6.125% senior notes increased to 6.875% and the interest rate on the 7.000% senior notes increased to 7.750%.
On February 3, 2020, the Company's 2.50% senior notes and floating rate notes, each due October 1, 2020, were fully redeemed by the Company at a redemption price of 100.446% and 100%, respectively, plus accrued but unpaid interest of $4.2 million and $1.2 million, respectively. This resulted in the payment of make whole call premiums of $2.2 million related to the 2.50% senior notes.
On February 12, 2020, the Company announced its commencement of a cash tender offer (the Tender Offer) for up to $400 million aggregate principal amount of its 4.875% senior notes due 2021 (the 4.875% Notes). Consideration paid in the Tender Offer for
49
the 4.875% Notes that are validly tendered on or prior to March 2, 2020, and accepted for purchase by the Company, will be $1,020 per $1,000 principal amount, including an early tender premium of $30 per $1,000 principal amount. The settlement date for such notes is expected to be March 4, 2020. Consideration paid in the Tender Offer for the 4.875% Notes that are validly tendered after March 2, 2020 and on or prior to March 16, 2020, and accepted for purchase by the Company, will be $990 per $1,000 principal amount. The settlement date for such notes is expected to be March 18, 2020. Payments for the 4.875% Notes purchased will also include accrued and unpaid interest from, and including, the last interest payment date on the 4.875% Notes up to, but not including, the applicable settlement date for such 4.875% Notes accepted for purchase by the Company.
The Company may from time to time seek to repurchase its outstanding debt securities. Such repurchases, if any, will depend on prevailing market conditions, the Company's liquidity requirements, contractual and legal restrictions and other factors. Additionally, the Company plans to dispose of its remaining retained shares of Equitrans Midstream's common stock and use the proceeds to reduce the Company's debt.
Revolving Credit Facility
The Company primarily uses borrowings under its revolving credit facility to fund working capital needs, timing differences between capital expenditures and other cash uses and cash flows from operating activities, margin deposits on derivative instruments and collateral requirements on midstream services contracts. See section "Security Ratings and Financing Triggers" for further discussion of margin deposits and collateral requirements on the Company's derivative instruments and midstream services contracts. See Note 10 to the Consolidated Financial Statements for further discussion of the Company's credit facility.
Security Ratings and Financing Triggers
The table below reflects the credit ratings and rating outlooks assigned to the Company's debt instruments at February 26, 2020. The Company's credit ratings and rating outlooks are subject to revision or withdrawal at any time by the assigning rating agency, and each rating should be evaluated independent from any other rating. The Company cannot ensure that a rating will remain in effect for any given period of time or that a rating will not be lowered or withdrawn by a rating agency if, in its judgment, circumstances so warrant. See Note 4 to the Consolidated Financial Statements for further discussion of what is deemed investment grade.
Rating Service | Senior Notes | Outlook | ||
Moody's Investors Service (Moody's) | Ba1 | Negative | ||
Standard & Poor's Ratings Service (S&P) | BB+ | Negative | ||
Fitch Ratings Service (Fitch) | BB | Negative | ||
As of December 31, 2019, the Company's senior notes were rated "Baa3" by Moody's, "BBB–" by S&P and "BBB–" by Fitch, each with a "Negative" outlook. In January 2020, Moody's downgraded the Company's senior notes credit rating to "Ba1," and, in February 2020, S&P and Fitch downgraded the Company's senior notes rating to "BB+" and "BB," respectively. The Company is not aware of any current plans of Moody's, S&P or Fitch to further downgrade its rating of the Company's senior notes. Further changes in credit ratings may affect the Company's access to the capital markets, the cost of short-term debt through interest rates and fees under the Company's lines of credit, the interest rate on the Company's Term Loan Facility and Adjustable Rate Notes, the rates available on new long-term debt, the Company's pool of investors and funding sources, the borrowing costs and margin deposit requirements on the Company's derivative instruments and credit assurance requirements, including collateral, in support of the Company's midstream service contracts, joint venture arrangements or construction contracts. Margin deposits on the Company's derivative instruments are also subject to factors other than credit rating, such as natural gas prices and credit thresholds set forth in the agreements between hedging counterparties and the Company. As of February 26, 2020, the Company had sufficient unused borrowing capacity under its credit facility, net of letters of credit, to satisfy any requests for margin deposit or other collateral that its counterparties would be permitted to request of the Company pursuant to the Company's derivative instruments and midstream services contracts in the event that Moody's and S&P downgrade the Company's credit rating two categories further. As of February 26, 2020, such margin deposit or other collateral amounts could be up to approximately $1.4 billion, inclusive of assurances posted of approximately $0.6 billion in the aggregate. See Notes 4 and 10 to the Consolidated Financial Statements for further information.
The Company's debt agreements and other financial obligations contain various provisions that, if not complied with, could result in default or event of default under the Company's credit facility and Term Loan Facility, mandatory partial or full repayment of the amounts outstanding, reduced loan capacity or other similar actions. The most significant covenants and events of default under the debt agreements relate to maintenance of a debt-to-total capitalization ratio, limitations on transactions with affiliates, insolvency events, nonpayment of scheduled principal or interest payments, acceleration of other financial obligations and change
50
of control provisions. The Company's credit facility and Term Loan Facility each contain financial covenants that require the Company to have a total debt-to-total capitalization ratio no greater than 65%. The calculation of this ratio excludes the effects of accumulated other comprehensive income. As of December 31, 2019, the Company was in compliance with all debt provisions and covenants.
See Note 10 to the Consolidated Financial Statements for a discussion of the borrowings under the Company's credit facility and Term Loan Facility.
Commodity Risk Management
The substantial majority of the Company's commodity risk management program is related to hedging sales of the Company's produced natural gas. The Company's overall objective in its hedging program is to protect cash flows from undue exposure to the risk of changing commodity prices. The derivative commodity instruments currently used by the Company are primarily swap, collar and option agreements. During the third quarter of 2019, the Company terminated certain OTC hedge positions related to years 2021 and onward. The value associated with these terminated positions was rolled into new hedge positions with the same counterparties for 2020. No cash was exchanged related to these terminations or the associated execution of new hedge positions.
The following table summarizes the approximate volumes and prices of the Company's NYMEX hedge positions through 2023 as of February 25, 2020.
2020 (a) | 2021 | 2022 | 2023 | 2024 | |||||||||||||||
Swaps: | |||||||||||||||||||
Volume (MMDth) | 1,093 | 155 | 3 | 2 | 2 | ||||||||||||||
Average Price ($/Dth) | $ | 2.75 | $ | 2.43 | $ | 2.72 | $ | 2.67 | $ | 2.67 | |||||||||
Calls – Net Short: | |||||||||||||||||||
Volume (MMDth) | 392 | 209 | 157 | 77 | 15 | ||||||||||||||
Average Short Strike Price ($/Dth) | $ | 2.99 | $ | 2.82 | $ | 2.79 | $ | 2.96 | $ | 3.11 | |||||||||
Puts – Net Long: | |||||||||||||||||||
Volume (MMDth) | 154 | 157 | 135 | 69 | 15 | ||||||||||||||
Average Long Strike Price ($/Dth) | $ | 2.38 | $ | 2.38 | $ | 2.35 | $ | 2.40 | $ | 2.45 | |||||||||
Fixed Price Sales (b): | |||||||||||||||||||
Volume (MMDth) | 15 | 65 | 4 | 3 | — | ||||||||||||||
Average Price ($/Dth) | $ | 2.76 | $ | 2.50 | $ | 2.38 | $ | 2.38 | $ | — | |||||||||
(a) | Full year 2020. |
(b) | The difference between the fixed price and NYMEX price is included in average differential presented in the Company's price reconciliation in the "Average Realized Price Reconciliation." The fixed price natural gas sales agreements can be physically or financially settled. |
For 2020, 2021, 2022, 2023 and 2024, the Company has natural gas sales agreements for approximately 13 MMDth, 18 MMDth, 18 MMDth, 79 MMDth and 11 MMDth, respectively, that include average NYMEX ceiling prices of $3.68, $3.17, $3.17, $2.84 and $3.21, respectively. The Company also has derivative instruments to hedge basis. The Company may use other contractual agreements to implement its commodity hedging strategy.
See Item 7A., "Quantitative and Qualitative Disclosures About Market Risk" and Note 4 to the Consolidated Financial Statements for further discussion of the Company's hedging program.
Off-Balance Sheet Arrangements
See Note 17 to the Consolidated Financial Statements for a discussion of the Company's guarantees.
51
Schedule of Contractual Obligations
The following table presents the Company's long-term contractual obligations as of December 31, 2019.
Total | 2020 | 2021 – 2022 | 2023 – 2024 | Thereafter | |||||||||||||||
(Thousands) | |||||||||||||||||||
Purchase obligations (a) | $ | 22,598,203 | $ | 1,449,974 | $ | 3,619,488 | $ | 3,397,093 | $ | 14,131,648 | |||||||||
Long-term debt, including current portion (b) | 4,020,259 | 1,016,204 | 1,534,736 | 22,083 | 1,447,236 | ||||||||||||||
Interest payments on debt (c) | 634,504 | 135,792 | 200,795 | 125,409 | 172,508 | ||||||||||||||
Term Loan Facility borrowings (d) | 1,000,000 | — | 1,000,000 | — | — | ||||||||||||||
Credit facility borrowings (d) | 294,000 | — | 294,000 | — | — | ||||||||||||||
Operating lease obligations (e) | 62,603 | 30,488 | 17,685 | 14,402 | 28 | ||||||||||||||
Other liabilities (f) | 23,269 | 7,839 | 8,360 | 1,552 | 5,518 | ||||||||||||||
Total contractual obligations | $ | 28,632,838 | $ | 2,640,297 | $ | 6,675,064 | $ | 3,560,539 | $ | 15,756,938 | |||||||||
(a) | Purchase obligations are primarily commitments for demand charges under existing long-term contracts and binding precedent agreements with various pipelines, some of which extend up to 20 years or longer. The Company has entered into agreements to release some of its capacity. Purchase obligations also include commitments for processing capacity in order to extract heavier liquid hydrocarbons from the natural gas stream. Purchase obligations excludes the New EQM Gathering Agreement signed on February 26, 2020. |
(b) | See Note 10 to the Consolidated Financial Statements for a discussion of the Company's January 2020 senior notes issuance and February 2020 repayment of the Company's 2.50% senior notes and floating rate notes, which were both due in 2020. |
(c) | Interest payments exclude interest related to the Term Loan Facility borrowings, credit facility borrowings and the floating rate notes as their interest rates are variable. |
(d) | Term Loan Facility borrowings and credit facility borrowings were classified based on their termination dates. |
(e) | See Note 15 to the Consolidated Financial Statements for a discussion of the Company's operating lease obligations. |
(f) | Other liabilities are primarily commitments for estimated payouts for various liability stock award plans as of December 31, 2019. See "Critical Accounting Policies and Estimates" and Note 13 to the Consolidated Financial Statements for further discussion of factors that affect the ultimate amount of the payout of these obligations. |
As discussed in Note 9 to the Consolidated Financial Statements, the Company had a total reserve for unrecognized tax benefits at December 31, 2019 of $259.6 million, of which $113.7 million is offset against deferred tax assets for alternative minimum tax (AMT) and general business tax credit carryforwards and net operating losses (NOLs). The Company is currently unable to make reasonably reliable estimates of the period of cash settlement of these potential liabilities with taxing authorities; therefore, this amount has been excluded from the schedule of contractual obligations.
Commitments and Contingencies
In the ordinary course of business, various legal and regulatory claims and proceedings are pending or threatened against the Company. While the amounts claimed may be substantial, the Company is unable to predict with certainty the ultimate outcome of such claims and proceedings. The Company accrues legal and other direct costs related to loss contingencies when actually incurred. The Company has established reserves it believes to be appropriate for pending matters and, after consultation with counsel and giving appropriate consideration to available insurance, the Company believes that the ultimate outcome of any matter currently pending against the Company will not materially affect the Company's financial condition, results of operations or liquidity. See Note 16 to the Consolidated Financial Statements for a discussion of the Company's commitments and contingencies. See Item 3., "Legal Proceedings."
Recently Issued Accounting Standards
The Company's recently issued accounting standards are described in Note 1 to the Consolidated Financial Statements.
Critical Accounting Policies and Estimates
The Company's significant accounting policies are described in Note 1 to the Consolidated Financial Statements. Management's discussion and analysis of the Consolidated Financial Statements and results of operations are based on the Company's Consolidated Financial Statements, which have been prepared in accordance with GAAP. The preparation of the Consolidated Financial Statements requires management to make estimates and judgments that affect the reported amounts of assets, liabilities, revenues and expenses and the related disclosure of contingent assets and liabilities. The following critical accounting policies, which were
52
reviewed by the Audit Committee of the Company's Board of Directors (the Audit Committee), relate to the Company's more significant judgments and estimates used in the preparation of its Consolidated Financial Statements. Actual results could differ from those estimates.
Accounting for Oil and Gas Producing Activities. The Company uses the successful efforts method of accounting for its oil and gas producing activities.
The carrying values of the Company's proved oil and gas properties are reviewed for impairment when events or circumstances indicate that the remaining carrying value may not be recoverable. To determine whether impairment has occurred, the Company compares estimated expected undiscounted future cash flows from its oil and gas properties to the carrying values of those properties. The estimated future cash flows used in the recoverability test are based on proved and, if determined reasonable by management, risk-adjusted probable reserves and assumptions generally consistent with the assumptions used by the Company for internal planning and budgeting purposes, including, among other things, the intended use of the asset, anticipated production from reserves, future market prices for natural gas, NGLs and oil adjusted for basis differentials, future operating costs and inflation. Proved oil and gas properties that have carrying amounts in excess of estimated future undiscounted cash flows are written down to fair value, which is estimated by discounting the estimated future cash flows using discount rates and other assumptions that marketplace participants would use in their fair value estimates.
Capitalized costs of unproved oil and gas properties are evaluated for recoverability on a prospective basis at least annually. Indicators of potential impairment include changes due to economic factors, potential shifts in business strategy and historical experience. The likelihood of an impairment of unproved oil and gas properties increases as the expiration of a lease term approaches and drilling activity has not commenced. If the Company does not intend to drill on the property prior to expiration of the lease or does not have the intent and ability to extend, renew, trade or sell the lease prior to expiration, impairment expense is recorded.
The Company believes that the accounting estimate related to the accounting for oil and gas producing activities is a "critical accounting estimate" because the evaluations of impairment of proved properties involve significant judgment about future events, such as future sales prices of natural gas and NGLs, future production costs, estimates of the amount of natural gas and NGLs recorded and the timing of recoveries. See "Impairment of Oil and Gas Properties" and Note 1 to the Consolidated Financial Statements for additional information on the Company's impairments of proved and unproved oil and gas properties.
Oil and Gas Reserves. Proved oil and gas reserves, as defined by SEC Regulation S-X Rule 4-10, are those quantities of oil and gas that, by analysis of geoscience and engineering data, can be estimated with reasonable certainty to be economically producible from a given date forward, from known reservoirs and under existing economic conditions, operating methods and government regulations, prior to the time at which contracts providing the right to operate expire, unless evidence indicates that renewal is reasonably certain, regardless of whether deterministic or probabilistic methods are used for the estimation.
The Company's estimates of proved reserves are reassessed annually using geological, reservoir and production performance data. Reserve estimates are prepared by the Company's engineers and audited by the Company's independent engineers. Revisions may result from changes in, among other things, reservoir performance, development plans, prices, operating costs, economic conditions and governmental restrictions. Decreases in prices, for example, may cause a reduction in some proved reserves due to reaching economic limits sooner. A material change in the estimated volumes of reserves could have an impact on the depletion rate calculation and the Company's Consolidated Financial Statements.
The Company estimates future net cash flows from natural gas, NGLs and crude oil reserves based on selling prices and costs using a twelve-month average price, which is calculated as the unweighted arithmetic average of the first-day-of-the-month price for each month within the twelve-month period and, as such, is subject to change in subsequent periods. Operating costs, production and ad valorem taxes and future development costs are based on current costs with no escalation. Income tax expense is computed using future statutory tax rates and giving effect to tax deductions and credits available under current laws related to oil and gas producing activities.
The Company believes that the accounting estimate related to oil and gas reserves is a "critical accounting estimate" because the Company must periodically reevaluate proved reserves along with estimates of future production rates, production costs and the timing of development expenditures. Future results of operations and the strength of the Company's Consolidated Balance Sheet for any quarterly or annual period could be materially affected by changes in the Company's assumptions. See "Impairment of Oil and Gas Properties" for additional information on the Company's oil and gas reserves.
Income Taxes. The Company recognizes deferred tax assets and liabilities for the expected future tax consequences of events that have been included in the Company's Consolidated Financial Statements or tax returns.
53
The Company has recorded deferred tax assets principally resulting from federal and state NOL carryforwards, an AMT credit carryforward, other federal tax credit carryforwards, unrealized capacity contract losses, incentive compensation and investments in securities. The Company has established a valuation allowance against a portion of its deferred tax assets related to the federal and state NOL carryforwards, the separate company state impact of the interest expense limitation imposed with the Tax Cuts and Jobs Act of 2017 (the Tax Cuts and Jobs Act) and the Company's investment in Equitrans Midstream because the Company believes it is more likely than not that those deferred tax assets will not be completely realized. The valuation allowance on the Equitrans Midstream investment relates to the state and part of the federal deferred tax asset as the fair value loss is not expected to be fully realized for tax purposes due to capital loss limitations. In January 2019, the IRS announced that it would no longer subject AMT refunds to sequestration; as such, the Company reversed the related previously recorded valuation allowance in the first quarter of 2019. No other significant valuation allowances have been established as the Company believes that future sources of taxable income, reversing temporary differences and other tax planning strategies will be sufficient to realize these deferred tax assets. Any determination to change the valuation allowance would impact the Company's income tax expense and net income in the period in which such a determination is made.
The Company also estimates the amount of financial statement benefit to record for uncertain tax positions as described in Note 9 to the Company's Consolidated Financial Statements.
The Company believes that accounting estimates related to income taxes are "critical accounting estimates" because the Company must assess the likelihood that deferred tax assets will be recovered from future taxable income and exercise judgment regarding the amount of financial statement benefit to record for uncertain tax positions. When evaluating whether or not a valuation allowance must be established on deferred tax assets, the Company exercises judgment in determining whether it is more likely than not (a likelihood of more than 50%) that some portion or all of the deferred tax assets will not be realized. The Company considers all available evidence, both positive and negative, to determine whether, based on the weight of the evidence, a valuation allowance is needed, including carrybacks, tax planning strategies, reversal of deferred tax assets and liabilities and forecasted future taxable income. In making the determination related to uncertain tax positions, the Company considers the amounts and probabilities of the outcomes that could be realized upon ultimate settlement of an uncertain tax position using the facts, circumstances and information available at the reporting date to establish the appropriate amount of financial statement benefit. To the extent that an uncertain tax position or valuation allowance is established or increased or decreased during a period, the Company must include an expense or benefit within tax expense in the income statement. Future results of operations for any quarterly or annual period could be materially affected by changes in the Company's assumptions.
Derivative Instruments. The Company enters into derivative commodity instrument contracts primarily to reduce exposure to commodity price risk associated with future sales of natural gas production.
The Company estimates the fair value of its financial instruments using quoted market prices, where available. If quoted market prices are not available, fair value is based on models that use market-based parameters as inputs, including forward curves, discount rates, volatilities and nonperformance risk. Nonperformance risk considers the effect of the Company's credit standing on the fair value of liabilities and the effect of the counterparty's credit standing on the fair value of assets. The Company estimates nonperformance risk by analyzing publicly available market information, including a comparison of the yield on debt instruments with credit ratings similar to the Company's or counterparty's credit rating and the yield on a risk-free instrument. The values reported in the Consolidated Financial Statements change as these estimates are revised to reflect actual results or as market conditions or other factors, many of which are beyond the Company's control, change.
The Company believes that the accounting estimates related to derivative instruments are "critical accounting estimates" because the Company's financial condition and results of operations can be significantly impacted by changes in the market value of the Company's derivative instruments due to the volatility of both NYMEX natural gas prices and basis. Future results of operations for any quarterly or annual period could be materially affected by changes in the Company's assumptions.
Contingencies and Asset Retirement Obligations. The Company is involved in various legal and regulatory proceedings that arise in the ordinary course of business. The Company records a liability for contingencies based on its assessment that a loss is probable and the amount of the loss can be reasonably estimated. The Company considers many factors in making these assessments, including historical experience and matter specifics. Estimates are developed in consultation with legal counsel and are based on an analysis of potential results.
The Company accrues a liability for asset retirement obligations based on an estimate of the timing and amount of settlement. For oil and gas wells, the fair value of the Company's plugging and abandonment obligations is recorded at the time the obligations are incurred, which is typically at the time the wells are spud.
54
The Company believes that the accounting estimates related to contingencies and asset retirement obligations are "critical accounting estimates" because the Company must assess the probability of loss related to contingencies and the expected amount and timing of asset retirement obligations. In addition, the Company must determine the estimated present value of future liabilities. Future results of operations for any quarterly or annual period could be materially affected by changes in the Company's assumptions.
Share-Based Compensation. The Company awards share-based compensation in connection with specific programs established under the 2009, 2014 and 2019 Long-Term Incentive Plans. Awards to employees are typically made in the form of performance-based awards, time-based restricted stock, time-based restricted units and stock options. Beginning in January 2020, awards to directors are typically made in the form of restricted stock units that vest on the date of the Company's annual meeting of shareholders following the date of grant.
Restricted units and performance-based awards that are expected to be satisfied in cash are treated as liability awards. For liability awards, the Company estimates, on the grant date and on each reporting date thereafter until vesting and payment, the fair value of the ultimate payout based on the expected performance through, and value of the Company's common stock on, the vesting date. The Company then recognizes a proportionate amount of the expense for each period in the Company's Consolidated Financial Statements over the vesting period of the award. The Company reviews assumptions regarding performance and common stock value on a quarterly basis and adjusts its accrual when changes to these assumptions result in a material change in the fair value of the ultimate payouts.
Performance-based awards that are expected to be satisfied in Company common stock are treated as equity awards. For equity awards, the Company determines the grant date fair value of the awards, which is then recognized as expense in the Company's Consolidated Financial Statements over the vesting period of the award. Determination of the grant date fair value of the awards requires judgments and estimates regarding, among other things, the appropriate methodologies to follow in valuing the awards and the related inputs required by those valuation methodologies. Most often, the Company is required to obtain a valuation based on assumptions regarding risk-free rates of return, dividend yields, expected volatilities and the expected term of the award. The risk-free rate is based on the U.S. Treasury yield curve in effect at the time of grant. The dividend yield is based on the historical dividend yield of the Company's common stock adjusted for any expected changes and, where applicable, the common stock of the peer group members at the time of grant. Expected volatilities are based on historical volatility of the Company's common stock and, where applicable, the common stock of the peer group members at the time of grant. The expected term represents the period of time elapsing during the applicable performance period.
For time-based restricted stock awards, the grant date fair value of the awards is recognized as expense in the Company's Consolidated Financial Statements over the vesting period, which, historically, has been three years. For director restricted stock units expected to be satisfied in equity, the grant date fair value of the awards is recognized as an expense in the Company's Consolidated Financial Statements in the year of grant. The grant date fair value, in both cases, is determined based on the closing price of the Company's common stock on the date of the grant.
For non-qualified stock options, the grant date fair value is recognized as expense in the Company's Consolidated Financial Statements over the vesting period, which, historically, has been three years. The Company uses the Black-Scholes option pricing model to measure the fair value of stock options, which includes assumptions for a risk-free interest rate, dividend yield, volatility factor and expected term. The risk-free rate for periods within the contractual life of the option is based on the U.S. Treasury yield curve in effect at the time of grant. The dividend yield is based on the dividend yield of the Company's common stock at the time of grant. The expected volatility is based on historical volatility of the Company's common stock at the time of grant. The expected term represents the period of time that options granted are expected to be outstanding based on historical option exercise experience at the time of grant.
The Company believes that the accounting estimates related to share-based compensation are "critical accounting estimates" because they may change from period-to-period based on changes in assumptions about factors affecting the ultimate payout of awards, including the number of awards to ultimately vest and the market price and volatility of the Company's common stock. Future results of operations for any quarterly or annual period could be materially affected by changes in the Company's assumptions. See Note 13 to the Consolidated Financial Statements for additional information on the Company's share-based compensation plans.
55
Item 7A. Quantitative and Qualitative Disclosures About Market Risk
Commodity Price Risk and Derivative Instruments
The Company's primary market risk exposure is the volatility of future prices for natural gas and NGLs. Due to the volatility of commodity prices, the Company is unable to predict future potential movements in the market prices for natural gas and NGLs at the Company's ultimate sales points and, thus, cannot predict the ultimate impact of prices on its operations. Prolonged low, or significant, extended declines in, natural gas and NGLs prices could adversely affect, among other things, the Company's development plans, which would decrease the pace of development and the level of the Company's proved reserves.
The Company's overall objective in its hedging program is to protect cash flows from undue exposure to the risk of changing commodity prices. The Company's use of derivatives is further described in Note 4 to the Consolidated Financial Statements and "Commodity Risk Management" of "Capital Resources and Liquidity" in Item 7., "Management's Discussion and Analysis of Financial Condition and Results of Operations." The Company's OTC derivative commodity instruments are placed primarily with financial institutions and the creditworthiness of those institutions is regularly monitored. The Company primarily enters into derivative instruments to hedge forecasted sales of production. The Company also enters into derivative instruments to hedge basis and exposure to fluctuations in interest rates. The Company's use of derivative instruments is implemented under a set of policies approved by the Company's Hedge and Financial Risk Committee and reviewed by the Company's Board of Directors.
For derivative commodity instruments used to hedge the Company's forecasted sales of production, which are at, for the most part, NYMEX natural gas prices, the Company sets policy limits relative to the expected production and sales levels that are exposed to price risk. The Company has an insignificant amount of financial natural gas derivative commodity instruments for trading purposes.
Derivative commodity instruments used by the Company are primarily swap, collar and option agreements. These agreements may require payments to, or receipt of payments from, counterparties based on the differential between two prices for the commodity. The Company uses these agreements to hedge its NYMEX and basis exposure. The Company may also use other contractual agreements when implementing its commodity hedging strategy. The Company monitors price and production levels on a continuous basis and makes adjustments to quantities hedged as warranted.
A hypothetical decrease of 10% in the market price of natural gas from December 31, 2019 and 2018 would increase the fair value of these natural gas derivative instruments by approximately $389.4 million and $432.5 million, respectively. A hypothetical increase of 10% in the market price of natural gas from December 31, 2019 and 2018 would decrease the fair value of these natural gas derivative instruments by approximately $394.5 million and $443.4 million, respectively. For purposes of this analysis, the Company applied the 10% change in the market price of natural gas from December 31, 2019 and 2018 to the Company's natural gas derivative commodity instruments to calculate the hypothetical change in fair value. The change in fair value was determined using a method similar to the Company's normal process for determining derivative commodity instrument fair value described in Note 5 to the Consolidated Financial Statements.
The above analysis of the Company's derivative commodity instruments does not include the offsetting impact that the same hypothetical price movement may have on the Company's physical sales of natural gas. The portfolio of derivative commodity instruments held to hedge the Company's forecasted produced gas approximates a portion of the Company's expected physical sales of natural gas; therefore, an adverse impact to the fair value of the portfolio of derivative commodity instruments held to hedge the Company's forecasted production associated with the hypothetical changes in commodity prices referenced above should be offset by a favorable impact on the Company's physical sales of natural gas, assuming that the derivative commodity instruments are not closed out in advance of their expected term and the derivative commodity instruments continue to function effectively as hedges of the underlying risk.
If the underlying physical transactions or positions are liquidated prior to the maturity of the derivative commodity instruments, a loss on the financial instruments may occur or the derivative commodity instruments might be worthless as determined by the prevailing market value on their termination or maturity date, whichever comes first.
Interest Rate Risk
Changes in interest rates affect the amount of interest the Company earns on cash, cash equivalents and short-term investments and the interest rates the Company pays on borrowings under its credit facility, Term Loan Facility and floating rate notes (which notes were fully redeemed on February 3, 2020). All of the Company's senior notes, other than the floating rate notes, have a fixed rate and, thus, do not expose the Company to fluctuations in market interest rates. A 1% increase in interest rates on the Company's
56
borrowings under its credit facility, Term Loan Facility and floating rate notes during the year ended December 31, 2019 would have increased 2019 annual interest expense by approximately $14 million.
Interest rates on the Adjustable Rate Notes fluctuate based on changes to the credit ratings assigned to the Company's senior notes by Moody's, S&P and Fitch. For a discussion of credit rating downgrade risk, see Item 1A., "Risk Factors – Our exploration and production operations have substantial capital requirements, and we may not be able to obtain needed capital or financing on satisfactory terms." Changes in interest rates affect the fair value of the Company's fixed rate debt. See Note 10 to the Consolidated Financial Statements for further discussion of the Company's long-term debt and Note 5 to the Consolidated Financial Statements for a discussion of fair value measurements, including the fair value of the Company's long-term debt.
Other Market Risks
The Company is exposed to credit loss in the event of nonperformance by counterparties to its derivative contracts. This credit exposure is limited to derivative contracts with a positive fair value, which may change as market prices change. The Company's OTC derivative instruments are primarily with financial institutions and, thus, are subject to events that would impact those companies individually as well as the financial industry as a whole. The Company uses various processes and analyses to monitor and evaluate its credit risk exposures, including monitoring current market conditions and counterparty credit fundamentals. Credit exposure is controlled through credit approvals and limits based on counterparty credit fundamentals. To manage the level of credit risk, the Company enters into transactions primarily with financial counterparties that are of investment grade, enters into netting agreements whenever possible and may obtain collateral or other security.
Approximately 75%, or $718.0 million, of the Company's OTC derivative contracts outstanding at December 31, 2019 had a positive fair value. Approximately 64%, or $369.5 million, of the Company's OTC derivative contracts outstanding at December 31, 2018 had a positive fair value.
As of December 31, 2019, the Company was not in default under any derivative contracts and had no knowledge of default by any counterparty to its derivative contracts. During the year ended December 31, 2019, the Company made no adjustments to the fair value of its derivative contracts due to credit-related concerns outside of the normal non-performance risk adjustment included in the Company's established fair value procedure. The Company monitors market conditions that may impact the fair value of its derivative contracts.
The Company is exposed to the risk of nonperformance by credit customers on physical sales of natural gas, NGLs and oil. Revenues and related accounts receivable from the Company's operations are generated primarily from the sale of produced natural gas, NGLs and oil to marketers, utilities and industrial customers located in the Appalachian Basin and in markets that are accessible through the Company's transportation portfolio, which includes markets in the Gulf Coast, Midwest and Northeast United States and Canada. The Company also contracts with certain processors to market a portion of NGLs on behalf of the Company.
No one lender of the large group of financial institutions in the syndicate for the Company's credit facility and the Term Loan Facility holds more than 10% and 15%, respectively, of the financial commitments under such facilities. The large syndicate group and relatively low percentage of participation by each lender are expected to limit the Company's exposure to disruption or consolidation in the banking industry.
57
Item 8. Financial Statements and Supplementary Data
Page Reference | ||
58
Report of Independent Registered Public Accounting Firm
To the Shareholders and the Board of Directors of EQT Corporation
Opinion on the Financial Statements
We have audited the accompanying consolidated balance sheets of EQT Corporation and subsidiaries (the Company) as of December 31, 2019 and 2018, the related statements of consolidated operations, comprehensive income, cash flows and equity for each of the three years in the period ended December 31, 2019, and the related notes and the financial statement schedule listed in the Index at Item 15 (a) (collectively referred to as the "consolidated financial statements"). In our opinion, the consolidated financial statements present fairly, in all material respects, the consolidated financial position of the Company at December 31, 2019 and 2018, and the consolidated results of its operations and its cash flows for each of the three years in the period ended December 31, 2019, in conformity with U.S. generally accepted accounting principles.
We also have audited, in accordance with the standards of the Public Company Accounting Oversight Board (United States) (PCAOB), the Company's internal control over financial reporting as of December 31, 2019, based on criteria established in Internal Control-Integrated Framework issued by the Committee of Sponsoring Organizations of the Treadway Commission (2013 framework) and our report dated February 27, 2020 expressed an unqualified opinion thereon.
Basis for Opinion
These financial statements are the responsibility of the Company's management. Our responsibility is to express an opinion on the Company's financial statements based on our audits. We are a public accounting firm registered with the PCAOB and are required to be independent with respect to the Company in accordance with the U.S. federal securities laws and the applicable rules and regulations of the Securities and Exchange Commission and the PCAOB.
We conducted our audits in accordance with the standards of the PCAOB. Those standards require that we plan and perform the audit to obtain reasonable assurance about whether the financial statements are free of material misstatement, whether due to error or fraud. Our audits included performing procedures to assess the risks of material misstatement of the financial statements, whether due to error or fraud, and performing procedures that respond to those risks. Such procedures included examining, on a test basis, evidence regarding the amounts and disclosures in the financial statements. Our audits also included evaluating the accounting principles used and significant estimates made by management, as well as evaluating the overall presentation of the financial statements. We believe that our audits provide a reasonable basis for our opinion.
Critical Audit Matters
The critical audit matters communicated below are matters arising from the current period audit of the financial statements that were communicated or required to be communicated to the audit committee and that: (1) relate to accounts or disclosures that are material to the financial statements and (2) involved our especially challenging, subjective or complex judgments. The communication of critical audit matters does not alter in any way our opinion on the consolidated financial statements, taken as a whole, and we are not, by communicating the critical audit matters below, providing separate opinions on the critical audit matters or on the accounts or disclosures to which they relate.
59
Depreciation, depletion and amortization ('DD&A') of proved oil and natural gas properties
Description of the Matter | At December 31, 2019, the net book value of the Company's proved oil and natural gas properties was $12,592 million, and depreciation, depletion and amortization (DD&A) expense was $1,539 million for the year then ended. As described in Note 1, under the successful efforts method of accounting, DD&A is recorded on a cost center basis using the units-of-production method. Proved developed reserves, as estimated by the Company's internal engineers, are used to calculate depreciation of wells and related equipment and facilities and amortization of intangible drilling costs. Total proved reserves, also estimated by the Company's engineers, are used to calculate depletion on property acquisitions. Proved natural gas, natural gas liquids (NGLs) and oil reserve estimates are based on geological and engineering evaluations of in-place hydrocarbon volumes. Significant judgment is required by the Company's engineers in evaluating geological and engineering data when estimating proved natural gas, NGLs and oil reserves. Estimating reserves also requires the selection of inputs, including natural gas, NGLs and oil price assumptions, future operating and capital costs assumptions and tax rates by jurisdiction, among others. Because of the complexity involved in estimating natural gas, NGLs and oil reserves, management used independent engineers to audit the estimates prepared by the Company's internal engineers as of December 31, 2019. Auditing the Company's DD&A calculation is especially complex because of the use of the work of the internal engineers and the independent engineers and the evaluation of management's determination of the inputs described above used by the specialists in estimating proved natural gas, NGLs and oil reserves. |
How We Addressed the Matter in Our Audit | We obtained an understanding, evaluated the design and tested the operating effectiveness of the Company's controls over its process to calculate DD&A, including management's controls over the completeness and accuracy of the financial data provided to the specialists for use in estimating the proved natural gas, NGLs and oil reserves. Our audit procedures included, among others, evaluating the professional qualifications and objectivity of the Company engineer primarily responsible for overseeing the preparation of the reserve estimates by the internal engineering staff and the independent engineers used to audit the estimates. In addition, in assessing whether we can use the work of the specialists we evaluated the completeness and accuracy of the financial data and inputs described above used by the specialists in estimating proved natural gas, NGLs and oil reserves by agreeing them to source documentation and we identified and evaluated corroborative and contrary evidence. For proved undeveloped reserves, we evaluated management's development plan for compliance with the SEC rule that undrilled locations are scheduled to be drilled within five years, unless specific circumstances justify a longer time, by assessing consistency of the development projections with the Company's drill plan and the availability of capital relative to the drill plan. We also tested the mathematical accuracy of the DD&A calculations, including comparing the proved natural gas, NGLs and oil reserves amounts used to the Company's reserve report. |
60
Ohio Utica Long-Lived Assets Impairment
Description of the Matter | As more fully described in Note 1 to the consolidated financial statements, the Company recorded an impairment charge of $1,036 million associated with its Ohio Utica long-lived asset grouping for the year ended December 31, 2019. The write-down to fair value was estimated based on the discounted future expected cash flows related to these assets and estimated proceeds from potentially selling the assets to a third-party. The determination of fair value included significant judgment and assumptions by management, including risk adjustments for probable reserves, future commodity prices, anticipated production volumes, future operating and development costs, inflation, a weighted average cost of capital (WACC) and estimated proceeds that could be realized upon a potential disposition. Auditing the Company's impairment calculation involved a high degree of subjectivity as the determination of fair value was based on assumptions as described above about future market and economic conditions. In addition, the identification of proved properties and anticipated production volumes developed by the Company's engineering staff in conjunction with the reserve estimates described in the preceding critical audit matter, are used as inputs in the cash flow model. |
How We Addressed the Matter in Our Audit | We obtained an understanding, evaluated the design, and tested the operating effectiveness of controls over the Company's process to estimate fair value for calculating the impairment charge. For example, we tested controls over management's assessment of the appropriateness of the significant assumptions outlined above that are inputs to the fair value calculation. Our testing of the Company's estimate of fair value of its Ohio Utica long-lived assets included, among other procedures, evaluating the significant assumptions used and testing the completeness and accuracy of the underlying data. The audit effort involved the use of our valuation specialists to assist in evaluating the appropriateness of the methodology used in the cash flow model, as well as testing the significant market-related assumptions described above used to develop the fair value estimate. We evaluated the reasonableness of management's assumptions by comparing the key market-related assumptions (including future natural gas prices and WACC rates) used in the cash flow model to external market and third-party data and proved locations and anticipated production volumes to the reserve estimates audited by the independent engineers in conjunction with the reserves estimation process. We also performed sensitivity analyses and a retrospective comparison of forecasted cash flows to actual historical data. Additionally, we assessed the likelihood of a potential market transaction and if such a transaction were to occur the estimated potential proceeds from such a transaction. |
/s/ Ernst & Young LLP
We have served as the Company's auditor since 1950.
Pittsburgh, Pennsylvania
February 27, 2020
61
Report of Independent Registered Public Accounting Firm
To the Shareholders and the Board of Directors of EQT Corporation
Opinion on Internal Control over Financial Reporting
We have audited EQT Corporation and subsidiaries' internal control over financial reporting as of December 31, 2019, based on criteria established in Internal Control-Integrated Framework issued by the Committee of Sponsoring Organizations of the Treadway Commission (2013 framework) (the COSO criteria). In our opinion, EQT Corporation and subsidiaries (the Company) maintained, in all material respects, effective internal control over financial reporting as of December 31, 2019, based on the COSO criteria.
We also have audited, in accordance with the standards of the Public Company Accounting Oversight Board (United States) (PCAOB), the consolidated balance sheets of the Company as of December 31, 2019 and 2018, and the related statements of consolidated operations, comprehensive income, cash flows and equity for each of the three years in the period ended December 31, 2018 and the related notes and the financial statement schedule listed in the Index at Item 15 (a) of the Company and our report dated February 27, 2020 expressed an unqualified opinion thereon.
Basis for Opinion
The Company's management is responsible for maintaining effective internal control over financial reporting and for its assessment of the effectiveness of internal control over financial reporting included in the accompanying Management's Report on Internal Control over Financial Reporting. Our responsibility is to express an opinion on the Company's internal control over financial reporting based on our audit. We are a public accounting firm registered with the PCAOB and are required to be independent with respect to the Company in accordance with the U.S. federal securities laws and the applicable rules and regulations of the Securities and Exchange Commission and the PCAOB.
We conducted our audit in accordance with the standards of the PCAOB. Those standards require that we plan and perform the audit to obtain reasonable assurance about whether effective internal control over financial reporting was maintained in all material respects.
Our audit included obtaining an understanding of internal control over financial reporting, assessing the risk that a material weakness exists, testing and evaluating the design and operating effectiveness of internal control based on the assessed risk, and performing such other procedures as we considered necessary in the circumstances. We believe that our audit provides a reasonable basis for our opinion.
Definition and Limitations of Internal Control Over Financial Reporting
A company's internal control over financial reporting is a process designed to provide reasonable assurance regarding the reliability of financial reporting and the preparation of financial statements for external purposes in accordance with generally accepted accounting principles. A company's internal control over financial reporting includes those policies and procedures that (1) pertain to the maintenance of records that, in reasonable detail, accurately and fairly reflect the transactions and dispositions of the assets of the company; (2) provide reasonable assurance that transactions are recorded as necessary to permit preparation of financial statements in accordance with generally accepted accounting principles, and that receipts and expenditures of the company are being made only in accordance with authorizations of management and directors of the company; and (3) provide reasonable assurance regarding prevention or timely detection of unauthorized acquisition, use, or disposition of the company's assets that could have a material effect on the financial statements.
Because of its inherent limitations, internal control over financial reporting may not prevent or detect misstatements. Also, projections of any evaluation of effectiveness to future periods are subject to the risk that controls may become inadequate because of changes in conditions, or that the degree of compliance with the policies or procedures may deteriorate.
/s/ Ernst & Young LLP
Pittsburgh, Pennsylvania
February 27, 2020
62
EQT CORPORATION AND SUBSIDIARIES
STATEMENTS OF CONSOLIDATED OPERATIONS
YEARS ENDED DECEMBER 31,
2019 | 2018 | 2017 | |||||||||
(Thousands, except per share amounts) | |||||||||||
Operating revenues: | |||||||||||
Sales of natural gas, natural gas liquids and oil | $ | $ | $ | ||||||||
Gain (loss) on derivatives not designated as hedges | ( | ) | |||||||||
Net marketing services and other | |||||||||||
Total operating revenues | |||||||||||
Operating expenses: | |||||||||||
Transportation and processing | |||||||||||
Production | |||||||||||
Exploration | |||||||||||
Selling, general and administrative | |||||||||||
Depreciation and depletion | |||||||||||
Amortization of intangible assets | |||||||||||
Impairment/loss on sale/exchange of long-lived assets | |||||||||||
Impairment of intangible assets | |||||||||||
Impairment of goodwill | |||||||||||
Impairment and expiration of leases | |||||||||||
Proxy, transaction and reorganization | |||||||||||
Total operating expenses | |||||||||||
Operating (loss) income | ( | ) | ( | ) | |||||||
Unrealized loss on investment in Equitrans Midstream Corporation | |||||||||||
Dividend and other (income) expense | ( | ) | ( | ) | |||||||
Loss on debt extinguishment | |||||||||||
Interest expense | |||||||||||
(Loss) income from continuing operations before income taxes | ( | ) | ( | ) | |||||||
Income tax benefit | ( | ) | ( | ) | ( | ) | |||||
(Loss) income from continuing operations | ( | ) | ( | ) | |||||||
Income from discontinued operations, net of tax | |||||||||||
Net (loss) income | ( | ) | ( | ) | |||||||
Less: Net income from discontinued operations attributable to noncontrolling interests | |||||||||||
Net (loss) income attributable to EQT Corporation | $ | ( | ) | $ | ( | ) | $ | ||||
Amounts attributable to EQT Corporation: | |||||||||||
(Loss) income from continuing operations | $ | ( | ) | $ | ( | ) | $ | ||||
Income from discontinued operations, net of tax | |||||||||||
Net (loss) income | $ | ( | ) | $ | ( | ) | $ | ||||
Earnings per share of common stock attributable to EQT Corporation: | |||||||||||
Basic: | |||||||||||
Weighted average common stock outstanding | |||||||||||
(Loss) income from continuing operations | $ | ( | ) | $ | ( | ) | $ | ||||
Income from discontinued operations | |||||||||||
Net (loss) income | $ | ( | ) | $ | ( | ) | $ | ||||
Diluted: | |||||||||||
Weighted average common stock outstanding | |||||||||||
(Loss) income from continuing operations | $ | ( | ) | $ | ( | ) | $ | ||||
Income from discontinued operations | |||||||||||
Net (loss) income | $ | ( | ) | $ | ( | ) | $ | ||||
The accompanying notes are an integral part of these Consolidated Financial Statements.
63
EQT CORPORATION AND SUBSIDIARIES
STATEMENTS OF CONSOLIDATED COMPREHENSIVE INCOME
YEARS ENDED DECEMBER 31,
2019 | 2018 | 2017 | |||||||||
(Thousands) | |||||||||||
Net (loss) income | $ | ( | ) | $ | ( | ) | $ | ||||
Other comprehensive income (loss), net of tax: | |||||||||||
Net change in cash flow hedges: | |||||||||||
Natural gas, net of tax expense (benefit): $2,584 in 2018 and ($3,191) in 2017 | ( | ) | ( | ) | |||||||
Interest rate, net of tax expense: $210, $80 and $105 | |||||||||||
Other postretirement benefits liability adjustment, net of tax expense: $150, $510 and $193 | |||||||||||
Change in accounting principle (a) | ( | ) | |||||||||
Other comprehensive income (loss) | ( | ) | ( | ) | |||||||
Comprehensive (loss) income | ( | ) | ( | ) | |||||||
Less: Comprehensive income from discontinued operations attributable to noncontrolling interests | |||||||||||
Comprehensive (loss) income attributable to EQT Corporation | $ | ( | ) | $ | ( | ) | $ | ||||
(a) | Related to adoption of Accounting Standards Update (ASU) 2018-02. See Note 1. |
The accompanying notes are an integral part of these Consolidated Financial Statements.
64
EQT CORPORATION AND SUBSIDIARIES
STATEMENTS OF CONSOLIDATED CASH FLOWS
YEARS ENDED DECEMBER 31,
2019 | 2018 | 2017 | |||||||||
(Thousands) | |||||||||||
Cash flows from operating activities: | |||||||||||
Net (loss) income | $ | ( | ) | $ | ( | ) | $ | ||||
Adjustments to reconcile net (loss) income to net cash provided by operating activities: | |||||||||||
Deferred income tax benefit | ( | ) | ( | ) | ( | ) | |||||
Depreciation and depletion | |||||||||||
Amortization of intangible assets | |||||||||||
Impairment of long-lived assets and leases and exploratory well costs | |||||||||||
Impairment of goodwill | |||||||||||
Unrealized loss on investment in Equitrans Midstream Corporation | |||||||||||
Loss on debt extinguishment | |||||||||||
Amortization, accretion and other | ( | ) | ( | ) | |||||||
Share-based compensation expense | |||||||||||
(Gain) loss on derivatives not designated as hedges | ( | ) | ( | ) | |||||||
Cash settlements received (paid) on derivatives not designated as hedges | ( | ) | |||||||||
Net premiums received on derivative instruments | |||||||||||
Changes in other assets and liabilities: | |||||||||||
Accounts receivable | ( | ) | ( | ) | |||||||
Accounts payable | ( | ) | ( | ) | |||||||
Tax receivable | ( | ) | ( | ) | ( | ) | |||||
Other items, net | ( | ) | ( | ) | |||||||
Net cash provided by operating activities | |||||||||||
Cash flows from investing activities: | |||||||||||
Capital expenditures | ( | ) | ( | ) | ( | ) | |||||
Cash paid for Rice Merger and other acquisitions (see Note 8), net of cash acquired | ( | ) | |||||||||
Capital expenditures for discontinued operations | ( | ) | ( | ) | |||||||
Net sales of trading securities | |||||||||||
Exploratory dry hole costs | ( | ) | |||||||||
Capital contributions to Mountain Valley Pipeline, LLC | ( | ) | ( | ) | |||||||
Proceeds from sale of assets | |||||||||||
Other investing activities | ( | ) | |||||||||
Net cash used in investing activities | ( | ) | ( | ) | ( | ) | |||||
Cash flows from financing activities: | |||||||||||
Proceeds from borrowings on credit facility | |||||||||||
Repayment of borrowings on credit facility | ( | ) | ( | ) | ( | ) | |||||
Proceeds from borrowings on term loan facility | |||||||||||
Debt issuance costs and credit facility origination fees | ( | ) | ( | ) | ( | ) | |||||
Proceeds from issuance of debt | |||||||||||
Repayments and retirements of debt | ( | ) | ( | ) | ( | ) | |||||
Premiums paid on debt extinguishment | ( | ) | |||||||||
Dividends paid | ( | ) | ( | ) | ( | ) | |||||
Proceeds and excess tax benefits from awards under employee compensation plans | |||||||||||
Cash paid for taxes related to net settlement of share-based incentive awards | ( | ) | ( | ) | ( | ) | |||||
Repurchase and retirement of common stock | ( | ) | |||||||||
Repurchase of common stock | ( | ) | ( | ) | |||||||
Distributions to noncontrolling interests | ( | ) | ( | ) | |||||||
Contribution to Strike Force Midstream LLC by minority owner, net of distribution | |||||||||||
Acquisition of 25% of Strike Force Midstream LLC | ( | ) | |||||||||
Net cash transferred at Separation and Distribution | ( | ) | |||||||||
Net cash (used in) provided by financing activities | ( | ) | |||||||||
Net change in cash and cash equivalents | ( | ) | ( | ) | |||||||
Cash and cash equivalents at beginning of year | |||||||||||
Cash and cash equivalents at end of year | $ | $ | $ | ||||||||
The accompanying notes are an integral part of these Consolidated Financial Statements. See Note 1 for supplemental cash flow information. See Note 2 for discontinued operations cash flow information.
65
EQT CORPORATION AND SUBSIDIARIES
CONSOLIDATED BALANCE SHEETS
DECEMBER 31,
2019 | 2018 | ||||||
(Thousands) | |||||||
ASSETS | |||||||
Current assets: | |||||||
Cash and cash equivalents | $ | $ | |||||
Accounts receivable (less provision for doubtful accounts: $6,861 and $8,648) | |||||||
Derivative instruments, at fair value | |||||||
Tax receivable | |||||||
Prepaid expenses and other | |||||||
Total current assets | |||||||
Property, plant and equipment | |||||||
Less: Accumulated depreciation and depletion | |||||||
Net property, plant and equipment | |||||||
Intangible assets, net | |||||||
Investment in Equitrans Midstream Corporation | |||||||
Other assets | |||||||
Total assets | $ | $ | |||||
LIABILITIES AND SHAREHOLDERS' EQUITY | |||||||
Current liabilities: | |||||||
Current portion of debt | $ | $ | |||||
Accounts payable | |||||||
Derivative instruments, at fair value | |||||||
Other current liabilities | |||||||
Total current liabilities | |||||||
Credit facility borrowings | |||||||
Term loan facility borrowings | |||||||
Senior notes | |||||||
Note payable to EQM Midstream Partners, LP | |||||||
Deferred income taxes | |||||||
Other liabilities and credits | |||||||
Total liabilities | |||||||
Shareholders' Equity: | |||||||
Common stock, no par value, shares authorized: 320,000, shares issued: 257,003 and 257,225 | |||||||
Treasury stock, shares at cost: 1,832 and 2,753 | ( | ) | ( | ) | |||
Retained earnings | |||||||
Accumulated other comprehensive loss | ( | ) | ( | ) | |||
Total shareholders' equity | |||||||
Total liabilities and shareholders' equity | $ | $ | |||||
The accompanying notes are an integral part of these Consolidated Financial Statements.
66
EQT CORPORATION AND SUBSIDIARIES
STATEMENTS OF CONSOLIDATED EQUITY
YEARS ENDED DECEMBER 31, 2019, 2018 and 2017
Common Stock | Accumulated Other Comprehensive (Loss) Income | Noncontrolling Interests in Discontinued Operations | ||||||||||||||||||||||||
Shares | No Par Value | Treasury Stock | Retained Earnings | Total Equity | ||||||||||||||||||||||
(Thousands, except per share or unit amounts) | ||||||||||||||||||||||||||
Balance at December 31, 2016 | $ | $ | ( | ) | $ | $ | $ | $ | ||||||||||||||||||
Comprehensive income, net of tax: | ||||||||||||||||||||||||||
Net income | ||||||||||||||||||||||||||
Net change in cash flow hedges: | ||||||||||||||||||||||||||
Natural gas, net of tax: ($3,191) | ( | ) | ( | ) | ||||||||||||||||||||||
Interest rate, net of tax: $105 | ||||||||||||||||||||||||||
Other postretirement benefits liability adjustment, net of tax: $193 | ||||||||||||||||||||||||||
Dividends ($0.12 per share) | ( | ) | ( | ) | ||||||||||||||||||||||
Share-based compensation plans, net | ( | ) | ||||||||||||||||||||||||
Distributions to noncontrolling interests in discontinued operations (a) | ( | ) | ( | ) | ||||||||||||||||||||||
Rice Merger, net of withholdings | ||||||||||||||||||||||||||
Contribution from noncontrolling interest, net of distribution | ||||||||||||||||||||||||||
Repurchase of common stock | ( | ) | ( | ) | ( | ) | ||||||||||||||||||||
Balance at December 31, 2017 | $ | $ | ( | ) | $ | $ | ( | ) | $ | $ | ||||||||||||||||
Comprehensive income, net of tax: | ||||||||||||||||||||||||||
Net (loss) income | ( | ) | ( | ) | ||||||||||||||||||||||
Net change in cash flow hedges: | ||||||||||||||||||||||||||
Natural gas, net of tax: $2,584 | ( | ) | ( | ) | ||||||||||||||||||||||
Interest rate, net of tax: $80 | ||||||||||||||||||||||||||
Other postretirement benefits liability adjustment, net of tax: $510 | ||||||||||||||||||||||||||
Dividends ($0.12 per share) | ( | ) | ( | ) | ||||||||||||||||||||||
Share-based compensation plans, net | ( | ) | ||||||||||||||||||||||||
Distributions to noncontrolling interests in discontinued operations (a) | ( | ) | ( | ) | ||||||||||||||||||||||
Change in accounting principle | ||||||||||||||||||||||||||
Repurchase and retirement of common stock | ( | ) | ( | ) | ( | ) | ||||||||||||||||||||
Purchase of Strike Force Midstream LLC noncontrolling interests | ( | ) | ( | ) | ||||||||||||||||||||||
Changes in ownership of consolidated subsidiaries | ( | ) | ||||||||||||||||||||||||
Distribution of Equitrans Midstream Corporation | ( | ) | ( | ) | ( | ) | ||||||||||||||||||||
Balance at December 31, 2018 | $ | $ | ( | ) | $ | $ | ( | ) | $ | $ | ||||||||||||||||
Comprehensive income, net of tax: | ||||||||||||||||||||||||||
Net (loss) | ( | ) | ( | ) | ||||||||||||||||||||||
Net change in interest rate cash flow hedges, net of tax: $210 | ||||||||||||||||||||||||||
Other postretirement benefits liability adjustment, net of tax: $150 | ||||||||||||||||||||||||||
Dividends ($0.12 per share) | ( | ) | ( | ) | ||||||||||||||||||||||
Share-based compensation plans | ||||||||||||||||||||||||||
Change in accounting principle (b) | ( | ) | — | |||||||||||||||||||||||
Distribution of Equitrans Midstream Corporation (see Note 9) | ( | ) | ||||||||||||||||||||||||
Other | ( | ) | ( | ) | ( | ) | ( | ) | ||||||||||||||||||
Balance at December 31, 2019 | $ | $ | ( | ) | $ | $ | ( | ) | $ | $ | ||||||||||||||||
Common shares authorized: 320,000 . Preferred shares authorized: 3,000 . There are no preferred shares issued or outstanding.
(a) | For the year ended December 31, 2017, distributions to noncontrolling interests were $ |
(b) | Related to adoption of ASU 2018-02. See Note 1. |
The accompanying notes are an integral part of these Consolidated Financial Statements.
67
EQT CORPORATION AND SUBSIDIARIES
NOTES TO CONSOLIDATED FINANCIAL STATEMENTS
DECEMBER 31, 2019
1. Summary of Significant Accounting Policies
Principles of Consolidation. The Consolidated Financial Statements include the accounts of EQT Corporation and all subsidiaries, ventures and partnerships in which EQT holds a controlling interest (collectively, EQT or the Company). All significant intercompany accounts and transactions have been eliminated in consolidation.
Segments. The Company's operations consist of one reportable segment. The Company has a single, company-wide management team that administers all properties as a whole rather than by discrete operating segments. The Company measures financial performance as a single enterprise and not on an area-by-area basis. Substantially all of the Company's operating revenues, income from operations and assets are generated and located in the United States.
Use of Estimates. The preparation of financial statements in conformity with United States generally accepted accounting principles (GAAP) requires management to make estimates and assumptions that affect the amounts reported in the Consolidated Financial Statements and accompanying notes. Actual results could differ from those estimates.
Cash Equivalents. The Company considers all highly-liquid investments with an original maturity of three months or less when purchased to be cash equivalents and accounts for such investments at cost. Interest earned on cash equivalents is included as a reduction of interest expense.
Investment in Equitrans Midstream Corporation. As of December 31, 2019, the Company owned approximately 19.9 % of the outstanding shares of common stock of Equitrans Midstream Corporation (Equitrans Midstream). See Note 18 for a discussion of events occurring subsequent to December 31, 2019 that will, among other things, affect the Company's ownership of Equitrans Midstream. The Company does not have the ability to exercise significant influence and does not have a controlling financial interest in Equitrans Midstream or any of its subsidiaries. As such, its investment in Equitrans Midstream is accounted for as an investment in equity securities and recorded at fair value in the Consolidated Balance Sheets. The fair value is calculated by multiplying the closing stock price of Equitrans Midstream's common stock by the number of shares of Equitrans Midstream's common stock owned by the Company. Changes in fair value are recorded in unrealized loss on investment in Equitrans Midstream Corporation in the Statements of Consolidated Operations. See Note 5 for a description of the fair value hierarchy. Dividends received on the investment in Equitrans Midstream are recorded in dividend and other income in the Statements of Consolidated Operations. See Note 2.
Property, Plant and Equipment. The following table summarizes the Company's property, plant and equipment.
December 31, | |||||||
2019 | 2018 | ||||||
(Thousands) | |||||||
Oil and gas producing properties, successful efforts method | $ | $ | |||||
Less: Accumulated depreciation and depletion | |||||||
Net oil and gas producing properties | |||||||
Other properties, at cost less accumulated depreciation | |||||||
Net property, plant and equipment | $ | $ | |||||
The Company uses the successful efforts method of accounting for oil and gas producing activities. Under this method, the cost of productive wells and related equipment, development dry holes and productive acreage, including productive mineral interests, are capitalized and depleted using the unit-of-production method. These costs include salaries, benefits and other internal costs directly attributable to production activities. The Company capitalized internal costs of approximately $77 million, $130 million and $115 million in 2019, 2018 and 2017, respectively. The Company also capitalized interest expense related to well development of approximately $24 million, $29 million and $21 million in 2019, 2018 and 2017, respectively. Depletion expense is calculated based on actual produced sales volumes multiplied by the applicable depletion rate per unit. Depletion rates for leases and wells are each calculated by dividing net capitalized costs by the number of units expected to be produced over the life of the reserves
68
separately. Costs for exploratory dry holes, exploratory geological and geophysical activities and delay rentals as well as other property carrying costs are charged to exploration expense. The Company's producing oil and gas properties had an overall average depletion rate of $1.01 , $1.04 and $1.04 per Mcfe for the years ended December 31, 2019, 2018 and 2017, respectively.
There were no exploratory wells drilled during 2019 and 2018, and there were no capitalized exploratory well costs for the years ended December 31, 2019, 2018 and 2017. During 2017, the Company drilled one exploratory dry hole within its non-core acreage, and the related expenditures were included in exploration expense in the Statement of Consolidated Operations for the year ended December 31, 2017.
Impairment of Long-lived Assets. The carrying values of the Company's proved oil and gas properties are reviewed for impairment when events or circumstances indicate that the remaining carrying value may not be recoverable. To determine whether impairment has occurred, the Company compares estimated expected undiscounted future cash flows from its oil and gas properties to the carrying values of those properties. The estimated future cash flows used in the recoverability test are based on proved and, if determined reasonable by management, risk-adjusted probable reserves and assumptions generally consistent with the assumptions used by the Company for internal planning and budgeting purposes, including, among other things, the intended use of the asset, anticipated production from reserves, future market prices for natural gas, NGLs and oil adjusted for basis differentials, future operating costs and inflation. Proved oil and gas properties that have carrying amounts in excess of estimated future undiscounted cash flows are written down to fair value, which is estimated by discounting the estimated future cash flows using discount rates and other assumptions that marketplace participants would use in their fair value estimates.
During the fourth quarter of 2019, there were indicators that the carrying values of certain of the Company's properties may be impaired due to depressed natural gas prices and changes in the Company's development strategy, including the Company's contemplation of a potential asset divestiture of certain of its non-strategic exploration and production assets. As a result of the 2019 impairment evaluation, the Company recorded total impairment of $1,124.4 million, of which $1,035.7 million was associated with the Company's non-strategic assets located in the Ohio Utica and $88.7 million was associated with the Company's Pennsylvania and West Virginia Utica assets. The impairment was recorded as a reduction to the assets' carrying values to their estimated fair values of approximately $839.4 million with respect to the Company's Ohio Utica assets and approximately $26.8 million with respect to the Company's Pennsylvania and West Virginia Utica assets. The fair value of the impaired assets, as determined at December 31, 2019, was based on significant inputs that are not observable in the market and, as such, are considered a Level 3 fair value measurement. See Note 5 for a description of the fair value hierarchy. Key assumptions included in the calculation of the fair value included the following: (i) reserves, including risk adjustments for probable reserves; (ii) future commodity prices; (iii) to the extent available, market-based indicators of fair value, including estimated proceeds that could be realized upon a potential disposition; (iv) production rates based on the Company's experience with similar properties; (v) future operating and development costs; (vi) inflation and (vii) a market-based weighted average cost of capital.
During 2018, there were indicators that the carrying values of certain of the Company's oil and gas producing properties may be impaired due to the Company's intention to sell its Huron and Permian assets before the end of their useful lives. As a result of the 2018 impairment evaluation, the Company recorded impairment of $2.4 billion associated with the Company's Huron and Permian assets. See Note 7 for discussion of the Huron and Permian assets divestitures. There were no indicators of impairment identified in 2017.
Impairment and Expiration of Leases. Capitalized costs of unproved oil and gas properties are evaluated for recoverability on a prospective basis at least annually. Indicators of potential impairment include changes due to economic factors, potential shifts in business strategy and historical experience. The likelihood of an impairment of unproved oil and gas properties increases as the expiration of a lease term approaches and drilling activity has not commenced. If the Company does not intend to drill on the property prior to expiration of the lease or does not have the intent and ability to extend, renew, trade or sell the lease prior to expiration, impairment expense is recorded. Expense for lease expirations where the lease was not previously impaired is recorded as the lease expires. For the years ended December 31, 2019, 2018 and 2017, the Company recorded $556.4 million, $279.7 million and $7.6 million, respectively, for lease impairments and expirations. The Company's unproved properties had a net book value of approximately $3,322 million and $4,166 million at December 31, 2019 and 2018, respectively.
Goodwill. Goodwill is the cost of an acquisition less the fair value of the identifiable net assets of the acquired business. At December 31, 2018, the Company had no goodwill. At November 30, 2018, prior to the completion of the 2018 annual goodwill impairment test, the Company's goodwill balance was $530.8 million.
Goodwill is tested for impairment at the Company's single reporting unit level on at least an annual basis or if events or circumstances indicate that it is more likely than not that the fair value of its reporting unit is below its carrying value. The Company considers market capitalization and other valuation techniques, as applicable, when estimating fair value for goodwill impairment testing purposes.
69
In connection with the 2018 annual goodwill impairment test, the Company identified several qualitative factors that are generally considered when assessing goodwill for impairment, including the steep decline in the Company's stock price through the quarter ended December 31, 2018, the weak market performance of the Company's peers for the same period, the Company's excess capital spend compared to the capital budget announced in October 2018, the recent operational volume curtailments and the Company's strategy to slow the cadence of its future drilling operations to generate near-term free cash flow.
The Company performed the first step of the goodwill impairment test for its single reporting unit as of November 30, 2018. The Company used its market capitalization plus a control premium to estimate fair value for its single reporting unit. Estimated market capitalization was calculated by multiplying the Company's 30 -day weighted average stock price and the number of outstanding common stock of the Company (EQT common stock) as of November 30, 2018. The reporting unit's estimated fair value was significantly less than its carrying value and, as such, all of the goodwill was impaired. This impairment charge was classified as a component of operating expenses.
The following table summarizes the Company's intangible assets.
December 31, | |||||||
2019 | 2018 | ||||||
(Thousands) | |||||||
Non-compete agreements | $ | $ | |||||
Less: Accumulated amortization | |||||||
Less: Impairment of intangible assets (a) | |||||||
Intangible assets, net | $ | $ | |||||
(a) | In 2019 the Company recognized impairment of its intangible assets associated with non-compete agreements for former Rice Energy executives who are now employees of the Company. |
Derivative Instruments. See Note 4 for further discussion of the Company's derivative instruments.
Other Current Liabilities. The following table summarizes the Company's other current liabilities.
December 31, | |||||||
2019 | 2018 | ||||||
(Thousands) | |||||||
Taxes other than income | $ | $ | |||||
Accrued interest payable | |||||||
Current portion of operating lease liability | |||||||
Incentive compensation | |||||||
Severance accrual | |||||||
Legal reserve | |||||||
Other accrued liabilities | |||||||
Total other current liabilities | $ | $ | |||||
Revenue Recognition. For information on revenue recognition from contracts with customers and gains and losses on derivative commodity instruments see Notes 3 and 4, respectively.
Unamortized Debt Discount and Issuance Expense. Discounts and expenses incurred with the issuance of debt are amortized on a straight-line basis over the term of the debt. These amounts are presented as a reduction of senior notes in the Consolidated Balance Sheets. See Note 10.
70
Transportation and Processing. Costs incurred to gather, process and transport gas produced by the Company to market sales points are recorded as transportation and processing costs in the Statements of Consolidated Operations. The Company markets some transportation for resale. These costs, which are not incurred to transport gas produced by the Company, are reflected as a deduction from net marketing services and other revenues.
Income Taxes. The Company files a consolidated federal income tax return and uses the asset and liability method to account for income taxes. The provision for income taxes represents amounts paid or estimated to be payable net of amounts refunded or estimated to be refunded for the current year and the change in deferred taxes exclusive of amounts recorded in other comprehensive income (OCI). Any refinements to prior year taxes made in the current year due to new information are reflected as adjustments in the current period. Separate income taxes are calculated for income from continuing operations, income from discontinued operations and items charged or credited directly to shareholders' equity.
Deferred income tax assets and liabilities arise from temporary differences between the financial reporting and tax bases of the Company's assets and liabilities and are recognized using enacted tax rates for the effect of such temporary differences. Deferred tax assets are reduced by a valuation allowance if it is more likely than not that a portion or all of the deferred tax asset will not be realized.
In accounting for uncertainty of a tax position taken or expected to be taken in a tax return, the Company uses a recognition threshold and measurement attribute for the financial statement recognition and measurement. The recognition threshold requires the Company to determine whether it is more likely than not that a tax position will be sustained upon examination, including resolution of any related appeals or litigation processes, based on the technical merits of the position. If it is more likely than not that a tax position will be sustained, the Company measures and recognizes the tax position at the largest amount of benefit that has a greater than 50 % likelihood of being realized upon ultimate settlement. The Company recognizes accrued interest and penalties related to unrecognized tax benefits in income tax expense.
Provision for Doubtful Accounts. Reserves for uncollectible accounts are recorded in selling, general and administrative expense in the Statements of Consolidated Operations. Judgment is required to assess the ultimate realization of the Company's accounts receivable. Reserves are based on historical experience, current and expected economic trends and specific information about customer accounts, such as the customer's creditworthiness.
The Company reported a net loss for the years ended December 31, 2019 and 2018; therefore, all options and restricted stock were excluded from the calculation of diluted weighted average shares outstanding because of their anti-dilutive effect on EPS. Restricted stock and performance awards excluded from the calculation due to their anti-dilutive effect on EPS totaled 184,075 and 234,149 for the years ended December 31, 2019 and 2018, respectively. Options to purchase common stock that were excluded from potentially dilutive securities because they were anti-dilutive were 2,554,729 and 1,775,249 for the years ended December 31, 2019 and 2018, respectively. Potentially dilutive securities (options and restricted stock) included in the calculation of diluted EPS totaled 346,528 shares for the year ended December 31, 2017. Options to purchase common stock excluded from potentially dilutive securities because they were anti-dilutive totaled 429,785 shares for the year ended December 31, 2017.
Asset Retirement Obligations. The Company accrues a liability for asset retirement obligations based on an estimate of the timing and amount of settlement. For oil and gas wells, the fair value of the Company's plugging and abandonment obligations is recorded at the time the obligations are incurred, which is typically at the time the wells are spud. Upon initial recognition of an asset retirement obligation, the Company increases the carrying amount of the long-lived asset by the same amount as the liability. Over time, the liabilities are accreted for the change in their present value through charges to depreciation and depletion expense. The initial capitalized costs are depleted over the useful lives of the related assets.
The Company's asset retirement obligations related to the abandonment of oil and gas producing facilities include reclaiming drilling sites, plugging wells and dismantling related structures. Estimates are based on historical experience of plugging and abandoning wells and reclaiming or disposing other assets and estimated remaining lives of the wells and assets.
71
The following table presents a reconciliation of the beginning and ending carrying amounts of the Company's asset retirement obligations included in other liabilities and credits in the Consolidated Balance Sheets.
December 31, | |||||||
2019 | 2018 | ||||||
(Thousands) | |||||||
Balance at January 1 | $ | $ | |||||
Accretion expense | |||||||
Liabilities incurred | |||||||
Liabilities settled | ( | ) | ( | ) | |||
Liabilities assumed in the Rice Merger | |||||||
Liabilities removed due to divestitures | ( | ) | ( | ) | |||
Change in estimates | |||||||
Balance at December 31 | $ | $ | |||||
The Company does not have any assets that are legally restricted for purposes of settling these obligations. During 2019 and 2018, the Company had changes in estimates for the plugging of horizontal and conventional wells that were related primarily to increased cost assumptions for the Company's compliance with existing regulatory requirements that were derived, in part, from recent plugging experience and actual costs incurred. The Company operates in several states that have implemented expanded requirements that resulted in the Company's use of additional materials during the plugging process, which has increased the estimated cost for plugging horizontal and conventional wells.
Self-Insurance. The Company is self-insured for certain losses related to workers' compensation and maintains a self-insured retention for general liability, automobile liability, environmental liability and other casualty coverage. The Company maintains stop loss coverage with third-party insurers to limit the total exposure for general liability, automobile liability, environmental liability and workers' compensation. The recorded reserves represent estimates of the ultimate cost of claims incurred as of the balance sheet date. Reserves are estimated based on analyses of historical data and actuarial estimates and are not discounted. The liabilities are reviewed by the Company quarterly and by independent actuaries annually to ensure appropriateness. While the Company believes these estimates are reasonable based on the information available, financial results could be impacted if actual trends, including the severity or frequency of claims, differ from estimates.
Discontinued Operations. For businesses classified as discontinued operations, balance sheet amounts and results of operations are reclassified from their historical presentation to assets and liabilities of discontinued operations in the Consolidated Balance Sheet and discontinued operations on the Statement of Consolidated Operations, respectively. The Statement of Consolidated Cash Flows was not reclassified for discontinued operations. See Note 2.
72
Supplemental Cash Flow Information. The following table summarizes net cash paid (received) for interest and income taxes and non-cash activity included in the Consolidated Statements of Cash Flows.
Years Ended December 31, | |||||||||||
2019 | 2018 | 2017 | |||||||||
(Thousands) | |||||||||||
Cash paid (received) during the year for: | |||||||||||
Interest, net of amount capitalized | $ | $ | $ | ||||||||
Income taxes, net | ( | ) | ( | ) | |||||||
Non-cash activity during the period for: | |||||||||||
Changes in property, plant and equipment accruals | $ | $ | ( | ) | $ | ||||||
Increase in asset retirement costs and obligations | |||||||||||
Increase in right-of-use lease assets and liabilities | |||||||||||
Capitalization of non-cash equity share-based compensation | |||||||||||
Assumption of net liabilities from current period acquisitions | |||||||||||
Measurement period adjustments for prior period acquisitions | ( | ) | |||||||||
Increase in capital contributions payable to Mountain Valley Pipeline, LLC | |||||||||||
Recently Issued Accounting Standards
In February 2016, the Financial Accounting Standards Board (FASB) issued ASU 2016-02, Leases. The standard requires entities to record assets and liabilities that arise from operating leases. In July 2018, the FASB issued ASU 2018-11, Leases: Targeted Improvements, which provided an optional transition method of adoption that permitted entities to recognize a cumulative-effect adjustment to the opening balance of retained earnings in the period of adoption. Under the optional transition method, comparative financial information and disclosures are not required. The update also provided transition practical expedients. The standard requires disclosure of the nature, maturity and value of an entity's lease liabilities and elections made by the entity. In March 2019, the FASB issued ASU 2019-01, Leases: Codification Improvements, which, among other things, clarified interim disclosure requirements in the year of ASU 2016-02 adoption.
The Company adopted ASU 2016-02, ASU 2018-11 and ASU 2019-01 on January 1, 2019 using the optional transition method of adoption. The Company implemented a new lease accounting system to monitor its population of lease contracts. The Company also implemented processes and controls to review both new contracts and modifications to existing contracts that contain or are leases for appropriate accounting treatment and generate disclosures required under the standards. For the disclosures required by the standards, see Note 15.
In June 2016, the FASB issued ASU 2016-13, Financial Instruments – Credit Losses: Measurement of Credit Losses on Financial Instruments. This ASU amends guidance on reporting credit losses for assets held at amortized cost basis and available for sale debt securities. For assets held at amortized cost basis, this ASU eliminates the probable initial recognition threshold and requires entities to reflect their current estimate of all expected credit losses. The amendment affects loans, debt securities, trade receivables, net investments in leases, off-balance sheet credit exposures, reinsurance receivables and any other financial assets not excluded from its scope that have a contractual right to receive cash. This ASU will be effective for annual reporting periods beginning after December 15, 2019, including interim periods within that reporting period. The Company plans to adopt this ASU in the first quarter of 2020 and expects this adoption to have no impact on its financial statements. The Company is evaluating the impact this standard will have on its related disclosures.
In February 2018, the FASB issued ASU 2018-02, Income Statement – Reporting Comprehensive Income: Reclassification of Certain Tax Effects from Accumulated Other Comprehensive Income. This ASU allows entities to reclassify stranded tax effects resulting from the Tax Cuts and Jobs Act of 2017 (the Tax Cuts and Jobs Act) from accumulated OCI to retained earnings. This ASU is effective for fiscal years beginning after December 15, 2018 and early adoption is permitted. The reclassification permitted under this ASU should be applied either in the period of adoption or retrospectively to each period or periods in which the effect of the change in the U.S. federal corporate income tax rate from the Tax Cuts and Jobs Act is recognized. The Company adopted this ASU on January 1, 2019 and reclassified the income tax effects of the Tax Cuts and Jobs Act of $0.5 million from accumulated OCI to retained earnings.
73
In August 2018, the FASB issued ASU 2018-13, Fair Value Measurement, Changes to the Disclosure Requirements for Fair Value Measurement. This ASU modifies the hierarchy associated with Level 1, 2 and 3 fair value measurements and the related disclosure requirements. This guidance is effective for fiscal years beginning after December 15, 2019, including interim periods within those fiscal years, and early adoption is permitted. The Company plans to adopt this ASU in the first quarter of 2020 and does not expect this adoption to have a material impact on its financial statements and related disclosures.
In December 2019, the FASB issued ASU 2019-12, Income Taxes: Simplifying the Accounting for Income Taxes. This ASU simplifies accounting for income taxes by eliminating certain exceptions to ASC 740 related to the general approach for intraperiod tax allocation, methodology for calculating income taxes in an interim period and recognition of deferred taxes when there are investment ownership changes. The new guidance also simplifies aspects of accounting for franchise taxes and interim period effects of enacted changes in tax laws or rates. The new guidance provides clarification on accounting for transactions that result in a step-up in the tax basis of goodwill and allocation of consolidated income tax expense to separate financial statements of entities not subject to income tax. This ASU is effective for fiscal years beginning after December 15, 2020, including interim periods within those fiscal years, and early adoption is permitted. The Company is evaluating the impact this standard will have on its financial statements and related disclosures.
2. Separation and Distribution and Discontinued Operations
On November 12, 2018, the Company completed the separation of its midstream business, which was composed of the separately operated natural gas gathering, transmission and storage and water services businesses of the Company, from its upstream business, which is composed of the natural gas, NGLs and oil development, production and sales and commercial operations of the Company (the Separation). The Separation was effected by the transfer of the midstream business from the Company to Equitrans Midstream and the distribution of 80.1 % of the outstanding shares of Equitrans Midstream's common stock to the Company's shareholders (the Distribution). The Company's shareholders received 0.80 shares of Equitrans Midstream's common stock for every one share of EQT common stock held as the close of business on November 1, 2018. The Company retained 19.9 % of the outstanding shares of Equitrans Midstream's common stock. See Note 1 for a discussion of the Company's accounting for the investment in Equitrans Midstream and Note 18 for a discussion of events occurring subsequent to December 31, 2019 that will, among other things, affect the Company's ownership of Equitrans Midstream.
In connection with the Separation and Distribution, the Company entered into several agreements with Equitrans Midstream to implement the legal and structural separation between the two companies, govern the relationship between the Company and Equitrans Midstream and allocate between the Company and Equitrans Midstream various assets, liabilities and obligations, including, among other things, employee benefits, litigation, contracts, equipment, real property, intellectual property and tax-related assets and liabilities.
In the ordinary course of business, the Company engages in transactions with EQM Midstream Partners, LP (EQM) and its affiliates including, but not limited to, gas gathering agreements, transportation service and precedent agreements, storage agreements and water services agreements. These agreements have terms ranging from month-to-month up to 20 years.
Equitrans Midstream comprised the Company's former EQM Gathering, EQM Transmission and EQM Water segments. For all periods prior to the Separation and Distribution, the results of operations of Equitrans Midstream are reflected as discontinued operations. The Statements of Consolidated Operations for the years ended December 31, 2018 and 2017 have been recast to reflect discontinued operations presentation and include certain transportation and processing expenses in continuing operations that had previously been eliminated in consolidation. Cash flows related to Equitrans Midstream are included in the Statements of Consolidated Cash Flows for all periods prior to the Separation and Distribution. The results of operations of Equitrans Midstream are summarized below. The Company allocated transaction costs associated with the Separation and Distribution and a portion of transaction costs associated with the Rice Merger (see Note 8) to discontinued operations.
74
January 1, 2018 to November 12, 2018 | Year Ended December 31, 2017 | ||||||
(Thousands) | |||||||
Operating revenues | $ | $ | |||||
Transportation and processing | ( | ) | ( | ) | |||
Operation and maintenance | |||||||
Selling, general and administrative | |||||||
Depreciation | |||||||
Impairment of goodwill (a) | |||||||
Transaction costs | |||||||
Amortization of intangible assets | |||||||
Other income | |||||||
Interest expense | |||||||
Income from discontinued operations before income taxes | |||||||
Income tax expense | |||||||
Income from discontinued operations after income taxes | |||||||
Less: Net income from discontinued operations attributable to noncontrolling interests | |||||||
Net income from discontinued operations | $ | $ | |||||
(a) | Following the third quarter of 2018, and prior to the Separation and Distribution, indicators of goodwill impairment were identified in the form of the announced production curtailments, which could reduce the volumetric-based fee revenues of two reporting units to which the Company's goodwill was recorded. The two reporting units, Rice Retained Midstream and RMP PA Gas Gathering, were allocated to discontinued operations as a result of the Separation and Distribution. Both of these reporting units earned a substantial portion of their revenues from volumetric-based fees, which are sensitive to changes in development plans. In estimating the fair value of these reporting units, a combination of the income approach and the market approach was used. The discounted cash flow method income approach applies significant inputs that are not observable in the public market (Level 3), including estimates and assumptions related to future throughput volumes, operating costs, capital spending and changes in working capital. The comparable company method market approach evaluates the value of a company using metrics of other businesses of similar size and industry. The reference transaction method evaluates the value of a company based on pricing multiples derived from similar transactions entered into by similar companies. |
For the year ended December 31, 2018, the fair value of the Rice Retained Midstream reporting unit was greater than its carrying value, but the carrying value of the RMP PA Gas Gathering reporting unit exceeded its fair value. As a result, impairment of goodwill of $267.9 million was recorded with a corresponding decrease to goodwill in the Consolidated Balance Sheet and allocated to discontinued operations.
75
The following table presents cash flows from or used in discontinued operations related to Equitrans Midstream that are included, and not separately stated, in the Statements of Consolidated Cash Flows for the years ended December 31, 2018 and 2017.
January 1, 2018 to November 12, 2018 | Year Ended December 31, 2017 | ||||||
(Thousands) | |||||||
Cash flows from operating activities: | |||||||
Deferred income tax (benefit) expense | $ | ( | ) | $ | |||
Depreciation | |||||||
Amortization of intangibles | |||||||
Impairment of goodwill | |||||||
Other income | ( | ) | ( | ) | |||
Share-based compensation expense | |||||||
Cash flows from investing activities: | |||||||
Capital expenditures | ( | ) | ( | ) | |||
Capital contributions to Mountain Valley Pipeline, LLC (a) | ( | ) | ( | ) | |||
Cash flows from financing activities: | |||||||
Proceeds from issuance of debt | |||||||
Increase in borrowings on credit facilities | |||||||
Repayment of borrowings on credit facilities | ( | ) | ( | ) | |||
Debt issuance costs and credit facility origination fees | ( | ) | ( | ) | |||
Distributions to noncontrolling interests | ( | ) | ( | ) | |||
Contribution to Strike Force Midstream LLC by minority owner, net of distribution | |||||||
Acquisition of 25% of Strike Force Midstream LLC | ( | ) | |||||
(a) | Mountain Valley Pipeline, LLC is a joint venture that is constructing the Mountain Valley Pipeline. EQM owns an interest in the joint venture and makes capital contributions to the joint venture. |
3. Revenue from Contracts with Customers
Under the Company's natural gas, NGLs and oil sales contracts, the Company generally considers the delivery of each unit (MMBtu or Bbl) to be a separate performance obligation that is satisfied upon delivery. These contracts typically require payment within 25 days of the end of the calendar month in which the commodity is delivered. A significant number of these contracts contain variable consideration because the payment terms refer to market prices at future delivery dates. In these situations, the Company has not identified a standalone selling price because the terms of the variable payments relate specifically to the Company's efforts to satisfy the performance obligations. Other contracts, such as fixed price contracts or contracts with a fixed differential to New York Mercantile Exchange (NYMEX) or index prices, contain fixed consideration. The fixed consideration is allocated to each performance obligation on a relative standalone selling price basis, which requires judgment from management. For these contracts, the Company generally concludes that the fixed price or fixed differentials in the contracts are representative of the standalone selling price.
Based on management's judgment, the performance obligations for the sale of natural gas, NGLs and oil are satisfied at a point in time because the customer obtains control and legal title of the asset when the natural gas, NGLs or oil are delivered to the designated sales point.
The sales of natural gas, NGLs and oil presented in the Statements of Consolidated Operations represent the Company's share of revenues net of royalties and excluding revenue interests owned by others. When selling natural gas, NGLs and oil on behalf of royalty owners or working interest owners, the Company is acting as an agent and, thus, reports the revenue on a net basis.
For contracts with customers where the Company's performance obligations had been satisfied and an unconditional right to consideration existed as of the balance sheet date, the Company recognized amounts due from contracts with customers of $384.0 million and $783.0 million in accounts receivable in the Consolidated Balance Sheets as of December 31, 2019 and 2018,
76
respectively. Accounts receivable also includes amounts due from joint interest partners of $127.9 million and $324.2 million at December 31, 2019 and 2018, respectively, and amounts due for settled derivative instruments.
The table below provides disaggregated information on the Company's revenues. Certain contracts that provide for the release of capacity that is not used to transport the Company's produced volumes are outside the scope of ASU 2014-09, Revenue from Contracts with Customers. The costs of, and recoveries on, such capacity are reported in net marketing services and other in the Statements of Consolidated Operations. Derivative contracts are also outside the scope of ASU 2014-09.
Years Ended December 31, | |||||||
2019 | 2018 | ||||||
(Thousands) | |||||||
Revenues from contracts with customers: | |||||||
Natural gas sales | $ | $ | |||||
NGLs sales | |||||||
Oil sales | |||||||
Net marketing services and other | |||||||
Total revenues from contracts with customers | |||||||
Other sources of revenue: | |||||||
Net marketing services and other | |||||||
Gain (loss) on derivatives not designated as hedges | ( | ) | |||||
Total operating revenues | $ | $ | |||||
The following table includes the transaction price allocated to the Company's remaining performance obligations on all contracts with fixed consideration as of December 31, 2019 and excludes all contracts that qualify for the exception to the relative standalone selling price method.
2020 | 2021 | Total | |||||||||
(Thousands) | |||||||||||
Natural gas sales | $ | $ | $ | ||||||||
4. Derivative Instruments
The Company's primary market risk exposure is the volatility of future prices for natural gas and NGLs, which can affect the Company's operating results. The Company uses derivative commodity instruments to hedge its cash flows from sales of produced natural gas and NGLs. The Company's overall objective in its hedging program is to protect cash flows from undue exposure to the risk of changing commodity prices.
Derivative commodity instruments used by the Company are primarily swap, collar and option agreements. These agreements may require payments to, or receipt of payments from, counterparties based on the differential between two prices for the commodity. The Company uses these agreements to hedge its NYMEX and basis exposure. The Company may also use other contractual agreements when implementing its commodity hedging strategy. The Company typically enters into over the counter (OTC) derivative commodity instruments with financial institutions, and the creditworthiness of all counterparties is regularly monitored.
The Company does not designate any of its derivative instruments as cash flow hedges; therefore, all changes in fair value of the Company's derivative instruments are recognized in operating revenues in the Statements of Consolidated Operations. The Company recognizes all derivative instruments as either assets or liabilities at fair value on a gross basis. These derivative instruments are reported as either current assets or current liabilities due to their highly liquid nature. The Company can net settle its derivative instruments at any time.
Contracts that result in physical delivery of a commodity expected to be sold by the Company in the normal course of business are generally designated as normal sales and are exempt from derivative accounting. Contracts that result in the physical receipt or delivery of a commodity but are not designated or do not meet all the criteria to qualify for the normal purchase and normal sale scope exception are subject to derivative accounting.
77
The Company's OTC derivative instruments generally require settlement in cash. The Company also enters into exchange traded derivative commodity instruments, which are generally settled with offsetting positions. Settlements of derivative commodity instruments are reported as a component of cash flows from operations in the Statements of Consolidated Cash Flows.
With respect to the derivative commodity instruments held by the Company, the Company hedged portions of expected sales of production and portions of its basis exposure covering approximately 1,644 billion cubic feet (Bcf) of natural gas as of December 31, 2019 and 3,128 Bcf of natural gas and 1,505 thousand barrels (Mbbl) of NGLs as of December 31, 2018. The open positions at both December 31, 2019 and 2018 had maturities extending through December 2024.
When the net fair value of any of the Company's swap agreements represents a liability to the Company that is in excess of the agreed-upon threshold between the Company and the counterparty, the counterparty has the right to require the Company to remit funds as a margin deposit in an amount equal to the portion of the derivative liability that is in excess of the threshold amount. The Company records these deposits as a current asset. When the net fair value of any of the Company's swap agreements represents an asset to the Company that is in excess of the agreed-upon threshold between the Company and the counterparty, the Company has the right to require the counterparty to remit funds as a margin deposit in an amount equal to the portion of the derivative asset that is in excess of the threshold amount. The Company records a current liability for such amounts received. The Company had no such deposits in its Consolidated Balance Sheets at both December 31, 2019 and 2018.
When the Company enters into exchange traded natural gas contracts, exchanges may require the Company to remit funds to the corresponding broker as good faith deposits to guard against the risks associated with changing market conditions. The Company must make such deposits based on an established initial margin requirement and the net liability position, if any, of the fair value of the associated contracts. The Company records these deposits as a current asset. When the fair value of such contracts is in a net asset position, the broker may remit funds to the Company. The Company records a current liability for any such amounts received. The initial margin requirements are established by the exchanges based on the price, volatility and the time to expiration of the contract. The margin requirements are subject to change at the exchanges' discretion. The Company recorded current assets of $12.6 million and $40.3 million in its Consolidated Balance Sheets as of December 31, 2019 and 2018, respectively, for such deposits.
The Company has netting agreements with financial institutions and its brokers that permit net settlement of gross commodity derivative assets against gross commodity derivative liabilities. The table below reflects the impact of netting agreements and margin deposits on gross derivative assets and liabilities.
Gross derivative instruments recorded in the Consolidated Balance Sheet | Derivative instruments subject to master netting agreements | Margin deposits remitted to counterparties | Net derivative instruments | ||||||||||||
December 31, 2019 | (Thousands) | ||||||||||||||
Asset derivative instruments at fair value | $ | $ | ( | ) | $ | $ | |||||||||
Liability derivative instruments at fair value | ( | ) | ( | ) | |||||||||||
December 31, 2018 | |||||||||||||||
Asset derivative instruments at fair value | $ | $ | ( | ) | $ | $ | |||||||||
Liability derivative instruments at fair value | ( | ) | ( | ) | |||||||||||
Certain of the Company's OTC derivative instrument contracts provide that, if the Company's credit ratings assigned by Moody's Investors Service, Inc. (Moody's) or S&P Global Ratings (S&P) is below investment grade, additional collateral must be deposited with the counterparty if the associated derivative liability exceeds certain thresholds. The additional collateral can be up to 100 % of the derivative liability. Investment grade refers to the quality of a company's credit as assessed by one or more credit rating agencies. To be considered investment grade, a company must be rated "Baa3" or higher by Moody's, "BBB–" or higher by S&P and "BBB–" or higher by Fitch Rating Service (Fitch). Anything below these ratings is considered non-investment grade. As of December 31, 2019, the Company's senior notes were rated "Baa3" by Moody's and "BBB–" by S&P. Margin deposits on the Company's derivative instruments are also subject to factors other than credit rating, such as natural gas prices and credit thresholds set forth in the agreements between hedging counterparties and the Company. As of December 31, 2019, the aggregate fair value of all OTC derivative instruments with credit risk-related contingent features that were in a net liability position was $76.7 million, for which the Company had no collateral posted. If the Company's credit rating assigned by Moody's or S&P had been downgraded
78
as of December 31, 2019, the Company would not have been required to post any additional collateral under its OTC derivative instrument contracts.
In January 2020, Moody's downgraded the Company's senior notes credit rating to "Ba1," and, in February 2020, S&P downgraded the Company's senior notes credit rating to "BB+"; however, as of February 26, 2020, the changes in Moody's and S&P's credit rating of the Company's senior notes had no effect on margin deposits on the Company's derivative instruments. See Note 10 for a discussion of the effects of the Moody's and S&P downgrades on the Company's collateral requirements under its midstream service contracts.
The Company has not executed any interest rate swaps since 2011. Amounts related to historical interest rate swaps were recorded to accumulated OCI and have been fully reclassified into interest expense as of December 31, 2019. See Note 12.
5. Fair Value Measurements
The Company records its financial instruments, principally derivative instruments, at fair value in its Consolidated Balance Sheets. The Company estimates the fair value of its financial instruments using quoted market prices, where available. If quoted market prices are not available, fair value is based on models that use market-based parameters as inputs, including forward curves, discount rates, volatilities and nonperformance risk. Nonperformance risk considers the effect of the Company's credit standing on the fair value of liabilities and the effect of the counterparty's credit standing on the fair value of assets. The Company estimates nonperformance risk by analyzing publicly available market information, including a comparison of the yield on debt instruments with credit ratings similar to the Company's or counterparty's credit rating and the yield on a risk-free instrument.
The Company has categorized its assets and liabilities recorded at fair value into a three-level fair value hierarchy based on the priority of the inputs to the valuation technique. The fair value hierarchy gives the highest priority to quoted prices in active markets for identical assets and liabilities (Level 1) and the lowest priority to unobservable inputs (Level 3). Assets and liabilities in Level 2 primarily include the Company's swap, collar and option agreements.
Exchange traded commodity swaps are included in Level 1. The fair value of the commodity swaps included in Level 2 is based on standard industry income approach models that use significant observable inputs, including but not limited to NYMEX natural gas forward curves, LIBOR-based discount rates, basis forward curves and natural gas liquids forward curves. The Company's collars and options are valued using standard industry income approach option models. The significant observable inputs used by the option pricing models include NYMEX forward curves, natural gas volatilities and LIBOR-based discount rates.
The table below summarizes assets and liabilities measured at fair value on a recurring basis.
Fair value measurements at reporting date using | |||||||||||||||
Gross derivative instruments recorded in the Consolidated Balance Sheets | Quoted prices in active markets for identical assets (Level 1) | Significant other observable inputs (Level 2) | Significant unobservable inputs (Level 3) | ||||||||||||
December 31, 2019 | (Thousands) | ||||||||||||||
Asset derivative instruments at fair value | $ | $ | $ | $ | |||||||||||
Liability derivative instruments at fair value | |||||||||||||||
December 31, 2018 | |||||||||||||||
Asset derivative instruments at fair value | $ | $ | $ | $ | |||||||||||
Liability derivative instruments at fair value | |||||||||||||||
The carrying values of cash equivalents, accounts receivable and accounts payable approximate fair value due to their short-term maturities. The carrying value of the Company's investment in Equitrans Midstream approximates fair value as Equitrans Midstream is a publicly traded company. The carrying values of borrowings under the Company's credit facility and Term Loan Facility approximate fair value as the interest rates are based on prevailing market rates. The Company considered all of these fair values to be Level 1 fair value measurements.
The Company has an immaterial investment in a fund that invests in companies developing technology and operating solutions for exploration and production companies for which the Company recognized a cumulative effect of accounting change in the
79
first quarter of 2018. The investment is valued using, as a practical expedient, the net asset value provided in the financial statements received from fund managers.
The Company estimates the fair value of its senior notes using established fair value methodology. Because not all of the Company's senior notes are actively traded, the fair value of the senior notes is a Level 2 fair value measurement. As of December 31, 2019 and 2018, the Company's senior notes had a fair value of approximately $3.9 billion and $4.4 billion, respectively, and a carrying value, as presented in the Consolidated Balance Sheets, of approximately $3.9 billion and $4.6 billion, respectively, inclusive of any current portion. The fair value of the Company's note payable to EQM is estimated using an income approach model with a market-based discount rate and is a Level 3 fair value measurement. As of December 31, 2019 and 2018, the Company's note payable to EQM had a fair value of $128.2 million and $121.8 million, respectively, and a carrying value, as presented in the Consolidated Balance Sheets of $110.1 million and $114.7 million, respectively, inclusive of any current portion. See Note 10 for further discussion of the Company's debt.
The Company recognizes transfers between Levels as of the actual date of the event or change in circumstances that caused the transfer. There were no transfers between Levels 1, 2 and 3 for the periods presented.
For information on the fair values, and impairments thereof, of proved and unproved oil and gas properties and other long-lived assets, see Note 1. For information on the fair values related to the Asset Exchange Transaction (defined in Note 6), see Note 6. For information on the fair values of assets acquired in the Rice Merger (defined in Note 8) and in other acquisition transactions, see Note 8.
6. Asset Exchange Transaction
During the third quarter of 2019, the Company closed on an acreage trade agreement and purchase and sale agreement with a third party (Asset Exchange Transaction), pursuant to which the Company exchanged approximately 16,000 net revenue interest acres primarily in Tyler and Wetzel Counties, West Virginia for approximately 16,000 net revenue interest acres primarily in Wetzel and Marion Counties, West Virginia. Under the terms of the purchase and sale agreement, the Company assigned to the third party a gas gathering agreement covering a portion of Tyler County and provided a firm gathering commitment, and the Company was released from its remaining obligations under the gas gathering agreement. As consideration for the third party's assumption of the Tyler County gas gathering agreement, the Company agreed to reimburse the third party for certain firm gathering costs under the gas gathering agreement through December 2022 and assign the third party an additional approximately 3,000 net revenue interest acres in Tyler and Wetzel Counties, West Virginia. During the third quarter of 2019, as a result of the Asset Exchange Transaction, the Company recorded a net loss of $13.9 million in impairment/loss on sale/exchange of long-lived assets in the Statement of Consolidated Operations for the year ended December 31, 2019. As of December 31, 2019, the liability for the reimbursement of certain firm gathering costs was $38.1 million, which is included in other current liabilities and other liabilities and credits in the Consolidated Balance Sheet.
The fair values of leases acquired and the liability for the reimbursement of certain firm gathering costs were based on significant inputs that are not observable in the market and, as such, are considered to be Level 3 fair value measurements. See Note 5 for a description of the fair value hierarchy. Key assumptions included in the calculation of fair values included market-based prices for comparable acreage and a calculation of net present value of the expected payments due for reimbursement.
7. Divestitures
In 2018, the Company sold its non-core production and related midstream assets located in the Huron play and Permian Basin (the 2018 Divestitures). For the year ended December 31, 2018, as a result of the 2018 Divestitures, the Company recorded an impairment/loss on sale of long-lived assets of $2.4 billion due to the carrying value of the properties and related pipeline assets exceeding the amounts received for the 2018 Divestitures.
The fair value of the impaired assets was based on significant inputs that are not observable in the market and, as such, are considered to be Level 3 fair value measurements. See Note 5 for a description of the fair value hierarchy and Note 1 for the Company's policy on impairment of proved and unproved properties. Key assumptions included in the calculation of the fair value of the impaired assets included the following: reserves, including risk adjustments for probable and possible reserves; future commodity prices; to the extent available, market-based indicators of fair value including estimated proceeds that could be realized upon a potential disposition; production rates based on the Company's experience with similar properties it operates; estimated future operating and development costs; and a market-based weighted average cost of capital.
In connection with the closing of the 2018 Divestitures, the Company recorded a loss of $259.3 million during the third quarter of 2018 related to certain capacity contracts that the Company no longer has existing production to satisfy and does not plan to
80
use in the future. The loss was recorded in impairment/loss on sale/exchange of long-lived assets in the Statement of Consolidated Operations. The fair value of the loss for the initial measurement was based on significant inputs that are not observable in the market and, as such, is considered a Level 3 fair value measurement. The key unobservable input in the calculation is the amount of potential future economic benefit from the contracts. See Note 5 for a description of the fair value hierarchy.
8. Rice Merger and Other Acquisitions
Rice Merger
On November 13, 2017, the Company completed its acquisition of Rice Energy (the Rice Merger). Total consideration for the Rice Merger was approximately $7.8 billion, consisting of approximately 91 million shares of EQT common stock and approximately $1.6 billion in cash, net of cash acquired and inclusive of amounts payable to Rice Energy employees for severance and other termination benefits and $555.5 million of aggregate cash payments made to affiliates of EIG Global Energy Partners to redeem the EIG Global Energy Partners' respective interests in Rice Midstream Holdings LLC (Rice Midstream Holdings) and Rice Midstream GP Holdings, LP. The Company accounted for the Rice Merger as a business combination using the acquisition method.
The fair value assigned to liabilities assumed was approximately $3.9 billion and was related primarily to long-term debt. In connection with the closing of the Rice Merger, the Company repaid $508.5 million of outstanding principal and $1.7 million of interest and fees under Rice Energy's credit facilities, and the credit agreements were terminated. In addition, in connection with Rice Energy's redemption and cancellation of its outstanding senior notes, the Company paid an aggregate $1.4 billion, including make whole call premiums of $63.8 million and interest payments of $13.4 million.
The fair value assigned to assets acquired was approximately $9.7 billion and was related primarily to acquired net property, plant and equipment, which included approximately 205,000 net Marcellus acres, approximately 65,000 net Ohio Utica acres and Upper Devonian and Utica drilling rights in Pennsylvania. In addition, the Company identified intangible assets associated with non-compete agreements for former Rice Energy executives. In 2019, the Company recognized impairment of these intangible assets. See Note 1.
The fair values of the acquired natural gas and oil properties were measured using discounted cash flow valuation techniques based on inputs that are not observable in the market and, as such, are considered Level 3 fair value measurements. Significant inputs include estimates of recoverable reserves, production rates, future operating and development costs, future commodity prices and market-based weighted average cost of capital. The fair value of undeveloped property was based on a market approach of comparable transactions using Level 3 inputs. The fair value of the identified intangible assets was determined using the income approach based on inputs that are not observable in the market and, as such, are considered Level 3 fair value measurements. Significant unobservable inputs include estimates of future production levels, future revenues, future costs, the probability that former executives would compete in the absence of such non-compete agreements and customer retention rates.
The Company recorded approximately $2.0 billion in goodwill as a result of the Rice Merger. During the year ended December 31, 2018, the Company recorded impairment of goodwill of $0.5 billion from continuing operations and $0.3 billion for discontinued operations and allocated $1.2 billion of goodwill to discontinued operations, including $387.1 million in unamortized carryover tax basis of tax-deductible goodwill. See Note 1 for a discussion of the 2018 goodwill impairment test.
For the year ended December 31, 2018 and 2017, the Company recorded transaction costs related to the Rice Merger of $25.4 million and $152.2 million, respectively, from continuing operations and $13.5 million and $85.1 million, respectively, from discontinued operations. For the year ended December 31, 2017, the Company recorded debt issuance costs related to the Rice Merger of $5.1 million from continuing operations and $2.9 million discontinued operations.
Other 2017 Acquisitions
In addition to the Rice Merger, the Company completed other acquisitions with third parties during the year ended December 31, 2017, through which the Company acquired, in the aggregate, approximately 158,500 net Marcellus acres, located primarily in West Virginia, and drilling rights on Ohio Utica acres.
In 2017, the Company paid, in the aggregate, net cash of $740.1 million in connection with the other 2017 acquisitions. The fair value assigned, in the aggregate, to the acquired property, plant and equipment was $750.1 million. In connection with the other 2017 acquisitions, the Company assumed $5.3 million of net current liabilities and $4.7 million of non-current liabilities.
81
In 2017, as a result of post-closing adjustments on acquisitions completed in 2016, the Company paid $78.9 million for additional undeveloped acreage and recorded $14.3 million in other non-cash adjustments, which reduced the fair value assigned to the acquired property, plant and equipment.
The Company accounted for the other 2017 acquisitions as business combinations using the acquisition method. The fair value of undeveloped property was based on a market approach of comparable transactions using Level 3 inputs.
9. Income Taxes
The following table summarizes income tax (benefit) expense.
Years Ended December 31, | |||||||||||
2019 | 2018 | 2017 | |||||||||
(Thousands) | |||||||||||
Current: | |||||||||||
Federal | $ | ( | ) | $ | ( | ) | $ | ( | ) | ||
State | ( | ) | ( | ) | |||||||
Subtotal | ( | ) | ( | ) | ( | ) | |||||
Deferred: | |||||||||||
Federal | ( | ) | ( | ) | |||||||
State | ( | ) | ( | ) | ( | ) | |||||
Subtotal | ( | ) | ( | ) | ( | ) | |||||
Total income tax benefit | $ | ( | ) | $ | ( | ) | $ | ( | ) | ||
For the year ended December 31, 2019, the current federal income tax benefit consisted primarily of expected refunds of $120 million related to the Company's alternative minimum tax (AMT) credit carryforward and the Tax Cuts and Jobs Act. For the year ended December 31, 2018, the current federal income tax benefit consisted primarily of an expected refund of $141 million related to the Company's AMT credit carryforward, partly offset by $16 million of current state tax expense. For the year ended December 31, 2017, the current federal income tax benefit consisted primarily of expected refunds of $65 million related to amended returns the Company had filed to carryback federal and AMT net operating losses (NOLs) that were generated in 2017 and 2016. The remaining current tax benefit of $435 million and $29 million for the years ended December 31, 2018 and 2017, respectively, was offset by current expense related to discontinued operations and will not result in additional refunds to the Company.
On December 22, 2017, the U.S. Congress enacted the Tax Cuts and Jobs Act, which made significant changes to U.S. federal income tax law, including lowering the federal corporate tax rate to 21% from 35% beginning January 1, 2018. As a result of the change in the corporate tax rate the Company recorded a deferred tax benefit of $1.2 billion during the year ended December 31, 2017 to revalue its existing net deferred tax liabilities to the lower rate.
The Company applied the guidance in SAB 118 when accounting for the enactment-date effects of the Tax Cuts and Jobs Act in 2017 and throughout 2018. At December 31, 2017, the Company had not completed the accounting for all the enactment-date income tax effects of the legislation under Accounting Standards Codification (ASC) 740, Income Taxes, for the following aspects: remeasurement of deferred tax assets and liabilities and incentive-based compensation limitations. During 2018, the Company completed the accounting for all the enactment-date income tax effects of the Tax Cuts and Jobs Act and recognized adjustments of $5.3 million to the provisional amounts recorded at December 31, 2017. These adjustments were included as a component of income tax expense from continuing operations. The additional expense was primarily a result of adjustments to the increased limitations on deductible executive compensation.
The Tax Cuts and Jobs Act preserved deductibility of intangible drilling costs (IDCs) for federal income tax purposes, which allows the Company to deduct a portion of drilling costs in the year incurred and minimizes current taxes payable. Prior to 2018, IDCs were limited for AMT purposes, which resulted in the Company paying AMT in periods when no other federal taxes were then currently payable. The Tax Cuts and Jobs Act also repealed the AMT for tax years beginning January 1, 2018 and provided that existing AMT credit carryforwards can be used to offset current federal taxes owed in tax years 2018 through 2020. In addition, 50% of any unused AMT credit carryforwards can be refunded during these years with any remaining AMT credit carryforward being fully refunded in 2021. As a result of an IRS announcement in January 2019 that reversed its position that AMT refunds were subject to sequestration by the federal government at a rate equal to 6.2% of the refund, the Company reversed the related valuation allowance of $13 million in the first quarter of 2019.
82
As of December 31, 2019, the Company had current income tax receivable of $299 million, which consisted of refunds of AMT credits of $95 million and $190 million for 2019 and 2018, respectively, and $14 million in state taxes previously paid related to the Company's 2018 tax return. The Company expects to receive $95 million in refunds of AMT in 2020 and 2021.
The Tax Cuts and Jobs Act limited the deductibility of interest expense, and, as a result, the Company recorded a valuation allowance in 2019 for a portion of the interest expense limit imposed for separate company state income tax purposes.
The Company has federal NOL carryforwards related to the Rice Merger and NOLs generated in 2017 in excess of amounts carried back to prior years. The Company also has NOLs acquired in the Company's 2016 acquisition of Trans Energy, Inc., of which a nominal amount is available for use annually over the next 20 years. The Tax Cuts and Jobs Act limited the utilization of NOLs generated after December 31, 2017 that have been carried forward into future years to 80% of taxable income and eliminated the ability to carry NOLs back to earlier tax years for refunds of taxes paid. NOLs generated in 2018 and in future periods can be carried forward indefinitely.
Income tax benefit from continuing operations differed from amounts computed at the federal statutory rate of 21 % for 2019 and 2018 and 35 % for 2017 on pre-tax income for reasons summarized below.
Years Ended December 31, | |||||||||||
2019 | 2018 | 2017 | |||||||||
(Thousands) | |||||||||||
Tax at statutory rate | $ | ( | ) | $ | ( | ) | $ | ||||
Federal tax law change | ( | ) | |||||||||
State income taxes | ( | ) | ( | ) | ( | ) | |||||
Valuation allowance | |||||||||||
Regulatory liability/asset | ( | ) | |||||||||
Federal tax credits | ( | ) | ( | ) | ( | ) | |||||
Goodwill impairment | |||||||||||
Other | ( | ) | |||||||||
Income tax benefit | $ | ( | ) | $ | ( | ) | $ | ( | ) | ||
Effective tax rate | % | % | ( | )% | |||||||
The Company's effective tax rate for the year ended December 31, 2019 was higher compared to the U.S. federal statutory rate due primarily to state income taxes and the release of the valuation allowance related to AMT sequestration, partly offset by valuation allowances that limit certain state tax benefits.
The Company's effective tax rate for the year ended December 31, 2018 was higher compared to the U.S. federal statutory rate due primarily to state income taxes. The Company recognized additional state tax benefit as a result of the 2018 Divestitures and the resulting shift in the Company's state apportionment in state taxing jurisdictions for natural gas and liquids sales as these sales shifted more heavily to lower taxed jurisdictions. The Company had no tax basis in the goodwill allocated to continuing operations that had been impaired in 2018.
The Company's effective tax rate for the year ended December 31, 2017 was lower compared to the U.S. federal statutory rate due primarily to the effect of the Tax Cuts and Jobs Act on the Company's net deferred tax liability, which was remeasured at the updated corporate tax rate of 21%. The effective tax rate was also lower compared to the U.S. federal statutory rate due to an increase in federal tax credits generated during 2017 as a result of $30.2 million of federal marginal well tax credits. The IRS notice supporting the calculation of the credit was not published until 2017 and, absent the IRS notice, the Company was unable to estimate the amount of this credit in 2016. As a result, $6.1 million of this credit recorded in 2017 related to 2016 activity.
For the year ended December 31, 2017, the Company realized $10.5 million of tax expense associated with Federal Energy Regulatory Commission (FERC) regulated assets as a result of the corporate tax rate reduction from the Tax Cuts and Jobs Act. Following the normalization rules of the Internal Revenue Code (IRC), this regulatory liability is amortized on a straight-line basis over the estimated remaining life of the related assets. This regulatory liability was transferred to Equitrans Midstream in connection with the Separation and Distribution and was included in discontinued operations.
83
The Company believes that it is more likely than not that the benefit from certain state NOL carryforwards and certain federal NOLs acquired in recent acquisitions will not be realized. A valuation allowance is required when it is more likely than not that all or a portion of a deferred tax asset will not be realized. All available evidence, both positive and negative, must be considered in determining the need for a valuation allowance. At December 31, 2019, 2018 and 2017, positive evidence considered included the reversals of financial-to-tax temporary differences, the implementation of and/or ability to employ various tax planning strategies and the estimation of future taxable income. Negative evidence considered included historical pre-tax book losses of the Company's former EQT Production business segment. A review of positive and negative evidence regarding these tax benefits resulted in the conclusion that valuation allowances for certain NOLs were warranted as it was more likely than not that the Company would not use them prior to expiration. Uncertainties such as future commodity prices can affect the Company's calculations and its ability to use these NOLs prior to expiration. Further, because of the Tax Cuts and Jobs Act, the Company recorded a valuation allowance against a deferred tax asset related to the interest expense limitation for separate company state income tax purposes and recorded a write-off of deferred tax assets related to certain executive incentive-based awards to be paid in a future year that will not be deductible.
During 2019, the Company recorded a partial valuation allowance against a deferred tax asset related to the unrealized loss recorded on its investment in Equitrans Midstream that it does not believe it will be able to utilize due to limitations imposed on capital losses. The Company has capital loss carryback capacity and provided a valuation allowance on the portion in excess of the carryback. Management will continue to assess the potential for realizing deferred tax assets based on the feasibility of future tax planning strategies and may record adjustments to the related valuation allowances in future periods that could materially impact net income.
The following table reconciles the beginning and ending amount of reserve for uncertain tax positions, excluding interest and penalties.
2019 | 2018 | 2017 | |||||||||
(Thousands) | |||||||||||
Balance at January 1 | $ | $ | $ | ||||||||
Additions for tax positions taken in current year | |||||||||||
Additions for tax positions taken in prior years | |||||||||||
Reductions for tax positions taken in prior years | ( | ) | ( | ) | ( | ) | |||||
Balance at December 31 | $ | $ | $ | ||||||||
Included in the balances above are unrecognized tax benefits of $150.9 million, $124.6 million and $120.5 million that, if recognized, would affect the effective tax rates as of December 31, 2019, 2018 and 2017, respectively. Also included in the balances above are uncertain tax positions of $113.7 million, $88.2 million, and $84.1 million for the years ended December 31, 2019, 2018 and 2017, respectively, that were recorded in the Consolidated Balance Sheets as a reduction of the related deferred tax asset for AMT and general business credit carryforwards and NOLs. The Company released $84 million of reserves and reinstated the related deferred tax asset for AMT during 2019 due to settlement of the 2013 amended return refund claim with the IRS. The state deferred tax asset was reduced for uncertain tax positions of approximately $0.3 million during the year ended December 31, 2017.
Included in the balances above are $0.7 million, $0.7 million and $4.7 million, as of December 31, 2019, 2018 and 2017, respectively, for tax positions for which the ultimate deductibility is highly certain but there is uncertainty about the timing of tax deductions. Any disallowance of the shorter deductibility period would accelerate the payment of cash taxes to an earlier period but would not affect the Company's annual effective tax rate.
The Company recognizes interest and penalties related to unrecognized tax benefits in income tax expense. The Company recorded interest and penalties of approximately $3.3 million, $3.4 million and $3.2 million for 2019, 2018 and 2017, respectively. Interest and penalties of $15.2 million, $11.9 million and $8.4 million were included in the Consolidated Balance Sheets at December 31, 2019, 2018 and 2017, respectively.
As of December 31, 2019, 2018 and 2017, the Company believed that, as a result of potential settlements with, or legal or administrative guidance by, relevant taxing authorities or the lapse of applicable statutes of limitation, it is reasonably possible that a decrease of $80.2 million, $33.3 million and $42.5 million, respectively, in unrecognized tax benefits related to federal tax positions may be necessary within twelve months.
The consolidated federal income tax liability of the Company has been settled with the IRS through 2009. The IRS has completed its review of the 2010, 2011 and 2012 tax years, and the Company is in the process of appealing its Research & Experimentation
84
(R&E) tax credit claim for such years. In addition, the Company has filed refund claims related to R&E and AMT preference adjustments for 2010 through 2013. The Company is under IRS audit for 2013 and agreed to a settlement related to a 2013 amended return refund claim in the fourth quarter of 2019. The Company is also the subject of various state income tax examinations. With few exceptions, as of December 31, 2019, the Company is no longer subject to state examinations by tax authorities for years before 2012.
There were no material changes to the Company's methodology for accounting for unrecognized tax benefits during 2019.
The following table summarizes the source and tax effects of temporary differences between financial reporting and tax bases of assets and liabilities.
December 31, | |||||||
2019 | 2018 | ||||||
(Thousands) | |||||||
Deferred income taxes: | |||||||
Total deferred income tax assets | $ | ( | ) | $ | ( | ) | |
Total deferred income tax liabilities | |||||||
Total net deferred income tax liabilities | |||||||
Total deferred income tax liabilities (assets): | |||||||
Drilling and development costs expensed for income tax reporting | |||||||
Tax depreciation in excess of book depreciation | |||||||
Investment in Equitrans Midstream | ( | ) | ( | ) | |||
Incentive compensation and deferred compensation plans | ( | ) | ( | ) | |||
Net operating loss carryforwards | ( | ) | ( | ) | |||
Alternative minimum tax credit carryforward | ( | ) | ( | ) | |||
Federal tax credits | ( | ) | ( | ) | |||
Unrealized gains (losses) | ( | ) | |||||
Interest disallowance limitation | ( | ) | ( | ) | |||
Other | ( | ) | ( | ) | |||
Total excluding valuation allowances | |||||||
Valuation allowances | |||||||
Total net deferred income tax liabilities | $ | $ | |||||
During 2019, net deferred tax liability decreased $337.6 million from 2018 due primarily to book impairments, which are included in drilling and development costs expensed for income tax reporting but are not currently deductible for tax purposes, and the Company's investment in Equitrans Midstream, partly offset by increased tax depreciation in excess of book depreciation.
As of December 31, 2019, the Company had a deferred tax asset of $218.8 million, net of valuation allowances of $22.8 million, related to tax benefits from federal NOL carryforwards expiring in 2037. Federal NOLs generated in 2018 and forward will carryforward indefinitely but will be limited to offset 80% of taxable income in each year. As of December 31, 2019, the Company had a deferred tax asset of $416.7 million, net of valuation allowances of $324.1 million, related to tax benefits from state NOL carryforwards with various expiration dates ranging from 2020 to 2039. Due to a decrease in state apportionment rates and impairment of assets, the Company will have less realizable NOL in future years and, as such, had to record a valuation allowance on its property, plant and equipment state deferred tax asset of $4.5 million in 2019. Additionally, for separate company state income tax reporting purposes, the Tax Cuts and Jobs Act interest deduction limitation resulted in a valuation allowance of $21.3 million recorded in 2019. In 2019, the Company incurred an unrealized loss on its investment in Equitrans Midstream. This investment is a capital asset for tax purposes and capital losses can only be utilized to offset a capital gain and are limited to being carried back three years and forward five years for potential utilization. Due to these limitations, the Company also recorded a valuation allowance on the deferred tax asset recorded for the retained stake of Equitrans Midstream of $42.4 million for separate company state income tax reporting purposes and $8.3 million for federal.
As of December 31, 2018, the Company had a deferred tax asset of $32.9 million, net of valuation allowances of $22.8 million, related to tax benefits from federal NOL carryforwards expiring in 2037 to 2038. As of December 31, 2018, the Company had a deferred tax asset of $94.7 million, net of valuation allowances of $279.5 million, related to tax benefits from state NOL
85
carryforwards with various expiration dates ranging from 2020 to 2037. In October 2017, Pennsylvania enacted a change in the limitation on Pennsylvania NOL utilization from 30% of taxable income to 35% of taxable income for tax years beginning in 2018 and 40% of taxable income for tax years beginning in 2019 and thereafter. However, due to the decrease in state apportionment rates, the Company will have less realizable NOL in future years. Additionally, the Tax Cuts and Jobs Act interest deduction limitation imposed for separate company state income tax reporting purposes resulted in a valuation allowance of $21.7 million. The Company also recorded a valuation allowance on the retained stake of Equitrans Midstream of $14 million for separate company state income tax reporting purposes. The Company reduced the valuation allowance on expected AMT credit refunds subject to federal sequestration to $13.3 million as a result of a change in estimate for the period ended December 31, 2018. As a result of an IRS announcement in January 2019 that reversed its position that AMT refunds were subject to sequestration by the federal government, the Company reversed the related valuation allowance in the first quarter of 2019.
As of December 31, 2017, the Company had a deferred tax asset of $130 million, net of valuation allowances of $217.0 million, related to tax benefits from state NOL carryforwards with various expiration dates ranging from 2028 to 2038.
For the year ended December 31, 2019, the Company recorded a $90.9 million adjustment to retained earnings and additional paid-in-capital related to the Separation and Distribution. The Separation and Distribution resulted in the recognition of a tax gain related to a pre-Separation transaction. Recognition occurred as a result of Equitrans Midstream exiting the Company's consolidated federal filing group. The gain amount reported in the tax return was different than the amount estimated in the 2018 financial statements; therefore, the Company recorded a return-to-provision adjustment in 2019. This adjustment impacts the amount of deferred taxes transferred to Equitrans Midstream as of the Separation and Distribution date of November 12, 2018.
10. Debt
December 31, 2019 | December 31, 2018 | ||||||||||||||||||||||
Principal Value | Carrying Value (a) | Fair Value (b) | Principal Value | Carrying Value (a) | Fair Value (b) | ||||||||||||||||||
(Thousands) | |||||||||||||||||||||||
Term Loan Facility due May 31, 2021 | $ | $ | $ | $ | — | $ | — | $ | — | ||||||||||||||
Senior notes: | |||||||||||||||||||||||
8.125% notes due June 1, 2019 | — | — | — | ||||||||||||||||||||
Floating rate notes due October 1, 2020 | |||||||||||||||||||||||
2.50% notes due October 1, 2020 | |||||||||||||||||||||||
8.81% to 9.00% series A due 2020 – 2021 | |||||||||||||||||||||||
4.875% notes due November 15, 2021 | |||||||||||||||||||||||
3.00% notes due October 1, 2022 | |||||||||||||||||||||||
7.42% series B due 2023 | |||||||||||||||||||||||
7.75% debentures due July 15, 2026 | |||||||||||||||||||||||
3.90% notes due October 1, 2027 | |||||||||||||||||||||||
Note payable to EQM | |||||||||||||||||||||||
Total debt | |||||||||||||||||||||||
Less: Current portion of debt (c) | |||||||||||||||||||||||
Long-term debt | $ | $ | $ | $ | $ | $ | |||||||||||||||||
(a) | For the note payable to EQM, the principal value represents the carrying value. For all other debt, the principal value less the unamortized debt issuance costs and debt discounts represents the carrying value. |
(b) | The carrying value of borrowings under the Company's Term Loan Facility approximates fair value as the interest rates are based on prevailing market rates; therefore, it is a Level 1 fair value measurement. For the note payable to EQM, fair value is measured using Level 3 inputs. For all other debt, fair value is measured using Level 2 inputs. |
(c) | The Floating Rate notes and |
Term Loan Facility. On May 31, 2019, the Company entered into a Term Loan Agreement (the Term Loan Agreement) providing for a $1.0 billion unsecured term loan facility (the Term Loan Facility) and borrowed $1.0 billion under the Term Loan Facility. The Company used the net proceeds to (i) repay $700 million aggregate principal amount of 8.125 % senior notes, (ii) repay
86
outstanding borrowings under the Company's $2.5 billion credit facility and (iii) pay accrued interest and fees and expenses related to the foregoing and the Term Loan Agreement. Remaining proceeds from the borrowing were used by the Company for general corporate purposes.
At the Company's election, the $1.0 billion in borrowings under the Term Loan Facility bear interest at a Eurodollar rate defined in the Term Loan Agreement plus a margin based on the Company's credit ratings. The Company may voluntarily prepay borrowings under the Term Loan Facility, in whole or in part, without premium or penalty, but subject to reimbursement of funding losses with respect to prepayment. Borrowings under the Term Loan Facility that are repaid may not be reborrowed. During the year ended December 31, 2019, the Company incurred interest on Term Loan Facility borrowings at a weighted average annual interest rate of 3.1 %. As a result of the Moody's, S&P and Fitch downgrades of the Company's senior notes credit rating (discussed in section "Security Ratings Events"), the margin on the Term Loan Facility borrowings increased from 1.00 % as of December 31, 2019 to 1.25 % as of February 26, 2020.
The Term Loan Agreement contains certain representations and warranties and various affirmative and negative covenants and events of default, including (i) a restriction on the ability of the Company or its subsidiaries to incur or permit liens on assets, subject to certain significant exceptions, (ii) the establishment of a maximum ratio of consolidated debt-to-total capital of the Company and its subsidiaries such that consolidated debt shall at no time exceed 65 % of total capital, (iii) a limitation on certain fundamental changes to the Company's business, (iv) a limitation on dividends that may be issued by the Company and (v) certain restrictions related to mergers or acquisitions.
Senior Notes. As of December 31, 2019, aggregate maturities for the Company's senior notes were $1,011 million in 2020, $1,774 million in 2021, $750 million in 2022, $10 million in 2023, $0 million in 2024 and $1,365 million thereafter. The indentures governing the Company's long-term indebtedness contain certain restrictive financial and operating covenants, including covenants that restrict, among other things, the Company's ability to incur, as applicable, indebtedness, incur liens, enter into sale and leaseback transactions, complete acquisitions, merge, sell assets and perform certain other corporate actions.
On January 21, 2020, the Company issued $1.0 billion aggregate principal amount of 6.125 % senior notes due February 1, 2025 and $750 million aggregate principal amount of 7.000 % senior notes due February 1, 2030 (together, the Adjustable Rate Notes). The Company used the net proceeds from the Adjustable Rate Notes to repay $500 million aggregate principal amount of the Company's floating rate notes and $500 million aggregate principal amount of the Company's 2.50 % senior notes and expects to use the remaining proceeds to repay or redeem other outstanding indebtedness. The Adjustable Rate Notes have covenants that are consistent with the Company's existing senior unsecured notes, with an additional interest rate adjustment provision that provides for adjustments to its interest rates based on credit ratings assigned by Moody's, S&P and Fitch to the Company's senior notes. As a result of the S&P and Fitch downgrades of the Company's senior notes credit rating (discussed in section "Security Ratings Events"), the interest rate on the 6.125 % senior notes increased to 6.875 % and the interest rate on the 7.000 % senior notes increased to 7.750 %.
On February 3, 2020, the Company's 2.50 % senior notes and floating rate notes, each due October 1, 2020, were fully redeemed by the Company at a redemption price of 100.446 % and 100 %, respectively, plus accrued but unpaid interest of $4.2 million and $1.2 million, respectively. This resulted in the payment of make whole call premiums of $2.2 million related to the 2.50 % senior notes.
On February 12, 2020, the Company announced its commencement of a cash tender offer (the Tender Offer) for up to $400 million aggregate principal amount of its 4.875 % senior notes due 2021 (the 4.875 % Notes). Consideration paid in the Tender Offer for the 4.875 % Notes that are validly tendered on or prior to March 2, 2020, and accepted for purchase by the Company, will be $1,020 per $1,000 principal amount, including an early tender premium of $30 per $1,000 principal amount. The settlement date for such notes is expected to be March 4, 2020. Consideration paid in the Tender Offer for the 4.875 % Notes that are validly tendered after March 2, 2020 and on or prior to March 16, 2020, and accepted for purchase by the Company, will be $990 per $1,000 principal amount. The settlement date for such notes is expected to be March 18, 2020. Payments for the 4.875 % Notes purchased will also include accrued and unpaid interest from, and including, the last interest payment date on the 4.875 % Notes up to, but not including, the applicable settlement date for such 4.875 % Notes accepted for purchase by the Company.
Note Payable to EQM. EQM owns a preferred interest in EQT Energy Supply, LLC (EES) that is accounted for as a note payable due to the terms of the operating agreement of EES. The fair value of the note payable to EQM is a Level 3 fair value measurement and is estimated using an income approach model using a market-based discount rate. Principal amounts due for the note payable to EQM are $5.0 million in 2020, $5.2 million in 2021, $5.5 million in 2022, $5.8 million in 2023, $6.3 million in 2024 and $82.3 million thereafter.
87
$2.5 Billion Facility. The Company has a $2.5 billion credit facility that expires in July 2022. The Company may request two one-year extensions of the expiration date, the approval of which is subject to satisfaction of certain conditions. The Company may, on a one-time basis, request that the lenders' commitments be increased to an aggregate of up to $3.0 billion, subject to certain terms and conditions. Each lender in the facility may decide if it will increase its commitment. The credit facility may be used for working capital, capital expenditures, share repurchases and any other lawful corporate purposes. The credit facility is underwritten by a syndicate of 19 financial institutions, each of which is obligated to fund its pro-rata portion of any borrowings by the Company.
Under the terms of the credit facility, the Company may obtain base rate loans or Eurodollar rate loans denominated in U.S. dollars. Base rate loans bear interest at a base rate plus a margin based on the Company's credit ratings. Eurodollar rate loans bear interest at a Eurodollar rate plus a margin based on the Company's credit ratings. As a result of the Moody's, S&P and Fitch downgrades of the Company's senior notes credit rating (discussed in section "Security Ratings Events"), the margin on base rate loans increased from 0.50 % as of December 31, 2019 to 0.75 % as of February 26, 2020 and the margin on Eurodollar rate loans increased from 1.50 % as of December 31, 2019 to 1.75 % as of February 26, 2020.
The Company is not required to maintain compensating bank balances. The Company's debt issuer credit ratings, as determined by Moody's, S&P or Fitch on its non-credit-enhanced, senior unsecured long-term debt, determine the level of fees associated with the credit facility in addition to the interest rate charged by the counterparties on any amounts borrowed against the credit facility; the lower the Company's debt credit rating, the higher the level of fees and borrowing rate.
The Company's credit facility contains various provisions that, if not complied with, could result in termination of the credit facility, require early payment of amounts outstanding or similar actions. The most significant covenants and events of default under the credit facility are the maintenance of a debt-to-total capitalization ratio and limitations on transactions with affiliates. The credit facility contains financial covenants that require a total debt-to-total capitalization ratio no greater than 65 %, the calculation of which excludes the effects of accumulated OCI. As of December 31, 2019, the Company was in compliance with all debt provisions and covenants.
The Company had $0.3 billion and $0.8 billion of borrowings outstanding under its credit facility as of December 31, 2019 and 2018, respectively. The Company had no letters of credit outstanding under its credit facility as of both December 31, 2019 and 2018. For each of the years ended December 31, 2019, 2018 and 2017, the Company incurred commitment fees of approximately 20 basis points on the undrawn portion of its credit facility to maintain credit availability. As of December 31, 2019, the Company had approximately $2.2 billion available under its credit facility.
For the years ended December 31, 2019, 2018 and 2017, the maximum amount of outstanding borrowings at any time under the credit facility was $1.1 billion, $1.6 billion and $1.4 billion, respectively, the average daily balance was approximately $340 million, $854 million and $191 million, respectively, and interest was incurred at weighted average annual interest rates of 3.8 %, 3.4 % and 2.8 %, respectively.
Security Ratings Events. As of December 31, 2019, the Company's senior notes were rated "Baa3" by Moody's, "BBB–" by S&P and "BBB–" by Fitch. In January 2020, Moody's downgraded the Company's senior notes credit rating to "Ba1," and, in February 2020, S&P and Fitch downgraded the Company's senior notes rating to "BB+" and "BB," respectively. As a result, certain of the Company's counterparties to its midstream services contracts requested additional assurances. As of February 26, 2020, these assurances were $0.6 billion in the aggregate, for which amount the Company posted letters of credit issued under its credit facility. The letters of credit do not increase the Company's total debt but instead represent a decrease to the Company's available borrowing capacity under the credit facility. In addition, the letters of credit are subject to a letters of credit fee based on the Company's credit ratings and a fronting fee.
As of February 26, 2020, the Company had sufficient unused borrowing capacity under its credit facility, net of letters of credit, to satisfy any requests for margin deposit or other collateral that its counterparties would be permitted to request of the Company pursuant to the Company's derivative instruments and midstream services contracts in the event that Moody's and S&P downgrade the Company's credit rating two categories further. As of February 26, 2020, such margin deposit or other collateral amounts could be up to approximately $1.4 billion, inclusive of assurances posted.
88
11. Common Stock
Shares of authorized and unissued EQT Common Stock were reserved as follows.
December 31, 2019 | ||
(Thousands) | ||
Possible future acquisitions | ||
Stock compensation plans | ||
Total | ||
The Company made no share repurchases in 2019.
During 2018, the Company repurchased 10,646,382 shares of EQT common stock at an average price of $50.62 , which included $0.02 for commission, pursuant to the Company's previously announced share repurchase programs. This exhausted the Company's share repurchase authorization under such programs.
In conjunction with the closing of the Rice Merger, on November 13, 2017 the Company issued approximately 91 million shares of EQT common stock to Rice Energy shareholders.
12. Changes in Accumulated OCI (Loss) by Component
The following table explains the changes in accumulated OCI (loss) by component.
Natural gas cash flow hedges, net of tax | Interest rate cash flow hedges, net of tax | Other postretirement benefits liability adjustment, net of tax | Accumulated OCI (loss), net of tax | ||||||||||||
(Thousands) | |||||||||||||||
December 31, 2016 | $ | $ | ( | ) | $ | ( | ) | $ | |||||||
(Gains) losses reclassified from accumulated OCI, net of tax | ( | ) | (a) | (a) | (b) | ( | ) | ||||||||
December 31, 2017 | ( | ) | ( | ) | ( | ) | |||||||||
(Gains) losses reclassified from accumulated OCI, net of tax | ( | ) | (a) | (a) | (b) | ( | ) | ||||||||
Distribution to Equitrans Midstream Corporation | |||||||||||||||
December 31, 2018 | ( | ) | ( | ) | ( | ) | |||||||||
Losses reclassified from accumulated OCI, net of tax | (a) | (b) | |||||||||||||
Change in accounting principle | ( | ) | (c) | ( | ) | ||||||||||
December 31, 2019 | $ | $ | $ | ( | ) | $ | ( | ) | |||||||
(a) | Losses (gains), net of tax related to natural gas cash flow hedges were reclassified from accumulated OCI into operating revenues. Losses, net of tax related to interest rate cash flow hedges were reclassified from accumulated OCI into interest expense. |
(b) | Noted accumulated OCI reclassification is attributable to the net actuarial loss and net prior service cost related to the Company's other postretirement benefits plan. See Note 1. |
(c) | Related to adoption of ASU 2018-02. See Note 1. |
89
13. Share-Based Compensation Plans
The following table summarizes the Company's share-based compensation expense.
Years Ended December 31, | |||||||||||
2019 | 2018 | 2017 | |||||||||
(Thousands) | |||||||||||
2015 Executive Performance Incentive Program | $ | $ | $ | ||||||||
2016 Incentive Performance Share Unit Program | |||||||||||
2017 Incentive Performance Share Unit Program | ( | ) | |||||||||
2018 Incentive Performance Share Unit Program | ( | ) | |||||||||
2019 Incentive Performance Share Unit Program | |||||||||||
2016 EQT Value Driver Performance Share Unit Award Program | |||||||||||
2017 EQT Value Driver Performance Share Unit Award Program | |||||||||||
2018 EQT Value Driver Performance Share Unit Award Program | ( | ) | |||||||||
2019 EQT Value Driver Performance Share Unit Award Program | |||||||||||
Restricted stock awards | |||||||||||
Non-qualified stock options | |||||||||||
Other programs, including non-employee director awards | |||||||||||
Less: Discontinued operations | ( | ) | ( | ) | |||||||
Total share-based compensation expense (a) | $ | $ | $ | ||||||||
(a) | For the year ended December 31, 2019, share-based compensation expense of $ |
In connection with the Separation in 2018, the Company transferred obligations related to then-outstanding share-based compensation awards to Equitrans Midstream. To preserve the aggregate fair value of awards held prior to the Separation, as measured immediately before and immediately after the Separation, each holder of share-based compensation awards generally received an adjusted award consisting of both a stock-based compensation award denominated in the Company equity and a stock-based compensation award denominated in Equitrans Midstream equity. These awards were adjusted in accordance with the basket method, which resulted in participants retaining one unit of the existing Company incentive award and receiving an additional 0.80 units of an Equitrans Midstream-based award.
The Company recognizes compensation cost related to unvested awards held by its employees, regardless of who settles the obligation. Upon vesting the Company is obligated to settle all outstanding share-based compensation awards denominated in the Company's equity, regardless of whether the holders are employees of the Company or Equitrans Midstream. Likewise, upon vesting, Equitrans Midstream is obligated to settle all of the outstanding share-based compensation awards denominated in its equity, regardless of whether the holders are employees of Equitrans Midstream or the Company. Changes in performance and number of outstanding awards can impact the ultimate amount of these obligations. Share counts for awards discussed herein represent outstanding shares to be remitted by the Company to its employees and employees of Equitrans Midstream. When an award has graduated vesting, the Company records expense equal to the vesting percentage on the vesting date.
The Company typically uses treasury stock to fund awards paid in stock, but the Company can elect to fund such awards by stock acquired by the Company in the open market or from any other person, issued directly by the Company or any combination of the foregoing.
There was no cash received from exercises under all share-based payment arrangements for employees and directors for the year ended December 31, 2019. Cash received from exercises under all share-based payment arrangements for employees and directors for the years ended December 31, 2018 and 2017 was $1.9 million and $0.2 million, respectively. During the years ended December 31, 2019, 2018 and 2017, share-based payment arrangements paid in stock generated tax benefits of $4.9 million, $13.4 million and $58.9 million, respectively.
90
Executive Performance Incentive Programs – Equity & Liability
The Management Development and Compensation Committee of the Company's Board of Directors (the Compensation Committee) has adopted:
• | the 2015 Executive Performance Incentive Plan (the 2015 Incentive PSU Program) under the 2014 Long-Term Incentive Plan (the 2014 LTIP); |
• | the 2016 Incentive Performance Share Unit Program (the 2016 Incentive PSU Program) under the 2014 LTIP; |
• | the 2017 Incentive Performance Share Unit Program (the 2017 Incentive PSU Program) under the 2014 LTIP; |
• | the 2018 Incentive Performance Share Unit Program (the 2018 Incentive PSU Program) under the 2014 LTIP; and |
• | the 2019 Incentive Performance Share Unit Program (the 2019 Incentive PSU Program) under the 2014 LTIP. |
The 2015 Incentive PSU Program, 2016 Incentive PSU Program, 2017 Incentive PSU Program, 2018 Incentive PSU Program and 2019 Incentive PSU Program are collectively referred to as the Incentive PSU Programs. The 2015 Incentive PSU Program and 2016 Incentive PSU Program granted equity awards. The 2017 Incentive PSU Program, 2018 Incentive PSU Program and 2019 Incentive PSU Program granted both equity and liability awards.
The Incentive PSU Programs were established to provide long-term incentive opportunities to key employees to further align their interests with those of the Company's shareholders and with the strategic objectives of the Company. The performance period for each of the awards under the Incentive PSU Programs is 36 months, with vesting occurring upon payment following the expiration of the performance period.
Executive performance incentive program awards granted in years 2015, 2016 and 2017 were earned based on:
• | the level of total shareholder return relative to a predefined peer group; and |
• | the cumulative total sales volume growth, in each case, over the performance period. |
Beginning with the 2018 Incentive PSU Program, awards granted are earned based on:
• | the level of total shareholder return relative to a predefined peer group; |
• | the level of operating and development cost improvement; and |
• | return on capital employed. |
The payout factor varies between zero and 300 % of the number of outstanding units contingent upon the performance metrics listed above. The Company recorded the 2015 Incentive PSU Program, the 2016 Incentive PSU Program and the portion of the 2017 Incentive PSU Program, 2018 Incentive PSU Program and 2019 Incentive PSU Program to be settled in stock as equity awards using a grant date fair value determined through a Monte Carlo simulation, which projected the share price for the Company and its peers at the end point of the performance period. The 2017 Incentive PSU Program, 2018 Incentive PSU Program and 2019 Incentive PSU Program also included awards to be settled in cash, which are recorded at fair value as of the measurement date determined through a Monte Carlo simulation, which projected the share price for the Company and its peers at the end point of the performance period. The expected share prices were generated using each company's annual volatility for the expected term and the commensurate three-year risk-free rate shown in the chart below for equity awards, one-year risk-free rate shown in the chart below for the 2018 Incentive PSU Program liability award and two-year risk-free rate shown in the chart below for the 2019 Incentive PSU Program liability award. As the Incentive PSU Programs include a performance condition that affects the number of shares that will ultimately vest, the Monte Carlo simulation computed either the grant date fair value for equity awards or the measurement date fair value for liability awards for each possible performance condition outcome on the grant date for equity awards or the measurement date for liability awards. The Company reevaluates the then-probable outcome at the end of each reporting period to record expense at the probable outcome grant date fair value or measurement date fair value, as applicable. Vesting of the units under each Incentive PSU Program occurs upon payment after the end of the performance period. More detailed information on each award is set forth in the table below.
91
Incentive PSU Program | Settled In | Accounting Treatment | Fair Value (a) | Risk-Free Rate | Vested/Payment Date | Awards Paid | Value (Millions) | Unvested/Expected Payment Date | Awards Outstanding as of December 31, 2019 (b) | ||||||
2015 | Stock | Equity | $ | February 2018 | $ | N/A | N/A | ||||||||
2016 | Stock | Equity | $ | February 2019 | $ | N/A | N/A | ||||||||
2017 (c) | Stock | Equity | $ | N/A | N/A | N/A | First Quarter of 2020 | ||||||||
2017 (d) | Cash | Liability | $ | N/A | N/A | N/A | N/A | First Quarter of 2020 | |||||||
2018 (e) | Stock | Equity | $ | N/A | N/A | N/A | First Quarter of 2021 | ||||||||
2018 (f) | Cash | Liability | $ | N/A | N/A | N/A | First Quarter of 2021 | ||||||||
2019 (g) | Stock | Equity | $ | N/A | N/A | N/A | First Quarter of 2022 | ||||||||
2019 (h) | Cash | Liability | $ | N/A | N/A | N/A | First Quarter of 2022 | ||||||||
(a) | Information for the valuation of the liability plans is shown as of December 31, 2019. |
(b) | Represents the number of outstanding units as of December 31, 2019 adjusted for forfeitures. The 2016 Incentive PSU Program settled in stock included |
(c) | As of January 1, 2019, |
(d) | As of January 1, 2019, |
(e) | As of January 1, 2019, |
(f) | As of January 1, 2019, |
(g) | A total of |
(h) | A total of |
The following table presents total capitalized compensation costs related to the Incentive PSU Programs.
Years Ended December 31, | |||||||||||
2019 | 2018 | 2017 | |||||||||
(Millions) | |||||||||||
2015 Incentive PSU Program | $ | $ | $ | ||||||||
2016 Incentive PSU Program | |||||||||||
2017 Incentive PSU Program (liability only) | ( | ) | |||||||||
2018 Incentive PSU Program (liability only) | ( | ) | |||||||||
2019 Incentive PSU Program (liability only) | |||||||||||
As of December 31, 2019, $0.2 million, $0.1 million and $1.2 million of unrecognized compensation cost (assuming no changes to the performance condition achievement level) related to the 2018 Incentive PSU Program – Liability, 2019 Incentive PSU Program – Equity and 2019 Incentive PSU Program – Liability, respectively, was expected to be recognized over the remainder of the performance periods. Assuming no changes to the performance condition achievement level, there is no remaining unrecognized compensation cost related to the 2018 Incentive PSU Program – Equity.
92
Fair value is estimated using a Monte Carlo simulation valuation method with the following weighted average assumptions:
Incentive PSU Programs Issued During the Years Ended December 31, | |||||||||||||||
2019 | 2019 | 2018 | 2018 | 2017 | 2017 | 2016 | 2015 | ||||||||
Accounting Treatment | Liability (a) | Equity | Liability (a) | Equity | Liability (b) | Equity | Equity | Equity | |||||||
Risk-free rate | N/A | ||||||||||||||
Dividend Yield (c) | N/A | N/A | N/A | N/A | N/A | N/A | N/A | N/A | |||||||
Volatility factor | N/A | ||||||||||||||
Expected term | N/A | ||||||||||||||
(a) | Information for the valuation of the liability plans is shown as of December 31, 2019. |
(b) | The 2017 Incentive PSU Program – Liability award fair value per unit is equal to EQT common stock price on the measurement date. |
(c) | Dividends paid from the beginning of the performance period will be cumulatively added as additional shares of common stock. |
Value Driver Award Programs
The Compensation Committee has also adopted:
• | the 2016 Value Driver Performance Share Unit Award Program (the 2016 EQT VDPSU Program) under the 2014 LTIP; |
• | the 2017 Value Driver Performance Share Unit Award Program (the 2017 EQT VDPSU Program) under the 2014 LTIP; |
• | the 2018 Value Driver Performance Share Unit Award Program (the 2018 EQT VDPSU Program) under the 2014 LTIP; and |
• | the 2019 Value Driver Performance Share Unit Award Program (the 2019 EQT VDPSU Program) under the 2014 LTIP. |
The 2016 EQT VDPSU Program, 2017 EQT VDPSU Program, 2018 EQT VDPSU Program and 2019 EQT VDPSU Program are collectively referred to as the VDPSU Programs.
The VDPSU Programs were established to align the interests of key employees with the interests of shareholders and customers and the strategic objectives of the Company. Under each VDPSU Program, 50 % of the confirmed awards vest upon payment following the first anniversary of the grant date; the remaining 50 % of the confirmed awards vest upon payment following the second anniversary of the grant date, subject to continued service through such date. Due to the graded vesting of each award under the VDPSU Programs, the Company recognized compensation cost over the requisite service period for each separately vesting tranche of the award as though each award was, in substance, multiple awards. The payments are contingent upon adjusted earnings before interest, income taxes, depreciation and amortization performance as compared to the Company's annual business plan and individual, business unit and Company value driver performance over the respective one-year periods. The following table provides additional detailed information on each award.
EQT VDPSU Program | Settled In | Accounting Treatment | Fair Value per Unit (a) | Vested/Payment Date | Number of awards (including accrued dividends) or cash paid (Millions) | Unvested/Expected Payment Date | Awards Outstanding (including accrued dividends) as of December 31, 2019 (b) | |||||
2016 (c) | Cash | Liability | $ | February 2017 | $ | N/A | N/A | |||||
$ | February 2018 | $ | N/A | N/A | ||||||||
2017 | Cash | Liability | $ | February 2018 | $ | N/A | N/A | |||||
$ | February 2019 | $ | N/A | N/A | ||||||||
2018 | Cash | Liability | $ | February 2019 | $ | N/A | N/A | |||||
$ | N/A | N/A | Second tranche first quarter of 2020 | |||||||||
2019 (d) | Cash | Liability | $ | N/A | N/A | First tranche first quarter of 2020 | ||||||
N/A | N/A | N/A | Second tranche first quarter of 2021 | |||||||||
93
(a) | For liability awards, the fair value per unit is equal to EQT common stock price on the measurement date. |
(b) | The 2017 EQT VDPSU Program and 2018 EQT VDPSU Program include |
(c) | In addition to the $ |
(d) | The total liability recorded for the 2019 EQT VDPSU Program was $ |
The following table presents total capitalized compensation costs related to the VDPSU Programs.
Years Ended December 31, | |||||||||||
2019 | 2018 | 2017 | |||||||||
(Millions) | |||||||||||
2016 EQT VDPSU Program | $ | $ | $ | ||||||||
2017 EQT VDPSU Program | |||||||||||
2018 EQT VDPSU Program | |||||||||||
2019 EQT VDPSU Program | |||||||||||
Restricted Stock Awards – Equity
The Company granted 613,440 , 145,540 and 85,350 restricted stock equity awards to key employees of the Company during the years ended December 31, 2019, 2018 and 2017, respectively. These restricted stock awards will be fully vested at the end of the three-year period commencing with the date of grant, assuming continued service through such date. For the years ended December 31, 2019, 2018 and 2017, the weighted average fair value of these restricted stock grants, based on the grant date fair value of EQT common stock, was approximately $17.42 , $54.33 and $63.00 , respectively.
In conjunction with the closing of the Rice Merger, the Company converted Rice Energy restricted stock equity awards and performance share equity awards to 2,290,234 Company restricted stock equity awards. Employees who were terminated on the Rice Merger closing date became immediately vested in their Company awards and received merger consideration cash of $5.30 per Rice Energy share. Company awards of those employees who continued employment with the Company under a transition agreement vest upon the earlier of the end of the vesting period set forth in the original award agreement or the end of the employee's employment period set forth in his or her transition agreement, in both cases subject to continued service through such date. Company awards of those employees who continued employment with the Company on an at-will basis vest in accordance with the vesting period set forth in the original award agreement, assuming continued service through such date. The fair value of these restricted stock grants, based on the grant date fair value of EQT common stock, was approximately $65.18 . See Note 8 for further discussion of the Rice Merger.
The total fair value of restricted stock awards vested during the years ended December 31, 2019, 2018 and 2017 was $11.9 million, $39.8 million and $123.0 million, respectively. The 2017 amount includes $13.0 million for the cash payment for the merger consideration of $5.30 per Rice Energy share.
As of December 31, 2019, $2.1 million of unrecognized compensation cost related to nonvested restricted stock equity awards was expected to be recognized over a remaining weighted average vesting term of approximately 2.1 years.
The following table summarizes restricted stock equity award activity as of December 31, 2019.
Restricted Stock | Nonvested Shares (a) | Weighted Average Fair Value | Aggregate Fair Value | ||||||||
Outstanding at January 1, 2019 | $ | $ | |||||||||
Granted | |||||||||||
Vested | ( | ) | ( | ) | |||||||
Forfeited | ( | ) | ( | ) | |||||||
Outstanding at December 31, 2019 | $ | $ | |||||||||
(a) | Nonvested shares outstanding at December 31, 2019 included |
94
Restricted Stock Unit Awards – Liability
During the years ended December 31, 2019, 2018, and 2017, the Company granted 686,350 , 373,750 , and 292,400 restricted stock unit liability awards, respectively, to key employees of the Company that will be paid in cash. Adjusting for forfeitures, there were 741,819 awards outstanding as of December 31, 2019. Because these awards are liability awards, the Company records compensation expense based on the fair value of the awards as remeasured at the end of each reporting period. The restricted units granted will be fully vested at the end of the three-year period commencing with the date of grant, assuming continued service through such date. The total liability recorded for these restricted units was $4.4 million, $6.9 million, and $8.8 million as of December 31, 2019, 2018, and 2017, respectively.
Non-Qualified Stock Options
The fair value of the Company's option grants was estimated at the dates of grant using a Black-Scholes option-pricing model with the assumptions indicated in the table below for the years ended December 31, 2019, 2018 and 2017. The risk-free rate for periods within the contractual life of the option is based on the U.S. Treasury yield curve in effect at the date of grant. The dividend yield is based on the dividend yield of EQT common stock at the time of grant. Expected volatilities are based on historical volatility of EQT common stock. The expected term represents the period of time that options granted are expected to be outstanding based on historical option exercise experience.
Years Ended December 31, | |||||||||||
2019 (a) | 2018 | 2017 (a) | |||||||||
Risk-free interest rate | % | % | % | ||||||||
Dividend yield | % | % | % | ||||||||
Volatility factor | % | % | % | ||||||||
Expected term | |||||||||||
Number of Options Granted | |||||||||||
Weighted Average Grant Date Fair Value | $ | $ | $ | ||||||||
Total Intrinsic Value of Options Exercised (Millions) | $ | $ | $ | ||||||||
(a) | There were |
As of December 31, 2019, $0.1 million of unrecognized compensation cost related to outstanding nonvested stock options was expected to be recognized by December 31, 2020.
The following table summarizes option activity as of December 31, 2019.
Non-Qualified Stock Options | Shares | Weighted Average Exercise Price | Weighted Average Remaining Contractual Term | Aggregate Intrinsic Value | |||||||||
Outstanding at January 1, 2019 | $ | ||||||||||||
Granted | |||||||||||||
Outstanding at December 31, 2019 | $ | $ | |||||||||||
Exercisable at December 31, 2019 | $ | $ | |||||||||||
Non-employee Directors' Share-Based Awards
Prior to 2020, the Company historically granted to EQT non-employee directors share-based awards that vest upon grant. The share-based awards are paid in cash or EQT common stock following a directors' termination of service on the Company's Board of Directors. Beginning in 2020, the Company grants to EQT non-employee directors restricted stock unit awards that vest on the date of the Company's annual meeting of shareholders immediately following the grant of such awards. The restricted stock unit awards are settled in EQT common stock on the vesting date or, if elected by the director, following a director's termination of service on the Company's Board of Directors. Awards to be paid in cash are accounted for as liability awards and, as such, compensation expense is recorded based on the fair value of the awards as remeasured at the end of each reporting period. Awards to be settled in EQT common stock are accounted for as equity awards and, as such, compensation expense is recorded based on the fair value of the awards at the grant date fair value. A total of 259,443 non-employee director share-based awards, including
95
accrued dividends, were outstanding as of December 31, 2019. A total of 146,790 , 50,979 and 26,090 share-based awards were granted to non-employee directors during the years ended December 31, 2019, 2018 and 2017, respectively. The weighted average fair value of these grants, based on the closing EQT common stock price on the business day prior to the grant date, was $18.11 , $52.65 and $65.35 for the years ended December 31, 2019, 2018 and 2017, respectively.
14. Concentrations of Credit Risk
Revenues and related accounts receivable from the Company's operations are generated primarily from the sale of produced natural gas, NGLs and oil to marketers, utilities and industrial customers located in the Appalachian Basin and in markets that are accessible through the Company's transportation portfolio, which includes markets in the Gulf Coast, Midwest and Northeast United States and Canada. The Company also contracts with certain processors to market a portion of NGLs on behalf of the Company. No single customer accounted for more than 10% of the Company's revenues for 2019, 2018 and 2017.
Approximately 62 % and 64 % of the Company's accounts receivable balances as of December 31, 2019 and 2018, respectively, represent amounts due from non-end users. The Company manages the credit risk of sales to non-end users by limiting its dealings with only non-end users that meet the Company's criteria for credit and liquidity strength and by regularly monitoring these accounts. The Company may require letters of credit, guarantees, performance bonds or other credit enhancements from a non-end user for that non-end user to meet the Company's credit criteria. The Company did not experience any significant defaults on sales of natural gas to non-end users during the years ended December 31, 2019, 2018 or 2017.
The Company is exposed to credit loss in the event of nonperformance by counterparties to its derivative contracts. This credit exposure is limited to derivative contracts with a positive fair value, which may change as market prices change. The Company's OTC derivative instruments are primarily with financial institutions and, thus, are subject to events that would impact those companies individually as well as the financial industry as a whole. The Company uses various processes and analyses to monitor and evaluate its credit risk exposures, including monitoring current market conditions and counterparty credit fundamentals. Credit exposure is controlled through credit approvals and limits based on counterparty credit fundamentals. To manage the level of credit risk, the Company enters into transactions primarily with financial counterparties that are of investment grade, enters into netting agreements whenever possible and may obtain collateral or other security.
15. Leases
The Company leases drilling rigs, facilities and other equipment. As discussed in Note 1, the Company adopted ASU 2016-02, ASU 2018-11 and ASU 2019-01 on January 1, 2019 using the optional transition method of adoption. The Company elected a package of practical expedients that together allows an entity to not reassess whether a contract is or contains a lease, lease classification and initial direct lease costs. In addition, the Company elected the following practical expedients: (i) to not reassess certain land easements, (ii) to not apply the recognition requirements under the standard to short-term leases and (iii) to combine and account for lease and nonlease contract components as a lease, where fixed nonlease payments are capitalized to the Consolidated Balance Sheet and variable nonlease payments are recognized as variable lease expense in the Statement of Consolidated Operations. Nonlease payments include payments for property taxes and other operating and maintenance expenses incurred by the lessor but paid by the Company pursuant to the lease contract.
On January 1, 2019, the Company recorded in its Consolidated Balance Sheet a total of $89.0 million in right-of-use assets and corresponding lease liabilities, representing the present value of its future lease payments. Adoption of the lease standards did not require an adjustment to the opening balance of retained earnings. The discount rate used to determine present value was based on the rate of interest that the Company estimated it would have to pay to borrow, on a collateralized-basis over a similar term, an amount equal to the lease payments in a similar economic environment as of January 1, 2019. The Company reassess the discount rate for new and modified lease contracts as of the lease effective date.
The right-of-use assets and lease liabilities recognized upon adoption of lease standards were based on lease classifications, commitment amounts and terms determined under the prior lease accounting guidance. Leases with an initial term of twelve months or less are considered short-term leases and are not recorded in the Consolidated Balance Sheet. Certain of the Company's lease contracts have multiple renewal periods at the Company's option; if a renewal period option is reasonably assured to be
96
exercised, the associated operating lease payments are included in the present value of future operating lease payments. As of December 31, 2019, the Company had no finance leases and was not a lessor.
The following table summarizes the Company's lease costs.
Year Ended December 31, 2019 | |||
(Thousands) | |||
Operating lease costs | $ | ||
Variable lease costs (a) | |||
Total lease costs (b) | $ | ||
(a) | Includes short-term lease costs. |
(b) | Includes drilling rig lease costs capitalized to property, plant and equipment of $ |
For the year ended December 31, 2019, cash paid for operating lease liabilities, and reported in cash flows provided by operating activities on the Statement of Consolidated Cash Flows, was $10.8 million. During the year ended December 31, 2019, the Company recorded $24.3 million of right-of-use assets in exchange for new lease liabilities.
The operating lease right-of-use assets were recorded in other assets and the current and noncurrent portions of the operating lease liabilities were recorded in other current liabilities and other liabilities and credits, respectively, on the Consolidated Balance Sheet. As of December 31, 2019, the operating right-of-use assets were $52.2 million and operating lease liabilities were $59.0 million, of which $29.0 million was classified as current. As of December 31, 2019, the weighted average remaining lease term was 3.3 years and the weighted average discount rate was 3.3 %.
The following table summarizes undiscounted future cash flows owed by the Company to lessors pursuant to lease contracts in effect as of December 31, 2019.
December 31, 2019 | |||
(Thousands) | |||
2020 | $ | ||
2021 | |||
2022 | |||
2023 | |||
2024 | |||
Thereafter | |||
Total lease payments | |||
Less: Interest | ( | ) | |
Present value of lease liabilities | $ | ||
16. Commitments and Contingencies
The Company has commitments for demand charges under existing long-term contracts and binding precedent agreements with various pipelines as well as commitments for processing capacity. Aggregate future payments for these items as of December 31, 2019 were $22.5 billion, composed of $1.4 billion in 2020, $1.8 billion in 2021, $1.8 billion in 2022, $1.7 billion in 2023, $1.7 billion in 2024 and $14.1 billion thereafter. The Company also has commitments to purchase equipment, materials, frac sand for use as a proppant in its hydraulic fracturing operations and minimum volume commitments associated with certain water agreements. As of December 31, 2019, future commitments under these contracts were $104.3 million in 2020, $36.8 million in 2021 and $2.0 million in 2022.
See Note 15 for a summary of undiscounted future cash flows owed by the Company as lessee to lessors pursuant to contractual agreements in effect as of December 31, 2019.
Conditioned upon the credit ratings assigned by Moody's, S&P and Fitch to the Company's senior notes, counterparties to the Company's derivative and midstream services contracts may request additional assurances of the Company, including collateral. In January 2020, Moody's downgraded the Company's senior notes credit rating to "Ba1," and, in February 2020, S&P and Fitch
97
downgraded the Company's senior notes rating to "BB+" and "BB," respectively. See Note 10 for a discussion of the effects of the downgrades on the Company's financial statements subsequent to December 31, 2019, including collateral posted as of February 26, 2020. See Note 4 for a discussion of what is deemed investment grade and other factors affecting margin deposit requirements on the Company's derivative contracts.
In the ordinary course of business, various legal and regulatory claims and proceedings are pending or threatened against the Company. While the amounts claimed may be substantial, the Company is unable to predict with certainty the ultimate outcome of such claims and proceedings. The Company accrues legal and other direct costs related to loss contingencies when actually incurred. The Company has established reserves it believes to be appropriate for pending matters and, after consultation with counsel and giving appropriate consideration to available insurance, the Company believes that the ultimate outcome of any matter currently pending against the Company will not materially affect the financial position, results of operations or liquidity of the Company.
The Company is subject to various federal, state and local environmental and environmentally-related laws and regulations. These laws and regulations, which are constantly changing, can require expenditures for remediation and may result in the assessment of fines. The Company has established procedures for ongoing evaluation of its operations to identify potential environmental exposures and to assure compliance with regulatory policies and procedures. The estimated costs associated with identified situations that require remedial action are accrued. Ongoing expenditures for compliance with environmental laws and regulations, including investments in plant and facilities to meet environmental requirements, have not been material. Management believes that any such required expenditures will not be significantly different in either their nature or amount in the future and does not know of any environmental liabilities that will have a material effect on the Company's financial position, results of operations or liquidity. The Company has identified situations that require remedial action for which approximately $12.1 million was recorded in other liabilities and credits in the Consolidated Balance Sheet as of December 31, 2019.
17. Guarantees
In connection with the sale of its NORESCO domestic operations in 2005, the Company agreed to maintain in-place guarantees of certain warranty obligations of NORESCO. The savings guarantees provided that, once an energy-efficiency construction project was completed by NORESCO, the customer would experience a certain dollar amount of energy savings over a number of years. The undiscounted maximum aggregate payments that may be due related to these guarantees were approximately $58 million as of December 31, 2019, extending at a decreasing amount for approximately 9 years.
This guarantee is exempt from ASC Topic 460, Guarantees. The Company considers the likelihood that it will be required to perform on these arrangements to be remote and expects any potential payments to be immaterial to the Company's financial position, results of operations and liquidity. As such, the Company has not recorded any liabilities related to this guarantee in its Consolidated Balance Sheets.
18. The Equitrans Share Exchange
On February 26, 2020, the Company entered into share purchase agreements with Equitrans Midstream to sell approximately 50 % of the Company's equity interest in Equitrans Midstream to Equitrans Midstream (the Equitrans Share Exchange) in exchange for a combination of cash and fee relief under the Company's gathering agreements with EQM. The Company currently owns approximately 19.9 % of the outstanding shares of Equitrans Midstream's common stock; following the closing of the Equitrans Share Exchange, the Company will own approximately 9.95 % of the outstanding shares of Equitrans Midstream's common stock.
98
19. Interim Financial Information (Unaudited)
The following summary of quarterly operating results reflects variations from various factors, including the volatility of natural gas commodity prices, impairments, the Separation and Distribution and the 2018 Divestitures. Quarterly operating results for the year ended December 31, 2018 have been recast to reflect the presentation of discontinued operations described in Note 2.
Three Months Ended | |||||||||||||||
March 31 | June 30 | September 30 | December 31 | ||||||||||||
2019 | (Thousands, except per share amounts) | ||||||||||||||
Total operating revenues | $ | $ | $ | $ | |||||||||||
Operating income (loss) | ( | ) | ( | ) | |||||||||||
Net income (loss) attributable to EQT Corporation (a) | ( | ) | ( | ) | |||||||||||
Earnings per share of common stock attributable to EQT Corporation: | |||||||||||||||
Basic and diluted net income (loss) (b) | $ | $ | $ | ( | ) | $ | ( | ) | |||||||
2018 | |||||||||||||||
Total operating revenues | $ | $ | $ | $ | |||||||||||
Operating loss | ( | ) | ( | ) | ( | ) | ( | ) | |||||||
Amounts attributable to EQT Corporation: | |||||||||||||||
Loss from continuing operations | $ | ( | ) | $ | ( | ) | $ | ( | ) | $ | ( | ) | |||
(Loss) income from discontinued operations, net of tax | ( | ) | ( | ) | |||||||||||
Net (loss) income attributable to EQT Corporation | $ | ( | ) | $ | $ | ( | ) | $ | ( | ) | |||||
Earnings per share of common stock attributable to EQT Corporation: | |||||||||||||||
Basic and diluted: | |||||||||||||||
Loss from continuing operations | $ | ( | ) | $ | ( | ) | $ | ( | ) | $ | ( | ) | |||
(Loss) income from discontinued operations | ( | ) | ( | ) | |||||||||||
Net (loss) income | $ | ( | ) | $ | $ | ( | ) | $ | ( | ) | |||||
(a) | Includes impairment of long-lived assets of $ |
(b) |
99
20. Natural Gas Producing Activities (Unaudited)
The following supplementary information summarized presents the results of natural gas and oil activities in accordance with the successful efforts method of accounting for production activities.
Production Costs
The following tables present total aggregate capitalized costs and costs incurred related to natural gas, NGLs and oil production activities.
Years Ended December 31, | |||||||||||
2019 | 2018 | 2017 | |||||||||
(Thousands) | |||||||||||
Capitalized costs | |||||||||||
Proved properties | $ | $ | $ | ||||||||
Unproved properties | |||||||||||
Total capitalized costs | |||||||||||
Less: Accumulated depreciation and depletion | |||||||||||
Net capitalized costs | $ | $ | $ | ||||||||
Years Ended December 31, | |||||||||||
2019 | 2018 | 2017 | |||||||||
(Thousands) | |||||||||||
Costs incurred (a) | |||||||||||
Property acquisition: | |||||||||||
Proved properties (b) | $ | $ | $ | ||||||||
Unproved properties (c) | |||||||||||
Exploration (d) | |||||||||||
Development | |||||||||||
(a) | Amounts exclude capital expenditures for facilities and information technology. |
(b) | Amounts in 2018 include $ |
(c) | Amounts in 2017 include $ |
(d) | Amounts include capitalizable exploratory costs and exploration expense, excluding impairments. |
100
Results of Operations for Producing Activities
The following table presents the results of operations related to natural gas, NGLs and oil production.
Years Ended December 31, | |||||||||||
2019 | 2018 | 2017 | |||||||||
(Thousands) | |||||||||||
Sales of natural gas, NGLs and oil | $ | $ | $ | ||||||||
Transportation and processing | |||||||||||
Production | |||||||||||
Exploration | |||||||||||
Depreciation and depletion | |||||||||||
Impairment/loss on sale/exchange of long-lived assets | |||||||||||
Impairment and expiration of leases | |||||||||||
Income tax (benefit) expense | ( | ) | ( | ) | |||||||
Results of operations from producing activities, excluding corporate overhead | $ | ( | ) | $ | ( | ) | $ | ||||
Reserve Information
Proved developed reserves represent only those reserves expected to be recovered from existing wells and support equipment. Proved undeveloped reserves represent proved reserves expected to be recovered from new wells after substantial development costs are incurred.
The Company's estimate of proved natural gas, NGLs and crude oil reserves was prepared by Company engineers. The engineer primarily responsible for overseeing the preparation of the reserves estimate holds a bachelor's degree in chemical engineering from Michigan Technological University, a master's degree in chemical engineering from Colorado State University and an executive master of business administration in energy from the University of Oklahoma and has 19 years of experience in the oil and gas industry. To support the accurate and timely preparation and disclosure of its reserve estimates, the Company established internal controls over its reserve estimation processes and procedures, including the following: the price, heat content conversion rate and cost assumptions used in the economic model to determine the reserves are reviewed by management; division of interest and production volumes are reconciled between the system used to calculate the reserves and other accounting/measurement systems; the reserves reconciliation between prior year reserves and current year reserves is reviewed by senior management; and the estimates of proved natural gas, NGLs and crude oil reserves are audited by Ryder Scott Company, L.P. (Ryder Scott), an independent consulting firm hired by management. Since 1937, Ryder Scott has evaluated oil and gas properties and independently certified petroleum reserves quantities in the United States and internationally. There were no differences between the internally prepared and externally audited estimates.
In the course of its audit, Ryder Scott reviewed 100 % of the total net natural gas, NGLs and oil proved reserves attributable to the Company's interests as of December 31, 2019. Ryder Scott conducted a detailed, well-by-well, audit of the Company's largest properties. For undeveloped locations, the Company determined, and Ryder Scott reviewed and approved, the areas within its acreage that the Company considered proven. Reserves were assigned and projected by the Company's reserve engineers for locations within these proven areas and approved by Ryder Scott based on offset production information and analogous type curves. In cases where historical production and pressure data was available and considered definitive, performance methods, including decline curve analysis, were used. Approximately 94 % of the proved developed reserves attributable to producing wells or reserves that Ryder Scott reviewed were estimated using performance methods. The remaining 6 % of those proved developed reserves were estimated by analogy, which calculates reserves based on correlation to comparable surrounding wells. All of the Company's proved reserves are located in the United States.
101
For all tables presented, NGLs and oil were converted at a rate of one Mbbl to approximately six million cubic feet (MMcf).
Years Ended December 31, | ||||||||
2019 | 2018 | 2017 | ||||||
(MMcf) | ||||||||
Natural gas, NGLs and oil | ||||||||
Proved developed and undeveloped reserves: | ||||||||
Balance at January 1 | ||||||||
Revision of previous estimates | ( | ) | ( | ) | ( | ) | ||
Purchase of hydrocarbons in place | ||||||||
Sale of hydrocarbons in place | ( | ) | ( | ) | ||||
Extensions, discoveries and other additions | ||||||||
Production | ( | ) | ( | ) | ( | ) | ||
Balance at December 31 | ||||||||
Proved developed reserves: | ||||||||
Balance at January 1 | ||||||||
Balance at December 31 | ||||||||
Proved undeveloped reserves: | ||||||||
Balance at January 1 | ||||||||
Balance at December 31 | ||||||||
Years Ended December 31, | ||||||||
2019 | 2018 | 2017 | ||||||
(MMcf) | ||||||||
Natural gas | ||||||||
Proved developed and undeveloped reserves: | ||||||||
Balance at January 1 | ||||||||
Revision of previous estimates | ( | ) | ( | ) | ( | ) | ||
Purchase of natural gas in place | ||||||||
Sale of natural gas in place | ( | ) | ( | ) | ||||
Extensions, discoveries and other additions | ||||||||
Production | ( | ) | ( | ) | ( | ) | ||
Balance at December 31 | ||||||||
Proved developed reserves: | ||||||||
Balance at January 1 | ||||||||
Balance at December 31 | ||||||||
Proved undeveloped reserves: | ||||||||
Balance at January 1 | ||||||||
Balance at December 31 | ||||||||
102
Years Ended December 31, | ||||||||
2019 | 2018 | 2017 | ||||||
(Mbbl) | ||||||||
NGLs | ||||||||
Proved developed and undeveloped reserves: | ||||||||
Balance at January 1 | ||||||||
Revision of previous estimates | ( | ) | ( | ) | ( | ) | ||
Purchase of NGLs in place | ||||||||
Sale of NGLs in place | ( | ) | ( | ) | ||||
Extensions, discoveries and other additions | ||||||||
Production | ( | ) | ( | ) | ( | ) | ||
Balance at December 31 | ||||||||
Proved developed reserves: | ||||||||
Balance at January 1 | ||||||||
Balance at December 31 | ||||||||
Proved undeveloped reserves: | ||||||||
Balance at January 1 | ||||||||
Balance at December 31 | ||||||||
Years Ended December 31, | ||||||||
2019 | 2018 | 2017 | ||||||
(Mbbl) | ||||||||
Oil | ||||||||
Proved developed and undeveloped reserves: | ||||||||
Balance at January 1 | ||||||||
Revision of previous estimates | ( | ) | ||||||
Purchase of oil in place | ||||||||
Sale of oil in place | ( | ) | ( | ) | ||||
Extensions, discoveries and other additions | ||||||||
Production | ( | ) | ( | ) | ( | ) | ||
Balance at December 31 | ||||||||
Proved developed reserves: | ||||||||
Balance at January 1 | ||||||||
Balance at December 31 | ||||||||
Proved undeveloped reserves: | ||||||||
Balance at January 1 | ||||||||
Balance at December 31 | ||||||||
The change in reserves during the year ended December 31, 2019 resulted from the following:
• | Conversions into |
• | Extensions, discoveries and other additions of |
• | Negative revisions of |
103
reserves that are now outside the Company's substantially revised five-year capital allocation program for purposes of the Company's reserves calculations and (ii) executing new development sequencing processes that will result in increased probable-to-proved developed conversion.
The change in reserves during the year ended December 31, 2018 resulted from the following:
• | Conversions into |
• | Extensions, discoveries and other additions of |
• | Negative revisions of |
• | Upward revisions of |
• | Sale of hydrocarbons in place of |
The change in reserves during the year ended December 31, 2017 resulted from the following:
• | Conversions into |
• | Increase of |
• | Extensions, discoveries and other additions of |
• | Negative revisions of |
• | Upward revisions of |
• | Upward revisions of |
Standard Measure of Discounted Future Cash Flow
Management cautions that the standard measure of discounted future cash flows should not be viewed as an indication of the fair market value of natural gas and oil producing properties, nor of the future cash flows expected to be generated therefrom. The information presented does not give recognition to future changes in estimated reserves, selling prices or costs and has been discounted at a rate of 10 %.
104
The following table summarizes estimated future net cash flows from natural gas and crude oil reserves.
December 31, | |||||||||||
2019 | 2018 | 2017 | |||||||||
(Thousands) | |||||||||||
Future cash inflows (a) | $ | $ | $ | ||||||||
Future production costs (b) | ( | ) | ( | ) | ( | ) | |||||
Future development costs | ( | ) | ( | ) | ( | ) | |||||
Future income tax expenses | ( | ) | ( | ) | ( | ) | |||||
Future net cash flow | |||||||||||
10% annual discount for estimated timing of cash flows | ( | ) | ( | ) | ( | ) | |||||
Standardized measure of discounted future net cash flows | $ | $ | $ | ||||||||
(a) | The majority of the Company's production is sold through liquid trading points on interstate pipelines. |
For 2019, reserves were computed using average first-day-of-the-month closing prices for the prior twelve months of $55.69 per Bbl for WTI less regional adjustments of $14.26 per Bbl, or $41.43 per Bbl, and $2.58 per MMBtu for NYMEX less regional adjustments of $0.29 per MMBtu, or $2.41 per Mcf. Regional adjustments were calculated using historical average realized prices received by the Company in the Appalachian Basin. For 2019, NGL pricing using average first-day-of-the-month closing prices for the prior twelve months for NGL components, adjusted using the regional component makeup of proved NGLs, resulted in a price of $16.81 per Bbl.
For 2018, reserves were computed using average first-day-of-the-month closing prices for the prior twelve months of $65.56 per Bbl for WTI less regional adjustments, $2.888 per Dth for Columbia Gas Transmission Corp., $2.568 per Dth for Dominion Transmission, Inc., $2.587 per Dth for Texas Eastern Transmission Corp., $2.320 per Dth for the Tennessee, zone 4-300 Leg of Tennessee Gas Pipeline Company and $2.939 per Dth for the Rockies Express Pipeline Zone 3. For 2018, NGL pricing using average first-day-of-the-month closing prices for the prior twelve months for NGL components, adjusted using the regional component makeup of produced NGLs, resulted in prices of $21.93 per Bbl from certain West Virginia Marcellus reserves and $33.89 per Bbl from Ohio Utica reserves.
For 2017, reserves were computed using average first-day-of-the-month closing prices for the prior twelve months of $51.34 per Bbl for WTI less regional adjustments, $2.801 per Dth for Columbia Gas Transmission Corp., $2.100 per Dth for Dominion Transmission, Inc., $2.914 per Dth for the East Tennessee Natural Gas Pipeline, $2.058 per Dth for Texas Eastern Transmission Corp., $1.995 per Dth for the Tennessee, zone 4-300 Leg of Tennessee Gas Pipeline Company, $2.321 per Dth for the Tennessee LA 500 Leg of Tennessee Gas Pipeline Company, $2.665 per Dth for Waha and $2.840 per Dth for the Rockies Express Pipeline Zone 3. For 2017, NGL pricing using average first-day-of-the-month closing prices for the prior twelve months for NGL components, adjusted using the regional component makeup of produced NGLs, resulted in prices of $23.07 per Bbl from certain West Virginia Marcellus reserves, $31.11 per Bbl from certain Kentucky reserves, $29.47 per Bbl from Ohio Utica reserves and $27.93 per Bbl from Permian reserves.
(b) | Includes approximately $ |
Holding production and development costs constant, a change in price of $0.10 per Dth for natural gas, $10 per barrel for NGLs and $10 per barrel for oil would result in a change in the December 31, 2019 discounted future net cash flows before income taxes of the Company's proved reserves of approximately $809 million, $163 million and $24 million, respectively.
105
The following table summarizes the changes in the standardized measure of discounted future net cash flows.
Years Ended December 31, | |||||||||||
2019 | 2018 | 2017 | |||||||||
(Thousands) | |||||||||||
Net sales and transfers of natural gas and oil produced | $ | ( | ) | $ | ( | ) | $ | ( | ) | ||
Net changes in prices, production and development costs | ( | ) | |||||||||
Extensions, discoveries and improved recovery, net of related costs | |||||||||||
Development costs incurred | |||||||||||
Net purchase of minerals in place | |||||||||||
Net sale of minerals in place | ( | ) | ( | ) | |||||||
Revisions of previous quantity estimates | ( | ) | ( | ) | ( | ) | |||||
Accretion of discount | |||||||||||
Net change in income taxes | ( | ) | ( | ) | |||||||
Timing and other (a) | |||||||||||
Net (decrease) increase | ( | ) | |||||||||
Balance at January 1 | |||||||||||
Balance at December 31 | $ | $ | $ | ||||||||
(a) | Timing and other for the year ended December 31, 2017 was primarily driven by timing changes to the Company's development plan as a result of the Rice Merger described in Note 8. |
Item 9. Changes in and Disagreements with Accountants on Accounting and Financial Disclosure
Not applicable.
Item 9A. Controls and Procedures
Evaluation of Disclosure Controls and Procedures
Under the supervision and with the participation of management, including the Company's Principal Executive Officer and Principal Financial Officer, an evaluation of the Company's disclosure controls and procedures (as defined in Rule 13a-15(e) under the Securities Exchange Act of 1934, as amended (Exchange Act)) was conducted as of the end of the period covered by this report. Based on that evaluation, the Principal Executive Officer and Principal Financial Officer concluded that the Company's disclosure controls and procedures were effective as of the end of the period covered by this report.
Management's Report on Internal Control over Financial Reporting
The Company's management is responsible for establishing and maintaining adequate internal control over financial reporting (as such term is defined in Rule 13a-15(f) under the Exchange Act). The Company's internal control system is designed to provide reasonable assurance to the Company's management and Board of Directors regarding the reliability of financial reporting and the preparation of financial statements for external purposes in accordance with generally accepted accounting principles. All internal control systems, no matter how well designed, have inherent limitations. Accordingly, even effective controls can provide only reasonable assurance with respect to financial statement preparation and presentation.
The Company's management assessed the effectiveness of the Company's internal control over financial reporting as of December 31, 2019. In making this assessment, management used the criteria set forth by the Committee of Sponsoring Organizations of the Treadway Commission in Internal Control-Integrated Framework (2013). Based on this assessment, management concluded that the Company maintained effective internal control over financial reporting as of December 31, 2019.
Ernst & Young LLP (Ernst & Young), the independent registered public accounting firm that audited the Company's Consolidated Financial Statements, has issued an attestation report on the Company's internal control over financial reporting. Ernst & Young's attestation report on the Company's internal control over financial reporting appears in Part II, Item 8., of this Annual Report on Form 10-K and is incorporated herein by reference.
106
Changes in Internal Control over Financial Reporting
There were no changes in internal control over financial reporting (as such term is defined in Rule 13a-15(f) under the Exchange Act) that occurred during the fourth quarter of 2019 that have materially affected, or are reasonably likely to materially affect, the Company's internal control over financial reporting.
Item 9B. Other Information
On February 26, 2020, the Board of Directors approved compensation decisions for the Company's President and Chief Executive Officer, Mr. Toby Z. Rice. For 2020, the Board of Directors determined that Mr. Rice's base salary will remain $1.00, approved an annual cash incentive target for Mr. Rice of $1 million and approved long-term equity compensation awards for Mr. Rice of (i) 1,000,000 options, having an exercise price per share of $10.00, and (ii) 458,716 incentive performance share units. The Board of Directors also approved a pro-rated equity award for Mr. Rice in respect of his service as President and Chief Executive Officer during the second half of 2019 consisting of 366,972 incentive performance share units. The forms of award agreement for these awards are provided as exhibits to this Form 10-K.
107
PART III
Item 10. Directors, Executive Officers and Corporate Governance
The following information is incorporated herein by reference from the Company's definitive proxy statement relating to the 2020 annual meeting of shareholders, which proxy statement is expected to be filed with the SEC within 120 days after the close of the Company's fiscal year ended December 31, 2019:
• | Information required by Item 401 of Regulation S-K with respect to directors is incorporated herein by reference from the sections captioned "Item No. 1 – Election of Directors," and "Corporate Governance and Board Matters" in the Company's definitive proxy statement; |
• | Information required by Item 405 of Regulation S-K with respect to compliance with Section 16(a) of the Exchange Act is incorporated herein by reference from the section captioned "Delinquent – Section 16(a) Reports" in the Company's definitive proxy statement; |
• | Information required by Item 407(d)(4) of Regulation S-K with respect to disclosure of the existence of the Company's separately-designated standing Audit Committee and the identification of the members of the Audit Committee is incorporated herein by reference from the section captioned "Corporate Governance and Board Matters – Board Meetings and Committees – Audit Committee" in the Company's definitive proxy statement; and |
• | Information required by Item 407(d)(5) of Regulation S-K with respect to disclosure of the Company's audit committee financial expert is incorporated herein by reference from the section captioned "Corporate Governance and Board Matters – Board Meetings and Committees – Audit Committee" in the Company's definitive proxy statement. |
Information required by Item 401 of Regulation S-K with respect to executive officers is included after Item 4 at the end of Part I of this Annual Report on Form 10-K under the caption "Information about our Executive Officers (as of February 27, 2020)," and is incorporated herein by reference.
The Company has adopted a code of business conduct and ethics applicable to all directors and employees, including the principal executive officer, principal financial officer and principal accounting officer. The code of business conduct and ethics is posted on the Company's website http://www.eqt.com (accessible by clicking on the "Investors" link on the main page, followed by the "Governance" heading, then the "Governance Documents" link), and a printed copy will be delivered free of charge on request by writing to the corporate secretary at EQT Corporation, c/o Corporate Secretary, 625 Liberty Avenue, Suite 1700, Pittsburgh, Pennsylvania 15222. The Company intends to satisfy the disclosure requirement regarding certain amendments to, or waivers from, provisions of its code of business conduct and ethics by posting such information on the Company's website.
Item 11. Executive Compensation
The following information is incorporated herein by reference from the Company's definitive proxy statement relating to the 2020 annual meeting of shareholders, which proxy statement is expected to be filed with the SEC within 120 days after the close of the Company's fiscal year ended December 31, 2019:
• | Information required by Item 402 of Regulation S-K with respect to named executive officer and director compensation is incorporated herein by reference from the sections captioned "Executive Compensation – Compensation Discussion and Analysis," "Executive Compensation – Compensation Tables," "Executive Compensation – Compensation Policies and Practices and Risk Management," and "Directors' Compensation" in the Company's definitive proxy statement; and |
• | Information required by paragraphs (e)(4) and (e)(5) of Item 407 of Regulation S-K with respect to certain matters related to the Management Development and Compensation Committee of the Company's Board of Directors is incorporated herein by reference from the sections captioned "Corporate Governance and Board Matters – Compensation Committee Interlocks and Insider Participation" and "Executive Compensation – Report of the Management Development and Compensation Committee" in the Company's definitive proxy statement. |
108
Item 12. Security Ownership of Certain Beneficial Owners and Management and Related Stockholder Matters
Information required by Item 403 of Regulation S-K with respect to stock ownership of significant shareholders, directors and executive officers is incorporated herein by reference to the sections captioned "Equity Ownership – Stock Ownership of Significant Shareholders" and "Equity Ownership – Equity Ownership of Directors and Executive Officers" in the Company's definitive proxy statement relating to the 2020 annual meeting of shareholders, which will be filed with the SEC within 120 days after the close of the Company's fiscal year ended December 31, 2019.
Equity Compensation Plan Information
The following table and related footnotes provide information as of December 31, 2019 with respect to shares of the Company's common stock that may be issued under the Company's existing equity compensation plans, including the 2019 Long-Term Incentive Plan (2019 LTIP), 2014 Long-Term Incentive Plan (2014 LTIP), the 2009 Long-Term Incentive Plan (2009 LTIP), the 1999 Non-Employee Directors' Stock Incentive Plan (1999 NEDSIP), the 2005 Directors' Deferred Compensation Plan (2005 DDCP), the 1999 Directors' Deferred Compensation Plan (1999 DDCP), the 2008 Employee Stock Purchase Plan (2008 ESPP), and the 2014 Rice Energy Inc. 2014 Long-Term Incentive Plan (Rice LTIP):
Plan Category | Number Of Securities To Be Issued Upon Exercise Of Outstanding Options, Warrants and Rights (A) | Weighted Average Exercise Price Of Outstanding Options, Warrants and Rights (B) | Number Of Securities Remaining Available For Future Issuance Under Equity Compensation Plans, Excluding Securities Reflected In Column A (C) | ||||||||
Equity Compensation Plans Approved by Shareholders (1) | 6,056,224 | (2) | $ | 28.37 | (3) | 15,306,952 | (4) | ||||
Equity Compensation Plans Not Approved by Shareholders (5) | 35,860 | (6) | N/A | 135,530 | (7) | ||||||
Total | 6,092,084 | $ | 28.37 | 15,442,482 | |||||||
(1) | Consists of the 2019 LTIP, 2014 LTIP, the 2009 LTIP, the 1999 NEDSIP and the 2008 ESPP. Effective as of July 10, 2019 in connection with the adoption of the 2019 LTIP, the Company ceased making new grants under the 2014 LTIP. Effective as of April 30, 2014, in connection with the adoption of the 2014 LTIP, the Company ceased making new grants under the 2009 LTIP. Effective as of April 22, 2009, in connection with the adoption of the 2009 LTIP, the Company ceased making new grants under the 1999 NEDSIP. The 2014 LTIP, the 2009 LTIP and the 1999 NEDSIP remain effective solely for the purpose of issuing shares upon the exercise or payout of awards outstanding under such plans on July 10, 2019 (for the 2014 LTIP), April 30, 2014 (for the 2009 LTIP) and April 22, 2009 (for the 1999 NEDSIP). |
(2) | Consists of (i) 1,598,415 shares subject to outstanding performance awards under the 2014 LTIP, inclusive of dividend reinvestments thereon (counted at a 3X multiple assuming maximum performance is achieved under the awards (representing 2,345,659 target and confirmed awards and dividend reinvestments thereon)), (ii) 117,102 shares subject to outstanding directors' deferred stock units under the 2014 LTIP, inclusive of dividend reinvestments thereon, (iii) 956,314 shares subject to outstanding stock options under the 2009 LTIP; (iv) 22,152 shares subject to outstanding directors' deferred stock units under the 2009 LTIP, inclusive of dividend reinvestments thereon, and (v) 664 shares subject to outstanding directors' deferred stock units under the 1999 NEDSIP, inclusive of dividend reinvestments thereon. |
(3) | The weighted-average exercise price is calculated solely based on outstanding stock options under the 2019 LTIP, 2014 LTIP and the 2009 LTIP and excludes deferred stock units under the 2019 LTIP, 2014 LTIP, the 2009 LTIP and the 1999 NEDSIP and performance awards under the 2019 LTIP, 2014 LTIP and 2009 LTIP. The weighted average remaining term of the stock options was 5.94 years as of December 31, 2019. |
(4) | Consists of (i) 14,891,683 shares available for future issuance under the 2019 LTIP, (ii) zero shares available for future issuance under the 2014 LTIP, (iii) 29,924 shares under the 2009 LTIP and (iv) 385,345 shares available for future issuance under the 2008 ESPP. As of December 31, 2019, no shares were subject to purchase under the 2008 ESPP. |
(5) | Consists of the 2005 DDCP, the 1999 DDCP and the Rice LTIP each of which are described below. |
(6) | Consists of (i) 35,860 shares invested in the EQT common stock fund, payable in shares of common stock, allocated to non-employee directors' accounts under the 2005 DDCP and the 1999 DDCP as of December 31, 2019. |
(7) | Consists of 135,530 shares available for future issuance under the 2005 DDCP as of December 31, 2019. No future awards are available for issuance under the Rice LTIP. |
109
2005 Directors' Deferred Compensation Plan
The 2005 DDCP was adopted by the Compensation Committee, effective January 1, 2005. Neither the original adoption of the plan nor its amendments required approval by the Company's shareholders. The plan allows non-employee directors to defer all or a portion of their directors' fees and retainers. Amounts deferred are payable on or following retirement from the Company's Board of Directors unless an early payment is authorized after the director suffers an unforeseeable financial emergency. In addition to deferred directors' fees and retainers, the deferred stock units granted to directors on or after January 1, 2005 under the 1999 NEDSIP, the 2009 LTIP and the 2014 LTIP are administered under this plan.
1999 Directors' Deferred Compensation Plan
The 1999 DDCP was suspended as of December 31, 2004. The plan continues to operate for the sole purpose of administering vested amounts deferred under the plan on or prior to December 31, 2004. Deferred amounts are generally payable on or following retirement from the Company's Board of Directors but may be payable earlier if an early payment is authorized after a director suffers an unforeseeable financial emergency. In addition to deferred directors' fees and retainers and a one-time grant of deferred shares in 1999 resulting from the curtailment of the directors' retirement plan, the deferred stock units granted to directors and vested prior to January 1, 2005 under the 1999 NEDSIP are administered under this plan.
Rice Energy Inc. 2014 Long-Term Incentive Plan
The Board of Directors of Rice Energy adopted the Rice Energy Inc. 2014 Long-Term Incentive Plan (as amended and restated effective as of May 9, 2014), which was assumed by the Company in connection with the Rice Merger for employees and non-employee directors of the Company and any of its affiliates. The Company may issue long-term equity-based awards under the plan. Employees and non-employee directors of the Company or any affiliate, including subsidiaries, are eligible to receive awards under the plan.
The aggregate number of shares that may be issued under the plan is 6,475,000 shares, subject to proportionate adjustment in the event of stock splits, recapitalizations, mergers and similar events. Shares subject to awards that (i) expire or are canceled, forfeited, exchanged, settled in cash, or otherwise terminated and (ii) are delivered by the participant or withheld from an award to satisfy tax withholding requirements, and delivered or withheld to pay the exercise price of an option, will again be available for awards under the plan.
The plan is administered by the Compensation Committee, except to the extent the Company's Board of Directors elects to administer the plan.
The plan authorizes the granting of awards in any of the following forms: performance awards, restricted stock units, dividend equivalent rights, market-priced options to purchase stock, stock appreciation rights, other share-based awards that are denominated or payable in, valued in whole or in part by reference to, or otherwise based on stock, and cash-based awards.
The Company's Board of Directors may amend, alter, suspend, discontinue or terminate the plan at any time, except that no amendment may be made without the approval of the Company's shareholders if shareholder approval is required by any federal or state law or regulation or by the rules of any exchange on which the stock may then be listed, or if the amendment, alteration or other change increases the number of shares available under the plan, or if the Company's Board of Directors in its discretion determines that obtaining such shareholder approval is for any reason advisable.
Shares to be delivered pursuant to awards under the plan may be shares made available from (i) authorized but unissued shares of stock, (ii) treasury stock, or (iii) previously issued shares of stock reacquired by the Company, including shares purchased on the open market.
Item 13. Certain Relationships and Related Transactions, and Director Independence
Information required by Items 404 and 407(a) of Regulation S-K with respect to director independence and related person transactions is incorporated herein by reference to the section captioned "Corporate Governance and Board Matters – Independence and Related Person Transactions" in the Company's definitive proxy statement relating to the 2020 annual meeting of shareholders, which proxy statement is expected to be filed with the SEC within 120 days after the close of the Company's fiscal year ended December 31, 2019.
110
Item 14. Principal Accounting Fees and Services
Information required by Item 9(e) of Schedule 14A is incorporated herein by reference to the section captioned "Item No. 3 – Ratification of Appointment of Independent Registered Public Accounting Firm" in the Company's definitive proxy statement relating to the 2020 annual meeting of shareholders, which proxy statement is expected to be filed with the SEC within 120 days after the close of the Company's fiscal year ended December 31, 2019.
111
PART IV
Item 15. Exhibits and Financial Statements Schedules
(a) | 1 | Financial Statements | Page Reference |
Statements of Consolidated Operations for each of the three years in the period ended December 31, 2019 | |||
Statements of Consolidated Comprehensive Income for each of the three years in the period ended December 31, 2019 | |||
Statements of Consolidated Cash Flows for each of the three years in the period ended December 31, 2019 | |||
Consolidated Balance Sheets as of December 31, 2019 and 2018 | |||
Statements of Consolidated Equity for each of the three years in the period ended December 31, 2019 | |||
Notes to Consolidated Financial Statements | |||
2 | Financial Statements Schedule | ||
Schedule II - Valuation and Qualifying Accounts and Reserves for the Three Years Ended December 31, 2019 | |||
EQT CORPORATION AND SUBSIDIARIES
SCHEDULE II - VALUATION AND QUALIFYING ACCOUNTS AND RESERVES
FOR THE THREE YEARS ENDED DECEMBER 31, 2019
Column A | Column B | Column C | Column D | Column E | ||||||||||||||||
Description | Balance at Beginning of Period | (Deductions) Additions Charged to Costs and Expenses | Additions Charged to Other Accounts | Deductions | Balance at End of Period | |||||||||||||||
(Thousands) | ||||||||||||||||||||
Valuation allowance for deferred tax assets: | ||||||||||||||||||||
2019 | $ | $ | $ | $ | ( | ) | $ | |||||||||||||
2018 | ( | ) | ||||||||||||||||||
2017 | ( | ) | ||||||||||||||||||
All other schedules are omitted since the subject matter thereof is either not present or is not present in amounts sufficient to require submission of the schedules.
112
3 | Exhibits | ||
Exhibits | Description | Method of Filing |
Separation and Distribution Agreement, dated as of November 12, 2018, by and among the Company, Equitrans Midstream Corporation and, solely for certain limited purposes therein, EQT Production Company. | Incorporated herein by reference to Exhibit 2.1 to Form 8-K (#001-3551) filed on November 13, 2018. | |
Tax Matters Agreement, dated as of November 12, 2018, by and between the Company and Equitrans Midstream Corporation. | Incorporated herein by reference to Exhibit 2.3 to Form 8-K (#001-3551) filed on November 13, 2018. | |
Employee Matters Agreement, dated as of November 12, 2018, by and between the Company and Equitrans Midstream Corporation. | Incorporated herein by reference to Exhibit 2.4 to Form 8-K (#001-3551) filed on November 13, 2018. | |
Shareholder and Registration Rights Agreement, dated as of November 12, 2018, by and between the Company and Equitrans Midstream Corporation. | Incorporated herein by reference to Exhibit 4.1 to Form 8-K (#001-3551) filed on November 13, 2018. | |
Restated Articles of Incorporation of the Company (amended through November 13, 2017). | Incorporated herein by reference to Exhibit 3.1 to Form 8-K (#001-3551) filed on November 14, 2017. | |
Amended and Restated Bylaws of the Company (amended through November 13, 2017). | Incorporated herein by reference to Exhibit 3.3 to Form 8-K (#001-3551) filed on November 14, 2017. | |
Indenture dated as of April 1, 1983 between the Company and Pittsburgh National Bank, as Trustee. | Incorporated herein by reference to Exhibit 4.01(a) to Form 10-K (#001-3551) for the year ended December 31, 2007. | |
Instrument appointing Bankers Trust Company as successor trustee to Pittsburgh National Bank. | Incorporated herein by reference to Exhibit 4.01(b) to Form 10-K (#001-3551) for the year ended December 31, 1998. | |
Supplemental Indenture dated March 15, 1991 between the Company and Bankers Trust Company. | Incorporated herein by reference to Exhibit 4.01(f) to Form 10-K (#001-3551) for the year ended December 31, 1996. | |
Resolution adopted August 19, 1991 by the Ad Hoc Finance Committee of the Board of Directors of the Company and Addenda Nos. 1 through 27, establishing the terms and provisions of the Series A Medium-Term Notes. | Incorporated herein by reference to Exhibit 4.01(g) to Form 10-K (#001-3551) for the year ended December 31, 1996. | |
Resolutions adopted July 6, 1992 and February 19, 1993 by the Ad Hoc Finance Committee of the Board of Directors of the Company and Addenda Nos. 1 through 8, establishing the terms and provisions of the Series B Medium-Term Notes. | Incorporated herein by reference to Exhibit 4.01(h) to Form 10-K (#001-3551) for the year ended December 31, 1997. | |
Second Supplemental Indenture dated as of June 30, 2008 between the Company and Deutsche Bank Trust Company Americas, as Trustee, pursuant to which the Company assumed the obligations of Equitable Resources, Inc. under the related Indenture. | Incorporated herein by reference to Exhibit 4.01(g) to Form 8-K (#001-3551) filed on July 1, 2008. | |
Indenture dated as of July 1, 1996 between the Company and The Bank of New York, as successor to Bank of Montreal Trust Company, as Trustee. | Incorporated herein by reference to Exhibit 4.01(a) to Form S-4 Registration Statement (#333-103178) filed on February 13, 2003. | |
Resolutions adopted January 18 and July 18, 1996 by the Board of Directors of the Company and Resolution adopted July 18, 1996 by the Executive Committee of the Board of Directors of the Company, establishing the terms and provisions of the 7.75% Debentures issued July 29, 1996. | Incorporated herein by reference to Exhibit 4.01(j) to Form 10-K (#001-3551) for the year ended December 31, 1996. | |
First Supplemental Indenture dated as of June 30, 2008 between the Company and The Bank of New York, as Trustee, pursuant to which the Company assumed the obligations of Equitable Resources, Inc. under the related Indenture. | Incorporated herein by reference to Exhibit 4.02(f) to Form 8-K (#001-3551) filed on July 1, 2008. | |
Indenture dated as of March 18, 2008 between the Company and The Bank of New York, as Trustee. | Incorporated herein by reference to Exhibit 4.1 to Form 8-K (#001-3551) filed on March 18, 2008. | |
Cross-reference table for Indenture dated as of March 18, 2008 (listed as Exhibit 4.03(a) above) and the Trust Indenture Act of 1939, as amended. | Filed herewith as Exhibit 4.03(b). | |
113
Second Supplemental Indenture dated as of June 30, 2008 between the Company and The Bank of New York, as Trustee, pursuant to which the Company assumed the obligations of Equitable Resources, Inc. under the related Indenture. | Incorporated herein by reference to Exhibit 4.03(c) to Form 8-K (#001-3551) filed on July 1, 2008. | |
Third Supplemental Indenture dated as of May 15, 2009 between the Company and The Bank of New York, as Trustee, pursuant to which the 8.125% Senior Notes due 2019 were issued. | Incorporated herein by reference to Exhibit 4.1 to Form 8-K (#001-3551) filed on May 15, 2009. | |
Fourth Supplemental Indenture dated as of November 7, 2011 between the Company and The Bank of New York Mellon, as Trustee, pursuant to which the 4.875% Senior Notes due 2021 were issued. | Incorporated herein by reference to Exhibit 4.2 to Form 8-K (#001-3551) filed on November 7, 2011. | |
Fifth Supplemental Indenture dated as of October 4, 2017 between the Company and The Bank of New York Mellon, as Trustee, pursuant to which the Floating Rate Notes due 2020 were issued. | Incorporated herein by reference to Exhibit 4.3 to Form 8-K (#001-3551) filed on October 4, 2017. | |
Sixth Supplemental Indenture dated as of October 4, 2017 between the Company and The Bank of New York Mellon, as Trustee, pursuant to which the 2.500% Senior Notes due 2020 were issued. | Incorporated herein by reference to Exhibit 4.5 to Form 8-K (#001-3551) filed on October 4, 2017. | |
Seventh Supplemental Indenture dated as of October 4, 2017 between the Company and The Bank of New York Mellon, as Trustee, pursuant to which the 3.000% Senior Notes due 2022 were issued. | Incorporated herein by reference to Exhibit 4.7 to Form 8-K (#001-3551) filed on October 4, 2017. | |
Eighth Supplemental Indenture dated as of October 4, 2017 between the Company and The Bank of New York Mellon, as Trustee, pursuant to which the 3.900% Senior Notes due 2027 were issued. | Incorporated herein by reference to Exhibit 4.9 to Form 8-K (#001-3551) filed on October 4, 2017. | |
Ninth Supplemental Indenture dated as of January 21, 2020 between the Company and The Bank of New York Mellon, as Trustee, pursuant to which the 6.125% Senior Notes due 2025 were issued. | Incorporated herein by reference to Exhibit 4.3 to Form 8-K (#001-3551) filed on January 21, 2020. | |
Tenth Supplemental Indenture dated as of January 21, 2020 between the Company and The Bank of New York Mellon, as Trustee, pursuant to which the 7.000% Senior Notes due 2030 were issued. | Incorporated herein by reference to Exhibit 4.5 to Form 8-K (#001-3551) filed on January 21, 2020. | |
Description of Capital Stock. | Incorporated herein by reference to Exhibit 99.1 to Form 8-K (#001-3551) filed on July 15, 2019. | |
Second Amended and Restated Credit Agreement, dated as of July 31, 2017, among the Company, PNC Bank, National Association, as Administrative Agent, Swing Line Lender and an L/C Issuer and the other lenders party thereto. | Incorporated herein by reference to Exhibit 10.1 to Form 8-K (#001-3551) filed on August 3, 2017. | |
Term Loan Agreement, dated as of May 31, 2019, by and among the Company, PNC Bank, National Association, as Administrative Agent, and the other lenders party thereto. | Incorporated herein by reference to Exhibit 10.1 to Form 8-K (#001-3551) filed on May 31, 2019. | |
2009 Long-Term Incentive Plan (as amended and restated through July 11, 2012). | Incorporated herein by reference to Exhibit 10.2 to Form 10-Q (#001-3551) for the quarter ended June 30, 2012. | |
Form of Participant Award Agreement (Stock Option) under 2009 Long-Term Incentive Plan (pre-2012 grants). | Incorporated herein by reference to Exhibit 10.01(q) to Form 10-K (#001-3551) for the year ended December 31, 2010. | |
Form of Amendment to Stock Option Award Agreements. | Incorporated herein by reference to Exhibit 10.3 to Form 10-Q (#001-3551) for the quarter ended June 30, 2011. | |
Form of Participant Award Agreement (Stock Option) under 2009 Long-Term Incentive Plan (2012 grants). | Incorporated herein by reference to Exhibit 10.02(n) to Form 10-K (#001-3551) for the year ended December 31, 2011. | |
Form of Participant Award Agreement (Phantom Stock Unit Awards) under 2009 Long-Term Incentive Plan (pre-2013 grants). | Incorporated herein by reference to Exhibit 10.02(b) to Form 10-K (#001-3551) for the year ended December 31, 2012. | |
Form of Participant Award Agreement (Stock Option) under 2009 Long-Term Incentive Plan (2013 grants). | Incorporated herein by reference to Exhibit 10.02(t) to Form 10-K (#001-3551) for the year ended December 31, 2012. | |
Form of Participant Award Agreement (Phantom Stock Unit Awards) under 2009 Long-Term Incentive Plan (2013 and 2014 grants). | Incorporated herein by reference to Exhibit 10.02(s) to Form 10-K (#001-3551) for the year ended December 31, 2012. | |
114
Form of Participant Award Agreement (Stock Option) under 2009 Long-Term Incentive Plan (2014 grants). | Incorporated herein by reference to Exhibit 10.02(v) to Form 10-K (#001-3551) for the year ended December 31, 2013. | |
2014 Long-Term Incentive Plan. | Incorporated herein by reference to Exhibit 10.1 to Form 8-K (#001-3551) filed on May 1, 2014. | |
Form of Participant Award Agreement (Phantom Stock Unit Awards) under 2014 Long-Term Incentive Plan. | Incorporated herein by reference to Exhibit 10.03(b) to Form 10-K (#001-3551) for the year ended December 31, 2014. | |
2015 Executive Performance Incentive Program. | Incorporated herein by reference to Exhibit 10.03(d) to Form 10-K (#001-3551) for the year ended December 31, 2014. | |
Form of Participant Award Agreement under 2015 Executive Performance Incentive Program. | Incorporated herein by reference to Exhibit 10.03(e) to Form 10-K (#001-3551) for the year ended December 31, 2014. | |
Amendment to 2015 Executive Performance Incentive Program. | Incorporated herein by reference to Exhibit 10.03(f) to Form 10-K (#001-3551) for the year ended December 31, 2014. | |
2016 Incentive Performance Share Unit Program. | Incorporated herein by reference to Exhibit 10.02(g) to Form 10-K (#001-3551) for the year ended December 31, 2015. | |
Form of Participant Award Agreement under 2016 Incentive Performance Share Unit Program. | Incorporated herein by reference to Exhibit 10.02(h) to Form 10-K (#001-3551) for the year ended December 31, 2015. | |
2016 Restricted Stock Award Agreement (Standard) for Robert J. McNally. | Incorporated herein by reference to Exhibit 10.03 to Form 10-Q (#001-3551) for the quarter ended March 31, 2016. | |
Form of 2016 Value Driver Performance Award Agreement. | Incorporated herein by reference to Exhibit 10.02(i) to Form 10-K (#001-3551) for the year ended December 31, 2018. | |
Form of Participant Award Agreement (Stock Option) under 2014 Long-Term Incentive Plan (pre-2017 grants). | Incorporated herein by reference to Exhibit 10.03(c) to Form 10-K (#001-3551) for the year ended December 31, 2014. | |
2017 Incentive Performance Share Unit Program. | Incorporated herein by reference to Exhibit 10.02(l) to Form 10-K (#001-3551) for the year ended December 31, 2016. | |
Form of Participant Award Agreement under 2017 Incentive Performance Share Unit Program. | Incorporated herein by reference to Exhibit 10.02(m) to Form 10-K (#001-3551) for the year ended December 31, 2016. | |
Form of Participant Award Agreement (Stock Option) under 2014 Long-Term Incentive Plan (2017 grants). | Incorporated herein by reference to Exhibit 10.02(k) to Form 10-K (#001-3551) for the year ended December 31, 2016. | |
Form of 2017 Value Driver Performance Award Agreement. | Incorporated herein by reference to Exhibit 10.02(n) to Form 10-K (#001-3551) for the year ended December 31, 2018. | |
Form of Restricted Stock Unit Award Agreement (Standard) under 2014 Long-Term Incentive Plan. | Incorporated herein by reference to Exhibit 10.02(o) to Form 10-K (#001-3551) for the year ended December 31, 2018. | |
Form of Restricted Stock Award Agreement under 2014 Long-Term Incentive Plan (pre-2018 grants). | Incorporated herein by reference to Exhibit 10.02(d) to Form 10-K (#001-3551) for the year ended December 31, 2016. | |
Form of Participant Award Agreement (Stock Option) under 2014 Long-Term Incentive Plan (2018 grants). | Incorporated herein by reference to Exhibit 10.02(r) to Form 10-K (#001-3551) for the year ended December 31, 2017. | |
Form of Restricted Stock Award Agreement (Standard) under 2014 Long-Term Incentive Plan (2018 grants). | Incorporated herein by reference to Exhibit 10.02(s) to Form 10-K (#001-3551) for the year ended December 31, 2017. | |
Form of 2018 Value Driver Performance Award Agreement. | Incorporated herein by reference to Exhibit 10.02(s) to Form 10-K (#001-3551) for the year ended December 31, 2018. | |
115
Form of 2018 Restricted Stock Units Award Agreement (Standard) under 2014 Long-Term Incentive Plan (2018 grants). | Incorporated herein by reference to Exhibit 10.02(t) to Form 10-K (#001-3551) for the year ended December 31, 2018. | |
2018 Incentive Performance Share Unit Program. | Incorporated herein by reference to Exhibit 10.02(t) to Form 10-K (#001-3551) for the year ended December 31, 2017. | |
Form of Participant Award Agreement under 2018 Incentive Performance Share Unit Program (executive officers). | Incorporated herein by reference to Exhibit 10.02(u) to Form 10-K (#001-3551) for the year ended December 31, 2017. | |
Form of Participant Award Agreement under 2018 Incentive Performance Share Unit Program. | Incorporated herein by reference to Exhibit 10.02(w) to Form 10-K (#001-3551) for the year ended December 31, 2018. | |
Form of 2018 Restricted Stock Unit Award Agreement (Transaction). | Incorporated herein by reference to Exhibit 10.02(y) to Form 10-K (#001-3551) for the year ended December 31, 2018. | |
Form of Participant Award Agreement (Stock Option) under 2014 Long-Term Incentive Plan (2019 grants). | Incorporated herein by reference to Exhibit 10.02(z) to Form 10-K (#001-3551) for the year ended December 31, 2018. | |
Form of Restricted Stock Award Agreement (Standard) under 2014 Long-Term Incentive Plan (2019 grants). | Incorporated herein by reference to Exhibit 10.02(aa) to Form 10-K (#001-3551) for the year ended December 31, 2018. | |
2019 Incentive Performance Share Unit Program. | Incorporated herein by reference to Exhibit 10.02(bb) to Form 10-K (#001-3551) for the year ended December 31, 2018. | |
Form of Participant Award Agreement under 2019 Incentive Performance Share Unit Program. | Incorporated herein by reference to Exhibit 10.02(cc) to Form 10-K (#001-3551) for the year ended December 31, 2018. | |
Rice Energy Inc. 2014 Long-Term Incentive Plan (as amended and restated May 9, 2014). | Incorporated herein by reference to Exhibit 10.3 to Rice Energy Inc.'s Form 10-Q (#001-36273) for the quarter ended June 30, 2014. | |
2019 Long-Term Incentive Plan. | Incorporated herein by reference to Exhibit 99.1 to Form S-8 (#333-232657) filed on July 15, 2019. | |
Form of Restricted Stock Unit Award Agreement (Non-Employee Directors) under 2019 Long-Term Incentive Plan. | Filed herewith as Exhibit 10.06(b). | |
Form of Restricted Stock Unit Award Agreement (Standard) under 2019 Long-Term Incentive Plan. | Filed herewith as Exhibit 10.06(c). | |
Form of Incentive Performance Share Unit Program under 2019 Long-Term Incentive Plan. | Filed herewith as Exhibit 10.06(d). | |
Form of Participant Award Agreement under 2020 Incentive Performance Share Unit Program. | Filed herewith as Exhibit 10.06(e). | |
Form of Stock Appreciation Rights Award Agreement under 2019 Long-Term Incentive Plan. | Filed herewith as Exhibit 10.06(f). | |
Form of Participant Award Agreement (Stock Option) under 2019 Long-Term Incentive Plan. | Filed herewith as Exhibit 10.06(g). | |
Form of Restricted Stock Unit Agreement (Directors) for Rice Energy Inc. | Incorporated herein by reference to Exhibit 10.19 to Rice Energy Inc.'s Amendment No. 2 to Form S-1 Registration Statement (#333-192894) filed on January 8, 2014. | |
1999 Non-Employee Directors' Stock Incentive Plan (as amended and restated December 3, 2008). | Incorporated herein by reference to Exhibit 10.02(a) to Form 10-K (#001-3551) for the year ended December 31, 2008. | |
Form of Participant Award Agreement (Phantom Stock Unit Awards) under 1999 Non-Employee Directors' Stock Incentive Plan. | Incorporated herein by reference to Exhibit 10.04(c) to Form 10-K (#001-3551) for the year ended December 31, 2006. | |
2016 Executive Short-Term Incentive Plan. | Incorporated herein by reference to Exhibit 10.1 to Form 8-K (#001-3551) filed on April 21, 2016. | |
116
2019 Supplemental Short-Term Incentive Plan. | Incorporated herein by reference to Exhibit 10.01 to Form 10-Q (#001-3551) for the quarter ended September 30, 2019. | |
2006 Payroll Deduction and Contribution Program (as amended and restated July 7, 2015). | Incorporated herein by reference to Exhibit 10.06 to Form 10-Q (#001-3551) for the quarter ended June 30, 2015. | |
1999 Directors' Deferred Compensation Plan (as amended and restated December 3, 2014). | Incorporated herein by reference to Exhibit 10.08 to Form 10-K (#001-3551) for the year ended December 31, 2014. | |
Amendment to 1999 Directors' Deferred Compensation Plan (as amended October 2, 2018). | Incorporated herein by reference to Exhibit 10.4 to Form 10-Q (#001-3551) for the quarter ended September 30, 2018. | |
2005 Directors' Deferred Compensation Plan (as amended and restated December 3, 2014). | Incorporated herein by reference to Exhibit 10.09 to Form 10-K (#001-3551) for the year ended December 31, 2014. | |
Amendment to 2005 Directors' Deferred Compensation Plan (as amended October 2, 2018). | Incorporated herein by reference to Exhibit 10.5 to Form 10-Q (#001-3551) for the quarter ended September 30, 2018. | |
Form of Indemnification Agreement between the Company and executive officers and outside directors. | Incorporated herein by reference to Exhibit 10.18 to Form 10-K (#001-3551) for the year ended December 31, 2008. | |
Form of Amendment of Confidentiality, Non-Solicitation and Non-Competition Agreement. | Incorporated herein by reference to Exhibit 10.22 to Form 10-K (#001-3551) for the year ended December 31, 2018. | |
Separation and Release Agreement, dated as of November 13, 2017, among the Company, EQT RE, LLC and Daniel J. Rice IV. | Incorporated herein by reference to Exhibit 10.1 to Form 8-K (#001-3551) filed on November 17, 2017. | |
Confidentiality, Non-Solicitation and Non-Competition Agreement, dated as of March 10, 2016, between the Company and Robert J. McNally. | Incorporated herein by reference to Exhibit 10.02 to Form 10-Q (#001-3551) for the quarter ended March 31, 2016. | |
Amendment of Confidentiality, Non-Solicitation and Non-Competition Agreement, dated as of November 12, 2018, by and among the Company, Equitrans Midstream Corporation and Robert J. McNally. | Incorporated herein by reference to Exhibit 10.13(b) to Form 10-K (#001-3551) for the year ended December 31, 2018. | |
Agreement and Release, dated as of July 19, 2019, by and between the Company and Robert J. McNally. | Incorporated herein by reference to Exhibit 10.05 to Form 10-Q (#001-3551) for the quarter ended June 30, 2019. | |
Letter Agreement, effective October 1, 2019, by and between the Company and Robert J. McNally. | Incorporated herein by reference to Exhibit 10.1 to Form 8-K (#001-3551) filed on October 2, 2019. | |
Second Amended and Restated Confidentiality, Non-Solicitation and Non-Competition Agreement, dated as of November 13, 2018, by and between the Company and Jimmi Sue Smith. | Incorporated herein by reference to Exhibit 10.2 to Form 8-K (#001-3551) filed on November 13, 2018. | |
Agreement and Release, dated as of September 9, 2019, by and between the Company and Jimmi Sue Smith. | Incorporated herein by reference to Exhibit 10.03 to Form 10-Q (#001-3551) for the quarter ended September 30, 2019. | |
Letter Agreement, effective October 1, 2019, by and between the Company and Jimmi Sue Smith. | Incorporated herein by reference to Exhibit 10.4 to Form 8-K (#001-3551) filed on October 2, 2019. | |
Amended and Restated Confidentiality, Non-Solicitation and Non-Competition Agreement, dated as of November 13, 2018, by and between the Company and Jonathan M. Lushko. | Incorporated herein by reference to Exhibit 10.17 to Form 10-K (#001-3551) for the year ended December 31, 2018. | |
Agreement and Release, dated as of July 17, 2019, by and between the Company and Jonathan M. Lushko. | Incorporated herein by reference to Exhibit 10.03 to Form 10-Q (#001-3551) for the quarter ended June 30, 2019. | |
Offer Letter, dated March 4, 2019, by and between the Company and Gary E. Gould. | Incorporated herein by reference to Exhibit 10.1 to Form 8-K (#001-3551) filed on March 7, 2019. | |
Confidentiality, Non-Solicitation and Non-Competition Agreement, dated as of March 6, 2019, by and between the Company and Gary E. Gould. | Incorporated herein by reference to Exhibit 10.02 to Form 10-Q (#001-3551) for the quarter ended March 31, 2019. | |
117
Agreement and Release, dated as of August 22, 2019, by and between the Company and Gary E. Gould. | Incorporated herein by reference to Exhibit 10.02 to Form 10-Q (#001-3551) for the quarter ended September 30, 2019. | |
Letter Agreement, effective October 21, 2019, by and between the Company and Gary E. Gould. | Filed herewith as Exhibit 10.20(d). | |
Stock Option Inducement Award Agreement, dated April 22, 2019, issued to Gary E. Gould. | Incorporated herein by reference to Exhibit 4.3 to Form S-8 (#333-230969) filed on April 22, 2019. | |
Performance Share Unit Inducement Award Agreement, dated April 22, 2019, issued to Gary E. Gould. | Incorporated herein by reference to Exhibit 4.4 to Form S-8 (#333-230969) filed on April 22, 2019. | |
Restricted Stock Inducement Award Agreement (Cliff Vesting), dated April 22, 2019, issued to Gary E. Gould. | Incorporated herein by reference to Exhibit 4.5 to Form S-8 (#333-230969) filed on April 22, 2019. | |
Restricted Stock Inducement Award Agreement (Ratable Vesting), dated April 22, 2019, issued to Gary E. Gould. | Incorporated herein by reference to Exhibit 4.6 to Form S-8 (#333-230969) filed on April 22, 2019. | |
Amended and Restated Confidentiality, Non-Solicitation and Non-Competition Agreement, dated as of November 13, 2018, by and between the Company and Erin R. Centofanti. | Incorporated herein by reference to Exhibit 10.15 to Form 10-K (#001-3551) for the year ended December 31, 2018. | |
Agreement and Release, dated as of May 7, 2019, by and between the Company and Erin R. Centofanti. | Incorporated herein by reference to Exhibit 10.04 to Form 10-Q (#001-3551) for the quarter ended June 30, 2019. | |
Second Amended and Restated Confidentiality, Non-Solicitation and Non-Competition Agreement, dated as of March 1, 2017, by and between the Company and Donald M. Jenkins. | Incorporated herein by reference to Exhibit 10.16(a) to Form 10-K (#001-3551) for the year ended December 31, 2018. | |
Amendment of Confidentiality, Non-Solicitation and Non-Competition Agreement, dated as of November 12, 2018, by and among the Company, Equitrans Midstream Corporation and Donald M. Jenkins. | Incorporated herein by reference to Exhibit 10.16(b) to Form 10-K (#001-3551) for the year ended December 31, 2018. | |
Amendment No. 2, dated October 7, 2019, to the Second Amended and Restated Confidentiality, Non-Solicitation and Non-Competition Agreement, by and between the Company and Donald M. Jenkins. | Incorporated herein by reference to Exhibit 10.1 to Form 8-K (#001-3551) filed on October 7, 2019. | |
Agreement and Release, dated as of January 9, 2020, by and between the Company and Donald M. Jenkins. | Filed herewith as Exhibit 10.22(d). | |
Amended and Restated Confidentiality, Non-Solicitation and Non-Competition Agreement, dated July 29, 2015, by and between the Company and Steven T. Schlotterbeck. | Incorporated herein by reference to Exhibit 10.5 to Form 8-K (#001-3551) filed on July 31, 2015. | |
Amended and Restated Confidentiality, Non-Solicitation and Non-Competition Agreement, dated July 29, 2015, by and between the Company and David L. Porges. | Incorporated herein by reference to Exhibit 10.1 to Form 8-K (#001-3551) filed on July 31, 2015. | |
Executive Alternative Work Arrangement Employment Agreement, dated October 26, 2018, by and between the Company and David L. Porges. | Incorporated herein by reference to Exhibit 10.19(b) to Form 10-K (#001-3551) for the year ended December 31, 2018. | |
Letter Agreement, effective October 1, 2019, by and between the Company and David L. Porges. | Incorporated herein by reference to Exhibit 10.2 to Form 8-K (#001-3551) filed on October 2, 2019. | |
Second Amended and Restated Confidentiality, Non-Solicitation and Non-Competition Agreement, dated March 1, 2017, by and between the Company and David E. Schlosser, Jr. | Incorporated herein by reference to Exhibit 10.17 to Form 10-K (#001-3551) for the year ended December 31, 2017. | |
Agreement and Release, dated October 26, 2018, by and between the Company and David E. Schlosser, Jr. | Incorporated herein by reference to Exhibit 10.20(b) to Form 10-K (#001-3551) for the year ended December 31, 2018. | |
Letter Agreement, effective October 1, 2019, by and between the Company and David E. Schlosser, Jr. | Incorporated herein by reference to Exhibit 10.3 to Form 8-K (#001-3551) filed on October 2, 2019. | |
Offer Letter, dated as of July 26, 2017, by and between the Company and Jeremiah J. Ashcroft II | Incorporated herein by reference to Exhibit 10.18(a) to Form 10-K (#001-3551) for the year ended December 31, 2017. | |
118
Confidentiality, Non-Solicitation and Non-Competition Agreement, dated as of August 7, 2017, by and between the Company and Jeremiah J. Ashcroft III. | Incorporated herein by reference to Exhibit 10.18(b) to Form 10-K (#001-3551) for the year ended December 31, 2017. | |
Agreement and Release, dated as of August 13, 2018, by and between the Company and Jeremiah J. Ashcroft III. | Incorporated herein by reference to Exhibit 10.1 to Form 10-Q (#001-3551) for the quarter ended September 30, 2018. | |
Offer Letter, dated January 13, 2020, by and between the Company and Kyle Derham. | Filed herewith as Exhibit 10.27(a). | |
Services Agreement, dated as of January 13, 2020, by and between the Company and Kyle Derham. | Filed herewith as Exhibit 10.27(b). | |
Offer Letter, dated December 18, 2019, by and between the Company and David M. Khani. | Filed herewith as Exhibit 10.28(a). | |
Confidentiality, Non-Solicitation and Non-Competition Agreement, dated January 3, 2020, by and between the Company and David M. Khani. | Filed herewith as Exhibit 10.28(b). | |
Offer Letter, dated January 6, 2020, by and between the Company and William E. Jordan. | Filed herewith as Exhibit 10.29(a). | |
Confidentiality, Non-Solicitation and Non-Competition Agreement, dated January 6, 2020, by and between the Company and William E. Jordan. | Filed herewith as Exhibit 10.29(b). | |
Offer Letter, dated July 18, 2019, by and between the Company and Richard Anthony Duran. | Filed herewith as Exhibit 10.30(a). | |
Confidentiality, Non-Solicitation and Non-Competition Agreement, dated August 5, 2019, by and between the Company and Richard Anthony Duran. | Filed herewith as Exhibit 10.30(b). | |
Relocation Expense Reimbursement Agreement, dated July 24, 2019, by and between the Company and Richard Anthony Duran. | Filed herewith as Exhibit 10.30(c). | |
Offer Letter, dated July 16, 2019, by and between the Company and Lesley Evancho. | Filed herewith as Exhibit 10.31(a). | |
Confidentiality, Non-Solicitation and Non-Competition Agreement, dated July 19, 2019, by and between the Company and Lesley Evancho. | Filed herewith as Exhibit 10.31(b). | |
Employee Savings Plan. | Incorporated herein by reference to Exhibit 4.1 to Form S-8 (#333-230970) filed on April 22, 2019. | |
Schedule of Subsidiaries. | Filed herewith as Exhibit 21. | |
Consent of Independent Registered Public Accounting Firm. | Filed herewith as Exhibit 23.01. | |
Consent of Ryder Scott Company, L.P. | Incorporated herein by reference to Exhibit 23.1 to Form 8-K/A (#001-3551) filed on February 25, 2020. | |
Rule 13(a)-14(a) Certification of Principal Executive Officer. | Filed herewith as Exhibit 31.01. | |
Rule 13(a)-14(a) Certification of Principal Financial Officer. | Filed herewith as Exhibit 31.02. | |
Section 1350 Certification of Principal Executive Officer and Principal Financial Officer. | Furnished herewith as Exhibit 32. | |
Independent Petroleum Engineers' Audit Report. | Incorporated herein by reference to Exhibit 99.1 to Form 8-K/A (#001-3551) filed on February 25, 2020. | |
101 | Interactive Data File. | Filed herewith as Exhibit 101. |
104 | Cover Page Interactive Data File. | Formatted as Inline XBRL and contained in Exhibit 101. |
Each management contract and compensatory arrangement in which any director or any named executive officer participates has been marked with an asterisk (*)
The Company agrees to furnish to the SEC, upon request, copies of instruments with respect to long-term debt that have not previously been filed.
Item 16. Form 10-K Summary
None.
119
SIGNATURES
Pursuant to the requirements of Section 13 or 15(d) of the Securities Exchange Act of 1934, the registrant has duly caused this report to be signed on its behalf by the undersigned, thereunto duly authorized.
EQT CORPORATION | |||
By: | /s/ Toby Z. Rice | ||
Toby Z. Rice | |||
President and Chief Executive Officer | |||
February 27, 2020 | |||
Pursuant to the requirements of the Securities Exchange Act of 1934, this report has been signed below by the following persons on behalf of the registrant and in the capacities and on the dates indicated.
/s/ TOBY Z. RICE | President, | February 27, 2020 | ||
Toby Z. Rice | Chief Executive Officer and | |||
(Principal Executive Officer) | Director | |||
/s/ DAVID M. KHANI | Chief Financial Officer | February 27, 2020 | ||
David M. Khani | ||||
(Principal Financial Officer) | ||||
/s/ TODD M. JAMES | Chief Accounting Officer | February 27, 2020 | ||
Todd M. James | ||||
(Principal Accounting Officer) | ||||
/s/ LYDIA I. BEEBE | Director | February 27, 2020 | ||
Lydia I. Beebe | ||||
/s/ PHILIP G. BEHRMAN | Director | February 27, 2020 | ||
Philip G. Behrman | ||||
/s/ LEE M. CANAAN | Director | February 27, 2020 | ||
Lee M. Canaan | ||||
/s/ JANET L. CARRIG | Director | February 27, 2020 | ||
Janet L. Carrig | ||||
/s/ KATHRYN J. JACKSON | Director | February 27, 2020 | ||
Kathryn J. Jackson | ||||
/s/ JOHN F. MCCARTNEY | Chairman | February 27, 2020 | ||
John F. McCartney | ||||
/s/ JAMES T. MCMANUS II | Director | February 27, 2020 | ||
James T. McManus II | ||||
/s/ ANITA M. POWERS | Director | February 27, 2020 | ||
Anita M. Powers | ||||
/s/ DANIEL J. RICE IV | Director | February 27, 2020 | ||
Daniel J. Rice IV | ||||
/s/ STEPHEN A. THORINGTON | Director | February 27, 2020 | ||
Stephen A. Thorington | ||||
/s/ HALLIE A. VANDERHIDER | Director | February 27, 2020 | ||
Hallie A. Vanderhider | ||||
120