Fidelity® Select Portfolios®
Financials Sector
Fund/Ticker
Financial Services Portfolio/FIDSX
Summary Prospectus
April 29, 2020
Before you invest, you may want to review the fund's prospectus, which contains more information about the fund and its risks. You can find the fund's prospectus, reports to shareholders, and other information about the fund (including the fund's SAI) online at www.fidelity.com/funddocuments. You can also get this information at no cost by calling 1-800-FIDELITY or by sending an e-mail request to fidfunddocuments@fidelity.com. The fund's prospectus and SAI dated April 29, 2020 are incorporated herein by reference.
See the inside front cover for important information about access to your fund's shareholder reports.
245 Summer Street, Boston, MA 02210
Beginning on January 1, 2021, as permitted by regulations adopted by the Securities and Exchange Commission, paper copies of a fund’s shareholder reports will no longer be sent by mail, unless you specifically request paper copies of the reports from the fund or from your financial intermediary, such as a financial advisor, broker-dealer or bank. Instead, the reports will be made available on a website, and you will be notified by mail each time a report is posted and provided with a website link to access the report.
If you already elected to receive shareholder reports electronically, you will not be affected by this change and you need not take any action. You may elect to receive shareholder reports and other communications from a fund electronically, by contacting your financial intermediary. For Fidelity customers, visit Fidelity's web site or call Fidelity using the contact information listed below.
You may elect to receive all future reports in paper free of charge. If you wish to continue receiving paper copies of your shareholder reports, you may contact your financial intermediary or, if you are a Fidelity customer, visit Fidelity’s website, or call Fidelity at the applicable toll-free number listed below. Your election to receive reports in paper will apply to all funds held with the fund complex/your financial intermediary.
| Account Type | Website | Phone Number |
| Brokerage, Mutual Fund, or Annuity Contracts: | fidelity.com/mailpreferences | 1-800-343-3548 |
| Employer Provided Retirement Accounts: | netbenefits.fidelity.com/preferences (choose 'no' under Required Disclosures to continue to print) | 1-800-343-0860 |
| Advisor Sold Accounts Serviced Through Your Financial Intermediary: | Contact Your Financial Intermediary | Your Financial Intermediary's phone number |
| Advisor Sold Accounts Serviced by Fidelity: | institutional.fidelity.com | 1-877-208-0098 |
Fund Summary
Fund:
Financial Services Portfolio
Investment Objective
The fund seeks capital appreciation.
Fee Table
The following table describes the fees and expenses that may be incurred when you buy and hold shares of the fund.
Shareholder fees
| (fees paid directly from your investment) | None |
Annual Operating Expenses
(expenses that you pay each year as a % of the value of your investment)
| Management fee | 0.54% | |
| Distribution and/or Service (12b-1) fees | None | |
| Other expenses | 0.23% | |
| Total annual operating expenses | 0.77% |
This example helps compare the cost of investing in the fund with the cost of investing in other funds.
Let's say, hypothetically, that the annual return for shares of the fund is 5% and that your shareholder fees and the annual operating expenses for shares of the fund are exactly as described in the fee table. This example illustrates the effect of fees and expenses, but is not meant to suggest actual or expected fees and expenses or returns, all of which may vary. For every $10,000 you invested, here's how much you would pay in total expenses if you sell all of your shares at the end of each time period indicated:
| 1 year | $79 |
| 3 years | $246 |
| 5 years | $428 |
| 10 years | $954 |
Portfolio Turnover
The fund pays transaction costs, such as commissions, when it buys and sells securities (or "turns over" its portfolio). A higher portfolio turnover rate may indicate higher transaction costs and may result in higher taxes when fund shares are held in a taxable account. These costs, which are not reflected in annual operating expenses or in the example, affect the fund's performance. During the most recent fiscal year, the fund's portfolio turnover rate was 61% of the average value of its portfolio.
Principal Investment Strategies
- Normally investing primarily in common stocks.
- Normally investing at least 80% of assets in securities of companies principally engaged in providing financial services to consumers and industry.
- Investing in domestic and foreign issuers.
- Using fundamental analysis of factors such as each issuer's financial condition and industry position, as well as market and economic conditions, to select investments.
Principal Investment Risks
- Stock Market Volatility. Stock markets are volatile and can decline significantly in response to adverse issuer, political, regulatory, market, or economic developments. Different parts of the market, including different market sectors, and different types of securities can react differently to these developments.
- Foreign Exposure. Foreign markets can be more volatile than the U.S. market due to increased risks of adverse issuer, political, regulatory, market, or economic developments and can perform differently from the U.S. market.
- Financials Industry Concentration. The financials industries are subject to extensive government regulation, can be subject to relatively rapid change due to increasingly blurred distinctions between service segments, and can be significantly affected by availability and cost of capital funds, changes in interest rates, the rate of corporate and consumer debt defaults, and price competition.
- Issuer-Specific Changes. The value of an individual security or particular type of security can be more volatile than, and can perform differently from, the market as a whole. The value of securities of smaller issuers can be more volatile than that of larger issuers.
In addition, the fund is classified as non-diversified under the Investment Company Act of 1940 (1940 Act), which means that it has the ability to invest a greater portion of assets in securities of a smaller number of individual issuers than a diversified fund. As a result, changes in the market value of a single investment could cause greater fluctuations in share price than would occur in a more diversified fund.
An investment in the fund is not a deposit of a bank and is not insured or guaranteed by the Federal Deposit Insurance Corporation or any other government agency. You could lose money by investing in the fund.
Performance
The following information is intended to help you understand the risks of investing in the fund. The information illustrates the changes in the performance of the fund's shares from year to year and compares the performance of the fund's shares to the performance of a securities market index and an additional index over various periods of time. The indexes have characteristics relevant to the fund's investment strategies. Index descriptions appear in the "Additional Index Information" section of the prospectus. Past performance (before and after taxes) is not an indication of future performance.
Visit www.fidelity.com for more recent performance information.
Year-by-Year Returns
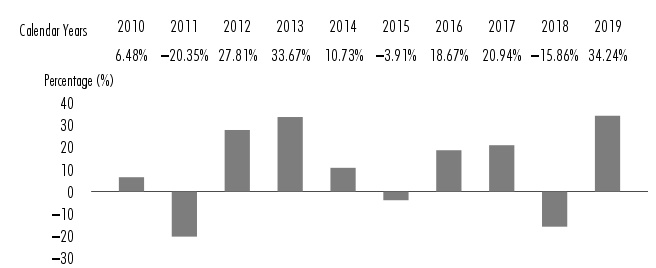
| During the periods shown in the chart: | Returns | Quarter ended |
| Highest Quarter Return | 23.10% | March 31, 2012 |
| Lowest Quarter Return | (23.01)% | September 30, 2011 |
| Year-to-Date Return | (34.99)% | March 31, 2020 |
Average Annual Returns
After-tax returns are calculated using the historical highest individual federal marginal income tax rates, but do not reflect the impact of state or local taxes. Actual after-tax returns may differ depending on your individual circumstances. The after-tax returns shown are not relevant if you hold your shares in a retirement account or in another tax-deferred arrangement, such as an employee benefit plan (profit sharing, 401(k), or 403(b) plan). Return After Taxes on Distributions and Sale of Fund Shares may be higher than other returns for the same period due to a tax benefit of realizing a capital loss upon the sale of fund shares.
| For the periods ended December 31, 2019 | Past 1 year | Past 5 years | Past 10 years |
| Financial Services Portfolio | |||
| Return Before Taxes | 34.24% | 9.27% | 9.59% |
| Return After Taxes on Distributions | 32.55% | 8.03% | 8.85% |
| Return After Taxes on Distributions and Sale of Fund Shares | 21.47% | 7.15% | 7.77% |
| S&P 500® Index (reflects no deduction for fees, expenses, or taxes) |
31.49% | 11.70% | 13.56% |
| MSCI US IMI Financials 5% Capped Linked Index (reflects no deduction for fees, expenses, or taxes) |
31.39% | 10.84% | 12.20% |
Investment Adviser
Fidelity Management & Research Company LLC (FMR) (the Adviser) is the fund's manager. Other investment advisers serve as sub-advisers for the fund.
Portfolio Manager(s)
Matt Reed (portfolio manager) has managed the fund since June 2019.
Purchase and Sale of Shares
You may buy or sell shares through a Fidelity® brokerage or mutual fund account, through a retirement account, or through an investment professional. You may buy or sell shares in various ways:
Internet
www.fidelity.com
Phone
Fidelity Automated Service Telephone (FAST®) 1-800-544-5555
To reach a Fidelity representative 1-800-544-6666
|
Additional purchases: Fidelity Investments |
Redemptions: Fidelity Investments |
TDD- Service for the Deaf and Hearing Impaired
1-800-544-0118
The price to buy one share is its net asset value per share (NAV). Shares will be bought at the NAV next calculated after an order is received in proper form.
The price to sell one share is its NAV. Shares will be sold at the NAV next calculated after an order is received in proper form.
The fund is open for business each day the New York Stock Exchange (NYSE) is open.
There is no purchase minimum for fund shares.
Tax Information
Distributions you receive from the fund are subject to federal income tax and generally will be taxed as ordinary income or capital gains, and may also be subject to state or local taxes, unless you are investing through a tax-advantaged retirement account (in which case you may be taxed later, upon withdrawal of your investment from such account).
Payments to Broker-Dealers and Other Financial Intermediaries
The fund, the Adviser, Fidelity Distributors Company LLC (FDC), and/or their affiliates may pay intermediaries, which may include banks, broker-dealers, retirement plan sponsors, administrators, or service-providers (who may be affiliated with the Adviser or FDC), for the sale of fund shares and related services. These payments may create a conflict of interest by influencing your intermediary and your investment professional to recommend the fund over another investment. Ask your investment professional or visit your intermediary's web site for more information.
Current regulations allow Fidelity to send a single copy of shareholder documents for Fidelity® funds, such as prospectuses, annual and semi-annual reports, and proxy materials, to certain mutual fund customers whom we believe are members of the same family who share the same address. For certain types of accounts, we will not send multiple copies of these documents to you and members of your family who share the same address. Instead, we will send only a single copy of these documents. This will continue for as long as you are a shareholder, unless you notify us otherwise. If at any time you choose to receive individual copies of any documents, please call 1-800-544-8544. We will begin sending individual copies to you within 30 days of receiving your call.
Fidelity Distributors Company LLC (FDC) is a member of the Securities Investor Protection Corporation (SIPC). You may obtain information about SIPC, including the SIPC brochure, by visiting www.sipc.org or calling SIPC at 202-371-8300.
Fidelity, Select Portfolios, Fidelity Investments & Pyramid Design, and FAST are registered service marks of FMR LLC. © 2020 FMR LLC. All rights reserved.
Any third-party marks that may appear above are the marks of their respective owners.
| 1.925632.115 | FIN-SUM-0420 |