| Label |
Element |
Value |
| Risk/Return: |
rr_RiskReturnAbstract |
|
|
| Registrant Name |
dei_EntityRegistrantName |
FIDELITY SELECT PORTFOLIOS
|
|
| Prospectus Date |
rr_ProspectusDate |
Sep. 29, 2018
|
|
| 07.31 Fidelity International Real Estate Fund AMCI PRO-08 | Fidelity International Real Estate Fund |
|
|
|
| Risk/Return: |
rr_RiskReturnAbstract |
|
|
| Risk/Return [Heading] |
rr_RiskReturnHeading |
<p style="font: bold 20pt Arial, Helvetica, sans-serif;">Fund Summary</p><p style="font: normal 12pt Arial, Helvetica, sans-serif;"><b>Fund/Class</b>:<br/><b>Fidelity® International Real Estate Fund</b>/Fidelity Advisor® International Real Estate Fund A, M, C, I</p>
|
|
| Objective [Heading] |
rr_ObjectiveHeading |
<font style="font: bold 16pt Arial, Helvetica, sans-serif;">Investment Objective</font>
|
|
| Objective, Primary [Text Block] |
rr_ObjectivePrimaryTextBlock |
The fund seeks capital appreciation.
|
|
| Expense [Heading] |
rr_ExpenseHeading |
<font style="font: bold 16pt Arial, Helvetica, sans-serif;"><b>Fee Table</b></font>
|
|
| Expense Narrative [Text Block] |
rr_ExpenseNarrativeTextBlock |
The following table describes the fees and expenses that may be incurred when you buy and hold shares of the fund. In addition to the fees and expenses described below, your broker may also require you to pay brokerage commissions on purchases and sales of certain share classes of the fund. You may qualify for sales charge discounts if you and your family invest, or agree to invest in the future, at least $50,000 in the fund or certain other Fidelity® funds. More information about these and other discounts is available from your investment professional and in the "Fund Distribution" section beginning on page 27 of the prospectus. Different intermediaries may provide additional waivers or reductions of the sales charge. Please see “Sales Charge Waiver Policies Applied by Certain Intermediaries” in the “Appendix” section of the prospectus.
|
|
| Shareholder Fees Caption [Text] |
rr_ShareholderFeesCaption |
<p style="font: bold 11pt Arial, sans-serif; margin-bottom: 0px;">Shareholder fees</p><p style="font: bold 9pt Arial, sans-serif; margin-top: 0px">(fees paid directly from your investment)</p>
|
|
| Operating Expenses Caption [Text] |
rr_OperatingExpensesCaption |
<p style="font: bold 11pt Arial, sans-serif; margin-bottom: 0px;">Annual Operating Expenses</p><p style="font: bold 9pt Arial, sans-serif; margin-top: 0px">(expenses that you pay each year as a % of the value of your investment)</p>
|
|
| Portfolio Turnover [Heading] |
rr_PortfolioTurnoverHeading |
<font style="font: bold 16pt Arial, Helvetica, sans-serif;"><b>Portfolio Turnover</b></font>
|
|
| Portfolio Turnover [Text Block] |
rr_PortfolioTurnoverTextBlock |
The fund pays transaction costs, such as commissions, when it buys and sells securities (or "turns over" its portfolio). A higher portfolio turnover rate may indicate higher transaction costs and may result in higher taxes when fund shares are held in a taxable account. These costs, which are not reflected in annual operating expenses or in the example, affect the fund's performance. During the most recent fiscal year, the fund's portfolio turnover rate was 56% of the average value of its portfolio.
|
|
| Portfolio Turnover, Rate |
rr_PortfolioTurnoverRate |
56.00%
|
|
| Expense Breakpoint Discounts [Text] |
rr_ExpenseBreakpointDiscounts |
<font style="FONT-FAMILY: Times New Roman" size="3">You may qualify for sales charge discounts if you and your family invest, or agree to invest in the future, at least $50,000 in the fund or certain other Fidelity® funds. More information about these and other discounts is available from your investment professional and in the "Fund Distribution" section beginning on page 27 of the prospectus.</font>
|
|
| Expense Breakpoint, Minimum Investment Required [Amount] |
rr_ExpenseBreakpointMinimumInvestmentRequiredAmount |
$ 50,000
|
|
| Expense Example Narrative [Text Block] |
rr_ExpenseExampleNarrativeTextBlock |
This example helps compare the cost of investing in the fund with the cost of investing in other funds. Let's say, hypothetically, that the annual return for shares of the fund is 5% and that your shareholder fees and the annual operating expenses for shares of the fund are exactly as described in the fee table. This example illustrates the effect of fees and expenses, but is not meant to suggest actual or expected fees and expenses or returns, all of which may vary. For every $10,000 you invested, here's how much you would pay in total expenses if you sell all of your shares at the end of each time period indicated and if you hold your shares:
|
|
| Expense Example by, Year, Caption [Text] |
rr_ExpenseExampleByYearCaption |
<p style="font: bold 9pt Arial, sans-serif; margin-top: 0px">Sell All Shares</p>
|
|
| Expense Example, No Redemption, By Year, Caption [Text] |
rr_ExpenseExampleNoRedemptionByYearCaption |
<p style="font: bold 9pt Arial, sans-serif; margin-top: 0px">Hold Shares</p>
|
|
| Strategy [Heading] |
rr_StrategyHeading |
<font style="font: bold 16pt Arial, Helvetica, sans-serif;"><b>Principal Investment Strategies</b></font>
|
|
| Strategy Narrative [Text Block] |
rr_StrategyNarrativeTextBlock |
- Normally investing primarily in non-U.S. securities.
- Normally investing primarily in common stocks.
- Normally investing at least 80% of assets in securities of companies principally engaged in the real estate industry and other real estate related investments.
- Allocating investments across different countries and regions.
- Using fundamental analysis of factors such as each issuer's financial condition and industry position, as well as market and economic conditions, to select investments.
|
|
| Strategy Portfolio Concentration [Text] |
rr_StrategyPortfolioConcentration |
<font style="FONT-FAMILY: Times New Roman" size="3">Normally investing at least 80% of assets in securities of companies principally engaged in the real estate industry and other real estate related investments.</font>
|
|
| Risk [Heading] |
rr_RiskHeading |
<font style="font: bold 16pt Arial, Helvetica, sans-serif;"><b>Principal Investment Risks</b></font>
|
|
| Risk Narrative [Text Block] |
rr_RiskNarrativeTextBlock |
- Stock Market Volatility. Stock markets are volatile and can decline significantly in response to adverse issuer, political, regulatory, market, or economic developments. Different parts of the market, including different market sectors, and different types of securities can react differently to these developments.
- Foreign Exposure. Foreign markets, particularly emerging markets, can be more volatile than the U.S. market due to increased risks of adverse issuer, political, regulatory, market, or economic developments and can perform differently from the U.S. market. Emerging markets can be subject to greater social, economic, regulatory, and political uncertainties and can be extremely volatile. Foreign exchange rates also can be extremely volatile.
- Real Estate Industry Concentration. Changes in real estate values or economic downturns can have a significant negative effect on issuers in the real estate industry. The value of securities of issuers in the real estate industry can be affected by changes in real estate values and rental income, property taxes, interest rates, tax and regulatory requirements, and the management skill and creditworthiness of the issuer.
- Issuer-Specific Changes. The value of an individual security or particular type of security can be more volatile than, and can perform differently from, the market as a whole.
In addition, the fund is classified as non-diversified under the Investment Company Act of 1940, which means that is has the ability to invest a greater portion of assets in securities of a smaller number of individual issuers than a diversified fund. As a result, changes in the market value of a single investment could cause greater fluctuations in share price than would occur in a more diversified fund. An investment in the fund is not a deposit of a bank and is not insured or guaranteed by the Federal Deposit Insurance Corporation or any other government agency. You could lose money by investing in the fund.
|
|
| Risk Lose Money [Text] |
rr_RiskLoseMoney |
<font style="FONT-FAMILY: Times New Roman" size="3">You could lose money by investing in the fund.</font>
|
|
| Risk Nondiversified Status [Text] |
rr_RiskNondiversifiedStatus |
<font style="FONT-FAMILY: Times New Roman" size="3">In addition, the fund is classified as non-diversified under the Investment Company Act of 1940, which means that is has the ability to invest a greater portion of assets in securities of a smaller number of individual issuers than a diversified fund. As a result, changes in the market value of a single investment could cause greater fluctuations in share price than would occur in a more diversified fund.</font>
|
|
| Risk Not Insured Depository Institution [Text] |
rr_RiskNotInsuredDepositoryInstitution |
<font style="FONT-FAMILY: Times New Roman" size="3">An investment in the fund is not a deposit of a bank and is not insured or guaranteed by the Federal Deposit Insurance Corporation or any other government agency.</font>
|
|
| Bar Chart and Performance Table [Heading] |
rr_BarChartAndPerformanceTableHeading |
<font style="font: bold 16pt Arial, Helvetica, sans-serif;"><b>Performance</b></font>
|
|
| Performance Narrative [Text Block] |
rr_PerformanceNarrativeTextBlock |
The following information is intended to help you understand the risks of investing in the fund. The information illustrates the changes in the performance of the fund's shares from year to year and compares the performance of the fund's shares to the performance of a securities market index and an additional index over various periods of time. The indexes have characteristics relevant to the fund's investment strategies. Index descriptions appear in the "Additional Index Information" section of the prospectus. Past performance (before and after taxes) is not an indication of future performance. Visit institutional.fidelity.com for more recent performance information.
|
|
| Performance Information Illustrates Variability of Returns [Text] |
rr_PerformanceInformationIllustratesVariabilityOfReturns |
<font style="FONT-FAMILY: Times New Roman" size="3">The information illustrates the changes in the performance of the fund's shares from year to year and compares the performance of the fund's shares to the performance of a securities market index and an additional index over various periods of time.</font>
|
|
| Performance Availability Website Address [Text] |
rr_PerformanceAvailabilityWebSiteAddress |
<font style="FONT-FAMILY: Times New Roman" size="3">institutional.fidelity.com</font>
|
|
| Performance Past Does Not Indicate Future [Text] |
rr_PerformancePastDoesNotIndicateFuture |
<font style="FONT-FAMILY: Times New Roman" size="3">Past performance (before and after taxes) is not an indication of future performance.</font>
|
|
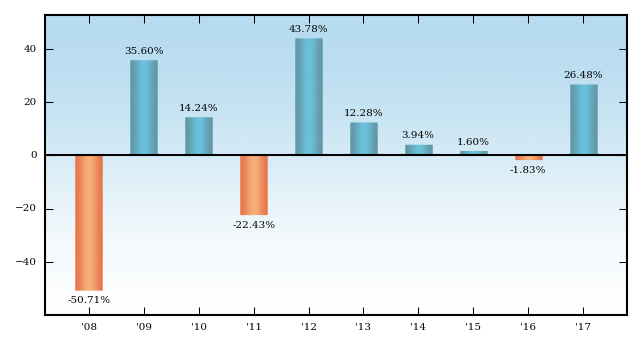
| Bar Chart [Heading] |
rr_BarChartHeading |
<p style="font:bold 11pt Arial, sans-serif; margin-bottom: 0px;">Year-by-Year Returns</p><p style="font: bold 9pt Arial, sans-serif; margin-top: 0px">Calendar Years</p>
|
|
| Bar Chart Narrative [Text Block] |
rr_BarChartNarrativeTextBlock |
The returns in the bar chart do not reflect any applicable sales charges; if sales charges were reflected, returns would be lower than those shown.
|
|
| Bar Chart Does Not Reflect Sales Loads [Text] |
rr_BarChartDoesNotReflectSalesLoads |
<font style="FONT-FAMILY: Times New Roman" size="3">The returns in the bar chart do not reflect any applicable sales charges; if sales charges were reflected, returns would be lower than those shown.</font>
|
|
| Bar Chart Closing [Text Block] |
rr_BarChartClosingTextBlock |
| During the periods shown in the chart for Class A: | Returns | Quarter ended | | Highest Quarter Return | 35.25% | June 30, 2009 | | Lowest Quarter Return | -24.43% | December 31, 2008 | | Year-to-Date Return | 0.00% | June 30, 2018 |
|
|
| Performance Table Heading |
rr_PerformanceTableHeading |
<font style="font: bold 16pt Arial, Helvetica, sans-serif;"><b>Average Annual Returns</b></font>
|
|
| Performance Table Does Reflect Sales Loads |
rr_PerformanceTableDoesReflectSalesLoads |
<font style="FONT-FAMILY: Times New Roman" size="3">Unlike the returns in the bar chart, the returns in the table reflect the maximum applicable sales charges.</font>
|
|
| Performance Table Uses Highest Federal Rate |
rr_PerformanceTableUsesHighestFederalRate |
<font style="FONT-FAMILY: Times New Roman" size="3">After-tax returns are calculated using the historical highest individual federal marginal income tax rates, but do not reflect the impact of state or local taxes.</font>
|
|
| Performance Table Not Relevant to Tax Deferred |
rr_PerformanceTableNotRelevantToTaxDeferred |
<font style="FONT-FAMILY: Times New Roman" size="3">The after-tax returns shown are not relevant if you hold your shares in a retirement account or in another tax-deferred arrangement, such as an employee benefit plan (profit sharing, 401(k), or 403(b) plan).</font>
|
|
| Performance Table One Class of after Tax Shown [Text] |
rr_PerformanceTableOneClassOfAfterTaxShown |
<font style="FONT-FAMILY: Times New Roman" size="3">After-tax returns for Class A are shown in the table below and after-tax returns for other classes will vary.</font>
|
|
| Performance Table Explanation after Tax Higher |
rr_PerformanceTableExplanationAfterTaxHigher |
<font style="FONT-FAMILY: Times New Roman" size="3">Return After Taxes on Distributions and Sale of Fund Shares may be higher than other returns for the same period due to a tax benefit of realizing a capital loss upon the sale of fund shares.</font>
|
|
| Performance Table Narrative |
rr_PerformanceTableNarrativeTextBlock |
Unlike the returns in the bar chart, the returns in the table reflect the maximum applicable sales charges. After-tax returns are calculated using the historical highest individual federal marginal income tax rates, but do not reflect the impact of state or local taxes. After-tax returns for Class A are shown in the table below and after-tax returns for other classes will vary. Actual after-tax returns may differ depending on your individual circumstances. The after-tax returns shown are not relevant if you hold your shares in a retirement account or in another tax-deferred arrangement, such as an employee benefit plan (profit sharing, 401(k), or 403(b) plan). Return After Taxes on Distributions and Sale of Fund Shares may be higher than other returns for the same period due to a tax benefit of realizing a capital loss upon the sale of fund shares. For the periods ended December 31, 2017
|
|
| 07.31 Fidelity International Real Estate Fund AMCI PRO-08 | Fidelity International Real Estate Fund | Fidelity Advisor International Real Estate Fund: Class A |
|
|
|
| Risk/Return: |
rr_RiskReturnAbstract |
|
|
| Maximum sales charge (load) on purchases (as a % of offering price) |
rr_MaximumCumulativeSalesChargeOverOfferingPrice |
5.75%
|
|
| Maximum contingent deferred sales charge (as a % of the lesser of original purchase price or redemption proceeds) |
rr_MaximumDeferredSalesChargeOverOther |
none
|
[1] |
| Management fee |
rr_ManagementFeesOverAssets |
0.69%
|
|
| Distribution and/or Service (12b-1) fees |
rr_DistributionAndService12b1FeesOverAssets |
0.25%
|
|
| Other expenses |
rr_OtherExpensesOverAssets |
0.42%
|
|
| Total annual operating expenses |
rr_ExpensesOverAssets |
1.36%
|
|
| Expenses Deferred Charges [Text Block] |
rr_ExpensesDeferredChargesTextBlock |
Class A and Class M purchases of $1 million or more will not be subject to a front-end sales charge. Such Class A and Class M purchases may be subject, upon redemption, to a contingent deferred sales charge (CDSC) of 1.00% or 0.25%, respectively.
|
|
| 1 year |
rr_ExpenseExampleYear01 |
$ 706
|
|
| 3 years |
rr_ExpenseExampleYear03 |
981
|
|
| 5 years |
rr_ExpenseExampleYear05 |
1,277
|
|
| 10 years |
rr_ExpenseExampleYear10 |
2,116
|
|
| 1 Year |
rr_ExpenseExampleNoRedemptionYear01 |
706
|
|
| 3 Years |
rr_ExpenseExampleNoRedemptionYear03 |
981
|
|
| 5 Years |
rr_ExpenseExampleNoRedemptionYear05 |
1,277
|
|
| 10 Years |
rr_ExpenseExampleNoRedemptionYear10 |
$ 2,116
|
|
| 2008 |
rr_AnnualReturn2008 |
(50.71%)
|
|
| 2009 |
rr_AnnualReturn2009 |
35.60%
|
|
| 2010 |
rr_AnnualReturn2010 |
14.24%
|
|
| 2011 |
rr_AnnualReturn2011 |
(22.43%)
|
|
| 2012 |
rr_AnnualReturn2012 |
43.78%
|
|
| 2013 |
rr_AnnualReturn2013 |
12.28%
|
|
| 2014 |
rr_AnnualReturn2014 |
3.94%
|
|
| 2015 |
rr_AnnualReturn2015 |
1.60%
|
|
| 2016 |
rr_AnnualReturn2016 |
(1.83%)
|
|
| 2017 |
rr_AnnualReturn2017 |
26.48%
|
|
| Year to Date Return, Label |
rr_YearToDateReturnLabel |
Year-to-Date Return
|
|
| Bar Chart, Year to Date Return, Date |
rr_BarChartYearToDateReturnDate |
Jun. 30, 2018
|
|
| Bar Chart, Year to Date Return |
rr_BarChartYearToDateReturn |
none
|
|
| Highest Quarterly Return, Label |
rr_HighestQuarterlyReturnLabel |
Highest Quarter Return
|
|
| Highest Quarterly Return, Date |
rr_BarChartHighestQuarterlyReturnDate |
Jun. 30, 2009
|
|
| Highest Quarterly Return |
rr_BarChartHighestQuarterlyReturn |
35.25%
|
|
| Lowest Quarterly Return, Label |
rr_LowestQuarterlyReturnLabel |
Lowest Quarter Return
|
|
| Lowest Quarterly Return, Date |
rr_BarChartLowestQuarterlyReturnDate |
Dec. 31, 2008
|
|
| Lowest Quarterly Return |
rr_BarChartLowestQuarterlyReturn |
(24.43%)
|
|
| 07.31 Fidelity International Real Estate Fund AMCI PRO-08 | Fidelity International Real Estate Fund | Fidelity Advisor International Real Estate Fund: Class M |
|
|
|
| Risk/Return: |
rr_RiskReturnAbstract |
|
|
| Maximum sales charge (load) on purchases (as a % of offering price) |
rr_MaximumCumulativeSalesChargeOverOfferingPrice |
3.50%
|
|
| Maximum contingent deferred sales charge (as a % of the lesser of original purchase price or redemption proceeds) |
rr_MaximumDeferredSalesChargeOverOther |
none
|
[1] |
| Management fee |
rr_ManagementFeesOverAssets |
0.69%
|
|
| Distribution and/or Service (12b-1) fees |
rr_DistributionAndService12b1FeesOverAssets |
0.50%
|
|
| Other expenses |
rr_OtherExpensesOverAssets |
0.46%
|
|
| Total annual operating expenses |
rr_ExpensesOverAssets |
1.65%
|
|
| Expenses Deferred Charges [Text Block] |
rr_ExpensesDeferredChargesTextBlock |
Class A and Class M purchases of $1 million or more will not be subject to a front-end sales charge. Such Class A and Class M purchases may be subject, upon redemption, to a contingent deferred sales charge (CDSC) of 1.00% or 0.25%, respectively.
|
|
| 1 year |
rr_ExpenseExampleYear01 |
$ 512
|
|
| 3 years |
rr_ExpenseExampleYear03 |
852
|
|
| 5 years |
rr_ExpenseExampleYear05 |
1,216
|
|
| 10 years |
rr_ExpenseExampleYear10 |
2,236
|
|
| 1 Year |
rr_ExpenseExampleNoRedemptionYear01 |
512
|
|
| 3 Years |
rr_ExpenseExampleNoRedemptionYear03 |
852
|
|
| 5 Years |
rr_ExpenseExampleNoRedemptionYear05 |
1,216
|
|
| 10 Years |
rr_ExpenseExampleNoRedemptionYear10 |
$ 2,236
|
|
| 07.31 Fidelity International Real Estate Fund AMCI PRO-08 | Fidelity International Real Estate Fund | Fidelity Advisor International Real Estate Fund: Class C |
|
|
|
| Risk/Return: |
rr_RiskReturnAbstract |
|
|
| Maximum sales charge (load) on purchases (as a % of offering price) |
rr_MaximumCumulativeSalesChargeOverOfferingPrice |
none
|
|
| Maximum contingent deferred sales charge (as a % of the lesser of original purchase price or redemption proceeds) |
rr_MaximumDeferredSalesChargeOverOther |
1.00%
|
[2] |
| Management fee |
rr_ManagementFeesOverAssets |
0.69%
|
|
| Distribution and/or Service (12b-1) fees |
rr_DistributionAndService12b1FeesOverAssets |
1.00%
|
|
| Other expenses |
rr_OtherExpensesOverAssets |
0.36%
|
|
| Total annual operating expenses |
rr_ExpensesOverAssets |
2.05%
|
|
| Expenses Deferred Charges [Text Block] |
rr_ExpensesDeferredChargesTextBlock |
On Class C shares redeemed less than one year after purchase.
|
|
| 1 year |
rr_ExpenseExampleYear01 |
$ 308
|
|
| 3 years |
rr_ExpenseExampleYear03 |
643
|
|
| 5 years |
rr_ExpenseExampleYear05 |
1,103
|
|
| 10 years |
rr_ExpenseExampleYear10 |
2,379
|
|
| 1 Year |
rr_ExpenseExampleNoRedemptionYear01 |
208
|
|
| 3 Years |
rr_ExpenseExampleNoRedemptionYear03 |
643
|
|
| 5 Years |
rr_ExpenseExampleNoRedemptionYear05 |
1,103
|
|
| 10 Years |
rr_ExpenseExampleNoRedemptionYear10 |
$ 2,379
|
|
| 07.31 Fidelity International Real Estate Fund AMCI PRO-08 | Fidelity International Real Estate Fund | Fidelity Advisor International Real Estate Fund: Class I |
|
|
|
| Risk/Return: |
rr_RiskReturnAbstract |
|
|
| Maximum sales charge (load) on purchases (as a % of offering price) |
rr_MaximumCumulativeSalesChargeOverOfferingPrice |
none
|
|
| Maximum contingent deferred sales charge (as a % of the lesser of original purchase price or redemption proceeds) |
rr_MaximumDeferredSalesChargeOverOther |
none
|
|
| Management fee |
rr_ManagementFeesOverAssets |
0.69%
|
|
| Distribution and/or Service (12b-1) fees |
rr_DistributionAndService12b1FeesOverAssets |
none
|
|
| Other expenses |
rr_OtherExpensesOverAssets |
0.27%
|
|
| Total annual operating expenses |
rr_ExpensesOverAssets |
0.96%
|
|
| 1 year |
rr_ExpenseExampleYear01 |
$ 98
|
|
| 3 years |
rr_ExpenseExampleYear03 |
306
|
|
| 5 years |
rr_ExpenseExampleYear05 |
531
|
|
| 10 years |
rr_ExpenseExampleYear10 |
1,178
|
|
| 1 Year |
rr_ExpenseExampleNoRedemptionYear01 |
98
|
|
| 3 Years |
rr_ExpenseExampleNoRedemptionYear03 |
306
|
|
| 5 Years |
rr_ExpenseExampleNoRedemptionYear05 |
531
|
|
| 10 Years |
rr_ExpenseExampleNoRedemptionYear10 |
$ 1,178
|
|
| 07.31 Fidelity International Real Estate Fund AMCI PRO-08 | Fidelity International Real Estate Fund | Return Before Taxes | Fidelity Advisor International Real Estate Fund: Class A |
|
|
|
| Risk/Return: |
rr_RiskReturnAbstract |
|
|
| Column |
rr_AverageAnnualReturnColumnName |
Fidelity International Real Estate Fund
|
|
| Label |
rr_AverageAnnualReturnLabel |
<font style="FONT-FAMILY: Times New Roman" ><b>Class A - Return Before Taxes</b></font>
|
|
| Past 1 year |
rr_AverageAnnualReturnYear01 |
19.20%
|
|
| Past 5 years |
rr_AverageAnnualReturnYear05 |
6.77%
|
|
| Past 10 years |
rr_AverageAnnualReturnYear10 |
1.68%
|
|
| 07.31 Fidelity International Real Estate Fund AMCI PRO-08 | Fidelity International Real Estate Fund | Return Before Taxes | Fidelity Advisor International Real Estate Fund: Class M |
|
|
|
| Risk/Return: |
rr_RiskReturnAbstract |
|
|
| Column |
rr_AverageAnnualReturnColumnName |
Fidelity International Real Estate Fund
|
|
| Label |
rr_AverageAnnualReturnLabel |
<font style="FONT-FAMILY: Times New Roman" ><b>Class M - Return Before Taxes</b></font>
|
|
| Past 1 year |
rr_AverageAnnualReturnYear01 |
21.72%
|
|
| Past 5 years |
rr_AverageAnnualReturnYear05 |
6.96%
|
|
| Past 10 years |
rr_AverageAnnualReturnYear10 |
1.64%
|
|
| 07.31 Fidelity International Real Estate Fund AMCI PRO-08 | Fidelity International Real Estate Fund | Return Before Taxes | Fidelity Advisor International Real Estate Fund: Class C |
|
|
|
| Risk/Return: |
rr_RiskReturnAbstract |
|
|
| Column |
rr_AverageAnnualReturnColumnName |
Fidelity International Real Estate Fund
|
|
| Label |
rr_AverageAnnualReturnLabel |
<font style="FONT-FAMILY: Times New Roman" ><b>Class C - Return Before Taxes</b></font>
|
|
| Past 1 year |
rr_AverageAnnualReturnYear01 |
24.46%
|
|
| Past 5 years |
rr_AverageAnnualReturnYear05 |
7.24%
|
|
| Past 10 years |
rr_AverageAnnualReturnYear10 |
1.52%
|
|
| 07.31 Fidelity International Real Estate Fund AMCI PRO-08 | Fidelity International Real Estate Fund | Return Before Taxes | Fidelity Advisor International Real Estate Fund: Class I |
|
|
|
| Risk/Return: |
rr_RiskReturnAbstract |
|
|
| Column |
rr_AverageAnnualReturnColumnName |
Fidelity International Real Estate Fund
|
|
| Label |
rr_AverageAnnualReturnLabel |
<font style="FONT-FAMILY: Times New Roman" ><b>Class I - Return Before Taxes</b></font>
|
|
| Past 1 year |
rr_AverageAnnualReturnYear01 |
26.94%
|
|
| Past 5 years |
rr_AverageAnnualReturnYear05 |
8.40%
|
|
| Past 10 years |
rr_AverageAnnualReturnYear10 |
2.59%
|
|
| 07.31 Fidelity International Real Estate Fund AMCI PRO-08 | Fidelity International Real Estate Fund | After Taxes on Distributions | Fidelity Advisor International Real Estate Fund: Class A |
|
|
|
| Risk/Return: |
rr_RiskReturnAbstract |
|
|
| Column |
rr_AverageAnnualReturnColumnName |
Fidelity International Real Estate Fund
|
|
| Label |
rr_AverageAnnualReturnLabel |
<font style="FONT-FAMILY: Times New Roman" ><b>Return After Taxes on Distributions</b></font>
|
|
| Past 1 year |
rr_AverageAnnualReturnYear01 |
18.30%
|
|
| Past 5 years |
rr_AverageAnnualReturnYear05 |
5.43%
|
|
| Past 10 years |
rr_AverageAnnualReturnYear10 |
0.49%
|
|
| 07.31 Fidelity International Real Estate Fund AMCI PRO-08 | Fidelity International Real Estate Fund | After Taxes on Distributions and Sales | Fidelity Advisor International Real Estate Fund: Class A |
|
|
|
| Risk/Return: |
rr_RiskReturnAbstract |
|
|
| Column |
rr_AverageAnnualReturnColumnName |
Fidelity International Real Estate Fund
|
|
| Label |
rr_AverageAnnualReturnLabel |
<font style="FONT-FAMILY: Times New Roman" ><b>Return After Taxes on Distributions and Sale of Fund Shares</b></font>
|
|
| Past 1 year |
rr_AverageAnnualReturnYear01 |
11.38%
|
|
| Past 5 years |
rr_AverageAnnualReturnYear05 |
4.76%
|
|
| Past 10 years |
rr_AverageAnnualReturnYear10 |
0.81%
|
|
| 07.31 Fidelity International Real Estate Fund AMCI PRO-08 | Fidelity International Real Estate Fund | MSCI EAFE Index(reflects no deduction for fees or expenses) |
|
|
|
| Risk/Return: |
rr_RiskReturnAbstract |
|
|
| Past 1 year |
rr_AverageAnnualReturnYear01 |
25.29%
|
|
| Past 5 years |
rr_AverageAnnualReturnYear05 |
8.07%
|
|
| Past 10 years |
rr_AverageAnnualReturnYear10 |
2.10%
|
|
| 07.31 Fidelity International Real Estate Fund AMCI PRO-08 | Fidelity International Real Estate Fund | FTSE® EPRA℠/NAREIT® Developed ex North America Index(reflects no deduction for fees, expenses, or taxes) |
|
|
|
| Risk/Return: |
rr_RiskReturnAbstract |
|
|
| Past 1 year |
rr_AverageAnnualReturnYear01 |
21.02%
|
|
| Past 5 years |
rr_AverageAnnualReturnYear05 |
5.87%
|
|
| Past 10 years |
rr_AverageAnnualReturnYear10 |
1.96%
|
|
|
|