Gold Portfolio
Class/Ticker
Fidelity Advisor® Gold Fund
Z/FIJDX
Summary Prospectus
September 29, 2018
Before you invest, you may want to review the fund's prospectus, which contains more information about the fund and its risks. You can find the fund's prospectus and other information about the fund (including the fund's SAI) online at institutional.fidelity.com/fafunddocuments. You can also get this information at no cost by calling 1-866-997-1254 or by sending an e-mail request to funddocuments@fmr.com. The fund's prospectus and SAI dated September 29, 2018 are incorporated herein by reference.
245 Summer Street, Boston, MA 02210
Fund Summary
Fund/Class:
Gold Portfolio
/Fidelity Advisor® Gold Fund Z
Investment Objective
The fund seeks capital appreciation.
Fee Table
The following table describes the fees and expenses that may be incurred when you buy and hold shares of the fund. In addition to the fees and expenses described below, your broker may also require you to pay brokerage commissions on purchases and sales of certain share classes of the fund.
Shareholder fees
| (fees paid directly from your investment) | None |
Annual Operating Expenses
(expenses that you pay each year as a % of the value of your investment)
| Management fee | 0.54% | |
| Distribution and/or Service (12b-1) fees | None | |
| Other expenses(a) | 0.13% | |
| Acquired fund fees and expenses(b),(c) | 0.03% | |
| Total annual operating expenses | 0.70% |
(a) Based on estimated amounts for the current fiscal year.
(b) Based on historical expenses, adjusted to reflect current fees.
(c) The fund may invest in a wholly-owned subsidiary. The subsidiary has entered into a separate contract with Fidelity Management & Research Company (FMR), an affiliate of Fidelity SelectCo, LLC (SelectCo), the fund's investment adviser, for the management of its portfolio pursuant to which the subsidiary pays FMR a fee at an annual rate of 0.30% of its net assets. The subsidiary also pays certain other expenses including custody fees. SelectCo has contractually agreed to waive the fund's management fee in an amount equal to the management fee paid to FMR by the subsidiary. This arrangement will remain in effect for at least one year from the effective date of the prospectus, and will remain in effect thereafter as long as FMR's contract with the subsidiary is in place, and neither SelectCo nor any of its affiliates retain the ability to be repaid with respect to this arrangement. If FMR's contract with the subsidiary is terminated, SelectCo, in its sole discretion, may discontinue the arrangement.
This example helps compare the cost of investing in the fund with the cost of investing in other funds.
Let's say, hypothetically, that the annual return for shares of the fund is 5% and that your shareholder fees and the annual operating expenses for shares of the fund are exactly as described in the fee table. This example illustrates the effect of fees and expenses, but is not meant to suggest actual or expected fees and expenses or returns, all of which may vary. For every $10,000 you invested, here's how much you would pay in total expenses if you sell all of your shares at the end of each time period indicated:
| 1 year | $72 |
| 3 years | $224 |
| 5 years | $390 |
| 10 years | $871 |
Portfolio Turnover
The fund pays transaction costs, such as commissions, when it buys and sells securities (or "turns over" its portfolio). A higher portfolio turnover rate may indicate higher transaction costs and may result in higher taxes when fund shares are held in a taxable account. These costs, which are not reflected in annual operating expenses or in the example, affect the fund's performance. During the most recent fiscal year, the fund's portfolio turnover rate was 13% of the average value of its portfolio.
Principal Investment Strategies
- Normally investing primarily in common stocks and in certain precious metals.
- Investing primarily in companies engaged in exploration, mining, processing, or dealing in gold, or to a lesser degree, in silver, platinum, diamonds, or other precious metals and minerals.
- Normally investing at least 80% of assets in securities of companies principally engaged in gold-related activities, and in gold bullion or coins.
- Investing up to 25% of assets in gold and other precious metals through a wholly-owned subsidiary organized under the laws of the Cayman Islands.
- Potentially investing in other precious metals, instruments whose value is linked to the price of precious metals, and securities of companies that manufacture and distribute precious metal and minerals products (such as jewelry, watches, and metal foil and leaf) and companies that invest in other companies engaged in gold and other precious metal and mineral-related activities.
- Investing in domestic and foreign issuers.
- Using fundamental analysis of factors such as each issuer's financial condition and industry position, as well as market and economic conditions, to select investments.
Principal Investment Risks
- Stock Market Volatility. Stock markets are volatile and can decline significantly in response to adverse issuer, political, regulatory, market, or economic developments. Different parts of the market, including different market sectors, and different types of securities can react differently to these developments.
- Foreign Exposure. Foreign markets, particularly emerging markets, can be more volatile than the U.S. market due to increased risks of adverse issuer, political, regulatory, market, or economic developments and can perform differently from the U.S. market. Emerging markets can be subject to greater social, economic, regulatory, and political uncertainties and can be extremely volatile. Foreign exchange rates also can be extremely volatile.
- Gold Industry Concentration. The gold industry can be significantly affected by international monetary and political developments such as currency devaluations or revaluations, central bank movements, economic and social conditions within a country, trade imbalances, or trade or currency restrictions between countries, as well as supply and demand for gold and operational costs associated with mining.
- Subsidiary Risk. Investment in an unregistered subsidiary is not subject to the investor protections of the Investment Company Act of 1940 (1940 Act) and is subject to the risks associated with the gold industry. Changes in tax and other laws could negatively affect investments in the subsidiary.
- Issuer-Specific Changes. The value of an individual security or particular type of security can be more volatile than, and can perform differently from, the market as a whole. The value of securities of smaller issuers can be more volatile than that of larger issuers.
In addition, the fund is classified as non-diversified under the Investment Company Act of 1940, which means that it has the ability to invest a greater portion of assets in securities of a smaller number of individual issuers than a diversified fund. As a result, changes in the market value of a single investment could cause greater fluctuations in share price than would occur in a more diversified fund.
An investment in the fund is not a deposit of a bank and is not insured or guaranteed by the Federal Deposit Insurance Corporation or any other government agency. You could lose money by investing in the fund.
Performance
The following information is intended to help you understand the risks of investing in the fund. The information illustrates the changes in the performance of Class I shares from year to year and compares the performance of Class I shares to the performance of a securities market index and an additional index over various periods of time. The indexes have characteristics relevant to the fund's investment strategies. Index descriptions appear in the "Additional Index Information" section of the prospectus. Past performance (before and after taxes) is not an indication of future performance.
Visit institutional.fidelity.com for more recent performance information.
Performance history will be available for Class Z after Class Z has been in operation for one calendar year.
Year-by-Year Returns*
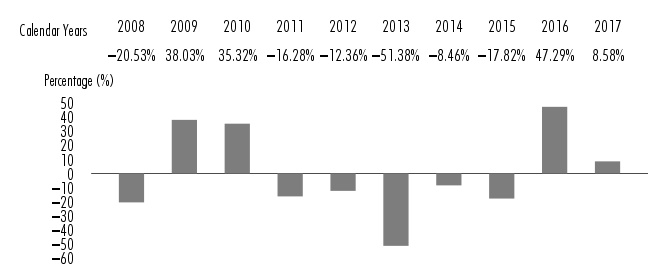
| During the periods shown in the chart: | Returns | Quarter ended |
| Highest Quarter Return | 41.01% | March 31, 2016 |
| Lowest Quarter Return | (37.34)% | June 30, 2013 |
| Year-to-Date Return | (8.09)% | June 30, 2018 |
* The returns shown above are for Class I, which is not offered through this prospectus. Class Z would have substantially similar annual returns to Class I because the classes are invested in the same portfolio of securities. Class Z's returns would differ from Class I's returns to the extent that the classes do not have the same expenses.
Average Annual Returns*
After-tax returns are calculated using the historical highest individual federal marginal income tax rates, but do not reflect the impact of state or local taxes. Actual after-tax returns may differ depending on your individual circumstances. The after-tax returns shown are not relevant if you hold your shares in a retirement account or in another tax-deferred arrangement, such as an employee benefit plan (profit sharing, 401(k), or 403(b) plan). Return After Taxes on Distributions and Sale of Fund Shares may be higher than other returns for the same period due to a tax benefit of realizing a capital loss upon the sale of fund shares.
| For the periods ended December 31, 2017 | Past 1 year | Past 5 years | Past 10 years |
| Class I | |||
| Return Before Taxes | 8.58% | (10.17)% | (4.41)% |
| Return After Taxes on Distributions | 8.50% | (10.44)% | (4.94)% |
| Return After Taxes on Distributions and Sale of Fund Shares | 4.88% | (7.42)% | (2.98)% |
| S&P 500® Index (reflects no deduction for fees, expenses, or taxes) |
21.83% | 15.79% | 8.50% |
| S&P® Global BMI Gold Capped 20/45 Linked Index (reflects no deduction for fees, expenses, or taxes) |
11.59% | (9.89)% | (4.79)% |
* The returns shown above are for Class I, which is not offered through this prospectus. Class Z would have substantially similar annual returns to Class I because the classes are invested in the same portfolio of securities. Class Z's returns would differ from Class I's returns to the extent that the classes do not have the same expenses.
Investment Adviser
Fidelity SelectCo, LLC (SelectCo) (the Adviser), an affiliate of Fidelity Management & Research Company (FMR), is the fund's manager. FMR Co., Inc. (FMRC), and other investment advisers serve as sub-advisers for the fund.
Portfolio Manager(s)
Joe Wickwire (lead portfolio manager) has managed the fund since August 2007.
Steve Calhoun (co-manager) has managed the fund since September 2018.
It is expected that Mr. Wickwire will retire effective as of the close of business on or about March 29, 2019. Thereafter, Mr. Calhoun will assume sole portfolio manager responsibilities for the fund.
Purchase and Sale of Shares
You may buy or sell shares through a retirement account or through an investment professional. You may buy or sell shares in various ways:
Internet
institutional.fidelity.com
Phone
To reach a Fidelity representative 1-877-208-0098
| Fidelity Investments P.O. Box 770002 Cincinnati, OH 45277-0081 |
Overnight Express: Fidelity Investments 100 Crosby Parkway Covington, KY 41015 |
Class Z eligibility requirements are listed in the "Additional Information about the Purchase and Sale of Shares" section of the prospectus.
The price to buy one share is its net asset value per share (NAV). Shares will be bought at the NAV next calculated after an order is received in proper form.
The price to sell one share is its NAV. Shares will be sold at the NAV next calculated after an order is received in proper form.
The fund is open for business each day the New York Stock Exchange (NYSE) is open.
There is no purchase minimum for Class Z shares.
Tax Information
Distributions you receive from the fund are subject to federal income tax and generally will be taxed as ordinary income or capital gains, and may also be subject to state or local taxes, unless you are investing through a tax-advantaged retirement account (in which case you may be taxed later, upon withdrawal of your investment from such account).
Payments to Broker-Dealers and Other Financial Intermediaries
The fund, the Adviser, Fidelity Distributors Corporation (FDC), and/or their affiliates may pay intermediaries, which may include banks, broker-dealers, retirement plan sponsors, administrators, or service-providers (who may be affiliated with the Adviser or FDC), for the sale of fund shares and related services. These payments may create a conflict of interest by influencing your intermediary and your investment professional to recommend the fund over another investment. Ask your investment professional or visit your intermediary's web site for more information.
FDC is a member of the Securities Investor Protection Corporation (SIPC). You may obtain information about SIPC, including the SIPC brochure, by visiting www.sipc.org or calling SIPC at 202-371-8300.
Fidelity Advisor and Fidelity Investments & Pyramid Design are registered service marks of FMR LLC. © 2018 FMR LLC. All rights reserved.
Any third-party marks that may appear above are the marks of their respective owners.
| 1.9891044.100 | AGLDZ-SUM-0918 |