UNITED STATES
SECURITIES AND EXCHANGE COMMISSION
Washington, D.C. 20549
FORM N-CSR
CERTIFIED SHAREHOLDER REPORT OF REGISTERED
MANAGEMENT INVESTMENT COMPANIES
Investment Company Act file number 811-3114
Fidelity Select Portfolios
(Exact name of registrant as specified in charter)
245 Summer St., Boston, Massachusetts 02210
(Address of principal executive offices) (Zip code)
Marc Bryant, Secretary
245 Summer St.
Boston, Massachusetts 02210
(Name and address of agent for service)
Registrant's telephone number, including area code:
617-563-7000
| Date of fiscal year end: | February 29 |
| | |
| Date of reporting period: | August 31, 2015 |
Item 1.
Reports to Stockholders
|
Fidelity® Select Portfolios® Communications Equipment Portfolio Computers Portfolio Electronics Portfolio IT Services Portfolio Software and Computer Services Portfolio Technology Portfolio Semi-Annual Report August 31, 2015 |
 |
Contents
|
Communications Equipment Portfolio |
|
|
Computers Portfolio |
|
|
Electronics Portfolio |
|
|
IT Services Portfolio |
|
|
Software and Computer Services Portfolio |
|
|
Technology Portfolio |
|
To view a fund's proxy voting guidelines and proxy voting record for the 12-month period ended June 30, visit http://www.fidelity.com/proxyvotingresults or visit the Securities and Exchange Commission's (SEC) web site at http://www.sec.gov.
You may also call 1-800-544-8544 to request a free copy of the proxy voting guidelines.
Standard & Poor's, S&P and S&P 500 are registered service marks of The McGraw-Hill Companies, Inc. and have been licensed for use by Fidelity Distributors Corporation.
Other third-party marks appearing herein are the property of their respective owners.
All other marks appearing herein are registered or unregistered trademarks or service marks of FMR LLC or an affiliated company. © 2015 FMR LLC. All rights reserved.
This report and the financial statements contained herein are submitted for the general information of the shareholders of the Funds. This report is not authorized for distribution to prospective investors in the Funds unless preceded or accompanied by an effective prospectus.
A fund files its complete schedule of portfolio holdings with the SEC for the first and third quarters of each fiscal year on Form N-Q. Forms N-Q are available on the SEC’s web site at http://www.sec.gov. A fund's Forms N-Q may be reviewed and copied at the SEC’s Public Reference Room in Washington, DC. Information regarding the operation of the SEC's Public Reference Room may be obtained by calling 1-800-SEC-0330.
For a complete list of a fund's portfolio holdings, view the most recent holdings listing, semiannual report, or annual report on Fidelity's web site at http://www.fidelity.com, http://www.advisor.fidelity.com, or http://www.401k.com, as applicable.
NOT FDIC INSURED •MAY LOSE VALUE •NO BANK GUARANTEE
Neither the Funds nor Fidelity Distributors Corporation is a bank.
Communications Equipment Portfolio
Investment Summary (Unaudited)
Top Ten Stocks as of August 31, 2015
| % of fund's net assets | % of fund's net assets 6 months ago | |
| Cisco Systems, Inc. | 18.3 | 16.7 |
| QUALCOMM, Inc. | 18.1 | 18.5 |
| F5 Networks, Inc. | 6.7 | 3.5 |
| CommScope Holding Co., Inc. | 5.4 | 2.1 |
| Harris Corp. | 4.7 | 1.3 |
| Juniper Networks, Inc. | 4.6 | 5.4 |
| Telefonaktiebolaget LM Ericsson (B Shares) sponsored ADR | 4.1 | 4.7 |
| Brocade Communications Systems, Inc. | 4.0 | 2.5 |
| Nokia Corp. sponsored ADR | 3.7 | 4.7 |
| Alcatel-Lucent SA sponsored ADR | 3.6 | 4.1 |
| 73.2 |
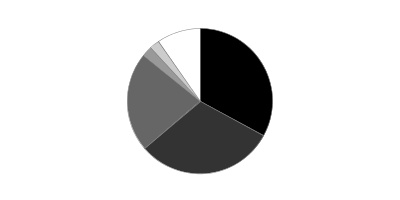
Top Industries (% of fund's net assets)
| As of August 31, 2015 | ||
| Communications Equipment | 91.6% | |
| Technology Hardware, Storage & Peripherals | 3.0% | |
| Semiconductors & Semiconductor Equipment | 1.8% | |
| Internet Software & Services | 1.3% | |
| Electronic Equipment & Components | 1.1% | |
| All Others* | 1.2% | |

| As of February 28, 2015 | ||
| Communications Equipment | 89.8% | |
| Technology Hardware, Storage & Peripherals | 2.5% | |
| Software | 1.8% | |
| Internet Software & Services | 1.8% | |
| Semiconductors & Semiconductor Equipment | 1.6% | |
| All Others* | 2.5% | |

* Includes short-term investments and net other assets (liabilities).
Communications Equipment Portfolio
Investments August 31, 2015 (Unaudited)
Showing Percentage of Net Assets
| Common Stocks - 99.8% | |||
| Shares | Value | ||
| Communications Equipment - 91.6% | |||
| Communications Equipment - 91.6% | |||
| ADTRAN, Inc. | 154,700 | $2,478,294 | |
| Alcatel-Lucent SA sponsored ADR (a) | 2,315,043 | 7,662,792 | |
| Arris Group, Inc. (a) | 110,100 | 2,908,842 | |
| AudioCodes Ltd. (a) | 98,400 | 332,592 | |
| Black Box Corp. | 6,700 | 103,180 | |
| Brocade Communications Systems, Inc. | 780,600 | 8,313,390 | |
| Calix Networks, Inc. (a) | 17,500 | 140,175 | |
| Ciena Corp. (a) | 9,900 | 221,364 | |
| Cisco Systems, Inc. | 1,482,376 | 38,363,890 | |
| CommScope Holding Co., Inc. (a) | 348,900 | 11,286,915 | |
| EchoStar Holding Corp. Class A (a) | 4,600 | 205,160 | |
| Extreme Networks, Inc. (a) | 21,300 | 63,900 | |
| F5 Networks, Inc. (a) | 114,935 | 13,954,258 | |
| Finisar Corp. (a)(b) | 263,600 | 4,067,348 | |
| Harris Corp. | 129,500 | 9,948,190 | |
| Infinera Corp. (a) | 25,225 | 550,410 | |
| InterDigital, Inc. | 50,500 | 2,498,235 | |
| Ixia (a) | 117,800 | 1,822,366 | |
| Juniper Networks, Inc. | 375,012 | 9,641,559 | |
| Lumentum Holdings, Inc. (a) | 45,520 | 898,565 | |
| Mitel Networks Corp. (a)(b) | 77,600 | 571,912 | |
| Motorola Solutions, Inc. | 61,281 | 3,972,234 | |
| NETGEAR, Inc. (a) | 16,950 | 514,941 | |
| Nokia Corp. sponsored ADR (b) | 1,254,920 | 7,830,701 | |
| Plantronics, Inc. | 70,500 | 3,747,780 | |
| Polycom, Inc. (a) | 114,763 | 1,234,850 | |
| QUALCOMM, Inc. | 671,319 | 37,983,229 | |
| Radware Ltd. (a) | 203,100 | 3,779,691 | |
| Ruckus Wireless, Inc. (a) | 440,300 | 4,984,196 | |
| Sandvine Corp. (U.K.) (a) | 86,300 | 211,224 | |
| Sonus Networks, Inc. (a) | 139,760 | 983,910 | |
| Telefonaktiebolaget LM Ericsson (B Shares) sponsored ADR | 882,280 | 8,611,053 | |
| ViaSat, Inc. (a) | 1,400 | 82,278 | |
| Viavi Solutions, Inc. (a) | 227,600 | 1,222,212 | |
| Wi-Lan, Inc. | 388,400 | 794,159 | |
| 191,985,795 | |||
| Diversified Telecommunication Services - 0.1% | |||
| Alternative Carriers - 0.1% | |||
| Vonage Holdings Corp. (a) | 54,300 | 301,365 | |
| Electronic Equipment & Components - 1.1% | |||
| Electronic Components - 0.2% | |||
| II-VI, Inc. (a) | 23,900 | 403,671 | |
| Electronic Manufacturing Services - 0.9% | |||
| TE Connectivity Ltd. | 32,100 | 1,903,209 | |
| TOTAL ELECTRONIC EQUIPMENT & COMPONENTS | 2,306,880 | ||
| Internet Software & Services - 1.3% | |||
| Internet Software & Services - 1.3% | |||
| Google, Inc.: | |||
| Class A (a) | 1,000 | 647,820 | |
| Class C | 1,355 | 837,729 | |
| Rackspace Hosting, Inc. (a) | 14,900 | 453,109 | |
| Web.com Group, Inc. (a) | 39,300 | 846,129 | |
| 2,784,787 | |||
| Semiconductors & Semiconductor Equipment - 1.8% | |||
| Semiconductors - 1.8% | |||
| Broadcom Corp. Class A | 11,200 | 578,704 | |
| EZchip Semiconductor Ltd. (a)(b) | 16,200 | 371,304 | |
| GSI Technology, Inc. (a) | 51,485 | 239,920 | |
| Marvell Technology Group Ltd. | 110,000 | 1,239,700 | |
| Maxim Integrated Products, Inc. | 26,700 | 898,989 | |
| Semtech Corp. (a) | 21,000 | 355,950 | |
| 3,684,567 | |||
| Software - 0.9% | |||
| Application Software - 0.1% | |||
| BroadSoft, Inc. (a) | 1,900 | 59,964 | |
| Comverse, Inc. (a) | 6,800 | 128,112 | |
| 188,076 | |||
| Systems Software - 0.8% | |||
| Oracle Corp. | 22,100 | 819,689 | |
| Rovi Corp. (a) | 71,300 | 789,291 | |
| 1,608,980 | |||
| TOTAL SOFTWARE | 1,797,056 | ||
| Technology Hardware, Storage & Peripherals - 3.0% | |||
| Technology Hardware, Storage & Peripherals - 3.0% | |||
| BlackBerry Ltd. (a) | 435,400 | 3,302,898 | |
| Hewlett-Packard Co. | 38,300 | 1,074,698 | |
| QLogic Corp. (a) | 90,200 | 932,668 | |
| Samsung Electronics Co. Ltd. | 1,024 | 942,889 | |
| 6,253,153 | |||
| TOTAL COMMON STOCKS | |||
| (Cost $209,890,050) | 209,113,603 | ||
| Money Market Funds - 2.7% | |||
| Fidelity Cash Central Fund, 0.15% (c) | 133,113 | 133,113 | |
| Fidelity Securities Lending Cash Central Fund, 0.19% (c)(d) | 5,618,300 | 5,618,300 | |
| TOTAL MONEY MARKET FUNDS | |||
| (Cost $5,751,413) | 5,751,413 | ||
| TOTAL INVESTMENT PORTFOLIO - 102.5% | |||
| (Cost $215,641,463) | 214,865,016 | ||
| NET OTHER ASSETS (LIABILITIES) - (2.5)% | (5,252,601) | ||
| NET ASSETS - 100% | $209,612,415 |
Legend
(a) Non-income producing
(b) Security or a portion of the security is on loan at period end.
(c) Affiliated fund that is generally available only to investment companies and other accounts managed by Fidelity Investments. The rate quoted is the annualized seven-day yield of the fund at period end. A complete unaudited listing of the fund's holdings as of its most recent quarter end is available upon request. In addition, each Fidelity Central Fund's financial statements are available on the SEC's website or upon request.
(d) Investment made with cash collateral received from securities on loan.
Affiliated Central Funds
Information regarding fiscal year to date income earned by the Fund from investments in Fidelity Central Funds is as follows:
| Fund | Income earned |
| Fidelity Cash Central Fund | $990 |
| Fidelity Securities Lending Cash Central Fund | 34,533 |
| Total | $35,523 |
Investment Valuation
All investments are categorized as Level 1 under the Fair Value Hierarchy. The inputs or methodology used for valuing securities may not be an indication of the risk associated with investing in those securities. For more information on valuation inputs please refer to the Investment Valuation section in the accompanying Notes to Financial Statements.
Other Information
Distribution of investments by country or territory of incorporation, as a percentage of Total Net Assets, is as follows (Unaudited):
| United States of America | 82.0% |
| Sweden | 4.1% |
| Finland | 3.7% |
| France | 3.6% |
| Canada | 2.4% |
| Israel | 2.2% |
| Others (Individually Less Than 1%) | 2.0% |
| 100.0% |
See accompanying notes which are an integral part of the financial statements.
Communications Equipment Portfolio
Financial Statements
Statement of Assets and Liabilities
| August 31, 2015 (Unaudited) | ||
| Assets | ||
| Investment in securities, at value (including securities loaned of $5,360,639) — See accompanying schedule: Unaffiliated issuers (cost $209,890,050) | $209,113,603 | |
| Fidelity Central Funds (cost $5,751,413) | 5,751,413 | |
| Total Investments (cost $215,641,463) | $214,865,016 | |
| Cash | 41,937 | |
| Receivable for investments sold | 846,647 | |
| Receivable for fund shares sold | 15,725 | |
| Dividends receivable | 392,151 | |
| Distributions receivable from Fidelity Central Funds | 1,038 | |
| Prepaid expenses | 1,627 | |
| Other receivables | 1,235 | |
| Total assets | 216,165,376 | |
| Liabilities | ||
| Payable for investments purchased | $476,404 | |
| Payable for fund shares redeemed | 284,741 | |
| Accrued management fee | 100,019 | |
| Other affiliated payables | 52,657 | |
| Other payables and accrued expenses | 20,840 | |
| Collateral on securities loaned, at value | 5,618,300 | |
| Total liabilities | 6,552,961 | |
| Net Assets | $209,612,415 | |
| Net Assets consist of: | ||
| Paid in capital | $207,930,504 | |
| Undistributed net investment income | 1,436,334 | |
| Accumulated undistributed net realized gain (loss) on investments and foreign currency transactions | 1,022,024 | |
| Net unrealized appreciation (depreciation) on investments | (776,447) | |
| Net Assets, for 7,239,634 shares outstanding | $209,612,415 | |
| Net Asset Value, offering price and redemption price per share ($209,612,415 ÷ 7,239,634 shares) | $28.95 |
See accompanying notes which are an integral part of the financial statements.
Statement of Operations
| Six months ended August 31, 2015 (Unaudited) | ||
| Investment Income | ||
| Dividends | $2,497,340 | |
| Income from Fidelity Central Funds (including $34,533 from security lending) | 35,523 | |
| Total income | 2,532,863 | |
| Expenses | ||
| Management fee | $660,267 | |
| Transfer agent fees | 285,567 | |
| Accounting and security lending fees | 47,704 | |
| Custodian fees and expenses | 62,361 | |
| Independent trustees' compensation | 2,142 | |
| Registration fees | 14,327 | |
| Audit | 21,594 | |
| Legal | 3,248 | |
| Miscellaneous | 1,681 | |
| Total expenses before reductions | 1,098,891 | |
| Expense reductions | (12,476) | 1,086,415 |
| Net investment income (loss) | 1,446,448 | |
| Realized and Unrealized Gain (Loss)
Net realized gain (loss) on: | ||
| Investment securities: | ||
| Unaffiliated issuers | 4,633,744 | |
| Foreign currency transactions | 4,651 | |
| Total net realized gain (loss) | 4,638,395 | |
| Change in net unrealized appreciation (depreciation) on: Investment securities | (35,749,684) | |
| Assets and liabilities in foreign currencies | 184 | |
| Total change in net unrealized appreciation (depreciation) | (35,749,500) | |
| Net gain (loss) | (31,111,105) | |
| Net increase (decrease) in net assets resulting from operations | $(29,664,657) |
See accompanying notes which are an integral part of the financial statements.
Statement of Changes in Net Assets
| Six months ended August 31, 2015 (Unaudited) | Year ended February 28, 2015 | |
| Increase (Decrease) in Net Assets | ||
| Operations | ||
| Net investment income (loss) | $1,446,448 | $2,392,115 |
| Net realized gain (loss) | 4,638,395 | 21,974,008 |
| Change in net unrealized appreciation (depreciation) | (35,749,500) | 5,918,097 |
| Net increase (decrease) in net assets resulting from operations | (29,664,657) | 30,284,220 |
| Distributions to shareholders from net investment income | (85,823) | (2,341,970) |
| Distributions to shareholders from net realized gain | (858,236) | (13,481,847) |
| Total distributions | (944,059) | (15,823,817) |
| Share transactions | ||
| Proceeds from sales of shares | 6,784,010 | 29,367,762 |
| Reinvestment of distributions | 909,114 | 15,205,659 |
| Cost of shares redeemed | (31,104,168) | (142,751,589) |
| Net increase (decrease) in net assets resulting from share transactions | (23,411,044) | (98,178,168) |
| Redemption fees | 1,128 | 3,746 |
| Total increase (decrease) in net assets | (54,018,632) | (83,714,019) |
| Net Assets | ||
| Beginning of period | 263,631,047 | 347,345,066 |
| End of period (including undistributed net investment income of $1,436,334 and undistributed net investment income of $75,709, respectively) | $209,612,415 | $263,631,047 |
| Other Information
Shares | ||
| Sold | 214,613 | 924,755 |
| Issued in reinvestment of distributions | 28,295 | 482,625 |
| Redeemed | (995,143) | (4,535,265) |
| Net increase (decrease) | (752,235) | (3,127,885) |
See accompanying notes which are an integral part of the financial statements.
Financial Highlights — Communications Equipment Portfolio
| Six months ended (Unaudited) | Years ended February 28, | |||||
| August 31, | 2015 | 2015 | 2014 | 2013 | 2012 A | 2011 |
| Selected Per–Share Data | ||||||
| Net asset value, beginning of period | $32.99 | $31.24 | $24.31 | $24.50 | $29.60 | $20.79 |
| Income from Investment Operations | ||||||
| Net investment income (loss)B | .19 | .28 | .18 | .14C | .03 | (.10) |
| Net realized and unrealized gain (loss) | (4.11) | 3.52 | 6.95 | (.14)D | (5.10) | 8.91 |
| Total from investment operations | (3.92) | 3.80 | 7.13 | – | (5.07) | 8.81 |
| Distributions from net investment income | (.01) | (.30) | (.20) | (.17) | (.03) | – |
| Distributions from net realized gain | (.11) | (1.75) | – | – | – | – |
| Tax return of capital | – | – | – | (.02) | – | – |
| Total distributions | (.12) | (2.05) | (.20) | (.19) | (.03) | – |
| Redemption fees added to paid in capitalB,E | – | – | – | – | – | – |
| Net asset value, end of period | $28.95 | $32.99 | $31.24 | $24.31 | $24.50 | $29.60 |
| Total ReturnF,G | (11.92)% | 12.49% | 29.41% | .07%D | (17.13)% | 42.38% |
| Ratios to Average Net AssetsH,I | ||||||
| Expenses before reductions | .91%J | .89% | .92% | .93% | .90% | .91% |
| Expenses net of fee waivers, if any | .91%J | .89% | .92% | .93% | .90% | .91% |
| Expenses net of all reductions | .90%J | .89% | .90% | .89% | .89% | .90% |
| Net investment income (loss) | 1.20%J | .89% | .69% | .61%C | .12% | (.43)% |
| Supplemental Data | ||||||
| Net assets, end of period (000 omitted) | $209,612 | $263,631 | $347,345 | $316,012 | $332,598 | $586,795 |
| Portfolio turnover rateK | 34%J | 42%L | 65% | 54% | 91% | 85% |
A For the year ended February 29.
B Calculated based on average shares outstanding during the period.
C Investment income per share reflects a large, non-recurring dividend which amounted to $.10 per share. Excluding these non-recurring dividend, the ratio of net investment income (loss) to average net assets would have been .18%.
D Net realized and unrealized gain (loss) per share reflects proceeds from litigation which amounts to $.06 per share. Excluding these ligation proceeds, the total return would have been (.19)%.
E Amount represents less than $.005 per share.
F Total returns for periods of less than one year are not annualized.
G Total returns would have been lower if certain expenses had not been reduced during the applicable periods shown.
H Fees and expenses of any underlying Fidelity Central Funds are not included in the Fund's expense ratio. The Fund indirectly bears its proportionate share of the expenses of any underlying Fidelity Central Funds.
I Expense ratios reflect operating expenses of the Fund. Expenses before reductions do not reflect amounts reimbursed by the investment adviser or reductions from brokerage service arrangements or reductions from other expense offset arrangements and do not represent the amount paid by the Fund during periods when reimbursements or reductions occur. Expenses net of fee waivers reflect expenses after reimbursement by the investment adviser but prior to reductions from brokerage service arrangements or other expense offset arrangements. Expenses net of all reductions represent the net expenses paid by the Fund.
J Annualized
K Amount does not include the portfolio activity of any underlying Fidelity Central Funds.
L Portfolio turnover rate excludes securities received or delivered in-kind.
See accompanying notes which are an integral part of the financial statements.
Computers Portfolio
Investment Summary (Unaudited)
Top Ten Stocks as of August 31, 2015
| % of fund's net assets | % of fund's net assets 6 months ago | |
| Apple, Inc. | 19.7 | 15.8 |
| EMC Corp. | 8.3 | 7.1 |
| Hewlett-Packard Co. | 8.1 | 6.6 |
| IBM Corp. | 6.7 | 5.6 |
| SanDisk Corp. | 5.1 | 4.6 |
| Western Digital Corp. | 5.0 | 6.4 |
| Seagate Technology LLC | 5.0 | 4.5 |
| Google, Inc. Class A | 4.7 | 3.0 |
| Electronics for Imaging, Inc. | 4.0 | 4.1 |
| Canon, Inc. sponsored ADR | 3.4 | 0.0 |
| 70.0 |
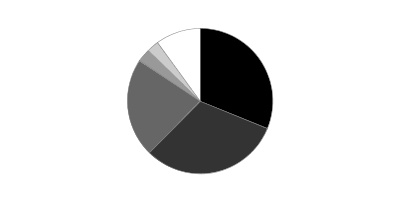
Top Industries (% of fund's net assets)
| As of August 31, 2015 | ||
| Technology Hardware, Storage & Peripherals | 71.7% | |
| Internet Software & Services | 11.8% | |
| IT Services | 9.4% | |
| Communications Equipment | 2.8% | |
| Semiconductors & Semiconductor Equipment | 1.6% | |
| All Others* | 2.7% | |

| As of February 28, 2015 | ||
| Technology Hardware, Storage & Peripherals | 72.3% | |
| IT Services | 11.2% | |
| Internet Software & Services | 8.7% | |
| Communications Equipment | 2.8% | |
| Semiconductors & Semiconductor Equipment | 2.7% | |
| All Others* | 2.3% | |

* Includes short-term investments and net other assets (liabilities).
Percentages shown as 0.0% may reflect amounts less than 0.05%.
Computers Portfolio
Investments August 31, 2015 (Unaudited)
Showing Percentage of Net Assets
| Common Stocks - 97.3% | |||
| Shares | Value | ||
| Communications Equipment - 2.8% | |||
| Communications Equipment - 2.8% | |||
| QUALCOMM, Inc. | 276,600 | $15,650,028 | |
| Internet Software & Services - 11.8% | |||
| Internet Software & Services - 11.8% | |||
| Alibaba Group Holding Ltd. sponsored ADR (a) | 220,100 | 14,553,012 | |
| Facebook, Inc. Class A (b) | 151,900 | 13,584,417 | |
| Google, Inc.: | |||
| Class A (b) | 40,000 | 25,912,800 | |
| Class C | 9,657 | 5,970,440 | |
| Twitter, Inc. (b) | 195,700 | 5,438,503 | |
| 65,459,172 | |||
| IT Services - 9.4% | |||
| Data Processing & Outsourced Services - 2.1% | |||
| MasterCard, Inc. Class A | 43,500 | 4,018,095 | |
| Visa, Inc. Class A | 102,200 | 7,286,860 | |
| 11,304,955 | |||
| IT Consulting & Other Services - 7.3% | |||
| IBM Corp. | 252,548 | 37,349,324 | |
| Teradata Corp. (b) | 112,057 | 3,275,426 | |
| 40,624,750 | |||
| TOTAL IT SERVICES | 51,929,705 | ||
| Semiconductors & Semiconductor Equipment - 1.6% | |||
| Semiconductors - 1.6% | |||
| Cirrus Logic, Inc. (b) | 216,600 | 6,532,656 | |
| Micron Technology, Inc. (b) | 137,800 | 2,261,298 | |
| 8,793,954 | |||
| Technology Hardware, Storage & Peripherals - 71.7% | |||
| Technology Hardware, Storage & Peripherals - 71.7% | |||
| Apple, Inc. | 970,448 | 109,427,716 | |
| Canon, Inc. sponsored ADR | 621,300 | 18,937,224 | |
| Cray, Inc. (b) | 13,800 | 292,422 | |
| Diebold, Inc. | 424,700 | 13,216,664 | |
| Electronics for Imaging, Inc. (b) | 512,915 | 22,450,290 | |
| EMC Corp. | 1,863,878 | 46,354,646 | |
| Hewlett-Packard Co. | 1,602,605 | 44,969,096 | |
| Lexmark International, Inc. Class A | 476,400 | 14,282,472 | |
| NCR Corp. (b) | 278,600 | 6,990,074 | |
| NetApp, Inc. | 202,860 | 6,483,406 | |
| Nimble Storage, Inc. (a)(b) | 547,500 | 14,596,350 | |
| QLogic Corp. (b) | 907,500 | 9,383,550 | |
| Quantum Corp. (a)(b) | 4,950,900 | 5,792,553 | |
| SanDisk Corp. | 516,000 | 28,152,960 | |
| Seagate Technology LLC | 538,700 | 27,689,180 | |
| Silicon Graphics International Corp. (a)(b) | 67,100 | 335,500 | |
| Super Micro Computer, Inc. (b) | 31,300 | 856,055 | |
| Western Digital Corp. | 339,734 | 27,844,599 | |
| 398,054,757 | |||
| TOTAL COMMON STOCKS | |||
| (Cost $432,663,338) | 539,887,616 | ||
| Money Market Funds - 7.9% | |||
| Fidelity Cash Central Fund, 0.15% (c) | 11,851,074 | 11,851,074 | |
| Fidelity Securities Lending Cash Central Fund, 0.19% (c)(d) | 31,924,075 | 31,924,075 | |
| TOTAL MONEY MARKET FUNDS | |||
| (Cost $43,775,149) | 43,775,149 | ||
| TOTAL INVESTMENT PORTFOLIO - 105.2% | |||
| (Cost $476,438,487) | 583,662,765 | ||
| NET OTHER ASSETS (LIABILITIES) - (5.2)% | (28,703,039) | ||
| NET ASSETS - 100% | $554,959,726 |
Legend
(a) Security or a portion of the security is on loan at period end.
(b) Non-income producing
(c) Affiliated fund that is generally available only to investment companies and other accounts managed by Fidelity Investments. The rate quoted is the annualized seven-day yield of the fund at period end. A complete unaudited listing of the fund's holdings as of its most recent quarter end is available upon request. In addition, each Fidelity Central Fund's financial statements are available on the SEC's website or upon request.
(d) Investment made with cash collateral received from securities on loan.
Affiliated Central Funds
Information regarding fiscal year to date income earned by the Fund from investments in Fidelity Central Funds is as follows:
| Fund | Income earned |
| Fidelity Cash Central Fund | $1,498 |
| Fidelity Securities Lending Cash Central Fund | 82,082 |
| Total | $83,580 |
Other Affiliated Issuers
An affiliated company is a company in which the Fund has ownership of at least 5% of the voting securities. Fiscal year to date transactions with companies which are or were affiliates are as follows:
| Affiliate | Value, beginning of period | Purchases | Sales Proceeds | Dividend Income | Value, end of period |
| Datalink Corp. | $15,196,124 | $-- | $14,792,124 | $-- | $-- |
Investment Valuation
All investments are categorized as Level 1 under the Fair Value Hierarchy. The inputs or methodology used for valuing securities may not be an indication of the risk associated with investing in those securities. For more information on valuation inputs please refer to the Investment Valuation section in the accompanying Notes to Financial Statements.
Other Information
Distribution of investments by country or territory of incorporation, as a percentage of Total Net Assets, is as follows (Unaudited):
| United States of America | 89.0% |
| Ireland | 5.0% |
| Japan | 3.4% |
| Cayman Islands | 2.6% |
| 100.0% |
See accompanying notes which are an integral part of the financial statements.
Computers Portfolio
Financial Statements
Statement of Assets and Liabilities
| August 31, 2015 (Unaudited) | ||
| Assets | ||
| Investment in securities, at value (including securities loaned of $30,610,881) — See accompanying schedule: Unaffiliated issuers (cost $432,663,338) | $539,887,616 | |
| Fidelity Central Funds (cost $43,775,149) | 43,775,149 | |
| Total Investments (cost $476,438,487) | $583,662,765 | |
| Receivable for investments sold | 6,283,113 | |
| Receivable for fund shares sold | 120,322 | |
| Dividends receivable | 1,144,863 | |
| Distributions receivable from Fidelity Central Funds | 12,523 | |
| Prepaid expenses | 4,569 | |
| Other receivables | 159,455 | |
| Total assets | 591,387,610 | |
| Liabilities | ||
| Payable for investments purchased | $3,435,267 | |
| Payable for fund shares redeemed | 651,806 | |
| Accrued management fee | 259,882 | |
| Other affiliated payables | 119,167 | |
| Other payables and accrued expenses | 37,687 | |
| Collateral on securities loaned, at value | 31,924,075 | |
| Total liabilities | 36,427,884 | |
| Net Assets | $554,959,726 | |
| Net Assets consist of: | ||
| Paid in capital | $430,073,283 | |
| Undistributed net investment income | 2,951,596 | |
| Accumulated undistributed net realized gain (loss) on investments and foreign currency transactions | 14,802,596 | |
| Net unrealized appreciation (depreciation) on investments and assets and liabilities in foreign currencies | 107,132,251 | |
| Net Assets, for 7,624,575 shares outstanding | $554,959,726 | |
| Net Asset Value, offering price and redemption price per share ($554,959,726 ÷ 7,624,575 shares) | $72.79 |
See accompanying notes which are an integral part of the financial statements.
Statement of Operations
| Six months ended August 31, 2015 (Unaudited) | ||
| Investment Income | ||
| Dividends | $5,629,049 | |
| Income from Fidelity Central Funds (including $82,082 from security lending) | 83,580 | |
| Total income | 5,712,629 | |
| Expenses | ||
| Management fee | $1,910,976 | |
| Transfer agent fees | 676,077 | |
| Accounting and security lending fees | 126,418 | |
| Custodian fees and expenses | 10,838 | |
| Independent trustees' compensation | 6,329 | |
| Registration fees | 15,967 | |
| Audit | 18,795 | |
| Legal | 6,050 | |
| Interest | 6,019 | |
| Miscellaneous | 4,630 | |
| Total expenses before reductions | 2,782,099 | |
| Expense reductions | (46,080) | 2,736,019 |
| Net investment income (loss) | 2,976,610 | |
| Realized and Unrealized Gain (Loss)
Net realized gain (loss) on: | ||
| Investment securities: | ||
| Unaffiliated issuers | 18,021,187 | |
| Other affiliated issuers | 126,875 | |
| Foreign currency transactions | 5,816 | |
| Total net realized gain (loss) | 18,153,878 | |
| Change in net unrealized appreciation (depreciation) on: Investment securities | (108,562,105) | |
| Assets and liabilities in foreign currencies | (10,375) | |
| Total change in net unrealized appreciation (depreciation) | (108,572,480) | |
| Net gain (loss) | (90,418,602) | |
| Net increase (decrease) in net assets resulting from operations | $(87,441,992) |
See accompanying notes which are an integral part of the financial statements.
Statement of Changes in Net Assets
| Six months ended August 31, 2015 (Unaudited) | Year ended February 28, 2015 | |
| Increase (Decrease) in Net Assets | ||
| Operations | ||
| Net investment income (loss) | $2,976,610 | $3,977,548 |
| Net realized gain (loss) | 18,153,878 | 19,825,223 |
| Change in net unrealized appreciation (depreciation) | (108,572,480) | 60,854,430 |
| Net increase (decrease) in net assets resulting from operations | (87,441,992) | 84,657,201 |
| Distributions to shareholders from net investment income | (799,723) | (4,364,252) |
| Distributions to shareholders from net realized gain | – | (16,558,901) |
| Total distributions | (799,723) | (20,923,153) |
| Share transactions | ||
| Proceeds from sales of shares | 13,689,333 | 195,542,539 |
| Reinvestment of distributions | 770,016 | 20,358,707 |
| Cost of shares redeemed | (180,110,123) | (150,113,082) |
| Net increase (decrease) in net assets resulting from share transactions | (165,650,774) | 65,788,164 |
| Redemption fees | 623 | 6,717 |
| Total increase (decrease) in net assets | (253,891,866) | 129,528,929 |
| Net Assets | ||
| Beginning of period | 808,851,592 | 679,322,663 |
| End of period (including undistributed net investment income of $2,951,596 and undistributed net investment income of $774,709, respectively) | $554,959,726 | $808,851,592 |
| Other Information
Shares | ||
| Sold | 170,667 | 2,396,480 |
| Issued in reinvestment of distributions | 9,478 | 245,952 |
| Redeemed | (2,268,549) | (1,931,757) |
| Net increase (decrease) | (2,088,404) | 710,675 |
See accompanying notes which are an integral part of the financial statements.
Financial Highlights — Computers Portfolio
| Six months ended (Unaudited) | Years ended February 28, | |||||
| August 31, | 2015 | 2015 | 2014 | 2013 | 2012 A | 2011 |
| Selected Per–Share Data | ||||||
| Net asset value, beginning of period | $83.28 | $75.46 | $64.51 | $64.89 | $59.80 | $43.59 |
| Income from Investment Operations | ||||||
| Net investment income (loss)B | .34 | .45 | .59 | .18 | (.18) | (.25) |
| Net realized and unrealized gain (loss) | (10.74) | 9.61 | 15.76 | (.43) | 5.27 | 16.46 |
| Total from investment operations | (10.40) | 10.06 | 16.35 | (.25) | 5.09 | 16.21 |
| Distributions from net investment income | (.09) | (.47) | (.53) | (.13) | – | – |
| Distributions from net realized gain | – | (1.77) | (4.87) | – | – | – |
| Total distributions | (.09) | (2.24) | (5.40) | (.13) | – | – |
| Redemption fees added to paid in capitalB,C | – | – | – | – | – | – |
| Net asset value, end of period | $72.79 | $83.28 | $75.46 | $64.51 | $64.89 | $59.80 |
| Total ReturnD,E | (12.50)% | 13.36% | 27.13% | (.38)% | 8.51% | 37.19% |
| Ratios to Average Net AssetsF,G | ||||||
| Expenses before reductions | .80%H | .80% | .82% | .85% | .86% | .89% |
| Expenses net of fee waivers, if any | .79%H | .80% | .82% | .85% | .86% | .89% |
| Expenses net of all reductions | .78%H | .80% | .82% | .82% | .85% | .88% |
| Net investment income (loss) | .85%H | .57% | .86% | .29% | (.32)% | (.50)% |
| Supplemental Data | ||||||
| Net assets, end of period (000 omitted) | $554,960 | $808,852 | $679,323 | $687,105 | $758,713 | $609,487 |
| Portfolio turnover rateI | 27%H | 46% | 35% | 184% | 193% | 141% |
A For the year ended February 29.
B Calculated based on average shares outstanding during the period.
C Amount represents less than $.005 per share.
D Total returns for periods of less than one year are not annualized.
E Total returns would have been lower if certain expenses had not been reduced during the applicable periods shown.
F Fees and expenses of any underlying Fidelity Central Funds are not included in the Fund's expense ratio. The Fund indirectly bears its proportionate share of the expenses of any underlying Fidelity Central Funds.
G Expense ratios reflect operating expenses of the Fund. Expenses before reductions do not reflect amounts reimbursed by the investment adviser or reductions from brokerage service arrangements or reductions from other expense offset arrangements and do not represent the amount paid by the Fund during periods when reimbursements or reductions occur. Expenses net of fee waivers reflect expenses after reimbursement by the investment adviser but prior to reductions from brokerage service arrangements or other expense offset arrangements. Expenses net of all reductions represent the net expenses paid by the Fund.
H Annualized
I Amount does not include the portfolio activity of any underlying Fidelity Central Funds.
See accompanying notes which are an integral part of the financial statements.
Electronics Portfolio
Investment Summary (Unaudited)
Top Ten Stocks as of August 31, 2015
| % of fund's net assets | % of fund's net assets 6 months ago | |
| Intel Corp. | 14.2 | 9.3 |
| Broadcom Corp. Class A | 11.9 | 7.7 |
| Avago Technologies Ltd. | 6.6 | 0.0 |
| Micron Technology, Inc. | 5.7 | 4.2 |
| Maxim Integrated Products, Inc. | 5.3 | 4.0 |
| Semtech Corp. | 4.8 | 2.1 |
| Analog Devices, Inc. | 4.7 | 1.4 |
| Marvell Technology Group Ltd. | 4.3 | 3.8 |
| QUALCOMM, Inc. | 4.2 | 6.4 |
| Intersil Corp. Class A | 3.3 | 2.4 |
| 65.0 |
Top Industries (% of fund's net assets)
| As of August 31, 2015 | ||
| Semiconductors & Semiconductor Equipment | 84.7% | |
| Technology Hardware, Storage & Peripherals | 6.7% | |
| Communications Equipment | 4.2% | |
| Electronic Equipment & Components | 3.3% | |
| Diversified Telecommunication Services | 0.4% | |
| All Others* | 0.7% | |

| As of February 28, 2015 | ||
| Semiconductors & Semiconductor Equipment | 71.3% | |
| Communications Equipment | 7.5% | |
| Electronic Equipment & Components | 6.8% | |
| Technology Hardware, Storage & Peripherals | 4.9% | |
| Internet Software & Services | 3.5% | |
| All Others* | 6.0% | |

* Includes short-term investments and net other assets (liabilities).
Percentages shown as 0.0% may reflect amounts less than 0.05%.
Electronics Portfolio
Investments August 31, 2015 (Unaudited)
Showing Percentage of Net Assets
| Common Stocks - 98.7% | |||
| Shares | Value | ||
| Biotechnology - 0.0% | |||
| Biotechnology - 0.0% | |||
| Arrowhead Research Corp. warrants 5/21/17 (a) | 285,468 | $3 | |
| Communications Equipment - 4.2% | |||
| Communications Equipment - 4.2% | |||
| QUALCOMM, Inc. | 1,053,832 | 59,625,815 | |
| Diversified Telecommunication Services - 0.4% | |||
| Alternative Carriers - 0.4% | |||
| Intelsat SA (a)(b) | 606,500 | 5,864,855 | |
| Electronic Equipment & Components - 3.0% | |||
| Electronic Components - 0.2% | |||
| Corning, Inc. | 22,000 | 378,620 | |
| InvenSense, Inc. (a) | 213,400 | 2,178,814 | |
| 2,557,434 | |||
| Electronic Manufacturing Services - 2.8% | |||
| Jabil Circuit, Inc. | 881,432 | 17,055,709 | |
| KEMET Corp. (a) | 863,200 | 1,778,192 | |
| TTM Technologies, Inc. (a) | 3,186,406 | 21,731,289 | |
| 40,565,190 | |||
| TOTAL ELECTRONIC EQUIPMENT & COMPONENTS | 43,122,624 | ||
| Internet Software & Services - 0.0% | |||
| Internet Software & Services - 0.0% | |||
| Demand Media, Inc. (a) | 27 | 127 | |
| Google, Inc. Class C | 190 | 117,468 | |
| Rightside Group Ltd. (a) | 27 | 209 | |
| 117,804 | |||
| Semiconductors & Semiconductor Equipment - 84.4% | |||
| Semiconductor Equipment - 6.4% | |||
| Amkor Technology, Inc. (a) | 2,104,967 | 11,366,822 | |
| Applied Materials, Inc. | 1,940,600 | 31,214,551 | |
| KLA-Tencor Corp. | 207,000 | 10,372,770 | |
| Lam Research Corp. | 483,373 | 35,175,053 | |
| Xcerra Corp. (a) | 507,800 | 3,178,828 | |
| 91,308,024 | |||
| Semiconductors - 78.0% | |||
| Advanced Micro Devices, Inc. (a)(b) | 3,486,500 | 6,310,565 | |
| Altera Corp. | 276,500 | 13,424,075 | |
| Analog Devices, Inc. | 1,190,489 | 66,500,716 | |
| Applied Micro Circuits Corp. (a)(b) | 612,570 | 3,583,535 | |
| Atmel Corp. | 4,893,100 | 39,976,627 | |
| Avago Technologies Ltd. | 741,000 | 93,343,770 | |
| Broadcom Corp. Class A | 3,272,506 | 169,090,385 | |
| Cavium, Inc. (a) | 61,862 | 4,207,853 | |
| Cirrus Logic, Inc. (a) | 394,690 | 11,903,850 | |
| Cree, Inc. (a)(b) | 374,849 | 10,203,390 | |
| Cypress Semiconductor Corp. | 1,271,900 | 12,719,000 | |
| Exar Corp. (a) | 1,101,600 | 6,499,440 | |
| Freescale Semiconductor, Inc. (a) | 714,538 | 25,530,443 | |
| Hua Hong Semiconductor Ltd. (a) | 2,202,000 | 1,969,001 | |
| Intel Corp. | 7,107,017 | 202,834,264 | |
| Intersil Corp. Class A | 4,503,698 | 47,468,977 | |
| Marvell Technology Group Ltd. | 5,459,396 | 61,527,393 | |
| Maxim Integrated Products, Inc. | 2,257,025 | 75,994,032 | |
| MaxLinear, Inc. Class A (a) | 205,900 | 2,048,705 | |
| MediaTek, Inc. | 1,280,000 | 9,888,277 | |
| Microchip Technology, Inc. (b) | 768,500 | 32,661,250 | |
| Micron Technology, Inc. (a) | 4,920,940 | 80,752,625 | |
| Motech Industries, Inc. | 1 | 1 | |
| NVIDIA Corp. | 560,820 | 12,607,234 | |
| NXP Semiconductors NV (a) | 96,523 | 8,170,672 | |
| PMC-Sierra, Inc. (a) | 3,438,874 | 21,630,517 | |
| Qorvo, Inc. (a) | 103,400 | 5,739,734 | |
| Sanken Electric Co. Ltd. | 554,000 | 2,123,458 | |
| Semiconductor Manufacturing International Corp. (a) | 29,115,000 | 2,532,782 | |
| Semtech Corp. (a)(c) | 4,053,689 | 68,710,029 | |
| Silicon Laboratories, Inc. (a) | 80,700 | 3,508,836 | |
| Texas Instruments, Inc. | 145,460 | 6,958,806 | |
| 1,110,420,242 | |||
| TOTAL SEMICONDUCTORS & SEMICONDUCTOR EQUIPMENT | 1,201,728,266 | ||
| Technology Hardware, Storage & Peripherals - 6.7% | |||
| Technology Hardware, Storage & Peripherals - 6.7% | |||
| BlackBerry Ltd. (a) | 1,400 | 10,626 | |
| Hewlett-Packard Co. | 1,541,300 | 43,248,878 | |
| QLogic Corp. (a) | 210,600 | 2,177,604 | |
| Samsung Electronics Co. Ltd. | 31,455 | 28,963,452 | |
| SanDisk Corp. | 41,200 | 2,247,872 | |
| Seagate Technology LLC | 221,200 | 11,369,680 | |
| Western Digital Corp. | 88,700 | 7,269,852 | |
| 95,287,964 | |||
| TOTAL COMMON STOCKS | |||
| (Cost $1,488,101,471) | 1,405,747,331 | ||
| Principal Amount | Value | ||
| Corporate Bonds - 0.6% | |||
| Convertible Bonds - 0.3% | |||
| Electronic Equipment & Components - 0.3% | |||
| Electronic Components - 0.3% | |||
| InvenSense, Inc. 1.75% 11/1/18 | 4,350,000 | 3,955,781 | |
| Nonconvertible Bonds - 0.3% | |||
| Semiconductors & Semiconductor Equipment - 0.3% | |||
| Semiconductors - 0.3% | |||
| Advanced Micro Devices, Inc.: | |||
| 7% 7/1/24 | 4,785,000 | 3,086,325 | |
| 7.75% 8/1/20 | 2,270,000 | 1,486,850 | |
| 4,573,175 | |||
| TOTAL CORPORATE BONDS | |||
| (Cost $9,958,397) | 8,528,956 | ||
| Shares | Value | ||
| Money Market Funds - 3.8% | |||
| Fidelity Cash Central Fund, 0.15% (d) | 6,462,521 | 6,462,521 | |
| Fidelity Securities Lending Cash Central Fund, 0.19% (d)(e) | 47,874,660 | 47,874,660 | |
| TOTAL MONEY MARKET FUNDS | |||
| (Cost $54,337,181) | 54,337,181 | ||
| TOTAL INVESTMENT PORTFOLIO - 103.1% | |||
| (Cost $1,552,397,049) | 1,468,613,468 | ||
| NET OTHER ASSETS (LIABILITIES) - (3.1)% | (44,842,626) | ||
| NET ASSETS - 100% | $1,423,770,842 |
Legend
(a) Non-income producing
(b) Security or a portion of the security is on loan at period end.
(c) Affiliated company
(d) Affiliated fund that is generally available only to investment companies and other accounts managed by Fidelity Investments. The rate quoted is the annualized seven-day yield of the fund at period end. A complete unaudited listing of the fund's holdings as of its most recent quarter end is available upon request. In addition, each Fidelity Central Fund's financial statements are available on the SEC's website or upon request.
(e) Investment made with cash collateral received from securities on loan.
Affiliated Central Funds
Information regarding fiscal year to date income earned by the Fund from investments in Fidelity Central Funds is as follows:
| Fund | Income earned |
| Fidelity Cash Central Fund | $27,933 |
| Fidelity Securities Lending Cash Central Fund | 231,115 |
| Total | $259,048 |
Other Affiliated Issuers
An affiliated company is a company in which the Fund has ownership of at least 5% of the voting securities. Fiscal year to date transactions with companies which are or were affiliates are as follows:
| Affiliate | Value, beginning of period | Purchases | Sales Proceeds | Dividend Income | Value, end of period |
| MagnaChip Semiconductor Corp. | $10,903,713 | $-- | $16,416,585 | $-- | $-- |
| Semtech Corp. | 49,741,634 | 56,671,660 | 3,875,784 | -- | 68,710,029 |
| TTM Technologies, Inc. | 53,948,528 | 4,386,127 | 34,043,742 | -- | -- |
| Total | $114,593,875 | $61,057,787 | $54,336,111 | $-- | $68,710,029 |
Investment Valuation
The following is a summary of the inputs used, as of August 31, 2015, involving the Fund's assets and liabilities carried at fair value. The inputs or methodology used for valuing securities may not be an indication of the risk associated with investing in those securities. For more information on valuation inputs, and their aggregation into the levels used below, please refer to the Investment Valuation section in the accompanying Notes to Financial Statements.
| Valuation Inputs at Reporting Date: | ||||
| Description | Total | Level 1 | Level 2 | Level 3 |
| Investments in Securities: | ||||
| Common Stocks | $1,405,747,331 | $1,401,091,088 | $4,656,243 | $-- |
| Corporate Bonds | 8,528,956 | -- | 8,528,956 | -- |
| Money Market Funds | 54,337,181 | 54,337,181 | -- | -- |
| Total Investments in Securities: | $1,468,613,468 | $1,455,428,269 | $13,185,199 | $-- |
Other Information
Distribution of investments by country or territory of incorporation, as a percentage of Total Net Assets, is as follows (Unaudited):
| United States of America | 82.3% |
| Singapore | 6.6% |
| Bermuda | 6.1% |
| Korea (South) | 2.0% |
| Others (Individually Less Than 1%) | 3.0% |
| 100.0% |
See accompanying notes which are an integral part of the financial statements.
Electronics Portfolio
Financial Statements
Statement of Assets and Liabilities
| August 31, 2015 (Unaudited) | ||
| Assets | ||
| Investment in securities, at value (including securities loaned of $45,867,972) — See accompanying schedule: Unaffiliated issuers (cost $1,403,134,777) | $1,345,566,258 | |
| Fidelity Central Funds (cost $54,337,181) | 54,337,181 | |
| Other affiliated issuers (cost $94,925,091) | 68,710,029 | |
| Total Investments (cost $1,552,397,049) | $1,468,613,468 | |
| Foreign currency held at value (cost $72,225) | 72,225 | |
| Receivable for investments sold | 12,346,533 | |
| Receivable for fund shares sold | 334,870 | |
| Dividends receivable | 4,519,783 | |
| Interest receivable | 95,860 | |
| Distributions receivable from Fidelity Central Funds | 94,976 | |
| Prepaid expenses | 13,699 | |
| Other receivables | 135,628 | |
| Total assets | 1,486,227,042 | |
| Liabilities | ||
| Payable for investments purchased | $10,024,643 | |
| Payable for fund shares redeemed | 3,462,253 | |
| Accrued management fee | 672,690 | |
| Other affiliated payables | 297,492 | |
| Other payables and accrued expenses | 124,462 | |
| Collateral on securities loaned, at value | 47,874,660 | |
| Total liabilities | 62,456,200 | |
| Net Assets | $1,423,770,842 | |
| Net Assets consist of: | ||
| Paid in capital | $1,433,234,780 | |
| Undistributed net investment income | 10,005,510 | |
| Accumulated undistributed net realized gain (loss) on investments and foreign currency transactions | 64,314,136 | |
| Net unrealized appreciation (depreciation) on investments and assets and liabilities in foreign currencies | (83,783,584) | |
| Net Assets, for 19,022,986 shares outstanding | $1,423,770,842 | |
| Net Asset Value, offering price and redemption price per share ($1,423,770,842 ÷ 19,022,986 shares) | $74.84 |
See accompanying notes which are an integral part of the financial statements.
Statement of Operations
| Six months ended August 31, 2015 (Unaudited) | ||
| Investment Income | ||
| Dividends | $17,098,440 | |
| Interest | 387,510 | |
| Income from Fidelity Central Funds (including $231,115 from security lending) | 259,048 | |
| Total income | 17,744,998 | |
| Expenses | ||
| Management fee | $5,716,524 | |
| Transfer agent fees | 1,791,640 | |
| Accounting and security lending fees | 324,273 | |
| Custodian fees and expenses | 60,733 | |
| Independent trustees' compensation | 19,097 | |
| Depreciation in deferred trustee compensation account | (7) | |
| Registration fees | 55,797 | |
| Audit | 22,227 | |
| Legal | 16,864 | |
| Interest | 5,304 | |
| Miscellaneous | 11,776 | |
| Total expenses before reductions | 8,024,228 | |
| Expense reductions | (267,551) | 7,756,677 |
| Net investment income (loss) | 9,988,321 | |
| Realized and Unrealized Gain (Loss)
Net realized gain (loss) on: | ||
| Investment securities: | ||
| Unaffiliated issuers | 90,504,721 | |
| Other affiliated issuers | (9,319,715) | |
| Foreign currency transactions | (28,581) | |
| Total net realized gain (loss) | 81,156,425 | |
| Change in net unrealized appreciation (depreciation) on: Investment securities | (325,641,528) | |
| Assets and liabilities in foreign currencies | 7,844 | |
| Total change in net unrealized appreciation (depreciation) | (325,633,684) | |
| Net gain (loss) | (244,477,259) | |
| Net increase (decrease) in net assets resulting from operations | $(234,488,938) |
See accompanying notes which are an integral part of the financial statements.
Statement of Changes in Net Assets
| Six months ended August 31, 2015 (Unaudited) | Year ended February 28, 2015 | |
| Increase (Decrease) in Net Assets | ||
| Operations | ||
| Net investment income (loss) | $9,988,321 | $10,916,263 |
| Net realized gain (loss) | 81,156,425 | 300,293,041 |
| Change in net unrealized appreciation (depreciation) | (325,633,684) | 227,965,379 |
| Net increase (decrease) in net assets resulting from operations | (234,488,938) | 539,174,683 |
| Distributions to shareholders from net investment income | (1,306,192) | (10,701,038) |
| Distributions to shareholders from net realized gain | (126,465,081) | (50,011,366) |
| Total distributions | (127,771,273) | (60,712,404) |
| Share transactions | ||
| Proceeds from sales of shares | 161,215,693 | 1,265,212,788 |
| Reinvestment of distributions | 121,773,933 | 57,811,166 |
| Cost of shares redeemed | (892,031,906) | (660,454,560) |
| Net increase (decrease) in net assets resulting from share transactions | (609,042,280) | 662,569,394 |
| Redemption fees | 34,465 | 154,050 |
| Total increase (decrease) in net assets | (971,268,026) | 1,141,185,723 |
| Net Assets | ||
| Beginning of period | 2,395,038,868 | 1,253,853,145 |
| End of period (including undistributed net investment income of $10,005,510 and undistributed net investment income of $1,323,381, respectively) | $1,423,770,842 | $2,395,038,868 |
| Other Information
Shares | ||
| Sold | 1,886,050 | 16,339,638 |
| Issued in reinvestment of distributions | 1,442,990 | 686,150 |
| Redeemed | (11,079,098) | (8,604,455) |
| Net increase (decrease) | (7,750,058) | 8,421,333 |
See accompanying notes which are an integral part of the financial statements.
Financial Highlights — Electronics Portfolio
| Six months ended (Unaudited) | Years ended February 28, | |||||
| August 31, | 2015 | 2015 | 2014 | 2013 | 2012 A | 2011 |
| Selected Per–Share Data | ||||||
| Net asset value, beginning of period | $89.46 | $68.32 | $49.82 | $53.29 | $53.36 | $39.66 |
| Income from Investment Operations | ||||||
| Net investment income (loss)B | .40 | .47 | .36 | .17 | .01 | .06 |
| Net realized and unrealized gain (loss) | (10.13) | 23.21 | 18.53 | (3.49) | (.02) | 13.75 |
| Total from investment operations | (9.73) | 23.68 | 18.89 | (3.32) | (.01) | 13.81 |
| Distributions from net investment income | (.05) | (.45) | (.32) | (.15) | (.06) | (.11) |
| Distributions from net realized gain | (4.84) | (2.10) | (.06) | – | – | – |
| Total distributions | (4.89) | (2.55) | (.39)C | (.15) | (.06) | (.11) |
| Redemption fees added to paid in capitalB | –D | .01 | –D | –D | –D | –D |
| Net asset value, end of period | $74.84 | $89.46 | $68.32 | $49.82 | $53.29 | $53.36 |
| Total ReturnE,F | (11.49)% | 34.91% | 38.01% | (6.20)% | (.01)% | 34.87% |
| Ratios to Average Net AssetsG,H | ||||||
| Expenses before reductions | .77%I | .78% | .82% | .84% | .84% | .86% |
| Expenses net of fee waivers, if any | .77%I | .78% | .82% | .84% | .84% | .86% |
| Expenses net of all reductions | .74%I | .77% | .79% | .82% | .83% | .86% |
| Net investment income (loss) | .96%I | .61% | .63% | .36% | .03% | .13% |
| Supplemental Data | ||||||
| Net assets, end of period (000 omitted) | $1,423,771 | $2,395,039 | $1,253,853 | $953,784 | $1,291,741 | $1,387,264 |
| Portfolio turnover rateJ | 144%I | 132%K | 186% | 118% | 137% | 101% |
A For the year ended February 29.
B Calculated based on average shares outstanding during the period.
C Total distributions of $.39 per share is comprised of distributions from net investment income of $.322 and distributions from net realized gain of $.064 per share.
D Amount represents less than $.005 per share.
E Total returns for periods of less than one year are not annualized.
F Total returns would have been lower if certain expenses had not been reduced during the applicable periods shown.
G Fees and expenses of any underlying Fidelity Central Funds are not included in the Fund's expense ratio. The Fund indirectly bears its proportionate share of the expenses of any underlying Fidelity Central Funds.
H Expense ratios reflect operating expenses of the Fund. Expenses before reductions do not reflect amounts reimbursed by the investment adviser or reductions from brokerage service arrangements or reductions from other expense offset arrangements and do not represent the amount paid by the Fund during periods when reimbursements or reductions occur. Expenses net of fee waivers reflect expenses after reimbursement by the investment adviser but prior to reductions from brokerage service arrangements or other expense offset arrangements. Expenses net of all reductions represent the net expenses paid by the Fund.
I Annualized
J Amount does not include the portfolio activity of any underlying Fidelity Central Funds.
K Portfolio turnover rate excludes securities received or delivered in-kind.
See accompanying notes which are an integral part of the financial statements.
IT Services Portfolio
Investment Summary (Unaudited)
Top Ten Stocks as of August 31, 2015
| % of fund's net assets | % of fund's net assets 6 months ago | |
| Visa, Inc. Class A | 15.8 | 15.3 |
| MasterCard, Inc. Class A | 9.6 | 11.0 |
| IBM Corp. | 7.9 | 3.6 |
| Cognizant Technology Solutions Corp. Class A | 7.6 | 6.9 |
| Accenture PLC Class A | 4.8 | 3.9 |
| Alliance Data Systems Corp. | 4.0 | 3.9 |
| Fidelity National Information Services, Inc. | 3.5 | 4.7 |
| PayPal Holdings, Inc. | 2.7 | 0.0 |
| Sabre Corp. | 2.5 | 0.1 |
| Endurance International Group Holdings, Inc. | 2.3 | 3.7 |
| 60.7 |
Top Industries (% of fund's net assets)
| As of August 31, 2015 | ||
| IT Services | 86.3% | |
| Internet Software & Services | 6.1% | |
| Technology Hardware, Storage & Peripherals | 2.2% | |
| Professional Services | 1.6% | |
| Diversified Consumer Services | 0.6% | |
| All Others* | 3.2% | |

| As of February 28, 2015 | ||
| IT Services | 83.0% | |
| Internet Software & Services | 8.5% | |
| Technology Hardware, Storage & Peripherals | 2.2% | |
| Professional Services | 1.5% | |
| Software | 1.4% | |
| All Others* | 3.4% | |

* Includes short-term investments and net other assets (liabilities).
Percentages shown as 0.0% may reflect amounts less than 0.05%.
IT Services Portfolio
Investments August 31, 2015 (Unaudited)
Showing Percentage of Net Assets
| Common Stocks - 97.6% | |||
| Shares | Value | ||
| Diversified Consumer Services - 0.6% | |||
| Specialized Consumer Services - 0.6% | |||
| H&R Block, Inc. | 263,100 | $8,950,662 | |
| Internet & Catalog Retail - 0.5% | |||
| Internet Retail - 0.5% | |||
| Travelport Worldwide Ltd. (a) | 624,024 | 8,268,318 | |
| Internet Software & Services - 6.1% | |||
| Internet Software & Services - 6.1% | |||
| Cvent, Inc. (b) | 126,400 | 3,986,656 | |
| Endurance International Group Holdings, Inc. (a)(b) | 2,290,732 | 35,025,292 | |
| GoDaddy, Inc. (a)(b) | 899,800 | 22,566,984 | |
| Marketo, Inc. (a)(b) | 129,770 | 3,634,858 | |
| Q2 Holdings, Inc. (b) | 226,600 | 5,927,856 | |
| Rightside Group Ltd. (b) | 9,454 | 73,269 | |
| Shopify, Inc. Class A | 1,400 | 39,065 | |
| Web.com Group, Inc. (b) | 807,008 | 17,374,882 | |
| Wix.com Ltd. (b) | 188,817 | 3,729,136 | |
| Xoom Corp. (b) | 1 | 25 | |
| 92,358,023 | |||
| IT Services - 86.3% | |||
| Data Processing & Outsourced Services - 57.7% | |||
| Alliance Data Systems Corp. (b) | 234,548 | 60,323,400 | |
| Amadeus IT Holding SA Class A | 162,500 | 6,803,455 | |
| Automatic Data Processing, Inc. | 1,000 | 77,320 | |
| Broadridge Financial Solutions, Inc. | 7,800 | 411,762 | |
| Cardtronics, Inc. (b) | 681,100 | 23,497,950 | |
| Cass Information Systems, Inc. | 1,852 | 89,266 | |
| Computer Sciences Corp. | 52,900 | 3,279,271 | |
| Convergys Corp. | 44,300 | 1,001,180 | |
| CoreLogic, Inc. (b) | 190,100 | 7,214,295 | |
| CSG Systems International, Inc. | 100,070 | 3,093,164 | |
| DST Systems, Inc. | 41,600 | 4,260,672 | |
| Euronet Worldwide, Inc. (b) | 157,000 | 10,121,790 | |
| Everi Holdings, Inc. (b) | 861,000 | 4,451,370 | |
| EVERTEC, Inc. | 148,900 | 2,695,090 | |
| ExlService Holdings, Inc. (b) | 882,470 | 31,927,765 | |
| Fidelity National Information Services, Inc. | 778,200 | 53,742,492 | |
| Fiserv, Inc. (b) | 292,700 | 24,958,529 | |
| FleetCor Technologies, Inc. (b) | 211,600 | 31,562,256 | |
| Global Payments, Inc. | 182,800 | 20,362,092 | |
| Heartland Payment Systems, Inc. | 105,500 | 6,285,690 | |
| Higher One Holdings, Inc. (b) | 2,001,200 | 3,962,376 | |
| Jack Henry & Associates, Inc. | 1,600 | 108,736 | |
| MasterCard, Inc. Class A | 1,586,600 | 146,554,242 | |
| Maximus, Inc. | 83,100 | 5,031,705 | |
| MoneyGram International, Inc. (b) | 752,849 | 6,579,900 | |
| Paychex, Inc. | 1,800 | 80,388 | |
| PayPal Holdings, Inc. (b) | 1,160,100 | 40,603,500 | |
| Sabre Corp. | 1,403,700 | 38,208,714 | |
| Sykes Enterprises, Inc. (b) | 37,200 | 935,580 | |
| Syntel, Inc. (b) | 244,800 | 10,881,360 | |
| Teletech Holdings, Inc. | 2,000 | 54,100 | |
| The Western Union Co. | 5,100 | 94,044 | |
| Total System Services, Inc. | 129,900 | 5,953,317 | |
| Vantiv, Inc. (b) | 489,800 | 21,570,792 | |
| VeriFone Systems, Inc. (b) | 793,900 | 24,801,436 | |
| Visa, Inc. Class A | 3,363,748 | 239,835,232 | |
| WEX, Inc. (b) | 190,800 | 18,036,324 | |
| WNS Holdings Ltd. sponsored ADR (b) | 354,729 | 10,585,113 | |
| Xerox Corp. | 783,500 | 7,968,195 | |
| 878,003,863 | |||
| IT Consulting & Other Services - 28.6% | |||
| Accenture PLC Class A | 775,100 | 73,068,677 | |
| Acxiom Corp. (b) | 343,700 | 7,203,952 | |
| Booz Allen Hamilton Holding Corp. Class A | 889,600 | 23,752,320 | |
| CACI International, Inc. Class A (b) | 11,800 | 925,356 | |
| Capgemini SA | 166,700 | 14,987,440 | |
| Ciber, Inc. (b) | 607,500 | 2,077,650 | |
| Cognizant Technology Solutions Corp. Class A (b) | 1,833,032 | 115,371,034 | |
| EPAM Systems, Inc. (b) | 291,100 | 20,554,571 | |
| Forrester Research, Inc. | 10,300 | 325,583 | |
| Gartner, Inc. Class A (b) | 165,276 | 14,132,751 | |
| IBM Corp. | 809,250 | 119,679,983 | |
| Leidos Holdings, Inc. | 27,525 | 1,158,252 | |
| Luxoft Holding, Inc. (b) | 210,050 | 12,831,955 | |
| Perficient, Inc. (b) | 18,300 | 303,048 | |
| Science Applications International Corp. | 70,800 | 3,452,916 | |
| Teradata Corp. (b) | 3,500 | 102,305 | |
| Unisys Corp. (b) | 132,196 | 1,741,021 | |
| Virtusa Corp. (b) | 433,098 | 22,919,546 | |
| 434,588,360 | |||
| TOTAL IT SERVICES | 1,312,592,223 | ||
| Professional Services - 1.6% | |||
| Human Resource & Employment Services - 0.5% | |||
| TriNet Group, Inc. (b) | 425,100 | 7,158,684 | |
| Research & Consulting Services - 1.1% | |||
| ICF International, Inc. (b) | 481,911 | 16,486,175 | |
| TOTAL PROFESSIONAL SERVICES | 23,644,859 | ||
| Software - 0.3% | |||
| Application Software - 0.3% | |||
| Globant SA (b) | 189,771 | 5,161,771 | |
| Technology Hardware, Storage & Peripherals - 2.2% | |||
| Technology Hardware, Storage & Peripherals - 2.2% | |||
| Electronics for Imaging, Inc. (b) | 530,400 | 23,215,608 | |
| EMC Corp. | 143,200 | 3,561,384 | |
| Nimble Storage, Inc. (a)(b) | 271,800 | 7,246,188 | |
| 34,023,180 | |||
| TOTAL COMMON STOCKS | |||
| (Cost $1,181,885,043) | 1,484,999,036 | ||
| Money Market Funds - 5.8% | |||
| Fidelity Cash Central Fund, 0.15% (c) | 31,379,020 | 31,379,020 | |
| Fidelity Securities Lending Cash Central Fund, 0.19% (c)(d) | 56,682,100 | 56,682,100 | |
| TOTAL MONEY MARKET FUNDS | |||
| (Cost $88,061,120) | 88,061,120 | ||
| TOTAL INVESTMENT PORTFOLIO - 103.4% | |||
| (Cost $1,269,946,163) | 1,573,060,156 | ||
| NET OTHER ASSETS (LIABILITIES) - (3.4)% | (51,316,925) | ||
| NET ASSETS - 100% | $1,521,743,231 |
Legend
(a) Security or a portion of the security is on loan at period end.
(b) Non-income producing
(c) Affiliated fund that is generally available only to investment companies and other accounts managed by Fidelity Investments. The rate quoted is the annualized seven-day yield of the fund at period end. A complete unaudited listing of the fund's holdings as of its most recent quarter end is available upon request. In addition, each Fidelity Central Fund's financial statements are available on the SEC's website or upon request.
(d) Investment made with cash collateral received from securities on loan.
Affiliated Central Funds
Information regarding fiscal year to date income earned by the Fund from investments in Fidelity Central Funds is as follows:
| Fund | Income earned |
| Fidelity Cash Central Fund | $29,771 |
| Fidelity Securities Lending Cash Central Fund | 647,728 |
| Total | $677,499 |
Investment Valuation
All investments are categorized as Level 1 under the Fair Value Hierarchy. The inputs or methodology used for valuing securities may not be an indication of the risk associated with investing in those securities. For more information on valuation inputs please refer to the Investment Valuation section in the accompanying Notes to Financial Statements.
See accompanying notes which are an integral part of the financial statements.
IT Services Portfolio
Financial Statements
Statement of Assets and Liabilities
| August 31, 2015 (Unaudited) | ||
| Assets | ||
| Investment in securities, at value (including securities loaned of $54,121,135) — See accompanying schedule: Unaffiliated issuers (cost $1,181,885,043) | $1,484,999,036 | |
| Fidelity Central Funds (cost $88,061,120) | 88,061,120 | |
| Total Investments (cost $1,269,946,163) | $1,573,060,156 | |
| Receivable for fund shares sold | 7,425,785 | |
| Dividends receivable | 1,349,153 | |
| Distributions receivable from Fidelity Central Funds | 32,265 | |
| Prepaid expenses | 10,489 | |
| Other receivables | 34,316 | |
| Total assets | 1,581,912,164 | |
| Liabilities | ||
| Payable for investments purchased | $371,820 | |
| Payable for fund shares redeemed | 2,106,597 | |
| Accrued management fee | 697,082 | |
| Other affiliated payables | 274,014 | |
| Other payables and accrued expenses | 37,320 | |
| Collateral on securities loaned, at value | 56,682,100 | |
| Total liabilities | 60,168,933 | |
| Net Assets | $1,521,743,231 | |
| Net Assets consist of: | ||
| Paid in capital | $1,201,406,864 | |
| Accumulated net investment loss | (1,149,607) | |
| Accumulated undistributed net realized gain (loss) on investments and foreign currency transactions | 18,379,643 | |
| Net unrealized appreciation (depreciation) on investments and assets and liabilities in foreign currencies | 303,106,331 | |
| Net Assets, for 38,981,859 shares outstanding | $1,521,743,231 | |
| Net Asset Value, offering price and redemption price per share ($1,521,743,231 ÷ 38,981,859 shares) | $39.04 |
See accompanying notes which are an integral part of the financial statements.
Statement of Operations
| Six months ended August 31, 2015 (Unaudited) | ||
| Investment Income | ||
| Dividends | $3,811,229 | |
| Interest | 20 | |
| Income from Fidelity Central Funds (including $647,728 from security lending) | 677,499 | |
| Total income | 4,488,748 | |
| Expenses | ||
| Management fee | $3,305,991 | |
| Transfer agent fees | 1,212,898 | |
| Accounting and security lending fees | 198,588 | |
| Custodian fees and expenses | 5,284 | |
| Independent trustees' compensation | 9,175 | |
| Registration fees | 86,469 | |
| Audit | 25,190 | |
| Legal | 5,927 | |
| Miscellaneous | 7,309 | |
| Total expenses before reductions | 4,856,831 | |
| Expense reductions | (68,958) | 4,787,873 |
| Net investment income (loss) | (299,125) | |
| Realized and Unrealized Gain (Loss)
Net realized gain (loss) on: | ||
| Investment securities: | ||
| Unaffiliated issuers | 28,784,936 | |
| Foreign currency transactions | 46,411 | |
| Total net realized gain (loss) | 28,831,347 | |
| Change in net unrealized appreciation (depreciation) on: Investment securities | (5,685,086) | |
| Assets and liabilities in foreign currencies | (1,433) | |
| Total change in net unrealized appreciation (depreciation) | (5,686,519) | |
| Net gain (loss) | 23,144,828 | |
| Net increase (decrease) in net assets resulting from operations | $22,845,703 |
See accompanying notes which are an integral part of the financial statements.
Statement of Changes in Net Assets
| Six months ended August 31, 2015 (Unaudited) | Year ended February 28, 2015 | |
| Increase (Decrease) in Net Assets | ||
| Operations | ||
| Net investment income (loss) | $(299,125) | $(791,376) |
| Net realized gain (loss) | 28,831,347 | 112,913,924 |
| Change in net unrealized appreciation (depreciation) | (5,686,519) | (55,301,680) |
| Net increase (decrease) in net assets resulting from operations | 22,845,703 | 56,820,868 |
| Distributions to shareholders from net investment income | – | (115,078) |
| Distributions to shareholders from net realized gain | (30,828,993) | (71,266,576) |
| Total distributions | (30,828,993) | (71,381,654) |
| Share transactions | ||
| Proceeds from sales of shares | 719,505,256 | 288,892,698 |
| Reinvestment of distributions | 29,655,491 | 68,706,176 |
| Cost of shares redeemed | (161,473,345) | (1,054,650,724) |
| Net increase (decrease) in net assets resulting from share transactions | 587,687,402 | (697,051,850) |
| Redemption fees | 41,430 | 38,282 |
| Total increase (decrease) in net assets | 579,745,542 | (711,574,354) |
| Net Assets | ||
| Beginning of period | 941,997,689 | 1,653,572,043 |
| End of period (including accumulated net investment loss of $1,149,607 and accumulated net investment loss of $850,482, respectively) | $1,521,743,231 | $941,997,689 |
| Other Information
Shares | ||
| Sold | 18,110,461 | 7,872,885 |
| Issued in reinvestment of distributions | 768,875 | 1,874,758 |
| Redeemed | (4,123,929) | (29,192,121) |
| Net increase (decrease) | 14,755,407 | (19,444,478) |
See accompanying notes which are an integral part of the financial statements.
Financial Highlights — IT Services Portfolio
| Six months ended (Unaudited) | Years ended February 28, | |||||
| August 31, | 2015 | 2015 | 2014 | 2013 | 2012 A | 2011 |
| Selected Per–Share Data | ||||||
| Net asset value, beginning of period | $38.88 | $37.86 | $27.53 | $23.77 | $22.31 | $17.08 |
| Income from Investment Operations | ||||||
| Net investment income (loss)B | (.01) | (.03) | (.03) | (.02)C | (.05) | (.03) |
| Net realized and unrealized gain (loss) | 1.36 | 4.06 | 11.42 | 4.08 | 1.86 | 5.26 |
| Total from investment operations | 1.35 | 4.03 | 11.39 | 4.06 | 1.81 | 5.23 |
| Distributions from net investment income | – | (.01) | – | – | – | – |
| Distributions from net realized gain | (1.19) | (3.01) | (1.06) | (.30) | (.35) | – |
| Total distributions | (1.19) | (3.01)D | (1.06) | (.30) | (.35) | – |
| Redemption fees added to paid in capitalB,E | – | – | – | – | – | – |
| Net asset value, end of period | $39.04 | $38.88 | $37.86 | $27.53 | $23.77 | $22.31 |
| Total ReturnF,G | 3.51% | 11.16% | 41.66% | 17.22% | 8.18% | 30.62% |
| Ratios to Average Net AssetsH,I | ||||||
| Expenses before reductions | .81%J | .81% | .84% | .86% | .91% | .94% |
| Expenses net of fee waivers, if any | .80%J | .81% | .84% | .86% | .91% | .94% |
| Expenses net of all reductions | .79%J | .81% | .83% | .85% | .91% | .94% |
| Net investment income (loss) | (.05)%J | (.07)% | (.09)% | (.09)%C | (.24)% | (.16)% |
| Supplemental Data | ||||||
| Net assets, end of period (000 omitted) | $1,521,743 | $941,998 | $1,653,572 | $470,962 | $249,124 | $131,972 |
| Portfolio turnover rateK | 25%J | 56% | 74% | 107% | 143% | 156% |
A For the year ended February 29.
B Calculated based on average shares outstanding during the period.
C Investment income per share reflects a large, non-recurring dividend which amounted to $.02 per share. Excluding this non-recurring dividend, the ratio of net investment income (loss) to average net assets would have been (.19) %.
D Total distributions of $3.01 per share is comprised of distributions from net investment income of $.005 and distributions from net realized gain of $3.009 per share.
E Amount represents less than $.005 per share.
F Total returns for periods of less than one year are not annualized.
G Total returns would have been lower if certain expenses had not been reduced during the applicable periods shown.
H Fees and expenses of any underlying Fidelity Central Funds are not included in the Fund's expense ratio. The Fund indirectly bears its proportionate share of the expenses of any underlying Fidelity Central Funds.
I Expense ratios reflect operating expenses of the Fund. Expenses before reductions do not reflect amounts reimbursed by the investment adviser or reductions from brokerage service arrangements or reductions from other expense offset arrangements and do not represent the amount paid by the Fund during periods when reimbursements or reductions occur. Expenses net of fee waivers reflect expenses after reimbursement by the investment adviser but prior to reductions from brokerage service arrangements or other expense offset arrangements. Expenses net of all reductions represent the net expenses paid by the Fund.
J Annualized
K Amount does not include the portfolio activity of any underlying Fidelity Central Funds.
See accompanying notes which are an integral part of the financial statements.
Software and Computer Services Portfolio
Investment Summary (Unaudited)
Top Ten Stocks as of August 31, 2015
| % of fund's net assets | % of fund's net assets 6 months ago | |
| Microsoft Corp. | 11.1 | 10.9 |
| Google, Inc. Class C | 10.1 | 9.9 |
| Google, Inc. Class A | 8.2 | 6.8 |
| Visa, Inc. Class A | 6.9 | 6.7 |
| Oracle Corp. | 5.7 | 6.2 |
| Facebook, Inc. Class A | 4.9 | 4.9 |
| MasterCard, Inc. Class A | 4.5 | 4.1 |
| Salesforce.com, Inc. | 3.4 | 3.7 |
| Adobe Systems, Inc. | 2.7 | 2.8 |
| Citrix Systems, Inc. | 2.3 | 1.4 |
| 59.8 |
Top Industries (% of fund's net assets)
| As of August 31, 2015 | ||
| Internet Software & Services | 33.0% | |
| Software | 30.7% | |
| IT Services | 22.1% | |
| Communications Equipment | 2.4% | |
| Professional Services | 2.2% | |
| All Others* | 9.6% | |
| As of February 28, 2015 | ||
| Internet Software & Services | 31.2% | |
| Software | 31.1% | |
| IT Services | 22.0% | |
| Media | 3.0% | |
| Professional Services | 2.7% | |
| All Others* | 10.0% | |
* Includes short-term investments and net other assets (liabilities).
Software and Computer Services Portfolio
Investments August 31, 2015 (Unaudited)
Showing Percentage of Net Assets
| Common Stocks - 98.0% | |||
| Shares | Value | ||
| Commercial Services & Supplies - 0.2% | |||
| Security & Alarm Services - 0.2% | |||
| Mix Telematics Ltd. | 24,490,396 | $5,891,665 | |
| Communications Equipment - 2.4% | |||
| Communications Equipment - 2.4% | |||
| QUALCOMM, Inc. | 1,120,000 | 63,369,600 | |
| Sonus Networks, Inc. (a) | 643,200 | 4,528,128 | |
| 67,897,728 | |||
| Consumer Finance - 0.6% | |||
| Consumer Finance - 0.6% | |||
| American Express Co. | 218,000 | 16,724,960 | |
| Diversified Consumer Services - 1.9% | |||
| Education Services - 0.3% | |||
| Chegg, Inc. (a)(b) | 936,200 | 6,955,966 | |
| Specialized Consumer Services - 1.6% | |||
| H&R Block, Inc. | 1,352,191 | 46,001,538 | |
| TOTAL DIVERSIFIED CONSUMER SERVICES | 52,957,504 | ||
| Diversified Telecommunication Services - 0.7% | |||
| Alternative Carriers - 0.7% | |||
| inContact, Inc. (a) | 2,623,756 | 19,809,358 | |
| Electronic Equipment & Components - 1.8% | |||
| Electronic Manufacturing Services - 1.8% | |||
| Trimble Navigation Ltd. (a) | 2,648,200 | 50,050,980 | |
| Internet & Catalog Retail - 0.7% | |||
| Internet Retail - 0.7% | |||
| Groupon, Inc. Class A (a)(b) | 4,294,500 | 19,325,250 | |
| Internet Software & Services - 33.0% | |||
| Internet Software & Services - 33.0% | |||
| Actua Corp. (a) | 429,389 | 6,110,205 | |
| Alibaba Group Holding Ltd. sponsored ADR | 344,700 | 22,791,564 | |
| Bazaarvoice, Inc. (a)(b) | 1,127,200 | 5,850,168 | |
| ChannelAdvisor Corp. (a)(b) | 519,212 | 5,908,633 | |
| Cvent, Inc. (a) | 220,200 | 6,945,108 | |
| Demandware, Inc. (a) | 36,450 | 2,033,546 | |
| Endurance International Group Holdings, Inc. (a) | 804,900 | 12,306,921 | |
| Facebook, Inc. Class A (a) | 1,531,700 | 136,979,931 | |
| Google, Inc.: | |||
| Class A (a) | 357,200 | 231,401,304 | |
| Class C | 458,660 | 283,566,545 | |
| GrubHub, Inc. (a) | 201,100 | 5,319,095 | |
| LinkedIn Corp. Class A (a) | 59,400 | 10,727,640 | |
| Marketo, Inc. (a) | 154,800 | 4,335,948 | |
| New Relic, Inc. | 192,600 | 6,271,056 | |
| NIC, Inc. | 552,300 | 10,405,332 | |
| Opower, Inc. (a)(b) | 503,500 | 4,561,710 | |
| Pandora Media, Inc. (a) | 328,200 | 5,887,908 | |
| Rackspace Hosting, Inc. (a) | 739,500 | 22,488,195 | |
| SciQuest, Inc. (a) | 412,857 | 4,533,170 | |
| Shutterstock, Inc. (a)(b) | 409,500 | 13,722,345 | |
| Textura Corp. (a) | 264,500 | 6,839,970 | |
| Twitter, Inc. (a) | 1,554,300 | 43,193,997 | |
| Web.com Group, Inc. (a) | 878,434 | 18,912,684 | |
| Yahoo!, Inc. (a) | 1,678,559 | 54,116,742 | |
| Yelp, Inc. (a)(b) | 176,400 | 4,282,992 | |
| 929,492,709 | |||
| IT Services - 22.1% | |||
| Data Processing & Outsourced Services - 18.7% | |||
| Alliance Data Systems Corp. (a) | 21,400 | 5,503,866 | |
| EVERTEC, Inc. | 946,100 | 17,124,410 | |
| ExlService Holdings, Inc. (a) | 496,010 | 17,945,642 | |
| Fidelity National Information Services, Inc. | 729,700 | 50,393,082 | |
| MasterCard, Inc. Class A | 1,357,200 | 125,364,564 | |
| The Western Union Co. | 862,100 | 15,897,124 | |
| Total System Services, Inc. | 334,000 | 15,307,220 | |
| Vantiv, Inc. (a) | 242,700 | 10,688,508 | |
| Visa, Inc. Class A | 2,735,320 | 195,028,316 | |
| WEX, Inc. (a) | 215,700 | 20,390,121 | |
| WNS Holdings Ltd. sponsored ADR (a) | 1,438,354 | 42,920,483 | |
| Xerox Corp. | 1,061,600 | 10,796,472 | |
| 527,359,808 | |||
| IT Consulting & Other Services - 3.4% | |||
| IBM Corp. | 360,800 | 53,358,712 | |
| Lionbridge Technologies, Inc. (a)(c) | 5,347,575 | 28,502,575 | |
| Unisys Corp. (a) | 979,300 | 12,897,381 | |
| 94,758,668 | |||
| TOTAL IT SERVICES | 622,118,476 | ||
| Media - 0.8% | |||
| Advertising - 0.8% | |||
| Aimia, Inc. | 114,958 | 1,001,382 | |
| MDC Partners, Inc. Class A (sub. vtg.) | 1,106,181 | 21,725,391 | |
| 22,726,773 | |||
| Professional Services - 2.2% | |||
| Research & Consulting Services - 2.2% | |||
| ICF International, Inc. (a)(c) | 1,824,936 | 62,431,061 | |
| Software - 30.5% | |||
| Application Software - 11.4% | |||
| Adobe Systems, Inc. (a) | 952,500 | 74,837,925 | |
| Cadence Design Systems, Inc. (a) | 986,700 | 19,753,734 | |
| Citrix Systems, Inc. (a) | 963,800 | 65,644,418 | |
| Parametric Technology Corp. (a) | 668,000 | 22,124,160 | |
| RealPage, Inc. (a) | 192,800 | 3,549,448 | |
| Salesforce.com, Inc. (a) | 1,379,126 | 95,656,179 | |
| Workday, Inc. Class A (a) | 356,000 | 25,012,560 | |
| Zendesk, Inc. (a) | 680,200 | 14,066,536 | |
| 320,644,960 | |||
| Home Entertainment Software - 0.7% | |||
| Activision Blizzard, Inc. | 747,900 | 21,412,377 | |
| Systems Software - 18.4% | |||
| CommVault Systems, Inc. (a) | 124,137 | 4,449,070 | |
| Microsoft Corp. | 7,174,300 | 312,225,537 | |
| Oracle Corp. | 4,339,000 | 160,933,510 | |
| Rovi Corp. (a)(b) | 1,514,200 | 16,762,194 | |
| Symantec Corp. | 773,800 | 15,855,162 | |
| Varonis Systems, Inc. (a)(b) | 376,879 | 7,462,204 | |
| 517,687,677 | |||
| TOTAL SOFTWARE | 859,745,014 | ||
| Technology Hardware, Storage & Peripherals - 0.9% | |||
| Technology Hardware, Storage & Peripherals - 0.9% | |||
| EMC Corp. | 1,090,200 | 27,113,274 | |
| Wireless Telecommunication Services - 0.2% | |||
| Wireless Telecommunication Services - 0.2% | |||
| RingCentral, Inc. (a) | 294,300 | 5,064,903 | |
| TOTAL COMMON STOCKS | |||
| (Cost $2,012,533,492) | 2,761,349,655 | ||
| Convertible Preferred Stocks - 0.2% | |||
| Software - 0.2% | |||
| Application Software - 0.2% | |||
| Deem, Inc. (a)(d) | |||
| (Cost $8,064,516) | 2,497,881 | 6,519,469 | |
| Money Market Funds - 3.3% | |||
| Fidelity Cash Central Fund, 0.15% (e) | 44,061,514 | 44,061,514 | |
| Fidelity Securities Lending Cash Central Fund, 0.19% (e)(f) | 47,684,475 | 47,684,475 | |
| TOTAL MONEY MARKET FUNDS | |||
| (Cost $91,745,989) | 91,745,989 | ||
| TOTAL INVESTMENT PORTFOLIO - 101.5% | |||
| (Cost $2,112,343,997) | 2,859,615,113 | ||
| NET OTHER ASSETS (LIABILITIES) - (1.5)% | (42,223,775) | ||
| NET ASSETS - 100% | $2,817,391,338 |
Legend
(a) Non-income producing
(b) Security or a portion of the security is on loan at period end.
(c) Affiliated company
(d) Restricted securities - Investment in securities not registered under the Securities Act of 1933 (excluding 144A issues). At the end of the period, the value of restricted securities (excluding 144A issues) amounted to $6,519,469 or 0.2% of net assets.
(e) Affiliated fund that is generally available only to investment companies and other accounts managed by Fidelity Investments. The rate quoted is the annualized seven-day yield of the fund at period end. A complete unaudited listing of the fund's holdings as of its most recent quarter end is available upon request. In addition, each Fidelity Central Fund's financial statements are available on the SEC's website or upon request.
(f) Investment made with cash collateral received from securities on loan.
Additional information on each restricted holding is as follows:
| Security | Acquisition Date | Acquisition Cost |
| Deem, Inc. | 9/19/13 | $8,064,516 |
Affiliated Central Funds
Information regarding fiscal year to date income earned by the Fund from investments in Fidelity Central Funds is as follows:
| Fund | Income earned |
| Fidelity Cash Central Fund | $ 59,248 |
| Fidelity Securities Lending Cash Central Fund | 279,115 |
| Total | $338,363 |
Other Affiliated Issuers
An affiliated company is a company in which the Fund has ownership of at least 5% of the voting securities. Fiscal year to date transactions with companies which are or were affiliates are as follows:
| Affiliate | Value, beginning of period | Purchases | Sales Proceeds | Dividend Income | Value, end of period |
| E2open, Inc. | $13,347,484 | $-- | $13,394,208 | $-- | $-- |
| ICF International, Inc. | 81,216,278 | -- | 4,276,363 | -- | 62,431,061 |
| Lionbridge Technologies, Inc. | 35,222,828 | -- | 5,582,861 | -- | 28,502,575 |
| MDC Partners, Inc. Class A (sub. vtg.) | 89,859,570 | -- | 50,418,039 | 1,379,099 | -- |
| Web.com Group, Inc. | 51,303,292 | -- | 45,942,747 | -- | -- |
| WNS Holdings Ltd. sponsored ADR | 71,644,587 | -- | 40,848,285 | -- | -- |
| Total | $342,594,039 | $-- | $160,462,503 | $1,379,099 | $90,933,636 |
Investment Valuation
The following is a summary of the inputs used, as of August 31, 2015, involving the Fund's assets and liabilities carried at fair value. The inputs or methodology used for valuing securities may not be an indication of the risk associated with investing in those securities. For more information on valuation inputs, and their aggregation into the levels used below, please refer to the Investment Valuation section in the accompanying Notes to Financial Statements.
| Valuation Inputs at Reporting Date: | ||||
| Description | Total | Level 1 | Level 2 | Level 3 |
| Investments in Securities: | ||||
| Common Stocks | $2,761,349,655 | $2,761,349,655 | $-- | $-- |
| Convertible Preferred Stocks | 6,519,469 | -- | -- | 6,519,469 |
| Money Market Funds | 91,745,989 | 91,745,989 | -- | -- |
| Total Investments in Securities: | $2,859,615,113 | $2,853,095,644 | $-- | $6,519,469 |
See accompanying notes which are an integral part of the financial statements.
Software and Computer Services Portfolio
Financial Statements
Statement of Assets and Liabilities
| August 31, 2015 (Unaudited) | ||
| Assets | ||
| Investment in securities, at value (including securities loaned of $45,745,244) — See accompanying schedule: Unaffiliated issuers (cost $1,947,850,800) | $2,676,935,488 | |
| Fidelity Central Funds (cost $91,745,989) | 91,745,989 | |
| Other affiliated issuers (cost $72,747,208) | 90,933,636 | |
| Total Investments (cost $2,112,343,997) | $2,859,615,113 | |
| Receivable for investments sold | 6,083,370 | |
| Receivable for fund shares sold | 1,727,225 | |
| Dividends receivable | 4,021,419 | |
| Distributions receivable from Fidelity Central Funds | 57,732 | |
| Prepaid expenses | 21,120 | |
| Other receivables | 202,374 | |
| Total assets | 2,871,728,353 | |
| Liabilities | ||
| Payable for investments purchased | $3,076,964 | |
| Payable for fund shares redeemed | 1,645,884 | |
| Accrued management fee | 1,336,885 | |
| Other affiliated payables | 497,080 | |
| Other payables and accrued expenses | 95,727 | |
| Collateral on securities loaned, at value | 47,684,475 | |
| Total liabilities | 54,337,015 | |
| Net Assets | $2,817,391,338 | |
| Net Assets consist of: | ||
| Paid in capital | $1,986,063,225 | |
| Undistributed net investment income | 1,424,832 | |
| Accumulated undistributed net realized gain (loss) on investments and foreign currency transactions | 82,710,478 | |
| Net unrealized appreciation (depreciation) on investments and assets and liabilities in foreign currencies | 747,192,803 | |
| Net Assets, for 24,808,262 shares outstanding | $2,817,391,338 | |
| Net Asset Value, offering price and redemption price per share ($2,817,391,338 ÷ 24,808,262 shares) | $113.57 |
See accompanying notes which are an integral part of the financial statements.
Statement of Operations
| Six months ended August 31, 2015 (Unaudited) | ||
| Investment Income | ||
| Dividends (including $1,379,099 earned from other affiliated issuers) | $12,170,085 | |
| Interest | 9 | |
| Income from Fidelity Central Funds (including $279,115 from security lending) | 338,363 | |
| Total income | 12,508,457 | |
| Expenses | ||
| Management fee | $7,993,796 | |
| Transfer agent fees | 2,569,433 | |
| Accounting and security lending fees | 435,429 | |
| Custodian fees and expenses | 25,507 | |
| Independent trustees' compensation | 24,907 | |
| Registration fees | 45,509 | |
| Audit | 26,540 | |
| Legal | 19,475 | |
| Miscellaneous | 20,288 | |
| Total expenses before reductions | 11,160,884 | |
| Expense reductions | (132,853) | 11,028,031 |
| Net investment income (loss) | 1,480,426 | |
| Realized and Unrealized Gain (Loss)
Net realized gain (loss) on: | ||
| Investment securities: | ||
| Unaffiliated issuers | 50,588,353 | |
| Other affiliated issuers | 33,204,075 | |
| Foreign currency transactions | (19,643) | |
| Total net realized gain (loss) | 83,772,785 | |
| Change in net unrealized appreciation (depreciation) on: Investment securities | (162,696,654) | |
| Assets and liabilities in foreign currencies | (11,683) | |
| Total change in net unrealized appreciation (depreciation) | (162,708,337) | |
| Net gain (loss) | (78,935,552) | |
| Net increase (decrease) in net assets resulting from operations | $(77,455,126) |
See accompanying notes which are an integral part of the financial statements.
Statement of Changes in Net Assets
| Six months ended August 31, 2015 (Unaudited) | Year ended February 28, 2015 | |
| Increase (Decrease) in Net Assets | ||
| Operations | ||
| Net investment income (loss) | $1,480,426 | $(4,676,943) |
| Net realized gain (loss) | 83,772,785 | 345,090,319 |
| Change in net unrealized appreciation (depreciation) | (162,708,337) | (213,840,902) |
| Net increase (decrease) in net assets resulting from operations | (77,455,126) | 126,572,474 |
| Distributions to shareholders from net realized gain | (69,544,038) | (318,048,641) |
| Share transactions | ||
| Proceeds from sales of shares | 229,385,883 | 613,896,141 |
| Reinvestment of distributions | 66,823,885 | 306,040,231 |
| Cost of shares redeemed | (344,620,693) | (1,560,250,010) |
| Net increase (decrease) in net assets resulting from share transactions | (48,410,925) | (640,313,638) |
| Redemption fees | 9,695 | 76,611 |
| Total increase (decrease) in net assets | (195,400,394) | (831,713,194) |
| Net Assets | ||
| Beginning of period | 3,012,791,732 | 3,844,504,926 |
| End of period (including undistributed net investment income of $1,424,832 and accumulated net investment loss of $55,594, respectively) | $2,817,391,338 | $3,012,791,732 |
| Other Information
Shares | ||
| Sold | 1,949,827 | 5,243,985 |
| Issued in reinvestment of distributions | 579,817 | 2,681,318 |
| Redeemed | (2,959,080) | (13,597,758) |
| Net increase (decrease) | (429,436) | (5,672,455) |
See accompanying notes which are an integral part of the financial statements.
Financial Highlights — Software and Computer Services Portfolio
| Six months ended (Unaudited) | Years ended February 28, | |||||
| August 31, | 2015 | 2015 | 2014 | 2013 | 2012 A | 2011 |
| Selected Per–Share Data | ||||||
| Net asset value, beginning of period | $119.38 | $124.38 | $87.97 | $89.96 | $91.63 | $72.29 |
| Income from Investment Operations | ||||||
| Net investment income (loss)B | .06 | (.17) | .06 | .04 | (.06) | (.11) |
| Net realized and unrealized gain (loss) | (3.07) | 7.26 | 41.95 | 7.25 | 10.39 | 22.28 |
| Total from investment operations | (3.01) | 7.09 | 42.01 | 7.29 | 10.33 | 22.17 |
| Distributions from net investment income | – | – | – | (.78)C | – | – |
| Distributions from net realized gain | (2.80) | (12.09) | (5.60) | (8.50)C | (12.00) | (2.83) |
| Total distributions | (2.80) | (12.09) | (5.60) | (9.28) | (12.00) | (2.83) |
| Redemption fees added to paid in capitalB,D | – | – | – | – | – | – |
| Net asset value, end of period | $113.57 | $119.38 | $124.38 | $87.97 | $89.96 | $91.63 |
| Total ReturnE,F | (2.55)% | 6.33% | 48.18% | 8.85% | 13.08% | 30.85% |
| Ratios to Average Net AssetsG,H | ||||||
| Expenses before reductions | .77%I | .77% | .79% | .82% | .82% | .84% |
| Expenses net of fee waivers, if any | .76%I | .77% | .79% | .82% | .82% | .84% |
| Expenses net of all reductions | .76%I | .77% | .78% | .80% | .81% | .83% |
| Net investment income (loss) | .10%I | (.15)% | .06% | .04% | (.07)% | (.13)% |
| Supplemental Data | ||||||
| Net assets, end of period (000 omitted) | $2,817,391 | $3,012,792 | $3,844,505 | $2,027,731 | $1,621,616 | $1,299,253 |
| Portfolio turnover rateJ | 32%I | 53% | 87% | 96% | 238% | 189% |
A For the year ended February 29.
B Calculated based on average shares outstanding during the period.
C The amounts shown reflect certain reclassifications related to book to tax differences that were made in the year shown.
D Amount represents less than $.005 per share.
E Total returns for periods of less than one year are not annualized.
F Total returns would have been lower if certain expenses had not been reduced during the applicable periods shown.
G Fees and expenses of any underlying Fidelity Central Funds are not included in the Fund's expense ratio. The Fund indirectly bears its proportionate share of the expenses of any underlying Fidelity Central Funds.
H Expense ratios reflect operating expenses of the Fund. Expenses before reductions do not reflect amounts reimbursed by the investment adviser or reductions from brokerage service arrangements or reductions from other expense offset arrangements and do not represent the amount paid by the Fund during periods when reimbursements or reductions occur. Expenses net of fee waivers reflect expenses after reimbursement by the investment adviser but prior to reductions from brokerage service arrangements or other expense offset arrangements. Expenses net of all reductions represent the net expenses paid by the Fund.
I Annualized
J Amount does not include the portfolio activity of any underlying Fidelity Central Funds.
See accompanying notes which are an integral part of the financial statements.
Technology Portfolio
Investment Summary (Unaudited)
Top Ten Stocks as of August 31, 2015
| % of fund's net assets | % of fund's net assets 6 months ago | |
| Apple, Inc. | 12.4 | 15.4 |
| Google, Inc. Class C | 5.5 | 4.5 |
| Google, Inc. Class A | 5.2 | 4.4 |
| Facebook, Inc. Class A | 5.0 | 6.5 |
| Yahoo!, Inc. | 3.1 | 2.7 |
| QUALCOMM, Inc. | 2.7 | 2.5 |
| Microsoft Corp. | 2.5 | 0.0 |
| Marvell Technology Group Ltd. | 2.1 | 1.1 |
| Hewlett-Packard Co. | 2.0 | 1.5 |
| Visa, Inc. Class A | 2.0 | 1.7 |
| 42.5 |
Top Industries (% of fund's net assets)
| As of August 31, 2015 | ||
| Internet Software & Services | 28.1% | |
| Technology Hardware, Storage & Peripherals | 17.1% | |
| Software | 14.3% | |
| Semiconductors & Semiconductor Equipment | 12.5% | |
| IT Services | 7.0% | |
| All Others* | 21.0% | |
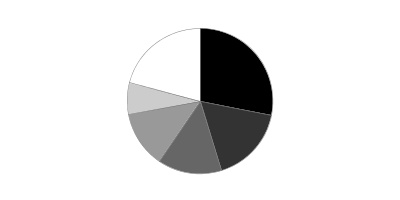
| As of February 28, 2015 | ||
| Internet Software & Services | 29.1% | |
| Technology Hardware, Storage & Peripherals | 18.4% | |
| Software | 12.7% | |
| Semiconductors & Semiconductor Equipment | 9.1% | |
| Communications Equipment | 7.6% | |
| All Others* | 23.1% | |

* Includes short-term investments and net other assets (liabilities).
Percentages shown as 0.0% may reflect amounts less than 0.05%.
Technology Portfolio
Investments August 31, 2015 (Unaudited)
Showing Percentage of Net Assets
| Common Stocks - 98.3% | |||
| Shares | Value | ||
| Auto Components - 0.0% | |||
| Auto Parts & Equipment - 0.0% | |||
| NOK Corp. | 44,400 | $1,091,425 | |
| Weifu High-Technology Co. Ltd. (B Shares) | 98,200 | 262,161 | |
| 1,353,586 | |||
| Automobiles - 1.6% | |||
| Automobile Manufacturers - 1.6% | |||
| Tesla Motors, Inc. (a)(b) | 174,156 | 43,375,293 | |
| Banks - 0.8% | |||
| Diversified Banks - 0.8% | |||
| Hangzhou Hikvision Digital Technology Co. Ltd. ELS (BNP Paribas Warrant Program) warrants 11/27/17 (a)(c) | 3,919,700 | 18,009,975 | |
| Midea Group ELS (BNP Paribas Arbitrage Warrant Program) warrants 1/6/16 (a)(c) | 621,700 | 2,807,030 | |
| 20,817,005 | |||
| Biotechnology - 0.1% | |||
| Biotechnology - 0.1% | |||
| JHL Biotech, Inc. (d) | 507,721 | 1,898,877 | |
| Chemicals - 0.2% | |||
| Specialty Chemicals - 0.2% | |||
| Duk San Neolux Co. Ltd. (a) | 192,897 | 2,731,952 | |
| JSR Corp. | 15,900 | 249,263 | |
| Nitto Denko Corp. | 21,600 | 1,447,552 | |
| 4,428,767 | |||
| Communications Equipment - 5.5% | |||
| Communications Equipment - 5.5% | |||
| BYD Electronic International Co. Ltd. | 2,900,500 | 1,676,665 | |
| Ciena Corp. (a)(b) | 459,300 | 10,269,948 | |
| Cisco Systems, Inc. | 1,315,800 | 34,052,904 | |
| CommScope Holding Co., Inc. (a) | 656,800 | 21,247,480 | |
| Ixia (a) | 297,176 | 4,597,313 | |
| Juniper Networks, Inc. | 1,056 | 27,150 | |
| Palo Alto Networks, Inc. (a) | 10,000 | 1,642,200 | |
| QUALCOMM, Inc. | 1,325,900 | 75,019,422 | |
| Radware Ltd. (a) | 1,163 | 21,643 | |
| 148,554,725 | |||
| Construction Materials - 0.0% | |||
| Construction Materials - 0.0% | |||
| Universal Cement Corp. | 894,744 | 579,679 | |
| Diversified Consumer Services - 0.8% | |||
| Education Services - 0.8% | |||
| New Oriental Education & Technology Group, Inc. sponsored ADR | 991,131 | 20,308,274 | |
| TAL Education Group ADR (a) | 44,300 | 1,358,681 | |
| 21,666,955 | |||
| Specialized Consumer Services - 0.0% | |||
| LifeLock, Inc. (a)(b) | 1,500 | 12,675 | |
| TOTAL DIVERSIFIED CONSUMER SERVICES | 21,679,630 | ||
| Diversified Telecommunication Services - 0.1% | |||
| Alternative Carriers - 0.1% | |||
| 8x8, Inc. (a) | 489,000 | 3,779,970 | |
| Electrical Equipment - 0.8% | |||
| Electrical Components & Equipment - 0.8% | |||
| Lumenpulse, Inc. (a) | 40,300 | 454,891 | |
| Nidec Corp. | 53,400 | 4,181,059 | |
| OSRAM Licht AG | 335,075 | 17,732,368 | |
| 22,368,318 | |||
| Electronic Equipment & Components - 3.5% | |||
| Electronic Components - 1.5% | |||
| Alps Electric Co. Ltd. | 144,500 | 4,515,570 | |
| AU Optronics Corp. | 9,216,000 | 2,933,856 | |
| Japan Aviation Electronics Industry Ltd. | 1,000 | 18,253 | |
| Largan Precision Co. Ltd. | 2,000 | 185,898 | |
| Ledlink Optics, Inc. | 1,567,914 | 2,195,688 | |
| Murata Manufacturing Co. Ltd. | 10,700 | 1,541,265 | |
| OMRON Corp. | 76,000 | 2,847,750 | |
| Samsung SDI Co. Ltd. | 70,883 | 5,064,441 | |
| Sunny Optical Technology Group Co. Ltd. | 6,072,000 | 10,122,546 | |
| Taiyo Yuden Co. Ltd. | 113,000 | 1,376,976 | |
| TDK Corp. | 22,600 | 1,402,182 | |
| TPK Holding Co. Ltd. | 1,077,000 | 2,701,533 | |
| Universal Display Corp. (a) | 600 | 22,104 | |
| Yageo Corp. | 3,709,217 | 5,257,131 | |
| Yaskawa Electric Corp. | 1,900 | 21,628 | |
| 40,206,821 | |||
| Electronic Equipment & Instruments - 0.3% | |||
| Chroma ATE, Inc. | 3,293,644 | 5,453,758 | |
| Cognex Corp. | 62,900 | 2,236,724 | |
| Keyence Corp. | 500 | 231,459 | |
| 7,921,941 | |||
| Electronic Manufacturing Services - 1.5% | |||
| AAC Technology Holdings, Inc. | 544,500 | 3,066,745 | |
| Trimble Navigation Ltd. (a) | 1,925,821 | 36,398,017 | |
| 39,464,762 | |||
| Technology Distributors - 0.2% | |||
| Digital China Holdings Ltd. (H Shares) | 7,644,000 | 6,687,224 | |
| TOTAL ELECTRONIC EQUIPMENT & COMPONENTS | 94,280,748 | ||
| Health Care Equipment & Supplies - 0.1% | |||
| Health Care Equipment - 0.1% | |||
| Intai Technology Corp. | 967,000 | 2,800,612 | |
| Olympus Corp. | 8,000 | 290,652 | |
| 3,091,264 | |||
| Health Care Providers & Services - 0.0% | |||
| Managed Health Care - 0.0% | |||
| HealthEquity, Inc. (a) | 1,100 | 32,252 | |
| Health Care Technology - 0.7% | |||
| Health Care Technology - 0.7% | |||
| athenahealth, Inc. (a)(b) | 120,926 | 16,079,530 | |
| M3, Inc. | 56,600 | 1,309,593 | |
| Medidata Solutions, Inc. (a) | 27,400 | 1,315,748 | |
| 18,704,871 | |||
| Hotels, Restaurants & Leisure - 0.2% | |||
| Casinos & Gaming - 0.2% | |||
| 500.com Ltd. sponsored ADR Class A (a)(b) | 354,329 | 5,531,076 | |
| Household Durables - 0.3% | |||
| Consumer Electronics - 0.3% | |||
| Sky Light Holdings Ltd. | 530,000 | 187,379 | |
| Skyworth Digital Holdings Ltd. | 590,000 | 340,295 | |
| Sony Corp. (a) | 220,100 | 5,675,497 | |
| Sony Corp. sponsored ADR (a) | 89,000 | 2,294,420 | |
| TCL Multimedia Technology Holdings Ltd. | 616,000 | 276,602 | |
| 8,774,193 | |||
| Internet & Catalog Retail - 2.5% | |||
| Internet Retail - 2.5% | |||
| Amazon.com, Inc. (a) | 13,500 | 6,924,015 | |
| ASOS PLC (a) | 6,400 | 294,035 | |
| Groupon, Inc. Class A (a)(b) | 3,719,800 | 16,739,100 | |
| JD.com, Inc. sponsored ADR (a) | 132,800 | 3,436,864 | |
| Jumei International Holding Ltd. sponsored ADR (a)(b) | 2,712,087 | 28,042,980 | |
| MySale Group PLC (a) | 42,200 | 34,968 | |
| Priceline Group, Inc. (a) | 100 | 124,864 | |
| Qunar Cayman Islands Ltd. sponsored ADR (a) | 56,465 | 1,835,113 | |
| Travelport Worldwide Ltd. | 156,100 | 2,068,325 | |
| Vipshop Holdings Ltd. ADR (a) | 519,780 | 9,350,842 | |
| zulily, Inc. Class A (a) | 1,900 | 33,725 | |
| 68,884,831 | |||
| Internet Software & Services - 27.3% | |||
| Internet Software & Services - 27.3% | |||
| 58.com, Inc. ADR (a)(b) | 349,764 | 15,900,271 | |
| Alibaba Group Holding Ltd. sponsored ADR | 18,800 | 1,243,056 | |
| Baidu.com, Inc. sponsored ADR (a) | 166,800 | 24,561,300 | |
| Bitauto Holdings Ltd. ADR (a) | 59,734 | 1,603,858 | |
| ChannelAdvisor Corp. (a) | 241,600 | 2,749,408 | |
| Constant Contact, Inc. (a) | 800 | 19,808 | |
| Cornerstone OnDemand, Inc. (a) | 181,286 | 6,479,162 | |
| Cvent, Inc. (a) | 133,064 | 4,196,839 | |
| Demandware, Inc. (a) | 60,874 | 3,396,160 | |
| DeNA Co. Ltd. | 580,800 | 10,593,556 | |
| eBay, Inc. (a) | 4,800 | 130,128 | |
| Endurance International Group Holdings, Inc. (a) | 1,058,920 | 16,190,887 | |
| Facebook, Inc. Class A (a) | 1,529,974 | 136,825,575 | |
| Google, Inc.: | |||
| Class A (a) | 218,603 | 141,615,395 | |
| Class C | 240,368 | 148,607,516 | |
| HomeAway, Inc. (a) | 488,701 | 14,020,832 | |
| Hortonworks, Inc. | 2,800 | 66,528 | |
| LendingClub Corp. (b) | 1,100 | 13,805 | |
| LinkedIn Corp. Class A (a) | 1,500 | 270,900 | |
| Marketo, Inc. (a)(b) | 227,964 | 6,385,272 | |
| Momo, Inc. ADR (b) | 20,777 | 242,260 | |
| NAVER Corp. | 24,798 | 10,389,462 | |
| New Relic, Inc. | 800 | 26,048 | |
| NIC, Inc. | 119,768 | 2,256,429 | |
| Q2 Holdings, Inc. (a) | 1,400 | 36,624 | |
| Qihoo 360 Technology Co. Ltd. ADR (a) | 199,521 | 10,548,675 | |
| Rackspace Hosting, Inc. (a) | 55,891 | 1,699,645 | |
| Renren, Inc. ADR (a)(b) | 295,600 | 937,052 | |
| SciQuest, Inc. (a) | 344,142 | 3,778,679 | |
| SINA Corp. (a) | 59,100 | 2,290,125 | |
| Sohu.com, Inc. (a)(b) | 31,200 | 1,476,696 | |
| SouFun Holdings Ltd. ADR (b) | 1,198,000 | 6,541,080 | |
| Textura Corp. (a) | 450,781 | 11,657,197 | |
| Twitter, Inc. (a) | 246,000 | 6,836,340 | |
| Web.com Group, Inc. (a) | 383,898 | 8,265,324 | |
| Weibo Corp. sponsored ADR (a)(b) | 102,300 | 1,240,899 | |
| Xunlei Ltd. sponsored ADR (a) | 1,027,755 | 8,129,542 | |
| Yahoo!, Inc. (a) | 2,608,600 | 84,101,264 | |
| Yelp, Inc. (a)(b) | 199,524 | 4,844,443 | |
| Youku Tudou, Inc. ADR (a)(b) | 2,272,007 | 37,738,036 | |
| YY, Inc. ADR (a)(b) | 49,804 | 2,720,294 | |
| Zillow Group, Inc. (a)(b) | 19,598 | 497,397 | |
| Zillow Group, Inc. Class C (a)(b) | 39,196 | 966,573 | |
| 742,090,340 | |||
| IT Services - 7.0% | |||
| Data Processing & Outsourced Services - 6.0% | |||
| Euronet Worldwide, Inc. (a) | 47,901 | 3,088,177 | |
| Fidelity National Information Services, Inc. | 506,168 | 34,955,962 | |
| FleetCor Technologies, Inc. (a) | 102,600 | 15,303,816 | |
| Optimal Payments PLC (a) | 2,968,641 | 14,486,107 | |
| PayPal Holdings, Inc. (a) | 4,800 | 168,000 | |
| Total System Services, Inc. | 467,899 | 21,443,811 | |
| Vantiv, Inc. (a) | 440,300 | 19,390,812 | |
| Visa, Inc. Class A | 758,500 | 54,081,050 | |
| 162,917,735 | |||
| IT Consulting & Other Services - 1.0% | |||
| Cognizant Technology Solutions Corp. Class A (a) | 430,312 | 27,083,837 | |
| EPAM Systems, Inc. (a) | 5,305 | 374,586 | |
| Virtusa Corp. (a) | 600 | 31,752 | |
| 27,490,175 | |||
| TOTAL IT SERVICES | 190,407,910 | ||
| Life Sciences Tools & Services - 0.0% | |||
| Life Sciences Tools & Services - 0.0% | |||
| WuXi PharmaTech Cayman, Inc. sponsored ADR (a) | 4,000 | 169,040 | |
| Machinery - 1.0% | |||
| Construction Machinery & Heavy Trucks - 0.8% | |||
| Zhengzhou Yutong Bus Co. Ltd. | 7,639,409 | 22,499,859 | |
| Industrial Machinery - 0.2% | |||
| Harmonic Drive Systems, Inc. (b) | 96,700 | 1,498,178 | |
| Minebea Ltd. | 257,000 | 3,067,277 | |
| 4,565,455 | |||
| TOTAL MACHINERY | 27,065,314 | ||
| Media - 0.9% | |||
| Advertising - 0.1% | |||
| iCar Asia Ltd. (a) | 2,268,088 | 1,065,296 | |
| Cable & Satellite - 0.2% | |||
| Naspers Ltd. Class N | 45,302 | 5,872,795 | |
| Movies & Entertainment - 0.4% | |||
| Bona Film Group Ltd. sponsored ADR (a) | 371,278 | 4,303,112 | |
| IMAX Corp. (a) | 217,100 | 6,806,085 | |
| 11,109,197 | |||
| Publishing - 0.2% | |||
| NEXT Co. Ltd. | 39,300 | 235,243 | |
| Schibsted ASA: | |||
| (A Shares) | 97,366 | 3,179,111 | |
| (B Shares) (a) | 97,288 | 3,034,259 | |
| 6,448,613 | |||
| TOTAL MEDIA | 24,495,901 | ||
| Professional Services - 0.5% | |||
| Human Resource & Employment Services - 0.4% | |||
| 51job, Inc. sponsored ADR (a) | 800 | 21,448 | |
| WageWorks, Inc. (a) | 227,900 | 10,212,199 | |
| 10,233,647 | |||
| Research & Consulting Services - 0.1% | |||
| ICF International, Inc. (a) | 61,500 | 2,103,915 | |
| Verisk Analytics, Inc. (a) | 400 | 29,232 | |
| 2,133,147 | |||
| TOTAL PROFESSIONAL SERVICES | 12,366,794 | ||
| Real Estate Management & Development - 0.0% | |||
| Real Estate Development - 0.0% | |||
| Greenland Hong Kong Holdings Ltd. (a) | 1,966,000 | 865,034 | |
| Semiconductors & Semiconductor Equipment - 12.5% | |||
| Semiconductor Equipment - 0.4% | |||
| Amkor Technology, Inc. (a) | 76,220 | 411,588 | |
| EO Technics Co. Ltd. | 14,623 | 1,334,107 | |
| Hermes Microvision, Inc. | 43,000 | 1,826,352 | |
| Nanometrics, Inc. (a) | 21,591 | 299,899 | |
| Rubicon Technology, Inc. (a)(b) | 1,264,318 | 1,770,045 | |
| SunEdison, Inc. (a) | 1,300 | 13,520 | |
| Ultratech, Inc. (a) | 222,400 | 3,825,280 | |
| 9,480,791 | |||
| Semiconductors - 12.1% | |||
| Advanced Semiconductor Engineering, Inc. | 4,868,000 | 4,921,188 | |
| Advanced Semiconductor Engineering, Inc. sponsored ADR | 769,025 | 3,783,603 | |
| Analog Devices, Inc. | 4,900 | 273,714 | |
| Atmel Corp. | 3,169,500 | 25,894,815 | |
| Avago Technologies Ltd. | 46,500 | 5,857,605 | |
| Broadcom Corp. Class A | 487,619 | 25,195,274 | |
| Cavium, Inc. (a) | 92,100 | 6,264,642 | |
| Chipbond Technology Corp. | 3,810,000 | 5,558,278 | |
| ChipMOS TECHNOLOGIES (Bermuda) Ltd. | 115,924 | 2,155,027 | |
| Cirrus Logic, Inc. (a) | 41,000 | 1,236,560 | |
| Cypress Semiconductor Corp. | 144,400 | 1,444,000 | |
| Everlight Electronics Co. Ltd. | 4,410,000 | 5,307,039 | |
| Fairchild Semiconductor International, Inc. (a) | 40,800 | 554,880 | |
| Freescale Semiconductor, Inc. (a) | 187,127 | 6,686,048 | |
| Genesis Photonics, Inc. (a) | 5,306,208 | 1,141,559 | |
| Hua Hong Semiconductor Ltd. (a) | 4,017,000 | 3,591,952 | |
| Inotera Memories, Inc. (a) | 10,292,000 | 6,208,587 | |
| Intel Corp. | 453,500 | 12,942,890 | |
| Intersil Corp. Class A | 630,685 | 6,647,420 | |
| King Yuan Electronics Co. Ltd. | 638,000 | 410,397 | |
| Lextar Electronics Corp. | 810,000 | 341,541 | |
| MagnaChip Semiconductor Corp. (a)(b) | 295,035 | 2,522,549 | |
| Marvell Technology Group Ltd. | 4,966,459 | 55,971,993 | |
| Maxim Integrated Products, Inc. | 600,400 | 20,215,468 | |
| Melexis NV | 567 | 28,259 | |
| Micron Technology, Inc. (a) | 921,900 | 15,128,379 | |
| Microsemi Corp. (a) | 412,193 | 13,091,250 | |
| Monolithic Power Systems, Inc. | 129,695 | 6,237,033 | |
| Novatek Microelectronics Corp. | 49,000 | 164,384 | |
| ON Semiconductor Corp. (a) | 382,900 | 3,658,610 | |
| PMC-Sierra, Inc. (a) | 594,600 | 3,740,034 | |
| Power Integrations, Inc. | 75,500 | 2,963,375 | |
| Qorvo, Inc. (a) | 502,117 | 27,872,515 | |
| Radiant Opto-Electronics Corp. | 2,849,000 | 8,312,616 | |
| Sanken Electric Co. Ltd. | 642,000 | 2,460,758 | |
| Semiconductor Manufacturing International Corp. sponsored ADR (a) | 40,300 | 173,290 | |
| Semtech Corp. (a) | 477,976 | 8,101,693 | |
| Silicon Laboratories, Inc. (a) | 59,240 | 2,575,755 | |
| Siliconware Precision Industries Co. Ltd. | 6,845,000 | 8,263,044 | |
| Siliconware Precision Industries Co. Ltd. sponsored ADR (b) | 1,768,800 | 10,913,496 | |
| STMicroelectronics NV | 2,860 | 20,741 | |
| Taiwan Semiconductor Manufacturing Co. Ltd. sponsored ADR | 211,900 | 4,212,572 | |
| United Microelectronics Corp. sponsored ADR | 402,600 | 656,238 | |
| Vanguard International Semiconductor Corp. | 5,089,000 | 5,795,236 | |
| 329,496,307 | |||
| TOTAL SEMICONDUCTORS & SEMICONDUCTOR EQUIPMENT | 338,977,098 | ||
| Software - 14.3% | |||
| Application Software - 6.7% | |||
| Adobe Systems, Inc. (a) | 335,739 | 26,379,013 | |
| ANSYS, Inc. (a) | 314 | 27,820 | |
| Autodesk, Inc. (a) | 168,500 | 7,877,375 | |
| Blackbaud, Inc. | 32,000 | 1,828,480 | |
| Citrix Systems, Inc. (a) | 421,507 | 28,708,842 | |
| Guidewire Software, Inc. (a) | 411 | 22,979 | |
| Idreamsky Technology Ltd. ADR | 249,891 | 2,753,799 | |
| Interactive Intelligence Group, Inc. (a) | 129,390 | 4,529,944 | |
| Intuit, Inc. | 242,100 | 20,760,075 | |
| Kingdee International Software Group Co. Ltd. | 15,827,600 | 5,432,406 | |
| Linx SA | 1,400 | 16,827 | |
| Mobileye NV (a) | 51,700 | 2,924,152 | |
| Parametric Technology Corp. (a) | 80,000 | 2,649,600 | |
| Paylocity Holding Corp. (a)(b) | 75,528 | 2,493,935 | |
| Qlik Technologies, Inc. (a) | 147,800 | 5,595,708 | |
| RealPage, Inc. (a) | 392,100 | 7,218,561 | |
| Salesforce.com, Inc. (a) | 619,892 | 42,995,709 | |
| SolarWinds, Inc. (a) | 536 | 21,306 | |
| Splunk, Inc. (a) | 40,317 | 2,498,444 | |
| SS&C Technologies Holdings, Inc. | 94,000 | 6,367,560 | |
| Ultimate Software Group, Inc. (a) | 117 | 20,614 | |
| Workday, Inc. Class A (a) | 17,600 | 1,236,576 | |
| Workiva, Inc. | 1,900 | 27,227 | |
| Yodlee, inc. | 2,300 | 37,283 | |
| Zendesk, Inc. (a) | 514,475 | 10,639,343 | |
| 183,063,578 | |||
| Home Entertainment Software - 1.3% | |||
| Activision Blizzard, Inc. | 527,400 | 15,099,462 | |
| Electronic Arts, Inc. (a) | 101,000 | 6,681,150 | |
| Nintendo Co. Ltd. | 72,000 | 14,813,727 | |
| 36,594,339 | |||
| Systems Software - 6.3% | |||
| Allot Communications Ltd. (a) | 528,072 | 2,756,536 | |
| Cheetah Mobile, Inc. ADR (a)(b) | 30,100 | 519,827 | |
| CommVault Systems, Inc. (a) | 600 | 21,504 | |
| Fleetmatics Group PLC (a) | 543,787 | 24,339,906 | |
| Imperva, Inc. (a) | 661 | 39,382 | |
| Infoblox, Inc. (a) | 1,700 | 32,708 | |
| Microsoft Corp. | 1,563,640 | 68,049,613 | |
| NetSuite, Inc. (a)(b) | 178,284 | 15,840,533 | |
| Oracle Corp. | 1,193,600 | 44,270,624 | |
| Progress Software Corp. (a) | 119,700 | 3,242,673 | |
| Rapid7, Inc. (a)(b) | 4,600 | 97,014 | |
| Red Hat, Inc. (a) | 18,912 | 1,365,636 | |
| ServiceNow, Inc. (a) | 128,550 | 9,121,908 | |
| Tableau Software, Inc. (a) | 6,000 | 565,020 | |
| VMware, Inc. Class A (a) | 300 | 23,745 | |
| 170,286,629 | |||
| TOTAL SOFTWARE | 389,944,546 | ||
| Technology Hardware, Storage & Peripherals - 17.1% | |||
| Technology Hardware, Storage & Peripherals - 17.1% | |||
| Apple, Inc. | 2,978,597 | 335,866,597 | |
| BlackBerry Ltd. (a) | 2,700 | 20,482 | |
| Electronics for Imaging, Inc. (a) | 159,349 | 6,974,706 | |
| EMC Corp. | 460,900 | 11,462,583 | |
| Hewlett-Packard Co. | 1,950,600 | 54,733,836 | |
| Nimble Storage, Inc. (a) | 9,400 | 250,604 | |
| SanDisk Corp. | 55,445 | 3,025,079 | |
| Seagate Technology LLC | 494,900 | 25,437,860 | |
| Silicon Graphics International Corp. (a) | 439,166 | 2,195,830 | |
| Stratasys Ltd. (a) | 300 | 9,198 | |
| Western Digital Corp. | 303,500 | 24,874,860 | |
| 464,851,635 | |||
| Wireless Telecommunication Services - 0.5% | |||
| Wireless Telecommunication Services - 0.5% | |||
| Bharti Infratel Ltd. | 1,530,843 | 9,224,281 | |
| RingCentral, Inc. (a) | 337,000 | 5,799,770 | |
| 15,024,051 | |||
| TOTAL COMMON STOCKS | |||
| (Cost $2,453,833,074) | 2,674,392,748 | ||
| Convertible Preferred Stocks - 1.1% | |||
| Internet & Catalog Retail - 0.3% | |||
| Internet Retail - 0.3% | |||
| Meituan Corp. Series D (d) | 1,401,081 | 8,504,562 | |
| Internet Software & Services - 0.8% | |||
| Internet Software & Services - 0.8% | |||
| Uber Technologies, Inc. Series D, 8.00% (a)(d) | 515,696 | 20,442,189 | |
| IT Services - 0.0% | |||
| Data Processing & Outsourced Services - 0.0% | |||
| Nutanix, Inc. Series E (d) | 72,872 | 1,025,309 | |
| TOTAL CONVERTIBLE PREFERRED STOCKS | |||
| (Cost $17,833,462) | 29,972,060 | ||
| Money Market Funds - 5.0% | |||
| Fidelity Cash Central Fund, 0.15% (e) | 26,437,321 | 26,437,321 | |
| Fidelity Securities Lending Cash Central Fund, 0.19% (e)(f) | 110,944,570 | 110,944,570 | |
| TOTAL MONEY MARKET FUNDS | |||
| (Cost $137,381,891) | 137,381,891 | ||
| TOTAL INVESTMENT PORTFOLIO - 104.4% | |||
| (Cost $2,609,048,427) | 2,841,746,699 | ||
| NET OTHER ASSETS (LIABILITIES) - (4.4)% | (120,065,352) | ||
| NET ASSETS - 100% | $2,721,681,347 |
Security Type Abbreviations
ELS – Equity-Linked Security
Legend
(a) Non-income producing
(b) Security or a portion of the security is on loan at period end.
(c) Security exempt from registration under Rule 144A of the Securities Act of 1933. These securities may be resold in transactions exempt from registration, normally to qualified institutional buyers. At the end of the period, the value of these securities amounted to $20,817,005 or 0.8% of net assets.
(d) Restricted securities - Investment in securities not registered under the Securities Act of 1933 (excluding 144A issues). At the end of the period, the value of restricted securities (excluding 144A issues) amounted to $31,870,937 or 1.2% of net assets.
(e) Affiliated fund that is generally available only to investment companies and other accounts managed by Fidelity Investments. The rate quoted is the annualized seven-day yield of the fund at period end. A complete unaudited listing of the fund's holdings as of its most recent quarter end is available upon request. In addition, each Fidelity Central Fund's financial statements are available on the SEC's website or upon request.
(f) Investment made with cash collateral received from securities on loan.
Additional information on each restricted holding is as follows:
| Security | Acquisition Date | Acquisition Cost |
| JHL Biotech, Inc. | 4/14/15 | $1,898,877 |
| Meituan Corp. Series D | 1/26/15 | $8,857,214 |
| Nutanix, Inc. Series E | 8/26/14 | $976,230 |
| Uber Technologies, Inc. Series D, 8.00% | 6/6/14 | $8,000,018 |
Affiliated Central Funds
Information regarding fiscal year to date income earned by the Fund from investments in Fidelity Central Funds is as follows:
| Fund | Income earned |
| Fidelity Cash Central Fund | $17,268 |
| Fidelity Securities Lending Cash Central Fund | 690,588 |
| Total | $707,856 |
Investment Valuation
The following is a summary of the inputs used, as of August 31, 2015, involving the Fund's assets and liabilities carried at fair value. The inputs or methodology used for valuing securities may not be an indication of the risk associated with investing in those securities. For more information on valuation inputs, and their aggregation into the levels used below, please refer to the Investment Valuation section in the accompanying Notes to Financial Statements.
| Valuation Inputs at Reporting Date: | ||||
| Description | Total | Level 1 | Level 2 | Level 3 |
| Investments in Securities: | ||||
| Common Stocks | $2,674,392,748 | $2,576,669,174 | $77,814,722 | $19,908,852 |
| Convertible Preferred Stocks | 29,972,060 | -- | -- | 29,972,060 |
| Money Market Funds | 137,381,891 | 137,381,891 | -- | -- |
| Total Investments in Securities: | $2,841,746,699 | $2,714,051,065 | $77,814,722 | $49,880,912 |
The following is a summary of transfers between Level 1 and Level 2 for the period ended August 31, 2015. Transfers are assumed to have occurred at the beginning of the period, and are primarily attributable to the valuation techniques used for foreign equity securities, as discussed in the accompanying Notes to Financial Statements:
| Transfers | Total |
| Level 1 to Level 2 | $46,631,700 |
| Level 2 to Level 1 | $0 |
The following is a reconciliation of Investments in Securities and Derivative Instruments for which Level 3 inputs were used in determining value:
| Investments in Securities: | |
| Other Investments in Securities | |
| Beginning Balance | $-- |
| Total Realized Gain (Loss) | -- |
| Total Unrealized Gain (Loss) | (6,683,958) |
| Cost of Purchases | 26,592,810 |
| Proceeds of Sales | -- |
| Amortization/Accretion | -- |
| Transfers in to Level 3 | -- |
| Transfers out of Level 3 | -- |
| Ending Balance | $19,908,852 |
| The change in unrealized gain (loss) for the period attributable to Level 3 securities held at August 31, 2015 | $(6,683,958) |
| Convertible Preferred Stocks | |
| Beginning Balance | $27,182,329 |
| Total Realized Gain (Loss) | -- |
| Total Unrealized Gain (Loss) | 2,789,731 |
| Cost of Purchases | -- |
| Proceeds of Sales | -- |
| Amortization/Accretion | -- |
| Transfers in to Level 3 | -- |
| Transfers out of Level 3 | -- |
| Ending Balance | $29,972,060 |
| The change in unrealized gain (loss) for the period attributable to Level 3 securities held at August 31, 2015 | $2,789,731 |
The information used in the above reconciliation represents fiscal year to date activity for any Investments in Securities identified as using Level 3 inputs at either the beginning or the end of the current fiscal period. Transfers in or out of Level 3 represent the beginning value of any Security or Instrument where a change in the pricing level occurred from the beginning to the end of the period. The cost of purchases and the proceeds of sales may include securities received or delivered through corporate actions or exchanges.
Other Information
Distribution of investments by country or territory of incorporation, as a percentage of Total Net Assets, is as follows (Unaudited):
| United States of America | 76.8% |
| Cayman Islands | 8.1% |
| Taiwan | 3.2% |
| Bermuda | 2.8% |
| Japan | 2.2% |
| Ireland | 1.8% |
| Others (Individually Less Than 1%) | 5.1% |
| 100.0% |
See accompanying notes which are an integral part of the financial statements.
Technology Portfolio
Financial Statements
Statement of Assets and Liabilities
| August 31, 2015 (Unaudited) | ||
| Assets | ||
| Investment in securities, at value (including securities loaned of $106,891,578) — See accompanying schedule: Unaffiliated issuers (cost $2,471,666,536) | $2,704,364,808 | |
| Fidelity Central Funds (cost $137,381,891) | 137,381,891 | |
| Total Investments (cost $2,609,048,427) | $2,841,746,699 | |
| Foreign currency held at value (cost $5,773,837) | 5,770,381 | |
| Receivable for investments sold | 41,862,025 | |
| Receivable for fund shares sold | 1,859,213 | |
| Dividends receivable | 1,564,722 | |
| Distributions receivable from Fidelity Central Funds | 87,608 | |
| Prepaid expenses | 21,455 | |
| Other receivables | 95,608 | |
| Total assets | 2,893,007,711 | |
| Liabilities | ||
| Payable for investments purchased | $55,807,261 | |
| Payable for fund shares redeemed | 2,639,002 | |
| Accrued management fee | 1,291,746 | |
| Other affiliated payables | 493,102 | |
| Other payables and accrued expenses | 150,683 | |
| Collateral on securities loaned, at value | 110,944,570 | |
| Total liabilities | 171,326,364 | |
| Net Assets | $2,721,681,347 | |
| Net Assets consist of: | ||
| Paid in capital | $2,416,136,881 | |
| Undistributed net investment income | 3,273,919 | |
| Accumulated undistributed net realized gain (loss) on investments and foreign currency transactions | 69,505,831 | |
| Net unrealized appreciation (depreciation) on investments and assets and liabilities in foreign currencies | 232,764,716 | |
| Net Assets, for 24,312,709 shares outstanding | $2,721,681,347 | |
| Net Asset Value, offering price and redemption price per share ($2,721,681,347 ÷ 24,312,709 shares) | $111.94 |
See accompanying notes which are an integral part of the financial statements.
Statement of Operations
| Six months ended August 31, 2015 (Unaudited) | ||
| Investment Income | ||
| Dividends | $14,174,907 | |
| Interest | 47 | |
| Income from Fidelity Central Funds (including $690,588 from security lending) | 707,856 | |
| Total income | 14,882,810 | |
| Expenses | ||
| Management fee | $7,851,780 | |
| Transfer agent fees | 2,541,031 | |
| Accounting and security lending fees | 434,123 | |
| Custodian fees and expenses | 163,976 | |
| Independent trustees' compensation | 24,251 | |
| Registration fees | 51,549 | |
| Audit | 20,283 | |
| Legal | 20,680 | |
| Interest | 2,985 | |
| Miscellaneous | 16,757 | |
| Total expenses before reductions | 11,127,415 | |
| Expense reductions | (295,955) | 10,831,460 |
| Net investment income (loss) | 4,051,350 | |
| Realized and Unrealized Gain (Loss)
Net realized gain (loss) on: | ||
| Investment securities: | ||
| Unaffiliated issuers (net of foreign taxes of $30,665) | 85,748,901 | |
| Foreign currency transactions | (572,192) | |
| Total net realized gain (loss) | 85,176,709 | |
| Change in net unrealized appreciation (depreciation) on: Investment securities (net of decrease in deferred foreign taxes of $28,176) | (272,256,110) | |
| Assets and liabilities in foreign currencies | 113,931 | |
| Total change in net unrealized appreciation (depreciation) | (272,142,179) | |
| Net gain (loss) | (186,965,470) | |
| Net increase (decrease) in net assets resulting from operations | $(182,914,120) |
See accompanying notes which are an integral part of the financial statements.
Statement of Changes in Net Assets
| Six months ended August 31, 2015 (Unaudited) | Year ended February 28, 2015 | |
| Increase (Decrease) in Net Assets | ||
| Operations | ||
| Net investment income (loss) | $4,051,350 | $3,378,469 |
| Net realized gain (loss) | 85,176,709 | 245,932,035 |
| Change in net unrealized appreciation (depreciation) | (272,142,179) | (1,732,966) |
| Net increase (decrease) in net assets resulting from operations | (182,914,120) | 247,577,538 |
| Distributions to shareholders from net investment income | – | (3,638,905) |
| Distributions to shareholders from net realized gain | (36,225,605) | (405,886,858) |
| Total distributions | (36,225,605) | (409,525,763) |
| Share transactions | ||
| Proceeds from sales of shares | 356,937,592 | 635,387,636 |
| Reinvestment of distributions | 34,854,957 | 393,674,884 |
| Cost of shares redeemed | (275,834,366) | (453,687,865) |
| Net increase (decrease) in net assets resulting from share transactions | 115,958,183 | 575,374,655 |
| Redemption fees | 15,302 | 29,839 |
| Total increase (decrease) in net assets | (103,166,240) | 413,456,269 |
| Net Assets | ||
| Beginning of period | 2,824,847,587 | 2,411,391,318 |
| End of period (including undistributed net investment income of $3,273,919 and distributions in excess of net investment income of $777,431, respectively) | $2,721,681,347 | $2,824,847,587 |
| Other Information
Shares | ||
| Sold | 2,952,477 | 5,243,944 |
| Issued in reinvestment of distributions | 287,464 | 3,511,964 |
| Redeemed | (2,302,117) | (3,831,448) |
| Net increase (decrease) | 937,824 | 4,924,460 |
See accompanying notes which are an integral part of the financial statements.
Financial Highlights — Technology Portfolio
| Six months ended (Unaudited) | Years ended February 28, | |||||
| August 31, | 2015 | 2015 | 2014 | 2013 | 2012 A | 2011 |
| Selected Per–Share Data | ||||||
| Net asset value, beginning of period | $120.85 | $130.70 | $104.11 | $101.57 | $102.37 | $72.24 |
| Income from Investment Operations | ||||||
| Net investment income (loss)B | .17 | .16 | .06 | .01 | (.27) | (.37) |
| Net realized and unrealized gain (loss) | (7.52) | 10.26 | 36.34 | 2.53 | (.53) | 30.50 |
| Total from investment operations | (7.35) | 10.42 | 36.40 | 2.54 | (.80) | 30.13 |
| Distributions from net investment income | – | (.17) | (.09)C | – | – | – |
| Distributions from net realized gain | (1.56) | (20.10) | (9.72)C | – | – | – |
| Total distributions | (1.56) | (20.27) | (9.81) | – | – | – |
| Redemption fees added to paid in capitalB,D | – | – | – | – | – | – |
| Net asset value, end of period | $111.94 | $120.85 | $130.70 | $104.11 | $101.57 | $102.37 |
| Total ReturnE,F | (6.18)% | 9.97% | 36.20% | 2.50% | (.78)% | 41.71% |
| Ratios to Average Net AssetsG,H | ||||||
| Expenses before reductions | .78%I | .78% | .80% | .81% | .82% | .85% |
| Expenses net of fee waivers, if any | .77%I | .78% | .80% | .81% | .82% | .85% |
| Expenses net of all reductions | .76%I | .78% | .77% | .79% | .81% | .83% |
| Net investment income (loss) | .28%I | .13% | .05% | .01% | (.29)% | (.44)% |
| Supplemental Data | ||||||
| Net assets, end of period (000 omitted) | $2,721,681 | $2,824,848 | $2,411,391 | $2,028,324 | $2,349,926 | $2,885,820 |
| Portfolio turnover rateJ | 138%I | 144% | 181% | 140% | 196% | 136% |
A For the year ended February 29.
B Calculated based on average shares outstanding during the period.
C The amounts shown reflect certain reclassifications related to book to tax differences that were made in the year shown.
D Amount represents less than $.005 per share.
E Total returns for periods of less than one year are not annualized.
F Total returns would have been lower if certain expenses had not been reduced during the applicable periods shown.
G Fees and expenses of any underlying Fidelity Central Funds are not included in the Fund's expense ratio. The Fund indirectly bears its proportionate share of the expenses of any underlying Fidelity Central Funds.
H Expense ratios reflect operating expenses of the Fund. Expenses before reductions do not reflect amounts reimbursed by the investment adviser or reductions from brokerage service arrangements or reductions from other expense offset arrangements and do not represent the amount paid by the Fund during periods when reimbursements or reductions occur. Expenses net of fee waivers reflect expenses after reimbursement by the investment adviser but prior to reductions from brokerage service arrangements or other expense offset arrangements. Expenses net of all reductions represent the net expenses paid by the Fund.
I Annualized
J Amount does not include the portfolio activity of any underlying Fidelity Central Funds.
See accompanying notes which are an integral part of the financial statements.
Notes to Financial Statements (Unaudited)
For the period ended August 31, 2015
1. Organization.
Communications Equipment Portfolio, Computers Portfolio, Electronics Portfolio, IT Services Portfolio, Software and Computer Services Portfolio, and Technology Portfolio (the Funds) are non-diversified funds of Fidelity Select Portfolios (the Trust). The Trust is registered under the Investment Company Act of 1940, as amended (the 1940 Act), as an open-end management investment company organized as a Massachusetts business trust. The Funds invest primarily in securities of companies whose principal business activities fall within specific industries. Each Fund is authorized to issue an unlimited number of shares. Share transactions on the Statement of Changes in Net Assets may contain exchanges between funds. Certain Funds investments in emerging markets can be subject to social, economic, regulatory, and political uncertainties and can be extremely volatile.
2. Investments in Fidelity Central Funds.
The Funds invest in Fidelity Central Funds, which are open-end investment companies generally available only to other investment companies and accounts managed by the investment adviser and its affiliates. The Funds' Schedules of Investments list each of the Fidelity Central Funds held as of period end, if any, as an investment of each Fund, but do not include the underlying holdings of each Fidelity Central Fund. As an Investing Fund, each Fund indirectly bears its proportionate share of the expenses of the underlying Fidelity Central Funds.
The Money Market Central Funds seek preservation of capital and current income and are managed by Fidelity Investments Money Management, Inc. (FIMM), an affiliate of the investment adviser. Annualized expenses of the Money Market Central Funds as of their most recent shareholder report date are less than .01%.
A complete unaudited list of holdings for each Fidelity Central Fund is available upon request or at the Securities and Exchange Commission (the SEC) website at www.sec.gov. In addition, the financial statements of the Fidelity Central Funds are available on the SEC website or upon request.
3. Significant Accounting Policies.
The financial statements have been prepared in conformity with accounting principles generally accepted in the United States of America (GAAP), which require management to make certain estimates and assumptions at the date of the financial statements. Actual results could differ from those estimates. Subsequent events, if any, through the date that the financial statements were issued have been evaluated in the preparation of the financial statements. The following summarizes the significant accounting policies of the Funds:
Investment Valuation. Investments are valued as of 4:00 p.m. Eastern time on the last calendar day of the period. The Board of Trustees (the Board) has delegated the day to day responsibility for the valuation of each Fund's investments to the Fidelity SelectCo, LLC (SelectCo) Fair Value Committee (the Committee). In accordance with valuation policies and procedures approved by the Board, each Fund attempts to obtain prices from one or more third party pricing vendors or brokers to value its investments. When current market prices, quotations or currency exchange rates are not readily available or reliable, investments will be fair valued in good faith by the Committee, in accordance with procedures adopted by the Board. Factors used in determining fair value vary by investment type and may include market or investment specific events, changes in interest rates and credit quality. The frequency with which these procedures are used cannot be predicted and they may be utilized to a significant extent. The Committee oversees each Fund's valuation policies and procedures and reports to the Board on the Committee's activities and fair value determinations. The Board monitors the appropriateness of the procedures used in valuing each Fund's investments and ratifies the fair value determinations of the Committee.
Each Fund categorizes the inputs to valuation techniques used to value its investments into a disclosure hierarchy consisting of three levels as shown below:
- Level 1 – quoted prices in active markets for identical investments
- Level 2 – other significant observable inputs (including quoted prices for similar investments, interest rates, prepayment speeds, etc.)
- Level 3 – unobservable inputs (including the Fund's own assumptions based on the best information available)
Valuation techniques used to value each Fund's investments by major category are as follows:
Equity securities, including restricted securities, for which market quotations are readily available, are valued at the last reported sale price or official closing price as reported by a third party pricing vendor on the primary market or exchange on which they are traded and are categorized as Level 1 in the hierarchy. In the event there were no sales during the day or closing prices are not available, securities are valued at the last quoted bid price or may be valued using the last available price and are generally categorized as Level 2 in the hierarchy. For foreign equity securities, when market or security specific events arise, comparisons to the valuation of American Depositary Receipts (ADRs), futures contracts, Exchange-Traded Funds (ETFs) and certain indexes as well as quoted prices for similar securities may be used and would be categorized as Level 2 in the hierarchy. Utilizing these techniques may result in transfers between Level 1 and Level 2. For equity securities, including restricted securities, where observable inputs are limited, assumptions about market activity and risk are used and these securities may be categorized as Level 3 in the hierarchy.
Debt securities, including restricted securities, are valued based on evaluated prices received from third party pricing vendors or from brokers who make markets in such securities. Corporate bonds are valued by pricing vendors who utilize matrix pricing which considers yield or price of bonds of comparable quality, coupon, maturity and type or by broker-supplied prices. When independent prices are unavailable or unreliable, debt securities may be valued utilizing pricing methodologies which consider similar factors that would be used by third party pricing vendors. Debt securities are generally categorized as Level 2 in the hierarchy but may be Level 3 depending on the circumstances.
Investments in open-end mutual funds, including the Fidelity Central Funds, are valued at their closing net asset value (NAV) each business day and are categorized as Level 1 in the hierarchy.
The following provides information on Level 3 securities held by the Technology Portfolio that were valued at period end based on unobservable inputs. These amounts exclude valuations provided by a broker.
| Asset Type | Fair Value at 08/31/15 | Valuation Technique(s) | Unobservable Input | Amount or Range/Weighted Average | Impact to Valuation from an Increase in Input* |
| Equities | $ 49,880,912 | Adjusted transaction Price | Proxy movement | 0.1% | Increase |
| Last transaction price | Transaction Price | $3.74 - $39.64 / $36.59 | Increase | ||
| Market comparable | Discount rate | 10.0% | Decrease | ||
| EV/Sales multiple | 6.5 | Increase | |||
| EV/GMV multiple | 0.3 | Increase |
* Represents the expected directional change in the fair value of the Level 3 investments that would result from an increase in the corresponding input. A decrease to the unobservable input would have the opposite effect. Significant changes in these inputs could result in significantly higher or lower fair value measurements.
Changes in valuation techniques may result in transfers in or out of an assigned level within the disclosure hierarchy. The aggregate value of investments by input level as of August 31, 2015, including information on transfers between Levels 1 and 2, as well as a roll forward of Level 3 investments, is included at the end of each applicable Fund's Schedule of Investments.
Foreign Currency. The Funds may use foreign currency contracts to facilitate transactions in foreign-denominated securities. Gains and losses from these transactions may arise from changes in the value of the foreign currency or if the counterparties do not perform under the contracts' terms.
Foreign-denominated assets, including investment securities, and liabilities are translated into U.S. dollars at the exchange rates at period end. Purchases and sales of investment securities, income and dividends received and expenses denominated in foreign currencies are translated into U.S. dollars at the exchange rate in effect on the transaction date.
The effects of exchange rate fluctuations on investments are included with the net realized and unrealized gain (loss) on investment securities. Other foreign currency transactions resulting in realized and unrealized gain (loss) are disclosed separately.
Investment Transactions and Income. For financial reporting purposes, the Funds' investment holdings and NAV include trades executed through the end of the last business day of the period. The NAV per share for processing shareholder transactions is calculated as of the close of business of the New York Stock Exchange (NYSE), normally 4:00 p.m. Eastern time and includes trades executed through the end of the prior business day. Gains and losses on securities sold are determined on the basis of identified cost and may include proceeds received from litigation. Dividend income is recorded on the ex-dividend date, except for certain dividends from foreign securities where the ex-dividend date may have passed, which are recorded as soon as the Funds are informed of the ex-dividend date. Non-cash dividends included in dividend income, if any, are recorded at the fair market value of the securities received. Income and capital gain distributions from Fidelity Central Funds, if any, are recorded on the ex-dividend date. Distributions received on securities that represent a return of capital or capital gain are recorded as a reduction of cost of investments and/or as a realized gain. Subsequent to ex-dividend date the Funds determine the components of these distributions, based upon receipt of tax filings or other correspondence relating to the underlying investment. Interest income is accrued as earned and includes coupon interest and amortization of premium and accretion of discount on debt securities as applicable. Investment income is recorded net of foreign taxes withheld where recovery of such taxes is uncertain.
Expenses. Expenses directly attributable to a fund are charged to that fund. Expenses attributable to more than one fund are allocated among the respective funds on the basis of relative net assets or other appropriate methods. Expense estimates are accrued in the period to which they relate and adjustments are made when actual amounts are known.
Deferred Trustee Compensation. Under a Deferred Compensation Plan (the Plan) for Computers Portfolio, Electronics Portfolio, Software and Computer Services Portfolio and Technology Portfolio, independent Trustees may elect to defer receipt of a portion of their annual compensation. Deferred amounts are invested in a cross-section of Fidelity funds, are marked-to-market and remain in the Fund until distributed in accordance with the Plan. The investment of deferred amounts and the offsetting payable to the Trustees are included in the accompanying Statement of Assets and Liabilities.
Income Tax Information and Distributions to Shareholders. Each year, each Fund intends to qualify as a regulated investment company under Subchapter M of the Internal Revenue Code, including distributing substantially all of its taxable income and realized gains. As a result, no provision for U.S. Federal income taxes is required. Each Fund files a U.S. federal tax return, in addition to state and local tax returns as required. Each Fund's federal income tax returns are subject to examination by the Internal Revenue Service (IRS) for a period of three fiscal years after they are filed. State and local tax returns may be subject to examination for an additional fiscal year depending on the jurisdiction. Foreign taxes are provided for based on each Fund's understanding of the tax rules and rates that exist in the foreign markets in which it invests. Technology Portfolio is subject to a tax imposed on capital gains by certain countries in which it invests.
Distributions are declared and recorded on the ex-dividend date. Income and capital gain distributions are determined in accordance with income tax regulations, which may differ from GAAP.
Capital accounts within the financial statements are adjusted for permanent book-tax differences. These adjustments have no impact on net assets or the results of operations. Capital accounts are not adjusted for temporary book-tax differences which will reverse in a subsequent period.
Book-tax differences are primarily due to futures contracts, foreign currency transactions, passive foreign investment companies (PFIC), market discount, redemptions in kind, deferred trustees compensation, net operating losses, capital loss carryforwards and losses deferred due to wash sales and excise tax regulations.
The federal tax cost of investment securities and unrealized appreciation (depreciation) as of period end were as follows for each Fund:
| Tax cost | Gross unrealized appreciation | Gross unrealized depreciation | Net unrealized appreciation (depreciation) on securities | |
| Communications Equipment Portfolio | $217,132,598 | $15,641,931 | $(17,909,513) | $(2,267,582) |
| Computers Portfolio | 478,135,794 | 147,549,488 | (42,022,517) | 105,526,971 |
| Electronics Portfolio | 1,576,436,573 | 101,562,402 | (209,385,507) | (107,823,105) |
| IT Services Portfolio | 1,273,131,899 | 348,984,618 | (49,056,361) | 299,928,257 |
| Software and Computer Services Portfolio | 2,113,432,695 | 892,375,497 | (146,193,079) | 746,182,418 |
| Technology Portfolio | 2,625,774,752 | 498,215,577 | (282,243,630) | 215,971,947 |
Capital loss carryforwards are only available to offset future capital gains of the Fund to the extent provided by regulations and may be limited. Under the Regulated Investment Company Modernization Act of 2010 (the Act), the Fund is permitted to carry forward capital losses incurred in taxable years beginning after December 22, 2010 for an unlimited period and such capital losses are required to be used prior to any losses that expire. The capital loss carryforward information presented below, including any applicable limitation, is estimated as of prior fiscal period end and is subject to adjustment.
| Fiscal year of expiration | ||
| 2017 | Total | |
| Communications Equipment Portfolio | $(416,259) | $(416,259) |
Certain of the Funds intend to elect to defer to the next fiscal year capital losses recognized during the period November 1, 2014 to February 28, 2015, and ordinary losses recognized during the period January 1, 2015 to February 28, 2015. Loss deferrals were as follows:
| Capital losses | Ordinary losses | |
| Communications Equipment Portfolio | $(1,655,447) | $ - |
| Computers Portfolio | (357,532) | – |
| IT Services Portfolio | (3,939,168) | (850,482) |
| Technology Portfolio | – | (762,135) |
Trading (Redemption) Fees. Shares held by investors in the Funds less than 30 days may be subject to a redemption fee equal to .75% of the NAV of shares redeemed. All redemption fees, which reduce the proceeds of the shareholder redemption, are retained by the Funds and accounted for as an addition to paid in capital.
Restricted Securities. The Funds may invest in securities that are subject to legal or contractual restrictions on resale. These securities generally may be resold in transactions exempt from registration or to the public if the securities are registered. Disposal of these securities may involve time-consuming negotiations and expense, and prompt sale at an acceptable price may be difficult. Information regarding restricted securities is included at the end of each applicable Fund's Schedule of Investments.
4. Purchases and Sales of Investments.
Purchases and sales of securities, other than short-term securities, are noted in the table below.
| Purchases ($) | Sales ($) | |
| Communications Equipment Portfolio | 40,572,798 | 51,522,525 |
| Computers Portfolio | 91,271,923 | 256,491,767 |
| Electronics Portfolio | 1,450,768,141 | 2,078,872,790 |
| IT Services Portfolio | 697,742,885 | 149,609,557 |
| Software and Computer Services Portfolio | 456,020,615 | 515,964,130 |
| Technology Portfolio | 2,045,083,803 | 1,943,219,114 |
5. Fees and Other Transactions with Affiliates.
Management Fee. Fidelity SelectCo, LLC (the investment adviser) and its affiliates provide the Funds with investment management related services for which the Funds pay a monthly management fee. The management fee is the sum of an individual fund fee rate and an annualized group fee rate. The individual fund fee rate is applied to each Fund's average net assets. The group fee rate is based upon the average net assets of all the mutual funds advised by Fidelity Management & Research Company (FMR) and the investment adviser. The group fee rate decreases as assets under management increase and increases as assets under management decrease. For the reporting period, each Fund's annualized management fee rate expressed as a percentage of each Fund's average net assets was as follows.
| Individual Rate | Group Rate | Total | |
| Communications Equipment Portfolio | .30% | .25% | .55% |
| Computers Portfolio | .30% | .25% | .55% |
| Electronics Portfolio | .30% | .25% | .55% |
| IT Services Portfolio | .30% | .25% | .55% |
| Software and Computer Services Portfolio | .30% | .25% | .55% |
| Technology Portfolio | .30% | .25% | .55% |
Transfer Agent Fees. Fidelity Investments Institutional Operations Company, Inc. (FIIOC), an affiliate of the investment adviser, is the Funds' transfer, dividend disbursing and shareholder servicing agent. FIIOC receives account fees and asset-based fees that vary according to account size and type of account. FIIOC pays for typesetting, printing and mailing of shareholder reports, except proxy statements. For the period, transfer agent fees were equivalent to the following annualized rates expressed as a percentage of average net assets:
| Communications Equipment Portfolio | .24% |
| Computers Portfolio | .19% |
| Electronics Portfolio | .17% |
| IT Services Portfolio | .20% |
| Software and Computer Services Portfolio | .18% |
| Technology Portfolio | .18% |
Accounting and Security Lending Fees. Fidelity Service Company, Inc. (FSC), an affiliate of the investment adviser, maintains each Fund's accounting records. The accounting fee is based on the level of average net assets for each month. Under a separate contract, FSC administers the security lending program. The security lending fee is based on the number and duration of lending transactions.
Brokerage Commissions. Certain Funds placed a portion of their portfolio transactions with brokerage firms which are affiliates of the investment adviser. Brokerage commissions are included in net realized gain (loss) and change in net unrealized appreciation (depreciation) in the Statement of Operations. The commissions paid to these affiliated firms were as follows:
| Amount | |
| Communications Equipment Portfolio | $3,362 |
| Computers Portfolio | 7,392 |
| Electronics Portfolio | 97,414 |
| IT Services Portfolio | 13,779 |
| Software and Computer Services Portfolio | 16,035 |
| Technology Portfolio | 42,568 |
Interfund Lending Program. Pursuant to an Exemptive Order issued by the SEC, the Funds, along with other registered investment companies having management contracts with FMR or other affiliated entities of FMR, may participate in an interfund lending program. This program provides an alternative credit facility allowing the funds to borrow from, or lend money to, other participating affiliated funds. At period end, there were no interfund loans outstanding. Each applicable fund's activity in this program during the period for which loans were outstanding was as follows:
| Borrower or Lender | Average Loan Balance | Weighted Average Interest Rate | Interest Expense | |
| Computers Portfolio | Borrower | $4,311,823 | .36% | $2,652 |
| Electronics Portfolio | Borrower | 12,235,077 | .37% | 3,249 |
| Technology Portfolio | Borrower | 11,994,269 | .34% | 2,985 |
6. Committed Line of Credit.
Certain Funds participate with other funds managed by the investment adviser or an affiliate in a $4.25 billion credit facility (the "line of credit") to be utilized for temporary or emergency purposes to fund shareholder redemptions or for other short-term liquidity purposes. The participating funds have agreed to pay commitment fees on their pro-rata portion of the line of credit, which are reflected in Miscellaneous expenses on the Statement of Operations, and are as follows:
| Communications Equipment Portfolio | $193 |
| Computers Portfolio | 586 |
| Electronics Portfolio | 1,724 |
| IT Services Portfolio | 763 |
| Software and Computer Services Portfolio | 2,251 |
| Technology Portfolio | 2,143 |
During the period, the Funds did not borrow on this line of credit.
7. Security Lending.
Certain Funds lend portfolio securities through a lending agent from time to time in order to earn additional income. On the settlement date of the loan, each applicable Fund receives collateral (in the form of U.S. Treasury obligations, letters of credit and/or cash) against the loaned securities and maintains collateral in an amount not less than 100% of the market value of the loaned securities during the period of the loan. The market value of the loaned securities is determined at the close of business of the Funds and any additional required collateral is delivered to the Funds on the next business day. If the borrower defaults on its obligation to return the securities loaned because of insolvency or other reasons, the Funds may apply collateral received from the borrower against the obligation. The Funds may experience delays and costs in recovering the securities loaned. Any cash collateral received is invested in the Fidelity Securities Lending Cash Central Fund. The value of loaned securities and cash collateral at period end are disclosed on each applicable Fund's Statement of Assets and Liabilities. Security lending income represents the income earned on investing cash collateral, less rebates paid to borrowers and any lending agent fees associated with the loan, plus any premium payments received for lending certain types of securities. Security lending income is presented on each applicable Fund's Statement of Operations as a component of income from Fidelity Central Funds.
8. Bank Borrowings.
Each Fund is permitted to have bank borrowings for temporary or emergency purposes to fund shareholder redemptions or for other short-term liquidity requirements. Each Fund has established borrowing arrangements with certain banks. The interest rate on the borrowings is the bank's base rate, as revised from time to time. At period end, there were no bank borrowings outstanding. Each applicable Fund's activity in this program during the period for which loans were outstanding was as follows:
| Average Loan Balance | Weighted Average Interest Rate | Interest Expense | |
| Computers Portfolio | $5,203,541 | .63% | $3,367 |
| Electronics Portfolio | 11,698,600 | .63% | 2,055 |
9. Expense Reductions.
Commissions paid to certain brokers with whom the investment adviser, or its affiliates, places trades on behalf of Certain Funds include an amount in addition to trade execution, which may be rebated back to the Funds to offset certain expenses. In addition, through arrangements with each applicable Fund's custodian, credits realized as a result of uninvested cash balances were used to reduce each applicable Fund's expenses. All of the applicable expense reductions are noted in the table below.
| Brokerage Service reduction | Custody expense reduction |
|
| Communications Equipment Portfolio | $5,027 | $– |
| Computers Portfolio | 27,117 | – |
| Electronics Portfolio | 224,442 | 48 |
| IT Services Portfolio | 40,628 | – |
| Software and Computer Services Portfolio | 54,448 | 34 |
| Technology Portfolio | 229,622 | 1 |
In addition, during the period the investment adviser reimbursed and/or waived a portion of operating expenses as follows:
| Amount | |
| Communications Equipment Portfolio | $7,449 |
| Computers Portfolio | 18,963 |
| Electronics Portfolio | 43,061 |
| IT Services Portfolio | 28,330 |
| Software and Computer Services Portfolio | 78,371 |
| Technology Portfolio | 66,332 |
10. Other.
The Funds' organizational documents provide former and current trustees and officers with a limited indemnification against liabilities arising in connection with the performance of their duties to the Funds. In the normal course of business, the Funds may also enter into contracts that provide general indemnifications. The Funds' maximum exposure under these arrangements is unknown as this would be dependent on future claims that may be made against the Funds. The risk of material loss from such claims is considered remote.
At the end of the period, the following mutual funds managed by the investment adviser or its affiliates were the owners of record of 10% or more of the total outstanding shares of the following Funds.
| VIP FundManagers 60% Portfolio | |
| Computers Portfolio | 12% |
| Technology Portfolio | 10% |
Mutual funds managed by the investment adviser or its affiliates, in aggregate, were the owners of record of more than 20% of the total outstanding shares of the following Funds.
| Fund | % of shares held |
| Computers Portfolio | 25% |
Shareholder Expense Example
As a shareholder of the Fund, you incur two types of costs: (1) transaction costs, including redemption fees and (2) ongoing costs, including management fees and other Fund expenses. This Example is intended to help you understand your ongoing costs (in dollars) of investing in the Fund and to compare these costs with the ongoing costs of investing in other mutual funds.
The Example is based on an investment of $1,000 invested at the beginning of the period and held for the entire period (March 1, 2015 to August 31, 2015).
Actual Expenses
The first line of the accompanying table for each fund provides information about actual account values and actual expenses. You may use the information in this line, together with the amount you invested, to estimate the expenses that you paid over the period. Simply divide your account value by $1,000.00 (for example, an $8,600 account value divided by $1,000.00 = 8.6), then multiply the result by the number in the first line for a fund under the heading entitled "Expenses Paid During Period" to estimate the expenses you paid on your account during this period. A small balance maintenance fee of $12.00 that is charged once a year may apply for certain accounts with a value of less than $2,000. This fee is not included in the table below. If it was, the estimate of expenses you paid during the period would be higher, and your ending account value lower, by this amount. In addition, each Fund, as a shareholder in the underlying Fidelity Central Funds, will indirectly bear its pro-rata share of the fees and expenses incurred by the underlying Fidelity Central Funds. These fees and expenses are not included in the Fund's annualized expense ratio used to calculate the expense estimate in the table below.
Hypothetical Example for Comparison Purposes
The second line of the accompanying table for each fund provides information about hypothetical account values and hypothetical expenses based on a fund's actual expense ratio and an assumed rate of return of 5% per year before expenses, which is not the Fund's actual return. The hypothetical account values and expenses may not be used to estimate the actual ending account balance or expenses you paid for the period. You may use this information to compare the ongoing costs of investing in the Fund and other funds. To do so, compare this 5% hypothetical example with the 5% hypothetical examples that appear in the shareholder reports of the other funds. A small balance maintenance fee of $12.00 that is charged once a year may apply for certain accounts with a value of less than $2,000. This fee is not included in the table below. If it was, the estimate of expenses you paid during the period would be higher, and your ending account value lower, by this amount. In addition, each Fund, as a shareholder in the underlying Fidelity Central Funds, will indirectly bear its pro-rata share of the fees and expenses incurred by the underlying Fidelity Central Funds. These fees and expenses are not included in the Fund's annualized expense ratio used to calculate the expense estimate in the table below.
Please note that the expenses shown in the table are meant to highlight your ongoing costs only and do not reflect any transaction costs. Therefore, the second line of the table is useful in comparing ongoing costs only, and will not help you determine the relative total costs of owning different funds. In addition, if these transactional costs were included, your costs would have been higher.
| Annualized Expense Ratio-A | Beginning Account Value March 1, 2015 | Ending Account Value August 31, 2015 | Expenses Paid During Period-B March 1, 2015 to August 31, 2015 |
|
| Communications Equipment Portfolio | .91% | |||
| Actual | $1,000.00 | $880.80 | $4.30 | |
| Hypothetical-C | $1,000.00 | $1,020.56 | $4.62 | |
| Computers Portfolio | .79% | |||
| Actual | $1,000.00 | $875.00 | $3.72 | |
| Hypothetical-C | $1,000.00 | $1,021.17 | $4.01 | |
| Electronics Portfolio | .77% | |||
| Actual | $1,000.00 | $885.10 | $3.65 | |
| Hypothetical-C | $1,000.00 | $1,021.27 | $3.91 | |
| IT Services Portfolio | .80% | |||
| Actual | $1,000.00 | $1,035.10 | $4.09 | |
| Hypothetical-C | $1,000.00 | $1,021.11 | $4.06 | |
| Software and Computer Services Portfolio | .76% | |||
| Actual | $1,000.00 | $974.50 | $3.77 | |
| Hypothetical-C | $1,000.00 | $1,021.32 | $3.86 | |
| Technology Portfolio | .77% | |||
| Actual | $1,000.00 | $938.20 | $3.75 | |
| Hypothetical-C | $1,000.00 | $1,021.27 | $3.91 |
A Annualized expense ratio reflects expenses net of applicable fee waivers.
B Expenses are equal to each Fund's annualized expense ratio, multiplied by the average account value over the period, multiplied by 184/366 (to reflect the one-half year period).
C 5% return per year before expenses.
![]()
SELTEC-SANN-1015
1.813673.110
|
Fidelity® Select Portfolios® Air Transportation Portfolio Defense and Aerospace Portfolio Environment and Alternative Energy Portfolio Industrial Equipment Portfolio Industrials Portfolio Transportation Portfolio Semi-Annual Report August 31, 2015 |
|
|
Contents
|
Air Transportation Portfolio |
|
|
Defense and Aerospace Portfolio |
|
|
Environment and Alternative Energy Portfolio |
|
|
Industrial Equipment Portfolio |
|
|
Industrials Portfolio |
|
|
Transportation Portfolio |
|
To view a fund's proxy voting guidelines and proxy voting record for the 12-month period ended June 30, visit http://www.fidelity.com/proxyvotingresults or visit the Securities and Exchange Commission's (SEC) web site at http://www.sec.gov.
You may also call 1-800-544-8544 to request a free copy of the proxy voting guidelines.
Standard & Poor's, S&P and S&P 500 are registered service marks of The McGraw-Hill Companies, Inc. and have been licensed for use by Fidelity Distributors Corporation.
Other third-party marks appearing herein are the property of their respective owners.
All other marks appearing herein are registered or unregistered trademarks or service marks of FMR LLC or an affiliated company. © 2015 FMR LLC. All rights reserved.
This report and the financial statements contained herein are submitted for the general information of the shareholders of the Funds. This report is not authorized for distribution to prospective investors in the Funds unless preceded or accompanied by an effective prospectus.
A fund files its complete schedule of portfolio holdings with the SEC for the first and third quarters of each fiscal year on Form N-Q. Forms N-Q are available on the SEC’s web site at http://www.sec.gov. A fund's Forms N-Q may be reviewed and copied at the SEC’s Public Reference Room in Washington, DC. Information regarding the operation of the SEC's Public Reference Room may be obtained by calling 1-800-SEC-0330.
For a complete list of a fund's portfolio holdings, view the most recent holdings listing, semiannual report, or annual report on Fidelity's web site at http://www.fidelity.com, http://www.advisor.fidelity.com, or http://www.401k.com, as applicable.
NOT FDIC INSURED •MAY LOSE VALUE •NO BANK GUARANTEE
Neither the Funds nor Fidelity Distributors Corporation is a bank.
Air Transportation Portfolio
Investment Summary (Unaudited)
Top Ten Stocks as of August 31, 2015
| % of fund's net assets | % of fund's net assets 6 months ago | |
| United Parcel Service, Inc. Class B | 10.1 | 8.7 |
| The Boeing Co. | 9.0 | 10.5 |
| American Airlines Group, Inc. | 7.4 | 9.1 |
| Southwest Airlines Co. | 6.7 | 4.2 |
| Precision Castparts Corp. | 6.2 | 5.9 |
| Alaska Air Group, Inc. | 5.5 | 2.8 |
| Delta Air Lines, Inc. | 5.1 | 8.2 |
| FedEx Corp. | 4.1 | 7.6 |
| United Continental Holdings, Inc. | 3.8 | 4.5 |
| Textron, Inc. | 3.7 | 4.4 |
| 61.6 |
Top Industries (% of fund's net assets)
| As of August 31, 2015 | ||
| Airlines | 40.6% | |
| Aerospace & Defense | 32.2% | |
| Air Freight & Logistics | 21.1% | |
| Machinery | 1.3% | |
| Transportation Infrastructure | 0.8% | |
| All Others* | 4.0% | |
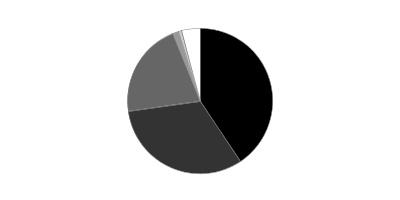
| As of February 28, 2015 | ||
| Aerospace & Defense | 36.6% | |
| Airlines | 35.3% | |
| Air Freight & Logistics | 25.7% | |
| Road & Rail | 0.8% | |
| All Others* | 1.6% | |
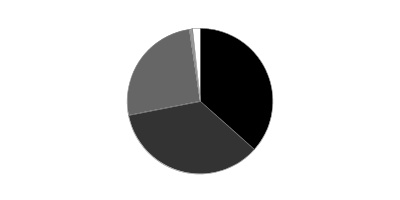
* Includes short-term investments and net other assets (liabilities).
Air Transportation Portfolio
Investments August 31, 2015 (Unaudited)
Showing Percentage of Net Assets
| Common Stocks - 96.1% | |||
| Shares | Value | ||
| Aerospace & Defense - 31.5% | |||
| Aerospace & Defense - 31.5% | |||
| BE Aerospace, Inc. | 89,800 | $4,377,750 | |
| Bombardier, Inc. Class B (sub. vtg.) | 3,692,300 | 3,620,452 | |
| Huntington Ingalls Industries, Inc. | 17,700 | 1,992,666 | |
| L-3 Communications Holdings, Inc. | 28,900 | 3,048,083 | |
| Moog, Inc. Class A (a) | 20,000 | 1,262,000 | |
| Precision Castparts Corp. | 96,959 | 22,324,810 | |
| Rockwell Collins, Inc. | 90,700 | 7,423,795 | |
| Spirit AeroSystems Holdings, Inc. Class A (a) | 181,200 | 9,261,132 | |
| Textron, Inc. | 345,800 | 13,417,040 | |
| The Boeing Co. | 246,700 | 32,238,756 | |
| TransDigm Group, Inc. (a) | 14,600 | 3,355,518 | |
| Triumph Group, Inc. | 180,600 | 8,919,834 | |
| United Technologies Corp. | 22,400 | 2,052,064 | |
| 113,293,900 | |||
| Air Freight & Logistics - 21.1% | |||
| Air Freight & Logistics - 21.1% | |||
| C.H. Robinson Worldwide, Inc. | 190,800 | 12,865,644 | |
| FedEx Corp. | 98,400 | 14,820,024 | |
| Forward Air Corp. | 53,200 | 2,395,064 | |
| Hub Group, Inc. Class A (a) | 34,278 | 1,291,938 | |
| Park-Ohio Holdings Corp. | 177,090 | 6,385,865 | |
| United Parcel Service, Inc. Class B | 373,100 | 36,433,216 | |
| UTi Worldwide, Inc. (a) | 257,900 | 1,836,248 | |
| 76,027,999 | |||
| Airlines - 40.6% | |||
| Airlines - 40.6% | |||
| Air Canada (a) | 584,600 | 4,990,163 | |
| Alaska Air Group, Inc. | 262,600 | 19,658,236 | |
| Allegiant Travel Co. | 26,300 | 5,345,738 | |
| American Airlines Group, Inc. | 679,400 | 26,483,012 | |
| Chorus Aviation, Inc. | 1,040,623 | 4,295,061 | |
| Dart Group PLC | 5,286 | 36,744 | |
| Delta Air Lines, Inc. | 422,402 | 18,492,760 | |
| Hawaiian Holdings, Inc. (a) | 171,200 | 3,879,392 | |
| Republic Airways Holdings, Inc. (a) | 278,900 | 859,012 | |
| SkyWest, Inc. | 114,300 | 1,817,370 | |
| Southwest Airlines Co. | 656,900 | 24,108,230 | |
| Spirit Airlines, Inc. (a) | 192,800 | 9,881,000 | |
| United Continental Holdings, Inc. (a) | 242,285 | 13,802,976 | |
| Virgin America, Inc. | 8,800 | 287,144 | |
| WestJet Airlines Ltd. | 473,900 | 8,645,181 | |
| Wizz Air Holdings PLC | 132,041 | 3,657,235 | |
| 146,239,254 | |||
| Machinery - 1.3% | |||
| Industrial Machinery - 1.3% | |||
| Global Brass & Copper Holdings, Inc. | 245,087 | 4,813,509 | |
| Road & Rail - 0.8% | |||
| Trucking - 0.8% | |||
| Swift Transporation Co. (a) | 138,900 | 2,707,161 | |
| Transportation Infrastructure - 0.8% | |||
| Airport Services - 0.8% | |||
| Wesco Aircraft Holdings, Inc. (a) | 206,000 | 2,892,240 | |
| TOTAL COMMON STOCKS | |||
| (Cost $294,900,025) | 345,974,063 | ||
| Nonconvertible Preferred Stocks - 0.7% | |||
| Aerospace & Defense - 0.7% | |||
| Aerospace & Defense - 0.7% | |||
| Embraer SA sponsored ADR | |||
| (Cost $3,496,128) | 99,000 | 2,502,720 | |
| Money Market Funds - 2.5% | |||
| Fidelity Cash Central Fund, 0.15% (b) | |||
| (Cost $9,132,278) | 9,132,278 | 9,132,278 | |
| TOTAL INVESTMENT PORTFOLIO - 99.3% | |||
| (Cost $307,528,431) | 357,609,061 | ||
| NET OTHER ASSETS (LIABILITIES) - 0.7% | 2,498,779 | ||
| NET ASSETS - 100% | $360,107,840 |
Legend
(a) Non-income producing
(b) Affiliated fund that is generally available only to investment companies and other accounts managed by Fidelity Investments. The rate quoted is the annualized seven-day yield of the fund at period end. A complete unaudited listing of the fund's holdings as of its most recent quarter end is available upon request. In addition, each Fidelity Central Fund's financial statements are available on the SEC's website or upon request.
Affiliated Central Funds
Information regarding fiscal year to date income earned by the Fund from investments in Fidelity Central Funds is as follows:
| Fund | Income earned |
| Fidelity Cash Central Fund | $7,156 |
| Fidelity Securities Lending Cash Central Fund | 10,046 |
| Total | $17,202 |
Investment Valuation
All investments are categorized as Level 1 under the Fair Value Hierarchy. The inputs or methodology used for valuing securities may not be an indication of the risk associated with investing in those securities. For more information on valuation inputs please refer to the Investment Valuation section in the accompanying Notes to Financial Statements.
See accompanying notes which are an integral part of the financial statements.
Air Transportation Portfolio
Financial Statements
Statement of Assets and Liabilities
| August 31, 2015 (Unaudited) | ||
| Assets | ||
| Investment in securities, at value — See accompanying schedule: Unaffiliated issuers (cost $298,396,153) | $348,476,783 | |
| Fidelity Central Funds (cost $9,132,278) | 9,132,278 | |
| Total Investments (cost $307,528,431) | $357,609,061 | |
| Receivable for investments sold | 19,520,734 | |
| Receivable for fund shares sold | 700,811 | |
| Dividends receivable | 752,513 | |
| Distributions receivable from Fidelity Central Funds | 1,347 | |
| Prepaid expenses | 2,889 | |
| Other receivables | 6,503 | |
| Total assets | 378,593,858 | |
| Liabilities | ||
| Payable for investments purchased | $17,117,962 | |
| Payable for fund shares redeemed | 1,086,092 | |
| Accrued management fee | 173,697 | |
| Other affiliated payables | 83,912 | |
| Other payables and accrued expenses | 24,355 | |
| Total liabilities | 18,486,018 | |
| Net Assets | $360,107,840 | |
| Net Assets consist of: | ||
| Paid in capital | $286,637,919 | |
| Undistributed net investment income | 603,104 | |
| Accumulated undistributed net realized gain (loss) on investments and foreign currency transactions | 22,787,020 | |
| Net unrealized appreciation (depreciation) on investments and assets and liabilities in foreign currencies | 50,079,797 | |
| Net Assets, for 5,423,896 shares outstanding | $360,107,840 | |
| Net Asset Value, offering price and redemption price per share ($360,107,840 ÷ 5,423,896 shares) | $66.39 |
See accompanying notes which are an integral part of the financial statements.
Statement of Operations
| Six months ended August 31, 2015 (Unaudited) | ||
| Investment Income | ||
| Dividends | $2,624,951 | |
| Income from Fidelity Central Funds | 17,202 | |
| Total income | 2,642,153 | |
| Expenses | ||
| Management fee | $1,364,864 | |
| Transfer agent fees | 514,596 | |
| Accounting and security lending fees | 95,679 | |
| Custodian fees and expenses | 10,542 | |
| Independent trustees' compensation | 4,854 | |
| Registration fees | 57,080 | |
| Audit | 22,002 | |
| Legal | 4,030 | |
| Interest | 191 | |
| Miscellaneous | 2,627 | |
| Total expenses before reductions | 2,076,465 | |
| Expense reductions | (37,632) | 2,038,833 |
| Net investment income (loss) | 603,320 | |
| Realized and Unrealized Gain (Loss)
Net realized gain (loss) on: | ||
| Investment securities: | ||
| Unaffiliated issuers | 26,681,275 | |
| Foreign currency transactions | 15,121 | |
| Total net realized gain (loss) | 26,696,396 | |
| Change in net unrealized appreciation (depreciation) on: Investment securities | (66,881,465) | |
| Assets and liabilities in foreign currencies | (971) | |
| Total change in net unrealized appreciation (depreciation) | (66,882,436) | |
| Net gain (loss) | (40,186,040) | |
| Net increase (decrease) in net assets resulting from operations | $(39,582,720) |
See accompanying notes which are an integral part of the financial statements.
Statement of Changes in Net Assets
| Six months ended August 31, 2015 (Unaudited) | Year ended February 28, 2015 | |
| Increase (Decrease) in Net Assets | ||
| Operations | ||
| Net investment income (loss) | $603,320 | $1,402,538 |
| Net realized gain (loss) | 26,696,396 | 48,127,659 |
| Change in net unrealized appreciation (depreciation) | (66,882,436) | 37,709,013 |
| Net increase (decrease) in net assets resulting from operations | (39,582,720) | 87,239,210 |
| Distributions to shareholders from net investment income | (404,415) | (630,886) |
| Distributions to shareholders from net realized gain | (3,889,257) | (8,759,130) |
| Total distributions | (4,293,672) | (9,390,016) |
| Share transactions | ||
| Proceeds from sales of shares | 78,010,637 | 756,163,010 |
| Reinvestment of distributions | 4,149,621 | 9,070,010 |
| Cost of shares redeemed | (394,114,335) | (478,208,807) |
| Net increase (decrease) in net assets resulting from share transactions | (311,954,077) | 287,024,213 |
| Redemption fees | 12,878 | 92,355 |
| Total increase (decrease) in net assets | (355,817,591) | 364,965,762 |
| Net Assets | ||
| Beginning of period | 715,925,431 | 350,959,669 |
| End of period (including undistributed net investment income of $603,104 and undistributed net investment income of $404,199, respectively) | $360,107,840 | $715,925,431 |
| Other Information
Shares | ||
| Sold | 1,091,953 | 11,025,387 |
| Issued in reinvestment of distributions | 57,690 | 130,079 |
| Redeemed | (5,520,384) | (7,112,132) |
| Net increase (decrease) | (4,370,741) | 4,043,334 |
See accompanying notes which are an integral part of the financial statements.
Financial Highlights — Air Transportation Portfolio
| Six months ended (Unaudited) | Years ended February 28, | |||||
| August 31, | 2015 | 2015 | 2014 | 2013 | 2012 A | 2011 |
| Selected Per–Share Data | ||||||
| Net asset value, beginning of period | $73.09 | $61.02 | $43.97 | $38.12 | $43.05 | $35.32 |
| Income from Investment Operations | ||||||
| Net investment income (loss)B | .09 | .20C | .12 | .21D | .05 | .17E |
| Net realized and unrealized gain (loss) | (6.29) | 13.09 | 18.28 | 6.44 | .46 | 7.68 |
| Total from investment operations | (6.20) | 13.29 | 18.40 | 6.65 | .51 | 7.85 |
| Distributions from net investment income | (.05) | (.08) | (.06) | (.15) | (.05) | (.13) |
| Distributions from net realized gain | (.45) | (1.14) | (1.30) | (.66) | (5.39) | – |
| Total distributions | (.50) | (1.23)F | (1.36) | (.80)G | (5.44) | (.13) |
| Redemption fees added to paid in capitalB | –H | .01 | .01 | –H | –H | .01 |
| Net asset value, end of period | $66.39 | $73.09 | $61.02 | $43.97 | $38.12 | $43.05 |
| Total ReturnI,J | (8.54)% | 21.93% | 42.26% | 17.62% | 2.01% | 22.26% |
| Ratios to Average Net AssetsK,L | ||||||
| Expenses before reductions | .83%M | .83% | .87% | .94% | .96% | .92% |
| Expenses net of fee waivers, if any | .83%M | .83% | .87% | .94% | .96% | .92% |
| Expenses net of all reductions | .82%M | .83% | .86% | .92% | .95% | .91% |
| Net investment income (loss) | .24%M | .30%C | .22% | .54%D | .12% | .43%E |
| Supplemental Data | ||||||
| Net assets, end of period (000 omitted) | $360,108 | $715,925 | $350,960 | $90,837 | $72,652 | $113,471 |
| Portfolio turnover rateN | 78%M | 65%O | 125% | 74% | 102% | 161% |
A For the year ended February 29.
B Calculated based on average shares outstanding during the period.
C Investment income per share reflects a large, non-recurring dividend which amounted to $.22 per share. Excluding this non-recurring dividend, the ratio of net investment income (loss) to average net assets would have been (.04) %.
D Investment income per share reflects a large, non-recurring dividend which amounted to $.07 per share. Excluding this non-recurring dividend, the ratio of net investment income (loss) to average net assets would have been .35%.
E Investment income per share reflects a large, non-recurring dividend which amounted to $.12 per share. Excluding this non-recurring dividend, the ratio of net investment income (loss) to average net assets would have been .14%.
F Total distributions of $1.23 per share is comprised of distributions from net investment income of $.084 and distributions from net realized gain of $1.144 per share.
G Total distributions of $.80 per share is comprised of distributions from net investment income of $.147 and distributions from net realized gain of $.655 per share.
H Amount represents less than $.005 per share.
I Total returns for periods of less than one year are not annualized.
J Total returns would have been lower if certain expenses had not been reduced during the applicable periods shown.
K Fees and expenses of any underlying Fidelity Central Funds are not included in the Fund's expense ratio. The Fund indirectly bears its proportionate share of the expenses of any underlying Fidelity Central Funds.
L Expense ratios reflect operating expenses of the Fund. Expenses before reductions do not reflect amounts reimbursed by the investment adviser or reductions from brokerage service arrangements or reductions from other expense offset arrangements and do not represent the amount paid by the Fund during periods when reimbursements or reductions occur. Expenses net of fee waivers reflect expenses after reimbursement by the investment adviser but prior to reductions from brokerage service arrangements or other expense offset arrangements. Expenses net of all reductions represent the net expenses paid by the Fund.
M Annualized
N Amount does not include the portfolio activity of any underlying Fidelity Central Funds.
O Portfolio turnover rate excludes securities received or delivered in-kind.
See accompanying notes which are an integral part of the financial statements.
Defense and Aerospace Portfolio
Investment Summary (Unaudited)
Top Ten Stocks as of August 31, 2015
| % of fund's net assets | % of fund's net assets 6 months ago | |
| The Boeing Co. | 17.5 | 16.0 |
| United Technologies Corp. | 14.9 | 18.6 |
| Raytheon Co. | 7.9 | 5.7 |
| Rockwell Collins, Inc. | 6.2 | 4.7 |
| Huntington Ingalls Industries, Inc. | 5.0 | 5.2 |
| TransDigm Group, Inc. | 4.8 | 3.9 |
| Orbital ATK, Inc. | 4.7 | 3.6 |
| Textron, Inc. | 4.6 | 4.4 |
| Honeywell International, Inc. | 4.4 | 4.0 |
| L-3 Communications Holdings, Inc. | 4.1 | 4.3 |
| 74.1 |
Top Industries (% of fund's net assets)
| As of August 31, 2015 | ||
| Aerospace & Defense | 96.5% | |
| Leisure Products | 2.5% | |
| All Others* | 1.0% | |

| As of February 28, 2015 | ||
| Aerospace & Defense | 92.5% | |
| Leisure Products | 2.0% | |
| Chemicals | 1.3% | |
| All Others* | 4.2% | |

* Includes short-term investments and net other assets (liabilities).
Defense and Aerospace Portfolio
Investments August 31, 2015 (Unaudited)
Showing Percentage of Net Assets
| Common Stocks - 99.0% | |||
| Shares | Value | ||
| Aerospace & Defense - 96.5% | |||
| Aerospace & Defense - 96.5% | |||
| Aerojet Rocketdyne Holdings, Inc. (a) | 175,885 | $3,617,954 | |
| Astronics Corp. (a) | 396,300 | 20,472,858 | |
| BAE Systems PLC | 2,985,797 | 20,718,472 | |
| BE Aerospace, Inc. | 331,500 | 16,160,625 | |
| Esterline Technologies Corp. (a) | 345,334 | 28,217,241 | |
| General Dynamics Corp. | 84,000 | 11,930,520 | |
| HEICO Corp. | 212,625 | 10,822,613 | |
| Honeywell International, Inc. | 359,476 | 35,685,183 | |
| Huntington Ingalls Industries, Inc. | 361,174 | 40,660,969 | |
| L-3 Communications Holdings, Inc. | 314,718 | 33,193,307 | |
| Meggitt PLC | 2,244,687 | 16,443,910 | |
| Orbital ATK, Inc. | 500,143 | 37,865,827 | |
| Precision Castparts Corp. | 13,594 | 3,130,019 | |
| Raytheon Co. | 625,956 | 64,198,047 | |
| Rockwell Collins, Inc. | 617,072 | 50,507,343 | |
| Safran SA | 229,300 | 17,913,852 | |
| Teledyne Technologies, Inc. (a) | 205,326 | 20,103,469 | |
| Textron, Inc. | 953,000 | 36,976,400 | |
| The Boeing Co. | 1,083,931 | 141,648,104 | |
| TransDigm Group, Inc. (a) | 168,733 | 38,779,905 | |
| Triumph Group, Inc. | 247,535 | 12,225,754 | |
| United Technologies Corp. | 1,323,101 | 121,209,283 | |
| 782,481,655 | |||
| Electrical Equipment - 0.0% | |||
| Electrical Components & Equipment - 0.0% | |||
| AMETEK, Inc. | 599 | 32,238 | |
| Leisure Products - 2.5% | |||
| Leisure Products - 2.5% | |||
| Vista Outdoor, Inc. (a) | 437,286 | 20,447,493 | |
| Metals & Mining - 0.0% | |||
| Steel - 0.0% | |||
| Carpenter Technology Corp. | 200 | 7,800 | |
| TOTAL COMMON STOCKS | |||
| (Cost $595,106,395) | 802,969,186 | ||
| Money Market Funds - 0.2% | |||
| Fidelity Cash Central Fund, 0.15% (b) | |||
| (Cost $1,366,233) | 1,366,233 | 1,366,233 | |
| TOTAL INVESTMENT PORTFOLIO - 99.2% | |||
| (Cost $596,472,628) | 804,335,419 | ||
| NET OTHER ASSETS (LIABILITIES) - 0.8% | 6,414,370 | ||
| NET ASSETS - 100% | $810,749,789 |
Legend
(a) Non-income producing
(b) Affiliated fund that is generally available only to investment companies and other accounts managed by Fidelity Investments. The rate quoted is the annualized seven-day yield of the fund at period end. A complete unaudited listing of the fund's holdings as of its most recent quarter end is available upon request. In addition, each Fidelity Central Fund's financial statements are available on the SEC's website or upon request.
Affiliated Central Funds
Information regarding fiscal year to date income earned by the Fund from investments in Fidelity Central Funds is as follows:
| Fund | Income earned |
| Fidelity Cash Central Fund | $9,999 |
| Fidelity Securities Lending Cash Central Fund | 13,145 |
| Total | $23,144 |
Investment Valuation
All investments are categorized as Level 1 under the Fair Value Hierarchy. The inputs or methodology used for valuing securities may not be an indication of the risk associated with investing in those securities. For more information on valuation inputs please refer to the Investment Valuation section in the accompanying Notes to Financial Statements.
See accompanying notes which are an integral part of the financial statements.
Defense and Aerospace Portfolio
Financial Statements
Statement of Assets and Liabilities
| August 31, 2015 (Unaudited) | ||
| Assets | ||
| Investment in securities, at value — See accompanying schedule: Unaffiliated issuers (cost $595,106,395) | $802,969,186 | |
| Fidelity Central Funds (cost $1,366,233) | 1,366,233 | |
| Total Investments (cost $596,472,628) | $804,335,419 | |
| Receivable for investments sold | 4,335,823 | |
| Receivable for fund shares sold | 486,260 | |
| Dividends receivable | 2,810,134 | |
| Distributions receivable from Fidelity Central Funds | 691 | |
| Prepaid expenses | 6,679 | |
| Other receivables | 20,654 | |
| Total assets | 811,995,660 | |
| Liabilities | ||
| Payable for fund shares redeemed | 642,787 | |
| Accrued management fee | 394,448 | |
| Transfer agent fee payable | 141,804 | |
| Other affiliated payables | 24,542 | |
| Other payables and accrued expenses | 42,290 | |
| Total liabilities | 1,245,871 | |
| Net Assets | $810,749,789 | |
| Net Assets consist of: | ||
| Paid in capital | $585,696,503 | |
| Undistributed net investment income | 4,437,576 | |
| Accumulated undistributed net realized gain (loss) on investments and foreign currency transactions | 12,752,919 | |
| Net unrealized appreciation (depreciation) on investments | 207,862,791 | |
| Net Assets, for 7,304,324 shares outstanding | $810,749,789 | |
| Net Asset Value, offering price and redemption price per share ($810,749,789 ÷ 7,304,324 shares) | $111.00 |
See accompanying notes which are an integral part of the financial statements.
Statement of Operations
| Six months ended August 31, 2015 (Unaudited) | ||
| Investment Income | ||
| Dividends | $8,180,162 | |
| Income from Fidelity Central Funds | 23,144 | |
| Total income | 8,203,306 | |
| Expenses | ||
| Management fee | $2,604,622 | |
| Transfer agent fees | 916,460 | |
| Accounting and security lending fees | 159,424 | |
| Custodian fees and expenses | 9,710 | |
| Independent trustees' compensation | 8,097 | |
| Registration fees | 55,464 | |
| Audit | 19,105 | |
| Legal | 5,806 | |
| Interest | 1,346 | |
| Miscellaneous | 5,736 | |
| Total expenses before reductions | 3,785,770 | |
| Expense reductions | (40,992) | 3,744,778 |
| Net investment income (loss) | 4,458,528 | |
| Realized and Unrealized Gain (Loss)
Net realized gain (loss) on: | ||
| Investment securities: | ||
| Unaffiliated issuers | 13,101,479 | |
| Foreign currency transactions | 46,519 | |
| Total net realized gain (loss) | 13,147,998 | |
| Change in net unrealized appreciation (depreciation) on investment securities | (124,063,603) | |
| Net gain (loss) | (110,915,605) | |
| Net increase (decrease) in net assets resulting from operations | $(106,457,077) |
See accompanying notes which are an integral part of the financial statements.
Statement of Changes in Net Assets
| Six months ended August 31, 2015 (Unaudited) | Year ended February 28, 2015 | |
| Increase (Decrease) in Net Assets | ||
| Operations | ||
| Net investment income (loss) | $4,458,528 | $7,695,832 |
| Net realized gain (loss) | 13,147,998 | 50,293,674 |
| Change in net unrealized appreciation (depreciation) | (124,063,603) | 37,285,780 |
| Net increase (decrease) in net assets resulting from operations | (106,457,077) | 95,275,286 |
| Distributions to shareholders from net investment income | (2,218,730) | (6,773,084) |
| Distributions to shareholders from net realized gain | (31,532,611) | (49,828,078) |
| Total distributions | (33,751,341) | (56,601,162) |
| Share transactions | ||
| Proceeds from sales of shares | 171,770,821 | 202,060,866 |
| Reinvestment of distributions | 32,362,710 | 54,381,038 |
| Cost of shares redeemed | (201,352,402) | (370,380,329) |
| Net increase (decrease) in net assets resulting from share transactions | 2,781,129 | (113,938,425) |
| Redemption fees | 21,320 | 26,928 |
| Total increase (decrease) in net assets | (137,405,969) | (75,237,373) |
| Net Assets | ||
| Beginning of period | 948,155,758 | 1,023,393,131 |
| End of period (including undistributed net investment income of $4,437,576 and undistributed net investment income of $2,197,778, respectively) | $810,749,789 | $948,155,758 |
| Other Information
Shares | ||
| Sold | 1,361,621 | 1,668,989 |
| Issued in reinvestment of distributions | 254,825 | 477,347 |
| Redeemed | (1,664,054) | (3,145,035) |
| Net increase (decrease) | (47,608) | (998,699) |
See accompanying notes which are an integral part of the financial statements.
Financial Highlights — Defense and Aerospace Portfolio
| Six months ended (Unaudited) | Years ended February 28, | |||||
| August 31, | 2015 | 2015 | 2014 | 2013 | 2012 A | 2011 |
| Selected Per–Share Data | ||||||
| Net asset value, beginning of period | $128.97 | $122.55 | $91.73 | $86.02 | $78.21 | $62.05 |
| Income from Investment Operations | ||||||
| Net investment income (loss)B | .57 | 1.06C | .77 | 1.17D | .56 | .42 |
| Net realized and unrealized gain (loss) | (14.23) | 13.14 | 36.34 | 5.94 | 7.87 | 16.17 |
| Total from investment operations | (13.66) | 14.20 | 37.11 | 7.11 | 8.43 | 16.59 |
| Distributions from net investment income | (.28) | (.97) | (.64) | (1.21) | (.51) | (.43) |
| Distributions from net realized gain | (4.02) | (6.81) | (5.65) | (.19) | (.12) | – |
| Total distributions | (4.31)E | (7.78) | (6.29) | (1.40) | (.62)F | (.43) |
| Redemption fees added to paid in capitalB,G | – | – | – | – | – | – |
| Net asset value, end of period | $111.00 | $128.97 | $122.55 | $91.73 | $86.02 | $78.21 |
| Total ReturnH,I | (11.02)% | 12.53% | 40.85% | 8.37% | 10.87% | 26.79% |
| Ratios to Average Net AssetsJ,K | ||||||
| Expenses before reductions | .80%L | .79% | .81% | .84% | .86% | .88% |
| Expenses net of fee waivers, if any | .79%L | .79% | .81% | .84% | .86% | .88% |
| Expenses net of all reductions | .79%L | .79% | .81% | .83% | .86% | .88% |
| Net investment income (loss) | .94%L | .90%C | .70% | 1.39%D | .72% | .62% |
| Supplemental Data | ||||||
| Net assets, end of period (000 omitted) | $810,750 | $948,156 | $1,023,393 | $606,859 | $681,154 | $677,961 |
| Portfolio turnover rateM | 37%L | 20% | 48% | 56% | 56% | 43% |
A For the year ended February 29.
B Calculated based on average shares outstanding during the period.
C Investment income per share reflects a large, non-recurring dividend which amounted to $.66 per share. Excluding this non-recurring dividend, the ratio of net investment income (loss) to average net assets would have been .34%.
D Investment income per share reflects a large, non-recurring dividend which amounted to $.34 per share. Excluding this non-recurring dividend, the ratio of net investment income (loss) to average net assets would have been .99%.
E Total distributions of $4.31 per share is comprised of distributions from net investment income of $.283 and distributions from net realized gain of $4.022 per share.
F Total distributions of $.62 per share is comprised of distributions from net investment income of $.508 and distributions from net realized gain of $.115 per share.
G Amount represents less than $.005 per share.
H Total returns for periods of less than one year are not annualized.
I Total returns would have been lower if certain expenses had not been reduced during the applicable periods shown.
J Fees and expenses of any underlying Fidelity Central Funds are not included in the Fund's expense ratio. The Fund indirectly bears its proportionate share of the expenses of any underlying Fidelity Central Funds.
K Expense ratios reflect operating expenses of the Fund. Expenses before reductions do not reflect amounts reimbursed by the investment adviser or reductions from brokerage service arrangements or reductions from other expense offset arrangements and do not represent the amount paid by the Fund during periods when reimbursements or reductions occur. Expenses net of fee waivers reflect expenses after reimbursement by the investment adviser but prior to reductions from brokerage service arrangements or other expense offset arrangements. Expenses net of all reductions represent the net expenses paid by the Fund.
L Annualized
M Amount does not include the portfolio activity of any underlying Fidelity Central Funds.
See accompanying notes which are an integral part of the financial statements.
Environment and Alternative Energy Portfolio
Investment Summary (Unaudited)
Top Ten Stocks as of August 31, 2015
| % of fund's net assets | % of fund's net assets 6 months ago | |
| Honeywell International, Inc. | 12.1 | 10.9 |
| Deere & Co. | 7.4 | 6.4 |
| Delphi Automotive PLC | 6.7 | 6.3 |
| Praxair, Inc. | 5.5 | 7.4 |
| Tenneco, Inc. | 4.7 | 4.6 |
| Rockwell Automation, Inc. | 4.6 | 4.1 |
| Cummins, Inc. | 4.6 | 5.0 |
| Roper Industries, Inc. | 4.6 | 3.7 |
| Parker Hannifin Corp. | 4.5 | 4.3 |
| Innospec, Inc. | 4.0 | 2.7 |
| 58.7 |
Top Industries (% of fund's net assets)
| As of August 31, 2015 | ||
| Energy Efficiency | 57.1% | |
| Pollution Control | 9.3% | |
| Renewable & Alternative Energy | 8.9% | |
| Environmental Support Services | 8.8% | |
| Water Infrastructure & Technologies | 8.8% | |
| All Others* | 7.1% | |

| As of February 28, 2015 | ||
| Energy Efficiency | 49.5% | |
| Pollution Control | 10.6% | |
| Water Infrastructure & Technologies | 10.5% | |
| Environmental Support Services | 9.1% | |
| Food Agriculture & Forestry | 7.8% | |
| All Others* | 12.5% | |

* Includes short-term investments and net other assets (liabilities).
Environment and Alternative Energy Portfolio
Investments August 31, 2015 (Unaudited)
Showing Percentage of Net Assets
| Common Stocks - 95.9% | |||
| Shares | Value | ||
| Energy Efficiency - 57.1% | |||
| Buildings Energy Efficiency - 14.8% | |||
| A.O. Smith Corp. | 44,600 | 2,877,146 | |
| Deere & Co. | 67,900 | 5,552,862 | |
| Lennox International, Inc. | 22,600 | 2,667,704 | |
| 11,097,712 | |||
| Diversified Energy Efficiency - 14.7% | |||
| Honeywell International, Inc. | 91,800 | 9,112,987 | |
| Linear Technology Corp. | 49,200 | 1,981,776 | |
| 11,094,763 | |||
| Industrial Energy Efficiency - 14.8% | |||
| EnerSys | 50,400 | 2,694,888 | |
| Praxair, Inc. | 39,300 | 4,155,975 | |
| Rockwell Automation, Inc. | 31,100 | 3,477,913 | |
| Rogers Corp. (a) | 14,600 | 812,636 | |
| 11,141,412 | |||
| Transport Energy Efficiency - 12.8% | |||
| BorgWarner, Inc. | 36,500 | 1,592,860 | |
| Delphi Automotive PLC | 66,800 | 5,044,736 | |
| Innospec, Inc. | 61,300 | 3,009,830 | |
| 9,647,426 | |||
| TOTAL ENERGY EFFICIENCY | 42,981,313 | ||
| Environmental Support Services - 8.8% | |||
| Diversified Environmental - 7.9% | |||
| 3M Co. | 18,200 | 2,586,948 | |
| Parker Hannifin Corp. (b) | 31,200 | 3,358,992 | |
| 5,945,940 | |||
| Environmental Consultancies - 0.9% | |||
| AECOM Technology Corp. (a) | 23,900 | 657,250 | |
| TOTAL ENVIRONMENTAL SUPPORT SERVICES | 6,603,190 | ||
| Food Agriculture & Forestry - 1.3% | |||
| Sustainable Forestry and Plant - 1.3% | |||
| Potlatch Corp. | 30,600 | 1,010,412 | |
| Miscellaneous Environmental - 0.1% | |||
| Other Environmental - 0.1% | |||
| IBM Corp. | 500 | 73,945 | |
| Pollution Control - 9.3% | |||
| Pollution Control Solutions - 9.3% | |||
| Cummins, Inc. | 28,500 | 3,469,875 | |
| Tenneco, Inc. (a) | 74,700 | 3,514,635 | |
| 6,984,510 | |||
| Renewable & Alternative Energy - 8.9% | |||
| Other Renewables Equipment - 2.3% | |||
| Andritz AG | 36,400 | 1,744,952 | |
| Renewable Energy Developers and Independent Power Producers - 2.6% | |||
| Fortum Corp. | 35,500 | 578,025 | |
| IDACORP, Inc. | 12,300 | 730,251 | |
| Portland General Electric Co. | 19,200 | 663,168 | |
| 1,971,444 | |||
| Solar Energy Generation Equipment - 0.1% | |||
| SMA Solar Technology AG (a)(b) | 2,000 | 78,034 | |
| Wind Power Generation Equipment - 3.9% | |||
| Iberdrola SA | 429,318 | 2,917,052 | |
| TOTAL RENEWABLE & ALTERNATIVE ENERGY | 6,711,482 | ||
| Waste Management & Technologies - 1.6% | |||
| Recycling and Value Added Waste Processing - 1.6% | |||
| Copart, Inc. (a) | 34,800 | 1,218,696 | |
| Water Infrastructure & Technologies - 8.8% | |||
| Diversified Water Infrastructure and Technology- 0.6% | |||
| Danaher Corp. | 4,600 | 400,292 | |
| Water Infrastructure - 8.2% | |||
| Crane Co. | 10,900 | 572,686 | |
| Roper Industries, Inc. | 21,260 | 3,446,033 | |
| Valmont Industries, Inc. | 20,350 | 2,163,002 | |
| 6,181,721 | |||
| TOTAL WATER INFRASTRUCTURE & TECHNOLOGIES | 6,582,013 | ||
| TOTAL COMMON STOCKS | |||
| (Cost $75,109,055) | 72,165,561 | ||
| Money Markets Funds - 7.5% | |||
| Fidelity Cash Central Fund, 0.15% (c) | 2,992,978 | 2,992,978 | |
| Fidelity Securities Lending Cash Central Fund, 0.19% (c)(d) | 2,635,450 | 2,635,450 | |
| TOTAL MONEY MARKET FUNDS | |||
| (Cost $5,628,428) | 5,628,428 | ||
| TOTAL INVESTMENT PORTFOLIO - 103.4% | |||
| (Cost $80,737,483) | 77,793,989 | ||
| NET OTHER ASSETS (LIABILITIES) - (3.4)% | (2,526,499) | ||
| NET ASSETS - 100% | $75,267,490 |
Legend
(a) Non-income producing
(b) Security or a portion of the security is on loan at period end.
(c) Affiliated fund that is generally available only to investment companies and other accounts managed by Fidelity Investments. The rate quoted is the annualized seven-day yield of the fund at period end. A complete unaudited listing of the fund's holdings as of its most recent quarter end is available upon request. In addition, each Fidelity Central Fund's financial statements are available on the SEC's website or upon request.
(d) Investment made with cash collateral received from securities on loan.
Affiliated Central Funds
Information regarding fiscal year to date income earned by the Fund from investments in Fidelity Central Funds is as follows:
| Fund | Income earned |
| Fidelity Cash Central Fund | $2,695 |
| Fidelity Securities Lending Cash Central Fund | 11,518 |
| Total | $14,213 |
Investment Valuation
All investments are categorized as Level 1 under the Fair Value Hierarchy. The inputs or methodology used for valuing securities may not be an indication of the risk associated with investing in those securities. For more information on valuation inputs please refer to the Investment Valuation section in the accompanying Notes to Financial Statements.
Other Information
Distribution of investments by country or territory of incorporation, as a percentage of Total Net Assets, is as follows (Unaudited):
| United States of America | 86.3% |
| Bailiwick of Jersey | 6.7% |
| Spain | 3.9% |
| Austria | 2.3% |
| Others (Individually Less Than 1%) | 0.8% |
| 100.0% |
See accompanying notes which are an integral part of the financial statements.
Environment and Alternative Energy Portfolio
Financial Statements
Statement of Assets and Liabilities
| August 31, 2015 (Unaudited) | ||
| Assets | ||
| Investment in securities, at value (including securities loaned of $2,597,163) — See accompanying schedule: Unaffiliated issuers (cost $75,109,055) | $72,165,561 | |
| Fidelity Central Funds (cost $5,628,428) | 5,628,428 | |
| Total Investments (cost $80,737,483) | $77,793,989 | |
| Cash | 39,479 | |
| Receivable for fund shares sold | 86,283 | |
| Dividends receivable | 151,318 | |
| Distributions receivable from Fidelity Central Funds | 1,025 | |
| Prepaid expenses | 588 | |
| Other receivables | 375 | |
| Total assets | 78,073,057 | |
| Liabilities | ||
| Payable for fund shares redeemed | 91,780 | |
| Accrued management fee | 35,560 | |
| Other affiliated payables | 20,830 | |
| Other payables and accrued expenses | 21,947 | |
| Collateral on securities loaned, at value | 2,635,450 | |
| Total liabilities | 2,805,567 | |
| Net Assets | $75,267,490 | |
| Net Assets consist of: | ||
| Paid in capital | $77,364,196 | |
| Undistributed net investment income | 342,047 | |
| Accumulated undistributed net realized gain (loss) on investments and foreign currency transactions | 506,039 | |
| Net unrealized appreciation (depreciation) on investments and assets and liabilities in foreign currencies | (2,944,792) | |
| Net Assets, for 4,034,535 shares outstanding | $75,267,490 | |
| Net Asset Value, offering price and redemption price per share ($75,267,490 ÷ 4,034,535 shares) | $18.66 |
See accompanying notes which are an integral part of the financial statements.
Statement of Operations
| Six months ended August 31, 2015 (Unaudited) | ||
| Investment Income | ||
| Dividends | $735,224 | |
| Income from Fidelity Central Funds | 14,213 | |
| Total income | 749,437 | |
| Expenses | ||
| Management fee | $232,040 | |
| Transfer agent fees | 113,218 | |
| Accounting and security lending fees | 16,868 | |
| Custodian fees and expenses | 5,577 | |
| Independent trustees' compensation | 734 | |
| Registration fees | 13,464 | |
| Audit | 24,397 | |
| Legal | 560 | |
| Miscellaneous | 777 | |
| Total expenses before reductions | 407,635 | |
| Expense reductions | (3,015) | 404,620 |
| Net investment income (loss) | 344,817 | |
| Realized and Unrealized Gain (Loss)
Net realized gain (loss) on: | ||
| Investment securities: | ||
| Unaffiliated issuers | 607,816 | |
| Foreign currency transactions | (3,677) | |
| Total net realized gain (loss) | 604,139 | |
| Change in net unrealized appreciation (depreciation) on: Investment securities | (8,449,652) | |
| Assets and liabilities in foreign currencies | (2) | |
| Total change in net unrealized appreciation (depreciation) | (8,449,654) | |
| Net gain (loss) | (7,845,515) | |
| Net increase (decrease) in net assets resulting from operations | $(7,500,698) |
See accompanying notes which are an integral part of the financial statements.
Statement of Changes in Net Assets
| Six months ended August 31, 2015 (Unaudited) | Year ended February 28, 2015 | |
| Increase (Decrease) in Net Assets | ||
| Operations | ||
| Net investment income (loss) | $344,817 | $688,451 |
| Net realized gain (loss) | 604,139 | 21,116,571 |
| Change in net unrealized appreciation (depreciation) | (8,449,654) | (20,169,911) |
| Net increase (decrease) in net assets resulting from operations | (7,500,698) | 1,635,111 |
| Distributions to shareholders from net investment income | (45,882) | (560,254) |
| Distributions to shareholders from net realized gain | (1,831,107) | (10,675,033) |
| Total distributions | (1,876,989) | (11,235,287) |
| Share transactions | ||
| Proceeds from sales of shares | 5,861,949 | 24,999,440 |
| Reinvestment of distributions | 1,791,346 | 10,697,844 |
| Cost of shares redeemed | (11,581,633) | (40,397,558) |
| Net increase (decrease) in net assets resulting from share transactions | (3,928,338) | (4,700,274) |
| Redemption fees | 840 | 4,105 |
| Total increase (decrease) in net assets | (13,305,185) | (14,296,345) |
| Net Assets | ||
| Beginning of period | 88,572,675 | 102,869,020 |
| End of period (including undistributed net investment income of $342,047 and undistributed net investment income of $43,112, respectively) | $75,267,490 | $88,572,675 |
| Other Information
Shares | ||
| Sold | 287,911 | 1,107,316 |
| Issued in reinvestment of distributions | 87,682 | 516,769 |
| Redeemed | (571,028) | (1,798,133) |
| Net increase (decrease) | (195,435) | (174,048) |
See accompanying notes which are an integral part of the financial statements.
Financial Highlights — Environment and Alternative Energy Portfolio
| Six months ended (Unaudited) | Years ended February 28, | |||||
| August 31, | 2015 | 2015 | 2014 | 2013 | 2012 A | 2011 |
| Selected Per–Share Data | ||||||
| Net asset value, beginning of period | $20.94 | $23.36 | $18.12 | $16.32 | $19.19 | $14.94 |
| Income from Investment Operations | ||||||
| Net investment income (loss)B | .08 | .16 | .14 | .18 | .20 | .10 |
| Net realized and unrealized gain (loss) | (1.46) | .31 | 5.27 | 1.77 | (2.88) | 4.22 |
| Total from investment operations | (1.38) | .47 | 5.41 | 1.95 | (2.68) | 4.32 |
| Distributions from net investment income | (.02) | (.14) | (.17) | (.15) | (.19) | (.07) |
| Distributions from net realized gain | (.88) | (2.75) | – | – | – | – |
| Total distributions | (.90) | (2.89) | (.17) | (.15) | (.19) | (.07) |
| Redemption fees added to paid in capitalB,C | – | – | – | – | – | – |
| Net asset value, end of period | $18.66 | $20.94 | $23.36 | $18.12 | $16.32 | $19.19 |
| Total ReturnD,E | (8.93)% | 2.19% | 29.97% | 12.02% | (13.92)% | 28.96% |
| Ratios to Average Net AssetsF,G | ||||||
| Expenses before reductions | .96%H | .92% | .97% | .99% | 1.01% | 1.08% |
| Expenses net of fee waivers, if any | .96%H | .92% | .97% | .99% | 1.01% | 1.08% |
| Expenses net of all reductions | .96%H | .92% | .97% | .97% | 1.00% | 1.07% |
| Net investment income (loss) | .81%H | .71% | .70% | 1.10% | 1.15% | .59% |
| Supplemental Data | ||||||
| Net assets, end of period (000 omitted) | $75,267 | $88,573 | $102,869 | $82,018 | $77,943 | $96,864 |
| Portfolio turnover rateI | 17%H | 160% | 28% | 54% | 183% | 190% |
A For the year ended February 29.
B Calculated based on average shares outstanding during the period.
C Amount represents less than $.005 per share.
D Total returns for periods of less than one year are not annualized.
E Total returns would have been lower if certain expenses had not been reduced during the applicable periods shown.
F Fees and expenses of any underlying Fidelity Central Funds are not included in the Fund's expense ratio. The Fund indirectly bears its proportionate share of the expenses of any underlying Fidelity Central Funds.
G Expense ratios reflect operating expenses of the Fund. Expenses before reductions do not reflect amounts reimbursed by the investment adviser or reductions from brokerage service arrangements or reductions from other expense offset arrangements and do not represent the amount paid by the Fund during periods when reimbursements or reductions occur. Expenses net of fee waivers reflect expenses after reimbursement by the investment adviser but prior to reductions from brokerage service arrangements or other expense offset arrangements. Expenses net of all reductions represent the net expenses paid by the Fund.
H Annualized
I Amount does not include the portfolio activity of any underlying Fidelity Central Funds.
See accompanying notes which are an integral part of the financial statements.
Industrial Equipment Portfolio
Investment Summary (Unaudited)
Top Ten Stocks as of August 31, 2015
| % of fund's net assets | % of fund's net assets 6 months ago | |
| General Electric Co. | 12.1 | 6.1 |
| United Technologies Corp. | 8.3 | 9.6 |
| The Boeing Co. | 8.1 | 7.7 |
| Danaher Corp. | 6.4 | 5.3 |
| Honeywell International, Inc. | 5.9 | 4.8 |
| General Dynamics Corp. | 4.1 | 0.0 |
| Ingersoll-Rand PLC | 3.4 | 3.0 |
| BWX Technologies, Inc. | 3.2 | 0.0 |
| Northrop Grumman Corp. | 3.0 | 3.0 |
| AECOM Technology Corp. | 2.9 | 5.2 |
| 57.4 |
Top Industries (% of fund's net assets)
| As of August 31, 2015 | ||
| Aerospace & Defense | 35.8% | |
| Industrial Conglomerates | 21.0% | |
| Machinery | 14.7% | |
| Electrical Equipment | 9.2% | |
| Trading Companies & Distributors | 5.0% | |
| All Others* | 14.3% | |

| As of February 28, 2015 | ||
| Machinery | 32.9% | |
| Aerospace & Defense | 31.5% | |
| Industrial Conglomerates | 11.4% | |
| Construction & Engineering | 5.2% | |
| Electrical Equipment | 4.1% | |
| All Others* | 14.9% | |
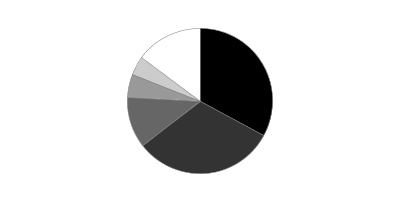
* Includes short-term investments and net other assets (liabilities).
Percentages shown as 0.0% may reflect amounts less than 0.05%.
Industrial Equipment Portfolio
Investments August 31, 2015 (Unaudited)
Showing Percentage of Net Assets
| Common Stocks - 96.6% | |||
| Shares | Value | ||
| Aerospace & Defense - 35.8% | |||
| Aerospace & Defense - 35.8% | |||
| General Dynamics Corp. | 31,000 | $4,402,930 | |
| Honeywell International, Inc. | 64,900 | 6,442,623 | |
| Huntington Ingalls Industries, Inc. | 12,100 | 1,362,218 | |
| L-3 Communications Holdings, Inc. | 25,800 | 2,721,126 | |
| Northrop Grumman Corp. | 20,000 | 3,274,800 | |
| Raytheon Co. | 5,100 | 523,056 | |
| Teledyne Technologies, Inc. (a) | 14,000 | 1,370,740 | |
| The Boeing Co. | 67,100 | 8,768,628 | |
| Triumph Group, Inc. | 18,300 | 903,837 | |
| United Technologies Corp. | 98,900 | 9,060,229 | |
| 38,830,187 | |||
| Auto Components - 0.7% | |||
| Auto Parts & Equipment - 0.7% | |||
| Johnson Controls, Inc. | 18,800 | 773,432 | |
| Building Products - 2.7% | |||
| Building Products - 2.7% | |||
| Lennox International, Inc. | 24,800 | 2,927,392 | |
| Construction & Engineering - 2.9% | |||
| Construction & Engineering - 2.9% | |||
| AECOM Technology Corp. (a) | 113,617 | 3,124,463 | |
| Diversified Consumer Services - 0.7% | |||
| Specialized Consumer Services - 0.7% | |||
| ServiceMaster Global Holdings, Inc. (a) | 23,200 | 816,176 | |
| Electrical Equipment - 9.2% | |||
| Electrical Components & Equipment - 6.0% | |||
| AMETEK, Inc. | 43,500 | 2,341,170 | |
| Eaton Corp. PLC | 51,400 | 2,932,884 | |
| Regal Beloit Corp. | 19,528 | 1,301,932 | |
| 6,575,986 | |||
| Heavy Electrical Equipment - 3.2% | |||
| BWX Technologies, Inc. | 129,500 | 3,434,340 | |
| TOTAL ELECTRICAL EQUIPMENT | 10,010,326 | ||
| Industrial Conglomerates - 21.0% | |||
| Industrial Conglomerates - 21.0% | |||
| 3M Co. | 19,100 | 2,714,874 | |
| Danaher Corp. | 79,600 | 6,926,792 | |
| General Electric Co. | 529,455 | 13,141,073 | |
| 22,782,739 | |||
| Machinery - 14.7% | |||
| Agricultural & Farm Machinery - 2.9% | |||
| Deere & Co. | 38,000 | 3,107,640 | |
| Construction Machinery & Heavy Trucks - 6.3% | |||
| Allison Transmission Holdings, Inc. | 107,133 | 3,064,004 | |
| Cummins, Inc. | 5,400 | 657,450 | |
| Manitowoc Co., Inc. (b) | 145,700 | 2,488,556 | |
| Navistar International Corp. (a)(b) | 34,400 | 613,696 | |
| 6,823,706 | |||
| Industrial Machinery - 5.5% | |||
| Global Brass & Copper Holdings, Inc. | 77,800 | 1,527,992 | |
| Ingersoll-Rand PLC | 66,900 | 3,698,901 | |
| Metka SA | 19,899 | 150,502 | |
| TriMas Corp. (a) | 34,800 | 634,752 | |
| 6,012,147 | |||
| TOTAL MACHINERY | 15,943,493 | ||
| Professional Services - 2.0% | |||
| Research & Consulting Services - 2.0% | |||
| CBIZ, Inc. (a) | 121,200 | 1,181,700 | |
| Dun & Bradstreet Corp. | 9,100 | 964,327 | |
| 2,146,027 | |||
| Road & Rail - 1.9% | |||
| Trucking - 1.9% | |||
| J.B. Hunt Transport Services, Inc. | 28,800 | 2,096,064 | |
| Trading Companies & Distributors - 5.0% | |||
| Trading Companies & Distributors - 5.0% | |||
| HD Supply Holdings, Inc. (a) | 76,600 | 2,527,800 | |
| United Rentals, Inc. (a) | 32,600 | 2,260,158 | |
| WESCO International, Inc. (a) | 12,300 | 688,431 | |
| 5,476,389 | |||
| TOTAL COMMON STOCKS | |||
| (Cost $98,567,190) | 104,926,688 | ||
| Money Market Funds - 6.2% | |||
| Fidelity Cash Central Fund, 0.15% (c) | 3,951,474 | 3,951,474 | |
| Fidelity Securities Lending Cash Central Fund, 0.19% (c)(d) | 2,775,600 | 2,775,600 | |
| TOTAL MONEY MARKET FUNDS | |||
| (Cost $6,727,074) | 6,727,074 | ||
| TOTAL INVESTMENT PORTFOLIO - 102.8% | |||
| (Cost $105,294,264) | 111,653,762 | ||
| NET OTHER ASSETS (LIABILITIES) - (2.8)% | (3,080,687) | ||
| NET ASSETS - 100% | $108,573,075 |
Legend
(a) Non-income producing
(b) Security or a portion of the security is on loan at period end.
(c) Affiliated fund that is generally available only to investment companies and other accounts managed by Fidelity Investments. The rate quoted is the annualized seven-day yield of the fund at period end. A complete unaudited listing of the fund's holdings as of its most recent quarter end is available upon request. In addition, each Fidelity Central Fund's financial statements are available on the SEC's website or upon request.
(d) Investment made with cash collateral received from securities on loan.
Affiliated Central Funds
Information regarding fiscal year to date income earned by the Fund from investments in Fidelity Central Funds is as follows:
| Fund | Income earned |
| Fidelity Cash Central Fund | $960 |
| Fidelity Securities Lending Cash Central Fund | 13,362 |
| Total | $14,322 |
Investment Valuation
All investments are categorized as Level 1 under the Fair Value Hierarchy. The inputs or methodology used for valuing securities may not be an indication of the risk associated with investing in those securities. For more information on valuation inputs please refer to the Investment Valuation section in the accompanying Notes to Financial Statements.
See accompanying notes which are an integral part of the financial statements.
Industrial Equipment Portfolio
Financial Statements
Statement of Assets and Liabilities
| August 31, 2015 (Unaudited) | ||
| Assets | ||
| Investment in securities, at value (including securities loaned of $2,709,708) — See accompanying schedule: Unaffiliated issuers (cost $98,567,190) | $104,926,688 | |
| Fidelity Central Funds (cost $6,727,074) | 6,727,074 | |
| Total Investments (cost $105,294,264) | $111,653,762 | |
| Receivable for investments sold | 395,474 | |
| Receivable for fund shares sold | 8,694 | |
| Dividends receivable | 242,246 | |
| Distributions receivable from Fidelity Central Funds | 859 | |
| Prepaid expenses | 687 | |
| Other receivables | 15,442 | |
| Total assets | 112,317,164 | |
| Liabilities | ||
| Payable for investments purchased | $817,925 | |
| Payable for fund shares redeemed | 54,017 | |
| Accrued management fee | 51,584 | |
| Other affiliated payables | 23,067 | |
| Other payables and accrued expenses | 21,896 | |
| Collateral on securities loaned, at value | 2,775,600 | |
| Total liabilities | 3,744,089 | |
| Net Assets | $108,573,075 | |
| Net Assets consist of: | ||
| Paid in capital | $72,834,467 | |
| Undistributed net investment income | 593,334 | |
| Accumulated undistributed net realized gain (loss) on investments and foreign currency transactions | 28,788,455 | |
| Net unrealized appreciation (depreciation) on investments and assets and liabilities in foreign currencies | 6,356,819 | |
| Net Assets, for 3,181,640 shares outstanding | $108,573,075 | |
| Net Asset Value, offering price and redemption price per share ($108,573,075 ÷ 3,181,640 shares) | $34.12 |
See accompanying notes which are an integral part of the financial statements.
Statement of Operations
| Six months ended August 31, 2015 (Unaudited) | ||
| Investment Income | ||
| Dividends | $1,293,789 | |
| Income from Fidelity Central Funds | 14,322 | |
| Total income | 1,308,111 | |
| Expenses | ||
| Management fee | $484,260 | |
| Transfer agent fees | 164,356 | |
| Accounting and security lending fees | 35,511 | |
| Custodian fees and expenses | 2,904 | |
| Independent trustees' compensation | 1,691 | |
| Registration fees | 14,568 | |
| Audit | 20,492 | |
| Legal | 1,424 | |
| Miscellaneous | 2,063 | |
| Total expenses before reductions | 727,269 | |
| Expense reductions | (17,002) | 710,267 |
| Net investment income (loss) | 597,844 | |
| Realized and Unrealized Gain (Loss)
Net realized gain (loss) on: | ||
| Investment securities: | ||
| Unaffiliated issuers | 28,941,428 | |
| Foreign currency transactions | 882 | |
| Total net realized gain (loss) | 28,942,310 | |
| Change in net unrealized appreciation (depreciation) on: Investment securities | (38,762,569) | |
| Assets and liabilities in foreign currencies | (779) | |
| Total change in net unrealized appreciation (depreciation) | (38,763,348) | |
| Net gain (loss) | (9,821,038) | |
| Net increase (decrease) in net assets resulting from operations | $(9,223,194) |
See accompanying notes which are an integral part of the financial statements.
Statement of Changes in Net Assets
| Six months ended August 31, 2015 (Unaudited) | Year ended February 28, 2015 | |
| Increase (Decrease) in Net Assets | ||
| Operations | ||
| Net investment income (loss) | $597,844 | $2,485,407 |
| Net realized gain (loss) | 28,942,310 | 46,030,365 |
| Change in net unrealized appreciation (depreciation) | (38,763,348) | (42,647,348) |
| Net increase (decrease) in net assets resulting from operations | (9,223,194) | 5,868,424 |
| Distributions to shareholders from net investment income | (393,165) | (2,406,422) |
| Distributions to shareholders from net realized gain | (8,894,650) | (57,814,171) |
| Total distributions | (9,287,815) | (60,220,593) |
| Share transactions | ||
| Proceeds from sales of shares | 4,047,680 | 24,679,677 |
| Reinvestment of distributions | 9,150,568 | 58,548,337 |
| Cost of shares redeemed | (114,425,096) | (225,953,361) |
| Net increase (decrease) in net assets resulting from share transactions | (101,226,848) | (142,725,347) |
| Redemption fees | 22 | 2,195 |
| Total increase (decrease) in net assets | (119,737,835) | (197,075,321) |
| Net Assets | ||
| Beginning of period | 228,310,910 | 425,386,231 |
| End of period (including undistributed net investment income of $593,334 and undistributed net investment income of $388,655, respectively) | $108,573,075 | $228,310,910 |
| Other Information
Shares | ||
| Sold | 108,926 | 583,434 |
| Issued in reinvestment of distributions | 243,172 | 1,492,839 |
| Redeemed | (3,045,886) | (5,442,610) |
| Net increase (decrease) | (2,693,788) | (3,366,337) |
See accompanying notes which are an integral part of the financial statements.
Financial Highlights — Industrial Equipment Portfolio
| Six months ended (Unaudited) | Years ended February 28, | |||||
| August 31, | 2015 | 2015 | 2014 | 2013 | 2012A | 2011 |
| Selected Per–Share Data | ||||||
| Net asset value, beginning of period | $38.86 | $46.03 | $39.59 | $36.37 | $36.16 | $26.16 |
| Income from Investment Operations | ||||||
| Net investment income (loss)B | .13 | .32 | .37 | .45 | .28 | .26 |
| Net realized and unrealized gain (loss) | (3.24) | .75 | 9.19 | 3.22 | .29 | 9.89 |
| Total from investment operations | (3.11) | 1.07 | 9.56 | 3.67 | .57 | 10.15 |
| Distributions from net investment income | (.07) | (.36) | (.32) | (.45) | (.26) | (.15) |
| Distributions from net realized gain | (1.56) | (7.88) | (2.80) | – | (.10) | – |
| Total distributions | (1.63) | (8.24) | (3.12) | (.45) | (.36) | (.15) |
| Redemption fees added to paid in capitalB,C | – | – | – | – | – | – |
| Net asset value, end of period | $34.12 | $38.86 | $46.03 | $39.59 | $36.37 | $36.16 |
| Total ReturnD,E | (8.39)% | 3.36% | 24.37% | 10.19% | 1.66% | 38.87% |
| Ratios to Average Net AssetsF,G | ||||||
| Expenses before reductions | .83%H | .77% | .79% | .82% | .84% | .89% |
| Expenses net of fee waivers, if any | .82%H | .77% | .78% | .82% | .84% | .89% |
| Expenses net of all reductions | .81%H | .77% | .78% | .81% | .84% | .88% |
| Net investment income (loss) | .68%H | .76% | .87% | 1.25% | .85% | .85% |
| Supplemental Data | ||||||
| Net assets, end of period (000 omitted) | $108,573 | $228,311 | $425,386 | $369,951 | $351,674 | $362,671 |
| Portfolio turnover rateI | 60%H,J | 53% | 100% | 69% | 101% | 82% |
A For the year ended February 29.
B Calculated based on average shares outstanding during the period.
C Amount represents less than .005%.
D Total returns for periods of less than one year are not annualized.
E Total returns would have been lower if certain expenses had not been reduced during the applicable periods shown.
F Fees and expenses of any underlying Fidelity Central Funds are not included in the Fund's expense ratio. The Fund indirectly bears its proportionate share of the expenses of any underlying Fidelity Central Funds.
G Expense ratios reflect operating expenses of the Fund. Expenses before reductions do not reflect amounts reimbursed by the investment adviser or reductions from brokerage service arrangements or reductions from other expense offset arrangements and do not represent the amount paid by the Fund during periods when reimbursements or reductions occur. Expenses net of fee waivers reflect expenses after reimbursement by the investment adviser but prior to reductions from brokerage service arrangements or other expense offset arrangements. Expenses net of all reductions represent the net expenses paid by the Fund.
H Annualized
I Amount does not include the portfolio activity of any underlying Fidelity Central Funds.
J Portfolio turnover rate excludes securities received or delivered in-kind.
See accompanying notes which are an integral part of the financial statements.
Industrials Portfolio
Investment Summary (Unaudited)
Top Ten Stocks as of August 31, 2015
| % of fund's net assets | % of fund's net assets 6 months ago | |
| General Electric Co. | 12.2 | 1.8 |
| Danaher Corp. | 7.4 | 6.8 |
| United Technologies Corp. | 5.6 | 8.2 |
| The Boeing Co. | 5.5 | 5.3 |
| FedEx Corp. | 5.3 | 5.2 |
| J.B. Hunt Transport Services, Inc. | 5.2 | 3.4 |
| Honeywell International, Inc. | 4.1 | 4.8 |
| Union Pacific Corp. | 3.8 | 5.4 |
| AECOM Technology Corp. | 3.0 | 0.9 |
| Raytheon Co. | 2.9 | 2.1 |
| 55.0 |
Top Industries (% of fund's net assets)
| As of August 31, 2015 | ||
| Aerospace & Defense | 26.7% | |
| Industrial Conglomerates | 20.6% | |
| Road & Rail | 10.1% | |
| Electrical Equipment | 6.7% | |
| Machinery | 6.3% | |
| All Others* | 29.6% | |
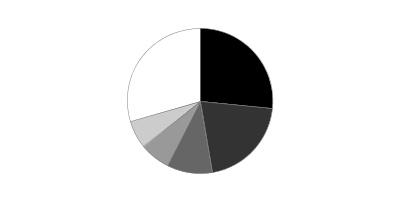
| As of February 28, 2015 | ||
| Aerospace & Defense | 29.3% | |
| Machinery | 12.3% | |
| Road & Rail | 11.8% | |
| Professional Services | 8.7% | |
| Industrial Conglomerates | 8.6% | |
| All Others* | 29.3% | |
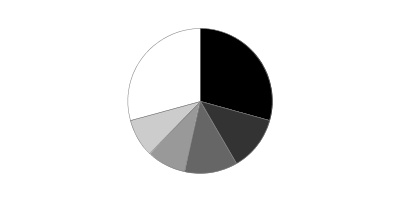
* Includes short-term investments and net other assets (liabilities).
Industrials Portfolio
Investments August 31, 2015 (Unaudited)
Showing Percentage of Net Assets
| Common Stocks - 98.1% | |||
| Shares | Value | ||
| Aerospace & Defense - 26.7% | |||
| Aerospace & Defense - 26.7% | |||
| General Dynamics Corp. | 218,697 | $31,061,535 | |
| Honeywell International, Inc. | 452,259 | 44,895,751 | |
| Orbital ATK, Inc. | 209,161 | 15,835,579 | |
| Raytheon Co. | 316,200 | 32,429,472 | |
| Teledyne Technologies, Inc. (a) | 246,821 | 24,166,244 | |
| Textron, Inc. | 635,419 | 24,654,257 | |
| The Boeing Co. | 459,498 | 60,047,199 | |
| United Technologies Corp. | 673,271 | 61,678,356 | |
| 294,768,393 | |||
| Air Freight & Logistics - 5.3% | |||
| Air Freight & Logistics - 5.3% | |||
| FedEx Corp. | 385,017 | 57,987,410 | |
| Building Products - 5.2% | |||
| Building Products - 5.2% | |||
| A.O. Smith Corp. | 363,639 | 23,458,352 | |
| Caesarstone Sdot-Yam Ltd. | 87,400 | 3,477,646 | |
| Lennox International, Inc. | 262,172 | 30,946,783 | |
| 57,882,781 | |||
| Commercial Services & Supplies - 4.2% | |||
| Environmental & Facility Services - 0.6% | |||
| Stericycle, Inc. (a) | 43,200 | 6,097,248 | |
| Office Services & Supplies - 1.9% | |||
| West Corp. | 884,305 | 21,523,984 | |
| Security & Alarm Services - 1.7% | |||
| Tyco International Ltd. | 519,800 | 18,863,542 | |
| TOTAL COMMERCIAL SERVICES & SUPPLIES | 46,484,774 | ||
| Construction & Engineering - 3.0% | |||
| Construction & Engineering - 3.0% | |||
| AECOM Technology Corp. (a) | 1,208,700 | 33,239,250 | |
| Diversified Consumer Services - 1.0% | |||
| Specialized Consumer Services - 1.0% | |||
| ServiceMaster Global Holdings, Inc. (a) | 317,600 | 11,173,168 | |
| Electrical Equipment - 6.7% | |||
| Electrical Components & Equipment - 4.1% | |||
| AMETEK, Inc. | 435,100 | 23,417,082 | |
| Eaton Corp. PLC | 376,600 | 21,488,796 | |
| 44,905,878 | |||
| Heavy Electrical Equipment - 2.6% | |||
| BWX Technologies, Inc. | 1,107,456 | 29,369,733 | |
| TOTAL ELECTRICAL EQUIPMENT | 74,275,611 | ||
| Energy Equipment & Services - 0.2% | |||
| Oil & Gas Equipment & Services - 0.2% | |||
| Aspen Aerogels, Inc. (a) | 301,649 | 2,253,318 | |
| Industrial Conglomerates - 20.6% | |||
| Industrial Conglomerates - 20.6% | |||
| 3M Co. | 77,900 | 11,072,706 | |
| Danaher Corp. | 938,021 | 81,626,587 | |
| General Electric Co. | 5,453,084 | 135,345,546 | |
| 228,044,839 | |||
| Machinery - 6.3% | |||
| Agricultural & Farm Machinery - 1.9% | |||
| Deere & Co. | 253,850 | 20,759,853 | |
| Construction Machinery & Heavy Trucks - 0.6% | |||
| Wabtec Corp. | 75,300 | 7,210,728 | |
| Industrial Machinery - 3.8% | |||
| IDEX Corp. | 275,998 | 19,824,936 | |
| Ingersoll-Rand PLC | 273,100 | 15,099,699 | |
| Pentair PLC | 118,900 | 6,573,981 | |
| 41,498,616 | |||
| TOTAL MACHINERY | 69,469,197 | ||
| Professional Services - 4.0% | |||
| Research & Consulting Services - 4.0% | |||
| CEB, Inc. | 209,400 | 14,997,228 | |
| Huron Consulting Group, Inc. (a) | 160,208 | 11,597,457 | |
| Verisk Analytics, Inc. (a) | 243,150 | 17,769,402 | |
| 44,364,087 | |||
| Road & Rail - 10.1% | |||
| Railroads - 4.7% | |||
| Kansas City Southern | 106,400 | 9,867,536 | |
| Union Pacific Corp. | 486,766 | 41,735,317 | |
| 51,602,853 | |||
| Trucking - 5.4% | |||
| J.B. Hunt Transport Services, Inc. | 794,720 | 57,839,722 | |
| Old Dominion Freight Lines, Inc. (a) | 30,900 | 2,054,541 | |
| 59,894,263 | |||
| TOTAL ROAD & RAIL | 111,497,116 | ||
| Trading Companies & Distributors - 4.8% | |||
| Trading Companies & Distributors - 4.8% | |||
| AerCap Holdings NV (a) | 491,500 | 20,662,660 | |
| HD Supply Holdings, Inc. (a) | 800,348 | 26,411,484 | |
| Wolseley PLC | 90,538 | 5,844,809 | |
| 52,918,953 | |||
| TOTAL COMMON STOCKS | |||
| (Cost $1,004,781,636) | 1,084,358,897 | ||
| Money Market Funds - 1.7% | |||
| Fidelity Cash Central Fund, 0.15% (b) | 13,828,745 | 13,828,745 | |
| Fidelity Securities Lending Cash Central Fund, 0.19% (b)(c) | 4,652,253 | 4,652,253 | |
| TOTAL MONEY MARKET FUNDS | |||
| (Cost $18,480,998) | 18,480,998 | ||
| TOTAL INVESTMENT PORTFOLIO - 99.8% | |||
| (Cost $1,023,262,634) | 1,102,839,895 | ||
| NET OTHER ASSETS (LIABILITIES) - 0.2% | 1,839,154 | ||
| NET ASSETS - 100% | $1,104,679,049 |
Legend
(a) Non-income producing
(b) Affiliated fund that is generally available only to investment companies and other accounts managed by Fidelity Investments. The rate quoted is the annualized seven-day yield of the fund at period end. A complete unaudited listing of the fund's holdings as of its most recent quarter end is available upon request. In addition, each Fidelity Central Fund's financial statements are available on the SEC's website or upon request.
(c) Investment made with cash collateral received from securities on loan.
Affiliated Central Funds
Information regarding fiscal year to date income earned by the Fund from investments in Fidelity Central Funds is as follows:
| Fund | Income earned |
| Fidelity Cash Central Fund | $12,287 |
| Fidelity Securities Lending Cash Central Fund | 24,053 |
| Total | $36,340 |
Investment Valuation
All investments are categorized as Level 1 under the Fair Value Hierarchy. The inputs or methodology used for valuing securities may not be an indication of the risk associated with investing in those securities. For more information on valuation inputs please refer to the Investment Valuation section in the accompanying Notes to Financial Statements.
See accompanying notes which are an integral part of the financial statements.
Industrials Portfolio
Financial Statements
Statement of Assets and Liabilities
| August 31, 2015 (Unaudited) | ||
| Assets | ||
| Investment in securities, at value (including securities loaned of $4,540,598) — See accompanying schedule: Unaffiliated issuers (cost $1,004,781,636) | $1,084,358,897 | |
| Fidelity Central Funds (cost $18,480,998) | 18,480,998 | |
| Total Investments (cost $1,023,262,634) | $1,102,839,895 | |
| Receivable for investments sold | 15,664,466 | |
| Receivable for fund shares sold | 185,848 | |
| Dividends receivable | 1,638,942 | |
| Distributions receivable from Fidelity Central Funds | 4,737 | |
| Prepaid expenses | 8,664 | |
| Other receivables | 39,506 | |
| Total assets | 1,120,382,058 | |
| Liabilities | ||
| Payable for investments purchased | $9,942,945 | |
| Payable for fund shares redeemed | 324,065 | |
| Accrued management fee | 528,878 | |
| Other affiliated payables | 199,993 | |
| Other payables and accrued expenses | 54,875 | |
| Collateral on securities loaned, at value | 4,652,253 | |
| Total liabilities | 15,703,009 | |
| Net Assets | $1,104,679,049 | |
| Net Assets consist of: | ||
| Paid in capital | $967,805,335 | |
| Undistributed net investment income | 3,671,405 | |
| Accumulated undistributed net realized gain (loss) on investments and foreign currency transactions | 53,625,048 | |
| Net unrealized appreciation (depreciation) on investments | 79,577,261 | |
| Net Assets, for 37,858,692 shares outstanding | $1,104,679,049 | |
| Net Asset Value, offering price and redemption price per share ($1,104,679,049 ÷ 37,858,692 shares) | $29.18 |
See accompanying notes which are an integral part of the financial statements.
Statement of Operations
| Six months ended August 31, 2015 (Unaudited) | ||
| Investment Income | ||
| Dividends | $8,007,628 | |
| Income from Fidelity Central Funds | 36,340 | |
| Total income | 8,043,968 | |
| Expenses | ||
| Management fee | $3,142,133 | |
| Transfer agent fees | 990,863 | |
| Accounting and security lending fees | 187,484 | |
| Custodian fees and expenses | 9,426 | |
| Independent trustees' compensation | 9,689 | |
| Registration fees | 34,423 | |
| Audit | 24,003 | |
| Legal | 7,106 | |
| Miscellaneous | 8,367 | |
| Total expenses before reductions | 4,413,494 | |
| Expense reductions | (75,063) | 4,338,431 |
| Net investment income (loss) | 3,705,537 | |
| Realized and Unrealized Gain (Loss)
Net realized gain (loss) on: | ||
| Investment securities: | ||
| Unaffiliated issuers | 56,399,563 | |
| Foreign currency transactions | (290) | |
| Total net realized gain (loss) | 56,399,273 | |
| Change in net unrealized appreciation (depreciation) on investment securities | (180,128,501) | |
| Net gain (loss) | (123,729,228) | |
| Net increase (decrease) in net assets resulting from operations | $(120,023,691) |
See accompanying notes which are an integral part of the financial statements.
Statement of Changes in Net Assets
| Six months ended August 31, 2015 (Unaudited) | Year ended February 28, 2015 | |
| Increase (Decrease) in Net Assets | ||
| Operations | ||
| Net investment income (loss) | $3,705,537 | $8,167,148 |
| Net realized gain (loss) | 56,399,273 | 133,982,514 |
| Change in net unrealized appreciation (depreciation) | (180,128,501) | (43,473,148) |
| Net increase (decrease) in net assets resulting from operations | (120,023,691) | 98,676,514 |
| Distributions to shareholders from net investment income | (837,360) | (7,771,302) |
| Distributions to shareholders from net realized gain | (11,827,701) | (120,155,720) |
| Total distributions | (12,665,061) | (127,927,022) |
| Share transactions | ||
| Proceeds from sales of shares | 195,492,794 | 664,803,726 |
| Reinvestment of distributions | 12,354,925 | 124,783,311 |
| Cost of shares redeemed | (113,169,735) | (834,778,865) |
| Net increase (decrease) in net assets resulting from share transactions | 94,677,984 | (45,191,828) |
| Redemption fees | 1,016 | 13,871 |
| Total increase (decrease) in net assets | (38,009,752) | (74,428,465) |
| Net Assets | ||
| Beginning of period | 1,142,688,801 | 1,217,117,266 |
| End of period (including undistributed net investment income of $3,671,405 and undistributed net investment income of $803,228, respectively) | $1,104,679,049 | $1,142,688,801 |
| Other Information
Shares | ||
| Sold | 6,086,762 | 20,937,925 |
| Issued in reinvestment of distributions | 382,269 | 4,000,298 |
| Redeemed | (3,561,978) | (26,111,243) |
| Net increase (decrease) | 2,907,053 | (1,173,020) |
See accompanying notes which are an integral part of the financial statements.
Financial Highlights — Industrials Portfolio
| Six months ended (Unaudited) | Years ended February 28, | |||||
| August 31, | 2015 | 2015 | 2014 | 2013 | 2012 A | 2011 |
| Selected Per–Share Data | ||||||
| Net asset value, beginning of period | $32.69 | $33.69 | $28.04 | $24.69 | $25.24 | $18.39 |
| Income from Investment Operations | ||||||
| Net investment income (loss)B | .10 | .22 | .23 | .28 | .19 | .15 |
| Net realized and unrealized gain (loss) | (3.25) | 2.44 | 7.36 | 3.54 | .01 | 6.80 |
| Total from investment operations | (3.15) | 2.66 | 7.59 | 3.82 | .20 | 6.95 |
| Distributions from net investment income | (.02) | (.23) | (.20) | (.26) | (.13) | (.10) |
| Distributions from net realized gain | (.34) | (3.43) | (1.74) | (.21) | (.62) | – |
| Total distributions | (.36) | (3.66) | (1.94) | (.47) | (.75) | (.10) |
| Redemption fees added to paid in capitalB,C | – | – | – | – | – | – |
| Net asset value, end of period | $29.18 | $32.69 | $33.69 | $28.04 | $24.69 | $25.24 |
| Total ReturnD,E | (9.73)% | 8.74% | 27.80% | 15.71% | .94% | 37.85% |
| Ratios to Average Net AssetsF,G | ||||||
| Expenses before reductions | .77%H | .78% | .81% | .85% | .87% | .90% |
| Expenses net of fee waivers, if any | .76%H | .78% | .81% | .85% | .87% | .90% |
| Expenses net of all reductions | .76%H | .78% | .81% | .84% | .86% | .90% |
| Net investment income (loss) | .65%H | .68% | .74% | 1.13% | .83% | .69% |
| Supplemental Data | ||||||
| Net assets, end of period (000 omitted) | $1,104,679 | $1,142,689 | $1,217,117 | $873,266 | $551,144 | $572,451 |
| Portfolio turnover rateI | 89%H,J | 72%J | 58% | 75% | 102% | 80% |
A For the year ended February 29.
B Calculated based on average shares outstanding during the period.
C Amount represents less than $.005 per share.
D Total returns for periods of less than one year are not annualized.
E Total returns would have been lower if certain expenses had not been reduced during the applicable periods shown.
F Fees and expenses of any underlying Fidelity Central Funds are not included in the Fund's expense ratio. The Fund indirectly bears its proportionate share of the expenses of any underlying Fidelity Central Funds.
G Expense ratios reflect operating expenses of the Fund. Expenses before reductions do not reflect amounts reimbursed by the investment adviser or reductions from brokerage service arrangements or reductions from other expense offset arrangements and do not represent the amount paid by the Fund during periods when reimbursements or reductions occur. Expenses net of fee waivers reflect expenses after reimbursement by the investment adviser but prior to reductions from brokerage service arrangements or other expense offset arrangements. Expenses net of all reductions represent the net expenses paid by the Fund.
H Annualized
I Amount does not include the portfolio activity of any underlying Fidelity Central Funds.
J Portfolio turnover rate excludes securities received or delivered in-kind.
See accompanying notes which are an integral part of the financial statements.
Transportation Portfolio
Investment Summary (Unaudited)
Top Ten Stocks as of August 31, 2015
| % of fund's net assets | % of fund's net assets 6 months ago | |
| United Parcel Service, Inc. Class B | 15.0 | 11.9 |
| Union Pacific Corp. | 14.3 | 16.9 |
| Southwest Airlines Co. | 6.4 | 3.6 |
| American Airlines Group, Inc. | 6.2 | 6.3 |
| Delta Air Lines, Inc. | 5.6 | 6.2 |
| FedEx Corp. | 5.0 | 8.0 |
| Alaska Air Group, Inc. | 4.7 | 1.1 |
| United Continental Holdings, Inc. | 3.7 | 4.5 |
| Swift Transporation Co. | 3.2 | 3.8 |
| CSX Corp. | 3.2 | 4.1 |
| 67.3 |
Top Industries (% of fund's net assets)
| As of August 31, 2015 | ||
| Road & Rail | 33.6% | |
| Airlines | 31.1% | |
| Air Freight & Logistics | 23.6% | |
| Machinery | 4.4% | |
| Oil, Gas & Consumable Fuels | 3.0% | |
| All Others* | 4.3% | |
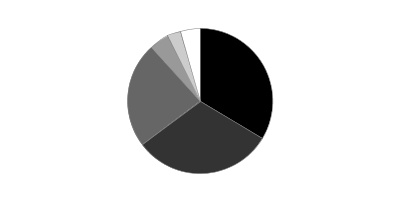
| As of February 28, 2015 | ||
| Road & Rail | 45.7% | |
| Air Freight & Logistics | 24.4% | |
| Airlines | 24.0% | |
| Machinery | 1.5% | |
| Oil, Gas & Consumable Fuels | 1.5% | |
| All Others* | 2.9% | |
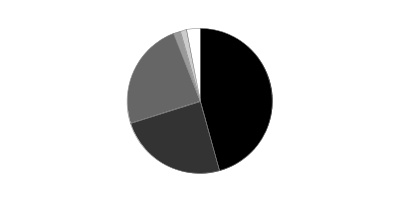
* Includes short-term investments and net other assets (liabilities).
Transportation Portfolio
Investments August 31, 2015 (Unaudited)
Showing Percentage of Net Assets
| Common Stocks - 98.5% | |||
| Shares | Value | ||
| Air Freight & Logistics - 23.6% | |||
| Air Freight & Logistics - 23.6% | |||
| Atlas Air Worldwide Holdings, Inc. (a) | 200 | $8,262 | |
| C.H. Robinson Worldwide, Inc. | 161,896 | 10,916,647 | |
| FedEx Corp. | 170,400 | 25,663,944 | |
| Forward Air Corp. | 59,100 | 2,660,682 | |
| Hub Group, Inc. Class A (a) | 18,300 | 689,727 | |
| Park-Ohio Holdings Corp. | 117,520 | 4,237,771 | |
| United Parcel Service, Inc. Class B | 792,200 | 77,358,331 | |
| UTi Worldwide, Inc. (a) | 107,800 | 767,536 | |
| 122,302,900 | |||
| Airlines - 31.1% | |||
| Airlines - 31.1% | |||
| Alaska Air Group, Inc. | 325,500 | 24,366,930 | |
| Allegiant Travel Co. | 6,300 | 1,280,538 | |
| American Airlines Group, Inc. | 815,900 | 31,803,782 | |
| Delta Air Lines, Inc. | 665,502 | 29,135,678 | |
| Republic Airways Holdings, Inc. (a) | 251,800 | 775,544 | |
| Southwest Airlines Co. | 896,200 | 32,890,540 | |
| Spirit Airlines, Inc. (a) | 293,159 | 15,024,399 | |
| United Continental Holdings, Inc. (a) | 337,936 | 19,252,214 | |
| Virgin America, Inc. (b) | 16,800 | 548,184 | |
| Wizz Air Holdings PLC (b) | 207,598 | 5,749,992 | |
| 160,827,801 | |||
| Electrical Equipment - 0.3% | |||
| Electrical Components & Equipment - 0.3% | |||
| EnerSys | 23,900 | 1,277,933 | |
| Machinery - 4.4% | |||
| Construction Machinery & Heavy Trucks - 1.8% | |||
| Supreme Industries, Inc. Class A | 1,101,646 | 9,143,662 | |
| Industrial Machinery - 2.6% | |||
| Global Brass & Copper Holdings, Inc. | 524,000 | 10,291,360 | |
| Hillenbrand, Inc. | 121,600 | 3,278,336 | |
| 13,569,696 | |||
| TOTAL MACHINERY | 22,713,358 | ||
| Marine - 0.0% | |||
| Marine - 0.0% | |||
| Diana Shipping, Inc. (a)(b) | 23,600 | 160,480 | |
| Oil, Gas & Consumable Fuels - 3.0% | |||
| Oil & Gas Storage & Transport - 3.0% | |||
| Ardmore Shipping Corp. | 197,100 | 2,211,462 | |
| Scorpio Tankers, Inc. | 1,416,233 | 13,397,564 | |
| 15,609,026 | |||
| Road & Rail - 33.6% | |||
| Railroads - 20.8% | |||
| CSX Corp. | 608,819 | 16,669,464 | |
| Genesee & Wyoming, Inc. Class A (a) | 22,100 | 1,511,198 | |
| Norfolk Southern Corp. | 195,100 | 15,200,241 | |
| Union Pacific Corp. | 861,195 | 73,838,859 | |
| 107,219,762 | |||
| Trucking - 12.8% | |||
| ArcBest Corp. | 56,900 | 1,643,272 | |
| Avis Budget Group, Inc. (a) | 199,100 | 8,786,283 | |
| Celadon Group, Inc. | 54,900 | 1,048,041 | |
| Hertz Global Holdings, Inc. (a) | 331,600 | 6,111,388 | |
| J.B. Hunt Transport Services, Inc. | 113,000 | 8,224,140 | |
| Landstar System, Inc. | 154,000 | 10,194,800 | |
| Roadrunner Transportation Systems, Inc. (a) | 181,200 | 3,928,416 | |
| Saia, Inc. (a) | 171,800 | 6,451,090 | |
| Swift Transporation Co. (a) | 864,900 | 16,856,901 | |
| Universal Truckload Services, Inc. | 29,589 | 580,832 | |
| YRC Worldwide, Inc. (a) | 147,600 | 2,466,396 | |
| 66,291,559 | |||
| TOTAL ROAD & RAIL | 173,511,321 | ||
| Transportation Infrastructure - 2.5% | |||
| Airport Services - 2.5% | |||
| Macquarie Infrastructure Co. LLC | 74,100 | 5,833,152 | |
| Wesco Aircraft Holdings, Inc. (a) | 509,424 | 7,152,313 | |
| 12,985,465 | |||
| TOTAL COMMON STOCKS | |||
| (Cost $399,777,428) | 509,388,284 | ||
| Money Market Funds - 1.2% | |||
| Fidelity Cash Central Fund, 0.15% (c) | 5,640,588 | 5,640,588 | |
| Fidelity Securities Lending Cash Central Fund, 0.19% (c)(d) | 673,110 | 673,110 | |
| TOTAL MONEY MARKET FUNDS | |||
| (Cost $6,313,698) | 6,313,698 | ||
| TOTAL INVESTMENT PORTFOLIO - 99.7% | |||
| (Cost $406,091,126) | 515,701,982 | ||
| NET OTHER ASSETS (LIABILITIES) - 0.3% | 1,498,761 | ||
| NET ASSETS - 100% | $517,200,743 |
Legend
(a) Non-income producing
(b) Security or a portion of the security is on loan at period end.
(c) Affiliated fund that is generally available only to investment companies and other accounts managed by Fidelity Investments. The rate quoted is the annualized seven-day yield of the fund at period end. A complete unaudited listing of the fund's holdings as of its most recent quarter end is available upon request. In addition, each Fidelity Central Fund's financial statements are available on the SEC's website or upon request.
(d) Investment made with cash collateral received from securities on loan.
Affiliated Central Funds
Information regarding fiscal year to date income earned by the Fund from investments in Fidelity Central Funds is as follows:
| Fund | Income earned |
| Fidelity Cash Central Fund | $6,276 |
| Fidelity Securities Lending Cash Central Fund | 5,940 |
| Total | $12,216 |
Investment Valuation
All investments are categorized as Level 1 under the Fair Value Hierarchy. The inputs or methodology used for valuing securities may not be an indication of the risk associated with investing in those securities. For more information on valuation inputs please refer to the Investment Valuation section in the accompanying Notes to Financial Statements.
See accompanying notes which are an integral part of the financial statements.
Transportation Portfolio
Financial Statements
Statement of Assets and Liabilities
| August 31, 2015 (Unaudited) | ||
| Assets | ||
| Investment in securities, at value (including securities loaned of $647,331) — See accompanying schedule: Unaffiliated issuers (cost $399,777,428) | $509,388,284 | |
| Fidelity Central Funds (cost $6,313,698) | 6,313,698 | |
| Total Investments (cost $406,091,126) | $515,701,982 | |
| Receivable for investments sold | 25,852,921 | |
| Receivable for fund shares sold | 558,893 | |
| Dividends receivable | 1,568,386 | |
| Distributions receivable from Fidelity Central Funds | 2,231 | |
| Prepaid expenses | 4,291 | |
| Other receivables | 25,663 | |
| Total assets | 543,714,367 | |
| Liabilities | ||
| Payable for investments purchased | $24,398,812 | |
| Payable for fund shares redeemed | 1,044,498 | |
| Accrued management fee | 255,093 | |
| Other affiliated payables | 119,332 | |
| Other payables and accrued expenses | 22,779 | |
| Collateral on securities loaned, at value | 673,110 | |
| Total liabilities | 26,513,624 | |
| Net Assets | $517,200,743 | |
| Net Assets consist of: | ||
| Paid in capital | $401,588,365 | |
| Undistributed net investment income | 1,965,060 | |
| Accumulated undistributed net realized gain (loss) on investments and foreign currency transactions | 4,036,462 | |
| Net unrealized appreciation (depreciation) on investments | 109,610,856 | |
| Net Assets, for 6,416,115 shares outstanding | $517,200,743 | |
| Net Asset Value, offering price and redemption price per share ($517,200,743 ÷ 6,416,115 shares) | $80.61 |
See accompanying notes which are an integral part of the financial statements.
Statement of Operations
| Six months ended August 31, 2015 (Unaudited) | ||
| Investment Income | ||
| Dividends | $4,938,631 | |
| Income from Fidelity Central Funds | 12,216 | |
| Total income | 4,950,847 | |
| Expenses | ||
| Management fee | $2,085,476 | |
| Transfer agent fees | 747,073 | |
| Accounting and security lending fees | 133,717 | |
| Custodian fees and expenses | 11,877 | |
| Independent trustees' compensation | 7,582 | |
| Registration fees | 60,665 | |
| Audit | 27,765 | |
| Legal | 6,790 | |
| Interest | 1,414 | |
| Miscellaneous | 4,637 | |
| Total expenses before reductions | 3,086,996 | |
| Expense reductions | (102,169) | 2,984,827 |
| Net investment income (loss) | 1,966,020 | |
| Realized and Unrealized Gain (Loss)
Net realized gain (loss) on: | ||
| Investment securities: | ||
| Unaffiliated issuers | 8,654,284 | |
| Foreign currency transactions | (716) | |
| Total net realized gain (loss) | 8,653,568 | |
| Change in net unrealized appreciation (depreciation) on: Investment securities | (125,292,280) | |
| Assets and liabilities in foreign currencies | (221) | |
| Total change in net unrealized appreciation (depreciation) | (125,292,501) | |
| Net gain (loss) | (116,638,933) | |
| Net increase (decrease) in net assets resulting from operations | $(114,672,913) |
See accompanying notes which are an integral part of the financial statements.
Statement of Changes in Net Assets
| Six months ended August 31, 2015 (Unaudited) | Year ended February 28, 2015 | |
| Increase (Decrease) in Net Assets | ||
| Operations | ||
| Net investment income (loss) | $1,966,020 | $4,091,540 |
| Net realized gain (loss) | 8,653,568 | 52,700,425 |
| Change in net unrealized appreciation (depreciation) | (125,292,501) | 100,902,601 |
| Net increase (decrease) in net assets resulting from operations | (114,672,913) | 157,694,566 |
| Distributions to shareholders from net investment income | (892,221) | (3,343,267) |
| Distributions to shareholders from net realized gain | (5,434,438) | (18,761,701) |
| Total distributions | (6,326,659) | (22,104,968) |
| Share transactions | ||
| Proceeds from sales of shares | 73,735,735 | 1,069,242,761 |
| Reinvestment of distributions | 6,078,661 | 21,308,776 |
| Cost of shares redeemed | (588,261,855) | (529,854,123) |
| Net increase (decrease) in net assets resulting from share transactions | (508,447,459) | 560,697,414 |
| Redemption fees | 14,323 | 109,874 |
| Total increase (decrease) in net assets | (629,432,708) | 696,396,886 |
| Net Assets | ||
| Beginning of period | 1,146,633,451 | 450,236,565 |
| End of period (including undistributed net investment income of $1,965,060 and undistributed net investment income of $891,261, respectively) | $517,200,743 | $1,146,633,451 |
| Other Information
Shares | ||
| Sold | 827,993 | 12,116,354 |
| Issued in reinvestment of distributions | 68,062 | 244,789 |
| Redeemed | (6,672,603) | (6,070,754) |
| Net increase (decrease) | (5,776,548) | 6,290,389 |
See accompanying notes which are an integral part of the financial statements.
Financial Highlights — Transportation Portfolio
| Six months ended (Unaudited) | Years ended February 28, | |||||
| August 31, | 2015 | 2015 | 2014 | 2013 | 2012 A | 2011 |
| Selected Per–Share Data | ||||||
| Net asset value, beginning of period | $94.04 | $76.28 | $57.75 | $53.02 | $56.26 | $42.01 |
| Income from Investment Operations | ||||||
| Net investment income (loss)B | .23 | .46 | .45 | .51 | .26 | .27 |
| Net realized and unrealized gain (loss) | (13.04) | 19.67 | 20.44 | 7.59 | (.34) | 14.13 |
| Total from investment operations | (12.81) | 20.13 | 20.89 | 8.10 | (.08) | 14.40 |
| Distributions from net investment income | (.09) | (.34) | (.27) | (.41) | (.17) | (.17) |
| Distributions from net realized gain | (.54) | (2.04) | (2.09) | (2.96) | (2.99) | – |
| Total distributions | (.62)C | (2.38) | (2.36) | (3.37) | (3.16) | (.17) |
| Redemption fees added to paid in capitalB | –D | .01 | –D | –D | – | .02 |
| Net asset value, end of period | $80.61 | $94.04 | $76.28 | $57.75 | $53.02 | $56.26 |
| Total ReturnE,F | (13.68)% | 26.80% | 36.60% | 16.10% | .16% | 34.32% |
| Ratios to Average Net AssetsG,H | ||||||
| Expenses before reductions | .81%I | .81% | .85% | .89% | .88% | .90% |
| Expenses net of fee waivers, if any | .81%I | .81% | .85% | .89% | .88% | .90% |
| Expenses net of all reductions | .78%I | .81% | .84% | .86% | .87% | .90% |
| Net investment income (loss) | .52%I | .53% | .68% | .98% | .49% | .53% |
| Supplemental Data | ||||||
| Net assets, end of period (000 omitted) | $517,201 | $1,146,633 | $450,237 | $212,956 | $212,647 | $467,230 |
| Portfolio turnover rateJ | 56%I | 72%K | 78% | 47% | 82% | 114% |
A For the year ended February 29.
B Calculated based on average shares outstanding during the period.
C Total distributions of $.62 per share is comprised of distributions from net investment income of $.088 and distributions from net realized gain of $.536 per share.
D Amount represents less than $.005 per share.
E Total returns for periods of less than one year are not annualized.
F Total returns would have been lower if certain expenses had not been reduced during the applicable periods shown.
G Fees and expenses of any underlying Fidelity Central Funds are not included in the Fund's expense ratio. The Fund indirectly bears its proportionate share of the expenses of any underlying Fidelity Central Funds.
H Expense ratios reflect operating expenses of the Fund. Expenses before reductions do not reflect amounts reimbursed by the investment adviser or reductions from brokerage service arrangements or reductions from other expense offset arrangements and do not represent the amount paid by the Fund during periods when reimbursements or reductions occur. Expenses net of fee waivers reflect expenses after reimbursement by the investment adviser but prior to reductions from brokerage service arrangements or other expense offset arrangements. Expenses net of all reductions represent the net expenses paid by the Fund.
I Annualized
J Amount does not include the portfolio activity of any underlying Fidelity Central Funds.
K Portfolio turnover rate excludes securities received or delivered in-kind.
See accompanying notes which are an integral part of the financial statements.
Notes to Financial Statements (Unaudited)
For the period ended August 31, 2015
1. Organization.
Air Transportation Portfolio, Defense and Aerospace Portfolio, Environment and Alternative Energy Portfolio, Industrial Equipment Portfolio, Industrials Portfolio, and Transportation Portfolio (the Funds) are non-diversified funds of Fidelity Select Portfolios (the Trust). The Trust is registered under the Investment Company Act of 1940, as amended (the 1940 Act), as an open-end management investment company organized as a Massachusetts business trust. The Funds invest primarily in securities of companies whose principal business activities fall within specific industries. Each Fund is authorized to issue an unlimited number of shares. Share transactions on the Statement of Changes in Net Assets may contain exchanges between funds.
2. Investments in Fidelity Central Funds.
The Funds invest in Fidelity Central Funds, which are open-end investment companies generally available only to other investment companies and accounts managed by the investment adviser and its affiliates. The Funds' Schedules of Investments list each of the Fidelity Central Funds held as of period end, if any, as an investment of each Fund, but does not include the underlying holdings of each Fidelity Central Fund. As an Investing Fund, each Fund indirectly bears its proportionate share of the expenses of the underlying Fidelity Central Funds.
The Money Market Central Funds seek preservation of capital and current income and are managed by Fidelity Investments Money Management, Inc. (FIMM), an affiliate of the investment adviser. Annualized expenses of the Money Market Central Funds as of their most recent shareholder report date are less than .01%.
A complete unaudited list of holdings for each Fidelity Central Fund is available upon request or at the Securities and Exchange Commission (the SEC) website at www.sec.gov. In addition, the financial statements of the Fidelity Central Funds are available on the SEC website or upon request.
3. Significant Accounting Policies.
The financial statements have been prepared in conformity with accounting principles generally accepted in the United States of America (GAAP), which require management to make certain estimates and assumptions at the date of the financial statements. Actual results could differ from those estimates. Subsequent events, if any, through the date that the financial statements were issued have been evaluated in the preparation of the financial statements. The following summarizes the significant accounting policies of the Funds:
Investment Valuation. Investments are valued as of 4:00 p.m. Eastern time on the last calendar day of the period. The Board of Trustees (the Board) has delegated the day to day responsibility for the valuation of each Fund's investments to the Fidelity SelectCo, LLC (SelectCo) Fair Value Committee (the Committee). In accordance with valuation policies and procedures approved by the Board, each Fund attempts to obtain prices from one or more third party pricing vendors or brokers to value its investments. When current market prices, quotations or currency exchange rates are not readily available or reliable, investments will be fair valued in good faith by the Committee, in accordance with procedures adopted by the Board. Factors used in determining fair value vary by investment type and may include market or investment specific events. The frequency with which these procedures are used cannot be predicted and they may be utilized to a significant extent. The Committee oversees each Fund's valuation policies and procedures and reports to the Board on the Committee's activities and fair value determinations. The Board monitors the appropriateness of the procedures used in valuing each Fund's investments and ratifies the fair value determinations of the Committee.
Each Fund categorizes the inputs to valuation techniques used to value its investments into a disclosure hierarchy consisting of three levels as shown below:
- Level 1 – quoted prices in active markets for identical investments
- Level 2 – other significant observable inputs (including quoted prices for similar investments, interest rates, prepayment speeds, etc.)
- Level 3 – unobservable inputs (including the Fund's own assumptions based on the best information available)
Valuation techniques used to value each Fund's investments by major category are as follows:
Equity securities, including restricted securities, for which market quotations are readily available, are valued at the last reported sale price or official closing price as reported by a third party pricing vendor on the primary market or exchange on which they are traded and are categorized as Level 1 in the hierarchy. In the event there were no sales during the day or closing prices are not available, securities are valued at the last quoted bid price or may be valued using the last available price and are generally categorized as Level 2 in the hierarchy. For foreign equity securities, when market or security specific events arise, comparisons to the valuation of American Depositary Receipts (ADRs), futures contracts, Exchange-Traded Funds (ETFs) and certain indexes as well as quoted prices for similar securities may be used and would be categorized as Level 2 in the hierarchy. Utilizing these techniques may result in transfers between Level 1 and Level 2. For equity securities, including restricted securities, where observable inputs are limited, assumptions about market activity and risk are used and these securities may be categorized as Level 3 in the hierarchy.
Investments in open-end mutual funds, including the Fidelity Central Funds, are valued at their closing net asset value (NAV) each business day and are categorized as Level 1 in the hierarchy.
Changes in valuation techniques may result in transfers in or out of an assigned level within the disclosure hierarchy.
Foreign Currency. The Funds may use foreign currency contracts to facilitate transactions in foreign-denominated securities. Gains and losses from these transactions may arise from changes in the value of the foreign currency or if the counterparties do not perform under the contracts' terms.
Foreign-denominated assets, including investment securities, and liabilities are translated into U.S. dollars at the exchange rates at period end. Purchases and sales of investment securities, income and dividends received and expenses denominated in foreign currencies are translated into U.S. dollars at the exchange rate in effect on the transaction date.
The effects of exchange rate fluctuations on investments are included with the net realized and unrealized gain (loss) on investment securities. Other foreign currency transactions resulting in realized and unrealized gain (loss) are disclosed separately.
Investment Transactions and Income. For financial reporting purposes, the Funds' investment holdings and NAV include trades executed through the end of the last business day of the period. The NAV per share for processing shareholder transactions is calculated as of the close of business of the New York Stock Exchange (NYSE), normally 4:00 p.m. Eastern time and includes trades executed through the end of the prior business day. Gains and losses on securities sold are determined on the basis of identified cost and may include proceeds received from litigation. Dividend income is recorded on the ex-dividend date, except for certain dividends from foreign securities where the ex-dividend date may have passed, which are recorded as soon as the Funds are informed of the ex-dividend date. Non-cash dividends included in dividend income, if any, are recorded at the fair market value of the securities received. Income and capital gain distributions from Fidelity Central Funds, if any, are recorded on the ex-dividend date. Distributions received on securities that represent a return of capital or capital gain are recorded as a reduction of cost of investments and/or as a realized gain. Subsequent to ex-dividend date the Funds determine the components of these distributions, based upon receipt of tax filings or other correspondence relating to the underlying investment. Investment income is recorded net of foreign taxes withheld where recovery of such taxes is uncertain.
Expenses. Expenses directly attributable to a fund are charged to that fund. Expenses attributable to more than one fund are allocated among the respective funds on the basis of relative net assets or other appropriate methods. Expense estimates are accrued in the period to which they relate and adjustments are made when actual amounts are known.
Deferred Trustee Compensation. Under a Deferred Compensation Plan (the Plan) for Defense and Aerospace Portfolio, independent Trustees may elect to defer receipt of a portion of their annual compensation. Deferred amounts are invested in a cross-section of Fidelity funds, are marked-to-market and remain in the Fund until distributed in accordance with the Plan. The investment of deferred amounts and the offsetting payable to the Trustees are included in the accompanying Statement of Assets and Liabilities.
Income Tax Information and Distributions to Shareholders. Each year, each Fund intends to qualify as a regulated investment company under Subchapter M of the Internal Revenue Code, including distributing substantially all of its taxable income and realized gains. As a result, no provision for U.S. Federal income taxes is required. Each Fund files a U.S. federal tax return, in addition to state and local tax returns as required. Each Fund's federal income tax returns are subject to examination by the Internal Revenue Service (IRS) for a period of three fiscal years after they are filed. State and local tax returns may be subject to examination for an additional fiscal year depending on the jurisdiction. Foreign taxes are provided for based on each Fund's understanding of the tax rules and rates that exist in the foreign markets in which it invests.
Distributions are declared and recorded on the ex-dividend date. Income and capital gain distributions are determined in accordance with income tax regulations, which may differ from GAAP.
Capital accounts within the financial statements are adjusted for permanent book-tax differences. These adjustments have no impact on net assets or the results of operations. Capital accounts are not adjusted for temporary book-tax differences which will reverse in a subsequent period.
Book-tax differences are primarily due to foreign currency transactions, certain foreign taxes, market discount, redemptions in kind, passive foreign investment companies (PFIC), deferred trustees compensation, original issue discount, capital loss carryforwards and losses deferred due to wash sales.
The federal tax cost of investment securities and unrealized appreciation (depreciation) as of period end were as follows for each Fund:
| Tax cost | Gross unrealized appreciation | Gross unrealized depreciation | Net unrealized appreciation (depreciation) on securities | |
| Air Transportation Portfolio | $309,964,705 | $70,425,544 | $(22,781,188) | $47,644,356 |
| Defense and Aerospace Portfolio | 597,566,140 | 228,353,765 | (21,584,486) | 206,769,279 |
| Environment and Alternative Energy Portfolio | 80,739,578 | 3,565,652 | (6,511,241) | (2,945,589) |
| Industrial Equipment Portfolio | 105,949,137 | 12,146,850 | (6,442,225) | 5,704,625 |
| Industrials Portfolio | 1,025,456,229 | 130,571,129 | (53,187,463) | 77,383,666 |
| Transportation Portfolio | 407,237,482 | 121,074,363 | (12,609,863) | 108,464,500 |
Trading (Redemption) Fees. Shares held by investors in the Funds less than 30 days may be subject to a redemption fee equal to .75% of the NAV of shares redeemed. All redemption fees, which reduce the proceeds of the shareholder redemption, are retained by the Funds and accounted for as an addition to paid in capital.
4. Purchases and Sales of Investments.
Purchases and sales of securities, other than short-term securities and in-kind transactions, are noted in the table below.
| Purchases ($) | Sales ($) | |
| Air Transportation Portfolio | 192,844,688 | 508,684,126 |
| Defense and Aerospace Portfolio | 173,661,797 | 168,160,661 |
| Environment and Alternative Energy Portfolio | 6,670,704 | 11,579,594 |
| Industrial Equipment Portfolio | 51,909,726 | 68,409,999 |
| Industrials Portfolio | 495,747,573 | 517,954,647 |
| Transportation Portfolio | 211,973,440 | 717,453,447 |
Redemptions In-Kind. During the period, 2,554,993 shares of the Industrial Equipment Portfolio held by an unaffiliated entity were redeemed for cash and investments with a value of $96,042,190. The net realized gain of $25,749,250 on investments delivered through in-kind redemptions is included in the accompanying Statement of Operations. The amount of in-kind redemptions is included in share transactions in the accompanying Statement of Changes in Net Assets. The Industrial Equipment Portfolio recognized no gain or loss for federal income tax purposes.
Exchanges In-Kind. Cash and investments received in-kind through subscriptions totaled $96,022,017 in exchange for 2,963,642 shares of the Industrials Portfolio. The amount of in-kind exchanges is included in share transactions in the accompanying Statement of Changes in Net Assets. The Industrials Portfolio recognized no gain or loss for federal income tax purposes.
5. Fees and Other Transactions with Affiliates.
Management Fee. Fidelity SelectCo, LLC (the investment adviser) and its affiliates provide the Funds with investment management related services for which the Funds pay a monthly management fee. The management fee is the sum of an individual fund fee rate and an annualized group fee rate. The individual fund fee rate is applied to each Fund's average net assets. The group fee rate is based upon the average net assets of all the mutual funds advised by Fidelity Management & Research Company (FMR) and the investment adviser. The group fee rate decreases as assets under management increase and increases as assets under management decrease. For the reporting period, each Fund's annualized management fee rate expressed as a percentage of each Fund's average net assets was as follows.
| Individual Rate | Group Rate | Total | |
| Air Transportation Portfolio | .30% | .25% | .55% |
| Defense and Aerospace Portfolio | .30% | .25% | .55% |
| Environment and Alternative Energy Portfolio | .30% | .25% | .55% |
| Industrial Equipment Portfolio | .30% | .25% | .55% |
| Industrials Portfolio | .30% | .25% | .55% |
| Transportation Portfolio | .30% | .25% | .55% |
Transfer Agent Fees. Fidelity Investments Institutional Operations Company, Inc. (FIIOC), an affiliate of the investment adviser, is the Funds' transfer, dividend disbursing and shareholder servicing agent. FIIOC receives account fees and asset-based fees that vary according to account size and type of account. FIIOC pays for typesetting, printing and mailing of shareholder reports, except proxy statements. For the period, transfer agent fees were equivalent to the following annualized rates expressed as a percentage of average net assets:
| Air Transportation Portfolio | .21% |
| Defense and Aerospace Portfolio | .19% |
| Environment and Alternative Energy Portfolio | .27% |
| Industrial Equipment Portfolio | .19% |
| Industrials Portfolio | .17% |
| Transportation Portfolio | .20% |
Accounting and Security Lending Fees. Fidelity Service Company, Inc. (FSC), an affiliate of the investment adviser, maintains each Fund's accounting records. The accounting fee is based on the level of average net assets for each month. Under a separate contract, FSC administers the security lending program. The security lending fee is based on the number and duration of lending transactions.
Brokerage Commissions. Certain Funds placed a portion of their portfolio transactions with brokerage firms which are affiliates of the investment adviser. Brokerage commissions are included in net realized gain (loss) and change in net unrealized appreciation (depreciation) in the Statement of Operations. The commissions paid to these affiliated firms were as follows:
| Amount | |
| Air Transportation Portfolio | $7,957 |
| Defense and Aerospace Portfolio | 2,027 |
| Environment and Alternative Energy Portfolio | 138 |
| Industrial Equipment Portfolio | 2,263 |
| Industrials Portfolio | 8,760 |
| Transportation Portfolio | 13,068 |
Interfund Lending Program. Pursuant to an Exemptive Order issued by the SEC, the Funds, along with other registered investment companies having management contracts with Fidelity Management & Research Company (FMR) or other affiliated entities of FMR, may participate in an interfund lending program. This program provides an alternative credit facility allowing the funds to borrow from, or lend money to, other participating affiliated funds. At period end, there were no interfund loans outstanding. Each applicable fund's activity in this program during the period for which loans were outstanding was as follows:
| Borrower or Lender | Average Loan Balance | Weighted Average Interest Rate | Interest Expense | |
| Air Transportation Portfolio | Borrower | $6,446,000 | .36% | $191 |
| Defense and Aerospace Portfolio | Borrower | 9,791,000 | .35% | 1,346 |
| Transportation Portfolio | Borrower | 9,593,267 | .35% | 1,414 |
Other. During the period, the investment adviser reimbursed Air Transportation Portfolio for certain losses in the amount of $7,333.
6. Committed Line of Credit.
Certain Funds participate with other funds managed by the investment adviser or an affiliate in a $4.25 billion credit facility (the "line of credit") to be utilized for temporary or emergency purposes to fund shareholder redemptions or for other short-term liquidity purposes. The participating funds have agreed to pay commitment fees on their pro-rata portion of the line of credit, which are reflected in Miscellaneous expenses on the Statement of Operations, and are as follows:
| Air Transportation Portfolio | $480 |
| Defense and Aerospace Portfolio | 701 |
| Environment and Alternative Energy Portfolio | 67 |
| Industrial Equipment Portfolio | 165 |
| Industrials Portfolio | 869 |
| Transportation Portfolio | 773 |
During the period, the Funds did not borrow on this line of credit.
7. Security Lending.
Certain Funds lend portfolio securities through a lending agent from time to time in order to earn additional income. On the settlement date of the loan, each applicable Fund receives collateral (in the form of U.S. Treasury obligations, letters of credit and/or cash) against the loaned securities and maintains collateral in an amount not less than 100% of the market value of the loaned securities during the period of the loan. The market value of the loaned securities is determined at the close of business of the Funds and any additional required collateral is delivered to the Funds on the next business day. If the borrower defaults on its obligation to return the securities loaned because of insolvency or other reasons, the Funds may apply collateral received from the borrower against the obligation. The Funds may experience delays and costs in recovering the securities loaned. Any cash collateral received is invested in the Fidelity Securities Lending Cash Central Fund. The value of loaned securities and cash collateral at period end are disclosed on each applicable Fund's Statement of Assets and Liabilities. Security lending income represents the income earned on investing cash collateral, less rebates paid to borrowers and any lending agent fees associated with the loan, plus any premium payments received for lending certain types of securities. Security lending income is presented on each applicable Fund's Statement of Operations as a component of income from Fidelity Central Funds. Security lending activity was as follows:
| Total Security Lending Income | |
| Air Transportation Portfolio | $10,046 |
| Defense and Aerospace Portfolio | 13,145 |
| Environment and Alternative Energy Portfolio | 11,518 |
| Industrial Equipment Portfolio | 13,362 |
| Industrials Portfolio | 24,053 |
| Transportation Portfolio | 5,940 |
8. Expense Reductions.
Commissions paid to certain brokers with whom the investment adviser, or its affiliates, places trades on behalf of Certain Funds include an amount in addition to trade execution, which may be rebated back to the Funds to offset certain expenses. In addition, through arrangements with each applicable Fund's custodian and transfer agent, credits realized as a result of uninvested cash balances were used to reduce each applicable Fund's expenses. All of the applicable expense reductions are noted in the table below.
| Brokerage Service reduction | Custody expense reduction |
|
| Air Transportation Portfolio | $27,345 | $6 |
| Defense and Aerospace Portfolio | 17,684 | – |
| Environment and Alternative Energy Portfolio | 924 | – |
| Industrial Equipment Portfolio | 8,460 | – |
| Industrials Portfolio | 44,358 | – |
| Transportation Portfolio | 85,408 | 171 |
In addition, during the period the investment adviser reimbursed and/or waived a portion of operating expenses as follows:
| Amount | |
| Air Transportation Portfolio | $10,281 |
| Defense and Aerospace Portfolio | 23,308 |
| Environment and Alternative Energy Portfolio | 2,091 |
| Industrial Equipment Portfolio | 8,542 |
| Industrials Portfolio | 30,705 |
| Transportation Portfolio | 16,590 |
9. Other.
The Funds' organizational documents provide former and current trustees and officers with a limited indemnification against liabilities arising in connection with the performance of their duties to the Funds. In the normal course of business, the Funds may also enter into contracts that provide general indemnifications. The Funds' maximum exposure under these arrangements is unknown as this would be dependent on future claims that may be made against the Funds. The risk of material loss from such claims is considered remote.
At the end of the period, the following mutual funds managed by the investment adviser or its affiliates were the owners of record of 10% or more of the total outstanding shares of the following funds:
| VIP FundsManager 50% Portfolio | VIP FundsManager 60% Portfolio | Strategic Advisers Core Fund | |
| Industrial Equipment Portfolio | 17% | 32% | – |
| Industrials Portfolio | – | 15% | 24% |
Mutual funds managed by the investment adviser or its affiliates, in aggregate, were the owners of record of more than 20% of the total outstanding shares of the following funds:
| % of shares held | |
| Industrial Equipment Portfolio | 49% |
| Industrials Portfolio | 54% |
Shareholder Expense Example
As a shareholder of the Fund, you incur two types of costs: (1) transaction costs, including redemption fees and (2) ongoing costs, including management fees and other Fund expenses. This Example is intended to help you understand your ongoing costs (in dollars) of investing in the Fund and to compare these costs with the ongoing costs of investing in other mutual funds.
The Example is based on an investment of $1,000 invested at the beginning of the period and held for the entire period (March 1, 2015 to August 31, 2015).
Actual Expenses
The first line of the accompanying table for each fund provides information about actual account values and actual expenses. You may use the information in this line, together with the amount you invested, to estimate the expenses that you paid over the period. Simply divide your account value by $1,000.00 (for example, an $8,600 account value divided by $1,000.00 = 8.6), then multiply the result by the number in the first line under the heading entitled "Expenses Paid During Period" to estimate the expenses you paid on your account during this period. A small balance maintenance fee of $12.00 that is charged once a year may apply for certain accounts with a value of less than $2,000. This fee is not included in the table below. If it was, the estimate of expenses you paid during the period would be higher, and your ending account value lower, by this amount. In addition, the Fund, as a shareholder in the underlying Fidelity Central Funds, will indirectly bear its pro-rata share of the fees and expenses incurred by the underlying Fidelity Central Funds. These fees and expenses are not included in the Fund's annualized expense ratio used to calculate the expense estimate in the table below.
Hypothetical Example for Comparison Purposes
The second line of the accompanying table provides information about hypothetical account values and hypothetical expenses based on the Fund's actual expense ratio and an assumed rate of return of 5% per year before expenses, which is not the Fund's actual return. The hypothetical account values and expenses may not be used to estimate the actual ending account balance or expenses you paid for the period. You may use this information to compare the ongoing costs of investing in the Fund and other funds. To do so, compare this 5% hypothetical example with the 5% hypothetical examples that appear in the shareholder reports of the other funds. A small balance maintenance fee of $12.00 that is charged once a year may apply for certain accounts with a value of less than $2,000. This fee is not included in the table below. If it was, the estimate of expenses you paid during the period would be higher, and your ending account value lower, by this amount. In addition, the Fund, as a shareholder in the underlying Fidelity Central Funds, will indirectly bear its pro-rata share of the fees and expenses incurred by the underlying Fidelity Central Funds. These fees and expenses are not included in the Fund's annualized expense ratio used to calculate the expense estimate in the table below.
Please note that the expenses shown in the table are meant to highlight your ongoing costs only and do not reflect any transaction costs. Therefore, the second line of the table is useful in comparing ongoing costs only, and will not help you determine the relative total costs of owning different funds. In addition, if these transactional costs were included, your costs would have been higher.
| Annualized Expense Ratio-A | Beginning Account Value March 1, 2015 | Ending Account Value August 31, 2015 | Expenses Paid During Period-B March 1, 2015 to August 31, 2015 |
|
| Air Transportation Portfolio | .83% | |||
| Actual | $1,000.00 | $914.60 | $3.99 | |
| Hypothetical-C | $1,000.00 | $1,020.96 | $4.22 | |
| Defense and Aerospace Portfolio | .79% | |||
| Actual | $1,000.00 | $889.80 | $3.75 | |
| Hypothetical-C | $1,000.00 | $1,021.17 | $4.01 | |
| Environment and Alternative Energy Portfolio | .96% | |||
| Actual | $1,000.00 | $910.70 | $4.61 | |
| Hypothetical-C | $1,000.00 | $1,020.31 | $4.88 | |
| Industrial Equipment Portfolio | .82% | |||
| Actual | $1,000.00 | $916.10 | $3.95 | |
| Hypothetical-C | $1,000.00 | $1,021.01 | $4.17 | |
| Industrials Portfolio | .76% | |||
| Actual | $1,000.00 | $902.70 | $3.63 | |
| Hypothetical-C | $1,000.00 | $1,021.32 | $3.86 | |
| Transportation Portfolio | .81% | |||
| Actual | $1,000.00 | $863.20 | $3.79 | |
| Hypothetical-C | $1,000.00 | $1,021.06 | $4.12 |
A Annualized expense ratio reflects expenses net of applicable fee waivers.
B Expenses are equal to each Fund's annualized expense ratio, multiplied by the average account value over the period, multiplied by 184/366 (to reflect the one-half year period).
C 5% return per year before expenses
![]()
SELCI-SANN-1015
1.813660.110
|
Fidelity® Select Portfolios® Biotechnology Portfolio Health Care Portfolio Medical Delivery Portfolio Medical Equipment and Systems Portfolio Pharmaceuticals Portfolio Semi-Annual Report August 31, 2015 |
|
|
Contents
|
Biotechnology Portfolio |
|
|
Health Care Portfolio |
|
|
Medical Delivery Portfolio |
|
|
Medical Equipment and Systems Portfolio |
|
|
Pharmaceuticals Portfolio |
|
To view a fund's proxy voting guidelines and proxy voting record for the 12-month period ended June 30, visit http://www.fidelity.com/proxyvotingresults or visit the Securities and Exchange Commission's (SEC) web site at http://www.sec.gov.
You may also call 1-800-544-8544 to request a free copy of the proxy voting guidelines.
Standard & Poor's, S&P and S&P 500 are registered service marks of The McGraw-Hill Companies, Inc. and have been licensed for use by Fidelity Distributors Corporation.
Other third-party marks appearing herein are the property of their respective owners.
All other marks appearing herein are registered or unregistered trademarks or service marks of FMR LLC or an affiliated company. © 2015 FMR LLC. All rights reserved.
This report and the financial statements contained herein are submitted for the general information of the shareholders of the Funds. This report is not authorized for distribution to prospective investors in the Funds unless preceded or accompanied by an effective prospectus.
A fund files its complete schedule of portfolio holdings with the SEC for the first and third quarters of each fiscal year on Form N-Q. Forms N-Q are available on the SEC’s web site at http://www.sec.gov. A fund's Forms N-Q may be reviewed and copied at the SEC’s Public Reference Room in Washington, DC. Information regarding the operation of the SEC's Public Reference Room may be obtained by calling 1-800-SEC-0330.
For a complete list of a fund's portfolio holdings, view the most recent holdings listing, semiannual report, or annual report on Fidelity's web site at http://www.fidelity.com, http://www.advisor.fidelity.com, or http://www.401k.com, as applicable.
NOT FDIC INSURED •MAY LOSE VALUE •NO BANK GUARANTEE
Neither the Funds nor Fidelity Distributors Corporation is a bank.
Biotechnology Portfolio
Investment Summary (Unaudited)
Top Ten Stocks as of August 31, 2015
| % of fund's net assets | % of fund's net assets 6 months ago | |
| Gilead Sciences, Inc. | 6.8 | 7.9 |
| Biogen, Inc. | 6.3 | 7.0 |
| Regeneron Pharmaceuticals, Inc. | 4.9 | 3.5 |
| Alexion Pharmaceuticals, Inc. | 4.6 | 3.7 |
| Celgene Corp. | 4.6 | 6.1 |
| BioMarin Pharmaceutical, Inc. | 4.2 | 2.4 |
| Vertex Pharmaceuticals, Inc. | 4.1 | 4.3 |
| Incyte Corp. | 2.6 | 1.8 |
| Anacor Pharmaceuticals, Inc. | 2.1 | 0.4 |
| Medivation, Inc. | 1.7 | 2.3 |
| 41.9 |
Top Industries (% of fund's net assets)
| As of August 31, 2015 | ||
| Biotechnology | 89.8% | |
| Pharmaceuticals | 9.7% | |
| Health Care Equipment & Supplies | 0.2% | |
| Life Sciences Tools & Services | 0.1% | |
| All Others* | 0.2% | |

| As of February 28, 2015 | ||
| Biotechnology | 93.0% | |
| Pharmaceuticals | 6.3% | |
| Health Care Equipment & Supplies | 0.3% | |
| Life Sciences Tools & Services | 0.1% | |
| All Others* | 0.3% | |

* Includes short-term investments and net other assets (liabilities).
Biotechnology Portfolio
Investments August 31, 2015 (Unaudited)
Showing Percentage of Net Assets
| Common Stocks - 98.1% | |||
| Shares | Value | ||
| Biotechnology - 88.8% | |||
| Biotechnology - 88.8% | |||
| ACADIA Pharmaceuticals, Inc. (a)(b) | 4,556,464 | $166,903,276 | |
| Acceleron Pharma, Inc. (a)(b)(c) | 3,222,920 | 93,400,222 | |
| Achillion Pharmaceuticals, Inc. (a)(b)(c) | 7,229,800 | 53,428,222 | |
| Acorda Therapeutics, Inc. (a)(b)(c) | 3,750,211 | 119,894,246 | |
| Actelion Ltd. | 438,353 | 59,858,890 | |
| Adamas Pharmaceuticals, Inc. (a)(c) | 1,831,533 | 36,740,552 | |
| Adaptimmune Therapeutics PLC sponsored ADR (b) | 2,468,330 | 27,052,897 | |
| ADMA Biologics, Inc. (a) | 372,800 | 3,440,944 | |
| Aduro Biotech, Inc. (b) | 988,715 | 19,141,522 | |
| Aduro Biotech, Inc. | 1,711,378 | 29,819,050 | |
| Aegerion Pharmaceuticals, Inc. (a)(b)(c) | 2,843,518 | 50,301,833 | |
| Affimed NV | 740,923 | 7,468,504 | |
| Agenus, Inc. (a)(b) | 2,301,918 | 16,366,637 | |
| Agenus, Inc. warrants 1/9/18 (a) | 1,548,000 | 123,917 | |
| Agios Pharmaceuticals, Inc. (a) | 287,590 | 24,847,776 | |
| Aimmune Therapeutics, Inc. (c) | 1,594,184 | 33,621,341 | |
| Aimmune Therapeutics, Inc. (c) | 2,173,892 | 41,262,644 | |
| Akebia Therapeutics, Inc. (a)(b)(c) | 1,643,723 | 11,440,312 | |
| Alder Biopharmaceuticals, Inc. (a)(c) | 2,537,943 | 98,345,291 | |
| Aldeyra Therapeutics, Inc. (a)(c) | 958,916 | 6,904,195 | |
| Alexion Pharmaceuticals, Inc. (a) | 4,169,054 | 717,869,408 | |
| Alkermes PLC (a) | 2,355,811 | 140,312,103 | |
| Alnylam Pharmaceuticals, Inc. (a) | 1,771,378 | 182,292,510 | |
| AMAG Pharmaceuticals, Inc. (a)(b) | 1,697,477 | 106,160,212 | |
| Amarin Corp. PLC ADR (a)(b) | 4,624,866 | 10,220,954 | |
| Amgen, Inc. | 34,486 | 5,234,285 | |
| Amicus Therapeutics, Inc. (a) | 3,392,125 | 48,778,758 | |
| Anacor Pharmaceuticals, Inc. (a)(c) | 2,481,866 | 323,660,145 | |
| Applied Genetic Technologies Corp. (a)(b)(c) | 1,138,500 | 18,705,555 | |
| Ardelyx, Inc. (a)(c) | 2,040,126 | 38,721,591 | |
| ARIAD Pharmaceuticals, Inc. (a)(b) | 5,543,251 | 52,328,289 | |
| Array BioPharma, Inc. (a) | 2,704,296 | 15,955,346 | |
| Ascendis Pharma A/S ADR | 156,332 | 2,992,194 | |
| Asterias Biotherapeutics, Inc. (a)(b) | 653,913 | 3,099,548 | |
| Atara Biotherapeutics, Inc. (b) | 1,313,182 | 53,223,266 | |
| aTyr Pharma, Inc. (a) | 201,820 | 2,922,354 | |
| aTyr Pharma, Inc. | 675,659 | 8,805,188 | |
| Avalanche Biotechnologies, Inc. (a)(b) | 720,957 | 7,541,210 | |
| Axovant Sciences Ltd. (a) | 717,566 | 8,625,143 | |
| BioCryst Pharmaceuticals, Inc. (a) | 1,406,100 | 16,367,004 | |
| Biogen, Inc. (a) | 3,313,548 | 985,117,820 | |
| BioMarin Pharmaceutical, Inc. (a) | 5,052,617 | 653,000,221 | |
| Bionovo, Inc. warrants 2/2/16 (a) | 1,043,150 | 10 | |
| BioTime, Inc. warrants 10/1/18 (a) | 30,113 | 23,187 | |
| bluebird bio, Inc. (a) | 251,619 | 33,482,940 | |
| Blueprint Medicines Corp. (b) | 436,113 | 11,932,052 | |
| Calithera Biosciences, Inc. (b)(c) | 1,794,600 | 10,462,518 | |
| Cara Therapeutics, Inc. (a)(c) | 1,535,153 | 29,106,501 | |
| Catabasis Pharmaceuticals, Inc. | 605,098 | 6,892,066 | |
| Catalyst Pharmaceutical Partners, Inc.: | |||
| warrants 5/2/17 (a) | 141,443 | 336,224 | |
| warrants 5/30/17 (a) | 282,100 | 738,442 | |
| Celgene Corp. (a) | 6,044,752 | 713,764,316 | |
| Cell Therapeutics, Inc. warrants 7/6/16 (a) | 835,596 | 8 | |
| Celldex Therapeutics, Inc. (a)(b) | 3,976,706 | 59,014,317 | |
| Cellectis SA sponsored ADR | 184,400 | 6,310,168 | |
| Cepheid, Inc. (a) | 589,900 | 28,751,726 | |
| Cerulean Pharma, Inc. (a)(c) | 2,620,301 | 10,559,813 | |
| Chiasma, Inc. (c) | 1,530,734 | 35,764,069 | |
| Chiasma, Inc. (a)(c) | 127,365 | 3,306,395 | |
| Chiasma, Inc. warrants (c) | 382,683 | 6,388,736 | |
| Chimerix, Inc. (a) | 1,485,567 | 72,703,649 | |
| Cidara Therapeutics, Inc. (c) | 86,800 | 1,235,164 | |
| Cidara Therapeutics, Inc. Series B (c) | 1,066,786 | 13,662,328 | |
| Clovis Oncology, Inc. (a) | 938,124 | 73,042,335 | |
| CTI BioPharma Corp. (a)(b) | 7,350,977 | 11,614,544 | |
| Cytokinetics, Inc. (a) | 1,063,466 | 7,359,185 | |
| Cytokinetics, Inc. warrants 6/25/17 (a) | 3,828,480 | 1,655,626 | |
| DBV Technologies SA sponsored ADR (a) | 1,147,600 | 44,790,828 | |
| Dicerna Pharmaceuticals, Inc. (a) | 659,421 | 7,233,848 | |
| Dyax Corp. (a)(c) | 10,015,728 | 230,562,059 | |
| Eleven Biotherapeutics, Inc. (a)(b) | 821,860 | 2,901,166 | |
| Emergent BioSolutions, Inc. (a) | 336,186 | 11,191,632 | |
| Enanta Pharmaceuticals, Inc. (a)(b) | 727,166 | 28,388,561 | |
| Epirus Biopharmaceuticals, Inc. (a)(b)(c) | 1,220,700 | 6,164,535 | |
| Epizyme, Inc. (a)(b)(c) | 4,120,207 | 82,404,140 | |
| Esperion Therapeutics, Inc. (a)(b)(c) | 1,922,778 | 92,197,205 | |
| Exact Sciences Corp. (a)(b) | 2,258,602 | 49,937,690 | |
| Exelixis, Inc. (a)(b) | 5,125,140 | 30,494,583 | |
| Fate Therapeutics, Inc. (a)(c) | 1,747,667 | 11,412,266 | |
| Fibrocell Science, Inc. (a)(b)(c) | 3,326,640 | 18,762,250 | |
| FibroGen, Inc. (b) | 363,239 | 8,899,356 | |
| Forward Pharma A/S sponsored ADR | 119,800 | 3,151,938 | |
| Foundation Medicine, Inc. (a)(b) | 901,500 | 21,221,310 | |
| Galapagos Genomics NV sponsored ADR | 1,138,988 | 68,954,334 | |
| Genmab A/S (a) | 2,198,724 | 197,514,428 | |
| Genocea Biosciences, Inc. (a) | 898,978 | 10,455,114 | |
| Genomic Health, Inc. (a) | 516,228 | 14,206,595 | |
| Geron Corp. (a)(b)(c) | 15,808,751 | 47,900,516 | |
| Gilead Sciences, Inc. | 10,014,951 | 1,052,270,897 | |
| Global Blood Therapeutics, Inc. (c) | 2,567,404 | 114,354,742 | |
| Global Blood Therapeutics, Inc. (c) | 293,992 | 14,549,664 | |
| Halozyme Therapeutics, Inc. (a)(b) | 3,916,903 | 68,389,126 | |
| Heron Therapeutics, Inc. (a) | 362,470 | 13,940,596 | |
| Histogenics Corp. (b)(c) | 1,240,986 | 7,681,703 | |
| Ignyta, Inc. (a) | 1,300,609 | 17,792,331 | |
| Immune Design Corp. (a)(b)(c) | 1,311,741 | 20,909,152 | |
| ImmunoGen, Inc. (a)(c) | 4,603,054 | 61,957,107 | |
| Immunomedics, Inc. (a)(b)(c) | 6,823,983 | 14,739,803 | |
| Incyte Corp. (a) | 3,432,007 | 398,764,893 | |
| Infinity Pharmaceuticals, Inc. (a) | 1,808,933 | 15,954,789 | |
| Insys Therapeutics, Inc. (a)(b) | 1,881,790 | 61,007,632 | |
| Intercept Pharmaceuticals, Inc. (a)(b) | 1,193,868 | 226,548,392 | |
| Intrexon Corp. (a)(b) | 1,459,053 | 64,927,859 | |
| Ironwood Pharmaceuticals, Inc. Class A (a) | 4,692,810 | 51,620,910 | |
| Isis Pharmaceuticals, Inc. (a)(b) | 2,455,587 | 123,221,356 | |
| JHL Biotech, Inc. (d) | 1,102,127 | 4,121,955 | |
| Juno Therapeutics, Inc. | 362,503 | 13,162,484 | |
| Juno Therapeutics, Inc. (e) | 1,158,952 | 42,081,547 | |
| Karyopharm Therapeutics, Inc. (a)(b)(c) | 3,571,115 | 49,495,654 | |
| Keryx Biopharmaceuticals, Inc. (a)(b) | 3,548,050 | 21,926,949 | |
| Kite Pharma, Inc. (a)(b) | 2,117,283 | 112,575,937 | |
| La Jolla Pharmaceutical Co. (a)(c) | 1,274,504 | 45,346,852 | |
| Lexicon Pharmaceuticals, Inc. (a)(b) | 4,989,403 | 59,573,472 | |
| Ligand Pharmaceuticals, Inc. Class B (a)(b) | 927,337 | 85,259,364 | |
| Lion Biotechnologies, Inc. (a) | 1,954,882 | 13,899,211 | |
| Macrogenics, Inc. (a)(c) | 2,736,885 | 72,116,920 | |
| MannKind Corp. (a)(b) | 8,063,306 | 30,559,930 | |
| MediciNova, Inc. (a)(c) | 2,489,320 | 7,343,494 | |
| Medivation, Inc. (a) | 3,048,809 | 268,478,121 | |
| Merrimack Pharmaceuticals, Inc. (a) | 534,440 | 5,392,500 | |
| MiMedx Group, Inc. (a)(b) | 1,006,364 | 9,771,794 | |
| Minerva Neurosciences, Inc. (a)(b)(c) | 1,843,948 | 10,289,230 | |
| Momenta Pharmaceuticals, Inc. (a) | 1,062,677 | 20,732,828 | |
| Myriad Genetics, Inc. (a)(b) | 1,189,343 | 44,671,723 | |
| NantKwest, Inc. (b) | 523,167 | 8,956,619 | |
| Neurocrine Biosciences, Inc. (a) | 3,582,851 | 166,172,629 | |
| NewLink Genetics Corp. (a)(b)(c) | 1,456,947 | 65,431,490 | |
| Nivalis Therapeutics, Inc. | 81,400 | 1,183,556 | |
| Novavax, Inc. (a)(c) | 15,181,621 | 163,506,058 | |
| Novelos Therapeutics, Inc. warrants 12/6/16 (a) | 2,362,400 | 1,134 | |
| OncoMed Pharmaceuticals, Inc. (a)(b) | 764,832 | 14,983,059 | |
| Ophthotech Corp. (a)(c) | 3,016,835 | 132,831,245 | |
| Opko Health, Inc. (a)(b) | 2,721,309 | 29,444,563 | |
| Oragenics, Inc. (a)(b)(c) | 2,545,258 | 5,752,283 | |
| Orexigen Therapeutics, Inc. (a)(b)(c) | 9,832,709 | 27,236,604 | |
| Organovo Holdings, Inc. (a)(b) | 1,111,017 | 3,033,076 | |
| Osiris Therapeutics, Inc. (a)(b)(c) | 1,866,995 | 33,605,910 | |
| OvaScience, Inc. (a) | 1,061,925 | 20,643,822 | |
| PolyMedix, Inc. warrants 4/10/16 (a) | 2,961,167 | 30 | |
| Portola Pharmaceuticals, Inc. (a)(c) | 2,732,341 | 128,857,202 | |
| Progenics Pharmaceuticals, Inc. (a)(b)(c) | 4,448,736 | 32,609,235 | |
| ProNai Therapeutics, Inc. (a) | 1,136,890 | 32,912,966 | |
| ProQR Therapeutics BV (a)(c) | 1,510,385 | 26,310,907 | |
| Proteon Therapeutics, Inc. (b) | 712,500 | 10,096,125 | |
| Prothena Corp. PLC (a) | 668,235 | 38,443,560 | |
| PTC Therapeutics, Inc. (a) | 1,153,610 | 44,056,366 | |
| Puma Biotechnology, Inc. (a) | 1,218,897 | 112,041,012 | |
| Radius Health, Inc. (a)(c) | 4,136,959 | 251,775,325 | |
| Raptor Pharmaceutical Corp. (a)(b) | 2,983,357 | 36,188,120 | |
| Regeneron Pharmaceuticals, Inc. (a) | 1,470,779 | 755,245,017 | |
| Regulus Therapeutics, Inc. (a)(b) | 1,925,341 | 16,038,091 | |
| Repligen Corp. (a)(c) | 1,861,315 | 63,433,615 | |
| Retrophin, Inc. (a)(b) | 330,200 | 9,054,084 | |
| Rigel Pharmaceuticals, Inc. (a) | 3,913,851 | 11,741,553 | |
| Sage Therapeutics, Inc. (a)(c) | 1,442,993 | 77,936,052 | |
| Sangamo Biosciences, Inc. (a)(c) | 3,556,931 | 26,890,398 | |
| Sarepta Therapeutics, Inc. (a)(b) | 1,705,108 | 60,872,356 | |
| Seattle Genetics, Inc. (a)(b) | 2,433,631 | 98,002,320 | |
| Seres Therapeutics, Inc. (b)(c) | 1,028,440 | 42,505,425 | |
| Seres Therapeutics, Inc. (c) | 1,292,035 | 48,059,826 | |
| Sophiris Bio, Inc. (a)(c) | 1,277,815 | 1,150,034 | |
| Sorrento Therapeutics, Inc. (a) | 33,730 | 427,696 | |
| Spark Therapeutics, Inc. (b)(c) | 1,413,639 | 61,648,797 | |
| Spectrum Pharmaceuticals, Inc. (a)(b)(c) | 3,903,900 | 28,381,353 | |
| Stemline Therapeutics, Inc. (a)(c) | 1,513,299 | 13,937,484 | |
| Sunesis Pharmaceuticals, Inc. (a)(b)(c) | 4,253,594 | 5,061,777 | |
| Synta Pharmaceuticals Corp. (a)(b) | 3,254,017 | 6,508,034 | |
| TESARO, Inc. (a)(b)(c) | 2,149,849 | 110,674,227 | |
| TG Therapeutics, Inc. (a)(b)(c) | 4,399,236 | 54,022,618 | |
| Threshold Pharmaceuticals, Inc. (a) | 366,950 | 1,541,190 | |
| Threshold Pharmaceuticals, Inc. warrants 3/16/16 (a) | 631,520 | 1,117,121 | |
| Tobira Therapeutics, Inc. (a) | 569,130 | 6,858,017 | |
| Tokai Pharmaceuticals, Inc. (b) | 484,000 | 5,716,040 | |
| Ultragenyx Pharmaceutical, Inc. (a)(c) | 1,976,978 | 220,670,284 | |
| uniQure B.V. (a) | 870,789 | 23,328,437 | |
| United Therapeutics Corp. (a) | 995,809 | 149,988,752 | |
| Verastem, Inc. (a)(b)(c) | 1,965,033 | 11,967,051 | |
| Versartis, Inc. (a)(c) | 2,158,310 | 27,993,281 | |
| Vertex Pharmaceuticals, Inc. (a) | 5,051,023 | 644,106,453 | |
| Vical, Inc. (a)(c) | 5,921,845 | 3,495,073 | |
| Vitae Pharmaceuticals, Inc. (c) | 2,182,971 | 16,939,855 | |
| Vital Therapies, Inc. (a)(b)(c) | 1,252,900 | 4,685,846 | |
| Xencor, Inc. (a)(c) | 2,594,033 | 43,501,933 | |
| Xenon Pharmaceuticals, Inc. (c) | 808,705 | 7,941,483 | |
| XOMA Corp. (a)(b)(c) | 8,676,574 | 7,209,365 | |
| Zafgen, Inc. (a)(c) | 2,613,501 | 95,445,057 | |
| ZIOPHARM Oncology, Inc. (a)(b) | 175,102 | 1,525,138 | |
| 13,826,270,994 | |||
| Capital Markets - 0.0% | |||
| Asset Management & Custody Banks - 0.0% | |||
| RPI International Holdings LP (d) | 54,958 | 7,738,086 | |
| Health Care Equipment & Supplies - 0.1% | |||
| Health Care Equipment - 0.1% | |||
| Bellerophon Therapeutics, Inc. (c) | 1,074,370 | 5,457,800 | |
| Vermillion, Inc. (a)(b)(c) | 5,009,600 | 10,219,584 | |
| Zosano Pharma Corp. (c) | 827,900 | 6,705,990 | |
| 22,383,374 | |||
| Life Sciences Tools & Services - 0.1% | |||
| Life Sciences Tools & Services - 0.1% | |||
| Genfit (a)(b) | 195,869 | 8,237,894 | |
| Transgenomic, Inc. (a) | 236,500 | 295,625 | |
| Transgenomic, Inc. warrants 2/3/17 (a) | 1,419,000 | 184 | |
| 8,533,703 | |||
| Personal Products - 0.0% | |||
| Personal Products - 0.0% | |||
| MYOS Corp. (a) | 33,334 | 56,668 | |
| Pharmaceuticals - 9.1% | |||
| Pharmaceuticals - 9.1% | |||
| Achaogen, Inc. (a)(b) | 901,382 | 6,219,536 | |
| Adimab LLC unit (d)(f) | 1,954,526 | 36,171,914 | |
| Aradigm Corp. (a) | 159,954 | 1,084,488 | |
| Auris Medical Holding AG (a) | 1,405,000 | 6,680,775 | |
| Biodel, Inc. (a)(c) | 3,281,200 | 2,172,154 | |
| Biodelivery Sciences International, Inc. (a)(b) | 439,500 | 2,966,625 | |
| Carbylan Therapeutics, Inc. (c) | 2,619,696 | 14,224,949 | |
| Cempra, Inc. (a) | 449,100 | 15,449,040 | |
| Collegium Pharmaceutical, Inc. | 368,300 | 5,568,696 | |
| Dermira, Inc. (c) | 2,041,386 | 52,463,620 | |
| Dermira, Inc. (c)(e) | 875,705 | 22,505,619 | |
| Egalet Corp. (a)(b)(c) | 1,881,493 | 21,091,537 | |
| Eisai Co. Ltd. | 1,619,000 | 110,292,128 | |
| Endo Health Solutions, Inc. (a) | 268,249 | 20,655,173 | |
| Flex Pharma, Inc. | 108,600 | 1,306,458 | |
| GW Pharmaceuticals PLC ADR (a)(b) | 1,329,654 | 141,408,703 | |
| Horizon Pharma PLC (a)(c) | 8,784,102 | 256,671,460 | |
| Intra-Cellular Therapies, Inc. (a) | 1,670,950 | 44,764,751 | |
| Jazz Pharmaceuticals PLC (a) | 1,291,520 | 218,034,406 | |
| Kura Oncology, Inc. | 1,520,587 | 9,610,110 | |
| Nektar Therapeutics (a)(b) | 1,432,471 | 15,828,805 | |
| NeurogesX, Inc. (a)(c) | 2,550,000 | 10,965 | |
| Ocular Therapeutix, Inc. (a)(b) | 936,128 | 16,494,575 | |
| Pacira Pharmaceuticals, Inc. (a)(b) | 957,533 | 55,106,024 | |
| Paratek Pharmaceuticals, Inc. (a)(c) | 1,727,718 | 44,886,114 | |
| Parnell Pharmaceuticals Holdings Ltd. (a)(c) | 692,482 | 2,790,702 | |
| Repros Therapeutics, Inc. (a)(b)(c) | 2,427,585 | 18,036,957 | |
| SCYNEXIS, Inc. (a) | 509,200 | 3,925,932 | |
| Sun Pharmaceutical Industries Ltd. (a) | 826,199 | 11,195,245 | |
| Tetraphase Pharmaceuticals, Inc. (a) | 1,742,703 | 75,650,737 | |
| The Medicines Company (a) | 574,250 | 23,544,250 | |
| TherapeuticsMD, Inc. (a) | 5,008,481 | 30,701,989 | |
| XenoPort, Inc. (a) | 2,190,701 | 14,787,232 | |
| Zogenix, Inc. (a)(c) | 1,929,146 | 37,078,186 | |
| Zogenix, Inc. warrants 7/27/17 (a)(c) | 498,465 | 140,981 | |
| ZS Pharma, Inc. (a)(b)(c) | 1,413,709 | 72,325,352 | |
| 1,411,846,188 | |||
| TOTAL COMMON STOCKS | |||
| (Cost $10,505,810,118) | 15,276,829,013 | ||
| Preferred Stocks - 1.7% | |||
| Convertible Preferred Stocks - 1.6% | |||
| Biotechnology - 0.9% | |||
| Biotechnology - 0.9% | |||
| 23andMe, Inc. Series E (d) | 1,505,457 | 16,299,989 | |
| CytomX Therapeutics, Inc. Series D (d) | 18,110,703 | 3,622,141 | |
| Editas Medicine, Inc. Series B (d) | 588,811 | 2,649,650 | |
| Gensight Biologics Series B (d) | 832,968 | 2,598,508 | |
| Immunocore Ltd. Series A (d) | 73,318 | 13,605,408 | |
| Intellia Therapeutics, Inc. Series B (d) | 508,813 | 2,671,268 | |
| Jounce Therapeutics, Inc. Series B (d) | 7,257,779 | 16,402,581 | |
| Moderna LLC Series E (d) | 269,897 | 16,644,548 | |
| Ovid Therapeutics, Inc. Series B (d) | 1,039,201 | 6,474,222 | |
| Pronutria Biosciences, Inc. Series C (d) | 1,642,272 | 16,554,102 | |
| RaNA Therapeutics LLC Series B (d) | 5,634,091 | 6,084,818 | |
| Syndax Pharmaceuticals, Inc. Series C1 (d) | 1,441,772 | 16,137,754 | |
| Twist Bioscience Corp. Series C (d) | 8,133,875 | 12,199,991 | |
| WAVE Life Sciences Series B (d) | 243,056 | 12,152,800 | |
| 144,097,780 | |||
| Health Care Equipment & Supplies - 0.1% | |||
| Health Care Supplies - 0.1% | |||
| Novocure Ltd. Series J (d) | 118,673 | 13,893,926 | |
| Pharmaceuticals - 0.6% | |||
| Pharmaceuticals - 0.6% | |||
| Afferent Pharmaceuticals, Inc. Series C (d) | 8,274,568 | 20,299,989 | |
| Kolltan Pharmaceuticals, Inc. Series D (a)(d) | 10,639,609 | 10,639,609 | |
| MyoKardia, Inc. Series B (d) | 8,237,477 | 22,200,001 | |
| Stemcentrx, Inc. Series G (d) | 876,163 | 20,186,796 | |
| Syros Pharmaceuticals, Inc. Series B, 6.00% (d) | 860,442 | 2,707,037 | |
| Voyager Therapeutics, Inc. Series B (d) | 5,466,667 | 16,400,001 | |
| 92,433,433 | |||
| TOTAL CONVERTIBLE PREFERRED STOCKS | 250,425,139 | ||
| Nonconvertible Preferred Stocks - 0.1% | |||
| Biotechnology - 0.1% | |||
| Biotechnology - 0.1% | |||
| Moderna LLC Series D, 8.00% (a)(d) | 207,494 | 12,796,155 | |
| TOTAL PREFERRED STOCKS | |||
| (Cost $256,552,939) | 263,221,294 | ||
| Money Market Funds - 8.9% | |||
| Fidelity Cash Central Fund, 0.15% (g) | 162,403,188 | 162,403,188 | |
| Fidelity Securities Lending Cash Central Fund, 0.19% (g)(h) | 1,216,884,374 | 1,216,884,374 | |
| TOTAL MONEY MARKET FUNDS | |||
| (Cost $1,379,287,562) | 1,379,287,562 | ||
| TOTAL INVESTMENT PORTFOLIO - 108.7% | |||
| (Cost $12,141,650,619) | 16,919,337,869 | ||
| NET OTHER ASSETS (LIABILITIES) - (8.7)% | (1,353,872,920) | ||
| NET ASSETS - 100% | $15,565,464,949 |
Legend
(a) Non-income producing
(b) Security or a portion of the security is on loan at period end.
(c) Affiliated company
(d) Restricted securities - Investment in securities not registered under the Securities Act of 1933 (excluding 144A issues). At the end of the period, the value of restricted securities (excluding 144A issues) amounted to $311,253,249 or 2.0% of net assets.
(e) Security exempt from registration under Rule 144A of the Securities Act of 1933. These securities may be resold in transactions exempt from registration, normally to qualified institutional buyers. At the end of the period, the value of these securities amounted to $64,587,166 or 0.4% of net assets.
(f) Investment is owned by an entity that is treated as a corporation for U.S. tax purposes and is wholly-owned by the Fund.
(g) Affiliated fund that is generally available only to investment companies and other accounts managed by Fidelity Investments. The rate quoted is the annualized seven-day yield of the fund at period end. A complete unaudited listing of the fund's holdings as of its most recent quarter end is available upon request. In addition, each Fidelity Central Fund's financial statements are available on the SEC's website or upon request.
(h) Investment made with cash collateral received from securities on loan.
Additional information on each restricted holding is as follows:
| Security | Acquisition Date | Acquisition Cost |
| 23andMe, Inc. Series E | 6/18/15 | $16,299,991 |
| Adimab LLC unit | 9/17/14 - 6/5/15 | $31,176,915 |
| Afferent Pharmaceuticals, Inc. Series C | 7/1/15 | $20,299,998 |
| CytomX Therapeutics, Inc. Series D | 6/12/15 | $2,686,578 |
| Editas Medicine, Inc. Series B | 8/4/15 | $2,649,650 |
| Gensight Biologics Series B | 7/2/15 | $2,567,478 |
| Immunocore Ltd. Series A | 7/27/15 | $13,796,921 |
| Intellia Therapeutics, Inc. Series B | 8/20/15 | $2,671,268 |
| JHL Biotech, Inc. | 4/14/15 | $4,121,955 |
| Jounce Therapeutics, Inc. Series B | 4/17/15 | $16,402,581 |
| Kolltan Pharmaceuticals, Inc. Series D | 3/13/14 | $10,639,609 |
| Moderna LLC Series D, 8.00% | 11/6/13 | $4,425,847 |
| Moderna LLC Series E | 12/18/14 | $16,644,548 |
| MyoKardia, Inc. Series B | 4/20/15 | $22,200,001 |
| Novocure Ltd. Series J | 6/1/15 | $16,370,940 |
| Ovid Therapeutics, Inc. Series B | 8/10/15 | $6,474,222 |
| Pronutria Biosciences, Inc. Series C | 1/30/15 | $16,554,102 |
| RaNA Therapeutics LLC Series B | 7/17/15 | $6,084,818 |
| RPI International Holdings LP | 5/21/15 | $6,479,548 |
| Stemcentrx, Inc. Series G | 8/14/15 | $20,186,796 |
| Syndax Pharmaceuticals, Inc. Series C1 | 8/21/15 | $16,137,754 |
| Syros Pharmaceuticals, Inc. Series B, 6.00% | 10/9/14 | $2,707,037 |
| Twist Bioscience Corp. Series C | 5/29/15 | $12,199,999 |
| Voyager Therapeutics, Inc. Series B | 4/10/15 | $16,400,001 |
| WAVE Life Sciences Series B | 8/14/15 | $12,152,800 |
Affiliated Central Funds
Information regarding fiscal year to date income earned by the Fund from investments in Fidelity Central Funds is as follows:
| Fund | Income earned |
| Fidelity Cash Central Fund | $62,483 |
| Fidelity Securities Lending Cash Central Fund | 15,569,961 |
| Total | $15,632,444 |
Other Affiliated Issuers
An affiliated company is a company in which the Fund has ownership of at least 5% of the voting securities. Fiscal year to date transactions with companies which are or were affiliates are as follows:
| Affiliate | Value, beginning of period | Purchases | Sales Proceeds | Dividend Income | Value, end of period |
| Acceleron Pharma, Inc. | $124,672,058 | $4,915,644 | $-- | $-- | $93,400,222 |
| Achillion Pharmaceuticals, Inc. | 87,769,772 | -- | -- | -- | 53,428,222 |
| Acorda Therapeutics, Inc. | 126,918,714 | -- | 10,602 | -- | 119,894,246 |
| Adamas Pharmaceuticals, Inc. | 29,593,192 | 3,011,393 | -- | -- | 36,740,552 |
| Aegerion Pharmaceuticals, Inc. | 77,343,690 | -- | -- | -- | 50,301,833 |
| Aimmune Therapeutics, Inc. | -- | 35,496,147 | -- | -- | 33,621,341 |
| Aimmune Therapeutics, Inc. | -- | -- | -- | -- | 41,262,644 |
| Akebia Therapeutics, Inc. | 5,790,491 | 8,401,800 | -- | -- | 11,440,312 |
| Alder Biopharmaceuticals, Inc. | 8,264,767 | 79,943,687 | -- | -- | 98,345,291 |
| Aldeyra Therapeutics, Inc. | 5,676,463 | 3,018,000 | -- | -- | 6,904,195 |
| Anacor Pharmaceuticals, Inc. | 49,918,773 | 99,750,305 | -- | -- | 323,660,145 |
| Applied Genetic Technologies Corp. | 22,821,543 | 253,179 | -- | -- | 18,705,555 |
| Ardelyx, Inc. | 29,190,159 | 3,503,133 | -- | -- | 38,721,591 |
| Atara Biotherapeutics, Inc. | 26,396,865 | 50,383,075 | 39,207,684 | -- | -- |
| Bellerophon Therapeutics, Inc. | 12,802,584 | 74,368 | -- | -- | 5,457,800 |
| Biodel, Inc. | -- | 3,018,704 | -- | -- | 2,172,154 |
| Calithera Biosciences, Inc. | 20,983,814 | 7,846,286 | -- | -- | 10,462,518 |
| Cara Therapeutics, Inc. | 6,937,743 | 16,710,484 | -- | -- | 29,106,501 |
| Carbylan Therapeutics, Inc. | -- | 13,246,490 | -- | -- | 14,224,949 |
| Cerulean Pharma, Inc. | 15,645,230 | 4,642,206 | 490,800 | -- | 10,559,813 |
| Chiasma, Inc. | -- | -- | -- | -- | 35,764,069 |
| Chiasma, Inc. | -- | 2,519,156 | -- | -- | 3,306,395 |
| Chiasma, Inc. warrants | -- | -- | -- | -- | 6,388,736 |
| Cidara Therapeutics, Inc. | -- | 1,408,485 | -- | -- | 1,235,164 |
| Cidara Therapeutics, Inc. Series B | -- | -- | -- | -- | 13,662,328 |
| Dermira, Inc. | 13,185,490 | -- | -- | -- | -- |
| Dermira, Inc. | 19,704,594 | 15,935,461 | -- | -- | 52,463,620 |
| Dermira, Inc. | -- | -- | -- | -- | 22,505,619 |
| Dyax Corp. | 107,545,440 | 74,249,709 | -- | -- | 230,562,059 |
| Egalet Corp. | 17,461,523 | 8,075,554 | -- | -- | 21,091,537 |
| Epirus Biopharmaceuticals, Inc. | 12,853,971 | -- | -- | -- | 6,164,535 |
| Epizyme, Inc. | 80,350,788 | 14,219,555 | -- | -- | 82,404,140 |
| Esperion Therapeutics, Inc. | 67,939,105 | 76,533,849 | 5,096,374 | -- | 92,197,205 |
| Fate Therapeutics, Inc. | 6,878,794 | 2,247,211 | -- | -- | 11,412,266 |
| Fibrocell Science, Inc. | 16,200,737 | -- | -- | -- | 18,762,250 |
| Geron Corp. | 47,395,355 | 483,317 | -- | -- | 47,900,516 |
| Global Blood Therapeutics, Inc. | -- | -- | -- | -- | 114,354,742 |
| Global Blood Therapeutics, Inc. | -- | 11,858,044 | -- | -- | 14,549,664 |
| Histogenics Corp. | 13,241,321 | -- | -- | -- | 7,681,703 |
| Horizon Pharma PLC | 125,280,137 | 73,455,615 | -- | -- | 256,671,460 |
| Hyperion Therapeutics, Inc. | 59,072,193 | -- | 92,062,169 | -- | -- |
| Ignyta, Inc. | 10,178,903 | 1,902,250 | -- | -- | -- |
| Immune Design Corp. | 15,113,732 | 16,536,993 | -- | -- | 20,909,152 |
| ImmunoGen, Inc. | 12,057,073 | 47,898,242 | -- | -- | 61,957,107 |
| Immunomedics, Inc. | 17,865,023 | 8,348,895 | -- | -- | 14,739,803 |
| Intercept Pharmaceuticals, Inc. | 259,372,145 | 6,185,618 | -- | -- | -- |
| Karyopharm Therapeutics, Inc. | 81,985,213 | 14,544,658 | -- | -- | 49,495,654 |
| KYTHERA Biopharmaceuticals, Inc. | 54,184,482 | 14,060,114 | 118,536,146 | -- | -- |
| La Jolla Pharmaceutical Co. | 19,477,400 | 6,966,970 | -- | -- | 45,346,852 |
| Macrogenics, Inc. | 87,247,247 | 7,884,700 | -- | -- | 72,116,920 |
| MediciNova, Inc. | -- | 8,713,150 | -- | -- | 7,343,494 |
| Minerva Neurosciences, Inc. | 6,560,424 | 3,323,584 | -- | -- | 10,289,230 |
| NeurogesX, Inc. | 15,300 | -- | -- | -- | 10,965 |
| NewLink Genetics Corp. | 71,346,813 | -- | 7,491,608 | -- | 65,431,490 |
| Novavax, Inc. | 131,868,162 | 6,473,052 | -- | -- | 163,506,058 |
| Ophthotech Corp. | 158,638,348 | 3,407,650 | -- | -- | 132,831,245 |
| Oragenics, Inc. | 2,876,142 | -- | -- | -- | 5,752,283 |
| Orexigen Therapeutics, Inc. | 51,734,406 | 4,989,839 | -- | -- | 27,236,604 |
| Osiris Therapeutics, Inc. | 32,243,004 | -- | -- | -- | 33,605,910 |
| Paratek Pharmaceuticals, Inc. | 40,049,455 | 9,252,099 | -- | -- | 44,886,114 |
| Parnell Pharmaceuticals Holdings Ltd. | 2,936,124 | -- | -- | -- | 2,790,702 |
| Portola Pharmaceuticals, Inc. | 93,948,729 | 10,608,000 | -- | -- | 128,857,202 |
| Progenics Pharmaceuticals, Inc. | 28,961,271 | -- | -- | -- | 32,609,235 |
| ProQR Therapeutics BV | 24,561,033 | -- | -- | -- | -- |
| ProQR Therapeutics BV | 1,150,513 | -- | -- | -- | 26,310,907 |
| PTC Therapeutics, Inc. | 146,997,577 | 974,627 | 43,553,026 | -- | -- |
| Radius Health, Inc. | 124,452,401 | 70,100,328 | -- | -- | 251,775,325 |
| Receptos, Inc. | 290,260,273 | -- | 496,505,196 | -- | -- |
| Repligen Corp. | 47,854,409 | -- | -- | -- | 63,433,615 |
| Repros Therapeutics, Inc. | 21,372,818 | 990,532 | -- | -- | 18,036,957 |
| Sage Therapeutics, Inc. | 7,478,180 | -- | -- | -- | -- |
| Sage Therapeutics, Inc. | 54,038,026 | 1,506,946 | -- | -- | 77,936,052 |
| Sangamo Biosciences, Inc. | 57,896,240 | 1,820,594 | -- | -- | 26,890,398 |
| Seres Therapeutics, Inc. | -- | 37,782,820 | -- | -- | 42,505,425 |
| Seres Therapeutics, Inc. | -- | -- | -- | -- | 48,059,826 |
| Sophiris Bio, Inc. | 1,024,808 | -- | -- | -- | 1,150,034 |
| Spark Therapeutics, Inc. | 55,513,996 | 29,714,713 | -- | -- | 61,648,797 |
| Spectrum Pharmaceuticals, Inc. | 24,321,297 | -- | -- | -- | 28,381,353 |
| Stemline Therapeutics, Inc. | 22,987,012 | -- | -- | -- | 13,937,484 |
| Sunesis Pharmaceuticals, Inc. | 9,442,979 | -- | -- | -- | 5,061,777 |
| TESARO, Inc. | 57,175,893 | 63,549,603 | -- | -- | 110,674,227 |
| TG Therapeutics, Inc. | 20,075,398 | 52,559,081 | -- | -- | 54,022,618 |
| Ultragenyx Pharmaceutical, Inc. | 103,155,222 | 9,286,667 | -- | -- | 220,670,284 |
| Verastem, Inc. | 14,619,846 | -- | -- | -- | 11,967,051 |
| Vermillion, Inc. | -- | 9,818,816 | -- | -- | 10,219,584 |
| Versartis, Inc. | 40,767,554 | 1,939,347 | -- | -- | 27,993,281 |
| Vical, Inc. | 6,040,282 | -- | -- | -- | 3,495,073 |
| Vitae Pharmaceuticals, Inc. | 24,883,893 | 608,147 | -- | -- | 16,939,855 |
| Vital Therapies, Inc. | 32,994,640 | -- | 5,639,991 | -- | 4,685,846 |
| Xencor, Inc. | 19,542,838 | 28,247,646 | -- | -- | 43,501,933 |
| Xenon Pharmaceuticals, Inc. | 4,992,163 | -- | -- | -- | -- |
| Xenon Pharmaceuticals, Inc. | 10,142,029 | -- | -- | -- | 7,941,483 |
| XOMA Corp. | 17,853,076 | 16,184,481 | -- | -- | 7,209,365 |
| Zafgen, Inc. | 101,011,814 | -- | -- | -- | 95,445,057 |
| Zogenix, Inc. | 16,471,906 | -- | -- | -- | -- |
| Zogenix, Inc. | -- | 13,555,449 | -- | -- | 37,078,186 |
| Zogenix, Inc. warrants 7/27/17 | 69,302 | -- | -- | -- | 140,981 |
| Zosano Pharma Corp. | 8,593,602 | -- | -- | -- | 6,705,990 |
| ZS Pharma, Inc. | 59,491,385 | 9,923,742 | -- | -- | 72,325,352 |
| Total | $3,843,727,107 | $1,134,860,210 | $808,593,596 | $-- | $4,353,348,028 |
Investment Valuation
The following is a summary of the inputs used, as of August 31, 2015, involving the Fund's assets and liabilities carried at fair value. The inputs or methodology used for valuing securities may not be an indication of the risk associated with investing in those securities. For more information on valuation inputs, and their aggregation into the levels used below, please refer to the Investment Valuation section in the accompanying Notes to Financial Statements.
| Valuation Inputs at Reporting Date: | ||||
| Description | Total | Level 1 | Level 2 | Level 3 |
| Investments in Securities: | ||||
| Common Stocks | $15,276,829,013 | $14,806,664,560 | $406,133,652 | $64,030,801 |
| Preferred Stocks | 263,221,294 | -- | -- | 263,221,294 |
| Money Market Funds | 1,379,287,562 | 1,379,287,562 | -- | -- |
| Total Investments in Securities: | $16,919,337,869 | $16,185,952,122 | $406,133,652 | $327,252,095 |
The following is a reconciliation of Investments in Securities for which Level 3 inputs were used in determining value:
| Investments in Securities: | |
| Preferred Stocks | |
| Beginning Balance | $137,108,643 |
| Total Realized Gain (Loss) | (1,638,822) |
| Total Unrealized Gain (Loss) | (63,104) |
| Cost of Purchases | 205,581,795 |
| Proceeds of Sales | (77,767,218) |
| Amortization/Accretion | -- |
| Transfers in to Level 3 | -- |
| Transfers out of Level 3 | -- |
| Ending Balance | $263,221,294 |
| The change in unrealized gain (loss) for the period attributable to Level 3 securities held at August 31, 2015 | $(1,701,952) |
| Other Investments in Securities | |
| Beginning Balance | $30,873,907 |
| Total Realized Gain (Loss) | -- |
| Total Unrealized Gain (Loss) | 12,547,028 |
| Cost of Purchases | 34,588,536 |
| Proceeds of Sales | (13,978,670) |
| Amortization/Accretion | -- |
| Transfers in to Level 3 | -- |
| Transfers out of Level 3 | -- |
| Ending Balance | $64,030,801 |
| The change in unrealized gain (loss) for the period attributable to Level 3 securities held at August 31, 2015 | $12,547,028 |
The information used in the above reconciliations represents fiscal year to date activity for any Investments in Securities identified as using Level 3 inputs at either the beginning or the end of the current fiscal period. Transfers in or out of Level 3 represent the beginning value of any Security or Instrument where a change in the pricing level occurred from the beginning to the end of the period. The cost of purchases and the proceeds of sales may include securities received or delivered through corporate actions or exchanges. Realized and unrealized gains (losses) disclosed in the reconciliations are included in Net Gain (Loss) on the Fund's Statement of Operations.
See accompanying notes which are an integral part of the financial statements.
Biotechnology Portfolio
Financial Statements
Statement of Assets and Liabilities
| August 31, 2015 (Unaudited) | ||
| Assets | ||
| Investment in securities, at value (including securities loaned of $1,145,122,198) — See accompanying schedule: Unaffiliated issuers (cost $7,425,914,923) | $11,186,702,279 | |
| Fidelity Central Funds (cost $1,379,287,562) | 1,379,287,562 | |
| Other affiliated issuers (cost $3,336,448,134) | 4,353,348,028 | |
| Total Investments (cost $12,141,650,619) | $16,919,337,869 | |
| Cash | 8,140 | |
| Receivable for investments sold | 2,910,029 | |
| Receivable for fund shares sold | 41,719,650 | |
| Dividends receivable | 92,408 | |
| Distributions receivable from Fidelity Central Funds | 2,239,509 | |
| Prepaid expenses | 133,451 | |
| Other receivables | 267,902 | |
| Total assets | 16,966,708,958 | |
| Liabilities | ||
| Payable for investments purchased | $156,610,904 | |
| Payable for fund shares redeemed | 17,615,744 | |
| Accrued management fee | 7,479,524 | |
| Other affiliated payables | 2,265,360 | |
| Other payables and accrued expenses | 388,103 | |
| Collateral on securities loaned, at value | 1,216,884,374 | |
| Total liabilities | 1,401,244,009 | |
| Net Assets | $15,565,464,949 | |
| Net Assets consist of: | ||
| Paid in capital | $9,940,420,521 | |
| Accumulated net investment loss | (33,815,500) | |
| Accumulated undistributed net realized gain (loss) on investments and foreign currency transactions | 881,172,506 | |
| Net unrealized appreciation (depreciation) on investments and assets and liabilities in foreign currencies | 4,777,687,422 | |
| Net Assets, for 62,680,817 shares outstanding | $15,565,464,949 | |
| Net Asset Value, offering price and redemption price per share ($15,565,464,949 ÷ 62,680,817 shares) | $248.33 |
See accompanying notes which are an integral part of the financial statements.
Statement of Operations
| Six months ended August 31, 2015 (Unaudited) | ||
| Investment Income | ||
| Dividends | $6,909,907 | |
| Income from Fidelity Central Funds (including $15,569,961 from security lending) | 15,632,444 | |
| Total income | 22,542,351 | |
| Expenses | ||
| Management fee | $42,740,680 | |
| Transfer agent fees | 11,965,535 | |
| Accounting and security lending fees | 935,792 | |
| Custodian fees and expenses | 85,232 | |
| Independent trustees' compensation | 125,640 | |
| Registration fees | 577,203 | |
| Audit | 33,698 | |
| Legal | 80,434 | |
| Interest | 6,336 | |
| Miscellaneous | 59,621 | |
| Total expenses before reductions | 56,610,171 | |
| Expense reductions | (396,746) | 56,213,425 |
| Net investment income (loss) | (33,671,074) | |
| Realized and Unrealized Gain (Loss)
Net realized gain (loss) on: | ||
| Investment securities: | ||
| Unaffiliated issuers | 417,022,815 | |
| Other affiliated issuers | 491,810,695 | |
| Foreign currency transactions | (213,555) | |
| Total net realized gain (loss) | 908,619,955 | |
| Change in net unrealized appreciation (depreciation) on: Investment securities | (693,692,569) | |
| Assets and liabilities in foreign currencies | 172 | |
| Total change in net unrealized appreciation (depreciation) | (693,692,397) | |
| Net gain (loss) | 214,927,558 | |
| Net increase (decrease) in net assets resulting from operations | $181,256,484 |
See accompanying notes which are an integral part of the financial statements.
Statement of Changes in Net Assets
| Six months ended August 31, 2015 (Unaudited) | Year ended February 28, 2015 | |
| Increase (Decrease) in Net Assets | ||
| Operations | ||
| Net investment income (loss) | $(33,671,074) | $(39,801,989) |
| Net realized gain (loss) | 908,619,955 | 1,567,318,834 |
| Change in net unrealized appreciation (depreciation) | (693,692,397) | 591,127,348 |
| Net increase (decrease) in net assets resulting from operations | 181,256,484 | 2,118,644,193 |
| Distributions to shareholders from net realized gain | (352,018,335) | (1,044,601,828) |
| Share transactions | ||
| Proceeds from sales of shares | 4,476,701,460 | 4,289,879,665 |
| Reinvestment of distributions | 337,007,274 | 999,582,805 |
| Cost of shares redeemed | (2,355,263,606) | (4,120,805,109) |
| Net increase (decrease) in net assets resulting from share transactions | 2,458,445,128 | 1,168,657,361 |
| Redemption fees | 729,380 | 1,039,850 |
| Total increase (decrease) in net assets | 2,288,412,657 | 2,243,739,576 |
| Net Assets | ||
| Beginning of period | 13,277,052,292 | 11,033,312,716 |
| End of period (including accumulated net investment loss of $33,815,500 and accumulated net investment loss of $144,426, respectively) | $15,565,464,949 | $13,277,052,292 |
| Other Information
Shares | ||
| Sold | 16,964,381 | 19,696,850 |
| Issued in reinvestment of distributions | 1,301,738 | 4,576,425 |
| Redeemed | (9,121,902) | (20,560,338) |
| Net increase (decrease) | 9,144,217 | 3,712,937 |
See accompanying notes which are an integral part of the financial statements.
Financial Highlights — Biotechnology Portfolio
| Six months ended (Unaudited) | Years ended February 28, | |||||
| August 31, | 2015 | 2015 | 2014 | 2013 | 2012 A | 2011 |
| Selected Per–Share Data | ||||||
| Net asset value, beginning of period | $248.00 | $221.45 | $120.51 | $97.78 | $74.01 | $67.83 |
| Income from Investment Operations | ||||||
| Net investment income (loss)B | (.57) | (.87) | (.54) | (.16) | (.23) | (.41)C |
| Net realized and unrealized gain (loss) | 7.17 | 51.24 | 101.91 | 29.36 | 24.11 | 6.59 |
| Total from investment operations | 6.60 | 50.37 | 101.37 | 29.20 | 23.88 | 6.18 |
| Distributions from net realized gain | (6.28) | (23.84) | (.46) | (6.48) | (.12) | – |
| Redemption fees added to paid in capitalB | .01 | .02 | .03 | .01 | .01 | –D |
| Net asset value, end of period | $248.33 | $248.00 | $221.45 | $120.51 | $97.78 | $74.01 |
| Total ReturnE,F | 2.56% | 24.21% | 84.25% | 31.78% | 32.31% | 9.11% |
| Ratios to Average Net AssetsG,H | ||||||
| Expenses before reductions | .73%I | .74% | .76% | .81% | .83% | .87% |
| Expenses net of fee waivers, if any | .72%I | .74% | .76% | .80% | .83% | .87% |
| Expenses net of all reductions | .72%I | .74% | .75% | .79% | .83% | .86% |
| Net investment income (loss) | (.43)%I | (.41)% | (.32)% | (.15)% | (.27)% | (.59)%C |
| Supplemental Data | ||||||
| Net assets, end of period (000 omitted) | $15,565,465 | $13,277,052 | $11,033,313 | $3,450,725 | $1,741,830 | $1,012,907 |
| Portfolio turnover rateJ | 29%I | 61% | 35% | 42% | 106% | 119% |
A For the year ended February 29.
B Calculated based on average shares outstanding during the period.
C Investment income per share reflects a large, non-recurring dividend which amounted to $.11 per share. Excluding this non-recurring dividend, the ratio of net investment income (loss) to average net assets would have been (.75) %.
D Amount represents less than $.005 per share.
E Total returns for periods of less than one year are not annualized.
F Total returns would have been lower if certain expenses had not been reduced during the applicable periods shown.
G Fees and expenses of any underlying Fidelity Central Funds are not included in the Fund's expense ratio. The Fund indirectly bears its proportionate share of the expenses of any underlying Fidelity Central Funds.
H Expense ratios reflect operating expenses of the Fund. Expenses before reductions do not reflect amounts reimbursed by the investment adviser or reductions from brokerage service arrangements or reductions from other expense offset arrangements and do not represent the amount paid by the Fund during periods when reimbursements or reductions occur. Expenses net of fee waivers reflect expenses after reimbursement by the investment adviser but prior to reductions from brokerage service arrangements or other expense offset arrangements. Expenses net of all reductions represent the net expenses paid by the Fund.
I Annualized
J Amount does not include the portfolio activity of any underlying Fidelity Central Funds.
See accompanying notes which are an integral part of the financial statements.
Health Care Portfolio
Investment Summary (Unaudited)
Top Ten Stocks as of August 31, 2015
| % of fund's net assets | % of fund's net assets 6 months ago | |
| Medtronic PLC | 8.2 | 6.1 |
| Allergan PLC | 6.2 | 8.3 |
| Teva Pharmaceutical Industries Ltd. sponsored ADR | 5.2 | 2.8 |
| Boston Scientific Corp. | 4.7 | 4.0 |
| AbbVie, Inc. | 4.3 | 0.9 |
| McKesson Corp. | 3.3 | 4.2 |
| Vertex Pharmaceuticals, Inc. | 3.0 | 2.6 |
| Bristol-Myers Squibb Co. | 2.6 | 0.7 |
| Amgen, Inc. | 2.6 | 4.6 |
| Cigna Corp. | 2.5 | 1.1 |
| 42.6 |
Top Industries (% of fund's net assets)
| As of August 31, 2015 | ||
| Pharmaceuticals | 35.7% | |
| Health Care Equipment & Supplies | 21.0% | |
| Biotechnology | 19.5% | |
| Health Care Providers & Services | 14.5% | |
| Health Care Technology | 3.5% | |
| All Others* | 5.8% | |
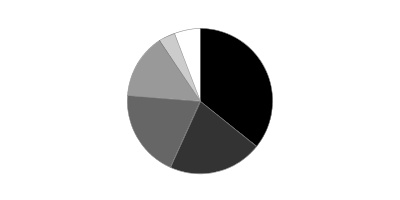
| As of February 28, 2015 | ||
| Pharmaceuticals | 31.0% | |
| Biotechnology | 27.0% | |
| Health Care Equipment & Supplies | 19.3% | |
| Health Care Providers & Services | 12.2% | |
| Health Care Technology | 3.9% | |
| All Others* | 6.6% | |
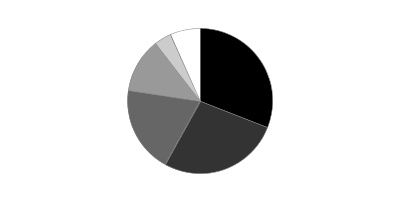
* Includes short-term investments and net other assets (liabilities).
Health Care Portfolio
Investments August 31, 2015 (Unaudited)
Showing Percentage of Net Assets
| Common Stocks - 98.2% | |||
| Shares | Value | ||
| Biotechnology - 19.5% | |||
| Biotechnology - 19.5% | |||
| Ablynx NV (a) | 2,000,000 | $28,266,959 | |
| Acceleron Pharma, Inc. (a) | 569,316 | 16,498,778 | |
| Acorda Therapeutics, Inc. (a) | 867,498 | 27,733,911 | |
| Actelion Ltd. | 300,000 | 40,966,224 | |
| Advaxis, Inc. (a)(b) | 1,500,000 | 22,200,000 | |
| Alnylam Pharmaceuticals, Inc. (a) | 451,919 | 46,506,984 | |
| AMAG Pharmaceuticals, Inc. (a)(b) | 1,222,300 | 76,442,642 | |
| Amgen, Inc. | 1,700,000 | 258,026,000 | |
| Amicus Therapeutics, Inc. (a) | 1,600,000 | 23,008,000 | |
| Arena Pharmaceuticals, Inc. (a)(b) | 7,400,000 | 20,054,000 | |
| Array BioPharma, Inc. (a)(b) | 3,200,000 | 18,880,000 | |
| Biogen, Inc. (a) | 280,000 | 83,244,000 | |
| BioMarin Pharmaceutical, Inc. (a) | 1,080,000 | 139,579,200 | |
| bluebird bio, Inc. (a) | 25,300 | 3,366,671 | |
| Blueprint Medicines Corp. (b) | 249,137 | 6,816,388 | |
| Cara Therapeutics, Inc. (a) | 867,139 | 16,440,955 | |
| Celgene Corp. (a) | 400,000 | 47,232,000 | |
| Cellectis SA sponsored ADR | 900,000 | 30,798,000 | |
| Curis, Inc. (a)(c) | 7,903,965 | 20,708,388 | |
| Discovery Laboratories, Inc. (a)(c) | 6,000,000 | 2,520,000 | |
| Dyax Corp. (a) | 1,711,000 | 39,387,220 | |
| Gilead Sciences, Inc. | 1,100,000 | 115,577,000 | |
| Heron Therapeutics, Inc. (a) | 473,330 | 18,204,272 | |
| Insmed, Inc. (a) | 2,501,200 | 61,129,328 | |
| Intercept Pharmaceuticals, Inc. (a) | 254,100 | 48,218,016 | |
| Mirati Therapeutics, Inc. (a) | 900,000 | 23,238,000 | |
| Neurocrine Biosciences, Inc. (a) | 1,100,000 | 51,018,000 | |
| ProNai Therapeutics, Inc. (a) | 329,600 | 9,541,920 | |
| ProQR Therapeutics BV (a) | 500,000 | 8,710,000 | |
| Prothena Corp. PLC (a) | 335,102 | 19,278,418 | |
| Puma Biotechnology, Inc. (a)(b) | 1,228,000 | 112,877,760 | |
| Spark Therapeutics, Inc. | 454,283 | 19,811,282 | |
| TESARO, Inc. (a) | 940,000 | 48,391,200 | |
| Ultragenyx Pharmaceutical, Inc. (a) | 800,000 | 89,296,000 | |
| United Therapeutics Corp. (a) | 258,031 | 38,864,629 | |
| Vertex Pharmaceuticals, Inc. (a) | 2,330,000 | 297,121,600 | |
| Xencor, Inc. (a) | 1,000,000 | 16,770,000 | |
| 1,946,723,745 | |||
| Capital Markets - 0.1% | |||
| Asset Management & Custody Banks - 0.1% | |||
| RPI International Holdings LP (d) | 38,202 | 5,378,842 | |
| Diversified Consumer Services - 0.2% | |||
| Specialized Consumer Services - 0.2% | |||
| Carriage Services, Inc. | 850,000 | 19,507,500 | |
| Health Care Equipment & Supplies - 20.7% | |||
| Health Care Equipment - 19.8% | |||
| Boston Scientific Corp. (a) | 28,000,000 | 468,720,000 | |
| CONMED Corp. | 1,200,000 | 63,672,000 | |
| Edwards Lifesciences Corp. (a) | 300,000 | 42,264,000 | |
| Genmark Diagnostics, Inc. (a)(c) | 2,228,978 | 23,047,633 | |
| Glaukos Corp. | 773,400 | 22,714,758 | |
| HeartWare International, Inc. (a) | 785,753 | 67,260,457 | |
| Integra LifeSciences Holdings Corp. (a) | 251,887 | 15,108,182 | |
| Medtronic PLC | 11,300,000 | 816,876,996 | |
| Neovasc, Inc. (a)(c) | 4,200,000 | 23,772,000 | |
| Nevro Corp. | 1,000,000 | 45,030,000 | |
| ResMed, Inc. (b) | 900,000 | 46,746,000 | |
| St. Jude Medical, Inc. | 1,409,400 | 99,799,614 | |
| Steris Corp. | 630,000 | 40,351,500 | |
| Tornier NV (a)(c) | 3,000,000 | 66,720,000 | |
| TriVascular Technologies, Inc. (a)(c) | 1,850,000 | 9,823,500 | |
| Zeltiq Aesthetics, Inc. (a)(b) | 1,000,000 | 32,270,000 | |
| Zimmer Biomet Holdings, Inc. | 900,000 | 93,204,000 | |
| 1,977,380,640 | |||
| Health Care Supplies - 0.9% | |||
| Derma Sciences, Inc. (a) | 1,000,000 | 5,830,000 | |
| The Cooper Companies, Inc. | 515,000 | 83,646,300 | |
| 89,476,300 | |||
| TOTAL HEALTH CARE EQUIPMENT & SUPPLIES | 2,066,856,940 | ||
| Health Care Providers & Services - 14.4% | |||
| Health Care Distributors & Services - 3.9% | |||
| Amplifon SpA | 3,000,000 | 24,137,447 | |
| EBOS Group Ltd. | 3,280,000 | 22,638,829 | |
| McKesson Corp. | 1,650,000 | 326,007,000 | |
| United Drug PLC (United Kingdom) | 2,800,000 | 21,676,347 | |
| 394,459,623 | |||
| Health Care Facilities - 3.1% | |||
| Brookdale Senior Living, Inc. (a) | 1,600,000 | 43,872,000 | |
| HCA Holdings, Inc. (a) | 1,100,000 | 95,282,000 | |
| Surgical Care Affiliates, Inc. (a)(c) | 2,000,000 | 73,100,000 | |
| Universal Health Services, Inc. Class B | 700,000 | 95,998,000 | |
| 308,252,000 | |||
| Health Care Services - 2.2% | |||
| Adeptus Health, Inc. Class A (a)(b) | 375,000 | 37,365,000 | |
| DaVita HealthCare Partners, Inc. (a) | 1,000,000 | 75,640,000 | |
| Envision Healthcare Holdings, Inc. (a) | 2,500,000 | 102,425,000 | |
| 215,430,000 | |||
| Managed Health Care - 5.2% | |||
| Cigna Corp. | 1,750,000 | 246,382,500 | |
| UnitedHealth Group, Inc. | 2,000,000 | 231,400,000 | |
| Wellcare Health Plans, Inc. (a) | 500,000 | 45,335,000 | |
| 523,117,500 | |||
| TOTAL HEALTH CARE PROVIDERS & SERVICES | 1,441,259,123 | ||
| Health Care Technology - 3.5% | |||
| Health Care Technology - 3.5% | |||
| athenahealth, Inc. (a)(b) | 920,249 | 122,365,510 | |
| Castlight Health, Inc. | 1,875,650 | 9,922,189 | |
| Castlight Health, Inc. Class B (a) | 274,588 | 1,452,571 | |
| Cerner Corp. (a) | 1,400,000 | 86,464,000 | |
| Connecture, Inc. (b)(c) | 2,000,000 | 14,280,000 | |
| Evolent Health, Inc. | 800,000 | 13,600,000 | |
| HealthStream, Inc. (a)(c) | 1,900,000 | 47,215,000 | |
| Medidata Solutions, Inc. (a) | 1,150,000 | 55,223,000 | |
| 350,522,270 | |||
| Industrial Conglomerates - 1.0% | |||
| Industrial Conglomerates - 1.0% | |||
| Danaher Corp. | 1,200,000 | 104,424,000 | |
| Life Sciences Tools & Services - 2.4% | |||
| Life Sciences Tools & Services - 2.4% | |||
| Agilent Technologies, Inc. | 4,500,000 | 163,395,000 | |
| Bruker Corp. (a) | 2,200,000 | 40,436,000 | |
| PRA Health Sciences, Inc. | 1,000,000 | 37,630,000 | |
| 241,461,000 | |||
| Pharmaceuticals - 35.7% | |||
| Pharmaceuticals - 35.7% | |||
| AbbVie, Inc. | 6,900,000 | 430,629,000 | |
| Allergan PLC (a) | 2,040,000 | 619,629,600 | |
| Bristol-Myers Squibb Co. | 4,400,000 | 261,668,000 | |
| Catalent, Inc. (a) | 1,289,000 | 40,977,310 | |
| Dechra Pharmaceuticals PLC | 2,000,000 | 29,170,845 | |
| Eisai Co. Ltd. | 1,100,000 | 74,935,974 | |
| Endo Health Solutions, Inc. (a) | 2,280,000 | 175,560,000 | |
| Horizon Pharma PLC (a) | 2,380,000 | 69,543,600 | |
| Jazz Pharmaceuticals PLC (a) | 1,000,000 | 168,820,000 | |
| Jiangsu Hengrui Medicine Co. Ltd. | 5,200,000 | 36,208,519 | |
| Mallinckrodt PLC (a) | 1,000,000 | 86,240,000 | |
| Mylan N.V. | 1,400,000 | 69,426,000 | |
| Novartis AG sponsored ADR | 500,000 | 48,610,000 | |
| Pacira Pharmaceuticals, Inc. (a) | 330,000 | 18,991,500 | |
| Perrigo Co. PLC | 800,000 | 146,376,000 | |
| Pfizer, Inc. | 2,800,000 | 90,216,000 | |
| Prestige Brands Holdings, Inc. (a) | 1,360,300 | 63,281,156 | |
| Sanofi SA sponsored ADR | 2,280,000 | 111,537,600 | |
| Shire PLC sponsored ADR | 880,000 | 204,160,000 | |
| Sun Pharmaceutical Industries Ltd. (a) | 2,800,000 | 37,940,843 | |
| Teva Pharmaceutical Industries Ltd. sponsored ADR | 8,100,000 | 521,721,000 | |
| The Medicines Company (a) | 175,771 | 7,206,611 | |
| TherapeuticsMD, Inc. (a)(b) | 5,000,000 | 30,650,000 | |
| Valeant Pharmaceuticals International, Inc. (Canada) (a) | 740,000 | 171,551,079 | |
| ZS Pharma, Inc. (a) | 861,700 | 44,084,572 | |
| 3,559,135,209 | |||
| Professional Services - 0.7% | |||
| Human Resource & Employment Services - 0.7% | |||
| WageWorks, Inc. (a) | 1,440,000 | 64,526,400 | |
| TOTAL COMMON STOCKS | |||
| (Cost $8,112,183,657) | 9,799,795,029 | ||
| Convertible Preferred Stocks - 0.6% | |||
| Health Care Equipment & Supplies - 0.3% | |||
| Health Care Equipment - 0.3% | |||
| Penumbra, Inc. Series F (a)(d) | 1,250,000 | 33,750,000 | |
| Health Care Providers & Services - 0.1% | |||
| Health Care Services - 0.1% | |||
| 1Life Healthcare, Inc. Series G (a)(d) | 1,639,892 | 10,495,309 | |
| Software - 0.2% | |||
| Application Software - 0.2% | |||
| Outset Medical, Inc. Series B (d) | 8,159,125 | 18,500,000 | |
| TOTAL CONVERTIBLE PREFERRED STOCKS | |||
| (Cost $45,800,001) | 62,745,309 | ||
| Money Market Funds - 4.0% | |||
| Fidelity Cash Central Fund, 0.15% (e) | 110,066,179 | 110,066,179 | |
| Fidelity Securities Lending Cash Central Fund, 0.19% (e)(f) | 286,024,385 | 286,024,385 | |
| TOTAL MONEY MARKET FUNDS | |||
| (Cost $396,090,564) | 396,090,564 | ||
| TOTAL INVESTMENT PORTFOLIO - 102.8% | |||
| (Cost $8,554,074,222) | 10,258,630,902 | ||
| NET OTHER ASSETS (LIABILITIES) - (2.8)% | (275,059,048) | ||
| NET ASSETS - 100% | $9,983,571,854 |
Legend
(a) Non-income producing
(b) Security or a portion of the security is on loan at period end.
(c) Affiliated company
(d) Restricted securities - Investment in securities not registered under the Securities Act of 1933 (excluding 144A issues). At the end of the period, the value of restricted securities (excluding 144A issues) amounted to $68,124,150 or 0.7% of net assets.
(e) Affiliated fund that is generally available only to investment companies and other accounts managed by Fidelity Investments. The rate quoted is the annualized seven-day yield of the fund at period end. A complete unaudited listing of the fund's holdings as of its most recent quarter end is available upon request. In addition, each Fidelity Central Fund's financial statements are available on the SEC's website or upon request.
(f) Investment made with cash collateral received from securities on loan.
Additional information on each restricted holding is as follows:
| Security | Acquisition Date | Acquisition Cost |
| 1Life Healthcare, Inc. Series G | 4/10/14 | $10,800,001 |
| Outset Medical, Inc. Series B | 5/5/15 | $18,500,000 |
| Penumbra, Inc. Series F | 5/16/14 | $16,500,000 |
| RPI International Holdings LP | 5/21/15 | $4,504,016 |
Affiliated Central Funds
Information regarding fiscal year to date income earned by the Fund from investments in Fidelity Central Funds is as follows:
| Fund | Income earned |
| Fidelity Cash Central Fund | $98,147 |
| Fidelity Securities Lending Cash Central Fund | 591,803 |
| Total | $689,950 |
Other Affiliated Issuers
An affiliated company is a company in which the Fund has ownership of at least 5% of the voting securities. Fiscal year to date transactions with companies which are or were affiliates are as follows:
| Affiliate | Value, beginning of period | Purchases | Sales Proceeds | Dividend Income | Value, end of period |
| Connecture, Inc. | $17,280,000 | $-- | $-- | $-- | $14,280,000 |
| Curis, Inc. | 21,019,931 | 3,301,784 | -- | -- | 20,708,388 |
| Discovery Laboratories, Inc. | 8,855,000 | 637,500 | -- | -- | 2,520,000 |
| Genmark Diagnostics, Inc. | 27,500,449 | 639,162 | -- | -- | 23,047,633 |
| HealthStream, Inc. | 38,820,000 | 10,583,785 | -- | -- | 47,215,000 |
| Mirati Therapeutics, Inc. | 16,639,000 | 5,420,919 | -- | -- | -- |
| Neovasc, Inc. | 39,600,000 | 1,795,800 | -- | -- | 23,772,000 |
| Surgical Care Affiliates, Inc. | 38,976,000 | 27,175,068 | -- | -- | 73,100,000 |
| Tornier NV | 52,020,955 | 22,559,889 | -- | -- | 66,720,000 |
| TriVascular Technologies, Inc. | 13,381,307 | 4,700,086 | -- | -- | 9,823,500 |
| Vanda Pharmaceuticals, Inc. | 23,672,000 | -- | 22,115,861 | -- | -- |
| Total | $297,764,642 | $76,813,993 | $22,115,861 | $-- | $281,186,521 |
Investment Valuation
The following is a summary of the inputs used, as of August 31, 2015, involving the Fund's assets and liabilities carried at fair value. The inputs or methodology used for valuing securities may not be an indication of the risk associated with investing in those securities. For more information on valuation inputs, and their aggregation into the levels used below, please refer to the Investment Valuation section in the accompanying Notes to Financial Statements.
| Valuation Inputs at Reporting Date: | ||||
| Description | Total | Level 1 | Level 2 | Level 3 |
| Investments in Securities: | ||||
| Common Stocks | $9,799,795,029 | $9,719,480,213 | $74,935,974 | $5,378,842 |
| Convertible Preferred Stocks | 62,745,309 | -- | -- | 62,745,309 |
| Money Market Funds | 396,090,564 | 396,090,564 | -- | -- |
| Total Investments in Securities: | $10,258,630,902 | $10,115,570,777 | $74,935,974 | $68,124,151 |
The following is a summary of transfers between Level 1 and Level 2 for the period ended August 31, 2015. Transfers are assumed to have occurred at the beginning of the period, and are primarily attributable to the valuation techniques used for foreign equity securities, as discussed in the accompanying Notes to Financial Statements:
| Transfers | Total |
| Level 1 to Level 2 | $52,179,728 |
| Level 2 to Level 1 | $146,178,750 |
Other Information
Distribution of investments by country or territory of incorporation, as a percentage of Total Net Assets, is as follows (Unaudited):
| United States of America | 63.1% |
| Ireland | 21.4% |
| Israel | 5.2% |
| Bailiwick of Jersey | 2.0% |
| Canada | 1.9% |
| Netherlands | 1.5% |
| France | 1.4% |
| Others (Individually Less Than 1%) | 3.5% |
| 100.0% |
See accompanying notes which are an integral part of the financial statements.
Health Care Portfolio
Financial Statements
Statement of Assets and Liabilities
| August 31, 2015 (Unaudited) | ||
| Assets | ||
| Investment in securities, at value (including securities loaned of $271,329,295) — See accompanying schedule: Unaffiliated issuers (cost $7,849,423,911) | $9,581,353,817 | |
| Fidelity Central Funds (cost $396,090,564) | 396,090,564 | |
| Other affiliated issuers (cost $308,559,747) | 281,186,521 | |
| Total Investments (cost $8,554,074,222) | $10,258,630,902 | |
| Receivable for investments sold | 28,967,964 | |
| Receivable for fund shares sold | 13,137,680 | |
| Dividends receivable | 5,592,247 | |
| Distributions receivable from Fidelity Central Funds | 89,611 | |
| Prepaid expenses | 83,152 | |
| Other receivables | 282,189 | |
| Total assets | 10,306,783,745 | |
| Liabilities | ||
| Payable for investments purchased | $14,544,205 | |
| Payable for fund shares redeemed | 16,054,152 | |
| Accrued management fee | 4,798,856 | |
| Other affiliated payables | 1,472,312 | |
| Other payables and accrued expenses | 317,981 | |
| Collateral on securities loaned, at value | 286,024,385 | |
| Total liabilities | 323,211,891 | |
| Net Assets | $9,983,571,854 | |
| Net Assets consist of: | ||
| Paid in capital | $7,542,404,396 | |
| Accumulated net investment loss | (5,594,650) | |
| Accumulated undistributed net realized gain (loss) on investments and foreign currency transactions | 742,205,428 | |
| Net unrealized appreciation (depreciation) on investments | 1,704,556,680 | |
| Net Assets, for 44,325,704 shares outstanding | $9,983,571,854 | |
| Net Asset Value, offering price and redemption price per share ($9,983,571,854 ÷ 44,325,704 shares) | $225.23 |
See accompanying notes which are an integral part of the financial statements.
Statement of Operations
| Six months ended August 31, 2015 (Unaudited) | ||
| Investment Income | ||
| Dividends | $33,704,214 | |
| Income from Fidelity Central Funds (including $591,803 from security lending) | 689,950 | |
| Income before foreign taxes withheld | 34,394,164 | |
| Less foreign taxes withheld | (1,917,647) | |
| Total income | 32,476,517 | |
| Expenses | ||
| Management fee | $28,922,374 | |
| Transfer agent fees | 8,074,029 | |
| Accounting and security lending fees | 679,672 | |
| Custodian fees and expenses | 87,814 | |
| Independent trustees' compensation | 87,399 | |
| Appreciation in deferred trustee compensation account | 524 | |
| Registration fees | 392,852 | |
| Audit | 27,682 | |
| Legal | 60,406 | |
| Interest | 468 | |
| Miscellaneous | 44,871 | |
| Total expenses before reductions | 38,378,091 | |
| Expense reductions | (524,128) | 37,853,963 |
| Net investment income (loss) | (5,377,446) | |
| Realized and Unrealized Gain (Loss)
Net realized gain (loss) on: | ||
| Investment securities: | ||
| Unaffiliated issuers | 737,487,914 | |
| Other affiliated issuers | (1,037,081) | |
| Foreign currency transactions | 908 | |
| Total net realized gain (loss) | 736,451,741 | |
| Change in net unrealized appreciation (depreciation) on: Investment securities | (846,420,453) | |
| Assets and liabilities in foreign currencies | 8 | |
| Total change in net unrealized appreciation (depreciation) | (846,420,445) | |
| Net gain (loss) | (109,968,704) | |
| Net increase (decrease) in net assets resulting from operations | $(115,346,150) |
See accompanying notes which are an integral part of the financial statements.
Statement of Changes in Net Assets
| Six months ended August 31, 2015 (Unaudited) | Year ended February 28, 2015 | |
| Increase (Decrease) in Net Assets | ||
| Operations | ||
| Net investment income (loss) | $(5,377,446) | $(12,736,218) |
| Net realized gain (loss) | 736,451,741 | 1,233,760,978 |
| Change in net unrealized appreciation (depreciation) | (846,420,445) | 588,737,627 |
| Net increase (decrease) in net assets resulting from operations | (115,346,150) | 1,809,762,387 |
| Distributions to shareholders from net realized gain | (408,347,668) | (1,009,840,103) |
| Share transactions | ||
| Proceeds from sales of shares | 1,703,699,030 | 4,120,654,780 |
| Reinvestment of distributions | 388,966,602 | 964,770,473 |
| Cost of shares redeemed | (1,417,340,493) | (2,234,166,562) |
| Net increase (decrease) in net assets resulting from share transactions | 675,325,139 | 2,851,258,691 |
| Redemption fees | 132,572 | 346,983 |
| Total increase (decrease) in net assets | 151,763,893 | 3,651,527,958 |
| Net Assets | ||
| Beginning of period | 9,831,807,961 | 6,180,280,003 |
| End of period (including accumulated net investment loss of $5,594,650 and accumulated net investment loss of $217,204, respectively) | $9,983,571,854 | $9,831,807,961 |
| Other Information
Shares | ||
| Sold | 7,114,760 | 19,148,481 |
| Issued in reinvestment of distributions | 1,615,914 | 4,618,668 |
| Redeemed | (5,988,820) | (10,679,375) |
| Net increase (decrease) | 2,741,854 | 13,087,774 |
See accompanying notes which are an integral part of the financial statements.
Financial Highlights — Health Care Portfolio
| Six months ended (Unaudited) | Years ended February 28, | |||||
| August 31, | 2015 | 2015 | 2014 | 2013 | 2012A | 2011 |
| Selected Per–Share Data | ||||||
| Net asset value, beginning of period | $236.43 | $216.88 | $144.20 | $133.07 | $133.93 | $109.17 |
| Income from Investment Operations | ||||||
| Net investment income (loss)B | (.12) | (.38) | (.20) | .50 | –C | .04 |
| Net realized and unrealized gain (loss) | (1.50) | 50.00 | 92.44 | 24.74 | 10.86 | 24.90 |
| Total from investment operations | (1.62) | 49.62 | 92.24 | 25.24 | 10.86 | 24.94 |
| Distributions from net investment income | – | – | (.03) | (.44) | – | (.17) |
| Distributions from net realized gain | (9.58) | (30.08) | (19.53) | (13.67) | (11.72) | (.01) |
| Total distributions | (9.58) | (30.08) | (19.57)D | (14.11) | (11.72) | (.18) |
| Redemption fees added to paid in capitalB | –C | .01 | .01 | –C | –C | –C |
| Net asset value, end of period | $225.23 | $236.43 | $216.88 | $144.20 | $133.07 | $133.93 |
| Total ReturnE,F | (.95)% | 25.44% | 67.13% | 20.07% | 9.10% | 22.86% |
| Ratios to Average Net AssetsG,H | ||||||
| Expenses before reductions | .73%I | .74% | .77% | .79% | .80% | .82% |
| Expenses net of fee waivers, if any | .72%I | .74% | .77% | .79% | .80% | .82% |
| Expenses net of all reductions | .72%I | .74% | .76% | .78% | .80% | .82% |
| Net investment income (loss) | (.10)%I | (.18)% | (.11)% | .36% | .00%J | .03% |
| Supplemental Data | ||||||
| Net assets, end of period (000 omitted) | $9,983,572 | $9,831,808 | $6,180,280 | $2,724,341 | $2,176,224 | $1,991,604 |
| Portfolio turnover rateK | 81%I | 98%L | 99% | 95% | 130% | 99% |
A For the year ended February 29.
B Calculated based on average shares outstanding during the period.
C Amount represents less than $.005 per share.
D Total distributions of $19.57 per share is comprised of distributions from net investment income of $.034 and distributions from net realized gain of $19.532 per share.
E Total returns for periods of less than one year are not annualized.
F Total returns would have been lower if certain expenses had not been reduced during the applicable periods shown.
G Fees and expenses of any underlying Fidelity Central Funds are not included in the Fund's expense ratio. The Fund indirectly bears its proportionate share of the expenses of any underlying Fidelity Central Funds.
H Expense ratios reflect operating expenses of the Fund. Expenses before reductions do not reflect amounts reimbursed by the investment adviser or reductions from brokerage service arrangements or reductions from other expense offset arrangements and do not represent the amount paid by the Fund during periods when reimbursements or reductions occur. Expenses net of fee waivers reflect expenses after reimbursement by the investment adviser but prior to reductions from brokerage service arrangements or other expense offset arrangements. Expenses net of all reductions represent the net expenses paid by the Fund.
I Annualized
J Amount represents less than .005%.
K Amount does not include the portfolio activity of any underlying Fidelity Central Funds.
L Portfolio turnover rate excludes securities received or delivered in-kind.
See accompanying notes which are an integral part of the financial statements.
Medical Delivery Portfolio
Investment Summary (Unaudited)
Top Ten Stocks as of August 31, 2015
| % of fund's net assets | % of fund's net assets 6 months ago | |
| UnitedHealth Group, Inc. | 18.0 | 17.2 |
| Express Scripts Holding Co. | 10.8 | 11.7 |
| McKesson Corp. | 7.9 | 8.4 |
| Cigna Corp. | 6.2 | 5.5 |
| Cardinal Health, Inc. | 6.1 | 6.6 |
| HCA Holdings, Inc. | 4.9 | 4.9 |
| Anthem, Inc. | 4.8 | 4.2 |
| DaVita HealthCare Partners, Inc. | 4.4 | 4.2 |
| Aetna, Inc. | 4.3 | 4.5 |
| Henry Schein, Inc. | 2.8 | 2.9 |
| 70.2 |
Top Industries (% of fund's net assets)
| As of August 31, 2015 | ||
| Health Care Providers & Services | 97.6% | |
| Professional Services | 0.4% | |
| IT Services | 0.3% | |
| Diversified Consumer Services | 0.1% | |
| Industrial Conglomerates | 0.1% | |
| All Others* | 1.5% | |

| As of February 28, 2015 | ||
| Health Care Providers & Services | 97.2% | |
| Professional Services | 0.3% | |
| Diversified Consumer Services | 0.2% | |
| Industrial Conglomerates | 0.1% | |
| Health Care Equipment & Supplies | 0.1% | |
| All Others* | 2.1% | |

* Includes short-term investments and net other assets (liabilities).
Medical Delivery Portfolio
Investments August 31, 2015 (Unaudited)
Showing Percentage of Net Assets
| Common Stocks - 98.7% | |||
| Shares | Value | ||
| Commercial Services & Supplies - 0.1% | |||
| Environmental & Facility Services - 0.1% | |||
| Stericycle, Inc. (a) | 6,500 | $917,410 | |
| Diversified Consumer Services - 0.1% | |||
| Specialized Consumer Services - 0.1% | |||
| H&R Block, Inc. | 28,700 | 976,374 | |
| Food & Staples Retailing - 0.0% | |||
| Drug Retail - 0.0% | |||
| Jean Coutu Group, Inc. Class A (sub. vtg.) | 33,000 | 507,441 | |
| Health Care Equipment & Supplies - 0.1% | |||
| Health Care Equipment - 0.1% | |||
| IDEXX Laboratories, Inc. (a) | 11,200 | 800,464 | |
| Health Care Providers & Services - 97.6% | |||
| Health Care Distributors & Services - 19.4% | |||
| AmerisourceBergen Corp. | 261,600 | 26,170,464 | |
| Cardinal Health, Inc. | 733,800 | 60,369,726 | |
| Henry Schein, Inc. (a) | 204,600 | 27,991,326 | |
| McKesson Corp. | 396,600 | 78,360,228 | |
| 192,891,744 | |||
| Health Care Facilities - 13.1% | |||
| Acadia Healthcare Co., Inc. (a) | 20,200 | 1,475,206 | |
| AmSurg Corp. (a) | 271,516 | 21,292,285 | |
| Community Health Systems, Inc. (a) | 330,500 | 17,747,850 | |
| HCA Holdings, Inc. (a) | 563,100 | 48,775,722 | |
| HealthSouth Corp. | 305,400 | 13,040,580 | |
| LifePoint Hospitals, Inc. (a) | 114,300 | 8,930,259 | |
| U.S. Physical Therapy, Inc. | 174,400 | 8,013,680 | |
| Universal Health Services, Inc. Class B | 80,600 | 11,053,484 | |
| 130,329,066 | |||
| Health Care Services - 27.7% | |||
| Accretive Health, Inc. (a) | 1,140,700 | 3,136,925 | |
| Adeptus Health, Inc. Class A (a)(b) | 40,300 | 4,015,492 | |
| Air Methods Corp. (a)(b) | 275,400 | 10,313,730 | |
| AMN Healthcare Services, Inc. (a) | 125,276 | 4,209,274 | |
| BioScrip, Inc. (a)(b) | 548,202 | 1,332,131 | |
| Corvel Corp. (a) | 84,200 | 2,528,526 | |
| DaVita HealthCare Partners, Inc. (a) | 572,600 | 43,311,464 | |
| Envision Healthcare Holdings, Inc. (a) | 220,600 | 9,037,982 | |
| Express Scripts Holding Co. (a) | 1,280,450 | 107,045,620 | |
| Fresenius SE & Co. KGaA | 99,000 | 7,004,404 | |
| IPC The Hospitalist Co., Inc. (a) | 50,300 | 3,993,820 | |
| Laboratory Corp. of America Holdings (a) | 121,000 | 14,255,010 | |
| Landauer, Inc. | 63,100 | 2,423,671 | |
| MEDNAX, Inc. (a) | 312,200 | 25,147,710 | |
| Providence Service Corp. (a) | 60,500 | 2,712,215 | |
| Quest Diagnostics, Inc. | 331,700 | 22,489,260 | |
| Team Health Holdings, Inc. (a) | 212,800 | 12,499,872 | |
| 275,457,106 | |||
| Managed Health Care - 37.4% | |||
| Aetna, Inc. | 376,800 | 43,151,136 | |
| Anthem, Inc. | 341,700 | 48,196,785 | |
| Centene Corp. (a) | 127,700 | 7,881,644 | |
| Cigna Corp. | 438,500 | 61,736,415 | |
| Health Net, Inc. (a) | 53,900 | 3,452,834 | |
| Humana, Inc. | 133,500 | 24,402,465 | |
| Molina Healthcare, Inc. (a) | 61,900 | 4,617,121 | |
| UnitedHealth Group, Inc. | 1,550,397 | 179,380,933 | |
| 372,819,333 | |||
| TOTAL HEALTH CARE PROVIDERS & SERVICES | 971,497,249 | ||
| Health Care Technology - 0.0% | |||
| Health Care Technology - 0.0% | |||
| Castlight Health, Inc. Class B (a) | 4,500 | 23,805 | |
| Industrial Conglomerates - 0.1% | |||
| Industrial Conglomerates - 0.1% | |||
| Danaher Corp. | 10,600 | 922,412 | |
| IT Services - 0.3% | |||
| Data Processing & Outsourced Services - 0.3% | |||
| Xerox Corp. | 248,000 | 2,522,160 | |
| Professional Services - 0.4% | |||
| Research & Consulting Services - 0.4% | |||
| Huron Consulting Group, Inc. (a) | 44,300 | 3,206,877 | |
| Verisk Analytics, Inc. (a) | 12,900 | 942,732 | |
| 4,149,609 | |||
| TOTAL COMMON STOCKS | |||
| (Cost $626,084,627) | 982,316,924 | ||
| Money Market Funds - 2.3% | |||
| Fidelity Cash Central Fund, 0.15% (c) | 17,160,207 | 17,160,207 | |
| Fidelity Securities Lending Cash Central Fund, 0.19% (c)(d) | 5,193,525 | 5,193,525 | |
| TOTAL MONEY MARKET FUNDS | |||
| (Cost $22,353,732) | 22,353,732 | ||
| TOTAL INVESTMENT PORTFOLIO - 101.0% | |||
| (Cost $648,438,359) | 1,004,670,656 | ||
| NET OTHER ASSETS (LIABILITIES) - (1.0)% | (9,819,341) | ||
| NET ASSETS - 100% | $994,851,315 |
Legend
(a) Non-income producing
(b) Security or a portion of the security is on loan at period end.
(c) Affiliated fund that is generally available only to investment companies and other accounts managed by Fidelity Investments. The rate quoted is the annualized seven-day yield of the fund at period end. A complete unaudited listing of the fund's holdings as of its most recent quarter end is available upon request. In addition, each Fidelity Central Fund's financial statements are available on the SEC's website or upon request.
(d) Investment made with cash collateral received from securities on loan.
Affiliated Central Funds
Information regarding fiscal year to date income earned by the Fund from investments in Fidelity Central Funds is as follows:
| Fund | Income earned |
| Fidelity Cash Central Fund | $14,110 |
| Fidelity Securities Lending Cash Central Fund | 16,332 |
| Total | $30,442 |
Investment Valuation
All investments are categorized as Level 1 under the Fair Value Hierarchy. The inputs or methodology used for valuing securities may not be an indication of the risk associated with investing in those securities. For more information on valuation inputs please refer to the Investment Valuation section in the accompanying Notes to Financial Statements.
See accompanying notes which are an integral part of the financial statements.
Medical Delivery Portfolio
Financial Statements
Statement of Assets and Liabilities
| August 31, 2015 (Unaudited) | ||
| Assets | ||
| Investment in securities, at value (including securities loaned of $4,959,383) — See accompanying schedule: Unaffiliated issuers (cost $626,084,627) | $982,316,924 | |
| Fidelity Central Funds (cost $22,353,732) | 22,353,732 | |
| Total Investments (cost $648,438,359) | $1,004,670,656 | |
| Receivable for fund shares sold | 1,198,623 | |
| Dividends receivable | 221,816 | |
| Distributions receivable from Fidelity Central Funds | 4,654 | |
| Prepaid expenses | 8,072 | |
| Other receivables | 19,743 | |
| Total assets | 1,006,123,564 | |
| Liabilities | ||
| Payable for investments purchased | $2,596,350 | |
| Payable for fund shares redeemed | 2,786,362 | |
| Accrued management fee | 475,737 | |
| Other affiliated payables | 180,499 | |
| Other payables and accrued expenses | 39,776 | |
| Collateral on securities loaned, at value | 5,193,525 | |
| Total liabilities | 11,272,249 | |
| Net Assets | $994,851,315 | |
| Net Assets consist of: | ||
| Paid in capital | $617,274,279 | |
| Accumulated net investment loss | (513,707) | |
| Accumulated undistributed net realized gain (loss) on investments and foreign currency transactions | 21,859,749 | |
| Net unrealized appreciation (depreciation) on investments and assets and liabilities in foreign currencies | 356,230,994 | |
| Net Assets, for 11,330,799 shares outstanding | $994,851,315 | |
| Net Asset Value, offering price and redemption price per share ($994,851,315 ÷ 11,330,799 shares) | $87.80 |
See accompanying notes which are an integral part of the financial statements.
Statement of Operations
| Six months ended August 31, 2015 (Unaudited) | ||
| Investment Income | ||
| Dividends | $3,235,826 | |
| Income from Fidelity Central Funds (including $16,332 from security lendding) | 30,442 | |
| Total income | 3,266,268 | |
| Expenses | ||
| Management fee | $2,689,943 | |
| Transfer agent fees | 858,843 | |
| Accounting and security lending fees | 164,470 | |
| Custodian fees and expenses | 6,879 | |
| Independent trustees' compensation | 8,064 | |
| Registration fees | 39,536 | |
| Audit | 18,896 | |
| Legal | 5,956 | |
| Miscellaneous | 4,779 | |
| Total expenses before reductions | 3,797,366 | |
| Expense reductions | (23,138) | 3,774,228 |
| Net investment income (loss) | (507,960) | |
| Realized and Unrealized Gain (Loss)
Net realized gain (loss) on: | ||
| Investment securities: | ||
| Unaffiliated issuers | 23,852,322 | |
| Foreign currency transactions | (10,092) | |
| Total net realized gain (loss) | 23,842,230 | |
| Change in net unrealized appreciation (depreciation) on: Investment securities | (7,373,190) | |
| Assets and liabilities in foreign currencies | (1,428) | |
| Total change in net unrealized appreciation (depreciation) | (7,374,618) | |
| Net gain (loss) | 16,467,612 | |
| Net increase (decrease) in net assets resulting from operations | $15,959,652 |
See accompanying notes which are an integral part of the financial statements.
Statement of Changes in Net Assets
| Six months ended August 31, 2015 (Unaudited) | Year ended February 28, 2015 | |
| Increase (Decrease) in Net Assets | ||
| Operations | ||
| Net investment income (loss) | $(507,960) | $(856,688) |
| Net realized gain (loss) | 23,842,230 | 67,152,548 |
| Change in net unrealized appreciation (depreciation) | (7,374,618) | 113,459,236 |
| Net increase (decrease) in net assets resulting from operations | 15,959,652 | 179,755,096 |
| Distributions to shareholders from net realized gain | (16,515,558) | (68,132,265) |
| Share transactions | ||
| Proceeds from sales of shares | 236,339,579 | 205,039,822 |
| Reinvestment of distributions | 15,897,703 | 65,616,728 |
| Cost of shares redeemed | (135,266,604) | (196,364,541) |
| Net increase (decrease) in net assets resulting from share transactions | 116,970,678 | 74,292,009 |
| Redemption fees | 20,442 | 15,203 |
| Total increase (decrease) in net assets | 116,435,214 | 185,930,043 |
| Net Assets | ||
| Beginning of period | 878,416,101 | 692,486,058 |
| End of period (including accumulated net investment loss of $513,707 and accumulated net investment loss of $5,747, respectively) | $994,851,315 | $878,416,101 |
| Other Information
Shares | ||
| Sold | 2,580,742 | 2,561,684 |
| Issued in reinvestment of distributions | 177,133 | 847,811 |
| Redeemed | (1,493,464) | (2,508,957) |
| Net increase (decrease) | 1,264,411 | 900,538 |
See accompanying notes which are an integral part of the financial statements.
Financial Highlights — Medical Delivery Portfolio
| Six months ended (Unaudited) | Years ended February 28, | |||||
| August 31, | 2015 | 2015 | 2014 | 2013 | 2012A | 2011 |
| Selected Per–Share Data | ||||||
| Net asset value, beginning of period | $87.26 | $75.55 | $59.90 | $61.26 | $55.32 | $44.38 |
| Income from Investment Operations | ||||||
| Net investment income (loss)B | (.05) | (.09) | (.07) | .06 | (.03) | (.25) |
| Net realized and unrealized gain (loss) | 2.18 | 19.25 | 20.08 | 1.77 | 5.96 | 11.19 |
| Total from investment operations | 2.13 | 19.16 | 20.01 | 1.83 | 5.93 | 10.94 |
| Distributions from net investment income | – | – | – | (.03) | – | – |
| Distributions from net realized gain | (1.59) | (7.45) | (4.36) | (3.16) | – | – |
| Total distributions | (1.59) | (7.45) | (4.36) | (3.19) | – | – |
| Redemption fees added to paid in capitalB | –C | –C | –C | –C | .01 | –C |
| Net asset value, end of period | $87.80 | $87.26 | $75.55 | $59.90 | $61.26 | $55.32 |
| Total ReturnD,E | 2.40% | 26.88% | 34.22% | 3.17% | 10.74% | 24.65% |
| Ratios to Average Net AssetsF,G | ||||||
| Expenses before reductions | .77%H | .79% | .82% | .84% | .86% | .89% |
| Expenses net of fee waivers, if any | .77%H | .79% | .82% | .84% | .86% | .89% |
| Expenses net of all reductions | .77%H | .79% | .82% | .83% | .84% | .88% |
| Net investment income (loss) | (.10)%H | (.12)% | (.10)% | .10% | (.05)% | (.54)% |
| Supplemental Data | ||||||
| Net assets, end of period (000 omitted) | $994,851 | $878,416 | $692,486 | $562,949 | $870,358 | $566,400 |
| Portfolio turnover rateI | 14%H | 44% | 65% | 96% | 86% | 55% |
A For the year ended February 29.
B Calculated based on average shares outstanding during the period.
C Amount represents less than $.005 per share.
D Total returns for periods of less than one year are not annualized.
E Total returns would have been lower if certain expenses had not been reduced during the applicable periods shown.
F Fees and expenses of any underlying Fidelity Central Funds are not included in the Fund's expense ratio. The Fund indirectly bears its proportionate share of the expenses of any underlying Fidelity Central Funds.
G Expense ratios reflect operating expenses of the Fund. Expenses before reductions do not reflect amounts reimbursed by the investment adviser or reductions from brokerage service arrangements or reductions from other expense offset arrangements and do not represent the amount paid by the Fund during periods when reimbursements or reductions occur. Expenses net of fee waivers reflect expenses after reimbursement by the investment adviser but prior to reductions from brokerage service arrangements or other expense offset arrangements. Expenses net of all reductions represent the net expenses paid by the Fund.
H Annualized
I Amount does not include the portfolio activity of any underlying Fidelity Central Funds.
See accompanying notes which are an integral part of the financial statements.
Medical Equipment and Systems Portfolio
Investment Summary (Unaudited)
Top Ten Stocks as of August 31, 2015
| % of fund's net assets | % of fund's net assets 6 months ago | |
| Medtronic PLC | 23.5 | 22.8 |
| Boston Scientific Corp. | 11.3 | 10.8 |
| Abbott Laboratories | 7.6 | 6.5 |
| St. Jude Medical, Inc. | 5.0 | 1.1 |
| Zimmer Biomet Holdings, Inc. | 4.8 | 6.5 |
| Stryker Corp. | 4.7 | 2.2 |
| The Cooper Companies, Inc. | 3.1 | 4.3 |
| Edwards Lifesciences Corp. | 2.3 | 3.2 |
| Tornier NV | 2.2 | 1.9 |
| Integra LifeSciences Holdings Corp. | 2.2 | 1.6 |
| 66.7 |
Top Industries (% of fund's net assets)
| As of August 31, 2015 | ||
| Health Care Equipment & Supplies | 92.3% | |
| Pharmaceuticals | 2.0% | |
| Life Sciences Tools & Services | 1.9% | |
| Health Care Providers & Services | 1.1% | |
| Industrial Conglomerates | 1.0% | |
| All Others* | 1.7% | |

| As of February 28, 2015 | ||
| Health Care Equipment & Supplies | 87.4% | |
| Pharmaceuticals | 5.7% | |
| Life Sciences Tools & Services | 2.4% | |
| Biotechnology | 1.4% | |
| Health Care Providers & Services | 1.1% | |
| All Others* | 2.0% | |

* Includes short-term investments and net other assets (liabilities).
Medical Equipment and Systems Portfolio
Investments August 31, 2015 (Unaudited)
Showing Percentage of Net Assets
| Common Stocks - 97.9% | |||
| Shares | Value | ||
| Biotechnology - 0.5% | |||
| Biotechnology - 0.5% | |||
| Puma Biotechnology, Inc. (a) | 120,000 | $11,030,400 | |
| Health Care Equipment & Supplies - 91.0% | |||
| Health Care Equipment - 84.8% | |||
| Abbott Laboratories | 3,400,000 | 153,986,000 | |
| Atricure, Inc. (a) | 950,000 | 23,237,000 | |
| Boston Scientific Corp. (a) | 13,700,000 | 229,338,000 | |
| Cardiovascular Systems, Inc. (a) | 400,000 | 9,632,000 | |
| CONMED Corp. | 600,000 | 31,836,000 | |
| Cyberonics, Inc. (a) | 360,000 | 23,522,400 | |
| DexCom, Inc. (a) | 120,000 | 11,296,800 | |
| Edwards Lifesciences Corp. (a) | 330,000 | 46,490,400 | |
| Entellus Medical, Inc. (b) | 200,000 | 4,452,000 | |
| Fukuda Denshi Co. Ltd. | 200,000 | 10,184,906 | |
| Genmark Diagnostics, Inc. (a)(b) | 1,280,000 | 13,235,200 | |
| Glaukos Corp. (b) | 340,000 | 9,985,800 | |
| HeartWare International, Inc. (a)(b) | 281,761 | 24,118,742 | |
| Inogen, Inc. (a) | 400,000 | 19,716,000 | |
| Integra LifeSciences Holdings Corp. (a) | 740,000 | 44,385,200 | |
| Intuitive Surgical, Inc. (a) | 44,000 | 22,481,800 | |
| Invuity, Inc. | 444,700 | 6,030,132 | |
| K2M Group Holdings, Inc. (a) | 1,000,000 | 21,230,000 | |
| Masimo Corp. (a) | 330,000 | 13,407,900 | |
| Medtronic PLC | 6,600,000 | 477,114,000 | |
| Natus Medical, Inc. (a) | 650,000 | 26,442,000 | |
| Neovasc, Inc. (a) | 2,421,948 | 13,708,226 | |
| Nevro Corp. (b) | 440,000 | 19,813,200 | |
| NuVasive, Inc. (a) | 100,000 | 5,272,000 | |
| ResMed, Inc. (b) | 777,264 | 40,371,092 | |
| St. Jude Medical, Inc. | 1,440,000 | 101,966,400 | |
| Steris Corp. (b) | 400,000 | 25,620,000 | |
| Stryker Corp. | 960,000 | 94,704,000 | |
| Teleflex, Inc. | 300,000 | 39,240,000 | |
| Tornier NV (a) | 2,000,000 | 44,480,000 | |
| TriVascular Technologies, Inc. (a)(b) | 700,000 | 3,717,000 | |
| Zeltiq Aesthetics, Inc. (a)(b) | 400,000 | 12,908,000 | |
| Zimmer Biomet Holdings, Inc. | 950,000 | 98,382,000 | |
| 1,722,304,198 | |||
| Health Care Supplies - 6.2% | |||
| ASAHI INTECC Co. Ltd. | 320,000 | 13,000,571 | |
| Derma Sciences, Inc. (a)(b) | 700,000 | 4,081,000 | |
| Endologix, Inc. (a)(b) | 1,000,000 | 12,980,000 | |
| Sientra, Inc. (b) | 430,000 | 10,229,700 | |
| The Cooper Companies, Inc. | 390,000 | 63,343,800 | |
| The Spectranetics Corp. (a)(b) | 700,000 | 11,795,000 | |
| Vascular Solutions, Inc. (a) | 280,000 | 9,676,800 | |
| 125,106,871 | |||
| TOTAL HEALTH CARE EQUIPMENT & SUPPLIES | 1,847,411,069 | ||
| Health Care Providers & Services - 1.0% | |||
| Health Care Distributors & Services - 0.4% | |||
| Amplifon SpA | 1,000,000 | 8,045,816 | |
| Health Care Services - 0.6% | |||
| Miraca Holdings, Inc. | 260,000 | 11,121,646 | |
| TOTAL HEALTH CARE PROVIDERS & SERVICES | 19,167,462 | ||
| Health Care Technology - 0.5% | |||
| Health Care Technology - 0.5% | |||
| Castlight Health, Inc. | 999,300 | 5,286,297 | |
| Castlight Health, Inc. Class B (a) | 70,283 | 371,797 | |
| HTG Molecular Diagnostics (c) | 673,461 | 3,885,870 | |
| 9,543,964 | |||
| Industrial Conglomerates - 1.0% | |||
| Industrial Conglomerates - 1.0% | |||
| Danaher Corp. | 240,000 | 20,884,800 | |
| Life Sciences Tools & Services - 1.9% | |||
| Life Sciences Tools & Services - 1.9% | |||
| Agilent Technologies, Inc. | 800,000 | 29,048,000 | |
| Bruker Corp. (a) | 500,000 | 9,190,000 | |
| 38,238,000 | |||
| Pharmaceuticals - 2.0% | |||
| Pharmaceuticals - 2.0% | |||
| Allergan PLC (a) | 50,000 | 15,187,000 | |
| Teva Pharmaceutical Industries Ltd. sponsored ADR | 400,000 | 25,764,000 | |
| 40,951,000 | |||
| TOTAL COMMON STOCKS | |||
| (Cost $1,584,301,375) | 1,987,226,695 | ||
| Preferred Stocks - 1.8% | |||
| Convertible Preferred Stocks - 0.8% | |||
| Health Care Equipment & Supplies - 0.3% | |||
| Health Care Equipment - 0.3% | |||
| Penumbra, Inc. Series F (a)(d) | 265,152 | 7,159,104 | |
| Health Care Providers & Services - 0.1% | |||
| Health Care Services - 0.1% | |||
| 1Life Healthcare, Inc. Series G (a)(d) | 455,526 | 2,915,366 | |
| Software - 0.4% | |||
| Application Software - 0.4% | |||
| Outset Medical, Inc. Series B (d) | 3,307,754 | 7,500,001 | |
| TOTAL CONVERTIBLE PREFERRED STOCKS | 17,574,471 | ||
| Nonconvertible Preferred Stocks - 1.0% | |||
| Health Care Equipment & Supplies - 1.0% | |||
| Health Care Equipment - 1.0% | |||
| Sartorius AG (non-vtg.) | 90,000 | 19,845,223 | |
| TOTAL PREFERRED STOCKS | |||
| (Cost $22,250,605) | 37,419,694 | ||
| Money Market Funds - 4.9% | |||
| Fidelity Securities Lending Cash Central Fund, 0.19% (e)(f) | |||
| (Cost $99,075,564) | 99,075,564 | 99,075,564 | |
| TOTAL INVESTMENT PORTFOLIO - 104.6% | |||
| (Cost $1,705,627,544) | 2,123,721,953 | ||
| NET OTHER ASSETS (LIABILITIES) - (4.6)% | (92,977,718) | ||
| NET ASSETS - 100% | $2,030,744,235 |
Legend
(a) Non-income producing
(b) Security or a portion of the security is on loan at period end.
(c) Affiliated company
(d) Restricted securities - Investment in securities not registered under the Securities Act of 1933 (excluding 144A issues). At the end of the period, the value of restricted securities (excluding 144A issues) amounted to $17,574,471 or 0.9% of net assets.
(e) Affiliated fund that is generally available only to investment companies and other accounts managed by Fidelity Investments. The rate quoted is the annualized seven-day yield of the fund at period end. A complete unaudited listing of the fund's holdings as of its most recent quarter end is available upon request. In addition, each Fidelity Central Fund's financial statements are available on the SEC's website or upon request.
(f) Investment made with cash collateral received from securities on loan.
Additional information on each restricted holding is as follows:
| Security | Acquisition Date | Acquisition Cost |
| 1Life Healthcare, Inc. Series G | 4/10/14 | $3,000,003 |
| Outset Medical, Inc. Series B | 5/5/15 - 6/5/15 | $7,500,001 |
| Penumbra, Inc. Series F | 5/16/14 | $3,500,006 |
Affiliated Central Funds
Information regarding fiscal year to date income earned by the Fund from investments in Fidelity Central Funds is as follows:
| Fund | Income earned |
| Fidelity Cash Central Fund | $8,559 |
| Fidelity Securities Lending Cash Central Fund | 121,712 |
| Total | $130,271 |
Other Affiliated Issuers
An affiliated company is a company in which the Fund has ownership of at least 5% of the voting securities. Fiscal year to date transactions with companies which are or were affiliates are as follows:
| Affiliate | Value, beginning of period | Purchases | Sales Proceeds | Dividend Income | Value, end of period |
| HTG Molecular Diagnostics | $-- | $9,428,454 | $-- | $-- | $3,885,870 |
| Total | $-- | $9,428,454 | $-- | $-- | $3,885,870 |
Investment Valuation
The following is a summary of the inputs used, as of August 31, 2015, involving the Fund's assets and liabilities carried at fair value. The inputs or methodology used for valuing securities may not be an indication of the risk associated with investing in those securities. For more information on valuation inputs, and their aggregation into the levels used below, please refer to the Investment Valuation section in the accompanying Notes to Financial Statements.
| Valuation Inputs at Reporting Date: | ||||
| Description | Total | Level 1 | Level 2 | Level 3 |
| Investments in Securities: | ||||
| Common Stocks | $1,987,226,695 | $1,952,919,572 | $34,307,123 | $-- |
| Preferred Stocks | 37,419,694 | 19,845,223 | -- | 17,574,471 |
| Money Market Funds | 99,075,564 | 99,075,564 | -- | -- |
| Total Investments in Securities: | $2,123,721,953 | $2,071,840,359 | $34,307,123 | $17,574,471 |
Distribution of investments by country or territory of incorporation, as a percentage of Total Net Assets, is as follows (Unaudited):
| United States of America | 68.4% |
| Ireland | 24.2% |
| Netherlands | 2.2% |
| Japan | 1.8% |
| Israel | 1.3% |
| Germany | 1.0% |
| Others (Individually Less Than 1%) | 1.1% |
| 100.0% |
See accompanying notes which are an integral part of the financial statements.
Medical Equipment and Systems Portfolio
Financial Statements
Statement of Assets and Liabilities
| August 31, 2015 (Unaudited) | ||
| Assets | ||
| Investment in securities, at value (including securities loaned of $96,519,654) — See accompanying schedule: Unaffiliated issuers (cost $1,597,123,526) | $2,020,760,519 | |
| Fidelity Central Funds (cost $99,075,564) | 99,075,564 | |
| Other affiliated issuers (cost $9,428,454) | 3,885,870 | |
| Total Investments (cost $1,705,627,544) | $2,123,721,953 | |
| Receivable for investments sold | 8,314,259 | |
| Receivable for fund shares sold | 1,527,263 | |
| Dividends receivable | 622,671 | |
| Distributions receivable from Fidelity Central Funds | 20,136 | |
| Prepaid expenses | 16,300 | |
| Other receivables | 56,765 | |
| Total assets | 2,134,279,347 | |
| Liabilities | ||
| Payable to custodian bank | $1,576,809 | |
| Payable for fund shares redeemed | 1,492,909 | |
| Accrued management fee | 964,960 | |
| Other affiliated payables | 350,762 | |
| Other payables and accrued expenses | 74,108 | |
| Collateral on securities loaned, at value | 99,075,564 | |
| Total liabilities | 103,535,112 | |
| Net Assets | $2,030,744,235 | |
| Net Assets consist of: | ||
| Paid in capital | $1,538,784,928 | |
| Distributions in excess of net investment income | (1,739,262) | |
| Accumulated undistributed net realized gain (loss) on investments and foreign currency transactions | 75,602,251 | |
| Net unrealized appreciation (depreciation) on investments and assets and liabilities in foreign currencies | 418,096,318 | |
| Net Assets, for 55,119,841 shares outstanding | $2,030,744,235 | |
| Net Asset Value, offering price and redemption price per share ($2,030,744,235 ÷ 55,119,841 shares) | $36.84 |
See accompanying notes which are an integral part of the financial statements.
Statement of Operations
| Six months ended August 31, 2015 (Unaudited) | ||
| Investment Income | ||
| Dividends | $6,902,471 | |
| Income from Fidelity Central Funds (including $121,712 from security lending) | 130,271 | |
| Total income | 7,032,742 | |
| Expenses | ||
| Management fee | $5,905,870 | |
| Transfer agent fees | 1,792,037 | |
| Accounting and security lending fees | 335,963 | |
| Custodian fees and expenses | 18,503 | |
| Independent trustees' compensation | 18,126 | |
| Registration fees | 56,692 | |
| Audit | 19,935 | |
| Legal | 12,881 | |
| Interest | 515 | |
| Miscellaneous | 11,366 | |
| Total expenses before reductions | 8,171,888 | |
| Expense reductions | (130,095) | 8,041,793 |
| Net investment income (loss) | (1,009,051) | |
| Realized and Unrealized Gain (Loss)
Net realized gain (loss) on: | ||
| Investment securities: | ||
| Unaffiliated issuers | 76,623,131 | |
| Foreign currency transactions | (36,011) | |
| Total net realized gain (loss) | 76,587,120 | |
| Change in net unrealized appreciation (depreciation) on: Investment securities | (131,977,329) | |
| Assets and liabilities in foreign currencies | 5,431 | |
| Total change in net unrealized appreciation (depreciation) | (131,971,898) | |
| Net gain (loss) | (55,384,778) | |
| Net increase (decrease) in net assets resulting from operations | $(56,393,829) |
See accompanying notes which are an integral part of the financial statements.
Statement of Changes in Net Assets
| Six months ended August 31, 2015 (Unaudited) | Year ended February 28, 2015 | |
| Increase (Decrease) in Net Assets | ||
| Operations | ||
| Net investment income (loss) | $(1,009,051) | $1,850,801 |
| Net realized gain (loss) | 76,587,120 | 414,857,444 |
| Change in net unrealized appreciation (depreciation) | (131,971,898) | 36,857,734 |
| Net increase (decrease) in net assets resulting from operations | (56,393,829) | 453,565,979 |
| Distributions to shareholders from net investment income | – | (2,127,455) |
| Distributions to shareholders from net realized gain | (214,901,919) | (266,626,490) |
| Total distributions | (214,901,919) | (268,753,945) |
| Share transactions | ||
| Proceeds from sales of shares | 242,581,163 | 311,116,720 |
| Reinvestment of distributions | 203,442,077 | 255,506,585 |
| Cost of shares redeemed | (251,511,713) | (364,261,170) |
| Net increase (decrease) in net assets resulting from share transactions | 194,511,527 | 202,362,135 |
| Redemption fees | 13,519 | 24,200 |
| Total increase (decrease) in net assets | (76,770,702) | 387,198,369 |
| Net Assets | ||
| Beginning of period | 2,107,514,937 | 1,720,316,568 |
| End of period (including distributions in excess of net investment income of $1,739,262 and distributions in excess of net investment income of $730,211, respectively) | $2,030,744,235 | $2,107,514,937 |
| Other Information
Shares | ||
| Sold | 6,118,885 | 7,939,627 |
| Issued in reinvestment of distributions | 5,176,643 | 6,807,619 |
| Redeemed | (6,478,508) | (9,675,095) |
| Net increase (decrease) | 4,817,020 | 5,072,151 |
See accompanying notes which are an integral part of the financial statements.
Financial Highlights — Medical Equipment and Systems Portfolio
| Six months ended (Unaudited) | Years ended February 28, | |||||
| August 31, | 2015 | 2015 | 2014 | 2013 | 2012 A | 2011 |
| Selected Per–Share Data | ||||||
| Net asset value, beginning of period | $41.90 | $38.03 | $30.60 | $28.02 | $29.55 | $25.23 |
| Income from Investment Operations | ||||||
| Net investment income (loss)B | (.02) | .04 | .01 | .04 | .01 | (.01)C |
| Net realized and unrealized gain (loss) | (.84) | 9.86 | 10.94 | 3.77 | (.10) | 4.33 |
| Total from investment operations | (.86) | 9.90 | 10.95 | 3.81 | (.09) | 4.32 |
| Distributions from net investment income | – | (.05) | – | (.05) | (.02) | – |
| Distributions from net realized gain | (4.20) | (5.98) | (3.52) | (1.18) | (1.43) | – |
| Total distributions | (4.20) | (6.03) | (3.52) | (1.23) | (1.44)D | – |
| Redemption fees added to paid in capitalB,E | – | – | – | – | – | – |
| Net asset value, end of period | $36.84 | $41.90 | $38.03 | $30.60 | $28.02 | $29.55 |
| Total ReturnF,G | (2.69)% | 28.52% | 37.03% | 14.09% | .23% | 17.12% |
| Ratios to Average Net AssetsH,I | ||||||
| Expenses before reductions | .76%J | .77% | .80% | .83% | .84% | .86% |
| Expenses net of fee waivers, if any | .75%J | .77% | .80% | .83% | .84% | .86% |
| Expenses net of all reductions | .75%J | .77% | .79% | .82% | .84% | .86% |
| Net investment income (loss) | (.09)%J | .11% | .04% | .13% | .02% | (.04)%C |
| Supplemental Data | ||||||
| Net assets, end of period (000 omitted) | $2,030,744 | $2,107,515 | $1,720,317 | $1,404,437 | $1,361,012 | $1,408,343 |
| Portfolio turnover rateK | 40%J | 106% | 75% | 69% | 120% | 92% |
A For the year ended February 29.
B Calculated based on average shares outstanding during the period.
C Investment income per share reflects a large, non-recurring dividend which amounted to $.04 per share. Excluding this non-recurring dividend, the ratio of net investment income (loss) to average net assets would have been (.18) %.
D Total distributions of $1.44 per share is comprised of distributions from net investment income of $.015 and distributions from net realized gain of $1.426 per share.
E Amount represents less than $.005 per share.
F Total returns for periods of less than one year are not annualized.
G Total returns would have been lower if certain expenses had not been reduced during the applicable periods shown.
H Fees and expenses of any underlying Fidelity Central Funds are not included in the Fund's expense ratio. The Fund indirectly bears its proportionate share of the expenses of any underlying Fidelity Central Funds.
I Expense ratios reflect operating expenses of the Fund. Expenses before reductions do not reflect amounts reimbursed by the investment adviser or reductions from brokerage service arrangements or reductions from other expense offset arrangements and do not represent the amount paid by the Fund during periods when reimbursements or reductions occur. Expenses net of fee waivers reflect expenses after reimbursement by the investment adviser but prior to reductions from brokerage service arrangements or other expense offset arrangements. Expenses net of all reductions represent the net expenses paid by the Fund.
J Annualized
K Amount does not include the portfolio activity of any underlying Fidelity Central Funds.
See accompanying notes which are an integral part of the financial statements.
Pharmaceuticals Portfolio
Investment Summary (Unaudited)
Top Ten Stocks as of August 31, 2015
| % of fund's net assets | % of fund's net assets 6 months ago | |
| Johnson & Johnson | 11.3 | 7.3 |
| Allergan PLC | 8.1 | 12.1 |
| Sanofi SA sponsored ADR | 7.0 | 7.7 |
| AbbVie, Inc. | 6.6 | 5.4 |
| Bristol-Myers Squibb Co. | 5.2 | 5.6 |
| Eli Lilly & Co. | 5.0 | 0.4 |
| Pfizer, Inc. | 4.6 | 2.4 |
| Teva Pharmaceutical Industries Ltd. sponsored ADR | 4.6 | 3.9 |
| Shire PLC sponsored ADR | 4.2 | 2.0 |
| Novo Nordisk A/S Series B sponsored ADR | 3.3 | 4.1 |
| 59.9 |
Top Industries (% of fund's net assets)
| As of August 31, 2015 | ||
| Pharmaceuticals | 85.4% | |
| Biotechnology | 6.8% | |
| Health Care Providers & Services | 3.0% | |
| Health Care Equipment & Supplies | 1.0% | |
| Household Products | 1.0% | |
| All Others* | 2.8% | |

| As of February 28, 2015 | ||
| Pharmaceuticals | 84.6% | |
| Biotechnology | 7.9% | |
| Health Care Providers & Services | 4.1% | |
| Household Products | 1.0% | |
| Health Care Equipment & Supplies | 0.9% | |
| All Others* | 1.5% | |

* Includes short-term investments and net other assets (liabilities).
Pharmaceuticals Portfolio
Investments August 31, 2015 (Unaudited)
Showing Percentage of Net Assets
| Common Stocks - 98.7% | |||
| Shares | Value | ||
| Biotechnology - 6.8% | |||
| Biotechnology - 6.8% | |||
| Ablynx NV (a)(b) | 677,200 | $9,571,192 | |
| Affimed NV | 411,100 | 4,143,888 | |
| Agios Pharmaceuticals, Inc. (a) | 35,353 | 3,054,499 | |
| Alexion Pharmaceuticals, Inc. (a) | 121,886 | 20,987,550 | |
| Alnylam Pharmaceuticals, Inc. (a) | 34,500 | 3,550,395 | |
| AMAG Pharmaceuticals, Inc. (a)(b) | 206,900 | 12,939,526 | |
| Baxalta, Inc. | 520,000 | 18,278,000 | |
| Biogen, Inc. (a) | 43,700 | 12,992,010 | |
| Cara Therapeutics, Inc. (a) | 368,000 | 6,977,280 | |
| Cytokinetics, Inc. (a) | 481,100 | 3,329,212 | |
| Dynavax Technologies Corp. (a) | 184,100 | 5,221,076 | |
| Eagle Pharmaceuticals, Inc. (a) | 1,300 | 102,115 | |
| Genmab A/S (a) | 83,300 | 7,482,955 | |
| Gilead Sciences, Inc. | 148,900 | 15,644,923 | |
| Intercept Pharmaceuticals, Inc. (a) | 10,598 | 2,011,076 | |
| Loxo Oncology, Inc. | 18,586 | 373,579 | |
| Momenta Pharmaceuticals, Inc. (a) | 18,053 | 352,214 | |
| NantKwest, Inc. (b) | 82,700 | 1,415,824 | |
| Pfenex, Inc. (a) | 245,400 | 5,361,990 | |
| Repligen Corp. (a) | 240,300 | 8,189,424 | |
| Vertex Pharmaceuticals, Inc. (a) | 89,500 | 11,413,040 | |
| 153,391,768 | |||
| Chemicals - 0.2% | |||
| Specialty Chemicals - 0.2% | |||
| Codexis, Inc. (a) | 1,104,700 | 4,120,531 | |
| Food & Staples Retailing - 0.5% | |||
| Drug Retail - 0.5% | |||
| Tsuruha Holdings, Inc. | 142,400 | 11,556,897 | |
| Health Care Equipment & Supplies - 1.0% | |||
| Health Care Equipment - 0.5% | |||
| Teleflex, Inc. | 82,600 | 10,804,080 | |
| Health Care Supplies - 0.5% | |||
| West Pharmaceutical Services, Inc. | 217,400 | 12,141,790 | |
| TOTAL HEALTH CARE EQUIPMENT & SUPPLIES | 22,945,870 | ||
| Health Care Providers & Services - 3.0% | |||
| Health Care Distributors & Services - 0.4% | |||
| Fagron NV | 347,600 | 9,244,406 | |
| Health Care Services - 2.6% | |||
| DaVita HealthCare Partners, Inc. (a) | 426,500 | 32,260,460 | |
| Express Scripts Holding Co. (a) | 318,400 | 26,618,240 | |
| 58,878,700 | |||
| TOTAL HEALTH CARE PROVIDERS & SERVICES | 68,123,106 | ||
| Household Products - 1.0% | |||
| Household Products - 1.0% | |||
| Reckitt Benckiser Group PLC | 244,172 | 21,392,990 | |
| Life Sciences Tools & Services - 0.8% | |||
| Life Sciences Tools & Services - 0.8% | |||
| Agilent Technologies, Inc. | 463,000 | 16,811,530 | |
| Compugen Ltd. (a) | 370,400 | 1,822,368 | |
| 18,633,898 | |||
| Personal Products - 0.0% | |||
| Personal Products - 0.0% | |||
| MYOS Corp. (a) | 40,000 | 68,000 | |
| Pharmaceuticals - 85.4% | |||
| Pharmaceuticals - 85.4% | |||
| AbbVie, Inc. | 2,397,590 | 149,633,592 | |
| Allergan PLC (a) | 597,938 | 181,617,688 | |
| Amphastar Pharmaceuticals, Inc. (a) | 503,000 | 6,473,610 | |
| Assembly Biosciences, Inc. (a) | 210,100 | 2,880,471 | |
| Astellas Pharma, Inc. | 1,159,000 | 17,142,159 | |
| Bristol-Myers Squibb Co. | 1,959,610 | 116,538,007 | |
| CSPC Pharmaceutical Group Ltd. | 5,320,000 | 4,873,775 | |
| DepoMed, Inc. (a) | 263,900 | 7,106,827 | |
| Eisai Co. Ltd. | 175,800 | 11,976,131 | |
| Eli Lilly & Co. | 1,379,600 | 113,610,060 | |
| Endo Health Solutions, Inc. (a) | 794,600 | 61,184,200 | |
| GlaxoSmithKline PLC sponsored ADR | 667,100 | 27,304,403 | |
| Horizon Pharma PLC (a) | 924,200 | 27,005,124 | |
| Impax Laboratories, Inc. (a) | 208,700 | 8,548,352 | |
| Indivior PLC | 3,445,400 | 11,816,370 | |
| Jazz Pharmaceuticals PLC (a) | 291,100 | 49,143,502 | |
| Jiangsu Hengrui Medicine Co. Ltd. | 1,210,702 | 8,430,332 | |
| Johnson & Johnson | 2,701,400 | 253,877,573 | |
| Mallinckrodt PLC (a) | 209,600 | 18,075,904 | |
| Merck & Co., Inc. | 194,636 | 10,481,149 | |
| Mylan N.V. | 621,900 | 30,840,021 | |
| Novartis AG sponsored ADR | 654,098 | 63,591,408 | |
| Novo Nordisk A/S Series B sponsored ADR | 1,358,100 | 75,062,187 | |
| Pacira Pharmaceuticals, Inc. (a) | 111,500 | 6,416,825 | |
| Perrigo Co. PLC | 310,452 | 56,803,402 | |
| Pfizer, Inc. | 3,184,588 | 102,607,425 | |
| Prestige Brands Holdings, Inc. (a) | 580,100 | 26,986,252 | |
| Recordati SpA | 713,400 | 16,995,503 | |
| Sanofi SA sponsored ADR | 3,202,222 | 156,652,700 | |
| Shire PLC sponsored ADR | 411,000 | 95,352,000 | |
| Sinclair Pharma PLC (a) | 2,786,365 | 1,656,825 | |
| Taro Pharmaceutical Industries Ltd. (a) | 57,200 | 7,641,920 | |
| Tetraphase Pharmaceuticals, Inc. (a) | 102,700 | 4,458,207 | |
| Teva Pharmaceutical Industries Ltd. sponsored ADR | 1,589,489 | 102,378,986 | |
| TherapeuticsMD, Inc. (a)(b) | 1,600,200 | 9,809,226 | |
| Valeant Pharmaceuticals International, Inc. (Canada) (a) | 292,227 | 67,745,753 | |
| Zoetis, Inc. Class A | 201,100 | 9,023,357 | |
| 1,921,741,226 | |||
| TOTAL COMMON STOCKS | |||
| (Cost $1,851,145,061) | 2,221,974,286 | ||
| Convertible Preferred Stocks - 0.0% | |||
| Life Sciences Tools & Services - 0.0% | |||
| Life Sciences Tools & Services - 0.0% | |||
| Living Proof, Inc. 8.00% (a)(c) | |||
| (Cost $200,000) | 112,714 | 346,032 | |
| Money Market Funds - 1.5% | |||
| Fidelity Cash Central Fund, 0.15% (d) | 24,412,103 | 24,412,103 | |
| Fidelity Securities Lending Cash Central Fund, 0.19% (d)(e) | 8,775,993 | 8,775,993 | |
| TOTAL MONEY MARKET FUNDS | |||
| (Cost $33,188,096) | 33,188,096 | ||
| TOTAL INVESTMENT PORTFOLIO - 100.2% | |||
| (Cost $1,884,533,157) | 2,255,508,414 | ||
| NET OTHER ASSETS (LIABILITIES) - (0.2)% | (4,410,087) | ||
| NET ASSETS - 100% | $2,251,098,327 |
Legend
(a) Non-income producing
(b) Security or a portion of the security is on loan at period end.
(c) Restricted securities - Investment in securities not registered under the Securities Act of 1933 (excluding 144A issues). At the end of the period, the value of restricted securities (excluding 144A issues) amounted to $346,032 or 0.0% of net assets.
(d) Affiliated fund that is generally available only to investment companies and other accounts managed by Fidelity Investments. The rate quoted is the annualized seven-day yield of the fund at period end. A complete unaudited listing of the fund's holdings as of its most recent quarter end is available upon request. In addition, each Fidelity Central Fund's financial statements are available on the SEC's website or upon request.
(e) Investment made with cash collateral received from securities on loan.
Additional information on each restricted holding is as follows:
| Security | Acquisition Date | Acquisition Cost |
| Living Proof, Inc. 8.00% | 2/13/13 | $200,000 |
Affiliated Central Funds
Information regarding fiscal year to date income earned by the Fund from investments in Fidelity Central Funds is as follows:
| Fund | Income earned |
| Fidelity Cash Central Fund | $25,746 |
| Fidelity Securities Lending Cash Central Fund | 80,920 |
| Total | $106,666 |
Investment Valuation
The following is a summary of the inputs used, as of August 31, 2015, involving the Fund's assets and liabilities carried at fair value. The inputs or methodology used for valuing securities may not be an indication of the risk associated with investing in those securities. For more information on valuation inputs, and their aggregation into the levels used below, please refer to the Investment Valuation section in the accompanying Notes to Financial Statements.
| Valuation Inputs at Reporting Date: | ||||
| Description | Total | Level 1 | Level 2 | Level 3 |
| Investments in Securities: | ||||
| Common Stocks | $2,221,974,286 | $2,159,906,109 | $62,068,177 | $-- |
| Convertible Preferred Stocks | 346,032 | -- | -- | 346,032 |
| Money Market Funds | 33,188,096 | 33,188,096 | -- | -- |
| Total Investments in Securities: | $2,255,508,414 | $2,193,094,205 | $62,068,177 | $346,032 |
The following is a summary of transfers between Level 1 and Level 2 for the period ended August 31, 2015. Transfers are assumed to have occurred at the beginning of the period, and are primarily attributable to the valuation techniques used for foreign equity securities, as discussed in the accompanying Notes to Financial Statements:
| Transfers | Total |
| Level 1 to Level 2 | $9,618,324 |
| Level 2 to Level 1 | $50,096,318 |
Other Information
Distribution of investments by country or territory of incorporation, as a percentage of Total Net Assets, is as follows (Unaudited):
| United States of America | 48.5% |
| Ireland | 17.5% |
| France | 7.0% |
| Israel | 5.0% |
| Bailiwick of Jersey | 4.2% |
| Denmark | 3.6% |
| Canada | 3.0% |
| Switzerland | 2.8% |
| United Kingdom | 2.8% |
| Japan | 1.8% |
| Netherlands | 1.6% |
| Others (Individually Less Than 1%) | 2.2% |
| 100.0% |
See accompanying notes which are an integral part of the financial statements.
Pharmaceuticals Portfolio
Financial Statements
Statement of Assets and Liabilities
| August 31, 2015 (Unaudited) | ||
| Assets | ||
| Investment in securities, at value (including securities loaned of $8,222,915) — See accompanying schedule: Unaffiliated issuers (cost $1,851,345,061) | $2,222,320,318 | |
| Fidelity Central Funds (cost $33,188,096) | 33,188,096 | |
| Total Investments (cost $1,884,533,157) | $2,255,508,414 | |
| Receivable for investments sold | 4,550 | |
| Receivable for fund shares sold | 5,128,331 | |
| Dividends receivable | 5,689,913 | |
| Distributions receivable from Fidelity Central Funds | 7,129 | |
| Prepaid expenses | 17,998 | |
| Other receivables | 49,704 | |
| Total assets | 2,266,406,039 | |
| Liabilities | ||
| Payable for fund shares redeemed | $4,950,999 | |
| Accrued management fee | 1,086,089 | |
| Payable for daily variation margin for derivative instruments | 4,550 | |
| Other affiliated payables | 405,770 | |
| Other payables and accrued expenses | 84,311 | |
| Collateral on securities loaned, at value | 8,775,993 | |
| Total liabilities | 15,307,712 | |
| Net Assets | $2,251,098,327 | |
| Net Assets consist of: | ||
| Paid in capital | $1,689,473,729 | |
| Undistributed net investment income | 12,879,662 | |
| Accumulated undistributed net realized gain (loss) on investments and foreign currency transactions | 177,792,060 | |
| Net unrealized appreciation (depreciation) on investments and assets and liabilities in foreign currencies | 370,952,876 | |
| Net Assets, for 98,703,680 shares outstanding | $2,251,098,327 | |
| Net Asset Value, offering price and redemption price per share ($2,251,098,327 ÷ 98,703,680 shares) | $22.81 |
See accompanying notes which are an integral part of the financial statements.
Statement of Operations
| Six months ended August 31, 2015 (Unaudited) | ||
| Investment Income | ||
| Dividends | $22,871,651 | |
| Income from Fidelity Central Funds (including $80,920 from security lending) | 106,666 | |
| Income before foreign taxes withheld | 22,978,317 | |
| Less foreign taxes withheld | (1,680,152) | |
| Total income | 21,298,165 | |
| Expenses | ||
| Management fee | $6,044,337 | |
| Transfer agent fees | 1,965,376 | |
| Accounting and security lending fees | 335,498 | |
| Custodian fees and expenses | 25,057 | |
| Independent trustees' compensation | 17,697 | |
| Registration fees | 125,038 | |
| Audit | 22,280 | |
| Legal | 11,892 | |
| Interest | 498 | |
| Miscellaneous | 10,684 | |
| Total expenses before reductions | 8,558,357 | |
| Expense reductions | (99,414) | 8,458,943 |
| Net investment income (loss) | 12,839,222 | |
| Realized and Unrealized Gain (Loss)
Net realized gain (loss) on: | ||
| Investment securities: | ||
| Unaffiliated issuers | 164,225,857 | |
| Foreign currency transactions | (4,547) | |
| Total net realized gain (loss) | 164,221,310 | |
| Change in net unrealized appreciation (depreciation) on: Investment securities | (138,331,017) | |
| Assets and liabilities in foreign currencies | 4,516 | |
| Total change in net unrealized appreciation (depreciation) | (138,326,501) | |
| Net gain (loss) | 25,894,809 | |
| Net increase (decrease) in net assets resulting from operations | $38,734,031 |
See accompanying notes which are an integral part of the financial statements.
Statement of Changes in Net Assets
| Six months ended August 31, 2015 (Unaudited) | Year ended February 28, 2015 | |
| Increase (Decrease) in Net Assets | ||
| Operations | ||
| Net investment income (loss) | $12,839,222 | $10,819,387 |
| Net realized gain (loss) | 164,221,310 | 248,040,186 |
| Change in net unrealized appreciation (depreciation) | (138,326,501) | 46,742,902 |
| Net increase (decrease) in net assets resulting from operations | 38,734,031 | 305,602,475 |
| Distributions to shareholders from net investment income | (2,992,721) | (13,480,605) |
| Distributions to shareholders from net realized gain | (80,632,418) | (156,387,668) |
| Total distributions | (83,625,139) | (169,868,273) |
| Share transactions | ||
| Proceeds from sales of shares | 663,372,072 | 891,442,186 |
| Reinvestment of distributions | 80,282,638 | 163,418,607 |
| Cost of shares redeemed | (340,592,377) | (932,575,497) |
| Net increase (decrease) in net assets resulting from share transactions | 403,062,333 | 122,285,296 |
| Redemption fees | 62,494 | 101,684 |
| Total increase (decrease) in net assets | 358,233,719 | 258,121,182 |
| Net Assets | ||
| Beginning of period | 1,892,864,608 | 1,634,743,426 |
| End of period (including undistributed net investment income of $12,879,662 and undistributed net investment income of $3,033,161, respectively) | $2,251,098,327 | $1,892,864,608 |
| Other Information
Shares | ||
| Sold | 27,729,121 | 42,226,714 |
| Issued in reinvestment of distributions | 3,391,746 | 8,114,920 |
| Redeemed | (14,426,543) | (44,744,142) |
| Net increase (decrease) | 16,694,324 | 5,597,492 |
See accompanying notes which are an integral part of the financial statements.
Financial Highlights — Pharmaceuticals Portfolio
| Six months ended (Unaudited) | Years ended February 28, | |||||
| August 31, | 2015 | 2015 | 2014 | 2013 | 2012A | 2011 |
| Selected Per–Share Data | ||||||
| Net asset value, beginning of period | $23.08 | $21.39 | $16.13 | $14.11 | $12.74 | $10.93 |
| Income from Investment Operations | ||||||
| Net investment income (loss)B | .14 | .14 | .26 | .23 | .15 | .17 |
| Net realized and unrealized gain (loss) | .57 | 3.76 | 6.96 | 2.26 | 1.64 | 1.96 |
| Total from investment operations | .71 | 3.90 | 7.22 | 2.49 | 1.79 | 2.13 |
| Distributions from net investment income | (.04) | (.18) | (.18) | (.20) | (.11) | (.13) |
| Distributions from net realized gain | (.94) | (2.03) | (1.77) | (.27) | (.31) | (.19) |
| Total distributions | (.98) | (2.21) | (1.96)C | (.47) | (.42) | (.32) |
| Redemption fees added to paid in capitalB,D | – | – | – | – | – | – |
| Net asset value, end of period | $22.81 | $23.08 | $21.39 | $16.13 | $14.11 | $12.74 |
| Total ReturnE,F | 2.91% | 20.04% | 46.77% | 17.93% | 14.34% | 19.68% |
| Ratios to Average Net AssetsG,H | ||||||
| Expenses before reductions | .78%I | .79% | .82% | .85% | .89% | .94% |
| Expenses net of fee waivers, if any | .77%I | .79% | .81% | .85% | .89% | .94% |
| Expenses net of all reductions | .77%I | .79% | .81% | .84% | .88% | .94% |
| Net investment income (loss) | 1.16%I | .66% | 1.39% | 1.54% | 1.12% | 1.42% |
| Supplemental Data | ||||||
| Net assets, end of period (000 omitted) | $2,251,098 | $1,892,865 | $1,634,743 | $911,064 | $715,882 | $391,020 |
| Portfolio turnover rateJ | 74%I | 72%K | 95% | 54% | 73% | 102% |
A For the year ended February 29.
B Calculated based on average shares outstanding during the period.
C Total distributions of $1.96 per share is comprised of distributions from net investment income of $.182 and distributions from net realized gain of $1.773 per share.
D Amount represents less than $.005 per share.
E Total returns for periods of less than one year are not annualized.
F Total returns would have been lower if certain expenses had not been reduced during the applicable periods shown.
G Fees and expenses of any underlying Fidelity Central Funds are not included in the Fund's expense ratio. The Fund indirectly bears its proportionate share of the expenses of any underlying Fidelity Central Funds.
H Expense ratios reflect operating expenses of the Fund. Expenses before reductions do not reflect amounts reimbursed by the investment adviser or reductions from brokerage service arrangements or reductions from other expense offset arrangements and do not represent the amount paid by the Fund during periods when reimbursements or reductions occur. Expenses net of fee waivers reflect expenses after reimbursement by the investment adviser but prior to reductions from brokerage service arrangements or other expense offset arrangements. Expenses net of all reductions represent the net expenses paid by the Fund.
I Annualized
J Amount does not include the portfolio activity of any underlying Fidelity Central Funds.
K Portfolio turnover rate excludes securities received or delivered in-kind.
See accompanying notes which are an integral part of the financial statements.
Notes to Financial Statements (Unaudited)
For the period ended August 31, 2015
1. Organization.
Biotechnology Portfolio, Health Care Portfolio, Medical Delivery Portfolio, Medical Equipment and Systems Portfolio, and Pharmaceuticals Portfolio (the Funds) are non-diversified funds of Fidelity Select Portfolios (the Trust). The Trust is registered under the Investment Company Act of 1940, as amended (the 1940 Act), as an open-end management investment company organized as a Massachusetts business trust. The Funds invest primarily in securities of companies whose principal business activities fall within specific industries. Each Fund is authorized to issue an unlimited number of shares. Share transactions on the Statement of Changes in Net Assets may contain exchanges between funds.
2. Investments in Fidelity Central Funds.
The Funds invest in Fidelity Central Funds, which are open-end investment companies generally available only to other investment companies and accounts managed by the investment adviser and its affiliates. The Funds' Schedules of Investments list each of the Fidelity Central Funds held as of period end, if any, as an investment of each Fund, but do not include the underlying holdings of each Fidelity Central Fund. As an Investing Fund, each Fund indirectly bears its proportionate share of the expenses of the underlying Fidelity Central Funds.
The Money Market Central Funds seek preservation of capital and current income and are managed by Fidelity Investments Money Management, Inc. (FIMM), an affiliate of the investment adviser. Annualized expenses of the Money Market Central Funds as of their most recent shareholder report date are less than .01%.
A complete unaudited list of holdings for each Fidelity Central Fund is available upon request or at the Securities and Exchange Commission (the SEC) website at www.sec.gov. In addition, the financial statements of the Fidelity Central Funds are available on the SEC website or upon request.
3. Significant Accounting Policies.
The financial statements have been prepared in conformity with accounting principles generally accepted in the United States of America (GAAP), which require management to make certain estimates and assumptions at the date of the financial statements. Actual results could differ from those estimates. Subsequent events, if any, through the date that the financial statements were issued have been evaluated in the preparation of the financial statements. The following summarizes the significant accounting policies of the Funds:
Investment Valuation. Investments are valued as of 4:00 p.m. Eastern time on the last calendar day of the period. The Board of Trustees (the Board) has delegated the day to day responsibility for the valuation of each Fund's investments to the Fidelity SelectCo, LLC (SelectCo) Fair Value Committee (the Committee). In accordance with valuation policies and procedures approved by the Board, each Fund attempts to obtain prices from one or more third party pricing vendors or brokers to value its investments. When current market prices, quotations or currency exchange rates are not readily available or reliable, investments will be fair valued in good faith by the Committee, in accordance with procedures adopted by the Board. Factors used in determining fair value vary by investment type and may include market or investment specific events. The frequency with which these procedures are used cannot be predicted and they may be utilized to a significant extent. The Committee oversees each Fund's valuation policies and procedures and reports to the Board on the Committee's activities and fair value determinations. The Board monitors the appropriateness of the procedures used in valuing each Fund's investments and ratifies the fair value determinations of the Committee.
Each Fund categorizes the inputs to valuation techniques used to value its investments into a disclosure hierarchy consisting of three levels as shown below:
- Level 1 – quoted prices in active markets for identical investments
- Level 2 – other significant observable inputs (including quoted prices for similar investments, interest rates, prepayment speeds, etc.)
- Level 3 – unobservable inputs (including the Fund's own assumptions based on the best information available)
Valuation techniques used to value each Fund's investments by major category are as follows:
Equity securities, including restricted securities, for which market quotations are readily available, are valued at the last reported sale price or official closing price as reported by a third party pricing vendor on the primary market or exchange on which they are traded and are categorized as Level 1 in the hierarchy. In the event there were no sales during the day or closing prices are not available, securities are valued at the last quoted bid price or may be valued using the last available price and are generally categorized as Level 2 in the hierarchy. For foreign equity securities, when market or security specific events arise, comparisons to the valuation of American Depositary Receipts (ADRs), futures contracts, Exchange-Traded Funds (ETFs) and certain indexes as well as quoted prices for similar securities may be used and would be categorized as Level 2 in the hierarchy. Utilizing these techniques may result in transfers between Level 1 and Level 2. For equity securities, including restricted securities, where observable inputs are limited, assumptions about market activity and risk are used and these securities may be categorized as Level 3 in the hierarchy. Equity securities, including restricted securities, for which observable inputs are not available are valued using alternate valuation approaches, including the market approach and the income approach and are categorized as Level 3 in the hierarchy. The market approach generally consists of using comparable market transactions while the income approach generally consists of using the net present value of estimated future cash flows, adjusted as appropriate for liquidity, credit, market and/or other risk factors.
Investments in open-end mutual funds, including the Fidelity Central Funds, are valued at their closing net asset value (NAV) each business day and are categorized as Level 1 in the hierarchy.
The following provides information on Level 3 securities held by the Biotechnology Portfolio that were valued at period end based on unobservable inputs. These amounts exclude valuations provided by a broker.
| Asset Type | Fair Value at 08/31/15 | Valuation Technique(s) | Unobservable Input | Amount or Range/Weighted Average | Impact to Valuation from an Increase in Input* |
| Equities | $ 327,252,095 | Black-Scholes | Discount for lack of marketability | 10.0% | Decrease |
| Discounted cash flow | Discount rate | 8.0% | Decrease | ||
| Last transaction price | Transaction price | $0.15-$137.95/$25.66 | Increase |
* Represents the expected directional change in the fair value of the Level 3 investments that would result from an increase in the corresponding input. A decrease to the unobservable input would have the opposite effect. Significant changes in these inputs could result in significantly higher or lower fair value measurements.
Changes in valuation techniques may result in transfers in or out of an assigned level within the disclosure hierarchy. The aggregate value of investments by input level as of August 31, 2015, including information on transfers between Levels 1 and 2, as well as a roll forward of Level 3 investments, is included at the end of each applicable Fund's Schedule of Investments.
Foreign Currency. The Funds may use foreign currency contracts to facilitate transactions in foreign-denominated securities. Gains and losses from these transactions may arise from changes in the value of the foreign currency or if the counterparties do not perform under the contracts' terms.
Foreign-denominated assets, including investment securities, and liabilities are translated into U.S. dollars at the exchange rates at period end. Purchases and sales of investment securities, income and dividends received and expenses denominated in foreign currencies are translated into U.S. dollars at the exchange rate in effect on the transaction date.
The effects of exchange rate fluctuations on investments are included with the net realized and unrealized gain (loss) on investment securities. Other foreign currency transactions resulting in realized and unrealized gain (loss) are disclosed separately.
Investment Transactions and Income. For financial reporting purposes, the Funds' investment holdings and NAV include trades executed through the end of the last business day of the period. The NAV per share for processing shareholder transactions is calculated as of the close of business of the New York Stock Exchange (NYSE), normally 4:00 p.m. Eastern time and includes trades executed through the end of the prior business day. Gains and losses on securities sold are determined on the basis of identified cost and may include proceeds received from litigation. Dividend income is recorded on the ex-dividend date, except for certain dividends from foreign securities where the ex-dividend date may have passed, which are recorded as soon as the Funds are informed of the ex-dividend date. Non-cash dividends included in dividend income, if any, are recorded at the fair market value of the securities received. Income and capital gain distributions from Fidelity Central Funds, if any, are recorded on the ex-dividend date. Distributions received on securities that represent a return of capital or capital gain are recorded as a reduction of cost of investments and/or as a realized gain. Subsequent to ex-dividend date the Funds determine the components of these distributions, based upon receipt of tax filings or other correspondence relating to the underlying investment. Investment income is recorded net of foreign taxes withheld where recovery of such taxes is uncertain.
Expenses. Expenses directly attributable to a fund are charged to that fund. Expenses attributable to more than one fund are allocated among the respective funds on the basis of relative net assets or other appropriate methods. Expense estimates are accrued in the period to which they relate and adjustments are made when actual amounts are known.
Deferred Trustee Compensation. Under a Deferred Compensation Plan (the Plan) for the Funds, independent Trustees may elect to defer receipt of a portion of their annual compensation. Deferred amounts are invested in a cross-section of Fidelity funds, are marked-to-market and remain in the Fund until distributed in accordance with the Plan. The investment of deferred amounts and the offsetting payable to the Trustees are included in the accompanying Statement of Assets and Liabilities.
Income Tax Information and Distributions to Shareholders. Each year, each Fund intends to qualify as a regulated investment company under Subchapter M of the Internal Revenue Code, including distributing substantially all of its taxable income and realized gains. As a result, no provision for U.S. Federal income taxes is required. Each Fund files a U.S. federal tax return, in addition to state and local tax returns as required. Each Fund's federal income tax returns are subject to examination by the Internal Revenue Service (IRS) for a period of three fiscal years after they are filed. State and local tax returns may be subject to examination for an additional fiscal year depending on the jurisdiction. Foreign taxes are provided for based on each Fund's understanding of the tax rules and rates that exist in the foreign markets in which it invests.
Distributions are declared and recorded on the ex-dividend date. Income and capital gain distributions are determined in accordance with income tax regulations, which may differ from GAAP.
Capital accounts within the financial statements are adjusted for permanent book-tax differences. These adjustments have no impact on net assets or the results of operations. Capital accounts are not adjusted for temporary book-tax differences which will reverse in a subsequent period.
Book-tax differences are primarily due to foreign currency transactions, passive foreign investment companies (PFIC), redemptions in kind, partnerships, deferred trustees compensation, net operating losses and losses deferred due to wash sales and excise tax regulations.
The federal tax cost of investment securities and unrealized appreciation (depreciation) as of period end were as follows for each Fund:
| Tax cost | Gross unrealized appreciation | Gross unrealized depreciation | Net unrealized appreciation (depreciation) on securities | |
| Biotechnology Portfolio | $12,205,894,129 | $5,813,868,875 | $(1,100,425,135) | $4,713,443,740 |
| Health Care Portfolio | 8,562,235,162 | 2,102,884,725 | (406,488,985) | 1,696,395,740 |
| Medical Delivery Portfolio | 650,405,621 | 379,586,733 | (25,321,698) | 354,265,035 |
| Medical Equipment and Systems Portfolio | 1,706,495,698 | 482,331,073 | (65,104,818) | 417,226,255 |
| Pharmaceuticals Portfolio | 1,890,537,677 | 437,839,435 | (72,868,698) | 364,970,737 |
Certain of the Funds intend to elect to defer to the next fiscal year ordinary losses recognized during the period January 1, 2015 to February 28, 2015. Loss deferrals were as follows:
| Ordinary Losses | |
| Medical Equipment and Systems Portfolio | $(703,139) |
Trading (Redemption) Fees. Shares held by investors in the Funds less than 30 days may be subject to a redemption fee equal to .75% of the NAV of shares redeemed. All redemption fees, which reduce the proceeds of the shareholder redemption, are retained by the Funds and accounted for as an addition to paid in capital.
Restricted Securities. The Funds may invest in securities that are subject to legal or contractual restrictions on resale. These securities generally may be resold in transactions exempt from registration or to the public if the securities are registered. Disposal of these securities may involve time-consuming negotiations and expense, and prompt sale at an acceptable price may be difficult. Information regarding restricted securities is included at the end of each applicable Fund's Schedule of Investments.
4. Purchases and Sales of Investments.
Purchases and sales of securities, other than short-term securities, are noted in the table below.
| Purchases ($) | Sales ($) | |
| Biotechnology Portfolio | 4,251,122,443 | 2,163,559,824 |
| Health Care Portfolio | 4,436,547,021 | 4,164,412,919 |
| Medical Delivery Portfolio | 187,033,958 | 67,124,507 |
| Medical Equipment and Systems Portfolio | 428,816,643 | 441,828,500 |
| Pharmaceuticals Portfolio | 1,117,121,794 | 794,799,858 |
5. Fees and Other Transactions with Affiliates.
Management Fee. Fidelity SelectCo, LLC (the investment adviser) and its affiliates provide the Funds with investment management related services for which the Funds pay a monthly management fee. The management fee is the sum of an individual fund fee rate and an annualized group fee rate. The individual fund fee rate is applied to each Fund's average net assets. The group fee rate is based upon the average net assets of all the mutual funds advised by Fidelity Management & Research Company (FMR) and the investment adviser. The group fee rate decreases as assets under management increase and increases as assets under management decrease. For the reporting period, each Fund's annualized management fee rate expressed as a percentage of each Fund's average net assets was as follows.
| Individual Rate | Group Rate | Total | |
| Biotechnology Portfolio | .30% | .25% | .55% |
| Health Care Portfolio | .30% | .25% | .55% |
| Medical Delivery Portfolio | .30% | .25% | .55% |
| Medical Equipment and Systems Portfolio | .30% | .25% | .55% |
| Pharmaceuticals Portfolio | .30% | .25% | .55% |
Transfer Agent Fees. Fidelity Investments Institutional Operations Company, Inc. (FIIOC), an affiliate of the investment adviser, is the Funds' transfer, dividend disbursing and shareholder servicing agent. FIIOC receives account fees and asset-based fees that vary according to account size and type of account. FIIOC pays for typesetting, printing and mailing of shareholder reports, except proxy statements. For the period, transfer agent fees were equivalent to the following annualized rates expressed as a percentage of average net assets:
| Biotechnology Portfolio | .15% |
| Health Care Portfolio | .15% |
| Medical Delivery Portfolio | .18% |
| Medical Equipment and Systems Portfolio | .17% |
| Pharmaceuticals Portfolio | .18% |
Accounting and Security Lending Fees. Fidelity Service Company, Inc. (FSC), an affiliate of the investment adviser, maintains each Fund's accounting records. The accounting fee is based on the level of average net assets for each month. Under a separate contract, FSC administers the security lending program. The security lending fee is based on the number and duration of lending transactions.
Brokerage Commissions. Certain Funds placed a portion of their portfolio transactions with brokerage firms which are affiliates of the investment adviser. Brokerage commissions are included in net realized gain (loss) and change in net unrealized appreciation (depreciation) in the Statement of Operations. The commissions paid to these affiliated firms were as follows:
| Amount | |
| Biotechnology Portfolio | $107,118 |
| Health Care Portfolio | 79,302 |
| Medical Delivery Portfolio | 1,859 |
| Medical Equipment and Systems Portfolio | 10,205 |
| Pharmaceuticals Portfolio | 19,404 |
Interfund Lending Program. Pursuant to an Exemptive Order issued by the SEC, the Funds, along with other registered investment companies having management contracts with FMR or other affiliated entities of FMR, may participate in an interfund lending program. This program provides an alternative credit facility allowing the funds to borrow from, or lend money to, other participating affiliated funds. At period end, there were no interfund loans outstanding. Each applicable fund's activity in this program during the period for which loans were outstanding was as follows:
| Borrower or Lender | Average Loan Balance | Weighted Average Interest Rate | Interest Expense | |
| Biotechnology Portfolio | Borrower | $101,613,833 | .37% | $6,336 |
| Health Care Portfolio | Borrower | 44,786,000 | .38% | 468 |
| Medical Equipment and Systems Portfolio | Borrower | 8,801,167 | .35% | 515 |
| Pharmaceuticals Portfolio | Borrower | 15,978,333 | .37% | 498 |
6. Committed Line of Credit.
Certain Funds participate with other funds managed by the investment adviser or an affiliate in a $4.25 billion credit facility (the "line of credit") to be utilized for temporary or emergency purposes to fund shareholder redemptions or for other short-term liquidity purposes. The participating funds have agreed to pay commitment fees on their pro-rata portion of the line of credit, which are reflected in Miscellaneous expenses on the Statement of Operations, and are as follows:
| Biotechnology Portfolio | $10,286 |
| Health Care Portfolio | 7,501 |
| Medical Delivery Portfolio | 687 |
| Medical Equipment and Systems Portfolio | 1,593 |
| Pharmaceuticals Portfolio | 1,507 |
During the period, the Funds did not borrow on this line of credit.
7. Security Lending.
Certain Funds lend portfolio securities through a lending agent from time to time in order to earn additional income. On the settlement date of the loan, each applicable Fund receives collateral (in the form of U.S. Treasury obligations, letters of credit and/or cash) against the loaned securities and maintains collateral in an amount not less than 100% of the market value of the loaned securities during the period of the loan. The market value of the loaned securities is determined at the close of business of the Funds and any additional required collateral is delivered to the Funds on the next business day. If the borrower defaults on its obligation to return the securities loaned because of insolvency or other reasons, the Funds may apply collateral received from the borrower against the obligation. The Funds may experience delays and costs in recovering the securities loaned. Any cash collateral received is invested in the Fidelity Securities Lending Cash Central Fund. The value of loaned securities and cash collateral at period end are disclosed on each applicable Fund's Statement of Assets and Liabilities. Security lending income represents the income earned on investing cash collateral, less rebates paid to borrowers and any lending agent fees associated with the loan, plus any premium payments received for lending certain types of securities. Security lending income is presented on each applicable Fund's Statement of Operations as a component of income from Fidelity Central Funds.
8. Expense Reductions.
Commissions paid to certain brokers with whom the investment adviser, or its affiliates, places trades on behalf of Certain Funds include an amount in addition to trade execution, which may be rebated back to the Funds to offset certain expenses. In addition, through arrangements with each applicable Fund's custodian, credits realized as a result of uninvested cash balances were used to reduce each applicable Fund's expenses. All of the applicable expense reductions are noted in the table below.
| Brokerage Service reduction | Custody expense reduction |
|
| Biotechnology Portfolio | $130,824 | $410 |
| Health Care Portfolio | 342,191 | 146 |
| Medical Delivery Portfolio | 2,377 | 29 |
| Medical Equipment and Systems Portfolio | 82,525 | 33 |
| Pharmaceuticals Portfolio | 55,900 | 125 |
In addition, during the period the investment adviser reimbursed and/or waived a portion of operating expenses as follows:
| Amount | |
| Biotechnology Portfolio | $265,512 |
| Health Care Portfolio | 181,791 |
| Medical Delivery Portfolio | 20,732 |
| Medical Equipment and Systems Portfolio | 47,537 |
| Pharmaceuticals Portfolio | 43,389 |
9. Other.
The Funds' organizational documents provide former and current trustees and officers with a limited indemnification against liabilities arising in connection with the performance of their duties to the Funds. In the normal course of business, the Funds may also enter into contracts that provide general indemnifications. The Funds' maximum exposure under these arrangements is unknown as this would be dependent on future claims that may be made against the Funds. The risk of material loss from such claims is considered remote.
Shareholder Expense Example
As a shareholder of a Fund, you incur two types of costs: (1) transaction costs, including redemption fees and (2) ongoing costs, including management fees and other Fund expenses. This Example is intended to help you understand your ongoing costs (in dollars) of investing in the Funds and to compare these costs with the ongoing costs of investing in other mutual funds.
The Example is based on an investment of $1,000 invested at the beginning of the period and held for the entire period (March 1, 2015 to August 31, 2015).
Actual Expenses
The first line of the accompanying table for each fund provides information about actual account values and actual expenses. You may use the information in this line, together with the amount you invested, to estimate the expenses that you paid over the period. Simply divide your account value by $1,000.00 (for example, an $8,600 account value divided by $1,000.00 = 8.6), then multiply the result by the number in the first line for a fund under the heading entitled "Expenses Paid During Period" to estimate the expenses you paid on your account during this period. A small balance maintenance fee of $12.00 that is charged once a year may apply for certain accounts with a value of less than $2,000. This fee is not included in the table below. If it was, the estimate of expenses you paid during the period would be higher, and your ending account value lower, by this amount. In addition, each Fund, as a shareholder in the underlying Fidelity Central Funds, will indirectly bear its pro-rata share of the fees and expenses incurred by the underlying Fidelity Central Funds. These fees and expenses are not included in the Fund's annualized expense ratio used to calculate the expense estimate in the table below.
Hypothetical Example for Comparison Purposes
The second line of the accompanying table for each fund provides information about hypothetical account values and hypothetical expenses based on a fund's actual expense ratio and an assumed rate of return of 5% per year before expenses, which is not the Fund's actual return. The hypothetical account values and expenses may not be used to estimate the actual ending account balance or expenses you paid for the period. You may use this information to compare the ongoing costs of investing in the Fund and other funds. To do so, compare this 5% hypothetical example with the 5% hypothetical examples that appear in the shareholder reports of the other funds. A small balance maintenance fee of $12.00 that is charged once a year may apply for certain accounts with a value of less than $2,000. This fee is not included in the table below. If it was, the estimate of expenses you paid during the period would be higher, and your ending account value lower, by this amount. In addition, each Fund, as a shareholder in the underlying Fidelity Central Funds, will indirectly bear its pro-rata share of the fees and expenses incurred by the underlying Fidelity Central Funds. These fees and expenses are not included in the Fund's annualized expense ratio used to calculate the expense estimate in the table below.
Please note that the expenses shown in the table are meant to highlight your ongoing costs only and do not reflect any transaction costs. Therefore, the second line of the table is useful in comparing ongoing costs only, and will not help you determine the relative total costs of owning different funds. In addition, if these transactional costs were included, your costs would have been higher.
| Annualized Expense Ratio-A | Beginning Account Value March 1, 2015 | Ending Account Value August 31, 2015 | Expenses Paid During Period-B March 1, 2015 to August 31, 2015 |
|
| Biotechnology Portfolio | .72% | |||
| Actual | $1,000.00 | $1,025.60 | $3.67 | |
| Hypothetical-C | $1,000.00 | $1,021.52 | $3.66 | |
| Health Care Portfolio | .72% | |||
| Actual | $1,000.00 | $990.50 | $3.60 | |
| Hypothetical-C | $1,000.00 | $1,021.52 | $3.66 | |
| Medical Delivery Portfolio | .77% | |||
| Actual | $1,000.00 | $1,024.00 | $3.92 | |
| Hypothetical-C | $1,000.00 | $1,021.27 | $3.91 | |
| Medical Equipment and Systems Portfolio | .75% | |||
| Actual | $1,000.00 | $973.10 | $3.72 | |
| Hypothetical-C | $1,000.00 | $1,021.37 | $3.81 | |
| Pharmaceuticals Portfolio | .77% | |||
| Actual | $1,000.00 | $1,029.10 | $3.93 | |
| Hypothetical-C | $1,000.00 | $1,021.27 | $3.91 |
A Annualized expense ratio reflects expenses net of applicable fee waivers.
B Expenses are equal to each Fund's annualized expense ratio, multiplied by the average account value over the period, multiplied by 184/366 (to reflect the one-half year period).
C 5% return per year before expenses
![]()
SELHC-SANN-1015
1.813645.110
|
Fidelity® Select Portfolios® Telecommunications Portfolio Wireless Portfolio Semi-Annual Report August 31, 2015 |
|
|
Contents
|
Telecommunications Portfolio |
|
|
Wireless Portfolio |
|
To view a fund's proxy voting guidelines and proxy voting record for the 12-month period ended June 30, visit http://www.fidelity.com/proxyvotingresults or visit the Securities and Exchange Commission's (SEC) web site at http://www.sec.gov.
You may also call 1-800-544-8544 to request a free copy of the proxy voting guidelines.
Standard & Poor's, S&P and S&P 500 are registered service marks of The McGraw-Hill Companies, Inc. and have been licensed for use by Fidelity Distributors Corporation.
Other third-party marks appearing herein are the property of their respective owners.
All other marks appearing herein are registered or unregistered trademarks or service marks of FMR LLC or an affiliated company. © 2015 FMR LLC. All rights reserved.
This report and the financial statements contained herein are submitted for the general information of the shareholders of the Funds. This report is not authorized for distribution to prospective investors in the Funds unless preceded or accompanied by an effective prospectus.
A fund files its complete schedule of portfolio holdings with the SEC for the first and third quarters of each fiscal year on Form N-Q. Forms N-Q are available on the SEC’s web site at http://www.sec.gov. A fund's Forms N-Q may be reviewed and copied at the SEC’s Public Reference Room in Washington, DC. Information regarding the operation of the SEC's Public Reference Room may be obtained by calling 1-800-SEC-0330.
For a complete list of a fund's portfolio holdings, view the most recent holdings listing, semiannual report, or annual report on Fidelity's web site at http://www.fidelity.com, http://www.advisor.fidelity.com, or http://www.401k.com, as applicable.
NOT FDIC INSURED •MAY LOSE VALUE •NO BANK GUARANTEE
Neither the Funds nor Fidelity Distributors Corporation is a bank.
Telecommunications Portfolio
Investment Summary (Unaudited)
Top Ten Stocks as of August 31, 2015
| % of fund's net assets | % of fund's net assets 6 months ago | |
| AT&T, Inc. | 24.0 | 13.9 |
| Verizon Communications, Inc. | 16.6 | 19.9 |
| T-Mobile U.S., Inc. | 4.5 | 4.3 |
| Level 3 Communications, Inc. | 4.5 | 6.4 |
| SBA Communications Corp. Class A | 4.2 | 4.3 |
| American Tower Corp. | 4.2 | 2.3 |
| Cogent Communications Group, Inc. | 3.9 | 4.3 |
| CenturyLink, Inc. | 3.2 | 3.3 |
| Telephone & Data Systems, Inc. | 3.0 | 3.2 |
| Frontier Communications Corp. | 2.8 | 3.0 |
| 70.9 |
Top Industries (% of fund's net assets)
| As of August 31, 2015 | ||
| Diversified Telecommunication Services | 70.2% | |
| Wireless Telecommunication Services | 19.1% | |
| Real Estate Investment Trusts | 5.2% | |
| Media | 2.1% | |
| Internet Software & Services | 1.0% | |
| All Others* | 2.4% | |

| As of February 28, 2015 | ||
| Diversified Telecommunication Services | 62.8% | |
| Wireless Telecommunication Services | 19.8% | |
| Media | 9.8% | |
| Real Estate Investment Trusts | 2.7% | |
| Internet Software & Services | 1.0% | |
| All Others* | 3.9% | |

* Includes short-term investments and net other assets (liabilities).
Telecommunications Portfolio
Investments August 31, 2015 (Unaudited)
Showing Percentage of Net Assets
| Common Stocks - 98.1% | |||
| Shares | Value | ||
| Communications Equipment - 0.7% | |||
| Communications Equipment - 0.7% | |||
| Ruckus Wireless, Inc. (a) | 295,500 | $3,345,060 | |
| Diversified Telecommunication Services - 69.7% | |||
| Alternative Carriers - 18.1% | |||
| 8x8, Inc. (a) | 837,086 | 6,470,675 | |
| Cogent Communications Group, Inc. | 619,868 | 17,213,734 | |
| Globalstar, Inc. (a)(b) | 2,591,600 | 4,561,216 | |
| Iliad SA | 9,309 | 2,102,799 | |
| inContact, Inc. (a)(b) | 958,313 | 7,235,263 | |
| Iridium Communications, Inc. (a)(b) | 504,976 | 3,762,071 | |
| Level 3 Communications, Inc. (a) | 443,767 | 19,849,698 | |
| Lumos Networks Corp. | 579,378 | 6,801,898 | |
| Premiere Global Services, Inc. (a) | 525,883 | 5,669,019 | |
| Towerstream Corp. (a)(b) | 807,024 | 1,202,466 | |
| Vonage Holdings Corp. (a) | 766,171 | 4,252,249 | |
| Zayo Group Holdings, Inc. | 34,800 | 973,356 | |
| 80,094,444 | |||
| Integrated Telecommunication Services - 51.6% | |||
| AT&T, Inc. | 3,201,420 | 106,287,144 | |
| Atlantic Tele-Network, Inc. | 110,000 | 7,859,500 | |
| Bezeq The Israel Telecommunication Corp. Ltd. | 1,252,300 | 2,250,046 | |
| CenturyLink, Inc. | 526,778 | 14,244,077 | |
| Cincinnati Bell, Inc. (a) | 884,314 | 3,033,197 | |
| Consolidated Communications Holdings, Inc. | 211,398 | 4,124,375 | |
| Frontier Communications Corp. (b) | 2,466,183 | 12,503,548 | |
| General Communications, Inc. Class A (a) | 63,694 | 1,073,244 | |
| IDT Corp. Class B | 202,881 | 3,169,001 | |
| Telecom Italia SpA (a) | 4,000 | 4,855 | |
| Verizon Communications, Inc. | 1,599,497 | 73,592,857 | |
| Windstream Holdings, Inc. (b) | 42,580 | 306,150 | |
| 228,447,994 | |||
| TOTAL DIVERSIFIED TELECOMMUNICATION SERVICES | 308,542,438 | ||
| Internet Software & Services - 1.0% | |||
| Internet Software & Services - 1.0% | |||
| Gogo, Inc. (a)(b) | 202,000 | 3,209,780 | |
| Rackspace Hosting, Inc. (a) | 38,700 | 1,176,867 | |
| 4,386,647 | |||
| Media - 2.1% | |||
| Cable & Satellite - 2.1% | |||
| Charter Communications, Inc. Class A (a)(b) | 12,800 | 2,324,608 | |
| Liberty Global PLC Class C (a) | 40,336 | 1,809,876 | |
| Liberty LiLac Group Class C (a) | 1,916 | 63,707 | |
| Time Warner Cable, Inc. | 28,300 | 5,264,366 | |
| 9,462,557 | |||
| Real Estate Investment Trusts - 5.2% | |||
| Specialized REITs - 5.2% | |||
| American Tower Corp. | 200,190 | 18,455,516 | |
| Communications Sales & Leasing, Inc. | 137,000 | 2,753,700 | |
| Crown Castle International Corp. | 14,000 | 1,167,460 | |
| CyrusOne, Inc. | 21,100 | 668,026 | |
| 23,044,702 | |||
| Software - 0.5% | |||
| Application Software - 0.3% | |||
| Interactive Intelligence Group, Inc. (a) | 37,100 | 1,298,871 | |
| Systems Software - 0.2% | |||
| Rovi Corp. (a) | 90,700 | 1,004,049 | |
| TOTAL SOFTWARE | 2,302,920 | ||
| Wireless Telecommunication Services - 18.9% | |||
| Wireless Telecommunication Services - 18.9% | |||
| Bharti Infratel Ltd. | 481,103 | 2,898,945 | |
| KDDI Corp. | 179,400 | 4,451,610 | |
| Leap Wireless International, Inc. rights (a) | 400 | 1,008 | |
| RingCentral, Inc. (a) | 257,690 | 4,434,845 | |
| SBA Communications Corp. Class A (a) | 158,156 | 18,694,039 | |
| Shenandoah Telecommunications Co. | 51,626 | 1,997,410 | |
| SoftBank Corp. | 76,900 | 4,474,300 | |
| Sprint Corp. (a)(b) | 2,118,585 | 10,720,040 | |
| T-Mobile U.S., Inc. (a) | 502,497 | 19,903,906 | |
| Telephone & Data Systems, Inc. | 470,664 | 13,385,684 | |
| U.S. Cellular Corp. (a) | 70,900 | 2,617,628 | |
| 83,579,415 | |||
| TOTAL COMMON STOCKS | |||
| (Cost $406,491,722) | 434,663,739 | ||
| Nonconvertible Preferred Stocks - 0.7% | |||
| Diversified Telecommunication Services - 0.5% | |||
| Integrated Telecommunication Services - 0.5% | |||
| Telefonica Brasil SA sponsored ADR | 187,700 | 2,089,101 | |
| Wireless Telecommunication Services - 0.2% | |||
| Wireless Telecommunication Services - 0.2% | |||
| TIM Participacoes SA sponsored ADR (b) | 68,300 | 825,747 | |
| TOTAL NONCONVERTIBLE PREFERRED STOCKS | |||
| (Cost $4,873,932) | 2,914,848 | ||
| Money Market Funds - 9.0% | |||
| Fidelity Cash Central Fund, 0.15% (c) | 3,716,824 | 3,716,824 | |
| Fidelity Securities Lending Cash Central Fund, 0.19% (c)(d) | 36,212,186 | 36,212,186 | |
| TOTAL MONEY MARKET FUNDS | |||
| (Cost $39,929,010) | 39,929,010 | ||
| TOTAL INVESTMENT PORTFOLIO - 107.8% | |||
| (Cost $451,294,664) | 477,507,597 | ||
| NET OTHER ASSETS (LIABILITIES) - (7.8)% | (34,609,017) | ||
| NET ASSETS - 100% | $442,898,580 |
Legend
(a) Non-income producing
(b) Security or a portion of the security is on loan at period end.
(c) Affiliated fund that is generally available only to investment companies and other accounts managed by Fidelity Investments. The rate quoted is the annualized seven-day yield of the fund at period end. A complete unaudited listing of the fund's holdings as of its most recent quarter end is available upon request. In addition, each Fidelity Central Fund's financial statements are available on the SEC's website or upon request.
(d) Investment made with cash collateral received from securities on loan.
Affiliated Central Funds
Information regarding fiscal year to date income earned by the Fund from investments in Fidelity Central Funds is as follows:
| Fund | Income earned |
| Fidelity Cash Central Fund | $4,800 |
| Fidelity Securities Lending Cash Central Fund | 261,852 |
| Total | $266,652 |
Investment Valuation
The following is a summary of the inputs used, as of August 31, 2015, involving the Fund's assets and liabilities carried at fair value. The inputs or methodology used for valuing securities may not be an indication of the risk associated with investing in those securities. For more information on valuation inputs, and their aggregation into the levels used below, please refer to the Investment Valuation section in the accompanying Notes to Financial Statements.
| Valuation Inputs at Reporting Date: | ||||
| Description | Total | Level 1 | Level 2 | Level 3 |
| Investments in Securities: | ||||
| Common Stocks | $434,663,739 | $425,731,966 | $8,930,765 | $1,008 |
| Nonconvertible Preferred Stocks | 2,914,848 | 2,914,848 | -- | -- |
| Money Market Funds | 39,929,010 | 39,929,010 | -- | -- |
| Total Investments in Securities: | $477,507,597 | $468,575,824 | $8,930,765 | $1,008 |
See accompanying notes which are an integral part of the financial statements.
Telecommunications Portfolio
Financial Statements
Statement of Assets and Liabilities
| August 31, 2015 (Unaudited) | ||
| Assets | ||
| Investment in securities, at value (including securities loaned of $34,895,988) — See accompanying schedule: Unaffiliated issuers (cost $411,365,654) | $437,578,587 | |
| Fidelity Central Funds (cost $39,929,010) | 39,929,010 | |
| Total Investments (cost $451,294,664) | $477,507,597 | |
| Receivable for investments sold | 1,766,887 | |
| Receivable for fund shares sold | 180,063 | |
| Dividends receivable | 290,683 | |
| Distributions receivable from Fidelity Central Funds | 17,228 | |
| Prepaid expenses | 3,301 | |
| Other receivables | 17,532 | |
| Total assets | 479,783,291 | |
| Liabilities | ||
| Payable for fund shares redeemed | $336,971 | |
| Accrued management fee | 209,789 | |
| Distribution and service plan fees payable | 11,414 | |
| Other affiliated payables | 87,438 | |
| Other payables and accrued expenses | 26,913 | |
| Collateral on securities loaned, at value | 36,212,186 | |
| Total liabilities | 36,884,711 | |
| Net Assets | $442,898,580 | |
| Net Assets consist of: | ||
| Paid in capital | $414,143,036 | |
| Undistributed net investment income | 3,347,303 | |
| Accumulated undistributed net realized gain (loss) on investments and foreign currency transactions | (801,296) | |
| Net unrealized appreciation (depreciation) on investments and assets and liabilities in foreign currencies | 26,209,537 | |
| Net Assets | $442,898,580 | |
| Calculation of Maximum Offering Price | ||
| Class A: | ||
| Net Asset Value and redemption price per share ($11,277,613 ÷ 190,074.6 shares) | $59.33 | |
| Maximum offering price per share (100/94.25 of $59.33) | $62.95 | |
| Class T: | ||
| Net Asset Value and redemption price per share ($4,673,388 ÷ 79,139.6 shares) | $59.05 | |
| Maximum offering price per share (100/96.50 of $59.05) | $61.19 | |
| Class B: | ||
| Net Asset Value and offering price per share ($293,027 ÷ 4,941.8 shares)(a) | $59.30 | |
| Class C: | ||
| Net Asset Value and offering price per share ($7,854,045 ÷ 133,279.2 shares)(a) | $58.93 | |
| Telecommunications: | ||
| Net Asset Value, offering price and redemption price per share ($416,170,637 ÷ 6,974,835.5 shares) | $59.67 | |
| Class I: | ||
| Net Asset Value, offering price and redemption price per share ($2,629,870 ÷ 44,193.5 shares) | $59.51 |
(a) Redemption price per share is equal to net asset value less any applicable contingent deferred sales charge.
See accompanying notes which are an integral part of the financial statements.
Statement of Operations
| Six months ended August 31, 2015 (Unaudited) | ||
| Investment Income | ||
| Dividends | $4,875,493 | |
| Income from Fidelity Central Funds (including $261,852 from security lending) | 266,652 | |
| Total income | 5,142,145 | |
| Expenses | ||
| Management fee | $1,143,661 | |
| Transfer agent fees | 410,388 | |
| Distribution and service plan fees | 68,462 | |
| Accounting and security lending fees | 84,413 | |
| Custodian fees and expenses | 13,468 | |
| Independent trustees' compensation | 3,397 | |
| Registration fees | 59,639 | |
| Audit | 29,468 | |
| Legal | 2,953 | |
| Interest | 121 | |
| Miscellaneous | 2,591 | |
| Total expenses before reductions | 1,818,561 | |
| Expense reductions | (37,014) | 1,781,547 |
| Net investment income (loss) | 3,360,598 | |
| Realized and Unrealized Gain (Loss)
Net realized gain (loss) on: | ||
| Investment securities: | ||
| Unaffiliated issuers | 5,446,056 | |
| Foreign currency transactions | (11,945) | |
| Total net realized gain (loss) | 5,434,111 | |
| Change in net unrealized appreciation (depreciation) on: Investment securities | (37,681,329) | |
| Assets and liabilities in foreign currencies | (592) | |
| Total change in net unrealized appreciation (depreciation) | (37,681,921) | |
| Net gain (loss) | (32,247,810) | |
| Net increase (decrease) in net assets resulting from operations | $(28,887,212) |
See accompanying notes which are an integral part of the financial statements.
Statement of Changes in Net Assets
| Six months ended August 31, 2015 (Unaudited) | Year ended February 28, 2015 | |
| Increase (Decrease) in Net Assets | ||
| Operations | ||
| Net investment income (loss) | $3,360,598 | $6,193,869 |
| Net realized gain (loss) | 5,434,111 | 7,829,307 |
| Change in net unrealized appreciation (depreciation) | (37,681,921) | 28,387,304 |
| Net increase (decrease) in net assets resulting from operations | (28,887,212) | 42,410,480 |
| Distributions to shareholders from net investment income | (275,781) | (13,679,321) |
| Share transactions - net increase (decrease) | 99,746,494 | (19,703,086) |
| Redemption fees | 5,715 | 3,706 |
| Total increase (decrease) in net assets | 70,589,216 | 9,031,779 |
| Net Assets | ||
| Beginning of period | 372,309,364 | 363,277,585 |
| End of period (including undistributed net investment income of $3,347,303 and undistributed net investment income of $262,486, respectively) | $442,898,580 | $372,309,364 |
See accompanying notes which are an integral part of the financial statements.
Financial Highlights — Telecommunications Portfolio Class A
| Six months ended (Unaudited) | Years ended February 28, | |||||
| August 31, | 2015 | 2015 | 2014 | 2013 | 2012A | 2011 |
| Selected Per–Share Data | ||||||
| Net asset value, beginning of period | $63.26 | $58.71 | $51.58 | $46.12 | $46.93 | $37.64 |
| Income from Investment Operations | ||||||
| Net investment income (loss)B | .41 | .76 | 1.76C | .99 | .56 | .57 |
| Net realized and unrealized gain (loss) | (4.32) | 5.83 | 6.48 | 5.43 | (.86) | 9.49 |
| Total from investment operations | (3.91) | 6.59 | 8.24 | 6.42 | (.30) | 10.06 |
| Distributions from net investment income | (.02) | (2.04) | (1.11) | (.96) | (.51) | (.77) |
| Distributions from net realized gain | – | – | (.01) | – | – | – |
| Total distributions | (.02) | (2.04) | (1.11)D | (.96) | (.51) | (.77) |
| Redemption fees added to paid in capitalB,E | – | – | – | – | – | – |
| Net asset value, end of period | $59.33 | $63.26 | $58.71 | $51.58 | $46.12 | $46.93 |
| Total ReturnF,G,H | (6.18)% | 11.54% | 16.00% | 13.97% | (.54)% | 26.87% |
| Ratios to Average Net AssetsI,J | ||||||
| Expenses before reductions | 1.17%K | 1.15% | 1.18% | 1.18% | 1.20% | 1.20% |
| Expenses net of fee waivers, if any | 1.16%K | 1.15% | 1.18% | 1.18% | 1.20% | 1.20% |
| Expenses net of all reductions | 1.15%K | 1.15% | 1.15% | 1.17% | 1.18% | 1.18% |
| Net investment income (loss) | 1.31%K | 1.26% | 3.08%C | 2.01% | 1.21% | 1.35% |
| Supplemental Data | ||||||
| Net assets, end of period (000 omitted) | $11,278 | $11,052 | $7,712 | $6,449 | $4,677 | $4,305 |
| Portfolio turnover rateL | 75%K | 94%M | 111% | 76% | 72% | 72% |
A For the year ended February 29.
B Calculated based on average shares outstanding during the period.
C Investment income per share reflects large, non-recurring dividends which amounted to $.95 per share. Excluding these non-recurring dividends, the ratio of net investment income (loss) to average net assets would have been 1.43%.
D Total distributions of $1.11 per share is comprised of distributions from net investment income of $1.106 and distributions from net realized gain of $.005 per share.
E Amount represents less than $.005 per share.
F Total returns for periods of less than one year are not annualized.
G Total returns would have been lower if certain expenses had not been reduced during the applicable periods shown.
H Total returns do not include the effect of the sales charges.
I Fees and expenses of any underlying Fidelity Central Funds are not included in the Fund's expense ratio. The Fund indirectly bears its proportionate share of the expenses of any underlying Fidelity Central Funds.
J Expense ratios reflect operating expenses of the class. Expenses before reductions do not reflect amounts reimbursed by the investment adviser or reductions from brokerage service arrangements or reductions from other expense offset arrangements and do not represent the amount paid by the class during periods when reimbursements or reductions occur. Expenses net of fee waivers reflect expenses after reimbursement by the investment adviser but prior to reductions from brokerage service arrangements or other expense offset arrangements. Expenses net of all reductions represent the net expenses paid by the class.
K Annualized
L Amount does not include the portfolio activity of any underlying Fidelity Central Funds.
M Portfolio turnover rate excludes securities received or delivered in-kind.
See accompanying notes which are an integral part of the financial statements.
Financial Highlights — Telecommunications Portfolio Class T
| Six months ended(Unaudited) | Years ended February 28, | |||||
| August 31, | 2015 | 2015 | 2014 | 2013 | 2012A | 2011 |
| Selected Per–Share Data | ||||||
| Net asset value, beginning of period | $63.04 | $58.50 | $51.41 | $46.01 | $46.81 | $37.55 |
| Income from Investment Operations | ||||||
| Net investment income (loss)B | .31 | .57 | 1.59C | .85 | .42 | .45 |
| Net realized and unrealized gain (loss) | (4.30) | 5.81 | 6.44 | 5.39 | (.84) | 9.47 |
| Total from investment operations | (3.99) | 6.38 | 8.03 | 6.24 | (.42) | 9.92 |
| Distributions from net investment income | – | (1.84) | (.94) | (.84) | (.38) | (.66) |
| Distributions from net realized gain | – | – | (.01) | – | – | – |
| Total distributions | – | (1.84) | (.94)D | (.84) | (.38) | (.66) |
| Redemption fees added to paid in capitalB,E | – | – | – | – | – | – |
| Net asset value, end of period | $59.05 | $63.04 | $58.50 | $51.41 | $46.01 | $46.81 |
| Total ReturnF,G,H | (6.33)% | 11.19% | 15.64% | 13.61% | (.82)% | 26.54% |
| Ratios to Average Net AssetsI,J | ||||||
| Expenses before reductions | 1.48%K | 1.47% | 1.48% | 1.48% | 1.49% | 1.48% |
| Expenses net of fee waivers, if any | 1.48%K | 1.47% | 1.48% | 1.48% | 1.49% | 1.48% |
| Expenses net of all reductions | 1.47%K | 1.46% | 1.45% | 1.46% | 1.47% | 1.46% |
| Net investment income (loss) | 1.00%K | .94% | 2.78%C | 1.72% | .92% | 1.06% |
| Supplemental Data | ||||||
| Net assets, end of period (000 omitted) | $4,673 | $5,095 | $4,344 | $4,237 | $2,702 | $2,882 |
| Portfolio turnover rateL | 75%K | 94%M | 111% | 76% | 72% | 72% |
A For the year ended February 29.
B Calculated based on average shares outstanding during the period.
C Investment income per share reflects large, non-recurring dividends which amounted to $.94 per share. Excluding these non-recurring dividends, the ratio of net investment income (loss) to average net assets would have been 1.13%.
D Total distributions of $.94 per share is comprised of distributions from net investment income of $.939 and distributions from net realized gain of $.005 per share.
E Amount represents less than $.005 per share.
F Total returns for periods of less than one year are not annualized.
G Total returns would have been lower if certain expenses had not been reduced during the applicable periods shown.
H Total returns do not include the effect of the sales charges.
I Fees and expenses of any underlying Fidelity Central Funds are not included in the Fund's expense ratio. The Fund indirectly bears its proportionate share of the expenses of any underlying Fidelity Central Funds.
J Expense ratios reflect operating expenses of the class. Expenses before reductions do not reflect amounts reimbursed by the investment adviser or reductions from brokerage service arrangements or reductions from other expense offset arrangements and do not represent the amount paid by the class during periods when reimbursements or reductions occur. Expenses net of fee waivers reflect expenses after reimbursement by the investment adviser but prior to reductions from brokerage service arrangements or other expense offset arrangements. Expenses net of all reductions represent the net expenses paid by the class.
K Annualized
L Amount does not include the portfolio activity of any underlying Fidelity Central Funds.
M Portfolio turnover rate excludes securities received or delivered in-kind.
See accompanying notes which are an integral part of the financial statements.
Financial Highlights — Telecommunications Portfolio Class B
| Six months ended (Unaudited) | Years ended February 28, | |||||
| August 31, | 2015 | 2015 | 2014 | 2013 | 2012A | 2011 |
| Selected Per–Share Data | ||||||
| Net asset value, beginning of period | $63.45 | $58.77 | $51.63 | $46.14 | $46.93 | $37.60 |
| Income from Investment Operations | ||||||
| Net investment income (loss)B | .17 | .29 | 1.33C | .62 | .21 | .25 |
| Net realized and unrealized gain (loss) | (4.32) | 5.84 | 6.48 | 5.42 | (.83) | 9.48 |
| Total from investment operations | (4.15) | 6.13 | 7.81 | 6.04 | (.62) | 9.73 |
| Distributions from net investment income | – | (1.45) | (.66) | (.55) | (.17) | (.40) |
| Distributions from net realized gain | – | – | (.01) | – | – | – |
| Total distributions | – | (1.45) | (.67) | (.55) | (.17) | (.40) |
| Redemption fees added to paid in capitalB,D | – | – | – | – | – | – |
| Net asset value, end of period | $59.30 | $63.45 | $58.77 | $51.63 | $46.14 | $46.93 |
| Total ReturnE,F,G | (6.54)% | 10.67% | 15.13% | 13.11% | (1.29)% | 25.96% |
| Ratios to Average Net AssetsH,I | ||||||
| Expenses before reductions | 1.95%J | 1.93% | 1.93% | 1.93% | 1.95% | 1.95% |
| Expenses net of fee waivers, if any | 1.95%J | 1.93% | 1.93% | 1.93% | 1.95% | 1.95% |
| Expenses net of all reductions | 1.93%J | 1.92% | 1.91% | 1.92% | 1.93% | 1.93% |
| Net investment income (loss) | .53%J | .49% | 2.32%C | 1.26% | .47% | .60% |
| Supplemental Data | ||||||
| Net assets, end of period (000 omitted) | $293 | $409 | $546 | $576 | $596 | $706 |
| Portfolio turnover rateK | 75%J | 94%L | 111% | 76% | 72% | 72% |
A For the year ended February 29.
B Calculated based on average shares outstanding during the period.
C Investment income per share reflects large, non-recurring dividends which amounted to $.95 per share. Excluding these non-recurring dividends, the ratio of net investment income (loss) to average net assets would have been .67%.
D Amount represents less than $.005 per share.
E Total returns for periods of less than one year are not annualized.
F Total returns would have been lower if certain expenses had not been reduced during the applicable periods shown.
G Total returns do not include the effect of the contingent deferred sales charge.
H Fees and expenses of any underlying Fidelity Central Funds are not included in the Fund's expense ratio. The Fund indirectly bears its proportionate share of the expenses of any underlying Fidelity Central Funds.
I Expense ratios reflect operating expenses of the class. Expenses before reductions do not reflect amounts reimbursed by the investment adviser or reductions from brokerage service arrangements or reductions from other expense offset arrangements and do not represent the amount paid by the class during periods when reimbursements or reductions occur. Expenses net of fee waivers reflect expenses after reimbursement by the investment adviser but prior to reductions from brokerage service arrangements or other expense offset arrangements. Expenses net of all reductions represent the net expenses paid by the class.
J Annualized
K Amount does not include the portfolio activity of any underlying Fidelity Central Funds.
L Portfolio turnover rate excludes securities received or delivered in-kind.
See accompanying notes which are an integral part of the financial statements.
Financial Highlights — Telecommunications Portfolio Class C
| Six months ended (Unaudited) | Years ended February 28, | |||||
| August 31, | 2015 | 2015 | 2014 | 2013 | 2012A | 2011 |
| Selected Per–Share Data | ||||||
| Net asset value, beginning of period | $63.04 | $58.54 | $51.47 | $46.02 | $46.89 | $37.61 |
| Income from Investment Operations | ||||||
| Net investment income (loss)B | .17 | .34 | 1.36C | .63 | .22 | .26 |
| Net realized and unrealized gain (loss) | (4.28) | 5.80 | 6.46 | 5.41 | (.84) | 9.46 |
| Total from investment operations | (4.11) | 6.14 | 7.82 | 6.04 | (.62) | 9.72 |
| Distributions from net investment income | – | (1.64) | (.74) | (.59) | (.25) | (.44) |
| Distributions from net realized gain | – | – | (.01) | – | – | – |
| Total distributions | – | (1.64) | (.75) | (.59) | (.25) | (.44) |
| Redemption fees added to paid in capitalB,D | – | – | – | – | – | – |
| Net asset value, end of period | $58.93 | $63.04 | $58.54 | $51.47 | $46.02 | $46.89 |
| Total ReturnE,F,G | (6.52)% | 10.75% | 15.20% | 13.14% | (1.27)% | 25.95% |
| Ratios to Average Net AssetsH,I | ||||||
| Expenses before reductions | 1.92%J | 1.85% | 1.88% | 1.90% | 1.93% | 1.94% |
| Expenses net of fee waivers, if any | 1.92%J | 1.85% | 1.88% | 1.90% | 1.93% | 1.94% |
| Expenses net of all reductions | 1.90%J | 1.85% | 1.85% | 1.89% | 1.91% | 1.92% |
| Net investment income (loss) | .56%J | .56% | 2.38%C | 1.29% | .48% | .61% |
| Supplemental Data | ||||||
| Net assets, end of period (000 omitted) | $7,854 | $7,074 | $5,523 | $4,353 | $3,514 | $3,035 |
| Portfolio turnover rateK | 75%J | 94%L | 111% | 76% | 72% | 72% |
A For the year ended February 29.
B Calculated based on average shares outstanding during the period.
C Investment income per share reflects large, non-recurring dividends which amounted to $.94 per share. Excluding these non-recurring dividends, the ratio of net investment income (loss) to average net assets would have been .73%.
D Amount represents less than $.005 per share.
E Total returns for periods of less than one year are not annualized.
F Total returns would have been lower if certain expenses had not been reduced during the applicable periods shown.
G Total returns do not include the effect of the contingent deferred sales charge.
H Fees and expenses of any underlying Fidelity Central Funds are not included in the Fund's expense ratio. The Fund indirectly bears its proportionate share of the expenses of any underlying Fidelity Central Funds.
I Expense ratios reflect operating expenses of the class. Expenses before reductions do not reflect amounts reimbursed by the investment adviser or reductions from brokerage service arrangements or reductions from other expense offset arrangements and do not represent the amount paid by the class during periods when reimbursements or reductions occur. Expenses net of fee waivers reflect expenses after reimbursement by the investment adviser but prior to reductions from brokerage service arrangements or other expense offset arrangements. Expenses net of all reductions represent the net expenses paid by the class.
J Annualized
K Amount does not include the portfolio activity of any underlying Fidelity Central Funds.
L Portfolio turnover rate excludes securities received or delivered in-kind.
See accompanying notes which are an integral part of the financial statements.
Financial Highlights — Telecommunications Portfolio
| Six months ended (Unaudited) | Years ended February 28, | |||||
| August 31, | 2015 | 2015 | 2014 | 2013 | 2012A | 2011 |
| Selected Per–Share Data | ||||||
| Net asset value, beginning of period | $63.54 | $58.94 | $51.75 | $46.26 | $47.07 | $37.73 |
| Income from Investment Operations | ||||||
| Net investment income (loss)B | .52 | .96 | 1.96C | 1.15 | .70 | .69 |
| Net realized and unrealized gain (loss) | (4.34) | 5.85 | 6.51 | 5.43 | (.86) | 9.52 |
| Total from investment operations | (3.82) | 6.81 | 8.47 | 6.58 | (.16) | 10.21 |
| Distributions from net investment income | (.05) | (2.21) | (1.28) | (1.09) | (.65) | (.87) |
| Distributions from net realized gain | – | – | (.01) | – | – | – |
| Total distributions | (.05) | (2.21) | (1.28)D | (1.09) | (.65) | (.87) |
| Redemption fees added to paid in capitalB,E | – | – | – | – | – | – |
| Net asset value, end of period | $59.67 | $63.54 | $58.94 | $51.75 | $46.26 | $47.07 |
| Total ReturnF,G | (6.01)% | 11.90% | 16.40% | 14.30% | (.23)% | 27.24% |
| Ratios to Average Net AssetsH,I | ||||||
| Expenses before reductions | .83%J | .83% | .85% | .87% | .90% | .92% |
| Expenses net of fee waivers, if any | .83%J | .83% | .85% | .87% | .90% | .92% |
| Expenses net of all reductions | .82%J | .82% | .82% | .85% | .88% | .91% |
| Net investment income (loss) | 1.65%J | 1.58% | 3.41%C | 2.33% | 1.52% | 1.62% |
| Supplemental Data | ||||||
| Net assets, end of period (000 omitted) | $416,171 | $346,174 | $343,548 | $377,841 | $342,262 | $354,938 |
| Portfolio turnover rateK | 75%J | 94%L | 111% | 76% | 72% | 72% |
A For the year ended February 29.
B Calculated based on average shares outstanding during the period.
C Investment income per share reflects large, non-recurring dividends which amounted to $.95 per share. Excluding these non-recurring dividends, the ratio of net investment income (loss) to average net assets would have been 1.76%.
D Total distributions of $1.28 per share is comprised of distributions from net investment income of $1.275 and distributions from net realized gain of $.005 per share.
E Amount represents less than $.005 per share.
F Total returns for periods of less than one year are not annualized.
G Total returns would have been lower if certain expenses had not been reduced during the applicable periods shown.
H Fees and expenses of any underlying Fidelity Central Funds are not included in the Fund's expense ratio. The Fund indirectly bears its proportionate share of the expenses of any underlying Fidelity Central Funds.
I Expense ratios reflect operating expenses of the class. Expenses before reductions do not reflect amounts reimbursed by the investment adviser or reductions from brokerage service arrangements or reductions from other expense offset arrangements and do not represent the amount paid by the class during periods when reimbursements or reductions occur. Expenses net of fee waivers reflect expenses after reimbursement by the investment adviser but prior to reductions from brokerage service arrangements or other expense offset arrangements. Expenses net of all reductions represent the net expenses paid by the class.
J Annualized
K Amount does not include the portfolio activity of any underlying Fidelity Central Funds.
L Portfolio turnover rate excludes securities received or delivered in-kind.
See accompanying notes which are an integral part of the financial statements.
Financial Highlights — Telecommunications Portfolio Class I
| Six months ended (Unaudited) | Years ended February 28, | |||||
| August 31, | 2015 | 2015 | 2014 | 2013 | 2012A | 2011 |
| Selected Per–Share Data | ||||||
| Net asset value, beginning of period | $63.38 | $58.80 | $51.65 | $46.20 | $47.02 | $37.69 |
| Income from Investment Operations | ||||||
| Net investment income (loss)B | .51 | .94 | 1.93C | 1.17 | .70 | .71 |
| Net realized and unrealized gain (loss) | (4.32) | 5.83 | 6.48 | 5.42 | (.88) | 9.50 |
| Total from investment operations | (3.81) | 6.77 | 8.41 | 6.59 | (.18) | 10.21 |
| Distributions from net investment income | (.06) | (2.19) | (1.25) | (1.14) | (.64) | (.88) |
| Distributions from net realized gain | – | – | (.01) | – | – | – |
| Total distributions | (.06) | (2.19) | (1.26) | (1.14) | (.64) | (.88) |
| Redemption fees added to paid in capitalB,D | – | – | – | – | – | – |
| Net asset value, end of period | $59.51 | $63.38 | $58.80 | $51.65 | $46.20 | $47.02 |
| Total ReturnE,F | (6.02)% | 11.85% | 16.30% | 14.33% | (.26)% | 27.27% |
| Ratios to Average Net AssetsG,H | ||||||
| Expenses before reductions | .85%I | .86% | .91% | .85% | .89% | .91% |
| Expenses net of fee waivers, if any | .85%I | .86% | .91% | .85% | .89% | .91% |
| Expenses net of all reductions | .84%I | .85% | .88% | .83% | .87% | .89% |
| Net investment income (loss) | 1.63%I | 1.55% | 3.35%C | 2.35% | 1.52% | 1.64% |
| Supplemental Data | ||||||
| Net assets, end of period (000 omitted) | $2,630 | $2,505 | $1,604 | $2,641 | $1,022 | $1,743 |
| Portfolio turnover rateJ | 75%I | 94%K | 111% | 76% | 72% | 72% |
A For the year ended February 29.
B Calculated based on average shares outstanding during the period.
C Investment income per share reflects large, non-recurring dividends which amounted to $.95 per share. Excluding these non-recurring dividends, the ratio of net investment income (loss) to average net assets would have been 1.70%.
D Amount represents less than $.005 per share.
E Total returns for periods of less than one year are not annualized.
F Total returns would have been lower if certain expenses had not been reduced during the applicable periods shown.
G Fees and expenses of any underlying Fidelity Central Funds are not included in the Fund's expense ratio. The Fund indirectly bears its proportionate share of the expenses of any underlying Fidelity Central Funds.
H Expense ratios reflect operating expenses of the class. Expenses before reductions do not reflect amounts reimbursed by the investment adviser or reductions from brokerage service arrangements or reductions from other expense offset arrangements and do not represent the amount paid by the class during periods when reimbursements or reductions occur. Expenses net of fee waivers reflect expenses after reimbursement by the investment adviser but prior to reductions from brokerage service arrangements or other expense offset arrangements. Expenses net of all reductions represent the net expenses paid by the class.
I Annualized
J Amount does not include the portfolio activity of any underlying Fidelity Central Funds.
K Portfolio turnover rate excludes securities received or delivered in-kind.
See accompanying notes which are an integral part of the financial statements.
Notes to Financial Statements (Unaudited)
For the period ended August 31, 2015
1. Organization.
Telecommunications Portfolio (the Fund) is a non-diversified fund of Fidelity Select Portfolios (the Trust) and is authorized to issue an unlimited number of shares. The Trust is registered under the Investment Company Act of 1940, as amended (the 1940 Act), as an open-end management investment company organized as a Massachusetts business trust. The Fund invests primarily in securities of companies whose principal business activities fall within specific industries. The Fund offers Class A, Class T, Class C, Telecommunications and Class I (formerly Institutional Class) shares, each of which, along with Class B shares, has equal rights as to assets and voting privileges. Class B shares are closed to new accounts and additional purchases, except for exchanges and reinvestments. Each class has exclusive voting rights with respect to matters that affect that class. Class B shares will automatically convert to Class A shares after a holding period of seven years from the initial date of purchase.
2. Investments in Fidelity Central Funds.
The Fund invests in Fidelity Central Funds, which are open-end investment companies generally available only to other investment companies and accounts managed by the investment adviser and its affiliates. The Fund's Schedule of Investments lists each of the Fidelity Central Funds held as of period end, if any, as an investment of the Fund, but does not include the underlying holdings of each Fidelity Central Fund. As an Investing Fund, the Fund indirectly bears its proportionate share of the expenses of the underlying Fidelity Central Funds.
The Money Market Central Funds seek preservation of capital and current income and are managed by Fidelity Investments Money Management, Inc. (FIMM), an affiliate of the investment adviser. Annualized expenses of the Money Market Central Funds as of their most recent shareholder report date are less than .01%.
A complete unaudited list of holdings for each Fidelity Central Fund is available upon request or at the Securities and Exchange Commission (the SEC) website at www.sec.gov. In addition, the financial statements of the Fidelity Central Funds are available on the SEC website or upon request.
3. Significant Accounting Policies.
The financial statements have been prepared in conformity with accounting principles generally accepted in the United States of America (GAAP), which require management to make certain estimates and assumptions at the date of the financial statements. Actual results could differ from those estimates. Subsequent events, if any, through the date that the financial statements were issued have been evaluated in the preparation of the financial statements. The following summarizes the significant accounting policies of the Fund:
Investment Valuation. Investments are valued as of 4:00 p.m. Eastern time on the last calendar day of the period. The Board of Trustees (the Board) has delegated the day to day responsibility for the valuation of the Fund's investments to the Fidelity SelectCo, LLC (SelectCo) Fair Value Committee (the Committee). In accordance with valuation policies and procedures approved by the Board, the Fund attempts to obtain prices from one or more third party pricing vendors or brokers to value its investments. When current market prices, quotations or currency exchange rates are not readily available or reliable, investments will be fair valued in good faith by the Committee, in accordance with procedures adopted by the Board. Factors used in determining fair value vary by investment type and may include market or investment specific events. The frequency with which these procedures are used cannot be predicted and they may be utilized to a significant extent. The Committee oversees the Fund's valuation policies and procedures and reports to the Board on the Committee's activities and fair value determinations. The Board monitors the appropriateness of the procedures used in valuing the Fund's investments and ratifies the fair value determinations of the Committee.
The Fund categorizes the inputs to valuation techniques used to value its investments into a disclosure hierarchy consisting of three levels as shown below:
- Level 1 – quoted prices in active markets for identical investments
- Level 2 – other significant observable inputs (including quoted prices for similar investments, interest rates, prepayment speeds, etc.)
- Level 3 – unobservable inputs (including the Fund's own assumptions based on the best information available)
Valuation techniques used to value the Fund's investments by major category are as follows:
Equity securities, including restricted securities, for which market quotations are readily available, are valued at the last reported sale price or official closing price as reported by a third party pricing vendor on the primary market or exchange on which they are traded and are categorized as Level 1 in the hierarchy. In the event there were no sales during the day or closing prices are not available, securities are valued at the last quoted bid price or may be valued using the last available price and are generally categorized as Level 2 in the hierarchy. For foreign equity securities, when market or security specific events arise, comparisons to the valuation of American Depositary Receipts (ADRs), futures contracts, Exchange-Traded Funds (ETFs) and certain indexes as well as quoted prices for similar securities may be used and would be categorized as Level 2 in the hierarchy. Utilizing these techniques may result in transfers between Level 1 and Level 2. For equity securities, including restricted securities, where observable inputs are limited, assumptions about market activity and risk are used and these securities may be categorized as Level 3 in the hierarchy.
Investments in open-end mutual funds, including the Fidelity Central Funds, are valued at their closing net asset value (NAV) each business day and are categorized as Level 1 in the hierarchy.
Changes in valuation techniques may result in transfers in or out of an assigned level within the disclosure hierarchy. The aggregate value of investments by input level, as of August 31, 2015, is included at the end of the Fund's Schedule of Investments.
Foreign Currency. The Fund may use foreign currency contracts to facilitate transactions in foreign-denominated securities. Gains and losses from these transactions may arise from changes in the value of the foreign currency or if the counterparties do not perform under the contracts' terms.
Foreign-denominated assets, including investment securities, and liabilities are translated into U.S. dollars at the exchange rates at period end. Purchases and sales of investment securities, income and dividends received and expenses denominated in foreign currencies are translated into U.S. dollars at the exchange rate in effect on the transaction date.
The effects of exchange rate fluctuations on investments are included with the net realized and unrealized gain (loss) on investment securities. Other foreign currency transactions resulting in realized and unrealized gain (loss) are disclosed separately.
Investment Transactions and Income. For financial reporting purposes, the Fund's investment holdings and NAV include trades executed through the end of the last business day of the period. The NAV per share for processing shareholder transactions is calculated as of the close of business of the New York Stock Exchange (NYSE), normally 4:00 p.m. Eastern time and includes trades executed through the end of the prior business day. Gains and losses on securities sold are determined on the basis of identified cost and may include proceeds received from litigation. Dividend income is recorded on the ex-dividend date, except for certain dividends from foreign securities where the ex-dividend date may have passed, which are recorded as soon as the Fund is informed of the ex-dividend date. Non-cash dividends included in dividend income, if any, are recorded at the fair market value of the securities received. Income and capital gain distributions from Fidelity Central Funds, if any, are recorded on the ex-dividend date. Distributions received on securities that represent a return of capital or capital gain are recorded as a reduction of cost of investments and/or as a realized gain. Subsequent to ex-dividend date the Fund determines the components of these distributions, based upon receipt of tax filings or other correspondence relating to the underlying investment. Investment income is recorded net of foreign taxes withheld where recovery of such taxes is uncertain.
Class Allocations and Expenses. Investment income, realized and unrealized capital gains and losses, common expenses of the Fund, and certain fund-level expense reductions, if any, are allocated daily on a pro-rata basis to each class based on the relative net assets of each class to the total net assets of the Fund. Each class differs with respect to transfer agent and distribution and service plan fees incurred. Certain expense reductions may also differ by class. For the reporting period, the allocated portion of income and expenses to each class as a percent of its average net assets may vary due to the timing of recording these transactions in relation to fluctuating net assets of the classes. Expenses directly attributable to a fund are charged to that fund. Expenses attributable to more than one fund are allocated among the respective funds on the basis of relative net assets or other appropriate methods. Expense estimates are accrued in the period to which they relate and adjustments are made when actual amounts are known.
Income Tax Information and Distributions to Shareholders. Each year, the Fund intends to qualify as a regulated investment company under Subchapter M of the Internal Revenue Code, including distributing substantially all of its taxable income and realized gains. As a result, no provision for U.S. Federal income taxes is required. The Fund files a U.S. federal tax return, in addition to state and local tax returns as required. The Fund's federal income tax returns are subject to examination by the Internal Revenue Service (IRS) for a period of three fiscal years after they are filed. State and local tax returns may be subject to examination for an additional fiscal year depending on the jurisdiction. Foreign taxes are provided for based on the Fund's understanding of the tax rules and rates that exist in the foreign markets in which it invests.
Distributions are declared and recorded on the ex-dividend date. Income dividends and capital gain distributions are declared separately for each class. Income and capital gain distributions are determined in accordance with income tax regulations, which may differ from GAAP.
Capital accounts within the financial statements are adjusted for permanent book-tax differences. These adjustments have no impact on net assets or the results of operations. Capital accounts are not adjusted for temporary book-tax differences which will reverse in a subsequent period.
Book-tax differences are primarily due to foreign currency transaction, in-kind transactions, deferred trustees compensation, capital loss carryforwards and losses deferred due to wash sales and excise tax regulations.
The federal tax cost of investment securities and unrealized appreciation (depreciation) as of period end were as follows:
| Gross unrealized appreciation | $48,958,944 |
| Gross unrealized depreciation | (26,279,442) |
| Net unrealized appreciation (depreciation) on securities | $22,679,502 |
| Tax cost | $454,828,095 |
Capital loss carryforwards are only available to offset future capital gains of the Fund to the extent provided by regulations and may be limited. Under the Regulated Investment Company Modernization Act of 2010 (the Act), the Fund is permitted to carry forward capital losses incurred in taxable years beginning after December 22, 2010 for an unlimited period and such capital losses are required to be used prior to any losses that expire. The capital loss carryforward information presented below, including any applicable limitation, is estimated as of prior fiscal period end and is subject to adjustment.
| Fiscal year of expiration | |
| 2018 | $(2,739,258) |
The Fund elected to defer to its next fiscal year approximately $1,605,208 of capital losses recognized during the period November 1, 2014 to February 28, 2015.
Trading (Redemption) Fees. Shares held by investors in the Fund less than 30 days may be subject to a redemption fee equal to .75% of the NAV of shares redeemed. All redemption fees, which reduce the proceeds of the shareholder redemption, are retained by the Fund and accounted for as an addition to paid in capital.
4. Purchases and Sales of Investments.
Purchases and sales of securities, other than short-term securities, aggregated $253,371,396 and $151,002,092, respectively.
5. Fees and Other Transactions with Affiliates.
Management Fee. Fidelity SelectCo, LLC (the investment adviser) and its affiliates provide the Fund with investment management related services for which the Fund pays a monthly management fee. The management fee is the sum of an individual fund fee rate that is based on an annual rate of .30% of the Fund's average net assets and an annualized group fee rate that averaged .25% during the period. The group fee rate is based upon the average net assets of all the mutual funds advised by Fidelity Management & Research Company (FMR) and the investment adviser. The group fee rate decreases as assets under management increase and increases as assets under management decrease. For the reporting period, the total annualized management fee rate was .55% of the Fund's average net assets.
Distribution and Service Plan Fees. In accordance with Rule 12b-1 of the 1940 Act, the Fund has adopted separate Distribution and Service Plans for each class of shares. Certain classes pay Fidelity Distributors Corporation (FDC), an affiliate of the investment adviser, separate Distribution and Service Fees, each of which is based on an annual percentage of each class' average net assets. In addition, FDC may pay financial intermediaries for selling shares of the Fund and providing shareholder support services. For the period, the Distribution and Service Fee rates, total fees and amounts retained by FDC were as follows:
| Distribution Fee | Service Fee | Total Fees | Retained by FDC |
|
| Class A | -% | .25% | $14,634 | $644 |
| Class T | .25% | .25% | 12,614 | – |
| Class B | .75% | .25% | 1,771 | 1,328 |
| Class C | .75% | .25% | 39,443 | 8,926 |
| $68,462 | $10,898 |
Sales Load. FDC may receive a front-end sales charge of up to 5.75% for selling Class A shares and 3.50% for selling Class T shares, some of which is paid to financial intermediaries for selling shares of the Fund. Depending on the holding period, FDC may receive contingent deferred sales charges levied on Class A, Class T, Class B, and Class C redemptions. The deferred sales charges range from 5.00% to 1.00% for Class B shares, 1.00% for Class C shares, 1.00% for certain purchases of Class A shares and .25% for certain purchases of Class T shares.
For the period, sales charge amounts retained by FDC were as follows:
| Retained by FDC |
|
| Class A | $6,592 |
| Class T | 1,090 |
| Class B* | 7 |
| Class C* | 296 |
| $7,985 |
* When Class B and Class C shares are initially sold, FDC pays commissions from its own resources to financial intermediaries through which the sales are made.
Transfer Agent Fees. Fidelity Investments Institutional Operations Company, Inc., (FIIOC), an affiliate of the investment adviser, is the transfer, dividend disbursing and shareholder servicing agent for each class of the Fund. FIIOC receives account fees and asset-based fees that vary according to the account size and type of account of the shareholders of the respective classes of the Fund. FIIOC pays for typesetting, printing and mailing of shareholder reports, except proxy statements.
For the period, transfer agent fees for each class were as follows:
| Amount | % of Class-Level Average Net Assets* |
|
| Class A | $16,054 | .27 |
| Class T | 8,611 | .34 |
| Class B | 538 | .30 |
| Class C | 10,901 | .28 |
| Telecommunications | 370,847 | .19 |
| Class I | 3,437 | .21 |
| $ 410,388 |
*Annualized
Accounting and Security Lending Fees. Fidelity Service Company, Inc. (FSC), an affiliate of the investment adviser, maintains the Fund's accounting records. The accounting fee is based on the level of average net assets for each month. Under a separate contract, FSC administers the security lending program. The security lending fee is based on the number and duration of lending transactions.
Brokerage Commissions. The Fund placed a portion of its portfolio transactions with brokerage firms which are affiliates of the investment adviser. Brokerage commissions are included in net realized gain (loss) and change in net unrealized appreciation (depreciation) in the Statement of Operations. The commissions paid to these affiliated firms were $6,398 for the period.
Interfund Lending Program. Pursuant to an Exemptive Order issued by the SEC, the Fund, along with other registered investment companies having management contracts with FMR or other affiliated entities of FMR, may participate in an interfund lending program. This program provides an alternative credit facility allowing the funds to borrow from, or lend money to, other participating affiliated funds. At period end, there were no interfund loans outstanding. The Fund's activity in this program during the period for which loans were outstanding was as follows:
| Borrower or Lender | Average Loan Balance | Weighted Average Interest Rate | Interest Expense |
| Borrower | $5,833,500 | .37% | $121 |
6. Committed Line of Credit.
The Fund participates with other funds managed by the investment adviser or an affiliate in a $4.25 billion credit facility (the "line of credit") to be utilized for temporary or emergency purposes to fund shareholder redemptions or for other short-term liquidity purposes. The Fund has agreed to pay commitment fees on its pro-rata portion of the line of credit, which amounted to $298 and is reflected in Miscellaneous expenses on the Statement of Operations. During the period, the Fund did not borrow on this line of credit.
7. Security Lending.
The Fund lends portfolio securities through a lending agent from time to time in order to earn additional income. On the settlement date of the loan, the Fund receives collateral (in the form of U.S. Treasury obligations, letters of credit and/or cash) against the loaned securities and maintains collateral in an amount not less than 100% of the market value of the loaned securities during the period of the loan. The market value of the loaned securities is determined at the close of business of the Fund and any additional required collateral is delivered to the Fund on the next business day. If the borrower defaults on its obligation to return the securities loaned because of insolvency or other reasons, the Fund may apply collateral received from the borrower against the obligation. The Fund may experience delays and costs in recovering the securities loaned. Any cash collateral received is invested in the Fidelity Securities Lending Cash Central Fund. The value of loaned securities and cash collateral at period end are disclosed on the Fund's Statement of Assets and Liabilities. Security lending income represents the income earned on investing cash collateral, less rebates paid to borrowers and any lending agent fees associated with the loan, plus any premium payments received for lending certain types of securities. Security lending income is presented in the Statement of Operations as a component of income from Fidelity Central Funds. Total security lending income during the period amounted to $261,852.
8. Expense Reductions.
Commissions paid to certain brokers with whom the investment adviser, or its affiliates, places trades on behalf of the Fund include an amount in addition to trade execution, which may be rebated back to the Fund to offset certain expenses. This amount totaled $25,810 for the period.
In addition, during the period the investment adviser reimbursed and/or waived a portion of the fund-level operating expenses in the amount of $1,758 and a portion of class-level operating expenses as follows:
| Amount | ||
| Class A | $152 | |
| Class T | 11 | |
| Class B | 1 | |
| Class C | 135 | |
| Telecommunications | 9,106 | |
| Class I | 41 | |
| $9,446 |
9. Distributions to Shareholders.
Distributions to shareholders of each class were as follows:
| Six months ended August 31, 2015 | Year ended February 28, 2015 | |
| From net investment income | ||
| Class A | $4,067 | $309,863 |
| Class T | – | 143,116 |
| Class B | – | 12,248 |
| Class C | – | 161,299 |
| Telecommunications | 268,350 | 12,985,170 |
| Class I | 3,364 | 67,625 |
| Total | $275,781 | $13,679,321 |
10. Share Transactions.
Share transactions for each class were as follows and may contain automatic conversions between classes or exchanges between funds:
| Shares | Shares | Dollars | Dollars | |
| Six months ended August 31, 2015 | Year ended February 28, 2015 | Six months ended August 31, 2015 | Year ended February 28, 2015 | |
| Class A | ||||
| Shares sold | 42,570 | 79,279 | $2,653,863 | $4,786,534 |
| Reinvestment of distributions | 62 | 5,091 | 3,876 | 297,550 |
| Shares redeemed | (27,260) | (41,031) | (1,695,334) | (2,466,354) |
| Net increase (decrease) | 15,372 | 43,339 | $962,405 | $2,617,730 |
| Class T | ||||
| Shares sold | 7,480 | 20,637 | $463,456 | $1,237,395 |
| Reinvestment of distributions | – | 2,409 | – | 139,987 |
| Shares redeemed | (9,168) | (16,465) | $(561,396) | $(994,017) |
| Net increase (decrease) | (1,688) | 6,581 | $(97,940) | $383,365 |
| Class B | ||||
| Shares sold | 129 | 45 | $7,453 | $2,624 |
| Reinvestment of distributions | – | 197 | – | 11,445 |
| Shares redeemed | (1,637) | (3,091) | (101,595) | (186,477) |
| Net increase (decrease) | (1,508) | (2,849) | $(94,142) | $(172,408) |
| Class C | ||||
| Shares sold | 32,550 | 28,734 | $2,029,083 | $1,731,696 |
| Reinvestment of distributions | – | 2,043 | – | 118,683 |
| Shares redeemed | (11,472) | (12,919) | (710,851) | (773,747) |
| Net increase (decrease) | 21,078 | 17,858 | $1,318,232 | $1,076,632 |
| Telecommunications | ||||
| Shares sold | 2,361,442 | 3,400,370 | $149,105,313 | $205,982,254 |
| Reinvestment of distributions | 4,075 | 212,695 | 257,513 | 12,494,070 |
| Shares redeemed | (838,911) | (3,993,893)A | (52,018,468) | (242,841,980)A |
| Net increase (decrease) | 1,526,606 | (380,828) | $97,344,358 | $(24,365,656) |
| Class I | ||||
| Shares sold | 28,397 | 29,046 | $1,792,100 | $1,764,278 |
| Reinvestment of distributions | 48 | 956 | 3,004 | 56,138 |
| Shares redeemed | (23,780) | (17,754) | (1,481,523) | (1,063,165) |
| Net increase (decrease) | 4,665 | 12,248 | $313,581 | $757,251 |
A Amount includes in-kind redemptions.
11. Other.
The Fund's organizational documents provide former and current trustees and officers with a limited indemnification against liabilities arising in connection with the performance of their duties to the Fund. In the normal course of business, the Fund may also enter into contracts that provide general indemnifications. The Fund's maximum exposure under these arrangements is unknown as this would be dependent on future claims that may be made against the Fund. The risk of material loss from such claims is considered remote.
At the end of the period, Strategic Advisers Core Fund was the owner of record of approximately 14% of the total outstanding shares of the Fund. Mutual funds managed by the investment adviser or its affiliates were the owners of record, in the aggregate, of approximately 22% of the total outstanding shares of the Fund.
Wireless Portfolio
Investment Summary (Unaudited)
Top Ten Stocks as of August 31, 2015
| % of fund's net assets | % of fund's net assets 6 months ago | |
| Apple, Inc. | 24.9 | 1.0 |
| American Tower Corp. | 7.8 | 7.3 |
| QUALCOMM, Inc. | 6.0 | 9.1 |
| Vodafone Group PLC sponsored ADR | 4.9 | 6.2 |
| AT&T, Inc. | 3.9 | 0.1 |
| Verizon Communications, Inc. | 3.9 | 10.4 |
| Crown Castle International Corp. | 3.6 | 5.9 |
| Google, Inc. Class C | 3.6 | 4.3 |
| BT Group PLC sponsored ADR | 3.6 | 4.1 |
| Broadcom Corp. Class A | 3.3 | 0.0 |
| 65.5 |
Top Industries (% of fund's net assets)
| As of August 31, 2015 | ||
| Technology Hardware, Storage & Peripherals | 25.2% | |
| Diversified Telecommunication Services | 18.3% | |
| Wireless Telecommunication Services | 14.9% | |
| Communications Equipment | 11.8% | |
| Real Estate Investment Trusts | 11.4% | |
| All Others* | 18.4% | |

| As of February 28, 2015 | ||
| Diversified Telecommunication Services | 25.6% | |
| Wireless Telecommunication Services | 19.9% | |
| Communications Equipment | 17.3% | |
| Real Estate Investment Trusts | 13.2% | |
| Internet Software & Services | 10.8% | |
| All Others* | 13.2% | |
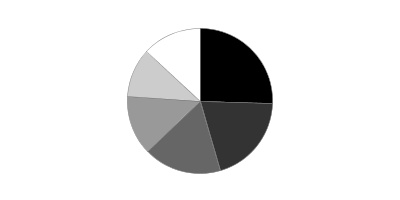
* Includes short-term investments and net other assets (liabilities).
Percentages shown as 0.0% may reflect amounts less than 0.05%.
Wireless Portfolio
Investments August 31, 2015 (Unaudited)
Showing Percentage of Net Assets
| Common Stocks - 99.3% | |||
| Shares | Value | ||
| Communications Equipment - 11.8% | |||
| Communications Equipment - 11.8% | |||
| Alcatel-Lucent SA sponsored ADR (a) | 344,000 | $1,138,640 | |
| CommScope Holding Co., Inc. (a) | 87,600 | 2,833,860 | |
| Harris Corp. | 30,900 | 2,373,738 | |
| Motorola Solutions, Inc. | 43,968 | 2,850,006 | |
| NETGEAR, Inc. (a) | 14,900 | 452,662 | |
| Nokia Corp. sponsored ADR | 96,000 | 599,040 | |
| QUALCOMM, Inc. | 249,950 | 14,142,171 | |
| Ruckus Wireless, Inc. (a) | 182,700 | 2,068,164 | |
| Sierra Wireless, Inc. (a) | 11,400 | 255,816 | |
| Telefonaktiebolaget LM Ericsson (B Shares) sponsored ADR | 1,900 | 18,544 | |
| ViaSat, Inc. (a)(b) | 14,800 | 869,796 | |
| 27,602,437 | |||
| Diversified Telecommunication Services - 18.3% | |||
| Alternative Carriers - 1.1% | |||
| inContact, Inc. (a) | 271,300 | 2,048,315 | |
| Towerstream Corp. (a) | 334,423 | 498,290 | |
| 2,546,605 | |||
| Integrated Telecommunication Services - 17.2% | |||
| AT&T, Inc. | 278,800 | 9,256,160 | |
| BT Group PLC sponsored ADR | 124,800 | 8,342,880 | |
| Chunghwa Telecom Co. Ltd. sponsored ADR (b) | 79,100 | 2,407,013 | |
| Manitoba Telecom Services, Inc. | 31,100 | 671,123 | |
| Orange SA | 323,300 | 5,113,072 | |
| Telecom Italia SpA (a) | 3,248,600 | 3,942,632 | |
| Telefonica SA sponsored ADR | 18,648 | 262,377 | |
| TELUS Corp. | 35,700 | 1,167,929 | |
| Verizon Communications, Inc. | 197,897 | 9,105,241 | |
| 40,268,427 | |||
| TOTAL DIVERSIFIED TELECOMMUNICATION SERVICES | 42,815,032 | ||
| Electronic Equipment & Components - 0.4% | |||
| Electronic Manufacturing Services - 0.4% | |||
| Neonode, Inc. (a)(b) | 344,100 | 1,008,213 | |
| Internet Software & Services - 6.6% | |||
| Internet Software & Services - 6.6% | |||
| Endurance International Group Holdings, Inc. (a)(b) | 459,800 | 7,030,342 | |
| Google, Inc. Class C | 13,552 | 8,378,524 | |
| 15,408,866 | |||
| Real Estate Investment Trusts - 11.4% | |||
| Specialized REITs - 11.4% | |||
| American Tower Corp. | 199,492 | 18,391,167 | |
| Crown Castle International Corp. | 101,000 | 8,422,390 | |
| 26,813,557 | |||
| Semiconductors & Semiconductor Equipment - 10.1% | |||
| Semiconductors - 10.1% | |||
| Broadcom Corp. Class A | 150,800 | 7,791,836 | |
| Marvell Technology Group Ltd. | 311,700 | 3,512,859 | |
| Maxim Integrated Products, Inc. | 37,700 | 1,269,359 | |
| Qorvo, Inc. (a) | 138,125 | 7,667,319 | |
| Skyworks Solutions, Inc. | 39,000 | 3,406,650 | |
| 23,648,023 | |||
| Software - 0.6% | |||
| Application Software - 0.6% | |||
| Synchronoss Technologies, Inc. (a) | 5,536 | 223,599 | |
| Tangoe, Inc. (a) | 152,100 | 1,140,750 | |
| 1,364,349 | |||
| Technology Hardware, Storage & Peripherals - 25.2% | |||
| Technology Hardware, Storage & Peripherals - 25.2% | |||
| Apple, Inc. | 517,500 | 58,353,300 | |
| BlackBerry Ltd. (a) | 96,500 | 732,039 | |
| 59,085,339 | |||
| Wireless Telecommunication Services - 14.9% | |||
| Wireless Telecommunication Services - 14.9% | |||
| America Movil S.A.B. de CV Series L sponsored ADR | 111,100 | 2,033,130 | |
| China Mobile Ltd. sponsored ADR | 75,600 | 4,522,392 | |
| Leap Wireless International, Inc. rights (a) | 16,600 | 41,832 | |
| RingCentral, Inc. (a) | 4,700 | 80,887 | |
| Rogers Communications, Inc. Class B (non-vtg.) | 80,800 | 2,758,230 | |
| SBA Communications Corp. Class A (a) | 49,800 | 5,886,360 | |
| Spok Holdings, Inc. | 12,000 | 198,120 | |
| Sprint Corp. (a) | 28,033 | 141,847 | |
| T-Mobile U.S., Inc. (a) | 121,875 | 4,827,469 | |
| Telephone & Data Systems, Inc. | 78,314 | 2,227,250 | |
| U.S. Cellular Corp. (a) | 20,800 | 767,936 | |
| Vodafone Group PLC sponsored ADR | 332,981 | 11,481,185 | |
| 34,966,638 | |||
| TOTAL COMMON STOCKS | |||
| (Cost $216,917,349) | 232,712,454 | ||
| Money Market Funds - 4.6% | |||
| Fidelity Cash Central Fund, 0.15% (c) | 570,637 | 570,637 | |
| Fidelity Securities Lending Cash Central Fund, 0.19% (c)(d) | 10,268,000 | 10,268,000 | |
| TOTAL MONEY MARKET FUNDS | |||
| (Cost $10,838,637) | 10,838,637 | ||
| TOTAL INVESTMENT PORTFOLIO - 103.9% | |||
| (Cost $227,755,986) | 243,551,091 | ||
| NET OTHER ASSETS (LIABILITIES) - (3.9)% | (9,217,405) | ||
| NET ASSETS - 100% | $234,333,686 |
Legend
(a) Non-income producing
(b) Security or a portion of the security is on loan at period end.
(c) Affiliated fund that is generally available only to investment companies and other accounts managed by Fidelity Investments. The rate quoted is the annualized seven-day yield of the fund at period end. A complete unaudited listing of the fund's holdings as of its most recent quarter end is available upon request. In addition, each Fidelity Central Fund's financial statements are available on the SEC's website or upon request.
(d) Investment made with cash collateral received from securities on loan.
Affiliated Central Funds
Information regarding fiscal year to date income earned by the Fund from investments in Fidelity Central Funds is as follows:
| Fund | Income earned |
| Fidelity Cash Central Fund | $1,083 |
| Fidelity Securities Lending Cash Central Fund | 170,515 |
| Total | $171,598 |
Investment Valuation
The following is a summary of the inputs used, as of August 31, 2015, involving the Fund's assets and liabilities carried at fair value. The inputs or methodology used for valuing securities may not be an indication of the risk associated with investing in those securities. For more information on valuation inputs, and their aggregation into the levels used below, please refer to the Investment Valuation section in the accompanying Notes to Financial Statements.
| Valuation Inputs at Reporting Date: | ||||
| Description | Total | Level 1 | Level 2 | Level 3 |
| Investments in Securities: | ||||
| Common Stocks | $232,712,454 | $223,614,918 | $9,055,704 | $41,832 |
| Money Market Funds | 10,838,637 | 10,838,637 | -- | -- |
| Total Investments in Securities: | $243,551,091 | $234,453,555 | $9,055,704 | $41,832 |
Other Information
Distribution of investments by country or territory of incorporation, as a percentage of Total Net Assets, is as follows (Unaudited):
| United States of America | 79.0% |
| United Kingdom | 8.5% |
| France | 2.7% |
| Canada | 2.4% |
| Hong Kong | 1.9% |
| Italy | 1.7% |
| Bermuda | 1.5% |
| Taiwan | 1.0% |
| Others (Individually Less Than 1%) | 1.3% |
| 100.0% |
See accompanying notes which are an integral part of the financial statements.
Wireless Portfolio
Financial Statements
Statement of Assets and Liabilities
| August 31, 2015 (Unaudited) | ||
| Assets | ||
| Investment in securities, at value (including securities loaned of $9,834,526) — See accompanying schedule: Unaffiliated issuers (cost $216,917,349) | $232,712,454 | |
| Fidelity Central Funds (cost $10,838,637) | 10,838,637 | |
| Total Investments (cost $227,755,986) | $243,551,091 | |
| Cash | 632,911 | |
| Receivable for investments sold | 1,173,490 | |
| Receivable for fund shares sold | 49,708 | |
| Dividends receivable | 416,768 | |
| Distributions receivable from Fidelity Central Funds | 12,551 | |
| Prepaid expenses | 1,858 | |
| Other receivables | 19,052 | |
| Total assets | 245,857,429 | |
| Liabilities | ||
| Payable for investments purchased | $707,020 | |
| Payable for fund shares redeemed | 360,831 | |
| Accrued management fee | 110,791 | |
| Other affiliated payables | 55,487 | |
| Other payables and accrued expenses | 21,614 | |
| Collateral on securities loaned, at value | 10,268,000 | |
| Total liabilities | 11,523,743 | |
| Net Assets | $234,333,686 | |
| Net Assets consist of: | ||
| Paid in capital | $203,932,946 | |
| Undistributed net investment income | 2,059,695 | |
| Accumulated undistributed net realized gain (loss) on investments and foreign currency transactions | 12,547,025 | |
| Net unrealized appreciation (depreciation) on investments and assets and liabilities in foreign currencies | 15,794,020 | |
| Net Assets, for 26,673,343 shares outstanding | $234,333,686 | |
| Net Asset Value, offering price and redemption price per share ($234,333,686 ÷ 26,673,343 shares) | $8.79 |
See accompanying notes which are an integral part of the financial statements.
Statement of Operations
| Six months ended August 31, 2015 (Unaudited) | ||
| Investment Income | ||
| Dividends | $3,002,260 | |
| Income from Fidelity Central Funds (including $170,515 from security lending) | 171,598 | |
| Total income | 3,173,858 | |
| Expenses | ||
| Management fee | $710,368 | |
| Transfer agent fees | 292,707 | |
| Accounting and security lending fees | 51,653 | |
| Custodian fees and expenses | 23,135 | |
| Independent trustees' compensation | 2,230 | |
| Registration fees | 21,759 | |
| Audit | 23,830 | |
| Legal | 1,863 | |
| Interest | 174 | |
| Miscellaneous | 1,740 | |
| Total expenses before reductions | 1,129,459 | |
| Expense reductions | (24,084) | 1,105,375 |
| Net investment income (loss) | 2,068,483 | |
| Realized and Unrealized Gain (Loss)
Net realized gain (loss) on: | ||
| Investment securities: | ||
| Unaffiliated issuers | 13,712,585 | |
| Foreign currency transactions | 22,460 | |
| Total net realized gain (loss) | 13,735,045 | |
| Change in net unrealized appreciation (depreciation) on: Investment securities | (32,768,270) | |
| Assets and liabilities in foreign currencies | (883) | |
| Total change in net unrealized appreciation (depreciation) | (32,769,153) | |
| Net gain (loss) | (19,034,108) | |
| Net increase (decrease) in net assets resulting from operations | $(16,965,625) |
See accompanying notes which are an integral part of the financial statements.
Statement of Changes in Net Assets
| Six months ended August 31, 2015 (Unaudited) | Year ended February 28, 2015 | |
| Increase (Decrease) in Net Assets | ||
| Operations | ||
| Net investment income (loss) | $2,068,483 | $4,843,498 |
| Net realized gain (loss) | 13,735,045 | 14,989,507 |
| Change in net unrealized appreciation (depreciation) | (32,769,153) | (621,646) |
| Net increase (decrease) in net assets resulting from operations | (16,965,625) | 19,211,359 |
| Distributions to shareholders from net investment income | (393,841) | (16,759,973) |
| Distributions to shareholders from net realized gain | (3,432,038) | (28,888,507) |
| Total distributions | (3,825,879) | (45,648,480) |
| Share transactions | ||
| Proceeds from sales of shares | 13,321,914 | 42,710,221 |
| Reinvestment of distributions | 3,676,898 | 44,098,611 |
| Cost of shares redeemed | (32,323,006) | (79,982,116) |
| Net increase (decrease) in net assets resulting from share transactions | (15,324,194) | 6,826,716 |
| Redemption fees | 506 | 2,631 |
| Total increase (decrease) in net assets | (36,115,192) | (19,607,774) |
| Net Assets | ||
| Beginning of period | 270,448,878 | 290,056,652 |
| End of period (including undistributed net investment income of $2,059,695 and undistributed net investment income of $385,053, respectively) | $234,333,686 | $270,448,878 |
| Other Information
Shares | ||
| Sold | 1,427,179 | 4,509,142 |
| Issued in reinvestment of distributions | 394,094 | 4,839,668 |
| Redeemed | (3,487,263) | (8,448,923) |
| Net increase (decrease) | (1,665,990) | 899,887 |
See accompanying notes which are an integral part of the financial statements.
Financial Highlights — Wireless Portfolio
| Six months ended (Unaudited) | Years ended February 28, | |||||
| August 31, | 2015 | 2015 | 2014 | 2013 | 2012A | 2011 |
| Selected Per–Share Data | ||||||
| Net asset value, beginning of period | $9.54 | $10.57 | $8.60 | $7.68 | $8.29 | $6.47 |
| Income from Investment Operations | ||||||
| Net investment income (loss)B | .07 | .17 | .56C | .12 | .10D | .08 |
| Net realized and unrealized gain (loss) | (.68) | .48 | 1.51 | .94 | (.33) | 1.82 |
| Total from investment operations | (.61) | .65 | 2.07 | 1.06 | (.23) | 1.90 |
| Distributions from net investment income | (.01) | (.62) | (.10) | (.14) | (.08) | (.08) |
| Distributions from net realized gain | (.12) | (1.06) | – | – | (.30) | – |
| Total distributions | (.14)E | (1.68) | (.10) | (.14) | (.38) | (.08) |
| Redemption fees added to paid in capitalB,F | – | – | – | – | – | – |
| Net asset value, end of period | $8.79 | $9.54 | $10.57 | $8.60 | $7.68 | $8.29 |
| Total ReturnG,H | (6.52)% | 7.55% | 24.11% | 13.89% | (2.55)% | 29.55% |
| Ratios to Average Net AssetsI,J | ||||||
| Expenses before reductions | .87%K | .86% | .88% | .90% | .90% | .92% |
| Expenses net of fee waivers, if any | .87%K | .86% | .88% | .90% | .90% | .92% |
| Expenses net of all reductions | .85%K | .85% | .86% | .87% | .89% | .91% |
| Net investment income (loss) | 1.60%K | 1.76% | 5.91%C | 1.50% | 1.23%D | 1.08% |
| Supplemental Data | ||||||
| Net assets, end of period (000 omitted) | $234,334 | $270,449 | $290,057 | $253,794 | $262,696 | $361,082 |
| Portfolio turnover rateL | 103%K | 48% | 120% | 100% | 114% | 111% |
A For the year ended February 29.
B Calculated based on average shares outstanding during the period.
C Investment income per share reflects a large, non-recurring dividend which amounted to $.45 per share. Excluding this non-recurring dividends, the ratio of net investment income (loss) to average net assets would have been 1.23%.
D Investment income per share reflects a large, non-recurring dividend which amounted to $.03 per share. Excluding this non-recurring dividends, the ratio of net investment income (loss) to average net assets would have been .90%.
E Total distributions of $.14 per share is comprised of distributions from net investment income of $.014 and distributions from net realized gain of $.122 per share.
F Amount represents less than $.005 per share.
G Total returns for periods of less than one year are not annualized.
H Total returns would have been lower if certain expenses had not been reduced during the applicable periods shown.
I Fees and expenses of any underlying Fidelity Central Funds are not included in the Fund's expense ratio. The Fund indirectly bears its proportionate share of the expenses of any underlying Fidelity Central Funds.
J Expense ratios reflect operating expenses of the Fund. Expenses before reductions do not reflect amounts reimbursed by the investment adviser or reductions from brokerage service arrangements or reductions from other expense offset arrangements and do not represent the amount paid by the Fund during periods when reimbursements or reductions occur. Expenses net of fee waivers reflect expenses after reimbursement by the investment adviser but prior to reductions from brokerage service arrangements or other expense offset arrangements. Expenses net of all reductions represent the net expenses paid by the Fund.
K Annualized
L Amount does not include the portfolio activity of any underlying Fidelity Central Funds.
See accompanying notes which are an integral part of the financial statements.
Notes to Financial Statements (Unaudited)
For the period ended August 31, 2015
1. Organization.
Wireless Portfolio (the Fund) is a non-diversified fund of Fidelity Select Portfolios (the Trust) and is authorized to issue an unlimited number of shares. Share transactions on the Statement of Changes in Net Assets may contain exchanges between funds. The Trust is registered under the Investment Company Act of 1940, as amended (the 1940 Act), as an open-end management investment company organized as a Massachusetts business trust. The Fund invests primarily in securities of companies whose principal business activities fall within specific industries.
2. Investments in Fidelity Central Funds.
The Fund invests in Fidelity Central Funds, which are open-end investment companies generally available only to other investment companies and accounts managed by the investment adviser and its affiliates. The Fund's Schedule of Investments lists each of the Fidelity Central Funds held as of period end, if any, as an investment of the Fund, but does not include the underlying holdings of each Fidelity Central Fund. As an Investing Fund, the Fund indirectly bears its proportionate share of the expenses of the underlying Fidelity Central Funds.
The Money Market Central Funds seek preservation of capital and current income and are managed by Fidelity Investments Money Management, Inc. (FIMM), an affiliate of the investment adviser. Annualized expenses of the Money Market Central Funds as of their most recent shareholder report date are less than .01%.
A complete unaudited list of holdings for each Fidelity Central Fund is available upon request or at the Securities and Exchange Commission (the SEC) website at www.sec.gov. In addition, the financial statements of the Fidelity Central Funds are available on the SEC website or upon request.
3. Significant Accounting Policies.
The financial statements have been prepared in conformity with accounting principles generally accepted in the United States of America (GAAP), which require management to make certain estimates and assumptions at the date of the financial statements. Actual results could differ from those estimates. Subsequent events, if any, through the date that the financial statements were issued have been evaluated in the preparation of the financial statements. The following summarizes the significant accounting policies of the Fund:
Investment Valuation. Investments are valued as of 4:00 p.m. Eastern time on the last calendar day of the period. The Board of Trustees (the Board) has delegated the day to day responsibility for the valuation of the Fund's investments to the Fidelity SelectCo, LLC (SelectCo) Fair Value Committee (the Committee). In accordance with valuation policies and procedures approved by the Board, the Fund attempts to obtain prices from one or more third party pricing vendors or brokers to value its investments. When current market prices, quotations or currency exchange rates are not readily available or reliable, investments will be fair valued in good faith by the Committee, in accordance with procedures adopted by the Board. Factors used in determining fair value vary by investment type and may include market or investment specific events. The frequency with which these procedures are used cannot be predicted and they may be utilized to a significant extent. The Committee oversees the Fund's valuation policies and procedures and reports to the Board on the Committee's activities and fair value determinations. The Board monitors the appropriateness of the procedures used in valuing the Fund's investments and ratifies the fair value determinations of the Committee.
The Fund categorizes the inputs to valuation techniques used to value its investments into a disclosure hierarchy consisting of three levels as shown below:
- Level 1 – quoted prices in active markets for identical investments
- Level 2 – other significant observable inputs (including quoted prices for similar investments, interest rates, prepayment speeds, etc.)
- Level 3 – unobservable inputs (including the Fund's own assumptions based on the best information available)
Valuation techniques used to value the Fund's investments by major category are as follows:
Equity securities, including restricted securities, for which market quotations are readily available, are valued at the last reported sale price or official closing price as reported by a third party pricing vendor on the primary market or exchange on which they are traded and are categorized as Level 1 in the hierarchy. In the event there were no sales during the day or closing prices are not available, securities are valued at the last quoted bid price or may be valued using the last available price and are generally categorized as Level 2 in the hierarchy. For foreign equity securities, when market or security specific events arise, comparisons to the valuation of American Depositary Receipts (ADRs), futures contracts, Exchange-Traded Funds (ETFs) and certain indexes as well as quoted prices for similar securities may be used and would be categorized as Level 2 in the hierarchy. Utilizing these techniques may result in transfers between Level 1 and Level 2. For equity securities, including restricted securities, where observable inputs are limited, assumptions about market activity and risk are used and these securities may be categorized as Level 3 in the hierarchy.
Investments in open-end mutual funds, including the Fidelity Central Funds, are valued at their closing net asset value (NAV) each business day and are categorized as Level 1 in the hierarchy.
Changes in valuation techniques may result in transfers in or out of an assigned level within the disclosure hierarchy. The aggregate value of investments by input level, as of August 31, 2015, is included at the end of the Fund's Schedule of Investments.
Foreign Currency. The Fund may use foreign currency contracts to facilitate transactions in foreign-denominated securities. Gains and losses from these transactions may arise from changes in the value of the foreign currency or if the counterparties do not perform under the contracts' terms.
Foreign-denominated assets, including investment securities, and liabilities are translated into U.S. dollars at the exchange rates at period end. Purchases and sales of investment securities, income and dividends received and expenses denominated in foreign currencies are translated into U.S. dollars at the exchange rate in effect on the transaction date.
The effects of exchange rate fluctuations on investments are included with the net realized and unrealized gain (loss) on investment securities. Other foreign currency transactions resulting in realized and unrealized gain (loss) are disclosed separately.
Investment Transactions and Income. For financial reporting purposes, the Fund's investment holdings and NAV include trades executed through the end of the last business day of the period. The NAV per share for processing shareholder transactions is calculated as of the close of business of the New York Stock Exchange (NYSE), normally 4:00 p.m. Eastern time and includes trades executed through the end of the prior business day. Gains and losses on securities sold are determined on the basis of identified cost and may include proceeds received from litigation. Dividend income is recorded on the ex-dividend date, except for certain dividends from foreign securities where the ex-dividend date may have passed, which are recorded as soon as the Fund is informed of the ex-dividend date. Non-cash dividends included in dividend income, if any, are recorded at the fair market value of the securities received. Income and capital gain distributions from Fidelity Central Funds, if any, are recorded on the ex-dividend date. Distributions received on securities that represent a return of capital or capital gain are recorded as a reduction of cost of investments and/or as a realized gain. Subsequent to ex-dividend date the Fund determines the components of these distributions, based upon receipt of tax filings or other correspondence relating to the underlying investment. Investment income is recorded net of foreign taxes withheld where recovery of such taxes is uncertain.
Expenses. Expenses directly attributable to a fund are charged to that fund. Expenses attributable to more than one fund are allocated among the respective funds on the basis of relative net assets or other appropriate methods. Expense estimates are accrued in the period to which they relate and adjustments are made when actual amounts are known.
Income Tax Information and Distributions to Shareholders. Each year, the Fund intends to qualify as a regulated investment company under Subchapter M of the Internal Revenue Code, including distributing substantially all of its taxable income and realized gains. As a result, no provision for U.S. Federal income taxes is required. The Fund files a U.S. federal tax return, in addition to state and local tax returns as required. The Fund's federal income tax returns are subject to examination by the Internal Revenue Service (IRS) for a period of three fiscal years after they are filed. State and local tax returns may be subject to examination for an additional fiscal year depending on the jurisdiction. Foreign taxes are provided for based on the Fund's understanding of the tax rules and rates that exist in the foreign markets in which it invests.
Distributions are declared and recorded on the ex-dividend date. Income and capital gain distributions are determined in accordance with income tax regulations, which may differ from GAAP.
Capital accounts within the financial statements are adjusted for permanent book-tax differences. These adjustments have no impact on net assets or the results of operations. Capital accounts are not adjusted for temporary book-tax differences which will reverse in a subsequent period.
Book-tax differences are primarily due to foreign currency transactions and losses deferred due to wash sales.
The federal tax cost of investment securities and unrealized appreciation (depreciation) as of period end were as follows:
| Gross unrealized appreciation | $30,952,120 |
| Gross unrealized depreciation | (16,292,780) |
| Net unrealized appreciation (depreciation) on securities | $14,659,340 |
| Tax cost | $228,891,751 |
Trading (Redemption) Fees. Shares held by investors in the Fund less than 30 days may be subject to a redemption fee equal to .75% of the NAV of shares redeemed. All redemption fees, which reduce the proceeds of the shareholder redemption, are retained by the Fund and accounted for as an addition to paid in capital.
4. Purchases and Sales of Investments.
Purchases and sales of securities, other than short-term securities, aggregated $131,243,182 and $148,434,641, respectively.
5. Fees and Other Transactions with Affiliates.
Management Fee. Fidelity SelectCo, LLC (the investment adviser) and its affiliates provide the Fund with investment management related services for which the Fund pays a monthly management fee. The management fee is the sum of an individual fund fee rate that is based on an annual rate of .30% of the Fund's average net assets and an annualized group fee rate that averaged .25% during the period. The group fee rate is based upon the average net assets of all the mutual funds advised by Fidelity Management & Research Company (FMR) and the investment adviser. The group fee rate decreases as assets under management increase and increases as assets under management decrease. For the reporting period, the total annualized management fee rate was .55% of the Fund's average net assets.
Transfer Agent Fees. Fidelity Investments Institutional Operations Company, Inc. (FIIOC), an affiliate of the investment adviser, is the Fund's transfer, dividend disbursing and shareholder servicing agent. FIIOC receives account fees and asset-based fees that vary according to account size and type of account. FIIOC pays for typesetting, printing and mailing of shareholder reports, except proxy statements. For the period, the transfer agent fees were equivalent to an annualized rate of .23% of average net assets.
Accounting and Security Lending Fees. Fidelity Service Company, Inc. (FSC), an affiliate of the investment adviser, maintains the Fund's accounting records. The accounting fee is based on the level of average net assets for each month. Under a separate contract, FSC administers the security lending program. The security lending fee is based on the number and duration of lending transactions.
Brokerage Commissions. The Fund placed a portion of its portfolio transactions with brokerage firms which are affiliates of the investment adviser. Brokerage commissions are included in net realized gain (loss) and change in net unrealized appreciation (depreciation) in the Statement of Operations. The commissions paid to these affiliated firms were $2,120 for the period.
Interfund Lending Program. Pursuant to an Exemptive Order issued by the SEC, the Fund, along with other registered investment companies having management contracts with Fidelity Management & Research Company (FMR) or other affiliated entities of FMR, may participate in an interfund lending program. This program provides an alternative credit facility allowing the funds to borrow from, or lend money to, other participating affiliated funds. At period end, there were no interfund loans outstanding. The Fund's activity in this program during the period for which loans were outstanding was as follows:
| Borrower or Lender | Average Loan Balance | Weighted Average Interest Rate | Interest Expense |
| Borrower | $6,204,000 | .34% | $174 |
6. Committed Line of Credit.
The Fund participates with other funds managed by the investment adviser or an affiliate in a $4.25 billion credit facility (the "line of credit") to be utilized for temporary or emergency purposes to fund shareholder redemptions or for other short-term liquidity purposes. The Fund has agreed to pay commitment fees on its pro-rata portion of the line of credit, which amounted to $202 and is reflected in Miscellaneous expenses on the Statement of Operations. During the period, the Fund did not borrow on this line of credit.
7. Security Lending.
The Fund lends portfolio securities through a lending agent from time to time in order to earn additional income. On the settlement date of the loan, the Fund receives collateral (in the form of U.S. Treasury obligations, letters of credit and/or cash) against the loaned securities and maintains collateral in an amount not less than 100% of the market value of the loaned securities during the period of the loan. The market value of the loaned securities is determined at the close of business of the Fund and any additional required collateral is delivered to the Fund on the next business day. If the borrower defaults on its obligation to return the securities loaned because of insolvency or other reasons, the Fund may apply collateral received from the borrower against the obligation. The Fund may experience delays and costs in recovering the securities loaned. Any cash collateral received is invested in the Fidelity Securities Lending Cash Central Fund. The value of loaned securities and cash collateral at period end are disclosed on the Fund's Statement of Assets and Liabilities. Security lending income represents the income earned on investing cash collateral, less rebates paid to borrowers and any lending agent fees associated with the loan, plus any premium payments received for lending certain types of securities. Security lending income is presented in the Statement of Operations as a component of income from Fidelity Central Funds.
8. Expense Reductions.
Commissions paid to certain brokers with whom the investment adviser, or its affiliates, places trades on behalf of the Fund include an amount in addition to trade execution, which may be rebated back to the Fund to offset certain expenses. This amount totaled $16,630 for the period.
In addition, during the period the investment adviser reimbursed and/or waived a portion of operating expenses in the amount of $7,454.
9. Other.
The Fund's organizational documents provide former and current trustees and officers with a limited indemnification against liabilities arising in connection with the performance of their duties to the Fund. In the normal course of business, the Fund may also enter into contracts that provide general indemnifications. The Fund's maximum exposure under these arrangements is unknown as this would be dependent on future claims that may be made against the Fund. The risk of material loss from such claims is considered remote.
Shareholder Expense Example
As a shareholder of the Fund, you incur two types of costs: (1) transaction costs, including sales charges (loads) on purchase payments or redemption proceeds, redemption fees and (2) ongoing costs, including management fees, distribution and/or service (12b-1) fees and other Fund expenses. This Example is intended to help you understand your ongoing costs (in dollars) of investing in the Fund and to compare these costs with the ongoing costs of investing in other mutual funds.
The Example is based on an investment of $1,000 invested at the beginning of the period and held for the entire period (March 1, 2015 to August 31, 2015).
Actual Expenses
The first line of the accompanying table for each class of the Fund provides information about actual account values and actual expenses. You may use the information in this line, together with the amount you invested, to estimate the expenses that you paid over the period. Simply divide your account value by $1,000.00 (for example, an $8,600 account value divided by $1,000.00 = 8.6), then multiply the result by the number in the first line for a class of the Fund under the heading entitled "Expenses Paid During Period" to estimate the expenses you paid on your account during this period. A small balance maintenance fee of $12.00 that is charged once a year may apply for certain accounts with a value of less than $2,000. This fee is not included in the table below. If it was, the estimate of expenses you paid during the period would be higher, and your ending account value lower, by this amount. In addition, the Fund, as a shareholder in the underlying Fidelity Central Funds, will indirectly bear its pro-rata share of the fees and expenses incurred by the underlying Fidelity Central Funds. These fees and expenses are not included in the Fund's annualized expense ratio used to calculate the expense estimate in the table below.
Hypothetical Example for Comparison Purposes
The second line of the accompanying table for each class of the Fund provides information about hypothetical account values and hypothetical expenses based on a Class' actual expense ratio and an assumed rate of return of 5% per year before expenses, which is not the Class' actual return. The hypothetical account values and expenses may not be used to estimate the actual ending account balance or expenses you paid for the period. You may use this information to compare the ongoing costs of investing in the Fund and other funds. To do so, compare this 5% hypothetical example with the 5% hypothetical examples that appear in the shareholder reports of the other funds. A small balance maintenance fee of $12.00 that is charged once a year may apply for certain accounts with a value of less than $2,000. This fee is not included in the table below. If it was, the estimate of expenses you paid during the period would be higher, and your ending account value lower, by this amount. In addition, the Fund, as a shareholder in the underlying Fidelity Central Funds, will indirectly bear its pro-rata share of the fees and expenses incurred by the underlying Fidelity Central Funds. These fees and expenses are not included in the Fund's annualized expense ratio used to calculate the expense estimate in the table below.
Please note that the expenses shown in the table are meant to highlight your ongoing costs only and do not reflect any transaction costs. Therefore, the second line of the table is useful in comparing ongoing costs only, and will not help you determine the relative total costs of owning different funds. In addition, if these transactional costs were included, your costs would have been higher.
| Annualized Expense Ratio-A | Beginning Account Value March 1, 2015 | Ending Account Value August 31, 2015 | Expenses Paid During Period-B March 1, 2015 to August 31, 2015 |
|
| Telecommunications Portfolio | ||||
| Class A | 1.16% | |||
| Actual | $1,000.00 | $938.20 | $5.65 | |
| Hypothetical-C | $1,000.00 | $1,019.30 | $5.89 | |
| Class T | 1.48% | |||
| Actual | $1,000.00 | $936.70 | $7.20 | |
| Hypothetical-C | $1,000.00 | $1,017.70 | $7.51 | |
| Class B | 1.95% | |||
| Actual | $1,000.00 | $934.60 | $9.48 | |
| Hypothetical-C | $1,000.00 | $1,015.33 | $9.88 | |
| Class C | 1.92% | |||
| Actual | $1,000.00 | $934.80 | $9.34 | |
| Hypothetical-C | $1,000.00 | $1,015.48 | $9.73 | |
| Telecommunications | .83% | |||
| Actual | $1,000.00 | $939.90 | $4.05 | |
| Hypothetical-C | $1,000.00 | $1,020.96 | $4.22 | |
| Class I | .85% | |||
| Actual | $1,000.00 | $939.80 | $4.14 | |
| Hypothetical-C | $1,000.00 | $1,020.86 | $4.32 | |
| Wireless Portfolio | .87% | |||
| Actual | $1,000.00 | $934.80 | $4.23 | |
| Hypothetical-C | $1,000.00 | $1,020.76 | $4.42 |
A Annualized expense ratio reflects expenses net of applicable fee waivers.
B Expenses are equal to each Class' annualized expense ratio, multiplied by the average account value over the period, multiplied by 184/ 366 (to reflect the one-half year period).
C 5% return per year before expenses
![]()
SELTS-SANN-1015
1.846053.108
|
Fidelity® Select Portfolios® Chemicals Portfolio Gold Portfolio Materials Portfolio Semi-Annual Report August 31, 2015 |
|
|
Contents
|
Chemicals Portfolio |
|
|
Gold Portfolio |
|
|
Materials Portfolio |
|
To view a fund's proxy voting guidelines and proxy voting record for the 12-month period ended June 30, visit http://www.fidelity.com/proxyvotingresults or visit the Securities and Exchange Commission's (SEC) web site at http://www.sec.gov.
You may also call 1-800-544-8544 to request a free copy of the proxy voting guidelines.
Standard & Poor's, S&P and S&P 500 are registered service marks of The McGraw-Hill Companies, Inc. and have been licensed for use by Fidelity Distributors Corporation.
Other third-party marks appearing herein are the property of their respective owners.
All other marks appearing herein are registered or unregistered trademarks or service marks of FMR LLC or an affiliated company. © 2015 FMR LLC. All rights reserved.
This report and the financial statements contained herein are submitted for the general information of the shareholders of the Funds. This report is not authorized for distribution to prospective investors in the Funds unless preceded or accompanied by an effective prospectus.
A fund files its complete schedule of portfolio holdings with the SEC for the first and third quarters of each fiscal year on Form N-Q. Forms N-Q are available on the SEC’s web site at http://www.sec.gov. A fund's Forms N-Q may be reviewed and copied at the SEC’s Public Reference Room in Washington, DC. Information regarding the operation of the SEC's Public Reference Room may be obtained by calling 1-800-SEC-0330.
For a complete list of a fund's portfolio holdings, view the most recent holdings listing, semiannual report, or annual report on Fidelity's web site at http://www.fidelity.com, http://www.advisor.fidelity.com, or http://www.401k.com, as applicable.
NOT FDIC INSURED •MAY LOSE VALUE •NO BANK GUARANTEE
Neither the Funds nor Fidelity Distributors Corporation is a bank.
Chemicals Portfolio
Investment Summary (Unaudited)
Top Ten Stocks as of August 31, 2015
| % of fund's net assets | % of fund's net assets 6 months ago | |
| The Dow Chemical Co. | 13.0 | 6.0 |
| E.I. du Pont de Nemours & Co. | 12.7 | 14.3 |
| LyondellBasell Industries NV Class A | 9.7 | 8.1 |
| Ecolab, Inc. | 7.5 | 5.5 |
| Monsanto Co. | 7.2 | 12.3 |
| Eastman Chemical Co. | 4.9 | 3.6 |
| Ashland, Inc. | 4.6 | 4.3 |
| Valspar Corp. | 3.8 | 2.6 |
| Axalta Coating Systems | 3.4 | 1.2 |
| PPG Industries, Inc. | 3.3 | 3.2 |
| 70.1 |
Top Industries (% of fund's net assets)
| As of August 31, 2015 | ||
| Chemicals | 92.5% | |
| Capital Markets | 1.0% | |
| All Others* | 6.5% | |

| As of February 28, 2015 | ||
| Chemicals | 96.1% | |
| All Others* | 3.9% | |

* Includes short-term investments and net other assets (liabilities).
Chemicals Portfolio
Investments August 31, 2015 (Unaudited)
Showing Percentage of Net Assets
| Common Stocks - 93.5% | |||
| Shares | Value | ||
| Capital Markets - 1.0% | |||
| Diversified Capital Markets - 1.0% | |||
| AgroFresh Solutions, Inc. (a) | 1,117,986 | $10,900,364 | |
| Chemicals - 92.5% | |||
| Commodity Chemicals - 11.3% | |||
| Koppers Holdings, Inc. | 272,735 | 5,672,888 | |
| LyondellBasell Industries NV Class A | 1,274,022 | 108,775,998 | |
| Westlake Chemical Partners LP | 635,066 | 12,402,839 | |
| 126,851,725 | |||
| Diversified Chemicals - 30.6% | |||
| E.I. du Pont de Nemours & Co. | 2,779,700 | 143,154,550 | |
| Eastman Chemical Co. | 769,061 | 55,726,160 | |
| The Dow Chemical Co. | 3,337,706 | 146,058,016 | |
| 344,938,726 | |||
| Fertilizers & Agricultural Chemicals - 8.4% | |||
| Monsanto Co. | 835,359 | 81,572,806 | |
| Syngenta AG sponsored ADR | 169,570 | 11,757,984 | |
| The Scotts Miracle-Gro Co. Class A | 16,381 | 1,018,734 | |
| 94,349,524 | |||
| Industrial Gases - 5.0% | |||
| Air Products & Chemicals, Inc. | 254,308 | 35,483,595 | |
| Airgas, Inc. | 191,858 | 18,518,134 | |
| Praxair, Inc. | 27,221 | 2,878,621 | |
| 56,880,350 | |||
| Specialty Chemicals - 37.2% | |||
| Albemarle Corp. U.S. | 539,000 | 24,368,190 | |
| Ashland, Inc. | 489,318 | 51,363,710 | |
| Axalta Coating Systems | 1,328,203 | 38,770,246 | |
| Celanese Corp. Class A | 587,246 | 35,610,597 | |
| Ecolab, Inc. | 771,930 | 84,248,440 | |
| International Flavors & Fragrances, Inc. | 301,754 | 33,057,151 | |
| PPG Industries, Inc. | 394,408 | 37,583,138 | |
| Sensient Technologies Corp. | 360,106 | 23,460,906 | |
| Sherwin-Williams Co. | 42,153 | 10,783,159 | |
| Valspar Corp. | 578,800 | 42,426,040 | |
| W.R. Grace & Co. (a) | 378,100 | 37,409,214 | |
| 419,080,791 | |||
| TOTAL CHEMICALS | 1,042,101,116 | ||
| TOTAL COMMON STOCKS | |||
| (Cost $917,023,924) | 1,053,001,480 | ||
| Shares | Value | ||
| Money Market Funds - 8.2% | |||
| Fidelity Cash Central Fund, 0.15% (b) | |||
| (Cost $92,026,817) | 92,026,817 | $92,026,817 | |
| TOTAL INVESTMENT PORTFOLIO - 101.7% | |||
| (Cost $1,009,050,741) | 1,145,028,297 | ||
| NET OTHER ASSETS (LIABILITIES) - (1.7)% | (18,830,543) | ||
| NET ASSETS - 100% | $1,126,197,754 |
Legend
(a) Non-income producing
(b) Affiliated fund that is generally available only to investment companies and other accounts managed by Fidelity Investments. The rate quoted is the annualized seven-day yield of the fund at period end. A complete unaudited listing of the fund's holdings as of its most recent quarter end is available upon request. In addition, each Fidelity Central Fund's financial statements are available on the SEC's website or upon request.
Affiliated Central Funds
Information regarding fiscal year to date income earned by the Fund from investments in Fidelity Central Funds is as follows:
| Fund | Income earned |
| Fidelity Cash Central Fund | $35,499 |
| Fidelity Securities Lending Cash Central Fund | 29,383 |
| Total | $64,882 |
Investment Valuation
All investments are categorized as Level 1 under the Fair Value Hierarchy. The inputs or methodology used for valuing securities may not be an indication of the risk associated with investing in those securities. For more information on valuation inputs please refer to the Investment Valuation section in the accompanying Notes to Financial Statements.
Other Information
Distribution of investments by country or territory of incorporation, as a percentage of Total Net Assets, is as follows (Unaudited):
| United States of America | 85.8% |
| Netherlands | 9.7% |
| Bermuda | 3.4% |
| Switzerland | 1.1% |
| 100.0% |
See accompanying notes which are an integral part of the financial statements.
Chemicals Portfolio
Financial Statements
Statement of Assets and Liabilities
| August 31, 2015 (Unaudited) | ||
| Assets | ||
| Investment in securities, at value — See accompanying schedule: Unaffiliated issuers (cost $917,023,924) | $1,053,001,480 | |
| Fidelity Central Funds (cost $92,026,817) | 92,026,817 | |
| Total Investments (cost $1,009,050,741) | $1,145,028,297 | |
| Receivable for fund shares sold | 1,101,210 | |
| Dividends receivable | 2,684,889 | |
| Distributions receivable from Fidelity Central Funds | 7,317 | |
| Prepaid expenses | 9,603 | |
| Other receivables | 54,226 | |
| Total assets | 1,148,885,542 | |
| Liabilities | ||
| Payable for investments purchased | $18,675,743 | |
| Payable for fund shares redeemed | 3,156,116 | |
| Accrued management fee | 542,079 | |
| Other affiliated payables | 258,393 | |
| Other payables and accrued expenses | 55,457 | |
| Total liabilities | 22,687,788 | |
| Net Assets | $1,126,197,754 | |
| Net Assets consist of: | ||
| Paid in capital | $937,580,433 | |
| Undistributed net investment income | 9,176,761 | |
| Accumulated undistributed net realized gain (loss) on investments and foreign currency transactions | 43,463,004 | |
| Net unrealized appreciation (depreciation) on investments | 135,977,556 | |
| Net Assets, for 8,854,141 shares outstanding | $1,126,197,754 | |
| Net Asset Value, offering price and redemption price per share ($1,126,197,754 ÷ 8,854,141 shares) | $127.19 |
See accompanying notes which are an integral part of the financial statements.
Statement of Operations
| Six months ended August 31, 2015 (Unaudited) | ||
| Investment Income | ||
| Dividends | $14,779,472 | |
| Income from Fidelity Central Funds | 64,882 | |
| Total income | 14,844,354 | |
| Expenses | ||
| Management fee | $3,931,808 | |
| Transfer agent fees | 1,457,361 | |
| Accounting and security lending fees | 226,262 | |
| Custodian fees and expenses | 11,201 | |
| Independent trustees' compensation | 12,847 | |
| Registration fees | 53,485 | |
| Audit | 26,578 | |
| Legal | 9,935 | |
| Interest | 1,220 | |
| Miscellaneous | 10,600 | |
| Total expenses before reductions | 5,741,297 | |
| Expense reductions | (103,110) | 5,638,187 |
| Net investment income (loss) | 9,206,167 | |
| Realized and Unrealized Gain (Loss)
Net realized gain (loss) on: | ||
| Investment securities: | ||
| Unaffiliated issuers | 50,569,898 | |
| Foreign currency transactions | (66,827) | |
| Total net realized gain (loss) | 50,503,071 | |
| Change in net unrealized appreciation (depreciation) on investment securities | (271,287,645) | |
| Net gain (loss) | (220,784,574) | |
| Net increase (decrease) in net assets resulting from operations | $(211,578,407) |
See accompanying notes which are an integral part of the financial statements.
Statement of Changes in Net Assets
| Six months ended August 31, 2015 (Unaudited) | Year ended February 28, 2015 | |
| Increase (Decrease) in Net Assets | ||
| Operations | ||
| Net investment income (loss) | $9,206,167 | $17,918,198 |
| Net realized gain (loss) | 50,503,071 | 94,482,226 |
| Change in net unrealized appreciation (depreciation) | (271,287,645) | 131,028 |
| Net increase (decrease) in net assets resulting from operations | (211,578,407) | 112,531,452 |
| Distributions to shareholders from net investment income | (3,826,796) | (15,536,694) |
| Distributions to shareholders from net realized gain | (36,220,089) | (47,390,610) |
| Total distributions | (40,046,885) | (62,927,304) |
| Share transactions | ||
| Proceeds from sales of shares | 130,107,678 | 895,876,330 |
| Reinvestment of distributions | 38,497,571 | 60,869,457 |
| Cost of shares redeemed | (415,857,593) | (810,770,343) |
| Net increase (decrease) in net assets resulting from share transactions | (247,252,344) | 145,975,444 |
| Redemption fees | 8,234 | 53,824 |
| Total increase (decrease) in net assets | (498,869,402) | 195,633,416 |
| Net Assets | ||
| Beginning of period | 1,625,067,156 | 1,429,433,740 |
| End of period (including undistributed net investment income of $9,176,761 and undistributed net investment income of $3,797,390, respectively) | $1,126,197,754 | $1,625,067,156 |
| Other Information
Shares | ||
| Sold | 887,186 | 5,974,565 |
| Issued in reinvestment of distributions | 261,675 | 422,535 |
| Redeemed | (2,892,260) | (5,443,032) |
| Net increase (decrease) | (1,743,399) | 954,068 |
See accompanying notes which are an integral part of the financial statements.
Financial Highlights — Chemicals Portfolio
| Six months ended (Unaudited) | Years ended February 28, | |||||
| August 31, | 2015 | 2015 | 2014 | 2013 | 2012 A | 2011 |
| Selected Per–Share Data | ||||||
| Net asset value, beginning of period | $153.34 | $148.23 | $122.98 | $110.52 | $100.85 | $75.43 |
| Income from Investment Operations | ||||||
| Net investment income (loss)B | .93 | 1.64 | 1.23 | 1.84C | .76 | .69 |
| Net realized and unrealized gain (loss) | (23.21) | 9.09 | 32.11 | 15.10 | 9.52 | 27.20 |
| Total from investment operations | (22.28) | 10.73 | 33.34 | 16.94 | 10.28 | 27.89 |
| Distributions from net investment income | (.37) | (1.42) | (1.18) | (1.55) | (.62) | (.57) |
| Distributions from net realized gain | (3.50) | (4.20) | (6.92) | (2.95) | – | (1.91) |
| Total distributions | (3.87) | (5.62) | (8.10) | (4.49)D | (.62) | (2.47)E |
| Redemption fees added to paid in capitalB | –F | –F | .01 | .01 | .01 | –F |
| Net asset value, end of period | $127.19 | $153.34 | $148.23 | $122.98 | $110.52 | $100.85 |
| Total ReturnG,H | (14.87)% | 7.52% | 27.77% | 15.61% | 10.31% | 37.74% |
| Ratios to Average Net AssetsI,J | ||||||
| Expenses before reductions | .80%K | .79% | .81% | .83% | .85% | .90% |
| Expenses net of fee waivers, if any | .79%K | .79% | .81% | .83% | .85% | .90% |
| Expenses net of all reductions | .79%K | .79% | .80% | .81% | .84% | .89% |
| Net investment income (loss) | 1.28%K | 1.10% | .91% | 1.62%C | .77% | .84% |
| Supplemental Data | ||||||
| Net assets, end of period (000 omitted) | $1,126,198 | $1,625,067 | $1,429,434 | $1,134,777 | $861,539 | $692,332 |
| Portfolio turnover rateL | 92%K | 80%M | 109% | 60% | 119% | 108% |
A For the year ended February 29.
B Calculated based on average shares outstanding during the period.
C Investment income per share reflects a large, non-recurring dividend which amounted to $.30 per share. Excluding this non-recurring dividend, the ratio of net investment income (loss) to average net assets would have been 1.35%.
D Total distributions of $4.49 per share is comprised of distributions from net investment income of $1.547 and distributions from net realized gain of $2.947per share.
E Total distributions of $2.47 per share is comprised of distributions from net investment income of $.565 and distributions from net realized gain of $1.905 per share.
F Amount represents less than $.005 per share.
G Total returns for periods of less than one year are not annualized.
H Total returns would have been lower if certain expenses had not been reduced during the applicable periods shown.
I Fees and expenses of any underlying Fidelity Central Funds are not included in the Fund's expense ratio. The Fund indirectly bears its proportionate share of the expenses of any underlying Fidelity Central Funds.
J Expense ratios reflect operating expenses of the Fund. Expenses before reductions do not reflect amounts reimbursed by the investment adviser or reductions from brokerage service arrangements or reductions from other expense offset arrangements and do not represent the amount paid by the Fund during periods when reimbursements or reductions occur. Expenses net of fee waivers reflect expenses after reimbursement by the investment adviser but prior to reductions from brokerage service arrangements or other expense offset arrangements. Expenses net of all reductions represent the net expenses paid by the Fund.
K Annualized
L Amount does not include the portfolio activity of any underlying Fidelity Central Funds.
M Portfolio turnover rate excludes securities received or delivered in-kind.
See accompanying notes which are an integral part of the financial statements.
Notes to Financial Statements (Unaudited)
For the period ended August 31, 2015
1. Organization.
Chemicals Portfolio (the Fund) is a non-diversified fund of Fidelity Select Portfolios (the Trust) and is authorized to issue an unlimited number of shares. Share transactions on the Statement of Changes in Net Assets may contain exchanges between funds. The Trust is registered under the Investment Company Act of 1940, as amended (the 1940 Act), as an open-end management investment company organized as a Massachusetts business trust. The Fund invests primarily in securities of companies whose principal business activities fall within specific industries.
2. Investments in Fidelity Central Funds.
The Fund invests in Fidelity Central Funds, which are open-end investment companies generally available only to other investment companies and accounts managed by the investment adviser and its affiliates. The Fund's Schedule of Investments lists each of the Fidelity Central Funds held as of period end, if any, as an investment of the Fund, but does not include the underlying holdings of each Fidelity Central Fund. As an Investing Fund, the Fund indirectly bears its proportionate share of the expenses of the underlying Fidelity Central Funds.
The Money Market Central Funds seek preservation of capital and current income and are managed by Fidelity Investments Money Management, Inc. (FIMM), an affiliate of the investment adviser. Annualized expenses of the Money Market Central Funds as of their most recent shareholder report date are less than .01%.
A complete unaudited list of holdings for each Fidelity Central Fund is available upon request or at the Securities and Exchange Commission (the SEC) website at www.sec.gov. In addition, the financial statements of the Fidelity Central Funds are available on the SEC website or upon request.
3. Significant Accounting Policies.
The financial statements have been prepared in conformity with accounting principles generally accepted in the United States of America (GAAP), which require management to make certain estimates and assumptions at the date of the financial statements. Actual results could differ from those estimates. Subsequent events, if any, through the date that the financial statements were issued have been evaluated in the preparation of the financial statements. The following summarizes the significant accounting policies of the Fund:
Investment Valuation. Investments are valued as of 4:00 p.m. Eastern time on the last calendar day of the period. The Board of Trustees (the Board) has delegated the day to day responsibility for the valuation of the Fund's investments to the Fidelity SelectCo, LLC (SelectCo) Fair Value Committee (the Committee). In accordance with valuation policies and procedures approved by the Board, the Fund attempts to obtain prices from one or more third party pricing vendors or brokers to value its investments. When current market prices, quotations or currency exchange rates are not readily available or reliable, investments will be fair valued in good faith by the Committee, in accordance with procedures adopted by the Board. Factors used in determining fair value vary by investment type and may include market or investment specific events. The frequency with which these procedures are used cannot be predicted and they may be utilized to a significant extent. The Committee oversees the Fund's valuation policies and procedures and reports to the Board on the Committee's activities and fair value determinations. The Board monitors the appropriateness of the procedures used in valuing the Fund's investments and ratifies the fair value determinations of the Committee.
The Fund categorizes the inputs to valuation techniques used to value its investments into a disclosure hierarchy consisting of three levels as shown below:
- Level 1 – quoted prices in active markets for identical investments
- Level 2 – other significant observable inputs (including quoted prices for similar investments, interest rates, prepayment speeds, etc.)
- Level 3 – unobservable inputs (including the Fund's own assumptions based on the best information available)
Valuation techniques used to value the Fund's investments by major category are as follows:
Equity securities, including restricted securities, for which market quotations are readily available, are valued at the last reported sale price or official closing price as reported by a third party pricing vendor on the primary market or exchange on which they are traded and are categorized as Level 1 in the hierarchy. In the event there were no sales during the day or closing prices are not available, securities are valued at the last quoted bid price or may be valued using the last available price and are generally categorized as Level 2 in the hierarchy. For foreign equity securities, when market or security specific events arise, comparisons to the valuation of American Depositary Receipts (ADRs), futures contracts, Exchange-Traded Funds (ETFs) and certain indexes as well as quoted prices for similar securities may be used and would be categorized as Level 2 in the hierarchy. Utilizing these techniques may result in transfers between Level 1 and Level 2. For equity securities, including restricted securities, where observable inputs are limited, assumptions about market activity and risk are used and these securities may be categorized as Level 3 in the hierarchy.
Investments in open-end mutual funds, including the Fidelity Central Funds, are valued at their closing net asset value (NAV) each business day and are categorized as Level 1 in the hierarchy.
Changes in valuation techniques may result in transfers in or out of an assigned level within the disclosure hierarchy.
Foreign Currency. The Fund may use foreign currency contracts to facilitate transactions in foreign-denominated securities. Gains and losses from these transactions may arise from changes in the value of the foreign currency or if the counterparties do not perform under the contracts' terms.
Foreign-denominated assets, including investment securities, and liabilities are translated into U.S. dollars at the exchange rates at period end. Purchases and sales of investment securities, income and dividends received and expenses denominated in foreign currencies are translated into U.S. dollars at the exchange rate in effect on the transaction date.
The effects of exchange rate fluctuations on investments are included with the net realized and unrealized gain (loss) on investment securities. Other foreign currency transactions resulting in realized and unrealized gain (loss) are disclosed separately.
Investment Transactions and Income. For financial reporting purposes, the Fund's investment holdings and NAV include trades executed through the end of the last business day of the period. The NAV per share for processing shareholder transactions is calculated as of the close of business of the New York Stock Exchange (NYSE), normally 4:00 p.m. Eastern time and includes trades executed through the end of the prior business day. Gains and losses on securities sold are determined on the basis of identified cost. Dividend income is recorded on the ex-dividend date, except for certain dividends from foreign securities where the ex-dividend date may have passed, which are recorded as soon as the Fund is informed of the ex-dividend date. Non-cash dividends included in dividend income, if any, are recorded at the fair market value of the securities received. Income and capital gain distributions from Fidelity Central Funds, if any, are recorded on the ex-dividend date. Distributions received on securities that represent a return of capital or capital gain are recorded as a reduction of cost of investments and/or as a realized gain. Subsequent to ex-dividend date the Fund determines the components of these distributions, based upon receipt of tax filings or other correspondence relating to the underlying investment. Investment income is recorded net of foreign taxes withheld where recovery of such taxes is uncertain.
Expenses. Expenses directly attributable to a fund are charged to that fund. Expenses attributable to more than one fund are allocated among the respective funds on the basis of relative net assets or other appropriate methods. Expense estimates are accrued in the period to which they relate and adjustments are made when actual amounts are known.
Deferred Trustee Compensation. Under a Deferred Compensation Plan (the Plan), independent Trustees may elect to defer receipt of a portion of their annual compensation. Deferred amounts are invested in a cross-section of Fidelity funds, are marked-to-market and remain in the Fund until distributed in accordance with the Plan. The investment of deferred amounts and the offsetting payable to the Trustees are included in the accompanying Statement of Assets and Liabilities.
Income Tax Information and Distributions to Shareholders. Each year, the Fund intends to qualify as a regulated investment company under Subchapter M of the Internal Revenue Code, including distributing substantially all of its taxable income and realized gains. As a result, no provision for U.S. Federal income taxes is required. The Fund files a U.S. federal tax return, in addition to state and local tax returns as required. The Fund's federal income tax returns are subject to examination by the Internal Revenue Service (IRS) for a period of three fiscal years after they are filed. State and local tax returns may be subject to examination for an additional fiscal year depending on the jurisdiction. Foreign taxes are provided for based on the Fund's understanding of the tax rules and rates that exist in the foreign markets in which it invests.
Distributions are declared and recorded on the ex-dividend date. Income and capital gain distributions are determined in accordance with income tax regulations, which may differ from GAAP.
Capital accounts within the financial statements are adjusted for permanent book-tax differences. These adjustments have no impact on net assets or the results of operations. Capital accounts are not adjusted for temporary book-tax differences which will reverse in a subsequent period.
Book-tax differences are primarily due to in-kind transactions, partnerships, deferred trustees compensation and losses deferred due to wash sales.
The federal tax cost of investment securities and unrealized appreciation (depreciation) as of period end were as follows:
| Gross unrealized appreciation | $195,829,380 |
| Gross unrealized depreciation | (65,299,382) |
| Net unrealized appreciation (depreciation) on securities | $130,529,998 |
| Tax cost | $1,014,498,299 |
Trading (Redemption) Fees. Shares held by investors in the Fund less than 30 days may be subject to a redemption fee equal to .75% of the NAV of shares redeemed. All redemption fees, which reduce the proceeds of the shareholder redemption, are retained by the Fund and accounted for as an addition to paid in capital.
4. Purchases and Sales of Investments.
Purchases and sales of securities, other than short-term securities, aggregated $625,487,806 and $913,735,633, respectively.
5. Fees and Other Transactions with Affiliates.
Management Fee. Fidelity SelectCo, LLC (the investment adviser) and its affiliates provide the Fund with investment management related services for which the Fund pays a monthly management fee. The management fee is the sum of an individual fund fee rate that is based on an annual rate of .30% of the Fund's average net assets and an annualized group fee rate that averaged .25% during the period. The group fee rate is based upon the average net assets of all the mutual funds advised by Fidelity Management & Research Company (FMR) and the investment adviser. The group fee rate decreases as assets under management increase and increases as assets under management decrease. For the reporting period, the total annualized management fee rate was .55% of the Fund's average net assets.
Transfer Agent Fees. Fidelity Investments Institutional Operations Company, Inc. (FIIOC), an affiliate of the investment adviser, is the Fund's transfer, dividend disbursing and shareholder servicing agent. FIIOC receives account fees and asset-based fees that vary according to account size and type of account. FIIOC pays for typesetting, printing and mailing of shareholder reports, except proxy statements. For the period, the transfer agent fees were equivalent to an annualized rate of .20% of average net assets.
Accounting and Security Lending Fees. Fidelity Service Company, Inc. (FSC), an affiliate of the investment adviser, maintains the Fund's accounting records. The accounting fee is based on the level of average net assets for each month. Under a separate contract, FSC administers the security lending program. The security lending fee is based on the number and duration of lending transactions.
Brokerage Commissions. The Fund placed a portion of its portfolio transactions with brokerage firms which are affiliates of the investment adviser. Brokerage commissions are included in net realized gain (loss) and change in net unrealized appreciation (depreciation) in the Statement of Operations. The commissions paid to these affiliated firms were $9,807 for the period.
Interfund Lending Program. Pursuant to an Exemptive Order issued by the SEC, the Fund, along with other registered investment companies having management contracts with Fidelity Management & Research Company (FMR) or other affiliated entities of FMR, may participate in an interfund lending program. This program provides an alternative credit facility allowing the funds to borrow from, or lend money to, other participating affiliated funds. At period end, there were no interfund loans outstanding. The Fund's activity in this program during the period for which loans were outstanding was as follows:
| Borrower or Lender | Average Loan Balance | Weighted Average Interest Rate | Interest Expense |
| Borrower | $11,552,727 | .35% | $1,220 |
6. Committed Line of Credit.
The Fund participates with other funds managed by the investment adviser or an affiliate in a $4.25 billion credit facility (the "line of credit") to be utilized for temporary or emergency purposes to fund shareholder redemptions or for other short-term liquidity purposes. The Fund has agreed to pay commitment fees on its pro-rata portion of the line of credit, which amounted to $1,191 and is reflected in Miscellaneous expenses on the Statement of Operations. During the period, the Fund did not borrow on this line of credit.
7. Security Lending.
The Fund lends portfolio securities through a lending agent from time to time in order to earn additional income. On the settlement date of the loan, the Fund receives collateral (in the form of U.S. Treasury obligations, letters of credit and/or cash) against the loaned securities and maintains collateral in an amount not less than 100% of the market value of the loaned securities during the period of the loan. The market value of the loaned securities is determined at the close of business of the Fund and any additional required collateral is delivered to the Fund on the next business day. If the borrower defaults on its obligation to return the securities loaned because of insolvency or other reasons, the Fund may apply collateral received from the borrower against the obligation. The Fund may experience delays and costs in recovering the securities loaned. Any cash collateral received is invested in the Fidelity Securities Lending Cash Central Fund. At period end, there were no security loans outstanding. Security lending income represents the income earned on investing cash collateral, less rebates paid to borrowers and any lending agent fees associated with the loan, plus any premium payments received for lending certain types of securities. Security lending income is presented in the Statement of Operations as a component of income from Fidelity Central Funds. Total security lending income during the period amounted to $29,383.
8. Expense Reductions.
Commissions paid to certain brokers with whom the investment adviser, or its affiliates, places trades on behalf of the Fund include an amount in addition to trade execution, which may be rebated back to the Fund to offset certain expenses. This amount totaled $63,578 for the period.
In addition, during the period the investment adviser reimbursed and/or waived a portion of operating expenses in the amount of $39,532.
9. Other.
The Fund's organizational documents provide former and current trustees and officers with a limited indemnification against liabilities arising in connection with the performance of their duties to the Fund. In the normal course of business, the Fund may also enter into contracts that provide general indemnifications. The Fund's maximum exposure under these arrangements is unknown as this would be dependent on future claims that may be made against the Fund. The risk of material loss from such claims is considered remote.
Gold Portfolio
Consolidated Investment Summary (Unaudited)
The information in the following tables is based on the consolidated investments of the Fund.Top Ten Holdings as of August 31, 2015
| % of fund's net assets | % of fund's net assets 6 months ago | |
| Goldcorp, Inc. | 8.0 | 8.8 |
| Randgold Resources Ltd. sponsored ADR | 7.8 | 7.1 |
| Franco-Nevada Corp. | 6.3 | 6.1 |
| Newcrest Mining Ltd. | 5.6 | 6.2 |
| Agnico Eagle Mines Ltd. (Canada) | 5.6 | 5.0 |
| Silver Bullion | 5.3 | 4.2 |
| Gold Bullion | 5.2 | 6.2 |
| Newmont Mining Corp. | 4.5 | 4.0 |
| B2Gold Corp. | 3.7 | 3.4 |
| Royal Gold, Inc. | 3.2 | 3.6 |
| 55.2 |
Top Industries (% of fund's net assets)
| As of August 31, 2015 | ||
| Gold | 87.1% | |
| Commodities & Related Investments* | 10.5% | |
| Precious Metals & Minerals | 1.1% | |
| Silver | 0.7% | |
| Diversified Metals & Mining | 0.2% | |
| All Others* | 0.4% | |

* Includes gold bullion and/or silver bullion.
| As of February 28, 2015 | ||
| Gold | 87.6% | |
| Commodities & Related Investments* | 10.4% | |
| Precious Metals & Minerals | 0.1% | |
| Silver | 0.7% | |
| Diversified Metals & Mining | 0.2% | |
| All Others* | 1.0% | |

* Includes gold bullion and/or silver bullion.
* Includes short-term investments and net other assets (liabilities).
Geographic Diversification (% of fund's net assets)
| As of August 31, 2015 | ||
| Canada | 57.9% | |
| United States of America* | 18.7% | |
| Bailiwick of Jersey | 8.4% | |
| Australia | 7.4% | |
| South Africa | 5.6% | |
| United Kingdom | 0.7% | |
| Peru | 0.7% | |
| Cayman Islands | 0.4% | |
| China | 0.2% | |

Percentages are based on country or territory of incorporation and are adjusted for the effect of futures contracts, if applicable.
| As of February 28, 2015 | ||
| Canada | 55.8% | |
| United States of America* | 19.1% | |
| Australia | 8.1% | |
| Bailiwick of Jersey | 7.9% | |
| South Africa | 6.9% | |
| Peru | 0.8% | |
| Bermuda | 0.7% | |
| Cayman Islands | 0.4% | |
| United Kingdom | 0.3% | |

Percentages are based on country or territory of incorporation and are adjusted for the effect of futures contracts, if applicable.
Gold Portfolio
Consolidated Investments August 31, 2015 (Unaudited)
Showing Percentage of Net Assets
| Common Stocks - 89.1% | |||
| Shares | Value | ||
| Australia - 7.4% | |||
| Metals & Mining - 7.4% | |||
| Gold - 7.4% | |||
| Beadell Resources Ltd. (a) | 7,587,418 | $755,942 | |
| Evolution Mining Ltd. | 352,543 | 255,905 | |
| Medusa Mining Ltd. (a)(b) | 1,228,595 | 424,050 | |
| Newcrest Mining Ltd. (b) | 5,941,753 | 47,409,487 | |
| Northern Star Resources Ltd. | 4,351,118 | 6,254,876 | |
| Perseus Mining Ltd.: | |||
| (Australia) (b) | 1,417,134 | 383,231 | |
| (Canada) (b) | 1,300,000 | 375,494 | |
| Regis Resources Ltd. (a)(b) | 2,832,191 | 2,932,594 | |
| Resolute Mng Ltd. (b) | 2,390,161 | 450,754 | |
| Saracen Mineral Holdings Ltd. (b) | 8,462,787 | 2,649,919 | |
| Silver Lake Resources Ltd.(a)(b) | 4,145,985 | 427,821 | |
| 62,320,073 | |||
| Bailiwick of Jersey - 8.4% | |||
| Metals & Mining - 8.4% | |||
| Gold - 8.4% | |||
| Lydian International Ltd. (b) | 2,325,200 | 530,222 | |
| Polyus Gold International Ltd. (a) | 222,400 | 648,418 | |
| Polyus Gold International Ltd. sponsored GDR | 1,340,231 | 3,886,670 | |
| Randgold Resources Ltd. sponsored ADR (a) | 1,093,995 | 65,956,959 | |
| 71,022,269 | |||
| Bermuda - 0.0% | |||
| Metals & Mining - 0.0% | |||
| Steel - 0.0% | |||
| African Minerals Ltd. (a)(b) | 1,718,700 | 26 | |
| Canada - 57.9% | |||
| Metals & Mining - 57.9% | |||
| Diversified Metals & Mining - 0.2% | |||
| Ivanhoe Mines Ltd. (b) | 2,441,200 | 1,484,463 | |
| Ivanhoe Mines Ltd. Class A warrants 12/10/15 (b)(c) | 837,300 | 3,182 | |
| True Gold Mining, Inc. (b) | 171,000 | 23,396 | |
| 1,511,041 | |||
| Gold - 55.9% | |||
| Agnico Eagle Mines Ltd. (Canada) (a) | 1,933,401 | 47,350,395 | |
| Alacer Gold Corp. (b) | 2,131,963 | 4,650,907 | |
| Alamos Gold, Inc. | 1,745,766 | 7,192,195 | |
| Argonaut Gold, Inc. (b) | 5,077,262 | 5,132,836 | |
| Asanko Gold, Inc. (b) | 120,000 | 197,020 | |
| B2Gold Corp. (b) | 26,622,293 | 31,163,219 | |
| Barrick Gold Corp. | 3,877,569 | 26,968,498 | |
| Centerra Gold, Inc. | 369,900 | 1,869,744 | |
| Continental Gold, Inc. (b) | 5,415,600 | 11,567,221 | |
| Detour Gold Corp. (b) | 1,619,000 | 16,354,903 | |
| Detour Gold Corp. (b)(c) | 785,900 | 7,939,048 | |
| Eldorado Gold Corp. | 8,672,235 | 25,905,962 | |
| Franco-Nevada Corp. | 1,221,100 | 52,905,670 | |
| Goldcorp, Inc. | 4,861,500 | 67,438,718 | |
| Guyana Goldfields, Inc. (b) | 3,651,400 | 11,212,873 | |
| Guyana Goldfields, Inc. (b)(c) | 155,000 | 475,981 | |
| IAMGOLD Corp. (b) | 1,027,100 | 1,725,366 | |
| Kinross Gold Corp. (b) | 2,363,891 | 4,222,517 | |
| Kirkland Lake Gold, Inc. (a)(b) | 854,100 | 3,453,794 | |
| Klondex Mines Ltd. (b) | 26,000 | 69,170 | |
| Lake Shore Gold Corp. (a)(b) | 2,806,600 | 2,367,989 | |
| New Gold, Inc. (b) | 8,408,275 | 19,365,364 | |
| Novagold Resources, Inc. (b) | 1,697,100 | 6,346,710 | |
| OceanaGold Corp. | 2,849,500 | 5,024,962 | |
| Osisko Gold Royalties Ltd. | 473,793 | 5,499,254 | |
| Pilot Gold, Inc. (a)(b) | 1,418,150 | 452,739 | |
| Premier Gold Mines Ltd. (b)(d) | 10,516,022 | 19,104,053 | |
| Pretium Resources, Inc. (a)(b) | 890,138 | 4,763,280 | |
| Pretium Resources, Inc. (b)(c) | 225,000 | 1,204,013 | |
| Pretium Resources, Inc. (b)(e) | 225,000 | 1,204,013 | |
| Primero Mining Corp. (a)(b) | 1,735,500 | 5,026,038 | |
| Richmont Mines, Inc. (b) | 89,400 | 224,927 | |
| Romarco Minerals, Inc. (b) | 37,623,994 | 16,015,078 | |
| Romarco Minerals, Inc. (b)(c) | 5,900,000 | 2,511,402 | |
| Rubicon Minerals Corp. (a)(b) | 5,376,402 | 4,290,987 | |
| Seabridge Gold, Inc. (b) | 659,166 | 4,218,662 | |
| SEMAFO, Inc. (b) | 3,922,900 | 9,720,777 | |
| Teranga Gold Corp. (a)(b) | 85,000 | 37,473 | |
| Teranga Gold Corp. CDI unit (b) | 3,338,072 | 1,544,100 | |
| Timmins Gold Corp. (b) | 17,600 | 4,749 | |
| Torex Gold Resources, Inc. (b) | 22,555,000 | 21,258,893 | |
| Yamana Gold, Inc. | 6,697,220 | 12,573,832 | |
| 470,555,332 | |||
| Precious Metals & Minerals - 1.1% | |||
| Gold Standard Ventures Corp. (b) | 2,155,400 | 745,445 | |
| Tahoe Resources, Inc. (a) | 1,006,982 | 8,419,582 | |
| 9,165,027 | |||
| Silver - 0.7% | |||
| MAG Silver Corp. (b) | 292,700 | 2,153,645 | |
| Silver Wheaton Corp. | 345,900 | 4,240,930 | |
| 6,394,575 | |||
| TOTAL METALS & MINING | 487,625,975 | ||
| Cayman Islands - 0.4% | |||
| Metals & Mining - 0.4% | |||
| Gold - 0.4% | |||
| Endeavour Mining Corp. (b) | 8,267,400 | 3,581,953 | |
| China - 0.2% | |||
| Metals & Mining - 0.2% | |||
| Gold - 0.2% | |||
| Zijin Mining Group Co. Ltd. (H Shares) | 5,300,000 | 1,367,733 | |
| Peru - 0.7% | |||
| Metals & Mining - 0.7% | |||
| Gold - 0.7% | |||
| Compania de Minas Buenaventura SA sponsored ADR | 854,828 | 5,402,513 | |
| South Africa - 5.6% | |||
| Metals & Mining - 5.6% | |||
| Gold - 5.6% | |||
| AngloGold Ashanti Ltd. sponsored ADR (b) | 3,108,508 | 25,241,085 | |
| Gold Fields Ltd. sponsored ADR | 4,698,926 | 15,177,531 | |
| Harmony Gold Mining Co. Ltd. (b) | 1,484,000 | 1,286,113 | |
| Harmony Gold Mining Co. Ltd. sponsored ADR (a)(b) | 1,812,900 | 1,672,763 | |
| Sibanye Gold Ltd. ADR (a) | 846,906 | 4,031,273 | |
| 47,408,765 | |||
| United Kingdom - 0.7% | |||
| Metals & Mining - 0.7% | |||
| Gold - 0.7% | |||
| Acacia Mining PLC | 1,551,427 | 5,696,931 | |
| United States of America - 7.8% | |||
| Metals & Mining - 7.8% | |||
| Gold - 7.8% | |||
| McEwen Mining, Inc. (a) | 579,110 | 528,438 | |
| Newmont Mining Corp. | 2,212,100 | 37,760,547 | |
| Royal Gold, Inc. | 564,613 | 27,169,178 | |
| 65,458,163 | |||
| TOTAL COMMON STOCKS | |||
| (Cost $1,282,263,655) | 749,884,401 | ||
| Commodities - 10.5% | |||
| Troy Ounces | |||
| Gold Bullion(b) | 38,510 | 43,722,714 | |
| Silver Bullion(b) | 3,082,000 | 45,146,677 | |
| TOTAL COMMODITIES | |||
| (Cost $109,204,403) | 88,869,391 | ||
| Money Market Funds - 5.1% | |||
| Shares | |||
| Fidelity Cash Central Fund, 0.15% (f) | 4,283,847 | 4,283,847 | |
| Fidelity Securities Lending Cash Central Fund, 0.19% (f)(g) | 38,557,163 | 38,557,163 | |
| TOTAL MONEY MARKET FUNDS | |||
| (Cost $42,841,010) | 42,841,010 | ||
| TOTAL INVESTMENT PORTFOLIO - 104.7% | |||
| (Cost $1,434,309,068) | 881,594,802 | ||
| NET OTHER ASSETS (LIABILITIES) - (4.7)% | (39,872,327) | ||
| NET ASSETS - 100% | $841,722,475 |
Legend
(a) Security or a portion of the security is on loan at period end.
(b) Non-income producing
(c) Security exempt from registration under Rule 144A of the Securities Act of 1933. These securities may be resold in transactions exempt from registration, normally to qualified institutional buyers. At the end of the period, the value of these securities amounted to $12,133,626 or 1.4% of net assets.
(d) Affiliated company
(e) Restricted securities - Investment in securities not registered under the Securities Act of 1933 (excluding 144A issues). At the end of the period, the value of restricted securities (excluding 144A issues) amounted to $1,204,013 or 0.1% of net assets.
(f) Affiliated fund that is generally available only to investment companies and other accounts managed by Fidelity Investments. The rate quoted is the annualized seven-day yield of the fund at period end. A complete unaudited listing of the fund's holdings as of its most recent quarter end is available upon request. In addition, each Fidelity Central Fund's financial statements are available on the SEC's website or upon request.
(g) Investment made with cash collateral received from securities on loan.
Additional information on each restricted holding is as follows:
| Security | Acquisition Date | Acquisition Cost |
| Pretium Resources, Inc. | 3/31/11 | $2,172,293 |
Affiliated Central Funds
Information regarding fiscal year to date income earned by the Fund from investments in Fidelity Central Funds is as follows:
| Fund | Income earned |
| Fidelity Cash Central Fund | $3,107 |
| Fidelity Securities Lending Cash Central Fund | 122,985 |
| Total | $126,092 |
Consolidated Subsidiary
| Value, beginning of period | Purchases | Sales Proceeds | Dividend Income | Value, end of period | |
| Fidelity Select Gold Cayman Ltd. | $116,684,748 | $17,032,584 | $33,092,250 | $-- | $88,827,307 |
Other Affiliated Issuers
An affiliated company is a company in which the Fund has ownership of at least 5% of the voting securities. Fiscal year to date transactions with companies which are or were affiliates are as follows:
| Affiliate | Value, beginning of period | Purchases | Sales Proceeds | Dividend Income | Value, end of period |
| Premier Gold Mines Ltd. | $20,747,454 | $210,553 | $61,846 | $-- | $19,104,053 |
| Total | $20,747,454 | $210,553 | $61,846 | $-- | $19,104,053 |
Investment Valuation
The following is a summary of the inputs used, as of August 31, 2015, involving the Fund's assets and liabilities carried at fair value. The inputs or methodology used for valuing securities may not be an indication of the risk associated with investing in those securities. For more information on valuation inputs, and their aggregation into the levels used below, please refer to the Investment Valuation section in the accompanying Notes to Consolidated Financial Statements.
| Valuation Inputs at Reporting Date: | ||||
| Description | Total | Level 1 | Level 2 | Level 3 |
| Investments in Securities: | ||||
| Common Stocks | $749,884,401 | $701,188,775 | $48,695,600 | $26 |
| Commodities | 88,869,391 | 88,869,391 | -- | -- |
| Money Market Funds | 42,841,010 | 42,841,010 | -- | -- |
| Total Investments in Securities: | $881,594,802 | $832,899,176 | $48,695,600 | $26 |
The following is a summary of transfers between Level 1 and Level 2 for the period ended August 31, 2015. Transfers are assumed to have occurred at the beginning of the period, and are primarily attributable to the valuation techniques used for foreign equity securities, as discussed in the accompanying Notes to Consolidated Financial Statements:
| Transfers | Total |
| Level 1 to Level 2 | $69,980,874 |
| Level 2 to Level 1 | $0 |
See accompanying notes which are an integral part of the consolidated financial statements.
Gold Portfolio
Consolidated Financial Statements
Consolidated Statement of Assets and Liabilities
| August 31, 2015 (Unaudited) | ||
| Assets | ||
| Investment in securities, at value (including securities loaned of $35,369,234) — See accompanying schedule: Unaffiliated issuers (cost $1,250,849,595) | $730,780,348 | |
| Fidelity Central Funds (cost $42,841,010) | 42,841,010 | |
| Commodities (cost $109,204,403) | 88,869,391 | |
| Other affiliated issuers (cost $31,414,060) | 19,104,053 | |
| Total Investments (cost $1,434,309,068) | $881,594,802 | |
| Cash | 16,980 | |
| Foreign currency held at value (cost $71) | 71 | |
| Receivable for investments sold | 2,196,707 | |
| Receivable for fund shares sold | 1,267,170 | |
| Dividends receivable | 248,677 | |
| Distributions receivable from Fidelity Central Funds | 17,021 | |
| Prepaid expenses | 5,930 | |
| Other receivables | 29,569 | |
| Total assets | 885,376,927 | |
| Liabilities | ||
| Payable for investments purchased | $2,787,191 | |
| Unrealized depreciation on foreign currency contracts | 51 | |
| Payable for fund shares redeemed | 1,525,927 | |
| Accrued management fee | 383,048 | |
| Distribution and service plan fees payable | 40,595 | |
| Other affiliated payables | 248,976 | |
| Other payables and accrued expenses | 111,501 | |
| Collateral on securities loaned, at value | 38,557,163 | |
| Total liabilities | 43,654,452 | |
| Net Assets | $841,722,475 | |
| Net Assets consist of: | ||
| Paid in capital | $2,580,184,708 | |
| Accumulated net investment loss | (526,638) | |
| Accumulated undistributed net realized gain (loss) on investments and foreign currency transactions | (1,185,219,612) | |
| Net unrealized appreciation (depreciation) on investments and assets and liabilities in foreign currencies | (552,715,983) | |
| Net Assets | $841,722,475 | |
| Calculation of Maximum Offering Price | ||
| Class A: | ||
| Net Asset Value and redemption price per share ($35,788,107 ÷ 2,642,108 shares) | $13.55 | |
| Maximum offering price per share (100/94.25 of $13.55) | $14.38 | |
| Class T: | ||
| Net Asset Value and redemption price per share ($12,157,085 ÷ 912,992 shares) | $13.32 | |
| Maximum offering price per share (100/96.50 of $13.32) | $13.80 | |
| Class B: | ||
| Net Asset Value and offering price per share ($1,397,454 ÷ 108,622 shares)(a) | $12.87 | |
| Class C: | ||
| Net Asset Value and offering price per share ($33,200,590 ÷ 2,590,933 shares)(a) | $12.81 | |
| Gold: | ||
| Net Asset Value, offering price and redemption price per share ($740,158,656 ÷ 53,436,990 shares) | $13.85 | |
| Class I: | ||
| Net Asset Value, offering price and redemption price per share ($19,020,583 ÷ 1,372,804 shares) | $13.86 |
(a) Redemption price per share is equal to net asset value less any applicable contingent deferred sales charge.
See accompanying notes which are an integral part of the consolidated financial statements.
Consolidated Statement of Operations
| Six months ended August 31, 2015 (Unaudited) | ||
| Investment Income | ||
| Dividends | $4,629,139 | |
| Income from Fidelity Central Funds | 126,092 | |
| Income before foreign taxes withheld | 4,755,231 | |
| Less foreign taxes withheld | (472,174) | |
| Total income | 4,283,057 | |
| Expenses | ||
| Management fee | $2,835,308 | |
| Transfer agent fees | 1,378,144 | |
| Distribution and service plan fees | 275,705 | |
| Accounting and security lending fees | 230,445 | |
| Custodian fees and expenses | 174,762 | |
| Independent trustees' compensation | 8,491 | |
| Registration fees | 72,307 | |
| Audit | 20,002 | |
| Legal | 6,505 | |
| Miscellaneous | 8,923 | |
| Total expenses before reductions | 5,010,592 | |
| Expense reductions | (220,178) | 4,790,414 |
| Net investment income (loss) | (507,357) | |
| Realized and Unrealized Gain (Loss)
Net realized gain (loss) on: | ||
| Investments: | ||
| Unaffiliated issuers | (85,858,960) | |
| Other affiliated issuers | (128,350) | |
| Commodities | (4,624,665) | |
| Foreign currency transactions | 1,687,366 | |
| Total net realized gain (loss) | (88,924,609) | |
| Change in net unrealized appreciation (depreciation) on: Investments | (184,851,914) | |
| Assets and liabilities in foreign currencies | (2,734) | |
| Commodities | (6,919,421) | |
| Total change in net unrealized appreciation (depreciation) | (191,774,069) | |
| Net gain (loss) | (280,698,678) | |
| Net increase (decrease) in net assets resulting from operations | $(281,206,035) |
See accompanying notes which are an integral part of the consolidated financial statements.
Consolidated Statement of Changes in Net Assets
| Six months ended August 31, 2015 (Unaudited) | Year ended February 28, 2015 | |
| Increase (Decrease) in Net Assets | ||
| Operations | ||
| Net investment income (loss) | $(507,357) | $(3,405,899) |
| Net realized gain (loss) | (88,924,609) | (231,533,739) |
| Change in net unrealized appreciation (depreciation) | (191,774,069) | (19,537,556) |
| Net increase (decrease) in net assets resulting from operations | (281,206,035) | (254,477,194) |
| Share transactions - net increase (decrease) | 1,271,509 | (124,744,949) |
| Redemption fees | 58,489 | 222,335 |
| Total increase (decrease) in net assets | (279,876,037) | (378,999,808) |
| Net Assets | ||
| Beginning of period | 1,121,598,512 | 1,500,598,320 |
| End of period (including accumulated net investment loss of $526,638 and accumulated net investment loss of $19,281, respectively) | $841,722,475 | $1,121,598,512 |
See accompanying notes which are an integral part of the consolidated financial statements.
Consolidated Financial Highlights — Gold Portfolio Class A
| Six months ended (Unaudited) | Years ended February 28, | |||||
| August 31, | 2015 | 2015 | 2014 | 2013 | 2012 A | 2011 |
| Selected Per–Share Data | ||||||
| Net asset value, beginning of period | $18.11 | $22.01 | $30.25 | $45.37 | $50.92 | $40.50 |
| Income from Investment Operations | ||||||
| Net investment income (loss)B | (.03) | (.10) | –C | .07 | (.13) | (.30) |
| Net realized and unrealized gain (loss) | (4.53) | (3.80) | (8.25) | (15.19) | (2.83) | 15.28 |
| Total from investment operations | (4.56) | (3.90) | (8.25) | (15.12) | (2.96) | 14.98 |
| Distributions from net realized gain | – | – | – | – | (2.59) | (4.57) |
| Redemption fees added to paid in capitalB | –C | –C | .01 | –C | –C | .01 |
| Net asset value, end of period | $13.55 | $18.11 | $22.01 | $30.25 | $45.37 | $50.92 |
| Total ReturnD,E,F | (25.18)% | (17.72)% | (27.24)% | (33.33)% | (6.24)% | 36.99% |
| Ratios to Average Net AssetsG,H | ||||||
| Expenses before reductions | 1.25%I | 1.23% | 1.21% | 1.18% | 1.14% | 1.16% |
| Expenses net of fee waivers, if any | 1.21%I | 1.19% | 1.19% | 1.17% | 1.14% | 1.15% |
| Expenses net of all reductions | 1.21%I | 1.19% | 1.18% | 1.17% | 1.14% | 1.14% |
| Net investment income (loss) | (.32)%I | (.51)% | - %J | .18% | (.28)% | (.63)% |
| Supplemental Data | ||||||
| Net assets, end of period (000 omitted) | $35,788 | $46,898 | $60,270 | $101,202 | $152,969 | $149,178 |
| Portfolio turnover rateK | 22%I | 20% | 56% | 18% | 22% | 35% |
A For the year ended February 29.
B Calculated based on average shares outstanding during the period.
C Amount represents less than $.005 per share.
D Total returns for periods of less than one year are not annualized.
E Total returns would have been lower if certain expenses had not been reduced during the applicable periods shown.
F Total returns do not include the effect of the sales charges.
G Fees and expenses of any underlying Fidelity Central Funds are not included in the Fund's expense ratio. The Fund indirectly bears its proportionate share of the expenses of any underlying Fidelity Central Funds.
H Expense ratios reflect operating expenses of the class. Expenses before reductions do not reflect amounts reimbursed by the investment adviser or reductions from brokerage service arrangements or reductions from other expense offset arrangements and do not represent the amount paid by the class during periods when reimbursements or reductions occur. Expenses net of fee waivers reflect expenses after reimbursement by the investment adviser but prior to reductions from brokerage service arrangements or other expense offset arrangements. Expenses net of all reductions represent the net expenses paid by the class.
I Annualized
J Amount represents less than .005%.
K Amount does not include the portfolio activity of any underlying Fidelity Central Funds.
See accompanying notes which are an integral part of the consolidated financial statements.
Consolidated Financial Highlights — Gold Portfolio Class T
| Six months ended (Unaudited) | Years ended February 28, | |||||
| August 31, | 2015 | 2015 | 2014 | 2013 | 2012 A | 2011 |
| Selected Per–Share Data | ||||||
| Net asset value, beginning of period | $17.83 | $21.73 | $29.95 | $45.04 | $50.68 | $40.34 |
| Income from Investment Operations | ||||||
| Net investment income (loss)B | (.05) | (.15) | (.06) | (.03) | (.27) | (.43) |
| Net realized and unrealized gain (loss) | (4.46) | (3.75) | (8.17) | (15.06) | (2.80) | 15.21 |
| Total from investment operations | (4.51) | (3.90) | (8.23) | (15.09) | (3.07) | 14.78 |
| Distributions from net realized gain | – | – | – | – | (2.57) | (4.45) |
| Redemption fees added to paid in capitalB | –C | –C | .01 | –C | –C | .01 |
| Net asset value, end of period | $13.32 | $17.83 | $21.73 | $29.95 | $45.04 | $50.68 |
| Total ReturnD,E,F | (25.29)% | (17.95)% | (27.45)% | (33.50)% | (6.49)% | 36.62% |
| Ratios to Average Net AssetsG,H | ||||||
| Expenses before reductions | 1.53%I | 1.50% | 1.49% | 1.45% | 1.43% | 1.44% |
| Expenses net of fee waivers, if any | 1.49%I | 1.46% | 1.47% | 1.44% | 1.42% | 1.42% |
| Expenses net of all reductions | 1.49%I | 1.46% | 1.46% | 1.44% | 1.42% | 1.42% |
| Net investment income (loss) | (.60)%I | (.79)% | (.28)% | (.09)% | (.57)% | (.90)% |
| Supplemental Data | ||||||
| Net assets, end of period (000 omitted) | $12,157 | $16,200 | $18,402 | $24,913 | $40,664 | $45,846 |
| Portfolio turnover rateJ | 22%I | 20% | 56% | 18% | 22% | 35% |
A For the year ended February 29.
B Calculated based on average shares outstanding during the period.
C Amount represents less than $.005 per share.
D Total returns for periods of less than one year are not annualized.
E Total returns would have been lower if certain expenses had not been reduced during the applicable periods shown.
F Total returns do not include the effect of the sales charges.
G Fees and expenses of any underlying Fidelity Central Funds are not included in the Fund's expense ratio. The Fund indirectly bears its proportionate share of the expenses of any underlying Fidelity Central Funds.
H Expense ratios reflect operating expenses of the class. Expenses before reductions do not reflect amounts reimbursed by the investment adviser or reductions from brokerage service arrangements or reductions from other expense offset arrangements and do not represent the amount paid by the class during periods when reimbursements or reductions occur. Expenses net of fee waivers reflect expenses after reimbursement by the investment adviser but prior to reductions from brokerage service arrangements or other expense offset arrangements. Expenses net of all reductions represent the net expenses paid by the class.
I Annualized
J Amount does not include the portfolio activity of any underlying Fidelity Central Funds.
See accompanying notes which are an integral part of the consolidated financial statements.
Consolidated Financial Highlights — Gold Portfolio Class B
| Six months ended (Unaudited) | Years ended February 28, | |||||
| August 31, | 2015 | 2015 | 2014 | 2013 | 2012 A | 2011 |
| Selected Per–Share Data | ||||||
| Net asset value, beginning of period | $17.27 | $21.14 | $29.27 | $44.24 | $50.02 | $39.87 |
| Income from Investment Operations | ||||||
| Net investment income (loss)B | (.08) | (.24) | (.16) | (.21) | (.49) | (.66) |
| Net realized and unrealized gain (loss) | (4.32) | (3.63) | (7.98) | (14.76) | (2.76) | 15.02 |
| Total from investment operations | (4.40) | (3.87) | (8.14) | (14.97) | (3.25) | 14.36 |
| Distributions from net realized gain | – | – | – | – | (2.53) | (4.21) |
| Redemption fees added to paid in capitalB | –C | –C | .01 | –C | –C | –C |
| Net asset value, end of period | $12.87 | $17.27 | $21.14 | $29.27 | $44.24 | $50.02 |
| Total ReturnD,E,F | (25.48)% | (18.31)% | (27.78)% | (33.84)% | (6.95)% | 35.97% |
| Ratios to Average Net AssetsG,H | ||||||
| Expenses before reductions | 2.00%I | 1.97% | 1.95% | 1.93% | 1.90% | 1.93% |
| Expenses net of fee waivers, if any | 1.96%I | 1.93% | 1.93% | 1.92% | 1.90% | 1.92% |
| Expenses net of all reductions | 1.96%I | 1.93% | 1.93% | 1.91% | 1.90% | 1.91% |
| Net investment income (loss) | (1.07)%I | (1.26)% | (.75)% | (.57)% | (1.04)% | (1.39)% |
| Supplemental Data | ||||||
| Net assets, end of period (000 omitted) | $1,397 | $2,461 | $4,373 | $9,423 | $20,894 | $26,837 |
| Portfolio turnover rateJ | 22%I | 20% | 56% | 18% | 22% | 35% |
A For the year ended February 29.
B Calculated based on average shares outstanding during the period.
C Amount represents less than $.005 per share.
D Total returns for periods of less than one year are not annualized.
E Total returns would have been lower if certain expenses had not been reduced during the applicable periods shown.
F Total returns do not include the effect of the contingent deferred sales charge.
G Fees and expenses of any underlying Fidelity Central Funds are not included in the Fund's expense ratio. The Fund indirectly bears its proportionate share of the expenses of any underlying Fidelity Central Funds.
H Expense ratios reflect operating expenses of the class. Expenses before reductions do not reflect amounts reimbursed by the investment adviser or reductions from brokerage service arrangements or reductions from other expense offset arrangements and do not represent the amount paid by the class during periods when reimbursements or reductions occur. Expenses net of fee waivers reflect expenses after reimbursement by the investment adviser but prior to reductions from brokerage service arrangements or other expense offset arrangements. Expenses net of all reductions represent the net expenses paid by the class.
I Annualized
J Amount does not include the portfolio activity of any underlying Fidelity Central Funds.
See accompanying notes which are an integral part of the consolidated financial statements.
Consolidated Financial Highlights — Gold Portfolio Class C
| Six months ended (Unaudited) | Years ended February 28, | |||||
| August 31, | 2015 | 2015 | 2014 | 2013 | 2012 A | 2011 |
| Selected Per–Share Data | ||||||
| Net asset value, beginning of period | $17.20 | $21.06 | $29.15 | $44.05 | $49.81 | $39.75 |
| Income from Investment Operations | ||||||
| Net investment income (loss)B | (.08) | (.23) | (.16) | (.20) | (.47) | (.64) |
| Net realized and unrealized gain (loss) | (4.31) | (3.63) | (7.94) | (14.70) | (2.76) | 14.98 |
| Total from investment operations | (4.39) | (3.86) | (8.10) | (14.90) | (3.23) | 14.34 |
| Distributions from net realized gain | – | – | – | – | (2.53) | (4.28) |
| Redemption fees added to paid in capitalB | –C | –C | .01 | –C | –C | –C |
| Net asset value, end of period | $12.81 | $17.20 | $21.06 | $29.15 | $44.05 | $49.81 |
| Total ReturnD,E,F | (25.52)% | (18.33)% | (27.75)% | (33.83)% | (6.93)% | 36.01% |
| Ratios to Average Net AssetsG,H | ||||||
| Expenses before reductions | 1.98%I | 1.96% | 1.96% | 1.93% | 1.87% | 1.89% |
| Expenses net of fee waivers, if any | 1.94%I | 1.92% | 1.94% | 1.92% | 1.87% | 1.88% |
| Expenses net of all reductions | 1.94%I | 1.92% | 1.93% | 1.91% | 1.87% | 1.87% |
| Net investment income (loss) | (1.06)%I | (1.25)% | (.76)% | (.57)% | (1.01)% | (1.35)% |
| Supplemental Data | ||||||
| Net assets, end of period (000 omitted) | $33,201 | $39,429 | $33,811 | $37,787 | $67,996 | $72,431 |
| Portfolio turnover rateJ | 22%I | 20% | 56% | 18% | 22% | 35% |
A For the year ended February 29.
B Calculated based on average shares outstanding during the period.
C Amount represents less than $.005 per share.
D Total returns for periods of less than one year are not annualized.
E Total returns would have been lower if certain expenses had not been reduced during the applicable periods shown.
F Total returns do not include the effect of the contingent deferred sales charge.
G Fees and expenses of any underlying Fidelity Central Funds are not included in the Fund's expense ratio. The Fund indirectly bears its proportionate share of the expenses of any underlying Fidelity Central Funds.
H Expense ratios reflect operating expenses of the class. Expenses before reductions do not reflect amounts reimbursed by the investment adviser or reductions from brokerage service arrangements or reductions from other expense offset arrangements and do not represent the amount paid by the class during periods when reimbursements or reductions occur. Expenses net of fee waivers reflect expenses after reimbursement by the investment adviser but prior to reductions from brokerage service arrangements or other expense offset arrangements. Expenses net of all reductions represent the net expenses paid by the class.
I Annualized
J Amount does not include the portfolio activity of any underlying Fidelity Central Funds.
See accompanying notes which are an integral part of the consolidated financial statements.
Consolidated Financial Highlights — Gold Portfolio
| Six months ended (Unaudited) | Years ended February 28, | |||||
| August 31, | 2015 | 2015 | 2014 | 2013 | 2012 A | 2011 |
| Selected Per–Share Data | ||||||
| Net asset value, beginning of period | $18.50 | $22.41 | $30.72 | $45.96 | $51.44 | $40.85 |
| Income from Investment Operations | ||||||
| Net investment income (loss)B | –C | (.04) | .06 | .16 | (.02) | (.18) |
| Net realized and unrealized gain (loss) | (4.65) | (3.87) | (8.38) | (15.40) | (2.85) | 15.43 |
| Total from investment operations | (4.65) | (3.91) | (8.32) | (15.24) | (2.87) | 15.25 |
| Distributions from net realized gain | – | – | – | – | (2.61) | (4.67) |
| Redemption fees added to paid in capitalB | –C | –C | .01 | –C | –C | .01 |
| Net asset value, end of period | $13.85 | $18.50 | $22.41 | $30.72 | $45.96 | $51.44 |
| Total ReturnD,E | (25.14)% | (17.45)% | (27.05)% | (33.16)% | (6.00)% | 37.35% |
| Ratios to Average Net AssetsF,G | ||||||
| Expenses before reductions | .98%H | .94% | .94% | .93% | .89% | .91% |
| Expenses net of fee waivers, if any | .93%H | .90% | .92% | .92% | .89% | .90% |
| Expenses net of all reductions | .93%H | .90% | .91% | .92% | .89% | .89% |
| Net investment income (loss) | (.05)%H | (.22)% | .27% | .43% | (.03)% | (.37)% |
| Supplemental Data | ||||||
| Net assets, end of period (000 omitted) | $740,159 | $992,944 | $1,275,913 | $2,301,019 | $3,924,440 | $4,250,249 |
| Portfolio turnover rateI | 22%H | 20% | 56% | 18% | 22% | 35% |
A For the year ended February 29.
B Calculated based on average shares outstanding during the period.
C Amount represents less than $.005 per share.
D Total returns for periods of less than one year are not annualized.
E Total returns would have been lower if certain expenses had not been reduced during the applicable periods shown.
F Fees and expenses of any underlying Fidelity Central Funds are not included in the Fund's expense ratio. The Fund indirectly bears its proportionate share of the expenses of any underlying Fidelity Central Funds.
G Expense ratios reflect operating expenses of the class. Expenses before reductions do not reflect amounts reimbursed by the investment adviser or reductions from brokerage service arrangements or reductions from other expense offset arrangements and do not represent the amount paid by the class during periods when reimbursements or reductions occur. Expenses net of fee waivers reflect expenses after reimbursement by the investment adviser but prior to reductions from brokerage service arrangements or other expense offset arrangements. Expenses net of all reductions represent the net expenses paid by the class.
H Annualized
I Amount does not include the portfolio activity of any underlying Fidelity Central Funds.
See accompanying notes which are an integral part of the consolidated financial statements.
Consolidated Financial Highlights — Gold Portfolio Class I
| Six months ended (Unaudited) | Years ended February 28, | |||||
| August 31, | 2015 | 2015 | 2014 | 2013 | 2012 A | 2011 |
| Selected Per–Share Data | ||||||
| Net asset value, beginning of period | $18.50 | $22.41 | $30.69 | $45.87 | $51.32 | $40.77 |
| Income from Investment Operations | ||||||
| Net investment income (loss)B | –C | (.04) | .07 | .20 | .02 | (.15) |
| Net realized and unrealized gain (loss) | (4.64) | (3.87) | (8.36) | (15.38) | (2.85) | 15.41 |
| Total from investment operations | (4.64) | (3.91) | (8.29) | (15.18) | (2.83) | 15.26 |
| Distributions from net realized gain | – | – | – | – | (2.62) | (4.72) |
| Redemption fees added to paid in capitalB | –C | –C | .01 | –C | –C | .01 |
| Net asset value, end of period | $13.86 | $18.50 | $22.41 | $30.69 | $45.87 | $51.32 |
| Total ReturnD,E | (25.08)% | (17.45)% | (26.98)% | (33.09)% | (5.94)% | 37.45% |
| Ratios to Average Net AssetsF,G | ||||||
| Expenses before reductions | .94%H | .90% | .87% | .84% | .82% | .85% |
| Expenses net of fee waivers, if any | .89%H | .86% | .85% | .83% | .81% | .84% |
| Expenses net of all reductions | .89%H | .86% | .84% | .82% | .81% | .83% |
| Net investment income (loss) | (.01)%H | (.18)% | .34% | .52% | .04% | (.31)% |
| Supplemental Data | ||||||
| Net assets, end of period (000 omitted) | $19,021 | $23,667 | $107,830 | $128,262 | $168,548 | $137,246 |
| Portfolio turnover rateI | 22%H | 20% | 56% | 18% | 22% | 35% |
A For the year ended February 29.
B Calculated based on average shares outstanding during the period.
C Amount represents less than $.005 per share.
D Total returns for periods of less than one year are not annualized.
E Total returns would have been lower if certain expenses had not been reduced during the applicable periods shown.
F Fees and expenses of any underlying Fidelity Central Funds are not included in the Fund's expense ratio. The Fund indirectly bears its proportionate share of the expenses of any underlying Fidelity Central Funds.
G Expense ratios reflect operating expenses of the class. Expenses before reductions do not reflect amounts reimbursed by the investment adviser or reductions from brokerage service arrangements or reductions from other expense offset arrangements and do not represent the amount paid by the class during periods when reimbursements or reductions occur. Expenses net of fee waivers reflect expenses after reimbursement by the investment adviser but prior to reductions from brokerage service arrangements or other expense offset arrangements. Expenses net of all reductions represent the net expenses paid by the class.
H Annualized
I Amount does not include the portfolio activity of any underlying Fidelity Central Funds.
See accompanying notes which are an integral part of the consolidated financial statements.
Notes to Consolidated Financial Statements (Unaudited)
For the period ended August 31, 2015
1. Organization.
Gold Portfolio (the Fund) is a non-diversified fund of Fidelity Select Portfolios (the Trust) and is authorized to issue an unlimited number of shares. The Trust is registered under the Investment Company Act of 1940, as amended (the 1940 Act), as an open-end management investment company organized as a Massachusetts business trust. The Fund invests primarily in securities of companies whose principal business activities fall within specific industries. The Fund offers Class A, Class T, Class C, Gold and Class I (formerly Institutional Class) shares, each of which, along with Class B shares, has equal rights as to assets and voting privileges. Class B shares are closed to new accounts and additional purchases, except for exchanges and reinvestments. Each class has exclusive voting rights with respect to matters that affect that class. Class B shares will automatically convert to Class A shares after a holding period of seven years from the initial date of purchase. The Fund's investments in emerging markets can be subject to social, economic, regulatory, and political uncertainties and can be extremely volatile.
2. Consolidated Subsidiary.
The Fund invests in certain commodity-related investments through Fidelity Select Gold Cayman, Ltd, a wholly owned subsidiary (the "Subsidiary"). As of August 31, 2015, the Fund held an investment of $88,827,307 in the Subsidiary, representing 10.6% of the Fund's net assets.
The financial statements have been consolidated and include accounts of the Fund and the Subsidiary. Accordingly, all inter-company transactions and balances have been eliminated.
3. Investments in Fidelity Central Funds.
The Fund invests in Fidelity Central Funds, which are open-end investment companies generally available only to other investment companies and accounts managed by the investment adviser and its affiliates. The Fund's Consolidated Schedule of Investments lists each of the Fidelity Central Funds held as of period end, if any, as an investment of the Fund, but does not include the underlying holdings of each Fidelity Central Fund. As an Investing Fund, the Fund indirectly bears its proportionate share of the expenses of the underlying Fidelity Central Funds.
The Money Market Central Funds seek preservation of capital and current income and are managed by Fidelity Investments Money Management, Inc. (FIMM), an affiliate of the investment adviser. Annualized expenses of the Money Market Central Funds as of their most recent shareholder report date are less than .01%.
A complete unaudited list of holdings for each Fidelity Central Fund is available upon request or at the Securities and Exchange Commission (the SEC) website at www.sec.gov. In addition, the financial statements of the Fidelity Central Funds are available on the SEC website or upon request.
4. Significant Accounting Policies.
The consolidated financial statements have been prepared in conformity with accounting principles generally accepted in the United States of America (GAAP), which require management to make certain estimates and assumptions at the date of the financial statements. Actual results could differ from those estimates. Subsequent events, if any, through the date that the financial statements were issued have been evaluated in the preparation of the financial statements. The following summarizes the significant accounting policies of the Fund:
Investment Valuation. Investments are valued as of 4:00 p.m. Eastern time on the last calendar day of the period. The Board of Trustees (the Board) has delegated the day to day responsibility for the valuation of the Fund's investments to the Fidelity SelectCo, LLC (SelectCo) Fair Value Committee (the Committee). In accordance with valuation policies and procedures approved by the Board, the Fund attempts to obtain prices from one or more third party pricing vendors or brokers to value its investments. When current market prices, quotations or currency exchange rates are not readily available or reliable, investments will be fair valued in good faith by the Committee, in accordance with procedures adopted by the Board. Factors used in determining fair value vary by investment type and may include market or investment specific events. The frequency with which these procedures are used cannot be predicted and they may be utilized to a significant extent. The Committee oversees the Fund's valuation policies and procedures and reports to the Board on the Committee's activities and fair value determinations. The Board monitors the appropriateness of the procedures used in valuing the Fund's investments and ratifies the fair value determinations of the Committee.
The Fund categorizes the inputs to valuation techniques used to value its investments into a disclosure hierarchy consisting of three levels as shown below:
- Level 1 – quoted prices in active markets for identical investments
- Level 2 – other significant observable inputs (including quoted prices for similar investments, interest rates, prepayment speeds, etc.)
- Level 3 – unobservable inputs (including the Fund's own assumptions based on the best information available)
Valuation techniques used to value the Fund's investments by major category are as follows:
Equity securities, including restricted securities, for which market quotations are readily available, are valued at the last reported sale price or official closing price as reported by a third party pricing vendor on the primary market or exchange on which they are traded and are categorized as Level 1 in the hierarchy. In the event there were no sales during the day or closing prices are not available, securities are valued at the last quoted bid price or may be valued using the last available price and are generally categorized as Level 2 in the hierarchy. For foreign equity securities, when market or security specific events arise, comparisons to the valuation of American Depositary Receipts (ADRs), futures contracts, Exchange-Traded Funds (ETFs) and certain indexes as well as quoted prices for similar securities may be used and would be categorized as Level 2 in the hierarchy. Utilizing these techniques may result in transfers between Level 1 and Level 2. For equity securities, including restricted securities, where observable inputs are limited, assumptions about market activity and risk are used and these securities may be categorized as Level 3 in the hierarchy.
Investments in commodities are valued at their last traded price at 4:00 p.m. Eastern time each business day and are categorized as Level 1 in the hierarchy. Investments in open-end mutual funds, including the Fidelity Central Funds, are valued at their closing net asset value (NAV) each business day and are categorized as Level 1 in the hierarchy.
Changes in valuation techniques may result in transfers in or out of an assigned level within the disclosure hierarchy. The aggregate value of investments by input level as of August 31, 2015, including information on transfers between Levels 1 and 2, is included at the end of the Fund's Consolidated Schedule of Investments.
Foreign Currency. The Fund may use foreign currency contracts to facilitate transactions in foreign-denominated securities. Gains and losses from these transactions may arise from changes in the value of the foreign currency or if the counterparties do not perform under the contracts' terms.
Foreign-denominated assets, including investment securities, and liabilities are translated into U.S. dollars at the exchange rates at period end. Purchases and sales of investment securities, income and dividends received and expenses denominated in foreign currencies are translated into U.S. dollars at the exchange rate in effect on the transaction date.
The effects of exchange rate fluctuations on investments are included with the net realized and unrealized gain (loss) on investment securities. Other foreign currency transactions resulting in realized and unrealized gain (loss) are disclosed separately.
Investment Transactions and Income. For financial reporting purposes, the Fund's investment holdings and NAV include trades executed through the end of the last business day of the period. The NAV per share for processing shareholder transactions is calculated as of the close of business of the New York Stock Exchange (NYSE), normally 4:00 p.m. Eastern time and includes trades executed through the end of the prior business day. Gains and losses on securities sold are determined on the basis of identified cost. Dividend income is recorded on the ex-dividend date, except for certain dividends from foreign securities where the ex-dividend date may have passed, which are recorded as soon as the Fund is informed of the ex-dividend date. Non-cash dividends included in dividend income, if any, are recorded at the fair market value of the securities received. Income and capital gain distributions from Fidelity Central Funds, if any, are recorded on the ex-dividend date. Distributions received on securities that represent a return of capital or capital gain are recorded as a reduction of cost of investments and/or as a realized gain. Subsequent to ex-dividend date the Fund determines the components of these distributions, based upon receipt of tax filings or other correspondence relating to the underlying investment. Investment income is recorded net of foreign taxes withheld where recovery of such taxes is uncertain.
Class Allocations and Expenses. Investment income, realized and unrealized capital gains and losses, common expenses of the Fund, and certain fund-level expense reductions, if any, are allocated daily on a pro-rata basis to each class based on the relative net assets of each class to the total net assets of the Fund. Each class differs with respect to transfer agent and distribution and service plan fees incurred. Certain expense reductions may also differ by class. For the reporting period, the allocated portion of income and expenses to each class as a percent of its average net assets may vary due to the timing of recording these transactions in relation to fluctuating net assets of the classes. Expenses directly attributable to a fund are charged to that fund. Expenses attributable to more than one fund are allocated among the respective funds on the basis of relative net assets or other appropriate methods. Expense estimates are accrued in the period to which they relate and adjustments are made when actual amounts are known.
Deferred Trustee Compensation. Under a Deferred Compensation Plan (the Plan), independent Trustees may elect to defer receipt of a portion of their annual compensation. Deferred amounts are invested in a cross-section of Fidelity funds, are marked-to-market and remain in the Fund until distributed in accordance with the Plan. The investment of deferred amounts and the offsetting payable to the Trustees are included in the accompanying Statement of Assets and Liabilities.
Income Tax Information and Distributions to Shareholders. Each year, the Fund intends to qualify as a regulated investment company under Subchapter M of the Internal Revenue Code, including distributing substantially all of its taxable income and realized gains. As a result, no provision for U.S. Federal income taxes is required. The Fund files a U.S. federal tax return, in addition to state and local tax returns as required. The Fund's federal income tax returns are subject to examination by the Internal Revenue Service (IRS) for a period of three fiscal years after they are filed. State and local tax returns may be subject to examination for an additional fiscal year depending on the jurisdiction. Foreign taxes are provided for based on the Fund's understanding of the tax rules and rates that exist in the foreign markets in which it invests.
The Subsidiary is classified as a controlled foreign corporation under Subchapter N of the Internal Revenue Code. Therefore, the Fund is required to increase its taxable income by its share of the Subsidiary's income. Net investment losses of the Subsidiary cannot be deducted by the Fund in the current period nor carried forward to offset taxable income in future periods.
Distributions are declared and recorded on the ex-dividend date. Income dividends and capital gain distributions are declared separately for each class. Income and capital gain distributions are determined in accordance with income tax regulations, which may differ from GAAP.
Capital accounts within the consolidated financial statements are adjusted for permanent book-tax differences. These adjustments have no impact on net assets or the results of operations. Capital accounts are not adjusted for temporary book-tax differences which will reverse in a subsequent period.
Book-tax differences are primarily due to foreign currency transactions, passive foreign investment companies (PFIC), controlled foreign corporation, deferred trustees compensation, net operating losses, losses deferred due to wash sales and capital loss carryforwards.
The federal tax cost of investment securities and unrealized appreciation (depreciation) as of period end on an unconsolidated basis were as follows:
| Gross unrealized appreciation | $81,771,580 |
| Gross unrealized depreciation | (746,584,444) |
| Net unrealized appreciation (depreciation) on securities | $(664,812,864) |
| Tax cost | $1,546,365,582 |
Capital loss carryforwards are only available to offset future capital gains of the Fund to the extent provided by regulations and may be limited. Under the Regulated Investment Company Modernization Act of 2010 (the Act), the Fund is permitted to carry forward capital losses incurred in taxable years beginning after December 22, 2010 for an unlimited period and such capital losses are required to be used prior to any losses that expire. The capital loss carryforward information presented below, including any applicable limitation, is estimated as of prior fiscal period end and is subject to adjustment.
| No expiration | |
| Short-term | $(134,736,786) |
| Long-term | (859,477,478) |
| Total capital loss carryforward | $(994,214,264) |
Trading (Redemption) Fees. Shares held by investors in the Fund less than 30 days may be subject to a redemption fee equal to .75% of the NAV of shares redeemed. All redemption fees, which reduce the proceeds of the shareholder redemption, are retained by the Fund and accounted for as an addition to paid in capital.
Restricted Securities. The Fund may invest in securities that are subject to legal or contractual restrictions on resale. These securities generally may be resold in transactions exempt from registration or to the public if the securities are registered. Disposal of these securities may involve time-consuming negotiations and expense, and prompt sale at an acceptable price may be difficult. Information regarding restricted securities is included at the end of the Fund's Consolidated Schedule of Investments.
5. Purchases and Sales of Investments.
Purchases and sales of securities, other than short-term securities, aggregated $120,418,024 and $108,936,305, respectively.
6. Fees and Other Transactions with Affiliates.
Management Fee. Fidelity SelectCo, LLC (the investment adviser) and its affiliates provide the Fund with investment management related services for which the Fund pays a monthly management fee. The management fee is the sum of an individual fund fee rate that is based on an annual rate of .30% of the Fund's average net assets and an annualized group fee rate that averaged .25% during the period. The group fee rate is based upon the average net assets of all the mutual funds advised by Fidelity Management & Research Company (FMR) and the investment adviser. The group fee rate decreases as assets under management increase and increases as assets under management decrease.
FMR, either through itself or through an affiliate provides investment management related services to the Subsidiary for which the Subsidiary pays a monthly management fee at the annual rate of .30% of its net assets. Under the management contract with the subsidiary, FMR pays all other expenses of the Subsidiary, except custodian fees.
For the reporting period, the total consolidated annualized management fee rate which includes the management fee of the Fund and the Subsidiary was .59% of the Fund's average net assets.
During the period, the investment adviser waived a portion of the Fund's management fee representing the amount of the management fee paid by the Subsidiary to FMR as described in the Expense Reductions note.
Distribution and Service Plan Fees. In accordance with Rule 12b-1 of the 1940 Act, the Fund has adopted separate Distribution and Service Plans for each class of shares. Certain classes pay Fidelity Distributors Corporation (FDC), an affiliate of the investment adviser, separate Distribution and Service Fees, each of which is based on an annual percentage of each class' average net assets. In addition, FDC may pay financial intermediaries for selling shares of the Fund and providing shareholder support services. For the period, the Distribution and Service Fee rates, total fees and amounts retained by FDC were as follows:
| Distribution Fee | Service Fee | Total Fees | Retained by FDC |
|
| Class A | -% | .25% | $50,570 | $95 |
| Class T | .25% | .25% | 35,568 | – |
| Class B | .75% | .25% | 9,399 | 7,049 |
| Class C | .75% | .25% | 180,168 | 49,070 |
| $275,705 | $56,214 |
Sales Load. FDC may receive a front-end sales charge of up to 5.75% for selling Class A shares and 3.50% for selling Class T shares, some of which is paid to financial intermediaries for selling shares of the Fund. Depending on the holding period, FDC may receive contingent deferred sales charges levied on Class A, Class T, Class B and Class C redemptions. The deferred sales charges range from 5.00% to 1.00% for Class B shares, 1.00% for Class C shares, 1.00% for certain purchases of Class A shares and .25% for certain purchases of Class T shares.
For the period, sales charge amounts retained by FDC were as follows:
| Retained by FDC |
|
| Class A | $12,199 |
| Class T | 4,395 |
| Class B* | 977 |
| Class C* | 1,705 |
| $19,276 |
* When Class B and Class C shares are initially sold, FDC pays commissions from its own resources to financial intermediaries through which the sales are made.
Transfer Agent Fees. Fidelity Investments Institutional Operations Company, Inc., (FIIOC), an affiliate of the investment adviser, is the transfer, dividend disbursing and shareholder servicing agent for each class of the Fund. FIIOC receives account fees and asset-based fees that vary according to the account size and type of account of the shareholders of the respective classes of the Fund. FIIOC pays for typesetting, printing and mailing of shareholder reports, except proxy statements.
For the period, transfer agent fees for each class were as follows:
| Amount | % of Class-Level Average Net Assets* |
|
| Class A | $61,519 | .30 |
| Class T | 23,694 | .33 |
| Class B | 2,834 | .30 |
| Class C | 51,971 | .29 |
| Gold | 1,208,630 | .28 |
| Class I | 29,496 | .25 |
| $1,378,144 |
*Annualized
Accounting and Security Lending Fees. Fidelity Service Company, Inc. (FSC), an affiliate of the investment adviser, maintains the Fund's accounting records. The accounting fee is based on the level of average net assets for each month. Under a separate contract, FSC administers the security lending program. The security lending fee is based on the number and duration of lending transactions.
Brokerage Commissions. The Fund placed a portion of its portfolio transactions with brokerage firms which are affiliates of the investment adviser. Brokerage commissions are included in net realized gain (loss) and change in net unrealized appreciation (depreciation) in the Consolidated Statement of Operations. The commissions paid to these affiliated firms were $3,255 for the period.
7. Committed Line of Credit.
The Fund participates with other funds managed by the investment adviser or an affiliate in a $4.25 billion credit facility (the "line of credit") to be utilized for temporary or emergency purposes to fund shareholder redemptions or for other short-term liquidity purposes. The Fund has agreed to pay commitment fees on its pro-rata portion of the line of credit, which amounted to $728 and is reflected in Miscellaneous expenses on the Consolidated Statement of Operations. During the period, the Fund did not borrow on this line of credit.
8. Security Lending.
The Fund lends portfolio securities through a lending agent from time to time in order to earn additional income. On the settlement date of the loan, the Fund receives collateral (in the form of U.S. Treasury obligations, letters of credit and/or cash) against the loaned securities and maintains collateral in an amount not less than 100% of the market value of the loaned securities during the period of the loan. The market value of the loaned securities is determined at the close of business of the Fund and any additional required collateral is delivered to the Fund on the next business day. If the borrower defaults on its obligation to return the securities loaned because of insolvency or other reasons, the Fund may apply collateral received from the borrower against the obligation. The Fund may experience delays and costs in recovering the securities loaned. Any cash collateral received is invested in the Fidelity Securities Lending Cash Central Fund. The value of loaned securities and cash collateral at period end are disclosed on the Fund's Consolidated Statement of Assets and Liabilities. Security lending income represents the income earned on investing cash collateral, less rebates paid to borrowers and any lending agent fees associated with the loan, plus any premium payments received for lending certain types of securities. Security lending income is presented in the Consolidated Statement of Operations as a component of income from Fidelity Central Funds. Total security lending income during the period amounted to $122,985.
9. Expense Reductions.
The investment adviser has contractually agreed to waive the Fund's management fee in an amount equal to the management fee paid by the Subsidiary to FMR. During the period, this waiver reduced the Fund's management fee by $179,299.
Commissions paid to certain brokers with whom the investment adviser, or its affiliates, places trades on behalf of the Fund include an amount in addition to trade execution, which may be rebated back to the Fund to offset certain expenses. This amount totaled $11,629 for the period.
In addition, during the period the investment adviser reimbursed and/or waived a portion of fund-level operating expenses in the amount of $4,008 and a portion of class-level operating expenses as follows:
| Amount | |
| Class A | $100 |
| Class T | 28 |
| Class B | 4 |
| Class C | 395 |
| Gold | 23,242 |
| Class I | 1,473 |
| $25,242 |
10. Share Transactions.
Share transactions for each class were as follows and may contain automatic conversions between classes or exchanges between funds:
| Shares | Shares | Dollars | Dollars | |
| Six months ended August 31, 2015 | Year ended February 28, 2015 | Six months ended August 31, 2015 | Year ended February 28, 2015 | |
| Class A | ||||
| Shares sold | 518,834 | 1,014,651 | $8,025,425 | $20,366,842 |
| Shares redeemed | (465,693) | (1,163,476) | (7,275,162) | (22,763,258) |
| Net increase (decrease) | 53,141 | (148,825) | $750,263 | $(2,396,416) |
| Class T | ||||
| Shares sold | 136,765 | 317,888 | $2,107,964 | $6,202,712 |
| Shares redeemed | (132,218) | (256,267) | (2,013,307) | (4,926,125) |
| Net increase (decrease) | 4,547 | 61,621 | $94,657 | $1,276,587 |
| Class B | ||||
| Shares sold | 4,058 | 6,743 | $57,181 | $129,320 |
| Shares redeemed | (37,931) | (71,044) | (574,395) | (1,326,720) |
| Net increase (decrease) | (33,873) | (64,301) | $(517,214) | $(1,197,400) |
| Class C | ||||
| Shares sold | 508,709 | 1,131,151 | $7,441,929 | $21,162,781 |
| Shares redeemed | (210,167) | (444,470) | (3,005,672) | (8,210,673) |
| Net increase (decrease) | 298,542 | 686,681 | $4,436,257 | $12,952,108 |
| Gold | ||||
| Shares sold | 8,910,056 | 22,066,731 | $139,098,070 | $446,680,830 |
| Shares redeemed | (9,151,440) | (25,311,740) | (145,489,035) | (508,417,315) |
| Net increase (decrease) | (241,384) | (3,245,009) | $(6,390,965) | $(61,736,485) |
| Class I | ||||
| Shares sold | 846,060 | 1,547,691 | $14,167,660 | $33,198,070 |
| Shares redeemed | (752,517) | (5,080,368) | (11,269,149) | (106,841,413) |
| Net increase (decrease) | 93,543 | (3,532,677) | $2,898,511 | $(73,643,343) |
11. Other.
The Fund's organizational documents provide former and current trustees and officers with a limited indemnification against liabilities arising in connection with the performance of their duties to the Fund. In the normal course of business, the Fund may also enter into contracts that provide general indemnifications. The Fund's maximum exposure under these arrangements is unknown as this would be dependent on future claims that may be made against the Fund. The risk of material loss from such claims is considered remote.
Materials Portfolio
Investment Summary (Unaudited)
Top Ten Stocks as of August 31, 2015
| % of fund's net assets | % of fund's net assets 6 months ago | |
| Monsanto Co. | 9.6 | 8.5 |
| E.I. du Pont de Nemours & Co. | 9.4 | 11.4 |
| WestRock Co. | 9.2 | 5.5 |
| Eastman Chemical Co. | 8.0 | 5.3 |
| LyondellBasell Industries NV Class A | 7.2 | 4.7 |
| Ecolab, Inc. | 6.4 | 5.3 |
| PPG Industries, Inc. | 4.9 | 0.0 |
| Eagle Materials, Inc. | 4.6 | 3.1 |
| Graphic Packaging Holding Co. | 3.8 | 2.5 |
| CF Industries Holdings, Inc. | 3.4 | 3.4 |
| 66.5 |
Top Industries (% of fund's net assets)
| As of August 31, 2015 | ||
| Chemicals | 63.5% | |
| Containers & Packaging | 21.6% | |
| Metals & Mining | 5.2% | |
| Construction Materials | 4.6% | |
| Paper & Forest Products | 1.5% | |
| All Others* | 3.6% | |

| As of February 28, 2015 | ||
| Chemicals | 70.0% | |
| Containers & Packaging | 16.6% | |
| Metals & Mining | 6.7% | |
| Construction Materials | 3.1% | |
| Paper & Forest Products | 1.7% | |
| All Others* | 1.9% | |

* Includes short-term investments and net other assets (liabilities).
Percentages shown as 0.0% may reflect amounts less than 0.05%.
Materials Portfolio
Investments August 31, 2015 (Unaudited)
Showing Percentage of Net Assets
| Common Stocks - 97.7% | |||
| Shares | Value | ||
| Chemicals - 63.5% | |||
| Commodity Chemicals - 8.2% | |||
| LyondellBasell Industries NV Class A | 1,421,396 | $121,358,790 | |
| Orion Engineered Carbons SA | 987,291 | 16,191,572 | |
| 137,550,362 | |||
| Diversified Chemicals - 17.4% | |||
| E.I. du Pont de Nemours & Co. | 3,037,700 | 156,441,550 | |
| Eastman Chemical Co. | 1,857,730 | 134,611,116 | |
| 291,052,666 | |||
| Fertilizers & Agricultural Chemicals - 14.5% | |||
| Agrium, Inc. | 235,300 | 24,433,211 | |
| CF Industries Holdings, Inc. | 1,004,710 | 57,650,260 | |
| Monsanto Co. | 1,644,830 | 160,617,649 | |
| 242,701,120 | |||
| Specialty Chemicals - 23.4% | |||
| Albemarle Corp. U.S. | 634,700 | 28,694,787 | |
| Ashland, Inc. | 473,600 | 49,713,792 | |
| Ecolab, Inc. | 988,320 | 107,865,245 | |
| Frutarom Industries Ltd. | 192,796 | 7,320,092 | |
| NewMarket Corp. | 73,229 | 28,064,282 | |
| PPG Industries, Inc. | 864,500 | 82,378,205 | |
| Valspar Corp. | 447,600 | 32,809,080 | |
| W.R. Grace & Co. (a) | 554,340 | 54,846,400 | |
| 391,691,883 | |||
| TOTAL CHEMICALS | 1,062,996,031 | ||
| Construction Materials - 4.6% | |||
| Construction Materials - 4.6% | |||
| Eagle Materials, Inc. | 945,655 | 77,382,949 | |
| Containers & Packaging - 21.6% | |||
| Metal & Glass Containers - 4.2% | |||
| Ball Corp. | 747,683 | 49,279,787 | |
| Owens-Illinois, Inc. (a) | 995,900 | 20,764,515 | |
| 70,044,302 | |||
| Paper Packaging - 17.4% | |||
| Graphic Packaging Holding Co. | 4,485,495 | 63,245,480 | |
| Packaging Corp. of America | 477,700 | 32,058,447 | |
| Sealed Air Corp. | 819,000 | 42,137,550 | |
| WestRock Co. | 2,585,119 | 153,426,813 | |
| 290,868,290 | |||
| TOTAL CONTAINERS & PACKAGING | 360,912,592 | ||
| Energy Equipment & Services - 0.3% | |||
| Oil & Gas Equipment & Services - 0.3% | |||
| Aspen Aerogels, Inc. (a) | 730,304 | 5,455,371 | |
| Metals & Mining - 5.2% | |||
| Steel - 5.2% | |||
| Nucor Corp. | 763,000 | 33,030,270 | |
| Steel Dynamics, Inc. | 2,789,000 | 54,329,720 | |
| 87,359,990 | |||
| Paper & Forest Products - 1.5% | |||
| Paper Products - 1.5% | |||
| Domtar Corp. | 614,400 | 24,705,024 | |
| Trading Companies & Distributors - 1.0% | |||
| Trading Companies & Distributors - 1.0% | |||
| Wolseley PLC | 265,676 | 17,151,090 | |
| TOTAL COMMON STOCKS | |||
| (Cost $1,466,459,195) | 1,635,963,047 | ||
| Money Market Funds - 1.7% | |||
| Fidelity Cash Central Fund, 0.15% (b) | 29,154,794 | 29,154,794 | |
| Fidelity Securities Lending Cash Central Fund, 0.19% (b)(c) | 12,705 | 12,705 | |
| TOTAL MONEY MARKET FUNDS | |||
| (Cost $29,167,499) | 29,167,499 | ||
| TOTAL INVESTMENT PORTFOLIO - 99.4% | |||
| (Cost $1,495,626,694) | 1,665,130,546 | ||
| NET OTHER ASSETS (LIABILITIES) - 0.6% | 9,372,241 | ||
| NET ASSETS - 100% | $1,674,502,787 |
Legend
(a) Non-income producing
(b) Affiliated fund that is generally available only to investment companies and other accounts managed by Fidelity Investments. The rate quoted is the annualized seven-day yield of the fund at period end. A complete unaudited listing of the fund's holdings as of its most recent quarter end is available upon request. In addition, each Fidelity Central Fund's financial statements are available on the SEC's website or upon request.
(c) Investment made with cash collateral received from securities on loan.
Affiliated Central Funds
Information regarding fiscal year to date income earned by the Fund from investments in Fidelity Central Funds is as follows:
| Fund | Income earned |
| Fidelity Cash Central Fund | $16,804 |
| Fidelity Securities Lending Cash Central Fund | 47,166 |
| Total | $63,970 |
Other Affiliated Issuers
An affiliated company is a company in which the Fund has ownership of at least 5% of the voting securities. Fiscal year to date transactions with companies which are or were affiliates are as follows:
| Affiliate | Value, beginning of period | Purchases | Sales Proceeds | Dividend Income | Value, end of period |
| Aspen Aerogels, Inc. | $10,127,522 | $-- | $3,743,092 | $-- | $-- |
| Total | $10,127,522 | $-- | $3,743,092 | $-- | $-- |
Investment Valuation
All investments are categorized as Level 1 under the Fair Value Hierarchy. The inputs or methodology used for valuing securities may not be an indication of the risk associated with investing in those securities. For more information on valuation inputs please refer to the Investment Valuation section in the accompanying Notes to Financial Statements.
Other Information
Distribution of investments by country or territory of incorporation, as a percentage of Total Net Assets, is as follows (Unaudited):
| United States of America | 88.9% |
| Netherlands | 7.2% |
| Canada | 1.5% |
| Bailiwick of Jersey | 1.0% |
| Luxembourg | 1.0% |
| Others (Individually Less Than 1%) | 0.4% |
| 100.0% |
See accompanying notes which are an integral part of the financial statements.
Materials Portfolio
Financial Statements
Statement of Assets and Liabilities
| August 31, 2015 (Unaudited) | ||
| Assets | ||
| Investment in securities, at value (including securities loaned of $12,140) — See accompanying schedule: Unaffiliated issuers (cost $1,466,459,195) | $1,635,963,047 | |
| Fidelity Central Funds (cost $29,167,499) | 29,167,499 | |
| Total Investments (cost $1,495,626,694) | $1,665,130,546 | |
| Receivable for investments sold | 13,287,975 | |
| Receivable for fund shares sold | 2,167,025 | |
| Dividends receivable | 3,035,995 | |
| Distributions receivable from Fidelity Central Funds | 6,502 | |
| Prepaid expenses | 13,140 | |
| Other receivables | 55,775 | |
| Total assets | 1,683,696,958 | |
| Liabilities | ||
| Payable for investments purchased | $2,755,247 | |
| Payable for fund shares redeemed | 5,040,926 | |
| Accrued management fee | 797,510 | |
| Distribution and service plan fees payable | 153,565 | |
| Other affiliated payables | 361,122 | |
| Other payables and accrued expenses | 73,096 | |
| Collateral on securities loaned, at value | 12,705 | |
| Total liabilities | 9,194,171 | |
| Net Assets | $1,674,502,787 | |
| Net Assets consist of: | ||
| Paid in capital | $1,472,594,709 | |
| Undistributed net investment income | 10,812,476 | |
| Accumulated undistributed net realized gain (loss) on investments and foreign currency transactions | 21,597,795 | |
| Net unrealized appreciation (depreciation) on investments and assets and liabilities in foreign currencies | 169,497,807 | |
| Net Assets | $1,674,502,787 | |
| Calculation of Maximum Offering Price | ||
| Class A: | ||
| Net Asset Value and redemption price per share ($266,036,916 ÷ 3,727,290 shares) | $71.38 | |
| Maximum offering price per share (100/94.25 of $71.38) | $75.73 | |
| Class T: | ||
| Net Asset Value and redemption price per share ($36,405,782 ÷ 513,954 shares) | $70.83 | |
| Maximum offering price per share (100/96.50 of $70.83) | $73.40 | |
| Class B: | ||
| Net Asset Value and offering price per share ($4,335,467 ÷ 62,647 shares)(a) | $69.20 | |
| Class C: | ||
| Net Asset Value and offering price per share ($87,674,791 ÷ 1,269,500 shares)(a) | $69.06 | |
| Materials: | ||
| Net Asset Value, offering price and redemption price per share ($870,836,054 ÷ 12,133,503 shares) | $71.77 | |
| Class I: | ||
| Net Asset Value, offering price and redemption price per share ($409,213,777 ÷ 5,713,013 shares) | $71.63 |
(a) Redemption price per share is equal to net asset value less any applicable contingent deferred sales charge.
See accompanying notes which are an integral part of the financial statements.
Statement of Operations
| Six months ended August 31, 2015 (Unaudited) | ||
| Investment Income | ||
| Dividends | $19,405,914 | |
| Interest | 16 | |
| Income from Fidelity Central Funds | 63,970 | |
| Total income | 19,469,900 | |
| Expenses | ||
| Management fee | $5,244,790 | |
| Transfer agent fees | 1,987,249 | |
| Distribution and service plan fees | 1,010,334 | |
| Accounting and security lending fees | 293,390 | |
| Custodian fees and expenses | 14,041 | |
| Independent trustees' compensation | 16,663 | |
| Registration fees | 93,949 | |
| Audit | 26,997 | |
| Legal | 12,507 | |
| Miscellaneous | 14,580 | |
| Total expenses before reductions | 8,714,500 | |
| Expense reductions | (90,142) | 8,624,358 |
| Net investment income (loss) | 10,845,542 | |
| Realized and Unrealized Gain (Loss)
Net realized gain (loss) on: | ||
| Investment securities: | ||
| Unaffiliated issuers | 38,934,697 | |
| Other affiliated issuers | (16,224) | |
| Foreign currency transactions | (97,265) | |
| Total net realized gain (loss) | 38,821,208 | |
| Change in net unrealized appreciation (depreciation) on: Investment securities | (267,797,224) | |
| Assets and liabilities in foreign currencies | (6,045) | |
| Total change in net unrealized appreciation (depreciation) | (267,803,269) | |
| Net gain (loss) | (228,982,061) | |
| Net increase (decrease) in net assets resulting from operations | $(218,136,519) |
See accompanying notes which are an integral part of the financial statements.
Statement of Changes in Net Assets
| Six months ended August 31, 2015 (Unaudited) | Year ended February 28, 2015 | |
| Increase (Decrease) in Net Assets | ||
| Operations | ||
| Net investment income (loss) | $10,845,542 | $16,415,183 |
| Net realized gain (loss) | 38,821,208 | 140,995,843 |
| Change in net unrealized appreciation (depreciation) | (267,803,269) | (115,351,730) |
| Net increase (decrease) in net assets resulting from operations | (218,136,519) | 42,059,296 |
| Distributions to shareholders from net investment income | – | (14,132,791) |
| Distributions to shareholders from net realized gain | (906,398) | (176,045,519) |
| Total distributions | (906,398) | (190,178,310) |
| Share transactions - net increase (decrease) | (161,718,782) | 139,840,860 |
| Redemption fees | 28,645 | 59,111 |
| Total increase (decrease) in net assets | (380,733,054) | (8,219,043) |
| Net Assets | ||
| Beginning of period | 2,055,235,841 | 2,063,454,884 |
| End of period (including undistributed net investment income of $10,812,476 and distributions in excess of net investment income of $33,066, respectively) | $1,674,502,787 | $2,055,235,841 |
See accompanying notes which are an integral part of the financial statements.
Financial Highlights — Materials Portfolio Class A
| Six months ended (Unaudited) | Years ended February 28, | |||||
| August 31, | 2015 | 2015 | 2014 | 2013 | 2012 A | 2011 |
| Selected Per–Share Data | ||||||
| Net asset value, beginning of period | $80.43 | $86.46 | $73.44 | $69.23 | $69.96 | $52.54 |
| Income from Investment Operations | ||||||
| Net investment income (loss)B | .38 | .51 | .36 | .70 | .40 | 1.08C |
| Net realized and unrealized gain (loss) | (9.39) | 1.05 | 14.56 | 5.69 | (.35) | 17.40 |
| Total from investment operations | (9.01) | 1.56 | 14.92 | 6.39 | .05 | 18.48 |
| Distributions from net investment income | – | (.43) | (.30) | (.63) | (.40) | (1.06) |
| Distributions from net realized gain | (.04) | (7.17) | (1.60) | (1.55) | (.38) | (.01) |
| Total distributions | (.04) | (7.59)D | (1.90) | (2.18) | (.78) | (1.07) |
| Redemption fees added to paid in capitalB | –E | –E | –E | –E | –E | .01 |
| Net asset value, end of period | $71.38 | $80.43 | $86.46 | $73.44 | $69.23 | $69.96 |
| Total ReturnF,G,H | (11.21)% | 2.20% | 20.46% | 9.40% | .21% | 35.33% |
| Ratios to Average Net AssetsI,J | ||||||
| Expenses before reductions | 1.06%K | 1.06% | 1.10% | 1.13% | 1.13% | 1.16% |
| Expenses net of fee waivers, if any | 1.06%K | 1.06% | 1.10% | 1.13% | 1.13% | 1.16% |
| Expenses net of all reductions | 1.05%K | 1.06% | 1.09% | 1.12% | 1.13% | 1.15% |
| Net investment income (loss) | .98%K | .61% | .45% | 1.02% | .61% | 1.81%C |
| Supplemental Data | ||||||
| Net assets, end of period (000 omitted) | $266,037 | $319,740 | $336,777 | $219,627 | $157,781 | $124,160 |
| Portfolio turnover rateL | 70%K | 76%M | 53% | 61% | 94% | 87% |
A For the year ended February 29.
B Calculated based on average shares outstanding during the period.
C Investment income per share reflects a large, non-recurring dividend which amounted to $.83 per share. Excluding this non-recurring dividend, the ratio of net investment income (loss) to average net assets would have been .41%.
D Total distributions of $7.59 per share is comprised of distributions from net investment income of $.425 and distributions from net realized gain of $7.167 per share.
E Amount represents less than $.005 per share.
F Total returns for periods of less than one year are not annualized.
G Total returns would have been lower if certain expenses had not been reduced during the applicable periods shown.
H Total returns do not include the effect of the sales charges.
I Fees and expenses of any underlying Fidelity Central Funds are not included in the Fund's expense ratio. The Fund indirectly bears its proportionate share of the expenses of any underlying Fidelity Central Funds.
J Expense ratios reflect operating expenses of the class. Expenses before reductions do not reflect amounts reimbursed by the investment adviser or reductions from brokerage service arrangements or reductions from other expense offset arrangements and do not represent the amount paid by the class during periods when reimbursements or reductions occur. Expenses net of fee waivers reflect expenses after reimbursement by the investment adviser but prior to reductions from brokerage service arrangements or other expense offset arrangements. Expenses net of all reductions represent the net expenses paid by the class.
K Annualized
L Amount does not include the portfolio activity of any underlying Fidelity Central Funds.
M Portfolio turnover rate excludes securities received or delivered in-kind.
See accompanying notes which are an integral part of the financial statements.
Financial Highlights — Materials Portfolio Class T
| Six months ended (Unaudited) | Years ended February 28, | |||||
| August 31, | 2015 | 2015 | 2014 | 2013 | 2012 A | 2011 |
| Selected Per–Share Data | ||||||
| Net asset value, beginning of period | $79.95 | $85.99 | $73.05 | $68.91 | $69.68 | $52.35 |
| Income from Investment Operations | ||||||
| Net investment income (loss)B | .26 | .25 | .12 | .50 | .21 | .90C |
| Net realized and unrealized gain (loss) | (9.34) | 1.06 | 14.48 | 5.66 | (.35) | 17.34 |
| Total from investment operations | (9.08) | 1.31 | 14.60 | 6.16 | (.14) | 18.24 |
| Distributions from net investment income | – | (.18) | (.06) | (.46) | (.25) | (.92) |
| Distributions from net realized gain | (.04) | (7.17) | (1.60) | (1.55) | (.38) | – |
| Total distributions | (.04) | (7.35) | (1.66) | (2.02)D | (.63) | (.92) |
| Redemption fees added to paid in capitalB | –E | –E | –E | –E | –E | .01 |
| Net asset value, end of period | $70.83 | $79.95 | $85.99 | $73.05 | $68.91 | $69.68 |
| Total ReturnF,G,H | (11.37)% | 1.90% | 20.10% | 9.10% | (.09)% | 34.98% |
| Ratios to Average Net AssetsI,J | ||||||
| Expenses before reductions | 1.37%K | 1.37% | 1.40% | 1.42% | 1.42% | 1.44% |
| Expenses net of fee waivers, if any | 1.37%K | 1.37% | 1.40% | 1.42% | 1.42% | 1.44% |
| Expenses net of all reductions | 1.36%K | 1.37% | 1.39% | 1.41% | 1.41% | 1.43% |
| Net investment income (loss) | .67%K | .31% | .15% | .73% | .33% | 1.54%C |
| Supplemental Data | ||||||
| Net assets, end of period (000 omitted) | $36,406 | $45,252 | $45,223 | $37,860 | $28,290 | $25,570 |
| Portfolio turnover rateL | 70%K | 76%M | 53% | 61% | 94% | 87% |
A For the year ended February 29.
B Calculated based on average shares outstanding during the period.
C Investment income per share reflects a large, non-recurring dividend which amounted to $.83 per share. Excluding this non-recurring dividend, the ratio of net investment income (loss) to average net assets would have been .14%.
D Total distributions of $2.02 per share is comprised of distributions from net investment income of $.463 and distributions from net realized gain of $1.552 per share.
E Amount represents less than $.005 per share.
F Total returns for periods of less than one year are not annualized.
G Total returns would have been lower if certain expenses had not been reduced during the applicable periods shown.
H Total returns do not include the effect of the sales charges.
I Fees and expenses of any underlying Fidelity Central Funds are not included in the Fund's expense ratio. The Fund indirectly bears its proportionate share of the expenses of any underlying Fidelity Central Funds.
J Expense ratios reflect operating expenses of the class. Expenses before reductions do not reflect amounts reimbursed by the investment adviser or reductions from brokerage service arrangements or reductions from other expense offset arrangements and do not represent the amount paid by the class during periods when reimbursements or reductions occur. Expenses net of fee waivers reflect expenses after reimbursement by the investment adviser but prior to reductions from brokerage service arrangements or other expense offset arrangements. Expenses net of all reductions represent the net expenses paid by the class.
K Annualized
L Amount does not include the portfolio activity of any underlying Fidelity Central Funds.
M Portfolio turnover rate excludes securities received or delivered in-kind.
See accompanying notes which are an integral part of the financial statements.
Financial Highlights — Materials Portfolio Class B
| Six months ended (Unaudited) | Years ended February 28, | |||||
| August 31, | 2015 | 2015 | 2014 | 2013 | 2012 A | 2011 |
| Selected Per–Share Data | ||||||
| Net asset value, beginning of period | $78.31 | $84.63 | $72.21 | $68.13 | $68.95 | $51.86 |
| Income from Investment Operations | ||||||
| Net investment income (loss)B | .06 | (.18) | (.28) | .16 | (.11) | .60C |
| Net realized and unrealized gain (loss) | (9.13) | 1.03 | 14.28 | 5.57 | (.33) | 17.13 |
| Total from investment operations | (9.07) | .85 | 14.00 | 5.73 | (.44) | 17.73 |
| Distributions from net investment income | – | – | – | (.10) | – | (.65) |
| Distributions from net realized gain | (.04) | (7.17) | (1.58) | (1.55) | (.38) | – |
| Total distributions | (.04) | (7.17) | (1.58) | (1.65) | (.38) | (.65) |
| Redemption fees added to paid in capitalB | –D | –D | –D | –D | –D | .01 |
| Net asset value, end of period | $69.20 | $78.31 | $84.63 | $72.21 | $68.13 | $68.95 |
| Total ReturnE,F,G | (11.59)% | 1.35% | 19.50% | 8.55% | (.57)% | 34.29% |
| Ratios to Average Net AssetsH,I | ||||||
| Expenses before reductions | 1.88%J | 1.89% | 1.90% | 1.92% | 1.91% | 1.93% |
| Expenses net of fee waivers, if any | 1.88%J | 1.89% | 1.90% | 1.92% | 1.91% | 1.93% |
| Expenses net of all reductions | 1.88%J | 1.89% | 1.90% | 1.91% | 1.91% | 1.92% |
| Net investment income (loss) | .16%J | (.22)% | (.36)% | .24% | (.17)% | 1.04%C |
| Supplemental Data | ||||||
| Net assets, end of period (000 omitted) | $4,335 | $6,487 | $8,671 | $10,218 | $11,040 | $13,507 |
| Portfolio turnover rateK | 70%J | 76%L | 53% | 61% | 94% | 87% |
A For the year ended February 29.
B Calculated based on average shares outstanding during the period.
C Investment income per share reflects a large, non-recurring dividend which amounted to $.83 per share. Excluding this non-recurring dividend, the ratio of net investment income (loss) to average net assets would have been (.35) %.
D Amount represents less than $.005 per share.
E Total returns for periods of less than one year are not annualized.
F Total returns would have been lower if certain expenses had not been reduced during the applicable periods shown.
G Total returns do not include the effect of the contingent deferred sales charge.
H Fees and expenses of any underlying Fidelity Central Funds are not included in the Fund's expense ratio. The Fund indirectly bears its proportionate share of the expenses of any underlying Fidelity Central Funds.
I Expense ratios reflect operating expenses of the class. Expenses before reductions do not reflect amounts reimbursed by the investment adviser or reductions from brokerage service arrangements or reductions from other expense offset arrangements and do not represent the amount paid by the class during periods when reimbursements or reductions occur. Expenses net of fee waivers reflect expenses after reimbursement by the investment adviser but prior to reductions from brokerage service arrangements or other expense offset arrangements. Expenses net of all reductions represent the net expenses paid by the class.
J Annualized
K Amount does not include the portfolio activity of any underlying Fidelity Central Funds.
L Portfolio turnover rate excludes securities received or delivered in-kind.
See accompanying notes which are an integral part of the financial statements.
Financial Highlights — Materials Portfolio Class C
| Six months ended (Unaudited) | Years ended February 28, | |||||
| August 31, | 2015 | 2015 | 2014 | 2013 | 2012 A | 2011 |
| Selected Per–Share Data | ||||||
| Net asset value, beginning of period | $78.12 | $84.38 | $71.96 | $67.98 | $68.78 | $51.79 |
| Income from Investment Operations | ||||||
| Net investment income (loss)B | .09 | (.12) | (.23) | .18 | (.10) | .61C |
| Net realized and unrealized gain (loss) | (9.11) | 1.03 | 14.23 | 5.55 | (.32) | 17.09 |
| Total from investment operations | (9.02) | .91 | 14.00 | 5.73 | (.42) | 17.70 |
| Distributions from net investment income | – | – | – | (.20) | – | (.72) |
| Distributions from net realized gain | (.04) | (7.17) | (1.58) | (1.55) | (.38) | – |
| Total distributions | (.04) | (7.17) | (1.58) | (1.75) | (.38) | (.72) |
| Redemption fees added to paid in capitalB | –D | –D | –D | –D | –D | .01 |
| Net asset value, end of period | $69.06 | $78.12 | $84.38 | $71.96 | $67.98 | $68.78 |
| Total ReturnE,F,G | (11.56)% | 1.43% | 19.56% | 8.58% | (.55)% | 34.29% |
| Ratios to Average Net AssetsH,I | ||||||
| Expenses before reductions | 1.82%J | 1.82% | 1.85% | 1.89% | 1.89% | 1.93% |
| Expenses net of fee waivers, if any | 1.81%J | 1.82% | 1.85% | 1.89% | 1.89% | 1.93% |
| Expenses net of all reductions | 1.81%J | 1.82% | 1.84% | 1.88% | 1.89% | 1.92% |
| Net investment income (loss) | .23%J | (.14)% | (.30)% | .26% | (.15)% | 1.04%C |
| Supplemental Data | ||||||
| Net assets, end of period (000 omitted) | $87,675 | $107,697 | $106,879 | $75,007 | $58,296 | $46,525 |
| Portfolio turnover rateK | 70%J | 76%L | 53% | 61% | 94% | 87% |
A For the year ended February 29.
B Calculated based on average shares outstanding during the period.
C Investment income per share reflects a large, non-recurring dividend which amounted to $.83 per share. Excluding this non-recurring dividend, the ratio of net investment income (loss) to average net assets would have been (.35) %.
D Amount represents less than $.005 per share.
E Total returns for periods of less than one year are not annualized.
F Total returns would have been lower if certain expenses had not been reduced during the applicable periods shown.
G Total returns do not include the effect of the contingent deferred sales charge.
H Fees and expenses of any underlying Fidelity Central Funds are not included in the Fund's expense ratio. The Fund indirectly bears its proportionate share of the expenses of any underlying Fidelity Central Funds.
I Expense ratios reflect operating expenses of the class. Expenses before reductions do not reflect amounts reimbursed by the investment adviser or reductions from brokerage service arrangements or reductions from other expense offset arrangements and do not represent the amount paid by the class during periods when reimbursements or reductions occur. Expenses net of fee waivers reflect expenses after reimbursement by the investment adviser but prior to reductions from brokerage service arrangements or other expense offset arrangements. Expenses net of all reductions represent the net expenses paid by the class.
J Annualized
K Amount does not include the portfolio activity of any underlying Fidelity Central Funds.
L Portfolio turnover rate excludes securities received or delivered in-kind.
See accompanying notes which are an integral part of the financial statements.
Financial Highlights — Materials Portfolio
| Six months ended (Unaudited) | Years ended February 28, | |||||
| August 31, | 2015 | 2015 | 2014 | 2013 | 2012 A | 2011 |
| Selected Per–Share Data | ||||||
| Net asset value, beginning of period | $80.77 | $86.81 | $73.68 | $69.41 | $70.11 | $52.61 |
| Income from Investment Operations | ||||||
| Net investment income (loss)B | .48 | .73 | .58 | .90 | .60 | 1.25C |
| Net realized and unrealized gain (loss) | (9.44) | 1.05 | 14.63 | 5.71 | (.37) | 17.43 |
| Total from investment operations | (8.96) | 1.78 | 15.21 | 6.61 | .23 | 18.68 |
| Distributions from net investment income | – | (.65) | (.48) | (.79) | (.55) | (1.16) |
| Distributions from net realized gain | (.04) | (7.17) | (1.60) | (1.55) | (.38) | (.03) |
| Total distributions | (.04) | (7.82) | (2.08) | (2.34) | (.93) | (1.19) |
| Redemption fees added to paid in capitalB | –D | –D | –D | –D | –D | .01 |
| Net asset value, end of period | $71.77 | $80.77 | $86.81 | $73.68 | $69.41 | $70.11 |
| Total ReturnE,F | (11.10)% | 2.46% | 20.80% | 9.71% | .49% | 35.70% |
| Ratios to Average Net AssetsG,H | ||||||
| Expenses before reductions | .81%I | .80% | .82% | .85% | .85% | .88% |
| Expenses net of fee waivers, if any | .80%I | .80% | .82% | .85% | .85% | .88% |
| Expenses net of all reductions | .80%I | .80% | .82% | .84% | .84% | .87% |
| Net investment income (loss) | 1.24%I | .87% | .73% | 1.30% | .90% | 2.10%C |
| Supplemental Data | ||||||
| Net assets, end of period (000 omitted) | $870,836 | $1,107,689 | $1,231,942 | $1,146,782 | $1,089,619 | $1,195,371 |
| Portfolio turnover rateJ | 70%I | 76%K | 53% | 61% | 94% | 87% |
A For the year ended February 29.
B Calculated based on average shares outstanding during the period.
C Investment income per share reflects a large, non-recurring dividend which amounted to $.83 per share. Excluding this non-recurring dividend, the ratio of net investment income (loss) to average net assets would have been .70%.
D Amount represents less than $.005 per share.
E Total returns for periods of less than one year are not annualized.
F Total returns would have been lower if certain expenses had not been reduced during the applicable periods shown.
G Fees and expenses of any underlying Fidelity Central Funds are not included in the Fund's expense ratio. The Fund indirectly bears its proportionate share of the expenses of any underlying Fidelity Central Funds.
H Expense ratios reflect operating expenses of the class. Expenses before reductions do not reflect amounts reimbursed by the investment adviser or reductions from brokerage service arrangements or reductions from other expense offset arrangements and do not represent the amount paid by the class during periods when reimbursements or reductions occur. Expenses net of fee waivers reflect expenses after reimbursement by the investment adviser but prior to reductions from brokerage service arrangements or other expense offset arrangements. Expenses net of all reductions represent the net expenses paid by the class.
I Annualized
J Amount does not include the portfolio activity of any underlying Fidelity Central Funds.
K Portfolio turnover rate excludes securities received or delivered in-kind.
See accompanying notes which are an integral part of the financial statements.
Financial Highlights — Materials Portfolio Class I
| Six months ended (Unaudited) | Years ended February 28, | |||||
| August 31, | 2015 | 2015 | 2014 | 2013 | 2012 A | 2011 |
| Selected Per–Share Data | ||||||
| Net asset value, beginning of period | $80.60 | $86.66 | $73.57 | $69.35 | $70.05 | $52.58 |
| Income from Investment Operations | ||||||
| Net investment income (loss)B | .49 | .74 | .59 | .90 | .60 | 1.28C |
| Net realized and unrealized gain (loss) | (9.42) | 1.05 | 14.60 | 5.70 | (.36) | 17.40 |
| Total from investment operations | (8.93) | 1.79 | 15.19 | 6.60 | .24 | 18.68 |
| Distributions from net investment income | – | (.68) | (.50) | (.83) | (.56) | (1.19) |
| Distributions from net realized gain | (.04) | (7.17) | (1.60) | (1.55) | (.38) | (.03) |
| Total distributions | (.04) | (7.85) | (2.10) | (2.38) | (.94) | (1.22) |
| Redemption fees added to paid in capitalB | –D | –D | –D | –D | –D | .01 |
| Net asset value, end of period | $71.63 | $80.60 | $86.66 | $73.57 | $69.35 | $70.05 |
| Total ReturnE,F | (11.09)% | 2.49% | 20.81% | 9.71% | .50% | 35.73% |
| Ratios to Average Net AssetsG,H | ||||||
| Expenses before reductions | .78%I | .78% | .81% | .85% | .84% | .86% |
| Expenses net of fee waivers, if any | .78%I | .78% | .81% | .85% | .84% | .86% |
| Expenses net of all reductions | .78%I | .78% | .81% | .84% | .83% | .85% |
| Net investment income (loss) | 1.26%I | .89% | .74% | 1.30% | .91% | 2.11%C |
| Supplemental Data | ||||||
| Net assets, end of period (000 omitted) | $409,214 | $468,371 | $333,963 | $246,696 | $89,299 | $85,130 |
| Portfolio turnover rateJ | 70%I | 76%K | 53% | 61% | 94% | 87% |
A For the year ended February 29.
B Calculated based on average shares outstanding during the period.
C Investment income per share reflects a large, non-recurring dividend which amounted to $.83 per share. Excluding this non-recurring dividend, the ratio of net investment income (loss) to average net assets would have been .72%.
D Amount represents less than $.005 per share.
E Total returns for periods of less than one year are not annualized.
F Total returns would have been lower if certain expenses had not been reduced during the applicable periods shown.
G Fees and expenses of any underlying Fidelity Central Funds are not included in the Fund's expense ratio. The Fund indirectly bears its proportionate share of the expenses of any underlying Fidelity Central Funds.
H Expense ratios reflect operating expenses of the class. Expenses before reductions do not reflect amounts reimbursed by the investment adviser or reductions from brokerage service arrangements or reductions from other expense offset arrangements and do not represent the amount paid by the class during periods when reimbursements or reductions occur. Expenses net of fee waivers reflect expenses after reimbursement by the investment adviser but prior to reductions from brokerage service arrangements or other expense offset arrangements. Expenses net of all reductions represent the net expenses paid by the class.
I Annualized
J Amount does not include the portfolio activity of any underlying Fidelity Central Funds.
K Portfolio turnover rate excludes securities received or delivered in-kind.
See accompanying notes which are an integral part of the financial statements.
Notes to Financial Statements (Unaudited)
For the period ended August 31, 2015
1. Organization.
Materials Portfolio (the Fund) is a non-diversified fund of Fidelity Select Portfolios (the Trust) and is authorized to issue an unlimited number of shares. The Trust is registered under the Investment Company Act of 1940, as amended (the 1940 Act), as an open-end management investment company organized as a Massachusetts business trust. The Fund invests primarily in securities of companies whose principal business activities fall within specific industries. The Fund offers Class A, Class T, Class C, Materials and Class I (formerly Institutional Class) shares, each of which, along with Class B shares, has equal rights as to assets and voting privileges. Class B shares are closed to new accounts and additional purchases, except for exchanges and reinvestments. Each class has exclusive voting rights with respect to matters that affect that class. Class B shares will automatically convert to Class A shares after a holding period of seven years from the initial date of purchase.
2. Investments in Fidelity Central Funds.
The Fund invests in Fidelity Central Funds, which are open-end investment companies generally available only to other investment companies and accounts managed by the investment adviser and its affiliates. The Fund's Schedule of Investments lists each of the Fidelity Central Funds held as of period end, if any, as an investment of the Fund, but does not include the underlying holdings of each Fidelity Central Fund. As an Investing Fund, the Fund indirectly bears its proportionate share of the expenses of the underlying Fidelity Central Funds.
The Money Market Central Funds seek preservation of capital and current income and are managed by Fidelity Investments Money Management, Inc. (FIMM), an affiliate of the investment adviser. Annualized expenses of the Money Market Central Funds as of their most recent shareholder report date are less than .01%.
A complete unaudited list of holdings for each Fidelity Central Fund is available upon request or at the Securities and Exchange Commission (the SEC) website at www.sec.gov. In addition, the financial statements of the Fidelity Central Funds are available on the SEC website or upon request.
3. Significant Accounting Policies.
The financial statements have been prepared in conformity with accounting principles generally accepted in the United States of America (GAAP), which require management to make certain estimates and assumptions at the date of the financial statements. Actual results could differ from those estimates. Subsequent events, if any, through the date that the financial statements were issued have been evaluated in the preparation of the financial statements. The following summarizes the significant accounting policies of the Fund:
Investment Valuation. Investments are valued as of 4:00 p.m. Eastern time on the last calendar day of the period. The Board of Trustees (the Board) has delegated the day to day responsibility for the valuation of the Fund's investments to the Fidelity SelectCo, LLC (SelectCo) Fair Value Committee (the Committee). In accordance with valuation policies and procedures approved by the Board, the Fund attempts to obtain prices from one or more third party pricing vendors or brokers to value its investments. When current market prices, quotations or currency exchange rates are not readily available or reliable, investments will be fair valued in good faith by the Committee, in accordance with procedures adopted by the Board. Factors used in determining fair value vary by investment type and may include market or investment specific events. The frequency with which these procedures are used cannot be predicted and they may be utilized to a significant extent. The Committee oversees the Fund's valuation policies and procedures and reports to the Board on the Committee's activities and fair value determinations. The Board monitors the appropriateness of the procedures used in valuing the Fund's investments and ratifies the fair value determinations of the Committee.
The Fund categorizes the inputs to valuation techniques used to value its investments into a disclosure hierarchy consisting of three levels as shown below:
- Level 1 – quoted prices in active markets for identical investments
- Level 2 – other significant observable inputs (including quoted prices for similar investments, interest rates, prepayment speeds, etc.)
- Level 3 – unobservable inputs (including the Fund's own assumptions based on the best information available)
Valuation techniques used to value the Fund's investments by major category are as follows:
Equity securities, including restricted securities, for which market quotations are readily available, are valued at the last reported sale price or official closing price as reported by a third party pricing vendor on the primary market or exchange on which they are traded and are categorized as Level 1 in the hierarchy. In the event there were no sales during the day or closing prices are not available, securities are valued at the last quoted bid price or may be valued using the last available price and are generally categorized as Level 2 in the hierarchy. For foreign equity securities, when market or security specific events arise, comparisons to the valuation of American Depositary Receipts (ADRs), futures contracts, Exchange-Traded Funds (ETFs) and certain indexes as well as quoted prices for similar securities may be used and would be categorized as Level 2 in the hierarchy. Utilizing these techniques may result in transfers between Level 1 and Level 2. For equity securities, including restricted securities, where observable inputs are limited, assumptions about market activity and risk are used and these securities may be categorized as Level 3 in the hierarchy.
Investments in open-end mutual funds, including the Fidelity Central Funds, are valued at their closing net asset value (NAV) each business day and are categorized as Level 1 in the hierarchy.
Changes in valuation techniques may result in transfers in or out of an assigned level within the disclosure hierarchy.
Foreign Currency. The Fund may use foreign currency contracts to facilitate transactions in foreign-denominated securities. Gains and losses from these transactions may arise from changes in the value of the foreign currency or if the counterparties do not perform under the contracts' terms.
Foreign-denominated assets, including investment securities, and liabilities are translated into U.S. dollars at the exchange rates at period end. Purchases and sales of investment securities, income and dividends received and expenses denominated in foreign currencies are translated into U.S. dollars at the exchange rate in effect on the transaction date.
The effects of exchange rate fluctuations on investments are included with the net realized and unrealized gain (loss) on investment securities. Other foreign currency transactions resulting in realized and unrealized gain (loss) are disclosed separately.
Investment Transactions and Income. For financial reporting purposes, the Fund's investment holdings and NAV include trades executed through the end of the last business day of the period. The NAV per share for processing shareholder transactions is calculated as of the close of business of the New York Stock Exchange (NYSE), normally 4:00 p.m. Eastern time and includes trades executed through the end of the prior business day. Gains and losses on securities sold are determined on the basis of identified cost and may include proceeds received from litigation. Dividend income is recorded on the ex-dividend date, except for certain dividends from foreign securities where the ex-dividend date may have passed, which are recorded as soon as the Fund is informed of the ex-dividend date. Non-cash dividends included in dividend income, if any, are recorded at the fair market value of the securities received. Income and capital gain distributions from Fidelity Central Funds, if any, are recorded on the ex-dividend date. Distributions received on securities that represent a return of capital or capital gain are recorded as a reduction of cost of investments and/or as a realized gain. Subsequent to ex-dividend date the Fund determines the components of these distributions, based upon receipt of tax filings or other correspondence relating to the underlying investment. Interest income is accrued as earned and includes coupon interest and amortization of premium and accretion of discount on debt securities as applicable. Investment income is recorded net of foreign taxes withheld where recovery of such taxes is uncertain.
Class Allocations and Expenses. Investment income, realized and unrealized capital gains and losses, common expenses of the Fund, and certain fund-level expense reductions, if any, are allocated daily on a pro-rata basis to each class based on the relative net assets of each class to the total net assets of the Fund. Each class differs with respect to transfer agent and distribution and service plan fees incurred. Certain expense reductions may also differ by class. For the reporting period, the allocated portion of income and expenses to each class as a percent of its average net assets may vary due to the timing of recording these transactions in relation to fluctuating net assets of the classes. Expenses directly attributable to a fund are charged to that fund. Expenses attributable to more than one fund are allocated among the respective funds on the basis of relative net assets or other appropriate methods. Expense estimates are accrued in the period to which they relate and adjustments are made when actual amounts are known.
Deferred Trustee Compensation. Under a Deferred Compensation Plan (the Plan), independent Trustees may elect to defer receipt of a portion of their annual compensation. Deferred amounts are invested in a cross-section of Fidelity funds, are marked-to-market and remain in the Fund until distributed in accordance with the Plan. The investment of deferred amounts and the offsetting payable to the Trustees are included in the accompanying Statement of Assets and Liabilities.
Income Tax Information and Distributions to Shareholders. Each year, the Fund intends to qualify as a regulated investment company under Subchapter M of the Internal Revenue Code, including distributing substantially all of its taxable income and realized gains. As a result, no provision for U.S. Federal income taxes is required. The Fund files a U.S. federal tax return, in addition to state and local tax returns as required. The Fund's federal income tax returns are subject to examination by the Internal Revenue Service (IRS) for a period of three fiscal years after they are filed. State and local tax returns may be subject to examination for an additional fiscal year depending on the jurisdiction. Foreign taxes are provided for based on the Fund's understanding of the tax rules and rates that exist in the foreign markets in which it invests.
Distributions are declared and recorded on the ex-dividend date. Income dividends and capital gain distributions are declared separately for each class. Income and capital gain distributions are determined in accordance with income tax regulations, which may differ from GAAP.
Capital accounts within the financial statements are adjusted for permanent book-tax differences. These adjustments have no impact on net assets or the results of operations. Capital accounts are not adjusted for temporary book-tax differences which will reverse in a subsequent period.
Book-tax differences are primarily due to foreign currency transactions, in-kind transactions, passive foreign investment companies (PFIC), original issue discount, deferred trustees compensation, capital loss carryforwards and losses deferred due to wash sales and excise tax regulations.
The federal tax cost of investment securities and unrealized appreciation (depreciation) as of period end were as follows:
| Gross unrealized appreciation | $275,231,923 |
| Gross unrealized depreciation | (110,844,501) |
| Net unrealized appreciation (depreciation) on securities | $164,387,422 |
| Tax cost | $1,500,743,124 |
The Fund elected to defer to its next fiscal year approximately $5,660,716 of capital losses recognized during the period November 1, 2014 to February 28, 2015.
Capital loss carryforwards are only available to offset future gains of the Fund to the extent provided by regulations and may be limited. Under the Regulated Investment Company Modernization Act or 2010 (the Act), the Fund is permitted to carry forward capital losses incurred in taxable years beginning after December 22, 2010 for an unlimited period and such capital losses are required to be used prior to any losses that expire. The capital loss carryforward information presented below, including any applicable limitation, is estimated as of prior fiscal period end and is subject to adjustment.
| Fiscal year of expiration: | |
| 2017 | $(810,939) |
| 2018 | (1,022,988) |
| 2019 | (80,787) |
| Total with expiration | $(1,914,714) |
The Fund acquired $1,914,714 of its capital loss carryforward as part of a merger in a prior period. The losses acquired that will be available to offset future capital gains of the Fund will be limited to approximately $611,309 per year.
Trading (Redemption) Fees. Shares held by investors in the Fund less than 30 days may be subject to a redemption fee equal to .75% of the NAV of shares redeemed. All redemption fees, which reduce the proceeds of the shareholder redemption, are retained by the Fund and accounted for as an addition to paid in capital.
4. Purchases and Sales of Investments.
Purchases and sales of securities, other than short-term securities, aggregated $655,679,558 and $827,401,816, respectively.
5. Fees and Other Transactions with Affiliates.
Management Fee. Fidelity SelectCo, LLC (the investment adviser) and its affiliates provide the Fund with investment management related services for which the Fund pays a monthly management fee. The management fee is the sum of an individual fund fee rate that is based on an annual rate of .30% of the Fund's average net assets and an annualized group fee rate that averaged .25% during the period. The group fee rate is based upon the average net assets of all the mutual funds advised by Fidelity Management & Research Company (FMR) and the investment adviser. The group fee rate decreases as assets under management increase and increases as assets under management decrease. For the reporting period, the total annualized management fee rate was .55% of the Fund's average net assets.
Distribution and Service Plan Fees. In accordance with Rule 12b-1 of the 1940 Act, the Fund has adopted separate Distribution and Service Plans for each class of shares. Certain classes pay Fidelity Distributors Corporation (FDC), an affiliate of the investment adviser, separate Distribution and Service Fees, each of which is based on an annual percentage of each class' average net assets. In addition, FDC may pay financial intermediaries for selling shares of the Fund and providing shareholder support services. For the period, the Distribution and Service Fee rates, total fees and amounts retained by FDC were as follows:
| Distribution Fee | Service Fee | Total Fees | Retained by FDC |
|
| Class A | -% | .25% | $375,494 | $– |
| Class T | .25% | .25% | 103,416 | – |
| Class B | .75% | .25% | 27,071 | 20,303 |
| Class C | .75% | .25% | 504,353 | 82,905 |
| $1,010,334 | $103,208 |
Sales Load. FDC may receive a front-end sales charge of up to 5.75% for selling Class A shares and 3.50% for selling Class T shares, some of which is paid to financial intermediaries for selling shares of the Fund. Depending on the holding period, FDC may receive contingent deferred sales charges levied on Class A, Class T, Class B, and Class C redemptions. The deferred sales charges range from 5.00% to 1.00% for Class B shares, 1.00% for Class C shares, 1.00% for certain purchases of Class A shares and .25% for certain purchases of Class T shares.
For the period, sales charge amounts retained by FDC were as follows:
| Retained by FDC |
|
| Class A | $36,807 |
| Class T | 2,919 |
| Class B* | 1,723 |
| Class C* | 7,735 |
| $49,184 |
*When Class B and Class C shares are initially sold, FDC pays commissions from its own resources to financial intermediaries through which the sales are made.
Transfer Agent Fees. Fidelity Investments Institutional Operations Company, Inc., (FIIOC), an affiliate of the investment adviser, is the transfer, dividend disbursing and shareholder servicing agent for each class of the Fund. FIIOC receives account fees and asset-based fees that vary according to the account size and type of account of the shareholders of the respective classes of the Fund. FIIOC pays for typesetting, printing and mailing of shareholder reports, except proxy statements.
For the period, transfer agent fees for each class were as follows:
| Amount | % of Class-Level Average Net Assets* |
|
| Class A | $322,696 | .21 |
| Class T | 56,715 | .27 |
| Class B | 7,671 | .28 |
| Class C | 110,277 | .22 |
| Materials | 1,067,247 | .21 |
| Class I | 422,643 | .19 |
| $1,987,249 |
*Annualized
Accounting and Security Lending Fees. Fidelity Service Company, Inc. (FSC), an affiliate of the investment adviser, maintains the Fund's accounting records. The accounting fee is based on the level of average net assets for each month. Under a separate contract, FSC administers the security lending program. The security lending fee is based on the number and duration of lending transactions.
Brokerage Commissions. The Fund placed a portion of its portfolio transactions with brokerage firms which are affiliates of the investment adviser. Brokerage commissions are included in net realized gain (loss) and change in net unrealized appreciation (depreciation) in the Statement of Operations. The commissions paid to these affiliated firms were $10,550 for the period.
6. Committed Line of Credit.
The Fund participates with other funds managed by the investment adviser or an affiliate in a $4.25 billion credit facility (the "line of credit") to be utilized for temporary or emergency purposes to fund shareholder redemptions or for other short-term liquidity purposes. The Fund has agreed to pay commitment fees on its pro-rata portion of the line of credit, which amounted to $1,527 and is reflected in Miscellaneous expenses on the Statement of Operations. During the period, the Fund did not borrow on this line of credit.
7. Security Lending.
The Fund lends portfolio securities through a lending agent from time to time in order to earn additional income. On the settlement date of the loan, the Fund receives collateral (in the form of U.S. Treasury obligations, letters of credit and/or cash) against the loaned securities and maintains collateral in an amount not less than 100% of the market value of the loaned securities during the period of the loan. The market value of the loaned securities is determined at the close of business of the Fund and any additional required collateral is delivered to the Fund on the next business day. If the borrower defaults on its obligation to return the securities loaned because of insolvency or other reasons, the Fund may apply collateral received from the borrower against the obligation. The Fund may experience delays and costs in recovering the securities loaned. Any cash collateral received is invested in the Fidelity Securities Lending Cash Central Fund. The value of loaned securities and cash collateral at period end are disclosed on the Fund's Statement of Assets and Liabilities. Security lending income represents the income earned on investing cash collateral, less rebates paid to borrowers and any lending agent fees associated with the loan, plus any premium payments received for lending certain types of securities. Security lending income is presented in the Statement of Operations as a component of income from Fidelity Central Funds. Total security lending income during the period amounted to $47,166.
8. Expense Reductions.
Commissions paid to certain brokers with whom the investment adviser, or its affiliates, places trades on behalf of the Fund include an amount in addition to trade execution, which may be rebated back to the Fund to offset certain expenses. This amount totaled $36,952 for the period.
In addition, during the period the investment adviser reimbursed and/or waived a portion of fund-level operating expenses in the amount of $7,779 and a portion of class-level operating expenses as follows:
| Amount | |
| Class A | $6,876 |
| Class T | 846 |
| Class B | 22 |
| Class C | 2,309 |
| Materials | 27,233 |
| Class I | 8,125 |
| $ 45,411 |
9. Distributions to Shareholders.
Distributions to shareholders of each class were as follows:
| Six months ended August 31, 2015 | Year ended February 28, 2015 | |
| From net investment income | ||
| Class A | $– | $1,638,100 |
| Class T | – | 99,020 |
| Materials | – | 8,803,568 |
| Class I | – | 3,592,103 |
| Total | $– | $14,132,791 |
| From net realized gain | ||
| Class A | $142,163 | $27,780,861 |
| Class T | 19,809 | 3,863,168 |
| Class B | 2,750 | 628,830 |
| Class C | 49,466 | 9,676,799 |
| Materials | 481,379 | 98,020,822 |
| Class I | 210,831 | 36,075,039 |
| Total | $906,398 | $176,045,519 |
10. Share Transactions.
Share transactions for each class were as follows and may contain automatic conversions between classes or exchanges between funds:
| Shares | Shares | Dollars | Dollars | |
| Six months ended August 31, 2015 | Year ended February 28, 2015 | Six months ended August 31, 2015 | Year ended February 28, 2015 | |
| Class A | ||||
| Shares sold | 440,698 | 1,287,549 | $34,144,694 | $107,992,682 |
| Reinvestment of distributions | 1,705 | 350,058 | 134,157 | 27,494,344 |
| Shares redeemed | (690,349) | (1,557,532) | (53,337,676) | (130,043,911) |
| Net increase (decrease) | (247,946) | 80,075 | $(19,058,825) | $5,443,115 |
| Class T | ||||
| Shares sold | 37,053 | 122,029 | $2,833,717 | $10,167,521 |
| Reinvestment of distributions | 244 | 48,608 | 19,104 | 3,794,851 |
| Shares redeemed | (89,364) | (130,511) | (6,884,642) | (10,688,592) |
| Net increase (decrease) | (52,067) | 40,126 | $(4,031,821) | $3,273,780 |
| Class B | ||||
| Shares sold | 1,414 | 2,935 | $108,496 | $242,184 |
| Reinvestment of distributions | 34 | 7,683 | 2,627 | 590,123 |
| Shares redeemed | (21,639) | (30,247) | (1,632,076) | (2,465,575) |
| Net increase (decrease) | (20,191) | (19,629) | $(1,520,953) | $(1,633,268) |
| Class C | ||||
| Shares sold | 85,043 | 367,698 | $6,423,692 | $30,096,831 |
| Reinvestment of distributions | 579 | 110,883 | 44,233 | 8,472,087 |
| Shares redeemed | (194,719) | (366,676) | (14,553,390) | (29,116,038) |
| Net increase (decrease) | (109,097) | 111,905 | $(8,085,465) | $9,452,880 |
| Materials | ||||
| Shares sold | 625,816 | 2,411,814 | $48,746,846 | $202,615,605 |
| Reinvestment of distributions | 5,717 | 1,274,428 | 451,965 | 100,536,677 |
| Shares redeemed | (2,211,617) | (4,164,314) | (171,119,417) | (345,204,286) |
| Net increase (decrease) | (1,580,084) | (478,072) | $(121,920,606) | $(42,052,004) |
| Class I | ||||
| Shares sold | 840,288 | 4,739,071A | $65,266,509 | $400,864,210A |
| Reinvestment of distributions | 2,499 | 464,747 | 197,171 | 36,366,289 |
| Shares redeemed | (940,497) | (3,246,644)B | (72,564,792) | (271,874,142)B |
| Net increase (decrease) | (97,710) | 1,957,174 | $(7,101,112) | $165,356,357 |
A Amount includes in-kind exchanges.
B Amount includes in-kind redemptions.
11. Other.
The Fund's organizational documents provide former and current trustees and officers with a limited indemnification against liabilities arising in connection with the performance of their duties to the Fund. In the normal course of business, the Fund may also enter into contracts that provide general indemnifications. The Fund's maximum exposure under these arrangements is unknown as this would be dependent on future claims that may be made against the Fund. The risk of material loss from such claims is considered remote.
Shareholder Expense Example
As a shareholder of the Fund, you incur two types of costs: (1) transaction costs, including sales charges (loads) on purchase payments or redemption proceeds, redemption fees and (2) ongoing costs, including management fees, distribution and/or service (12b-1) fees and other Fund expenses. This Example is intended to help you understand your ongoing costs (in dollars) of investing in the Fund and to compare these costs with the ongoing costs of investing in other mutual funds.
The Example is based on an investment of $1,000 invested at the beginning of the period and held for the entire period (March 1, 2015 to August 31, 2015).
Actual Expenses
The first line of the accompanying table for each class of the Fund provides information about actual account values and actual expenses. You may use the information in this line, together with the amount you invested, to estimate the expenses that you paid over the period. Simply divide your account value by $1,000.00 (for example, an $8,600 account value divided by $1,000.00 = 8.6), then multiply the result by the number in the first line for a class of the Fund under the heading entitled "Expenses Paid During Period" to estimate the expenses you paid on your account during this period. A small balance maintenance fee of $12.00 that is charged once a year may apply for certain accounts with a value of less than $2,000. This fee is not included in the table below. If it was, the estimate of expenses you paid during the period would be higher, and your ending account value lower, by this amount. In addition, the Fund, as a shareholder in the underlying Fidelity Central Funds, will indirectly bear its pro-rata share of the fees and expenses incurred by the underlying Fidelity Central Funds. These fees and expenses are not included in the Fund's annualized expense ratio used to calculate the expense estimate in the table below.
Hypothetical Example for Comparison Purposes
The second line of the accompanying table provides information about hypothetical account values and hypothetical expenses based on the Fund's actual expense ratio and an assumed rate of return of 5% per year before expenses, which is not the Fund's actual return. The hypothetical account values and expenses may not be used to estimate the actual ending account balance or expenses you paid for the period. You may use this information to compare the ongoing costs of investing in the Fund and other funds. To do so, compare this 5% hypothetical example with the 5% hypothetical examples that appear in the shareholder reports of the other funds. A small balance maintenance fee of $12.00 that is charged once a year may apply for certain accounts with a value of less than $2,000. This fee is not included in the table below. If it was, the estimate of expenses you paid during the period would be higher, and your ending account value lower, by this amount. In addition, the Fund, as a shareholder in the underlying Fidelity Central Funds, will indirectly bear its pro-rata share of the fees and expenses incurred by the underlying Fidelity Central Funds. These fees and expenses are not included in the Fund's annualized expense ratio used to calculate the expense estimate in the table below.
Please note that the expenses shown in the table are meant to highlight your ongoing costs only and do not reflect any transaction costs. Therefore, the second line of the table is useful in comparing ongoing costs only, and will not help you determine the relative total costs of owning different funds. In addition, if these transactional costs were included, your costs would have been higher.
| Annualized Expense Ratio-A | Beginning Account Value March 1, 2015 | Ending Account Value August 31, 2015 | Expenses Paid During Period-B March 1, 2015 to August 31, 2015 |
|
| Chemicals Portfolio | .79% | |||
| Actual | $1,000.00 | $851.30 | $3.68 | |
| Hypothetical-C | $1,000.00 | $1,021.17 | $4.01 | |
| Gold Portfolio | ||||
| Class A | 1.21% | |||
| Actual | $1,000.00 | $748.20 | $5.32 | |
| Hypothetical-C | $1,000.00 | $1,019.05 | $6.14 | |
| Class T | 1.49% | |||
| Actual | $1,000.00 | $747.10 | $6.54 | |
| Hypothetical-C | $1,000.00 | $1,017.65 | $7.56 | |
| Class B | 1.96% | |||
| Actual | $1,000.00 | $745.20 | $8.60 | |
| Hypothetical-C | $1,000.00 | $1,015.28 | $9.93 | |
| Class C | 1.94% | |||
| Actual | $1,000.00 | $744.80 | $8.51 | |
| Hypothetical-C | $1,000.00 | $1,015.38 | $9.83 | |
| Gold | .93% | |||
| Actual | $1,000.00 | $748.60 | $4.09 | |
| Hypothetical-C | $1,000.00 | $1,020.46 | $4.72 | |
| Class I | .89% | |||
| Actual | $1,000.00 | $749.20 | $3.91 | |
| Hypothetical-C | $1,000.00 | $1,020.66 | $4.52 | |
| Materials Portfolio | ||||
| Class A | 1.06% | |||
| Actual | $1,000.00 | $887.90 | $5.03 | |
| Hypothetical-C | $1,000.00 | $1,019.81 | $5.38 | |
| Class T | 1.37% | |||
| Actual | $1,000.00 | $886.30 | $6.50 | |
| Hypothetical-C | $1,000.00 | $1,018.25 | $6.95 | |
| Class B | 1.88% | |||
| Actual | $1,000.00 | $884.10 | $8.90 | |
| Hypothetical-C | $1,000.00 | $1,015.69 | $9.53 | |
| Class C | 1.81% | |||
| Actual | $1,000.00 | $884.40 | $8.57 | |
| Hypothetical-C | $1,000.00 | $1,016.04 | $9.17 | |
| Materials | .80% | |||
| Actual | $1,000.00 | $889.00 | $3.80 | |
| Hypothetical-C | $1,000.00 | $1,021.11 | $4.06 | |
| Class I | .78% | |||
| Actual | $1,000.00 | $889.10 | $3.70 | |
| Hypothetical-C | $1,000.00 | $1,021.22 | $3.96 | |
A Annualized expense ratio reflects expenses net of applicable fee waivers.
B Expenses are equal to each Class' annualized expense ratio, multiplied by the average account value over the period, multiplied by 184/ 366 (to reflect the one-half year period).
C 5% return per year before expenses
![]()
SELMT-SANN-1015
1.846035.108
|
Fidelity® Select Portfolios® Utilities Portfolio Semi-Annual Report August 31, 2015 |
|
|
Contents
To view a fund's proxy voting guidelines and proxy voting record for the 12-month period ended June 30, visit http://www.fidelity.com/proxyvotingresults or visit the Securities and Exchange Commission's (SEC) web site at http://www.sec.gov.
You may also call 1-800-544-8544 to request a free copy of the proxy voting guidelines.
Standard & Poor's, S&P and S&P 500 are registered service marks of The McGraw-Hill Companies, Inc. and have been licensed for use by Fidelity Distributors Corporation.
Other third-party marks appearing herein are the property of their respective owners.
All other marks appearing herein are registered or unregistered trademarks or service marks of FMR LLC or an affiliated company. © 2015 FMR LLC. All rights reserved.
This report and the financial statements contained herein are submitted for the general information of the shareholders of the Fund. This report is not authorized for distribution to prospective investors in the Fund unless preceded or accompanied by an effective prospectus.
A fund files its complete schedule of portfolio holdings with the SEC for the first and third quarters of each fiscal year on Form N-Q. Forms N-Q are available on the SEC’s web site at http://www.sec.gov. A fund's Forms N-Q may be reviewed and copied at the SEC’s Public Reference Room in Washington, DC. Information regarding the operation of the SEC's Public Reference Room may be obtained by calling 1-800-SEC-0330.
For a complete list of a fund's portfolio holdings, view the most recent holdings listing, semiannual report, or annual report on Fidelity's web site at http://www.fidelity.com, http://www.advisor.fidelity.com, or http://www.401k.com, as applicable.
NOT FDIC INSURED •MAY LOSE VALUE •NO BANK GUARANTEE
Neither the Fund nor Fidelity Distributors Corporation is a bank.
Investment Summary (Unaudited)
Top Ten Stocks as of August 31, 2015
| % of fund's net assets | % of fund's net assets 6 months ago | |
| NextEra Energy, Inc. | 16.0 | 12.8 |
| Exelon Corp. | 13.3 | 10.5 |
| Sempra Energy | 10.6 | 9.8 |
| Dominion Resources, Inc. | 9.3 | 9.9 |
| Edison International | 4.9 | 4.5 |
| PPL Corp. | 4.9 | 5.0 |
| PG&E Corp. | 4.7 | 7.3 |
| Calpine Corp. | 4.4 | 4.9 |
| AT&T, Inc. | 3.2 | 0.0 |
| FirstEnergy Corp. | 3.0 | 1.8 |
| 74.3 |
Top Industries (% of fund's net assets)
| As of August 31, 2015 | ||
| Electric Utilities | 47.7% | |
| Multi-Utilities | 31.4% | |
| Independent Power and Renewable Electricity Producers | 10.8% | |
| Diversified Telecommunication Services | 3.2% | |
| Real Estate Investment Trusts | 2.9% | |
| All Others* | 4.0% | |

| As of February 28, 2015 | ||
| Electric Utilities | 43.7% | |
| Multi-Utilities | 33.3% | |
| Independent Power and Renewable Electricity Producers | 11.7% | |
| Oil, Gas & Consumable Fuels | 5.8% | |
| Real Estate Investment Trusts | 2.0% | |
| All Others* | 3.5% | |
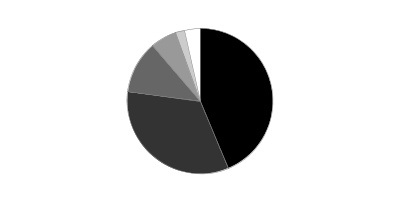
* Includes short-term investments and net other assets (liabilities).
Percentages shown as 0.0% may reflect amounts less than 0.05%.
Investments August 31, 2015 (Unaudited)
Showing Percentage of Net Assets
| Common Stocks - 98.6% | |||
| Shares | Value | ||
| Diversified Telecommunication Services - 3.2% | |||
| Integrated Telecommunication Services - 3.2% | |||
| AT&T, Inc. | 674,500 | $22,393,400 | |
| Electric Utilities - 47.7% | |||
| Electric Utilities - 47.7% | |||
| Duke Energy Corp. | 48,500 | 3,439,135 | |
| Edison International | 576,512 | 33,714,422 | |
| Exelon Corp. | 2,962,200 | 91,117,272 | |
| FirstEnergy Corp. | 645,300 | 20,623,788 | |
| ITC Holdings Corp. | 394,700 | 12,906,690 | |
| NextEra Energy, Inc. | 1,120,085 | 110,227,565 | |
| OGE Energy Corp. | 691,885 | 19,400,455 | |
| PNM Resources, Inc. | 112,500 | 2,881,125 | |
| PPL Corp. | 1,086,842 | 33,681,234 | |
| 327,991,686 | |||
| Independent Power and Renewable Electricity Producers - 10.8% | |||
| Independent Power Producers & Energy Traders - 10.8% | |||
| Black Hills Corp. | 171,550 | 6,824,259 | |
| Calpine Corp. (a) | 1,884,887 | 30,045,099 | |
| Dynegy, Inc. (a) | 450,137 | 11,591,028 | |
| NRG Energy, Inc. | 956,422 | 19,051,926 | |
| The AES Corp. | 540,600 | 6,487,200 | |
| 73,999,512 | |||
| Multi-Utilities - 31.4% | |||
| Multi-Utilities - 31.4% | |||
| Dominion Resources, Inc. | 915,012 | 63,822,087 | |
| DTE Energy Co. | 244,670 | 19,098,940 | |
| NiSource, Inc. | 1,198,923 | 20,129,917 | |
| PG&E Corp. | 649,237 | 32,189,170 | |
| Sempra Energy | 768,551 | 72,897,062 | |
| WEC Energy Group, Inc. | 163,795 | 7,804,832 | |
| 215,942,008 | |||
| Oil, Gas & Consumable Fuels - 2.6% | |||
| Oil & Gas Storage & Transport - 2.6% | |||
| Cheniere Energy Partners LP Holdings LLC | 823,241 | 17,790,238 | |
| Real Estate Investment Trusts - 2.9% | |||
| Specialized REITs - 2.9% | |||
| Crown Castle International Corp. | 239,000 | 19,930,210 | |
| TOTAL COMMON STOCKS | |||
| (Cost $659,817,866) | 678,047,054 | ||
| Money Market Funds - 1.2% | |||
| Fidelity Cash Central Fund, 0.15% (b) | |||
| (Cost $8,246,407) | 8,246,407 | 8,246,407 | |
| TOTAL INVESTMENT PORTFOLIO - 99.8% | |||
| (Cost $668,064,273) | 686,293,461 | ||
| NET OTHER ASSETS (LIABILITIES) - 0.2% | 1,162,843 | ||
| NET ASSETS - 100% | $687,456,304 |
Legend
(a) Non-income producing
(b) Affiliated fund that is generally available only to investment companies and other accounts managed by Fidelity Investments. The rate quoted is the annualized seven-day yield of the fund at period end. A complete unaudited listing of the fund's holdings as of its most recent quarter end is available upon request. In addition, each Fidelity Central Fund's financial statements are available on the SEC's website or upon request.
Affiliated Central Funds
Information regarding fiscal year to date income earned by the Fund from investments in Fidelity Central Funds is as follows:
| Fund | Income earned |
| Fidelity Cash Central Fund | $6,779 |
| Fidelity Securities Lending Cash Central Fund | 22,535 |
| Total | $29,314 |
Investment Valuation
All investments are categorized as Level 1 under the Fair Value Hierarchy. The inputs or methodology used for valuing securities may not be an indication of the risk associated with investing in those securities. For more information on valuation inputs please refer to the Investment Valuation section in the accompanying Notes to Financial Statements.
See accompanying notes which are an integral part of the financial statements.
Financial Statements
Statement of Assets and Liabilities
| August 31, 2015 (Unaudited) | ||
| Assets | ||
| Investment in securities, at value — See accompanying schedule: Unaffiliated issuers (cost $659,817,866) | $678,047,054 | |
| Fidelity Central Funds (cost $8,246,407) | 8,246,407 | |
| Total Investments (cost $668,064,273) | $686,293,461 | |
| Receivable for investments sold | 620,091 | |
| Receivable for fund shares sold | 252,952 | |
| Dividends receivable | 2,970,670 | |
| Distributions receivable from Fidelity Central Funds | 1,313 | |
| Prepaid expenses | 5,253 | |
| Other receivables | 11,838 | |
| Total assets | 690,155,578 | |
| Liabilities | ||
| Payable for investments purchased | $681,463 | |
| Payable for fund shares redeemed | 1,523,737 | |
| Accrued management fee | 330,136 | |
| Other affiliated payables | 141,787 | |
| Other payables and accrued expenses | 22,151 | |
| Total liabilities | 2,699,274 | |
| Net Assets | $687,456,304 | |
| Net Assets consist of: | ||
| Paid in capital | $659,580,386 | |
| Undistributed net investment income | 8,762,660 | |
| Accumulated undistributed net realized gain (loss) on investments and foreign currency transactions | 884,070 | |
| Net unrealized appreciation (depreciation) on investments | 18,229,188 | |
| Net Assets, for 10,417,299 shares outstanding | $687,456,304 | |
| Net Asset Value, offering price and redemption price per share ($687,456,304 ÷ 10,417,299 shares) | $65.99 |
See accompanying notes which are an integral part of the financial statements.
Statement of Operations
| Six months ended August 31, 2015 (Unaudited) | ||
| Investment Income | ||
| Dividends | $11,966,705 | |
| Income from Fidelity Central Funds | 29,314 | |
| Total income | 11,996,019 | |
| Expenses | ||
| Management fee | $2,261,264 | |
| Transfer agent fees | 793,663 | |
| Accounting and security lending fees | 142,752 | |
| Custodian fees and expenses | 7,709 | |
| Independent trustees' compensation | 7,514 | |
| Registration fees | 47,994 | |
| Audit | 21,516 | |
| Legal | 6,115 | |
| Interest | 268 | |
| Miscellaneous | 6,265 | |
| Total expenses before reductions | 3,295,060 | |
| Expense reductions | (82,186) | 3,212,874 |
| Net investment income (loss) | 8,783,145 | |
| Realized and Unrealized Gain (Loss)
Net realized gain (loss) on: | ||
| Investment securities: | ||
| Unaffiliated issuers | 8,160,394 | |
| Foreign currency transactions | 6,800 | |
| Total net realized gain (loss) | 8,167,194 | |
| Change in net unrealized appreciation (depreciation) on investment securities | (79,671,823) | |
| Net gain (loss) | (71,504,629) | |
| Net increase (decrease) in net assets resulting from operations | $(62,721,484) |
See accompanying notes which are an integral part of the financial statements.
Statement of Changes in Net Assets
| Six months ended August 31, 2015 (Unaudited) | Year ended February 28, 2015 | |
| Increase (Decrease) in Net Assets | ||
| Operations | ||
| Net investment income (loss) | $8,783,145 | $17,788,106 |
| Net realized gain (loss) | 8,167,194 | 58,182,417 |
| Change in net unrealized appreciation (depreciation) | (79,671,823) | 6,622,534 |
| Net increase (decrease) in net assets resulting from operations | (62,721,484) | 82,593,057 |
| Distributions to shareholders from net investment income | (3,424,471) | (14,727,703) |
| Distributions to shareholders from net realized gain | (13,536,580) | (53,286,789) |
| Total distributions | (16,961,051) | (68,014,492) |
| Share transactions | ||
| Proceeds from sales of shares | 61,784,583 | 882,547,504 |
| Reinvestment of distributions | 16,306,673 | 65,214,543 |
| Cost of shares redeemed | (299,386,425) | (669,930,558) |
| Net increase (decrease) in net assets resulting from share transactions | (221,295,169) | 277,831,489 |
| Redemption fees | 8,096 | 83,359 |
| Total increase (decrease) in net assets | (300,969,608) | 292,493,413 |
| Net Assets | ||
| Beginning of period | 988,425,912 | 695,932,499 |
| End of period (including undistributed net investment income of $8,762,660 and undistributed net investment income of $3,403,986, respectively) | $687,456,304 | $988,425,912 |
| Other Information
Shares | ||
| Sold | 874,901 | 11,876,954 |
| Issued in reinvestment of distributions | 226,042 | 894,827 |
| Redeemed | (4,251,801) | (9,055,975) |
| Net increase (decrease) | (3,150,858) | 3,715,806 |
See accompanying notes which are an integral part of the financial statements.
Financial Highlights — Utilities Portfolio
| Six months ended (Unaudited) | Years ended February 28, | |||||
| August 31, | 2015 | 2015 | 2014 | 2013 | 2012 A | 2011 |
| Selected Per–Share Data | ||||||
| Net asset value, beginning of period | $72.85 | $70.64 | $61.04 | $52.56 | $50.28 | $42.24 |
| Income from Investment Operations | ||||||
| Net investment income (loss)B | .75 | 1.41 | 1.49 | 1.41 | 1.43 | 1.14 |
| Net realized and unrealized gain (loss) | (6.24) | 6.40 | 9.80 | 7.70 | 1.99 | 8.09 |
| Total from investment operations | (5.49) | 7.81 | 11.29 | 9.11 | 3.42 | 9.23 |
| Distributions from net investment income | (.28) | (1.20) | (1.07) | (.63) | (1.14) | (1.19) |
| Distributions from net realized gain | (1.09) | (4.42) | (.62) | – | – | – |
| Total distributions | (1.37) | (5.61)C | (1.69) | (.63) | (1.14) | (1.19) |
| Redemption fees added to paid in capitalB | –D | .01 | –D | –D | –D | –D |
| Net asset value, end of period | $65.99 | $72.85 | $70.64 | $61.04 | $52.56 | $50.28 |
| Total ReturnE,F | (7.70)% | 11.22% | 18.71% | 17.46% | 6.85% | 22.07% |
| Ratios to Average Net AssetsG,H | ||||||
| Expenses before reductions | .80%I | .80% | .82% | .83% | .86% | .90% |
| Expenses net of fee waivers, if any | .79%I | .80% | .82% | .83% | .86% | .90% |
| Expenses net of all reductions | .78%I | .80% | .80% | .79% | .84% | .87% |
| Net investment income (loss) | 2.13%I | 1.89% | 2.28% | 2.49% | 2.78% | 2.46% |
| Supplemental Data | ||||||
| Net assets, end of period (000 omitted) | $687,456 | $988,426 | $695,932 | $532,382 | $518,969 | $454,097 |
| Portfolio turnover rateJ | 63%I | 129%K | 160% | 158% | 202% | 238% |
A For the year ended February 29.
B Calculated based on average shares outstanding during the period.
C Total distributions of $5.61 per share is comprised of distributions from net investment income of $1.199 and distributions from net realized gain of $4.415 per share.
D Amount represents less than $.005 per share.
E Total returns for periods of less than one year are not annualized.
F Total returns would have been lower if certain expenses had not been reduced during the applicable periods shown.
G Fees and expenses of any underlying Fidelity Central Funds are not included in the Fund's expense ratio. The Fund indirectly bears its proportionate share of the expenses of any underlying Fidelity Central Funds.
H Expense ratios reflect operating expenses of the Fund. Expenses before reductions do not reflect amounts reimbursed by the investment adviser or reductions from brokerage service arrangements or reductions from other expense offset arrangements and do not represent the amount paid by the Fund during periods when reimbursements or reductions occur. Expenses net of fee waivers reflect expenses after reimbursement by the investment adviser but prior to reductions from brokerage service arrangements or other expense offset arrangements. Expenses net of all reductions represent the net expenses paid by the Fund.
I Annualized
J Amount does not include the portfolio activity of any underlying Fidelity Central Funds.
K Portfolio turnover rate excludes securities received or delivered in-kind.
See accompanying notes which are an integral part of the financial statements.
Notes to Financial Statements (Unaudited)
For the period ended August 31, 2015
1. Organization.
Utilities Portfolio (the Fund) is a non-diversified fund of Fidelity Select Portfolios (the Trust) and is authorized to issue an unlimited number of shares. Share transactions on the Statement of Changes in Net Assets may contain exchanges between funds. The Trust is registered under the Investment Company Act of 1940, as amended (the 1940 Act), as an open-end management investment company organized as a Massachusetts business trust. The Fund invests primarily in securities of companies whose principal business activities fall within specific industries.
2. Investments in Fidelity Central Funds.
The Fund invests in Fidelity Central Funds, which are open-end investment companies generally available only to other investment companies and accounts managed by the investment adviser and its affiliates. The Fund's Schedule of Investments lists each of the Fidelity Central Funds held as of period end, if any, as an investment of the Fund, but does not include the underlying holdings of each Fidelity Central Fund. As an Investing Fund, the Fund indirectly bears its proportionate share of the expenses of the underlying Fidelity Central Funds.
The Money Market Central Funds seek preservation of capital and current income and are managed by Fidelity Investments Money Management, Inc. (FIMM), an affiliate of the investment adviser. Annualized expenses of the Money Market Central Funds as of their most recent shareholder report date are less than .01%.
A complete unaudited list of holdings for each Fidelity Central Fund is available upon request or at the Securities and Exchange Commission (the SEC) website at www.sec.gov. In addition, the financial statements of the Fidelity Central Funds are available on the SEC website or upon request.
3. Significant Accounting Policies.
The financial statements have been prepared in conformity with accounting principles generally accepted in the United States of America (GAAP), which require management to make certain estimates and assumptions at the date of the financial statements. Actual results could differ from those estimates. Subsequent events, if any, through the date that the financial statements were issued have been evaluated in the preparation of the financial statements. The following summarizes the significant accounting policies of the Fund:
Investment Valuation. Investments are valued as of 4:00 p.m. Eastern time on the last calendar day of the period. The Board of Trustees (the Board) has delegated the day to day responsibility for the valuation of the Fund's investments to the Fidelity SelectCo, LLC (SelectCo) Fair Value Committee (the Committee). In accordance with valuation policies and procedures approved by the Board, the Fund attempts to obtain prices from one or more third party pricing vendors or brokers to value its investments. When current market prices, quotations or currency exchange rates are not readily available or reliable, investments will be fair valued in good faith by the Committee, in accordance with procedures adopted by the Board. Factors used in determining fair value vary by investment type and may include market or investment specific events. The frequency with which these procedures are used cannot be predicted and they may be utilized to a significant extent. The Committee oversees the Fund's valuation policies and procedures and reports to the Board on the Committee's activities and fair value determinations. The Board monitors the appropriateness of the procedures used in valuing the Fund's investments and ratifies the fair value determinations of the Committee.
The Fund categorizes the inputs to valuation techniques used to value its investments into a disclosure hierarchy consisting of three levels as shown below:
- Level 1 – quoted prices in active markets for identical investments
- Level 2 – other significant observable inputs (including quoted prices for similar investments, interest rates, prepayment speeds, etc.)
- Level 3 – unobservable inputs (including the Fund's own assumptions based on the best information available)
Valuation techniques used to value the Fund's investments by major category are as follows:
Equity securities, including restricted securities, for which market quotations are readily available, are valued at the last reported sale price or official closing price as reported by a third party pricing vendor on the primary market or exchange on which they are traded and are categorized as Level 1 in the hierarchy. In the event there were no sales during the day or closing prices are not available, securities are valued at the last quoted bid price or may be valued using the last available price and are generally categorized as Level 2 in the hierarchy. For foreign equity securities, when market or security specific events arise, comparisons to the valuation of American Depositary Receipts (ADRs), futures contracts, Exchange-Traded Funds (ETFs) and certain indexes as well as quoted prices for similar securities may be used and would be categorized as Level 2 in the hierarchy. Utilizing these techniques may result in transfers between Level 1 and Level 2. For equity securities, including restricted securities, where observable inputs are limited, assumptions about market activity and risk are used and these securities may be categorized as Level 3 in the hierarchy.
Investments in open-end mutual funds, including the Fidelity Central Funds, are valued at their closing net asset value (NAV) each business day and are categorized as Level 1 in the hierarchy.
Changes in valuation techniques may result in transfers in or out of an assigned level within the disclosure hierarchy.
Foreign Currency. The Fund may use foreign currency contracts to facilitate transactions in foreign-denominated securities. Gains and losses from these transactions may arise from changes in the value of the foreign currency or if the counterparties do not perform under the contracts' terms.
Foreign-denominated assets, including investment securities, and liabilities are translated into U.S. dollars at the exchange rates at period end. Purchases and sales of investment securities, income and dividends received and expenses denominated in foreign currencies are translated into U.S. dollars at the exchange rate in effect on the transaction date.
The effects of exchange rate fluctuations on investments are included with the net realized and unrealized gain (loss) on investment securities. Other foreign currency transactions resulting in realized and unrealized gain (loss) are disclosed separately.
Investment Transactions and Income. For financial reporting purposes, the Fund's investment holdings and NAV include trades executed through the end of the last business day of the period. The NAV per share for processing shareholder transactions is calculated as of the close of business of the New York Stock Exchange (NYSE), normally 4:00 p.m. Eastern time and includes trades executed through the end of the prior business day. Gains and losses on securities sold are determined on the basis of identified cost and may include proceeds received from litigation. Dividend income is recorded on the ex-dividend date, except for certain dividends from foreign securities where the ex-dividend date may have passed, which are recorded as soon as the Fund is informed of the ex-dividend date. Non-cash dividends included in dividend income, if any, are recorded at the fair market value of the securities received. Income and capital gain distributions from Fidelity Central Funds, if any, are recorded on the ex-dividend date. Distributions received on securities that represent a return of capital or capital gain are recorded as a reduction of cost of investments and/or as a realized gain. Subsequent to ex-dividend date the Fund determines the components of these distributions, based upon receipt of tax filings or other correspondence relating to the underlying investment. Investment income is recorded net of foreign taxes withheld where recovery of such taxes is uncertain.
Expenses. Expenses directly attributable to a fund are charged to that fund. Expenses attributable to more than one fund are allocated among the respective funds on the basis of relative net assets or other appropriate methods. Expense estimates are accrued in the period to which they relate and adjustments are made when actual amounts are known.
Income Tax Information and Distributions to Shareholders. Each year, the Fund intends to qualify as a regulated investment company under Subchapter M of the Internal Revenue Code, including distributing substantially all of its taxable income and realized gains. As a result, no provision for U.S. Federal income taxes is required. The Fund files a U.S. federal tax return, in addition to state and local tax returns as required. The Fund's federal income tax returns are subject to examination by the Internal Revenue Service (IRS) for a period of three fiscal years after they are filed. State and local tax returns may be subject to examination for an additional fiscal year depending on the jurisdiction. Foreign taxes are provided for based on the Fund's understanding of the tax rules and rates that exist in the foreign markets in which it invests.
Distributions are declared and recorded on the ex-dividend date. Income and capital gain distributions are determined in accordance with income tax regulations, which may differ from GAAP.
Capital accounts within the financial statements are adjusted for permanent book-tax differences. These adjustments have no impact on net assets or the results of operations. Capital accounts are not adjusted for temporary book-tax differences which will reverse in a subsequent period.
Book-tax differences are primarily due to foreign currency transactions, redemptions in kind, partnerships, deferred trustees compensation and losses deferred due to wash sales.
The federal tax cost of investment securities and unrealized appreciation (depreciation) as of period end were as follows:
| Gross unrealized appreciation | $52,220,831 |
| Gross unrealized depreciation | (35,323,888) |
| Net unrealized appreciation (depreciation) on securities | $16,896,943 |
| Tax cost | $669,396,518 |
Trading (Redemption) Fees. Shares held by investors in the Fund less than 30 days may be subject to a redemption fee equal to .75% of the NAV of shares redeemed. All redemption fees, which reduce the proceeds of the shareholder redemption, are retained by the Fund and accounted for as an addition to paid in capital.
4. Purchases and Sales of Investments.
Purchases and sales of securities other than short-term securities, aggregated $255,808,721 and $466,966,639, respectively.
5. Fees and Other Transactions with Affiliates.
Management Fee. Fidelity SelectCo, LLC (the investment adviser) and its affiliates provide the Fund with investment management related services for which the Fund pays a monthly management fee. The management fee is the sum of an individual fund fee rate that is based on an annual rate of .30% of the Fund's average net assets and an annualized group fee rate that averaged .25% during the period. The group fee rate is based upon the average net assets of all the mutual funds advised by Fidelity Management & Research Company (FMR) and the investment adviser. The group fee rate decreases as assets under management increase and increases as assets under management decrease. For the reporting period, the total annualized management fee rate was .55% of the Fund's average net assets.
Transfer Agent Fees. Fidelity Investments Institutional Operations Company, Inc. (FIIOC), an affiliate of the investment adviser, is the Fund's transfer, dividend disbursing and shareholder servicing agent. FIIOC receives account fees and asset-based fees that vary according to account size and type of account. FIIOC pays for typesetting, printing and mailing of shareholder reports, except proxy statements. For the period, the transfer agent fees were equivalent to an annualized rate of .19% of average net assets.
Accounting and Security Lending Fees. Fidelity Service Company, Inc. (FSC), an affiliate of the investment adviser, maintains the Fund's accounting records. The accounting fee is based on the level of average net assets for each month. Under a separate contract, FSC administers the security lending program. The security lending fee is based on the number and duration of lending transactions.
Brokerage Commissions. The Fund placed a portion of its portfolio transactions with brokerage firms which are affiliates of the investment adviser. Brokerage commissions are included in net realized gain (loss) and change in net unrealized appreciation (depreciation) in the Statement of Operations. The commissions paid to these affiliated firms were $7,240 for the period.
Interfund Lending Program. Pursuant to an Exemptive Order issued by the SEC, the Fund, along with other registered investment companies having management contracts with Fidelity Management & Research Company (FMR) or other affiliated entities of FMR, may participate in an interfund lending program. This program provides an alternative credit facility allowing the funds to borrow from, or lend money to, other participating affiliated funds. At period end, there were no interfund loans outstanding. The Fund's activity in this program during the period for which loans were outstanding was as follows:
| Borrower or Lender | Average Loan Balance | Weighted Average Interest Rate | Interest Expense |
| Borrower | $5,679,600 | .34% | $268 |
6. Committed Line of Credit.
The Fund participates with other funds managed by the investment adviser or an affiliate in a $4.25 billion credit facility (the "line of credit") to be utilized for temporary or emergency purposes to fund shareholder redemptions or for other short-term liquidity purposes. The Fund has agreed to pay commitment fees on its pro-rata portion of the line of credit, which amounted to $736 and is reflected in Miscellaneous expenses on the Statement of Operations. During the period, the Fund did not borrow on this line of credit.
7. Security Lending.
The Fund lends portfolio securities through a lending agent from time to time in order to earn additional income. On the settlement date of the loan, the Fund receives collateral (in the form of U.S. Treasury obligations, letters of credit and/or cash) against the loaned securities and maintains collateral in an amount not less than 100% of the market value of the loaned securities during the period of the loan. The market value of the loaned securities is determined at the close of business of the Fund and any additional required collateral is delivered to the Fund on the next business day. If the borrower defaults on its obligation to return the securities loaned because of insolvency or other reasons, the Fund may apply collateral received from the borrower against the obligation. The Fund may experience delays and costs in recovering the securities loaned. Any cash collateral received is invested in the Fidelity Securities Lending Cash Central Fund. At period end, there were no security loans outstanding. Security lending income represents the income earned on investing cash collateral, less rebates paid to borrowers and any lending agent fees associated with the loan, plus any premium payments received for lending certain types of securities. Security lending income is presented in the Statement of Operations as a component of income from Fidelity Central Funds. Total security lending income during the period amounted to $22,535.
8. Expense Reductions.
Commissions paid to certain brokers with whom the investment adviser, or its affiliates, places trades on behalf of the Fund include an amount in addition to trade execution, which may be rebated back to the Fund to offset certain expenses. This amount totaled $60,951 for the period.
In addition, during the period the investment adviser reimbursed and/or waived a portion of operating expenses in the amount of$ 21,235.
9. Other.
The Fund's organizational documents provide former and current trustees and officers with a limited indemnification against liabilities arising in connection with the performance of their duties to the Fund. In the normal course of business, the Fund may also enter into contracts that provide general indemnifications. The Fund's maximum exposure under these arrangements is unknown as this would be dependent on future claims that may be made against the Fund. The risk of material loss from such claims is considered remote.
At the end of the period, Strategic Advisers Core Fund was the owner of record of approximately 11% of the total outstanding shares of the Fund.
Shareholder Expense Example
As a shareholder of the Fund, you incur two types of costs: (1) transaction costs, including redemption fees and (2) ongoing costs, including management fees and other Fund expenses. This Example is intended to help you understand your ongoing costs (in dollars) of investing in the Fund and to compare these costs with the ongoing costs of investing in other mutual funds.
Actual Expenses
The first line of the accompanying table provides information about actual account values and actual expenses. You may use the information in this line, together with the amount you invested, to estimate the expenses that you paid over the period. Simply divide your account value by $1,000.00 (for example, an $8,600 account value divided by $1,000.00 = 8.6), then multiply the result by the number in the first line under the heading entitled "Expenses Paid During Period" to estimate the expenses you paid on your account during this period. A small balance maintenance fee of $12.00 that is charged once a year may apply for certain accounts with a value of less than $2,000. This fee is not included in the table below. If it was, the estimate of expenses you paid during the period would be higher, and your ending account value lower, by this amount. In addition, the Fund, as a shareholder in the underlying Fidelity Central Funds, will indirectly bear its pro-rata share of the fees and expenses incurred by the underlying Fidelity Central Funds. These fees and expenses are not included in the Fund's annualized expense ratio used to calculate the expense estimate in the table below.
Hypothetical Example for Comparison Purposes
The second line of the accompanying table provides information about hypothetical account values and hypothetical expenses based on the Fund's actual expense ratio and an assumed rate of return of 5% per year before expenses, which is not the Fund's actual return. The hypothetical account values and expenses may not be used to estimate the actual ending account balance or expenses you paid for the period. You may use this information to compare the ongoing costs of investing in the Fund and other funds. To do so, compare this 5% hypothetical example with the 5% hypothetical examples that appear in the shareholder reports of the other funds. A small balance maintenance fee of $12.00 that is charged once a year may apply for certain accounts with a value of less than $2,000. This fee is not included in the table below. If it was, the estimate of expenses you paid during the period would be higher, and your ending account value lower, by this amount. In addition, the Fund, as a shareholder in the underlying Fidelity Central Funds, will indirectly bear its pro-rata share of the fees and expenses incurred by the underlying Fidelity Central Funds. These fees and expenses are not included in the Fund's annualized expense ratio used to calculate the expense estimate in the table below.
Please note that the expenses shown in the table are meant to highlight your ongoing costs only and do not reflect any transaction costs. Therefore, the second line of the table is useful in comparing ongoing costs only, and will not help you determine the relative total costs of owning different funds. In addition, if these transactional costs were included, your costs would have been higher.
| Annualized Expense Ratio-A | Beginning Account Value March 1, 2015 | Ending Account Value August 31, 2015 | Expenses Paid During Period-B March 1, 2015 to August 31, 2015 |
|
| Actual | .79% | $1,000.00 | $923.00 | $3.82 |
| Hypothetical-C | $1,000.00 | $1,021.17 | $4.01 |
A Annualized expense ratio reflects expenses net of applicable fee waivers.
B Expenses are equal to the Fund's annualized expense ratio, multiplied by the average account value over the period, multiplied by 184/366 (to reflect the one-half year period).
C 5% return per year before expenses
![]()
SELUTL-SANN-1015
1.813630.110
|
Fidelity Advisor Focus Funds® Class I (formerly Institutional Class) Consumer Staples Portfolio Gold Portfolio Materials Portfolio Telecommunications Portfolio Semi-Annual Report August 31, 2015 Each Advisor fund listed above is a class of the Fidelity® Select Portfolios® |
|
|
Contents
|
Consumer Staples Portfolio |
|
|
Gold Portfolio |
|
|
Materials Portfolio |
|
|
Telecommunications Portfolio |
|
To view a fund's proxy voting guidelines and proxy voting record for the 12-month period ended June 30, visit http://www.fidelity.com/proxyvotingresults or visit the Securities and Exchange Commission's (SEC) web site at http://www.sec.gov.
You may also call 1-877-208-0098 to request a free copy of the proxy voting guidelines.
Standard & Poor's, S&P and S&P 500 are registered service marks of The McGraw-Hill Companies, Inc. and have been licensed for use by Fidelity Distributors Corporation.
Other third-party marks appearing herein are the property of their respective owners.
All other marks appearing herein are registered or unregistered trademarks or service marks of FMR LLC or an affiliated company. © 2015 FMR LLC. All rights reserved.
This report and the financial statements contained herein are submitted for the general information of the shareholders of the Funds. This report is not authorized for distribution to prospective investors in the Funds unless preceded or accompanied by an effective prospectus.
A fund files its complete schedule of portfolio holdings with the SEC for the first and third quarters of each fiscal year on Form N-Q. Forms N-Q are available on the SEC’s web site at http://www.sec.gov. A fund's Forms N-Q may be reviewed and copied at the SEC’s Public Reference Room in Washington, DC. Information regarding the operation of the SEC's Public Reference Room may be obtained by calling 1-800-SEC-0330.
For a complete list of a fund's portfolio holdings, view the most recent holdings listing, semiannual report, or annual report on Fidelity's web site at http://www.fidelity.com, http://www.advisor.fidelity.com, or http://www.401k.com, as applicable.
NOT FDIC INSURED •MAY LOSE VALUE •NO BANK GUARANTEE
Neither the Funds nor Fidelity Distributors Corporation is a bank.
Consumer Staples Portfolio
Investment Summary (Unaudited)
Top Ten Stocks as of August 31, 2015
| % of fund's net assets | % of fund's net assets 6 months ago | |
| British American Tobacco PLC sponsored ADR | 11.1 | 11.0 |
| CVS Health Corp. | 10.5 | 9.0 |
| Procter & Gamble Co. | 9.7 | 9.1 |
| PepsiCo, Inc. | 9.6 | 4.2 |
| Kroger Co. | 5.9 | 6.0 |
| Mead Johnson Nutrition Co. Class A | 4.7 | 4.5 |
| Altria Group, Inc. | 4.4 | 2.3 |
| Colgate-Palmolive Co. | 3.9 | 3.0 |
| Wal-Mart Stores, Inc. | 3.7 | 7.0 |
| Keurig Green Mountain, Inc. | 3.4 | 2.2 |
| 66.9 |
Top Industries (% of fund's net assets)
| As of August 31, 2015 | ||
| Food & Staples Retailing | 23.6% | |
| Beverages | 23.5% | |
| Tobacco | 20.0% | |
| Household Products | 13.7% | |
| Food Products | 13.3% | |
| All Others* | 5.9% | |

| As of February 28, 2015 | ||
| Food & Staples Retailing | 26.7% | |
| Tobacco | 19.7% | |
| Beverages | 18.8% | |
| Food Products | 16.7% | |
| Household Products | 12.3% | |
| All Others* | 5.8% | |

* Includes short-term investments and net other assets (liabilities).
Consumer Staples Portfolio
Investments August 31, 2015 (Unaudited)
Showing Percentage of Net Assets
| Common Stocks - 99.0% | |||
| Shares | Value | ||
| Beverages - 23.4% | |||
| Brewers - 2.8% | |||
| Anheuser-Busch InBev SA NV | 343,090 | $37,420,380 | |
| SABMiller PLC | 839,084 | 39,322,522 | |
| 76,742,902 | |||
| Distillers & Vintners - 2.3% | |||
| Diageo PLC sponsored ADR | 370,226 | 39,380,940 | |
| Remy Cointreau SA (a) | 359,676 | 21,334,847 | |
| 60,715,787 | |||
| Soft Drinks - 18.3% | |||
| Coca-Cola Bottling Co. Consolidated | 120,318 | 18,556,645 | |
| Coca-Cola Central Japan Co. Ltd. | 360,900 | 6,520,314 | |
| Coca-Cola FEMSA S.A.B. de CV sponsored ADR | 58,029 | 4,178,668 | |
| Coca-Cola Icecek Sanayi A/S | 990,162 | 12,248,164 | |
| Embotelladora Andina SA: | |||
| ADR (a) | 481,227 | 7,747,755 | |
| sponsored ADR | 73,900 | 1,537,859 | |
| Fomento Economico Mexicano S.A.B. de CV sponsored ADR | 79,587 | 7,085,631 | |
| Monster Beverage Corp. (b) | 637,000 | 88,199,020 | |
| PepsiCo, Inc. | 2,777,318 | 258,096,162 | |
| The Coca-Cola Co. | 2,258,418 | 88,800,996 | |
| 492,971,214 | |||
| TOTAL BEVERAGES | 630,429,903 | ||
| Chemicals - 0.1% | |||
| Specialty Chemicals - 0.1% | |||
| Senomyx, Inc. (a)(b) | 425,655 | 2,834,862 | |
| Food & Staples Retailing - 23.6% | |||
| Drug Retail - 10.6% | |||
| CVS Health Corp. | 2,756,076 | 282,222,182 | |
| Drogasil SA | 390,400 | 4,273,608 | |
| 286,495,790 | |||
| Food Distributors - 1.2% | |||
| Chefs' Warehouse Holdings (a)(b) | 544,969 | 8,250,831 | |
| United Natural Foods, Inc. (b) | 466,581 | 22,465,875 | |
| 30,716,706 | |||
| Food Retail - 7.8% | |||
| Fresh Market, Inc. (a)(b) | 905,424 | 19,493,779 | |
| Kroger Co. | 4,603,436 | 158,818,542 | |
| Sprouts Farmers Market LLC (b) | 1,614,529 | 32,887,956 | |
| 211,200,277 | |||
| Hypermarkets & Super Centers - 4.0% | |||
| Costco Wholesale Corp. | 57,850 | 8,101,893 | |
| Wal-Mart Stores, Inc. | 1,539,056 | 99,623,095 | |
| 107,724,988 | |||
| TOTAL FOOD & STAPLES RETAILING | 636,137,761 | ||
| Food Products - 13.3% | |||
| Agricultural Products - 2.1% | |||
| Bunge Ltd. | 690,613 | 50,034,912 | |
| SLC Agricola SA | 1,290,200 | 5,724,103 | |
| 55,759,015 | |||
| Packaged Foods & Meats - 11.2% | |||
| Amplify Snack Brands, Inc. | 720,200 | 9,492,236 | |
| Blue Buffalo Pet Products, Inc. (b) | 166,842 | 4,262,813 | |
| Inner Mongoli Yili Industries Co. Ltd. | 1,610,842 | 4,069,799 | |
| Keurig Green Mountain, Inc. | 1,630,023 | 92,259,302 | |
| Lindt & Spruengli AG | 90 | 6,059,742 | |
| Mead Johnson Nutrition Co. Class A | 1,599,816 | 125,329,585 | |
| Nestle SA | 393,790 | 29,009,296 | |
| The Hain Celestial Group, Inc. (b) | 407,478 | 24,799,111 | |
| Ulker Biskuvi Sanayi A/S | 1,010,525 | 6,215,303 | |
| 301,497,187 | |||
| TOTAL FOOD PRODUCTS | 357,256,202 | ||
| Health Care Providers & Services - 0.1% | |||
| Health Care Services - 0.1% | |||
| Diplomat Pharmacy, Inc. | 42,900 | 1,694,121 | |
| Hotels, Restaurants & Leisure - 1.6% | |||
| Restaurants - 1.6% | |||
| ARAMARK Holdings Corp. | 1,342,628 | 42,077,962 | |
| Household Durables - 0.3% | |||
| Household Appliances - 0.2% | |||
| SodaStream International Ltd. (a)(b) | 389,815 | 5,940,781 | |
| Housewares & Specialties - 0.1% | |||
| Tupperware Brands Corp. | 73,000 | 3,739,790 | |
| TOTAL HOUSEHOLD DURABLES | 9,680,571 | ||
| Household Products - 13.7% | |||
| Household Products - 13.7% | |||
| Colgate-Palmolive Co. | 1,668,275 | 104,784,353 | |
| Procter & Gamble Co. | 3,718,365 | 262,776,855 | |
| Svenska Cellulosa AB (SCA) (B Shares) | 70,800 | 2,018,795 | |
| 369,580,003 | |||
| Personal Products - 2.9% | |||
| Personal Products - 2.9% | |||
| Avon Products, Inc. (a) | 1,426,500 | 7,403,535 | |
| Coty, Inc. Class A | 234,200 | 7,098,602 | |
| Herbalife Ltd. (b) | 440,010 | 25,331,376 | |
| L'Oreal SA | 116,700 | 19,996,814 | |
| Nu Skin Enterprises, Inc. Class A (a) | 257,967 | 11,783,933 | |
| Unilever NV (NY Reg.) | 167,698 | 6,728,044 | |
| 78,342,304 | |||
| Pharmaceuticals - 0.0% | |||
| Pharmaceuticals - 0.0% | |||
| Perrigo Co. PLC | 7,200 | 1,317,384 | |
| Tobacco - 20.0% | |||
| Tobacco - 20.0% | |||
| Altria Group, Inc. | 2,222,045 | 119,057,171 | |
| British American Tobacco PLC sponsored ADR | 2,807,765 | 297,566,931 | |
| ITC Ltd. | 1,820,070 | 8,920,419 | |
| Philip Morris International, Inc. | 593,358 | 47,349,968 | |
| Reynolds American, Inc. | 671,600 | 56,246,500 | |
| Souza Cruz SA | 1,264,000 | 9,250,013 | |
| 538,391,002 | |||
| TOTAL COMMON STOCKS | |||
| (Cost $2,192,411,429) | 2,667,742,075 | ||
| Nonconvertible Preferred Stocks - 0.1% | |||
| Beverages - 0.1% | |||
| Brewers - 0.1% | |||
| Ambev SA sponsored ADR | |||
| (Cost $1,095,710) | 467,510 | 2,463,778 | |
| Money Market Funds - 1.9% | |||
| Fidelity Cash Central Fund, 0.15% (c) | 21,104,995 | 21,104,995 | |
| Fidelity Securities Lending Cash Central Fund, 0.19% (c)(d) | 29,388,738 | 29,388,738 | |
| TOTAL MONEY MARKET FUNDS | |||
| (Cost $50,493,733) | 50,493,733 | ||
| TOTAL INVESTMENT PORTFOLIO - 101.0% | |||
| (Cost $2,244,000,872) | 2,720,699,586 | ||
| NET OTHER ASSETS (LIABILITIES) - (1.0)% | (26,833,561) | ||
| NET ASSETS - 100% | $2,693,866,025 |
Legend
(a) Security or a portion of the security is on loan at period end.
(b) Non-income producing
(c) Affiliated fund that is generally available only to investment companies and other accounts managed by Fidelity Investments. The rate quoted is the annualized seven-day yield of the fund at period end. A complete unaudited listing of the fund's holdings as of its most recent quarter end is available upon request. In addition, each Fidelity Central Fund's financial statements are available on the SEC's website or upon request.
(d) Investment made with cash collateral received from securities on loan.
Affiliated Central Funds
Information regarding fiscal year to date income earned by the Fund from investments in Fidelity Central Funds is as follows:
| Fund | Income earned |
| Fidelity Cash Central Fund | $40,101 |
| Fidelity Securities Lending Cash Central Fund | 140,230 |
| Total | $180,331 |
Investment Valuation
The following is a summary of the inputs used, as of August 31, 2015, involving the Fund's assets and liabilities carried at fair value. The inputs or methodology used for valuing securities may not be an indication of the risk associated with investing in those securities. For more information on valuation inputs, and their aggregation into the levels used below, please refer to the Investment Valuation section in the accompanying Notes to Financial Statements.
| Valuation Inputs at Reporting Date: | ||||
| Description | Total | Level 1 | Level 2 | Level 3 |
| Investments in Securities: | ||||
| Common Stocks | $2,667,742,075 | $2,594,792,085 | $72,949,990 | $-- |
| Nonconvertible Preferred Stocks | 2,463,778 | 2,463,778 | -- | -- |
| Money Market Funds | 50,493,733 | 50,493,733 | -- | -- |
| Total Investments in Securities: | $2,720,699,586 | $2,647,749,596 | $72,949,990 | $-- |
Other Information
Distribution of investments by country or territory of incorporation, as a percentage of Total Net Assets, is as follows (Unaudited):
| United States of America | 75.7% |
| United Kingdom | 14.0% |
| Bermuda | 1.9% |
| France | 1.5% |
| Belgium | 1.4% |
| Switzerland | 1.3% |
| Others (Individually Less Than 1%) | 4.2% |
| 100.0% |
See accompanying notes which are an integral part of the financial statements.
Consumer Staples Portfolio
Financial Statements
Statement of Assets and Liabilities
| August 31, 2015 (Unaudited) | ||
| Assets | ||
| Investment in securities, at value (including securities loaned of $28,785,296) — See accompanying schedule: Unaffiliated issuers (cost $2,193,507,139) | $2,670,205,853 | |
| Fidelity Central Funds (cost $50,493,733) | 50,493,733 | |
| Total Investments (cost $2,244,000,872) | $2,720,699,586 | |
| Receivable for investments sold | 5,391,290 | |
| Receivable for fund shares sold | 3,120,282 | |
| Dividends receivable | 8,251,366 | |
| Distributions receivable from Fidelity Central Funds | 36,075 | |
| Prepaid expenses | 21,709 | |
| Other receivables | 81,452 | |
| Total assets | 2,737,601,760 | |
| Liabilities | ||
| Payable for investments purchased | $8,063,869 | |
| Payable for fund shares redeemed | 4,069,059 | |
| Accrued management fee | 1,289,040 | |
| Distribution and service plan fees payable | 314,728 | |
| Other affiliated payables | 500,944 | |
| Other payables and accrued expenses | 109,357 | |
| Collateral on securities loaned, at value | 29,388,738 | |
| Total liabilities | 43,735,735 | |
| Net Assets | $2,693,866,025 | |
| Net Assets consist of: | ||
| Paid in capital | $2,103,937,906 | |
| Undistributed net investment income | 29,254,409 | |
| Accumulated undistributed net realized gain (loss) on investments and foreign currency transactions | 83,993,911 | |
| Net unrealized appreciation (depreciation) on investments and assets and liabilities in foreign currencies | 476,679,799 | |
| Net Assets | $2,693,866,025 | |
| Calculation of Maximum Offering Price | ||
| Class A: | ||
| Net Asset Value and redemption price per share ($392,461,247 ÷ 4,444,616 shares) | $88.30 | |
| Maximum offering price per share (100/94.25 of $88.30) | $93.69 | |
| Class T: | ||
| Net Asset Value and redemption price per share ($69,027,907 ÷ 788,204 shares) | $87.58 | |
| Maximum offering price per share (100/96.50 of $87.58) | $90.76 | |
| Class B: | ||
| Net Asset Value and offering price per share ($10,629,683 ÷ 122,152 shares)(a) | $87.02 | |
| Class C: | ||
| Net Asset Value and offering price per share ($219,219,473 ÷ 2,542,393 shares)(a) | $86.23 | |
| Consumer Staples: | ||
| Net Asset Value, offering price and redemption price per share ($1,833,149,595 ÷ 20,591,131 shares) | $89.03 | |
| Class I: | ||
| Net Asset Value, offering price and redemption price per share ($169,378,120 ÷ 1,905,167 shares) | $88.90 |
(a) Redemption price per share is equal to net asset value less any applicable contingent deferred sales charge.
See accompanying notes which are an integral part of the financial statements.
Statement of Operations
| Six months ended August 31, 2015 (Unaudited) | ||
| Investment Income | ||
| Dividends | $42,300,928 | |
| Interest | 10 | |
| Income from Fidelity Central Funds | 180,331 | |
| Total income | 42,481,269 | |
| Expenses | ||
| Management fee | $8,030,301 | |
| Transfer agent fees | 2,664,655 | |
| Distribution and service plan fees | 1,927,652 | |
| Accounting and security lending fees | 434,955 | |
| Custodian fees and expenses | 48,588 | |
| Independent trustees' compensation | 25,230 | |
| Registration fees | 150,698 | |
| Audit | 31,998 | |
| Legal | 18,552 | |
| Miscellaneous | 16,078 | |
| Total expenses before reductions | 13,348,707 | |
| Expense reductions | (167,966) | 13,180,741 |
| Net investment income (loss) | 29,300,528 | |
| Realized and Unrealized Gain (Loss)
Net realized gain (loss) on: | ||
| Investment securities: | ||
| Unaffiliated issuers | 92,999,124 | |
| Foreign currency transactions | (32,263) | |
| Total net realized gain (loss) | 92,966,861 | |
| Change in net unrealized appreciation (depreciation) on: Investment securities (net of decrease in deferred foreign taxes of $18,850) | (419,060,852) | |
| Assets and liabilities in foreign currencies | 6,754 | |
| Total change in net unrealized appreciation (depreciation) | (419,054,098) | |
| Net gain (loss) | (326,087,237) | |
| Net increase (decrease) in net assets resulting from operations | $(296,786,709) |
See accompanying notes which are an integral part of the financial statements.
Statement of Changes in Net Assets
| Six months ended August 31, 2015 (Unaudited) | Year ended February 28, 2015 | |
| Increase (Decrease) in Net Assets | ||
| Operations | ||
| Net investment income (loss) | $29,300,528 | $40,432,818 |
| Net realized gain (loss) | 92,966,861 | 155,658,969 |
| Change in net unrealized appreciation (depreciation) | (419,054,098) | 315,382,310 |
| Net increase (decrease) in net assets resulting from operations | (296,786,709) | 511,474,097 |
| Distributions to shareholders from net investment income | (5,994,066) | (39,618,532) |
| Distributions to shareholders from net realized gain | (95,685,262) | (102,399,285) |
| Total distributions | (101,679,328) | (142,017,817) |
| Share transactions - net increase (decrease) | (19,783,740) | 686,786,861 |
| Redemption fees | 18,425 | 51,833 |
| Total increase (decrease) in net assets | (418,231,352) | 1,056,294,974 |
| Net Assets | ||
| Beginning of period | 3,112,097,377 | 2,055,802,403 |
| End of period (including undistributed net investment income of $29,254,409 and undistributed net investment income of $5,947,947, respectively) | $2,693,866,025 | $3,112,097,377 |
See accompanying notes which are an integral part of the financial statements.
Financial Highlights — Consumer Staples Portfolio Class A
| Six months ended (Unaudited) | Years ended February 28, | |||||
| August 31, | 2015 | 2015 | 2014 | 2013 | 2012A | 2011 |
| Selected Per–Share Data | ||||||
| Net asset value, beginning of period | $101.33 | $87.93 | $85.67 | $74.90 | $67.65 | $61.06 |
| Income from Investment Operations | ||||||
| Net investment income (loss)B | .89 | 1.37 | 1.43 | 1.26 | 1.22 | .98 |
| Net realized and unrealized gain (loss) | (10.59) | 17.28 | 7.51 | 11.73 | 8.73 | 7.10 |
| Total from investment operations | (9.70) | 18.65 | 8.94 | 12.99 | 9.95 | 8.08 |
| Distributions from net investment income | (.18) | (1.28) | (1.44) | (1.08) | (1.06) | (.83) |
| Distributions from net realized gain | (3.15) | (3.98) | (5.24) | (1.14) | (1.64) | (.66) |
| Total distributions | (3.33) | (5.25)C | (6.68) | (2.22) | (2.70) | (1.49) |
| Redemption fees added to paid in capitalB,D | – | – | – | – | – | – |
| Net asset value, end of period | $88.30 | $101.33 | $87.93 | $85.67 | $74.90 | $67.65 |
| Total ReturnE,F,G | (9.87)% | 21.95% | 10.53% | 17.60% | 15.00% | 13.27% |
| Ratios to Average Net AssetsH,I | ||||||
| Expenses before reductions | 1.04%J | 1.05% | 1.06% | 1.08% | 1.10% | 1.11% |
| Expenses net of fee waivers, if any | 1.04%J | 1.05% | 1.06% | 1.08% | 1.10% | 1.11% |
| Expenses net of all reductions | 1.04%J | 1.05% | 1.06% | 1.08% | 1.09% | 1.11% |
| Net investment income (loss) | 1.86%J | 1.45% | 1.61% | 1.58% | 1.74% | 1.53% |
| Supplemental Data | ||||||
| Net assets, end of period (000 omitted) | $392,461 | $414,151 | $329,459 | $277,329 | $205,851 | $160,526 |
| Portfolio turnover rateK | 61%J | 42%L | 31% | 28% | 35% | 57% |
A For the year ended February 29.
B Calculated based on average shares outstanding during the period.
C Total distributions of $5.25 per share is comprised of distributions from net investment income of $1.275 and distributions from net realized gain of $3.976 per share.
D Amount represents less than $.005 per share.
E Total returns for periods of less than one year are not annualized.
F Total returns would have been lower if certain expenses had not been reduced during the applicable periods shown.
G Total returns do not include the effect of the sales charges.
H Fees and expenses of any underlying Fidelity Central Funds are not included in the Fund's expense ratio. The Fund indirectly bears its proportionate share of the expenses of any underlying Fidelity Central Funds.
I Expense ratios reflect operating expenses of the class. Expenses before reductions do not reflect amounts reimbursed by the investment adviser or reductions from brokerage service arrangements or reductions from other expense offset arrangements and do not represent the amount paid by the class during periods when reimbursements or reductions occur. Expenses net of fee waivers reflect expenses after reimbursement by the investment adviser but prior to reductions from brokerage service arrangements or other expense offset arrangements. Expenses net of all reductions represent the net expenses paid by the class.
J Annualized
K Amount does not include the portfolio activity of any underlying Fidelity Central Funds.
L Portfolio turnover rate excludes securities received or delivered in-kind.
See accompanying notes which are an integral part of the financial statements.
Financial Highlights — Consumer Staples Portfolio Class T
| Six months ended (Unaudited) | Years ended February 28, | |||||
| August 31, | 2015 | 2015 | 2014 | 2013 | 2012A | 2011 |
| Selected Per–Share Data | ||||||
| Net asset value, beginning of period | $100.61 | $87.37 | $85.18 | $74.49 | $67.30 | $60.77 |
| Income from Investment Operations | ||||||
| Net investment income (loss)B | .75 | 1.10 | 1.18 | 1.03 | 1.01 | .79 |
| Net realized and unrealized gain (loss) | (10.49) | 17.15 | 7.46 | 11.68 | 8.68 | 7.05 |
| Total from investment operations | (9.74) | 18.25 | 8.64 | 12.71 | 9.69 | 7.84 |
| Distributions from net investment income | (.13) | (1.04) | (1.21) | (.88) | (.86) | (.65) |
| Distributions from net realized gain | (3.15) | (3.98) | (5.24) | (1.14) | (1.64) | (.66) |
| Total distributions | (3.29)C | (5.01)D | (6.45) | (2.02) | (2.50) | (1.31) |
| Redemption fees added to paid in capitalB,E | – | – | – | – | – | – |
| Net asset value, end of period | $87.58 | $100.61 | $87.37 | $85.18 | $74.49 | $67.30 |
| Total ReturnF,G,H | (9.99)% | 21.60% | 10.23% | 17.29% | 14.67% | 12.93% |
| Ratios to Average Net AssetsI,J | ||||||
| Expenses before reductions | 1.32%K | 1.32% | 1.33% | 1.36% | 1.38% | 1.40% |
| Expenses net of fee waivers, if any | 1.32%K | 1.32% | 1.33% | 1.36% | 1.38% | 1.40% |
| Expenses net of all reductions | 1.31%K | 1.32% | 1.33% | 1.35% | 1.38% | 1.40% |
| Net investment income (loss) | 1.59%K | 1.18% | 1.34% | 1.30% | 1.45% | 1.24% |
| Supplemental Data | ||||||
| Net assets, end of period (000 omitted) | $69,028 | $81,489 | $61,421 | $52,024 | $39,047 | $31,496 |
| Portfolio turnover rateL | 61%K | 42%M | 31% | 28% | 35% | 57% |
A For the year ended February 29.
B Calculated based on average shares outstanding during the period.
C Total distributions of $3.29 per share is comprised of distributions from net investment income of $.134 and distributions from net realized gain of $3.152 per share.
D Total distributions of $5.01 per share is comprised of distributions from net investment income of $1.036 and distributions from net realized gain of $3.976 per share.
E Amount represents less than $.005 per share.
F Total returns for periods of less than one year are not annualized.
G Total returns would have been lower if certain expenses had not been reduced during the applicable periods shown.
H Total returns do not include the effect of the sales charges.
I Fees and expenses of any underlying Fidelity Central Funds are not included in the Fund's expense ratio. The Fund indirectly bears its proportionate share of the expenses of any underlying Fidelity Central Funds.
J Expense ratios reflect operating expenses of the class. Expenses before reductions do not reflect amounts reimbursed by the investment adviser or reductions from brokerage service arrangements or reductions from other expense offset arrangements and do not represent the amount paid by the class during periods when reimbursements or reductions occur. Expenses net of fee waivers reflect expenses after reimbursement by the investment adviser but prior to reductions from brokerage service arrangements or other expense offset arrangements. Expenses net of all reductions represent the net expenses paid by the class.
K Annualized
L Amount does not include the portfolio activity of any underlying Fidelity Central Funds.
M Portfolio turnover rate excludes securities received or delivered in-kind.
See accompanying notes which are an integral part of the financial statements.
Financial Highlights — Consumer Staples Portfolio Class B
| Six months ended (Unaudited) | Years ended February 28, | |||||
| August 31, | 2015 | 2015 | 2014 | 2013 | 2012A | 2011 |
| Selected Per–Share Data | ||||||
| Net asset value, beginning of period | $100.13 | $86.90 | $84.72 | $74.01 | $66.83 | $60.37 |
| Income from Investment Operations | ||||||
| Net investment income (loss)B | .52 | .63 | .71 | .61 | .64 | .46 |
| Net realized and unrealized gain (loss) | (10.44) | 17.06 | 7.40 | 11.61 | 8.61 | 6.98 |
| Total from investment operations | (9.92) | 17.69 | 8.11 | 12.22 | 9.25 | 7.44 |
| Distributions from net investment income | (.03) | (.48) | (.69) | (.37) | (.43) | (.32) |
| Distributions from net realized gain | (3.15) | (3.98) | (5.24) | (1.14) | (1.64) | (.66) |
| Total distributions | (3.19)C | (4.46) | (5.93) | (1.51) | (2.07) | (.98) |
| Redemption fees added to paid in capitalB,D | – | – | – | – | – | – |
| Net asset value, end of period | $87.02 | $100.13 | $86.90 | $84.72 | $74.01 | $66.83 |
| Total ReturnE,F,G | (10.21)% | 21.01% | 9.63% | 16.68% | 14.06% | 12.35% |
| Ratios to Average Net AssetsH,I | ||||||
| Expenses before reductions | 1.81%J | 1.82% | 1.86% | 1.89% | 1.91% | 1.91% |
| Expenses net of fee waivers, if any | 1.81%J | 1.82% | 1.86% | 1.89% | 1.91% | 1.91% |
| Expenses net of all reductions | 1.80%J | 1.82% | 1.86% | 1.88% | 1.90% | 1.91% |
| Net investment income (loss) | 1.10%J | .68% | .81% | .78% | .93% | .73% |
| Supplemental Data | ||||||
| Net assets, end of period (000 omitted) | $10,630 | $15,799 | $17,388 | $18,548 | $19,330 | $20,033 |
| Portfolio turnover rateK | 61%J | 42%L | 31% | 28% | 35% | 57% |
A For the year ended February 29.
B Calculated based on average shares outstanding during the period.
C Total distributions of $3.19 per share is comprised of distributions from net investment income of $.033 and distributions from net realized gain of $3.152 per share.
D Amount represents less than $.005 per share.
E Total returns for periods of less than one year are not annualized.
F Total returns would have been lower if certain expenses had not been reduced during the applicable periods shown.
G Total returns do not include the effect of the contingent deferred sales charge.
H Fees and expenses of any underlying Fidelity Central Funds are not included in the Fund's expense ratio. The Fund indirectly bears its proportionate share of the expenses of any underlying Fidelity Central Funds.
I Expense ratios reflect operating expenses of the class. Expenses before reductions do not reflect amounts reimbursed by the investment adviser or reductions from brokerage service arrangements or reductions from other expense offset arrangements and do not represent the amount paid by the class during periods when reimbursements or reductions occur. Expenses net of fee waivers reflect expenses after reimbursement by the investment adviser but prior to reductions from brokerage service arrangements or other expense offset arrangements. Expenses net of all reductions represent the net expenses paid by the class.
J Annualized
K Amount does not include the portfolio activity of any underlying Fidelity Central Funds.
L Portfolio turnover rate excludes securities received or delivered in-kind.
See accompanying notes which are an integral part of the financial statements.
Financial Highlights — Consumer Staples Portfolio Class C
| Six months ended (Unaudited) | Years ended February 28, | |||||
| August 31, | 2015 | 2015 | 2014 | 2013 | 2012A | 2011 |
| Selected Per–Share Data | ||||||
| Net asset value, beginning of period | $99.27 | $86.32 | $84.28 | $73.75 | $66.71 | $60.29 |
| Income from Investment Operations | ||||||
| Net investment income (loss)B | .52 | .65 | .75 | .65 | .68 | .49 |
| Net realized and unrealized gain (loss) | (10.34) | 16.93 | 7.36 | 11.55 | 8.59 | 7.00 |
| Total from investment operations | (9.82) | 17.58 | 8.11 | 12.20 | 9.27 | 7.49 |
| Distributions from net investment income | (.06) | (.65) | (.84) | (.53) | (.59) | (.41) |
| Distributions from net realized gain | (3.15) | (3.98) | (5.24) | (1.14) | (1.64) | (.66) |
| Total distributions | (3.22)C | (4.63) | (6.07)D | (1.67) | (2.23) | (1.07) |
| Redemption fees added to paid in capitalB,E | – | – | – | – | – | – |
| Net asset value, end of period | $86.23 | $99.27 | $86.32 | $84.28 | $73.75 | $66.71 |
| Total ReturnF,G,H | (10.20)% | 21.03% | 9.70% | 16.73% | 14.14% | 12.44% |
| Ratios to Average Net AssetsI,J | ||||||
| Expenses before reductions | 1.80%K | 1.80% | 1.82% | 1.83% | 1.85% | 1.86% |
| Expenses net of fee waivers, if any | 1.80%K | 1.80% | 1.82% | 1.83% | 1.85% | 1.86% |
| Expenses net of all reductions | 1.79%K | 1.80% | 1.81% | 1.82% | 1.84% | 1.85% |
| Net investment income (loss) | 1.11%K | .70% | .85% | .83% | .99% | .79% |
| Supplemental Data | ||||||
| Net assets, end of period (000 omitted) | $219,219 | $228,151 | $164,669 | $134,966 | $102,321 | $81,239 |
| Portfolio turnover rateL | 61%K | 42%M | 31% | 28% | 35% | 57% |
A For the year ended February 29.
B Calculated based on average shares outstanding during the period.
C Total distributions of $3.22 per share is comprised of distributions from net investment income of $.064 and distributions from net realized gain of $3.152 per share.
D Total distributions of $6.07 per share is comprised of distributions from net investment income of $.837 and distributions from net realized gain of $5.237 per share.
E Amount represents less than $.005 per share.
F Total returns for periods of less than one year are not annualized.
G Total returns would have been lower if certain expenses had not been reduced during the applicable periods shown.
H Total returns do not include the effect of the contingent deferred sales charge.
I Fees and expenses of any underlying Fidelity Central Funds are not included in the Fund's expense ratio. The Fund indirectly bears its proportionate share of the expenses of any underlying Fidelity Central Funds.
J Expense ratios reflect operating expenses of the class. Expenses before reductions do not reflect amounts reimbursed by the investment adviser or reductions from brokerage service arrangements or reductions from other expense offset arrangements and do not represent the amount paid by the class during periods when reimbursements or reductions occur. Expenses net of fee waivers reflect expenses after reimbursement by the investment adviser but prior to reductions from brokerage service arrangements or other expense offset arrangements. Expenses net of all reductions represent the net expenses paid by the class.
K Annualized
L Amount does not include the portfolio activity of any underlying Fidelity Central Funds.
M Portfolio turnover rate excludes securities received or delivered in-kind.
See accompanying notes which are an integral part of the financial statements.
Financial Highlights — Consumer Staples Portfolio
| Six months ended (Unaudited) | Years ended February 28, | |||||
| August 31, | 2015 | 2015 | 2014 | 2013 | 2012A | 2011 |
| Selected Per–Share Data | ||||||
| Net asset value, beginning of period | $102.03 | $88.51 | $86.17 | $75.29 | $67.98 | $61.34 |
| Income from Investment Operations | ||||||
| Net investment income (loss)B | 1.03 | 1.64 | 1.69 | 1.48 | 1.42 | 1.14 |
| Net realized and unrealized gain (loss) | (10.66) | 17.40 | 7.55 | 11.82 | 8.76 | 7.14 |
| Total from investment operations | (9.63) | 19.04 | 9.24 | 13.30 | 10.18 | 8.28 |
| Distributions from net investment income | (.22) | (1.54) | (1.66) | (1.28) | (1.24) | (.98) |
| Distributions from net realized gain | (3.15) | (3.98) | (5.24) | (1.14) | (1.64) | (.66) |
| Total distributions | (3.37) | (5.52) | (6.90) | (2.42) | (2.87)C | (1.64) |
| Redemption fees added to paid in capitalB,D | – | – | – | – | – | – |
| Net asset value, end of period | $89.03 | $102.03 | $88.51 | $86.17 | $75.29 | $67.98 |
| Total ReturnE,F | (9.74)% | 22.27% | 10.82% | 17.94% | 15.30% | 13.55% |
| Ratios to Average Net AssetsG,H | ||||||
| Expenses before reductions | .77%I | .77% | .79% | .81% | .83% | .86% |
| Expenses net of fee waivers, if any | .77%I | .77% | .79% | .81% | .83% | .86% |
| Expenses net of all reductions | .76%I | .77% | .79% | .80% | .82% | .86% |
| Net investment income (loss) | 2.14%I | 1.73% | 1.88% | 1.85% | 2.01% | 1.78% |
| Supplemental Data | ||||||
| Net assets, end of period (000 omitted) | $1,833,150 | $2,173,970 | $1,328,594 | $1,425,055 | $1,202,440 | $877,548 |
| Portfolio turnover rateJ | 61%I | 42%K | 31% | 28% | 35% | 57% |
A For the year ended February 29.
B Calculated based on average shares outstanding during the period.
C Total distributions of $2.87 per share is comprised of distributions from net investment income of $1.236 and distributions from net realized gain of $1.637 per share.
D Amount represents less than $.005 per share.
E Total returns for periods of less than one year are not annualized.
F Total returns would have been lower if certain expenses had not been reduced during the applicable periods shown.
G Fees and expenses of any underlying Fidelity Central Funds are not included in the Fund's expense ratio. The Fund indirectly bears its proportionate share of the expenses of any underlying Fidelity Central Funds.
H Expense ratios reflect operating expenses of the class. Expenses before reductions do not reflect amounts reimbursed by the investment adviser or reductions from brokerage service arrangements or reductions from other expense offset arrangements and do not represent the amount paid by the class during periods when reimbursements or reductions occur. Expenses net of fee waivers reflect expenses after reimbursement by the investment adviser but prior to reductions from brokerage service arrangements or other expense offset arrangements. Expenses net of all reductions represent the net expenses paid by the class.
I Annualized
J Amount does not include the portfolio activity of any underlying Fidelity Central Funds.
K Portfolio turnover rate excludes securities received or delivered in-kind.
See accompanying notes which are an integral part of the financial statements.
Financial Highlights — Consumer Staples Portfolio Class I
| Six months ended (Unaudited) | Years ended February 28, | |||||
| August 31, | 2015 | 2015 | 2014 | 2013 | 2012A | 2011 |
| Selected Per–Share Data | ||||||
| Net asset value, beginning of period | $101.91 | $88.33 | $85.92 | $75.14 | $67.84 | $61.26 |
| Income from Investment Operations | ||||||
| Net investment income (loss)B | 1.03 | 1.59 | 1.66 | 1.45 | 1.39 | 1.15 |
| Net realized and unrealized gain (loss) | (10.67) | 17.40 | 7.53 | 11.79 | 8.73 | 7.13 |
| Total from investment operations | (9.64) | 18.99 | 9.19 | 13.24 | 10.12 | 8.28 |
| Distributions from net investment income | (.22) | (1.44) | (1.54) | (1.32) | (1.19) | (1.04) |
| Distributions from net realized gain | (3.15) | (3.98) | (5.24) | (1.14) | (1.64) | (.66) |
| Total distributions | (3.37) | (5.41)C | (6.78) | (2.46) | (2.82)D | (1.70) |
| Redemption fees added to paid in capitalB,E | – | – | – | – | – | – |
| Net asset value, end of period | $88.90 | $101.91 | $88.33 | $85.92 | $75.14 | $67.84 |
| Total ReturnF,G | (9.76)% | 22.26% | 10.80% | 17.90% | 15.24% | 13.57% |
| Ratios to Average Net AssetsH,I | ||||||
| Expenses before reductions | .78%J | .80% | .82% | .85% | .87% | .87% |
| Expenses net of fee waivers, if any | .77%J | .80% | .82% | .85% | .87% | .87% |
| Expenses net of all reductions | .77%J | .80% | .82% | .84% | .87% | .87% |
| Net investment income (loss) | 2.13%J | 1.70% | 1.85% | 1.81% | 1.96% | 1.77% |
| Supplemental Data | ||||||
| Net assets, end of period (000 omitted) | $169,378 | $198,538 | $154,271 | $378,731 | $163,544 | $237,883 |
| Portfolio turnover rateK | 61%J | 42%L | 31% | 28% | 35% | 57% |
A For the year ended February 29.
B Calculated based on average shares outstanding during the period.
C Total distributions of $5.41 per share is comprised of distributions from net investment income of $1.436 and distributions from net realized gain of $3.976 per share.
D Total distributions of $2.82 per share is comprised of distributions from net investment income of $1.186 and distributions from net realized gain of $1.637 per share.
E Amount represents less than $.005 per share.
F Total returns for periods of less than one year are not annualized.
G Total returns would have been lower if certain expenses had not been reduced during the applicable periods shown.
H Fees and expenses of any underlying Fidelity Central Funds are not included in the Fund's expense ratio. The Fund indirectly bears its proportionate share of the expenses of any underlying Fidelity Central Funds.
I Expense ratios reflect operating expenses of the class. Expenses before reductions do not reflect amounts reimbursed by the investment adviser or reductions from brokerage service arrangements or reductions from other expense offset arrangements and do not represent the amount paid by the class during periods when reimbursements or reductions occur. Expenses net of fee waivers reflect expenses after reimbursement by the investment adviser but prior to reductions from brokerage service arrangements or other expense offset arrangements. Expenses net of all reductions represent the net expenses paid by the class.
J Annualized
K Amount does not include the portfolio activity of any underlying Fidelity Central Funds.
L Portfolio turnover rate excludes securities received or delivered in-kind.
See accompanying notes which are an integral part of the financial statements.
Notes to Financial Statements (Unaudited)
For the period ended August 31, 2015
1. Organization.
Consumer Staples Portfolio (the Fund) is a non-diversified fund of Fidelity Select Portfolios (the Trust) and is authorized to issue an unlimited number of shares. The Trust is registered under the Investment Company Act of 1940, as amended (the 1940 Act), as an open-end management investment company organized as a Massachusetts business trust. The Fund invests primarily in securities of companies whose principal business activities fall within specific industries. The Fund offers Class A, Class T, Class C, Consumer Staples and Class I (formerly Institutional Class) shares, each of which, along with Class B shares, has equal rights as to assets and voting privileges. Class B shares are closed to new accounts and additional purchases, except for exchanges and reinvestments. Each class has exclusive voting rights with respect to matters that affect that class. Class B shares will automatically convert to Class A shares after a holding period of seven years from the initial date of purchase.
2. Investments in Fidelity Central Funds.
The Fund invests in Fidelity Central Funds, which are open-end investment companies generally available only to other investment companies and accounts managed by the investment adviser and its affiliates. The Fund's Schedule of Investments lists each of the Fidelity Central Funds held as of period end, if any, as an investment of the Fund, but does not include the underlying holdings of each Fidelity Central Fund. As an Investing Fund, the Fund indirectly bears its proportionate share of the expenses of the underlying Fidelity Central Funds.
The Money Market Central Funds seek preservation of capital and current income and are managed by Fidelity Investments Money Management, Inc. (FIMM), an affiliate of the investment adviser. Annualized expenses of the Money Market Central Funds as of their most recent shareholder report date are less than .01%.
A complete unaudited list of holdings for each Fidelity Central Fund is available upon request or at the Securities and Exchange Commission (the SEC) website at www.sec.gov. In addition, the financial statements of the Fidelity Central Funds are available on the SEC website or upon request.
3. Significant Accounting Policies.
The financial statements have been prepared in conformity with accounting principles generally accepted in the United States of America (GAAP), which require management to make certain estimates and assumptions at the date of the financial statements. Actual results could differ from those estimates. Subsequent events, if any, through the date that the financial statements were issued have been evaluated in the preparation of the financial statements. The following summarizes the significant accounting policies of the Fund:
Investment Valuation. Investments are valued as of 4:00 p.m. Eastern time on the last calendar day of the period. The Board of Trustees (the Board) has delegated the day to day responsibility for the valuation of the Fund's investments to the Fidelity SelectCo, LLC (SelectCo) Fair Value Committee (the Committee). In accordance with valuation policies and procedures approved by the Board, the Fund attempts to obtain prices from one or more third party pricing vendors or brokers to value its investments. When current market prices, quotations or currency exchange rates are not readily available or reliable, investments will be fair valued in good faith by the Committee, in accordance with procedures adopted by the Board. Factors used in determining fair value vary by investment type and may include market or investment specific events. The frequency with which these procedures are used cannot be predicted and they may be utilized to a significant extent. The Committee oversees the Fund's valuation policies and procedures and reports to the Board on the Committee's activities and fair value determinations. The Board monitors the appropriateness of the procedures used in valuing the Fund's investments and ratifies the fair value determinations of the Committee.
The Fund categorizes the inputs to valuation techniques used to value its investments into a disclosure hierarchy consisting of three levels as shown below:
- Level 1 – quoted prices in active markets for identical investments
- Level 2 – other significant observable inputs (including quoted prices for similar investments, interest rates, prepayment speeds, etc.)
- Level 3 – unobservable inputs (including the Fund's own assumptions based on the best information available)
Valuation techniques used to value the Fund's investments by major category are as follows:
Equity securities, including restricted securities, for which market quotations are readily available, are valued at the last reported sale price or official closing price as reported by a third party pricing vendor on the primary market or exchange on which they are traded and are categorized as Level 1 in the hierarchy. In the event there were no sales during the day or closing prices are not available, securities are valued at the last quoted bid price or may be valued using the last available price and are generally categorized as Level 2 in the hierarchy. For foreign equity securities, when market or security specific events arise, comparisons to the valuation of American Depositary Receipts (ADRs), futures contracts, Exchange-Traded Funds (ETFs) and certain indexes as well as quoted prices for similar securities may be used and would be categorized as Level 2 in the hierarchy. Utilizing these techniques may result in transfers between Level 1 and Level 2. For equity securities, including restricted securities, where observable inputs are limited, assumptions about market activity and risk are used and these securities may be categorized as Level 3 in the hierarchy.
Investments in open-end mutual funds, including the Fidelity Central Funds, are valued at their closing net asset value (NAV) each business day and are categorized as Level 1 in the hierarchy.
Changes in valuation techniques may result in transfers in or out of an assigned level within the disclosure hierarchy. The aggregate value of investments by input level as of August 31, 2015, is included at the end of the Fund's Schedule of Investments.
Foreign Currency. The Fund may use foreign currency contracts to facilitate transactions in foreign-denominated securities. Gains and losses from these transactions may arise from changes in the value of the foreign currency or if the counterparties do not perform under the contracts' terms.
Foreign-denominated assets, including investment securities, and liabilities are translated into U.S. dollars at the exchange rates at period end. Purchases and sales of investment securities, income and dividends received and expenses denominated in foreign currencies are translated into U.S. dollars at the exchange rate in effect on the transaction date.
The effects of exchange rate fluctuations on investments are included with the net realized and unrealized gain (loss) on investment securities. Other foreign currency transactions resulting in realized and unrealized gain (loss) are disclosed separately.
Investment Transactions and Income. For financial reporting purposes, the Fund's investment holdings and NAV include trades executed through the end of the last business day of the period. The NAV per share for processing shareholder transactions is calculated as of the close of business of the New York Stock Exchange (NYSE), normally 4:00 p.m. Eastern time and includes trades executed through the end of the prior business day. Gains and losses on securities sold are determined on the basis of identified cost and may include proceeds received from litigation. Dividend income is recorded on the ex-dividend date, except for certain dividends from foreign securities where the ex-dividend date may have passed, which are recorded as soon as the Fund is informed of the ex-dividend date. Non-cash dividends included in dividend income, if any, are recorded at the fair market value of the securities received. Income and capital gain distributions from Fidelity Central Funds, if any, are recorded on the ex-dividend date. Interest income is accrued as earned and includes coupon interest and amortization of premium and accretion of discount on debt securities as applicable. Investment income is recorded net of foreign taxes withheld where recovery of such taxes is uncertain.
Class Allocations and Expenses. Investment income, realized and unrealized capital gains and losses, common expenses of the Fund, and certain fund-level expense reductions, if any, are allocated daily on a pro-rata basis to each class based on the relative net assets of each class to the total net assets of the Fund. Each class differs with respect to transfer agent and distribution and service plan fees incurred. Certain expense reductions may also differ by class. For the reporting period, the allocated portion of income and expenses to each class as a percent of its average net assets may vary due to the timing of recording these transactions in relation to fluctuating net assets of the classes. Expenses directly attributable to a fund are charged to that fund. Expenses attributable to more than one fund are allocated among the respective funds on the basis of relative net assets or other appropriate methods. Expense estimates are accrued in the period to which they relate and adjustments are made when actual amounts are known.
Deferred Trustee Compensation. Under a Deferred Compensation Plan (the Plan), independent Trustees may elect to defer receipt of a portion of their annual compensation. Deferred amounts are invested in a cross-section of Fidelity funds, are marked-to-market and remain in the Fund until distributed in accordance with the Plan. The investment of deferred amounts and the offsetting payable to the Trustees are included in the accompanying Statement of Assets and Liabilities.
Income Tax Information and Distributions to Shareholders. Each year, the Fund intends to qualify as a regulated investment company under Subchapter M of the Internal Revenue Code, including distributing substantially all of its taxable income and realized gains. As a result, no provision for U.S. Federal income taxes is required. The Fund files a U.S. federal tax return, in addition to state and local tax returns as required. The Fund's federal income tax returns are subject to examination by the Internal Revenue Service (IRS) for a period of three fiscal years after they are filed. State and local tax returns may be subject to examination for an additional fiscal year depending on the jurisdiction. Foreign taxes are provided for based on the Fund's understanding of the tax rules and rates that exist in the foreign markets in which it invests.
Distributions are declared and recorded on the ex-dividend date. Income dividends and capital gain distributions are declared separately for each class. Income and capital gain distributions are determined in accordance with income tax regulations, which may differ from GAAP.
Capital accounts within the financial statements are adjusted for permanent book-tax differences. These adjustments have no impact on net assets or the results of operations. Capital accounts are not adjusted for temporary book-tax differences which will reverse in a subsequent period.
Book-tax differences are primarily due to foreign currency transactions, redemptions in kind, deferred trustees compensation and losses deferred due to wash sales.
The federal tax cost of investment securities and unrealized appreciation (depreciation) as of period end were as follows:
| Gross unrealized appreciation | $639,524,517 |
| Gross unrealized depreciation | (174,608,013) |
| Net unrealized appreciation (depreciation) on securities | $464,916,504 |
| Tax cost | $2,255,783,082 |
Trading (Redemption) Fees. Shares held by investors in the Fund less than 30 days may be subject to a redemption fee equal to .75% of the NAV of shares redeemed. All redemption fees, which reduce the proceeds of the shareholder redemption, are retained by the Fund and accounted for as an addition to paid in capital.
4. Purchases and Sales of Investments.
Purchases and sales of securities, other than short-term securities, aggregated $873,186,629 and $945,351,325, respectively.
5. Fees and Other Transactions with Affiliates.
Management Fee. Fidelity SelectCo, LLC (the investment adviser) and its affiliates provide the Fund with investment management related services for which the Fund pays a monthly management fee. The management fee is the sum of an individual fund fee rate that is based on an annual rate of .30% of the Fund's average net assets and an annualized group fee rate that averaged .25% during the period. The group fee rate is based upon the average net assets of all the mutual funds advised by Fidelity Management & Research Company (FMR) and the investment adviser. The group fee rate decreases as assets under management increase and increases as assets under management decrease. For the reporting period, the total annualized management fee rate was .55% of the Fund's average net assets.
Distribution and Service Plan Fees. In accordance with Rule 12b-1 of the 1940 Act, the Fund has adopted separate Distribution and Service Plans for each class of shares. Certain classes pay Fidelity Distributors Corporation (FDC), an affiliate of the investment adviser, separate Distribution and Service Fees, each of which is based on an annual percentage of each class' average net assets. In addition, FDC may pay financial intermediaries for selling shares of the Fund and providing shareholder support services. For the period, the Distribution and Service Fee rates, total fees and amounts retained by FDC were as follows:
| Distribution Fee | Service Fee | Total Fees | Retained by FDC |
|
| Class A | -% | .25% | $516,274 | $– |
| Class T | .25% | .25% | 193,944 | – |
| Class B | .75% | .25% | 67,677 | 50,758 |
| Class C | .75% | .25% | 1,149,757 | 259,440 |
| $1,927,652 | $310,198 |
Sales Load. FDC may receive a front-end sales charge of up to 5.75% for selling Class A shares and 3.50% for selling Class T shares, some of which is paid to financial intermediaries for selling shares of the Fund. Depending on the holding period, FDC may receive contingent deferred sales charges levied on Class A, Class T, Class B, and Class C redemptions. The deferred sales charges range from 5.00% to 1.00% for Class B shares, 1.00% for Class C shares, 1.00% for certain purchases of Class A shares and .25% for certain purchases of Class T shares.
For the period, sales charge amounts retained by FDC were as follows:
| Retained by FDC |
|
| Class A | $181,597 |
| Class T | 24,783 |
| Class B* | 1,710 |
| Class C* | 12,483 |
| $220,573 |
* When Class B and Class C shares are initially sold, FDC pays commissions from its own resources to financial intermediaries through which the sales are made.
Transfer Agent Fees. Fidelity Investments Institutional Operations Company, Inc., (FIIOC), an affiliate of the investment adviser, is the transfer, dividend disbursing and shareholder servicing agent for each class of the Fund. FIIOC receives account fees and asset-based fees that vary according to the account size and type of account of the shareholders of the respective classes of the Fund. FIIOC pays for typesetting, printing and mailing of shareholder reports, except proxy statements.
For the period, transfer agent fees for each class were as follows:
| Amount | % of Class-Level Average Net Assets* |
|
| Class A | $410,505 | .20 |
| Class T | 86,826 | .22 |
| Class B | 14,578 | .22 |
| Class C | 233,477 | .20 |
| Consumer Staples | 1,748,464 | .17 |
| Class I | 170,805 | .18 |
| $ 2,664,655 |
*Annualized
Accounting and Security Lending Fees. Fidelity Service Company, Inc. (FSC), an affiliate of the investment adviser, maintains the Fund's accounting records. The accounting fee is based on the level of average net assets for each month. Under a separate contract, FSC administers the security lending program. The security lending fee is based on the number and duration of lending transactions.
Brokerage Commissions. The Fund placed a portion of its portfolio transactions with brokerage firms which are affiliates of the investment adviser. Brokerage commissions are included in net realized gain (loss) and change in net unrealized appreciation (depreciation) in the Statement of Operations. The commissions paid to these affiliated firms were $8,070 for the period.
6. Committed Line of Credit.
The Fund participates with other funds managed by the investment adviser or an affiliate in a $4.25 billion credit facility (the "line of credit") to be utilized for temporary or emergency purposes to fund shareholder redemptions or for other short-term liquidity purposes. The Fund has agreed to pay commitment fees on its pro-rata portion of the line of credit, which amounted to $2,279 and is reflected in Miscellaneous expenses on the Statement of Operations. During the period, the Fund did not borrow on this line of credit.
7. Security Lending.
The Fund lends portfolio securities through a lending agent from time to time in order to earn additional income. On the settlement date of the loan, the Fund receives collateral (in the form of U.S. Treasury obligations, letters of credit and/or cash) against the loaned securities and maintains collateral in an amount not less than 100% of the market value of the loaned securities during the period of the loan. The market value of the loaned securities is determined at the close of business of the Fund and any additional required collateral is delivered to the Fund on the next business day. If the borrower defaults on its obligation to return the securities loaned because of insolvency or other reasons, the Fund may apply collateral received from the borrower against the obligation. The Fund may experience delays and costs in recovering the securities loaned. Any cash collateral received is invested in the Fidelity Securities Lending Cash Central Fund. The value of loaned securities and cash collateral at period end are disclosed on the Fund's Statement of Assets and Liabilities. Security lending income represents the income earned on investing cash collateral, less rebates paid to borrowers and any lending agent fees associated with the loan, plus any premium payments received for lending certain types of securities. Security lending income is presented in the Statement of Operations as a component of income from Fidelity Central Funds. Total security lending income during the period amounted to $140,230.
8. Expense Reductions.
Commissions paid to certain brokers with whom the investment adviser, or its affiliates, places trades on behalf of the Fund include an amount in addition to trade execution, which may be rebated back to the Fund to offset certain expenses. This amount totaled $98,315 for the period. In addition, through arrangements with the Fund's custodian, credits realized as a result of uninvested cash balances were used to reduce the Fund's expenses. During the period, these credits reduced the Fund's custody by $63.
In addition, during the period the investment adviser reimbursed and/or waived a portion of fund-level operating expenses in the amount of $11,417 and a portion of class-level operating expenses as follows:
| Amount | |
| Class A | $7,870 |
| Class T | 1,516 |
| Class B | 395 |
| Class C | 4,058 |
| Consumer Staples | 37,669 |
| Class I | 6,663 |
| $ 58,171 |
9. Distributions to Shareholders.
Distributions to shareholders of each class were as follows:
| Six months ended August 31, 2015 | Year ended February 28, 2015 | |
| From net investment income | ||
| Class A | $748,002 | $4,812,004 |
| Class T | 109,152 | 776,331 |
| Class B | 4,951 | 83,556 |
| Class C | 151,085 | 1,335,126 |
| Consumer Staples | 4,534,913 | 29,856,743 |
| Class I | 445,963 | 2,754,772 |
| Total | $5,994,066 | $39,618,532 |
| From net realized gain | ||
| Class A | $13,245,483 | $14,768,867 |
| Class T | 2,567,517 | 2,841,831 |
| Class B | 472,929 | 743,976 |
| Class C | 7,440,920 | 7,778,566 |
| Consumer Staples | 65,568,990 | 65,408,817 |
| Class I | 6,389,423 | 10,857,228 |
| Total | $95,685,262 | $102,399,285 |
10. Share Transactions.
Share transactions for each class were as follows and may contain automatic conversions between classes or exchanges between funds:
| Shares | Shares | Dollars | Dollars | |
| Six months ended August 31, 2015 | Year ended February 28, 2015 | Six months ended August 31, 2015 | Year ended February 28, 2015 | |
| Class A | ||||
| Shares sold | 823,694 | 1,066,097 | $78,762,656 | $101,322,941 |
| Reinvestment of distributions | 139,522 | 205,710 | 13,557,335 | 18,829,531 |
| Shares redeemed | (605,912) | (931,333) | (57,741,721) | (86,559,239) |
| Net increase (decrease) | 357,304 | 340,474 | $34,578,270 | $33,593,233 |
| Class T | ||||
| Shares sold | 93,924 | 215,514 | $8,935,490 | $20,203,421 |
| Reinvestment of distributions | 26,837 | 38,102 | 2,588,978 | 3,463,287 |
| Shares redeemed | (142,485) | (146,712) | (13,456,409) | (13,666,581) |
| Net increase (decrease) | (21,724) | 106,904 | $(1,931,941) | $10,000,127 |
| Class B | ||||
| Shares sold | 2,493 | 7,270 | $232,612 | $675,777 |
| Reinvestment of distributions | 4,669 | 8,161 | 448,407 | 730,673 |
| Shares redeemed | (42,792) | (57,733) | (3,995,750) | (5,359,510) |
| Net increase (decrease) | (35,630) | (42,302) | $(3,314,731) | $(3,953,060) |
| Class C | ||||
| Shares sold | 449,616 | 636,469 | $42,091,266 | $59,593,472 |
| Reinvestment of distributions | 70,230 | 86,847 | 6,683,108 | 7,772,854 |
| Shares redeemed | (275,660) | (332,705) | (25,673,793) | (30,479,924) |
| Net increase (decrease) | 244,186 | 390,611 | $23,100,581 | $36,886,402 |
| Consumer Staples | ||||
| Shares sold | 1,753,451 | 8,889,529 | $169,496,786 | $838,041,591 |
| Reinvestment of distributions | 690,724 | 985,926 | 67,594,280 | 91,713,079 |
| Shares redeemed | (3,159,236) | (3,580,043) | $(305,508,464) | $(340,719,360) |
| Net increase (decrease) | (715,061) | 6,295,412 | $(68,417,398) | $589,035,310 |
| Class I | ||||
| Shares sold | 493,672 | 3,870,748A | $47,529,891 | $354,438,000A |
| Reinvestment of distributions | 56,913 | 135,150 | 5,562,149 | 12,187,732 |
| Shares redeemed | (593,677) | (3,804,175)B | (56,890,561) | (345,400,883)B |
| Net increase (decrease) | (43,092) | 201,723 | $(3,798,521) | $21,224,849 |
A Amount includes in-kind exchanges.
B Amount includes in-kind redemptions.
11. Other.
The Fund's organizational documents provide former and current trustees and officers with a limited indemnification against liabilities arising in connection with the performance of their duties to the Fund. In the normal course of business, the Fund may also enter into contracts that provide general indemnifications. The Fund's maximum exposure under these arrangements is unknown as this would be dependent on future claims that may be made against the Fund. The risk of material loss from such claims is considered remote.
Mutual funds managed by the investment adviser or its affiliates were the owners of record, in the aggregate, of approximately 26% of the total outstanding shares of the Fund.
Gold Portfolio
Consolidated Investment Summary (Unaudited)
The information in the following tables is based on the consolidated investments of the Fund.Top Ten Holdings as of August 31, 2015
| % of fund's net assets | % of fund's net assets 6 months ago | |
| Goldcorp, Inc. | 8.0 | 8.8 |
| Randgold Resources Ltd. sponsored ADR | 7.8 | 7.1 |
| Franco-Nevada Corp. | 6.3 | 6.1 |
| Newcrest Mining Ltd. | 5.6 | 6.2 |
| Agnico Eagle Mines Ltd. (Canada) | 5.6 | 5.0 |
| Silver Bullion | 5.3 | 4.2 |
| Gold Bullion | 5.2 | 6.2 |
| Newmont Mining Corp. | 4.5 | 4.0 |
| B2Gold Corp. | 3.7 | 3.4 |
| Royal Gold, Inc. | 3.2 | 3.6 |
| 55.2 |
Top Industries (% of fund's net assets)
| As of August 31, 2015 | ||
| Gold | 87.1% | |
| Commodities & Related Investments* | 10.5% | |
| Precious Metals & Minerals | 1.1% | |
| Silver | 0.7% | |
| Diversified Metals & Mining | 0.2% | |
| All Others* | 0.4% | |

* Includes gold bullion and/or silver bullion.
| As of February 28, 2015 | ||
| Gold | 87.6% | |
| Commodities & Related Investments* | 10.4% | |
| Precious Metals & Minerals | 0.1% | |
| Silver | 0.7% | |
| Diversified Metals & Mining | 0.2% | |
| All Others* | 1.0% | |

* Includes gold bullion and/or silver bullion.
* Includes short-term investments and net other assets (liabilities).
Geographic Diversification (% of fund's net assets)
| As of August 31, 2015 | ||
| Canada | 57.9% | |
| United States of America* | 18.7% | |
| Bailiwick of Jersey | 8.4% | |
| Australia | 7.4% | |
| South Africa | 5.6% | |
| United Kingdom | 0.7% | |
| Peru | 0.7% | |
| Cayman Islands | 0.4% | |
| China | 0.2% | |

Percentages are based on country or territory of incorporation and are adjusted for the effect of futures contracts, if applicable.
| As of February 28, 2015 | ||
| Canada | 55.8% | |
| United States of America* | 19.1% | |
| Australia | 8.1% | |
| Bailiwick of Jersey | 7.9% | |
| South Africa | 6.9% | |
| Peru | 0.8% | |
| Bermuda | 0.7% | |
| Cayman Islands | 0.4% | |
| United Kingdom | 0.3% | |

Percentages are based on country or territory of incorporation and are adjusted for the effect of futures contracts, if applicable.
Gold Portfolio
Consolidated Investments August 31, 2015 (Unaudited)
Showing Percentage of Net Assets
| Common Stocks - 89.1% | |||
| Shares | Value | ||
| Australia - 7.4% | |||
| Metals & Mining - 7.4% | |||
| Gold - 7.4% | |||
| Beadell Resources Ltd. (a) | 7,587,418 | $755,942 | |
| Evolution Mining Ltd. | 352,543 | 255,905 | |
| Medusa Mining Ltd. (a)(b) | 1,228,595 | 424,050 | |
| Newcrest Mining Ltd. (b) | 5,941,753 | 47,409,487 | |
| Northern Star Resources Ltd. | 4,351,118 | 6,254,876 | |
| Perseus Mining Ltd.: | |||
| (Australia) (b) | 1,417,134 | 383,231 | |
| (Canada) (b) | 1,300,000 | 375,494 | |
| Regis Resources Ltd. (a)(b) | 2,832,191 | 2,932,594 | |
| Resolute Mng Ltd. (b) | 2,390,161 | 450,754 | |
| Saracen Mineral Holdings Ltd. (b) | 8,462,787 | 2,649,919 | |
| Silver Lake Resources Ltd.(a)(b) | 4,145,985 | 427,821 | |
| 62,320,073 | |||
| Bailiwick of Jersey - 8.4% | |||
| Metals & Mining - 8.4% | |||
| Gold - 8.4% | |||
| Lydian International Ltd. (b) | 2,325,200 | 530,222 | |
| Polyus Gold International Ltd. (a) | 222,400 | 648,418 | |
| Polyus Gold International Ltd. sponsored GDR | 1,340,231 | 3,886,670 | |
| Randgold Resources Ltd. sponsored ADR (a) | 1,093,995 | 65,956,959 | |
| 71,022,269 | |||
| Bermuda - 0.0% | |||
| Metals & Mining - 0.0% | |||
| Steel - 0.0% | |||
| African Minerals Ltd. (a)(b) | 1,718,700 | 26 | |
| Canada - 57.9% | |||
| Metals & Mining - 57.9% | |||
| Diversified Metals & Mining - 0.2% | |||
| Ivanhoe Mines Ltd. (b) | 2,441,200 | 1,484,463 | |
| Ivanhoe Mines Ltd. Class A warrants 12/10/15 (b)(c) | 837,300 | 3,182 | |
| True Gold Mining, Inc. (b) | 171,000 | 23,396 | |
| 1,511,041 | |||
| Gold - 55.9% | |||
| Agnico Eagle Mines Ltd. (Canada) (a) | 1,933,401 | 47,350,395 | |
| Alacer Gold Corp. (b) | 2,131,963 | 4,650,907 | |
| Alamos Gold, Inc. | 1,745,766 | 7,192,195 | |
| Argonaut Gold, Inc. (b) | 5,077,262 | 5,132,836 | |
| Asanko Gold, Inc. (b) | 120,000 | 197,020 | |
| B2Gold Corp. (b) | 26,622,293 | 31,163,219 | |
| Barrick Gold Corp. | 3,877,569 | 26,968,498 | |
| Centerra Gold, Inc. | 369,900 | 1,869,744 | |
| Continental Gold, Inc. (b) | 5,415,600 | 11,567,221 | |
| Detour Gold Corp. (b) | 1,619,000 | 16,354,903 | |
| Detour Gold Corp. (b)(c) | 785,900 | 7,939,048 | |
| Eldorado Gold Corp. | 8,672,235 | 25,905,962 | |
| Franco-Nevada Corp. | 1,221,100 | 52,905,670 | |
| Goldcorp, Inc. | 4,861,500 | 67,438,718 | |
| Guyana Goldfields, Inc. (b) | 3,651,400 | 11,212,873 | |
| Guyana Goldfields, Inc. (b)(c) | 155,000 | 475,981 | |
| IAMGOLD Corp. (b) | 1,027,100 | 1,725,366 | |
| Kinross Gold Corp. (b) | 2,363,891 | 4,222,517 | |
| Kirkland Lake Gold, Inc. (a)(b) | 854,100 | 3,453,794 | |
| Klondex Mines Ltd. (b) | 26,000 | 69,170 | |
| Lake Shore Gold Corp. (a)(b) | 2,806,600 | 2,367,989 | |
| New Gold, Inc. (b) | 8,408,275 | 19,365,364 | |
| Novagold Resources, Inc. (b) | 1,697,100 | 6,346,710 | |
| OceanaGold Corp. | 2,849,500 | 5,024,962 | |
| Osisko Gold Royalties Ltd. | 473,793 | 5,499,254 | |
| Pilot Gold, Inc. (a)(b) | 1,418,150 | 452,739 | |
| Premier Gold Mines Ltd. (b)(d) | 10,516,022 | 19,104,053 | |
| Pretium Resources, Inc. (a)(b) | 890,138 | 4,763,280 | |
| Pretium Resources, Inc. (b)(c) | 225,000 | 1,204,013 | |
| Pretium Resources, Inc. (b)(e) | 225,000 | 1,204,013 | |
| Primero Mining Corp. (a)(b) | 1,735,500 | 5,026,038 | |
| Richmont Mines, Inc. (b) | 89,400 | 224,927 | |
| Romarco Minerals, Inc. (b) | 37,623,994 | 16,015,078 | |
| Romarco Minerals, Inc. (b)(c) | 5,900,000 | 2,511,402 | |
| Rubicon Minerals Corp. (a)(b) | 5,376,402 | 4,290,987 | |
| Seabridge Gold, Inc. (b) | 659,166 | 4,218,662 | |
| SEMAFO, Inc. (b) | 3,922,900 | 9,720,777 | |
| Teranga Gold Corp. (a)(b) | 85,000 | 37,473 | |
| Teranga Gold Corp. CDI unit (b) | 3,338,072 | 1,544,100 | |
| Timmins Gold Corp. (b) | 17,600 | 4,749 | |
| Torex Gold Resources, Inc. (b) | 22,555,000 | 21,258,893 | |
| Yamana Gold, Inc. | 6,697,220 | 12,573,832 | |
| 470,555,332 | |||
| Precious Metals & Minerals - 1.1% | |||
| Gold Standard Ventures Corp. (b) | 2,155,400 | 745,445 | |
| Tahoe Resources, Inc. (a) | 1,006,982 | 8,419,582 | |
| 9,165,027 | |||
| Silver - 0.7% | |||
| MAG Silver Corp. (b) | 292,700 | 2,153,645 | |
| Silver Wheaton Corp. | 345,900 | 4,240,930 | |
| 6,394,575 | |||
| TOTAL METALS & MINING | 487,625,975 | ||
| Cayman Islands - 0.4% | |||
| Metals & Mining - 0.4% | |||
| Gold - 0.4% | |||
| Endeavour Mining Corp. (b) | 8,267,400 | 3,581,953 | |
| China - 0.2% | |||
| Metals & Mining - 0.2% | |||
| Gold - 0.2% | |||
| Zijin Mining Group Co. Ltd. (H Shares) | 5,300,000 | 1,367,733 | |
| Peru - 0.7% | |||
| Metals & Mining - 0.7% | |||
| Gold - 0.7% | |||
| Compania de Minas Buenaventura SA sponsored ADR | 854,828 | 5,402,513 | |
| South Africa - 5.6% | |||
| Metals & Mining - 5.6% | |||
| Gold - 5.6% | |||
| AngloGold Ashanti Ltd. sponsored ADR (b) | 3,108,508 | 25,241,085 | |
| Gold Fields Ltd. sponsored ADR | 4,698,926 | 15,177,531 | |
| Harmony Gold Mining Co. Ltd. (b) | 1,484,000 | 1,286,113 | |
| Harmony Gold Mining Co. Ltd. sponsored ADR (a)(b) | 1,812,900 | 1,672,763 | |
| Sibanye Gold Ltd. ADR (a) | 846,906 | 4,031,273 | |
| 47,408,765 | |||
| United Kingdom - 0.7% | |||
| Metals & Mining - 0.7% | |||
| Gold - 0.7% | |||
| Acacia Mining PLC | 1,551,427 | 5,696,931 | |
| United States of America - 7.8% | |||
| Metals & Mining - 7.8% | |||
| Gold - 7.8% | |||
| McEwen Mining, Inc. (a) | 579,110 | 528,438 | |
| Newmont Mining Corp. | 2,212,100 | 37,760,547 | |
| Royal Gold, Inc. | 564,613 | 27,169,178 | |
| 65,458,163 | |||
| TOTAL COMMON STOCKS | |||
| (Cost $1,282,263,655) | 749,884,401 | ||
| Commodities - 10.5% | |||
| Troy Ounces | |||
| Gold Bullion(b) | 38,510 | 43,722,714 | |
| Silver Bullion(b) | 3,082,000 | 45,146,677 | |
| TOTAL COMMODITIES | |||
| (Cost $109,204,403) | 88,869,391 | ||
| Money Market Funds - 5.1% | |||
| Shares | |||
| Fidelity Cash Central Fund, 0.15% (f) | 4,283,847 | 4,283,847 | |
| Fidelity Securities Lending Cash Central Fund, 0.19% (f)(g) | 38,557,163 | 38,557,163 | |
| TOTAL MONEY MARKET FUNDS | |||
| (Cost $42,841,010) | 42,841,010 | ||
| TOTAL INVESTMENT PORTFOLIO - 104.7% | |||
| (Cost $1,434,309,068) | 881,594,802 | ||
| NET OTHER ASSETS (LIABILITIES) - (4.7)% | (39,872,327) | ||
| NET ASSETS - 100% | $841,722,475 |
Legend
(a) Security or a portion of the security is on loan at period end.
(b) Non-income producing
(c) Security exempt from registration under Rule 144A of the Securities Act of 1933. These securities may be resold in transactions exempt from registration, normally to qualified institutional buyers. At the end of the period, the value of these securities amounted to $12,133,626 or 1.4% of net assets.
(d) Affiliated company
(e) Restricted securities - Investment in securities not registered under the Securities Act of 1933 (excluding 144A issues). At the end of the period, the value of restricted securities (excluding 144A issues) amounted to $1,204,013 or 0.1% of net assets.
(f) Affiliated fund that is generally available only to investment companies and other accounts managed by Fidelity Investments. The rate quoted is the annualized seven-day yield of the fund at period end. A complete unaudited listing of the fund's holdings as of its most recent quarter end is available upon request. In addition, each Fidelity Central Fund's financial statements are available on the SEC's website or upon request.
(g) Investment made with cash collateral received from securities on loan.
Additional information on each restricted holding is as follows:
| Security | Acquisition Date | Acquisition Cost |
| Pretium Resources, Inc. | 3/31/11 | $2,172,293 |
Affiliated Central Funds
Information regarding fiscal year to date income earned by the Fund from investments in Fidelity Central Funds is as follows:
| Fund | Income earned |
| Fidelity Cash Central Fund | $3,107 |
| Fidelity Securities Lending Cash Central Fund | 122,985 |
| Total | $126,092 |
Consolidated Subsidiary
| Value, beginning of period | Purchases | Sales Proceeds | Dividend Income | Value, end of period | |
| Fidelity Select Gold Cayman Ltd. | $116,684,748 | $17,032,584 | $33,092,250 | $-- | $88,827,307 |
Other Affiliated Issuers
An affiliated company is a company in which the Fund has ownership of at least 5% of the voting securities. Fiscal year to date transactions with companies which are or were affiliates are as follows:
| Affiliate | Value, beginning of period | Purchases | Sales Proceeds | Dividend Income | Value, end of period |
| Premier Gold Mines Ltd. | $20,747,454 | $210,553 | $61,846 | $-- | $19,104,053 |
| Total | $20,747,454 | $210,553 | $61,846 | $-- | $19,104,053 |
Investment Valuation
The following is a summary of the inputs used, as of August 31, 2015, involving the Fund's assets and liabilities carried at fair value. The inputs or methodology used for valuing securities may not be an indication of the risk associated with investing in those securities. For more information on valuation inputs, and their aggregation into the levels used below, please refer to the Investment Valuation section in the accompanying Notes to Consolidated Financial Statements.
| Valuation Inputs at Reporting Date: | ||||
| Description | Total | Level 1 | Level 2 | Level 3 |
| Investments in Securities: | ||||
| Common Stocks | $749,884,401 | $701,188,775 | $48,695,600 | $26 |
| Commodities | 88,869,391 | 88,869,391 | -- | -- |
| Money Market Funds | 42,841,010 | 42,841,010 | -- | -- |
| Total Investments in Securities: | $881,594,802 | $832,899,176 | $48,695,600 | $26 |
The following is a summary of transfers between Level 1 and Level 2 for the period ended August 31, 2015. Transfers are assumed to have occurred at the beginning of the period, and are primarily attributable to the valuation techniques used for foreign equity securities, as discussed in the accompanying Notes to Consolidated Financial Statements:
| Transfers | Total |
| Level 1 to Level 2 | $69,980,874 |
| Level 2 to Level 1 | $0 |
See accompanying notes which are an integral part of the consolidated financial statements.
Gold Portfolio
Consolidated Financial Statements
Consolidated Statement of Assets and Liabilities
| August 31, 2015 (Unaudited) | ||
| Assets | ||
| Investment in securities, at value (including securities loaned of $35,369,234) — See accompanying schedule: Unaffiliated issuers (cost $1,250,849,595) | $730,780,348 | |
| Fidelity Central Funds (cost $42,841,010) | 42,841,010 | |
| Commodities (cost $109,204,403) | 88,869,391 | |
| Other affiliated issuers (cost $31,414,060) | 19,104,053 | |
| Total Investments (cost $1,434,309,068) | $881,594,802 | |
| Cash | 16,980 | |
| Foreign currency held at value (cost $71) | 71 | |
| Receivable for investments sold | 2,196,707 | |
| Receivable for fund shares sold | 1,267,170 | |
| Dividends receivable | 248,677 | |
| Distributions receivable from Fidelity Central Funds | 17,021 | |
| Prepaid expenses | 5,930 | |
| Other receivables | 29,569 | |
| Total assets | 885,376,927 | |
| Liabilities | ||
| Payable for investments purchased | $2,787,191 | |
| Unrealized depreciation on foreign currency contracts | 51 | |
| Payable for fund shares redeemed | 1,525,927 | |
| Accrued management fee | 383,048 | |
| Distribution and service plan fees payable | 40,595 | |
| Other affiliated payables | 248,976 | |
| Other payables and accrued expenses | 111,501 | |
| Collateral on securities loaned, at value | 38,557,163 | |
| Total liabilities | 43,654,452 | |
| Net Assets | $841,722,475 | |
| Net Assets consist of: | ||
| Paid in capital | $2,580,184,708 | |
| Accumulated net investment loss | (526,638) | |
| Accumulated undistributed net realized gain (loss) on investments and foreign currency transactions | (1,185,219,612) | |
| Net unrealized appreciation (depreciation) on investments and assets and liabilities in foreign currencies | (552,715,983) | |
| Net Assets | $841,722,475 | |
| Calculation of Maximum Offering Price | ||
| Class A: | ||
| Net Asset Value and redemption price per share ($35,788,107 ÷ 2,642,108 shares) | $13.55 | |
| Maximum offering price per share (100/94.25 of $13.55) | $14.38 | |
| Class T: | ||
| Net Asset Value and redemption price per share ($12,157,085 ÷ 912,992 shares) | $13.32 | |
| Maximum offering price per share (100/96.50 of $13.32) | $13.80 | |
| Class B: | ||
| Net Asset Value and offering price per share ($1,397,454 ÷ 108,622 shares)(a) | $12.87 | |
| Class C: | ||
| Net Asset Value and offering price per share ($33,200,590 ÷ 2,590,933 shares)(a) | $12.81 | |
| Gold: | ||
| Net Asset Value, offering price and redemption price per share ($740,158,656 ÷ 53,436,990 shares) | $13.85 | |
| Class I: | ||
| Net Asset Value, offering price and redemption price per share ($19,020,583 ÷ 1,372,804 shares) | $13.86 |
(a) Redemption price per share is equal to net asset value less any applicable contingent deferred sales charge.
See accompanying notes which are an integral part of the consolidated financial statements.
Consolidated Statement of Operations
| Six months ended August 31, 2015 (Unaudited) | ||
| Investment Income | ||
| Dividends | $4,629,139 | |
| Income from Fidelity Central Funds | 126,092 | |
| Income before foreign taxes withheld | 4,755,231 | |
| Less foreign taxes withheld | (472,174) | |
| Total income | 4,283,057 | |
| Expenses | ||
| Management fee | $2,835,308 | |
| Transfer agent fees | 1,378,144 | |
| Distribution and service plan fees | 275,705 | |
| Accounting and security lending fees | 230,445 | |
| Custodian fees and expenses | 174,762 | |
| Independent trustees' compensation | 8,491 | |
| Registration fees | 72,307 | |
| Audit | 20,002 | |
| Legal | 6,505 | |
| Miscellaneous | 8,923 | |
| Total expenses before reductions | 5,010,592 | |
| Expense reductions | (220,178) | 4,790,414 |
| Net investment income (loss) | (507,357) | |
| Realized and Unrealized Gain (Loss)
Net realized gain (loss) on: | ||
| Investments: | ||
| Unaffiliated issuers | (85,858,960) | |
| Other affiliated issuers | (128,350) | |
| Commodities | (4,624,665) | |
| Foreign currency transactions | 1,687,366 | |
| Total net realized gain (loss) | (88,924,609) | |
| Change in net unrealized appreciation (depreciation) on: Investments | (184,851,914) | |
| Assets and liabilities in foreign currencies | (2,734) | |
| Commodities | (6,919,421) | |
| Total change in net unrealized appreciation (depreciation) | (191,774,069) | |
| Net gain (loss) | (280,698,678) | |
| Net increase (decrease) in net assets resulting from operations | $(281,206,035) |
See accompanying notes which are an integral part of the consolidated financial statements.
Consolidated Statement of Changes in Net Assets
| Six months ended August 31, 2015 (Unaudited) | Year ended February 28, 2015 | |
| Increase (Decrease) in Net Assets | ||
| Operations | ||
| Net investment income (loss) | $(507,357) | $(3,405,899) |
| Net realized gain (loss) | (88,924,609) | (231,533,739) |
| Change in net unrealized appreciation (depreciation) | (191,774,069) | (19,537,556) |
| Net increase (decrease) in net assets resulting from operations | (281,206,035) | (254,477,194) |
| Share transactions - net increase (decrease) | 1,271,509 | (124,744,949) |
| Redemption fees | 58,489 | 222,335 |
| Total increase (decrease) in net assets | (279,876,037) | (378,999,808) |
| Net Assets | ||
| Beginning of period | 1,121,598,512 | 1,500,598,320 |
| End of period (including accumulated net investment loss of $526,638 and accumulated net investment loss of $19,281, respectively) | $841,722,475 | $1,121,598,512 |
See accompanying notes which are an integral part of the consolidated financial statements.
Consolidated Financial Highlights — Gold Portfolio Class A
| Six months ended (Unaudited) | Years ended February 28, | |||||
| August 31, | 2015 | 2015 | 2014 | 2013 | 2012 A | 2011 |
| Selected Per–Share Data | ||||||
| Net asset value, beginning of period | $18.11 | $22.01 | $30.25 | $45.37 | $50.92 | $40.50 |
| Income from Investment Operations | ||||||
| Net investment income (loss)B | (.03) | (.10) | –C | .07 | (.13) | (.30) |
| Net realized and unrealized gain (loss) | (4.53) | (3.80) | (8.25) | (15.19) | (2.83) | 15.28 |
| Total from investment operations | (4.56) | (3.90) | (8.25) | (15.12) | (2.96) | 14.98 |
| Distributions from net realized gain | – | – | – | – | (2.59) | (4.57) |
| Redemption fees added to paid in capitalB | –C | –C | .01 | –C | –C | .01 |
| Net asset value, end of period | $13.55 | $18.11 | $22.01 | $30.25 | $45.37 | $50.92 |
| Total ReturnD,E,F | (25.18)% | (17.72)% | (27.24)% | (33.33)% | (6.24)% | 36.99% |
| Ratios to Average Net AssetsG,H | ||||||
| Expenses before reductions | 1.25%I | 1.23% | 1.21% | 1.18% | 1.14% | 1.16% |
| Expenses net of fee waivers, if any | 1.21%I | 1.19% | 1.19% | 1.17% | 1.14% | 1.15% |
| Expenses net of all reductions | 1.21%I | 1.19% | 1.18% | 1.17% | 1.14% | 1.14% |
| Net investment income (loss) | (.32)%I | (.51)% | - %J | .18% | (.28)% | (.63)% |
| Supplemental Data | ||||||
| Net assets, end of period (000 omitted) | $35,788 | $46,898 | $60,270 | $101,202 | $152,969 | $149,178 |
| Portfolio turnover rateK | 22%I | 20% | 56% | 18% | 22% | 35% |
A For the year ended February 29.
B Calculated based on average shares outstanding during the period.
C Amount represents less than $.005 per share.
D Total returns for periods of less than one year are not annualized.
E Total returns would have been lower if certain expenses had not been reduced during the applicable periods shown.
F Total returns do not include the effect of the sales charges.
G Fees and expenses of any underlying Fidelity Central Funds are not included in the Fund's expense ratio. The Fund indirectly bears its proportionate share of the expenses of any underlying Fidelity Central Funds.
H Expense ratios reflect operating expenses of the class. Expenses before reductions do not reflect amounts reimbursed by the investment adviser or reductions from brokerage service arrangements or reductions from other expense offset arrangements and do not represent the amount paid by the class during periods when reimbursements or reductions occur. Expenses net of fee waivers reflect expenses after reimbursement by the investment adviser but prior to reductions from brokerage service arrangements or other expense offset arrangements. Expenses net of all reductions represent the net expenses paid by the class.
I Annualized
J Amount represents less than .005%.
K Amount does not include the portfolio activity of any underlying Fidelity Central Funds.
See accompanying notes which are an integral part of the consolidated financial statements.
Consolidated Financial Highlights — Gold Portfolio Class T
| Six months ended (Unaudited) | Years ended February 28, | |||||
| August 31, | 2015 | 2015 | 2014 | 2013 | 2012 A | 2011 |
| Selected Per–Share Data | ||||||
| Net asset value, beginning of period | $17.83 | $21.73 | $29.95 | $45.04 | $50.68 | $40.34 |
| Income from Investment Operations | ||||||
| Net investment income (loss)B | (.05) | (.15) | (.06) | (.03) | (.27) | (.43) |
| Net realized and unrealized gain (loss) | (4.46) | (3.75) | (8.17) | (15.06) | (2.80) | 15.21 |
| Total from investment operations | (4.51) | (3.90) | (8.23) | (15.09) | (3.07) | 14.78 |
| Distributions from net realized gain | – | – | – | – | (2.57) | (4.45) |
| Redemption fees added to paid in capitalB | –C | –C | .01 | –C | –C | .01 |
| Net asset value, end of period | $13.32 | $17.83 | $21.73 | $29.95 | $45.04 | $50.68 |
| Total ReturnD,E,F | (25.29)% | (17.95)% | (27.45)% | (33.50)% | (6.49)% | 36.62% |
| Ratios to Average Net AssetsG,H | ||||||
| Expenses before reductions | 1.53%I | 1.50% | 1.49% | 1.45% | 1.43% | 1.44% |
| Expenses net of fee waivers, if any | 1.49%I | 1.46% | 1.47% | 1.44% | 1.42% | 1.42% |
| Expenses net of all reductions | 1.49%I | 1.46% | 1.46% | 1.44% | 1.42% | 1.42% |
| Net investment income (loss) | (.60)%I | (.79)% | (.28)% | (.09)% | (.57)% | (.90)% |
| Supplemental Data | ||||||
| Net assets, end of period (000 omitted) | $12,157 | $16,200 | $18,402 | $24,913 | $40,664 | $45,846 |
| Portfolio turnover rateJ | 22%I | 20% | 56% | 18% | 22% | 35% |
A For the year ended February 29.
B Calculated based on average shares outstanding during the period.
C Amount represents less than $.005 per share.
D Total returns for periods of less than one year are not annualized.
E Total returns would have been lower if certain expenses had not been reduced during the applicable periods shown.
F Total returns do not include the effect of the sales charges.
G Fees and expenses of any underlying Fidelity Central Funds are not included in the Fund's expense ratio. The Fund indirectly bears its proportionate share of the expenses of any underlying Fidelity Central Funds.
H Expense ratios reflect operating expenses of the class. Expenses before reductions do not reflect amounts reimbursed by the investment adviser or reductions from brokerage service arrangements or reductions from other expense offset arrangements and do not represent the amount paid by the class during periods when reimbursements or reductions occur. Expenses net of fee waivers reflect expenses after reimbursement by the investment adviser but prior to reductions from brokerage service arrangements or other expense offset arrangements. Expenses net of all reductions represent the net expenses paid by the class.
I Annualized
J Amount does not include the portfolio activity of any underlying Fidelity Central Funds.
See accompanying notes which are an integral part of the consolidated financial statements.
Consolidated Financial Highlights — Gold Portfolio Class B
| Six months ended (Unaudited) | Years ended February 28, | |||||
| August 31, | 2015 | 2015 | 2014 | 2013 | 2012 A | 2011 |
| Selected Per–Share Data | ||||||
| Net asset value, beginning of period | $17.27 | $21.14 | $29.27 | $44.24 | $50.02 | $39.87 |
| Income from Investment Operations | ||||||
| Net investment income (loss)B | (.08) | (.24) | (.16) | (.21) | (.49) | (.66) |
| Net realized and unrealized gain (loss) | (4.32) | (3.63) | (7.98) | (14.76) | (2.76) | 15.02 |
| Total from investment operations | (4.40) | (3.87) | (8.14) | (14.97) | (3.25) | 14.36 |
| Distributions from net realized gain | – | – | – | – | (2.53) | (4.21) |
| Redemption fees added to paid in capitalB | –C | –C | .01 | –C | –C | –C |
| Net asset value, end of period | $12.87 | $17.27 | $21.14 | $29.27 | $44.24 | $50.02 |
| Total ReturnD,E,F | (25.48)% | (18.31)% | (27.78)% | (33.84)% | (6.95)% | 35.97% |
| Ratios to Average Net AssetsG,H | ||||||
| Expenses before reductions | 2.00%I | 1.97% | 1.95% | 1.93% | 1.90% | 1.93% |
| Expenses net of fee waivers, if any | 1.96%I | 1.93% | 1.93% | 1.92% | 1.90% | 1.92% |
| Expenses net of all reductions | 1.96%I | 1.93% | 1.93% | 1.91% | 1.90% | 1.91% |
| Net investment income (loss) | (1.07)%I | (1.26)% | (.75)% | (.57)% | (1.04)% | (1.39)% |
| Supplemental Data | ||||||
| Net assets, end of period (000 omitted) | $1,397 | $2,461 | $4,373 | $9,423 | $20,894 | $26,837 |
| Portfolio turnover rateJ | 22%I | 20% | 56% | 18% | 22% | 35% |
A For the year ended February 29.
B Calculated based on average shares outstanding during the period.
C Amount represents less than $.005 per share.
D Total returns for periods of less than one year are not annualized.
E Total returns would have been lower if certain expenses had not been reduced during the applicable periods shown.
F Total returns do not include the effect of the contingent deferred sales charge.
G Fees and expenses of any underlying Fidelity Central Funds are not included in the Fund's expense ratio. The Fund indirectly bears its proportionate share of the expenses of any underlying Fidelity Central Funds.
H Expense ratios reflect operating expenses of the class. Expenses before reductions do not reflect amounts reimbursed by the investment adviser or reductions from brokerage service arrangements or reductions from other expense offset arrangements and do not represent the amount paid by the class during periods when reimbursements or reductions occur. Expenses net of fee waivers reflect expenses after reimbursement by the investment adviser but prior to reductions from brokerage service arrangements or other expense offset arrangements. Expenses net of all reductions represent the net expenses paid by the class.
I Annualized
J Amount does not include the portfolio activity of any underlying Fidelity Central Funds.
See accompanying notes which are an integral part of the consolidated financial statements.
Consolidated Financial Highlights — Gold Portfolio Class C
| Six months ended (Unaudited) | Years ended February 28, | |||||
| August 31, | 2015 | 2015 | 2014 | 2013 | 2012 A | 2011 |
| Selected Per–Share Data | ||||||
| Net asset value, beginning of period | $17.20 | $21.06 | $29.15 | $44.05 | $49.81 | $39.75 |
| Income from Investment Operations | ||||||
| Net investment income (loss)B | (.08) | (.23) | (.16) | (.20) | (.47) | (.64) |
| Net realized and unrealized gain (loss) | (4.31) | (3.63) | (7.94) | (14.70) | (2.76) | 14.98 |
| Total from investment operations | (4.39) | (3.86) | (8.10) | (14.90) | (3.23) | 14.34 |
| Distributions from net realized gain | – | – | – | – | (2.53) | (4.28) |
| Redemption fees added to paid in capitalB | –C | –C | .01 | –C | –C | –C |
| Net asset value, end of period | $12.81 | $17.20 | $21.06 | $29.15 | $44.05 | $49.81 |
| Total ReturnD,E,F | (25.52)% | (18.33)% | (27.75)% | (33.83)% | (6.93)% | 36.01% |
| Ratios to Average Net AssetsG,H | ||||||
| Expenses before reductions | 1.98%I | 1.96% | 1.96% | 1.93% | 1.87% | 1.89% |
| Expenses net of fee waivers, if any | 1.94%I | 1.92% | 1.94% | 1.92% | 1.87% | 1.88% |
| Expenses net of all reductions | 1.94%I | 1.92% | 1.93% | 1.91% | 1.87% | 1.87% |
| Net investment income (loss) | (1.06)%I | (1.25)% | (.76)% | (.57)% | (1.01)% | (1.35)% |
| Supplemental Data | ||||||
| Net assets, end of period (000 omitted) | $33,201 | $39,429 | $33,811 | $37,787 | $67,996 | $72,431 |
| Portfolio turnover rateJ | 22%I | 20% | 56% | 18% | 22% | 35% |
A For the year ended February 29.
B Calculated based on average shares outstanding during the period.
C Amount represents less than $.005 per share.
D Total returns for periods of less than one year are not annualized.
E Total returns would have been lower if certain expenses had not been reduced during the applicable periods shown.
F Total returns do not include the effect of the contingent deferred sales charge.
G Fees and expenses of any underlying Fidelity Central Funds are not included in the Fund's expense ratio. The Fund indirectly bears its proportionate share of the expenses of any underlying Fidelity Central Funds.
H Expense ratios reflect operating expenses of the class. Expenses before reductions do not reflect amounts reimbursed by the investment adviser or reductions from brokerage service arrangements or reductions from other expense offset arrangements and do not represent the amount paid by the class during periods when reimbursements or reductions occur. Expenses net of fee waivers reflect expenses after reimbursement by the investment adviser but prior to reductions from brokerage service arrangements or other expense offset arrangements. Expenses net of all reductions represent the net expenses paid by the class.
I Annualized
J Amount does not include the portfolio activity of any underlying Fidelity Central Funds.
See accompanying notes which are an integral part of the consolidated financial statements.
Consolidated Financial Highlights — Gold Portfolio
| Six months ended (Unaudited) | Years ended February 28, | |||||
| August 31, | 2015 | 2015 | 2014 | 2013 | 2012 A | 2011 |
| Selected Per–Share Data | ||||||
| Net asset value, beginning of period | $18.50 | $22.41 | $30.72 | $45.96 | $51.44 | $40.85 |
| Income from Investment Operations | ||||||
| Net investment income (loss)B | –C | (.04) | .06 | .16 | (.02) | (.18) |
| Net realized and unrealized gain (loss) | (4.65) | (3.87) | (8.38) | (15.40) | (2.85) | 15.43 |
| Total from investment operations | (4.65) | (3.91) | (8.32) | (15.24) | (2.87) | 15.25 |
| Distributions from net realized gain | – | – | – | – | (2.61) | (4.67) |
| Redemption fees added to paid in capitalB | –C | –C | .01 | –C | –C | .01 |
| Net asset value, end of period | $13.85 | $18.50 | $22.41 | $30.72 | $45.96 | $51.44 |
| Total ReturnD,E | (25.14)% | (17.45)% | (27.05)% | (33.16)% | (6.00)% | 37.35% |
| Ratios to Average Net AssetsF,G | ||||||
| Expenses before reductions | .98%H | .94% | .94% | .93% | .89% | .91% |
| Expenses net of fee waivers, if any | .93%H | .90% | .92% | .92% | .89% | .90% |
| Expenses net of all reductions | .93%H | .90% | .91% | .92% | .89% | .89% |
| Net investment income (loss) | (.05)%H | (.22)% | .27% | .43% | (.03)% | (.37)% |
| Supplemental Data | ||||||
| Net assets, end of period (000 omitted) | $740,159 | $992,944 | $1,275,913 | $2,301,019 | $3,924,440 | $4,250,249 |
| Portfolio turnover rateI | 22%H | 20% | 56% | 18% | 22% | 35% |
A For the year ended February 29.
B Calculated based on average shares outstanding during the period.
C Amount represents less than $.005 per share.
D Total returns for periods of less than one year are not annualized.
E Total returns would have been lower if certain expenses had not been reduced during the applicable periods shown.
F Fees and expenses of any underlying Fidelity Central Funds are not included in the Fund's expense ratio. The Fund indirectly bears its proportionate share of the expenses of any underlying Fidelity Central Funds.
G Expense ratios reflect operating expenses of the class. Expenses before reductions do not reflect amounts reimbursed by the investment adviser or reductions from brokerage service arrangements or reductions from other expense offset arrangements and do not represent the amount paid by the class during periods when reimbursements or reductions occur. Expenses net of fee waivers reflect expenses after reimbursement by the investment adviser but prior to reductions from brokerage service arrangements or other expense offset arrangements. Expenses net of all reductions represent the net expenses paid by the class.
H Annualized
I Amount does not include the portfolio activity of any underlying Fidelity Central Funds.
See accompanying notes which are an integral part of the consolidated financial statements.
Consolidated Financial Highlights — Gold Portfolio Class I
| Six months ended (Unaudited) | Years ended February 28, | |||||
| August 31, | 2015 | 2015 | 2014 | 2013 | 2012 A | 2011 |
| Selected Per–Share Data | ||||||
| Net asset value, beginning of period | $18.50 | $22.41 | $30.69 | $45.87 | $51.32 | $40.77 |
| Income from Investment Operations | ||||||
| Net investment income (loss)B | –C | (.04) | .07 | .20 | .02 | (.15) |
| Net realized and unrealized gain (loss) | (4.64) | (3.87) | (8.36) | (15.38) | (2.85) | 15.41 |
| Total from investment operations | (4.64) | (3.91) | (8.29) | (15.18) | (2.83) | 15.26 |
| Distributions from net realized gain | – | – | – | – | (2.62) | (4.72) |
| Redemption fees added to paid in capitalB | –C | –C | .01 | –C | –C | .01 |
| Net asset value, end of period | $13.86 | $18.50 | $22.41 | $30.69 | $45.87 | $51.32 |
| Total ReturnD,E | (25.08)% | (17.45)% | (26.98)% | (33.09)% | (5.94)% | 37.45% |
| Ratios to Average Net AssetsF,G | ||||||
| Expenses before reductions | .94%H | .90% | .87% | .84% | .82% | .85% |
| Expenses net of fee waivers, if any | .89%H | .86% | .85% | .83% | .81% | .84% |
| Expenses net of all reductions | .89%H | .86% | .84% | .82% | .81% | .83% |
| Net investment income (loss) | (.01)%H | (.18)% | .34% | .52% | .04% | (.31)% |
| Supplemental Data | ||||||
| Net assets, end of period (000 omitted) | $19,021 | $23,667 | $107,830 | $128,262 | $168,548 | $137,246 |
| Portfolio turnover rateI | 22%H | 20% | 56% | 18% | 22% | 35% |
A For the year ended February 29.
B Calculated based on average shares outstanding during the period.
C Amount represents less than $.005 per share.
D Total returns for periods of less than one year are not annualized.
E Total returns would have been lower if certain expenses had not been reduced during the applicable periods shown.
F Fees and expenses of any underlying Fidelity Central Funds are not included in the Fund's expense ratio. The Fund indirectly bears its proportionate share of the expenses of any underlying Fidelity Central Funds.
G Expense ratios reflect operating expenses of the class. Expenses before reductions do not reflect amounts reimbursed by the investment adviser or reductions from brokerage service arrangements or reductions from other expense offset arrangements and do not represent the amount paid by the class during periods when reimbursements or reductions occur. Expenses net of fee waivers reflect expenses after reimbursement by the investment adviser but prior to reductions from brokerage service arrangements or other expense offset arrangements. Expenses net of all reductions represent the net expenses paid by the class.
H Annualized
I Amount does not include the portfolio activity of any underlying Fidelity Central Funds.
See accompanying notes which are an integral part of the consolidated financial statements.
Notes to Consolidated Financial Statements (Unaudited)
For the period ended August 31, 2015
1. Organization.
Gold Portfolio (the Fund) is a non-diversified fund of Fidelity Select Portfolios (the Trust) and is authorized to issue an unlimited number of shares. The Trust is registered under the Investment Company Act of 1940, as amended (the 1940 Act), as an open-end management investment company organized as a Massachusetts business trust. The Fund invests primarily in securities of companies whose principal business activities fall within specific industries. The Fund offers Class A, Class T, Class C, Gold and Class I (formerly Institutional Class) shares, each of which, along with Class B shares, has equal rights as to assets and voting privileges. Class B shares are closed to new accounts and additional purchases, except for exchanges and reinvestments. Each class has exclusive voting rights with respect to matters that affect that class. Class B shares will automatically convert to Class A shares after a holding period of seven years from the initial date of purchase. The Fund's investments in emerging markets can be subject to social, economic, regulatory, and political uncertainties and can be extremely volatile.
2. Consolidated Subsidiary.
The Fund invests in certain commodity-related investments through Fidelity Select Gold Cayman, Ltd, a wholly owned subsidiary (the "Subsidiary"). As of August 31, 2015, the Fund held an investment of $88,827,307 in the Subsidiary, representing 10.6% of the Fund's net assets.
The financial statements have been consolidated and include accounts of the Fund and the Subsidiary. Accordingly, all inter-company transactions and balances have been eliminated.
3. Investments in Fidelity Central Funds.
The Fund invests in Fidelity Central Funds, which are open-end investment companies generally available only to other investment companies and accounts managed by the investment adviser and its affiliates. The Fund's Consolidated Schedule of Investments lists each of the Fidelity Central Funds held as of period end, if any, as an investment of the Fund, but does not include the underlying holdings of each Fidelity Central Fund. As an Investing Fund, the Fund indirectly bears its proportionate share of the expenses of the underlying Fidelity Central Funds.
The Money Market Central Funds seek preservation of capital and current income and are managed by Fidelity Investments Money Management, Inc. (FIMM), an affiliate of the investment adviser. Annualized expenses of the Money Market Central Funds as of their most recent shareholder report date are less than .01%.
A complete unaudited list of holdings for each Fidelity Central Fund is available upon request or at the Securities and Exchange Commission (the SEC) website at www.sec.gov. In addition, the financial statements of the Fidelity Central Funds are available on the SEC website or upon request.
4. Significant Accounting Policies.
The consolidated financial statements have been prepared in conformity with accounting principles generally accepted in the United States of America (GAAP), which require management to make certain estimates and assumptions at the date of the financial statements. Actual results could differ from those estimates. Subsequent events, if any, through the date that the financial statements were issued have been evaluated in the preparation of the financial statements. The following summarizes the significant accounting policies of the Fund:
Investment Valuation. Investments are valued as of 4:00 p.m. Eastern time on the last calendar day of the period. The Board of Trustees (the Board) has delegated the day to day responsibility for the valuation of the Fund's investments to the Fidelity SelectCo, LLC (SelectCo) Fair Value Committee (the Committee). In accordance with valuation policies and procedures approved by the Board, the Fund attempts to obtain prices from one or more third party pricing vendors or brokers to value its investments. When current market prices, quotations or currency exchange rates are not readily available or reliable, investments will be fair valued in good faith by the Committee, in accordance with procedures adopted by the Board. Factors used in determining fair value vary by investment type and may include market or investment specific events. The frequency with which these procedures are used cannot be predicted and they may be utilized to a significant extent. The Committee oversees the Fund's valuation policies and procedures and reports to the Board on the Committee's activities and fair value determinations. The Board monitors the appropriateness of the procedures used in valuing the Fund's investments and ratifies the fair value determinations of the Committee.
The Fund categorizes the inputs to valuation techniques used to value its investments into a disclosure hierarchy consisting of three levels as shown below:
- Level 1 – quoted prices in active markets for identical investments
- Level 2 – other significant observable inputs (including quoted prices for similar investments, interest rates, prepayment speeds, etc.)
- Level 3 – unobservable inputs (including the Fund's own assumptions based on the best information available)
Valuation techniques used to value the Fund's investments by major category are as follows:
Equity securities, including restricted securities, for which market quotations are readily available, are valued at the last reported sale price or official closing price as reported by a third party pricing vendor on the primary market or exchange on which they are traded and are categorized as Level 1 in the hierarchy. In the event there were no sales during the day or closing prices are not available, securities are valued at the last quoted bid price or may be valued using the last available price and are generally categorized as Level 2 in the hierarchy. For foreign equity securities, when market or security specific events arise, comparisons to the valuation of American Depositary Receipts (ADRs), futures contracts, Exchange-Traded Funds (ETFs) and certain indexes as well as quoted prices for similar securities may be used and would be categorized as Level 2 in the hierarchy. Utilizing these techniques may result in transfers between Level 1 and Level 2. For equity securities, including restricted securities, where observable inputs are limited, assumptions about market activity and risk are used and these securities may be categorized as Level 3 in the hierarchy.
Investments in commodities are valued at their last traded price at 4:00 p.m. Eastern time each business day and are categorized as Level 1 in the hierarchy. Investments in open-end mutual funds, including the Fidelity Central Funds, are valued at their closing net asset value (NAV) each business day and are categorized as Level 1 in the hierarchy.
Changes in valuation techniques may result in transfers in or out of an assigned level within the disclosure hierarchy. The aggregate value of investments by input level as of August 31, 2015, including information on transfers between Levels 1 and 2, is included at the end of the Fund's Consolidated Schedule of Investments.
Foreign Currency. The Fund may use foreign currency contracts to facilitate transactions in foreign-denominated securities. Gains and losses from these transactions may arise from changes in the value of the foreign currency or if the counterparties do not perform under the contracts' terms.
Foreign-denominated assets, including investment securities, and liabilities are translated into U.S. dollars at the exchange rates at period end. Purchases and sales of investment securities, income and dividends received and expenses denominated in foreign currencies are translated into U.S. dollars at the exchange rate in effect on the transaction date.
The effects of exchange rate fluctuations on investments are included with the net realized and unrealized gain (loss) on investment securities. Other foreign currency transactions resulting in realized and unrealized gain (loss) are disclosed separately.
Investment Transactions and Income. For financial reporting purposes, the Fund's investment holdings and NAV include trades executed through the end of the last business day of the period. The NAV per share for processing shareholder transactions is calculated as of the close of business of the New York Stock Exchange (NYSE), normally 4:00 p.m. Eastern time and includes trades executed through the end of the prior business day. Gains and losses on securities sold are determined on the basis of identified cost. Dividend income is recorded on the ex-dividend date, except for certain dividends from foreign securities where the ex-dividend date may have passed, which are recorded as soon as the Fund is informed of the ex-dividend date. Non-cash dividends included in dividend income, if any, are recorded at the fair market value of the securities received. Income and capital gain distributions from Fidelity Central Funds, if any, are recorded on the ex-dividend date. Distributions received on securities that represent a return of capital or capital gain are recorded as a reduction of cost of investments and/or as a realized gain. Subsequent to ex-dividend date the Fund determines the components of these distributions, based upon receipt of tax filings or other correspondence relating to the underlying investment. Investment income is recorded net of foreign taxes withheld where recovery of such taxes is uncertain.
Class Allocations and Expenses. Investment income, realized and unrealized capital gains and losses, common expenses of the Fund, and certain fund-level expense reductions, if any, are allocated daily on a pro-rata basis to each class based on the relative net assets of each class to the total net assets of the Fund. Each class differs with respect to transfer agent and distribution and service plan fees incurred. Certain expense reductions may also differ by class. For the reporting period, the allocated portion of income and expenses to each class as a percent of its average net assets may vary due to the timing of recording these transactions in relation to fluctuating net assets of the classes. Expenses directly attributable to a fund are charged to that fund. Expenses attributable to more than one fund are allocated among the respective funds on the basis of relative net assets or other appropriate methods. Expense estimates are accrued in the period to which they relate and adjustments are made when actual amounts are known.
Deferred Trustee Compensation. Under a Deferred Compensation Plan (the Plan), independent Trustees may elect to defer receipt of a portion of their annual compensation. Deferred amounts are invested in a cross-section of Fidelity funds, are marked-to-market and remain in the Fund until distributed in accordance with the Plan. The investment of deferred amounts and the offsetting payable to the Trustees are included in the accompanying Statement of Assets and Liabilities.
Income Tax Information and Distributions to Shareholders. Each year, the Fund intends to qualify as a regulated investment company under Subchapter M of the Internal Revenue Code, including distributing substantially all of its taxable income and realized gains. As a result, no provision for U.S. Federal income taxes is required. The Fund files a U.S. federal tax return, in addition to state and local tax returns as required. The Fund's federal income tax returns are subject to examination by the Internal Revenue Service (IRS) for a period of three fiscal years after they are filed. State and local tax returns may be subject to examination for an additional fiscal year depending on the jurisdiction. Foreign taxes are provided for based on the Fund's understanding of the tax rules and rates that exist in the foreign markets in which it invests.
The Subsidiary is classified as a controlled foreign corporation under Subchapter N of the Internal Revenue Code. Therefore, the Fund is required to increase its taxable income by its share of the Subsidiary's income. Net investment losses of the Subsidiary cannot be deducted by the Fund in the current period nor carried forward to offset taxable income in future periods.
Distributions are declared and recorded on the ex-dividend date. Income dividends and capital gain distributions are declared separately for each class. Income and capital gain distributions are determined in accordance with income tax regulations, which may differ from GAAP.
Capital accounts within the consolidated financial statements are adjusted for permanent book-tax differences. These adjustments have no impact on net assets or the results of operations. Capital accounts are not adjusted for temporary book-tax differences which will reverse in a subsequent period.
Book-tax differences are primarily due to foreign currency transactions, passive foreign investment companies (PFIC), controlled foreign corporation, deferred trustees compensation, net operating losses, losses deferred due to wash sales and capital loss carryforwards.
The federal tax cost of investment securities and unrealized appreciation (depreciation) as of period end on an unconsolidated basis were as follows:
| Gross unrealized appreciation | $81,771,580 |
| Gross unrealized depreciation | (746,584,444) |
| Net unrealized appreciation (depreciation) on securities | $(664,812,864) |
| Tax cost | $1,546,365,582 |
Capital loss carryforwards are only available to offset future capital gains of the Fund to the extent provided by regulations and may be limited. Under the Regulated Investment Company Modernization Act of 2010 (the Act), the Fund is permitted to carry forward capital losses incurred in taxable years beginning after December 22, 2010 for an unlimited period and such capital losses are required to be used prior to any losses that expire. The capital loss carryforward information presented below, including any applicable limitation, is estimated as of prior fiscal period end and is subject to adjustment.
| No expiration | |
| Short-term | $(134,736,786) |
| Long-term | (859,477,478) |
| Total capital loss carryforward | $(994,214,264) |
Trading (Redemption) Fees. Shares held by investors in the Fund less than 30 days may be subject to a redemption fee equal to .75% of the NAV of shares redeemed. All redemption fees, which reduce the proceeds of the shareholder redemption, are retained by the Fund and accounted for as an addition to paid in capital.
Restricted Securities. The Fund may invest in securities that are subject to legal or contractual restrictions on resale. These securities generally may be resold in transactions exempt from registration or to the public if the securities are registered. Disposal of these securities may involve time-consuming negotiations and expense, and prompt sale at an acceptable price may be difficult. Information regarding restricted securities is included at the end of the Fund's Consolidated Schedule of Investments.
5. Purchases and Sales of Investments.
Purchases and sales of securities, other than short-term securities, aggregated $120,418,024 and $108,936,305, respectively.
6. Fees and Other Transactions with Affiliates.
Management Fee. Fidelity SelectCo, LLC (the investment adviser) and its affiliates provide the Fund with investment management related services for which the Fund pays a monthly management fee. The management fee is the sum of an individual fund fee rate that is based on an annual rate of .30% of the Fund's average net assets and an annualized group fee rate that averaged .25% during the period. The group fee rate is based upon the average net assets of all the mutual funds advised by Fidelity Management & Research Company (FMR) and the investment adviser. The group fee rate decreases as assets under management increase and increases as assets under management decrease.
FMR, either through itself or through an affiliate provides investment management related services to the Subsidiary for which the Subsidiary pays a monthly management fee at the annual rate of .30% of its net assets. Under the management contract with the subsidiary, FMR pays all other expenses of the Subsidiary, except custodian fees.
For the reporting period, the total consolidated annualized management fee rate which includes the management fee of the Fund and the Subsidiary was .59% of the Fund's average net assets.
During the period, the investment adviser waived a portion of the Fund's management fee representing the amount of the management fee paid by the Subsidiary to FMR as described in the Expense Reductions note.
Distribution and Service Plan Fees. In accordance with Rule 12b-1 of the 1940 Act, the Fund has adopted separate Distribution and Service Plans for each class of shares. Certain classes pay Fidelity Distributors Corporation (FDC), an affiliate of the investment adviser, separate Distribution and Service Fees, each of which is based on an annual percentage of each class' average net assets. In addition, FDC may pay financial intermediaries for selling shares of the Fund and providing shareholder support services. For the period, the Distribution and Service Fee rates, total fees and amounts retained by FDC were as follows:
| Distribution Fee | Service Fee | Total Fees | Retained by FDC |
|
| Class A | -% | .25% | $50,570 | $95 |
| Class T | .25% | .25% | 35,568 | – |
| Class B | .75% | .25% | 9,399 | 7,049 |
| Class C | .75% | .25% | 180,168 | 49,070 |
| $275,705 | $56,214 |
Sales Load. FDC may receive a front-end sales charge of up to 5.75% for selling Class A shares and 3.50% for selling Class T shares, some of which is paid to financial intermediaries for selling shares of the Fund. Depending on the holding period, FDC may receive contingent deferred sales charges levied on Class A, Class T, Class B and Class C redemptions. The deferred sales charges range from 5.00% to 1.00% for Class B shares, 1.00% for Class C shares, 1.00% for certain purchases of Class A shares and .25% for certain purchases of Class T shares.
For the period, sales charge amounts retained by FDC were as follows:
| Retained by FDC |
|
| Class A | $12,199 |
| Class T | 4,395 |
| Class B* | 977 |
| Class C* | 1,705 |
| $19,276 |
* When Class B and Class C shares are initially sold, FDC pays commissions from its own resources to financial intermediaries through which the sales are made.
Transfer Agent Fees. Fidelity Investments Institutional Operations Company, Inc., (FIIOC), an affiliate of the investment adviser, is the transfer, dividend disbursing and shareholder servicing agent for each class of the Fund. FIIOC receives account fees and asset-based fees that vary according to the account size and type of account of the shareholders of the respective classes of the Fund. FIIOC pays for typesetting, printing and mailing of shareholder reports, except proxy statements.
For the period, transfer agent fees for each class were as follows:
| Amount | % of Class-Level Average Net Assets* |
|
| Class A | $61,519 | .30 |
| Class T | 23,694 | .33 |
| Class B | 2,834 | .30 |
| Class C | 51,971 | .29 |
| Gold | 1,208,630 | .28 |
| Class I | 29,496 | .25 |
| $1,378,144 |
*Annualized
Accounting and Security Lending Fees. Fidelity Service Company, Inc. (FSC), an affiliate of the investment adviser, maintains the Fund's accounting records. The accounting fee is based on the level of average net assets for each month. Under a separate contract, FSC administers the security lending program. The security lending fee is based on the number and duration of lending transactions.
Brokerage Commissions. The Fund placed a portion of its portfolio transactions with brokerage firms which are affiliates of the investment adviser. Brokerage commissions are included in net realized gain (loss) and change in net unrealized appreciation (depreciation) in the Consolidated Statement of Operations. The commissions paid to these affiliated firms were $3,255 for the period.
7. Committed Line of Credit.
The Fund participates with other funds managed by the investment adviser or an affiliate in a $4.25 billion credit facility (the "line of credit") to be utilized for temporary or emergency purposes to fund shareholder redemptions or for other short-term liquidity purposes. The Fund has agreed to pay commitment fees on its pro-rata portion of the line of credit, which amounted to $728 and is reflected in Miscellaneous expenses on the Consolidated Statement of Operations. During the period, the Fund did not borrow on this line of credit.
8. Security Lending.
The Fund lends portfolio securities through a lending agent from time to time in order to earn additional income. On the settlement date of the loan, the Fund receives collateral (in the form of U.S. Treasury obligations, letters of credit and/or cash) against the loaned securities and maintains collateral in an amount not less than 100% of the market value of the loaned securities during the period of the loan. The market value of the loaned securities is determined at the close of business of the Fund and any additional required collateral is delivered to the Fund on the next business day. If the borrower defaults on its obligation to return the securities loaned because of insolvency or other reasons, the Fund may apply collateral received from the borrower against the obligation. The Fund may experience delays and costs in recovering the securities loaned. Any cash collateral received is invested in the Fidelity Securities Lending Cash Central Fund. The value of loaned securities and cash collateral at period end are disclosed on the Fund's Consolidated Statement of Assets and Liabilities. Security lending income represents the income earned on investing cash collateral, less rebates paid to borrowers and any lending agent fees associated with the loan, plus any premium payments received for lending certain types of securities. Security lending income is presented in the Consolidated Statement of Operations as a component of income from Fidelity Central Funds. Total security lending income during the period amounted to $122,985.
9. Expense Reductions.
The investment adviser has contractually agreed to waive the Fund's management fee in an amount equal to the management fee paid by the Subsidiary to FMR. During the period, this waiver reduced the Fund's management fee by $179,299.
Commissions paid to certain brokers with whom the investment adviser, or its affiliates, places trades on behalf of the Fund include an amount in addition to trade execution, which may be rebated back to the Fund to offset certain expenses. This amount totaled $11,629 for the period.
In addition, during the period the investment adviser reimbursed and/or waived a portion of fund-level operating expenses in the amount of $4,008 and a portion of class-level operating expenses as follows:
| Amount | |
| Class A | $100 |
| Class T | 28 |
| Class B | 4 |
| Class C | 395 |
| Gold | 23,242 |
| Class I | 1,473 |
| $25,242 |
10. Share Transactions.
Share transactions for each class were as follows and may contain automatic conversions between classes or exchanges between funds:
| Shares | Shares | Dollars | Dollars | |
| Six months ended August 31, 2015 | Year ended February 28, 2015 | Six months ended August 31, 2015 | Year ended February 28, 2015 | |
| Class A | ||||
| Shares sold | 518,834 | 1,014,651 | $8,025,425 | $20,366,842 |
| Shares redeemed | (465,693) | (1,163,476) | (7,275,162) | (22,763,258) |
| Net increase (decrease) | 53,141 | (148,825) | $750,263 | $(2,396,416) |
| Class T | ||||
| Shares sold | 136,765 | 317,888 | $2,107,964 | $6,202,712 |
| Shares redeemed | (132,218) | (256,267) | (2,013,307) | (4,926,125) |
| Net increase (decrease) | 4,547 | 61,621 | $94,657 | $1,276,587 |
| Class B | ||||
| Shares sold | 4,058 | 6,743 | $57,181 | $129,320 |
| Shares redeemed | (37,931) | (71,044) | (574,395) | (1,326,720) |
| Net increase (decrease) | (33,873) | (64,301) | $(517,214) | $(1,197,400) |
| Class C | ||||
| Shares sold | 508,709 | 1,131,151 | $7,441,929 | $21,162,781 |
| Shares redeemed | (210,167) | (444,470) | (3,005,672) | (8,210,673) |
| Net increase (decrease) | 298,542 | 686,681 | $4,436,257 | $12,952,108 |
| Gold | ||||
| Shares sold | 8,910,056 | 22,066,731 | $139,098,070 | $446,680,830 |
| Shares redeemed | (9,151,440) | (25,311,740) | (145,489,035) | (508,417,315) |
| Net increase (decrease) | (241,384) | (3,245,009) | $(6,390,965) | $(61,736,485) |
| Class I | ||||
| Shares sold | 846,060 | 1,547,691 | $14,167,660 | $33,198,070 |
| Shares redeemed | (752,517) | (5,080,368) | (11,269,149) | (106,841,413) |
| Net increase (decrease) | 93,543 | (3,532,677) | $2,898,511 | $(73,643,343) |
11. Other.
The Fund's organizational documents provide former and current trustees and officers with a limited indemnification against liabilities arising in connection with the performance of their duties to the Fund. In the normal course of business, the Fund may also enter into contracts that provide general indemnifications. The Fund's maximum exposure under these arrangements is unknown as this would be dependent on future claims that may be made against the Fund. The risk of material loss from such claims is considered remote.
Materials Portfolio
Investment Summary (Unaudited)
Top Ten Stocks as of August 31, 2015
| % of fund's net assets | % of fund's net assets 6 months ago | |
| Monsanto Co. | 9.6 | 8.5 |
| E.I. du Pont de Nemours & Co. | 9.4 | 11.4 |
| WestRock Co. | 9.2 | 5.5 |
| Eastman Chemical Co. | 8.0 | 5.3 |
| LyondellBasell Industries NV Class A | 7.2 | 4.7 |
| Ecolab, Inc. | 6.4 | 5.3 |
| PPG Industries, Inc. | 4.9 | 0.0 |
| Eagle Materials, Inc. | 4.6 | 3.1 |
| Graphic Packaging Holding Co. | 3.8 | 2.5 |
| CF Industries Holdings, Inc. | 3.4 | 3.4 |
| 66.5 |
Top Industries (% of fund's net assets)
| As of August 31, 2015 | ||
| Chemicals | 63.5% | |
| Containers & Packaging | 21.6% | |
| Metals & Mining | 5.2% | |
| Construction Materials | 4.6% | |
| Paper & Forest Products | 1.5% | |
| All Others* | 3.6% | |

| As of February 28, 2015 | ||
| Chemicals | 70.0% | |
| Containers & Packaging | 16.6% | |
| Metals & Mining | 6.7% | |
| Construction Materials | 3.1% | |
| Paper & Forest Products | 1.7% | |
| All Others* | 1.9% | |

* Includes short-term investments and net other assets (liabilities).
Percentages shown as 0.0% may reflect amounts less than 0.05%.
Materials Portfolio
Investments August 31, 2015 (Unaudited)
Showing Percentage of Net Assets
| Common Stocks - 97.7% | |||
| Shares | Value | ||
| Chemicals - 63.5% | |||
| Commodity Chemicals - 8.2% | |||
| LyondellBasell Industries NV Class A | 1,421,396 | $121,358,790 | |
| Orion Engineered Carbons SA | 987,291 | 16,191,572 | |
| 137,550,362 | |||
| Diversified Chemicals - 17.4% | |||
| E.I. du Pont de Nemours & Co. | 3,037,700 | 156,441,550 | |
| Eastman Chemical Co. | 1,857,730 | 134,611,116 | |
| 291,052,666 | |||
| Fertilizers & Agricultural Chemicals - 14.5% | |||
| Agrium, Inc. | 235,300 | 24,433,211 | |
| CF Industries Holdings, Inc. | 1,004,710 | 57,650,260 | |
| Monsanto Co. | 1,644,830 | 160,617,649 | |
| 242,701,120 | |||
| Specialty Chemicals - 23.4% | |||
| Albemarle Corp. U.S. | 634,700 | 28,694,787 | |
| Ashland, Inc. | 473,600 | 49,713,792 | |
| Ecolab, Inc. | 988,320 | 107,865,245 | |
| Frutarom Industries Ltd. | 192,796 | 7,320,092 | |
| NewMarket Corp. | 73,229 | 28,064,282 | |
| PPG Industries, Inc. | 864,500 | 82,378,205 | |
| Valspar Corp. | 447,600 | 32,809,080 | |
| W.R. Grace & Co. (a) | 554,340 | 54,846,400 | |
| 391,691,883 | |||
| TOTAL CHEMICALS | 1,062,996,031 | ||
| Construction Materials - 4.6% | |||
| Construction Materials - 4.6% | |||
| Eagle Materials, Inc. | 945,655 | 77,382,949 | |
| Containers & Packaging - 21.6% | |||
| Metal & Glass Containers - 4.2% | |||
| Ball Corp. | 747,683 | 49,279,787 | |
| Owens-Illinois, Inc. (a) | 995,900 | 20,764,515 | |
| 70,044,302 | |||
| Paper Packaging - 17.4% | |||
| Graphic Packaging Holding Co. | 4,485,495 | 63,245,480 | |
| Packaging Corp. of America | 477,700 | 32,058,447 | |
| Sealed Air Corp. | 819,000 | 42,137,550 | |
| WestRock Co. | 2,585,119 | 153,426,813 | |
| 290,868,290 | |||
| TOTAL CONTAINERS & PACKAGING | 360,912,592 | ||
| Energy Equipment & Services - 0.3% | |||
| Oil & Gas Equipment & Services - 0.3% | |||
| Aspen Aerogels, Inc. (a) | 730,304 | 5,455,371 | |
| Metals & Mining - 5.2% | |||
| Steel - 5.2% | |||
| Nucor Corp. | 763,000 | 33,030,270 | |
| Steel Dynamics, Inc. | 2,789,000 | 54,329,720 | |
| 87,359,990 | |||
| Paper & Forest Products - 1.5% | |||
| Paper Products - 1.5% | |||
| Domtar Corp. | 614,400 | 24,705,024 | |
| Trading Companies & Distributors - 1.0% | |||
| Trading Companies & Distributors - 1.0% | |||
| Wolseley PLC | 265,676 | 17,151,090 | |
| TOTAL COMMON STOCKS | |||
| (Cost $1,466,459,195) | 1,635,963,047 | ||
| Money Market Funds - 1.7% | |||
| Fidelity Cash Central Fund, 0.15% (b) | 29,154,794 | 29,154,794 | |
| Fidelity Securities Lending Cash Central Fund, 0.19% (b)(c) | 12,705 | 12,705 | |
| TOTAL MONEY MARKET FUNDS | |||
| (Cost $29,167,499) | 29,167,499 | ||
| TOTAL INVESTMENT PORTFOLIO - 99.4% | |||
| (Cost $1,495,626,694) | 1,665,130,546 | ||
| NET OTHER ASSETS (LIABILITIES) - 0.6% | 9,372,241 | ||
| NET ASSETS - 100% | $1,674,502,787 |
Legend
(a) Non-income producing
(b) Affiliated fund that is generally available only to investment companies and other accounts managed by Fidelity Investments. The rate quoted is the annualized seven-day yield of the fund at period end. A complete unaudited listing of the fund's holdings as of its most recent quarter end is available upon request. In addition, each Fidelity Central Fund's financial statements are available on the SEC's website or upon request.
(c) Investment made with cash collateral received from securities on loan.
Affiliated Central Funds
Information regarding fiscal year to date income earned by the Fund from investments in Fidelity Central Funds is as follows:
| Fund | Income earned |
| Fidelity Cash Central Fund | $16,804 |
| Fidelity Securities Lending Cash Central Fund | 47,166 |
| Total | $63,970 |
Other Affiliated Issuers
An affiliated company is a company in which the Fund has ownership of at least 5% of the voting securities. Fiscal year to date transactions with companies which are or were affiliates are as follows:
| Affiliate | Value, beginning of period | Purchases | Sales Proceeds | Dividend Income | Value, end of period |
| Aspen Aerogels, Inc. | $10,127,522 | $-- | $3,743,092 | $-- | $-- |
| Total | $10,127,522 | $-- | $3,743,092 | $-- | $-- |
Investment Valuation
All investments are categorized as Level 1 under the Fair Value Hierarchy. The inputs or methodology used for valuing securities may not be an indication of the risk associated with investing in those securities. For more information on valuation inputs please refer to the Investment Valuation section in the accompanying Notes to Financial Statements.
Other Information
Distribution of investments by country or territory of incorporation, as a percentage of Total Net Assets, is as follows (Unaudited):
| United States of America | 88.9% |
| Netherlands | 7.2% |
| Canada | 1.5% |
| Bailiwick of Jersey | 1.0% |
| Luxembourg | 1.0% |
| Others (Individually Less Than 1%) | 0.4% |
| 100.0% |
See accompanying notes which are an integral part of the financial statements.
Materials Portfolio
Financial Statements
Statement of Assets and Liabilities
| August 31, 2015 (Unaudited) | ||
| Assets | ||
| Investment in securities, at value (including securities loaned of $12,140) — See accompanying schedule: Unaffiliated issuers (cost $1,466,459,195) | $1,635,963,047 | |
| Fidelity Central Funds (cost $29,167,499) | 29,167,499 | |
| Total Investments (cost $1,495,626,694) | $1,665,130,546 | |
| Receivable for investments sold | 13,287,975 | |
| Receivable for fund shares sold | 2,167,025 | |
| Dividends receivable | 3,035,995 | |
| Distributions receivable from Fidelity Central Funds | 6,502 | |
| Prepaid expenses | 13,140 | |
| Other receivables | 55,775 | |
| Total assets | 1,683,696,958 | |
| Liabilities | ||
| Payable for investments purchased | $2,755,247 | |
| Payable for fund shares redeemed | 5,040,926 | |
| Accrued management fee | 797,510 | |
| Distribution and service plan fees payable | 153,565 | |
| Other affiliated payables | 361,122 | |
| Other payables and accrued expenses | 73,096 | |
| Collateral on securities loaned, at value | 12,705 | |
| Total liabilities | 9,194,171 | |
| Net Assets | $1,674,502,787 | |
| Net Assets consist of: | ||
| Paid in capital | $1,472,594,709 | |
| Undistributed net investment income | 10,812,476 | |
| Accumulated undistributed net realized gain (loss) on investments and foreign currency transactions | 21,597,795 | |
| Net unrealized appreciation (depreciation) on investments and assets and liabilities in foreign currencies | 169,497,807 | |
| Net Assets | $1,674,502,787 | |
| Calculation of Maximum Offering Price | ||
| Class A: | ||
| Net Asset Value and redemption price per share ($266,036,916 ÷ 3,727,290 shares) | $71.38 | |
| Maximum offering price per share (100/94.25 of $71.38) | $75.73 | |
| Class T: | ||
| Net Asset Value and redemption price per share ($36,405,782 ÷ 513,954 shares) | $70.83 | |
| Maximum offering price per share (100/96.50 of $70.83) | $73.40 | |
| Class B: | ||
| Net Asset Value and offering price per share ($4,335,467 ÷ 62,647 shares)(a) | $69.20 | |
| Class C: | ||
| Net Asset Value and offering price per share ($87,674,791 ÷ 1,269,500 shares)(a) | $69.06 | |
| Materials: | ||
| Net Asset Value, offering price and redemption price per share ($870,836,054 ÷ 12,133,503 shares) | $71.77 | |
| Class I: | ||
| Net Asset Value, offering price and redemption price per share ($409,213,777 ÷ 5,713,013 shares) | $71.63 |
(a) Redemption price per share is equal to net asset value less any applicable contingent deferred sales charge.
See accompanying notes which are an integral part of the financial statements.
Statement of Operations
| Six months ended August 31, 2015 (Unaudited) | ||
| Investment Income | ||
| Dividends | $19,405,914 | |
| Interest | 16 | |
| Income from Fidelity Central Funds | 63,970 | |
| Total income | 19,469,900 | |
| Expenses | ||
| Management fee | $5,244,790 | |
| Transfer agent fees | 1,987,249 | |
| Distribution and service plan fees | 1,010,334 | |
| Accounting and security lending fees | 293,390 | |
| Custodian fees and expenses | 14,041 | |
| Independent trustees' compensation | 16,663 | |
| Registration fees | 93,949 | |
| Audit | 26,997 | |
| Legal | 12,507 | |
| Miscellaneous | 14,580 | |
| Total expenses before reductions | 8,714,500 | |
| Expense reductions | (90,142) | 8,624,358 |
| Net investment income (loss) | 10,845,542 | |
| Realized and Unrealized Gain (Loss)
Net realized gain (loss) on: | ||
| Investment securities: | ||
| Unaffiliated issuers | 38,934,697 | |
| Other affiliated issuers | (16,224) | |
| Foreign currency transactions | (97,265) | |
| Total net realized gain (loss) | 38,821,208 | |
| Change in net unrealized appreciation (depreciation) on: Investment securities | (267,797,224) | |
| Assets and liabilities in foreign currencies | (6,045) | |
| Total change in net unrealized appreciation (depreciation) | (267,803,269) | |
| Net gain (loss) | (228,982,061) | |
| Net increase (decrease) in net assets resulting from operations | $(218,136,519) |
See accompanying notes which are an integral part of the financial statements.
Statement of Changes in Net Assets
| Six months ended August 31, 2015 (Unaudited) | Year ended February 28, 2015 | |
| Increase (Decrease) in Net Assets | ||
| Operations | ||
| Net investment income (loss) | $10,845,542 | $16,415,183 |
| Net realized gain (loss) | 38,821,208 | 140,995,843 |
| Change in net unrealized appreciation (depreciation) | (267,803,269) | (115,351,730) |
| Net increase (decrease) in net assets resulting from operations | (218,136,519) | 42,059,296 |
| Distributions to shareholders from net investment income | – | (14,132,791) |
| Distributions to shareholders from net realized gain | (906,398) | (176,045,519) |
| Total distributions | (906,398) | (190,178,310) |
| Share transactions - net increase (decrease) | (161,718,782) | 139,840,860 |
| Redemption fees | 28,645 | 59,111 |
| Total increase (decrease) in net assets | (380,733,054) | (8,219,043) |
| Net Assets | ||
| Beginning of period | 2,055,235,841 | 2,063,454,884 |
| End of period (including undistributed net investment income of $10,812,476 and distributions in excess of net investment income of $33,066, respectively) | $1,674,502,787 | $2,055,235,841 |
See accompanying notes which are an integral part of the financial statements.
Financial Highlights — Materials Portfolio Class A
| Six months ended (Unaudited) | Years ended February 28, | |||||
| August 31, | 2015 | 2015 | 2014 | 2013 | 2012 A | 2011 |
| Selected Per–Share Data | ||||||
| Net asset value, beginning of period | $80.43 | $86.46 | $73.44 | $69.23 | $69.96 | $52.54 |
| Income from Investment Operations | ||||||
| Net investment income (loss)B | .38 | .51 | .36 | .70 | .40 | 1.08C |
| Net realized and unrealized gain (loss) | (9.39) | 1.05 | 14.56 | 5.69 | (.35) | 17.40 |
| Total from investment operations | (9.01) | 1.56 | 14.92 | 6.39 | .05 | 18.48 |
| Distributions from net investment income | – | (.43) | (.30) | (.63) | (.40) | (1.06) |
| Distributions from net realized gain | (.04) | (7.17) | (1.60) | (1.55) | (.38) | (.01) |
| Total distributions | (.04) | (7.59)D | (1.90) | (2.18) | (.78) | (1.07) |
| Redemption fees added to paid in capitalB | –E | –E | –E | –E | –E | .01 |
| Net asset value, end of period | $71.38 | $80.43 | $86.46 | $73.44 | $69.23 | $69.96 |
| Total ReturnF,G,H | (11.21)% | 2.20% | 20.46% | 9.40% | .21% | 35.33% |
| Ratios to Average Net AssetsI,J | ||||||
| Expenses before reductions | 1.06%K | 1.06% | 1.10% | 1.13% | 1.13% | 1.16% |
| Expenses net of fee waivers, if any | 1.06%K | 1.06% | 1.10% | 1.13% | 1.13% | 1.16% |
| Expenses net of all reductions | 1.05%K | 1.06% | 1.09% | 1.12% | 1.13% | 1.15% |
| Net investment income (loss) | .98%K | .61% | .45% | 1.02% | .61% | 1.81%C |
| Supplemental Data | ||||||
| Net assets, end of period (000 omitted) | $266,037 | $319,740 | $336,777 | $219,627 | $157,781 | $124,160 |
| Portfolio turnover rateL | 70%K | 76%M | 53% | 61% | 94% | 87% |
A For the year ended February 29.
B Calculated based on average shares outstanding during the period.
C Investment income per share reflects a large, non-recurring dividend which amounted to $.83 per share. Excluding this non-recurring dividend, the ratio of net investment income (loss) to average net assets would have been .41%.
D Total distributions of $7.59 per share is comprised of distributions from net investment income of $.425 and distributions from net realized gain of $7.167 per share.
E Amount represents less than $.005 per share.
F Total returns for periods of less than one year are not annualized.
G Total returns would have been lower if certain expenses had not been reduced during the applicable periods shown.
H Total returns do not include the effect of the sales charges.
I Fees and expenses of any underlying Fidelity Central Funds are not included in the Fund's expense ratio. The Fund indirectly bears its proportionate share of the expenses of any underlying Fidelity Central Funds.
J Expense ratios reflect operating expenses of the class. Expenses before reductions do not reflect amounts reimbursed by the investment adviser or reductions from brokerage service arrangements or reductions from other expense offset arrangements and do not represent the amount paid by the class during periods when reimbursements or reductions occur. Expenses net of fee waivers reflect expenses after reimbursement by the investment adviser but prior to reductions from brokerage service arrangements or other expense offset arrangements. Expenses net of all reductions represent the net expenses paid by the class.
K Annualized
L Amount does not include the portfolio activity of any underlying Fidelity Central Funds.
M Portfolio turnover rate excludes securities received or delivered in-kind.
See accompanying notes which are an integral part of the financial statements.
Financial Highlights — Materials Portfolio Class T
| Six months ended (Unaudited) | Years ended February 28, | |||||
| August 31, | 2015 | 2015 | 2014 | 2013 | 2012 A | 2011 |
| Selected Per–Share Data | ||||||
| Net asset value, beginning of period | $79.95 | $85.99 | $73.05 | $68.91 | $69.68 | $52.35 |
| Income from Investment Operations | ||||||
| Net investment income (loss)B | .26 | .25 | .12 | .50 | .21 | .90C |
| Net realized and unrealized gain (loss) | (9.34) | 1.06 | 14.48 | 5.66 | (.35) | 17.34 |
| Total from investment operations | (9.08) | 1.31 | 14.60 | 6.16 | (.14) | 18.24 |
| Distributions from net investment income | – | (.18) | (.06) | (.46) | (.25) | (.92) |
| Distributions from net realized gain | (.04) | (7.17) | (1.60) | (1.55) | (.38) | – |
| Total distributions | (.04) | (7.35) | (1.66) | (2.02)D | (.63) | (.92) |
| Redemption fees added to paid in capitalB | –E | –E | –E | –E | –E | .01 |
| Net asset value, end of period | $70.83 | $79.95 | $85.99 | $73.05 | $68.91 | $69.68 |
| Total ReturnF,G,H | (11.37)% | 1.90% | 20.10% | 9.10% | (.09)% | 34.98% |
| Ratios to Average Net AssetsI,J | ||||||
| Expenses before reductions | 1.37%K | 1.37% | 1.40% | 1.42% | 1.42% | 1.44% |
| Expenses net of fee waivers, if any | 1.37%K | 1.37% | 1.40% | 1.42% | 1.42% | 1.44% |
| Expenses net of all reductions | 1.36%K | 1.37% | 1.39% | 1.41% | 1.41% | 1.43% |
| Net investment income (loss) | .67%K | .31% | .15% | .73% | .33% | 1.54%C |
| Supplemental Data | ||||||
| Net assets, end of period (000 omitted) | $36,406 | $45,252 | $45,223 | $37,860 | $28,290 | $25,570 |
| Portfolio turnover rateL | 70%K | 76%M | 53% | 61% | 94% | 87% |
A For the year ended February 29.
B Calculated based on average shares outstanding during the period.
C Investment income per share reflects a large, non-recurring dividend which amounted to $.83 per share. Excluding this non-recurring dividend, the ratio of net investment income (loss) to average net assets would have been .14%.
D Total distributions of $2.02 per share is comprised of distributions from net investment income of $.463 and distributions from net realized gain of $1.552 per share.
E Amount represents less than $.005 per share.
F Total returns for periods of less than one year are not annualized.
G Total returns would have been lower if certain expenses had not been reduced during the applicable periods shown.
H Total returns do not include the effect of the sales charges.
I Fees and expenses of any underlying Fidelity Central Funds are not included in the Fund's expense ratio. The Fund indirectly bears its proportionate share of the expenses of any underlying Fidelity Central Funds.
J Expense ratios reflect operating expenses of the class. Expenses before reductions do not reflect amounts reimbursed by the investment adviser or reductions from brokerage service arrangements or reductions from other expense offset arrangements and do not represent the amount paid by the class during periods when reimbursements or reductions occur. Expenses net of fee waivers reflect expenses after reimbursement by the investment adviser but prior to reductions from brokerage service arrangements or other expense offset arrangements. Expenses net of all reductions represent the net expenses paid by the class.
K Annualized
L Amount does not include the portfolio activity of any underlying Fidelity Central Funds.
M Portfolio turnover rate excludes securities received or delivered in-kind.
See accompanying notes which are an integral part of the financial statements.
Financial Highlights — Materials Portfolio Class B
| Six months ended (Unaudited) | Years ended February 28, | |||||
| August 31, | 2015 | 2015 | 2014 | 2013 | 2012 A | 2011 |
| Selected Per–Share Data | ||||||
| Net asset value, beginning of period | $78.31 | $84.63 | $72.21 | $68.13 | $68.95 | $51.86 |
| Income from Investment Operations | ||||||
| Net investment income (loss)B | .06 | (.18) | (.28) | .16 | (.11) | .60C |
| Net realized and unrealized gain (loss) | (9.13) | 1.03 | 14.28 | 5.57 | (.33) | 17.13 |
| Total from investment operations | (9.07) | .85 | 14.00 | 5.73 | (.44) | 17.73 |
| Distributions from net investment income | – | – | – | (.10) | – | (.65) |
| Distributions from net realized gain | (.04) | (7.17) | (1.58) | (1.55) | (.38) | – |
| Total distributions | (.04) | (7.17) | (1.58) | (1.65) | (.38) | (.65) |
| Redemption fees added to paid in capitalB | –D | –D | –D | –D | –D | .01 |
| Net asset value, end of period | $69.20 | $78.31 | $84.63 | $72.21 | $68.13 | $68.95 |
| Total ReturnE,F,G | (11.59)% | 1.35% | 19.50% | 8.55% | (.57)% | 34.29% |
| Ratios to Average Net AssetsH,I | ||||||
| Expenses before reductions | 1.88%J | 1.89% | 1.90% | 1.92% | 1.91% | 1.93% |
| Expenses net of fee waivers, if any | 1.88%J | 1.89% | 1.90% | 1.92% | 1.91% | 1.93% |
| Expenses net of all reductions | 1.88%J | 1.89% | 1.90% | 1.91% | 1.91% | 1.92% |
| Net investment income (loss) | .16%J | (.22)% | (.36)% | .24% | (.17)% | 1.04%C |
| Supplemental Data | ||||||
| Net assets, end of period (000 omitted) | $4,335 | $6,487 | $8,671 | $10,218 | $11,040 | $13,507 |
| Portfolio turnover rateK | 70%J | 76%L | 53% | 61% | 94% | 87% |
A For the year ended February 29.
B Calculated based on average shares outstanding during the period.
C Investment income per share reflects a large, non-recurring dividend which amounted to $.83 per share. Excluding this non-recurring dividend, the ratio of net investment income (loss) to average net assets would have been (.35) %.
D Amount represents less than $.005 per share.
E Total returns for periods of less than one year are not annualized.
F Total returns would have been lower if certain expenses had not been reduced during the applicable periods shown.
G Total returns do not include the effect of the contingent deferred sales charge.
H Fees and expenses of any underlying Fidelity Central Funds are not included in the Fund's expense ratio. The Fund indirectly bears its proportionate share of the expenses of any underlying Fidelity Central Funds.
I Expense ratios reflect operating expenses of the class. Expenses before reductions do not reflect amounts reimbursed by the investment adviser or reductions from brokerage service arrangements or reductions from other expense offset arrangements and do not represent the amount paid by the class during periods when reimbursements or reductions occur. Expenses net of fee waivers reflect expenses after reimbursement by the investment adviser but prior to reductions from brokerage service arrangements or other expense offset arrangements. Expenses net of all reductions represent the net expenses paid by the class.
J Annualized
K Amount does not include the portfolio activity of any underlying Fidelity Central Funds.
L Portfolio turnover rate excludes securities received or delivered in-kind.
See accompanying notes which are an integral part of the financial statements.
Financial Highlights — Materials Portfolio Class C
| Six months ended (Unaudited) | Years ended February 28, | |||||
| August 31, | 2015 | 2015 | 2014 | 2013 | 2012 A | 2011 |
| Selected Per–Share Data | ||||||
| Net asset value, beginning of period | $78.12 | $84.38 | $71.96 | $67.98 | $68.78 | $51.79 |
| Income from Investment Operations | ||||||
| Net investment income (loss)B | .09 | (.12) | (.23) | .18 | (.10) | .61C |
| Net realized and unrealized gain (loss) | (9.11) | 1.03 | 14.23 | 5.55 | (.32) | 17.09 |
| Total from investment operations | (9.02) | .91 | 14.00 | 5.73 | (.42) | 17.70 |
| Distributions from net investment income | – | – | – | (.20) | – | (.72) |
| Distributions from net realized gain | (.04) | (7.17) | (1.58) | (1.55) | (.38) | – |
| Total distributions | (.04) | (7.17) | (1.58) | (1.75) | (.38) | (.72) |
| Redemption fees added to paid in capitalB | –D | –D | –D | –D | –D | .01 |
| Net asset value, end of period | $69.06 | $78.12 | $84.38 | $71.96 | $67.98 | $68.78 |
| Total ReturnE,F,G | (11.56)% | 1.43% | 19.56% | 8.58% | (.55)% | 34.29% |
| Ratios to Average Net AssetsH,I | ||||||
| Expenses before reductions | 1.82%J | 1.82% | 1.85% | 1.89% | 1.89% | 1.93% |
| Expenses net of fee waivers, if any | 1.81%J | 1.82% | 1.85% | 1.89% | 1.89% | 1.93% |
| Expenses net of all reductions | 1.81%J | 1.82% | 1.84% | 1.88% | 1.89% | 1.92% |
| Net investment income (loss) | .23%J | (.14)% | (.30)% | .26% | (.15)% | 1.04%C |
| Supplemental Data | ||||||
| Net assets, end of period (000 omitted) | $87,675 | $107,697 | $106,879 | $75,007 | $58,296 | $46,525 |
| Portfolio turnover rateK | 70%J | 76%L | 53% | 61% | 94% | 87% |
A For the year ended February 29.
B Calculated based on average shares outstanding during the period.
C Investment income per share reflects a large, non-recurring dividend which amounted to $.83 per share. Excluding this non-recurring dividend, the ratio of net investment income (loss) to average net assets would have been (.35) %.
D Amount represents less than $.005 per share.
E Total returns for periods of less than one year are not annualized.
F Total returns would have been lower if certain expenses had not been reduced during the applicable periods shown.
G Total returns do not include the effect of the contingent deferred sales charge.
H Fees and expenses of any underlying Fidelity Central Funds are not included in the Fund's expense ratio. The Fund indirectly bears its proportionate share of the expenses of any underlying Fidelity Central Funds.
I Expense ratios reflect operating expenses of the class. Expenses before reductions do not reflect amounts reimbursed by the investment adviser or reductions from brokerage service arrangements or reductions from other expense offset arrangements and do not represent the amount paid by the class during periods when reimbursements or reductions occur. Expenses net of fee waivers reflect expenses after reimbursement by the investment adviser but prior to reductions from brokerage service arrangements or other expense offset arrangements. Expenses net of all reductions represent the net expenses paid by the class.
J Annualized
K Amount does not include the portfolio activity of any underlying Fidelity Central Funds.
L Portfolio turnover rate excludes securities received or delivered in-kind.
See accompanying notes which are an integral part of the financial statements.
Financial Highlights — Materials Portfolio
| Six months ended (Unaudited) | Years ended February 28, | |||||
| August 31, | 2015 | 2015 | 2014 | 2013 | 2012 A | 2011 |
| Selected Per–Share Data | ||||||
| Net asset value, beginning of period | $80.77 | $86.81 | $73.68 | $69.41 | $70.11 | $52.61 |
| Income from Investment Operations | ||||||
| Net investment income (loss)B | .48 | .73 | .58 | .90 | .60 | 1.25C |
| Net realized and unrealized gain (loss) | (9.44) | 1.05 | 14.63 | 5.71 | (.37) | 17.43 |
| Total from investment operations | (8.96) | 1.78 | 15.21 | 6.61 | .23 | 18.68 |
| Distributions from net investment income | – | (.65) | (.48) | (.79) | (.55) | (1.16) |
| Distributions from net realized gain | (.04) | (7.17) | (1.60) | (1.55) | (.38) | (.03) |
| Total distributions | (.04) | (7.82) | (2.08) | (2.34) | (.93) | (1.19) |
| Redemption fees added to paid in capitalB | –D | –D | –D | –D | –D | .01 |
| Net asset value, end of period | $71.77 | $80.77 | $86.81 | $73.68 | $69.41 | $70.11 |
| Total ReturnE,F | (11.10)% | 2.46% | 20.80% | 9.71% | .49% | 35.70% |
| Ratios to Average Net AssetsG,H | ||||||
| Expenses before reductions | .81%I | .80% | .82% | .85% | .85% | .88% |
| Expenses net of fee waivers, if any | .80%I | .80% | .82% | .85% | .85% | .88% |
| Expenses net of all reductions | .80%I | .80% | .82% | .84% | .84% | .87% |
| Net investment income (loss) | 1.24%I | .87% | .73% | 1.30% | .90% | 2.10%C |
| Supplemental Data | ||||||
| Net assets, end of period (000 omitted) | $870,836 | $1,107,689 | $1,231,942 | $1,146,782 | $1,089,619 | $1,195,371 |
| Portfolio turnover rateJ | 70%I | 76%K | 53% | 61% | 94% | 87% |
A For the year ended February 29.
B Calculated based on average shares outstanding during the period.
C Investment income per share reflects a large, non-recurring dividend which amounted to $.83 per share. Excluding this non-recurring dividend, the ratio of net investment income (loss) to average net assets would have been .70%.
D Amount represents less than $.005 per share.
E Total returns for periods of less than one year are not annualized.
F Total returns would have been lower if certain expenses had not been reduced during the applicable periods shown.
G Fees and expenses of any underlying Fidelity Central Funds are not included in the Fund's expense ratio. The Fund indirectly bears its proportionate share of the expenses of any underlying Fidelity Central Funds.
H Expense ratios reflect operating expenses of the class. Expenses before reductions do not reflect amounts reimbursed by the investment adviser or reductions from brokerage service arrangements or reductions from other expense offset arrangements and do not represent the amount paid by the class during periods when reimbursements or reductions occur. Expenses net of fee waivers reflect expenses after reimbursement by the investment adviser but prior to reductions from brokerage service arrangements or other expense offset arrangements. Expenses net of all reductions represent the net expenses paid by the class.
I Annualized
J Amount does not include the portfolio activity of any underlying Fidelity Central Funds.
K Portfolio turnover rate excludes securities received or delivered in-kind.
See accompanying notes which are an integral part of the financial statements.
Financial Highlights — Materials Portfolio Class I
| Six months ended (Unaudited) | Years ended February 28, | |||||
| August 31, | 2015 | 2015 | 2014 | 2013 | 2012 A | 2011 |
| Selected Per–Share Data | ||||||
| Net asset value, beginning of period | $80.60 | $86.66 | $73.57 | $69.35 | $70.05 | $52.58 |
| Income from Investment Operations | ||||||
| Net investment income (loss)B | .49 | .74 | .59 | .90 | .60 | 1.28C |
| Net realized and unrealized gain (loss) | (9.42) | 1.05 | 14.60 | 5.70 | (.36) | 17.40 |
| Total from investment operations | (8.93) | 1.79 | 15.19 | 6.60 | .24 | 18.68 |
| Distributions from net investment income | – | (.68) | (.50) | (.83) | (.56) | (1.19) |
| Distributions from net realized gain | (.04) | (7.17) | (1.60) | (1.55) | (.38) | (.03) |
| Total distributions | (.04) | (7.85) | (2.10) | (2.38) | (.94) | (1.22) |
| Redemption fees added to paid in capitalB | –D | –D | –D | –D | –D | .01 |
| Net asset value, end of period | $71.63 | $80.60 | $86.66 | $73.57 | $69.35 | $70.05 |
| Total ReturnE,F | (11.09)% | 2.49% | 20.81% | 9.71% | .50% | 35.73% |
| Ratios to Average Net AssetsG,H | ||||||
| Expenses before reductions | .78%I | .78% | .81% | .85% | .84% | .86% |
| Expenses net of fee waivers, if any | .78%I | .78% | .81% | .85% | .84% | .86% |
| Expenses net of all reductions | .78%I | .78% | .81% | .84% | .83% | .85% |
| Net investment income (loss) | 1.26%I | .89% | .74% | 1.30% | .91% | 2.11%C |
| Supplemental Data | ||||||
| Net assets, end of period (000 omitted) | $409,214 | $468,371 | $333,963 | $246,696 | $89,299 | $85,130 |
| Portfolio turnover rateJ | 70%I | 76%K | 53% | 61% | 94% | 87% |
A For the year ended February 29.
B Calculated based on average shares outstanding during the period.
C Investment income per share reflects a large, non-recurring dividend which amounted to $.83 per share. Excluding this non-recurring dividend, the ratio of net investment income (loss) to average net assets would have been .72%.
D Amount represents less than $.005 per share.
E Total returns for periods of less than one year are not annualized.
F Total returns would have been lower if certain expenses had not been reduced during the applicable periods shown.
G Fees and expenses of any underlying Fidelity Central Funds are not included in the Fund's expense ratio. The Fund indirectly bears its proportionate share of the expenses of any underlying Fidelity Central Funds.
H Expense ratios reflect operating expenses of the class. Expenses before reductions do not reflect amounts reimbursed by the investment adviser or reductions from brokerage service arrangements or reductions from other expense offset arrangements and do not represent the amount paid by the class during periods when reimbursements or reductions occur. Expenses net of fee waivers reflect expenses after reimbursement by the investment adviser but prior to reductions from brokerage service arrangements or other expense offset arrangements. Expenses net of all reductions represent the net expenses paid by the class.
I Annualized
J Amount does not include the portfolio activity of any underlying Fidelity Central Funds.
K Portfolio turnover rate excludes securities received or delivered in-kind.
See accompanying notes which are an integral part of the financial statements.
Notes to Financial Statements (Unaudited)
For the period ended August 31, 2015
1. Organization.
Materials Portfolio (the Fund) is a non-diversified fund of Fidelity Select Portfolios (the Trust) and is authorized to issue an unlimited number of shares. The Trust is registered under the Investment Company Act of 1940, as amended (the 1940 Act), as an open-end management investment company organized as a Massachusetts business trust. The Fund invests primarily in securities of companies whose principal business activities fall within specific industries. The Fund offers Class A, Class T, Class C, Materials and Class I (formerly Institutional Class) shares, each of which, along with Class B shares, has equal rights as to assets and voting privileges. Class B shares are closed to new accounts and additional purchases, except for exchanges and reinvestments. Each class has exclusive voting rights with respect to matters that affect that class. Class B shares will automatically convert to Class A shares after a holding period of seven years from the initial date of purchase.
2. Investments in Fidelity Central Funds.
The Fund invests in Fidelity Central Funds, which are open-end investment companies generally available only to other investment companies and accounts managed by the investment adviser and its affiliates. The Fund's Schedule of Investments lists each of the Fidelity Central Funds held as of period end, if any, as an investment of the Fund, but does not include the underlying holdings of each Fidelity Central Fund. As an Investing Fund, the Fund indirectly bears its proportionate share of the expenses of the underlying Fidelity Central Funds.
The Money Market Central Funds seek preservation of capital and current income and are managed by Fidelity Investments Money Management, Inc. (FIMM), an affiliate of the investment adviser. Annualized expenses of the Money Market Central Funds as of their most recent shareholder report date are less than .01%.
A complete unaudited list of holdings for each Fidelity Central Fund is available upon request or at the Securities and Exchange Commission (the SEC) website at www.sec.gov. In addition, the financial statements of the Fidelity Central Funds are available on the SEC website or upon request.
3. Significant Accounting Policies.
The financial statements have been prepared in conformity with accounting principles generally accepted in the United States of America (GAAP), which require management to make certain estimates and assumptions at the date of the financial statements. Actual results could differ from those estimates. Subsequent events, if any, through the date that the financial statements were issued have been evaluated in the preparation of the financial statements. The following summarizes the significant accounting policies of the Fund:
Investment Valuation. Investments are valued as of 4:00 p.m. Eastern time on the last calendar day of the period. The Board of Trustees (the Board) has delegated the day to day responsibility for the valuation of the Fund's investments to the Fidelity SelectCo, LLC (SelectCo) Fair Value Committee (the Committee). In accordance with valuation policies and procedures approved by the Board, the Fund attempts to obtain prices from one or more third party pricing vendors or brokers to value its investments. When current market prices, quotations or currency exchange rates are not readily available or reliable, investments will be fair valued in good faith by the Committee, in accordance with procedures adopted by the Board. Factors used in determining fair value vary by investment type and may include market or investment specific events. The frequency with which these procedures are used cannot be predicted and they may be utilized to a significant extent. The Committee oversees the Fund's valuation policies and procedures and reports to the Board on the Committee's activities and fair value determinations. The Board monitors the appropriateness of the procedures used in valuing the Fund's investments and ratifies the fair value determinations of the Committee.
The Fund categorizes the inputs to valuation techniques used to value its investments into a disclosure hierarchy consisting of three levels as shown below:
- Level 1 – quoted prices in active markets for identical investments
- Level 2 – other significant observable inputs (including quoted prices for similar investments, interest rates, prepayment speeds, etc.)
- Level 3 – unobservable inputs (including the Fund's own assumptions based on the best information available)
Valuation techniques used to value the Fund's investments by major category are as follows:
Equity securities, including restricted securities, for which market quotations are readily available, are valued at the last reported sale price or official closing price as reported by a third party pricing vendor on the primary market or exchange on which they are traded and are categorized as Level 1 in the hierarchy. In the event there were no sales during the day or closing prices are not available, securities are valued at the last quoted bid price or may be valued using the last available price and are generally categorized as Level 2 in the hierarchy. For foreign equity securities, when market or security specific events arise, comparisons to the valuation of American Depositary Receipts (ADRs), futures contracts, Exchange-Traded Funds (ETFs) and certain indexes as well as quoted prices for similar securities may be used and would be categorized as Level 2 in the hierarchy. Utilizing these techniques may result in transfers between Level 1 and Level 2. For equity securities, including restricted securities, where observable inputs are limited, assumptions about market activity and risk are used and these securities may be categorized as Level 3 in the hierarchy.
Investments in open-end mutual funds, including the Fidelity Central Funds, are valued at their closing net asset value (NAV) each business day and are categorized as Level 1 in the hierarchy.
Changes in valuation techniques may result in transfers in or out of an assigned level within the disclosure hierarchy.
Foreign Currency. The Fund may use foreign currency contracts to facilitate transactions in foreign-denominated securities. Gains and losses from these transactions may arise from changes in the value of the foreign currency or if the counterparties do not perform under the contracts' terms.
Foreign-denominated assets, including investment securities, and liabilities are translated into U.S. dollars at the exchange rates at period end. Purchases and sales of investment securities, income and dividends received and expenses denominated in foreign currencies are translated into U.S. dollars at the exchange rate in effect on the transaction date.
The effects of exchange rate fluctuations on investments are included with the net realized and unrealized gain (loss) on investment securities. Other foreign currency transactions resulting in realized and unrealized gain (loss) are disclosed separately.
Investment Transactions and Income. For financial reporting purposes, the Fund's investment holdings and NAV include trades executed through the end of the last business day of the period. The NAV per share for processing shareholder transactions is calculated as of the close of business of the New York Stock Exchange (NYSE), normally 4:00 p.m. Eastern time and includes trades executed through the end of the prior business day. Gains and losses on securities sold are determined on the basis of identified cost and may include proceeds received from litigation. Dividend income is recorded on the ex-dividend date, except for certain dividends from foreign securities where the ex-dividend date may have passed, which are recorded as soon as the Fund is informed of the ex-dividend date. Non-cash dividends included in dividend income, if any, are recorded at the fair market value of the securities received. Income and capital gain distributions from Fidelity Central Funds, if any, are recorded on the ex-dividend date. Distributions received on securities that represent a return of capital or capital gain are recorded as a reduction of cost of investments and/or as a realized gain. Subsequent to ex-dividend date the Fund determines the components of these distributions, based upon receipt of tax filings or other correspondence relating to the underlying investment. Interest income is accrued as earned and includes coupon interest and amortization of premium and accretion of discount on debt securities as applicable. Investment income is recorded net of foreign taxes withheld where recovery of such taxes is uncertain.
Class Allocations and Expenses. Investment income, realized and unrealized capital gains and losses, common expenses of the Fund, and certain fund-level expense reductions, if any, are allocated daily on a pro-rata basis to each class based on the relative net assets of each class to the total net assets of the Fund. Each class differs with respect to transfer agent and distribution and service plan fees incurred. Certain expense reductions may also differ by class. For the reporting period, the allocated portion of income and expenses to each class as a percent of its average net assets may vary due to the timing of recording these transactions in relation to fluctuating net assets of the classes. Expenses directly attributable to a fund are charged to that fund. Expenses attributable to more than one fund are allocated among the respective funds on the basis of relative net assets or other appropriate methods. Expense estimates are accrued in the period to which they relate and adjustments are made when actual amounts are known.
Deferred Trustee Compensation. Under a Deferred Compensation Plan (the Plan), independent Trustees may elect to defer receipt of a portion of their annual compensation. Deferred amounts are invested in a cross-section of Fidelity funds, are marked-to-market and remain in the Fund until distributed in accordance with the Plan. The investment of deferred amounts and the offsetting payable to the Trustees are included in the accompanying Statement of Assets and Liabilities.
Income Tax Information and Distributions to Shareholders. Each year, the Fund intends to qualify as a regulated investment company under Subchapter M of the Internal Revenue Code, including distributing substantially all of its taxable income and realized gains. As a result, no provision for U.S. Federal income taxes is required. The Fund files a U.S. federal tax return, in addition to state and local tax returns as required. The Fund's federal income tax returns are subject to examination by the Internal Revenue Service (IRS) for a period of three fiscal years after they are filed. State and local tax returns may be subject to examination for an additional fiscal year depending on the jurisdiction. Foreign taxes are provided for based on the Fund's understanding of the tax rules and rates that exist in the foreign markets in which it invests.
Distributions are declared and recorded on the ex-dividend date. Income dividends and capital gain distributions are declared separately for each class. Income and capital gain distributions are determined in accordance with income tax regulations, which may differ from GAAP.
Capital accounts within the financial statements are adjusted for permanent book-tax differences. These adjustments have no impact on net assets or the results of operations. Capital accounts are not adjusted for temporary book-tax differences which will reverse in a subsequent period.
Book-tax differences are primarily due to foreign currency transactions, in-kind transactions, passive foreign investment companies (PFIC), original issue discount, deferred trustees compensation, capital loss carryforwards and losses deferred due to wash sales and excise tax regulations.
The federal tax cost of investment securities and unrealized appreciation (depreciation) as of period end were as follows:
| Gross unrealized appreciation | $275,231,923 |
| Gross unrealized depreciation | (110,844,501) |
| Net unrealized appreciation (depreciation) on securities | $164,387,422 |
| Tax cost | $1,500,743,124 |
The Fund elected to defer to its next fiscal year approximately $5,660,716 of capital losses recognized during the period November 1, 2014 to February 28, 2015.
Capital loss carryforwards are only available to offset future gains of the Fund to the extent provided by regulations and may be limited. Under the Regulated Investment Company Modernization Act or 2010 (the Act), the Fund is permitted to carry forward capital losses incurred in taxable years beginning after December 22, 2010 for an unlimited period and such capital losses are required to be used prior to any losses that expire. The capital loss carryforward information presented below, including any applicable limitation, is estimated as of prior fiscal period end and is subject to adjustment.
| Fiscal year of expiration: | |
| 2017 | $(810,939) |
| 2018 | (1,022,988) |
| 2019 | (80,787) |
| Total with expiration | $(1,914,714) |
The Fund acquired $1,914,714 of its capital loss carryforward as part of a merger in a prior period. The losses acquired that will be available to offset future capital gains of the Fund will be limited to approximately $611,309 per year.
Trading (Redemption) Fees. Shares held by investors in the Fund less than 30 days may be subject to a redemption fee equal to .75% of the NAV of shares redeemed. All redemption fees, which reduce the proceeds of the shareholder redemption, are retained by the Fund and accounted for as an addition to paid in capital.
4. Purchases and Sales of Investments.
Purchases and sales of securities, other than short-term securities, aggregated $655,679,558 and $827,401,816, respectively.
5. Fees and Other Transactions with Affiliates.
Management Fee. Fidelity SelectCo, LLC (the investment adviser) and its affiliates provide the Fund with investment management related services for which the Fund pays a monthly management fee. The management fee is the sum of an individual fund fee rate that is based on an annual rate of .30% of the Fund's average net assets and an annualized group fee rate that averaged .25% during the period. The group fee rate is based upon the average net assets of all the mutual funds advised by Fidelity Management & Research Company (FMR) and the investment adviser. The group fee rate decreases as assets under management increase and increases as assets under management decrease. For the reporting period, the total annualized management fee rate was .55% of the Fund's average net assets.
Distribution and Service Plan Fees. In accordance with Rule 12b-1 of the 1940 Act, the Fund has adopted separate Distribution and Service Plans for each class of shares. Certain classes pay Fidelity Distributors Corporation (FDC), an affiliate of the investment adviser, separate Distribution and Service Fees, each of which is based on an annual percentage of each class' average net assets. In addition, FDC may pay financial intermediaries for selling shares of the Fund and providing shareholder support services. For the period, the Distribution and Service Fee rates, total fees and amounts retained by FDC were as follows:
| Distribution Fee | Service Fee | Total Fees | Retained by FDC |
|
| Class A | -% | .25% | $375,494 | $– |
| Class T | .25% | .25% | 103,416 | – |
| Class B | .75% | .25% | 27,071 | 20,303 |
| Class C | .75% | .25% | 504,353 | 82,905 |
| $1,010,334 | $103,208 |
Sales Load. FDC may receive a front-end sales charge of up to 5.75% for selling Class A shares and 3.50% for selling Class T shares, some of which is paid to financial intermediaries for selling shares of the Fund. Depending on the holding period, FDC may receive contingent deferred sales charges levied on Class A, Class T, Class B, and Class C redemptions. The deferred sales charges range from 5.00% to 1.00% for Class B shares, 1.00% for Class C shares, 1.00% for certain purchases of Class A shares and .25% for certain purchases of Class T shares.
For the period, sales charge amounts retained by FDC were as follows:
| Retained by FDC |
|
| Class A | $36,807 |
| Class T | 2,919 |
| Class B* | 1,723 |
| Class C* | 7,735 |
| $49,184 |
*When Class B and Class C shares are initially sold, FDC pays commissions from its own resources to financial intermediaries through which the sales are made.
Transfer Agent Fees. Fidelity Investments Institutional Operations Company, Inc., (FIIOC), an affiliate of the investment adviser, is the transfer, dividend disbursing and shareholder servicing agent for each class of the Fund. FIIOC receives account fees and asset-based fees that vary according to the account size and type of account of the shareholders of the respective classes of the Fund. FIIOC pays for typesetting, printing and mailing of shareholder reports, except proxy statements.
For the period, transfer agent fees for each class were as follows:
| Amount | % of Class-Level Average Net Assets* |
|
| Class A | $322,696 | .21 |
| Class T | 56,715 | .27 |
| Class B | 7,671 | .28 |
| Class C | 110,277 | .22 |
| Materials | 1,067,247 | .21 |
| Class I | 422,643 | .19 |
| $1,987,249 |
*Annualized
Accounting and Security Lending Fees. Fidelity Service Company, Inc. (FSC), an affiliate of the investment adviser, maintains the Fund's accounting records. The accounting fee is based on the level of average net assets for each month. Under a separate contract, FSC administers the security lending program. The security lending fee is based on the number and duration of lending transactions.
Brokerage Commissions. The Fund placed a portion of its portfolio transactions with brokerage firms which are affiliates of the investment adviser. Brokerage commissions are included in net realized gain (loss) and change in net unrealized appreciation (depreciation) in the Statement of Operations. The commissions paid to these affiliated firms were $10,550 for the period.
6. Committed Line of Credit.
The Fund participates with other funds managed by the investment adviser or an affiliate in a $4.25 billion credit facility (the "line of credit") to be utilized for temporary or emergency purposes to fund shareholder redemptions or for other short-term liquidity purposes. The Fund has agreed to pay commitment fees on its pro-rata portion of the line of credit, which amounted to $1,527 and is reflected in Miscellaneous expenses on the Statement of Operations. During the period, the Fund did not borrow on this line of credit.
7. Security Lending.
The Fund lends portfolio securities through a lending agent from time to time in order to earn additional income. On the settlement date of the loan, the Fund receives collateral (in the form of U.S. Treasury obligations, letters of credit and/or cash) against the loaned securities and maintains collateral in an amount not less than 100% of the market value of the loaned securities during the period of the loan. The market value of the loaned securities is determined at the close of business of the Fund and any additional required collateral is delivered to the Fund on the next business day. If the borrower defaults on its obligation to return the securities loaned because of insolvency or other reasons, the Fund may apply collateral received from the borrower against the obligation. The Fund may experience delays and costs in recovering the securities loaned. Any cash collateral received is invested in the Fidelity Securities Lending Cash Central Fund. The value of loaned securities and cash collateral at period end are disclosed on the Fund's Statement of Assets and Liabilities. Security lending income represents the income earned on investing cash collateral, less rebates paid to borrowers and any lending agent fees associated with the loan, plus any premium payments received for lending certain types of securities. Security lending income is presented in the Statement of Operations as a component of income from Fidelity Central Funds. Total security lending income during the period amounted to $47,166.
8. Expense Reductions.
Commissions paid to certain brokers with whom the investment adviser, or its affiliates, places trades on behalf of the Fund include an amount in addition to trade execution, which may be rebated back to the Fund to offset certain expenses. This amount totaled $36,952 for the period.
In addition, during the period the investment adviser reimbursed and/or waived a portion of fund-level operating expenses in the amount of $7,779 and a portion of class-level operating expenses as follows:
| Amount | |
| Class A | $6,876 |
| Class T | 846 |
| Class B | 22 |
| Class C | 2,309 |
| Materials | 27,233 |
| Class I | 8,125 |
| $ 45,411 |
9. Distributions to Shareholders.
Distributions to shareholders of each class were as follows:
| Six months ended August 31, 2015 | Year ended February 28, 2015 | |
| From net investment income | ||
| Class A | $– | $1,638,100 |
| Class T | – | 99,020 |
| Materials | – | 8,803,568 |
| Class I | – | 3,592,103 |
| Total | $– | $14,132,791 |
| From net realized gain | ||
| Class A | $142,163 | $27,780,861 |
| Class T | 19,809 | 3,863,168 |
| Class B | 2,750 | 628,830 |
| Class C | 49,466 | 9,676,799 |
| Materials | 481,379 | 98,020,822 |
| Class I | 210,831 | 36,075,039 |
| Total | $906,398 | $176,045,519 |
10. Share Transactions.
Share transactions for each class were as follows and may contain automatic conversions between classes or exchanges between funds:
| Shares | Shares | Dollars | Dollars | |
| Six months ended August 31, 2015 | Year ended February 28, 2015 | Six months ended August 31, 2015 | Year ended February 28, 2015 | |
| Class A | ||||
| Shares sold | 440,698 | 1,287,549 | $34,144,694 | $107,992,682 |
| Reinvestment of distributions | 1,705 | 350,058 | 134,157 | 27,494,344 |
| Shares redeemed | (690,349) | (1,557,532) | (53,337,676) | (130,043,911) |
| Net increase (decrease) | (247,946) | 80,075 | $(19,058,825) | $5,443,115 |
| Class T | ||||
| Shares sold | 37,053 | 122,029 | $2,833,717 | $10,167,521 |
| Reinvestment of distributions | 244 | 48,608 | 19,104 | 3,794,851 |
| Shares redeemed | (89,364) | (130,511) | (6,884,642) | (10,688,592) |
| Net increase (decrease) | (52,067) | 40,126 | $(4,031,821) | $3,273,780 |
| Class B | ||||
| Shares sold | 1,414 | 2,935 | $108,496 | $242,184 |
| Reinvestment of distributions | 34 | 7,683 | 2,627 | 590,123 |
| Shares redeemed | (21,639) | (30,247) | (1,632,076) | (2,465,575) |
| Net increase (decrease) | (20,191) | (19,629) | $(1,520,953) | $(1,633,268) |
| Class C | ||||
| Shares sold | 85,043 | 367,698 | $6,423,692 | $30,096,831 |
| Reinvestment of distributions | 579 | 110,883 | 44,233 | 8,472,087 |
| Shares redeemed | (194,719) | (366,676) | (14,553,390) | (29,116,038) |
| Net increase (decrease) | (109,097) | 111,905 | $(8,085,465) | $9,452,880 |
| Materials | ||||
| Shares sold | 625,816 | 2,411,814 | $48,746,846 | $202,615,605 |
| Reinvestment of distributions | 5,717 | 1,274,428 | 451,965 | 100,536,677 |
| Shares redeemed | (2,211,617) | (4,164,314) | (171,119,417) | (345,204,286) |
| Net increase (decrease) | (1,580,084) | (478,072) | $(121,920,606) | $(42,052,004) |
| Class I | ||||
| Shares sold | 840,288 | 4,739,071A | $65,266,509 | $400,864,210A |
| Reinvestment of distributions | 2,499 | 464,747 | 197,171 | 36,366,289 |
| Shares redeemed | (940,497) | (3,246,644)B | (72,564,792) | (271,874,142)B |
| Net increase (decrease) | (97,710) | 1,957,174 | $(7,101,112) | $165,356,357 |
A Amount includes in-kind exchanges.
B Amount includes in-kind redemptions.
11. Other.
The Fund's organizational documents provide former and current trustees and officers with a limited indemnification against liabilities arising in connection with the performance of their duties to the Fund. In the normal course of business, the Fund may also enter into contracts that provide general indemnifications. The Fund's maximum exposure under these arrangements is unknown as this would be dependent on future claims that may be made against the Fund. The risk of material loss from such claims is considered remote.
Telecommunications Portfolio
Investment Summary (Unaudited)
Top Ten Stocks as of August 31, 2015
| % of fund's net assets | % of fund's net assets 6 months ago | |
| AT&T, Inc. | 24.0 | 13.9 |
| Verizon Communications, Inc. | 16.6 | 19.9 |
| T-Mobile U.S., Inc. | 4.5 | 4.3 |
| Level 3 Communications, Inc. | 4.5 | 6.4 |
| SBA Communications Corp. Class A | 4.2 | 4.3 |
| American Tower Corp. | 4.2 | 2.3 |
| Cogent Communications Group, Inc. | 3.9 | 4.3 |
| CenturyLink, Inc. | 3.2 | 3.3 |
| Telephone & Data Systems, Inc. | 3.0 | 3.2 |
| Frontier Communications Corp. | 2.8 | 3.0 |
| 70.9 |
Top Industries (% of fund's net assets)
| As of August 31, 2015 | ||
| Diversified Telecommunication Services | 70.2% | |
| Wireless Telecommunication Services | 19.1% | |
| Real Estate Investment Trusts | 5.2% | |
| Media | 2.1% | |
| Internet Software & Services | 1.0% | |
| All Others* | 2.4% | |

| As of February 28, 2015 | ||
| Diversified Telecommunication Services | 62.8% | |
| Wireless Telecommunication Services | 19.8% | |
| Media | 9.8% | |
| Real Estate Investment Trusts | 2.7% | |
| Internet Software & Services | 1.0% | |
| All Others* | 3.9% | |

* Includes short-term investments and net other assets (liabilities).
Telecommunications Portfolio
Investments August 31, 2015 (Unaudited)
Showing Percentage of Net Assets
| Common Stocks - 98.1% | |||
| Shares | Value | ||
| Communications Equipment - 0.7% | |||
| Communications Equipment - 0.7% | |||
| Ruckus Wireless, Inc. (a) | 295,500 | $3,345,060 | |
| Diversified Telecommunication Services - 69.7% | |||
| Alternative Carriers - 18.1% | |||
| 8x8, Inc. (a) | 837,086 | 6,470,675 | |
| Cogent Communications Group, Inc. | 619,868 | 17,213,734 | |
| Globalstar, Inc. (a)(b) | 2,591,600 | 4,561,216 | |
| Iliad SA | 9,309 | 2,102,799 | |
| inContact, Inc. (a)(b) | 958,313 | 7,235,263 | |
| Iridium Communications, Inc. (a)(b) | 504,976 | 3,762,071 | |
| Level 3 Communications, Inc. (a) | 443,767 | 19,849,698 | |
| Lumos Networks Corp. | 579,378 | 6,801,898 | |
| Premiere Global Services, Inc. (a) | 525,883 | 5,669,019 | |
| Towerstream Corp. (a)(b) | 807,024 | 1,202,466 | |
| Vonage Holdings Corp. (a) | 766,171 | 4,252,249 | |
| Zayo Group Holdings, Inc. | 34,800 | 973,356 | |
| 80,094,444 | |||
| Integrated Telecommunication Services - 51.6% | |||
| AT&T, Inc. | 3,201,420 | 106,287,144 | |
| Atlantic Tele-Network, Inc. | 110,000 | 7,859,500 | |
| Bezeq The Israel Telecommunication Corp. Ltd. | 1,252,300 | 2,250,046 | |
| CenturyLink, Inc. | 526,778 | 14,244,077 | |
| Cincinnati Bell, Inc. (a) | 884,314 | 3,033,197 | |
| Consolidated Communications Holdings, Inc. | 211,398 | 4,124,375 | |
| Frontier Communications Corp. (b) | 2,466,183 | 12,503,548 | |
| General Communications, Inc. Class A (a) | 63,694 | 1,073,244 | |
| IDT Corp. Class B | 202,881 | 3,169,001 | |
| Telecom Italia SpA (a) | 4,000 | 4,855 | |
| Verizon Communications, Inc. | 1,599,497 | 73,592,857 | |
| Windstream Holdings, Inc. (b) | 42,580 | 306,150 | |
| 228,447,994 | |||
| TOTAL DIVERSIFIED TELECOMMUNICATION SERVICES | 308,542,438 | ||
| Internet Software & Services - 1.0% | |||
| Internet Software & Services - 1.0% | |||
| Gogo, Inc. (a)(b) | 202,000 | 3,209,780 | |
| Rackspace Hosting, Inc. (a) | 38,700 | 1,176,867 | |
| 4,386,647 | |||
| Media - 2.1% | |||
| Cable & Satellite - 2.1% | |||
| Charter Communications, Inc. Class A (a)(b) | 12,800 | 2,324,608 | |
| Liberty Global PLC Class C (a) | 40,336 | 1,809,876 | |
| Liberty LiLac Group Class C (a) | 1,916 | 63,707 | |
| Time Warner Cable, Inc. | 28,300 | 5,264,366 | |
| 9,462,557 | |||
| Real Estate Investment Trusts - 5.2% | |||
| Specialized REITs - 5.2% | |||
| American Tower Corp. | 200,190 | 18,455,516 | |
| Communications Sales & Leasing, Inc. | 137,000 | 2,753,700 | |
| Crown Castle International Corp. | 14,000 | 1,167,460 | |
| CyrusOne, Inc. | 21,100 | 668,026 | |
| 23,044,702 | |||
| Software - 0.5% | |||
| Application Software - 0.3% | |||
| Interactive Intelligence Group, Inc. (a) | 37,100 | 1,298,871 | |
| Systems Software - 0.2% | |||
| Rovi Corp. (a) | 90,700 | 1,004,049 | |
| TOTAL SOFTWARE | 2,302,920 | ||
| Wireless Telecommunication Services - 18.9% | |||
| Wireless Telecommunication Services - 18.9% | |||
| Bharti Infratel Ltd. | 481,103 | 2,898,945 | |
| KDDI Corp. | 179,400 | 4,451,610 | |
| Leap Wireless International, Inc. rights (a) | 400 | 1,008 | |
| RingCentral, Inc. (a) | 257,690 | 4,434,845 | |
| SBA Communications Corp. Class A (a) | 158,156 | 18,694,039 | |
| Shenandoah Telecommunications Co. | 51,626 | 1,997,410 | |
| SoftBank Corp. | 76,900 | 4,474,300 | |
| Sprint Corp. (a)(b) | 2,118,585 | 10,720,040 | |
| T-Mobile U.S., Inc. (a) | 502,497 | 19,903,906 | |
| Telephone & Data Systems, Inc. | 470,664 | 13,385,684 | |
| U.S. Cellular Corp. (a) | 70,900 | 2,617,628 | |
| 83,579,415 | |||
| TOTAL COMMON STOCKS | |||
| (Cost $406,491,722) | 434,663,739 | ||
| Nonconvertible Preferred Stocks - 0.7% | |||
| Diversified Telecommunication Services - 0.5% | |||
| Integrated Telecommunication Services - 0.5% | |||
| Telefonica Brasil SA sponsored ADR | 187,700 | 2,089,101 | |
| Wireless Telecommunication Services - 0.2% | |||
| Wireless Telecommunication Services - 0.2% | |||
| TIM Participacoes SA sponsored ADR (b) | 68,300 | 825,747 | |
| TOTAL NONCONVERTIBLE PREFERRED STOCKS | |||
| (Cost $4,873,932) | 2,914,848 | ||
| Money Market Funds - 9.0% | |||
| Fidelity Cash Central Fund, 0.15% (c) | 3,716,824 | 3,716,824 | |
| Fidelity Securities Lending Cash Central Fund, 0.19% (c)(d) | 36,212,186 | 36,212,186 | |
| TOTAL MONEY MARKET FUNDS | |||
| (Cost $39,929,010) | 39,929,010 | ||
| TOTAL INVESTMENT PORTFOLIO - 107.8% | |||
| (Cost $451,294,664) | 477,507,597 | ||
| NET OTHER ASSETS (LIABILITIES) - (7.8)% | (34,609,017) | ||
| NET ASSETS - 100% | $442,898,580 |
Legend
(a) Non-income producing
(b) Security or a portion of the security is on loan at period end.
(c) Affiliated fund that is generally available only to investment companies and other accounts managed by Fidelity Investments. The rate quoted is the annualized seven-day yield of the fund at period end. A complete unaudited listing of the fund's holdings as of its most recent quarter end is available upon request. In addition, each Fidelity Central Fund's financial statements are available on the SEC's website or upon request.
(d) Investment made with cash collateral received from securities on loan.
Affiliated Central Funds
Information regarding fiscal year to date income earned by the Fund from investments in Fidelity Central Funds is as follows:
| Fund | Income earned |
| Fidelity Cash Central Fund | $4,800 |
| Fidelity Securities Lending Cash Central Fund | 261,852 |
| Total | $266,652 |
Investment Valuation
The following is a summary of the inputs used, as of August 31, 2015, involving the Fund's assets and liabilities carried at fair value. The inputs or methodology used for valuing securities may not be an indication of the risk associated with investing in those securities. For more information on valuation inputs, and their aggregation into the levels used below, please refer to the Investment Valuation section in the accompanying Notes to Financial Statements.
| Valuation Inputs at Reporting Date: | ||||
| Description | Total | Level 1 | Level 2 | Level 3 |
| Investments in Securities: | ||||
| Common Stocks | $434,663,739 | $425,731,966 | $8,930,765 | $1,008 |
| Nonconvertible Preferred Stocks | 2,914,848 | 2,914,848 | -- | -- |
| Money Market Funds | 39,929,010 | 39,929,010 | -- | -- |
| Total Investments in Securities: | $477,507,597 | $468,575,824 | $8,930,765 | $1,008 |
See accompanying notes which are an integral part of the financial statements.
Telecommunications Portfolio
Financial Statements
Statement of Assets and Liabilities
| August 31, 2015 (Unaudited) | ||
| Assets | ||
| Investment in securities, at value (including securities loaned of $34,895,988) — See accompanying schedule: Unaffiliated issuers (cost $411,365,654) | $437,578,587 | |
| Fidelity Central Funds (cost $39,929,010) | 39,929,010 | |
| Total Investments (cost $451,294,664) | $477,507,597 | |
| Receivable for investments sold | 1,766,887 | |
| Receivable for fund shares sold | 180,063 | |
| Dividends receivable | 290,683 | |
| Distributions receivable from Fidelity Central Funds | 17,228 | |
| Prepaid expenses | 3,301 | |
| Other receivables | 17,532 | |
| Total assets | 479,783,291 | |
| Liabilities | ||
| Payable for fund shares redeemed | $336,971 | |
| Accrued management fee | 209,789 | |
| Distribution and service plan fees payable | 11,414 | |
| Other affiliated payables | 87,438 | |
| Other payables and accrued expenses | 26,913 | |
| Collateral on securities loaned, at value | 36,212,186 | |
| Total liabilities | 36,884,711 | |
| Net Assets | $442,898,580 | |
| Net Assets consist of: | ||
| Paid in capital | $414,143,036 | |
| Undistributed net investment income | 3,347,303 | |
| Accumulated undistributed net realized gain (loss) on investments and foreign currency transactions | (801,296) | |
| Net unrealized appreciation (depreciation) on investments and assets and liabilities in foreign currencies | 26,209,537 | |
| Net Assets | $442,898,580 | |
| Calculation of Maximum Offering Price | ||
| Class A: | ||
| Net Asset Value and redemption price per share ($11,277,613 ÷ 190,074.6 shares) | $59.33 | |
| Maximum offering price per share (100/94.25 of $59.33) | $62.95 | |
| Class T: | ||
| Net Asset Value and redemption price per share ($4,673,388 ÷ 79,139.6 shares) | $59.05 | |
| Maximum offering price per share (100/96.50 of $59.05) | $61.19 | |
| Class B: | ||
| Net Asset Value and offering price per share ($293,027 ÷ 4,941.8 shares)(a) | $59.30 | |
| Class C: | ||
| Net Asset Value and offering price per share ($7,854,045 ÷ 133,279.2 shares)(a) | $58.93 | |
| Telecommunications: | ||
| Net Asset Value, offering price and redemption price per share ($416,170,637 ÷ 6,974,835.5 shares) | $59.67 | |
| Class I: | ||
| Net Asset Value, offering price and redemption price per share ($2,629,870 ÷ 44,193.5 shares) | $59.51 |
(a) Redemption price per share is equal to net asset value less any applicable contingent deferred sales charge.
See accompanying notes which are an integral part of the financial statements.
Statement of Operations
| Six months ended August 31, 2015 (Unaudited) | ||
| Investment Income | ||
| Dividends | $4,875,493 | |
| Income from Fidelity Central Funds (including $261,852 from security lending) | 266,652 | |
| Total income | 5,142,145 | |
| Expenses | ||
| Management fee | $1,143,661 | |
| Transfer agent fees | 410,388 | |
| Distribution and service plan fees | 68,462 | |
| Accounting and security lending fees | 84,413 | |
| Custodian fees and expenses | 13,468 | |
| Independent trustees' compensation | 3,397 | |
| Registration fees | 59,639 | |
| Audit | 29,468 | |
| Legal | 2,953 | |
| Interest | 121 | |
| Miscellaneous | 2,591 | |
| Total expenses before reductions | 1,818,561 | |
| Expense reductions | (37,014) | 1,781,547 |
| Net investment income (loss) | 3,360,598 | |
| Realized and Unrealized Gain (Loss)
Net realized gain (loss) on: | ||
| Investment securities: | ||
| Unaffiliated issuers | 5,446,056 | |
| Foreign currency transactions | (11,945) | |
| Total net realized gain (loss) | 5,434,111 | |
| Change in net unrealized appreciation (depreciation) on: Investment securities | (37,681,329) | |
| Assets and liabilities in foreign currencies | (592) | |
| Total change in net unrealized appreciation (depreciation) | (37,681,921) | |
| Net gain (loss) | (32,247,810) | |
| Net increase (decrease) in net assets resulting from operations | $(28,887,212) |
See accompanying notes which are an integral part of the financial statements.
Statement of Changes in Net Assets
| Six months ended August 31, 2015 (Unaudited) | Year ended February 28, 2015 | |
| Increase (Decrease) in Net Assets | ||
| Operations | ||
| Net investment income (loss) | $3,360,598 | $6,193,869 |
| Net realized gain (loss) | 5,434,111 | 7,829,307 |
| Change in net unrealized appreciation (depreciation) | (37,681,921) | 28,387,304 |
| Net increase (decrease) in net assets resulting from operations | (28,887,212) | 42,410,480 |
| Distributions to shareholders from net investment income | (275,781) | (13,679,321) |
| Share transactions - net increase (decrease) | 99,746,494 | (19,703,086) |
| Redemption fees | 5,715 | 3,706 |
| Total increase (decrease) in net assets | 70,589,216 | 9,031,779 |
| Net Assets | ||
| Beginning of period | 372,309,364 | 363,277,585 |
| End of period (including undistributed net investment income of $3,347,303 and undistributed net investment income of $262,486, respectively) | $442,898,580 | $372,309,364 |
See accompanying notes which are an integral part of the financial statements.
Financial Highlights — Telecommunications Portfolio Class A
| Six months ended (Unaudited) | Years ended February 28, | |||||
| August 31, | 2015 | 2015 | 2014 | 2013 | 2012A | 2011 |
| Selected Per–Share Data | ||||||
| Net asset value, beginning of period | $63.26 | $58.71 | $51.58 | $46.12 | $46.93 | $37.64 |
| Income from Investment Operations | ||||||
| Net investment income (loss)B | .41 | .76 | 1.76C | .99 | .56 | .57 |
| Net realized and unrealized gain (loss) | (4.32) | 5.83 | 6.48 | 5.43 | (.86) | 9.49 |
| Total from investment operations | (3.91) | 6.59 | 8.24 | 6.42 | (.30) | 10.06 |
| Distributions from net investment income | (.02) | (2.04) | (1.11) | (.96) | (.51) | (.77) |
| Distributions from net realized gain | – | – | (.01) | – | – | – |
| Total distributions | (.02) | (2.04) | (1.11)D | (.96) | (.51) | (.77) |
| Redemption fees added to paid in capitalB,E | – | – | – | – | – | – |
| Net asset value, end of period | $59.33 | $63.26 | $58.71 | $51.58 | $46.12 | $46.93 |
| Total ReturnF,G,H | (6.18)% | 11.54% | 16.00% | 13.97% | (.54)% | 26.87% |
| Ratios to Average Net AssetsI,J | ||||||
| Expenses before reductions | 1.17%K | 1.15% | 1.18% | 1.18% | 1.20% | 1.20% |
| Expenses net of fee waivers, if any | 1.16%K | 1.15% | 1.18% | 1.18% | 1.20% | 1.20% |
| Expenses net of all reductions | 1.15%K | 1.15% | 1.15% | 1.17% | 1.18% | 1.18% |
| Net investment income (loss) | 1.31%K | 1.26% | 3.08%C | 2.01% | 1.21% | 1.35% |
| Supplemental Data | ||||||
| Net assets, end of period (000 omitted) | $11,278 | $11,052 | $7,712 | $6,449 | $4,677 | $4,305 |
| Portfolio turnover rateL | 75%K | 94%M | 111% | 76% | 72% | 72% |
A For the year ended February 29.
B Calculated based on average shares outstanding during the period.
C Investment income per share reflects large, non-recurring dividends which amounted to $.95 per share. Excluding these non-recurring dividends, the ratio of net investment income (loss) to average net assets would have been 1.43%.
D Total distributions of $1.11 per share is comprised of distributions from net investment income of $1.106 and distributions from net realized gain of $.005 per share.
E Amount represents less than $.005 per share.
F Total returns for periods of less than one year are not annualized.
G Total returns would have been lower if certain expenses had not been reduced during the applicable periods shown.
H Total returns do not include the effect of the sales charges.
I Fees and expenses of any underlying Fidelity Central Funds are not included in the Fund's expense ratio. The Fund indirectly bears its proportionate share of the expenses of any underlying Fidelity Central Funds.
J Expense ratios reflect operating expenses of the class. Expenses before reductions do not reflect amounts reimbursed by the investment adviser or reductions from brokerage service arrangements or reductions from other expense offset arrangements and do not represent the amount paid by the class during periods when reimbursements or reductions occur. Expenses net of fee waivers reflect expenses after reimbursement by the investment adviser but prior to reductions from brokerage service arrangements or other expense offset arrangements. Expenses net of all reductions represent the net expenses paid by the class.
K Annualized
L Amount does not include the portfolio activity of any underlying Fidelity Central Funds.
M Portfolio turnover rate excludes securities received or delivered in-kind.
See accompanying notes which are an integral part of the financial statements.
Financial Highlights — Telecommunications Portfolio Class T
| Six months ended(Unaudited) | Years ended February 28, | |||||
| August 31, | 2015 | 2015 | 2014 | 2013 | 2012A | 2011 |
| Selected Per–Share Data | ||||||
| Net asset value, beginning of period | $63.04 | $58.50 | $51.41 | $46.01 | $46.81 | $37.55 |
| Income from Investment Operations | ||||||
| Net investment income (loss)B | .31 | .57 | 1.59C | .85 | .42 | .45 |
| Net realized and unrealized gain (loss) | (4.30) | 5.81 | 6.44 | 5.39 | (.84) | 9.47 |
| Total from investment operations | (3.99) | 6.38 | 8.03 | 6.24 | (.42) | 9.92 |
| Distributions from net investment income | – | (1.84) | (.94) | (.84) | (.38) | (.66) |
| Distributions from net realized gain | – | – | (.01) | – | – | – |
| Total distributions | – | (1.84) | (.94)D | (.84) | (.38) | (.66) |
| Redemption fees added to paid in capitalB,E | – | – | – | – | – | – |
| Net asset value, end of period | $59.05 | $63.04 | $58.50 | $51.41 | $46.01 | $46.81 |
| Total ReturnF,G,H | (6.33)% | 11.19% | 15.64% | 13.61% | (.82)% | 26.54% |
| Ratios to Average Net AssetsI,J | ||||||
| Expenses before reductions | 1.48%K | 1.47% | 1.48% | 1.48% | 1.49% | 1.48% |
| Expenses net of fee waivers, if any | 1.48%K | 1.47% | 1.48% | 1.48% | 1.49% | 1.48% |
| Expenses net of all reductions | 1.47%K | 1.46% | 1.45% | 1.46% | 1.47% | 1.46% |
| Net investment income (loss) | 1.00%K | .94% | 2.78%C | 1.72% | .92% | 1.06% |
| Supplemental Data | ||||||
| Net assets, end of period (000 omitted) | $4,673 | $5,095 | $4,344 | $4,237 | $2,702 | $2,882 |
| Portfolio turnover rateL | 75%K | 94%M | 111% | 76% | 72% | 72% |
A For the year ended February 29.
B Calculated based on average shares outstanding during the period.
C Investment income per share reflects large, non-recurring dividends which amounted to $.94 per share. Excluding these non-recurring dividends, the ratio of net investment income (loss) to average net assets would have been 1.13%.
D Total distributions of $.94 per share is comprised of distributions from net investment income of $.939 and distributions from net realized gain of $.005 per share.
E Amount represents less than $.005 per share.
F Total returns for periods of less than one year are not annualized.
G Total returns would have been lower if certain expenses had not been reduced during the applicable periods shown.
H Total returns do not include the effect of the sales charges.
I Fees and expenses of any underlying Fidelity Central Funds are not included in the Fund's expense ratio. The Fund indirectly bears its proportionate share of the expenses of any underlying Fidelity Central Funds.
J Expense ratios reflect operating expenses of the class. Expenses before reductions do not reflect amounts reimbursed by the investment adviser or reductions from brokerage service arrangements or reductions from other expense offset arrangements and do not represent the amount paid by the class during periods when reimbursements or reductions occur. Expenses net of fee waivers reflect expenses after reimbursement by the investment adviser but prior to reductions from brokerage service arrangements or other expense offset arrangements. Expenses net of all reductions represent the net expenses paid by the class.
K Annualized
L Amount does not include the portfolio activity of any underlying Fidelity Central Funds.
M Portfolio turnover rate excludes securities received or delivered in-kind.
See accompanying notes which are an integral part of the financial statements.
Financial Highlights — Telecommunications Portfolio Class B
| Six months ended (Unaudited) | Years ended February 28, | |||||
| August 31, | 2015 | 2015 | 2014 | 2013 | 2012A | 2011 |
| Selected Per–Share Data | ||||||
| Net asset value, beginning of period | $63.45 | $58.77 | $51.63 | $46.14 | $46.93 | $37.60 |
| Income from Investment Operations | ||||||
| Net investment income (loss)B | .17 | .29 | 1.33C | .62 | .21 | .25 |
| Net realized and unrealized gain (loss) | (4.32) | 5.84 | 6.48 | 5.42 | (.83) | 9.48 |
| Total from investment operations | (4.15) | 6.13 | 7.81 | 6.04 | (.62) | 9.73 |
| Distributions from net investment income | – | (1.45) | (.66) | (.55) | (.17) | (.40) |
| Distributions from net realized gain | – | – | (.01) | – | – | – |
| Total distributions | – | (1.45) | (.67) | (.55) | (.17) | (.40) |
| Redemption fees added to paid in capitalB,D | – | – | – | – | – | – |
| Net asset value, end of period | $59.30 | $63.45 | $58.77 | $51.63 | $46.14 | $46.93 |
| Total ReturnE,F,G | (6.54)% | 10.67% | 15.13% | 13.11% | (1.29)% | 25.96% |
| Ratios to Average Net AssetsH,I | ||||||
| Expenses before reductions | 1.95%J | 1.93% | 1.93% | 1.93% | 1.95% | 1.95% |
| Expenses net of fee waivers, if any | 1.95%J | 1.93% | 1.93% | 1.93% | 1.95% | 1.95% |
| Expenses net of all reductions | 1.93%J | 1.92% | 1.91% | 1.92% | 1.93% | 1.93% |
| Net investment income (loss) | .53%J | .49% | 2.32%C | 1.26% | .47% | .60% |
| Supplemental Data | ||||||
| Net assets, end of period (000 omitted) | $293 | $409 | $546 | $576 | $596 | $706 |
| Portfolio turnover rateK | 75%J | 94%L | 111% | 76% | 72% | 72% |
A For the year ended February 29.
B Calculated based on average shares outstanding during the period.
C Investment income per share reflects large, non-recurring dividends which amounted to $.95 per share. Excluding these non-recurring dividends, the ratio of net investment income (loss) to average net assets would have been .67%.
D Amount represents less than $.005 per share.
E Total returns for periods of less than one year are not annualized.
F Total returns would have been lower if certain expenses had not been reduced during the applicable periods shown.
G Total returns do not include the effect of the contingent deferred sales charge.
H Fees and expenses of any underlying Fidelity Central Funds are not included in the Fund's expense ratio. The Fund indirectly bears its proportionate share of the expenses of any underlying Fidelity Central Funds.
I Expense ratios reflect operating expenses of the class. Expenses before reductions do not reflect amounts reimbursed by the investment adviser or reductions from brokerage service arrangements or reductions from other expense offset arrangements and do not represent the amount paid by the class during periods when reimbursements or reductions occur. Expenses net of fee waivers reflect expenses after reimbursement by the investment adviser but prior to reductions from brokerage service arrangements or other expense offset arrangements. Expenses net of all reductions represent the net expenses paid by the class.
J Annualized
K Amount does not include the portfolio activity of any underlying Fidelity Central Funds.
L Portfolio turnover rate excludes securities received or delivered in-kind.
See accompanying notes which are an integral part of the financial statements.
Financial Highlights — Telecommunications Portfolio Class C
| Six months ended (Unaudited) | Years ended February 28, | |||||
| August 31, | 2015 | 2015 | 2014 | 2013 | 2012A | 2011 |
| Selected Per–Share Data | ||||||
| Net asset value, beginning of period | $63.04 | $58.54 | $51.47 | $46.02 | $46.89 | $37.61 |
| Income from Investment Operations | ||||||
| Net investment income (loss)B | .17 | .34 | 1.36C | .63 | .22 | .26 |
| Net realized and unrealized gain (loss) | (4.28) | 5.80 | 6.46 | 5.41 | (.84) | 9.46 |
| Total from investment operations | (4.11) | 6.14 | 7.82 | 6.04 | (.62) | 9.72 |
| Distributions from net investment income | – | (1.64) | (.74) | (.59) | (.25) | (.44) |
| Distributions from net realized gain | – | – | (.01) | – | – | – |
| Total distributions | – | (1.64) | (.75) | (.59) | (.25) | (.44) |
| Redemption fees added to paid in capitalB,D | – | – | – | – | – | – |
| Net asset value, end of period | $58.93 | $63.04 | $58.54 | $51.47 | $46.02 | $46.89 |
| Total ReturnE,F,G | (6.52)% | 10.75% | 15.20% | 13.14% | (1.27)% | 25.95% |
| Ratios to Average Net AssetsH,I | ||||||
| Expenses before reductions | 1.92%J | 1.85% | 1.88% | 1.90% | 1.93% | 1.94% |
| Expenses net of fee waivers, if any | 1.92%J | 1.85% | 1.88% | 1.90% | 1.93% | 1.94% |
| Expenses net of all reductions | 1.90%J | 1.85% | 1.85% | 1.89% | 1.91% | 1.92% |
| Net investment income (loss) | .56%J | .56% | 2.38%C | 1.29% | .48% | .61% |
| Supplemental Data | ||||||
| Net assets, end of period (000 omitted) | $7,854 | $7,074 | $5,523 | $4,353 | $3,514 | $3,035 |
| Portfolio turnover rateK | 75%J | 94%L | 111% | 76% | 72% | 72% |
A For the year ended February 29.
B Calculated based on average shares outstanding during the period.
C Investment income per share reflects large, non-recurring dividends which amounted to $.94 per share. Excluding these non-recurring dividends, the ratio of net investment income (loss) to average net assets would have been .73%.
D Amount represents less than $.005 per share.
E Total returns for periods of less than one year are not annualized.
F Total returns would have been lower if certain expenses had not been reduced during the applicable periods shown.
G Total returns do not include the effect of the contingent deferred sales charge.
H Fees and expenses of any underlying Fidelity Central Funds are not included in the Fund's expense ratio. The Fund indirectly bears its proportionate share of the expenses of any underlying Fidelity Central Funds.
I Expense ratios reflect operating expenses of the class. Expenses before reductions do not reflect amounts reimbursed by the investment adviser or reductions from brokerage service arrangements or reductions from other expense offset arrangements and do not represent the amount paid by the class during periods when reimbursements or reductions occur. Expenses net of fee waivers reflect expenses after reimbursement by the investment adviser but prior to reductions from brokerage service arrangements or other expense offset arrangements. Expenses net of all reductions represent the net expenses paid by the class.
J Annualized
K Amount does not include the portfolio activity of any underlying Fidelity Central Funds.
L Portfolio turnover rate excludes securities received or delivered in-kind.
See accompanying notes which are an integral part of the financial statements.
Financial Highlights — Telecommunications Portfolio
| Six months ended (Unaudited) | Years ended February 28, | |||||
| August 31, | 2015 | 2015 | 2014 | 2013 | 2012A | 2011 |
| Selected Per–Share Data | ||||||
| Net asset value, beginning of period | $63.54 | $58.94 | $51.75 | $46.26 | $47.07 | $37.73 |
| Income from Investment Operations | ||||||
| Net investment income (loss)B | .52 | .96 | 1.96C | 1.15 | .70 | .69 |
| Net realized and unrealized gain (loss) | (4.34) | 5.85 | 6.51 | 5.43 | (.86) | 9.52 |
| Total from investment operations | (3.82) | 6.81 | 8.47 | 6.58 | (.16) | 10.21 |
| Distributions from net investment income | (.05) | (2.21) | (1.28) | (1.09) | (.65) | (.87) |
| Distributions from net realized gain | – | – | (.01) | – | – | – |
| Total distributions | (.05) | (2.21) | (1.28)D | (1.09) | (.65) | (.87) |
| Redemption fees added to paid in capitalB,E | – | – | – | – | – | – |
| Net asset value, end of period | $59.67 | $63.54 | $58.94 | $51.75 | $46.26 | $47.07 |
| Total ReturnF,G | (6.01)% | 11.90% | 16.40% | 14.30% | (.23)% | 27.24% |
| Ratios to Average Net AssetsH,I | ||||||
| Expenses before reductions | .83%J | .83% | .85% | .87% | .90% | .92% |
| Expenses net of fee waivers, if any | .83%J | .83% | .85% | .87% | .90% | .92% |
| Expenses net of all reductions | .82%J | .82% | .82% | .85% | .88% | .91% |
| Net investment income (loss) | 1.65%J | 1.58% | 3.41%C | 2.33% | 1.52% | 1.62% |
| Supplemental Data | ||||||
| Net assets, end of period (000 omitted) | $416,171 | $346,174 | $343,548 | $377,841 | $342,262 | $354,938 |
| Portfolio turnover rateK | 75%J | 94%L | 111% | 76% | 72% | 72% |
A For the year ended February 29.
B Calculated based on average shares outstanding during the period.
C Investment income per share reflects large, non-recurring dividends which amounted to $.95 per share. Excluding these non-recurring dividends, the ratio of net investment income (loss) to average net assets would have been 1.76%.
D Total distributions of $1.28 per share is comprised of distributions from net investment income of $1.275 and distributions from net realized gain of $.005 per share.
E Amount represents less than $.005 per share.
F Total returns for periods of less than one year are not annualized.
G Total returns would have been lower if certain expenses had not been reduced during the applicable periods shown.
H Fees and expenses of any underlying Fidelity Central Funds are not included in the Fund's expense ratio. The Fund indirectly bears its proportionate share of the expenses of any underlying Fidelity Central Funds.
I Expense ratios reflect operating expenses of the class. Expenses before reductions do not reflect amounts reimbursed by the investment adviser or reductions from brokerage service arrangements or reductions from other expense offset arrangements and do not represent the amount paid by the class during periods when reimbursements or reductions occur. Expenses net of fee waivers reflect expenses after reimbursement by the investment adviser but prior to reductions from brokerage service arrangements or other expense offset arrangements. Expenses net of all reductions represent the net expenses paid by the class.
J Annualized
K Amount does not include the portfolio activity of any underlying Fidelity Central Funds.
L Portfolio turnover rate excludes securities received or delivered in-kind.
See accompanying notes which are an integral part of the financial statements.
Financial Highlights — Telecommunications Portfolio Class I
| Six months ended (Unaudited) | Years ended February 28, | |||||
| August 31, | 2015 | 2015 | 2014 | 2013 | 2012A | 2011 |
| Selected Per–Share Data | ||||||
| Net asset value, beginning of period | $63.38 | $58.80 | $51.65 | $46.20 | $47.02 | $37.69 |
| Income from Investment Operations | ||||||
| Net investment income (loss)B | .51 | .94 | 1.93C | 1.17 | .70 | .71 |
| Net realized and unrealized gain (loss) | (4.32) | 5.83 | 6.48 | 5.42 | (.88) | 9.50 |
| Total from investment operations | (3.81) | 6.77 | 8.41 | 6.59 | (.18) | 10.21 |
| Distributions from net investment income | (.06) | (2.19) | (1.25) | (1.14) | (.64) | (.88) |
| Distributions from net realized gain | – | – | (.01) | – | – | – |
| Total distributions | (.06) | (2.19) | (1.26) | (1.14) | (.64) | (.88) |
| Redemption fees added to paid in capitalB,D | – | – | – | – | – | – |
| Net asset value, end of period | $59.51 | $63.38 | $58.80 | $51.65 | $46.20 | $47.02 |
| Total ReturnE,F | (6.02)% | 11.85% | 16.30% | 14.33% | (.26)% | 27.27% |
| Ratios to Average Net AssetsG,H | ||||||
| Expenses before reductions | .85%I | .86% | .91% | .85% | .89% | .91% |
| Expenses net of fee waivers, if any | .85%I | .86% | .91% | .85% | .89% | .91% |
| Expenses net of all reductions | .84%I | .85% | .88% | .83% | .87% | .89% |
| Net investment income (loss) | 1.63%I | 1.55% | 3.35%C | 2.35% | 1.52% | 1.64% |
| Supplemental Data | ||||||
| Net assets, end of period (000 omitted) | $2,630 | $2,505 | $1,604 | $2,641 | $1,022 | $1,743 |
| Portfolio turnover rateJ | 75%I | 94%K | 111% | 76% | 72% | 72% |
A For the year ended February 29.
B Calculated based on average shares outstanding during the period.
C Investment income per share reflects large, non-recurring dividends which amounted to $.95 per share. Excluding these non-recurring dividends, the ratio of net investment income (loss) to average net assets would have been 1.70%.
D Amount represents less than $.005 per share.
E Total returns for periods of less than one year are not annualized.
F Total returns would have been lower if certain expenses had not been reduced during the applicable periods shown.
G Fees and expenses of any underlying Fidelity Central Funds are not included in the Fund's expense ratio. The Fund indirectly bears its proportionate share of the expenses of any underlying Fidelity Central Funds.
H Expense ratios reflect operating expenses of the class. Expenses before reductions do not reflect amounts reimbursed by the investment adviser or reductions from brokerage service arrangements or reductions from other expense offset arrangements and do not represent the amount paid by the class during periods when reimbursements or reductions occur. Expenses net of fee waivers reflect expenses after reimbursement by the investment adviser but prior to reductions from brokerage service arrangements or other expense offset arrangements. Expenses net of all reductions represent the net expenses paid by the class.
I Annualized
J Amount does not include the portfolio activity of any underlying Fidelity Central Funds.
K Portfolio turnover rate excludes securities received or delivered in-kind.
See accompanying notes which are an integral part of the financial statements.
Notes to Financial Statements (Unaudited)
For the period ended August 31, 2015
1. Organization.
Telecommunications Portfolio (the Fund) is a non-diversified fund of Fidelity Select Portfolios (the Trust) and is authorized to issue an unlimited number of shares. The Trust is registered under the Investment Company Act of 1940, as amended (the 1940 Act), as an open-end management investment company organized as a Massachusetts business trust. The Fund invests primarily in securities of companies whose principal business activities fall within specific industries. The Fund offers Class A, Class T, Class C, Telecommunications and Class I (formerly Institutional Class) shares, each of which, along with Class B shares, has equal rights as to assets and voting privileges. Class B shares are closed to new accounts and additional purchases, except for exchanges and reinvestments. Each class has exclusive voting rights with respect to matters that affect that class. Class B shares will automatically convert to Class A shares after a holding period of seven years from the initial date of purchase.
2. Investments in Fidelity Central Funds.
The Fund invests in Fidelity Central Funds, which are open-end investment companies generally available only to other investment companies and accounts managed by the investment adviser and its affiliates. The Fund's Schedule of Investments lists each of the Fidelity Central Funds held as of period end, if any, as an investment of the Fund, but does not include the underlying holdings of each Fidelity Central Fund. As an Investing Fund, the Fund indirectly bears its proportionate share of the expenses of the underlying Fidelity Central Funds.
The Money Market Central Funds seek preservation of capital and current income and are managed by Fidelity Investments Money Management, Inc. (FIMM), an affiliate of the investment adviser. Annualized expenses of the Money Market Central Funds as of their most recent shareholder report date are less than .01%.
A complete unaudited list of holdings for each Fidelity Central Fund is available upon request or at the Securities and Exchange Commission (the SEC) website at www.sec.gov. In addition, the financial statements of the Fidelity Central Funds are available on the SEC website or upon request.
3. Significant Accounting Policies.
The financial statements have been prepared in conformity with accounting principles generally accepted in the United States of America (GAAP), which require management to make certain estimates and assumptions at the date of the financial statements. Actual results could differ from those estimates. Subsequent events, if any, through the date that the financial statements were issued have been evaluated in the preparation of the financial statements. The following summarizes the significant accounting policies of the Fund:
Investment Valuation. Investments are valued as of 4:00 p.m. Eastern time on the last calendar day of the period. The Board of Trustees (the Board) has delegated the day to day responsibility for the valuation of the Fund's investments to the Fidelity SelectCo, LLC (SelectCo) Fair Value Committee (the Committee). In accordance with valuation policies and procedures approved by the Board, the Fund attempts to obtain prices from one or more third party pricing vendors or brokers to value its investments. When current market prices, quotations or currency exchange rates are not readily available or reliable, investments will be fair valued in good faith by the Committee, in accordance with procedures adopted by the Board. Factors used in determining fair value vary by investment type and may include market or investment specific events. The frequency with which these procedures are used cannot be predicted and they may be utilized to a significant extent. The Committee oversees the Fund's valuation policies and procedures and reports to the Board on the Committee's activities and fair value determinations. The Board monitors the appropriateness of the procedures used in valuing the Fund's investments and ratifies the fair value determinations of the Committee.
The Fund categorizes the inputs to valuation techniques used to value its investments into a disclosure hierarchy consisting of three levels as shown below:
- Level 1 – quoted prices in active markets for identical investments
- Level 2 – other significant observable inputs (including quoted prices for similar investments, interest rates, prepayment speeds, etc.)
- Level 3 – unobservable inputs (including the Fund's own assumptions based on the best information available)
Valuation techniques used to value the Fund's investments by major category are as follows:
Equity securities, including restricted securities, for which market quotations are readily available, are valued at the last reported sale price or official closing price as reported by a third party pricing vendor on the primary market or exchange on which they are traded and are categorized as Level 1 in the hierarchy. In the event there were no sales during the day or closing prices are not available, securities are valued at the last quoted bid price or may be valued using the last available price and are generally categorized as Level 2 in the hierarchy. For foreign equity securities, when market or security specific events arise, comparisons to the valuation of American Depositary Receipts (ADRs), futures contracts, Exchange-Traded Funds (ETFs) and certain indexes as well as quoted prices for similar securities may be used and would be categorized as Level 2 in the hierarchy. Utilizing these techniques may result in transfers between Level 1 and Level 2. For equity securities, including restricted securities, where observable inputs are limited, assumptions about market activity and risk are used and these securities may be categorized as Level 3 in the hierarchy.
Investments in open-end mutual funds, including the Fidelity Central Funds, are valued at their closing net asset value (NAV) each business day and are categorized as Level 1 in the hierarchy.
Changes in valuation techniques may result in transfers in or out of an assigned level within the disclosure hierarchy. The aggregate value of investments by input level, as of August 31, 2015, is included at the end of the Fund's Schedule of Investments.
Foreign Currency. The Fund may use foreign currency contracts to facilitate transactions in foreign-denominated securities. Gains and losses from these transactions may arise from changes in the value of the foreign currency or if the counterparties do not perform under the contracts' terms.
Foreign-denominated assets, including investment securities, and liabilities are translated into U.S. dollars at the exchange rates at period end. Purchases and sales of investment securities, income and dividends received and expenses denominated in foreign currencies are translated into U.S. dollars at the exchange rate in effect on the transaction date.
The effects of exchange rate fluctuations on investments are included with the net realized and unrealized gain (loss) on investment securities. Other foreign currency transactions resulting in realized and unrealized gain (loss) are disclosed separately.
Investment Transactions and Income. For financial reporting purposes, the Fund's investment holdings and NAV include trades executed through the end of the last business day of the period. The NAV per share for processing shareholder transactions is calculated as of the close of business of the New York Stock Exchange (NYSE), normally 4:00 p.m. Eastern time and includes trades executed through the end of the prior business day. Gains and losses on securities sold are determined on the basis of identified cost and may include proceeds received from litigation. Dividend income is recorded on the ex-dividend date, except for certain dividends from foreign securities where the ex-dividend date may have passed, which are recorded as soon as the Fund is informed of the ex-dividend date. Non-cash dividends included in dividend income, if any, are recorded at the fair market value of the securities received. Income and capital gain distributions from Fidelity Central Funds, if any, are recorded on the ex-dividend date. Distributions received on securities that represent a return of capital or capital gain are recorded as a reduction of cost of investments and/or as a realized gain. Subsequent to ex-dividend date the Fund determines the components of these distributions, based upon receipt of tax filings or other correspondence relating to the underlying investment. Investment income is recorded net of foreign taxes withheld where recovery of such taxes is uncertain.
Class Allocations and Expenses. Investment income, realized and unrealized capital gains and losses, common expenses of the Fund, and certain fund-level expense reductions, if any, are allocated daily on a pro-rata basis to each class based on the relative net assets of each class to the total net assets of the Fund. Each class differs with respect to transfer agent and distribution and service plan fees incurred. Certain expense reductions may also differ by class. For the reporting period, the allocated portion of income and expenses to each class as a percent of its average net assets may vary due to the timing of recording these transactions in relation to fluctuating net assets of the classes. Expenses directly attributable to a fund are charged to that fund. Expenses attributable to more than one fund are allocated among the respective funds on the basis of relative net assets or other appropriate methods. Expense estimates are accrued in the period to which they relate and adjustments are made when actual amounts are known.
Income Tax Information and Distributions to Shareholders. Each year, the Fund intends to qualify as a regulated investment company under Subchapter M of the Internal Revenue Code, including distributing substantially all of its taxable income and realized gains. As a result, no provision for U.S. Federal income taxes is required. The Fund files a U.S. federal tax return, in addition to state and local tax returns as required. The Fund's federal income tax returns are subject to examination by the Internal Revenue Service (IRS) for a period of three fiscal years after they are filed. State and local tax returns may be subject to examination for an additional fiscal year depending on the jurisdiction. Foreign taxes are provided for based on the Fund's understanding of the tax rules and rates that exist in the foreign markets in which it invests.
Distributions are declared and recorded on the ex-dividend date. Income dividends and capital gain distributions are declared separately for each class. Income and capital gain distributions are determined in accordance with income tax regulations, which may differ from GAAP.
Capital accounts within the financial statements are adjusted for permanent book-tax differences. These adjustments have no impact on net assets or the results of operations. Capital accounts are not adjusted for temporary book-tax differences which will reverse in a subsequent period.
Book-tax differences are primarily due to foreign currency transaction, in-kind transactions, deferred trustees compensation, capital loss carryforwards and losses deferred due to wash sales and excise tax regulations.
The federal tax cost of investment securities and unrealized appreciation (depreciation) as of period end were as follows:
| Gross unrealized appreciation | $48,958,944 |
| Gross unrealized depreciation | (26,279,442) |
| Net unrealized appreciation (depreciation) on securities | $22,679,502 |
| Tax cost | $454,828,095 |
Capital loss carryforwards are only available to offset future capital gains of the Fund to the extent provided by regulations and may be limited. Under the Regulated Investment Company Modernization Act of 2010 (the Act), the Fund is permitted to carry forward capital losses incurred in taxable years beginning after December 22, 2010 for an unlimited period and such capital losses are required to be used prior to any losses that expire. The capital loss carryforward information presented below, including any applicable limitation, is estimated as of prior fiscal period end and is subject to adjustment.
| Fiscal year of expiration | |
| 2018 | $(2,739,258) |
The Fund elected to defer to its next fiscal year approximately $1,605,208 of capital losses recognized during the period November 1, 2014 to February 28, 2015.
Trading (Redemption) Fees. Shares held by investors in the Fund less than 30 days may be subject to a redemption fee equal to .75% of the NAV of shares redeemed. All redemption fees, which reduce the proceeds of the shareholder redemption, are retained by the Fund and accounted for as an addition to paid in capital.
4. Purchases and Sales of Investments.
Purchases and sales of securities, other than short-term securities, aggregated $253,371,396 and $151,002,092, respectively.
5. Fees and Other Transactions with Affiliates.
Management Fee. Fidelity SelectCo, LLC (the investment adviser) and its affiliates provide the Fund with investment management related services for which the Fund pays a monthly management fee. The management fee is the sum of an individual fund fee rate that is based on an annual rate of .30% of the Fund's average net assets and an annualized group fee rate that averaged .25% during the period. The group fee rate is based upon the average net assets of all the mutual funds advised by Fidelity Management & Research Company (FMR) and the investment adviser. The group fee rate decreases as assets under management increase and increases as assets under management decrease. For the reporting period, the total annualized management fee rate was .55% of the Fund's average net assets.
Distribution and Service Plan Fees. In accordance with Rule 12b-1 of the 1940 Act, the Fund has adopted separate Distribution and Service Plans for each class of shares. Certain classes pay Fidelity Distributors Corporation (FDC), an affiliate of the investment adviser, separate Distribution and Service Fees, each of which is based on an annual percentage of each class' average net assets. In addition, FDC may pay financial intermediaries for selling shares of the Fund and providing shareholder support services. For the period, the Distribution and Service Fee rates, total fees and amounts retained by FDC were as follows:
| Distribution Fee | Service Fee | Total Fees | Retained by FDC |
|
| Class A | -% | .25% | $14,634 | $644 |
| Class T | .25% | .25% | 12,614 | – |
| Class B | .75% | .25% | 1,771 | 1,328 |
| Class C | .75% | .25% | 39,443 | 8,926 |
| $68,462 | $10,898 |
Sales Load. FDC may receive a front-end sales charge of up to 5.75% for selling Class A shares and 3.50% for selling Class T shares, some of which is paid to financial intermediaries for selling shares of the Fund. Depending on the holding period, FDC may receive contingent deferred sales charges levied on Class A, Class T, Class B, and Class C redemptions. The deferred sales charges range from 5.00% to 1.00% for Class B shares, 1.00% for Class C shares, 1.00% for certain purchases of Class A shares and .25% for certain purchases of Class T shares.
For the period, sales charge amounts retained by FDC were as follows:
| Retained by FDC |
|
| Class A | $6,592 |
| Class T | 1,090 |
| Class B* | 7 |
| Class C* | 296 |
| $7,985 |
* When Class B and Class C shares are initially sold, FDC pays commissions from its own resources to financial intermediaries through which the sales are made.
Transfer Agent Fees. Fidelity Investments Institutional Operations Company, Inc., (FIIOC), an affiliate of the investment adviser, is the transfer, dividend disbursing and shareholder servicing agent for each class of the Fund. FIIOC receives account fees and asset-based fees that vary according to the account size and type of account of the shareholders of the respective classes of the Fund. FIIOC pays for typesetting, printing and mailing of shareholder reports, except proxy statements.
For the period, transfer agent fees for each class were as follows:
| Amount | % of Class-Level Average Net Assets* |
|
| Class A | $16,054 | .27 |
| Class T | 8,611 | .34 |
| Class B | 538 | .30 |
| Class C | 10,901 | .28 |
| Telecommunications | 370,847 | .19 |
| Class I | 3,437 | .21 |
| $ 410,388 |
*Annualized
Accounting and Security Lending Fees. Fidelity Service Company, Inc. (FSC), an affiliate of the investment adviser, maintains the Fund's accounting records. The accounting fee is based on the level of average net assets for each month. Under a separate contract, FSC administers the security lending program. The security lending fee is based on the number and duration of lending transactions.
Brokerage Commissions. The Fund placed a portion of its portfolio transactions with brokerage firms which are affiliates of the investment adviser. Brokerage commissions are included in net realized gain (loss) and change in net unrealized appreciation (depreciation) in the Statement of Operations. The commissions paid to these affiliated firms were $6,398 for the period.
Interfund Lending Program. Pursuant to an Exemptive Order issued by the SEC, the Fund, along with other registered investment companies having management contracts with FMR or other affiliated entities of FMR, may participate in an interfund lending program. This program provides an alternative credit facility allowing the funds to borrow from, or lend money to, other participating affiliated funds. At period end, there were no interfund loans outstanding. The Fund's activity in this program during the period for which loans were outstanding was as follows:
| Borrower or Lender | Average Loan Balance | Weighted Average Interest Rate | Interest Expense |
| Borrower | $5,833,500 | .37% | $121 |
6. Committed Line of Credit.
The Fund participates with other funds managed by the investment adviser or an affiliate in a $4.25 billion credit facility (the "line of credit") to be utilized for temporary or emergency purposes to fund shareholder redemptions or for other short-term liquidity purposes. The Fund has agreed to pay commitment fees on its pro-rata portion of the line of credit, which amounted to $298 and is reflected in Miscellaneous expenses on the Statement of Operations. During the period, the Fund did not borrow on this line of credit.
7. Security Lending.
The Fund lends portfolio securities through a lending agent from time to time in order to earn additional income. On the settlement date of the loan, the Fund receives collateral (in the form of U.S. Treasury obligations, letters of credit and/or cash) against the loaned securities and maintains collateral in an amount not less than 100% of the market value of the loaned securities during the period of the loan. The market value of the loaned securities is determined at the close of business of the Fund and any additional required collateral is delivered to the Fund on the next business day. If the borrower defaults on its obligation to return the securities loaned because of insolvency or other reasons, the Fund may apply collateral received from the borrower against the obligation. The Fund may experience delays and costs in recovering the securities loaned. Any cash collateral received is invested in the Fidelity Securities Lending Cash Central Fund. The value of loaned securities and cash collateral at period end are disclosed on the Fund's Statement of Assets and Liabilities. Security lending income represents the income earned on investing cash collateral, less rebates paid to borrowers and any lending agent fees associated with the loan, plus any premium payments received for lending certain types of securities. Security lending income is presented in the Statement of Operations as a component of income from Fidelity Central Funds. Total security lending income during the period amounted to $261,852.
8. Expense Reductions.
Commissions paid to certain brokers with whom the investment adviser, or its affiliates, places trades on behalf of the Fund include an amount in addition to trade execution, which may be rebated back to the Fund to offset certain expenses. This amount totaled $25,810 for the period.
In addition, during the period the investment adviser reimbursed and/or waived a portion of the fund-level operating expenses in the amount of $1,758 and a portion of class-level operating expenses as follows:
| Amount | ||
| Class A | $152 | |
| Class T | 11 | |
| Class B | 1 | |
| Class C | 135 | |
| Telecommunications | 9,106 | |
| Class I | 41 | |
| $9,446 |
9. Distributions to Shareholders.
Distributions to shareholders of each class were as follows:
| Six months ended August 31, 2015 | Year ended February 28, 2015 | |
| From net investment income | ||
| Class A | $4,067 | $309,863 |
| Class T | – | 143,116 |
| Class B | – | 12,248 |
| Class C | – | 161,299 |
| Telecommunications | 268,350 | 12,985,170 |
| Class I | 3,364 | 67,625 |
| Total | $275,781 | $13,679,321 |
10. Share Transactions.
Share transactions for each class were as follows and may contain automatic conversions between classes or exchanges between funds:
| Shares | Shares | Dollars | Dollars | |
| Six months ended August 31, 2015 | Year ended February 28, 2015 | Six months ended August 31, 2015 | Year ended February 28, 2015 | |
| Class A | ||||
| Shares sold | 42,570 | 79,279 | $2,653,863 | $4,786,534 |
| Reinvestment of distributions | 62 | 5,091 | 3,876 | 297,550 |
| Shares redeemed | (27,260) | (41,031) | (1,695,334) | (2,466,354) |
| Net increase (decrease) | 15,372 | 43,339 | $962,405 | $2,617,730 |
| Class T | ||||
| Shares sold | 7,480 | 20,637 | $463,456 | $1,237,395 |
| Reinvestment of distributions | – | 2,409 | – | 139,987 |
| Shares redeemed | (9,168) | (16,465) | $(561,396) | $(994,017) |
| Net increase (decrease) | (1,688) | 6,581 | $(97,940) | $383,365 |
| Class B | ||||
| Shares sold | 129 | 45 | $7,453 | $2,624 |
| Reinvestment of distributions | – | 197 | – | 11,445 |
| Shares redeemed | (1,637) | (3,091) | (101,595) | (186,477) |
| Net increase (decrease) | (1,508) | (2,849) | $(94,142) | $(172,408) |
| Class C | ||||
| Shares sold | 32,550 | 28,734 | $2,029,083 | $1,731,696 |
| Reinvestment of distributions | – | 2,043 | – | 118,683 |
| Shares redeemed | (11,472) | (12,919) | (710,851) | (773,747) |
| Net increase (decrease) | 21,078 | 17,858 | $1,318,232 | $1,076,632 |
| Telecommunications | ||||
| Shares sold | 2,361,442 | 3,400,370 | $149,105,313 | $205,982,254 |
| Reinvestment of distributions | 4,075 | 212,695 | 257,513 | 12,494,070 |
| Shares redeemed | (838,911) | (3,993,893)A | (52,018,468) | (242,841,980)A |
| Net increase (decrease) | 1,526,606 | (380,828) | $97,344,358 | $(24,365,656) |
| Class I | ||||
| Shares sold | 28,397 | 29,046 | $1,792,100 | $1,764,278 |
| Reinvestment of distributions | 48 | 956 | 3,004 | 56,138 |
| Shares redeemed | (23,780) | (17,754) | (1,481,523) | (1,063,165) |
| Net increase (decrease) | 4,665 | 12,248 | $313,581 | $757,251 |
A Amount includes in-kind redemptions.
11. Other.
The Fund's organizational documents provide former and current trustees and officers with a limited indemnification against liabilities arising in connection with the performance of their duties to the Fund. In the normal course of business, the Fund may also enter into contracts that provide general indemnifications. The Fund's maximum exposure under these arrangements is unknown as this would be dependent on future claims that may be made against the Fund. The risk of material loss from such claims is considered remote.
At the end of the period, Strategic Advisers Core Fund was the owner of record of approximately 14% of the total outstanding shares of the Fund. Mutual funds managed by the investment adviser or its affiliates were the owners of record, in the aggregate, of approximately 22% of the total outstanding shares of the Fund.
Shareholder Expense Example
As a shareholder of the Fund, you incur two types of costs: (1) transaction costs, including sales charges (loads) on purchase payments or redemption proceeds, redemption fees and (2) ongoing costs, including management fees, distribution and/or service (12b-1) fees and other Fund expenses. This Example is intended to help you understand your ongoing costs (in dollars) of investing in the Fund and to compare these costs with the ongoing costs of investing in other mutual funds.
The Example is based on an investment of $1,000 invested at the beginning of the period and held for the entire period (March 1, 2015 to August 31, 2015).
Actual Expenses
The first line of the accompanying table for each class of the Fund provides information about actual account values and actual expenses. You may use the information in this line, together with the amount you invested, to estimate the expenses that you paid over the period. Simply divide your account value by $1,000.00 (for example, an $8,600 account value divided by $1,000.00 = 8.6), then multiply the result by the number in the first line for a class of the Fund under the heading entitled "Expenses Paid During Period" to estimate the expenses you paid on your account during this period. A small balance maintenance fee of $12.00 that is charged once a year may apply for certain accounts with a value of less than $2,000. This fee is not included in the table below. If it was, the estimate of expenses you paid during the period would be higher, and your ending account value lower, by this amount. In addition, the Fund, as a shareholder in the underlying Fidelity Central Funds, will indirectly bear its pro-rata share of the fees and expenses incurred by the underlying Fidelity Central Funds. These fees and expenses are not included in the Fund's annualized expense ratio used to calculate the expense estimate in the table below.
Hypothetical Example for Comparison Purposes
The second line of the accompanying table for each class of the Fund provides information about hypothetical account values and hypothetical expenses based on a Class' actual expense ratio and an assumed rate of return of 5% per year before expenses, which is not the Class' actual return. The hypothetical account values and expenses may not be used to estimate the actual ending account balance or expenses you paid for the period. You may use this information to compare the ongoing costs of investing in the Fund and other funds. To do so, compare this 5% hypothetical example with the 5% hypothetical examples that appear in the shareholder reports of the other funds. A small balance maintenance fee of $12.00 that is charged once a year may apply for certain accounts with a value of less than $2,000. This fee is not included in the table below. If it was, the estimate of expenses you paid during the period would be higher, and your ending account value lower, by this amount. In addition, the Fund, as a shareholder in the underlying Fidelity Central Funds, will indirectly bear its pro-rata share of the fees and expenses incurred by the underlying Fidelity Central Funds. These fees and expenses are not included in the Fund's annualized expense ratio used to calculate the expense estimate in the table below.
Please note that the expenses shown in the table are meant to highlight your ongoing costs only and do not reflect any transaction costs. Therefore, the second line of the table is useful in comparing ongoing costs only, and will not help you determine the relative total costs of owning different funds. In addition, if these transactional costs were included, your costs would have been higher.
| Annualized Expense Ratio-A | Beginning Account Value March 1, 2015 | Ending Account Value August 31, 2015 | Expenses Paid During Period-B March 1, 2015 to August 31, 2015 |
|
| Consumer Staples Portfolio | ||||
| Class A | 1.04% | |||
| Actual | $1,000.00 | $901.30 | $4.97 | |
| Hypothetical-C | $1,000.00 | $1,019.91 | $5.28 | |
| Class T | 1.32% | |||
| Actual | $1,000.00 | $900.10 | $6.30 | |
| Hypothetical-C | $1,000.00 | $1,018.50 | $6.70 | |
| Class B | 1.81% | |||
| Actual | $1,000.00 | $897.90 | $8.63 | |
| Hypothetical-C | $1,000.00 | $1,016.04 | $9.17 | |
| Class C | 1.80% | |||
| Actual | $1,000.00 | $898.00 | $8.59 | |
| Hypothetical-C | $1,000.00 | $1,016.09 | $9.12 | |
| Consumer Staples | .77% | |||
| Actual | $1,000.00 | $902.60 | $3.68 | |
| Hypothetical-C | $1,000.00 | $1,021.27 | $3.91 | |
| Class I | .77% | |||
| Actual | $1,000.00 | $902.40 | $3.68 | |
| Hypothetical-C | $1,000.00 | $1,021.27 | $3.91 | |
| Gold Portfolio | ||||
| Class A | 1.21% | |||
| Actual | $1,000.00 | $748.20 | $5.32 | |
| Hypothetical-C | $1,000.00 | $1,019.05 | $6.14 | |
| Class T | 1.49% | |||
| Actual | $1,000.00 | $747.10 | $6.54 | |
| Hypothetical-C | $1,000.00 | $1,017.65 | $7.56 | |
| Class B | 1.96% | |||
| Actual | $1,000.00 | $745.20 | $8.60 | |
| Hypothetical-C | $1,000.00 | $1,015.28 | $9.93 | |
| Class C | 1.94% | |||
| Actual | $1,000.00 | $744.80 | $8.51 | |
| Hypothetical-C | $1,000.00 | $1,015.38 | $9.83 | |
| Gold | .93% | |||
| Actual | $1,000.00 | $748.60 | $4.09 | |
| Hypothetical-C | $1,000.00 | $1,020.46 | $4.72 | |
| Class I | .89% | |||
| Actual | $1,000.00 | $749.20 | $3.91 | |
| Hypothetical-C | $1,000.00 | $1,020.66 | $4.52 | |
| Materials Portfolio | ||||
| Class A | 1.06% | |||
| Actual | $1,000.00 | $887.90 | $5.03 | |
| Hypothetical-C | $1,000.00 | $1,019.81 | $5.38 | |
| Class T | 1.37% | |||
| Actual | $1,000.00 | 886.30 | $6.50 | |
| Hypothetical-C | $1,000.00 | $1,018.25 | $6.95 | |
| Class B | 1.88% | |||
| Actual | $1,000.00 | 884.10 | $8.90 | |
| Hypothetical-C | $1,000.00 | $1,015.69 | $9.53 | |
| Class C | 1.81% | |||
| Actual | $1,000.00 | $884.40 | $8.57 | |
| Hypothetical-C | $1,000.00 | $1,016.04 | $9.17 | |
| Materials | .80% | |||
| Actual | $1,000.00 | $889.00 | $3.80 | |
| Hypothetical-C | $1,000.00 | $1,021.11 | $4.06 | |
| Class I | .78% | |||
| Actual | $1,000.00 | $889.10 | $3.70 | |
| Hypothetical-C | $1,000.00 | $1,021.22 | $3.96 | |
| Telecommunications Portfolio | ||||
| Class A | 1.16% | |||
| Actual | $1,000.00 | $938.20 | $5.65 | |
| Hypothetical-C | $1,000.00 | $1,019.30 | $5.89 | |
| Class T | 1.48% | |||
| Actual | $1,000.00 | $936.70 | $7.20 | |
| Hypothetical-C | $1,000.00 | $1,017.70 | $7.51 | |
| Class B | 1.95% | |||
| Actual | $1,000.00 | $934.60 | $9.48 | |
| Hypothetical-C | $1,000.00 | $1,015.33 | $9.88 | |
| Class C | 1.92% | |||
| Actual | $1,000.00 | $934.80 | $9.34 | |
| Hypothetical-C | $1,000.00 | $1,015.48 | $9.73 | |
| Telecommunications | .83% | |||
| Actual | $1,000.00 | $939.90 | $4.05 | |
| Hypothetical-C | $1,000.00 | $1,020.96 | $4.22 | |
| Class I | .85% | |||
| Actual | $1,000.00 | $939.80 | $4.14 | |
| Hypothetical-C | $1,000.00 | $1,020.86 | $4.32 | |
A Annualized expense ratio reflects expenses net of applicable fee waivers.
B Expenses are equal to each Class' annualized expense ratio, multiplied by the average account value over the period, multiplied by 184/ 366 (to reflect the one-half year period).
C 5% return per year before expenses
![]()
ASGMTI-SANN-1015
1.855657.108
|
Fidelity® Select Portfolios® Energy Portfolio Energy Service Portfolio Natural Gas Portfolio Natural Resources Portfolio Semi-Annual Report August 31, 2015 |
|
|
Contents
|
Energy Portfolio |
|
|
Energy Service Portfolio |
|
|
Natural Gas Portfolio |
|
|
Natural Resources Portfolio |
|
To view a fund's proxy voting guidelines and proxy voting record for the 12-month period ended June 30, visit http://www.fidelity.com/proxyvotingresults or visit the Securities and Exchange Commission's (SEC) web site at http://www.sec.gov.
You may also call 1-800-544-8544 to request a free copy of the proxy voting guidelines.
Standard & Poor's, S&P and S&P 500 are registered service marks of The McGraw-Hill Companies, Inc. and have been licensed for use by Fidelity Distributors Corporation.
Other third-party marks appearing herein are the property of their respective owners.
All other marks appearing herein are registered or unregistered trademarks or service marks of FMR LLC or an affiliated company. © 2015 FMR LLC. All rights reserved.
This report and the financial statements contained herein are submitted for the general information of the shareholders of the Funds. This report is not authorized for distribution to prospective investors in the Funds unless preceded or accompanied by an effective prospectus.
A fund files its complete schedule of portfolio holdings with the SEC for the first and third quarters of each fiscal year on Form N-Q. Forms N-Q are available on the SEC’s web site at http://www.sec.gov. A fund's Forms N-Q may be reviewed and copied at the SEC’s Public Reference Room in Washington, DC. Information regarding the operation of the SEC's Public Reference Room may be obtained by calling 1-800-SEC-0330.
For a complete list of a fund's portfolio holdings, view the most recent holdings listing, semiannual report, or annual report on Fidelity's web site at http://www.fidelity.com, http://www.advisor.fidelity.com, or http://www.401k.com, as applicable.
NOT FDIC INSURED •MAY LOSE VALUE •NO BANK GUARANTEE
Neither the Funds nor Fidelity Distributors Corporation is a bank.
Energy Portfolio
Investment Summary (Unaudited)
Top Ten Stocks as of August 31, 2015
| % of fund's net assets | % of fund's net assets 6 months ago | |
| Exxon Mobil Corp. | 13.8 | 13.1 |
| Schlumberger Ltd. | 8.4 | 8.2 |
| EOG Resources, Inc. | 6.2 | 6.1 |
| Valero Energy Corp. | 4.8 | 1.2 |
| Anadarko Petroleum Corp. | 4.3 | 5.0 |
| Newfield Exploration Co. | 4.1 | 1.8 |
| Cimarex Energy Co. | 4.1 | 4.0 |
| Chevron Corp. | 3.8 | 6.6 |
| Noble Energy, Inc. | 2.9 | 3.5 |
| Pioneer Natural Resources Co. | 2.9 | 0.9 |
| 55.3 |
Top Industries (% of fund's net assets)
| As of August 31, 2015 | ||
| Oil, Gas & Consumable Fuels | 80.7% | |
| Energy Equipment & Services | 16.5% | |
| Independent Power and Renewable Electricity Producers | 1.0% | |
| Chemicals | 0.6% | |
| All Others* | 1.2% | |

| As of February 28, 2015 | ||
| Oil, Gas & Consumable Fuels | 78.5% | |
| Energy Equipment & Services | 17.8% | |
| Independent Power and Renewable Electricity Producers | 1.0% | |
| Multi-Utilities | 0.1% | |
| All Others* | 2.6% | |

* Includes short-term investments and net other assets (liabilities).
Energy Portfolio
Investments August 31, 2015 (Unaudited)
Showing Percentage of Net Assets
| Common Stocks - 98.8% | |||
| Shares | Value | ||
| Chemicals - 0.6% | |||
| Commodity Chemicals - 0.6% | |||
| LyondellBasell Industries NV Class A | 150,300 | $12,832,614 | |
| Energy Equipment & Services - 16.5% | |||
| Oil & Gas Drilling - 0.5% | |||
| Helmerich & Payne, Inc. (a) | 78,600 | 4,638,186 | |
| Ocean Rig UDW, Inc. (United States) | 296,300 | 1,028,161 | |
| Odfjell Drilling A/S (b) | 1,539,580 | 958,480 | |
| Xtreme Drilling & Coil Services Corp. (b) | 2,252,600 | 3,082,001 | |
| 9,706,828 | |||
| Oil & Gas Equipment & Services - 16.0% | |||
| Baker Hughes, Inc. | 904,800 | 50,668,800 | |
| Cameron International Corp. (b) | 538,000 | 35,916,880 | |
| Dril-Quip, Inc. (b) | 227,674 | 15,695,846 | |
| FMC Technologies, Inc. (b) | 164,159 | 5,709,450 | |
| Frank's International NV | 771,000 | 12,575,010 | |
| Oceaneering International, Inc. | 566,227 | 24,812,067 | |
| Schlumberger Ltd. | 2,109,481 | 163,210,545 | |
| Total Energy Services, Inc. | 147,600 | 1,682,882 | |
| 310,271,480 | |||
| TOTAL ENERGY EQUIPMENT & SERVICES | 319,978,308 | ||
| Independent Power and Renewable Electricity Producers - 1.0% | |||
| Independent Power Producers & Energy Traders - 0.6% | |||
| Dynegy, Inc. (b) | 328,878 | 8,468,609 | |
| NRG Yield, Inc. Class C (a) | 237,700 | 3,817,462 | |
| 12,286,071 | |||
| Renewable Electricity - 0.4% | |||
| NextEra Energy Partners LP | 250,400 | 7,557,072 | |
| TOTAL INDEPENDENT POWER AND RENEWABLE ELECTRICITY PRODUCERS | 19,843,143 | ||
| Oil, Gas & Consumable Fuels - 80.7% | |||
| Integrated Oil & Gas - 18.5% | |||
| Chevron Corp. | 908,723 | 73,597,476 | |
| Exxon Mobil Corp. | 3,555,848 | 267,542,005 | |
| Occidental Petroleum Corp. | 204,900 | 14,959,749 | |
| Suncor Energy, Inc. | 73,200 | 2,073,147 | |
| 358,172,377 | |||
| Oil & Gas Exploration & Production - 45.6% | |||
| Anadarko Petroleum Corp. | 1,170,315 | 83,771,148 | |
| Bankers Petroleum Ltd. (b) | 1,607,000 | 2,870,515 | |
| Cabot Oil & Gas Corp. | 137,400 | 3,252,258 | |
| Canadian Natural Resources Ltd. | 292,100 | 6,583,129 | |
| Carrizo Oil & Gas, Inc. (b) | 127,500 | 4,644,825 | |
| Cimarex Energy Co. | 719,345 | 79,494,816 | |
| Concho Resources, Inc. (b) | 415,300 | 44,918,848 | |
| ConocoPhillips Co. | 230,496 | 11,328,878 | |
| Continental Resources, Inc. (b) | 412,572 | 13,243,561 | |
| Diamondback Energy, Inc. | 666,100 | 45,487,969 | |
| Encana Corp. | 2,538,600 | 18,968,104 | |
| Energen Corp. | 443,968 | 23,086,336 | |
| EOG Resources, Inc. | 1,546,164 | 121,080,103 | |
| EQT Corp. | 260,300 | 20,256,546 | |
| Evolution Petroleum Corp. | 162,543 | 954,127 | |
| Gulfport Energy Corp. (b) | 578,400 | 20,724,072 | |
| Hess Corp. | 352,400 | 20,950,180 | |
| Memorial Resource Development Corp. (b) | 2,050,800 | 39,806,028 | |
| Newfield Exploration Co. (b) | 2,397,900 | 79,874,049 | |
| Noble Energy, Inc. | 1,689,488 | 56,445,794 | |
| Northern Oil & Gas, Inc. (b) | 582,001 | 3,509,466 | |
| Parsley Energy, Inc. Class A (b) | 656,000 | 11,283,200 | |
| PDC Energy, Inc. (b) | 678,051 | 38,092,905 | |
| Peyto Exploration & Development Corp. | 112,700 | 2,671,014 | |
| Pioneer Natural Resources Co. | 449,699 | 55,339,959 | |
| QEP Resources, Inc. | 237,000 | 3,327,480 | |
| Rice Energy, Inc. (b) | 810,300 | 15,760,335 | |
| RSP Permian, Inc. (a)(b) | 389,400 | 9,322,236 | |
| SM Energy Co. | 674,300 | 24,746,810 | |
| Synergy Resources Corp. (b) | 1,989,320 | 21,365,297 | |
| TAG Oil Ltd. (b) | 1,401,975 | 1,076,311 | |
| 884,236,299 | |||
| Oil & Gas Refining & Marketing - 6.7% | |||
| Alon U.S.A. Energy, Inc. | 145,600 | 2,699,424 | |
| CVR Refining, LP | 93,434 | 1,784,589 | |
| Delek U.S. Holdings, Inc. | 26,900 | 827,444 | |
| Tesoro Corp. | 291,300 | 26,802,513 | |
| Valero Energy Corp. | 1,569,681 | 93,144,871 | |
| World Fuel Services Corp. | 123,677 | 4,780,116 | |
| 130,038,957 | |||
| Oil & Gas Storage & Transport - 9.9% | |||
| Cheniere Energy Partners LP Holdings LLC | 301,300 | 6,511,093 | |
| Cheniere Energy, Inc. (b) | 387,400 | 24,076,910 | |
| Columbia Pipeline Group, Inc. | 69,000 | 1,749,840 | |
| Columbia Pipeline Partners LP | 75,800 | 1,503,114 | |
| Dominion Midstream Partners LP | 75,155 | 2,753,679 | |
| Enable Midstream Partners LP | 119,400 | 1,853,088 | |
| Energy Transfer Equity LP | 502,300 | 14,089,515 | |
| EQT Midstream Partners LP | 85,600 | 6,659,680 | |
| Golar LNG Ltd. (a) | 498,700 | 19,419,378 | |
| Kinder Morgan, Inc. | 1,209,300 | 39,193,413 | |
| Magellan Midstream Partners LP | 91,719 | 6,472,610 | |
| MPLX LP | 138,755 | 6,885,023 | |
| ONEOK, Inc. | 108,600 | 3,910,686 | |
| Phillips 66 Partners LP | 148,233 | 9,249,739 | |
| Plains GP Holdings LP Class A | 669,000 | 13,105,710 | |
| Rice Midstream Partners LP | 324,700 | 5,445,219 | |
| SemGroup Corp. Class A | 76,100 | 4,185,500 | |
| Tallgrass Energy Partners LP | 49,000 | 2,316,720 | |
| Targa Resources Corp. | 77,390 | 5,112,383 | |
| The Williams Companies, Inc. | 343,000 | 16,532,600 | |
| 191,025,900 | |||
| TOTAL OIL, GAS& CONSUMABLE FUELS | 1,563,473,533 | ||
| TOTAL COMMON STOCKS | |||
| (Cost $2,011,476,790) | 1,916,127,598 | ||
| Money Market Funds - 2.3% | |||
| Fidelity Cash Central Fund, 0.15% (c) | 24,104,501 | 24,104,501 | |
| Fidelity Securities Lending Cash Central Fund, 0.19% (c)(d) | 19,897,450 | 19,897,450 | |
| TOTAL MONEY MARKET FUNDS | |||
| (Cost $44,001,951) | 44,001,951 | ||
| TOTAL INVESTMENT PORTFOLIO - 101.1% | |||
| (Cost $2,055,478,741) | 1,960,129,549 | ||
| NET OTHER ASSETS (LIABILITIES) - (1.1)% | (21,837,302) | ||
| NET ASSETS - 100% | $1,938,292,247 |
Legend
(a) Security or a portion of the security is on loan at period end.
(b) Non-income producing
(c) Affiliated fund that is generally available only to investment companies and other accounts managed by Fidelity Investments. The rate quoted is the annualized seven-day yield of the fund at period end. A complete unaudited listing of the fund's holdings as of its most recent quarter end is available upon request. In addition, each Fidelity Central Fund's financial statements are available on the SEC's website or upon request.
(d) Investment made with cash collateral received from securities on loan.
Affiliated Central Funds
Information regarding fiscal year to date income earned by the Fund from investments in Fidelity Central Funds is as follows:
| Fund | Income earned |
| Fidelity Cash Central Fund | $24,427 |
| Fidelity Securities Lending Cash Central Fund | 89,997 |
| Total | $114,424 |
Investment Valuation
All investments are categorized as Level 1 under the Fair Value Hierarchy. The inputs or methodology used for valuing securities may not be an indication of the risk associated with investing in those securities. For more information on valuation inputs please refer to the Investment Valuation section in the accompanying Notes to Financial Statements.
Other Information
Distribution of investments by country or territory of incorporation, as a percentage of Total Net Assets, is as follows (Unaudited):
| United States of America | 87.3% |
| Curacao | 8.4% |
| Canada | 2.0% |
| Netherlands | 1.2% |
| Bermuda | 1.0% |
| Others (Individually Less Than 1%) | 0.1% |
| 100.0% |
See accompanying notes which are an integral part of the financial statements.
Energy Portfolio
Financial Statements
Statement of Assets and Liabilities
| August 31, 2015 (Unaudited) | ||
| Assets | ||
| Investment in securities, at value (including securities loaned of $19,737,377) — See accompanying schedule: Unaffiliated issuers (cost $2,011,476,790) | $1,916,127,598 | |
| Fidelity Central Funds (cost $44,001,951) | 44,001,951 | |
| Total Investments (cost $2,055,478,741) | $1,960,129,549 | |
| Receivable for investments sold | 15,313,574 | |
| Receivable for fund shares sold | 3,561,131 | |
| Dividends receivable | 6,773,691 | |
| Distributions receivable from Fidelity Central Funds | 7,910 | |
| Prepaid expenses | 14,623 | |
| Other receivables | 95,355 | |
| Total assets | 1,985,895,833 | |
| Liabilities | ||
| Payable for investments purchased | $23,170,998 | |
| Payable for fund shares redeemed | 3,166,424 | |
| Accrued management fee | 878,056 | |
| Other affiliated payables | 403,496 | |
| Other payables and accrued expenses | 87,162 | |
| Collateral on securities loaned, at value | 19,897,450 | |
| Total liabilities | 47,603,586 | |
| Net Assets | $1,938,292,247 | |
| Net Assets consist of: | ||
| Paid in capital | $2,207,726,447 | |
| Undistributed net investment income | 12,366,158 | |
| Accumulated undistributed net realized gain (loss) on investments and foreign currency transactions | (186,450,613) | |
| Net unrealized appreciation (depreciation) on investments and assets and liabilities in foreign currencies | (95,349,745) | |
| Net Assets, for 49,347,968 shares outstanding | $1,938,292,247 | |
| Net Asset Value, offering price and redemption price per share ($1,938,292,247 ÷ 49,347,968 shares) | $39.28 |
See accompanying notes which are an integral part of the financial statements.
Statement of Operations
| Six months ended August 31, 2015 (Unaudited) | ||
| Investment Income | ||
| Dividends | $20,803,721 | |
| Income from Fidelity Central Funds | 114,424 | |
| Total income | 20,918,145 | |
| Expenses | ||
| Management fee | $5,932,558 | |
| Transfer agent fees | 2,242,848 | |
| Accounting and security lending fees | 329,926 | |
| Custodian fees and expenses | 16,709 | |
| Independent trustees' compensation | 18,569 | |
| Registration fees | 107,423 | |
| Audit | 30,198 | |
| Legal | 13,052 | |
| Miscellaneous | 16,672 | |
| Total expenses before reductions | 8,707,955 | |
| Expense reductions | (212,940) | 8,495,015 |
| Net investment income (loss) | 12,423,130 | |
| Realized and Unrealized Gain (Loss)
Net realized gain (loss) on: | ||
| Investment securities: | ||
| Unaffiliated issuers | (121,817,403) | |
| Foreign currency transactions | 148,065 | |
| Total net realized gain (loss) | (121,669,338) | |
| Change in net unrealized appreciation (depreciation) on: Investment securities | (204,159,265) | |
| Assets and liabilities in foreign currencies | 94 | |
| Total change in net unrealized appreciation (depreciation) | (204,159,171) | |
| Net gain (loss) | (325,828,509) | |
| Net increase (decrease) in net assets resulting from operations | $(313,405,379) |
See accompanying notes which are an integral part of the financial statements.
Statement of Changes in Net Assets
| Six months ended August 31, 2015 (Unaudited) | Year ended February 28, 2015 | |
| Increase (Decrease) in Net Assets | ||
| Operations | ||
| Net investment income (loss) | $12,423,130 | $19,529,338 |
| Net realized gain (loss) | (121,669,338) | 47,922,508 |
| Change in net unrealized appreciation (depreciation) | (204,159,171) | (322,616,881) |
| Net increase (decrease) in net assets resulting from operations | (313,405,379) | (255,165,035) |
| Distributions to shareholders from net investment income | (1,052,430) | (18,840,374) |
| Distributions to shareholders from net realized gain | (3,157,292) | (163,093,871) |
| Total distributions | (4,209,722) | (181,934,245) |
| Share transactions | ||
| Proceeds from sales of shares | 414,591,717 | 1,520,395,410 |
| Reinvestment of distributions | 4,056,738 | 175,944,918 |
| Cost of shares redeemed | (342,616,447) | (1,075,346,718) |
| Net increase (decrease) in net assets resulting from share transactions | 76,032,008 | 620,993,610 |
| Redemption fees | 46,952 | 126,447 |
| Total increase (decrease) in net assets | (241,536,141) | 184,020,777 |
| Net Assets | ||
| Beginning of period | 2,179,828,388 | 1,995,807,611 |
| End of period (including undistributed net investment income of $12,366,158 and undistributed net investment income of $995,458, respectively) | $1,938,292,247 | $2,179,828,388 |
| Other Information
Shares | ||
| Sold | 9,346,538 | 28,386,672 |
| Issued in reinvestment of distributions | 86,021 | 3,458,398 |
| Redeemed | (7,850,103) | (19,558,503) |
| Net increase (decrease) | 1,582,456 | 12,286,567 |
See accompanying notes which are an integral part of the financial statements.
Financial Highlights — Energy Portfolio
| Six months ended (Unaudited) | Years ended February 28, | |||||
| August 31, | 2015 | 2015 | 2014 | 2013 | 2012A | 2011 |
| Selected Per–Share Data | ||||||
| Net asset value, beginning of period | $45.64 | $56.25 | $54.81 | $55.14 | $60.22 | $43.55 |
| Income from Investment Operations | ||||||
| Net investment income (loss)B | .25 | .46 | .44 | .53 | .41 | .29 |
| Net realized and unrealized gain (loss) | (6.52) | (6.37) | 7.86 | (.04) | (5.06) | 16.63 |
| Total from investment operations | (6.27) | (5.91) | 8.30 | .49 | (4.65) | 16.92 |
| Distributions from net investment income | (.02) | (.46) | (.46) | (.47) | (.40) | (.25) |
| Distributions from net realized gain | (.07) | (4.23) | (6.40) | (.35) | (.03) | – |
| Total distributions | (.09) | (4.70)C | (6.86) | (.82) | (.43) | (.25) |
| Redemption fees added to paid in capitalB,D | – | – | – | – | – | – |
| Net asset value, end of period | $39.28 | $45.64 | $56.25 | $54.81 | $55.14 | $60.22 |
| Total ReturnE,F | (13.77)% | (11.25)% | 15.43% | 1.00% | (7.68)% | 38.95% |
| Ratios to Average Net AssetsG,H | ||||||
| Expenses before reductions | .81%I | .79% | .80% | .82% | .83% | .85% |
| Expenses net of fee waivers, if any | .80%I | .79% | .80% | .82% | .83% | .85% |
| Expenses net of all reductions | .79%I | .79% | .80% | .81% | .82% | .85% |
| Net investment income (loss) | 1.15%I | .85% | .76% | 1.04% | .77% | .64% |
| Supplemental Data | ||||||
| Net assets, end of period (000 omitted) | $1,938,292 | $2,179,828 | $1,995,808 | $2,126,992 | $2,504,448 | $3,033,023 |
| Portfolio turnover rateJ | 74%I | 73%K | 98% | 80% | 90% | 107% |
A For the year ended February 29.
B Calculated based on average shares outstanding during the period.
C Total distributions of $4.70 per share is comprised of distributions from net investment income of $.463 and distributions from net realized gain of $4.233 per share.
D Amount represents less than $.005 per share.
E Total returns for periods of less than one year are not annualized.
F Total returns would have been lower if certain expenses had not been reduced during the applicable periods shown.
G Fees and expenses of any underlying Fidelity Central Funds are not included in the Fund's expense ratio. The Fund indirectly bears its proportionate share of the expenses of any underlying Fidelity Central Funds.
H Expense ratios reflect operating expenses of the Fund. Expenses before reductions do not reflect amounts reimbursed by the investment adviser or reductions from brokerage service arrangements or reductions from other expense offset arrangements and do not represent the amount paid by the Fund during periods when reimbursements or reductions occur. Expenses net of fee waivers reflect expenses after reimbursement by the investment adviser but prior to reductions from brokerage service arrangements or other expense offset arrangements. Expenses net of all reductions represent the net expenses paid by the Fund.
I Annualized
J Amount does not include the portfolio activity of any underlying Fidelity Central Funds.
K Portfolio turnover rate excludes securities received or delivered in-kind.
See accompanying notes which are an integral part of the financial statements.
Energy Service Portfolio
Investment Summary (Unaudited)
Top Ten Stocks as of August 31, 2015
| % of fund's net assets | % of fund's net assets 6 months ago | |
| Schlumberger Ltd. | 20.9 | 19.5 |
| Baker Hughes, Inc. | 20.3 | 4.9 |
| Dril-Quip, Inc. | 8.5 | 5.9 |
| Cameron International Corp. | 5.0 | 4.8 |
| Oceaneering International, Inc. | 5.0 | 4.9 |
| National Oilwell Varco, Inc. | 4.5 | 5.5 |
| Frank's International NV | 3.9 | 3.8 |
| FMC Technologies, Inc. | 3.3 | 3.9 |
| Nabors Industries Ltd. | 3.2 | 3.5 |
| TETRA Technologies, Inc. | 2.5 | 0.8 |
| 77.1 |
Top Industries (% of fund's net assets)
| As of August 31, 2015 | ||
| Energy Equipment & Services | 93.6% | |
| Oil, Gas & Consumable Fuels | 4.5% | |
| Construction & Engineering | 0.2% | |
| All Others* | 1.7% | |

| As of February 28, 2015 | ||
| Energy Equipment & Services | 93.8% | |
| Oil, Gas & Consumable Fuels | 2.6% | |
| Construction & Engineering | 0.7% | |
| Airlines | 0.2% | |
| All Others* | 2.7% | |

* Includes short-term investments and net other assets (liabilities).
Energy Service Portfolio
Investments August 31, 2015 (Unaudited)
Showing Percentage of Net Assets
| Common Stocks - 98.3% | |||
| Shares | Value | ||
| Construction & Engineering - 0.2% | |||
| Construction & Engineering - 0.2% | |||
| Enterprise Group, Inc.(a)(b) | 4,941,887 | $1,183,258 | |
| Energy Equipment & Services - 93.6% | |||
| Oil & Gas Drilling - 10.1% | |||
| Ensco PLC Class A | 229,400 | 4,154,434 | |
| Eurasia Drilling Co. Ltd. GDR (Reg. S) | 396,800 | 4,960,000 | |
| Independence Contract Drilling, Inc. | 574,831 | 3,983,579 | |
| Nabors Industries Ltd. | 1,529,600 | 17,651,584 | |
| Ocean Rig UDW, Inc. (United States) (c) | 871,415 | 3,023,810 | |
| Odfjell Drilling A/S (c)(b) | 6,705,592 | 4,174,631 | |
| Rowan Companies PLC | 423,700 | 7,613,889 | |
| Trinidad Drilling Ltd. | 1,379,100 | 2,893,217 | |
| Xtreme Drilling & Coil Services Corp.(a)(b) | 5,585,217 | 7,641,677 | |
| 56,096,821 | |||
| Oil & Gas Equipment & Services - 83.5% | |||
| Baker Hughes, Inc. | 2,027,022 | 113,513,232 | |
| BW Offshore Ltd. | 9,050,315 | 3,391,557 | |
| C&J Energy Services Ltd. (b) | 1,109,100 | 6,144,414 | |
| Cameron International Corp. (b) | 418,288 | 27,924,907 | |
| Core Laboratories NV | 37,900 | 4,384,272 | |
| Dril-Quip, Inc. (b) | 689,300 | 47,520,342 | |
| FMC Technologies, Inc. (b) | 520,762 | 18,112,102 | |
| Forbes Energy Services Ltd.(a)(b) | 2,190,141 | 1,993,028 | |
| Frank's International NV (c) | 1,344,986 | 21,936,722 | |
| Gulfmark Offshore, Inc. Class A (c) | 592,417 | 5,349,526 | |
| Halliburton Co. | 326,934 | 12,864,853 | |
| McCoy Global, Inc. | 510,700 | 1,242,201 | |
| National Oilwell Varco, Inc. | 593,362 | 25,117,013 | |
| Oceaneering International, Inc. | 629,800 | 27,597,836 | |
| RigNet, Inc. (c)(b) | 56,600 | 1,631,778 | |
| Schlumberger Ltd. | 1,509,811 | 116,814,077 | |
| Spectrum ASA | 980,108 | 3,554,421 | |
| Superior Drilling Products, Inc.(a)(b) | 1,274,675 | 2,103,214 | |
| TETRA Technologies, Inc. (b) | 1,822,785 | 14,017,217 | |
| Weatherford International Ltd. (b) | 1,043,266 | 10,589,150 | |
| 465,801,862 | |||
| TOTAL ENERGY EQUIPMENT & SERVICES | 521,898,683 | ||
| Oil, Gas & Consumable Fuels - 4.5% | |||
| Coal & Consumable Fuels - 0.2% | |||
| Foresight Energy LP | 158,500 | 1,328,230 | |
| Oil & Gas Exploration & Production - 1.7% | |||
| Black Stone Minerals LP | 464,800 | 7,278,768 | |
| Noble Energy, Inc. | 71,000 | 2,372,110 | |
| 9,650,878 | |||
| Oil & Gas Storage & Transport - 2.6% | |||
| Golar LNG Ltd. | 73,133 | 2,847,799 | |
| StealthGas, Inc.(a)(b) | 2,344,189 | 11,463,084 | |
| 14,310,883 | |||
| TOTAL OIL, GAS & CONSUMABLE FUELS | 25,289,991 | ||
| TOTAL COMMON STOCKS | |||
| (Cost $611,717,522) | 548,371,932 | ||
| Money Market Funds - 3.8% | |||
| Fidelity Cash Central Fund, 0.15% (d) | 5,196,883 | 5,196,883 | |
| Fidelity Securities Lending Cash Central Fund, 0.19% (d)(e) | 16,036,457 | 16,036,457 | |
| TOTAL MONEY MARKET FUNDS | |||
| (Cost $21,233,340) | 21,233,340 | ||
| TOTAL INVESTMENT PORTFOLIO - 102.1% | |||
| (Cost $632,950,862) | 569,605,272 | ||
| NET OTHER ASSETS (LIABILITIES) - (2.1)% | (11,701,953) | ||
| NET ASSETS - 100% | $557,903,319 |
Legend
(a) Affiliated company
(b) Non-income producing
(c) Security or a portion of the security is on loan at period end.
(d) Affiliated fund that is generally available only to investment companies and other accounts managed by Fidelity Investments. The rate quoted is the annualized seven-day yield of the fund at period end. A complete unaudited listing of the fund's holdings as of its most recent quarter end is available upon request. In addition, each Fidelity Central Fund's financial statements are available on the SEC's website or upon request.
(e) Investment made with cash collateral received from securities on loan.
Affiliated Central Funds
Information regarding fiscal year to date income earned by the Fund from investments in Fidelity Central Funds is as follows:
| Fund | Income earned |
| Fidelity Cash Central Fund | $9,362 |
| Fidelity Securities Lending Cash Central Fund | 45,117 |
| Total | $54,479 |
Other Affiliated Issuers
An affiliated company is a company in which the Fund has ownership of at least 5% of the voting securities. Fiscal year to date transactions with companies which are or were affiliates are as follows:
| Affiliate | Value, beginning of period | Purchases | Sales Proceeds | Dividend Income | Value, end of period |
| Enterprise Group, Inc. | $3,949,532 | $202,613 | $-- | $-- | $1,183,258 |
| Forbes Energy Services Ltd. | 2,125,731 | 250,064 | -- | -- | 1,993,028 |
| StealthGas, Inc. | 15,003,472 | -- | 540,736 | -- | 11,463,084 |
| Superior Drilling Products, Inc. | 3,836,772 | -- | -- | -- | 2,103,214 |
| Vantage Drilling Co. | 6,688,897 | -- | 3,453,627 | -- | -- |
| Xtreme Drilling & Coil Services Corp. | 8,025,914 | 81,608 | -- | -- | 7,641,677 |
| Total | $39,630,318 | $534,285 | $3,994,363 | $-- | $24,384,261 |
Investment Valuation
All investments are categorized as Level 1 under the Fair Value Hierarchy. The inputs or methodology used for valuing securities may not be an indication of the risk associated with investing in those securities. For more information on valuation inputs please refer to the Investment Valuation section in the accompanying Notes to Financial Statements.
Other Information
Distribution of investments by country or territory of incorporation, as a percentage of Total Net Assets, is as follows (Unaudited):
| United States of America | 57.8% |
| Curacao | 20.9% |
| Bermuda | 6.2% |
| Netherlands | 4.7% |
| Marshall Islands | 2.6% |
| Canada | 2.3% |
| United Kingdom | 2.1% |
| Ireland | 1.9% |
| Others (Individually Less Than 1%) | 1.5% |
| 100.0% |
See accompanying notes which are an integral part of the financial statements.
Energy Service Portfolio
Financial Statements
Statement of Assets and Liabilities
| August 31, 2015 (Unaudited) | ||
| Assets | ||
| Investment in securities, at value (including securities loaned of $16,290,753) — See accompanying schedule: Unaffiliated issuers (cost $552,388,337) | $523,987,671 | |
| Fidelity Central Funds (cost $21,233,340) | 21,233,340 | |
| Other affiliated issuers (cost $59,329,185) | 24,384,261 | |
| Total Investments (cost $632,950,862) | $569,605,272 | |
| Receivable for investments sold | 9,249,769 | |
| Receivable for fund shares sold | 2,925,410 | |
| Dividends receivable | 1,481,354 | |
| Distributions receivable from Fidelity Central Funds | 23,765 | |
| Prepaid expenses | 4,188 | |
| Other receivables | 114,442 | |
| Total assets | 583,404,200 | |
| Liabilities | ||
| Payable for investments purchased | $7,590,180 | |
| Payable for fund shares redeemed | 1,444,191 | |
| Accrued management fee | 248,108 | |
| Other affiliated payables | 137,052 | |
| Other payables and accrued expenses | 44,893 | |
| Collateral on securities loaned, at value | 16,036,457 | |
| Total liabilities | 25,500,881 | |
| Net Assets | $557,903,319 | |
| Net Assets consist of: | ||
| Paid in capital | $626,320,498 | |
| Undistributed net investment income | 3,798,492 | |
| Accumulated undistributed net realized gain (loss) on investments and foreign currency transactions | (8,867,413) | |
| Net unrealized appreciation (depreciation) on investments and assets and liabilities in foreign currencies | (63,348,258) | |
| Net Assets, for 11,559,802 shares outstanding | $557,903,319 | |
| Net Asset Value, offering price and redemption price per share ($557,903,319 ÷ 11,559,802 shares) | $48.26 |
See accompanying notes which are an integral part of the financial statements.
Statement of Operations
| Six months ended August 31, 2015 (Unaudited) | ||
| Investment Income | ||
| Dividends | $6,384,785 | |
| Income from Fidelity Central Funds | 54,479 | |
| Total income | 6,439,264 | |
| Expenses | ||
| Management fee | $1,892,875 | |
| Transfer agent fees | 786,585 | |
| Accounting and security lending fees | 124,836 | |
| Custodian fees and expenses | 8,118 | |
| Independent trustees' compensation | 6,044 | |
| Registration fees | 37,269 | |
| Audit | 25,457 | |
| Legal | 4,357 | |
| Interest | 1,771 | |
| Miscellaneous | 7,710 | |
| Total expenses before reductions | 2,895,022 | |
| Expense reductions | (272,016) | 2,623,006 |
| Net investment income (loss) | 3,816,258 | |
| Realized and Unrealized Gain (Loss)
Net realized gain (loss) on: | ||
| Investment securities: | ||
| Unaffiliated issuers | 39,229,548 | |
| Other affiliated issuers | (21,363,110) | |
| Foreign currency transactions | (6,813) | |
| Total net realized gain (loss) | 17,859,625 | |
| Change in net unrealized appreciation (depreciation) on: Investment securities | (100,878,377) | |
| Assets and liabilities in foreign currencies | 81 | |
| Total change in net unrealized appreciation (depreciation) | (100,878,296) | |
| Net gain (loss) | (83,018,671) | |
| Net increase (decrease) in net assets resulting from operations | $(79,202,413) |
See accompanying notes which are an integral part of the financial statements.
Statement of Changes in Net Assets
| Six months ended August 31, 2015 (Unaudited) | Year ended February 28, 2015 | |
| Increase (Decrease) in Net Assets | ||
| Operations | ||
| Net investment income (loss) | $3,816,258 | $5,553,521 |
| Net realized gain (loss) | 17,859,625 | 54,432,568 |
| Change in net unrealized appreciation (depreciation) | (100,878,296) | (324,497,383) |
| Net increase (decrease) in net assets resulting from operations | (79,202,413) | (264,511,294) |
| Distributions to shareholders from net investment income | – | (4,379,828) |
| Distributions to shareholders from net realized gain | – | (101,072,498) |
| Total distributions | – | (105,452,326) |
| Share transactions | ||
| Proceeds from sales of shares | 129,908,624 | 353,836,305 |
| Reinvestment of distributions | – | 100,638,770 |
| Cost of shares redeemed | (191,632,875) | (433,748,150) |
| Net increase (decrease) in net assets resulting from share transactions | (61,724,251) | 20,726,925 |
| Redemption fees | 27,081 | 60,047 |
| Total increase (decrease) in net assets | (140,899,583) | (349,176,648) |
| Net Assets | ||
| Beginning of period | 698,802,902 | 1,047,979,550 |
| End of period (including undistributed net investment income of $3,798,492 and distributions in excess of net investment income of $17,766, respectively) | $557,903,319 | $698,802,902 |
| Other Information
Shares | ||
| Sold | 2,395,868 | 4,746,273 |
| Issued in reinvestment of distributions | – | 1,536,295 |
| Redeemed | (3,695,491) | (5,590,642) |
| Net increase (decrease) | (1,299,623) | 691,926 |
See accompanying notes which are an integral part of the financial statements.
Financial Highlights — Energy Service Portfolio
| Six months ended (Unaudited) | Years ended February 28, | |||||
| August 31, | 2015 | 2015 | 2014 | 2013 | 2012A | 2011 |
| Selected Per–Share Data | ||||||
| Net asset value, beginning of period | $54.34 | $86.13 | $74.01 | $73.01 | $85.88 | $58.27 |
| Income from Investment Operations | ||||||
| Net investment income (loss)B | .30 | .45 | .21 | –C | (.09) | (.04) |
| Net realized and unrealized gain (loss) | (6.38) | (23.10) | 12.09 | 1.00 | (12.79) | 27.65 |
| Total from investment operations | (6.08) | (22.65) | 12.30 | 1.00 | (12.88) | 27.61 |
| Distributions from net investment income | – | (.39) | (.18) | – | – | – |
| Distributions from net realized gain | – | (8.75) | – | – | – | – |
| Total distributions | – | (9.14) | (.18) | – | – | – |
| Redemption fees added to paid in capitalB | –C | –C | –C | –C | .01 | –C |
| Net asset value, end of period | $48.26 | $54.34 | $86.13 | $74.01 | $73.01 | $85.88 |
| Total ReturnD,E | (11.19)% | (27.82)% | 16.62% | 1.37% | (14.99)% | 47.38% |
| Ratios to Average Net AssetsF,G | ||||||
| Expenses before reductions | .84%H | .79% | .80% | .82% | .82% | .85% |
| Expenses net of fee waivers, if any | .83%H | .79% | .80% | .82% | .82% | .85% |
| Expenses net of all reductions | .76%H | .79% | .80% | .81% | .81% | .85% |
| Net investment income (loss) | 1.11%H | .56% | .26% | .01% | (.12)% | (.06)% |
| Supplemental Data | ||||||
| Net assets, end of period (000 omitted) | $557,903 | $698,803 | $1,047,980 | $1,236,403 | $1,382,288 | $2,040,691 |
| Portfolio turnover rateI | 69%H | 55% | 34% | 49% | 74% | 85% |
A For the year ended February 29.
B Calculated based on average shares outstanding during the period.
C Amount represents less than $.005 per share.
D Total returns for periods of less than one year are not annualized.
E Total returns would have been lower if certain expenses had not been reduced during the applicable periods shown.
F Fees and expenses of any underlying Fidelity Central Funds are not included in the Fund's expense ratio. The Fund indirectly bears its proportionate share of the expenses of any underlying Fidelity Central Funds.
G Expense ratios reflect operating expenses of the Fund. Expenses before reductions do not reflect amounts reimbursed by the investment adviser or reductions from brokerage service arrangements or reductions from other expense offset arrangements and do not represent the amount paid by the Fund during periods when reimbursements or reductions occur. Expenses net of fee waivers reflect expenses after reimbursement by the investment adviser but prior to reductions from brokerage service arrangements or other expense offset arrangements. Expenses net of all reductions represent the net expenses paid by the Fund.
H Annualized
I Amount does not include the portfolio activity of any underlying Fidelity Central Funds.
See accompanying notes which are an integral part of the financial statements.
Natural Gas Portfolio
Investment Summary (Unaudited)
Top Ten Stocks as of August 31, 2015
| % of fund's net assets | % of fund's net assets 6 months ago | |
| Baker Hughes, Inc. | 11.3 | 7.9 |
| Devon Energy Corp. | 8.6 | 9.0 |
| Encana Corp. | 6.6 | 6.6 |
| Schlumberger Ltd. | 5.9 | 1.2 |
| Boardwalk Pipeline Partners, LP | 5.5 | 4.5 |
| Cimarex Energy Co. | 4.9 | 2.3 |
| The Williams Companies, Inc. | 4.5 | 3.6 |
| Hess Corp. | 4.4 | 3.6 |
| Marathon Oil Corp. | 4.3 | 4.6 |
| Weatherford International Ltd. | 4.3 | 3.5 |
| 60.3 |
Top Industries (% of fund's net assets)
| As of August 31, 2015 | ||
| Oil, Gas & Consumable Fuels | 62.6% | |
| Energy Equipment & Services | 29.6% | |
| Gas Utilities | 6.3% | |
| All Others* | 1.5% | |

| As of February 28, 2015 | ||
| Oil, Gas & Consumable Fuels | 74.2% | |
| Energy Equipment & Services | 19.1% | |
| Multi-Utilities | 2.5% | |
| Gas Utilities | 1.6% | |
| All Others* | 2.6% | |

* Includes short-term investments and net other assets (liabilities).
Natural Gas Portfolio
Investments August 31, 2015 (Unaudited)
Showing Percentage of Net Assets
| Common Stocks - 98.0% | |||
| Shares | Value | ||
| Energy Equipment & Services - 29.6% | |||
| Oil & Gas Drilling - 0.5% | |||
| Archer Ltd. (a)(b) | 4,711,600 | $723,346 | |
| Pacific Drilling SA (b) | 371,400 | 742,800 | |
| Patterson-UTI Energy, Inc. | 15,000 | 244,200 | |
| 1,710,346 | |||
| Oil & Gas Equipment & Services - 29.1% | |||
| Baker Hughes, Inc. | 729,300 | 40,840,800 | |
| Cameron International Corp. (b) | 190,900 | 12,744,484 | |
| Era Group, Inc. (b) | 235,900 | 3,986,710 | |
| Forum Energy Technologies, Inc. (b) | 149,300 | 2,346,996 | |
| National Oilwell Varco, Inc. | 77,600 | 3,284,808 | |
| Oil States International, Inc. (b) | 159,900 | 4,536,363 | |
| Schlumberger Ltd. | 276,000 | 21,354,120 | |
| Superior Energy Services, Inc. | 28,600 | 455,026 | |
| Weatherford International Ltd. (b) | 1,512,900 | 15,355,935 | |
| 104,905,242 | |||
| TOTAL ENERGY EQUIPMENT & SERVICES | 106,615,588 | ||
| Gas Utilities - 6.3% | |||
| Gas Utilities - 6.3% | |||
| AGL Resources, Inc. | 131,600 | 8,026,284 | |
| Atmos Energy Corp. | 270,997 | 14,847,926 | |
| 22,874,210 | |||
| Oil, Gas & Consumable Fuels - 62.1% | |||
| Oil & Gas Exploration & Production - 51.5% | |||
| Advantage Oil & Gas Ltd. (b) | 1,070,600 | 5,964,957 | |
| Anadarko Petroleum Corp. | 131,700 | 9,427,086 | |
| Apache Corp. | 114,700 | 5,189,028 | |
| Bellatrix Exploration Ltd. (a)(b) | 1,070,200 | 2,025,538 | |
| Cabot Oil & Gas Corp. | 44,524 | 1,053,883 | |
| Chesapeake Energy Corp. (a) | 463,800 | 3,622,278 | |
| Cimarex Energy Co. | 161,000 | 17,792,110 | |
| Crew Energy, Inc. (b) | 2,291,100 | 7,784,446 | |
| Crown Point Energy, Inc. (c)(b) | 181,658 | 13,808 | |
| Devon Energy Corp. | 729,146 | 31,105,368 | |
| Emerald Oil, Inc. warrants 2/4/16 (b) | 750 | 0 | |
| Encana Corp. | 3,193,100 | 23,858,447 | |
| EQT Corp. | 120,000 | 9,338,400 | |
| Gulfport Energy Corp. (b) | 212,100 | 7,599,543 | |
| Hess Corp. | 266,200 | 15,825,590 | |
| Laredo Petroleum, Inc. (a)(b) | 134,600 | 1,371,574 | |
| Lekoil Ltd. (a)(b) | 3,774,900 | 1,013,702 | |
| Marathon Oil Corp. | 901,500 | 15,586,935 | |
| Newfield Exploration Co. (b) | 160,000 | 5,329,600 | |
| Northern Blizzard Resources, Inc. (a) | 1,438,900 | 4,921,747 | |
| Savannah Petroleum PLC (b) | 2,400,000 | 1,233,738 | |
| Surge Energy, Inc. (a) | 3,986,000 | 9,149,985 | |
| Whiting Petroleum Corp. (b) | 333,400 | 6,444,622 | |
| 185,652,385 | |||
| Oil & Gas Storage & Transport - 10.6% | |||
| Boardwalk Pipeline Partners, LP | 1,460,500 | 19,950,430 | |
| Kinder Morgan, Inc. | 62,200 | 2,015,902 | |
| The Williams Companies, Inc. | 336,000 | 16,195,200 | |
| 38,161,532 | |||
| TOTAL OIL, GAS & CONSUMABLE FUELS | 223,813,917 | ||
| TOTAL COMMON STOCKS | |||
| (Cost $546,204,259) | 353,303,715 | ||
| Principal Amount | Value | ||
| Convertible Bonds - 0.5% | |||
| Oil, Gas & Consumable Fuels - 0.5% | |||
| Oil & Gas Exploration & Production - 0.5% | |||
| American Energy Permian Holdings LLC 9% 5/1/22 pay-in-kind (Cost $7,690,902)(c)(d) | 8,000,000 | 2,000,000 | |
| Shares | Value | ||
| Money Market Funds - 5.4% | |||
| Fidelity Cash Central Fund, 0.15% (e) | 3,957,923 | 3,957,923 | |
| Fidelity Securities Lending Cash Central Fund, 0.19% (e)(f) | 15,405,065 | 15,405,065 | |
| TOTAL MONEY MARKET FUNDS | |||
| (Cost $19,362,988) | 19,362,988 | ||
| TOTAL INVESTMENT PORTFOLIO - 103.9% | |||
| (Cost $573,258,149) | 374,666,703 | ||
| NET OTHER ASSETS (LIABILITIES) - (3.9)% | (14,033,272) | ||
| NET ASSETS - 100% | $360,633,431 |
Legend
(a) Security or a portion of the security is on loan at period end.
(b) Non-income producing
(c) Security exempt from registration under Rule 144A of the Securities Act of 1933. These securities may be resold in transactions exempt from registration, normally to qualified institutional buyers. At the end of the period, the value of these securities amounted to $2,013,808 or 0.6% of net assets.
(d) Coupon rates for floating and adjustable rate securities reflect the rates in effect at period end.
(e) Affiliated fund that is generally available only to investment companies and other accounts managed by Fidelity Investments. The rate quoted is the annualized seven-day yield of the fund at period end. A complete unaudited listing of the fund's holdings as of its most recent quarter end is available upon request. In addition, each Fidelity Central Fund's financial statements are available on the SEC's website or upon request.
(f) Investment made with cash collateral received from securities on loan.
Affiliated Central Funds
Information regarding fiscal year to date income earned by the Fund from investments in Fidelity Central Funds is as follows:
| Fund | Income earned |
| Fidelity Cash Central Fund | $5,766 |
| Fidelity Securities Lending Cash Central Fund | 149,520 |
| Total | $155,286 |
Investment Valuation
The following is a summary of the inputs used, as of August 31, 2015, involving the Fund's assets and liabilities carried at fair value. The inputs or methodology used for valuing securities may not be an indication of the risk associated with investing in those securities. For more information on valuation inputs, and their aggregation into the levels used below, please refer to the Investment Valuation section in the accompanying Notes to Financial Statements.
| Valuation Inputs at Reporting Date: | ||||
| Description | Total | Level 1 | Level 2 | Level 3 |
| Investments in Securities: | ||||
| Common Stocks | $353,303,715 | $353,303,715 | $-- | $-- |
| Convertible Bonds | 2,000,000 | -- | 2,000,000 | -- |
| Money Market Funds | 19,362,988 | 19,362,988 | -- | -- |
| Total Investments in Securities: | $374,666,703 | $372,666,703 | $2,000,000 | $-- |
Other Information
Distribution of investments by country or territory of incorporation, as a percentage of Total Net Assets, is as follows (Unaudited):
| United States of America | 73.8% |
| Canada | 15.0% |
| Curacao | 5.9% |
| Ireland | 4.3% |
| Others (Individually Less Than 1%) | 1.0% |
| 100.0% |
See accompanying notes which are an integral part of the financial statements.
Natural Gas Portfolio
Financial Statements
Statement of Assets and Liabilities
| August 31, 2015 (Unaudited) | ||
| Assets | ||
| Investment in securities, at value (including securities loaned of $15,122,506) — See accompanying schedule: Unaffiliated issuers (cost $553,895,161) | $355,303,715 | |
| Fidelity Central Funds (cost $19,362,988) | 19,362,988 | |
| Total Investments (cost $573,258,149) | $374,666,703 | |
| Receivable for investments sold | 2,538,153 | |
| Receivable for fund shares sold | 531,507 | |
| Dividends receivable | 736,028 | |
| Interest receivable | 240,652 | |
| Distributions receivable from Fidelity Central Funds | 27,245 | |
| Prepaid expenses | 2,442 | |
| Other receivables | 18,133 | |
| Total assets | 378,760,863 | |
| Liabilities | ||
| Payable for investments purchased | $1,907,071 | |
| Payable for fund shares redeemed | 510,347 | |
| Accrued management fee | 161,746 | |
| Other affiliated payables | 104,431 | |
| Other payables and accrued expenses | 38,772 | |
| Collateral on securities loaned, at value | 15,405,065 | |
| Total liabilities | 18,127,432 | |
| Net Assets | $360,633,431 | |
| Net Assets consist of: | ||
| Paid in capital | $935,820,182 | |
| Undistributed net investment income | 1,597,979 | |
| Accumulated undistributed net realized gain (loss) on investments and foreign currency transactions | (378,193,653) | |
| Net unrealized appreciation (depreciation) on investments and assets and liabilities in foreign currencies | (198,591,077) | |
| Net Assets, for 14,121,461 shares outstanding | $360,633,431 | |
| Net Asset Value, offering price and redemption price per share ($360,633,431 ÷ 14,121,461 shares) | $25.54 |
See accompanying notes which are an integral part of the financial statements.
Statement of Operations
| Six months ended August 31, 2015 (Unaudited) | ||
| Investment Income | ||
| Dividends | $4,373,974 | |
| Interest | 349,878 | |
| Income from Fidelity Central Funds | 155,286 | |
| Total income | 4,879,138 | |
| Expenses | ||
| Management fee | $1,321,335 | |
| Transfer agent fees | 618,564 | |
| Accounting and security lending fees | 96,315 | |
| Custodian fees and expenses | 8,604 | |
| Independent trustees' compensation | 4,385 | |
| Registration fees | 32,462 | |
| Audit | 20,962 | |
| Legal | 3,415 | |
| Miscellaneous | 7,320 | |
| Total expenses before reductions | 2,113,362 | |
| Expense reductions | (30,603) | 2,082,759 |
| Net investment income (loss) | 2,796,379 | |
| Realized and Unrealized Gain (Loss)
Net realized gain (loss) on: | ||
| Investment securities: | ||
| Unaffiliated issuers | (37,537,071) | |
| Foreign currency transactions | (7,709) | |
| Total net realized gain (loss) | (37,544,780) | |
| Change in net unrealized appreciation (depreciation) on: Investment securities | (63,916,583) | |
| Assets and liabilities in foreign currencies | (1,720) | |
| Total change in net unrealized appreciation (depreciation) | (63,918,303) | |
| Net gain (loss) | (101,463,083) | |
| Net increase (decrease) in net assets resulting from operations | $(98,666,704) |
See accompanying notes which are an integral part of the financial statements.
Statement of Changes in Net Assets
| Six months ended August 31, 2015 (Unaudited) | Year ended February 28, 2015 | |
| Increase (Decrease) in Net Assets | ||
| Operations | ||
| Net investment income (loss) | $2,796,379 | $7,540,116 |
| Net realized gain (loss) | (37,544,780) | 41,606,525 |
| Change in net unrealized appreciation (depreciation) | (63,918,303) | (189,411,049) |
| Net increase (decrease) in net assets resulting from operations | (98,666,704) | (140,264,408) |
| Distributions to shareholders from net investment income | (1,061,279) | (6,843,809) |
| Distributions to shareholders from net realized gain | – | (835,212) |
| Total distributions | (1,061,279) | (7,679,021) |
| Share transactions | ||
| Proceeds from sales of shares | 69,118,586 | 658,709,839 |
| Reinvestment of distributions | 1,001,128 | 7,250,312 |
| Cost of shares redeemed | (140,058,519) | (828,307,919) |
| Net increase (decrease) in net assets resulting from share transactions | (69,938,805) | (162,347,768) |
| Redemption fees | 15,531 | 61,977 |
| Total increase (decrease) in net assets | (169,651,257) | (310,229,220) |
| Net Assets | ||
| Beginning of period | 530,284,688 | 840,513,908 |
| End of period (including undistributed net investment income of $1,597,979 and distributions in excess of net investment income of $137,121, respectively) | $360,633,431 | $530,284,688 |
| Other Information
Shares | ||
| Sold | 2,173,191 | 15,534,332 |
| Issued in reinvestment of distributions | 30,392 | 209,792 |
| Redeemed | (4,626,166) | (20,662,742) |
| Net increase (decrease) | (2,422,583) | (4,918,618) |
See accompanying notes which are an integral part of the financial statements.
Financial Highlights — Natural Gas Portfolio
| Six months ended (Unaudited) | Years ended February 28, | |||||
| August 31, | 2015 | 2015 | 2014 | 2013 | 2012 A | 2011 |
| Selected Per–Share Data | ||||||
| Net asset value, beginning of period | $32.05 | $39.16 | $32.86 | $32.91 | $36.50 | $31.34 |
| Income from Investment Operations | ||||||
| Net investment income (loss)B | .18 | .34 | .35 | .30 | .26 | .29C |
| Net realized and unrealized gain (loss) | (6.62) | (7.03) | 6.61 | (.03)D | (3.56) | 5.19 |
| Total from investment operations | (6.44) | (6.69) | 6.96 | .27 | (3.30) | 5.48 |
| Distributions from net investment income | (.07) | (.38) | (.33) | (.27) | (.29) | (.26) |
| Distributions from net realized gain | – | (.04) | (.32) | (.05) | – | (.06) |
| Total distributions | (.07) | (.42) | (.66)E | (.32) | (.29) | (.32) |
| Redemption fees added to paid in capitalB,F | – | – | – | – | – | – |
| Net asset value, end of period | $25.54 | $32.05 | $39.16 | $32.86 | $32.91 | $36.50 |
| Total ReturnG,H | (20.15)% | (17.15)% | 21.28% | .86%D | (9.03)% | 17.58% |
| Ratios to Average Net AssetsI,J | ||||||
| Expenses before reductions | .88%K | .82% | .84% | .87% | .86% | .89% |
| Expenses net of fee waivers, if any | .87%K | .82% | .84% | .87% | .86% | .89% |
| Expenses net of all reductions | .86%K | .82% | .84% | .86% | .86% | .88% |
| Net investment income (loss) | 1.16%K | .84% | .98% | .96% | .81% | .95%C |
| Supplemental Data | ||||||
| Net assets, end of period (000 omitted) | $360,633 | $530,285 | $840,514 | $650,073 | $743,680 | $990,083 |
| Portfolio turnover rateL | 54%K | 147%M | 135% | 107% | 63% | 167% |
A For the year ended February 29.
B Calculated based on average shares outstanding during the period.
C Investment income per share reflects a large, non-recurring dividend which amounted to $.15 per share. Excluding this non-recurring dividend, the ratio of net investment income (loss) to average net assets would have been .47%.
D Net realized and unrealized gain (loss) per share reflects proceeds received from litigation which amounted to $.03 per share. Excluding these litigation proceeds, that total return would have been 0.75%.
E Total distributions of $.66 per share is comprised of distributions from net investment income of $.332 and distributions from net realized gain of $.324 per share.
F Amount represents less than $.005 per share.
G Total returns for periods of less than one year are not annualized.
H Total returns would have been lower if certain expenses had not been reduced during the applicable periods shown.
I Fees and expenses of any underlying Fidelity Central Funds are not included in the Fund's expense ratio. The Fund indirectly bears its proportionate share of the expenses of any underlying Fidelity Central Funds.
J Expense ratios reflect operating expenses of the Fund. Expenses before reductions do not reflect amounts reimbursed by the investment adviser or reductions from brokerage service arrangements or reductions from other expense offset arrangements and do not represent the amount paid by the Fund during periods when reimbursements or reductions occur. Expenses net of fee waivers reflect expenses after reimbursement by the investment adviser but prior to reductions from brokerage service arrangements or other expense offset arrangements. Expenses net of all reductions represent the net expenses paid by the Fund.
K Annualized
L Amount does not include the portfolio activity of any underlying Fidelity Central Funds.
M Portfolio turnover rate excludes securities received or delivered in-kind.
See accompanying notes which are an integral part of the financial statements.
Natural Resources Portfolio
Investment Summary (Unaudited)
Top Ten Stocks as of August 31, 2015
| % of fund's net assets | % of fund's net assets 6 months ago | |
| Schlumberger Ltd. | 9.1 | 8.5 |
| EOG Resources, Inc. | 6.7 | 6.2 |
| Valero Energy Corp. | 5.5 | 1.4 |
| Cimarex Energy Co. | 4.4 | 4.0 |
| Anadarko Petroleum Corp. | 4.0 | 4.4 |
| Newfield Exploration Co. | 4.0 | 1.8 |
| Noble Energy, Inc. | 3.4 | 3.9 |
| WestRock Co. | 2.8 | 0.0 |
| Concho Resources, Inc. | 2.6 | 2.4 |
| Memorial Resource Development Corp. | 2.3 | 1.3 |
| 44.8 |
Top Industries (% of fund's net assets)
| As of August 31, 2015 | ||
| Oil, Gas & Consumable Fuels | 67.8% | |
| Energy Equipment & Services | 16.8% | |
| Containers & Packaging | 7.7% | |
| Metals & Mining | 5.0% | |
| Independent Power and Renewable Electricity Producers | 1.3% | |
| All Others* | 1.4% | |

| As of February 28, 2015 | ||
| Oil, Gas & Consumable Fuels | 67.8% | |
| Energy Equipment & Services | 18.4% | |
| Metals & Mining | 6.9% | |
| Containers & Packaging | 5.3% | |
| Independent Power and Renewable Electricity Producers | 1.2% | |
| All Others* | 0.4% | |

* Includes short-term investments and net other assets (liabilities).
Percentages shown as 0.0% may reflect amounts less than 0.05%.
Natural Resources Portfolio
Investments August 31, 2015 (Unaudited)
Showing Percentage of Net Assets
| Common Stocks - 99.8% | |||
| Shares | Value | ||
| Chemicals - 1.2% | |||
| Commodity Chemicals - 0.7% | |||
| LyondellBasell Industries NV Class A | 47,200 | $4,029,936 | |
| Diversified Chemicals - 0.5% | |||
| Eastman Chemical Co. | 40,400 | 2,927,384 | |
| TOTAL CHEMICALS | 6,957,320 | ||
| Containers & Packaging - 7.7% | |||
| Metal & Glass Containers - 1.7% | |||
| Ball Corp. | 152,700 | 10,064,457 | |
| Paper Packaging - 6.0% | |||
| Graphic Packaging Holding Co. | 423,200 | 5,967,120 | |
| Packaging Corp. of America | 86,300 | 5,791,593 | |
| Sealed Air Corp. | 137,700 | 7,084,665 | |
| WestRock Co. | 287,600 | 17,069,060 | |
| 35,912,438 | |||
| TOTAL CONTAINERS & PACKAGING | 45,976,895 | ||
| Energy Equipment & Services - 16.8% | |||
| Oil & Gas Drilling - 0.6% | |||
| Helmerich & Payne, Inc. (a) | 25,700 | 1,516,557 | |
| Ocean Rig UDW, Inc. (United States) (a) | 127,400 | 442,078 | |
| Odfjell Drilling A/S (b) | 701,200 | 436,539 | |
| Xtreme Drilling & Coil Services Corp. (b) | 1,009,400 | 1,381,058 | |
| 3,776,232 | |||
| Oil & Gas Equipment & Services - 16.2% | |||
| Baker Hughes, Inc. | 230,500 | 12,908,000 | |
| Cameron International Corp. (b) | 141,400 | 9,439,864 | |
| Dril-Quip, Inc. (b) | 67,600 | 4,660,344 | |
| FMC Technologies, Inc. (b) | 68,600 | 2,385,908 | |
| Frank's International NV | 189,100 | 3,084,221 | |
| Oceaneering International, Inc. | 200,700 | 8,794,674 | |
| Schlumberger Ltd. | 706,292 | 54,645,810 | |
| Total Energy Services, Inc. | 99,100 | 1,129,903 | |
| 97,048,724 | |||
| TOTAL ENERGY EQUIPMENT & SERVICES | 100,824,956 | ||
| Independent Power and Renewable Electricity Producers - 1.3% | |||
| Independent Power Producers & Energy Traders - 0.9% | |||
| Dynegy, Inc. (b) | 156,212 | 4,022,459 | |
| NRG Yield, Inc. Class C (a) | 77,500 | 1,244,650 | |
| 5,267,109 | |||
| Renewable Electricity - 0.4% | |||
| NextEra Energy Partners LP | 76,300 | 2,302,734 | |
| TOTAL INDEPENDENT POWER AND RENEWABLE ELECTRICITY PRODUCERS | 7,569,843 | ||
| Metals & Mining - 5.0% | |||
| Aluminum - 0.3% | |||
| Alcoa, Inc. | 165,900 | 1,567,755 | |
| Gold - 4.2% | |||
| AngloGold Ashanti Ltd. sponsored ADR (b) | 313,700 | 2,547,244 | |
| B2Gold Corp. (b) | 884,000 | 1,034,783 | |
| Barrick Gold Corp. | 235,400 | 1,637,207 | |
| Franco-Nevada Corp. | 116,500 | 5,047,507 | |
| Gold Fields Ltd. sponsored ADR | 608,800 | 1,966,424 | |
| Goldcorp, Inc. | 218,200 | 3,026,870 | |
| Harmony Gold Mining Co. Ltd. sponsored ADR (b) | 530,400 | 489,400 | |
| Kinross Gold Corp. (b) | 295,867 | 528,495 | |
| Randgold Resources Ltd. sponsored ADR | 116,580 | 7,028,608 | |
| Royal Gold, Inc. | 27,100 | 1,304,052 | |
| Yamana Gold, Inc. | 390,000 | 732,213 | |
| 25,342,803 | |||
| Silver - 0.5% | |||
| Pan American Silver Corp. | 128,600 | 891,198 | |
| Silver Wheaton Corp. | 186,600 | 2,287,822 | |
| 3,179,020 | |||
| TOTAL METALS & MINING | 30,089,578 | ||
| Oil, Gas & Consumable Fuels - 67.8% | |||
| Integrated Oil & Gas - 2.3% | |||
| Exxon Mobil Corp. | 110,900 | 8,344,116 | |
| Occidental Petroleum Corp. | 66,300 | 4,840,563 | |
| Suncor Energy, Inc. | 25,500 | 722,203 | |
| 13,906,882 | |||
| Oil & Gas Exploration & Production - 48.1% | |||
| Anadarko Petroleum Corp. | 337,100 | 24,129,618 | |
| Bankers Petroleum Ltd. (b) | 662,900 | 1,184,110 | |
| Cabot Oil & Gas Corp. | 63,600 | 1,505,412 | |
| Canadian Natural Resources Ltd. | 447,700 | 10,089,925 | |
| Carrizo Oil & Gas, Inc. (b) | 43,700 | 1,591,991 | |
| Cimarex Energy Co. | 240,200 | 26,544,502 | |
| Concho Resources, Inc. (b) | 144,200 | 15,596,672 | |
| ConocoPhillips Co. | 83,600 | 4,108,940 | |
| Continental Resources, Inc. (b) | 182,100 | 5,845,410 | |
| Diamondback Energy, Inc. | 182,000 | 12,428,780 | |
| Encana Corp. | 799,800 | 5,976,006 | |
| Energen Corp. | 150,500 | 7,826,000 | |
| EOG Resources, Inc. | 513,400 | 40,204,354 | |
| EQT Corp. | 54,100 | 4,210,062 | |
| Evolution Petroleum Corp. | 78,400 | 460,208 | |
| Gulfport Energy Corp. (b) | 163,750 | 5,867,163 | |
| Hess Corp. | 85,900 | 5,106,755 | |
| Memorial Resource Development Corp. (b) | 712,100 | 13,821,861 | |
| Murphy Oil Corp. | 45,200 | 1,401,200 | |
| Newfield Exploration Co. (b) | 719,600 | 23,969,876 | |
| Noble Energy, Inc. | 611,300 | 20,423,533 | |
| Northern Oil & Gas, Inc. (a)(b) | 317,795 | 1,916,304 | |
| Parsley Energy, Inc. Class A (a)(b) | 212,700 | 3,658,440 | |
| PDC Energy, Inc. (b) | 218,400 | 12,269,712 | |
| Peyto Exploration & Development Corp. | 48,500 | 1,149,460 | |
| Pioneer Natural Resources Co. | 105,600 | 12,995,136 | |
| QEP Resources, Inc. | 77,200 | 1,083,888 | |
| Rice Energy, Inc. (b) | 266,500 | 5,183,425 | |
| RSP Permian, Inc. (b) | 115,900 | 2,774,646 | |
| SM Energy Co. | 169,600 | 6,224,320 | |
| Synergy Resources Corp. (a)(b) | 687,200 | 7,380,528 | |
| TAG Oil Ltd. (b) | 615,100 | 472,219 | |
| 287,400,456 | |||
| Oil & Gas Refining & Marketing - 7.7% | |||
| Alon U.S.A. Energy, Inc. (a) | 61,900 | 1,147,626 | |
| CVR Refining, LP | 43,617 | 833,085 | |
| Tesoro Corp. | 95,800 | 8,814,558 | |
| Valero Energy Corp. | 557,400 | 33,076,116 | |
| World Fuel Services Corp. | 50,800 | 1,963,420 | |
| 45,834,805 | |||
| Oil & Gas Storage & Transport - 9.7% | |||
| Cheniere Energy Partners LP Holdings LLC | 93,400 | 2,018,374 | |
| Cheniere Energy, Inc. (b) | 100,600 | 6,252,290 | |
| Columbia Pipeline Group, Inc. | 22,100 | 560,456 | |
| Columbia Pipeline Partners LP | 27,100 | 537,393 | |
| Enable Midstream Partners LP | 53,700 | 833,424 | |
| Energy Transfer Equity LP | 158,300 | 4,440,315 | |
| EQT Midstream Partners LP | 37,700 | 2,933,060 | |
| Golar LNG Ltd. | 186,700 | 7,270,098 | |
| Kinder Morgan, Inc. | 381,800 | 12,374,138 | |
| Magellan Midstream Partners LP | 45,700 | 3,225,049 | |
| MPLX LP | 66,100 | 3,279,882 | |
| Phillips 66 Partners LP | 69,500 | 4,336,800 | |
| Plains GP Holdings LP Class A | 195,700 | 3,833,763 | |
| Rice Midstream Partners LP | 100,400 | 1,683,708 | |
| SemGroup Corp. Class A | 28,900 | 1,589,500 | |
| Tallgrass Energy Partners LP | 16,300 | 770,664 | |
| Targa Resources Corp. | 35,800 | 2,364,948 | |
| 58,303,862 | |||
| TOTAL OIL, GAS & CONSUMABLE FUELS | 405,446,005 | ||
| TOTAL COMMON STOCKS | |||
| (Cost $663,563,612) | 596,864,597 | ||
| Money Market Funds - 1.1% | |||
| Fidelity Securities Lending Cash Central Fund, 0.19% (c)(d) | |||
| (Cost $6,288,498) | 6,288,498 | 6,288,498 | |
| TOTAL INVESTMENT PORTFOLIO - 100.9% | |||
| (Cost $669,852,110) | 603,153,095 | ||
| NET OTHER ASSETS (LIABILITIES) - (0.9)% | (5,260,673) | ||
| NET ASSETS - 100% | $597,892,422 |
Legend
(a) Security or a portion of the security is on loan at period end.
(b) Non-income producing
(c) Affiliated fund that is generally available only to investment companies and other accounts managed by Fidelity Investments. The rate quoted is the annualized seven-day yield of the fund at period end. A complete unaudited listing of the fund's holdings as of its most recent quarter end is available upon request. In addition, each Fidelity Central Fund's financial statements are available on the SEC's website or upon request.
(d) Investment made with cash collateral received from securities on loan.
Affiliated Central Funds
Information regarding fiscal year to date income earned by the Fund from investments in Fidelity Central Funds is as follows:
| Fund | Income earned |
| Fidelity Cash Central Fund | $4,737 |
| Fidelity Securities Lending Cash Central Fund | 50,209 |
| Total | $54,946 |
Investment Valuation
All investments are categorized as Level 1 under the Fair Value Hierarchy. The inputs or methodology used for valuing securities may not be an indication of the risk associated with investing in those securities. For more information on valuation inputs please refer to the Investment Valuation section in the accompanying Notes to Financial Statements.
Other Information
Distribution of investments by country or territory of incorporation, as a percentage of Total Net Assets, is as follows (Unaudited):
| United States of America | 80.1% |
| Curacao | 9.1% |
| Canada | 6.2% |
| Bermuda | 1.3% |
| Netherlands | 1.2% |
| Bailiwick of Jersey | 1.2% |
| Others (Individually Less Than 1%) | 0.9% |
| 100.0% |
See accompanying notes which are an integral part of the financial statements.
Natural Resources Portfolio
Financial Statements
Statement of Assets and Liabilities
| August 31, 2015 (Unaudited) | ||
| Assets | ||
| Investment in securities, at value (including securities loaned of $6,209,787) — See accompanying schedule: Unaffiliated issuers (cost $663,563,612) | $596,864,597 | |
| Fidelity Central Funds (cost $6,288,498) | 6,288,498 | |
| Total Investments (cost $669,852,110) | $603,153,095 | |
| Receivable for investments sold | 7,482,923 | |
| Receivable for fund shares sold | 2,989,596 | |
| Dividends receivable | 1,351,550 | |
| Distributions receivable from Fidelity Central Funds | 3,508 | |
| Prepaid expenses | 4,465 | |
| Other receivables | 38,042 | |
| Total assets | 615,023,179 | |
| Liabilities | ||
| Payable to custodian bank | $3,473,991 | |
| Payable for investments purchased | 5,742,440 | |
| Payable for fund shares redeemed | 1,149,584 | |
| Accrued management fee | 275,952 | |
| Other affiliated payables | 155,323 | |
| Other payables and accrued expenses | 44,969 | |
| Collateral on securities loaned, at value | 6,288,498 | |
| Total liabilities | 17,130,757 | |
| Net Assets | $597,892,422 | |
| Net Assets consist of: | ||
| Paid in capital | $753,867,197 | |
| Undistributed net investment income | 2,655,275 | |
| Accumulated undistributed net realized gain (loss) on investments and foreign currency transactions | (91,931,104) | |
| Net unrealized appreciation (depreciation) on investments and assets and liabilities in foreign currencies | (66,698,946) | |
| Net Assets, for 22,323,131 shares outstanding | $597,892,422 | |
| Net Asset Value, offering price and redemption price per share ($597,892,422 ÷ 22,323,131 shares) | $26.78 |
See accompanying notes which are an integral part of the financial statements.
Statement of Operations
| Six months ended August 31, 2015 (Unaudited) | ||
| Investment Income | ||
| Dividends | $5,561,369 | |
| Income from Fidelity Central Funds | 54,946 | |
| Total income | 5,616,315 | |
| Expenses | ||
| Management fee | $1,947,953 | |
| Transfer agent fees | 873,685 | |
| Accounting and security lending fees | 128,017 | |
| Custodian fees and expenses | 11,808 | |
| Independent trustees' compensation | 6,262 | |
| Registration fees | 23,152 | |
| Audit | 25,645 | |
| Legal | 4,678 | |
| Miscellaneous | 6,843 | |
| Total expenses before reductions | 3,028,043 | |
| Expense reductions | (82,785) | 2,945,258 |
| Net investment income (loss) | 2,671,057 | |
| Realized and Unrealized Gain (Loss)
Net realized gain (loss) on: | ||
| Investment securities: | ||
| Unaffiliated issuers | (55,594,598) | |
| Foreign currency transactions | 49,410 | |
| Total net realized gain (loss) | (55,545,188) | |
| Change in net unrealized appreciation (depreciation) on: Investment securities | (56,198,365) | |
| Assets and liabilities in foreign currencies | 42 | |
| Total change in net unrealized appreciation (depreciation) | (56,198,323) | |
| Net gain (loss) | (111,743,511) | |
| Net increase (decrease) in net assets resulting from operations | $(109,072,454) |
See accompanying notes which are an integral part of the financial statements.
Statement of Changes in Net Assets
| Six months ended August 31, 2015 (Unaudited) | Year ended February 28, 2015 | |
| Increase (Decrease) in Net Assets | ||
| Operations | ||
| Net investment income (loss) | $2,671,057 | $5,084,685 |
| Net realized gain (loss) | (55,545,188) | 12,413,402 |
| Change in net unrealized appreciation (depreciation) | (56,198,323) | (119,536,233) |
| Net increase (decrease) in net assets resulting from operations | (109,072,454) | (102,038,146) |
| Distributions to shareholders from net investment income | – | (3,492,100) |
| Distributions to shareholders from net realized gain | – | (43,304,505) |
| Total distributions | – | (46,796,605) |
| Share transactions | ||
| Proceeds from sales of shares | 68,267,507 | 224,332,908 |
| Reinvestment of distributions | – | 44,616,027 |
| Cost of shares redeemed | (122,395,131) | (308,452,835) |
| Net increase (decrease) in net assets resulting from share transactions | (54,127,624) | (39,503,900) |
| Redemption fees | 14,637 | 22,379 |
| Total increase (decrease) in net assets | (163,185,441) | (188,316,272) |
| Net Assets | ||
| Beginning of period | 761,077,863 | 949,394,135 |
| End of period (including undistributed net investment income of $2,655,275 and distributions in excess of net investment income of $15,782, respectively) | $597,892,422 | $761,077,863 |
| Other Information
Shares | ||
| Sold | 2,257,162 | 6,084,348 |
| Issued in reinvestment of distributions | – | 1,408,837 |
| Redeemed | (4,103,244) | (8,407,605) |
| Net increase (decrease) | (1,846,082) | (914,420) |
See accompanying notes which are an integral part of the financial statements.
Financial Highlights — Natural Resources Portfolio
| Six months ended (Unaudited) | Years ended February 28, | |||||
| August 31, | 2015 | 2015 | 2014 | 2013 | 2012 A | 2011 |
| Selected Per–Share Data | ||||||
| Net asset value, beginning of period | $31.49 | $37.85 | $34.10 | $35.36 | $39.07 | $27.66 |
| Income from Investment Operations | ||||||
| Net investment income (loss)B | .11 | .21 | .20 | .28 | .20 | .12 |
| Net realized and unrealized gain (loss) | (4.82) | (4.55) | 4.52 | (1.45) | (3.59) | 11.49 |
| Total from investment operations | (4.71) | (4.34) | 4.72 | (1.17) | (3.39) | 11.61 |
| Distributions from net investment income | – | (.15) | (.10) | (.09) | (.26) | (.11) |
| Distributions from net realized gain | – | (1.87) | (.88) | – | (.06) | (.09) |
| Total distributions | – | (2.02) | (.97)C | (.09) | (.32) | (.20) |
| Redemption fees added to paid in capitalB,D | – | – | – | – | – | – |
| Net asset value, end of period | $26.78 | $31.49 | $37.85 | $34.10 | $35.36 | $39.07 |
| Total ReturnE,F | (14.96)% | (11.45)% | 13.97% | (3.30)% | (8.63)% | 42.09% |
| Ratios to Average Net AssetsG,H | ||||||
| Expenses before reductions | .85%I | .82% | .84% | .86% | .84% | .88% |
| Expenses net of fee waivers, if any | .85%I | .82% | .84% | .85% | .84% | .88% |
| Expenses net of all reductions | .83%I | .82% | .83% | .84% | .84% | .87% |
| Net investment income (loss) | .75%I | .55% | .54% | .89% | .58% | .39% |
| Supplemental Data | ||||||
| Net assets, end of period (000 omitted) | $597,892 | $761,078 | $949,394 | $1,054,528 | $1,430,581 | $1,971,764 |
| Portfolio turnover rateJ | 79%I | 87% | 99% | 76% | 88% | 113% |
A For the year ended February 29.
B Calculated based on average shares outstanding during the period.
C Total distributions of $.97 per share is comprised of distributions from net investment income of $.095 and distributions from net realized gain of $.877 per share.
D Amount represents less than $.005 per share.
E Total returns for periods of less than one year are not annualized.
F Total returns would have been lower if certain expenses had not been reduced during the applicable periods shown.
G Fees and expenses of any underlying Fidelity Central Funds are not included in the Fund's expense ratio. The Fund indirectly bears its proportionate share of the expenses of any underlying Fidelity Central Funds.
H Expense ratios reflect operating expenses of the Fund. Expenses before reductions do not reflect amounts reimbursed by the investment adviser or reductions from brokerage service arrangements or reductions from other expense offset arrangements and do not represent the amount paid by the Fund during periods when reimbursements or reductions occur. Expenses net of fee waivers reflect expenses after reimbursement by the investment adviser but prior to reductions from brokerage service arrangements or other expense offset arrangements. Expenses net of all reductions represent the net expenses paid by the Fund.
I Annualized
J Amount does not include the portfolio activity of any underlying Fidelity Central Funds.
See accompanying notes which are an integral part of the financial statements.
Notes to Financial Statements (Unaudited)
For the period ended August 31, 2015
1. Organization.
Energy Portfolio, Energy Service Portfolio, Natural Gas Portfolio and Natural Resources Portfolio (the Funds) are funds of Fidelity Select Portfolios (the Trust). Energy Portfolio, Energy Service Portfolio and Natural Gas Portfolio are non-diversified funds. The Trust is registered under the Investment Company Act of 1940, as amended (the 1940 Act), as an open-end management investment company organized as a Massachusetts business trust. The Funds invest primarily in securities of companies whose principal business activities fall within specific industries. Each Fund is authorized to issue an unlimited number of shares. Share transactions on the Statement of Changes in Net Assets may contain exchanges between funds. The Natural Resources Portfolio may also invest in certain precious metals. Certain Funds investments in emerging markets can be subject to social, economic, regulatory, and political uncertainties and can be extremely volatile.
2. Investments in Fidelity Central Funds.
The Funds invest in Fidelity Central Funds, which are open-end investment companies generally available only to other investment companies and accounts managed by the investment adviser and its affiliates. The Funds' Schedules of Investments list each of the Fidelity Central Funds held as of period end, if any, as an investment of each Fund, but do not include the underlying holdings of each Fidelity Central Fund. As an Investing Fund, each Fund indirectly bears its proportionate share of the expenses of the underlying Fidelity Central Funds.
The Money Market Central Funds seek preservation of capital and current income and are managed by Fidelity Investments Money Management, Inc. (FIMM), an affiliate of the investment adviser. Annualized expenses of the Money Market Central Funds as of their most recent shareholder report date are less than .01%.
A complete unaudited list of holdings for each Fidelity Central Fund is available upon request or at the Securities and Exchange Commission (the SEC) website at www.sec.gov. In addition, the financial statements of the Fidelity Central Funds are available on the SEC website or upon request.
3. Significant Accounting Policies.
The financial statements have been prepared in conformity with accounting principles generally accepted in the United States of America (GAAP), which require management to make certain estimates and assumptions at the date of the financial statements. Actual results could differ from those estimates. Subsequent events, if any, through the date that the financial statements were issued have been evaluated in the preparation of the financial statements. The following summarizes the significant accounting policies of the Funds:
Investment Valuation. Investments are valued as of 4:00 p.m. Eastern time on the last calendar day of the period. The Board of Trustees (the Board) has delegated the day to day responsibility for the valuation of each Fund's investments to the Fidelity SelectCo, LLC (SelectCo) Fair Value Committee (the Committee). In accordance with valuation policies and procedures approved by the Board, each Fund attempts to obtain prices from one or more third party pricing vendors or brokers to value its investments. When current market prices, quotations or currency exchange rates are not readily available or reliable, investments will be fair valued in good faith by the Committee, in accordance with procedures adopted by the Board. Factors used in determining fair value vary by investment type and may include market or investment specific events, changes in interest rates and credit quality. The frequency with which these procedures are used cannot be predicted and they may be utilized to a significant extent. The Committee oversees each Fund's valuation policies and procedures and reports to the Board on the Committee's activities and fair value determinations. The Board monitors the appropriateness of the procedures used in valuing each Fund's investments and ratifies the fair value determinations of the Committee.
Each Fund categorizes the inputs to valuation techniques used to value its investments into a disclosure hierarchy consisting of three levels as shown below:
- Level 1 – quoted prices in active markets for identical investments
- Level 2 – other significant observable inputs (including quoted prices for similar investments, interest rates, prepayment speeds, etc.)
- Level 3 – unobservable inputs (including the Fund's own assumptions based on the best information available)
Valuation techniques used to value each Fund's investments by major category are as follows:
Equity securities, including restricted securities, for which market quotations are readily available, are valued at the last reported sale price or official closing price as reported by a third party pricing vendor on the primary market or exchange on which they are traded and are categorized as Level 1 in the hierarchy. In the event there were no sales during the day or closing prices are not available, securities are valued at the last quoted bid price or may be valued using the last available price and are generally categorized as Level 2 in the hierarchy. For foreign equity securities, when market or security specific events arise, comparisons to the valuation of American Depositary Receipts (ADRs), futures contracts, Exchange-Traded Funds (ETFs) and certain indexes as well as quoted prices for similar securities may be used and would be categorized as Level 2 in the hierarchy. Utilizing these techniques may result in transfers between Level 1 and Level 2. For equity securities, including restricted securities, where observable inputs are limited, assumptions about market activity and risk are used and these securities may be categorized as Level 3 in the hierarchy.
Debt securities, including restricted securities, are valued based on evaluated prices received from third party pricing vendors or from brokers who make markets in such securities. Corporate bonds are valued by pricing vendors who utilize matrix pricing which considers yield or price of bonds of comparable quality, coupon, maturity and type or by broker-supplied prices. When independent prices are unavailable or unreliable, debt securities may be valued utilizing pricing methodologies which consider similar factors that would be used by third party pricing vendors. Debt securities are generally categorized as Level 2 in the hierarchy but may be Level 3 depending on the circumstances.
Investments in open-end mutual funds, including the Fidelity Central Funds, are valued at their closing net asset value (NAV) each business day and are categorized as Level 1 in the hierarchy.
Changes in valuation techniques may result in transfers in or out of an assigned level within the disclosure hierarchy. The aggregate value of investments by input level as of August 31, 2015 is included at the end of each applicable Fund's Schedule of Investments.
Foreign Currency. The Funds may use foreign currency contracts to facilitate transactions in foreign-denominated securities. Gains and losses from these transactions may arise from changes in the value of the foreign currency or if the counterparties do not perform under the contracts' terms.
Foreign-denominated assets, including investment securities, and liabilities are translated into U.S. dollars at the exchange rates at period end. Purchases and sales of investment securities, income and dividends received and expenses denominated in foreign currencies are translated into U.S. dollars at the exchange rate in effect on the transaction date.
The effects of exchange rate fluctuations on investments are included with the net realized and unrealized gain (loss) on investment securities. Other foreign currency transactions resulting in realized and unrealized gain (loss) are disclosed separately.
Investment Transactions and Income. For financial reporting purposes, the Funds' investment holdings and NAV include trades executed through the end of the last business day of the period. The NAV per share for processing shareholder transactions is calculated as of the close of business of the New York Stock Exchange (NYSE), normally 4:00 p.m. Eastern time and includes trades executed through the end of the prior business day. Gains and losses on securities sold are determined on the basis of identified cost and may include proceeds received from litigation. Dividend income is recorded on the ex-dividend date, except for certain dividends from foreign securities where the ex-dividend date may have passed, which are recorded as soon as the Funds are informed of the ex-dividend date. Non-cash dividends included in dividend income, if any, are recorded at the fair market value of the securities received. Income and capital gain distributions from Fidelity Central Funds, if any, are recorded on the ex-dividend date. Distributions received on securities that represent a return of capital or capital gain are recorded as a reduction of cost of investments and/or as a realized gain. Subsequent to ex-dividend date the Funds determine the components of these distributions, based upon receipt of tax filings or other correspondence relating to the underlying investment. Interest income is accrued as earned and includes coupon interest and amortization of premium and accretion of discount on debt securities as applicable. Investment income is recorded net of foreign taxes withheld where recovery of such taxes is uncertain.
Expenses. Expenses directly attributable to a fund are charged to that fund. Expenses attributable to more than one fund are allocated among the respective funds on the basis of relative net assets or other appropriate methods. Expense estimates are accrued in the period to which they relate and adjustments are made when actual amounts are known.
Deferred Trustee Compensation. Under a Deferred Compensation Plan (the Plan) for the Funds, independent Trustees may elect to defer receipt of a portion of their annual compensation. Deferred amounts are invested in a cross-section of Fidelity funds, are marked-to-market and remain in the Fund until distributed in accordance with the Plan. The investment of deferred amounts and the offsetting payable to the Trustees are included in the accompanying Statement of Assets and Liabilities.
Income Tax Information and Distributions to Shareholders. Each year, each Fund intends to qualify as a regulated investment company under Subchapter M of the Internal Revenue Code, including distributing substantially all of its taxable income and realized gains. As a result, no provision for U.S. Federal income taxes is required. Each Fund files a U.S. federal tax return, in addition to state and local tax returns as required. Each Fund's federal income tax returns are subject to examination by the Internal Revenue Service (IRS) for a period of three fiscal years after they are filed. State and local tax returns may be subject to examination for an additional fiscal year depending on the jurisdiction. Foreign taxes are provided for based on each Fund's understanding of the tax rules and rates that exist in the foreign markets in which it invests.
Distributions are declared and recorded on the ex-dividend date. Income and capital gain distributions are determined in accordance with income tax regulations, which may differ from GAAP.
Capital accounts within the financial statements are adjusted for permanent book-tax differences. These adjustments have no impact on net assets or the results of operations. Capital accounts are not adjusted for temporary book-tax differences which will reverse in a subsequent period.
Book-tax differences are primarily due to in-kind transactions, foreign currency transactions, passive foreign investment companies (PFIC), redemptions in kind, partnerships, deferred trustees compensation, market discount, capital loss carryforwards, and losses deferred due to wash sales and excise tax regulations.
The federal tax cost of investment securities and unrealized appreciation (depreciation) as of period end were as follows for each Fund:
| Tax cost | Gross unrealized appreciation | Gross unrealized depreciation | Net unrealized appreciation (depreciation) on securities | |
| Energy Portfolio | $2,072,320,958 | $166,526,316 | $(278,717,725) | $(112,191,409) |
| Energy Service Portfolio | 635,457,223 | 103,192,981 | (169,044,932) | (65,851,951) |
| Natural Gas Portfolio | 575,644,026 | 3,436,008 | (204,413,331) | (200,977,323) |
| Natural Resources Portfolio | 673,151,988 | 53,276,230 | (123,275,123) | (69,998,893) |
Capital loss carryforwards are only available to offset future capital gains of the Funds to the extent provided by regulations and may be limited. Under the Regulated Investment Company Modernization Act of 2010 (the Act), the Funds are permitted to carry forward capital losses incurred in taxable years beginning after December 22, 2010 for an unlimited period and such capital losses are required to be used prior to any losses that expire. The capital loss carryforward information presented below, including any applicable limitation, is estimated as of prior fiscal period end and is subject to adjustment.
| Fiscal year of expiration | |||
| 2018 | 2019 | Total with expiration | |
| Natural Gas Portfolio | $(60,545,261) | $(215,752,708) | $(276,297,969) |
Certain of the Funds elected to defer to the next fiscal year capital losses recognized during the period November 1, 2014 to February 28, 2015. Loss deferrals were as follows:
| Capital losses | |
| Energy Portfolio | $(58,495,599) |
| Energy Service Portfolio | (21,358,338) |
| Natural Gas Portfolio | (63,876,509) |
| Natural Resources Portfolio | (33,617,305) |
Trading (Redemption) Fees. Shares held by investors in the Funds less than 30 days may be subject to a redemption fee equal to .75% of the NAV of shares redeemed. All redemption fees, which reduce the proceeds of the shareholder redemption, are retained by the Funds and accounted for as an addition to paid in capital.
Restricted Securities. The Funds may invest in securities that are subject to legal or contractual restrictions on resale. These securities generally may be resold in transactions exempt from registration or to the public if the securities are registered. Disposal of these securities may involve time-consuming negotiations and expense, and prompt sale at an acceptable price may be difficult. Information regarding restricted securities is included at the end of each applicable Fund's Schedule of Investments.
4. Purchases and Sales of Investments.
Purchases and sales of securities, other than short-term securities, are noted in the table below.
| Purchases ($) | Sales ($) | |
| Energy Portfolio | 901,483,337 | 782,564,824 |
| Energy Service Portfolio | 232,349,393 | 281,244,419 |
| Natural Gas Portfolio | 127,974,485 | 187,446,100 |
| Natural Resources Portfolio | 276,090,018 | 325,607,353 |
5. Fees and Other Transactions with Affiliates.
Management Fee. Fidelity SelectCo, LLC (the investment adviser) and its affiliates provide the Funds with investment management related services for which the Funds pay a monthly management fee. The management fee is the sum of an individual fund fee rate and an annualized group fee rate. The individual fund fee rate is applied to each Fund's average net assets. The group fee rate is based upon the average net assets of all the mutual funds advised by Fidelity Management & Research Company (FMR) and the investment adviser. The group fee rate decreases as assets under management increase and increases as assets under management decrease. For the reporting period, each Fund's annualized management fee rate expressed as a percentage of each Fund's average net assets was as follows.
| Individual Rate | Group Rate | Total | |
| Energy Portfolio | .30% | .25% | .55% |
| Energy Service Portfolio | .30% | .25% | .55% |
| Natural Gas Portfolio | .30% | .25% | .55% |
| Natural Resources Portfolio | .30% | .25% | .55% |
Transfer Agent Fees. Fidelity Investments Institutional Operations Company, Inc. (FIIOC), an affiliate of the investment adviser, is the Funds' transfer, dividend disbursing and shareholder servicing agent. FIIOC receives account fees and asset-based fees that vary according to account size and type of account. FIIOC pays for typesetting, printing and mailing of shareholder reports, except proxy statements. For the period, transfer agent fees were equivalent to the following annualized rates expressed as a percentage of average net assets:
| Energy Portfolio | .21% |
| Energy Service Portfolio | .23% |
| Natural Gas Portfolio | .26% |
| Natural Resources Portfolio | .25% |
Accounting and Security Lending Fees. Fidelity Service Company, Inc. (FSC), an affiliate of the investment adviser, maintains each Fund's accounting records. The accounting fee is based on the level of average net assets for each month. Under a separate contract, FSC administers the security lending program. The security lending fee is based on the number and duration of lending transactions.
Brokerage Commissions. Certain Funds placed a portion of their portfolio transactions with brokerage firms which are affiliates of the investment adviser. Brokerage commissions are included in net realized gain (loss) and change in net unrealized appreciation (depreciation) in the Statement of Operations. The commissions paid to these affiliated firms were as follows:
| Amount | |
| Energy Portfolio | $13,805 |
| Energy Service Portfolio | 9,058 |
| Natural Gas Portfolio | 4,248 |
| Natural Resources Portfolio | 4,886 |
Interfund Lending Program. Pursuant to an Exemptive Order issued by the SEC, the Funds, along with other registered investment companies having management contracts with Fidelity Management & Research Company (FMR) or other affiliated entities of FMR, may participate in an interfund lending program. This program provides an alternative credit facility allowing the funds to borrow from, or lend money to, other participating affiliated funds. At period end, there were no interfund loans outstanding. Each applicable fund's activity in this program during the period for which loans were outstanding was as follows:
| Borrower or Lender | Average Loan Balance | Weighted Average Interest Rate | Interest Expense | |
| Energy Service Portfolio | Borrower | $3,484,231 | .36% | $913 |
6. Committed Line of Credit.
Certain Funds participate with other funds managed by the investment adviser or an affiliate in a $4.25 billion credit facility (the "line of credit") to be utilized for temporary or emergency purposes to fund shareholder redemptions or for other short-term liquidity purposes. The participating funds have agreed to pay commitment fees on their pro-rata portion of the line of credit, which are reflected in Miscellaneous expenses on the Statement of Operations, and are as follows:
| Energy Portfolio | $1,653 |
| Energy Service Portfolio | 550 |
| Natural Gas Portfolio | 415 |
| Natural Resources Portfolio | 576 |
During the period, the Funds did not borrow on this line of credit.
7. Security Lending.
Certain Funds lend portfolio securities through a lending agent from time to time in order to earn additional income. On the settlement date of the loan, each applicable Fund receives collateral (in the form of U.S. Treasury obligations, letters of credit and/or cash) against the loaned securities and maintains collateral in an amount not less than 100% of the market value of the loaned securities during the period of the loan. The market value of the loaned securities is determined at the close of business of the Funds and any additional required collateral is delivered to the Funds on the next business day. If the borrower defaults on its obligation to return the securities loaned because of insolvency or other reasons, the Funds may apply collateral received from the borrower against the obligation. The Funds may experience delays and costs in recovering the securities loaned. Any cash collateral received is invested in the Fidelity Securities Lending Cash Central Fund. The value of loaned securities and cash collateral at period end are disclosed on each applicable Fund's Statement of Assets and Liabilities. Security lending income represents the income earned on investing cash collateral, less rebates paid to borrowers and any lending agent fees associated with the loan, plus any premium payments received for lending certain types of securities. Security lending income is presented on each applicable Fund's Statement of Operations as a component of income from Fidelity Central Funds. Security lending activity was as follows:
| Total Security Lending Income | |
| Energy Portfolio | $89,997 |
| Energy Service Portfolio | 45,117 |
| Natural Gas Portfolio | 149,520 |
| Natural Resources Portfolio | 50,209 |
8. Bank Borrowings.
Each Fund is permitted to have bank borrowings for temporary or emergency purposes to fund shareholder redemptions or for other short-term liquidity requirements. Each Fund has established borrowing arrangements with certain banks. The interest rate on the borrowings is the bank's base rate, as revised from time to time. At period end, there were no bank borrowings outstanding. Each applicable Fund's activity in this program during the period for which loans were outstanding was as follows:
| Average Loan Balance | Weighted Average Interest Rate | Interest Expense | |
| Energy Service Portfolio | $3,490,929 | .63% | $858 |
9. Expense Reductions.
Commissions paid to certain brokers with whom the investment adviser, or its affiliates, places trades on behalf of certain Funds include an amount in addition to trade execution, which may be rebated back to the Funds to offset certain expenses. In addition, through arrangements with each applicable Fund's custodian, credits realized as a result of uninvested cash balances were used to reduce each applicable Fund's expenses. All of the applicable expense reductions are noted in the table below.
| Brokerage Service reduction | Custody expense reduction |
|
| Energy Portfolio | $153,509 | $– |
| Energy Service Portfolio | 245,039 | – |
| Natural Gas Portfolio | 11,020 | – |
| Natural Resources Portfolio | 57,889 | 14 |
In addition, during the period the investment adviser reimbursed and/or waived a portion of operating expenses as follows:
| Amount | |
| Energy Portfolio | $59,431 |
| Energy Service Portfolio | 26,977 |
| Natural Gas Portfolio | 19,583 |
| Natural Resources Portfolio | 24,882 |
10. Other.
The Funds' organizational documents provide former and current trustees and officers with a limited indemnification against liabilities arising in connection with the performance of their duties to the Funds. In the normal course of business, the Funds may also enter into contracts that provide general indemnifications. The Funds' maximum exposure under these arrangements is unknown as this would be dependent on future claims that may be made against the Funds. The risk of material loss from such claims is considered remote.
At the end of the period, the following mutual fund managed by the investment adviser or its affiliates was the owner of record of 10% or more of the total outstanding shares of the following Fund:
| Strategic Advisers Core Fund | |
| Energy Portfolio | 10% |
Mutual funds managed by the investment adviser or its affiliates, in aggregate, was the owners of record of more than 20% of the total outstanding shares of the following Fund.
| % of Shares held | |
| Energy Portfolio | 23% |
Shareholder Expense Example
As a shareholder of the Fund, you incur two types of costs: (1) transaction costs, including redemption fees and (2) ongoing costs, including management fees and other Fund expenses. This Example is intended to help you understand your ongoing costs (in dollars) of investing in the Fund and to compare these costs with the ongoing costs of investing in other mutual funds.
The Example is based on an investment of $1,000 invested at the beginning of the period and held for the entire period (March 1, 2015 to August 31, 2015).
Actual Expenses
The first line of the accompanying table for each fund provides information about actual account values and actual expenses. You may use the information in this line, together with the amount you invested, to estimate the expenses that you paid over the period. Simply divide your account value by $1,000.00 (for example, an $8,600 account value divided by $1,000.00 = 8.6), then multiply the result by the number in the first line for a fund under the heading entitled "Expenses Paid During Period" to estimate the expenses you paid on your account during this period. A small balance maintenance fee of $12.00 that is charged once a year may apply for certain accounts with a value of less than $2,000. This fee is not included in the table below. If it was, the estimate of expenses you paid during the period would be higher, and your ending account value lower, by this amount. In addition, each Fund, as a shareholder in the underlying Fidelity Central Funds, will indirectly bear its pro-rata share of the fees and expenses incurred by the underlying Fidelity Central Funds. These fees and expenses are not included in the Fund's annualized expense ratio used to calculate the expense estimate in the table below.
Hypothetical Example for Comparison Purposes
The second line of the accompanying table for each fund provides information about hypothetical account values and hypothetical expenses based on a fund's actual expense ratio and an assumed rate of return of 5% per year before expenses, which is not the Fund's actual return. The hypothetical account values and expenses may not be used to estimate the actual ending account balance or expenses you paid for the period. You may use this information to compare the ongoing costs of investing in the Fund and other funds. To do so, compare this 5% hypothetical example with the 5% hypothetical examples that appear in the shareholder reports of the other funds. A small balance maintenance fee of $12.00 that is charged once a year may apply for certain accounts with a value of less than $2,000. This fee is not included in the table below. If it was, the estimate of expenses you paid during the period would be higher, and your ending account value lower, by this amount. In addition, each Fund, as a shareholder in the underlying Fidelity Central Funds, will indirectly bear its pro-rata share of the fees and expenses incurred by the underlying Fidelity Central Funds. These fees and expenses are not included in the Fund's annualized expense ratio used to calculate the expense estimate in the table below.
Please note that the expenses shown in the table are meant to highlight your ongoing costs only and do not reflect any transaction costs. Therefore, the second line of the table is useful in comparing ongoing costs only, and will not help you determine the relative total costs of owning different funds. In addition, if these transactional costs were included, your costs would have been higher.
| Annualized Expense Ratio-A | Beginning Account Value March 1, 2015 | Ending Account Value August 31, 2015 | Expenses Paid During Period-B March 1, 2015 to August 31, 2015 |
|
| Energy Portfolio | .80% | |||
| Actual | $1,000.00 | $862.30 | $3.74 | |
| Hypothetical-C | $1,000.00 | $1,021.11 | $4.06 | |
| Energy Service Portfolio | .83% | |||
| Actual | $1,000.00 | $888.10 | $3.94 | |
| Hypothetical-C | $1,000.00 | $1,020.96 | $4.22 | |
| Natural Gas Portfolio | .87% | |||
| Actual | $1,000.00 | $798.50 | $3.93 | |
| Hypothetical-C | $1,000.00 | $1,020.76 | $4.42 | |
| Natural Resources Portfolio | .85% | |||
| Actual | $1,000.00 | $850.40 | $3.95 | |
| Hypothetical-C | $1,000.00 | $1,020.86 | $4.32 |
A Annualized expense ratio reflects expenses net of applicable fee waivers.
B Expenses are equal to each Fund's annualized expense ratio, multiplied by the average account value over the period, multiplied by 184/366 (to reflect the one-half year period).
C 5% return per year before expenses
![]()
SELNR-SANN-1015
1.813654.110
|
Fidelity® Select Portfolios® Consumer Staples Portfolio Semi-Annual Report August 31, 2015 |
|
|
Contents
To view a fund's proxy voting guidelines and proxy voting record for the 12-month period ended June 30, visit http://www.fidelity.com/proxyvotingresults or visit the Securities and Exchange Commission's (SEC) web site at http://www.sec.gov.
You may also call 1-800-544-8544 to request a free copy of the proxy voting guidelines.
Standard & Poor's, S&P and S&P 500 are registered service marks of The McGraw-Hill Companies, Inc. and have been licensed for use by Fidelity Distributors Corporation.
Other third-party marks appearing herein are the property of their respective owners.
All other marks appearing herein are registered or unregistered trademarks or service marks of FMR LLC or an affiliated company. © 2015 FMR LLC. All rights reserved.
This report and the financial statements contained herein are submitted for the general information of the shareholders of the Fund. This report is not authorized for distribution to prospective investors in the Fund unless preceded or accompanied by an effective prospectus.
A fund files its complete schedule of portfolio holdings with the SEC for the first and third quarters of each fiscal year on Form N-Q. Forms N-Q are available on the SEC’s web site at http://www.sec.gov. A fund's Forms N-Q may be reviewed and copied at the SEC’s Public Reference Room in Washington, DC. Information regarding the operation of the SEC's Public Reference Room may be obtained by calling 1-800-SEC-0330.
For a complete list of a fund's portfolio holdings, view the most recent holdings listing, semiannual report, or annual report on Fidelity's web site at http://www.fidelity.com, http://www.advisor.fidelity.com, or http://www.401k.com, as applicable.
NOT FDIC INSURED •MAY LOSE VALUE •NO BANK GUARANTEE
Neither the Fund nor Fidelity Distributors Corporation is a bank.
Investment Summary (Unaudited)
Top Ten Stocks as of August 31, 2015
| % of fund's net assets | % of fund's net assets 6 months ago | |
| British American Tobacco PLC sponsored ADR | 11.1 | 11.0 |
| CVS Health Corp. | 10.5 | 9.0 |
| Procter & Gamble Co. | 9.7 | 9.1 |
| PepsiCo, Inc. | 9.6 | 4.2 |
| Kroger Co. | 5.9 | 6.0 |
| Mead Johnson Nutrition Co. Class A | 4.7 | 4.5 |
| Altria Group, Inc. | 4.4 | 2.3 |
| Colgate-Palmolive Co. | 3.9 | 3.0 |
| Wal-Mart Stores, Inc. | 3.7 | 7.0 |
| Keurig Green Mountain, Inc. | 3.4 | 2.2 |
| 66.9 |
Top Industries (% of fund's net assets)
| As of August 31, 2015 | ||
| Food & Staples Retailing | 23.6% | |
| Beverages | 23.5% | |
| Tobacco | 20.0% | |
| Household Products | 13.7% | |
| Food Products | 13.3% | |
| All Others* | 5.9% | |

| As of February 28, 2015 | ||
| Food & Staples Retailing | 26.7% | |
| Tobacco | 19.7% | |
| Beverages | 18.8% | |
| Food Products | 16.7% | |
| Household Products | 12.3% | |
| All Others* | 5.8% | |
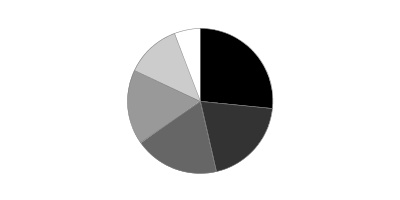
* Includes short-term investments and net other assets (liabilities).
Investments August 31, 2015 (Unaudited)
Showing Percentage of Net Assets
| Common Stocks - 99.0% | |||
| Shares | Value | ||
| Beverages - 23.4% | |||
| Brewers - 2.8% | |||
| Anheuser-Busch InBev SA NV | 343,090 | $37,420,380 | |
| SABMiller PLC | 839,084 | 39,322,522 | |
| 76,742,902 | |||
| Distillers & Vintners - 2.3% | |||
| Diageo PLC sponsored ADR | 370,226 | 39,380,940 | |
| Remy Cointreau SA (a) | 359,676 | 21,334,847 | |
| 60,715,787 | |||
| Soft Drinks - 18.3% | |||
| Coca-Cola Bottling Co. Consolidated | 120,318 | 18,556,645 | |
| Coca-Cola Central Japan Co. Ltd. | 360,900 | 6,520,314 | |
| Coca-Cola FEMSA S.A.B. de CV sponsored ADR | 58,029 | 4,178,668 | |
| Coca-Cola Icecek Sanayi A/S | 990,162 | 12,248,164 | |
| Embotelladora Andina SA: | |||
| ADR (a) | 481,227 | 7,747,755 | |
| sponsored ADR | 73,900 | 1,537,859 | |
| Fomento Economico Mexicano S.A.B. de CV sponsored ADR | 79,587 | 7,085,631 | |
| Monster Beverage Corp. (b) | 637,000 | 88,199,020 | |
| PepsiCo, Inc. | 2,777,318 | 258,096,162 | |
| The Coca-Cola Co. | 2,258,418 | 88,800,996 | |
| 492,971,214 | |||
| TOTAL BEVERAGES | 630,429,903 | ||
| Chemicals - 0.1% | |||
| Specialty Chemicals - 0.1% | |||
| Senomyx, Inc. (a)(b) | 425,655 | 2,834,862 | |
| Food & Staples Retailing - 23.6% | |||
| Drug Retail - 10.6% | |||
| CVS Health Corp. | 2,756,076 | 282,222,182 | |
| Drogasil SA | 390,400 | 4,273,608 | |
| 286,495,790 | |||
| Food Distributors - 1.2% | |||
| Chefs' Warehouse Holdings (a)(b) | 544,969 | 8,250,831 | |
| United Natural Foods, Inc. (b) | 466,581 | 22,465,875 | |
| 30,716,706 | |||
| Food Retail - 7.8% | |||
| Fresh Market, Inc. (a)(b) | 905,424 | 19,493,779 | |
| Kroger Co. | 4,603,436 | 158,818,542 | |
| Sprouts Farmers Market LLC (b) | 1,614,529 | 32,887,956 | |
| 211,200,277 | |||
| Hypermarkets & Super Centers - 4.0% | |||
| Costco Wholesale Corp. | 57,850 | 8,101,893 | |
| Wal-Mart Stores, Inc. | 1,539,056 | 99,623,095 | |
| 107,724,988 | |||
| TOTAL FOOD & STAPLES RETAILING | 636,137,761 | ||
| Food Products - 13.3% | |||
| Agricultural Products - 2.1% | |||
| Bunge Ltd. | 690,613 | 50,034,912 | |
| SLC Agricola SA | 1,290,200 | 5,724,103 | |
| 55,759,015 | |||
| Packaged Foods & Meats - 11.2% | |||
| Amplify Snack Brands, Inc. | 720,200 | 9,492,236 | |
| Blue Buffalo Pet Products, Inc. (b) | 166,842 | 4,262,813 | |
| Inner Mongoli Yili Industries Co. Ltd. | 1,610,842 | 4,069,799 | |
| Keurig Green Mountain, Inc. | 1,630,023 | 92,259,302 | |
| Lindt & Spruengli AG | 90 | 6,059,742 | |
| Mead Johnson Nutrition Co. Class A | 1,599,816 | 125,329,585 | |
| Nestle SA | 393,790 | 29,009,296 | |
| The Hain Celestial Group, Inc. (b) | 407,478 | 24,799,111 | |
| Ulker Biskuvi Sanayi A/S | 1,010,525 | 6,215,303 | |
| 301,497,187 | |||
| TOTAL FOOD PRODUCTS | 357,256,202 | ||
| Health Care Providers & Services - 0.1% | |||
| Health Care Services - 0.1% | |||
| Diplomat Pharmacy, Inc. | 42,900 | 1,694,121 | |
| Hotels, Restaurants & Leisure - 1.6% | |||
| Restaurants - 1.6% | |||
| ARAMARK Holdings Corp. | 1,342,628 | 42,077,962 | |
| Household Durables - 0.3% | |||
| Household Appliances - 0.2% | |||
| SodaStream International Ltd. (a)(b) | 389,815 | 5,940,781 | |
| Housewares & Specialties - 0.1% | |||
| Tupperware Brands Corp. | 73,000 | 3,739,790 | |
| TOTAL HOUSEHOLD DURABLES | 9,680,571 | ||
| Household Products - 13.7% | |||
| Household Products - 13.7% | |||
| Colgate-Palmolive Co. | 1,668,275 | 104,784,353 | |
| Procter & Gamble Co. | 3,718,365 | 262,776,855 | |
| Svenska Cellulosa AB (SCA) (B Shares) | 70,800 | 2,018,795 | |
| 369,580,003 | |||
| Personal Products - 2.9% | |||
| Personal Products - 2.9% | |||
| Avon Products, Inc. (a) | 1,426,500 | 7,403,535 | |
| Coty, Inc. Class A | 234,200 | 7,098,602 | |
| Herbalife Ltd. (b) | 440,010 | 25,331,376 | |
| L'Oreal SA | 116,700 | 19,996,814 | |
| Nu Skin Enterprises, Inc. Class A (a) | 257,967 | 11,783,933 | |
| Unilever NV (NY Reg.) | 167,698 | 6,728,044 | |
| 78,342,304 | |||
| Pharmaceuticals - 0.0% | |||
| Pharmaceuticals - 0.0% | |||
| Perrigo Co. PLC | 7,200 | 1,317,384 | |
| Tobacco - 20.0% | |||
| Tobacco - 20.0% | |||
| Altria Group, Inc. | 2,222,045 | 119,057,171 | |
| British American Tobacco PLC sponsored ADR | 2,807,765 | 297,566,931 | |
| ITC Ltd. | 1,820,070 | 8,920,419 | |
| Philip Morris International, Inc. | 593,358 | 47,349,968 | |
| Reynolds American, Inc. | 671,600 | 56,246,500 | |
| Souza Cruz SA | 1,264,000 | 9,250,013 | |
| 538,391,002 | |||
| TOTAL COMMON STOCKS | |||
| (Cost $2,192,411,429) | 2,667,742,075 | ||
| Nonconvertible Preferred Stocks - 0.1% | |||
| Beverages - 0.1% | |||
| Brewers - 0.1% | |||
| Ambev SA sponsored ADR | |||
| (Cost $1,095,710) | 467,510 | 2,463,778 | |
| Money Market Funds - 1.9% | |||
| Fidelity Cash Central Fund, 0.15% (c) | 21,104,995 | 21,104,995 | |
| Fidelity Securities Lending Cash Central Fund, 0.19% (c)(d) | 29,388,738 | 29,388,738 | |
| TOTAL MONEY MARKET FUNDS | |||
| (Cost $50,493,733) | 50,493,733 | ||
| TOTAL INVESTMENT PORTFOLIO - 101.0% | |||
| (Cost $2,244,000,872) | 2,720,699,586 | ||
| NET OTHER ASSETS (LIABILITIES) - (1.0)% | (26,833,561) | ||
| NET ASSETS - 100% | $2,693,866,025 |
Legend
(a) Security or a portion of the security is on loan at period end.
(b) Non-income producing
(c) Affiliated fund that is generally available only to investment companies and other accounts managed by Fidelity Investments. The rate quoted is the annualized seven-day yield of the fund at period end. A complete unaudited listing of the fund's holdings as of its most recent quarter end is available upon request. In addition, each Fidelity Central Fund's financial statements are available on the SEC's website or upon request.
(d) Investment made with cash collateral received from securities on loan.
Affiliated Central Funds
Information regarding fiscal year to date income earned by the Fund from investments in Fidelity Central Funds is as follows:
| Fund | Income earned |
| Fidelity Cash Central Fund | $40,101 |
| Fidelity Securities Lending Cash Central Fund | 140,230 |
| Total | $180,331 |
Investment Valuation
The following is a summary of the inputs used, as of August 31, 2015, involving the Fund's assets and liabilities carried at fair value. The inputs or methodology used for valuing securities may not be an indication of the risk associated with investing in those securities. For more information on valuation inputs, and their aggregation into the levels used below, please refer to the Investment Valuation section in the accompanying Notes to Financial Statements.
| Valuation Inputs at Reporting Date: | ||||
| Description | Total | Level 1 | Level 2 | Level 3 |
| Investments in Securities: | ||||
| Common Stocks | $2,667,742,075 | $2,594,792,085 | $72,949,990 | $-- |
| Nonconvertible Preferred Stocks | 2,463,778 | 2,463,778 | -- | -- |
| Money Market Funds | 50,493,733 | 50,493,733 | -- | -- |
| Total Investments in Securities: | $2,720,699,586 | $2,647,749,596 | $72,949,990 | $-- |
Other Information
Distribution of investments by country or territory of incorporation, as a percentage of Total Net Assets, is as follows (Unaudited):
| United States of America | 75.7% |
| United Kingdom | 14.0% |
| Bermuda | 1.9% |
| France | 1.5% |
| Belgium | 1.4% |
| Switzerland | 1.3% |
| Others (Individually Less Than 1%) | 4.2% |
| 100.0% |
See accompanying notes which are an integral part of the financial statements.
Financial Statements
Statement of Assets and Liabilities
| August 31, 2015 (Unaudited) | ||
| Assets | ||
| Investment in securities, at value (including securities loaned of $28,785,296) — See accompanying schedule: Unaffiliated issuers (cost $2,193,507,139) | $2,670,205,853 | |
| Fidelity Central Funds (cost $50,493,733) | 50,493,733 | |
| Total Investments (cost $2,244,000,872) | $2,720,699,586 | |
| Receivable for investments sold | 5,391,290 | |
| Receivable for fund shares sold | 3,120,282 | |
| Dividends receivable | 8,251,366 | |
| Distributions receivable from Fidelity Central Funds | 36,075 | |
| Prepaid expenses | 21,709 | |
| Other receivables | 81,452 | |
| Total assets | 2,737,601,760 | |
| Liabilities | ||
| Payable for investments purchased | $8,063,869 | |
| Payable for fund shares redeemed | 4,069,059 | |
| Accrued management fee | 1,289,040 | |
| Distribution and service plan fees payable | 314,728 | |
| Other affiliated payables | 500,944 | |
| Other payables and accrued expenses | 109,357 | |
| Collateral on securities loaned, at value | 29,388,738 | |
| Total liabilities | 43,735,735 | |
| Net Assets | $2,693,866,025 | |
| Net Assets consist of: | ||
| Paid in capital | $2,103,937,906 | |
| Undistributed net investment income | 29,254,409 | |
| Accumulated undistributed net realized gain (loss) on investments and foreign currency transactions | 83,993,911 | |
| Net unrealized appreciation (depreciation) on investments and assets and liabilities in foreign currencies | 476,679,799 | |
| Net Assets | $2,693,866,025 | |
| Calculation of Maximum Offering Price | ||
| Class A: | ||
| Net Asset Value and redemption price per share ($392,461,247 ÷ 4,444,616 shares) | $88.30 | |
| Maximum offering price per share (100/94.25 of $88.30) | $93.69 | |
| Class T: | ||
| Net Asset Value and redemption price per share ($69,027,907 ÷ 788,204 shares) | $87.58 | |
| Maximum offering price per share (100/96.50 of $87.58) | $90.76 | |
| Class B: | ||
| Net Asset Value and offering price per share ($10,629,683 ÷ 122,152 shares)(a) | $87.02 | |
| Class C: | ||
| Net Asset Value and offering price per share ($219,219,473 ÷ 2,542,393 shares)(a) | $86.23 | |
| Consumer Staples: | ||
| Net Asset Value, offering price and redemption price per share ($1,833,149,595 ÷ 20,591,131 shares) | $89.03 | |
| Class I: | ||
| Net Asset Value, offering price and redemption price per share ($169,378,120 ÷ 1,905,167 shares) | $88.90 |
(a) Redemption price per share is equal to net asset value less any applicable contingent deferred sales charge.
See accompanying notes which are an integral part of the financial statements.
Statement of Operations
| Six months ended August 31, 2015 (Unaudited) | ||
| Investment Income | ||
| Dividends | $42,300,928 | |
| Interest | 10 | |
| Income from Fidelity Central Funds | 180,331 | |
| Total income | 42,481,269 | |
| Expenses | ||
| Management fee | $8,030,301 | |
| Transfer agent fees | 2,664,655 | |
| Distribution and service plan fees | 1,927,652 | |
| Accounting and security lending fees | 434,955 | |
| Custodian fees and expenses | 48,588 | |
| Independent trustees' compensation | 25,230 | |
| Registration fees | 150,698 | |
| Audit | 31,998 | |
| Legal | 18,552 | |
| Miscellaneous | 16,078 | |
| Total expenses before reductions | 13,348,707 | |
| Expense reductions | (167,966) | 13,180,741 |
| Net investment income (loss) | 29,300,528 | |
| Realized and Unrealized Gain (Loss)
Net realized gain (loss) on: | ||
| Investment securities: | ||
| Unaffiliated issuers | 92,999,124 | |
| Foreign currency transactions | (32,263) | |
| Total net realized gain (loss) | 92,966,861 | |
| Change in net unrealized appreciation (depreciation) on: Investment securities (net of decrease in deferred foreign taxes of $18,850) | (419,060,852) | |
| Assets and liabilities in foreign currencies | 6,754 | |
| Total change in net unrealized appreciation (depreciation) | (419,054,098) | |
| Net gain (loss) | (326,087,237) | |
| Net increase (decrease) in net assets resulting from operations | $(296,786,709) |
See accompanying notes which are an integral part of the financial statements.
Statement of Changes in Net Assets
| Six months ended August 31, 2015 (Unaudited) | Year ended February 28, 2015 | |
| Increase (Decrease) in Net Assets | ||
| Operations | ||
| Net investment income (loss) | $29,300,528 | $40,432,818 |
| Net realized gain (loss) | 92,966,861 | 155,658,969 |
| Change in net unrealized appreciation (depreciation) | (419,054,098) | 315,382,310 |
| Net increase (decrease) in net assets resulting from operations | (296,786,709) | 511,474,097 |
| Distributions to shareholders from net investment income | (5,994,066) | (39,618,532) |
| Distributions to shareholders from net realized gain | (95,685,262) | (102,399,285) |
| Total distributions | (101,679,328) | (142,017,817) |
| Share transactions - net increase (decrease) | (19,783,740) | 686,786,861 |
| Redemption fees | 18,425 | 51,833 |
| Total increase (decrease) in net assets | (418,231,352) | 1,056,294,974 |
| Net Assets | ||
| Beginning of period | 3,112,097,377 | 2,055,802,403 |
| End of period (including undistributed net investment income of $29,254,409 and undistributed net investment income of $5,947,947, respectively) | $2,693,866,025 | $3,112,097,377 |
See accompanying notes which are an integral part of the financial statements.
Financial Highlights — Consumer Staples Portfolio Class A
| Six months ended (Unaudited) | Years ended February 28, | |||||
| August 31, | 2015 | 2015 | 2014 | 2013 | 2012A | 2011 |
| Selected Per–Share Data | ||||||
| Net asset value, beginning of period | $101.33 | $87.93 | $85.67 | $74.90 | $67.65 | $61.06 |
| Income from Investment Operations | ||||||
| Net investment income (loss)B | .89 | 1.37 | 1.43 | 1.26 | 1.22 | .98 |
| Net realized and unrealized gain (loss) | (10.59) | 17.28 | 7.51 | 11.73 | 8.73 | 7.10 |
| Total from investment operations | (9.70) | 18.65 | 8.94 | 12.99 | 9.95 | 8.08 |
| Distributions from net investment income | (.18) | (1.28) | (1.44) | (1.08) | (1.06) | (.83) |
| Distributions from net realized gain | (3.15) | (3.98) | (5.24) | (1.14) | (1.64) | (.66) |
| Total distributions | (3.33) | (5.25)C | (6.68) | (2.22) | (2.70) | (1.49) |
| Redemption fees added to paid in capitalB,D | – | – | – | – | – | – |
| Net asset value, end of period | $88.30 | $101.33 | $87.93 | $85.67 | $74.90 | $67.65 |
| Total ReturnE,F,G | (9.87)% | 21.95% | 10.53% | 17.60% | 15.00% | 13.27% |
| Ratios to Average Net AssetsH,I | ||||||
| Expenses before reductions | 1.04%J | 1.05% | 1.06% | 1.08% | 1.10% | 1.11% |
| Expenses net of fee waivers, if any | 1.04%J | 1.05% | 1.06% | 1.08% | 1.10% | 1.11% |
| Expenses net of all reductions | 1.04%J | 1.05% | 1.06% | 1.08% | 1.09% | 1.11% |
| Net investment income (loss) | 1.86%J | 1.45% | 1.61% | 1.58% | 1.74% | 1.53% |
| Supplemental Data | ||||||
| Net assets, end of period (000 omitted) | $392,461 | $414,151 | $329,459 | $277,329 | $205,851 | $160,526 |
| Portfolio turnover rateK | 61%J | 42%L | 31% | 28% | 35% | 57% |
A For the year ended February 29.
B Calculated based on average shares outstanding during the period.
C Total distributions of $5.25 per share is comprised of distributions from net investment income of $1.275 and distributions from net realized gain of $3.976 per share.
D Amount represents less than $.005 per share.
E Total returns for periods of less than one year are not annualized.
F Total returns would have been lower if certain expenses had not been reduced during the applicable periods shown.
G Total returns do not include the effect of the sales charges.
H Fees and expenses of any underlying Fidelity Central Funds are not included in the Fund's expense ratio. The Fund indirectly bears its proportionate share of the expenses of any underlying Fidelity Central Funds.
I Expense ratios reflect operating expenses of the class. Expenses before reductions do not reflect amounts reimbursed by the investment adviser or reductions from brokerage service arrangements or reductions from other expense offset arrangements and do not represent the amount paid by the class during periods when reimbursements or reductions occur. Expenses net of fee waivers reflect expenses after reimbursement by the investment adviser but prior to reductions from brokerage service arrangements or other expense offset arrangements. Expenses net of all reductions represent the net expenses paid by the class.
J Annualized
K Amount does not include the portfolio activity of any underlying Fidelity Central Funds.
L Portfolio turnover rate excludes securities received or delivered in-kind.
See accompanying notes which are an integral part of the financial statements.
Financial Highlights — Consumer Staples Portfolio Class T
| Six months ended (Unaudited) | Years ended February 28, | |||||
| August 31, | 2015 | 2015 | 2014 | 2013 | 2012A | 2011 |
| Selected Per–Share Data | ||||||
| Net asset value, beginning of period | $100.61 | $87.37 | $85.18 | $74.49 | $67.30 | $60.77 |
| Income from Investment Operations | ||||||
| Net investment income (loss)B | .75 | 1.10 | 1.18 | 1.03 | 1.01 | .79 |
| Net realized and unrealized gain (loss) | (10.49) | 17.15 | 7.46 | 11.68 | 8.68 | 7.05 |
| Total from investment operations | (9.74) | 18.25 | 8.64 | 12.71 | 9.69 | 7.84 |
| Distributions from net investment income | (.13) | (1.04) | (1.21) | (.88) | (.86) | (.65) |
| Distributions from net realized gain | (3.15) | (3.98) | (5.24) | (1.14) | (1.64) | (.66) |
| Total distributions | (3.29)C | (5.01)D | (6.45) | (2.02) | (2.50) | (1.31) |
| Redemption fees added to paid in capitalB,E | – | – | – | – | – | – |
| Net asset value, end of period | $87.58 | $100.61 | $87.37 | $85.18 | $74.49 | $67.30 |
| Total ReturnF,G,H | (9.99)% | 21.60% | 10.23% | 17.29% | 14.67% | 12.93% |
| Ratios to Average Net AssetsI,J | ||||||
| Expenses before reductions | 1.32%K | 1.32% | 1.33% | 1.36% | 1.38% | 1.40% |
| Expenses net of fee waivers, if any | 1.32%K | 1.32% | 1.33% | 1.36% | 1.38% | 1.40% |
| Expenses net of all reductions | 1.31%K | 1.32% | 1.33% | 1.35% | 1.38% | 1.40% |
| Net investment income (loss) | 1.59%K | 1.18% | 1.34% | 1.30% | 1.45% | 1.24% |
| Supplemental Data | ||||||
| Net assets, end of period (000 omitted) | $69,028 | $81,489 | $61,421 | $52,024 | $39,047 | $31,496 |
| Portfolio turnover rateL | 61%K | 42%M | 31% | 28% | 35% | 57% |
A For the year ended February 29.
B Calculated based on average shares outstanding during the period.
C Total distributions of $3.29 per share is comprised of distributions from net investment income of $.134 and distributions from net realized gain of $3.152 per share.
D Total distributions of $5.01 per share is comprised of distributions from net investment income of $1.036 and distributions from net realized gain of $3.976 per share.
E Amount represents less than $.005 per share.
F Total returns for periods of less than one year are not annualized.
G Total returns would have been lower if certain expenses had not been reduced during the applicable periods shown.
H Total returns do not include the effect of the sales charges.
I Fees and expenses of any underlying Fidelity Central Funds are not included in the Fund's expense ratio. The Fund indirectly bears its proportionate share of the expenses of any underlying Fidelity Central Funds.
J Expense ratios reflect operating expenses of the class. Expenses before reductions do not reflect amounts reimbursed by the investment adviser or reductions from brokerage service arrangements or reductions from other expense offset arrangements and do not represent the amount paid by the class during periods when reimbursements or reductions occur. Expenses net of fee waivers reflect expenses after reimbursement by the investment adviser but prior to reductions from brokerage service arrangements or other expense offset arrangements. Expenses net of all reductions represent the net expenses paid by the class.
K Annualized
L Amount does not include the portfolio activity of any underlying Fidelity Central Funds.
M Portfolio turnover rate excludes securities received or delivered in-kind.
See accompanying notes which are an integral part of the financial statements.
Financial Highlights — Consumer Staples Portfolio Class B
| Six months ended (Unaudited) | Years ended February 28, | |||||
| August 31, | 2015 | 2015 | 2014 | 2013 | 2012A | 2011 |
| Selected Per–Share Data | ||||||
| Net asset value, beginning of period | $100.13 | $86.90 | $84.72 | $74.01 | $66.83 | $60.37 |
| Income from Investment Operations | ||||||
| Net investment income (loss)B | .52 | .63 | .71 | .61 | .64 | .46 |
| Net realized and unrealized gain (loss) | (10.44) | 17.06 | 7.40 | 11.61 | 8.61 | 6.98 |
| Total from investment operations | (9.92) | 17.69 | 8.11 | 12.22 | 9.25 | 7.44 |
| Distributions from net investment income | (.03) | (.48) | (.69) | (.37) | (.43) | (.32) |
| Distributions from net realized gain | (3.15) | (3.98) | (5.24) | (1.14) | (1.64) | (.66) |
| Total distributions | (3.19)C | (4.46) | (5.93) | (1.51) | (2.07) | (.98) |
| Redemption fees added to paid in capitalB,D | – | – | – | – | – | – |
| Net asset value, end of period | $87.02 | $100.13 | $86.90 | $84.72 | $74.01 | $66.83 |
| Total ReturnE,F,G | (10.21)% | 21.01% | 9.63% | 16.68% | 14.06% | 12.35% |
| Ratios to Average Net AssetsH,I | ||||||
| Expenses before reductions | 1.81%J | 1.82% | 1.86% | 1.89% | 1.91% | 1.91% |
| Expenses net of fee waivers, if any | 1.81%J | 1.82% | 1.86% | 1.89% | 1.91% | 1.91% |
| Expenses net of all reductions | 1.80%J | 1.82% | 1.86% | 1.88% | 1.90% | 1.91% |
| Net investment income (loss) | 1.10%J | .68% | .81% | .78% | .93% | .73% |
| Supplemental Data | ||||||
| Net assets, end of period (000 omitted) | $10,630 | $15,799 | $17,388 | $18,548 | $19,330 | $20,033 |
| Portfolio turnover rateK | 61%J | 42%L | 31% | 28% | 35% | 57% |
A For the year ended February 29.
B Calculated based on average shares outstanding during the period.
C Total distributions of $3.19 per share is comprised of distributions from net investment income of $.033 and distributions from net realized gain of $3.152 per share.
D Amount represents less than $.005 per share.
E Total returns for periods of less than one year are not annualized.
F Total returns would have been lower if certain expenses had not been reduced during the applicable periods shown.
G Total returns do not include the effect of the contingent deferred sales charge.
H Fees and expenses of any underlying Fidelity Central Funds are not included in the Fund's expense ratio. The Fund indirectly bears its proportionate share of the expenses of any underlying Fidelity Central Funds.
I Expense ratios reflect operating expenses of the class. Expenses before reductions do not reflect amounts reimbursed by the investment adviser or reductions from brokerage service arrangements or reductions from other expense offset arrangements and do not represent the amount paid by the class during periods when reimbursements or reductions occur. Expenses net of fee waivers reflect expenses after reimbursement by the investment adviser but prior to reductions from brokerage service arrangements or other expense offset arrangements. Expenses net of all reductions represent the net expenses paid by the class.
J Annualized
K Amount does not include the portfolio activity of any underlying Fidelity Central Funds.
L Portfolio turnover rate excludes securities received or delivered in-kind.
See accompanying notes which are an integral part of the financial statements.
Financial Highlights — Consumer Staples Portfolio Class C
| Six months ended (Unaudited) | Years ended February 28, | |||||
| August 31, | 2015 | 2015 | 2014 | 2013 | 2012A | 2011 |
| Selected Per–Share Data | ||||||
| Net asset value, beginning of period | $99.27 | $86.32 | $84.28 | $73.75 | $66.71 | $60.29 |
| Income from Investment Operations | ||||||
| Net investment income (loss)B | .52 | .65 | .75 | .65 | .68 | .49 |
| Net realized and unrealized gain (loss) | (10.34) | 16.93 | 7.36 | 11.55 | 8.59 | 7.00 |
| Total from investment operations | (9.82) | 17.58 | 8.11 | 12.20 | 9.27 | 7.49 |
| Distributions from net investment income | (.06) | (.65) | (.84) | (.53) | (.59) | (.41) |
| Distributions from net realized gain | (3.15) | (3.98) | (5.24) | (1.14) | (1.64) | (.66) |
| Total distributions | (3.22)C | (4.63) | (6.07)D | (1.67) | (2.23) | (1.07) |
| Redemption fees added to paid in capitalB,E | – | – | – | – | – | – |
| Net asset value, end of period | $86.23 | $99.27 | $86.32 | $84.28 | $73.75 | $66.71 |
| Total ReturnF,G,H | (10.20)% | 21.03% | 9.70% | 16.73% | 14.14% | 12.44% |
| Ratios to Average Net AssetsI,J | ||||||
| Expenses before reductions | 1.80%K | 1.80% | 1.82% | 1.83% | 1.85% | 1.86% |
| Expenses net of fee waivers, if any | 1.80%K | 1.80% | 1.82% | 1.83% | 1.85% | 1.86% |
| Expenses net of all reductions | 1.79%K | 1.80% | 1.81% | 1.82% | 1.84% | 1.85% |
| Net investment income (loss) | 1.11%K | .70% | .85% | .83% | .99% | .79% |
| Supplemental Data | ||||||
| Net assets, end of period (000 omitted) | $219,219 | $228,151 | $164,669 | $134,966 | $102,321 | $81,239 |
| Portfolio turnover rateL | 61%K | 42%M | 31% | 28% | 35% | 57% |
A For the year ended February 29.
B Calculated based on average shares outstanding during the period.
C Total distributions of $3.22 per share is comprised of distributions from net investment income of $.064 and distributions from net realized gain of $3.152 per share.
D Total distributions of $6.07 per share is comprised of distributions from net investment income of $.837 and distributions from net realized gain of $5.237 per share.
E Amount represents less than $.005 per share.
F Total returns for periods of less than one year are not annualized.
G Total returns would have been lower if certain expenses had not been reduced during the applicable periods shown.
H Total returns do not include the effect of the contingent deferred sales charge.
I Fees and expenses of any underlying Fidelity Central Funds are not included in the Fund's expense ratio. The Fund indirectly bears its proportionate share of the expenses of any underlying Fidelity Central Funds.
J Expense ratios reflect operating expenses of the class. Expenses before reductions do not reflect amounts reimbursed by the investment adviser or reductions from brokerage service arrangements or reductions from other expense offset arrangements and do not represent the amount paid by the class during periods when reimbursements or reductions occur. Expenses net of fee waivers reflect expenses after reimbursement by the investment adviser but prior to reductions from brokerage service arrangements or other expense offset arrangements. Expenses net of all reductions represent the net expenses paid by the class.
K Annualized
L Amount does not include the portfolio activity of any underlying Fidelity Central Funds.
M Portfolio turnover rate excludes securities received or delivered in-kind.
See accompanying notes which are an integral part of the financial statements.
Financial Highlights — Consumer Staples Portfolio
| Six months ended (Unaudited) | Years ended February 28, | |||||
| August 31, | 2015 | 2015 | 2014 | 2013 | 2012A | 2011 |
| Selected Per–Share Data | ||||||
| Net asset value, beginning of period | $102.03 | $88.51 | $86.17 | $75.29 | $67.98 | $61.34 |
| Income from Investment Operations | ||||||
| Net investment income (loss)B | 1.03 | 1.64 | 1.69 | 1.48 | 1.42 | 1.14 |
| Net realized and unrealized gain (loss) | (10.66) | 17.40 | 7.55 | 11.82 | 8.76 | 7.14 |
| Total from investment operations | (9.63) | 19.04 | 9.24 | 13.30 | 10.18 | 8.28 |
| Distributions from net investment income | (.22) | (1.54) | (1.66) | (1.28) | (1.24) | (.98) |
| Distributions from net realized gain | (3.15) | (3.98) | (5.24) | (1.14) | (1.64) | (.66) |
| Total distributions | (3.37) | (5.52) | (6.90) | (2.42) | (2.87)C | (1.64) |
| Redemption fees added to paid in capitalB,D | – | – | – | – | – | – |
| Net asset value, end of period | $89.03 | $102.03 | $88.51 | $86.17 | $75.29 | $67.98 |
| Total ReturnE,F | (9.74)% | 22.27% | 10.82% | 17.94% | 15.30% | 13.55% |
| Ratios to Average Net AssetsG,H | ||||||
| Expenses before reductions | .77%I | .77% | .79% | .81% | .83% | .86% |
| Expenses net of fee waivers, if any | .77%I | .77% | .79% | .81% | .83% | .86% |
| Expenses net of all reductions | .76%I | .77% | .79% | .80% | .82% | .86% |
| Net investment income (loss) | 2.14%I | 1.73% | 1.88% | 1.85% | 2.01% | 1.78% |
| Supplemental Data | ||||||
| Net assets, end of period (000 omitted) | $1,833,150 | $2,173,970 | $1,328,594 | $1,425,055 | $1,202,440 | $877,548 |
| Portfolio turnover rateJ | 61%I | 42%K | 31% | 28% | 35% | 57% |
A For the year ended February 29.
B Calculated based on average shares outstanding during the period.
C Total distributions of $2.87 per share is comprised of distributions from net investment income of $1.236 and distributions from net realized gain of $1.637 per share.
D Amount represents less than $.005 per share.
E Total returns for periods of less than one year are not annualized.
F Total returns would have been lower if certain expenses had not been reduced during the applicable periods shown.
G Fees and expenses of any underlying Fidelity Central Funds are not included in the Fund's expense ratio. The Fund indirectly bears its proportionate share of the expenses of any underlying Fidelity Central Funds.
H Expense ratios reflect operating expenses of the class. Expenses before reductions do not reflect amounts reimbursed by the investment adviser or reductions from brokerage service arrangements or reductions from other expense offset arrangements and do not represent the amount paid by the class during periods when reimbursements or reductions occur. Expenses net of fee waivers reflect expenses after reimbursement by the investment adviser but prior to reductions from brokerage service arrangements or other expense offset arrangements. Expenses net of all reductions represent the net expenses paid by the class.
I Annualized
J Amount does not include the portfolio activity of any underlying Fidelity Central Funds.
K Portfolio turnover rate excludes securities received or delivered in-kind.
See accompanying notes which are an integral part of the financial statements.
Financial Highlights — Consumer Staples Portfolio Class I
| Six months ended (Unaudited) | Years ended February 28, | |||||
| August 31, | 2015 | 2015 | 2014 | 2013 | 2012A | 2011 |
| Selected Per–Share Data | ||||||
| Net asset value, beginning of period | $101.91 | $88.33 | $85.92 | $75.14 | $67.84 | $61.26 |
| Income from Investment Operations | ||||||
| Net investment income (loss)B | 1.03 | 1.59 | 1.66 | 1.45 | 1.39 | 1.15 |
| Net realized and unrealized gain (loss) | (10.67) | 17.40 | 7.53 | 11.79 | 8.73 | 7.13 |
| Total from investment operations | (9.64) | 18.99 | 9.19 | 13.24 | 10.12 | 8.28 |
| Distributions from net investment income | (.22) | (1.44) | (1.54) | (1.32) | (1.19) | (1.04) |
| Distributions from net realized gain | (3.15) | (3.98) | (5.24) | (1.14) | (1.64) | (.66) |
| Total distributions | (3.37) | (5.41)C | (6.78) | (2.46) | (2.82)D | (1.70) |
| Redemption fees added to paid in capitalB,E | – | – | – | – | – | – |
| Net asset value, end of period | $88.90 | $101.91 | $88.33 | $85.92 | $75.14 | $67.84 |
| Total ReturnF,G | (9.76)% | 22.26% | 10.80% | 17.90% | 15.24% | 13.57% |
| Ratios to Average Net AssetsH,I | ||||||
| Expenses before reductions | .78%J | .80% | .82% | .85% | .87% | .87% |
| Expenses net of fee waivers, if any | .77%J | .80% | .82% | .85% | .87% | .87% |
| Expenses net of all reductions | .77%J | .80% | .82% | .84% | .87% | .87% |
| Net investment income (loss) | 2.13%J | 1.70% | 1.85% | 1.81% | 1.96% | 1.77% |
| Supplemental Data | ||||||
| Net assets, end of period (000 omitted) | $169,378 | $198,538 | $154,271 | $378,731 | $163,544 | $237,883 |
| Portfolio turnover rateK | 61%J | 42%L | 31% | 28% | 35% | 57% |
A For the year ended February 29.
B Calculated based on average shares outstanding during the period.
C Total distributions of $5.41 per share is comprised of distributions from net investment income of $1.436 and distributions from net realized gain of $3.976 per share.
D Total distributions of $2.82 per share is comprised of distributions from net investment income of $1.186 and distributions from net realized gain of $1.637 per share.
E Amount represents less than $.005 per share.
F Total returns for periods of less than one year are not annualized.
G Total returns would have been lower if certain expenses had not been reduced during the applicable periods shown.
H Fees and expenses of any underlying Fidelity Central Funds are not included in the Fund's expense ratio. The Fund indirectly bears its proportionate share of the expenses of any underlying Fidelity Central Funds.
I Expense ratios reflect operating expenses of the class. Expenses before reductions do not reflect amounts reimbursed by the investment adviser or reductions from brokerage service arrangements or reductions from other expense offset arrangements and do not represent the amount paid by the class during periods when reimbursements or reductions occur. Expenses net of fee waivers reflect expenses after reimbursement by the investment adviser but prior to reductions from brokerage service arrangements or other expense offset arrangements. Expenses net of all reductions represent the net expenses paid by the class.
J Annualized
K Amount does not include the portfolio activity of any underlying Fidelity Central Funds.
L Portfolio turnover rate excludes securities received or delivered in-kind.
See accompanying notes which are an integral part of the financial statements.
Notes to Financial Statements (Unaudited)
For the period ended August 31, 2015
1. Organization.
Consumer Staples Portfolio (the Fund) is a non-diversified fund of Fidelity Select Portfolios (the Trust) and is authorized to issue an unlimited number of shares. The Trust is registered under the Investment Company Act of 1940, as amended (the 1940 Act), as an open-end management investment company organized as a Massachusetts business trust. The Fund invests primarily in securities of companies whose principal business activities fall within specific industries. The Fund offers Class A, Class T, Class C, Consumer Staples and Class I (formerly Institutional Class) shares, each of which, along with Class B shares, has equal rights as to assets and voting privileges. Class B shares are closed to new accounts and additional purchases, except for exchanges and reinvestments. Each class has exclusive voting rights with respect to matters that affect that class. Class B shares will automatically convert to Class A shares after a holding period of seven years from the initial date of purchase.
2. Investments in Fidelity Central Funds.
The Fund invests in Fidelity Central Funds, which are open-end investment companies generally available only to other investment companies and accounts managed by the investment adviser and its affiliates. The Fund's Schedule of Investments lists each of the Fidelity Central Funds held as of period end, if any, as an investment of the Fund, but does not include the underlying holdings of each Fidelity Central Fund. As an Investing Fund, the Fund indirectly bears its proportionate share of the expenses of the underlying Fidelity Central Funds.
The Money Market Central Funds seek preservation of capital and current income and are managed by Fidelity Investments Money Management, Inc. (FIMM), an affiliate of the investment adviser. Annualized expenses of the Money Market Central Funds as of their most recent shareholder report date are less than .01%.
A complete unaudited list of holdings for each Fidelity Central Fund is available upon request or at the Securities and Exchange Commission (the SEC) website at www.sec.gov. In addition, the financial statements of the Fidelity Central Funds are available on the SEC website or upon request.
3. Significant Accounting Policies.
The financial statements have been prepared in conformity with accounting principles generally accepted in the United States of America (GAAP), which require management to make certain estimates and assumptions at the date of the financial statements. Actual results could differ from those estimates. Subsequent events, if any, through the date that the financial statements were issued have been evaluated in the preparation of the financial statements. The following summarizes the significant accounting policies of the Fund:
Investment Valuation. Investments are valued as of 4:00 p.m. Eastern time on the last calendar day of the period. The Board of Trustees (the Board) has delegated the day to day responsibility for the valuation of the Fund's investments to the Fidelity SelectCo, LLC (SelectCo) Fair Value Committee (the Committee). In accordance with valuation policies and procedures approved by the Board, the Fund attempts to obtain prices from one or more third party pricing vendors or brokers to value its investments. When current market prices, quotations or currency exchange rates are not readily available or reliable, investments will be fair valued in good faith by the Committee, in accordance with procedures adopted by the Board. Factors used in determining fair value vary by investment type and may include market or investment specific events. The frequency with which these procedures are used cannot be predicted and they may be utilized to a significant extent. The Committee oversees the Fund's valuation policies and procedures and reports to the Board on the Committee's activities and fair value determinations. The Board monitors the appropriateness of the procedures used in valuing the Fund's investments and ratifies the fair value determinations of the Committee.
The Fund categorizes the inputs to valuation techniques used to value its investments into a disclosure hierarchy consisting of three levels as shown below:
- Level 1 – quoted prices in active markets for identical investments
- Level 2 – other significant observable inputs (including quoted prices for similar investments, interest rates, prepayment speeds, etc.)
- Level 3 – unobservable inputs (including the Fund's own assumptions based on the best information available)
Valuation techniques used to value the Fund's investments by major category are as follows:
Equity securities, including restricted securities, for which market quotations are readily available, are valued at the last reported sale price or official closing price as reported by a third party pricing vendor on the primary market or exchange on which they are traded and are categorized as Level 1 in the hierarchy. In the event there were no sales during the day or closing prices are not available, securities are valued at the last quoted bid price or may be valued using the last available price and are generally categorized as Level 2 in the hierarchy. For foreign equity securities, when market or security specific events arise, comparisons to the valuation of American Depositary Receipts (ADRs), futures contracts, Exchange-Traded Funds (ETFs) and certain indexes as well as quoted prices for similar securities may be used and would be categorized as Level 2 in the hierarchy. Utilizing these techniques may result in transfers between Level 1 and Level 2. For equity securities, including restricted securities, where observable inputs are limited, assumptions about market activity and risk are used and these securities may be categorized as Level 3 in the hierarchy.
Investments in open-end mutual funds, including the Fidelity Central Funds, are valued at their closing net asset value (NAV) each business day and are categorized as Level 1 in the hierarchy.
Changes in valuation techniques may result in transfers in or out of an assigned level within the disclosure hierarchy. The aggregate value of investments by input level as of August 31, 2015, is included at the end of the Fund's Schedule of Investments.
Foreign Currency. The Fund may use foreign currency contracts to facilitate transactions in foreign-denominated securities. Gains and losses from these transactions may arise from changes in the value of the foreign currency or if the counterparties do not perform under the contracts' terms.
Foreign-denominated assets, including investment securities, and liabilities are translated into U.S. dollars at the exchange rates at period end. Purchases and sales of investment securities, income and dividends received and expenses denominated in foreign currencies are translated into U.S. dollars at the exchange rate in effect on the transaction date.
The effects of exchange rate fluctuations on investments are included with the net realized and unrealized gain (loss) on investment securities. Other foreign currency transactions resulting in realized and unrealized gain (loss) are disclosed separately.
Investment Transactions and Income. For financial reporting purposes, the Fund's investment holdings and NAV include trades executed through the end of the last business day of the period. The NAV per share for processing shareholder transactions is calculated as of the close of business of the New York Stock Exchange (NYSE), normally 4:00 p.m. Eastern time and includes trades executed through the end of the prior business day. Gains and losses on securities sold are determined on the basis of identified cost and may include proceeds received from litigation. Dividend income is recorded on the ex-dividend date, except for certain dividends from foreign securities where the ex-dividend date may have passed, which are recorded as soon as the Fund is informed of the ex-dividend date. Non-cash dividends included in dividend income, if any, are recorded at the fair market value of the securities received. Income and capital gain distributions from Fidelity Central Funds, if any, are recorded on the ex-dividend date. Interest income is accrued as earned and includes coupon interest and amortization of premium and accretion of discount on debt securities as applicable. Investment income is recorded net of foreign taxes withheld where recovery of such taxes is uncertain.
Class Allocations and Expenses. Investment income, realized and unrealized capital gains and losses, common expenses of the Fund, and certain fund-level expense reductions, if any, are allocated daily on a pro-rata basis to each class based on the relative net assets of each class to the total net assets of the Fund. Each class differs with respect to transfer agent and distribution and service plan fees incurred. Certain expense reductions may also differ by class. For the reporting period, the allocated portion of income and expenses to each class as a percent of its average net assets may vary due to the timing of recording these transactions in relation to fluctuating net assets of the classes. Expenses directly attributable to a fund are charged to that fund. Expenses attributable to more than one fund are allocated among the respective funds on the basis of relative net assets or other appropriate methods. Expense estimates are accrued in the period to which they relate and adjustments are made when actual amounts are known.
Deferred Trustee Compensation. Under a Deferred Compensation Plan (the Plan), independent Trustees may elect to defer receipt of a portion of their annual compensation. Deferred amounts are invested in a cross-section of Fidelity funds, are marked-to-market and remain in the Fund until distributed in accordance with the Plan. The investment of deferred amounts and the offsetting payable to the Trustees are included in the accompanying Statement of Assets and Liabilities.
Income Tax Information and Distributions to Shareholders. Each year, the Fund intends to qualify as a regulated investment company under Subchapter M of the Internal Revenue Code, including distributing substantially all of its taxable income and realized gains. As a result, no provision for U.S. Federal income taxes is required. The Fund files a U.S. federal tax return, in addition to state and local tax returns as required. The Fund's federal income tax returns are subject to examination by the Internal Revenue Service (IRS) for a period of three fiscal years after they are filed. State and local tax returns may be subject to examination for an additional fiscal year depending on the jurisdiction. Foreign taxes are provided for based on the Fund's understanding of the tax rules and rates that exist in the foreign markets in which it invests.
Distributions are declared and recorded on the ex-dividend date. Income dividends and capital gain distributions are declared separately for each class. Income and capital gain distributions are determined in accordance with income tax regulations, which may differ from GAAP.
Capital accounts within the financial statements are adjusted for permanent book-tax differences. These adjustments have no impact on net assets or the results of operations. Capital accounts are not adjusted for temporary book-tax differences which will reverse in a subsequent period.
Book-tax differences are primarily due to foreign currency transactions, redemptions in kind, deferred trustees compensation and losses deferred due to wash sales.
The federal tax cost of investment securities and unrealized appreciation (depreciation) as of period end were as follows:
| Gross unrealized appreciation | $639,524,517 |
| Gross unrealized depreciation | (174,608,013) |
| Net unrealized appreciation (depreciation) on securities | $464,916,504 |
| Tax cost | $2,255,783,082 |
Trading (Redemption) Fees. Shares held by investors in the Fund less than 30 days may be subject to a redemption fee equal to .75% of the NAV of shares redeemed. All redemption fees, which reduce the proceeds of the shareholder redemption, are retained by the Fund and accounted for as an addition to paid in capital.
4. Purchases and Sales of Investments.
Purchases and sales of securities, other than short-term securities, aggregated $873,186,629 and $945,351,325, respectively.
5. Fees and Other Transactions with Affiliates.
Management Fee. Fidelity SelectCo, LLC (the investment adviser) and its affiliates provide the Fund with investment management related services for which the Fund pays a monthly management fee. The management fee is the sum of an individual fund fee rate that is based on an annual rate of .30% of the Fund's average net assets and an annualized group fee rate that averaged .25% during the period. The group fee rate is based upon the average net assets of all the mutual funds advised by Fidelity Management & Research Company (FMR) and the investment adviser. The group fee rate decreases as assets under management increase and increases as assets under management decrease. For the reporting period, the total annualized management fee rate was .55% of the Fund's average net assets.
Distribution and Service Plan Fees. In accordance with Rule 12b-1 of the 1940 Act, the Fund has adopted separate Distribution and Service Plans for each class of shares. Certain classes pay Fidelity Distributors Corporation (FDC), an affiliate of the investment adviser, separate Distribution and Service Fees, each of which is based on an annual percentage of each class' average net assets. In addition, FDC may pay financial intermediaries for selling shares of the Fund and providing shareholder support services. For the period, the Distribution and Service Fee rates, total fees and amounts retained by FDC were as follows:
| Distribution Fee | Service Fee | Total Fees | Retained by FDC |
|
| Class A | -% | .25% | $516,274 | $– |
| Class T | .25% | .25% | 193,944 | – |
| Class B | .75% | .25% | 67,677 | 50,758 |
| Class C | .75% | .25% | 1,149,757 | 259,440 |
| $1,927,652 | $310,198 |
Sales Load. FDC may receive a front-end sales charge of up to 5.75% for selling Class A shares and 3.50% for selling Class T shares, some of which is paid to financial intermediaries for selling shares of the Fund. Depending on the holding period, FDC may receive contingent deferred sales charges levied on Class A, Class T, Class B, and Class C redemptions. The deferred sales charges range from 5.00% to 1.00% for Class B shares, 1.00% for Class C shares, 1.00% for certain purchases of Class A shares and .25% for certain purchases of Class T shares.
For the period, sales charge amounts retained by FDC were as follows:
| Retained by FDC |
|
| Class A | $181,597 |
| Class T | 24,783 |
| Class B* | 1,710 |
| Class C* | 12,483 |
| $220,573 |
* When Class B and Class C shares are initially sold, FDC pays commissions from its own resources to financial intermediaries through which the sales are made.
Transfer Agent Fees. Fidelity Investments Institutional Operations Company, Inc., (FIIOC), an affiliate of the investment adviser, is the transfer, dividend disbursing and shareholder servicing agent for each class of the Fund. FIIOC receives account fees and asset-based fees that vary according to the account size and type of account of the shareholders of the respective classes of the Fund. FIIOC pays for typesetting, printing and mailing of shareholder reports, except proxy statements.
For the period, transfer agent fees for each class were as follows:
| Amount | % of Class-Level Average Net Assets* |
|
| Class A | $410,505 | .20 |
| Class T | 86,826 | .22 |
| Class B | 14,578 | .22 |
| Class C | 233,477 | .20 |
| Consumer Staples | 1,748,464 | .17 |
| Class I | 170,805 | .18 |
| $ 2,664,655 |
*Annualized
Accounting and Security Lending Fees. Fidelity Service Company, Inc. (FSC), an affiliate of the investment adviser, maintains the Fund's accounting records. The accounting fee is based on the level of average net assets for each month. Under a separate contract, FSC administers the security lending program. The security lending fee is based on the number and duration of lending transactions.
Brokerage Commissions. The Fund placed a portion of its portfolio transactions with brokerage firms which are affiliates of the investment adviser. Brokerage commissions are included in net realized gain (loss) and change in net unrealized appreciation (depreciation) in the Statement of Operations. The commissions paid to these affiliated firms were $8,070 for the period.
6. Committed Line of Credit.
The Fund participates with other funds managed by the investment adviser or an affiliate in a $4.25 billion credit facility (the "line of credit") to be utilized for temporary or emergency purposes to fund shareholder redemptions or for other short-term liquidity purposes. The Fund has agreed to pay commitment fees on its pro-rata portion of the line of credit, which amounted to $2,279 and is reflected in Miscellaneous expenses on the Statement of Operations. During the period, the Fund did not borrow on this line of credit.
7. Security Lending.
The Fund lends portfolio securities through a lending agent from time to time in order to earn additional income. On the settlement date of the loan, the Fund receives collateral (in the form of U.S. Treasury obligations, letters of credit and/or cash) against the loaned securities and maintains collateral in an amount not less than 100% of the market value of the loaned securities during the period of the loan. The market value of the loaned securities is determined at the close of business of the Fund and any additional required collateral is delivered to the Fund on the next business day. If the borrower defaults on its obligation to return the securities loaned because of insolvency or other reasons, the Fund may apply collateral received from the borrower against the obligation. The Fund may experience delays and costs in recovering the securities loaned. Any cash collateral received is invested in the Fidelity Securities Lending Cash Central Fund. The value of loaned securities and cash collateral at period end are disclosed on the Fund's Statement of Assets and Liabilities. Security lending income represents the income earned on investing cash collateral, less rebates paid to borrowers and any lending agent fees associated with the loan, plus any premium payments received for lending certain types of securities. Security lending income is presented in the Statement of Operations as a component of income from Fidelity Central Funds. Total security lending income during the period amounted to $140,230.
8. Expense Reductions.
Commissions paid to certain brokers with whom the investment adviser, or its affiliates, places trades on behalf of the Fund include an amount in addition to trade execution, which may be rebated back to the Fund to offset certain expenses. This amount totaled $98,315 for the period. In addition, through arrangements with the Fund's custodian, credits realized as a result of uninvested cash balances were used to reduce the Fund's expenses. During the period, these credits reduced the Fund's custody by $63.
In addition, during the period the investment adviser reimbursed and/or waived a portion of fund-level operating expenses in the amount of $11,417 and a portion of class-level operating expenses as follows:
| Amount | |
| Class A | $7,870 |
| Class T | 1,516 |
| Class B | 395 |
| Class C | 4,058 |
| Consumer Staples | 37,669 |
| Class I | 6,663 |
| $ 58,171 |
9. Distributions to Shareholders.
Distributions to shareholders of each class were as follows:
| Six months ended August 31, 2015 | Year ended February 28, 2015 | |
| From net investment income | ||
| Class A | $748,002 | $4,812,004 |
| Class T | 109,152 | 776,331 |
| Class B | 4,951 | 83,556 |
| Class C | 151,085 | 1,335,126 |
| Consumer Staples | 4,534,913 | 29,856,743 |
| Class I | 445,963 | 2,754,772 |
| Total | $5,994,066 | $39,618,532 |
| From net realized gain | ||
| Class A | $13,245,483 | $14,768,867 |
| Class T | 2,567,517 | 2,841,831 |
| Class B | 472,929 | 743,976 |
| Class C | 7,440,920 | 7,778,566 |
| Consumer Staples | 65,568,990 | 65,408,817 |
| Class I | 6,389,423 | 10,857,228 |
| Total | $95,685,262 | $102,399,285 |
10. Share Transactions.
Share transactions for each class were as follows and may contain automatic conversions between classes or exchanges between funds:
| Shares | Shares | Dollars | Dollars | |
| Six months ended August 31, 2015 | Year ended February 28, 2015 | Six months ended August 31, 2015 | Year ended February 28, 2015 | |
| Class A | ||||
| Shares sold | 823,694 | 1,066,097 | $78,762,656 | $101,322,941 |
| Reinvestment of distributions | 139,522 | 205,710 | 13,557,335 | 18,829,531 |
| Shares redeemed | (605,912) | (931,333) | (57,741,721) | (86,559,239) |
| Net increase (decrease) | 357,304 | 340,474 | $34,578,270 | $33,593,233 |
| Class T | ||||
| Shares sold | 93,924 | 215,514 | $8,935,490 | $20,203,421 |
| Reinvestment of distributions | 26,837 | 38,102 | 2,588,978 | 3,463,287 |
| Shares redeemed | (142,485) | (146,712) | (13,456,409) | (13,666,581) |
| Net increase (decrease) | (21,724) | 106,904 | $(1,931,941) | $10,000,127 |
| Class B | ||||
| Shares sold | 2,493 | 7,270 | $232,612 | $675,777 |
| Reinvestment of distributions | 4,669 | 8,161 | $448,407 | $730,673 |
| Shares redeemed | (42,792) | (57,733) | (3,995,750) | (5,359,510) |
| Net increase (decrease) | (35,630) | (42,302) | $(3,314,731) | $(3,953,060) |
| Class C | ||||
| Shares sold | 449,616 | 636,469 | $42,091,266 | $59,593,472 |
| Reinvestment of distributions | 70,230 | 86,847 | 6,683,108 | 7,772,854 |
| Shares redeemed | (275,660) | (332,705) | (25,673,793) | (30,479,924) |
| Net increase (decrease) | 244,186 | 390,611 | $23,100,581 | $36,886,402 |
| Consumer Staples | ||||
| Shares sold | 1,753,451 | 8,889,529 | $169,496,786 | $838,041,591 |
| Reinvestment of distributions | 690,724 | 985,926 | 67,594,280 | 91,713,079 |
| Shares redeemed | (3,159,236) | (3,580,043) | (305,508,464) | (340,719,360) |
| Net increase (decrease) | (715,061) | 6,295,412 | $(68,417,398) | $589,035,310 |
| Class I | ||||
| Shares sold | 493,672 | 3,870,748A | $47,529,891 | $354,438,000A |
| Reinvestment of distributions | 56,913 | 135,150 | 5,562,149 | 12,187,732 |
| Shares redeemed | (593,677) | (3,804,175)B | (56,890,561) | (345,400,883)B |
| Net increase (decrease) | (43,092) | 201,723 | $(3,798,521) | $21,224,849 |
A Amount includes in-kind exchanges.
B Amount includes in-kind redemptions.
11. Other.
The Fund's organizational documents provide former and current trustees and officers with a limited indemnification against liabilities arising in connection with the performance of their duties to the Fund. In the normal course of business, the Fund may also enter into contracts that provide general indemnifications. The Fund's maximum exposure under these arrangements is unknown as this would be dependent on future claims that may be made against the Fund. The risk of material loss from such claims is considered remote.
Mutual funds managed by the investment adviser or its affiliates were the owners of record, in the aggregate, of approximately 26% of the total outstanding shares of the Fund.
Shareholder Expense Example
As a shareholder of the Fund, you incur two types of costs: (1) transaction costs, including sales charges (loads) on purchase payments or redemption proceeds, redemption fees and (2) ongoing costs, including management fees, distribution and/or service (12b-1) fees and other Fund expenses. This Example is intended to help you understand your ongoing costs (in dollars) of investing in the Fund and to compare these costs with the ongoing costs of investing in other mutual funds.
The Example is based on an investment of $1,000 invested at the beginning of the period and held for the entire period (March 1, 2015 to August 31, 2015).
Actual Expenses
The first line of the accompanying table for each class of the Fund provides information about actual account values and actual expenses. You may use the information in this line, together with the amount you invested, to estimate the expenses that you paid over the period. Simply divide your account value by $1,000.00 (for example, an $8,600 account value divided by $1,000.00 = 8.6), then multiply the result by the number in the first line for a class of the Fund under the heading entitled "Expenses Paid During Period" to estimate the expenses you paid on your account during this period. A small balance maintenance fee of $12.00 that is charged once a year may apply for certain accounts with a value of less than $2,000. This fee is not included in the table below. If it was, the estimate of expenses you paid during the period would be higher, and your ending account value lower, by this amount. In addition, the Fund, as a shareholder in the underlying Fidelity Central Funds, will indirectly bear its pro-rata share of the fees and expenses incurred by the underlying Fidelity Central Funds. These fees and expenses are not included in the Fund's annualized expense ratio used to calculate the expense estimate in the table below.
Hypothetical Example for Comparison Purposes
The second line of the accompanying table for each class of the Fund provides information about hypothetical account values and hypothetical expenses based on a Class' actual expense ratio and an assumed rate of return of 5% per year before expenses, which is not the Class' actual return. The hypothetical account values and expenses may not be used to estimate the actual ending account balance or expenses you paid for the period. You may use this information to compare the ongoing costs of investing in the Fund and other funds. To do so, compare this 5% hypothetical example with the 5% hypothetical examples that appear in the shareholder reports of the other funds. A small balance maintenance fee of $12.00 that is charged once a year may apply for certain accounts with a value of less than $2,000. This fee is not included in the table below. If it was, the estimate of expenses you paid during the period would be higher, and your ending account value lower, by this amount. In addition, the Fund, as a shareholder in the underlying Fidelity Central Funds, will indirectly bear its pro-rata share of the fees and expenses incurred by the underlying Fidelity Central Funds. These fees and expenses are not included in the Fund's annualized expense ratio used to calculate the expense estimate in the table below.
Please note that the expenses shown in the table are meant to highlight your ongoing costs only and do not reflect any transaction costs. Therefore, the second line of the table is useful in comparing ongoing costs only, and will not help you determine the relative total costs of owning different funds. In addition, if these transactional costs were included, your costs would have been higher.
| Annualized Expense Ratio-A | Beginning Account Value March 1, 2015 | Ending Account Value August 31, 2015 | Expenses Paid During Period-B March 1, 2015 to August 31, 2015 |
|
| Class A | 1.04% | |||
| Actual | $1,000.00 | $901.30 | $4.97 | |
| Hypothetical-C | $1,000.00 | $1,019.91 | $5.28 | |
| Class T | 1.32% | |||
| Actual | $1,000.00 | $900.10 | $6.30 | |
| Hypothetical-C | $1,000.00 | $1,018.50 | $6.70 | |
| Class B | 1.81% | |||
| Actual | $1,000.00 | $897.90 | $8.63 | |
| Hypothetical-C | $1,000.00 | $1,016.04 | $9.17 | |
| Class C | 1.80% | |||
| Actual | $1,000.00 | $898.00 | $8.59 | |
| Hypothetical-C | $1,000.00 | $1,016.09 | $9.12 | |
| Consumer Staples | .77% | |||
| Actual | $1,000.00 | $902.60 | $3.68 | |
| Hypothetical-C | $1,000.00 | $1,021.27 | $3.91 | |
| Class I | .77% | |||
| Actual | $1,000.00 | $902.40 | $3.68 | |
| Hypothetical-C | $1,000.00 | $1,021.27 | $3.91 |
A Annualized expense ratio reflects expenses net of applicable fee waivers.
B Expenses are equal to each Class' annualized expense ratio, multiplied by the average account value over the period, multiplied by 184/366 (to reflect the one-half year period).
C 5% return per year before expenses.
![]()
SELCS-SANN-1015
1.846045.108
|
Fidelity Advisor Focus Funds® Consumer Staples Portfolio Gold Portfolio Materials Portfolio Telecommunications Portfolio Semi-Annual Report August 31, 2015 Each Advisor fund listed above is a class of the Fidelity® Select Portfolios® |
|
|
Contents
|
Consumer Staples Portfolio |
|
|
Gold Portfolio |
|
|
Materials Portfolio |
|
|
Telecommunications Portfolio |
|
To view a fund's proxy voting guidelines and proxy voting record for the 12-month period ended June 30, visit http://www.fidelity.com/proxyvotingresults or visit the Securities and Exchange Commission's (SEC) web site at http://www.sec.gov.
You may also call 1-877-208-0098 to request a free copy of the proxy voting guidelines.
Standard & Poor's, S&P and S&P 500 are registered service marks of The McGraw-Hill Companies, Inc. and have been licensed for use by Fidelity Distributors Corporation.
Other third-party marks appearing herein are the property of their respective owners.
All other marks appearing herein are registered or unregistered trademarks or service marks of FMR LLC or an affiliated company. ©2015 FMR LLC. All rights reserved.
This report and the financial statements contained herein are submitted for the general information of the shareholders of the Funds. This report is not authorized for distribution to prospective investors in the Funds unless preceded or accompanied by an effective prospectus.
A fund files its complete schedule of portfolio holdings with the SEC for the first and third quarters of each fiscal year on Form N-Q. Forms N-Q are available on the SEC’s web site at http://www.sec.gov. A fund's Forms N-Q may be reviewed and copied at the SEC’s Public Reference Room in Washington, DC. Information regarding the operation of the SEC's Public Reference Room may be obtained by calling 1-800-SEC-0330.
For a complete list of a fund's portfolio holdings, view the most recent holdings listing, semiannual report, or annual report on Fidelity's web site at http://www.fidelity.com, http://www.advisor.fidelity.com, or http://www.401k.com, as applicable.
NOT FDIC INSURED •MAY LOSE VALUE •NO BANK GUARANTEE
Neither the Funds nor Fidelity Distributors Corporation is a bank.
Consumer Staples Portfolio
Investment Summary (Unaudited)
Top Ten Stocks as of August 31, 2015
| % of fund's net assets | % of fund's net assets 6 months ago | |
| British American Tobacco PLC sponsored ADR | 11.1 | 11.0 |
| CVS Health Corp. | 10.5 | 9.0 |
| Procter & Gamble Co. | 9.7 | 9.1 |
| PepsiCo, Inc. | 9.6 | 4.2 |
| Kroger Co. | 5.9 | 6.0 |
| Mead Johnson Nutrition Co. Class A | 4.7 | 4.5 |
| Altria Group, Inc. | 4.4 | 2.3 |
| Colgate-Palmolive Co. | 3.9 | 3.0 |
| Wal-Mart Stores, Inc. | 3.7 | 7.0 |
| Keurig Green Mountain, Inc. | 3.4 | 2.2 |
| 66.9 |
Top Industries (% of fund's net assets)
| As of August 31, 2015 | ||
| Food & Staples Retailing | 23.6% | |
| Beverages | 23.5% | |
| Tobacco | 20.0% | |
| Household Products | 13.7% | |
| Food Products | 13.3% | |
| All Others* | 5.9% | |
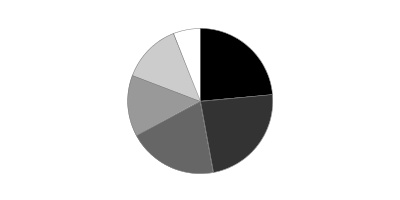
| As of February 28, 2015 | ||
| Food & Staples Retailing | 26.7% | |
| Tobacco | 19.7% | |
| Beverages | 18.8% | |
| Food Products | 16.7% | |
| Household Products | 12.3% | |
| All Others* | 5.8% | |

* Includes short-term investments and net other assets (liabilities).
Consumer Staples Portfolio
Investments August 31, 2015 (Unaudited)
Showing Percentage of Net Assets
| Common Stocks - 99.0% | |||
| Shares | Value | ||
| Beverages - 23.4% | |||
| Brewers - 2.8% | |||
| Anheuser-Busch InBev SA NV | 343,090 | $37,420,380 | |
| SABMiller PLC | 839,084 | 39,322,522 | |
| 76,742,902 | |||
| Distillers & Vintners - 2.3% | |||
| Diageo PLC sponsored ADR | 370,226 | 39,380,940 | |
| Remy Cointreau SA (a) | 359,676 | 21,334,847 | |
| 60,715,787 | |||
| Soft Drinks - 18.3% | |||
| Coca-Cola Bottling Co. Consolidated | 120,318 | 18,556,645 | |
| Coca-Cola Central Japan Co. Ltd. | 360,900 | 6,520,314 | |
| Coca-Cola FEMSA S.A.B. de CV sponsored ADR | 58,029 | 4,178,668 | |
| Coca-Cola Icecek Sanayi A/S | 990,162 | 12,248,164 | |
| Embotelladora Andina SA: | |||
| ADR (a) | 481,227 | 7,747,755 | |
| sponsored ADR | 73,900 | 1,537,859 | |
| Fomento Economico Mexicano S.A.B. de CV sponsored ADR | 79,587 | 7,085,631 | |
| Monster Beverage Corp. (b) | 637,000 | 88,199,020 | |
| PepsiCo, Inc. | 2,777,318 | 258,096,162 | |
| The Coca-Cola Co. | 2,258,418 | 88,800,996 | |
| 492,971,214 | |||
| TOTAL BEVERAGES | 630,429,903 | ||
| Chemicals - 0.1% | |||
| Specialty Chemicals - 0.1% | |||
| Senomyx, Inc. (a)(b) | 425,655 | 2,834,862 | |
| Food & Staples Retailing - 23.6% | |||
| Drug Retail - 10.6% | |||
| CVS Health Corp. | 2,756,076 | 282,222,182 | |
| Drogasil SA | 390,400 | 4,273,608 | |
| 286,495,790 | |||
| Food Distributors - 1.2% | |||
| Chefs' Warehouse Holdings (a)(b) | 544,969 | 8,250,831 | |
| United Natural Foods, Inc. (b) | 466,581 | 22,465,875 | |
| 30,716,706 | |||
| Food Retail - 7.8% | |||
| Fresh Market, Inc. (a)(b) | 905,424 | 19,493,779 | |
| Kroger Co. | 4,603,436 | 158,818,542 | |
| Sprouts Farmers Market LLC (b) | 1,614,529 | 32,887,956 | |
| 211,200,277 | |||
| Hypermarkets & Super Centers - 4.0% | |||
| Costco Wholesale Corp. | 57,850 | 8,101,893 | |
| Wal-Mart Stores, Inc. | 1,539,056 | 99,623,095 | |
| 107,724,988 | |||
| TOTAL FOOD & STAPLES RETAILING | 636,137,761 | ||
| Food Products - 13.3% | |||
| Agricultural Products - 2.1% | |||
| Bunge Ltd. | 690,613 | 50,034,912 | |
| SLC Agricola SA | 1,290,200 | 5,724,103 | |
| 55,759,015 | |||
| Packaged Foods & Meats - 11.2% | |||
| Amplify Snack Brands, Inc. | 720,200 | 9,492,236 | |
| Blue Buffalo Pet Products, Inc. (b) | 166,842 | 4,262,813 | |
| Inner Mongoli Yili Industries Co. Ltd. | 1,610,842 | 4,069,799 | |
| Keurig Green Mountain, Inc. | 1,630,023 | 92,259,302 | |
| Lindt & Spruengli AG | 90 | 6,059,742 | |
| Mead Johnson Nutrition Co. Class A | 1,599,816 | 125,329,585 | |
| Nestle SA | 393,790 | 29,009,296 | |
| The Hain Celestial Group, Inc. (b) | 407,478 | 24,799,111 | |
| Ulker Biskuvi Sanayi A/S | 1,010,525 | 6,215,303 | |
| 301,497,187 | |||
| TOTAL FOOD PRODUCTS | 357,256,202 | ||
| Health Care Providers & Services - 0.1% | |||
| Health Care Services - 0.1% | |||
| Diplomat Pharmacy, Inc. | 42,900 | 1,694,121 | |
| Hotels, Restaurants & Leisure - 1.6% | |||
| Restaurants - 1.6% | |||
| ARAMARK Holdings Corp. | 1,342,628 | 42,077,962 | |
| Household Durables - 0.3% | |||
| Household Appliances - 0.2% | |||
| SodaStream International Ltd. (a)(b) | 389,815 | 5,940,781 | |
| Housewares & Specialties - 0.1% | |||
| Tupperware Brands Corp. | 73,000 | 3,739,790 | |
| TOTAL HOUSEHOLD DURABLES | 9,680,571 | ||
| Household Products - 13.7% | |||
| Household Products - 13.7% | |||
| Colgate-Palmolive Co. | 1,668,275 | 104,784,353 | |
| Procter & Gamble Co. | 3,718,365 | 262,776,855 | |
| Svenska Cellulosa AB (SCA) (B Shares) | 70,800 | 2,018,795 | |
| 369,580,003 | |||
| Personal Products - 2.9% | |||
| Personal Products - 2.9% | |||
| Avon Products, Inc. (a) | 1,426,500 | 7,403,535 | |
| Coty, Inc. Class A | 234,200 | 7,098,602 | |
| Herbalife Ltd. (b) | 440,010 | 25,331,376 | |
| L'Oreal SA | 116,700 | 19,996,814 | |
| Nu Skin Enterprises, Inc. Class A (a) | 257,967 | 11,783,933 | |
| Unilever NV (NY Reg.) | 167,698 | 6,728,044 | |
| 78,342,304 | |||
| Pharmaceuticals - 0.0% | |||
| Pharmaceuticals - 0.0% | |||
| Perrigo Co. PLC | 7,200 | 1,317,384 | |
| Tobacco - 20.0% | |||
| Tobacco - 20.0% | |||
| Altria Group, Inc. | 2,222,045 | 119,057,171 | |
| British American Tobacco PLC sponsored ADR | 2,807,765 | 297,566,931 | |
| ITC Ltd. | 1,820,070 | 8,920,419 | |
| Philip Morris International, Inc. | 593,358 | 47,349,968 | |
| Reynolds American, Inc. | 671,600 | 56,246,500 | |
| Souza Cruz SA | 1,264,000 | 9,250,013 | |
| 538,391,002 | |||
| TOTAL COMMON STOCKS | |||
| (Cost $2,192,411,429) | 2,667,742,075 | ||
| Nonconvertible Preferred Stocks - 0.1% | |||
| Beverages - 0.1% | |||
| Brewers - 0.1% | |||
| Ambev SA sponsored ADR | |||
| (Cost $1,095,710) | 467,510 | 2,463,778 | |
| Money Market Funds - 1.9% | |||
| Fidelity Cash Central Fund, 0.15% (c) | 21,104,995 | 21,104,995 | |
| Fidelity Securities Lending Cash Central Fund, 0.19% (c)(d) | 29,388,738 | 29,388,738 | |
| TOTAL MONEY MARKET FUNDS | |||
| (Cost $50,493,733) | 50,493,733 | ||
| TOTAL INVESTMENT PORTFOLIO - 101.0% | |||
| (Cost $2,244,000,872) | 2,720,699,586 | ||
| NET OTHER ASSETS (LIABILITIES) - (1.0)% | (26,833,561) | ||
| NET ASSETS - 100% | $2,693,866,025 |
Legend
(a) Security or a portion of the security is on loan at period end.
(b) Non-income producing
(c) Affiliated fund that is generally available only to investment companies and other accounts managed by Fidelity Investments. The rate quoted is the annualized seven-day yield of the fund at period end. A complete unaudited listing of the fund's holdings as of its most recent quarter end is available upon request. In addition, each Fidelity Central Fund's financial statements are available on the SEC's website or upon request.
(d) Investment made with cash collateral received from securities on loan.
Affiliated Central Funds
Information regarding fiscal year to date income earned by the Fund from investments in Fidelity Central Funds is as follows:
| Fund | Income earned |
| Fidelity Cash Central Fund | $40,101 |
| Fidelity Securities Lending Cash Central Fund | 140,230 |
| Total | $180,331 |
Investment Valuation
The following is a summary of the inputs used, as of August 31, 2015, involving the Fund's assets and liabilities carried at fair value. The inputs or methodology used for valuing securities may not be an indication of the risk associated with investing in those securities. For more information on valuation inputs, and their aggregation into the levels used below, please refer to the Investment Valuation section in the accompanying Notes to Financial Statements.
| Valuation Inputs at Reporting Date: | ||||
| Description | Total | Level 1 | Level 2 | Level 3 |
| Investments in Securities: | ||||
| Common Stocks | $2,667,742,075 | $2,594,792,085 | $72,949,990 | $-- |
| Nonconvertible Preferred Stocks | 2,463,778 | 2,463,778 | -- | -- |
| Money Market Funds | 50,493,733 | 50,493,733 | -- | -- |
| Total Investments in Securities: | $2,720,699,586 | $2,647,749,596 | $72,949,990 | $-- |
Other Information
Distribution of investments by country or territory of incorporation, as a percentage of Total Net Assets, is as follows (Unaudited):
| United States of America | 75.7% |
| United Kingdom | 14.0% |
| Bermuda | 1.9% |
| France | 1.5% |
| Belgium | 1.4% |
| Switzerland | 1.3% |
| Others (Individually Less Than 1%) | 4.2% |
| 100.0% |
See accompanying notes which are an integral part of the financial statements.
Consumer Staples Portfolio
Financial Statements
Statement of Assets and Liabilities
| August 31, 2015 (Unaudited) | ||
| Assets | ||
| Investment in securities, at value (including securities loaned of $28,785,296) — See accompanying schedule: Unaffiliated issuers (cost $2,193,507,139) | $2,670,205,853 | |
| Fidelity Central Funds (cost $50,493,733) | 50,493,733 | |
| Total Investments (cost $2,244,000,872) | $2,720,699,586 | |
| Receivable for investments sold | 5,391,290 | |
| Receivable for fund shares sold | 3,120,282 | |
| Dividends receivable | 8,251,366 | |
| Distributions receivable from Fidelity Central Funds | 36,075 | |
| Prepaid expenses | 21,709 | |
| Other receivables | 81,452 | |
| Total assets | 2,737,601,760 | |
| Liabilities | ||
| Payable for investments purchased | $8,063,869 | |
| Payable for fund shares redeemed | 4,069,059 | |
| Accrued management fee | 1,289,040 | |
| Distribution and service plan fees payable | 314,728 | |
| Other affiliated payables | 500,944 | |
| Other payables and accrued expenses | 109,357 | |
| Collateral on securities loaned, at value | 29,388,738 | |
| Total liabilities | 43,735,735 | |
| Net Assets | $2,693,866,025 | |
| Net Assets consist of: | ||
| Paid in capital | $2,103,937,906 | |
| Undistributed net investment income | 29,254,409 | |
| Accumulated undistributed net realized gain (loss) on investments and foreign currency transactions | 83,993,911 | |
| Net unrealized appreciation (depreciation) on investments and assets and liabilities in foreign currencies | 476,679,799 | |
| Net Assets | $2,693,866,025 | |
| Calculation of Maximum Offering Price | ||
| Class A: | ||
| Net Asset Value and redemption price per share ($392,461,247 ÷ 4,444,616 shares) | $88.30 | |
| Maximum offering price per share (100/94.25 of $88.30) | $93.69 | |
| Class T: | ||
| Net Asset Value and redemption price per share ($69,027,907 ÷ 788,204 shares) | $87.58 | |
| Maximum offering price per share (100/96.50 of $87.58) | $90.76 | |
| Class B: | ||
| Net Asset Value and offering price per share ($10,629,683 ÷ 122,152 shares)(a) | $87.02 | |
| Class C: | ||
| Net Asset Value and offering price per share ($219,219,473 ÷ 2,542,393 shares)(a) | $86.23 | |
| Consumer Staples: | ||
| Net Asset Value, offering price and redemption price per share ($1,833,149,595 ÷ 20,591,131 shares) | $89.03 | |
| Class I: | ||
| Net Asset Value, offering price and redemption price per share ($169,378,120 ÷ 1,905,167 shares) | $88.90 |
(a) Redemption price per share is equal to net asset value less any applicable contingent deferred sales charge.
See accompanying notes which are an integral part of the financial statements.
Statement of Operations
| Six months ended August 31, 2015 (Unaudited) | ||
| Investment Income | ||
| Dividends | $42,300,928 | |
| Interest | 10 | |
| Income from Fidelity Central Funds | 180,331 | |
| Total income | 42,481,269 | |
| Expenses | ||
| Management fee | $8,030,301 | |
| Transfer agent fees | 2,664,655 | |
| Distribution and service plan fees | 1,927,652 | |
| Accounting and security lending fees | 434,955 | |
| Custodian fees and expenses | 48,588 | |
| Independent trustees' compensation | 25,230 | |
| Registration fees | 150,698 | |
| Audit | 31,998 | |
| Legal | 18,552 | |
| Miscellaneous | 16,078 | |
| Total expenses before reductions | 13,348,707 | |
| Expense reductions | (167,966) | 13,180,741 |
| Net investment income (loss) | 29,300,528 | |
| Realized and Unrealized Gain (Loss)
Net realized gain (loss) on: | ||
| Investment securities: | ||
| Unaffiliated issuers | 92,999,124 | |
| Foreign currency transactions | (32,263) | |
| Total net realized gain (loss) | 92,966,861 | |
| Change in net unrealized appreciation (depreciation) on: Investment securities (net of decrease in deferred foreign taxes of $18,850) | (419,060,852) | |
| Assets and liabilities in foreign currencies | 6,754 | |
| Total change in net unrealized appreciation (depreciation) | (419,054,098) | |
| Net gain (loss) | (326,087,237) | |
| Net increase (decrease) in net assets resulting from operations | $(296,786,709) |
See accompanying notes which are an integral part of the financial statements.
Statement of Changes in Net Assets
| Six months ended August 31, 2015 (Unaudited) | Year ended February 28, 2015 | |
| Increase (Decrease) in Net Assets | ||
| Operations | ||
| Net investment income (loss) | $29,300,528 | $40,432,818 |
| Net realized gain (loss) | 92,966,861 | 155,658,969 |
| Change in net unrealized appreciation (depreciation) | (419,054,098) | 315,382,310 |
| Net increase (decrease) in net assets resulting from operations | (296,786,709) | 511,474,097 |
| Distributions to shareholders from net investment income | (5,994,066) | (39,618,532) |
| Distributions to shareholders from net realized gain | (95,685,262) | (102,399,285) |
| Total distributions | (101,679,328) | (142,017,817) |
| Share transactions - net increase (decrease) | (19,783,740) | 686,786,861 |
| Redemption fees | 18,425 | 51,833 |
| Total increase (decrease) in net assets | (418,231,352) | 1,056,294,974 |
| Net Assets | ||
| Beginning of period | 3,112,097,377 | 2,055,802,403 |
| End of period (including undistributed net investment income of $29,254,409 and undistributed net investment income of $5,947,947, respectively) | $2,693,866,025 | $3,112,097,377 |
See accompanying notes which are an integral part of the financial statements.
Financial Highlights — Consumer Staples Portfolio Class A
| Six months ended (Unaudited) | Years ended February 28, | |||||
| August 31, | 2015 | 2015 | 2014 | 2013 | 2012A | 2011 |
| Selected Per–Share Data | ||||||
| Net asset value, beginning of period | $101.33 | $87.93 | $85.67 | $74.90 | $67.65 | $61.06 |
| Income from Investment Operations | ||||||
| Net investment income (loss)B | .89 | 1.37 | 1.43 | 1.26 | 1.22 | .98 |
| Net realized and unrealized gain (loss) | (10.59) | 17.28 | 7.51 | 11.73 | 8.73 | 7.10 |
| Total from investment operations | (9.70) | 18.65 | 8.94 | 12.99 | 9.95 | 8.08 |
| Distributions from net investment income | (.18) | (1.28) | (1.44) | (1.08) | (1.06) | (.83) |
| Distributions from net realized gain | (3.15) | (3.98) | (5.24) | (1.14) | (1.64) | (.66) |
| Total distributions | (3.33) | (5.25)C | (6.68) | (2.22) | (2.70) | (1.49) |
| Redemption fees added to paid in capitalB,D | – | – | – | – | – | – |
| Net asset value, end of period | $88.30 | $101.33 | $87.93 | $85.67 | $74.90 | $67.65 |
| Total ReturnE,F,G | (9.87)% | 21.95% | 10.53% | 17.60% | 15.00% | 13.27% |
| Ratios to Average Net AssetsH,I | ||||||
| Expenses before reductions | 1.04%J | 1.05% | 1.06% | 1.08% | 1.10% | 1.11% |
| Expenses net of fee waivers, if any | 1.04%J | 1.05% | 1.06% | 1.08% | 1.10% | 1.11% |
| Expenses net of all reductions | 1.04%J | 1.05% | 1.06% | 1.08% | 1.09% | 1.11% |
| Net investment income (loss) | 1.86%J | 1.45% | 1.61% | 1.58% | 1.74% | 1.53% |
| Supplemental Data | ||||||
| Net assets, end of period (000 omitted) | $392,461 | $414,151 | $329,459 | $277,329 | $205,851 | $160,526 |
| Portfolio turnover rateK | 61%J | 42%L | 31% | 28% | 35% | 57% |
A For the year ended February 29.
B Calculated based on average shares outstanding during the period.
C Total distributions of $5.25 per share is comprised of distributions from net investment income of $1.275 and distributions from net realized gain of $3.976 per share.
D Amount represents less than $.005 per share.
E Total returns for periods of less than one year are not annualized.
F Total returns would have been lower if certain expenses had not been reduced during the applicable periods shown.
G Total returns do not include the effect of the sales charges.
H Fees and expenses of any underlying Fidelity Central Funds are not included in the Fund's expense ratio. The Fund indirectly bears its proportionate share of the expenses of any underlying Fidelity Central Funds.
I Expense ratios reflect operating expenses of the class. Expenses before reductions do not reflect amounts reimbursed by the investment adviser or reductions from brokerage service arrangements or reductions from other expense offset arrangements and do not represent the amount paid by the class during periods when reimbursements or reductions occur. Expenses net of fee waivers reflect expenses after reimbursement by the investment adviser but prior to reductions from brokerage service arrangements or other expense offset arrangements. Expenses net of all reductions represent the net expenses paid by the class.
J Annualized
K Amount does not include the portfolio activity of any underlying Fidelity Central Funds.
L Portfolio turnover rate excludes securities received or delivered in-kind.
See accompanying notes which are an integral part of the financial statements.
Financial Highlights — Consumer Staples Portfolio Class T
| Six months ended (Unaudited) | Years ended February 28, | |||||
| August 31, | 2015 | 2015 | 2014 | 2013 | 2012A | 2011 |
| Selected Per–Share Data | ||||||
| Net asset value, beginning of period | $100.61 | $87.37 | $85.18 | $74.49 | $67.30 | $60.77 |
| Income from Investment Operations | ||||||
| Net investment income (loss)B | .75 | 1.10 | 1.18 | 1.03 | 1.01 | .79 |
| Net realized and unrealized gain (loss) | (10.49) | 17.15 | 7.46 | 11.68 | 8.68 | 7.05 |
| Total from investment operations | (9.74) | 18.25 | 8.64 | 12.71 | 9.69 | 7.84 |
| Distributions from net investment income | (.13) | (1.04) | (1.21) | (.88) | (.86) | (.65) |
| Distributions from net realized gain | (3.15) | (3.98) | (5.24) | (1.14) | (1.64) | (.66) |
| Total distributions | (3.29)C | (5.01)D | (6.45) | (2.02) | (2.50) | (1.31) |
| Redemption fees added to paid in capitalB,E | – | – | – | – | – | – |
| Net asset value, end of period | $87.58 | $100.61 | $87.37 | $85.18 | $74.49 | $67.30 |
| Total ReturnF,G,H | (9.99)% | 21.60% | 10.23% | 17.29% | 14.67% | 12.93% |
| Ratios to Average Net AssetsI,J | ||||||
| Expenses before reductions | 1.32%K | 1.32% | 1.33% | 1.36% | 1.38% | 1.40% |
| Expenses net of fee waivers, if any | 1.32%K | 1.32% | 1.33% | 1.36% | 1.38% | 1.40% |
| Expenses net of all reductions | 1.31%K | 1.32% | 1.33% | 1.35% | 1.38% | 1.40% |
| Net investment income (loss) | 1.59%K | 1.18% | 1.34% | 1.30% | 1.45% | 1.24% |
| Supplemental Data | ||||||
| Net assets, end of period (000 omitted) | $69,028 | $81,489 | $61,421 | $52,024 | $39,047 | $31,496 |
| Portfolio turnover rateL | 61%K | 42%M | 31% | 28% | 35% | 57% |
A For the year ended February 29.
B Calculated based on average shares outstanding during the period.
C Total distributions of $3.29 per share is comprised of distributions from net investment income of $.134 and distributions from net realized gain of $3.152 per share.
D Total distributions of $5.01 per share is comprised of distributions from net investment income of $1.036 and distributions from net realized gain of $3.976 per share.
E Amount represents less than $.005 per share.
F Total returns for periods of less than one year are not annualized.
G Total returns would have been lower if certain expenses had not been reduced during the applicable periods shown.
H Total returns do not include the effect of the sales charges.
I Fees and expenses of any underlying Fidelity Central Funds are not included in the Fund's expense ratio. The Fund indirectly bears its proportionate share of the expenses of any underlying Fidelity Central Funds.
J Expense ratios reflect operating expenses of the class. Expenses before reductions do not reflect amounts reimbursed by the investment adviser or reductions from brokerage service arrangements or reductions from other expense offset arrangements and do not represent the amount paid by the class during periods when reimbursements or reductions occur. Expenses net of fee waivers reflect expenses after reimbursement by the investment adviser but prior to reductions from brokerage service arrangements or other expense offset arrangements. Expenses net of all reductions represent the net expenses paid by the class.
K Annualized
L Amount does not include the portfolio activity of any underlying Fidelity Central Funds.
M Portfolio turnover rate excludes securities received or delivered in-kind.
See accompanying notes which are an integral part of the financial statements.
Financial Highlights — Consumer Staples Portfolio Class B
| Six months ended (Unaudited) | Years ended February 28, | |||||
| August 31, | 2015 | 2015 | 2014 | 2013 | 2012A | 2011 |
| Selected Per–Share Data | ||||||
| Net asset value, beginning of period | $100.13 | $86.90 | $84.72 | $74.01 | $66.83 | $60.37 |
| Income from Investment Operations | ||||||
| Net investment income (loss)B | .52 | .63 | .71 | .61 | .64 | .46 |
| Net realized and unrealized gain (loss) | (10.44) | 17.06 | 7.40 | 11.61 | 8.61 | 6.98 |
| Total from investment operations | (9.92) | 17.69 | 8.11 | 12.22 | 9.25 | 7.44 |
| Distributions from net investment income | (.03) | (.48) | (.69) | (.37) | (.43) | (.32) |
| Distributions from net realized gain | (3.15) | (3.98) | (5.24) | (1.14) | (1.64) | (.66) |
| Total distributions | (3.19)C | (4.46) | (5.93) | (1.51) | (2.07) | (.98) |
| Redemption fees added to paid in capitalB,D | – | – | – | – | – | – |
| Net asset value, end of period | $87.02 | $100.13 | $86.90 | $84.72 | $74.01 | $66.83 |
| Total ReturnE,F,G | (10.21)% | 21.01% | 9.63% | 16.68% | 14.06% | 12.35% |
| Ratios to Average Net AssetsH,I | ||||||
| Expenses before reductions | 1.81%J | 1.82% | 1.86% | 1.89% | 1.91% | 1.91% |
| Expenses net of fee waivers, if any | 1.81%J | 1.82% | 1.86% | 1.89% | 1.91% | 1.91% |
| Expenses net of all reductions | 1.80%J | 1.82% | 1.86% | 1.88% | 1.90% | 1.91% |
| Net investment income (loss) | 1.10%J | .68% | .81% | .78% | .93% | .73% |
| Supplemental Data | ||||||
| Net assets, end of period (000 omitted) | $10,630 | $15,799 | $17,388 | $18,548 | $19,330 | $20,033 |
| Portfolio turnover rateK | 61%J | 42%L | 31% | 28% | 35% | 57% |
A For the year ended February 29.
B Calculated based on average shares outstanding during the period.
C Total distributions of $3.19 per share is comprised of distributions from net investment income of $.033 and distributions from net realized gain of $3.152 per share.
D Amount represents less than $.005 per share.
E Total returns for periods of less than one year are not annualized.
F Total returns would have been lower if certain expenses had not been reduced during the applicable periods shown.
G Total returns do not include the effect of the contingent deferred sales charge.
H Fees and expenses of any underlying Fidelity Central Funds are not included in the Fund's expense ratio. The Fund indirectly bears its proportionate share of the expenses of any underlying Fidelity Central Funds.
I Expense ratios reflect operating expenses of the class. Expenses before reductions do not reflect amounts reimbursed by the investment adviser or reductions from brokerage service arrangements or reductions from other expense offset arrangements and do not represent the amount paid by the class during periods when reimbursements or reductions occur. Expenses net of fee waivers reflect expenses after reimbursement by the investment adviser but prior to reductions from brokerage service arrangements or other expense offset arrangements. Expenses net of all reductions represent the net expenses paid by the class.
J Annualized
K Amount does not include the portfolio activity of any underlying Fidelity Central Funds.
L Portfolio turnover rate excludes securities received or delivered in-kind.
See accompanying notes which are an integral part of the financial statements.
Financial Highlights — Consumer Staples Portfolio Class C
| Six months ended (Unaudited) | Years ended February 28, | |||||
| August 31, | 2015 | 2015 | 2014 | 2013 | 2012A | 2011 |
| Selected Per–Share Data | ||||||
| Net asset value, beginning of period | $99.27 | $86.32 | $84.28 | $73.75 | $66.71 | $60.29 |
| Income from Investment Operations | ||||||
| Net investment income (loss)B | .52 | .65 | .75 | .65 | .68 | .49 |
| Net realized and unrealized gain (loss) | (10.34) | 16.93 | 7.36 | 11.55 | 8.59 | 7.00 |
| Total from investment operations | (9.82) | 17.58 | 8.11 | 12.20 | 9.27 | 7.49 |
| Distributions from net investment income | (.06) | (.65) | (.84) | (.53) | (.59) | (.41) |
| Distributions from net realized gain | (3.15) | (3.98) | (5.24) | (1.14) | (1.64) | (.66) |
| Total distributions | (3.22)C | (4.63) | (6.07)D | (1.67) | (2.23) | (1.07) |
| Redemption fees added to paid in capitalB,E | – | – | – | – | – | – |
| Net asset value, end of period | $86.23 | $99.27 | $86.32 | $84.28 | $73.75 | $66.71 |
| Total ReturnF,G,H | (10.20)% | 21.03% | 9.70% | 16.73% | 14.14% | 12.44% |
| Ratios to Average Net AssetsI,J | ||||||
| Expenses before reductions | 1.80%K | 1.80% | 1.82% | 1.83% | 1.85% | 1.86% |
| Expenses net of fee waivers, if any | 1.80%K | 1.80% | 1.82% | 1.83% | 1.85% | 1.86% |
| Expenses net of all reductions | 1.79%K | 1.80% | 1.81% | 1.82% | 1.84% | 1.85% |
| Net investment income (loss) | 1.11%K | .70% | .85% | .83% | .99% | .79% |
| Supplemental Data | ||||||
| Net assets, end of period (000 omitted) | $219,219 | $228,151 | $164,669 | $134,966 | $102,321 | $81,239 |
| Portfolio turnover rateL | 61%K | 42%M | 31% | 28% | 35% | 57% |
A For the year ended February 29.
B Calculated based on average shares outstanding during the period.
C Total distributions of $3.22 per share is comprised of distributions from net investment income of $.064 and distributions from net realized gain of $3.152 per share.
D Total distributions of $6.07 per share is comprised of distributions from net investment income of $.837 and distributions from net realized gain of $5.237 per share.
E Amount represents less than $.005 per share.
F Total returns for periods of less than one year are not annualized.
G Total returns would have been lower if certain expenses had not been reduced during the applicable periods shown.
H Total returns do not include the effect of the contingent deferred sales charge.
I Fees and expenses of any underlying Fidelity Central Funds are not included in the Fund's expense ratio. The Fund indirectly bears its proportionate share of the expenses of any underlying Fidelity Central Funds.
J Expense ratios reflect operating expenses of the class. Expenses before reductions do not reflect amounts reimbursed by the investment adviser or reductions from brokerage service arrangements or reductions from other expense offset arrangements and do not represent the amount paid by the class during periods when reimbursements or reductions occur. Expenses net of fee waivers reflect expenses after reimbursement by the investment adviser but prior to reductions from brokerage service arrangements or other expense offset arrangements. Expenses net of all reductions represent the net expenses paid by the class.
K Annualized
L Amount does not include the portfolio activity of any underlying Fidelity Central Funds.
M Portfolio turnover rate excludes securities received or delivered in-kind.
See accompanying notes which are an integral part of the financial statements.
Financial Highlights — Consumer Staples Portfolio
| Six months ended (Unaudited) | Years ended February 28, | |||||
| August 31, | 2015 | 2015 | 2014 | 2013 | 2012A | 2011 |
| Selected Per–Share Data | ||||||
| Net asset value, beginning of period | $102.03 | $88.51 | $86.17 | $75.29 | $67.98 | $61.34 |
| Income from Investment Operations | ||||||
| Net investment income (loss)B | 1.03 | 1.64 | 1.69 | 1.48 | 1.42 | 1.14 |
| Net realized and unrealized gain (loss) | (10.66) | 17.40 | 7.55 | 11.82 | 8.76 | 7.14 |
| Total from investment operations | (9.63) | 19.04 | 9.24 | 13.30 | 10.18 | 8.28 |
| Distributions from net investment income | (.22) | (1.54) | (1.66) | (1.28) | (1.24) | (.98) |
| Distributions from net realized gain | (3.15) | (3.98) | (5.24) | (1.14) | (1.64) | (.66) |
| Total distributions | (3.37) | (5.52) | (6.90) | (2.42) | (2.87)C | (1.64) |
| Redemption fees added to paid in capitalB,D | – | – | – | – | – | – |
| Net asset value, end of period | $89.03 | $102.03 | $88.51 | $86.17 | $75.29 | $67.98 |
| Total ReturnE,F | (9.74)% | 22.27% | 10.82% | 17.94% | 15.30% | 13.55% |
| Ratios to Average Net AssetsG,H | ||||||
| Expenses before reductions | .77%I | .77% | .79% | .81% | .83% | .86% |
| Expenses net of fee waivers, if any | .77%I | .77% | .79% | .81% | .83% | .86% |
| Expenses net of all reductions | .76%I | .77% | .79% | .80% | .82% | .86% |
| Net investment income (loss) | 2.14%I | 1.73% | 1.88% | 1.85% | 2.01% | 1.78% |
| Supplemental Data | ||||||
| Net assets, end of period (000 omitted) | $1,833,150 | $2,173,970 | $1,328,594 | $1,425,055 | $1,202,440 | $877,548 |
| Portfolio turnover rateJ | 61%I | 42%K | 31% | 28% | 35% | 57% |
A For the year ended February 29.
B Calculated based on average shares outstanding during the period.
C Total distributions of $2.87 per share is comprised of distributions from net investment income of $1.236 and distributions from net realized gain of $1.637 per share.
D Amount represents less than $.005 per share.
E Total returns for periods of less than one year are not annualized.
F Total returns would have been lower if certain expenses had not been reduced during the applicable periods shown.
G Fees and expenses of any underlying Fidelity Central Funds are not included in the Fund's expense ratio. The Fund indirectly bears its proportionate share of the expenses of any underlying Fidelity Central Funds.
H Expense ratios reflect operating expenses of the class. Expenses before reductions do not reflect amounts reimbursed by the investment adviser or reductions from brokerage service arrangements or reductions from other expense offset arrangements and do not represent the amount paid by the class during periods when reimbursements or reductions occur. Expenses net of fee waivers reflect expenses after reimbursement by the investment adviser but prior to reductions from brokerage service arrangements or other expense offset arrangements. Expenses net of all reductions represent the net expenses paid by the class.
I Annualized
J Amount does not include the portfolio activity of any underlying Fidelity Central Funds.
K Portfolio turnover rate excludes securities received or delivered in-kind.
See accompanying notes which are an integral part of the financial statements.
Financial Highlights — Consumer Staples Portfolio Class I
| Six months ended (Unaudited) | Years ended February 28, | |||||
| August 31, | 2015 | 2015 | 2014 | 2013 | 2012A | 2011 |
| Selected Per–Share Data | ||||||
| Net asset value, beginning of period | $101.91 | $88.33 | $85.92 | $75.14 | $67.84 | $61.26 |
| Income from Investment Operations | ||||||
| Net investment income (loss)B | 1.03 | 1.59 | 1.66 | 1.45 | 1.39 | 1.15 |
| Net realized and unrealized gain (loss) | (10.67) | 17.40 | 7.53 | 11.79 | 8.73 | 7.13 |
| Total from investment operations | (9.64) | 18.99 | 9.19 | 13.24 | 10.12 | 8.28 |
| Distributions from net investment income | (.22) | (1.44) | (1.54) | (1.32) | (1.19) | (1.04) |
| Distributions from net realized gain | (3.15) | (3.98) | (5.24) | (1.14) | (1.64) | (.66) |
| Total distributions | (3.37) | (5.41)C | (6.78) | (2.46) | (2.82)D | (1.70) |
| Redemption fees added to paid in capitalB,E | – | – | – | – | – | – |
| Net asset value, end of period | $88.90 | $101.91 | $88.33 | $85.92 | $75.14 | $67.84 |
| Total ReturnF,G | (9.76)% | 22.26% | 10.80% | 17.90% | 15.24% | 13.57% |
| Ratios to Average Net AssetsH,I | ||||||
| Expenses before reductions | .78%J | .80% | .82% | .85% | .87% | .87% |
| Expenses net of fee waivers, if any | .77%J | .80% | .82% | .85% | .87% | .87% |
| Expenses net of all reductions | .77%J | .80% | .82% | .84% | .87% | .87% |
| Net investment income (loss) | 2.13%J | 1.70% | 1.85% | 1.81% | 1.96% | 1.77% |
| Supplemental Data | ||||||
| Net assets, end of period (000 omitted) | $169,378 | $198,538 | $154,271 | $378,731 | $163,544 | $237,883 |
| Portfolio turnover rateK | 61%J | 42%L | 31% | 28% | 35% | 57% |
A For the year ended February 29.
B Calculated based on average shares outstanding during the period.
C Total distributions of $5.41 per share is comprised of distributions from net investment income of $1.436 and distributions from net realized gain of $3.976 per share.
D Total distributions of $2.82 per share is comprised of distributions from net investment income of $1.186 and distributions from net realized gain of $1.637 per share.
E Amount represents less than $.005 per share.
F Total returns for periods of less than one year are not annualized.
G Total returns would have been lower if certain expenses had not been reduced during the applicable periods shown.
H Fees and expenses of any underlying Fidelity Central Funds are not included in the Fund's expense ratio. The Fund indirectly bears its proportionate share of the expenses of any underlying Fidelity Central Funds.
I Expense ratios reflect operating expenses of the class. Expenses before reductions do not reflect amounts reimbursed by the investment adviser or reductions from brokerage service arrangements or reductions from other expense offset arrangements and do not represent the amount paid by the class during periods when reimbursements or reductions occur. Expenses net of fee waivers reflect expenses after reimbursement by the investment adviser but prior to reductions from brokerage service arrangements or other expense offset arrangements. Expenses net of all reductions represent the net expenses paid by the class.
J Annualized
K Amount does not include the portfolio activity of any underlying Fidelity Central Funds.
L Portfolio turnover rate excludes securities received or delivered in-kind.
See accompanying notes which are an integral part of the financial statements.
Notes to Financial Statements (Unaudited)
For the period ended August 31, 2015
1. Organization.
Consumer Staples Portfolio (the Fund) is a non-diversified fund of Fidelity Select Portfolios (the Trust) and is authorized to issue an unlimited number of shares. The Trust is registered under the Investment Company Act of 1940, as amended (the 1940 Act), as an open-end management investment company organized as a Massachusetts business trust. The Fund invests primarily in securities of companies whose principal business activities fall within specific industries. The Fund offers Class A, Class T, Class C, Consumer Staples and Class I (formerly Institutional Class) shares, each of which, along with Class B shares, has equal rights as to assets and voting privileges. Class B shares are closed to new accounts and additional purchases, except for exchanges and reinvestments. Each class has exclusive voting rights with respect to matters that affect that class. Class B shares will automatically convert to Class A shares after a holding period of seven years from the initial date of purchase.
2. Investments in Fidelity Central Funds.
The Fund invests in Fidelity Central Funds, which are open-end investment companies generally available only to other investment companies and accounts managed by the investment adviser and its affiliates. The Fund's Schedule of Investments lists each of the Fidelity Central Funds held as of period end, if any, as an investment of the Fund, but does not include the underlying holdings of each Fidelity Central Fund. As an Investing Fund, the Fund indirectly bears its proportionate share of the expenses of the underlying Fidelity Central Funds.
The Money Market Central Funds seek preservation of capital and current income and are managed by Fidelity Investments Money Management, Inc. (FIMM), an affiliate of the investment adviser. Annualized expenses of the Money Market Central Funds as of their most recent shareholder report date are less than .01%.
A complete unaudited list of holdings for each Fidelity Central Fund is available upon request or at the Securities and Exchange Commission (the SEC) website at www.sec.gov. In addition, the financial statements of the Fidelity Central Funds are available on the SEC website or upon request.
3. Significant Accounting Policies.
The financial statements have been prepared in conformity with accounting principles generally accepted in the United States of America (GAAP), which require management to make certain estimates and assumptions at the date of the financial statements. Actual results could differ from those estimates. Subsequent events, if any, through the date that the financial statements were issued have been evaluated in the preparation of the financial statements. The following summarizes the significant accounting policies of the Fund:
Investment Valuation. Investments are valued as of 4:00 p.m. Eastern time on the last calendar day of the period. The Board of Trustees (the Board) has delegated the day to day responsibility for the valuation of the Fund's investments to the Fidelity SelectCo, LLC (SelectCo) Fair Value Committee (the Committee). In accordance with valuation policies and procedures approved by the Board, the Fund attempts to obtain prices from one or more third party pricing vendors or brokers to value its investments. When current market prices, quotations or currency exchange rates are not readily available or reliable, investments will be fair valued in good faith by the Committee, in accordance with procedures adopted by the Board. Factors used in determining fair value vary by investment type and may include market or investment specific events. The frequency with which these procedures are used cannot be predicted and they may be utilized to a significant extent. The Committee oversees the Fund's valuation policies and procedures and reports to the Board on the Committee's activities and fair value determinations. The Board monitors the appropriateness of the procedures used in valuing the Fund's investments and ratifies the fair value determinations of the Committee.
The Fund categorizes the inputs to valuation techniques used to value its investments into a disclosure hierarchy consisting of three levels as shown below:
- Level 1 – quoted prices in active markets for identical investments
- Level 2 – other significant observable inputs (including quoted prices for similar investments, interest rates, prepayment speeds, etc.)
- Level 3 – unobservable inputs (including the Fund's own assumptions based on the best information available)
Valuation techniques used to value the Fund's investments by major category are as follows:
Equity securities, including restricted securities, for which market quotations are readily available, are valued at the last reported sale price or official closing price as reported by a third party pricing vendor on the primary market or exchange on which they are traded and are categorized as Level 1 in the hierarchy. In the event there were no sales during the day or closing prices are not available, securities are valued at the last quoted bid price or may be valued using the last available price and are generally categorized as Level 2 in the hierarchy. For foreign equity securities, when market or security specific events arise, comparisons to the valuation of American Depositary Receipts (ADRs), futures contracts, Exchange-Traded Funds (ETFs) and certain indexes as well as quoted prices for similar securities may be used and would be categorized as Level 2 in the hierarchy. Utilizing these techniques may result in transfers between Level 1 and Level 2. For equity securities, including restricted securities, where observable inputs are limited, assumptions about market activity and risk are used and these securities may be categorized as Level 3 in the hierarchy.
Investments in open-end mutual funds, including the Fidelity Central Funds, are valued at their closing net asset value (NAV) each business day and are categorized as Level 1 in the hierarchy.
Changes in valuation techniques may result in transfers in or out of an assigned level within the disclosure hierarchy. The aggregate value of investments by input level as of August 31, 2015, is included at the end of the Fund's Schedule of Investments.
Foreign Currency. The Fund may use foreign currency contracts to facilitate transactions in foreign-denominated securities. Gains and losses from these transactions may arise from changes in the value of the foreign currency or if the counterparties do not perform under the contracts' terms.
Foreign-denominated assets, including investment securities, and liabilities are translated into U.S. dollars at the exchange rates at period end. Purchases and sales of investment securities, income and dividends received and expenses denominated in foreign currencies are translated into U.S. dollars at the exchange rate in effect on the transaction date.
The effects of exchange rate fluctuations on investments are included with the net realized and unrealized gain (loss) on investment securities. Other foreign currency transactions resulting in realized and unrealized gain (loss) are disclosed separately.
Investment Transactions and Income. For financial reporting purposes, the Fund's investment holdings and NAV include trades executed through the end of the last business day of the period. The NAV per share for processing shareholder transactions is calculated as of the close of business of the New York Stock Exchange (NYSE), normally 4:00 p.m. Eastern time and includes trades executed through the end of the prior business day. Gains and losses on securities sold are determined on the basis of identified cost and may include proceeds received from litigation. Dividend income is recorded on the ex-dividend date, except for certain dividends from foreign securities where the ex-dividend date may have passed, which are recorded as soon as the Fund is informed of the ex-dividend date. Non-cash dividends included in dividend income, if any, are recorded at the fair market value of the securities received. Income and capital gain distributions from Fidelity Central Funds, if any, are recorded on the ex-dividend date. Interest income is accrued as earned and includes coupon interest and amortization of premium and accretion of discount on debt securities as applicable. Investment income is recorded net of foreign taxes withheld where recovery of such taxes is uncertain.
Class Allocations and Expenses. Investment income, realized and unrealized capital gains and losses, common expenses of the Fund, and certain fund-level expense reductions, if any, are allocated daily on a pro-rata basis to each class based on the relative net assets of each class to the total net assets of the Fund. Each class differs with respect to transfer agent and distribution and service plan fees incurred. Certain expense reductions may also differ by class. For the reporting period, the allocated portion of income and expenses to each class as a percent of its average net assets may vary due to the timing of recording these transactions in relation to fluctuating net assets of the classes. Expenses directly attributable to a fund are charged to that fund. Expenses attributable to more than one fund are allocated among the respective funds on the basis of relative net assets or other appropriate methods. Expense estimates are accrued in the period to which they relate and adjustments are made when actual amounts are known.
Deferred Trustee Compensation. Under a Deferred Compensation Plan (the Plan), independent Trustees may elect to defer receipt of a portion of their annual compensation. Deferred amounts are invested in a cross-section of Fidelity funds, are marked-to-market and remain in the Fund until distributed in accordance with the Plan. The investment of deferred amounts and the offsetting payable to the Trustees are included in the accompanying Statement of Assets and Liabilities.
Income Tax Information and Distributions to Shareholders. Each year, the Fund intends to qualify as a regulated investment company under Subchapter M of the Internal Revenue Code, including distributing substantially all of its taxable income and realized gains. As a result, no provision for U.S. Federal income taxes is required. The Fund files a U.S. federal tax return, in addition to state and local tax returns as required. The Fund's federal income tax returns are subject to examination by the Internal Revenue Service (IRS) for a period of three fiscal years after they are filed. State and local tax returns may be subject to examination for an additional fiscal year depending on the jurisdiction. Foreign taxes are provided for based on the Fund's understanding of the tax rules and rates that exist in the foreign markets in which it invests.
Distributions are declared and recorded on the ex-dividend date. Income dividends and capital gain distributions are declared separately for each class. Income and capital gain distributions are determined in accordance with income tax regulations, which may differ from GAAP.
Capital accounts within the financial statements are adjusted for permanent book-tax differences. These adjustments have no impact on net assets or the results of operations. Capital accounts are not adjusted for temporary book-tax differences which will reverse in a subsequent period.
Book-tax differences are primarily due to foreign currency transactions, redemptions in kind, deferred trustees compensation and losses deferred due to wash sales.
The federal tax cost of investment securities and unrealized appreciation (depreciation) as of period end were as follows:
| Gross unrealized appreciation | $639,524,517 |
| Gross unrealized depreciation | (174,608,013) |
| Net unrealized appreciation (depreciation) on securities | $464,916,504 |
| Tax cost | $2,255,783,082 |
Trading (Redemption) Fees. Shares held by investors in the Fund less than 30 days may be subject to a redemption fee equal to .75% of the NAV of shares redeemed. All redemption fees, which reduce the proceeds of the shareholder redemption, are retained by the Fund and accounted for as an addition to paid in capital.
4. Purchases and Sales of Investments.
Purchases and sales of securities, other than short-term securities, aggregated $873,186,629 and $945,351,325, respectively.
5. Fees and Other Transactions with Affiliates.
Management Fee. Fidelity SelectCo, LLC (the investment adviser) and its affiliates provide the Fund with investment management related services for which the Fund pays a monthly management fee. The management fee is the sum of an individual fund fee rate that is based on an annual rate of .30% of the Fund's average net assets and an annualized group fee rate that averaged .25% during the period. The group fee rate is based upon the average net assets of all the mutual funds advised by Fidelity Management & Research Company (FMR) and the investment adviser. The group fee rate decreases as assets under management increase and increases as assets under management decrease. For the reporting period, the total annualized management fee rate was .55% of the Fund's average net assets.
Distribution and Service Plan Fees. In accordance with Rule 12b-1 of the 1940 Act, the Fund has adopted separate Distribution and Service Plans for each class of shares. Certain classes pay Fidelity Distributors Corporation (FDC), an affiliate of the investment adviser, separate Distribution and Service Fees, each of which is based on an annual percentage of each class' average net assets. In addition, FDC may pay financial intermediaries for selling shares of the Fund and providing shareholder support services. For the period, the Distribution and Service Fee rates, total fees and amounts retained by FDC were as follows:
| Distribution Fee | Service Fee | Total Fees | Retained by FDC |
|
| Class A | -% | .25% | $516,274 | $– |
| Class T | .25% | .25% | 193,944 | – |
| Class B | .75% | .25% | 67,677 | 50,758 |
| Class C | .75% | .25% | 1,149,757 | 259,440 |
| $1,927,652 | $310,198 |
Sales Load. FDC may receive a front-end sales charge of up to 5.75% for selling Class A shares and 3.50% for selling Class T shares, some of which is paid to financial intermediaries for selling shares of the Fund. Depending on the holding period, FDC may receive contingent deferred sales charges levied on Class A, Class T, Class B, and Class C redemptions. The deferred sales charges range from 5.00% to 1.00% for Class B shares, 1.00% for Class C shares, 1.00% for certain purchases of Class A shares and .25% for certain purchases of Class T shares.
For the period, sales charge amounts retained by FDC were as follows:
| Retained by FDC |
|
| Class A | $181,597 |
| Class T | 24,783 |
| Class B* | 1,710 |
| Class C* | 12,483 |
| $220,573 |
* When Class B and Class C shares are initially sold, FDC pays commissions from its own resources to financial intermediaries through which the sales are made.
Transfer Agent Fees. Fidelity Investments Institutional Operations Company, Inc., (FIIOC), an affiliate of the investment adviser, is the transfer, dividend disbursing and shareholder servicing agent for each class of the Fund. FIIOC receives account fees and asset-based fees that vary according to the account size and type of account of the shareholders of the respective classes of the Fund. FIIOC pays for typesetting, printing and mailing of shareholder reports, except proxy statements.
For the period, transfer agent fees for each class were as follows:
| Amount | % of Class-Level Average Net Assets* |
|
| Class A | $410,505 | .20 |
| Class T | 86,826 | .22 |
| Class B | 14,578 | .22 |
| Class C | 233,477 | .20 |
| Consumer Staples | 1,748,464 | .17 |
| Class I | 170,805 | .18 |
| $ 2,664,655 |
*Annualized
Accounting and Security Lending Fees. Fidelity Service Company, Inc. (FSC), an affiliate of the investment adviser, maintains the Fund's accounting records. The accounting fee is based on the level of average net assets for each month. Under a separate contract, FSC administers the security lending program. The security lending fee is based on the number and duration of lending transactions.
Brokerage Commissions. The Fund placed a portion of its portfolio transactions with brokerage firms which are affiliates of the investment adviser. Brokerage commissions are included in net realized gain (loss) and change in net unrealized appreciation (depreciation) in the Statement of Operations. The commissions paid to these affiliated firms were $8,070 for the period.
6. Committed Line of Credit.
The Fund participates with other funds managed by the investment adviser or an affiliate in a $4.25 billion credit facility (the "line of credit") to be utilized for temporary or emergency purposes to fund shareholder redemptions or for other short-term liquidity purposes. The Fund has agreed to pay commitment fees on its pro-rata portion of the line of credit, which amounted to $2,279 and is reflected in Miscellaneous expenses on the Statement of Operations. During the period, the Fund did not borrow on this line of credit.
7. Security Lending.
The Fund lends portfolio securities through a lending agent from time to time in order to earn additional income. On the settlement date of the loan, the Fund receives collateral (in the form of U.S. Treasury obligations, letters of credit and/or cash) against the loaned securities and maintains collateral in an amount not less than 100% of the market value of the loaned securities during the period of the loan. The market value of the loaned securities is determined at the close of business of the Fund and any additional required collateral is delivered to the Fund on the next business day. If the borrower defaults on its obligation to return the securities loaned because of insolvency or other reasons, the Fund may apply collateral received from the borrower against the obligation. The Fund may experience delays and costs in recovering the securities loaned. Any cash collateral received is invested in the Fidelity Securities Lending Cash Central Fund. The value of loaned securities and cash collateral at period end are disclosed on the Fund's Statement of Assets and Liabilities. Security lending income represents the income earned on investing cash collateral, less rebates paid to borrowers and any lending agent fees associated with the loan, plus any premium payments received for lending certain types of securities. Security lending income is presented in the Statement of Operations as a component of income from Fidelity Central Funds. Total security lending income during the period amounted to $140,230.
8. Expense Reductions.
Commissions paid to certain brokers with whom the investment adviser, or its affiliates, places trades on behalf of the Fund include an amount in addition to trade execution, which may be rebated back to the Fund to offset certain expenses. This amount totaled $98,315 for the period. In addition, through arrangements with the Fund's custodian, credits realized as a result of uninvested cash balances were used to reduce the Fund's expenses. During the period, these credits reduced the Fund's custody by $63.
In addition, during the period the investment adviser reimbursed and/or waived a portion of fund-level operating expenses in the amount of $11,417 and a portion of class-level operating expenses as follows:
| Amount | |
| Class A | $7,870 |
| Class T | 1,516 |
| Class B | 395 |
| Class C | 4,058 |
| Consumer Staples | 37,669 |
| Class I | 6,663 |
| $ 58,171 |
9. Distributions to Shareholders.
Distributions to shareholders of each class were as follows:
| Six months ended August 31, 2015 | Year ended February 28, 2015 | |
| From net investment income | ||
| Class A | $748,002 | $4,812,004 |
| Class T | 109,152 | 776,331 |
| Class B | 4,951 | 83,556 |
| Class C | 151,085 | 1,335,126 |
| Consumer Staples | 4,534,913 | 29,856,743 |
| Class I | 445,963 | 2,754,772 |
| Total | $5,994,066 | $39,618,532 |
| From net realized gain | ||
| Class A | $13,245,483 | $14,768,867 |
| Class T | 2,567,517 | 2,841,831 |
| Class B | 472,929 | 743,976 |
| Class C | 7,440,920 | 7,778,566 |
| Consumer Staples | 65,568,990 | 65,408,817 |
| Class I | 6,389,423 | 10,857,228 |
| Total | $95,685,262 | $102,399,285 |
10. Share Transactions.
Share transactions for each class were as follows and may contain automatic conversions between classes or exchanges between funds:
| Shares | Shares | Dollars | Dollars | |
| Six months ended August 31, 2015 | Year ended February 28, 2015 | Six months ended August 31, 2015 | Year ended February 28, 2015 | |
| Class A | ||||
| Shares sold | 823,694 | 1,066,097 | $78,762,656 | $101,322,941 |
| Reinvestment of distributions | 139,522 | 205,710 | 13,557,335 | 18,829,531 |
| Shares redeemed | (605,912) | (931,333) | (57,741,721) | (86,559,239) |
| Net increase (decrease) | 357,304 | 340,474 | $34,578,270 | $33,593,233 |
| Class T | ||||
| Shares sold | 93,924 | 215,514 | $8,935,490 | $20,203,421 |
| Reinvestment of distributions | 26,837 | 38,102 | 2,588,978 | 3,463,287 |
| Shares redeemed | (142,485) | (146,712) | (13,456,409) | (13,666,581) |
| Net increase (decrease) | (21,724) | 106,904 | $(1,931,941) | $10,000,127 |
| Class B | ||||
| Shares sold | 2,493 | 7,270 | $232,612 | $675,777 |
| Reinvestment of distributions | 4,669 | 8,161 | $448,407 | $730,673 |
| Shares redeemed | (42,792) | (57,733) | (3,995,750) | (5,359,510) |
| Net increase (decrease) | (35,630) | (42,302) | $(3,314,731) | $(3,953,060) |
| Class C | ||||
| Shares sold | 449,616 | 636,469 | $42,091,266 | $59,593,472 |
| Reinvestment of distributions | 70,230 | 86,847 | 6,683,108 | 7,772,854 |
| Shares redeemed | (275,660) | (332,705) | (25,673,793) | (30,479,924) |
| Net increase (decrease) | 244,186 | 390,611 | $23,100,581 | $36,886,402 |
| Consumer Staples | ||||
| Shares sold | 1,753,451 | 8,889,529 | $169,496,786 | $838,041,591 |
| Reinvestment of distributions | 690,724 | 985,926 | 67,594,280 | 91,713,079 |
| Shares redeemed | (3,159,236) | (3,580,043) | (305,508,464) | (340,719,360) |
| Net increase (decrease) | (715,061) | 6,295,412 | $(68,417,398) | $589,035,310 |
| Class I | ||||
| Shares sold | 493,672 | 3,870,748A | $47,529,891 | $354,438,000A |
| Reinvestment of distributions | 56,913 | 135,150 | 5,562,149 | 12,187,732 |
| Shares redeemed | (593,677) | (3,804,175)B | (56,890,561) | (345,400,883)B |
| Net increase (decrease) | (43,092) | 201,723 | $(3,798,521) | $21,224,849 |
A Amount includes in-kind exchanges.
B Amount includes in-kind redemptions.
11. Other.
The Fund's organizational documents provide former and current trustees and officers with a limited indemnification against liabilities arising in connection with the performance of their duties to the Fund. In the normal course of business, the Fund may also enter into contracts that provide general indemnifications. The Fund's maximum exposure under these arrangements is unknown as this would be dependent on future claims that may be made against the Fund. The risk of material loss from such claims is considered remote.
Mutual funds managed by the investment adviser or its affiliates were the owners of record, in the aggregate, of approximately 26% of the total outstanding shares of the Fund.
Gold Portfolio
Consolidated Investment Summary (Unaudited)
The information in the following tables is based on the consolidated investments of the Fund.Top Ten Holdings as of August 31, 2015
| % of fund's net assets | % of fund's net assets 6 months ago | |
| Goldcorp, Inc. | 8.0 | 8.8 |
| Randgold Resources Ltd. sponsored ADR | 7.8 | 7.1 |
| Franco-Nevada Corp. | 6.3 | 6.1 |
| Newcrest Mining Ltd. | 5.6 | 6.2 |
| Agnico Eagle Mines Ltd. (Canada) | 5.6 | 5.0 |
| Silver Bullion | 5.3 | 4.2 |
| Gold Bullion | 5.2 | 6.2 |
| Newmont Mining Corp. | 4.5 | 4.0 |
| B2Gold Corp. | 3.7 | 3.4 |
| Royal Gold, Inc. | 3.2 | 3.6 |
| 55.2 |
Top Industries (% of fund's net assets)
| As of August 31, 2015 | ||
| Gold | 87.1% | |
| Commodities & Related Investments* | 10.5% | |
| Precious Metals & Minerals | 1.1% | |
| Silver | 0.7% | |
| Diversified Metals & Mining | 0.2% | |
| All Others* | 0.4% | |

* Includes gold bullion and/or silver bullion.
| As of February 28, 2015 | ||
| Gold | 87.6% | |
| Commodities & Related Investments* | 10.4% | |
| Precious Metals & Minerals | 0.1% | |
| Silver | 0.7% | |
| Diversified Metals & Mining | 0.2% | |
| All Others* | 1.0% | |

* Includes gold bullion and/or silver bullion.
* Includes short-term investments and net other assets (liabilities).
Geographic Diversification (% of fund's net assets)
| As of August 31, 2015 | ||
| Canada | 57.9% | |
| United States of America* | 18.7% | |
| Bailiwick of Jersey | 8.4% | |
| Australia | 7.4% | |
| South Africa | 5.6% | |
| United Kingdom | 0.7% | |
| Peru | 0.7% | |
| Cayman Islands | 0.4% | |
| China | 0.2% | |

Percentages are based on country or territory of incorporation and are adjusted for the effect of futures contracts, if applicable.
| As of February 28, 2015 | ||
| Canada | 55.8% | |
| United States of America* | 19.1% | |
| Australia | 8.1% | |
| Bailiwick of Jersey | 7.9% | |
| South Africa | 6.9% | |
| Peru | 0.8% | |
| Bermuda | 0.7% | |
| Cayman Islands | 0.4% | |
| United Kingdom | 0.3% | |

Percentages are based on country or territory of incorporation and are adjusted for the effect of futures contracts, if applicable.
Gold Portfolio
Consolidated Investments August 31, 2015 (Unaudited)
Showing Percentage of Net Assets
| Common Stocks - 89.1% | |||
| Shares | Value | ||
| Australia - 7.4% | |||
| Metals & Mining - 7.4% | |||
| Gold - 7.4% | |||
| Beadell Resources Ltd. (a) | 7,587,418 | $755,942 | |
| Evolution Mining Ltd. | 352,543 | 255,905 | |
| Medusa Mining Ltd. (a)(b) | 1,228,595 | 424,050 | |
| Newcrest Mining Ltd. (b) | 5,941,753 | 47,409,487 | |
| Northern Star Resources Ltd. | 4,351,118 | 6,254,876 | |
| Perseus Mining Ltd.: | |||
| (Australia) (b) | 1,417,134 | 383,231 | |
| (Canada) (b) | 1,300,000 | 375,494 | |
| Regis Resources Ltd. (a)(b) | 2,832,191 | 2,932,594 | |
| Resolute Mng Ltd. (b) | 2,390,161 | 450,754 | |
| Saracen Mineral Holdings Ltd. (b) | 8,462,787 | 2,649,919 | |
| Silver Lake Resources Ltd.(a)(b) | 4,145,985 | 427,821 | |
| 62,320,073 | |||
| Bailiwick of Jersey - 8.4% | |||
| Metals & Mining - 8.4% | |||
| Gold - 8.4% | |||
| Lydian International Ltd. (b) | 2,325,200 | 530,222 | |
| Polyus Gold International Ltd. (a) | 222,400 | 648,418 | |
| Polyus Gold International Ltd. sponsored GDR | 1,340,231 | 3,886,670 | |
| Randgold Resources Ltd. sponsored ADR (a) | 1,093,995 | 65,956,959 | |
| 71,022,269 | |||
| Bermuda - 0.0% | |||
| Metals & Mining - 0.0% | |||
| Steel - 0.0% | |||
| African Minerals Ltd. (a)(b) | 1,718,700 | 26 | |
| Canada - 57.9% | |||
| Metals & Mining - 57.9% | |||
| Diversified Metals & Mining - 0.2% | |||
| Ivanhoe Mines Ltd. (b) | 2,441,200 | 1,484,463 | |
| Ivanhoe Mines Ltd. Class A warrants 12/10/15 (b)(c) | 837,300 | 3,182 | |
| True Gold Mining, Inc. (b) | 171,000 | 23,396 | |
| 1,511,041 | |||
| Gold - 55.9% | |||
| Agnico Eagle Mines Ltd. (Canada) (a) | 1,933,401 | 47,350,395 | |
| Alacer Gold Corp. (b) | 2,131,963 | 4,650,907 | |
| Alamos Gold, Inc. | 1,745,766 | 7,192,195 | |
| Argonaut Gold, Inc. (b) | 5,077,262 | 5,132,836 | |
| Asanko Gold, Inc. (b) | 120,000 | 197,020 | |
| B2Gold Corp. (b) | 26,622,293 | 31,163,219 | |
| Barrick Gold Corp. | 3,877,569 | 26,968,498 | |
| Centerra Gold, Inc. | 369,900 | 1,869,744 | |
| Continental Gold, Inc. (b) | 5,415,600 | 11,567,221 | |
| Detour Gold Corp. (b) | 1,619,000 | 16,354,903 | |
| Detour Gold Corp. (b)(c) | 785,900 | 7,939,048 | |
| Eldorado Gold Corp. | 8,672,235 | 25,905,962 | |
| Franco-Nevada Corp. | 1,221,100 | 52,905,670 | |
| Goldcorp, Inc. | 4,861,500 | 67,438,718 | |
| Guyana Goldfields, Inc. (b) | 3,651,400 | 11,212,873 | |
| Guyana Goldfields, Inc. (b)(c) | 155,000 | 475,981 | |
| IAMGOLD Corp. (b) | 1,027,100 | 1,725,366 | |
| Kinross Gold Corp. (b) | 2,363,891 | 4,222,517 | |
| Kirkland Lake Gold, Inc. (a)(b) | 854,100 | 3,453,794 | |
| Klondex Mines Ltd. (b) | 26,000 | 69,170 | |
| Lake Shore Gold Corp. (a)(b) | 2,806,600 | 2,367,989 | |
| New Gold, Inc. (b) | 8,408,275 | 19,365,364 | |
| Novagold Resources, Inc. (b) | 1,697,100 | 6,346,710 | |
| OceanaGold Corp. | 2,849,500 | 5,024,962 | |
| Osisko Gold Royalties Ltd. | 473,793 | 5,499,254 | |
| Pilot Gold, Inc. (a)(b) | 1,418,150 | 452,739 | |
| Premier Gold Mines Ltd. (b)(d) | 10,516,022 | 19,104,053 | |
| Pretium Resources, Inc. (a)(b) | 890,138 | 4,763,280 | |
| Pretium Resources, Inc. (b)(c) | 225,000 | 1,204,013 | |
| Pretium Resources, Inc. (b)(e) | 225,000 | 1,204,013 | |
| Primero Mining Corp. (a)(b) | 1,735,500 | 5,026,038 | |
| Richmont Mines, Inc. (b) | 89,400 | 224,927 | |
| Romarco Minerals, Inc. (b) | 37,623,994 | 16,015,078 | |
| Romarco Minerals, Inc. (b)(c) | 5,900,000 | 2,511,402 | |
| Rubicon Minerals Corp. (a)(b) | 5,376,402 | 4,290,987 | |
| Seabridge Gold, Inc. (b) | 659,166 | 4,218,662 | |
| SEMAFO, Inc. (b) | 3,922,900 | 9,720,777 | |
| Teranga Gold Corp. (a)(b) | 85,000 | 37,473 | |
| Teranga Gold Corp. CDI unit (b) | 3,338,072 | 1,544,100 | |
| Timmins Gold Corp. (b) | 17,600 | 4,749 | |
| Torex Gold Resources, Inc. (b) | 22,555,000 | 21,258,893 | |
| Yamana Gold, Inc. | 6,697,220 | 12,573,832 | |
| 470,555,332 | |||
| Precious Metals & Minerals - 1.1% | |||
| Gold Standard Ventures Corp. (b) | 2,155,400 | 745,445 | |
| Tahoe Resources, Inc. (a) | 1,006,982 | 8,419,582 | |
| 9,165,027 | |||
| Silver - 0.7% | |||
| MAG Silver Corp. (b) | 292,700 | 2,153,645 | |
| Silver Wheaton Corp. | 345,900 | 4,240,930 | |
| 6,394,575 | |||
| TOTAL METALS & MINING | 487,625,975 | ||
| Cayman Islands - 0.4% | |||
| Metals & Mining - 0.4% | |||
| Gold - 0.4% | |||
| Endeavour Mining Corp. (b) | 8,267,400 | 3,581,953 | |
| China - 0.2% | |||
| Metals & Mining - 0.2% | |||
| Gold - 0.2% | |||
| Zijin Mining Group Co. Ltd. (H Shares) | 5,300,000 | 1,367,733 | |
| Peru - 0.7% | |||
| Metals & Mining - 0.7% | |||
| Gold - 0.7% | |||
| Compania de Minas Buenaventura SA sponsored ADR | 854,828 | 5,402,513 | |
| South Africa - 5.6% | |||
| Metals & Mining - 5.6% | |||
| Gold - 5.6% | |||
| AngloGold Ashanti Ltd. sponsored ADR (b) | 3,108,508 | 25,241,085 | |
| Gold Fields Ltd. sponsored ADR | 4,698,926 | 15,177,531 | |
| Harmony Gold Mining Co. Ltd. (b) | 1,484,000 | 1,286,113 | |
| Harmony Gold Mining Co. Ltd. sponsored ADR (a)(b) | 1,812,900 | 1,672,763 | |
| Sibanye Gold Ltd. ADR (a) | 846,906 | 4,031,273 | |
| 47,408,765 | |||
| United Kingdom - 0.7% | |||
| Metals & Mining - 0.7% | |||
| Gold - 0.7% | |||
| Acacia Mining PLC | 1,551,427 | 5,696,931 | |
| United States of America - 7.8% | |||
| Metals & Mining - 7.8% | |||
| Gold - 7.8% | |||
| McEwen Mining, Inc. (a) | 579,110 | 528,438 | |
| Newmont Mining Corp. | 2,212,100 | 37,760,547 | |
| Royal Gold, Inc. | 564,613 | 27,169,178 | |
| 65,458,163 | |||
| TOTAL COMMON STOCKS | |||
| (Cost $1,282,263,655) | 749,884,401 | ||
| Commodities - 10.5% | |||
| Troy Ounces | |||
| Gold Bullion(b) | 38,510 | 43,722,714 | |
| Silver Bullion(b) | 3,082,000 | 45,146,677 | |
| TOTAL COMMODITIES | |||
| (Cost $109,204,403) | 88,869,391 | ||
| Money Market Funds - 5.1% | |||
| Shares | |||
| Fidelity Cash Central Fund, 0.15% (f) | 4,283,847 | 4,283,847 | |
| Fidelity Securities Lending Cash Central Fund, 0.19% (f)(g) | 38,557,163 | 38,557,163 | |
| TOTAL MONEY MARKET FUNDS | |||
| (Cost $42,841,010) | 42,841,010 | ||
| TOTAL INVESTMENT PORTFOLIO - 104.7% | |||
| (Cost $1,434,309,068) | 881,594,802 | ||
| NET OTHER ASSETS (LIABILITIES) - (4.7)% | (39,872,327) | ||
| NET ASSETS - 100% | $841,722,475 |
Legend
(a) Security or a portion of the security is on loan at period end.
(b) Non-income producing
(c) Security exempt from registration under Rule 144A of the Securities Act of 1933. These securities may be resold in transactions exempt from registration, normally to qualified institutional buyers. At the end of the period, the value of these securities amounted to $12,133,626 or 1.4% of net assets.
(d) Affiliated company
(e) Restricted securities - Investment in securities not registered under the Securities Act of 1933 (excluding 144A issues). At the end of the period, the value of restricted securities (excluding 144A issues) amounted to $1,204,013 or 0.1% of net assets.
(f) Affiliated fund that is generally available only to investment companies and other accounts managed by Fidelity Investments. The rate quoted is the annualized seven-day yield of the fund at period end. A complete unaudited listing of the fund's holdings as of its most recent quarter end is available upon request. In addition, each Fidelity Central Fund's financial statements are available on the SEC's website or upon request.
(g) Investment made with cash collateral received from securities on loan.
Additional information on each restricted holding is as follows:
| Security | Acquisition Date | Acquisition Cost |
| Pretium Resources, Inc. | 3/31/11 | $2,172,293 |
Affiliated Central Funds
Information regarding fiscal year to date income earned by the Fund from investments in Fidelity Central Funds is as follows:
| Fund | Income earned |
| Fidelity Cash Central Fund | $3,107 |
| Fidelity Securities Lending Cash Central Fund | 122,985 |
| Total | $126,092 |
Consolidated Subsidiary
| Value, beginning of period | Purchases | Sales Proceeds | Dividend Income | Value, end of period | |
| Fidelity Select Gold Cayman Ltd. | $116,684,748 | $17,032,584 | $33,092,250 | $-- | $88,827,307 |
Other Affiliated Issuers
An affiliated company is a company in which the Fund has ownership of at least 5% of the voting securities. Fiscal year to date transactions with companies which are or were affiliates are as follows:
| Affiliate | Value, beginning of period | Purchases | Sales Proceeds | Dividend Income | Value, end of period |
| Premier Gold Mines Ltd. | $20,747,454 | $210,553 | $61,846 | $-- | $19,104,053 |
| Total | $20,747,454 | $210,553 | $61,846 | $-- | $19,104,053 |
Investment Valuation
The following is a summary of the inputs used, as of August 31, 2015, involving the Fund's assets and liabilities carried at fair value. The inputs or methodology used for valuing securities may not be an indication of the risk associated with investing in those securities. For more information on valuation inputs, and their aggregation into the levels used below, please refer to the Investment Valuation section in the accompanying Notes to Consolidated Financial Statements.
| Valuation Inputs at Reporting Date: | ||||
| Description | Total | Level 1 | Level 2 | Level 3 |
| Investments in Securities: | ||||
| Common Stocks | $749,884,401 | $701,188,775 | $48,695,600 | $26 |
| Commodities | 88,869,391 | 88,869,391 | -- | -- |
| Money Market Funds | 42,841,010 | 42,841,010 | -- | -- |
| Total Investments in Securities: | $881,594,802 | $832,899,176 | $48,695,600 | $26 |
The following is a summary of transfers between Level 1 and Level 2 for the period ended August 31, 2015. Transfers are assumed to have occurred at the beginning of the period, and are primarily attributable to the valuation techniques used for foreign equity securities, as discussed in the accompanying Notes to Consolidated Financial Statements:
| Transfers | Total |
| Level 1 to Level 2 | $69,980,874 |
| Level 2 to Level 1 | $0 |
See accompanying notes which are an integral part of the consolidated financial statements.
Gold Portfolio
Consolidated Financial Statements
Consolidated Statement of Assets and Liabilities
| August 31, 2015 (Unaudited) | ||
| Assets | ||
| Investment in securities, at value (including securities loaned of $35,369,234) — See accompanying schedule: Unaffiliated issuers (cost $1,250,849,595) | $730,780,348 | |
| Fidelity Central Funds (cost $42,841,010) | 42,841,010 | |
| Commodities (cost $109,204,403) | 88,869,391 | |
| Other affiliated issuers (cost $31,414,060) | 19,104,053 | |
| Total Investments (cost $1,434,309,068) | $881,594,802 | |
| Cash | 16,980 | |
| Foreign currency held at value (cost $71) | 71 | |
| Receivable for investments sold | 2,196,707 | |
| Receivable for fund shares sold | 1,267,170 | |
| Dividends receivable | 248,677 | |
| Distributions receivable from Fidelity Central Funds | 17,021 | |
| Prepaid expenses | 5,930 | |
| Other receivables | 29,569 | |
| Total assets | 885,376,927 | |
| Liabilities | ||
| Payable for investments purchased | $2,787,191 | |
| Unrealized depreciation on foreign currency contracts | 51 | |
| Payable for fund shares redeemed | 1,525,927 | |
| Accrued management fee | 383,048 | |
| Distribution and service plan fees payable | 40,595 | |
| Other affiliated payables | 248,976 | |
| Other payables and accrued expenses | 111,501 | |
| Collateral on securities loaned, at value | 38,557,163 | |
| Total liabilities | 43,654,452 | |
| Net Assets | $841,722,475 | |
| Net Assets consist of: | ||
| Paid in capital | $2,580,184,708 | |
| Accumulated net investment loss | (526,638) | |
| Accumulated undistributed net realized gain (loss) on investments and foreign currency transactions | (1,185,219,612) | |
| Net unrealized appreciation (depreciation) on investments and assets and liabilities in foreign currencies | (552,715,983) | |
| Net Assets | $841,722,475 | |
| Calculation of Maximum Offering Price | ||
| Class A: | ||
| Net Asset Value and redemption price per share ($35,788,107 ÷ 2,642,108 shares) | $13.55 | |
| Maximum offering price per share (100/94.25 of $13.55) | $14.38 | |
| Class T: | ||
| Net Asset Value and redemption price per share ($12,157,085 ÷ 912,992 shares) | $13.32 | |
| Maximum offering price per share (100/96.50 of $13.32) | $13.80 | |
| Class B: | ||
| Net Asset Value and offering price per share ($1,397,454 ÷ 108,622 shares)(a) | $12.87 | |
| Class C: | ||
| Net Asset Value and offering price per share ($33,200,590 ÷ 2,590,933 shares)(a) | $12.81 | |
| Gold: | ||
| Net Asset Value, offering price and redemption price per share ($740,158,656 ÷ 53,436,990 shares) | $13.85 | |
| Class I: | ||
| Net Asset Value, offering price and redemption price per share ($19,020,583 ÷ 1,372,804 shares) | $13.86 |
(a) Redemption price per share is equal to net asset value less any applicable contingent deferred sales charge.
See accompanying notes which are an integral part of the consolidated financial statements.
Consolidated Statement of Operations
| Six months ended August 31, 2015 (Unaudited) | ||
| Investment Income | ||
| Dividends | $4,629,139 | |
| Income from Fidelity Central Funds | 126,092 | |
| Income before foreign taxes withheld | 4,755,231 | |
| Less foreign taxes withheld | (472,174) | |
| Total income | 4,283,057 | |
| Expenses | ||
| Management fee | $2,835,308 | |
| Transfer agent fees | 1,378,144 | |
| Distribution and service plan fees | 275,705 | |
| Accounting and security lending fees | 230,445 | |
| Custodian fees and expenses | 174,762 | |
| Independent trustees' compensation | 8,491 | |
| Registration fees | 72,307 | |
| Audit | 20,002 | |
| Legal | 6,505 | |
| Miscellaneous | 8,923 | |
| Total expenses before reductions | 5,010,592 | |
| Expense reductions | (220,178) | 4,790,414 |
| Net investment income (loss) | (507,357) | |
| Realized and Unrealized Gain (Loss)
Net realized gain (loss) on: | ||
| Investments: | ||
| Unaffiliated issuers | (85,858,960) | |
| Other affiliated issuers | (128,350) | |
| Commodities | (4,624,665) | |
| Foreign currency transactions | 1,687,366 | |
| Total net realized gain (loss) | (88,924,609) | |
| Change in net unrealized appreciation (depreciation) on: Investments | (184,851,914) | |
| Assets and liabilities in foreign currencies | (2,734) | |
| Commodities | (6,919,421) | |
| Total change in net unrealized appreciation (depreciation) | (191,774,069) | |
| Net gain (loss) | (280,698,678) | |
| Net increase (decrease) in net assets resulting from operations | $(281,206,035) |
See accompanying notes which are an integral part of the consolidated financial statements.
Consolidated Statement of Changes in Net Assets
| Six months ended August 31, 2015 (Unaudited) | Year ended February 28, 2015 | |
| Increase (Decrease) in Net Assets | ||
| Operations | ||
| Net investment income (loss) | $(507,357) | $(3,405,899) |
| Net realized gain (loss) | (88,924,609) | (231,533,739) |
| Change in net unrealized appreciation (depreciation) | (191,774,069) | (19,537,556) |
| Net increase (decrease) in net assets resulting from operations | (281,206,035) | (254,477,194) |
| Share transactions - net increase (decrease) | 1,271,509 | (124,744,949) |
| Redemption fees | 58,489 | 222,335 |
| Total increase (decrease) in net assets | (279,876,037) | (378,999,808) |
| Net Assets | ||
| Beginning of period | 1,121,598,512 | 1,500,598,320 |
| End of period (including accumulated net investment loss of $526,638 and accumulated net investment loss of $19,281, respectively) | $841,722,475 | $1,121,598,512 |
See accompanying notes which are an integral part of the consolidated financial statements.
Consolidated Financial Highlights — Gold Portfolio Class A
| Six months ended (Unaudited) | Years ended February 28, | |||||
| August 31, | 2015 | 2015 | 2014 | 2013 | 2012 A | 2011 |
| Selected Per–Share Data | ||||||
| Net asset value, beginning of period | $18.11 | $22.01 | $30.25 | $45.37 | $50.92 | $40.50 |
| Income from Investment Operations | ||||||
| Net investment income (loss)B | (.03) | (.10) | –C | .07 | (.13) | (.30) |
| Net realized and unrealized gain (loss) | (4.53) | (3.80) | (8.25) | (15.19) | (2.83) | 15.28 |
| Total from investment operations | (4.56) | (3.90) | (8.25) | (15.12) | (2.96) | 14.98 |
| Distributions from net realized gain | – | – | – | – | (2.59) | (4.57) |
| Redemption fees added to paid in capitalB | –C | –C | .01 | –C | –C | .01 |
| Net asset value, end of period | $13.55 | $18.11 | $22.01 | $30.25 | $45.37 | $50.92 |
| Total ReturnD,E,F | (25.18)% | (17.72)% | (27.24)% | (33.33)% | (6.24)% | 36.99% |
| Ratios to Average Net AssetsG,H | ||||||
| Expenses before reductions | 1.25%I | 1.23% | 1.21% | 1.18% | 1.14% | 1.16% |
| Expenses net of fee waivers, if any | 1.21%I | 1.19% | 1.19% | 1.17% | 1.14% | 1.15% |
| Expenses net of all reductions | 1.21%I | 1.19% | 1.18% | 1.17% | 1.14% | 1.14% |
| Net investment income (loss) | (.32)%I | (.51)% | - %J | .18% | (.28)% | (.63)% |
| Supplemental Data | ||||||
| Net assets, end of period (000 omitted) | $35,788 | $46,898 | $60,270 | $101,202 | $152,969 | $149,178 |
| Portfolio turnover rateK | 22%I | 20% | 56% | 18% | 22% | 35% |
A For the year ended February 29.
B Calculated based on average shares outstanding during the period.
C Amount represents less than $.005 per share.
D Total returns for periods of less than one year are not annualized.
E Total returns would have been lower if certain expenses had not been reduced during the applicable periods shown.
F Total returns do not include the effect of the sales charges.
G Fees and expenses of any underlying Fidelity Central Funds are not included in the Fund's expense ratio. The Fund indirectly bears its proportionate share of the expenses of any underlying Fidelity Central Funds.
H Expense ratios reflect operating expenses of the class. Expenses before reductions do not reflect amounts reimbursed by the investment adviser or reductions from brokerage service arrangements or reductions from other expense offset arrangements and do not represent the amount paid by the class during periods when reimbursements or reductions occur. Expenses net of fee waivers reflect expenses after reimbursement by the investment adviser but prior to reductions from brokerage service arrangements or other expense offset arrangements. Expenses net of all reductions represent the net expenses paid by the class.
I Annualized
J Amount represents less than .005%.
K Amount does not include the portfolio activity of any underlying Fidelity Central Funds.
See accompanying notes which are an integral part of the consolidated financial statements.
Consolidated Financial Highlights — Gold Portfolio Class T
| Six months ended (Unaudited) | Years ended February 28, | |||||
| August 31, | 2015 | 2015 | 2014 | 2013 | 2012 A | 2011 |
| Selected Per–Share Data | ||||||
| Net asset value, beginning of period | $17.83 | $21.73 | $29.95 | $45.04 | $50.68 | $40.34 |
| Income from Investment Operations | ||||||
| Net investment income (loss)B | (.05) | (.15) | (.06) | (.03) | (.27) | (.43) |
| Net realized and unrealized gain (loss) | (4.46) | (3.75) | (8.17) | (15.06) | (2.80) | 15.21 |
| Total from investment operations | (4.51) | (3.90) | (8.23) | (15.09) | (3.07) | 14.78 |
| Distributions from net realized gain | – | – | – | – | (2.57) | (4.45) |
| Redemption fees added to paid in capitalB | –C | –C | .01 | –C | –C | .01 |
| Net asset value, end of period | $13.32 | $17.83 | $21.73 | $29.95 | $45.04 | $50.68 |
| Total ReturnD,E,F | (25.29)% | (17.95)% | (27.45)% | (33.50)% | (6.49)% | 36.62% |
| Ratios to Average Net AssetsG,H | ||||||
| Expenses before reductions | 1.53%I | 1.50% | 1.49% | 1.45% | 1.43% | 1.44% |
| Expenses net of fee waivers, if any | 1.49%I | 1.46% | 1.47% | 1.44% | 1.42% | 1.42% |
| Expenses net of all reductions | 1.49%I | 1.46% | 1.46% | 1.44% | 1.42% | 1.42% |
| Net investment income (loss) | (.60)%I | (.79)% | (.28)% | (.09)% | (.57)% | (.90)% |
| Supplemental Data | ||||||
| Net assets, end of period (000 omitted) | $12,157 | $16,200 | $18,402 | $24,913 | $40,664 | $45,846 |
| Portfolio turnover rateJ | 22%I | 20% | 56% | 18% | 22% | 35% |
A For the year ended February 29.
B Calculated based on average shares outstanding during the period.
C Amount represents less than $.005 per share.
D Total returns for periods of less than one year are not annualized.
E Total returns would have been lower if certain expenses had not been reduced during the applicable periods shown.
F Total returns do not include the effect of the sales charges.
G Fees and expenses of any underlying Fidelity Central Funds are not included in the Fund's expense ratio. The Fund indirectly bears its proportionate share of the expenses of any underlying Fidelity Central Funds.
H Expense ratios reflect operating expenses of the class. Expenses before reductions do not reflect amounts reimbursed by the investment adviser or reductions from brokerage service arrangements or reductions from other expense offset arrangements and do not represent the amount paid by the class during periods when reimbursements or reductions occur. Expenses net of fee waivers reflect expenses after reimbursement by the investment adviser but prior to reductions from brokerage service arrangements or other expense offset arrangements. Expenses net of all reductions represent the net expenses paid by the class.
I Annualized
J Amount does not include the portfolio activity of any underlying Fidelity Central Funds.
See accompanying notes which are an integral part of the consolidated financial statements.
Consolidated Financial Highlights — Gold Portfolio Class B
| Six months ended (Unaudited) | Years ended February 28, | |||||
| August 31, | 2015 | 2015 | 2014 | 2013 | 2012 A | 2011 |
| Selected Per–Share Data | ||||||
| Net asset value, beginning of period | $17.27 | $21.14 | $29.27 | $44.24 | $50.02 | $39.87 |
| Income from Investment Operations | ||||||
| Net investment income (loss)B | (.08) | (.24) | (.16) | (.21) | (.49) | (.66) |
| Net realized and unrealized gain (loss) | (4.32) | (3.63) | (7.98) | (14.76) | (2.76) | 15.02 |
| Total from investment operations | (4.40) | (3.87) | (8.14) | (14.97) | (3.25) | 14.36 |
| Distributions from net realized gain | – | – | – | – | (2.53) | (4.21) |
| Redemption fees added to paid in capitalB | –C | –C | .01 | –C | –C | –C |
| Net asset value, end of period | $12.87 | $17.27 | $21.14 | $29.27 | $44.24 | $50.02 |
| Total ReturnD,E,F | (25.48)% | (18.31)% | (27.78)% | (33.84)% | (6.95)% | 35.97% |
| Ratios to Average Net AssetsG,H | ||||||
| Expenses before reductions | 2.00%I | 1.97% | 1.95% | 1.93% | 1.90% | 1.93% |
| Expenses net of fee waivers, if any | 1.96%I | 1.93% | 1.93% | 1.92% | 1.90% | 1.92% |
| Expenses net of all reductions | 1.96%I | 1.93% | 1.93% | 1.91% | 1.90% | 1.91% |
| Net investment income (loss) | (1.07)%I | (1.26)% | (.75)% | (.57)% | (1.04)% | (1.39)% |
| Supplemental Data | ||||||
| Net assets, end of period (000 omitted) | $1,397 | $2,461 | $4,373 | $9,423 | $20,894 | $26,837 |
| Portfolio turnover rateJ | 22%I | 20% | 56% | 18% | 22% | 35% |
A For the year ended February 29.
B Calculated based on average shares outstanding during the period.
C Amount represents less than $.005 per share.
D Total returns for periods of less than one year are not annualized.
E Total returns would have been lower if certain expenses had not been reduced during the applicable periods shown.
F Total returns do not include the effect of the contingent deferred sales charge.
G Fees and expenses of any underlying Fidelity Central Funds are not included in the Fund's expense ratio. The Fund indirectly bears its proportionate share of the expenses of any underlying Fidelity Central Funds.
H Expense ratios reflect operating expenses of the class. Expenses before reductions do not reflect amounts reimbursed by the investment adviser or reductions from brokerage service arrangements or reductions from other expense offset arrangements and do not represent the amount paid by the class during periods when reimbursements or reductions occur. Expenses net of fee waivers reflect expenses after reimbursement by the investment adviser but prior to reductions from brokerage service arrangements or other expense offset arrangements. Expenses net of all reductions represent the net expenses paid by the class.
I Annualized
J Amount does not include the portfolio activity of any underlying Fidelity Central Funds.
See accompanying notes which are an integral part of the consolidated financial statements.
Consolidated Financial Highlights — Gold Portfolio Class C
| Six months ended (Unaudited) | Years ended February 28, | |||||
| August 31, | 2015 | 2015 | 2014 | 2013 | 2012 A | 2011 |
| Selected Per–Share Data | ||||||
| Net asset value, beginning of period | $17.20 | $21.06 | $29.15 | $44.05 | $49.81 | $39.75 |
| Income from Investment Operations | ||||||
| Net investment income (loss)B | (.08) | (.23) | (.16) | (.20) | (.47) | (.64) |
| Net realized and unrealized gain (loss) | (4.31) | (3.63) | (7.94) | (14.70) | (2.76) | 14.98 |
| Total from investment operations | (4.39) | (3.86) | (8.10) | (14.90) | (3.23) | 14.34 |
| Distributions from net realized gain | – | – | – | – | (2.53) | (4.28) |
| Redemption fees added to paid in capitalB | –C | –C | .01 | –C | –C | –C |
| Net asset value, end of period | $12.81 | $17.20 | $21.06 | $29.15 | $44.05 | $49.81 |
| Total ReturnD,E,F | (25.52)% | (18.33)% | (27.75)% | (33.83)% | (6.93)% | 36.01% |
| Ratios to Average Net AssetsG,H | ||||||
| Expenses before reductions | 1.98%I | 1.96% | 1.96% | 1.93% | 1.87% | 1.89% |
| Expenses net of fee waivers, if any | 1.94%I | 1.92% | 1.94% | 1.92% | 1.87% | 1.88% |
| Expenses net of all reductions | 1.94%I | 1.92% | 1.93% | 1.91% | 1.87% | 1.87% |
| Net investment income (loss) | (1.06)%I | (1.25)% | (.76)% | (.57)% | (1.01)% | (1.35)% |
| Supplemental Data | ||||||
| Net assets, end of period (000 omitted) | $33,201 | $39,429 | $33,811 | $37,787 | $67,996 | $72,431 |
| Portfolio turnover rateJ | 22%I | 20% | 56% | 18% | 22% | 35% |
A For the year ended February 29.
B Calculated based on average shares outstanding during the period.
C Amount represents less than $.005 per share.
D Total returns for periods of less than one year are not annualized.
E Total returns would have been lower if certain expenses had not been reduced during the applicable periods shown.
F Total returns do not include the effect of the contingent deferred sales charge.
G Fees and expenses of any underlying Fidelity Central Funds are not included in the Fund's expense ratio. The Fund indirectly bears its proportionate share of the expenses of any underlying Fidelity Central Funds.
H Expense ratios reflect operating expenses of the class. Expenses before reductions do not reflect amounts reimbursed by the investment adviser or reductions from brokerage service arrangements or reductions from other expense offset arrangements and do not represent the amount paid by the class during periods when reimbursements or reductions occur. Expenses net of fee waivers reflect expenses after reimbursement by the investment adviser but prior to reductions from brokerage service arrangements or other expense offset arrangements. Expenses net of all reductions represent the net expenses paid by the class.
I Annualized
J Amount does not include the portfolio activity of any underlying Fidelity Central Funds.
See accompanying notes which are an integral part of the consolidated financial statements.
Consolidated Financial Highlights — Gold Portfolio
| Six months ended (Unaudited) | Years ended February 28, | |||||
| August 31, | 2015 | 2015 | 2014 | 2013 | 2012 A | 2011 |
| Selected Per–Share Data | ||||||
| Net asset value, beginning of period | $18.50 | $22.41 | $30.72 | $45.96 | $51.44 | $40.85 |
| Income from Investment Operations | ||||||
| Net investment income (loss)B | –C | (.04) | .06 | .16 | (.02) | (.18) |
| Net realized and unrealized gain (loss) | (4.65) | (3.87) | (8.38) | (15.40) | (2.85) | 15.43 |
| Total from investment operations | (4.65) | (3.91) | (8.32) | (15.24) | (2.87) | 15.25 |
| Distributions from net realized gain | – | – | – | – | (2.61) | (4.67) |
| Redemption fees added to paid in capitalB | –C | –C | .01 | –C | –C | .01 |
| Net asset value, end of period | $13.85 | $18.50 | $22.41 | $30.72 | $45.96 | $51.44 |
| Total ReturnD,E | (25.14)% | (17.45)% | (27.05)% | (33.16)% | (6.00)% | 37.35% |
| Ratios to Average Net AssetsF,G | ||||||
| Expenses before reductions | .98%H | .94% | .94% | .93% | .89% | .91% |
| Expenses net of fee waivers, if any | .93%H | .90% | .92% | .92% | .89% | .90% |
| Expenses net of all reductions | .93%H | .90% | .91% | .92% | .89% | .89% |
| Net investment income (loss) | (.05)%H | (.22)% | .27% | .43% | (.03)% | (.37)% |
| Supplemental Data | ||||||
| Net assets, end of period (000 omitted) | $740,159 | $992,944 | $1,275,913 | $2,301,019 | $3,924,440 | $4,250,249 |
| Portfolio turnover rateI | 22%H | 20% | 56% | 18% | 22% | 35% |
A For the year ended February 29.
B Calculated based on average shares outstanding during the period.
C Amount represents less than $.005 per share.
D Total returns for periods of less than one year are not annualized.
E Total returns would have been lower if certain expenses had not been reduced during the applicable periods shown.
F Fees and expenses of any underlying Fidelity Central Funds are not included in the Fund's expense ratio. The Fund indirectly bears its proportionate share of the expenses of any underlying Fidelity Central Funds.
G Expense ratios reflect operating expenses of the class. Expenses before reductions do not reflect amounts reimbursed by the investment adviser or reductions from brokerage service arrangements or reductions from other expense offset arrangements and do not represent the amount paid by the class during periods when reimbursements or reductions occur. Expenses net of fee waivers reflect expenses after reimbursement by the investment adviser but prior to reductions from brokerage service arrangements or other expense offset arrangements. Expenses net of all reductions represent the net expenses paid by the class.
H Annualized
I Amount does not include the portfolio activity of any underlying Fidelity Central Funds.
See accompanying notes which are an integral part of the consolidated financial statements.
Consolidated Financial Highlights — Gold Portfolio Class I
| Six months ended (Unaudited) | Years ended February 28, | |||||
| August 31, | 2015 | 2015 | 2014 | 2013 | 2012 A | 2011 |
| Selected Per–Share Data | ||||||
| Net asset value, beginning of period | $18.50 | $22.41 | $30.69 | $45.87 | $51.32 | $40.77 |
| Income from Investment Operations | ||||||
| Net investment income (loss)B | –C | (.04) | .07 | .20 | .02 | (.15) |
| Net realized and unrealized gain (loss) | (4.64) | (3.87) | (8.36) | (15.38) | (2.85) | 15.41 |
| Total from investment operations | (4.64) | (3.91) | (8.29) | (15.18) | (2.83) | 15.26 |
| Distributions from net realized gain | – | – | – | – | (2.62) | (4.72) |
| Redemption fees added to paid in capitalB | –C | –C | .01 | –C | –C | .01 |
| Net asset value, end of period | $13.86 | $18.50 | $22.41 | $30.69 | $45.87 | $51.32 |
| Total ReturnD,E | (25.08)% | (17.45)% | (26.98)% | (33.09)% | (5.94)% | 37.45% |
| Ratios to Average Net AssetsF,G | ||||||
| Expenses before reductions | .94%H | .90% | .87% | .84% | .82% | .85% |
| Expenses net of fee waivers, if any | .89%H | .86% | .85% | .83% | .81% | .84% |
| Expenses net of all reductions | .89%H | .86% | .84% | .82% | .81% | .83% |
| Net investment income (loss) | (.01)%H | (.18)% | .34% | .52% | .04% | (.31)% |
| Supplemental Data | ||||||
| Net assets, end of period (000 omitted) | $19,021 | $23,667 | $107,830 | $128,262 | $168,548 | $137,246 |
| Portfolio turnover rateI | 22%H | 20% | 56% | 18% | 22% | 35% |
A For the year ended February 29.
B Calculated based on average shares outstanding during the period.
C Amount represents less than $.005 per share.
D Total returns for periods of less than one year are not annualized.
E Total returns would have been lower if certain expenses had not been reduced during the applicable periods shown.
F Fees and expenses of any underlying Fidelity Central Funds are not included in the Fund's expense ratio. The Fund indirectly bears its proportionate share of the expenses of any underlying Fidelity Central Funds.
G Expense ratios reflect operating expenses of the class. Expenses before reductions do not reflect amounts reimbursed by the investment adviser or reductions from brokerage service arrangements or reductions from other expense offset arrangements and do not represent the amount paid by the class during periods when reimbursements or reductions occur. Expenses net of fee waivers reflect expenses after reimbursement by the investment adviser but prior to reductions from brokerage service arrangements or other expense offset arrangements. Expenses net of all reductions represent the net expenses paid by the class.
H Annualized
I Amount does not include the portfolio activity of any underlying Fidelity Central Funds.
See accompanying notes which are an integral part of the consolidated financial statements.
Notes to Consolidated Financial Statements (Unaudited)
For the period ended August 31, 2015
1. Organization.
Gold Portfolio (the Fund) is a non-diversified fund of Fidelity Select Portfolios (the Trust) and is authorized to issue an unlimited number of shares. The Trust is registered under the Investment Company Act of 1940, as amended (the 1940 Act), as an open-end management investment company organized as a Massachusetts business trust. The Fund invests primarily in securities of companies whose principal business activities fall within specific industries. The Fund offers Class A, Class T, Class C, Gold and Class I (formerly Institutional Class) shares, each of which, along with Class B shares, has equal rights as to assets and voting privileges. Class B shares are closed to new accounts and additional purchases, except for exchanges and reinvestments. Each class has exclusive voting rights with respect to matters that affect that class. Class B shares will automatically convert to Class A shares after a holding period of seven years from the initial date of purchase. The Fund's investments in emerging markets can be subject to social, economic, regulatory, and political uncertainties and can be extremely volatile.
2. Consolidated Subsidiary.
The Fund invests in certain commodity-related investments through Fidelity Select Gold Cayman, Ltd, a wholly owned subsidiary (the "Subsidiary"). As of August 31, 2015, the Fund held an investment of $88,827,307 in the Subsidiary, representing 10.6% of the Fund's net assets.
The financial statements have been consolidated and include accounts of the Fund and the Subsidiary. Accordingly, all inter-company transactions and balances have been eliminated.
3. Investments in Fidelity Central Funds.
The Fund invests in Fidelity Central Funds, which are open-end investment companies generally available only to other investment companies and accounts managed by the investment adviser and its affiliates. The Fund's Consolidated Schedule of Investments lists each of the Fidelity Central Funds held as of period end, if any, as an investment of the Fund, but does not include the underlying holdings of each Fidelity Central Fund. As an Investing Fund, the Fund indirectly bears its proportionate share of the expenses of the underlying Fidelity Central Funds.
The Money Market Central Funds seek preservation of capital and current income and are managed by Fidelity Investments Money Management, Inc. (FIMM), an affiliate of the investment adviser. Annualized expenses of the Money Market Central Funds as of their most recent shareholder report date are less than .01%.
A complete unaudited list of holdings for each Fidelity Central Fund is available upon request or at the Securities and Exchange Commission (the SEC) website at www.sec.gov. In addition, the financial statements of the Fidelity Central Funds are available on the SEC website or upon request.
4. Significant Accounting Policies.
The consolidated financial statements have been prepared in conformity with accounting principles generally accepted in the United States of America (GAAP), which require management to make certain estimates and assumptions at the date of the financial statements. Actual results could differ from those estimates. Subsequent events, if any, through the date that the financial statements were issued have been evaluated in the preparation of the financial statements. The following summarizes the significant accounting policies of the Fund:
Investment Valuation. Investments are valued as of 4:00 p.m. Eastern time on the last calendar day of the period. The Board of Trustees (the Board) has delegated the day to day responsibility for the valuation of the Fund's investments to the Fidelity SelectCo, LLC (SelectCo) Fair Value Committee (the Committee). In accordance with valuation policies and procedures approved by the Board, the Fund attempts to obtain prices from one or more third party pricing vendors or brokers to value its investments. When current market prices, quotations or currency exchange rates are not readily available or reliable, investments will be fair valued in good faith by the Committee, in accordance with procedures adopted by the Board. Factors used in determining fair value vary by investment type and may include market or investment specific events. The frequency with which these procedures are used cannot be predicted and they may be utilized to a significant extent. The Committee oversees the Fund's valuation policies and procedures and reports to the Board on the Committee's activities and fair value determinations. The Board monitors the appropriateness of the procedures used in valuing the Fund's investments and ratifies the fair value determinations of the Committee.
The Fund categorizes the inputs to valuation techniques used to value its investments into a disclosure hierarchy consisting of three levels as shown below:
- Level 1 – quoted prices in active markets for identical investments
- Level 2 – other significant observable inputs (including quoted prices for similar investments, interest rates, prepayment speeds, etc.)
- Level 3 – unobservable inputs (including the Fund's own assumptions based on the best information available)
Valuation techniques used to value the Fund's investments by major category are as follows:
Equity securities, including restricted securities, for which market quotations are readily available, are valued at the last reported sale price or official closing price as reported by a third party pricing vendor on the primary market or exchange on which they are traded and are categorized as Level 1 in the hierarchy. In the event there were no sales during the day or closing prices are not available, securities are valued at the last quoted bid price or may be valued using the last available price and are generally categorized as Level 2 in the hierarchy. For foreign equity securities, when market or security specific events arise, comparisons to the valuation of American Depositary Receipts (ADRs), futures contracts, Exchange-Traded Funds (ETFs) and certain indexes as well as quoted prices for similar securities may be used and would be categorized as Level 2 in the hierarchy. Utilizing these techniques may result in transfers between Level 1 and Level 2. For equity securities, including restricted securities, where observable inputs are limited, assumptions about market activity and risk are used and these securities may be categorized as Level 3 in the hierarchy.
Investments in commodities are valued at their last traded price at 4:00 p.m. Eastern time each business day and are categorized as Level 1 in the hierarchy. Investments in open-end mutual funds, including the Fidelity Central Funds, are valued at their closing net asset value (NAV) each business day and are categorized as Level 1 in the hierarchy.
Changes in valuation techniques may result in transfers in or out of an assigned level within the disclosure hierarchy. The aggregate value of investments by input level as of August 31, 2015, including information on transfers between Levels 1 and 2, is included at the end of the Fund's Consolidated Schedule of Investments.
Foreign Currency. The Fund may use foreign currency contracts to facilitate transactions in foreign-denominated securities. Gains and losses from these transactions may arise from changes in the value of the foreign currency or if the counterparties do not perform under the contracts' terms.
Foreign-denominated assets, including investment securities, and liabilities are translated into U.S. dollars at the exchange rates at period end. Purchases and sales of investment securities, income and dividends received and expenses denominated in foreign currencies are translated into U.S. dollars at the exchange rate in effect on the transaction date.
The effects of exchange rate fluctuations on investments are included with the net realized and unrealized gain (loss) on investment securities. Other foreign currency transactions resulting in realized and unrealized gain (loss) are disclosed separately.
Investment Transactions and Income. For financial reporting purposes, the Fund's investment holdings and NAV include trades executed through the end of the last business day of the period. The NAV per share for processing shareholder transactions is calculated as of the close of business of the New York Stock Exchange (NYSE), normally 4:00 p.m. Eastern time and includes trades executed through the end of the prior business day. Gains and losses on securities sold are determined on the basis of identified cost. Dividend income is recorded on the ex-dividend date, except for certain dividends from foreign securities where the ex-dividend date may have passed, which are recorded as soon as the Fund is informed of the ex-dividend date. Non-cash dividends included in dividend income, if any, are recorded at the fair market value of the securities received. Income and capital gain distributions from Fidelity Central Funds, if any, are recorded on the ex-dividend date. Distributions received on securities that represent a return of capital or capital gain are recorded as a reduction of cost of investments and/or as a realized gain. Subsequent to ex-dividend date the Fund determines the components of these distributions, based upon receipt of tax filings or other correspondence relating to the underlying investment. Investment income is recorded net of foreign taxes withheld where recovery of such taxes is uncertain.
Class Allocations and Expenses. Investment income, realized and unrealized capital gains and losses, common expenses of the Fund, and certain fund-level expense reductions, if any, are allocated daily on a pro-rata basis to each class based on the relative net assets of each class to the total net assets of the Fund. Each class differs with respect to transfer agent and distribution and service plan fees incurred. Certain expense reductions may also differ by class. For the reporting period, the allocated portion of income and expenses to each class as a percent of its average net assets may vary due to the timing of recording these transactions in relation to fluctuating net assets of the classes. Expenses directly attributable to a fund are charged to that fund. Expenses attributable to more than one fund are allocated among the respective funds on the basis of relative net assets or other appropriate methods. Expense estimates are accrued in the period to which they relate and adjustments are made when actual amounts are known.
Deferred Trustee Compensation. Under a Deferred Compensation Plan (the Plan), independent Trustees may elect to defer receipt of a portion of their annual compensation. Deferred amounts are invested in a cross-section of Fidelity funds, are marked-to-market and remain in the Fund until distributed in accordance with the Plan. The investment of deferred amounts and the offsetting payable to the Trustees are included in the accompanying Statement of Assets and Liabilities.
Income Tax Information and Distributions to Shareholders. Each year, the Fund intends to qualify as a regulated investment company under Subchapter M of the Internal Revenue Code, including distributing substantially all of its taxable income and realized gains. As a result, no provision for U.S. Federal income taxes is required. The Fund files a U.S. federal tax return, in addition to state and local tax returns as required. The Fund's federal income tax returns are subject to examination by the Internal Revenue Service (IRS) for a period of three fiscal years after they are filed. State and local tax returns may be subject to examination for an additional fiscal year depending on the jurisdiction. Foreign taxes are provided for based on the Fund's understanding of the tax rules and rates that exist in the foreign markets in which it invests.
The Subsidiary is classified as a controlled foreign corporation under Subchapter N of the Internal Revenue Code. Therefore, the Fund is required to increase its taxable income by its share of the Subsidiary's income. Net investment losses of the Subsidiary cannot be deducted by the Fund in the current period nor carried forward to offset taxable income in future periods.
Distributions are declared and recorded on the ex-dividend date. Income dividends and capital gain distributions are declared separately for each class. Income and capital gain distributions are determined in accordance with income tax regulations, which may differ from GAAP.
Capital accounts within the consolidated financial statements are adjusted for permanent book-tax differences. These adjustments have no impact on net assets or the results of operations. Capital accounts are not adjusted for temporary book-tax differences which will reverse in a subsequent period.
Book-tax differences are primarily due to foreign currency transactions, passive foreign investment companies (PFIC), controlled foreign corporation, deferred trustees compensation, net operating losses, losses deferred due to wash sales and capital loss carryforwards.
The federal tax cost of investment securities and unrealized appreciation (depreciation) as of period end on an unconsolidated basis were as follows:
| Gross unrealized appreciation | $81,771,580 |
| Gross unrealized depreciation | (746,584,444) |
| Net unrealized appreciation (depreciation) on securities | $(664,812,864) |
| Tax cost | $1,546,365,582 |
Capital loss carryforwards are only available to offset future capital gains of the Fund to the extent provided by regulations and may be limited. Under the Regulated Investment Company Modernization Act of 2010 (the Act), the Fund is permitted to carry forward capital losses incurred in taxable years beginning after December 22, 2010 for an unlimited period and such capital losses are required to be used prior to any losses that expire. The capital loss carryforward information presented below, including any applicable limitation, is estimated as of prior fiscal period end and is subject to adjustment.
| No expiration | |
| Short-term | $(134,736,786) |
| Long-term | (859,477,478) |
| Total capital loss carryforward | $(994,214,264) |
Trading (Redemption) Fees. Shares held by investors in the Fund less than 30 days may be subject to a redemption fee equal to .75% of the NAV of shares redeemed. All redemption fees, which reduce the proceeds of the shareholder redemption, are retained by the Fund and accounted for as an addition to paid in capital.
Restricted Securities. The Fund may invest in securities that are subject to legal or contractual restrictions on resale. These securities generally may be resold in transactions exempt from registration or to the public if the securities are registered. Disposal of these securities may involve time-consuming negotiations and expense, and prompt sale at an acceptable price may be difficult. Information regarding restricted securities is included at the end of the Fund's Consolidated Schedule of Investments.
5. Purchases and Sales of Investments.
Purchases and sales of securities, other than short-term securities, aggregated $120,418,024 and $108,936,305, respectively.
6. Fees and Other Transactions with Affiliates.
Management Fee. Fidelity SelectCo, LLC (the investment adviser) and its affiliates provide the Fund with investment management related services for which the Fund pays a monthly management fee. The management fee is the sum of an individual fund fee rate that is based on an annual rate of .30% of the Fund's average net assets and an annualized group fee rate that averaged .25% during the period. The group fee rate is based upon the average net assets of all the mutual funds advised by Fidelity Management & Research Company (FMR) and the investment adviser. The group fee rate decreases as assets under management increase and increases as assets under management decrease.
FMR, either through itself or through an affiliate provides investment management related services to the Subsidiary for which the Subsidiary pays a monthly management fee at the annual rate of .30% of its net assets. Under the management contract with the subsidiary, FMR pays all other expenses of the Subsidiary, except custodian fees.
For the reporting period, the total consolidated annualized management fee rate which includes the management fee of the Fund and the Subsidiary was .59% of the Fund's average net assets.
During the period, the investment adviser waived a portion of the Fund's management fee representing the amount of the management fee paid by the Subsidiary to FMR as described in the Expense Reductions note.
Distribution and Service Plan Fees. In accordance with Rule 12b-1 of the 1940 Act, the Fund has adopted separate Distribution and Service Plans for each class of shares. Certain classes pay Fidelity Distributors Corporation (FDC), an affiliate of the investment adviser, separate Distribution and Service Fees, each of which is based on an annual percentage of each class' average net assets. In addition, FDC may pay financial intermediaries for selling shares of the Fund and providing shareholder support services. For the period, the Distribution and Service Fee rates, total fees and amounts retained by FDC were as follows:
| Distribution Fee | Service Fee | Total Fees | Retained by FDC |
|
| Class A | -% | .25% | $50,570 | $95 |
| Class T | .25% | .25% | 35,568 | – |
| Class B | .75% | .25% | 9,399 | 7,049 |
| Class C | .75% | .25% | 180,168 | 49,070 |
| $275,705 | $56,214 |
Sales Load. FDC may receive a front-end sales charge of up to 5.75% for selling Class A shares and 3.50% for selling Class T shares, some of which is paid to financial intermediaries for selling shares of the Fund. Depending on the holding period, FDC may receive contingent deferred sales charges levied on Class A, Class T, Class B and Class C redemptions. The deferred sales charges range from 5.00% to 1.00% for Class B shares, 1.00% for Class C shares, 1.00% for certain purchases of Class A shares and .25% for certain purchases of Class T shares.
For the period, sales charge amounts retained by FDC were as follows:
| Retained by FDC |
|
| Class A | $12,199 |
| Class T | 4,395 |
| Class B* | 977 |
| Class C* | 1,705 |
| $19,276 |
* When Class B and Class C shares are initially sold, FDC pays commissions from its own resources to financial intermediaries through which the sales are made.
Transfer Agent Fees. Fidelity Investments Institutional Operations Company, Inc., (FIIOC), an affiliate of the investment adviser, is the transfer, dividend disbursing and shareholder servicing agent for each class of the Fund. FIIOC receives account fees and asset-based fees that vary according to the account size and type of account of the shareholders of the respective classes of the Fund. FIIOC pays for typesetting, printing and mailing of shareholder reports, except proxy statements.
For the period, transfer agent fees for each class were as follows:
| Amount | % of Class-Level Average Net Assets* |
|
| Class A | $61,519 | .30 |
| Class T | 23,694 | .33 |
| Class B | 2,834 | .30 |
| Class C | 51,971 | .29 |
| Gold | 1,208,630 | .28 |
| Class I | 29,496 | .25 |
| $1,378,144 |
*Annualized
Accounting and Security Lending Fees. Fidelity Service Company, Inc. (FSC), an affiliate of the investment adviser, maintains the Fund's accounting records. The accounting fee is based on the level of average net assets for each month. Under a separate contract, FSC administers the security lending program. The security lending fee is based on the number and duration of lending transactions.
Brokerage Commissions. The Fund placed a portion of its portfolio transactions with brokerage firms which are affiliates of the investment adviser. Brokerage commissions are included in net realized gain (loss) and change in net unrealized appreciation (depreciation) in the Consolidated Statement of Operations. The commissions paid to these affiliated firms were $3,255 for the period.
7. Committed Line of Credit.
The Fund participates with other funds managed by the investment adviser or an affiliate in a $4.25 billion credit facility (the "line of credit") to be utilized for temporary or emergency purposes to fund shareholder redemptions or for other short-term liquidity purposes. The Fund has agreed to pay commitment fees on its pro-rata portion of the line of credit, which amounted to $728 and is reflected in Miscellaneous expenses on the Consolidated Statement of Operations. During the period, the Fund did not borrow on this line of credit.
8. Security Lending.
The Fund lends portfolio securities through a lending agent from time to time in order to earn additional income. On the settlement date of the loan, the Fund receives collateral (in the form of U.S. Treasury obligations, letters of credit and/or cash) against the loaned securities and maintains collateral in an amount not less than 100% of the market value of the loaned securities during the period of the loan. The market value of the loaned securities is determined at the close of business of the Fund and any additional required collateral is delivered to the Fund on the next business day. If the borrower defaults on its obligation to return the securities loaned because of insolvency or other reasons, the Fund may apply collateral received from the borrower against the obligation. The Fund may experience delays and costs in recovering the securities loaned. Any cash collateral received is invested in the Fidelity Securities Lending Cash Central Fund. The value of loaned securities and cash collateral at period end are disclosed on the Fund's Consolidated Statement of Assets and Liabilities. Security lending income represents the income earned on investing cash collateral, less rebates paid to borrowers and any lending agent fees associated with the loan, plus any premium payments received for lending certain types of securities. Security lending income is presented in the Consolidated Statement of Operations as a component of income from Fidelity Central Funds. Total security lending income during the period amounted to $122,985.
9. Expense Reductions.
The investment adviser has contractually agreed to waive the Fund's management fee in an amount equal to the management fee paid by the Subsidiary to FMR. During the period, this waiver reduced the Fund's management fee by $179,299.
Commissions paid to certain brokers with whom the investment adviser, or its affiliates, places trades on behalf of the Fund include an amount in addition to trade execution, which may be rebated back to the Fund to offset certain expenses. This amount totaled $11,629 for the period.
In addition, during the period the investment adviser reimbursed and/or waived a portion of fund-level operating expenses in the amount of $4,008 and a portion of class-level operating expenses as follows:
| Amount | |
| Class A | $100 |
| Class T | 28 |
| Class B | 4 |
| Class C | 395 |
| Gold | 23,242 |
| Class I | 1,473 |
| $25,242 |
10. Share Transactions.
Share transactions for each class were as follows and may contain automatic conversions between classes or exchanges between funds:
| Shares | Shares | Dollars | Dollars | |
| Six months ended August 31, 2015 | Year ended February 28, 2015 | Six months ended August 31, 2015 | Year ended February 28, 2015 | |
| Class A | ||||
| Shares sold | 518,834 | 1,014,651 | $8,025,425 | $20,366,842 |
| Shares redeemed | (465,693) | (1,163,476) | (7,275,162) | (22,763,258) |
| Net increase (decrease) | 53,141 | (148,825) | $750,263 | $(2,396,416) |
| Class T | ||||
| Shares sold | 136,765 | 317,888 | $2,107,964 | $6,202,712 |
| Shares redeemed | (132,218) | (256,267) | (2,013,307) | (4,926,125) |
| Net increase (decrease) | 4,547 | 61,621 | $94,657 | $1,276,587 |
| Class B | ||||
| Shares sold | 4,058 | 6,743 | $57,181 | $129,320 |
| Shares redeemed | (37,931) | (71,044) | (574,395) | (1,326,720) |
| Net increase (decrease) | (33,873) | (64,301) | $(517,214) | $(1,197,400) |
| Class C | ||||
| Shares sold | 508,709 | 1,131,151 | $7,441,929 | $21,162,781 |
| Shares redeemed | (210,167) | (444,470) | (3,005,672) | (8,210,673) |
| Net increase (decrease) | 298,542 | 686,681 | $4,436,257 | $12,952,108 |
| Gold | ||||
| Shares sold | 8,910,056 | 22,066,731 | $139,098,070 | $446,680,830 |
| Shares redeemed | (9,151,440) | (25,311,740) | (145,489,035) | (508,417,315) |
| Net increase (decrease) | (241,384) | (3,245,009) | $(6,390,965) | $(61,736,485) |
| Class I | ||||
| Shares sold | 846,060 | 1,547,691 | $14,167,660 | $33,198,070 |
| Shares redeemed | (752,517) | (5,080,368) | (11,269,149) | (106,841,413) |
| Net increase (decrease) | 93,543 | (3,532,677) | $2,898,511 | $(73,643,343) |
11. Other.
The Fund's organizational documents provide former and current trustees and officers with a limited indemnification against liabilities arising in connection with the performance of their duties to the Fund. In the normal course of business, the Fund may also enter into contracts that provide general indemnifications. The Fund's maximum exposure under these arrangements is unknown as this would be dependent on future claims that may be made against the Fund. The risk of material loss from such claims is considered remote.
Materials Portfolio
Investment Summary (Unaudited)
Top Ten Stocks as of August 31, 2015
| % of fund's net assets | % of fund's net assets 6 months ago | |
| Monsanto Co. | 9.6 | 8.5 |
| E.I. du Pont de Nemours & Co. | 9.4 | 11.4 |
| WestRock Co. | 9.2 | 5.5 |
| Eastman Chemical Co. | 8.0 | 5.3 |
| LyondellBasell Industries NV Class A | 7.2 | 4.7 |
| Ecolab, Inc. | 6.4 | 5.3 |
| PPG Industries, Inc. | 4.9 | 0.0 |
| Eagle Materials, Inc. | 4.6 | 3.1 |
| Graphic Packaging Holding Co. | 3.8 | 2.5 |
| CF Industries Holdings, Inc. | 3.4 | 3.4 |
| 66.5 |
Top Industries (% of fund's net assets)
| As of August 31, 2015 | ||
| Chemicals | 63.5% | |
| Containers & Packaging | 21.6% | |
| Metals & Mining | 5.2% | |
| Construction Materials | 4.6% | |
| Paper & Forest Products | 1.5% | |
| All Others* | 3.6% | |

| As of February 28, 2015 | ||
| Chemicals | 70.0% | |
| Containers & Packaging | 16.6% | |
| Metals & Mining | 6.7% | |
| Construction Materials | 3.1% | |
| Paper & Forest Products | 1.7% | |
| All Others* | 1.9% | |

* Includes short-term investments and net other assets (liabilities).
Percentages shown as 0.0% may reflect amounts less than 0.05%.
Materials Portfolio
Investments August 31, 2015 (Unaudited)
Showing Percentage of Net Assets
| Common Stocks - 97.7% | |||
| Shares | Value | ||
| Chemicals - 63.5% | |||
| Commodity Chemicals - 8.2% | |||
| LyondellBasell Industries NV Class A | 1,421,396 | $121,358,790 | |
| Orion Engineered Carbons SA | 987,291 | 16,191,572 | |
| 137,550,362 | |||
| Diversified Chemicals - 17.4% | |||
| E.I. du Pont de Nemours & Co. | 3,037,700 | 156,441,550 | |
| Eastman Chemical Co. | 1,857,730 | 134,611,116 | |
| 291,052,666 | |||
| Fertilizers & Agricultural Chemicals - 14.5% | |||
| Agrium, Inc. | 235,300 | 24,433,211 | |
| CF Industries Holdings, Inc. | 1,004,710 | 57,650,260 | |
| Monsanto Co. | 1,644,830 | 160,617,649 | |
| 242,701,120 | |||
| Specialty Chemicals - 23.4% | |||
| Albemarle Corp. U.S. | 634,700 | 28,694,787 | |
| Ashland, Inc. | 473,600 | 49,713,792 | |
| Ecolab, Inc. | 988,320 | 107,865,245 | |
| Frutarom Industries Ltd. | 192,796 | 7,320,092 | |
| NewMarket Corp. | 73,229 | 28,064,282 | |
| PPG Industries, Inc. | 864,500 | 82,378,205 | |
| Valspar Corp. | 447,600 | 32,809,080 | |
| W.R. Grace & Co. (a) | 554,340 | 54,846,400 | |
| 391,691,883 | |||
| TOTAL CHEMICALS | 1,062,996,031 | ||
| Construction Materials - 4.6% | |||
| Construction Materials - 4.6% | |||
| Eagle Materials, Inc. | 945,655 | 77,382,949 | |
| Containers & Packaging - 21.6% | |||
| Metal & Glass Containers - 4.2% | |||
| Ball Corp. | 747,683 | 49,279,787 | |
| Owens-Illinois, Inc. (a) | 995,900 | 20,764,515 | |
| 70,044,302 | |||
| Paper Packaging - 17.4% | |||
| Graphic Packaging Holding Co. | 4,485,495 | 63,245,480 | |
| Packaging Corp. of America | 477,700 | 32,058,447 | |
| Sealed Air Corp. | 819,000 | 42,137,550 | |
| WestRock Co. | 2,585,119 | 153,426,813 | |
| 290,868,290 | |||
| TOTAL CONTAINERS & PACKAGING | 360,912,592 | ||
| Energy Equipment & Services - 0.3% | |||
| Oil & Gas Equipment & Services - 0.3% | |||
| Aspen Aerogels, Inc. (a) | 730,304 | 5,455,371 | |
| Metals & Mining - 5.2% | |||
| Steel - 5.2% | |||
| Nucor Corp. | 763,000 | 33,030,270 | |
| Steel Dynamics, Inc. | 2,789,000 | 54,329,720 | |
| 87,359,990 | |||
| Paper & Forest Products - 1.5% | |||
| Paper Products - 1.5% | |||
| Domtar Corp. | 614,400 | 24,705,024 | |
| Trading Companies & Distributors - 1.0% | |||
| Trading Companies & Distributors - 1.0% | |||
| Wolseley PLC | 265,676 | 17,151,090 | |
| TOTAL COMMON STOCKS | |||
| (Cost $1,466,459,195) | 1,635,963,047 | ||
| Money Market Funds - 1.7% | |||
| Fidelity Cash Central Fund, 0.15% (b) | 29,154,794 | 29,154,794 | |
| Fidelity Securities Lending Cash Central Fund, 0.19% (b)(c) | 12,705 | 12,705 | |
| TOTAL MONEY MARKET FUNDS | |||
| (Cost $29,167,499) | 29,167,499 | ||
| TOTAL INVESTMENT PORTFOLIO - 99.4% | |||
| (Cost $1,495,626,694) | 1,665,130,546 | ||
| NET OTHER ASSETS (LIABILITIES) - 0.6% | 9,372,241 | ||
| NET ASSETS - 100% | $1,674,502,787 |
Legend
(a) Non-income producing
(b) Affiliated fund that is generally available only to investment companies and other accounts managed by Fidelity Investments. The rate quoted is the annualized seven-day yield of the fund at period end. A complete unaudited listing of the fund's holdings as of its most recent quarter end is available upon request. In addition, each Fidelity Central Fund's financial statements are available on the SEC's website or upon request.
(c) Investment made with cash collateral received from securities on loan.
Affiliated Central Funds
Information regarding fiscal year to date income earned by the Fund from investments in Fidelity Central Funds is as follows:
| Fund | Income earned |
| Fidelity Cash Central Fund | $16,804 |
| Fidelity Securities Lending Cash Central Fund | 47,166 |
| Total | $63,970 |
Other Affiliated Issuers
An affiliated company is a company in which the Fund has ownership of at least 5% of the voting securities. Fiscal year to date transactions with companies which are or were affiliates are as follows:
| Affiliate | Value, beginning of period | Purchases | Sales Proceeds | Dividend Income | Value, end of period |
| Aspen Aerogels, Inc. | $10,127,522 | $-- | $3,743,092 | $-- | $-- |
| Total | $10,127,522 | $-- | $3,743,092 | $-- | $-- |
Investment Valuation
All investments are categorized as Level 1 under the Fair Value Hierarchy. The inputs or methodology used for valuing securities may not be an indication of the risk associated with investing in those securities. For more information on valuation inputs please refer to the Investment Valuation section in the accompanying Notes to Financial Statements.
Other Information
Distribution of investments by country or territory of incorporation, as a percentage of Total Net Assets, is as follows (Unaudited):
| United States of America | 88.9% |
| Netherlands | 7.2% |
| Canada | 1.5% |
| Bailiwick of Jersey | 1.0% |
| Luxembourg | 1.0% |
| Others (Individually Less Than 1%) | 0.4% |
| 100.0% |
See accompanying notes which are an integral part of the financial statements.
Materials Portfolio
Financial Statements
Statement of Assets and Liabilities
| August 31, 2015 (Unaudited) | ||
| Assets | ||
| Investment in securities, at value (including securities loaned of $12,140) — See accompanying schedule: Unaffiliated issuers (cost $1,466,459,195) | $1,635,963,047 | |
| Fidelity Central Funds (cost $29,167,499) | 29,167,499 | |
| Total Investments (cost $1,495,626,694) | $1,665,130,546 | |
| Receivable for investments sold | 13,287,975 | |
| Receivable for fund shares sold | 2,167,025 | |
| Dividends receivable | 3,035,995 | |
| Distributions receivable from Fidelity Central Funds | 6,502 | |
| Prepaid expenses | 13,140 | |
| Other receivables | 55,775 | |
| Total assets | 1,683,696,958 | |
| Liabilities | ||
| Payable for investments purchased | $2,755,247 | |
| Payable for fund shares redeemed | 5,040,926 | |
| Accrued management fee | 797,510 | |
| Distribution and service plan fees payable | 153,565 | |
| Other affiliated payables | 361,122 | |
| Other payables and accrued expenses | 73,096 | |
| Collateral on securities loaned, at value | 12,705 | |
| Total liabilities | 9,194,171 | |
| Net Assets | $1,674,502,787 | |
| Net Assets consist of: | ||
| Paid in capital | $1,472,594,709 | |
| Undistributed net investment income | 10,812,476 | |
| Accumulated undistributed net realized gain (loss) on investments and foreign currency transactions | 21,597,795 | |
| Net unrealized appreciation (depreciation) on investments and assets and liabilities in foreign currencies | 169,497,807 | |
| Net Assets | $1,674,502,787 | |
| Calculation of Maximum Offering Price | ||
| Class A: | ||
| Net Asset Value and redemption price per share ($266,036,916 ÷ 3,727,290 shares) | $71.38 | |
| Maximum offering price per share (100/94.25 of $71.38) | $75.73 | |
| Class T: | ||
| Net Asset Value and redemption price per share ($36,405,782 ÷ 513,954 shares) | $70.83 | |
| Maximum offering price per share (100/96.50 of $70.83) | $73.40 | |
| Class B: | ||
| Net Asset Value and offering price per share ($4,335,467 ÷ 62,647 shares)(a) | $69.20 | |
| Class C: | ||
| Net Asset Value and offering price per share ($87,674,791 ÷ 1,269,500 shares)(a) | $69.06 | |
| Materials: | ||
| Net Asset Value, offering price and redemption price per share ($870,836,054 ÷ 12,133,503 shares) | $71.77 | |
| Class I: | ||
| Net Asset Value, offering price and redemption price per share ($409,213,777 ÷ 5,713,013 shares) | $71.63 |
(a) Redemption price per share is equal to net asset value less any applicable contingent deferred sales charge.
See accompanying notes which are an integral part of the financial statements.
Statement of Operations
| Six months ended August 31, 2015 (Unaudited) | ||
| Investment Income | ||
| Dividends | $19,405,914 | |
| Interest | 16 | |
| Income from Fidelity Central Funds | 63,970 | |
| Total income | 19,469,900 | |
| Expenses | ||
| Management fee | $5,244,790 | |
| Transfer agent fees | 1,987,249 | |
| Distribution and service plan fees | 1,010,334 | |
| Accounting and security lending fees | 293,390 | |
| Custodian fees and expenses | 14,041 | |
| Independent trustees' compensation | 16,663 | |
| Registration fees | 93,949 | |
| Audit | 26,997 | |
| Legal | 12,507 | |
| Miscellaneous | 14,580 | |
| Total expenses before reductions | 8,714,500 | |
| Expense reductions | (90,142) | 8,624,358 |
| Net investment income (loss) | 10,845,542 | |
| Realized and Unrealized Gain (Loss)
Net realized gain (loss) on: | ||
| Investment securities: | ||
| Unaffiliated issuers | 38,934,697 | |
| Other affiliated issuers | (16,224) | |
| Foreign currency transactions | (97,265) | |
| Total net realized gain (loss) | 38,821,208 | |
| Change in net unrealized appreciation (depreciation) on: Investment securities | (267,797,224) | |
| Assets and liabilities in foreign currencies | (6,045) | |
| Total change in net unrealized appreciation (depreciation) | (267,803,269) | |
| Net gain (loss) | (228,982,061) | |
| Net increase (decrease) in net assets resulting from operations | $(218,136,519) |
See accompanying notes which are an integral part of the financial statements.
Statement of Changes in Net Assets
| Six months ended August 31, 2015 (Unaudited) | Year ended February 28, 2015 | |
| Increase (Decrease) in Net Assets | ||
| Operations | ||
| Net investment income (loss) | $10,845,542 | $16,415,183 |
| Net realized gain (loss) | 38,821,208 | 140,995,843 |
| Change in net unrealized appreciation (depreciation) | (267,803,269) | (115,351,730) |
| Net increase (decrease) in net assets resulting from operations | (218,136,519) | 42,059,296 |
| Distributions to shareholders from net investment income | – | (14,132,791) |
| Distributions to shareholders from net realized gain | (906,398) | (176,045,519) |
| Total distributions | (906,398) | (190,178,310) |
| Share transactions - net increase (decrease) | (161,718,782) | 139,840,860 |
| Redemption fees | 28,645 | 59,111 |
| Total increase (decrease) in net assets | (380,733,054) | (8,219,043) |
| Net Assets | ||
| Beginning of period | 2,055,235,841 | 2,063,454,884 |
| End of period (including undistributed net investment income of $10,812,476 and distributions in excess of net investment income of $33,066, respectively) | $1,674,502,787 | $2,055,235,841 |
See accompanying notes which are an integral part of the financial statements.
Financial Highlights — Materials Portfolio Class A
| Six months ended (Unaudited) | Years ended February 28, | |||||
| August 31, | 2015 | 2015 | 2014 | 2013 | 2012 A | 2011 |
| Selected Per–Share Data | ||||||
| Net asset value, beginning of period | $80.43 | $86.46 | $73.44 | $69.23 | $69.96 | $52.54 |
| Income from Investment Operations | ||||||
| Net investment income (loss)B | .38 | .51 | .36 | .70 | .40 | 1.08C |
| Net realized and unrealized gain (loss) | (9.39) | 1.05 | 14.56 | 5.69 | (.35) | 17.40 |
| Total from investment operations | (9.01) | 1.56 | 14.92 | 6.39 | .05 | 18.48 |
| Distributions from net investment income | – | (.43) | (.30) | (.63) | (.40) | (1.06) |
| Distributions from net realized gain | (.04) | (7.17) | (1.60) | (1.55) | (.38) | (.01) |
| Total distributions | (.04) | (7.59)D | (1.90) | (2.18) | (.78) | (1.07) |
| Redemption fees added to paid in capitalB | –E | –E | –E | –E | –E | .01 |
| Net asset value, end of period | $71.38 | $80.43 | $86.46 | $73.44 | $69.23 | $69.96 |
| Total ReturnF,G,H | (11.21)% | 2.20% | 20.46% | 9.40% | .21% | 35.33% |
| Ratios to Average Net AssetsI,J | ||||||
| Expenses before reductions | 1.06%K | 1.06% | 1.10% | 1.13% | 1.13% | 1.16% |
| Expenses net of fee waivers, if any | 1.06%K | 1.06% | 1.10% | 1.13% | 1.13% | 1.16% |
| Expenses net of all reductions | 1.05%K | 1.06% | 1.09% | 1.12% | 1.13% | 1.15% |
| Net investment income (loss) | .98%K | .61% | .45% | 1.02% | .61% | 1.81%C |
| Supplemental Data | ||||||
| Net assets, end of period (000 omitted) | $266,037 | $319,740 | $336,777 | $219,627 | $157,781 | $124,160 |
| Portfolio turnover rateL | 70%K | 76%M | 53% | 61% | 94% | 87% |
A For the year ended February 29.
B Calculated based on average shares outstanding during the period.
C Investment income per share reflects a large, non-recurring dividend which amounted to $.83 per share. Excluding this non-recurring dividend, the ratio of net investment income (loss) to average net assets would have been .41%.
D Total distributions of $7.59 per share is comprised of distributions from net investment income of $.425 and distributions from net realized gain of $7.167 per share.
E Amount represents less than $.005 per share.
F Total returns for periods of less than one year are not annualized.
G Total returns would have been lower if certain expenses had not been reduced during the applicable periods shown.
H Total returns do not include the effect of the sales charges.
I Fees and expenses of any underlying Fidelity Central Funds are not included in the Fund's expense ratio. The Fund indirectly bears its proportionate share of the expenses of any underlying Fidelity Central Funds.
J Expense ratios reflect operating expenses of the class. Expenses before reductions do not reflect amounts reimbursed by the investment adviser or reductions from brokerage service arrangements or reductions from other expense offset arrangements and do not represent the amount paid by the class during periods when reimbursements or reductions occur. Expenses net of fee waivers reflect expenses after reimbursement by the investment adviser but prior to reductions from brokerage service arrangements or other expense offset arrangements. Expenses net of all reductions represent the net expenses paid by the class.
K Annualized
L Amount does not include the portfolio activity of any underlying Fidelity Central Funds.
M Portfolio turnover rate excludes securities received or delivered in-kind.
See accompanying notes which are an integral part of the financial statements.
Financial Highlights — Materials Portfolio Class T
| Six months ended (Unaudited) | Years ended February 28, | |||||
| August 31, | 2015 | 2015 | 2014 | 2013 | 2012 A | 2011 |
| Selected Per–Share Data | ||||||
| Net asset value, beginning of period | $79.95 | $85.99 | $73.05 | $68.91 | $69.68 | $52.35 |
| Income from Investment Operations | ||||||
| Net investment income (loss)B | .26 | .25 | .12 | .50 | .21 | .90C |
| Net realized and unrealized gain (loss) | (9.34) | 1.06 | 14.48 | 5.66 | (.35) | 17.34 |
| Total from investment operations | (9.08) | 1.31 | 14.60 | 6.16 | (.14) | 18.24 |
| Distributions from net investment income | – | (.18) | (.06) | (.46) | (.25) | (.92) |
| Distributions from net realized gain | (.04) | (7.17) | (1.60) | (1.55) | (.38) | – |
| Total distributions | (.04) | (7.35) | (1.66) | (2.02)D | (.63) | (.92) |
| Redemption fees added to paid in capitalB | –E | –E | –E | –E | –E | .01 |
| Net asset value, end of period | $70.83 | $79.95 | $85.99 | $73.05 | $68.91 | $69.68 |
| Total ReturnF,G,H | (11.37)% | 1.90% | 20.10% | 9.10% | (.09)% | 34.98% |
| Ratios to Average Net AssetsI,J | ||||||
| Expenses before reductions | 1.37%K | 1.37% | 1.40% | 1.42% | 1.42% | 1.44% |
| Expenses net of fee waivers, if any | 1.37%K | 1.37% | 1.40% | 1.42% | 1.42% | 1.44% |
| Expenses net of all reductions | 1.36%K | 1.37% | 1.39% | 1.41% | 1.41% | 1.43% |
| Net investment income (loss) | .67%K | .31% | .15% | .73% | .33% | 1.54%C |
| Supplemental Data | ||||||
| Net assets, end of period (000 omitted) | $36,406 | $45,252 | $45,223 | $37,860 | $28,290 | $25,570 |
| Portfolio turnover rateL | 70%K | 76%M | 53% | 61% | 94% | 87% |
A For the year ended February 29.
B Calculated based on average shares outstanding during the period.
C Investment income per share reflects a large, non-recurring dividend which amounted to $.83 per share. Excluding this non-recurring dividend, the ratio of net investment income (loss) to average net assets would have been .14%.
D Total distributions of $2.02 per share is comprised of distributions from net investment income of $.463 and distributions from net realized gain of $1.552 per share.
E Amount represents less than $.005 per share.
F Total returns for periods of less than one year are not annualized.
G Total returns would have been lower if certain expenses had not been reduced during the applicable periods shown.
H Total returns do not include the effect of the sales charges.
I Fees and expenses of any underlying Fidelity Central Funds are not included in the Fund's expense ratio. The Fund indirectly bears its proportionate share of the expenses of any underlying Fidelity Central Funds.
J Expense ratios reflect operating expenses of the class. Expenses before reductions do not reflect amounts reimbursed by the investment adviser or reductions from brokerage service arrangements or reductions from other expense offset arrangements and do not represent the amount paid by the class during periods when reimbursements or reductions occur. Expenses net of fee waivers reflect expenses after reimbursement by the investment adviser but prior to reductions from brokerage service arrangements or other expense offset arrangements. Expenses net of all reductions represent the net expenses paid by the class.
K Annualized
L Amount does not include the portfolio activity of any underlying Fidelity Central Funds.
M Portfolio turnover rate excludes securities received or delivered in-kind.
See accompanying notes which are an integral part of the financial statements.
Financial Highlights — Materials Portfolio Class B
| Six months ended (Unaudited) | Years ended February 28, | |||||
| August 31, | 2015 | 2015 | 2014 | 2013 | 2012 A | 2011 |
| Selected Per–Share Data | ||||||
| Net asset value, beginning of period | $78.31 | $84.63 | $72.21 | $68.13 | $68.95 | $51.86 |
| Income from Investment Operations | ||||||
| Net investment income (loss)B | .06 | (.18) | (.28) | .16 | (.11) | .60C |
| Net realized and unrealized gain (loss) | (9.13) | 1.03 | 14.28 | 5.57 | (.33) | 17.13 |
| Total from investment operations | (9.07) | .85 | 14.00 | 5.73 | (.44) | 17.73 |
| Distributions from net investment income | – | – | – | (.10) | – | (.65) |
| Distributions from net realized gain | (.04) | (7.17) | (1.58) | (1.55) | (.38) | – |
| Total distributions | (.04) | (7.17) | (1.58) | (1.65) | (.38) | (.65) |
| Redemption fees added to paid in capitalB | –D | –D | –D | –D | –D | .01 |
| Net asset value, end of period | $69.20 | $78.31 | $84.63 | $72.21 | $68.13 | $68.95 |
| Total ReturnE,F,G | (11.59)% | 1.35% | 19.50% | 8.55% | (.57)% | 34.29% |
| Ratios to Average Net AssetsH,I | ||||||
| Expenses before reductions | 1.88%J | 1.89% | 1.90% | 1.92% | 1.91% | 1.93% |
| Expenses net of fee waivers, if any | 1.88%J | 1.89% | 1.90% | 1.92% | 1.91% | 1.93% |
| Expenses net of all reductions | 1.88%J | 1.89% | 1.90% | 1.91% | 1.91% | 1.92% |
| Net investment income (loss) | .16%J | (.22)% | (.36)% | .24% | (.17)% | 1.04%C |
| Supplemental Data | ||||||
| Net assets, end of period (000 omitted) | $4,335 | $6,487 | $8,671 | $10,218 | $11,040 | $13,507 |
| Portfolio turnover rateK | 70%J | 76%L | 53% | 61% | 94% | 87% |
A For the year ended February 29.
B Calculated based on average shares outstanding during the period.
C Investment income per share reflects a large, non-recurring dividend which amounted to $.83 per share. Excluding this non-recurring dividend, the ratio of net investment income (loss) to average net assets would have been (.35) %.
D Amount represents less than $.005 per share.
E Total returns for periods of less than one year are not annualized.
F Total returns would have been lower if certain expenses had not been reduced during the applicable periods shown.
G Total returns do not include the effect of the contingent deferred sales charge.
H Fees and expenses of any underlying Fidelity Central Funds are not included in the Fund's expense ratio. The Fund indirectly bears its proportionate share of the expenses of any underlying Fidelity Central Funds.
I Expense ratios reflect operating expenses of the class. Expenses before reductions do not reflect amounts reimbursed by the investment adviser or reductions from brokerage service arrangements or reductions from other expense offset arrangements and do not represent the amount paid by the class during periods when reimbursements or reductions occur. Expenses net of fee waivers reflect expenses after reimbursement by the investment adviser but prior to reductions from brokerage service arrangements or other expense offset arrangements. Expenses net of all reductions represent the net expenses paid by the class.
J Annualized
K Amount does not include the portfolio activity of any underlying Fidelity Central Funds.
L Portfolio turnover rate excludes securities received or delivered in-kind.
See accompanying notes which are an integral part of the financial statements.
Financial Highlights — Materials Portfolio Class C
| Six months ended (Unaudited) | Years ended February 28, | |||||
| August 31, | 2015 | 2015 | 2014 | 2013 | 2012 A | 2011 |
| Selected Per–Share Data | ||||||
| Net asset value, beginning of period | $78.12 | $84.38 | $71.96 | $67.98 | $68.78 | $51.79 |
| Income from Investment Operations | ||||||
| Net investment income (loss)B | .09 | (.12) | (.23) | .18 | (.10) | .61C |
| Net realized and unrealized gain (loss) | (9.11) | 1.03 | 14.23 | 5.55 | (.32) | 17.09 |
| Total from investment operations | (9.02) | .91 | 14.00 | 5.73 | (.42) | 17.70 |
| Distributions from net investment income | – | – | – | (.20) | – | (.72) |
| Distributions from net realized gain | (.04) | (7.17) | (1.58) | (1.55) | (.38) | – |
| Total distributions | (.04) | (7.17) | (1.58) | (1.75) | (.38) | (.72) |
| Redemption fees added to paid in capitalB | –D | –D | –D | –D | –D | .01 |
| Net asset value, end of period | $69.06 | $78.12 | $84.38 | $71.96 | $67.98 | $68.78 |
| Total ReturnE,F,G | (11.56)% | 1.43% | 19.56% | 8.58% | (.55)% | 34.29% |
| Ratios to Average Net AssetsH,I | ||||||
| Expenses before reductions | 1.82%J | 1.82% | 1.85% | 1.89% | 1.89% | 1.93% |
| Expenses net of fee waivers, if any | 1.81%J | 1.82% | 1.85% | 1.89% | 1.89% | 1.93% |
| Expenses net of all reductions | 1.81%J | 1.82% | 1.84% | 1.88% | 1.89% | 1.92% |
| Net investment income (loss) | .23%J | (.14)% | (.30)% | .26% | (.15)% | 1.04%C |
| Supplemental Data | ||||||
| Net assets, end of period (000 omitted) | $87,675 | $107,697 | $106,879 | $75,007 | $58,296 | $46,525 |
| Portfolio turnover rateK | 70%J | 76%L | 53% | 61% | 94% | 87% |
A For the year ended February 29.
B Calculated based on average shares outstanding during the period.
C Investment income per share reflects a large, non-recurring dividend which amounted to $.83 per share. Excluding this non-recurring dividend, the ratio of net investment income (loss) to average net assets would have been (.35) %.
D Amount represents less than $.005 per share.
E Total returns for periods of less than one year are not annualized.
F Total returns would have been lower if certain expenses had not been reduced during the applicable periods shown.
G Total returns do not include the effect of the contingent deferred sales charge.
H Fees and expenses of any underlying Fidelity Central Funds are not included in the Fund's expense ratio. The Fund indirectly bears its proportionate share of the expenses of any underlying Fidelity Central Funds.
I Expense ratios reflect operating expenses of the class. Expenses before reductions do not reflect amounts reimbursed by the investment adviser or reductions from brokerage service arrangements or reductions from other expense offset arrangements and do not represent the amount paid by the class during periods when reimbursements or reductions occur. Expenses net of fee waivers reflect expenses after reimbursement by the investment adviser but prior to reductions from brokerage service arrangements or other expense offset arrangements. Expenses net of all reductions represent the net expenses paid by the class.
J Annualized
K Amount does not include the portfolio activity of any underlying Fidelity Central Funds.
L Portfolio turnover rate excludes securities received or delivered in-kind.
See accompanying notes which are an integral part of the financial statements.
Financial Highlights — Materials Portfolio
| Six months ended (Unaudited) | Years ended February 28, | |||||
| August 31, | 2015 | 2015 | 2014 | 2013 | 2012 A | 2011 |
| Selected Per–Share Data | ||||||
| Net asset value, beginning of period | $80.77 | $86.81 | $73.68 | $69.41 | $70.11 | $52.61 |
| Income from Investment Operations | ||||||
| Net investment income (loss)B | .48 | .73 | .58 | .90 | .60 | 1.25C |
| Net realized and unrealized gain (loss) | (9.44) | 1.05 | 14.63 | 5.71 | (.37) | 17.43 |
| Total from investment operations | (8.96) | 1.78 | 15.21 | 6.61 | .23 | 18.68 |
| Distributions from net investment income | – | (.65) | (.48) | (.79) | (.55) | (1.16) |
| Distributions from net realized gain | (.04) | (7.17) | (1.60) | (1.55) | (.38) | (.03) |
| Total distributions | (.04) | (7.82) | (2.08) | (2.34) | (.93) | (1.19) |
| Redemption fees added to paid in capitalB | –D | –D | –D | –D | –D | .01 |
| Net asset value, end of period | $71.77 | $80.77 | $86.81 | $73.68 | $69.41 | $70.11 |
| Total ReturnE,F | (11.10)% | 2.46% | 20.80% | 9.71% | .49% | 35.70% |
| Ratios to Average Net AssetsG,H | ||||||
| Expenses before reductions | .81%I | .80% | .82% | .85% | .85% | .88% |
| Expenses net of fee waivers, if any | .80%I | .80% | .82% | .85% | .85% | .88% |
| Expenses net of all reductions | .80%I | .80% | .82% | .84% | .84% | .87% |
| Net investment income (loss) | 1.24%I | .87% | .73% | 1.30% | .90% | 2.10%C |
| Supplemental Data | ||||||
| Net assets, end of period (000 omitted) | $870,836 | $1,107,689 | $1,231,942 | $1,146,782 | $1,089,619 | $1,195,371 |
| Portfolio turnover rateJ | 70%I | 76%K | 53% | 61% | 94% | 87% |
A For the year ended February 29.
B Calculated based on average shares outstanding during the period.
C Investment income per share reflects a large, non-recurring dividend which amounted to $.83 per share. Excluding this non-recurring dividend, the ratio of net investment income (loss) to average net assets would have been .70%.
D Amount represents less than $.005 per share.
E Total returns for periods of less than one year are not annualized.
F Total returns would have been lower if certain expenses had not been reduced during the applicable periods shown.
G Fees and expenses of any underlying Fidelity Central Funds are not included in the Fund's expense ratio. The Fund indirectly bears its proportionate share of the expenses of any underlying Fidelity Central Funds.
H Expense ratios reflect operating expenses of the class. Expenses before reductions do not reflect amounts reimbursed by the investment adviser or reductions from brokerage service arrangements or reductions from other expense offset arrangements and do not represent the amount paid by the class during periods when reimbursements or reductions occur. Expenses net of fee waivers reflect expenses after reimbursement by the investment adviser but prior to reductions from brokerage service arrangements or other expense offset arrangements. Expenses net of all reductions represent the net expenses paid by the class.
I Annualized
J Amount does not include the portfolio activity of any underlying Fidelity Central Funds.
K Portfolio turnover rate excludes securities received or delivered in-kind.
See accompanying notes which are an integral part of the financial statements.
Financial Highlights — Materials Portfolio Class I
| Six months ended (Unaudited) | Years ended February 28, | |||||
| August 31, | 2015 | 2015 | 2014 | 2013 | 2012 A | 2011 |
| Selected Per–Share Data | ||||||
| Net asset value, beginning of period | $80.60 | $86.66 | $73.57 | $69.35 | $70.05 | $52.58 |
| Income from Investment Operations | ||||||
| Net investment income (loss)B | .49 | .74 | .59 | .90 | .60 | 1.28C |
| Net realized and unrealized gain (loss) | (9.42) | 1.05 | 14.60 | 5.70 | (.36) | 17.40 |
| Total from investment operations | (8.93) | 1.79 | 15.19 | 6.60 | .24 | 18.68 |
| Distributions from net investment income | – | (.68) | (.50) | (.83) | (.56) | (1.19) |
| Distributions from net realized gain | (.04) | (7.17) | (1.60) | (1.55) | (.38) | (.03) |
| Total distributions | (.04) | (7.85) | (2.10) | (2.38) | (.94) | (1.22) |
| Redemption fees added to paid in capitalB | –D | –D | –D | –D | –D | .01 |
| Net asset value, end of period | $71.63 | $80.60 | $86.66 | $73.57 | $69.35 | $70.05 |
| Total ReturnE,F | (11.09)% | 2.49% | 20.81% | 9.71% | .50% | 35.73% |
| Ratios to Average Net AssetsG,H | ||||||
| Expenses before reductions | .78%I | .78% | .81% | .85% | .84% | .86% |
| Expenses net of fee waivers, if any | .78%I | .78% | .81% | .85% | .84% | .86% |
| Expenses net of all reductions | .78%I | .78% | .81% | .84% | .83% | .85% |
| Net investment income (loss) | 1.26%I | .89% | .74% | 1.30% | .91% | 2.11%C |
| Supplemental Data | ||||||
| Net assets, end of period (000 omitted) | $409,214 | $468,371 | $333,963 | $246,696 | $89,299 | $85,130 |
| Portfolio turnover rateJ | 70%I | 76%K | 53% | 61% | 94% | 87% |
A For the year ended February 29.
B Calculated based on average shares outstanding during the period.
C Investment income per share reflects a large, non-recurring dividend which amounted to $.83 per share. Excluding this non-recurring dividend, the ratio of net investment income (loss) to average net assets would have been .72%.
D Amount represents less than $.005 per share.
E Total returns for periods of less than one year are not annualized.
F Total returns would have been lower if certain expenses had not been reduced during the applicable periods shown.
G Fees and expenses of any underlying Fidelity Central Funds are not included in the Fund's expense ratio. The Fund indirectly bears its proportionate share of the expenses of any underlying Fidelity Central Funds.
H Expense ratios reflect operating expenses of the class. Expenses before reductions do not reflect amounts reimbursed by the investment adviser or reductions from brokerage service arrangements or reductions from other expense offset arrangements and do not represent the amount paid by the class during periods when reimbursements or reductions occur. Expenses net of fee waivers reflect expenses after reimbursement by the investment adviser but prior to reductions from brokerage service arrangements or other expense offset arrangements. Expenses net of all reductions represent the net expenses paid by the class.
I Annualized
J Amount does not include the portfolio activity of any underlying Fidelity Central Funds.
K Portfolio turnover rate excludes securities received or delivered in-kind.
See accompanying notes which are an integral part of the financial statements.
Notes to Financial Statements (Unaudited)
For the period ended August 31, 2015
1. Organization.
Materials Portfolio (the Fund) is a non-diversified fund of Fidelity Select Portfolios (the Trust) and is authorized to issue an unlimited number of shares. The Trust is registered under the Investment Company Act of 1940, as amended (the 1940 Act), as an open-end management investment company organized as a Massachusetts business trust. The Fund invests primarily in securities of companies whose principal business activities fall within specific industries. The Fund offers Class A, Class T, Class C, Materials and Class I (formerly Institutional Class) shares, each of which, along with Class B shares, has equal rights as to assets and voting privileges. Class B shares are closed to new accounts and additional purchases, except for exchanges and reinvestments. Each class has exclusive voting rights with respect to matters that affect that class. Class B shares will automatically convert to Class A shares after a holding period of seven years from the initial date of purchase.
2. Investments in Fidelity Central Funds.
The Fund invests in Fidelity Central Funds, which are open-end investment companies generally available only to other investment companies and accounts managed by the investment adviser and its affiliates. The Fund's Schedule of Investments lists each of the Fidelity Central Funds held as of period end, if any, as an investment of the Fund, but does not include the underlying holdings of each Fidelity Central Fund. As an Investing Fund, the Fund indirectly bears its proportionate share of the expenses of the underlying Fidelity Central Funds.
The Money Market Central Funds seek preservation of capital and current income and are managed by Fidelity Investments Money Management, Inc. (FIMM), an affiliate of the investment adviser. Annualized expenses of the Money Market Central Funds as of their most recent shareholder report date are less than .01%.
A complete unaudited list of holdings for each Fidelity Central Fund is available upon request or at the Securities and Exchange Commission (the SEC) website at www.sec.gov. In addition, the financial statements of the Fidelity Central Funds are available on the SEC website or upon request.
3. Significant Accounting Policies.
The financial statements have been prepared in conformity with accounting principles generally accepted in the United States of America (GAAP), which require management to make certain estimates and assumptions at the date of the financial statements. Actual results could differ from those estimates. Subsequent events, if any, through the date that the financial statements were issued have been evaluated in the preparation of the financial statements. The following summarizes the significant accounting policies of the Fund:
Investment Valuation. Investments are valued as of 4:00 p.m. Eastern time on the last calendar day of the period. The Board of Trustees (the Board) has delegated the day to day responsibility for the valuation of the Fund's investments to the Fidelity SelectCo, LLC (SelectCo) Fair Value Committee (the Committee). In accordance with valuation policies and procedures approved by the Board, the Fund attempts to obtain prices from one or more third party pricing vendors or brokers to value its investments. When current market prices, quotations or currency exchange rates are not readily available or reliable, investments will be fair valued in good faith by the Committee, in accordance with procedures adopted by the Board. Factors used in determining fair value vary by investment type and may include market or investment specific events. The frequency with which these procedures are used cannot be predicted and they may be utilized to a significant extent. The Committee oversees the Fund's valuation policies and procedures and reports to the Board on the Committee's activities and fair value determinations. The Board monitors the appropriateness of the procedures used in valuing the Fund's investments and ratifies the fair value determinations of the Committee.
The Fund categorizes the inputs to valuation techniques used to value its investments into a disclosure hierarchy consisting of three levels as shown below:
- Level 1 – quoted prices in active markets for identical investments
- Level 2 – other significant observable inputs (including quoted prices for similar investments, interest rates, prepayment speeds, etc.)
- Level 3 – unobservable inputs (including the Fund's own assumptions based on the best information available)
Valuation techniques used to value the Fund's investments by major category are as follows:
Equity securities, including restricted securities, for which market quotations are readily available, are valued at the last reported sale price or official closing price as reported by a third party pricing vendor on the primary market or exchange on which they are traded and are categorized as Level 1 in the hierarchy. In the event there were no sales during the day or closing prices are not available, securities are valued at the last quoted bid price or may be valued using the last available price and are generally categorized as Level 2 in the hierarchy. For foreign equity securities, when market or security specific events arise, comparisons to the valuation of American Depositary Receipts (ADRs), futures contracts, Exchange-Traded Funds (ETFs) and certain indexes as well as quoted prices for similar securities may be used and would be categorized as Level 2 in the hierarchy. Utilizing these techniques may result in transfers between Level 1 and Level 2. For equity securities, including restricted securities, where observable inputs are limited, assumptions about market activity and risk are used and these securities may be categorized as Level 3 in the hierarchy.
Investments in open-end mutual funds, including the Fidelity Central Funds, are valued at their closing net asset value (NAV) each business day and are categorized as Level 1 in the hierarchy.
Changes in valuation techniques may result in transfers in or out of an assigned level within the disclosure hierarchy.
Foreign Currency. The Fund may use foreign currency contracts to facilitate transactions in foreign-denominated securities. Gains and losses from these transactions may arise from changes in the value of the foreign currency or if the counterparties do not perform under the contracts' terms.
Foreign-denominated assets, including investment securities, and liabilities are translated into U.S. dollars at the exchange rates at period end. Purchases and sales of investment securities, income and dividends received and expenses denominated in foreign currencies are translated into U.S. dollars at the exchange rate in effect on the transaction date.
The effects of exchange rate fluctuations on investments are included with the net realized and unrealized gain (loss) on investment securities. Other foreign currency transactions resulting in realized and unrealized gain (loss) are disclosed separately.
Investment Transactions and Income. For financial reporting purposes, the Fund's investment holdings and NAV include trades executed through the end of the last business day of the period. The NAV per share for processing shareholder transactions is calculated as of the close of business of the New York Stock Exchange (NYSE), normally 4:00 p.m. Eastern time and includes trades executed through the end of the prior business day. Gains and losses on securities sold are determined on the basis of identified cost and may include proceeds received from litigation. Dividend income is recorded on the ex-dividend date, except for certain dividends from foreign securities where the ex-dividend date may have passed, which are recorded as soon as the Fund is informed of the ex-dividend date. Non-cash dividends included in dividend income, if any, are recorded at the fair market value of the securities received. Income and capital gain distributions from Fidelity Central Funds, if any, are recorded on the ex-dividend date. Distributions received on securities that represent a return of capital or capital gain are recorded as a reduction of cost of investments and/or as a realized gain. Subsequent to ex-dividend date the Fund determines the components of these distributions, based upon receipt of tax filings or other correspondence relating to the underlying investment. Interest income is accrued as earned and includes coupon interest and amortization of premium and accretion of discount on debt securities as applicable. Investment income is recorded net of foreign taxes withheld where recovery of such taxes is uncertain.
Class Allocations and Expenses. Investment income, realized and unrealized capital gains and losses, common expenses of the Fund, and certain fund-level expense reductions, if any, are allocated daily on a pro-rata basis to each class based on the relative net assets of each class to the total net assets of the Fund. Each class differs with respect to transfer agent and distribution and service plan fees incurred. Certain expense reductions may also differ by class. For the reporting period, the allocated portion of income and expenses to each class as a percent of its average net assets may vary due to the timing of recording these transactions in relation to fluctuating net assets of the classes. Expenses directly attributable to a fund are charged to that fund. Expenses attributable to more than one fund are allocated among the respective funds on the basis of relative net assets or other appropriate methods. Expense estimates are accrued in the period to which they relate and adjustments are made when actual amounts are known.
Deferred Trustee Compensation. Under a Deferred Compensation Plan (the Plan), independent Trustees may elect to defer receipt of a portion of their annual compensation. Deferred amounts are invested in a cross-section of Fidelity funds, are marked-to-market and remain in the Fund until distributed in accordance with the Plan. The investment of deferred amounts and the offsetting payable to the Trustees are included in the accompanying Statement of Assets and Liabilities.
Income Tax Information and Distributions to Shareholders. Each year, the Fund intends to qualify as a regulated investment company under Subchapter M of the Internal Revenue Code, including distributing substantially all of its taxable income and realized gains. As a result, no provision for U.S. Federal income taxes is required. The Fund files a U.S. federal tax return, in addition to state and local tax returns as required. The Fund's federal income tax returns are subject to examination by the Internal Revenue Service (IRS) for a period of three fiscal years after they are filed. State and local tax returns may be subject to examination for an additional fiscal year depending on the jurisdiction. Foreign taxes are provided for based on the Fund's understanding of the tax rules and rates that exist in the foreign markets in which it invests.
Distributions are declared and recorded on the ex-dividend date. Income dividends and capital gain distributions are declared separately for each class. Income and capital gain distributions are determined in accordance with income tax regulations, which may differ from GAAP.
Capital accounts within the financial statements are adjusted for permanent book-tax differences. These adjustments have no impact on net assets or the results of operations. Capital accounts are not adjusted for temporary book-tax differences which will reverse in a subsequent period.
Book-tax differences are primarily due to foreign currency transactions, in-kind transactions, passive foreign investment companies (PFIC), original issue discount, deferred trustees compensation, capital loss carryforwards and losses deferred due to wash sales and excise tax regulations.
The federal tax cost of investment securities and unrealized appreciation (depreciation) as of period end were as follows:
| Gross unrealized appreciation | $275,231,923 |
| Gross unrealized depreciation | (110,844,501) |
| Net unrealized appreciation (depreciation) on securities | $164,387,422 |
| Tax cost | $1,500,743,124 |
The Fund elected to defer to its next fiscal year approximately $5,660,716 of capital losses recognized during the period November 1, 2014 to February 28, 2015.
Capital loss carryforwards are only available to offset future gains of the Fund to the extent provided by regulations and may be limited. Under the Regulated Investment Company Modernization Act or 2010 (the Act), the Fund is permitted to carry forward capital losses incurred in taxable years beginning after December 22, 2010 for an unlimited period and such capital losses are required to be used prior to any losses that expire. The capital loss carryforward information presented below, including any applicable limitation, is estimated as of prior fiscal period end and is subject to adjustment.
| Fiscal year of expiration: | |
| 2017 | $(810,939) |
| 2018 | (1,022,988) |
| 2019 | (80,787) |
| Total with expiration | $(1,914,714) |
The Fund acquired $1,914,714 of its capital loss carryforward as part of a merger in a prior period. The losses acquired that will be available to offset future capital gains of the Fund will be limited to approximately $611,309 per year.
Trading (Redemption) Fees. Shares held by investors in the Fund less than 30 days may be subject to a redemption fee equal to .75% of the NAV of shares redeemed. All redemption fees, which reduce the proceeds of the shareholder redemption, are retained by the Fund and accounted for as an addition to paid in capital.
4. Purchases and Sales of Investments.
Purchases and sales of securities, other than short-term securities, aggregated $655,679,558 and $827,401,816, respectively.
5. Fees and Other Transactions with Affiliates.
Management Fee. Fidelity SelectCo, LLC (the investment adviser) and its affiliates provide the Fund with investment management related services for which the Fund pays a monthly management fee. The management fee is the sum of an individual fund fee rate that is based on an annual rate of .30% of the Fund's average net assets and an annualized group fee rate that averaged .25% during the period. The group fee rate is based upon the average net assets of all the mutual funds advised by Fidelity Management & Research Company (FMR) and the investment adviser. The group fee rate decreases as assets under management increase and increases as assets under management decrease. For the reporting period, the total annualized management fee rate was .55% of the Fund's average net assets.
Distribution and Service Plan Fees. In accordance with Rule 12b-1 of the 1940 Act, the Fund has adopted separate Distribution and Service Plans for each class of shares. Certain classes pay Fidelity Distributors Corporation (FDC), an affiliate of the investment adviser, separate Distribution and Service Fees, each of which is based on an annual percentage of each class' average net assets. In addition, FDC may pay financial intermediaries for selling shares of the Fund and providing shareholder support services. For the period, the Distribution and Service Fee rates, total fees and amounts retained by FDC were as follows:
| Distribution Fee | Service Fee | Total Fees | Retained by FDC |
|
| Class A | -% | .25% | $375,494 | $– |
| Class T | .25% | .25% | 103,416 | – |
| Class B | .75% | .25% | 27,071 | 20,303 |
| Class C | .75% | .25% | 504,353 | 82,905 |
| $1,010,334 | $103,208 |
Sales Load. FDC may receive a front-end sales charge of up to 5.75% for selling Class A shares and 3.50% for selling Class T shares, some of which is paid to financial intermediaries for selling shares of the Fund. Depending on the holding period, FDC may receive contingent deferred sales charges levied on Class A, Class T, Class B, and Class C redemptions. The deferred sales charges range from 5.00% to 1.00% for Class B shares, 1.00% for Class C shares, 1.00% for certain purchases of Class A shares and .25% for certain purchases of Class T shares.
For the period, sales charge amounts retained by FDC were as follows:
| Retained by FDC |
|
| Class A | $36,807 |
| Class T | 2,919 |
| Class B* | 1,723 |
| Class C* | 7,735 |
| $49,184 |
*When Class B and Class C shares are initially sold, FDC pays commissions from its own resources to financial intermediaries through which the sales are made.
Transfer Agent Fees. Fidelity Investments Institutional Operations Company, Inc., (FIIOC), an affiliate of the investment adviser, is the transfer, dividend disbursing and shareholder servicing agent for each class of the Fund. FIIOC receives account fees and asset-based fees that vary according to the account size and type of account of the shareholders of the respective classes of the Fund. FIIOC pays for typesetting, printing and mailing of shareholder reports, except proxy statements.
For the period, transfer agent fees for each class were as follows:
| Amount | % of Class-Level Average Net Assets* |
|
| Class A | $322,696 | .21 |
| Class T | 56,715 | .27 |
| Class B | 7,671 | .28 |
| Class C | 110,277 | .22 |
| Materials | 1,067,247 | .21 |
| Class I | 422,643 | .19 |
| $1,987,249 |
*Annualized
Accounting and Security Lending Fees. Fidelity Service Company, Inc. (FSC), an affiliate of the investment adviser, maintains the Fund's accounting records. The accounting fee is based on the level of average net assets for each month. Under a separate contract, FSC administers the security lending program. The security lending fee is based on the number and duration of lending transactions.
Brokerage Commissions. The Fund placed a portion of its portfolio transactions with brokerage firms which are affiliates of the investment adviser. Brokerage commissions are included in net realized gain (loss) and change in net unrealized appreciation (depreciation) in the Statement of Operations. The commissions paid to these affiliated firms were $10,550 for the period.
6. Committed Line of Credit.
The Fund participates with other funds managed by the investment adviser or an affiliate in a $4.25 billion credit facility (the "line of credit") to be utilized for temporary or emergency purposes to fund shareholder redemptions or for other short-term liquidity purposes. The Fund has agreed to pay commitment fees on its pro-rata portion of the line of credit, which amounted to $1,527 and is reflected in Miscellaneous expenses on the Statement of Operations. During the period, the Fund did not borrow on this line of credit.
7. Security Lending.
The Fund lends portfolio securities through a lending agent from time to time in order to earn additional income. On the settlement date of the loan, the Fund receives collateral (in the form of U.S. Treasury obligations, letters of credit and/or cash) against the loaned securities and maintains collateral in an amount not less than 100% of the market value of the loaned securities during the period of the loan. The market value of the loaned securities is determined at the close of business of the Fund and any additional required collateral is delivered to the Fund on the next business day. If the borrower defaults on its obligation to return the securities loaned because of insolvency or other reasons, the Fund may apply collateral received from the borrower against the obligation. The Fund may experience delays and costs in recovering the securities loaned. Any cash collateral received is invested in the Fidelity Securities Lending Cash Central Fund. The value of loaned securities and cash collateral at period end are disclosed on the Fund's Statement of Assets and Liabilities. Security lending income represents the income earned on investing cash collateral, less rebates paid to borrowers and any lending agent fees associated with the loan, plus any premium payments received for lending certain types of securities. Security lending income is presented in the Statement of Operations as a component of income from Fidelity Central Funds. Total security lending income during the period amounted to $47,166.
8. Expense Reductions.
Commissions paid to certain brokers with whom the investment adviser, or its affiliates, places trades on behalf of the Fund include an amount in addition to trade execution, which may be rebated back to the Fund to offset certain expenses. This amount totaled $36,952 for the period.
In addition, during the period the investment adviser reimbursed and/or waived a portion of fund-level operating expenses in the amount of $7,779 and a portion of class-level operating expenses as follows:
| Amount | |
| Class A | $6,876 |
| Class T | 846 |
| Class B | 22 |
| Class C | 2,309 |
| Materials | 27,233 |
| Class I | 8,125 |
| $ 45,411 |
9. Distributions to Shareholders.
Distributions to shareholders of each class were as follows:
| Six months ended August 31, 2015 | Year ended February 28, 2015 | |
| From net investment income | ||
| Class A | $– | $1,638,100 |
| Class T | – | 99,020 |
| Materials | – | 8,803,568 |
| Class I | – | 3,592,103 |
| Total | $– | $14,132,791 |
| From net realized gain | ||
| Class A | $142,163 | $27,780,861 |
| Class T | 19,809 | 3,863,168 |
| Class B | 2,750 | 628,830 |
| Class C | 49,466 | 9,676,799 |
| Materials | 481,379 | 98,020,822 |
| Class I | 210,831 | 36,075,039 |
| Total | $906,398 | $176,045,519 |
10. Share Transactions.
Share transactions for each class were as follows and may contain automatic conversions between classes or exchanges between funds:
| Shares | Shares | Dollars | Dollars | |
| Six months ended August 31, 2015 | Year ended February 28, 2015 | Six months ended August 31, 2015 | Year ended February 28, 2015 | |
| Class A | ||||
| Shares sold | 440,698 | 1,287,549 | $34,144,694 | $107,992,682 |
| Reinvestment of distributions | 1,705 | 350,058 | 134,157 | 27,494,344 |
| Shares redeemed | (690,349) | (1,557,532) | (53,337,676) | (130,043,911) |
| Net increase (decrease) | (247,946) | 80,075 | $(19,058,825) | $5,443,115 |
| Class T | ||||
| Shares sold | 37,053 | 122,029 | $2,833,717 | $10,167,521 |
| Reinvestment of distributions | 244 | 48,608 | 19,104 | 3,794,851 |
| Shares redeemed | (89,364) | (130,511) | (6,884,642) | (10,688,592) |
| Net increase (decrease) | (52,067) | 40,126 | $(4,031,821) | $3,273,780 |
| Class B | ||||
| Shares sold | 1,414 | 2,935 | $108,496 | $242,184 |
| Reinvestment of distributions | 34 | 7,683 | 2,627 | 590,123 |
| Shares redeemed | (21,639) | (30,247) | (1,632,076) | (2,465,575) |
| Net increase (decrease) | (20,191) | (19,629) | $(1,520,953) | $(1,633,268) |
| Class C | ||||
| Shares sold | 85,043 | 367,698 | $6,423,692 | $30,096,831 |
| Reinvestment of distributions | 579 | 110,883 | 44,233 | 8,472,087 |
| Shares redeemed | (194,719) | (366,676) | (14,553,390) | (29,116,038) |
| Net increase (decrease) | (109,097) | 111,905 | $(8,085,465) | $9,452,880 |
| Materials | ||||
| Shares sold | 625,816 | 2,411,814 | $48,746,846 | $202,615,605 |
| Reinvestment of distributions | 5,717 | 1,274,428 | 451,965 | 100,536,677 |
| Shares redeemed | (2,211,617) | (4,164,314) | (171,119,417) | (345,204,286) |
| Net increase (decrease) | (1,580,084) | (478,072) | $(121,920,606) | $(42,052,004) |
| Class I | ||||
| Shares sold | 840,288 | 4,739,071A | $65,266,509 | $400,864,210A |
| Reinvestment of distributions | 2,499 | 464,747 | 197,171 | 36,366,289 |
| Shares redeemed | (940,497) | (3,246,644)B | (72,564,792) | (271,874,142)B |
| Net increase (decrease) | (97,710) | 1,957,174 | $(7,101,112) | $165,356,357 |
A Amount includes in-kind exchanges.
B Amount includes in-kind redemptions.
11. Other.
The Fund's organizational documents provide former and current trustees and officers with a limited indemnification against liabilities arising in connection with the performance of their duties to the Fund. In the normal course of business, the Fund may also enter into contracts that provide general indemnifications. The Fund's maximum exposure under these arrangements is unknown as this would be dependent on future claims that may be made against the Fund. The risk of material loss from such claims is considered remote.
Telecommunications Portfolio
Investment Summary (Unaudited)
Top Ten Stocks as of August 31, 2015
| % of fund's net assets | % of fund's net assets 6 months ago | |
| AT&T, Inc. | 24.0 | 13.9 |
| Verizon Communications, Inc. | 16.6 | 19.9 |
| T-Mobile U.S., Inc. | 4.5 | 4.3 |
| Level 3 Communications, Inc. | 4.5 | 6.4 |
| SBA Communications Corp. Class A | 4.2 | 4.3 |
| American Tower Corp. | 4.2 | 2.3 |
| Cogent Communications Group, Inc. | 3.9 | 4.3 |
| CenturyLink, Inc. | 3.2 | 3.3 |
| Telephone & Data Systems, Inc. | 3.0 | 3.2 |
| Frontier Communications Corp. | 2.8 | 3.0 |
| 70.9 |
Top Industries (% of fund's net assets)
| As of August 31, 2015 | ||
| Diversified Telecommunication Services | 70.2% | |
| Wireless Telecommunication Services | 19.1% | |
| Real Estate Investment Trusts | 5.2% | |
| Media | 2.1% | |
| Internet Software & Services | 1.0% | |
| All Others* | 2.4% | |

| As of February 28, 2015 | ||
| Diversified Telecommunication Services | 62.8% | |
| Wireless Telecommunication Services | 19.8% | |
| Media | 9.8% | |
| Real Estate Investment Trusts | 2.7% | |
| Internet Software & Services | 1.0% | |
| All Others* | 3.9% | |

* Includes short-term investments and net other assets (liabilities).
Telecommunications Portfolio
Investments August 31, 2015 (Unaudited)
Showing Percentage of Net Assets
| Common Stocks - 98.1% | |||
| Shares | Value | ||
| Communications Equipment - 0.7% | |||
| Communications Equipment - 0.7% | |||
| Ruckus Wireless, Inc. (a) | 295,500 | $3,345,060 | |
| Diversified Telecommunication Services - 69.7% | |||
| Alternative Carriers - 18.1% | |||
| 8x8, Inc. (a) | 837,086 | 6,470,675 | |
| Cogent Communications Group, Inc. | 619,868 | 17,213,734 | |
| Globalstar, Inc. (a)(b) | 2,591,600 | 4,561,216 | |
| Iliad SA | 9,309 | 2,102,799 | |
| inContact, Inc. (a)(b) | 958,313 | 7,235,263 | |
| Iridium Communications, Inc. (a)(b) | 504,976 | 3,762,071 | |
| Level 3 Communications, Inc. (a) | 443,767 | 19,849,698 | |
| Lumos Networks Corp. | 579,378 | 6,801,898 | |
| Premiere Global Services, Inc. (a) | 525,883 | 5,669,019 | |
| Towerstream Corp. (a)(b) | 807,024 | 1,202,466 | |
| Vonage Holdings Corp. (a) | 766,171 | 4,252,249 | |
| Zayo Group Holdings, Inc. | 34,800 | 973,356 | |
| 80,094,444 | |||
| Integrated Telecommunication Services - 51.6% | |||
| AT&T, Inc. | 3,201,420 | 106,287,144 | |
| Atlantic Tele-Network, Inc. | 110,000 | 7,859,500 | |
| Bezeq The Israel Telecommunication Corp. Ltd. | 1,252,300 | 2,250,046 | |
| CenturyLink, Inc. | 526,778 | 14,244,077 | |
| Cincinnati Bell, Inc. (a) | 884,314 | 3,033,197 | |
| Consolidated Communications Holdings, Inc. | 211,398 | 4,124,375 | |
| Frontier Communications Corp. (b) | 2,466,183 | 12,503,548 | |
| General Communications, Inc. Class A (a) | 63,694 | 1,073,244 | |
| IDT Corp. Class B | 202,881 | 3,169,001 | |
| Telecom Italia SpA (a) | 4,000 | 4,855 | |
| Verizon Communications, Inc. | 1,599,497 | 73,592,857 | |
| Windstream Holdings, Inc. (b) | 42,580 | 306,150 | |
| 228,447,994 | |||
| TOTAL DIVERSIFIED TELECOMMUNICATION SERVICES | 308,542,438 | ||
| Internet Software & Services - 1.0% | |||
| Internet Software & Services - 1.0% | |||
| Gogo, Inc. (a)(b) | 202,000 | 3,209,780 | |
| Rackspace Hosting, Inc. (a) | 38,700 | 1,176,867 | |
| 4,386,647 | |||
| Media - 2.1% | |||
| Cable & Satellite - 2.1% | |||
| Charter Communications, Inc. Class A (a)(b) | 12,800 | 2,324,608 | |
| Liberty Global PLC Class C (a) | 40,336 | 1,809,876 | |
| Liberty LiLac Group Class C (a) | 1,916 | 63,707 | |
| Time Warner Cable, Inc. | 28,300 | 5,264,366 | |
| 9,462,557 | |||
| Real Estate Investment Trusts - 5.2% | |||
| Specialized REITs - 5.2% | |||
| American Tower Corp. | 200,190 | 18,455,516 | |
| Communications Sales & Leasing, Inc. | 137,000 | 2,753,700 | |
| Crown Castle International Corp. | 14,000 | 1,167,460 | |
| CyrusOne, Inc. | 21,100 | 668,026 | |
| 23,044,702 | |||
| Software - 0.5% | |||
| Application Software - 0.3% | |||
| Interactive Intelligence Group, Inc. (a) | 37,100 | 1,298,871 | |
| Systems Software - 0.2% | |||
| Rovi Corp. (a) | 90,700 | 1,004,049 | |
| TOTAL SOFTWARE | 2,302,920 | ||
| Wireless Telecommunication Services - 18.9% | |||
| Wireless Telecommunication Services - 18.9% | |||
| Bharti Infratel Ltd. | 481,103 | 2,898,945 | |
| KDDI Corp. | 179,400 | 4,451,610 | |
| Leap Wireless International, Inc. rights (a) | 400 | 1,008 | |
| RingCentral, Inc. (a) | 257,690 | 4,434,845 | |
| SBA Communications Corp. Class A (a) | 158,156 | 18,694,039 | |
| Shenandoah Telecommunications Co. | 51,626 | 1,997,410 | |
| SoftBank Corp. | 76,900 | 4,474,300 | |
| Sprint Corp. (a)(b) | 2,118,585 | 10,720,040 | |
| T-Mobile U.S., Inc. (a) | 502,497 | 19,903,906 | |
| Telephone & Data Systems, Inc. | 470,664 | 13,385,684 | |
| U.S. Cellular Corp. (a) | 70,900 | 2,617,628 | |
| 83,579,415 | |||
| TOTAL COMMON STOCKS | |||
| (Cost $406,491,722) | 434,663,739 | ||
| Nonconvertible Preferred Stocks - 0.7% | |||
| Diversified Telecommunication Services - 0.5% | |||
| Integrated Telecommunication Services - 0.5% | |||
| Telefonica Brasil SA sponsored ADR | 187,700 | 2,089,101 | |
| Wireless Telecommunication Services - 0.2% | |||
| Wireless Telecommunication Services - 0.2% | |||
| TIM Participacoes SA sponsored ADR (b) | 68,300 | 825,747 | |
| TOTAL NONCONVERTIBLE PREFERRED STOCKS | |||
| (Cost $4,873,932) | 2,914,848 | ||
| Money Market Funds - 9.0% | |||
| Fidelity Cash Central Fund, 0.15% (c) | 3,716,824 | 3,716,824 | |
| Fidelity Securities Lending Cash Central Fund, 0.19% (c)(d) | 36,212,186 | 36,212,186 | |
| TOTAL MONEY MARKET FUNDS | |||
| (Cost $39,929,010) | 39,929,010 | ||
| TOTAL INVESTMENT PORTFOLIO - 107.8% | |||
| (Cost $451,294,664) | 477,507,597 | ||
| NET OTHER ASSETS (LIABILITIES) - (7.8)% | (34,609,017) | ||
| NET ASSETS - 100% | $442,898,580 |
Legend
(a) Non-income producing
(b) Security or a portion of the security is on loan at period end.
(c) Affiliated fund that is generally available only to investment companies and other accounts managed by Fidelity Investments. The rate quoted is the annualized seven-day yield of the fund at period end. A complete unaudited listing of the fund's holdings as of its most recent quarter end is available upon request. In addition, each Fidelity Central Fund's financial statements are available on the SEC's website or upon request.
(d) Investment made with cash collateral received from securities on loan.
Affiliated Central Funds
Information regarding fiscal year to date income earned by the Fund from investments in Fidelity Central Funds is as follows:
| Fund | Income earned |
| Fidelity Cash Central Fund | $4,800 |
| Fidelity Securities Lending Cash Central Fund | 261,852 |
| Total | $266,652 |
Investment Valuation
The following is a summary of the inputs used, as of August 31, 2015, involving the Fund's assets and liabilities carried at fair value. The inputs or methodology used for valuing securities may not be an indication of the risk associated with investing in those securities. For more information on valuation inputs, and their aggregation into the levels used below, please refer to the Investment Valuation section in the accompanying Notes to Financial Statements.
| Valuation Inputs at Reporting Date: | ||||
| Description | Total | Level 1 | Level 2 | Level 3 |
| Investments in Securities: | ||||
| Common Stocks | $434,663,739 | $425,731,966 | $8,930,765 | $1,008 |
| Nonconvertible Preferred Stocks | 2,914,848 | 2,914,848 | -- | -- |
| Money Market Funds | 39,929,010 | 39,929,010 | -- | -- |
| Total Investments in Securities: | $477,507,597 | $468,575,824 | $8,930,765 | $1,008 |
See accompanying notes which are an integral part of the financial statements.
Telecommunications Portfolio
Financial Statements
Statement of Assets and Liabilities
| August 31, 2015 (Unaudited) | ||
| Assets | ||
| Investment in securities, at value (including securities loaned of $34,895,988) — See accompanying schedule: Unaffiliated issuers (cost $411,365,654) | $437,578,587 | |
| Fidelity Central Funds (cost $39,929,010) | 39,929,010 | |
| Total Investments (cost $451,294,664) | $477,507,597 | |
| Receivable for investments sold | 1,766,887 | |
| Receivable for fund shares sold | 180,063 | |
| Dividends receivable | 290,683 | |
| Distributions receivable from Fidelity Central Funds | 17,228 | |
| Prepaid expenses | 3,301 | |
| Other receivables | 17,532 | |
| Total assets | 479,783,291 | |
| Liabilities | ||
| Payable for fund shares redeemed | $336,971 | |
| Accrued management fee | 209,789 | |
| Distribution and service plan fees payable | 11,414 | |
| Other affiliated payables | 87,438 | |
| Other payables and accrued expenses | 26,913 | |
| Collateral on securities loaned, at value | 36,212,186 | |
| Total liabilities | 36,884,711 | |
| Net Assets | $442,898,580 | |
| Net Assets consist of: | ||
| Paid in capital | $414,143,036 | |
| Undistributed net investment income | 3,347,303 | |
| Accumulated undistributed net realized gain (loss) on investments and foreign currency transactions | (801,296) | |
| Net unrealized appreciation (depreciation) on investments and assets and liabilities in foreign currencies | 26,209,537 | |
| Net Assets | $442,898,580 | |
| Calculation of Maximum Offering Price | ||
| Class A: | ||
| Net Asset Value and redemption price per share ($11,277,613 ÷ 190,074.6 shares) | $59.33 | |
| Maximum offering price per share (100/94.25 of $59.33) | $62.95 | |
| Class T: | ||
| Net Asset Value and redemption price per share ($4,673,388 ÷ 79,139.6 shares) | $59.05 | |
| Maximum offering price per share (100/96.50 of $59.05) | $61.19 | |
| Class B: | ||
| Net Asset Value and offering price per share ($293,027 ÷ 4,941.8 shares)(a) | $59.30 | |
| Class C: | ||
| Net Asset Value and offering price per share ($7,854,045 ÷ 133,279.2 shares)(a) | $58.93 | |
| Telecommunications: | ||
| Net Asset Value, offering price and redemption price per share ($416,170,637 ÷ 6,974,835.5 shares) | $59.67 | |
| Class I: | ||
| Net Asset Value, offering price and redemption price per share ($2,629,870 ÷ 44,193.5 shares) | $59.51 |
(a) Redemption price per share is equal to net asset value less any applicable contingent deferred sales charge.
See accompanying notes which are an integral part of the financial statements.
Statement of Operations
| Six months ended August 31, 2015 (Unaudited) | ||
| Investment Income | ||
| Dividends | $4,875,493 | |
| Income from Fidelity Central Funds (including $261,852 from security lending) | 266,652 | |
| Total income | 5,142,145 | |
| Expenses | ||
| Management fee | $1,143,661 | |
| Transfer agent fees | 410,388 | |
| Distribution and service plan fees | 68,462 | |
| Accounting and security lending fees | 84,413 | |
| Custodian fees and expenses | 13,468 | |
| Independent trustees' compensation | 3,397 | |
| Registration fees | 59,639 | |
| Audit | 29,468 | |
| Legal | 2,953 | |
| Interest | 121 | |
| Miscellaneous | 2,591 | |
| Total expenses before reductions | 1,818,561 | |
| Expense reductions | (37,014) | 1,781,547 |
| Net investment income (loss) | 3,360,598 | |
| Realized and Unrealized Gain (Loss)
Net realized gain (loss) on: | ||
| Investment securities: | ||
| Unaffiliated issuers | 5,446,056 | |
| Foreign currency transactions | (11,945) | |
| Total net realized gain (loss) | 5,434,111 | |
| Change in net unrealized appreciation (depreciation) on: Investment securities | (37,681,329) | |
| Assets and liabilities in foreign currencies | (592) | |
| Total change in net unrealized appreciation (depreciation) | (37,681,921) | |
| Net gain (loss) | (32,247,810) | |
| Net increase (decrease) in net assets resulting from operations | $(28,887,212) |
See accompanying notes which are an integral part of the financial statements.
Statement of Changes in Net Assets
| Six months ended August 31, 2015 (Unaudited) | Year ended February 28, 2015 | |
| Increase (Decrease) in Net Assets | ||
| Operations | ||
| Net investment income (loss) | $3,360,598 | $6,193,869 |
| Net realized gain (loss) | 5,434,111 | 7,829,307 |
| Change in net unrealized appreciation (depreciation) | (37,681,921) | 28,387,304 |
| Net increase (decrease) in net assets resulting from operations | (28,887,212) | 42,410,480 |
| Distributions to shareholders from net investment income | (275,781) | (13,679,321) |
| Share transactions - net increase (decrease) | 99,746,494 | (19,703,086) |
| Redemption fees | 5,715 | 3,706 |
| Total increase (decrease) in net assets | 70,589,216 | 9,031,779 |
| Net Assets | ||
| Beginning of period | 372,309,364 | 363,277,585 |
| End of period (including undistributed net investment income of $3,347,303 and undistributed net investment income of $262,486, respectively) | $442,898,580 | $372,309,364 |
See accompanying notes which are an integral part of the financial statements.
Financial Highlights — Telecommunications Portfolio Class A
| Six months ended (Unaudited) | Years ended February 28, | |||||
| August 31, | 2015 | 2015 | 2014 | 2013 | 2012A | 2011 |
| Selected Per–Share Data | ||||||
| Net asset value, beginning of period | $63.26 | $58.71 | $51.58 | $46.12 | $46.93 | $37.64 |
| Income from Investment Operations | ||||||
| Net investment income (loss)B | .41 | .76 | 1.76C | .99 | .56 | .57 |
| Net realized and unrealized gain (loss) | (4.32) | 5.83 | 6.48 | 5.43 | (.86) | 9.49 |
| Total from investment operations | (3.91) | 6.59 | 8.24 | 6.42 | (.30) | 10.06 |
| Distributions from net investment income | (.02) | (2.04) | (1.11) | (.96) | (.51) | (.77) |
| Distributions from net realized gain | – | – | (.01) | – | – | – |
| Total distributions | (.02) | (2.04) | (1.11)D | (.96) | (.51) | (.77) |
| Redemption fees added to paid in capitalB,E | – | – | – | – | – | – |
| Net asset value, end of period | $59.33 | $63.26 | $58.71 | $51.58 | $46.12 | $46.93 |
| Total ReturnF,G,H | (6.18)% | 11.54% | 16.00% | 13.97% | (.54)% | 26.87% |
| Ratios to Average Net AssetsI,J | ||||||
| Expenses before reductions | 1.17%K | 1.15% | 1.18% | 1.18% | 1.20% | 1.20% |
| Expenses net of fee waivers, if any | 1.16%K | 1.15% | 1.18% | 1.18% | 1.20% | 1.20% |
| Expenses net of all reductions | 1.15%K | 1.15% | 1.15% | 1.17% | 1.18% | 1.18% |
| Net investment income (loss) | 1.31%K | 1.26% | 3.08%C | 2.01% | 1.21% | 1.35% |
| Supplemental Data | ||||||
| Net assets, end of period (000 omitted) | $11,278 | $11,052 | $7,712 | $6,449 | $4,677 | $4,305 |
| Portfolio turnover rateL | 75%K | 94%M | 111% | 76% | 72% | 72% |
A For the year ended February 29.
B Calculated based on average shares outstanding during the period.
C Investment income per share reflects large, non-recurring dividends which amounted to $.95 per share. Excluding these non-recurring dividends, the ratio of net investment income (loss) to average net assets would have been 1.43%.
D Total distributions of $1.11 per share is comprised of distributions from net investment income of $1.106 and distributions from net realized gain of $.005 per share.
E Amount represents less than $.005 per share.
F Total returns for periods of less than one year are not annualized.
G Total returns would have been lower if certain expenses had not been reduced during the applicable periods shown.
H Total returns do not include the effect of the sales charges.
I Fees and expenses of any underlying Fidelity Central Funds are not included in the Fund's expense ratio. The Fund indirectly bears its proportionate share of the expenses of any underlying Fidelity Central Funds.
J Expense ratios reflect operating expenses of the class. Expenses before reductions do not reflect amounts reimbursed by the investment adviser or reductions from brokerage service arrangements or reductions from other expense offset arrangements and do not represent the amount paid by the class during periods when reimbursements or reductions occur. Expenses net of fee waivers reflect expenses after reimbursement by the investment adviser but prior to reductions from brokerage service arrangements or other expense offset arrangements. Expenses net of all reductions represent the net expenses paid by the class.
K Annualized
L Amount does not include the portfolio activity of any underlying Fidelity Central Funds.
M Portfolio turnover rate excludes securities received or delivered in-kind.
See accompanying notes which are an integral part of the financial statements.
Financial Highlights — Telecommunications Portfolio Class T
| Six months ended(Unaudited) | Years ended February 28, | |||||
| August 31, | 2015 | 2015 | 2014 | 2013 | 2012A | 2011 |
| Selected Per–Share Data | ||||||
| Net asset value, beginning of period | $63.04 | $58.50 | $51.41 | $46.01 | $46.81 | $37.55 |
| Income from Investment Operations | ||||||
| Net investment income (loss)B | .31 | .57 | 1.59C | .85 | .42 | .45 |
| Net realized and unrealized gain (loss) | (4.30) | 5.81 | 6.44 | 5.39 | (.84) | 9.47 |
| Total from investment operations | (3.99) | 6.38 | 8.03 | 6.24 | (.42) | 9.92 |
| Distributions from net investment income | – | (1.84) | (.94) | (.84) | (.38) | (.66) |
| Distributions from net realized gain | – | – | (.01) | – | – | – |
| Total distributions | – | (1.84) | (.94)D | (.84) | (.38) | (.66) |
| Redemption fees added to paid in capitalB,E | – | – | – | – | – | – |
| Net asset value, end of period | $59.05 | $63.04 | $58.50 | $51.41 | $46.01 | $46.81 |
| Total ReturnF,G,H | (6.33)% | 11.19% | 15.64% | 13.61% | (.82)% | 26.54% |
| Ratios to Average Net AssetsI,J | ||||||
| Expenses before reductions | 1.48%K | 1.47% | 1.48% | 1.48% | 1.49% | 1.48% |
| Expenses net of fee waivers, if any | 1.48%K | 1.47% | 1.48% | 1.48% | 1.49% | 1.48% |
| Expenses net of all reductions | 1.47%K | 1.46% | 1.45% | 1.46% | 1.47% | 1.46% |
| Net investment income (loss) | 1.00%K | .94% | 2.78%C | 1.72% | .92% | 1.06% |
| Supplemental Data | ||||||
| Net assets, end of period (000 omitted) | $4,673 | $5,095 | $4,344 | $4,237 | $2,702 | $2,882 |
| Portfolio turnover rateL | 75%K | 94%M | 111% | 76% | 72% | 72% |
A For the year ended February 29.
B Calculated based on average shares outstanding during the period.
C Investment income per share reflects large, non-recurring dividends which amounted to $.94 per share. Excluding these non-recurring dividends, the ratio of net investment income (loss) to average net assets would have been 1.13%.
D Total distributions of $.94 per share is comprised of distributions from net investment income of $.939 and distributions from net realized gain of $.005 per share.
E Amount represents less than $.005 per share.
F Total returns for periods of less than one year are not annualized.
G Total returns would have been lower if certain expenses had not been reduced during the applicable periods shown.
H Total returns do not include the effect of the sales charges.
I Fees and expenses of any underlying Fidelity Central Funds are not included in the Fund's expense ratio. The Fund indirectly bears its proportionate share of the expenses of any underlying Fidelity Central Funds.
J Expense ratios reflect operating expenses of the class. Expenses before reductions do not reflect amounts reimbursed by the investment adviser or reductions from brokerage service arrangements or reductions from other expense offset arrangements and do not represent the amount paid by the class during periods when reimbursements or reductions occur. Expenses net of fee waivers reflect expenses after reimbursement by the investment adviser but prior to reductions from brokerage service arrangements or other expense offset arrangements. Expenses net of all reductions represent the net expenses paid by the class.
K Annualized
L Amount does not include the portfolio activity of any underlying Fidelity Central Funds.
M Portfolio turnover rate excludes securities received or delivered in-kind.
See accompanying notes which are an integral part of the financial statements.
Financial Highlights — Telecommunications Portfolio Class B
| Six months ended (Unaudited) | Years ended February 28, | |||||
| August 31, | 2015 | 2015 | 2014 | 2013 | 2012A | 2011 |
| Selected Per–Share Data | ||||||
| Net asset value, beginning of period | $63.45 | $58.77 | $51.63 | $46.14 | $46.93 | $37.60 |
| Income from Investment Operations | ||||||
| Net investment income (loss)B | .17 | .29 | 1.33C | .62 | .21 | .25 |
| Net realized and unrealized gain (loss) | (4.32) | 5.84 | 6.48 | 5.42 | (.83) | 9.48 |
| Total from investment operations | (4.15) | 6.13 | 7.81 | 6.04 | (.62) | 9.73 |
| Distributions from net investment income | – | (1.45) | (.66) | (.55) | (.17) | (.40) |
| Distributions from net realized gain | – | – | (.01) | – | – | – |
| Total distributions | – | (1.45) | (.67) | (.55) | (.17) | (.40) |
| Redemption fees added to paid in capitalB,D | – | – | – | – | – | – |
| Net asset value, end of period | $59.30 | $63.45 | $58.77 | $51.63 | $46.14 | $46.93 |
| Total ReturnE,F,G | (6.54)% | 10.67% | 15.13% | 13.11% | (1.29)% | 25.96% |
| Ratios to Average Net AssetsH,I | ||||||
| Expenses before reductions | 1.95%J | 1.93% | 1.93% | 1.93% | 1.95% | 1.95% |
| Expenses net of fee waivers, if any | 1.95%J | 1.93% | 1.93% | 1.93% | 1.95% | 1.95% |
| Expenses net of all reductions | 1.93%J | 1.92% | 1.91% | 1.92% | 1.93% | 1.93% |
| Net investment income (loss) | .53%J | .49% | 2.32%C | 1.26% | .47% | .60% |
| Supplemental Data | ||||||
| Net assets, end of period (000 omitted) | $293 | $409 | $546 | $576 | $596 | $706 |
| Portfolio turnover rateK | 75%J | 94%L | 111% | 76% | 72% | 72% |
A For the year ended February 29.
B Calculated based on average shares outstanding during the period.
C Investment income per share reflects large, non-recurring dividends which amounted to $.95 per share. Excluding these non-recurring dividends, the ratio of net investment income (loss) to average net assets would have been .67%.
D Amount represents less than $.005 per share.
E Total returns for periods of less than one year are not annualized.
F Total returns would have been lower if certain expenses had not been reduced during the applicable periods shown.
G Total returns do not include the effect of the contingent deferred sales charge.
H Fees and expenses of any underlying Fidelity Central Funds are not included in the Fund's expense ratio. The Fund indirectly bears its proportionate share of the expenses of any underlying Fidelity Central Funds.
I Expense ratios reflect operating expenses of the class. Expenses before reductions do not reflect amounts reimbursed by the investment adviser or reductions from brokerage service arrangements or reductions from other expense offset arrangements and do not represent the amount paid by the class during periods when reimbursements or reductions occur. Expenses net of fee waivers reflect expenses after reimbursement by the investment adviser but prior to reductions from brokerage service arrangements or other expense offset arrangements. Expenses net of all reductions represent the net expenses paid by the class.
J Annualized
K Amount does not include the portfolio activity of any underlying Fidelity Central Funds.
L Portfolio turnover rate excludes securities received or delivered in-kind.
See accompanying notes which are an integral part of the financial statements.
Financial Highlights — Telecommunications Portfolio Class C
| Six months ended (Unaudited) | Years ended February 28, | |||||
| August 31, | 2015 | 2015 | 2014 | 2013 | 2012A | 2011 |
| Selected Per–Share Data | ||||||
| Net asset value, beginning of period | $63.04 | $58.54 | $51.47 | $46.02 | $46.89 | $37.61 |
| Income from Investment Operations | ||||||
| Net investment income (loss)B | .17 | .34 | 1.36C | .63 | .22 | .26 |
| Net realized and unrealized gain (loss) | (4.28) | 5.80 | 6.46 | 5.41 | (.84) | 9.46 |
| Total from investment operations | (4.11) | 6.14 | 7.82 | 6.04 | (.62) | 9.72 |
| Distributions from net investment income | – | (1.64) | (.74) | (.59) | (.25) | (.44) |
| Distributions from net realized gain | – | – | (.01) | – | – | – |
| Total distributions | – | (1.64) | (.75) | (.59) | (.25) | (.44) |
| Redemption fees added to paid in capitalB,D | – | – | – | – | – | – |
| Net asset value, end of period | $58.93 | $63.04 | $58.54 | $51.47 | $46.02 | $46.89 |
| Total ReturnE,F,G | (6.52)% | 10.75% | 15.20% | 13.14% | (1.27)% | 25.95% |
| Ratios to Average Net AssetsH,I | ||||||
| Expenses before reductions | 1.92%J | 1.85% | 1.88% | 1.90% | 1.93% | 1.94% |
| Expenses net of fee waivers, if any | 1.92%J | 1.85% | 1.88% | 1.90% | 1.93% | 1.94% |
| Expenses net of all reductions | 1.90%J | 1.85% | 1.85% | 1.89% | 1.91% | 1.92% |
| Net investment income (loss) | .56%J | .56% | 2.38%C | 1.29% | .48% | .61% |
| Supplemental Data | ||||||
| Net assets, end of period (000 omitted) | $7,854 | $7,074 | $5,523 | $4,353 | $3,514 | $3,035 |
| Portfolio turnover rateK | 75%J | 94%L | 111% | 76% | 72% | 72% |
A For the year ended February 29.
B Calculated based on average shares outstanding during the period.
C Investment income per share reflects large, non-recurring dividends which amounted to $.94 per share. Excluding these non-recurring dividends, the ratio of net investment income (loss) to average net assets would have been .73%.
D Amount represents less than $.005 per share.
E Total returns for periods of less than one year are not annualized.
F Total returns would have been lower if certain expenses had not been reduced during the applicable periods shown.
G Total returns do not include the effect of the contingent deferred sales charge.
H Fees and expenses of any underlying Fidelity Central Funds are not included in the Fund's expense ratio. The Fund indirectly bears its proportionate share of the expenses of any underlying Fidelity Central Funds.
I Expense ratios reflect operating expenses of the class. Expenses before reductions do not reflect amounts reimbursed by the investment adviser or reductions from brokerage service arrangements or reductions from other expense offset arrangements and do not represent the amount paid by the class during periods when reimbursements or reductions occur. Expenses net of fee waivers reflect expenses after reimbursement by the investment adviser but prior to reductions from brokerage service arrangements or other expense offset arrangements. Expenses net of all reductions represent the net expenses paid by the class.
J Annualized
K Amount does not include the portfolio activity of any underlying Fidelity Central Funds.
L Portfolio turnover rate excludes securities received or delivered in-kind.
See accompanying notes which are an integral part of the financial statements.
Financial Highlights — Telecommunications Portfolio
| Six months ended (Unaudited) | Years ended February 28, | |||||
| August 31, | 2015 | 2015 | 2014 | 2013 | 2012A | 2011 |
| Selected Per–Share Data | ||||||
| Net asset value, beginning of period | $63.54 | $58.94 | $51.75 | $46.26 | $47.07 | $37.73 |
| Income from Investment Operations | ||||||
| Net investment income (loss)B | .52 | .96 | 1.96C | 1.15 | .70 | .69 |
| Net realized and unrealized gain (loss) | (4.34) | 5.85 | 6.51 | 5.43 | (.86) | 9.52 |
| Total from investment operations | (3.82) | 6.81 | 8.47 | 6.58 | (.16) | 10.21 |
| Distributions from net investment income | (.05) | (2.21) | (1.28) | (1.09) | (.65) | (.87) |
| Distributions from net realized gain | – | – | (.01) | – | – | – |
| Total distributions | (.05) | (2.21) | (1.28)D | (1.09) | (.65) | (.87) |
| Redemption fees added to paid in capitalB,E | – | – | – | – | – | – |
| Net asset value, end of period | $59.67 | $63.54 | $58.94 | $51.75 | $46.26 | $47.07 |
| Total ReturnF,G | (6.01)% | 11.90% | 16.40% | 14.30% | (.23)% | 27.24% |
| Ratios to Average Net AssetsH,I | ||||||
| Expenses before reductions | .83%J | .83% | .85% | .87% | .90% | .92% |
| Expenses net of fee waivers, if any | .83%J | .83% | .85% | .87% | .90% | .92% |
| Expenses net of all reductions | .82%J | .82% | .82% | .85% | .88% | .91% |
| Net investment income (loss) | 1.65%J | 1.58% | 3.41%C | 2.33% | 1.52% | 1.62% |
| Supplemental Data | ||||||
| Net assets, end of period (000 omitted) | $416,171 | $346,174 | $343,548 | $377,841 | $342,262 | $354,938 |
| Portfolio turnover rateK | 75%J | 94%L | 111% | 76% | 72% | 72% |
A For the year ended February 29.
B Calculated based on average shares outstanding during the period.
C Investment income per share reflects large, non-recurring dividends which amounted to $.95 per share. Excluding these non-recurring dividends, the ratio of net investment income (loss) to average net assets would have been 1.76%.
D Total distributions of $1.28 per share is comprised of distributions from net investment income of $1.275 and distributions from net realized gain of $.005 per share.
E Amount represents less than $.005 per share.
F Total returns for periods of less than one year are not annualized.
G Total returns would have been lower if certain expenses had not been reduced during the applicable periods shown.
H Fees and expenses of any underlying Fidelity Central Funds are not included in the Fund's expense ratio. The Fund indirectly bears its proportionate share of the expenses of any underlying Fidelity Central Funds.
I Expense ratios reflect operating expenses of the class. Expenses before reductions do not reflect amounts reimbursed by the investment adviser or reductions from brokerage service arrangements or reductions from other expense offset arrangements and do not represent the amount paid by the class during periods when reimbursements or reductions occur. Expenses net of fee waivers reflect expenses after reimbursement by the investment adviser but prior to reductions from brokerage service arrangements or other expense offset arrangements. Expenses net of all reductions represent the net expenses paid by the class.
J Annualized
K Amount does not include the portfolio activity of any underlying Fidelity Central Funds.
L Portfolio turnover rate excludes securities received or delivered in-kind.
See accompanying notes which are an integral part of the financial statements.
Financial Highlights — Telecommunications Portfolio Class I
| Six months ended (Unaudited) | Years ended February 28, | |||||
| August 31, | 2015 | 2015 | 2014 | 2013 | 2012A | 2011 |
| Selected Per–Share Data | ||||||
| Net asset value, beginning of period | $63.38 | $58.80 | $51.65 | $46.20 | $47.02 | $37.69 |
| Income from Investment Operations | ||||||
| Net investment income (loss)B | .51 | .94 | 1.93C | 1.17 | .70 | .71 |
| Net realized and unrealized gain (loss) | (4.32) | 5.83 | 6.48 | 5.42 | (.88) | 9.50 |
| Total from investment operations | (3.81) | 6.77 | 8.41 | 6.59 | (.18) | 10.21 |
| Distributions from net investment income | (.06) | (2.19) | (1.25) | (1.14) | (.64) | (.88) |
| Distributions from net realized gain | – | – | (.01) | – | – | – |
| Total distributions | (.06) | (2.19) | (1.26) | (1.14) | (.64) | (.88) |
| Redemption fees added to paid in capitalB,D | – | – | – | – | – | – |
| Net asset value, end of period | $59.51 | $63.38 | $58.80 | $51.65 | $46.20 | $47.02 |
| Total ReturnE,F | (6.02)% | 11.85% | 16.30% | 14.33% | (.26)% | 27.27% |
| Ratios to Average Net AssetsG,H | ||||||
| Expenses before reductions | .85%I | .86% | .91% | .85% | .89% | .91% |
| Expenses net of fee waivers, if any | .85%I | .86% | .91% | .85% | .89% | .91% |
| Expenses net of all reductions | .84%I | .85% | .88% | .83% | .87% | .89% |
| Net investment income (loss) | 1.63%I | 1.55% | 3.35%C | 2.35% | 1.52% | 1.64% |
| Supplemental Data | ||||||
| Net assets, end of period (000 omitted) | $2,630 | $2,505 | $1,604 | $2,641 | $1,022 | $1,743 |
| Portfolio turnover rateJ | 75%I | 94%K | 111% | 76% | 72% | 72% |
A For the year ended February 29.
B Calculated based on average shares outstanding during the period.
C Investment income per share reflects large, non-recurring dividends which amounted to $.95 per share. Excluding these non-recurring dividends, the ratio of net investment income (loss) to average net assets would have been 1.70%.
D Amount represents less than $.005 per share.
E Total returns for periods of less than one year are not annualized.
F Total returns would have been lower if certain expenses had not been reduced during the applicable periods shown.
G Fees and expenses of any underlying Fidelity Central Funds are not included in the Fund's expense ratio. The Fund indirectly bears its proportionate share of the expenses of any underlying Fidelity Central Funds.
H Expense ratios reflect operating expenses of the class. Expenses before reductions do not reflect amounts reimbursed by the investment adviser or reductions from brokerage service arrangements or reductions from other expense offset arrangements and do not represent the amount paid by the class during periods when reimbursements or reductions occur. Expenses net of fee waivers reflect expenses after reimbursement by the investment adviser but prior to reductions from brokerage service arrangements or other expense offset arrangements. Expenses net of all reductions represent the net expenses paid by the class.
I Annualized
J Amount does not include the portfolio activity of any underlying Fidelity Central Funds.
K Portfolio turnover rate excludes securities received or delivered in-kind.
See accompanying notes which are an integral part of the financial statements.
Notes to Financial Statements (Unaudited)
For the period ended August 31, 2015
1. Organization.
Telecommunications Portfolio (the Fund) is a non-diversified fund of Fidelity Select Portfolios (the Trust) and is authorized to issue an unlimited number of shares. The Trust is registered under the Investment Company Act of 1940, as amended (the 1940 Act), as an open-end management investment company organized as a Massachusetts business trust. The Fund invests primarily in securities of companies whose principal business activities fall within specific industries. The Fund offers Class A, Class T, Class C, Telecommunications and Class I (formerly Institutional Class) shares, each of which, along with Class B shares, has equal rights as to assets and voting privileges. Class B shares are closed to new accounts and additional purchases, except for exchanges and reinvestments. Each class has exclusive voting rights with respect to matters that affect that class. Class B shares will automatically convert to Class A shares after a holding period of seven years from the initial date of purchase.
2. Investments in Fidelity Central Funds.
The Fund invests in Fidelity Central Funds, which are open-end investment companies generally available only to other investment companies and accounts managed by the investment adviser and its affiliates. The Fund's Schedule of Investments lists each of the Fidelity Central Funds held as of period end, if any, as an investment of the Fund, but does not include the underlying holdings of each Fidelity Central Fund. As an Investing Fund, the Fund indirectly bears its proportionate share of the expenses of the underlying Fidelity Central Funds.
The Money Market Central Funds seek preservation of capital and current income and are managed by Fidelity Investments Money Management, Inc. (FIMM), an affiliate of the investment adviser. Annualized expenses of the Money Market Central Funds as of their most recent shareholder report date are less than .01%.
A complete unaudited list of holdings for each Fidelity Central Fund is available upon request or at the Securities and Exchange Commission (the SEC) website at www.sec.gov. In addition, the financial statements of the Fidelity Central Funds are available on the SEC website or upon request.
3. Significant Accounting Policies.
The financial statements have been prepared in conformity with accounting principles generally accepted in the United States of America (GAAP), which require management to make certain estimates and assumptions at the date of the financial statements. Actual results could differ from those estimates. Subsequent events, if any, through the date that the financial statements were issued have been evaluated in the preparation of the financial statements. The following summarizes the significant accounting policies of the Fund:
Investment Valuation. Investments are valued as of 4:00 p.m. Eastern time on the last calendar day of the period. The Board of Trustees (the Board) has delegated the day to day responsibility for the valuation of the Fund's investments to the Fidelity SelectCo, LLC (SelectCo) Fair Value Committee (the Committee). In accordance with valuation policies and procedures approved by the Board, the Fund attempts to obtain prices from one or more third party pricing vendors or brokers to value its investments. When current market prices, quotations or currency exchange rates are not readily available or reliable, investments will be fair valued in good faith by the Committee, in accordance with procedures adopted by the Board. Factors used in determining fair value vary by investment type and may include market or investment specific events. The frequency with which these procedures are used cannot be predicted and they may be utilized to a significant extent. The Committee oversees the Fund's valuation policies and procedures and reports to the Board on the Committee's activities and fair value determinations. The Board monitors the appropriateness of the procedures used in valuing the Fund's investments and ratifies the fair value determinations of the Committee.
The Fund categorizes the inputs to valuation techniques used to value its investments into a disclosure hierarchy consisting of three levels as shown below:
- Level 1 – quoted prices in active markets for identical investments
- Level 2 – other significant observable inputs (including quoted prices for similar investments, interest rates, prepayment speeds, etc.)
- Level 3 – unobservable inputs (including the Fund's own assumptions based on the best information available)
Valuation techniques used to value the Fund's investments by major category are as follows:
Equity securities, including restricted securities, for which market quotations are readily available, are valued at the last reported sale price or official closing price as reported by a third party pricing vendor on the primary market or exchange on which they are traded and are categorized as Level 1 in the hierarchy. In the event there were no sales during the day or closing prices are not available, securities are valued at the last quoted bid price or may be valued using the last available price and are generally categorized as Level 2 in the hierarchy. For foreign equity securities, when market or security specific events arise, comparisons to the valuation of American Depositary Receipts (ADRs), futures contracts, Exchange-Traded Funds (ETFs) and certain indexes as well as quoted prices for similar securities may be used and would be categorized as Level 2 in the hierarchy. Utilizing these techniques may result in transfers between Level 1 and Level 2. For equity securities, including restricted securities, where observable inputs are limited, assumptions about market activity and risk are used and these securities may be categorized as Level 3 in the hierarchy.
Investments in open-end mutual funds, including the Fidelity Central Funds, are valued at their closing net asset value (NAV) each business day and are categorized as Level 1 in the hierarchy.
Changes in valuation techniques may result in transfers in or out of an assigned level within the disclosure hierarchy. The aggregate value of investments by input level, as of August 31, 2015, is included at the end of the Fund's Schedule of Investments.
Foreign Currency. The Fund may use foreign currency contracts to facilitate transactions in foreign-denominated securities. Gains and losses from these transactions may arise from changes in the value of the foreign currency or if the counterparties do not perform under the contracts' terms.
Foreign-denominated assets, including investment securities, and liabilities are translated into U.S. dollars at the exchange rates at period end. Purchases and sales of investment securities, income and dividends received and expenses denominated in foreign currencies are translated into U.S. dollars at the exchange rate in effect on the transaction date.
The effects of exchange rate fluctuations on investments are included with the net realized and unrealized gain (loss) on investment securities. Other foreign currency transactions resulting in realized and unrealized gain (loss) are disclosed separately.
Investment Transactions and Income. For financial reporting purposes, the Fund's investment holdings and NAV include trades executed through the end of the last business day of the period. The NAV per share for processing shareholder transactions is calculated as of the close of business of the New York Stock Exchange (NYSE), normally 4:00 p.m. Eastern time and includes trades executed through the end of the prior business day. Gains and losses on securities sold are determined on the basis of identified cost and may include proceeds received from litigation. Dividend income is recorded on the ex-dividend date, except for certain dividends from foreign securities where the ex-dividend date may have passed, which are recorded as soon as the Fund is informed of the ex-dividend date. Non-cash dividends included in dividend income, if any, are recorded at the fair market value of the securities received. Income and capital gain distributions from Fidelity Central Funds, if any, are recorded on the ex-dividend date. Distributions received on securities that represent a return of capital or capital gain are recorded as a reduction of cost of investments and/or as a realized gain. Subsequent to ex-dividend date the Fund determines the components of these distributions, based upon receipt of tax filings or other correspondence relating to the underlying investment. Investment income is recorded net of foreign taxes withheld where recovery of such taxes is uncertain.
Class Allocations and Expenses. Investment income, realized and unrealized capital gains and losses, common expenses of the Fund, and certain fund-level expense reductions, if any, are allocated daily on a pro-rata basis to each class based on the relative net assets of each class to the total net assets of the Fund. Each class differs with respect to transfer agent and distribution and service plan fees incurred. Certain expense reductions may also differ by class. For the reporting period, the allocated portion of income and expenses to each class as a percent of its average net assets may vary due to the timing of recording these transactions in relation to fluctuating net assets of the classes. Expenses directly attributable to a fund are charged to that fund. Expenses attributable to more than one fund are allocated among the respective funds on the basis of relative net assets or other appropriate methods. Expense estimates are accrued in the period to which they relate and adjustments are made when actual amounts are known.
Income Tax Information and Distributions to Shareholders. Each year, the Fund intends to qualify as a regulated investment company under Subchapter M of the Internal Revenue Code, including distributing substantially all of its taxable income and realized gains. As a result, no provision for U.S. Federal income taxes is required. The Fund files a U.S. federal tax return, in addition to state and local tax returns as required. The Fund's federal income tax returns are subject to examination by the Internal Revenue Service (IRS) for a period of three fiscal years after they are filed. State and local tax returns may be subject to examination for an additional fiscal year depending on the jurisdiction. Foreign taxes are provided for based on the Fund's understanding of the tax rules and rates that exist in the foreign markets in which it invests.
Distributions are declared and recorded on the ex-dividend date. Income dividends and capital gain distributions are declared separately for each class. Income and capital gain distributions are determined in accordance with income tax regulations, which may differ from GAAP.
Capital accounts within the financial statements are adjusted for permanent book-tax differences. These adjustments have no impact on net assets or the results of operations. Capital accounts are not adjusted for temporary book-tax differences which will reverse in a subsequent period.
Book-tax differences are primarily due to foreign currency transaction, in-kind transactions, deferred trustees compensation, capital loss carryforwards and losses deferred due to wash sales and excise tax regulations.
The federal tax cost of investment securities and unrealized appreciation (depreciation) as of period end were as follows:
| Gross unrealized appreciation | $48,958,944 |
| Gross unrealized depreciation | (26,279,442) |
| Net unrealized appreciation (depreciation) on securities | $22,679,502 |
| Tax cost | $454,828,095 |
Capital loss carryforwards are only available to offset future capital gains of the Fund to the extent provided by regulations and may be limited. Under the Regulated Investment Company Modernization Act of 2010 (the Act), the Fund is permitted to carry forward capital losses incurred in taxable years beginning after December 22, 2010 for an unlimited period and such capital losses are required to be used prior to any losses that expire. The capital loss carryforward information presented below, including any applicable limitation, is estimated as of prior fiscal period end and is subject to adjustment.
| Fiscal year of expiration | |
| 2018 | $(2,739,258) |
The Fund elected to defer to its next fiscal year approximately $1,605,208 of capital losses recognized during the period November 1, 2014 to February 28, 2015.
Trading (Redemption) Fees. Shares held by investors in the Fund less than 30 days may be subject to a redemption fee equal to .75% of the NAV of shares redeemed. All redemption fees, which reduce the proceeds of the shareholder redemption, are retained by the Fund and accounted for as an addition to paid in capital.
4. Purchases and Sales of Investments.
Purchases and sales of securities, other than short-term securities, aggregated $253,371,396 and $151,002,092, respectively.
5. Fees and Other Transactions with Affiliates.
Management Fee. Fidelity SelectCo, LLC (the investment adviser) and its affiliates provide the Fund with investment management related services for which the Fund pays a monthly management fee. The management fee is the sum of an individual fund fee rate that is based on an annual rate of .30% of the Fund's average net assets and an annualized group fee rate that averaged .25% during the period. The group fee rate is based upon the average net assets of all the mutual funds advised by Fidelity Management & Research Company (FMR) and the investment adviser. The group fee rate decreases as assets under management increase and increases as assets under management decrease. For the reporting period, the total annualized management fee rate was .55% of the Fund's average net assets.
Distribution and Service Plan Fees. In accordance with Rule 12b-1 of the 1940 Act, the Fund has adopted separate Distribution and Service Plans for each class of shares. Certain classes pay Fidelity Distributors Corporation (FDC), an affiliate of the investment adviser, separate Distribution and Service Fees, each of which is based on an annual percentage of each class' average net assets. In addition, FDC may pay financial intermediaries for selling shares of the Fund and providing shareholder support services. For the period, the Distribution and Service Fee rates, total fees and amounts retained by FDC were as follows:
| Distribution Fee | Service Fee | Total Fees | Retained by FDC |
|
| Class A | -% | .25% | $14,634 | $644 |
| Class T | .25% | .25% | 12,614 | – |
| Class B | .75% | .25% | 1,771 | 1,328 |
| Class C | .75% | .25% | 39,443 | 8,926 |
| $68,462 | $10,898 |
Sales Load. FDC may receive a front-end sales charge of up to 5.75% for selling Class A shares and 3.50% for selling Class T shares, some of which is paid to financial intermediaries for selling shares of the Fund. Depending on the holding period, FDC may receive contingent deferred sales charges levied on Class A, Class T, Class B, and Class C redemptions. The deferred sales charges range from 5.00% to 1.00% for Class B shares, 1.00% for Class C shares, 1.00% for certain purchases of Class A shares and .25% for certain purchases of Class T shares.
For the period, sales charge amounts retained by FDC were as follows:
| Retained by FDC |
|
| Class A | $6,592 |
| Class T | 1,090 |
| Class B* | 7 |
| Class C* | 296 |
| $7,985 |
* When Class B and Class C shares are initially sold, FDC pays commissions from its own resources to financial intermediaries through which the sales are made.
Transfer Agent Fees. Fidelity Investments Institutional Operations Company, Inc., (FIIOC), an affiliate of the investment adviser, is the transfer, dividend disbursing and shareholder servicing agent for each class of the Fund. FIIOC receives account fees and asset-based fees that vary according to the account size and type of account of the shareholders of the respective classes of the Fund. FIIOC pays for typesetting, printing and mailing of shareholder reports, except proxy statements.
For the period, transfer agent fees for each class were as follows:
| Amount | % of Class-Level Average Net Assets* |
|
| Class A | $16,054 | .27 |
| Class T | 8,611 | .34 |
| Class B | 538 | .30 |
| Class C | 10,901 | .28 |
| Telecommunications | 370,847 | .19 |
| Class I | 3,437 | .21 |
| $ 410,388 |
*Annualized
Accounting and Security Lending Fees. Fidelity Service Company, Inc. (FSC), an affiliate of the investment adviser, maintains the Fund's accounting records. The accounting fee is based on the level of average net assets for each month. Under a separate contract, FSC administers the security lending program. The security lending fee is based on the number and duration of lending transactions.
Brokerage Commissions. The Fund placed a portion of its portfolio transactions with brokerage firms which are affiliates of the investment adviser. Brokerage commissions are included in net realized gain (loss) and change in net unrealized appreciation (depreciation) in the Statement of Operations. The commissions paid to these affiliated firms were $6,398 for the period.
Interfund Lending Program. Pursuant to an Exemptive Order issued by the SEC, the Fund, along with other registered investment companies having management contracts with FMR or other affiliated entities of FMR, may participate in an interfund lending program. This program provides an alternative credit facility allowing the funds to borrow from, or lend money to, other participating affiliated funds. At period end, there were no interfund loans outstanding. The Fund's activity in this program during the period for which loans were outstanding was as follows:
| Borrower or Lender | Average Loan Balance | Weighted Average Interest Rate | Interest Expense |
| Borrower | $5,833,500 | .37% | $121 |
6. Committed Line of Credit.
The Fund participates with other funds managed by the investment adviser or an affiliate in a $4.25 billion credit facility (the "line of credit") to be utilized for temporary or emergency purposes to fund shareholder redemptions or for other short-term liquidity purposes. The Fund has agreed to pay commitment fees on its pro-rata portion of the line of credit, which amounted to $298 and is reflected in Miscellaneous expenses on the Statement of Operations. During the period, the Fund did not borrow on this line of credit.
7. Security Lending.
The Fund lends portfolio securities through a lending agent from time to time in order to earn additional income. On the settlement date of the loan, the Fund receives collateral (in the form of U.S. Treasury obligations, letters of credit and/or cash) against the loaned securities and maintains collateral in an amount not less than 100% of the market value of the loaned securities during the period of the loan. The market value of the loaned securities is determined at the close of business of the Fund and any additional required collateral is delivered to the Fund on the next business day. If the borrower defaults on its obligation to return the securities loaned because of insolvency or other reasons, the Fund may apply collateral received from the borrower against the obligation. The Fund may experience delays and costs in recovering the securities loaned. Any cash collateral received is invested in the Fidelity Securities Lending Cash Central Fund. The value of loaned securities and cash collateral at period end are disclosed on the Fund's Statement of Assets and Liabilities. Security lending income represents the income earned on investing cash collateral, less rebates paid to borrowers and any lending agent fees associated with the loan, plus any premium payments received for lending certain types of securities. Security lending income is presented in the Statement of Operations as a component of income from Fidelity Central Funds. Total security lending income during the period amounted to $261,852.
8. Expense Reductions.
Commissions paid to certain brokers with whom the investment adviser, or its affiliates, places trades on behalf of the Fund include an amount in addition to trade execution, which may be rebated back to the Fund to offset certain expenses. This amount totaled $25,810 for the period.
In addition, during the period the investment adviser reimbursed and/or waived a portion of the fund-level operating expenses in the amount of $1,758 and a portion of class-level operating expenses as follows:
| Amount | ||
| Class A | $152 | |
| Class T | 11 | |
| Class B | 1 | |
| Class C | 135 | |
| Telecommunications | 9,106 | |
| Class I | 41 | |
| Total | $9,446 |
9. Distributions to Shareholders.
Distributions to shareholders of each class were as follows:
| Six months ended August 31, 2015 | Year ended February 28, 2015 | |
| From net investment income | ||
| Class A | $4,067 | $309,863 |
| Class T | – | 143,116 |
| Class B | – | 12,248 |
| Class C | – | 161,299 |
| Telecommunications | 268,350 | 12,985,170 |
| Class I | 3,364 | 67,625 |
| Total | $275,781 | $13,679,321 |
10. Share Transactions.
Share transactions for each class were as follows and may contain automatic conversions between classes or exchanges between funds:
| Shares | Shares | Dollars | Dollars | |
| Six months ended August 31, 2015 | Year ended February 28, 2015 | Six months ended August 31, 2015 | Year ended February 28, 2015 | |
| Class A | ||||
| Shares sold | 42,570 | 79,279 | $2,653,863 | $4,786,534 |
| Reinvestment of distributions | 62 | 5,091 | 3,876 | 297,550 |
| Shares redeemed | (27,260) | (41,031) | (1,695,334) | (2,466,354) |
| Net increase (decrease) | 15,372 | 43,339 | $962,405 | $2,617,730 |
| Class T | ||||
| Shares sold | 7,480 | 20,637 | $463,456 | $1,237,395 |
| Reinvestment of distributions | – | 2,409 | – | 139,987 |
| Shares redeemed | (9,168) | (16,465) | (561,396) | (994,017) |
| Net increase (decrease) | (1,688) | 6,581 | $(97,940) | $383,365 |
| Class B | ||||
| Shares sold | 129 | 45 | $7,453 | $2,624 |
| Reinvestment of distributions | – | 197 | – | 11,445 |
| Shares redeemed | (1,637) | (3,091) | (101,595) | (186,477) |
| Net increase (decrease) | (1,508) | (2,849) | $(94,142) | $(172,408) |
| Class C | ||||
| Shares sold | 32,550 | 28,734 | $2,029,083 | $1,731,696 |
| Reinvestment of distributions | – | 2,043 | – | 118,683 |
| Shares redeemed | (11,472) | (12,919) | (710,851) | (773,747) |
| Net increase (decrease) | 21,078 | 17,858 | $1,318,232 | $1,076,632 |
| Telecommunications | ||||
| Shares sold | 2,361,442 | 3,400,370 | $149,105,313 | $205,982,254 |
| Reinvestment of distributions | 4,075 | 212,695 | 257,513 | 12,494,070 |
| Shares redeemed | (838,911) | (3,993,893)A | (52,018,468) | (242,841,980)A |
| Net increase (decrease) | 1,526,606 | (380,828) | $97,344,358 | $(24,365,656) |
| Class I | ||||
| Shares sold | 28,397 | 29,046 | $1,792,100 | $1,764,278 |
| Reinvestment of distributions | 48 | 956 | 3,004 | 56,138 |
| Shares redeemed | (23,780) | (17,754) | (1,481,523) | (1,063,165) |
| Net increase (decrease) | 4,665 | 12,248 | $313,581 | $757,251 |
A Amount includes in-kind redemptions.
11. Other.
The Fund's organizational documents provide former and current trustees and officers with a limited indemnification against liabilities arising in connection with the performance of their duties to the Fund. In the normal course of business, the Fund may also enter into contracts that provide general indemnifications. The Fund's maximum exposure under these arrangements is unknown as this would be dependent on future claims that may be made against the Fund. The risk of material loss from such claims is considered remote.
At the end of the period, Strategic Advisers Core Fund was the owner of record of approximately 14% of the total outstanding shares of the Fund. Mutual funds managed by the investment adviser or its affiliates were the owners of record, in the aggregate, of approximately 22% of the total outstanding shares of the Fund.
Shareholder Expense Example
As a shareholder of the Fund, you incur two types of costs: (1) transaction costs, including sales charges (loads) on purchase payments or redemption proceeds, redemption fees and (2) ongoing costs, including management fees, distribution and/or service (12b-1) fees and other Fund expenses. This Example is intended to help you understand your ongoing costs (in dollars) of investing in the Fund and to compare these costs with the ongoing costs of investing in other mutual funds.
The Example is based on an investment of $1,000 invested at the beginning of the period and held for the entire period (March 1, 2015 to August 31, 2015).
Actual Expenses
The first line of the accompanying table for each class of the Fund provides information about actual account values and actual expenses. You may use the information in this line, together with the amount you invested, to estimate the expenses that you paid over the period. Simply divide your account value by $1,000.00 (for example, an $8,600 account value divided by $1,000.00 = 8.6), then multiply the result by the number in the first line for a class of the Fund under the heading entitled "Expenses Paid During Period" to estimate the expenses you paid on your account during this period. A small balance maintenance fee of $12.00 that is charged once a year may apply for certain accounts with a value of less than $2,000. This fee is not included in the table below. If it was, the estimate of expenses you paid during the period would be higher, and your ending account value lower, by this amount. In addition, the Fund, as a shareholder in the underlying Fidelity Central Funds, will indirectly bear its pro-rata share of the fees and expenses incurred by the underlying Fidelity Central Funds. These fees and expenses are not included in the Fund's annualized expense ratio used to calculate the expense estimate in the table below.
Hypothetical Example for Comparison Purposes
The second line of the accompanying table for each class of the Fund provides information about hypothetical account values and hypothetical expenses based on a Class' actual expense ratio and an assumed rate of return of 5% per year before expenses, which is not the Class' actual return. The hypothetical account values and expenses may not be used to estimate the actual ending account balance or expenses you paid for the period. You may use this information to compare the ongoing costs of investing in the Fund and other funds. To do so, compare this 5% hypothetical example with the 5% hypothetical examples that appear in the shareholder reports of the other funds. A small balance maintenance fee of $12.00 that is charged once a year may apply for certain accounts with a value of less than $2,000. This fee is not included in the table below. If it was, the estimate of expenses you paid during the period would be higher, and your ending account value lower, by this amount. In addition, the Fund, as a shareholder in the underlying Fidelity Central Funds, will indirectly bear its pro-rata share of the fees and expenses incurred by the underlying Fidelity Central Funds. These fees and expenses are not included in the Fund's annualized expense ratio used to calculate the expense estimate in the table below.
Please note that the expenses shown in the table are meant to highlight your ongoing costs only and do not reflect any transaction costs. Therefore, the second line of the table is useful in comparing ongoing costs only, and will not help you determine the relative total costs of owning different funds. In addition, if these transactional costs were included, your costs would have been higher.
| Annualized Expense Ratio-A | Beginning Account Value March 1, 2015 | Ending Account Value August 31, 2015 | Expenses Paid During Period-B March 1, 2015 to August 31, 2015 |
|
| Consumer Staples Portfolio | ||||
| Class A | 1.04% | |||
| Actual | $1,000.00 | $901.30 | $4.97 | |
| Hypothetical-C | $1,000.00 | $1,019.91 | $5.28 | |
| Class T | 1.32% | |||
| Actual | $1,000.00 | $900.10 | $6.30 | |
| Hypothetical-C | $1,000.00 | $1,018.50 | $6.70 | |
| Class B | 1.81% | |||
| Actual | $1,000.00 | $897.90 | $8.63 | |
| Hypothetical-C | $1,000.00 | $1,016.04 | $9.17 | |
| Class C | 1.80% | |||
| Actual | $1,000.00 | $898.00 | $8.59 | |
| Hypothetical-C | $1,000.00 | $1,016.09 | $9.12 | |
| Consumer Staples | .77% | |||
| Actual | $1,000.00 | $902.60 | $3.68 | |
| Hypothetical-C | $1,000.00 | $1,021.27 | $3.91 | |
| Class I | .77% | |||
| Actual | $1,000.00 | $902.40 | $3.68 | |
| Hypothetical-C | $1,000.00 | $1,021.27 | $3.91 | |
| Gold Portfolio | ||||
| Class A | 1.21% | |||
| Actual | $1,000.00 | $748.20 | $5.32 | |
| Hypothetical-C | $1,000.00 | $1,019.05 | $6.14 | |
| Class T | 1.49% | |||
| Actual | $1,000.00 | $747.10 | $6.54 | |
| Hypothetical-C | $1,000.00 | $1,017.65 | $7.56 | |
| Class B | 1.96% | |||
| Actual | $1,000.00 | $745.20 | $8.60 | |
| Hypothetical-C | $1,000.00 | $1,015.28 | $9.93 | |
| Class C | 1.94% | |||
| Actual | $1,000.00 | $744.80 | $8.51 | |
| Hypothetical-C | $1,000.00 | $1,015.38 | $9.83 | |
| Gold | .93% | |||
| Actual | $1,000.00 | $748.60 | $4.09 | |
| Hypothetical-C | $1,000.00 | $1,020.46 | $4.72 | |
| Class I | .89% | |||
| Actual | $1,000.00 | $749.20 | $3.91 | |
| Hypothetical-C | $1,000.00 | $1,020.66 | $4.52 | |
| Materials Portfolio | ||||
| Class A | 1.06% | |||
| Actual | $1,000.00 | $887.90 | $5.03 | |
| Hypothetical-C | $1,000.00 | $1,019.81 | $5.38 | |
| Class T | 1.37% | |||
| Actual | $1,000.00 | 886.30 | $6.50 | |
| Hypothetical-C | $1,000.00 | $1,018.25 | $6.95 | |
| Class B | 1.88% | |||
| Actual | $1,000.00 | 884.10 | $8.90 | |
| Hypothetical-C | $1,000.00 | $1,015.69 | $9.53 | |
| Class C | 1.81% | |||
| Actual | $1,000.00 | $884.40 | $8.57 | |
| Hypothetical-C | $1,000.00 | $1,016.04 | $9.17 | |
| Materials | .80% | |||
| Actual | $1,000.00 | $889.00 | $3.80 | |
| Hypothetical-C | $1,000.00 | $1,021.11 | $4.06 | |
| Class I | .78% | |||
| Actual | $1,000.00 | $889.10 | $3.70 | |
| Hypothetical-C | $1,000.00 | $1,021.22 | $3.96 | |
| Telecommunications Portfolio | ||||
| Class A | 1.16% | |||
| Actual | $1,000.00 | $938.20 | $5.65 | |
| Hypothetical-C | $1,000.00 | $1,019.30 | $5.89 | |
| Class T | 1.48% | |||
| Actual | $1,000.00 | $936.70 | $7.20 | |
| Hypothetical-C | $1,000.00 | $1,017.70 | $7.51 | |
| Class B | 1.95% | |||
| Actual | $1,000.00 | $934.60 | $9.48 | |
| Hypothetical-C | $1,000.00 | $1,015.33 | $9.88 | |
| Class C | 1.92% | |||
| Actual | $1,000.00 | $934.80 | $9.34 | |
| Hypothetical-C | $1,000.00 | $1,015.48 | $9.73 | |
| Telecommunications | .83% | |||
| Actual | $1,000.00 | $939.90 | $4.05 | |
| Hypothetical-C | $1,000.00 | $1,020.96 | $4.22 | |
| Class I | .85% | |||
| Actual | $1,000.00 | $939.80 | $4.14 | |
| Hypothetical-C | $1,000.00 | $1,020.86 | $4.32 | |
A Annualized expense ratio reflects expenses net of applicable fee waivers.
B Expenses are equal to each Class' annualized expense ratio, multiplied by the average account value over the period, multiplied by 184/ 366 (to reflect the one-half year period).
C 5% return per year before expenses
![]()
ASGMT-SANN-1015
1.855654.108
|
Fidelity® Select Portfolios® Banking Portfolio Brokerage and Investment Management Portfolio Consumer Finance Portfolio Financial Services Portfolio Insurance Portfolio Semi-Annual Report August 31, 2015 |
|
|
Contents
|
Banking Portfolio |
|
|
Brokerage and Investment Management Portfolio |
|
|
Consumer Finance Portfolio |
|
|
Financial Services Portfolio |
|
|
Insurance Portfolio |
|
To view a fund's proxy voting guidelines and proxy voting record for the 12-month period ended June 30, visit http://www.fidelity.com/proxyvotingresults or visit the Securities and Exchange Commission's (SEC) web site at http://www.sec.gov.
You may also call 1-800-544-8544 to request a free copy of the proxy voting guidelines.
Standard & Poor's, S&P and S&P 500 are registered service marks of The McGraw-Hill Companies, Inc. and have been licensed for use by Fidelity Distributors Corporation.
Other third-party marks appearing herein are the property of their respective owners.
All other marks appearing herein are registered or unregistered trademarks or service marks of FMR LLC or an affiliated company. ©2015 FMR LLC. All rights reserved.
This report and the financial statements contained herein are submitted for the general information of the shareholders of the Funds. This report is not authorized for distribution to prospective investors in the Funds unless preceded or accompanied by an effective prospectus.
A fund files its complete schedule of portfolio holdings with the SEC for the first and third quarters of each fiscal year on Form N-Q. Forms N-Q are available on the SEC’s web site at http://www.sec.gov. A fund's Forms N-Q may be reviewed and copied at the SEC’s Public Reference Room in Washington, DC. Information regarding the operation of the SEC's Public Reference Room may be obtained by calling 1-800-SEC-0330.
For a complete list of a fund's portfolio holdings, view the most recent holdings listing, semiannual report, or annual report on Fidelity's web site at http://www.fidelity.com, http://www.advisor.fidelity.com, or http://www.401k.com, as applicable.
NOT FDIC INSURED •MAY LOSE VALUE •NO BANK GUARANTEE
Neither the Funds nor Fidelity Distributors Corporation is a bank.
Banking Portfolio
Investment Summary (Unaudited)
Top Ten Stocks as of August 31, 2015
| % of fund's net assets | % of fund's net assets 6 months ago | |
| Wells Fargo & Co. | 11.3 | 11.0 |
| U.S. Bancorp | 7.4 | 7.6 |
| Bank of America Corp. | 5.9 | 6.5 |
| JPMorgan Chase & Co. | 5.1 | 5.5 |
| Citigroup, Inc. | 5.1 | 5.4 |
| SunTrust Banks, Inc. | 5.0 | 4.8 |
| Regions Financial Corp. | 4.2 | 3.9 |
| Capital One Financial Corp. | 4.0 | 3.8 |
| Prosperity Bancshares, Inc. | 3.2 | 5.2 |
| M&T Bank Corp. | 3.1 | 3.2 |
| 54.3 |
Top Industries (% of fund's net assets)
| As of August 31, 2015 | ||
| Banks | 82.7% | |
| Consumer Finance | 8.3% | |
| Thrifts & Mortgage Finance | 3.6% | |
| Trading Companies & Distributors | 1.5% | |
| Capital Markets | 1.3% | |
| All Others* | 2.6% | |

| As of February 28, 2015 | ||
| Banks | 87.7% | |
| Consumer Finance | 4.3% | |
| Thrifts & Mortgage Finance | 3.9% | |
| IT Services | 1.3% | |
| Insurance | 1.2% | |
| All Others* | 1.6% | |

* Includes short-term investments and net other assets (liabilities).
Banking Portfolio
Investments August 31, 2015 (Unaudited)
Showing Percentage of Net Assets
| Common Stocks - 98.8% | |||
| Shares | Value | ||
| Banks - 82.2% | |||
| Diversified Banks - 38.4% | |||
| Banco ABC Brasil SA (a) | 44,711 | $111,942 | |
| Bank of America Corp. | 2,395,100 | 39,135,934 | |
| Citigroup, Inc. | 641,400 | 34,302,072 | |
| Comerica, Inc. | 397,300 | 17,481,200 | |
| JPMorgan Chase & Co. | 535,500 | 34,325,550 | |
| Lloyds Banking Group PLC | 5,815,500 | 6,854,608 | |
| U.S. Bancorp | 1,168,700 | 49,494,445 | |
| Wells Fargo & Co. | 1,412,792 | 75,344,198 | |
| 257,049,949 | |||
| Regional Banks - 43.8% | |||
| 1st Source Corp. | 246,660 | 7,385,000 | |
| Bank of the Ozarks, Inc. | 213,200 | 8,911,760 | |
| Camden National Corp. | 165,590 | 6,625,256 | |
| Central Valley Community Bancorp | 48,178 | 556,456 | |
| CIT Group, Inc. | 443,600 | 19,269,984 | |
| Commerce Bancshares, Inc. | 286,257 | 12,827,176 | |
| Community Trust Bancorp, Inc. | 223,000 | 7,827,300 | |
| CVB Financial Corp. | 717,900 | 11,665,875 | |
| First Citizen Bancshares, Inc. | 37,000 | 8,775,660 | |
| First Republic Bank | 206,100 | 12,429,891 | |
| Hanmi Financial Corp. | 141,200 | 3,422,688 | |
| Hilltop Holdings, Inc. (a) | 394,600 | 8,148,490 | |
| Huntington Bancshares, Inc. | 1,406,900 | 15,349,279 | |
| Investors Bancorp, Inc. | 770,400 | 9,075,312 | |
| Lakeland Financial Corp. | 98,599 | 4,051,433 | |
| M&T Bank Corp. (b) | 173,800 | 20,550,112 | |
| PacWest Bancorp | 399,136 | 17,019,159 | |
| PNC Financial Services Group, Inc. | 96,541 | 8,796,816 | |
| Prosperity Bancshares, Inc. | 414,100 | 21,396,547 | |
| Regions Financial Corp. | 2,891,900 | 27,733,321 | |
| Shinsei Bank Ltd. | 2,740,000 | 5,906,136 | |
| SunTrust Banks, Inc. | 835,500 | 33,729,135 | |
| UMB Financial Corp. | 321,000 | 16,091,730 | |
| Wilshire Bancorp, Inc. | 469,000 | 5,008,920 | |
| 292,553,436 | |||
| TOTAL BANKS | 549,603,385 | ||
| Capital Markets - 1.3% | |||
| Asset Management & Custody Banks - 1.3% | |||
| The Blackstone Group LP | 261,600 | 8,959,800 | |
| Consumer Finance - 8.3% | |||
| Consumer Finance - 8.3% | |||
| American Express Co. | 50,900 | 3,905,048 | |
| Capital One Financial Corp. | 343,800 | 26,730,450 | |
| Discover Financial Services | 342,800 | 18,418,644 | |
| Navient Corp. | 248,600 | 3,179,594 | |
| Springleaf Holdings, Inc. (a) | 79,700 | 3,567,372 | |
| 55,801,108 | |||
| Diversified Financial Services - 1.0% | |||
| Specialized Finance - 1.0% | |||
| Element Financial Corp. (a) | 472,100 | 6,753,513 | |
| Insurance - 0.5% | |||
| Property & Casualty Insurance - 0.5% | |||
| First American Financial Corp. | 84,100 | 3,268,126 | |
| IT Services - 0.4% | |||
| Data Processing & Outsourced Services - 0.4% | |||
| Fidelity National Information Services, Inc. | 39,900 | 2,755,494 | |
| Thrifts & Mortgage Finance - 3.6% | |||
| Thrifts & Mortgage Finance - 3.6% | |||
| Hudson City Bancorp, Inc. | 911,200 | 8,474,160 | |
| Meridian Bancorp, Inc. | 678,065 | 8,638,548 | |
| TFS Financial Corp. | 397,200 | 6,819,924 | |
| 23,932,632 | |||
| Trading Companies & Distributors - 1.5% | |||
| Trading Companies & Distributors - 1.5% | |||
| AerCap Holdings NV (a) | 231,600 | 9,736,464 | |
| TOTAL COMMON STOCKS | |||
| (Cost $586,571,108) | 660,810,522 | ||
| Nonconvertible Preferred Stocks - 0.5% | |||
| Banks - 0.5% | |||
| Diversified Banks - 0.5% | |||
| Banco ABC Brasil SA | |||
| (Cost $5,454,368) | 1,195,723 | 2,993,717 | |
| Money Market Funds - 2.1% | |||
| Fidelity Cash Central Fund, 0.15% (c) | 3,247,964 | 3,247,964 | |
| Fidelity Securities Lending Cash Central Fund, 0.19% (c)(d) | 10,534,050 | 10,534,050 | |
| TOTAL MONEY MARKET FUNDS | |||
| (Cost $13,782,014) | 13,782,014 | ||
| TOTAL INVESTMENT PORTFOLIO - 101.4% | |||
| (Cost $605,807,490) | 677,586,253 | ||
| NET OTHER ASSETS (LIABILITIES) - (1.4)% | (9,040,767) | ||
| NET ASSETS - 100% | $668,545,486 |
Legend
(a) Non-income producing
(b) Security or a portion of the security is on loan at period end.
(c) Affiliated fund that is generally available only to investment companies and other accounts managed by Fidelity Investments. The rate quoted is the annualized seven-day yield of the fund at period end. A complete unaudited listing of the fund's holdings as of its most recent quarter end is available upon request. In addition, each Fidelity Central Fund's financial statements are available on the SEC's website or upon request.
(d) Investment made with cash collateral received from securities on loan.
Affiliated Central Funds
Information regarding fiscal year to date income earned by the Fund from investments in Fidelity Central Funds is as follows:
| Fund | Income earned |
| Fidelity Cash Central Fund | $10,779 |
| Fidelity Securities Lending Cash Central Fund | 6,926 |
| Total | $17,705 |
Investment Valuation
The following is a summary of the inputs used, as of August 31, 2015, involving the Fund's assets and liabilities carried at fair value. The inputs or methodology used for valuing securities may not be an indication of the risk associated with investing in those securities. For more information on valuation inputs, and their aggregation into the levels used below, please refer to the Investment Valuation section in the accompanying Notes to Financial Statements.
| Valuation Inputs at Reporting Date: | ||||
| Description | Total | Level 1 | Level 2 | Level 3 |
| Investments in Securities: | ||||
| Common Stocks | $660,810,522 | $648,049,778 | $12,760,744 | $-- |
| Nonconvertible Preferred Stocks | 2,993,717 | 2,993,717 | -- | -- |
| Money Market Funds | 13,782,014 | 13,782,014 | -- | -- |
| Total Investments in Securities: | $677,586,253 | $664,825,509 | $12,760,744 | $-- |
See accompanying notes which are an integral part of the financial statements.
Banking Portfolio
Financial Statements
Statement of Assets and Liabilities
| August 31, 2015 (Unaudited) | ||
| Assets | ||
| Investment in securities, at value (including securities loaned of $10,251,408) — See accompanying schedule: Unaffiliated issuers (cost $592,025,476) | $663,804,239 | |
| Fidelity Central Funds (cost $13,782,014) | 13,782,014 | |
| Total Investments (cost $605,807,490) | $677,586,253 | |
| Receivable for investments sold | 7,792,279 | |
| Receivable for fund shares sold | 415,373 | |
| Dividends receivable | 946,824 | |
| Distributions receivable from Fidelity Central Funds | 2,534 | |
| Prepaid expenses | 5,379 | |
| Other receivables | 6,445 | |
| Total assets | 686,755,087 | |
| Liabilities | ||
| Payable for investments purchased | $3,939,099 | |
| Payable for fund shares redeemed | 3,257,582 | |
| Accrued management fee | 324,642 | |
| Other affiliated payables | 131,171 | |
| Other payables and accrued expenses | 23,057 | |
| Collateral on securities loaned, at value | 10,534,050 | |
| Total liabilities | 18,209,601 | |
| Net Assets | $668,545,486 | |
| Net Assets consist of: | ||
| Paid in capital | $582,884,189 | |
| Undistributed net investment income | 4,006,980 | |
| Accumulated undistributed net realized gain (loss) on investments and foreign currency transactions | 9,876,569 | |
| Net unrealized appreciation (depreciation) on investments and assets and liabilities in foreign currencies | 71,777,748 | |
| Net Assets, for 25,669,423 shares outstanding | $668,545,486 | |
| Net Asset Value, offering price and redemption price per share ($668,545,486 ÷ 25,669,423 shares) | $26.04 |
See accompanying notes which are an integral part of the financial statements.
Statement of Operations
| Six months ended August 31, 2015 (Unaudited) | ||
| Investment Income | ||
| Dividends | $6,548,405 | |
| Income from Fidelity Central Funds | 17,705 | |
| Total income | 6,566,110 | |
| Expenses | ||
| Management fee | $1,768,163 | |
| Transfer agent fees | 601,847 | |
| Accounting and security lending fees | 117,979 | |
| Custodian fees and expenses | 9,288 | |
| Independent trustees' compensation | 5,299 | |
| Registration fees | 41,894 | |
| Audit | 18,276 | |
| Legal | 4,812 | |
| Miscellaneous | 4,800 | |
| Total expenses before reductions | 2,572,358 | |
| Expense reductions | (30,398) | 2,541,960 |
| Net investment income (loss) | 4,024,150 | |
| Realized and Unrealized Gain (Loss)
Net realized gain (loss) on: | ||
| Investment securities: | ||
| Unaffiliated issuers | 11,383,008 | |
| Foreign currency transactions | 61,021 | |
| Total net realized gain (loss) | 11,444,029 | |
| Change in net unrealized appreciation (depreciation) on: Investment securities | (11,357,391) | |
| Assets and liabilities in foreign currencies | (252) | |
| Total change in net unrealized appreciation (depreciation) | (11,357,643) | |
| Net gain (loss) | 86,386 | |
| Net increase (decrease) in net assets resulting from operations | $4,110,536 |
See accompanying notes which are an integral part of the financial statements.
Statement of Changes in Net Assets
| Six months ended August 31, 2015 (Unaudited) | Year ended February 28, 2015 | |
| Increase (Decrease) in Net Assets | ||
| Operations | ||
| Net investment income (loss) | $4,024,150 | $7,605,170 |
| Net realized gain (loss) | 11,444,029 | 43,412,342 |
| Change in net unrealized appreciation (depreciation) | (11,357,643) | (23,730,282) |
| Net increase (decrease) in net assets resulting from operations | 4,110,536 | 27,287,230 |
| Distributions to shareholders from net investment income | (972,350) | (8,667,459) |
| Distributions to shareholders from net realized gain | (13,634,992) | (28,732,272) |
| Total distributions | (14,607,342) | (37,399,731) |
| Share transactions | ||
| Proceeds from sales of shares | 168,812,010 | 218,322,401 |
| Reinvestment of distributions | 14,166,375 | 36,509,291 |
| Cost of shares redeemed | (88,585,045) | (470,086,598) |
| Net increase (decrease) in net assets resulting from share transactions | 94,393,340 | (215,254,906) |
| Redemption fees | 13,588 | 22,561 |
| Total increase (decrease) in net assets | 83,910,122 | (225,344,846) |
| Net Assets | ||
| Beginning of period | 584,635,364 | 809,980,210 |
| End of period (including undistributed net investment income of $4,006,980 and undistributed net investment income of $955,180, respectively) | $668,545,486 | $584,635,364 |
| Other Information
Shares | ||
| Sold | 6,153,083 | 8,234,396 |
| Issued in reinvestment of distributions | 547,599 | 1,431,983 |
| Redeemed | (3,313,940) | (18,407,235) |
| Net increase (decrease) | 3,386,742 | (8,740,856) |
See accompanying notes which are an integral part of the financial statements.
Financial Highlights — Banking Portfolio
| Six months ended (Unaudited) | Years ended February 28, | |||||
| August 31, | 2015 | 2015 | 2014 | 2013 | 2012 A | 2011 |
| Selected Per–Share Data | ||||||
| Net asset value, beginning of period | $26.24 | $26.11 | $20.58 | $17.83 | $18.92 | $16.63 |
| Income from Investment Operations | ||||||
| Net investment income (loss)B | .17 | .30 | .29 | .26 | .09 | (.01) |
| Net realized and unrealized gain (loss) | .29 | 1.04 | 5.97 | 2.73 | (1.11) | 2.31 |
| Total from investment operations | .46 | 1.34 | 6.26 | 2.99 | (1.02) | 2.30 |
| Distributions from net investment income | (.04) | (.34) | (.20) | (.24) | (.07) | (.01) |
| Distributions from net realized gain | (.62) | (.87) | (.53) | – | – | – |
| Total distributions | (.66) | (1.21) | (.73) | (.24) | (.07) | (.01) |
| Redemption fees added to paid in capitalB,C | – | – | – | – | – | – |
| Net asset value, end of period | $26.04 | $26.24 | $26.11 | $20.58 | $17.83 | $18.92 |
| Total ReturnD,E | 1.77% | 5.30% | 30.48% | 16.86% | (5.31)% | 13.83% |
| Ratios to Average Net AssetsF,G | ||||||
| Expenses before reductions | .80%H | .80% | .81% | .85% | .88% | .89% |
| Expenses net of fee waivers, if any | .79%H | .80% | .81% | .85% | .88% | .89% |
| Expenses net of all reductions | .79%H | .79% | .80% | .83% | .87% | .88% |
| Net investment income (loss) | 1.25%H | 1.14% | 1.22% | 1.37% | .55% | (.04)% |
| Supplemental Data | ||||||
| Net assets, end of period (000 omitted) | $668,545 | $584,635 | $809,980 | $530,562 | $429,747 | $518,317 |
| Portfolio turnover rateI | 54%H | 65% | 91% | 69% | 91% | 73% |
A For the year ended February 29.
B Calculated based on average shares outstanding during the period.
C Amount represents less than $.005 per share.
D Total returns for periods of less than one year are not annualized.
E Total returns would have been lower if certain expenses had not been reduced during the applicable periods shown.
F Fees and expenses of any underlying Fidelity Central Funds are not included in the Fund's expense ratio. The Fund indirectly bears its proportionate share of the expenses of any underlying Fidelity Central Funds.
G Expense ratios reflect operating expenses of the Fund. Expenses before reductions do not reflect amounts reimbursed by the investment adviser or reductions from brokerage service arrangements or reductions from other expense offset arrangements and do not represent the amount paid by the Fund during periods when reimbursements or reductions occur. Expenses net of fee waivers reflect expenses after reimbursement by the investment adviser but prior to reductions from brokerage service arrangements or other expense offset arrangements. Expenses net of all reductions represent the net expenses paid by the Fund.
H Annualized
I Amount does not include the portfolio activity of any underlying Fidelity Central Funds.
See accompanying notes which are an integral part of the financial statements.
Brokerage and Investment Management Portfolio
Investment Summary (Unaudited)
Top Ten Stocks as of August 31, 2015
| % of fund's net assets | % of fund's net assets 6 months ago | |
| E*TRADE Financial Corp. | 6.8 | 5.9 |
| State Street Corp. | 6.8 | 6.1 |
| Invesco Ltd. | 6.8 | 7.0 |
| Ameriprise Financial, Inc. | 6.3 | 7.9 |
| Affiliated Managers Group, Inc. | 6.2 | 6.2 |
| BlackRock, Inc. Class A | 6.1 | 6.4 |
| Northern Trust Corp. | 5.9 | 5.1 |
| Goldman Sachs Group, Inc. | 4.9 | 4.3 |
| Raymond James Financial, Inc. | 4.8 | 4.7 |
| Artisan Partners Asset Management, Inc. | 4.4 | 4.0 |
| 59.0 |
Top Industries (% of fund's net assets)
| As of August 31, 2015 | ||
| Capital Markets | 88.9% | |
| Banks | 5.2% | |
| Diversified Financial Services | 2.7% | |
| Insurance | 1.0% | |
| All Others* | 2.2% | |

| As of February 28, 2015 | ||
| Capital Markets | 85.4% | |
| Banks | 5.5% | |
| Diversified Financial Services | 4.7% | |
| Insurance | 1.1% | |
| All Others* | 3.3% | |

* Includes short-term investments and net other assets (liabilities).
Brokerage and Investment Management Portfolio
Investments August 31, 2015 (Unaudited)
Showing Percentage of Net Assets
| Common Stocks - 97.8% | |||
| Shares | Value | ||
| Banks - 5.2% | |||
| Diversified Banks - 5.2% | |||
| Barclays PLC | 1,500,000 | $5,960,715 | |
| Citigroup, Inc. | 225,000 | 12,033,000 | |
| JPMorgan Chase & Co. | 125,000 | 8,012,500 | |
| 26,006,215 | |||
| Capital Markets - 88.9% | |||
| Asset Management & Custody Banks - 58.7% | |||
| Affiliated Managers Group, Inc. (a) | 165,000 | 30,762,600 | |
| Ameriprise Financial, Inc. | 280,000 | 31,547,600 | |
| Apollo Global Management LLC Class A | 250,000 | 4,645,000 | |
| Artisan Partners Asset Management, Inc. | 540,000 | 22,069,800 | |
| Bank of New York Mellon Corp. | 100,000 | 3,980,000 | |
| BlackRock, Inc. Class A | 100,000 | 30,247,000 | |
| Diamond Hill Investment Group, Inc. | 48,146 | 9,374,989 | |
| Fortress Investment Group LLC | 750,000 | 4,350,000 | |
| Franklin Resources, Inc. | 100,000 | 4,058,000 | |
| Invesco Ltd. | 1,000,000 | 34,110,000 | |
| KKR & Co. LP | 450,000 | 8,590,500 | |
| Legg Mason, Inc. | 150,000 | 6,649,500 | |
| Northern Trust Corp. | 425,000 | 29,682,000 | |
| Oaktree Capital Group LLC Class A | 225,000 | 11,925,000 | |
| State Street Corp. | 475,000 | 34,162,000 | |
| The Blackstone Group LP | 275,000 | 9,418,750 | |
| Virtus Investment Partners, Inc. | 155,000 | 17,834,300 | |
| 293,407,039 | |||
| Diversified Capital Markets - 1.2% | |||
| UBS Group AG | 275,000 | 5,689,750 | |
| Investment Banking & Brokerage - 29.0% | |||
| Charles Schwab Corp. | 600,000 | 18,228,000 | |
| E*TRADE Financial Corp. (a) | 1,300,000 | 34,177,000 | |
| Goldman Sachs Group, Inc. | 129,300 | 24,385,980 | |
| Greenhill & Co., Inc. | 250,000 | 8,777,500 | |
| Moelis & Co. Class A | 275,000 | 7,502,000 | |
| Raymond James Financial, Inc. | 450,000 | 23,845,500 | |
| Stifel Financial Corp. (a) | 420,000 | 19,572,000 | |
| TD Ameritrade Holding Corp. | 250,000 | 8,365,000 | |
| 144,852,980 | |||
| TOTAL CAPITAL MARKETS | 443,949,769 | ||
| Diversified Financial Services - 2.7% | |||
| Specialized Finance - 2.7% | |||
| IntercontinentalExchange Group, Inc. | 45,000 | 10,278,450 | |
| McGraw Hill Financial, Inc. | 35,000 | 3,394,650 | |
| 13,673,100 | |||
| Insurance - 1.0% | |||
| Life & Health Insurance - 1.0% | |||
| St. James's Place Capital PLC | 350,000 | 4,916,922 | |
| TOTAL COMMON STOCKS | |||
| (Cost $435,785,592) | 488,546,006 | ||
| Money Market Funds - 2.2% | |||
| Fidelity Cash Central Fund, 0.15% (b) | |||
| (Cost $11,061,279) | 11,061,279 | 11,061,279 | |
| TOTAL INVESTMENT PORTFOLIO - 100.0% | |||
| (Cost $446,846,871) | 499,607,285 | ||
| NET OTHER ASSETS (LIABILITIES) - 0.0% | (17,374) | ||
| NET ASSETS - 100% | $499,589,911 |
Legend
(a) Non-income producing
(b) Affiliated fund that is generally available only to investment companies and other accounts managed by Fidelity Investments. The rate quoted is the annualized seven-day yield of the fund at period end. A complete unaudited listing of the fund's holdings as of its most recent quarter end is available upon request. In addition, each Fidelity Central Fund's financial statements are available on the SEC's website or upon request.
Affiliated Central Funds
Information regarding fiscal year to date income earned by the Fund from investments in Fidelity Central Funds is as follows:
| Fund | Income earned |
| Fidelity Cash Central Fund | $13,809 |
| Fidelity Securities Lending Cash Central Fund | 5 |
| Total | $13,814 |
Investment Valuation
The following is a summary of the inputs used, as of August 31, 2015, involving the Fund's assets and liabilities carried at fair value. The inputs or methodology used for valuing securities may not be an indication of the risk associated with investing in those securities. For more information on valuation inputs, and their aggregation into the levels used below, please refer to the Investment Valuation section in the accompanying Notes to Financial Statements.
| Valuation Inputs at Reporting Date: | ||||
| Description | Total | Level 1 | Level 2 | Level 3 |
| Investments in Securities: | ||||
| Common Stocks | $488,546,006 | $482,585,291 | $5,960,715 | $-- |
| Money Market Funds | 11,061,279 | 11,061,279 | -- | -- |
| Total Investments in Securities: | $499,607,285 | $493,646,570 | $5,960,715 | $-- |
Other Information
Distribution of investments by country or territory of incorporation, as a percentage of Total Net Assets, is as follows (Unaudited):
| United States of America | 89.8% |
| Bermuda | 6.8% |
| United Kingdom | 2.2% |
| Switzerland | 1.2% |
| 100.0% |
See accompanying notes which are an integral part of the financial statements.
Brokerage and Investment Management Portfolio
Financial Statements
Statement of Assets and Liabilities
| August 31, 2015 (Unaudited) | ||
| Assets | ||
| Investment in securities, at value — See accompanying schedule: Unaffiliated issuers (cost $435,785,592) | $488,546,006 | |
| Fidelity Central Funds (cost $11,061,279) | 11,061,279 | |
| Total Investments (cost $446,846,871) | $499,607,285 | |
| Receivable for investments sold | 1,863,963 | |
| Receivable for fund shares sold | 143,413 | |
| Dividends receivable | 829,776 | |
| Distributions receivable from Fidelity Central Funds | 1,439 | |
| Prepaid expenses | 4,214 | |
| Other receivables | 17,201 | |
| Total assets | 502,467,291 | |
| Liabilities | ||
| Payable for investments purchased | $824,345 | |
| Payable for fund shares redeemed | 1,667,409 | |
| Accrued management fee | 245,549 | |
| Other affiliated payables | 105,153 | |
| Other payables and accrued expenses | 34,924 | |
| Total liabilities | 2,877,380 | |
| Net Assets | $499,589,911 | |
| Net Assets consist of: | ||
| Paid in capital | $429,819,180 | |
| Undistributed net investment income | 3,211,587 | |
| Accumulated undistributed net realized gain (loss) on investments and foreign currency transactions | 13,798,993 | |
| Net unrealized appreciation (depreciation) on investments and assets and liabilities in foreign currencies | 52,760,151 | |
| Net Assets, for 7,267,693 shares outstanding | $499,589,911 | |
| Net Asset Value, offering price and redemption price per share ($499,589,911 ÷ 7,267,693 shares) | $68.74 |
See accompanying notes which are an integral part of the financial statements.
Statement of Operations
| Six months ended August 31, 2015 (Unaudited) | ||
| Investment Income | ||
| Dividends | $5,445,779 | |
| Income from Fidelity Central Funds | 13,814 | |
| Total income | 5,459,593 | |
| Expenses | ||
| Management fee | $1,567,679 | |
| Transfer agent fees | 533,228 | |
| Accounting and security lending fees | 107,169 | |
| Custodian fees and expenses | 3,220 | |
| Independent trustees' compensation | 4,926 | |
| Registration fees | 16,911 | |
| Audit | 19,135 | |
| Legal | 4,108 | |
| Miscellaneous | 4,275 | |
| Total expenses before reductions | 2,260,651 | |
| Expense reductions | (30,955) | 2,229,696 |
| Net investment income (loss) | 3,229,897 | |
| Realized and Unrealized Gain (Loss)
Net realized gain (loss) on: | ||
| Investment securities: | ||
| Unaffiliated issuers | 14,440,241 | |
| Foreign currency transactions | 6,259 | |
| Total net realized gain (loss) | 14,446,500 | |
| Change in net unrealized appreciation (depreciation) on: Investment securities | (56,697,382) | |
| Assets and liabilities in foreign currencies | (263) | |
| Total change in net unrealized appreciation (depreciation) | (56,697,645) | |
| Net gain (loss) | (42,251,145) | |
| Net increase (decrease) in net assets resulting from operations | $(39,021,248) |
See accompanying notes which are an integral part of the financial statements.
Statement of Changes in Net Assets
| Six months ended August 31, 2015 (Unaudited) | Year ended February 28, 2015 | |
| Increase (Decrease) in Net Assets | ||
| Operations | ||
| Net investment income (loss) | $3,229,897 | $8,290,929 |
| Net realized gain (loss) | 14,446,500 | 17,201,741 |
| Change in net unrealized appreciation (depreciation) | (56,697,645) | 15,368,811 |
| Net increase (decrease) in net assets resulting from operations | (39,021,248) | 40,861,481 |
| Distributions to shareholders from net investment income | (702,362) | (6,687,809) |
| Distributions to shareholders from net realized gain | (4,290,515) | (13,758,502) |
| Total distributions | (4,992,877) | (20,446,311) |
| Share transactions | ||
| Proceeds from sales of shares | 27,416,970 | 44,436,800 |
| Reinvestment of distributions | 4,813,639 | 19,563,162 |
| Cost of shares redeemed | (66,582,259) | (340,693,447) |
| Net increase (decrease) in net assets resulting from share transactions | (34,351,650) | (276,693,485) |
| Redemption fees | 2,555 | 9,496 |
| Total increase (decrease) in net assets | (78,363,220) | (256,268,819) |
| Net Assets | ||
| Beginning of period | 577,953,131 | 834,221,950 |
| End of period (including undistributed net investment income of $3,211,587 and undistributed net investment income of $684,052, respectively) | $499,589,911 | $577,953,131 |
| Other Information
Shares | ||
| Sold | 362,161 | 606,214 |
| Issued in reinvestment of distributions | 64,769 | 261,782 |
| Redeemed | (888,021) | (4,726,727) |
| Net increase (decrease) | (461,091) | (3,858,731) |
See accompanying notes which are an integral part of the financial statements.
Financial Highlights — Brokerage and Investment Management Portfolio
| Six months ended (Unaudited) | Years ended February 28, | |||||
| August 31, | 2015 | 2015 | 2014 | 2013 | 2012 A | 2011 |
| Selected Per–Share Data | ||||||
| Net asset value, beginning of period | $74.78 | $71.99 | $55.99 | $47.28 | $54.11 | $47.32 |
| Income from Investment Operations | ||||||
| Net investment income (loss)B | .43 | .96 | .99 | 1.31 | .26 | .39 |
| Net realized and unrealized gain (loss) | (5.82) | 4.39 | 15.41 | 8.52 | (6.56) | 6.71 |
| Total from investment operations | (5.39) | 5.35 | 16.40 | 9.83 | (6.30) | 7.10 |
| Distributions from net investment income | (.09) | (.83) | (.39) | (1.12) | (.53) | (.31) |
| Distributions from net realized gain | (.56) | (1.73) | (.02) | – | – | – |
| Total distributions | (.65) | (2.56) | (.40)C | (1.12) | (.53) | (.31) |
| Redemption fees added to paid in capitalB,D | – | – | – | – | – | – |
| Net asset value, end of period | $68.74 | $74.78 | $71.99 | $55.99 | $47.28 | $54.11 |
| Total ReturnE,F | (7.27)% | 7.43% | 29.29% | 21.08% | (11.51)% | 15.03% |
| Ratios to Average Net AssetsG,H | ||||||
| Expenses before reductions | .79%I | .79% | .82% | .87% | .89% | .88% |
| Expenses net of fee waivers, if any | .78%I | .79% | .82% | .87% | .89% | .88% |
| Expenses net of all reductions | .78%I | .79% | .80% | .78% | .85% | .86% |
| Net investment income (loss) | 1.13%I | 1.32% | 1.52% | 2.72% | .57% | .79% |
| Supplemental Data | ||||||
| Net assets, end of period (000 omitted) | $499,590 | $577,953 | $834,222 | $604,773 | $413,228 | $551,976 |
| Portfolio turnover rateJ | 30%I | 31% | 182% | 308% | 294% | 153% |
A For the year ended February 29.
B Calculated based on average shares outstanding during the period.
C Total distributions of $.40 per share is comprised of distributions from net investment income of $.388 and distributions from net realized gain of $.016 per share.
D Amount represents less than $.005 per share.
E Total returns for periods of less than one year are not annualized.
F Total returns would have been lower if certain expenses had not been reduced during the applicable periods shown.
G Fees and expenses of any underlying Fidelity Central Funds are not included in the Fund's expense ratio. The Fund indirectly bears its proportionate share of the expenses of any underlying Fidelity Central Funds.
H Expense ratios reflect operating expenses of the Fund. Expenses before reductions do not reflect amounts reimbursed by the investment adviser or reductions from brokerage service arrangements or reductions from other expense offset arrangements and do not represent the amount paid by the Fund during periods when reimbursements or reductions occur. Expenses net of fee waivers reflect expenses after reimbursement by the investment adviser but prior to reductions from brokerage service arrangements or other expense offset arrangements. Expenses net of all reductions represent the net expenses paid by the Fund.
I Annualized
J Amount does not include the portfolio activity of any underlying Fidelity Central Funds.
See accompanying notes which are an integral part of the financial statements.
Consumer Finance Portfolio
Investment Summary (Unaudited)
Top Ten Stocks as of August 31, 2015
| % of fund's net assets | % of fund's net assets 6 months ago | |
| Visa, Inc. Class A | 9.6 | 8.6 |
| MasterCard, Inc. Class A | 6.5 | 6.2 |
| Capital One Financial Corp. | 5.7 | 6.2 |
| Ally Financial, Inc. | 4.5 | 3.6 |
| Santander Consumer U.S.A. Holdings, Inc. | 4.4 | 4.3 |
| Springleaf Holdings, Inc. | 4.3 | 5.5 |
| American Express Co. | 4.2 | 4.2 |
| Total System Services, Inc. | 4.2 | 3.1 |
| American Capital Agency Corp. | 3.8 | 4.4 |
| TFS Financial Corp. | 3.6 | 2.8 |
| 50.8 |
Top Industries (% of fund's net assets)
| As of August 31, 2015 | ||
| Consumer Finance | 34.8% | |
| IT Services | 29.3% | |
| Thrifts & Mortgage Finance | 20.0% | |
| Real Estate Investment Trusts | 12.0% | |
| Diversified Financial Services | 2.2% | |
| All Others* | 1.7% | |
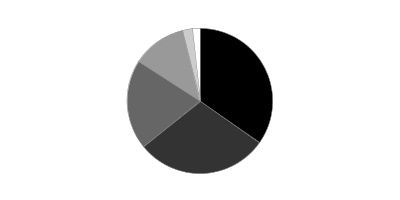
| As of February 28, 2015 | ||
| Consumer Finance | 40.0% | |
| IT Services | 27.5% | |
| Thrifts & Mortgage Finance | 19.3% | |
| Real Estate Investment Trusts | 12.5% | |
| Capital Markets | 1.0% | |
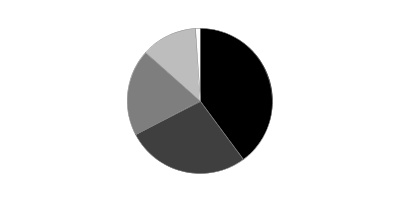
* Includes short-term investments and net other assets (liabilities).
Consumer Finance Portfolio
Investments August 31, 2015 (Unaudited)
Showing Percentage of Net Assets
| Common Stocks - 99.4% | |||
| Shares | Value | ||
| Banks - 0.5% | |||
| Regional Banks - 0.5% | |||
| Peoples United Financial, Inc. | 34,400 | $533,200 | |
| Capital Markets - 0.6% | |||
| Investment Banking & Brokerage - 0.6% | |||
| E*TRADE Financial Corp. (a) | 25,800 | 678,282 | |
| Consumer Finance - 34.8% | |||
| Consumer Finance - 34.8% | |||
| Ally Financial, Inc. (a) | 239,400 | 5,233,284 | |
| American Express Co. | 64,000 | 4,910,080 | |
| Capital One Financial Corp. | 85,600 | 6,655,400 | |
| Cash America International, Inc. | 25,819 | 712,604 | |
| Credit Acceptance Corp. (a) | 6,075 | 1,238,146 | |
| Discover Financial Services | 53,300 | 2,863,809 | |
| Enova International, Inc. (a) | 23,373 | 303,849 | |
| First Cash Financial Services, Inc. (a) | 21,700 | 895,559 | |
| Navient Corp. | 320,300 | 4,096,637 | |
| Nelnet, Inc. Class A | 27,900 | 1,050,435 | |
| Santander Consumer U.S.A. Holdings, Inc. (a) | 231,700 | 5,203,982 | |
| SLM Corp. (a) | 311,500 | 2,641,520 | |
| Springleaf Holdings, Inc. (a) | 113,600 | 5,084,736 | |
| 40,890,041 | |||
| Diversified Financial Services - 2.2% | |||
| Specialized Finance - 2.2% | |||
| Element Financial Corp. (a) | 160,200 | 2,291,703 | |
| PHH Corp. (a) | 18,000 | 291,600 | |
| 2,583,303 | |||
| IT Services - 29.3% | |||
| Data Processing & Outsourced Services - 29.3% | |||
| Alliance Data Systems Corp. (a) | 2,300 | 591,537 | |
| Blackhawk Network Holdings, Inc. (a) | 24,900 | 983,799 | |
| EVERTEC, Inc. | 11,900 | 215,390 | |
| Fidelity National Information Services, Inc. | 27,100 | 1,871,526 | |
| Fiserv, Inc. (a) | 6,600 | 562,782 | |
| FleetCor Technologies, Inc. (a) | 6,600 | 984,456 | |
| Global Payments, Inc. | 34,000 | 3,787,260 | |
| MasterCard, Inc. Class A | 82,700 | 7,638,999 | |
| Total System Services, Inc. | 106,300 | 4,871,729 | |
| Vantiv, Inc. (a) | 36,700 | 1,616,268 | |
| Visa, Inc. Class A | 158,636 | 11,310,745 | |
| 34,434,491 | |||
| Real Estate Investment Trusts - 12.0% | |||
| Mortgage REITs - 12.0% | |||
| Altisource Residential Corp. Class B | 31,500 | 481,005 | |
| American Capital Agency Corp. | 231,100 | 4,420,943 | |
| Annaly Capital Management, Inc. | 179,300 | 1,803,758 | |
| Capstead Mortgage Corp. | 37,300 | 388,666 | |
| Chimera Investment Corp. | 153,680 | 2,153,057 | |
| Hatteras Financial Corp. | 74,900 | 1,215,627 | |
| Invesco Mortgage Capital, Inc. | 56,557 | 769,175 | |
| MFA Financial, Inc. | 122,400 | 870,264 | |
| New Residential Investment Corp. | 65,450 | 926,772 | |
| Redwood Trust, Inc. | 69,200 | 1,009,628 | |
| 14,038,895 | |||
| Thrifts & Mortgage Finance - 20.0% | |||
| Thrifts & Mortgage Finance - 20.0% | |||
| BofI Holding, Inc. (a) | 4,200 | 486,528 | |
| Capitol Federal Financial, Inc. | 48,300 | 582,015 | |
| EverBank Financial Corp. | 51,800 | 1,024,604 | |
| Flagstar Bancorp, Inc. (a) | 300 | 6,099 | |
| Hudson City Bancorp, Inc. | 268,385 | 2,495,981 | |
| Meridian Bancorp, Inc. | 76,400 | 973,336 | |
| MGIC Investment Corp. (a) | 300,128 | 3,169,352 | |
| Nationstar Mortgage Holdings, Inc. (a)(b) | 69,900 | 1,168,728 | |
| New York Community Bancorp, Inc. (b) | 199,600 | 3,524,936 | |
| Northfield Bancorp, Inc. | 200 | 2,994 | |
| Ocwen Financial Corp. (a)(b) | 100,600 | 748,464 | |
| Provident Financial Services, Inc. | 8,000 | 151,520 | |
| Radian Group, Inc. | 160,265 | 2,881,565 | |
| TFS Financial Corp. | 243,000 | 4,172,310 | |
| United Financial Bancorp, Inc. New | 42,100 | 528,355 | |
| Washington Federal, Inc. | 42,400 | 962,056 | |
| WSFS Financial Corp. | 23,400 | 644,202 | |
| 23,523,045 | |||
| TOTAL COMMON STOCKS | |||
| (Cost $95,547,739) | 116,681,257 | ||
| Money Market Funds - 1.9% | |||
| Fidelity Securities Lending Cash Central Fund, 0.19% (c)(d) | |||
| (Cost $2,236,703) | 2,236,703 | 2,236,703 | |
| TOTAL INVESTMENT PORTFOLIO - 101.3% | |||
| (Cost $97,784,442) | 118,917,960 | ||
| NET OTHER ASSETS (LIABILITIES) - (1.3)% | (1,525,251) | ||
| NET ASSETS - 100% | $117,392,709 |
Legend
(a) Non-income producing
(b) Security or a portion of the security is on loan at period end.
(c) Affiliated fund that is generally available only to investment companies and other accounts managed by Fidelity Investments. The rate quoted is the annualized seven-day yield of the fund at period end. A complete unaudited listing of the fund's holdings as of its most recent quarter end is available upon request. In addition, each Fidelity Central Fund's financial statements are available on the SEC's website or upon request.
(d) Investment made with cash collateral received from securities on loan.
Affiliated Central Funds
Information regarding fiscal year to date income earned by the Fund from investments in Fidelity Central Funds is as follows:
| Fund | Income earned |
| Fidelity Cash Central Fund | $285 |
| Fidelity Securities Lending Cash Central Fund | 15,150 |
| Total | $15,435 |
Investment Valuation
All investments are categorized as Level 1 under the Fair Value Hierarchy. The inputs or methodology used for valuing securities may not be an indication of the risk associated with investing in those securities. For more information on valuation inputs please refer to the Investment Valuation section in the accompanying Notes to Financial Statements.
See accompanying notes which are an integral part of the financial statements.
Consumer Finance Portfolio
Financial Statements
Statement of Assets and Liabilities
| August 31, 2015 (Unaudited) | ||
| Assets | ||
| Investment in securities, at value (including securities loaned of $2,190,565) — See accompanying schedule: Unaffiliated issuers (cost $95,547,739) | $116,681,257 | |
| Fidelity Central Funds (cost $2,236,703) | 2,236,703 | |
| Total Investments (cost $97,784,442) | $118,917,960 | |
| Receivable for investments sold | 1,568,673 | |
| Receivable for fund shares sold | 22,257 | |
| Dividends receivable | 81,597 | |
| Distributions receivable from Fidelity Central Funds | 1,295 | |
| Prepaid expenses | 940 | |
| Other receivables | 3,131 | |
| Total assets | 120,595,853 | |
| Liabilities | ||
| Payable to custodian bank | $767,448 | |
| Payable for fund shares redeemed | 94,064 | |
| Accrued management fee | 55,894 | |
| Other affiliated payables | 30,103 | |
| Other payables and accrued expenses | 18,932 | |
| Collateral on securities loaned, at value | 2,236,703 | |
| Total liabilities | 3,203,144 | |
| Net Assets | $117,392,709 | |
| Net Assets consist of: | ||
| Paid in capital | $107,092,111 | |
| Undistributed net investment income | 831,219 | |
| Accumulated undistributed net realized gain (loss) on investments and foreign currency transactions | (11,664,194) | |
| Net unrealized appreciation (depreciation) on investments and assets and liabilities in foreign currencies | 21,133,573 | |
| Net Assets, for 8,883,276 shares outstanding | $117,392,709 | |
| Net Asset Value, offering price and redemption price per share ($117,392,709 ÷ 8,883,276 shares) | $13.22 |
See accompanying notes which are an integral part of the financial statements.
Statement of Operations
| Six months ended August 31, 2015 (Unaudited) | ||
| Investment Income | ||
| Dividends | $1,396,861 | |
| Income from Fidelity Central Funds | 15,435 | |
| Total income | 1,412,296 | |
| Expenses | ||
| Management fee | $359,182 | |
| Transfer agent fees | 159,096 | |
| Accounting and security lending fees | 26,601 | |
| Custodian fees and expenses | 1,388 | |
| Independent trustees' compensation | 1,167 | |
| Registration fees | 13,892 | |
| Audit | 19,085 | |
| Legal | 1,102 | |
| Miscellaneous | 1,021 | |
| Total expenses before reductions | 582,534 | |
| Expense reductions | (7,982) | 574,552 |
| Net investment income (loss) | 837,744 | |
| Realized and Unrealized Gain (Loss)
Net realized gain (loss) on: | ||
| Investment securities: | ||
| Unaffiliated issuers | 6,098,398 | |
| Foreign currency transactions | (166) | |
| Total net realized gain (loss) | 6,098,232 | |
| Change in net unrealized appreciation (depreciation) on: Investment securities | (6,765,909) | |
| Assets and liabilities in foreign currencies | 55 | |
| Total change in net unrealized appreciation (depreciation) | (6,765,854) | |
| Net gain (loss) | (667,622) | |
| Net increase (decrease) in net assets resulting from operations | $170,122 |
See accompanying notes which are an integral part of the financial statements.
Statement of Changes in Net Assets
| Six months ended August 31, 2015 (Unaudited) | Year ended February 28, 2015 | |
| Increase (Decrease) in Net Assets | ||
| Operations | ||
| Net investment income (loss) | $837,744 | $2,397,831 |
| Net realized gain (loss) | 6,098,232 | 33,581,035 |
| Change in net unrealized appreciation (depreciation) | (6,765,854) | (24,753,049) |
| Net increase (decrease) in net assets resulting from operations | 170,122 | 11,225,817 |
| Distributions to shareholders from net investment income | (45,928) | (2,831,537) |
| Distributions to shareholders from net realized gain | (7,110,609) | (32,268,529) |
| Total distributions | (7,156,537) | (35,100,066) |
| Share transactions | ||
| Proceeds from sales of shares | 14,424,939 | 25,556,687 |
| Reinvestment of distributions | 6,936,435 | 34,016,855 |
| Cost of shares redeemed | (31,551,776) | (151,354,434) |
| Net increase (decrease) in net assets resulting from share transactions | (10,190,402) | (91,780,892) |
| Redemption fees | 836 | 2,139 |
| Total increase (decrease) in net assets | (17,175,981) | (115,653,002) |
| Net Assets | ||
| Beginning of period | 134,568,690 | 250,221,692 |
| End of period (including undistributed net investment income of $831,219 and undistributed net investment income of $39,403, respectively) | $117,392,709 | $134,568,690 |
| Other Information
Shares | ||
| Sold | 1,035,496 | 1,651,346 |
| Issued in reinvestment of distributions | 509,279 | 2,357,659 |
| Redeemed | (2,266,235) | (9,885,257) |
| Net increase (decrease) | (721,460) | (5,876,252) |
See accompanying notes which are an integral part of the financial statements.
Financial Highlights — Consumer Finance Portfolio
| Six months ended (Unaudited) | Years ended February 28, | |||||
| August 31, | 2015 | 2015 | 2014 | 2013 | 2012 A | 2011 |
| Selected Per–Share Data | ||||||
| Net asset value, beginning of period | $14.01 | $16.16 | $15.37 | $12.62 | $11.97 | $11.58 |
| Income from Investment Operations | ||||||
| Net investment income (loss)B | .09 | .22 | .34 | .28 | .22 | .19 |
| Net realized and unrealized gain (loss) | (.10)C | .95 | 3.18 | 2.72 | .64 | .48 |
| Total from investment operations | (.01) | 1.17 | 3.52 | 3.00 | .86 | .67 |
| Distributions from net investment income | (.01) | (.30) | (.40) | (.24) | (.20) | (.28) |
| Distributions from net realized gain | (.77) | (3.03) | (2.33) | (.01) | (.01) | – |
| Total distributions | (.78) | (3.32)D | (2.73) | (.25) | (.21) | (.28) |
| Redemption fees added to paid in capitalB,E | – | – | – | – | – | – |
| Net asset value, end of period | $13.22 | $14.01 | $16.16 | $15.37 | $12.62 | $11.97 |
| Total ReturnF,G | (.24)%C | 7.69% | 24.31% | 23.92% | 7.41% | 5.83% |
| Ratios to Average Net AssetsH,I | ||||||
| Expenses before reductions | .89%J | .88% | .85% | .89% | .95% | 1.01% |
| Expenses net of fee waivers, if any | .88%J | .88% | .85% | .89% | .95% | 1.01% |
| Expenses net of all reductions | .88%J | .88% | .83% | .86% | .94% | .98% |
| Net investment income (loss) | 1.28%J | 1.45% | 2.07% | 1.98% | 1.96% | 1.63% |
| Supplemental Data | ||||||
| Net assets, end of period (000 omitted) | $117,393 | $134,569 | $250,222 | $303,556 | $166,391 | $102,081 |
| Portfolio turnover rateK | 38%J | 71% | 89% | 79% | 113% | 161% |
A For the year ended February 29.
B Calculated based on average shares outstanding during the period.
C Net realized and unrealized gain (loss) per share reflects proceeds received from litigation which amounted to $.01 per share. Excluding these litigation proceeds, the total return would have been (.32) %.
D Total distributions of $3.32 per share is comprised of distributions from net investment income of $.296 and distributions from net realized gain of $3.026 per share.
E Amount represents less than $.005 per share.
F Total returns for periods of less than one year are not annualized.
G Total returns would have been lower if certain expenses had not been reduced during the applicable periods shown.
H Fees and expenses of any underlying Fidelity Central Funds are not included in the Fund's expense ratio. The Fund indirectly bears its proportionate share of the expenses of any underlying Fidelity Central Funds.
I Expense ratios reflect operating expenses of the Fund. Expenses before reductions do not reflect amounts reimbursed by the investment adviser or reductions from brokerage service arrangements or reductions from other expense offset arrangements and do not represent the amount paid by the Fund during periods when reimbursements or reductions occur. Expenses net of fee waivers reflect expenses after reimbursement by the investment adviser but prior to reductions from brokerage service arrangements or other expense offset arrangements. Expenses net of all reductions represent the net expenses paid by the Fund.
J Annualized
K Amount does not include the portfolio activity of any underlying Fidelity Central Funds.
See accompanying notes which are an integral part of the financial statements.
Financial Services Portfolio
Investment Summary (Unaudited)
Top Ten Stocks as of August 31, 2015
| % of fund's net assets | % of fund's net assets 6 months ago | |
| JPMorgan Chase & Co. | 5.6 | 5.1 |
| Bank of America Corp. | 5.6 | 4.4 |
| Citigroup, Inc. | 5.5 | 5.2 |
| Berkshire Hathaway, Inc. Class B | 4.9 | 4.7 |
| U.S. Bancorp | 4.1 | 4.2 |
| Wells Fargo & Co. | 3.7 | 3.3 |
| Capital One Financial Corp. | 3.6 | 3.7 |
| American Tower Corp. | 3.3 | 3.5 |
| ACE Ltd. | 2.7 | 0.0 |
| Allstate Corp. | 2.4 | 2.4 |
| 41.4 |
Top Industries (% of fund's net assets)
| As of August 31, 2015 | ||
| Banks | 32.0% | |
| Real Estate Investment Trusts | 13.9% | |
| Insurance | 12.4% | |
| Capital Markets | 10.9% | |
| Diversified Financial Services | 8.8% | |
| All Others* | 22.0% | |
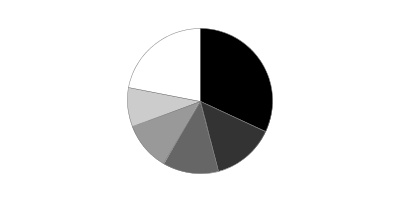
| As of February 28, 2015 | ||
| Banks | 28.0% | |
| Real Estate Investment Trusts | 13.1% | |
| Capital Markets | 12.2% | |
| Insurance | 11.5% | |
| Diversified Financial Services | 9.9% | |
| All Others* | 25.3% | |
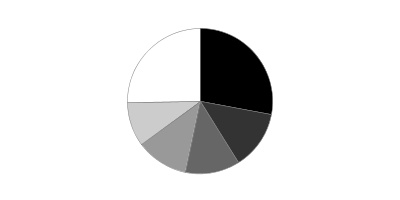
* Includes short-term investments and net other assets (liabilities).
Financial Services Portfolio
Investments August 31, 2015 (Unaudited)
Showing Percentage of Net Assets
| Common Stocks - 96.7% | |||
| Shares | Value | ||
| Banks - 32.0% | |||
| Diversified Banks - 25.3% | |||
| Bank of America Corp. | 4,485,817 | $73,298,250 | |
| Citigroup, Inc. | 1,364,480 | 72,972,390 | |
| Comerica, Inc. | 227,300 | 10,001,200 | |
| JPMorgan Chase & Co. | 1,156,710 | 74,145,109 | |
| U.S. Bancorp | 1,257,584 | 53,258,682 | |
| Wells Fargo & Co. | 922,201 | 49,180,979 | |
| 332,856,610 | |||
| Regional Banks - 6.7% | |||
| CIT Group, Inc. | 194,000 | 8,427,360 | |
| CoBiz, Inc. | 440,365 | 5,671,901 | |
| Fifth Third Bancorp | 767,128 | 15,281,190 | |
| Huntington Bancshares, Inc. | 767,100 | 8,369,061 | |
| Popular, Inc. (a) | 338,000 | 9,923,680 | |
| Prosperity Bancshares, Inc. | 170,500 | 8,809,735 | |
| Regions Financial Corp. | 1,136,500 | 10,899,035 | |
| SunTrust Banks, Inc. | 503,000 | 20,306,110 | |
| 87,688,072 | |||
| TOTAL BANKS | 420,544,682 | ||
| Capital Markets - 10.9% | |||
| Asset Management & Custody Banks - 7.0% | |||
| Affiliated Managers Group, Inc. (a) | 97,783 | 18,230,663 | |
| Artisan Partners Asset Management, Inc. | 387,600 | 15,841,212 | |
| Invesco Ltd. | 754,510 | 25,736,336 | |
| Oaktree Capital Group LLC Class A | 249,700 | 13,234,100 | |
| The Blackstone Group LP | 558,904 | 19,142,462 | |
| 92,184,773 | |||
| Investment Banking & Brokerage - 3.9% | |||
| E*TRADE Financial Corp. (a) | 698,644 | 18,367,351 | |
| Goldman Sachs Group, Inc. | 92,200 | 17,388,920 | |
| Raymond James Financial, Inc. | 283,961 | 15,047,093 | |
| 50,803,364 | |||
| TOTAL CAPITAL MARKETS | 142,988,137 | ||
| Consumer Finance - 5.8% | |||
| Consumer Finance - 5.8% | |||
| American Express Co. | 69,800 | 5,355,056 | |
| Capital One Financial Corp. | 614,816 | 47,801,944 | |
| Navient Corp. | 510,259 | 6,526,213 | |
| Springleaf Holdings, Inc. (a) | 363,313 | 16,261,890 | |
| 75,945,103 | |||
| Diversified Consumer Services - 1.4% | |||
| Specialized Consumer Services - 1.4% | |||
| H&R Block, Inc. | 558,872 | 19,012,825 | |
| Diversified Financial Services - 8.8% | |||
| Multi-Sector Holdings - 4.9% | |||
| Berkshire Hathaway, Inc. Class B (a) | 475,090 | 63,681,064 | |
| Specialized Finance - 3.9% | |||
| Element Financial Corp. (a) | 249,600 | 3,570,593 | |
| Element Financial Corp. rights | 341,000 | 4,883,278 | |
| IntercontinentalExchange Group, Inc. | 134,147 | 30,640,516 | |
| McGraw Hill Financial, Inc. | 127,876 | 12,402,693 | |
| 51,497,080 | |||
| TOTAL DIVERSIFIED FINANCIAL SERVICES | 115,178,144 | ||
| Health Care Providers & Services - 0.9% | |||
| Health Care Facilities - 0.9% | |||
| Brookdale Senior Living, Inc. (a) | 454,600 | 12,465,132 | |
| Insurance - 12.4% | |||
| Insurance Brokers - 3.5% | |||
| Arthur J. Gallagher & Co. | 269,900 | 11,800,028 | |
| Brown & Brown, Inc. | 586,900 | 18,816,014 | |
| Marsh & McLennan Companies, Inc. | 284,164 | 15,268,132 | |
| 45,884,174 | |||
| Life & Health Insurance - 1.8% | |||
| Torchmark Corp. | 419,200 | 24,506,432 | |
| Property & Casualty Insurance - 7.1% | |||
| ACE Ltd. | 349,300 | 35,684,488 | |
| Allstate Corp. | 531,000 | 30,946,680 | |
| FNF Group | 574,700 | 20,924,827 | |
| The Chubb Corp. | 48,300 | 5,835,123 | |
| 93,391,118 | |||
| TOTAL INSURANCE | 163,781,724 | ||
| IT Services - 4.8% | |||
| Data Processing & Outsourced Services - 4.8% | |||
| EVERTEC, Inc. | 389,370 | 7,047,597 | |
| MasterCard, Inc. Class A | 97,700 | 9,024,549 | |
| PayPal Holdings, Inc. (a) | 284,000 | 9,940,000 | |
| The Western Union Co. | 721,072 | 13,296,568 | |
| Visa, Inc. Class A | 335,400 | 23,914,020 | |
| 63,222,734 | |||
| Real Estate Investment Trusts - 13.9% | |||
| Diversified REITs - 1.2% | |||
| NorthStar Realty Finance Corp. | 1,117,800 | 15,705,090 | |
| Health Care REIT's - 1.1% | |||
| Ventas, Inc. | 251,000 | 13,810,020 | |
| Mortgage REITs - 2.8% | |||
| Altisource Residential Corp. Class B | 795,600 | 12,148,812 | |
| Redwood Trust, Inc. (b) | 993,786 | 14,499,338 | |
| Two Harbors Investment Corp. | 1,136,500 | 10,751,290 | |
| 37,399,440 | |||
| Office REITs - 1.2% | |||
| Boston Properties, Inc. | 139,700 | 15,839,186 | |
| Residential REITs - 1.5% | |||
| Essex Property Trust, Inc. | 56,800 | 12,190,416 | |
| UDR, Inc. | 227,300 | 7,341,790 | |
| 19,532,206 | |||
| Specialized REITs - 6.1% | |||
| American Tower Corp. | 475,072 | 43,796,888 | |
| Outfront Media, Inc. | 710,329 | 16,074,745 | |
| Public Storage | 100,650 | 20,257,826 | |
| 80,129,459 | |||
| TOTAL REAL ESTATE INVESTMENT TRUSTS | 182,415,401 | ||
| Real Estate Management & Development - 3.9% | |||
| Real Estate Services - 3.9% | |||
| CBRE Group, Inc. (a) | 838,431 | 26,846,561 | |
| Realogy Holdings Corp. (a) | 614,800 | 24,776,440 | |
| 51,623,001 | |||
| Thrifts & Mortgage Finance - 0.6% | |||
| Thrifts & Mortgage Finance - 0.6% | |||
| MGIC Investment Corp. (a) | 468,300 | 4,945,248 | |
| Radian Group, Inc. | 198,200 | 3,563,636 | |
| 8,508,884 | |||
| Trading Companies & Distributors - 1.3% | |||
| Trading Companies & Distributors - 1.3% | |||
| AerCap Holdings NV (a) | 405,200 | 17,034,608 | |
| TOTAL COMMON STOCKS | |||
| (Cost $1,176,264,201) | 1,272,720,375 | ||
| Money Market Funds - 3.4% | |||
| Fidelity Cash Central Fund, 0.15% (c) | 39,447,390 | 39,447,390 | |
| Fidelity Securities Lending Cash Central Fund, 0.19% (c)(d) | 4,926,200 | 4,926,200 | |
| TOTAL MONEY MARKET FUNDS | |||
| (Cost $44,373,590) | 44,373,590 | ||
| TOTAL INVESTMENT PORTFOLIO - 100.1% | |||
| (Cost $1,220,637,791) | 1,317,093,965 | ||
| NET OTHER ASSETS (LIABILITIES) - (0.1)% | (1,145,224) | ||
| NET ASSETS - 100% | $1,315,948,741 |
Legend
(a) Non-income producing
(b) Security or a portion of the security is on loan at period end.
(c) Affiliated fund that is generally available only to investment companies and other accounts managed by Fidelity Investments. The rate quoted is the annualized seven-day yield of the fund at period end. A complete unaudited listing of the fund's holdings as of its most recent quarter end is available upon request. In addition, each Fidelity Central Fund's financial statements are available on the SEC's website or upon request.
(d) Investment made with cash collateral received from securities on loan.
Affiliated Central Funds
Information regarding fiscal year to date income earned by the Fund from investments in Fidelity Central Funds is as follows:
| Fund | Income earned |
| Fidelity Cash Central Fund | $38,381 |
| Fidelity Securities Lending Cash Central Fund | 29,917 |
| Total | $68,298 |
Investment Valuation
All investments are categorized as Level 1 under the Fair Value Hierarchy. The inputs or methodology used for valuing securities may not be an indication of the risk associated with investing in those securities. For more information on valuation inputs please refer to the Investment Valuation section in the accompanying Notes to Financial Statements.
See accompanying notes which are an integral part of the financial statements.
Financial Services Portfolio
Financial Statements
Statement of Assets and Liabilities
| August 31, 2015 (Unaudited) | ||
| Assets | ||
| Investment in securities, at value (including securities loaned of $4,763,696) — See accompanying schedule: Unaffiliated issuers (cost $1,176,264,201) | $1,272,720,375 | |
| Fidelity Central Funds (cost $44,373,590) | 44,373,590 | |
| Total Investments (cost $1,220,637,791) | $1,317,093,965 | |
| Receivable for investments sold | 7,243,484 | |
| Receivable for fund shares sold | 304,416 | |
| Dividends receivable | 1,070,286 | |
| Distributions receivable from Fidelity Central Funds | 8,189 | |
| Prepaid expenses | 10,661 | |
| Other receivables | 25,592 | |
| Total assets | 1,325,756,593 | |
| Liabilities | ||
| Payable for investments purchased | $3,500,551 | |
| Payable for fund shares redeemed | 481,330 | |
| Accrued management fee | 632,231 | |
| Other affiliated payables | 234,201 | |
| Other payables and accrued expenses | 33,339 | |
| Collateral on securities loaned, at value | 4,926,200 | |
| Total liabilities | 9,807,852 | |
| Net Assets | $1,315,948,741 | |
| Net Assets consist of: | ||
| Paid in capital | $1,205,404,491 | |
| Undistributed net investment income | 5,856,446 | |
| Accumulated undistributed net realized gain (loss) on investments and foreign currency transactions | 8,231,883 | |
| Net unrealized appreciation (depreciation) on investments and assets and liabilities in foreign currencies | 96,455,921 | |
| Net Assets, for 15,590,092 shares outstanding | $1,315,948,741 | |
| Net Asset Value, offering price and redemption price per share ($1,315,948,741 ÷ 15,590,092 shares) | $84.41 |
See accompanying notes which are an integral part of the financial statements.
Statement of Operations
| Six months ended August 31, 2015 (Unaudited) | ||
| Investment Income | ||
| Dividends | $12,561,971 | |
| Income from Fidelity Central Funds | 68,298 | |
| Total income | 12,630,269 | |
| Expenses | ||
| Management fee | $3,868,855 | |
| Transfer agent fees | 1,187,197 | |
| Accounting and security lending fees | 223,893 | |
| Custodian fees and expenses | 8,096 | |
| Independent trustees' compensation | 11,957 | |
| Registration fees | 49,919 | |
| Audit | 24,908 | |
| Legal | 9,286 | |
| Miscellaneous | 8,020 | |
| Total expenses before reductions | 5,392,131 | |
| Expense reductions | (67,237) | 5,324,894 |
| Net investment income (loss) | 7,305,375 | |
| Realized and Unrealized Gain (Loss)
Net realized gain (loss) on: | ||
| Investment securities: | ||
| Unaffiliated issuers | 13,861,720 | |
| Foreign currency transactions | 51,622 | |
| Total net realized gain (loss) | 13,913,342 | |
| Change in net unrealized appreciation (depreciation) on: Investment securities | (90,644,821) | |
| Assets and liabilities in foreign currencies | 455 | |
| Total change in net unrealized appreciation (depreciation) | (90,644,366) | |
| Net gain (loss) | (76,731,024) | |
| Net increase (decrease) in net assets resulting from operations | $(69,425,649) |
See accompanying notes which are an integral part of the financial statements.
Statement of Changes in Net Assets
| Six months ended August 31, 2015 (Unaudited) | Year ended February 28, 2015 | |
| Increase (Decrease) in Net Assets | ||
| Operations | ||
| Net investment income (loss) | $7,305,375 | $11,683,837 |
| Net realized gain (loss) | 13,913,342 | 23,337,403 |
| Change in net unrealized appreciation (depreciation) | (90,644,366) | 97,277,423 |
| Net increase (decrease) in net assets resulting from operations | (69,425,649) | 132,298,663 |
| Distributions to shareholders from net investment income | – | (13,087,799) |
| Distributions to shareholders from net realized gain | – | (11,512,848) |
| Total distributions | – | (24,600,647) |
| Share transactions | ||
| Proceeds from sales of shares | 83,313,423 | 1,131,831,200 |
| Reinvestment of distributions | – | 24,263,067 |
| Cost of shares redeemed | (83,433,602) | (657,834,771) |
| Net increase (decrease) in net assets resulting from share transactions | (120,179) | 498,259,496 |
| Redemption fees | 5,012 | 7,756 |
| Total increase (decrease) in net assets | (69,540,816) | 605,965,268 |
| Net Assets | ||
| Beginning of period | 1,385,489,557 | 779,524,289 |
| End of period (including undistributed net investment income of $5,856,446 and distributions in excess of net investment income of $1,448,929, respectively) | $1,315,948,741 | $1,385,489,557 |
| Other Information
Shares | ||
| Sold | 927,090 | 13,593,841 |
| Issued in reinvestment of distributions | – | 273,356 |
| Redeemed | (932,889) | (7,906,401) |
| Net increase (decrease) | (5,799) | 5,960,796 |
See accompanying notes which are an integral part of the financial statements.
Financial Highlights — Financial Services Portfolio
| Six months ended (Unaudited) | Years ended February 28, | |||||
| August 31, | 2015 | 2015 | 2014 | 2013 | 2012 A | 2011 |
| Selected Per–Share Data | ||||||
| Net asset value, beginning of period | $88.84 | $80.90 | $65.56 | $57.57 | $62.81 | $59.32 |
| Income from Investment Operations | ||||||
| Net investment income (loss)B | .47 | .84 | 1.06 | .99 | .21 | .17 |
| Net realized and unrealized gain (loss) | (4.90) | 8.75 | 15.03 | 7.75 | (5.31) | 3.49 |
| Total from investment operations | (4.43) | 9.59 | 16.09 | 8.74 | (5.10) | 3.66 |
| Distributions from net investment income | – | (.89) | (.75) | (.75) | (.14) | (.18) |
| Distributions from net realized gain | – | (.76) | – | – | – | – |
| Total distributions | – | (1.65) | (.75) | (.75) | (.14) | (.18) |
| Redemption fees added to paid in capitalB | –C | –C | –C | –C | –C | .01 |
| Net asset value, end of period | $84.41 | $88.84 | $80.90 | $65.56 | $57.57 | $62.81 |
| Total ReturnD,E | (4.99)% | 11.87% | 24.56% | 15.26% | (8.07)% | 6.21% |
| Ratios to Average Net AssetsF,G | ||||||
| Expenses before reductions | .76%H | .78% | .83% | .87% | .90% | .92% |
| Expenses net of fee waivers, if any | .76%H | .78% | .83% | .87% | .90% | .92% |
| Expenses net of all reductions | .75%H | .78% | .81% | .78% | .84% | .88% |
| Net investment income (loss) | 1.04%H | .99% | 1.43% | 1.66% | .39% | .28% |
| Supplemental Data | ||||||
| Net assets, end of period (000 omitted) | $1,315,949 | $1,385,490 | $779,524 | $616,059 | $439,012 | $512,227 |
| Portfolio turnover rateI | 48%H | 42%J | 197% | 271% | 384% | 242% |
A For the year ended February 29.
B Calculated based on average shares outstanding during the period.
C Amount represents less than $.005 per share.
D Total returns for periods of less than one year are not annualized.
E Total returns would have been lower if certain expenses had not been reduced during the applicable periods shown.
F Fees and expenses of any underlying Fidelity Central Funds are not included in the Fund's expense ratio. The Fund indirectly bears its proportionate share of the expenses of any underlying Fidelity Central Funds.
G Expense ratios reflect operating expenses of the Fund. Expenses before reductions do not reflect amounts reimbursed by the investment adviser or reductions from brokerage service arrangements or reductions from other expense offset arrangements and do not represent the amount paid by the Fund during periods when reimbursements or reductions occur. Expenses net of fee waivers reflect expenses after reimbursement by the investment adviser but prior to reductions from brokerage service arrangements or other expense offset arrangements. Expenses net of all reductions represent the net expenses paid by the Fund.
H Annualized
I Amount does not include the portfolio activity of any underlying Fidelity Central Funds.
J Portfolio turnover rate excludes securities received or delivered in-kind.
See accompanying notes which are an integral part of the financial statements.
Insurance Portfolio
Investment Summary (Unaudited)
Top Ten Stocks as of August 31, 2015
| % of fund's net assets | % of fund's net assets 6 months ago | |
| American International Group, Inc. | 12.1 | 11.4 |
| MetLife, Inc. | 8.0 | 8.2 |
| ACE Ltd. | 6.5 | 7.3 |
| Prudential Financial, Inc. | 5.5 | 4.8 |
| AFLAC, Inc. | 5.1 | 4.7 |
| Marsh & McLennan Companies, Inc. | 5.0 | 5.4 |
| The Travelers Companies, Inc. | 4.8 | 5.3 |
| The Chubb Corp. | 4.6 | 5.6 |
| Allstate Corp. | 4.2 | 5.1 |
| Principal Financial Group, Inc. | 2.9 | 3.1 |
| 58.7 |
Top Industries (% of fund's net assets)
| As of August 31, 2015 | ||
| Insurance | 92.8% | |
| Diversified Financial Services | 2.1% | |
| Thrifts & Mortgage Finance | 0.7% | |
| Capital Markets | 0.4% | |
| All Others* | 4.0% | |

| As of February 28, 2015 | ||
| Insurance | 96.2% | |
| Diversified Financial Services | 1.5% | |
| Capital Markets | 0.6% | |
| All Others* | 1.7% | |

* Includes short-term investments and net other assets (liabilities).
Insurance Portfolio
Investments August 31, 2015 (Unaudited)
Showing Percentage of Net Assets
| Common Stocks - 96.0% | |||
| Shares | Value | ||
| Banks - 0.0% | |||
| Regional Banks - 0.0% | |||
| Hilltop Holdings, Inc. (a) | 500 | $10,325 | |
| Capital Markets - 0.4% | |||
| Asset Management & Custody Banks - 0.4% | |||
| Ares Management LP | 124,550 | 2,148,488 | |
| Diversified Financial Services - 2.1% | |||
| Multi-Sector Holdings - 2.1% | |||
| Berkshire Hathaway, Inc. Class B (a) | 71,400 | 9,570,456 | |
| Insurance - 92.8% | |||
| Insurance Brokers - 12.3% | |||
| Aon PLC | 129,700 | 12,119,168 | |
| Arthur J. Gallagher & Co. | 180,000 | 7,869,600 | |
| Brown & Brown, Inc. | 309,500 | 9,922,570 | |
| Marsh & McLennan Companies, Inc. | 421,800 | 22,663,314 | |
| Willis Group Holdings PLC | 88,300 | 3,804,847 | |
| 56,379,499 | |||
| Life & Health Insurance - 27.5% | |||
| AFLAC, Inc. | 400,400 | 23,463,440 | |
| CNO Financial Group, Inc. | 375,100 | 6,710,539 | |
| FBL Financial Group, Inc. Class A | 300 | 17,112 | |
| Lincoln National Corp. | 3,600 | 182,844 | |
| MetLife, Inc. | 734,875 | 36,817,238 | |
| Primerica, Inc. | 49,400 | 2,099,006 | |
| Principal Financial Group, Inc. | 263,600 | 13,272,260 | |
| Prudential Financial, Inc. | 309,289 | 24,959,622 | |
| StanCorp Financial Group, Inc. | 34,400 | 3,911,624 | |
| Symetra Financial Corp. | 35,100 | 1,104,597 | |
| Torchmark Corp. | 119,500 | 6,985,970 | |
| Unum Group | 190,564 | 6,391,517 | |
| 125,915,769 | |||
| Multi-Line Insurance - 18.3% | |||
| American International Group, Inc. | 916,500 | 55,301,608 | |
| Assurant, Inc. | 52,600 | 3,910,810 | |
| Genworth Financial, Inc. Class A (a) | 674,300 | 3,492,874 | |
| Hartford Financial Services Group, Inc. | 252,500 | 11,602,375 | |
| HCC Insurance Holdings, Inc. | 62,600 | 4,837,102 | |
| Loews Corp. | 98,800 | 3,601,260 | |
| Zurich Insurance Group AG | 3,737 | 1,027,177 | |
| 83,773,206 | |||
| Property & Casualty Insurance - 31.6% | |||
| ACE Ltd. | 291,149 | 29,743,782 | |
| Allied World Assur Co. Holdings AG | 135,000 | 5,391,900 | |
| Allstate Corp. | 328,900 | 19,168,292 | |
| AmTrust Financial Services, Inc. (b) | 32,400 | 1,884,060 | |
| Arch Capital Group Ltd. (a) | 10,300 | 703,284 | |
| Argo Group International Holdings, Ltd. | 19,910 | 1,114,562 | |
| Assured Guaranty Ltd. | 116,100 | 2,932,686 | |
| Axis Capital Holdings Ltd. | 16,700 | 935,200 | |
| Beazley PLC | 188,896 | 970,164 | |
| Employers Holdings, Inc. | 800 | 17,640 | |
| esure Group PLC | 174,900 | 661,030 | |
| First American Financial Corp. | 70,500 | 2,739,630 | |
| FNF Group | 66,200 | 2,410,342 | |
| FNFV Group (a) | 21,299 | 308,197 | |
| Hanover Insurance Group, Inc. | 45,800 | 3,613,620 | |
| Hiscox Ltd. | 140,220 | 1,936,508 | |
| Markel Corp. (a) | 8,700 | 7,166,625 | |
| MBIA, Inc. (a) | 96,000 | 673,920 | |
| Mercury General Corp. | 200 | 10,172 | |
| ProAssurance Corp. | 68,900 | 3,323,047 | |
| Progressive Corp. | 192,900 | 5,779,284 | |
| Selective Insurance Group, Inc. | 23,900 | 724,648 | |
| The Chubb Corp. | 175,058 | 21,148,757 | |
| The Travelers Companies, Inc. | 218,500 | 21,751,675 | |
| W.R. Berkley Corp. | 25,000 | 1,357,000 | |
| White Mountains Insurance Group Ltd. | 1,600 | 1,150,896 | |
| XL Group PLC Class A | 180,300 | 6,723,387 | |
| 144,340,308 | |||
| Reinsurance - 3.1% | |||
| Alleghany Corp. (a) | 3,025 | 1,421,115 | |
| Everest Re Group Ltd. | 3,200 | 562,592 | |
| Maiden Holdings Ltd. | 700 | 10,031 | |
| Muenchener Rueckversicherungs AG | 8,400 | 1,543,989 | |
| PartnerRe Ltd. | 15,700 | 2,173,037 | |
| Reinsurance Group of America, Inc. | 77,333 | 7,028,023 | |
| Validus Holdings Ltd. | 34,300 | 1,518,804 | |
| 14,257,591 | |||
| TOTAL INSURANCE | 424,666,373 | ||
| Thrifts & Mortgage Finance - 0.7% | |||
| Thrifts & Mortgage Finance - 0.7% | |||
| Hudson City Bancorp, Inc. | 355,900 | 3,309,870 | |
| TOTAL COMMON STOCKS | |||
| (Cost $346,248,960) | 439,705,512 | ||
| Money Market Funds - 4.4% | |||
| Fidelity Cash Central Fund, 0.15% (c) | 18,102,404 | 18,102,404 | |
| Fidelity Securities Lending Cash Central Fund, 0.19% (c)(d) | 1,929,925 | 1,929,925 | |
| TOTAL MONEY MARKET FUNDS | |||
| (Cost $20,032,329) | 20,032,329 | ||
| TOTAL INVESTMENT PORTFOLIO - 100.4% | |||
| (Cost $366,281,289) | 459,737,841 | ||
| NET OTHER ASSETS (LIABILITIES) - (0.4)% | (2,049,127) | ||
| NET ASSETS - 100% | $457,688,714 |
Legend
(a) Non-income producing
(b) Security or a portion of the security is on loan at period end.
(c) Affiliated fund that is generally available only to investment companies and other accounts managed by Fidelity Investments. The rate quoted is the annualized seven-day yield of the fund at period end. A complete unaudited listing of the fund's holdings as of its most recent quarter end is available upon request. In addition, each Fidelity Central Fund's financial statements are available on the SEC's website or upon request.
(d) Investment made with cash collateral received from securities on loan.
Affiliated Central Funds
Information regarding fiscal year to date income earned by the Fund from investments in Fidelity Central Funds is as follows:
| Fund | Income earned |
| Fidelity Cash Central Fund | $8,935 |
| Fidelity Securities Lending Cash Central Fund | 11,653 |
| Total | $20,588 |
Investment Valuation
All investments are categorized as Level 1 under the Fair Value Hierarchy. The inputs or methodology used for valuing securities may not be an indication of the risk associated with investing in those securities. For more information on valuation inputs please refer to the Investment Valuation section in the accompanying Notes to Financial Statements.
Other Information
Distribution of investments by country or territory of incorporation, as a percentage of Total Net Assets, is as follows (Unaudited):
| United States of America | 83.7% |
| Switzerland | 7.9% |
| Bermuda | 2.8% |
| United Kingdom | 2.7% |
| Ireland | 2.3% |
| Others (Individually Less Than 1%) | 0.6% |
| 100.0% |
See accompanying notes which are an integral part of the financial statements.
Insurance Portfolio
Financial Statements
Statement of Assets and Liabilities
| August 31, 2015 (Unaudited) | ||
| Assets | ||
| Investment in securities, at value (including securities loaned of $1,878,245) — See accompanying schedule: Unaffiliated issuers (cost $346,248,960) | $439,705,512 | |
| Fidelity Central Funds (cost $20,032,329) | 20,032,329 | |
| Total Investments (cost $366,281,289) | $459,737,841 | |
| Receivable for investments sold | 3,270,472 | |
| Receivable for fund shares sold | 264,867 | |
| Dividends receivable | 869,852 | |
| Distributions receivable from Fidelity Central Funds | 4,297 | |
| Prepaid expenses | 3,206 | |
| Other receivables | 2,775 | |
| Total assets | 464,153,310 | |
| Liabilities | ||
| Payable for investments purchased | $3,189,266 | |
| Payable for fund shares redeemed | 1,024,869 | |
| Accrued management fee | 215,130 | |
| Other affiliated payables | 83,421 | |
| Other payables and accrued expenses | 21,985 | |
| Collateral on securities loaned, at value | 1,929,925 | |
| Total liabilities | 6,464,596 | |
| Net Assets | $457,688,714 | |
| Net Assets consist of: | ||
| Paid in capital | $357,220,278 | |
| Undistributed net investment income | 2,680,616 | |
| Accumulated undistributed net realized gain (loss) on investments and foreign currency transactions | 4,331,562 | |
| Net unrealized appreciation (depreciation) on investments and assets and liabilities in foreign currencies | 93,456,258 | |
| Net Assets, for 6,821,053 shares outstanding | $457,688,714 | |
| Net Asset Value, offering price and redemption price per share ($457,688,714 ÷ 6,821,053 shares) | $67.10 |
See accompanying notes which are an integral part of the financial statements.
Statement of Operations
| Six months ended August 31, 2015 (Unaudited) | ||
| Investment Income | ||
| Dividends | $4,322,215 | |
| Income from Fidelity Central Funds | 20,588 | |
| Total income | 4,342,803 | |
| Expenses | ||
| Management fee | $1,148,070 | |
| Transfer agent fees | 390,194 | |
| Accounting and security lending fees | 81,695 | |
| Custodian fees and expenses | 4,103 | |
| Independent trustees' compensation | 3,449 | |
| Registration fees | 27,577 | |
| Audit | 18,274 | |
| Legal | 2,603 | |
| Miscellaneous | 2,447 | |
| Total expenses before reductions | 1,678,412 | |
| Expense reductions | (18,946) | 1,659,466 |
| Net investment income (loss) | 2,683,337 | |
| Realized and Unrealized Gain (Loss)
Net realized gain (loss) on: | ||
| Investment securities: | ||
| Unaffiliated issuers | 5,848,980 | |
| Foreign currency transactions | (3,580) | |
| Total net realized gain (loss) | 5,845,400 | |
| Change in net unrealized appreciation (depreciation) on: Investment securities | (7,238,792) | |
| Assets and liabilities in foreign currencies | 154 | |
| Total change in net unrealized appreciation (depreciation) | (7,238,638) | |
| Net gain (loss) | (1,393,238) | |
| Net increase (decrease) in net assets resulting from operations | $1,290,099 |
See accompanying notes which are an integral part of the financial statements.
Statement of Changes in Net Assets
| Six months ended August 31, 2015 (Unaudited) | Year ended February 28, 2015 | |
| Increase (Decrease) in Net Assets | ||
| Operations | ||
| Net investment income (loss) | $2,683,337 | $5,759,496 |
| Net realized gain (loss) | 5,845,400 | 22,107,850 |
| Change in net unrealized appreciation (depreciation) | (7,238,638) | 21,060,837 |
| Net increase (decrease) in net assets resulting from operations | 1,290,099 | 48,928,183 |
| Distributions to shareholders from net investment income | (649,301) | (5,518,736) |
| Distributions to shareholders from net realized gain | (2,906,964) | (37,396,850) |
| Total distributions | (3,556,265) | (42,915,586) |
| Share transactions | ||
| Proceeds from sales of shares | 101,176,092 | 86,312,878 |
| Reinvestment of distributions | 3,454,223 | 41,742,628 |
| Cost of shares redeemed | (46,496,690) | (162,737,537) |
| Net increase (decrease) in net assets resulting from share transactions | 58,133,625 | (34,682,031) |
| Redemption fees | 3,054 | 5,876 |
| Total increase (decrease) in net assets | 55,870,513 | (28,663,558) |
| Net Assets | ||
| Beginning of period | 401,818,201 | 430,481,759 |
| End of period (including undistributed net investment income of $2,680,616 and undistributed net investment income of $646,580, respectively) | $457,688,714 | $401,818,201 |
| Other Information
Shares | ||
| Sold | 1,444,136 | 1,299,698 |
| Issued in reinvestment of distributions | 51,425 | 650,226 |
| Redeemed | (683,450) | (2,455,227) |
| Net increase (decrease) | 812,111 | (505,303) |
See accompanying notes which are an integral part of the financial statements.
Financial Highlights — Insurance Portfolio
| Six months ended (Unaudited) | Years ended February 28, | |||||
| August 31, | 2015 | 2015 | 2014 | 2013 | 2012 A | 2011 |
| Selected Per–Share Data | ||||||
| Net asset value, beginning of period | $66.87 | $66.08 | $56.81 | $47.56 | $50.04 | $41.55 |
| Income from Investment Operations | ||||||
| Net investment income (loss)B | .44 | .96 | .75 | .68 | .43 | .47 |
| Net realized and unrealized gain (loss) | .39 | 7.13 | 13.75 | 10.06 | (2.52) | 8.36 |
| Total from investment operations | .83 | 8.09 | 14.50 | 10.74 | (2.09) | 8.83 |
| Distributions from net investment income | (.11) | (.96) | (.61) | (.52) | (.39) | (.34) |
| Distributions from net realized gain | (.49) | (6.34) | (4.62) | (.97) | – | – |
| Total distributions | (.60) | (7.30) | (5.23) | (1.49) | (.39) | (.34) |
| Redemption fees added to paid in capitalB,C | – | – | – | – | – | – |
| Net asset value, end of period | $67.10 | $66.87 | $66.08 | $56.81 | $47.56 | $50.04 |
| Total ReturnD,E | 1.24% | 13.01% | 25.82% | 22.91% | (4.13)% | 21.31% |
| Ratios to Average Net AssetsF,G | ||||||
| Expenses before reductions | .80%H | .81% | .83% | .87% | .89% | .93% |
| Expenses net of fee waivers, if any | .80%H | .81% | .83% | .87% | .89% | .93% |
| Expenses net of all reductions | .79%H | .81% | .82% | .85% | .88% | .91% |
| Net investment income (loss) | 1.28%H | 1.44% | 1.17% | 1.35% | .94% | 1.05% |
| Supplemental Data | ||||||
| Net assets, end of period (000 omitted) | $457,689 | $401,818 | $430,482 | $307,071 | $270,776 | $248,055 |
| Portfolio turnover rateI | 24%H | 26% | 126% | 157% | 153% | 193% |
A For the year ended February 29.
B Calculated based on average shares outstanding during the period.
C Amount represents less than $.005 per share.
D Total returns for periods of less than one year are not annualized.
E Total returns would have been lower if certain expenses had not been reduced during the applicable periods shown.
F Fees and expenses of any underlying Fidelity Central Funds are not included in the Fund's expense ratio. The Fund indirectly bears its proportionate share of the expenses of any underlying Fidelity Central Funds.
G Expense ratios reflect operating expenses of the Fund. Expenses before reductions do not reflect amounts reimbursed by the investment adviser or reductions from brokerage service arrangements or reductions from other expense offset arrangements and do not represent the amount paid by the Fund during periods when reimbursements or reductions occur. Expenses net of fee waivers reflect expenses after reimbursement by the investment adviser but prior to reductions from brokerage service arrangements or other expense offset arrangements. Expenses net of all reductions represent the net expenses paid by the Fund.
H Annualized
I Amount does not include the portfolio activity of any underlying Fidelity Central Funds.
See accompanying notes which are an integral part of the financial statements.
Notes to Financial Statements (Unaudited)
For the period ended August 31, 2015
1. Organization.
Banking Portfolio, Brokerage and Investment Management Portfolio, Consumer Finance Portfolio, Financial Services Portfolio, and Insurance Portfolio (the Funds) are funds of Fidelity Select Portfolios (the Trust). The Trust is registered under the Investment Company Act of 1940, as amended (the 1940 Act), as an open-end management investment company organized as a Massachusetts business trust. The Funds are non-diversified with the exception of Financial Services Portfolio and Banking Portfolio. The Funds invest primarily in securities of companies whose principal business activities fall within specific industries. Each Fund is authorized to issue an unlimited number of shares. Share transactions on the Statement of Changes in Net Assets may contain exchanges between funds.
2. Investments in Fidelity Central Funds.
The Funds invest in Fidelity Central Funds, which are open-end investment companies generally available only to other investment companies and accounts managed by the investment adviser and its affiliates. The Funds' Schedules of Investments list each of the Fidelity Central Funds held as of period end, if any, as an investment of each Fund, but do not include the underlying holdings of each Fidelity Central Fund. As an Investing Fund, each Fund indirectly bears its proportionate share of the expenses of the underlying Fidelity Central Funds.
The Money Market Central Funds seek preservation of capital and current income and are managed by Fidelity Investments Money Management, Inc. (FIMM), an affiliate of the investment adviser. Annualized expenses of the Money Market Central Funds as of their most recent shareholder report date are less than .01%.
A complete unaudited list of holdings for each Fidelity Central Fund is available upon request or at the Securities and Exchange Commission (the SEC) website at www.sec.gov. In addition, the financial statements of the Fidelity Central Funds are available on the SEC website or upon request.
3. Significant Accounting Policies.
The financial statements have been prepared in conformity with accounting principles generally accepted in the United States of America (GAAP), which require management to make certain estimates and assumptions at the date of the financial statements. Actual results could differ from those estimates. Subsequent events, if any, through the date that the financial statements were issued have been evaluated in the preparation of the financial statements. The following summarizes the significant accounting policies of the Funds:
Investment Valuation. Investments are valued as of 4:00 p.m. Eastern time on the last calendar day of the period. The Board of Trustees (the Board) has delegated the day to day responsibility for the valuation of each Fund's investments to the Fidelity SelectCo, LLC (SelectCo) Fair Value Committee (the Committee). In accordance with valuation policies and procedures approved by the Board, each Fund attempts to obtain prices from one or more third party pricing vendors or brokers to value its investments. When current market prices, quotations or currency exchange rates are not readily available or reliable, investments will be fair valued in good faith by the Committee, in accordance with procedures adopted by the Board. Factors used in determining fair value vary by investment type and may include market or investment specific events. The frequency with which these procedures are used cannot be predicted and they may be utilized to a significant extent. The Committee oversees each Fund's valuation policies and procedures and reports to the Board on the Committee's activities and fair value determinations. The Board monitors the appropriateness of the procedures used in valuing each Fund's investments and ratifies the fair value determinations of the Committee.
Each Fund categorizes the inputs to valuation techniques used to value its investments into a disclosure hierarchy consisting of three levels as shown below:
- Level 1 – quoted prices in active markets for identical investments
- Level 2 – other significant observable inputs (including quoted prices for similar investments, interest rates, prepayment speeds, etc.)
- Level 3 – unobservable inputs (including the Fund's own assumptions based on the best information available)
Valuation techniques used to value each Fund's investments by major category are as follows:
Equity securities, including restricted securities, for which market quotations are readily available, are valued at the last reported sale price or official closing price as reported by a third party pricing vendor on the primary market or exchange on which they are traded and are categorized as Level 1 in the hierarchy. In the event there were no sales during the day or closing prices are not available, securities are valued at the last quoted bid price or may be valued using the last available price and are generally categorized as Level 2 in the hierarchy. For foreign equity securities, when market or security specific events arise, comparisons to the valuation of American Depositary Receipts (ADRs), futures contracts, Exchange-Traded Funds (ETFs) and certain indexes as well as quoted prices for similar securities may be used and would be categorized as Level 2 in the hierarchy. Utilizing these techniques may result in transfers between Level 1 and Level 2. For equity securities, including restricted securities, where observable inputs are limited, assumptions about market activity and risk are used and these securities may be categorized as Level 3 in the hierarchy.
Investments in open-end mutual funds, including the Fidelity Central Funds, are valued at their closing net asset value (NAV) each business day and are categorized as Level 1 in the hierarchy.
Changes in valuation techniques may result in transfers in or out of an assigned level within the disclosure hierarchy. The aggregate value of investments by input level as of August 31, 2015 is included at the end of each applicable Fund's Schedule of Investments.
Foreign Currency. The Funds may use foreign currency contracts to facilitate transactions in foreign-denominated securities. Gains and losses from these transactions may arise from changes in the value of the foreign currency or if the counterparties do not perform under the contracts' terms.
Foreign-denominated assets, including investment securities, and liabilities are translated into U.S. dollars at the exchange rates at period end. Purchases and sales of investment securities, income and dividends received and expenses denominated in foreign currencies are translated into U.S. dollars at the exchange rate in effect on the transaction date.
The effects of exchange rate fluctuations on investments are included with the net realized and unrealized gain (loss) on investment securities. Other foreign currency transactions resulting in realized and unrealized gain (loss) are disclosed separately.
Investment Transactions and Income. For financial reporting purposes, the Funds' investment holdings and NAV include trades executed through the end of the last business day of the period. The NAV per share for processing shareholder transactions is calculated as of the close of business of the New York Stock Exchange (NYSE), normally 4:00 p.m. Eastern time and includes trades executed through the end of the prior business day. Gains and losses on securities sold are determined on the basis of identified cost and may include proceeds received from litigation. Dividend income is recorded on the ex-dividend date, except for certain dividends from foreign securities where the ex-dividend date may have passed, which are recorded as soon as the Funds are informed of the ex-dividend date. Non-cash dividends included in dividend income, if any, are recorded at the fair market value of the securities received. Income and capital gain distributions from Fidelity Central Funds, if any, are recorded on the ex-dividend date. Distributions received on securities that represent a return of capital or capital gain are recorded as a reduction of cost of investments and/or as a realized gain. Subsequent to ex-dividend date the Funds determine the components of these distributions, based upon receipt of tax filings or other correspondence relating to the underlying investment. Investment income is recorded net of foreign taxes withheld where recovery of such taxes is uncertain.
Expenses. Expenses directly attributable to a fund are charged to that fund. Expenses attributable to more than one fund are allocated among the respective funds on the basis of relative net assets or other appropriate methods. Expense estimates are accrued in the period to which they relate and adjustments are made when actual amounts are known.
Deferred Trustee Compensation. Under a Deferred Compensation Plan (the Plan) for Brokerage and Investment Management Portfolio, independent Trustees may elect to defer receipt of a portion of their annual compensation. Deferred amounts are invested in a cross-section of Fidelity funds, are marked-to-market and remain in the Fund until distributed in accordance with the Plan. The investment of deferred amounts and the offsetting payable to the Trustees are included in the accompanying Statement of Assets and Liabilities.
Income Tax Information and Distributions to Shareholders. Each year, each Fund intends to qualify as a regulated investment company under Subchapter M of the Internal Revenue Code, including distributing substantially all of its taxable income and realized gains. As a result, no provision for U.S. Federal income taxes is required. Each Fund files a U.S. federal tax return, in addition to state and local tax returns as required. Each Fund's federal income tax returns are subject to examination by the Internal Revenue Service (IRS) for a period of three fiscal years after they are filed. State and local tax returns may be subject to examination for an additional fiscal year depending on the jurisdiction. Foreign taxes are provided for based on each Fund's understanding of the tax rules and rates that exist in the foreign markets in which it invests.
Distributions are declared and recorded on the ex-dividend date. Income and capital gain distributions are determined in accordance with income tax regulations, which may differ from GAAP.
Capital accounts within the financial statements are adjusted for permanent book-tax differences. These adjustments have no impact on net assets or the results of operations. Capital accounts are not adjusted for temporary book-tax differences which will reverse in a subsequent period.
Book-tax differences are primarily due to foreign currency transactions, passive foreign investment companies (PFIC), redemptions in kind, partnerships, deferred trustees compensation, capital loss carryforwards and losses deferred due to wash sales and excise tax regulations.
The federal tax cost of investment securities and unrealized appreciation (depreciation) as of period end were as follows for each Fund:
| Tax cost | Gross unrealized appreciation | Gross unrealized depreciation | Net unrealized appreciation (depreciation) on securities | |
| Banking Portfolio | $606,561,840 | $92,585,179 | $(21,560,766) | $71,024,413 |
| Brokerage and Investment Management Portfolio | 448,751,691 | 73,251,857 | (22,396,263) | 50,855,594 |
| Consumer Finance Portfolio | 98,064,447 | 27,613,917 | (6,760,404) | 20,853,513 |
| Financial Services Portfolio | 1,226,461,638 | 137,377,012 | (46,744,685) | 90,632,327 |
| Insurance Portfolio | 368,026,016 | 98,039,614 | (6,327,789) | 91,711,825 |
Due to large subscriptions in a prior period, $17,267,539 of capital losses that will be available to offset future capital gains of Consumer Finance Portfolio will be limited to approximately $ 5,418,625 per year.
Certain of the Funds elected to defer to the next fiscal year capital losses and ordinary losses recognized during the period November 1, 2014 to February 28, 2015. Loss deferrals were as follows:
| Capital losses | Ordinary losses deferred | |
| Financial Services Portfolio | $188,552 | $1,448,764 |
Trading (Redemption) Fees. Shares held by investors in the Funds less than 30 days may be subject to a redemption fee equal to .75% of the NAV of shares redeemed. All redemption fees, which reduce the proceeds of the shareholder redemption, are retained by the Funds and accounted for as an addition to paid in capital.
4. Purchases and Sales of Investments.
Purchases and sales of securities, other than short-term securities, are noted in the table below.
| Purchases ($) | Sales ($) | |
| Banking Portfolio | 252,027,915 | 169,571,119 |
| Brokerage and Investment Management Portfolio | 82,187,362 | 109,625,062 |
| Consumer Finance Portfolio | 24,405,697 | 42,260,494 |
| Financial Services Portfolio | 358,596,366 | 325,565,196 |
| Insurance Portfolio | 94,031,172 | 48,103,069 |
5. Fees and Other Transactions with Affiliates.
Management Fee. Fidelity SelectCo, LLC (the investment adviser) and its affiliates provide the Funds with investment management related services for which the Funds pay a monthly management fee. The management fee is the sum of an individual fund fee rate and an annualized group fee rate. The individual fund fee rate is applied to each Fund's average net assets. The group fee rate is based upon the average net assets of all the mutual funds advised by Fidelity Management & Research Company (FMR) and the investment adviser. The group fee rate decreases as assets under management increase and increases as assets under management decrease. For the reporting period, each Fund's annualized management fee rate expressed as a percentage of each Fund's average net assets was as follows.
| Individual Rate | Group Rate | Total | |
| Banking Portfolio | .30% | .25% | .55% |
| Brokerage and Investment Management Portfolio | .30% | .25% | .55% |
| Consumer Finance Portfolio | .30% | .25% | .55% |
| Financial Services Portfolio | .30% | .25% | .55% |
| Insurance Portfolio | .30% | .25% | .55% |
Transfer Agent Fees. Fidelity Investments Institutional Operations Company, Inc. (FIIOC), an affiliate of the investment adviser, is the Funds' transfer, dividend disbursing and shareholder servicing agent. FIIOC receives account fees and asset-based fees that vary according to account size and type of account. FIIOC pays for typesetting, printing and mailing of shareholder reports, except proxy statements. For the period, transfer agent fees were equivalent to the following annualized rates expressed as a percentage of average net assets:
| Banking Portfolio | .19% |
| Brokerage and Investment Management Portfolio | .19% |
| Consumer Finance Portfolio | .24% |
| Financial Services Portfolio | .17% |
| Insurance Portfolio | .19% |
Accounting and Security Lending Fees. Fidelity Service Company, Inc. (FSC), an affiliate of the investment adviser, maintains each Fund's accounting records. The accounting fee is based on the level of average net assets for each month. Under a separate contract, FSC administers the security lending program. The security lending fee is based on the number and duration of lending transactions.
Brokerage Commissions. Certain Funds placed a portion of their portfolio transactions with brokerage firms which are affiliates of the investment adviser. Brokerage commissions are included in net realized gain (loss) and change in net unrealized appreciation (depreciation) in the Statement of Operations. The commissions paid to these affiliated firms were as follows:
| Amount | |
| Banking Portfolio | $6,729 |
| Brokerage and Investment Management Portfolio | 1,533 |
| Consumer Finance Portfolio | 1,138 |
| Financial Services Portfolio | 4,509 |
| Insurance Portfolio | 927 |
6. Committed Line of Credit.
Certain Funds participate with other funds managed by the investment adviser or an affiliate in a $4.25 billion credit facility (the "line of credit") to be utilized for temporary or emergency purposes to fund shareholder redemptions or for other short-term liquidity purposes. The participating funds have agreed to pay commitment fees on their pro-rata portion of the line of credit, which are reflected in Miscellaneous expenses on the Statement of Operations, and are as follows:
| Banking Portfolio | $461 |
| Brokerage and Investment Management Portfolio | 445 |
| Consumer Finance Portfolio | 105 |
| Financial Services Portfolio | 1,061 |
| Insurance Portfolio | 307 |
During the period, the Funds did not borrow on this line of credit.
7. Security Lending.
Certain Funds lend portfolio securities through a lending agent from time to time in order to earn additional income. On the settlement date of the loan, each applicable Fund receives collateral (in the form of U.S. Treasury obligations, letters of credit and/or cash) against the loaned securities and maintains collateral in an amount not less than 100% of the market value of the loaned securities during the period of the loan. The market value of the loaned securities is determined at the close of business of the Funds and any additional required collateral is delivered to the Funds on the next business day. If the borrower defaults on its obligation to return the securities loaned because of insolvency or other reasons, the Funds may apply collateral received from the borrower against the obligation. The Funds may experience delays and costs in recovering the securities loaned. Any cash collateral received is invested in the Fidelity Securities Lending Cash Central Fund. The value of loaned securities and cash collateral at period end are disclosed on each applicable Fund's Statement of Assets and Liabilities. Security lending income represents the income earned on investing cash collateral, less rebates paid to borrowers and any lending agent fees associated with the loan, plus any premium payments received for lending certain types of securities. Security lending income is presented on each applicable Fund's Statement of Operations as a component of income from Fidelity Central Funds. Security lending activity was as follows:
| Total Security Lending Income | |
| Banking Portfolio | $6,926 |
| Brokerage and Investment Management Portfolio | 5 |
| Consumer Finance Portfolio | 15,150 |
| Financial Services Portfolio | 29,917 |
| Insurance Portfolio | 11,653 |
8. Expense Reductions.
Commissions paid to certain brokers with whom the investment adviser, or its affiliates, places trades on behalf of Certain Funds include an amount in addition to trade execution, which may be rebated back to the Funds to offset certain expenses. In addition, through arrangements with each applicable Fund's custodian, credits realized as a result of uninvested cash balances were used to reduce each applicable Fund's expenses. All of the applicable expense reductions are noted in the table below.
| Brokerage Service reduction | Custody expense reduction |
|
| Banking Portfolio | $12,547 | $7 |
| Brokerage and Investment Management Portfolio | 13,195 | 4 |
| Consumer Finance Portfolio | 2,356 | – |
| Financial Services Portfolio | 38,928 | 22 |
| Insurance Portfolio | 7,249 | 1 |
In addition, during the period the investment adviser reimbursed and/or waived a portion of operating expenses as follows:
| Amount | |
| Banking Portfolio | $17,844 |
| Brokerage and Investment Management Portfolio | 17,756 |
| Consumer Finance Portfolio | 5,626 |
| Financial Services Portfolio | 28,287 |
| Insurance Portfolio | 11,696 |
9. Other.
The Funds' organizational documents provide former and current trustees and officers with a limited indemnification against liabilities arising in connection with the performance of their duties to the Funds. In the normal course of business, the Funds may also enter into contracts that provide general indemnifications. The Funds' maximum exposure under these arrangements is unknown as this would be dependent on future claims that may be made against the Funds. The risk of material loss from such claims is considered remote.
At the end of the period, the following mutual funds managed by the investment adviser or its affiliates were the owners of record of 10% or more of the total outstanding shares of the following Funds.
| VIP FundsManager 50% Portfolio | VIP FundsManager 60% Portfolio | Strategic Advisers Core Fund | |
| Banking Portfolio | 11% | 23% | – |
| Financial Services Portfolio | 12% | 21% | 33% |
| Insurance Portfolio | 11% | 14% | – |
Mutual funds managed by the investment adviser or its affiliates, in aggregate, were the owners of record of more than 20% of the total outstanding shares of the following Funds.
| % of shares held | |
| Banking Portfolio | 40% |
| Brokerage and Investment Management Portfolio | 20% |
| Financial Services Portfolio | 73% |
| Insurance Portfolio | 31% |
Shareholder Expense Example
As a shareholder of a Fund, you incur two types of costs: (1) transaction costs, including redemption fees and (2) ongoing costs, including management fees and other Fund expenses. This Example is intended to help you understand your ongoing costs (in dollars) of investing in the Funds and to compare these costs with the ongoing costs of investing in other mutual funds.
The Example is based on an investment of $1,000 invested at the beginning of the period and held for the entire period (March 1, 2015 to August 31, 2015).
Actual Expenses
The first line of the accompanying table for each fund provides information about actual account values and actual expenses. You may use the information in this line, together with the amount you invested, to estimate the expenses that you paid over the period. Simply divide your account value by $1,000.00 (for example, an $8,600 account value divided by $1,000.00 = 8.6), then multiply the result by the number in the first line for a fund under the heading entitled "Expenses Paid During Period" to estimate the expenses you paid on your account during this period. A small balance maintenance fee of $12.00 that is charged once a year may apply for certain accounts with a value of less than $2,000. This fee is not included in the table below. If it was, the estimate of expenses you paid during the period would be higher, and your ending account value lower, by this amount. In addition, each Fund, as a shareholder in the underlying Fidelity Central Funds, will indirectly bear its pro-rata share of the fees and expenses incurred by the underlying Fidelity Central Funds. These fees and expenses are not included in the Fund's annualized expense ratio used to calculate the expense estimate in the table below.
Hypothetical Example for Comparison Purposes
The second line of the accompanying table for each fund provides information about hypothetical account values and hypothetical expenses based on a fund's actual expense ratio and an assumed rate of return of 5% per year before expenses, which is not the Fund's actual return. The hypothetical account values and expenses may not be used to estimate the actual ending account balance or expenses you paid for the period. You may use this information to compare the ongoing costs of investing in the Fund and other funds. To do so, compare this 5% hypothetical example with the 5% hypothetical examples that appear in the shareholder reports of the other funds. A small balance maintenance fee of $12.00 that is charged once a year may apply for certain accounts with a value of less than $2,000. This fee is not included in the table below. If it was, the estimate of expenses you paid during the period would be higher, and your ending account value lower, by this amount. In addition, each Fund, as a shareholder in the underlying Fidelity Central Funds, will indirectly bear its pro-rata share of the fees and expenses incurred by the underlying Fidelity Central Funds. These fees and expenses are not included in the Fund's annualized expense ratio used to calculate the expense estimate in the table below.
Please note that the expenses shown in the table are meant to highlight your ongoing costs only and do not reflect any transaction costs. Therefore, the second line of the table is useful in comparing ongoing costs only, and will not help you determine the relative total costs of owning different funds. In addition, if these transactional costs were included, your costs would have been higher.
| Annualized Expense Ratio-A | Beginning Account Value March 1, 2015 | Ending Account Value August 31, 2015 | Expenses Paid During Period-B March 1, 2015 to August 31, 2015 |
|
| Banking Portfolio | .79% | |||
| Actual | $1,000.00 | $1,017.70 | $4.01 | |
| Hypothetical-C | $1,000.00 | $1,021.17 | $4.01 | |
| Brokerage and Investment Management Portfolio | .78% | |||
| Actual | $1,000.00 | $927.30 | $3.78 | |
| Hypothetical-C | $1,000.00 | $1,021.22 | $3.96 | |
| Consumer Finance Portfolio | .88% | |||
| Actual | $1,000.00 | $997.60 | $4.42 | |
| Hypothetical-C | $1,000.00 | $1,020.71 | $4.47 | |
| Financial Services Portfolio | .76% | |||
| Actual | $1,000.00 | $950.10 | $3.73 | |
| Hypothetical-C | $1,000.00 | $1,021.32 | $3.86 | |
| Insurance Portfolio | .80% | |||
| Actual | $1,000.00 | $1,012.40 | $4.05 | |
| Hypothetical-C | $1,000.00 | $1,021.11 | $4.06 |
A Annualized expense ratio reflects expenses net of applicable fee waivers.
B Expenses are equal to each Fund's annualized expense ratio, multiplied by the average account value over the period, multiplied by 184/366 (to reflect the one-half year period).
C 5% return per year before expenses.
![]()
SELFIN-SANN-1015
1.813666.110
|
Fidelity® Select Portfolios® Automotive Portfolio Construction and Housing Portfolio Consumer Discretionary Portfolio Leisure Portfolio Multimedia Portfolio Retailing Portfolio Semi-Annual Report August 31, 2015 |
|
|
Contents
|
Automotive Portfolio |
|
|
Construction and Housing Portfolio |
|
|
Consumer Discretionary Portfolio |
|
|
Leisure Portfolio |
|
|
Multimedia Portfolio |
|
|
Retailing Portfolio |
|
To view a fund's proxy voting guidelines and proxy voting record for the 12-month period ended June 30, visit http://www.fidelity.com/proxyvotingresults or visit the Securities and Exchange Commission's (SEC) web site at http://www.sec.gov.
You may also call 1-800-544-8544 to request a free copy of the proxy voting guidelines.
Standard & Poor's, S&P and S&P 500 are registered service marks of The McGraw-Hill Companies, Inc. and have been licensed for use by Fidelity Distributors Corporation.
Other third-party marks appearing herein are the property of their respective owners.
All other marks appearing herein are registered or unregistered trademarks or service marks of FMR LLC or an affiliated company. © 2015 FMR LLC. All rights reserved.
This report and the financial statements contained herein are submitted for the general information of the shareholders of the Funds. This report is not authorized for distribution to prospective investors in the Funds unless preceded or accompanied by an effective prospectus.
A fund files its complete schedule of portfolio holdings with the SEC for the first and third quarters of each fiscal year on Form N-Q. Forms N-Q are available on the SEC’s web site at http://www.sec.gov. A fund's Forms N-Q may be reviewed and copied at the SEC’s Public Reference Room in Washington, DC. Information regarding the operation of the SEC's Public Reference Room may be obtained by calling 1-800-SEC-0330.
For a complete list of a fund's portfolio holdings, view the most recent holdings listing, semiannual report, or annual report on Fidelity's web site at http://www.fidelity.com, http://www.advisor.fidelity.com, or http://www.401k.com, as applicable.
NOT FDIC INSURED •MAY LOSE VALUE •NO BANK GUARANTEE
Neither the Funds nor Fidelity Distributors Corporation is a bank.
Automotive Portfolio
Investment Summary (Unaudited)
Top Ten Stocks as of August 31, 2015
| % of fund's net assets | % of fund's net assets 6 months ago | |
| Ford Motor Co. | 12.3 | 11.0 |
| Toyota Motor Corp. sponsored ADR | 11.9 | 15.6 |
| General Motors Co. | 11.4 | 9.0 |
| Tesla Motors, Inc. | 7.8 | 3.9 |
| Delphi Automotive PLC | 6.7 | 5.7 |
| Tenneco, Inc. | 4.8 | 4.9 |
| Visteon Corp. | 4.7 | 4.5 |
| NGK Spark Plug Co. Ltd. | 4.6 | 0.0 |
| BorgWarner, Inc. | 4.3 | 4.3 |
| Stoneridge, Inc. | 3.7 | 1.3 |
| 72.2 |
Top Industries (% of fund's net assets)
| As of August 31, 2015 | ||
| Automobiles | 56.0% | |
| Auto Components | 34.4% | |
| Household Durables | 2.8% | |
| Commercial Services & Supplies | 2.0% | |
| Electronic Equipment & Components | 1.7% | |
| All Others* | 3.1% | |

| As of February 28, 2015 | ||
| Automobiles | 58.6% | |
| Auto Components | 32.8% | |
| Distributors | 3.0% | |
| Commercial Services & Supplies | 2.0% | |
| Household Durables | 2.0% | |
| All Others* | 1.6% | |

* Includes short-term investments and net other assets (liabilities).
Percentages shown as 0.0% may reflect amounts less than 0.05%.
Automotive Portfolio
Investments August 31, 2015 (Unaudited)
Showing Percentage of Net Assets
| Common Stocks - 94.8% | |||
| Shares | Value | ||
| Auto Components - 34.4% | |||
| Auto Parts & Equipment - 34.4% | |||
| BorgWarner, Inc. | 98,810 | $4,312,068 | |
| Delphi Automotive PLC | 88,658 | 6,695,452 | |
| LEONI AG | 34,200 | 2,077,376 | |
| Magna International, Inc. Class A (sub. vtg.) (a) | 72,868 | 3,595,767 | |
| NGK Spark Plug Co. Ltd. | 189,300 | 4,636,726 | |
| Stoneridge, Inc. (b) | 303,940 | 3,711,107 | |
| Tenneco, Inc. (b) | 102,306 | 4,813,497 | |
| Visteon Corp. (b) | 47,240 | 4,707,938 | |
| 34,549,931 | |||
| Automobiles - 52.9% | |||
| Automobile Manufacturers - 51.4% | |||
| Ford Motor Co. | 888,931 | 12,329,473 | |
| General Motors Co. | 387,514 | 11,408,412 | |
| Honda Motor Co. Ltd. sponsored ADR | 84,595 | 2,663,051 | |
| Renault SA | 29,300 | 2,436,005 | |
| Tata Motors Ltd. sponsored ADR | 117,140 | 2,965,985 | |
| Tesla Motors, Inc. (a)(b) | 31,500 | 7,845,390 | |
| Toyota Motor Corp. sponsored ADR | 101,017 | 11,958,392 | |
| 51,606,708 | |||
| Motorcycle Manufacturers - 1.5% | |||
| Harley-Davidson, Inc. | 25,820 | 1,447,211 | |
| TOTAL AUTOMOBILES | 53,053,919 | ||
| Commercial Services & Supplies - 2.0% | |||
| Diversified Support Services - 2.0% | |||
| KAR Auction Services, Inc. | 54,480 | 2,017,939 | |
| Electronic Equipment & Components - 1.7% | |||
| Electronic Equipment & Instruments - 1.7% | |||
| Research Frontiers, Inc. (a)(b) | 309,750 | 1,647,870 | |
| Household Durables - 2.8% | |||
| Consumer Electronics - 2.8% | |||
| Harman International Industries, Inc. | 28,840 | 2,818,822 | |
| Software - 1.0% | |||
| Application Software - 1.0% | |||
| Mobileye NV (a)(b) | 18,300 | 1,035,048 | |
| TOTAL COMMON STOCKS | |||
| (Cost $70,259,028) | 95,123,529 | ||
| Nonconvertible Preferred Stocks - 3.1% | |||
| Automobiles - 3.1% | |||
| Automobile Manufacturers - 3.1% | |||
| Volkswagen AG | |||
| (Cost $3,526,226) | 16,100 | 3,062,291 | |
| Money Market Funds - 12.6% | |||
| Fidelity Cash Central Fund, 0.15% (c) | 1,303,726 | 1,303,726 | |
| Fidelity Securities Lending Cash Central Fund, 0.19% (c)(d) | 11,376,500 | 11,376,500 | |
| TOTAL MONEY MARKET FUNDS | |||
| (Cost $12,680,226) | 12,680,226 | ||
| TOTAL INVESTMENT PORTFOLIO - 110.5% | |||
| (Cost $86,465,480) | 110,866,046 | ||
| NET OTHER ASSETS (LIABILITIES) - (10.5)% | (10,532,094) | ||
| NET ASSETS - 100% | $100,333,952 |
Legend
(a) Security or a portion of the security is on loan at period end.
(b) Non-income producing
(c) Affiliated fund that is generally available only to investment companies and other accounts managed by Fidelity Investments. The rate quoted is the annualized seven-day yield of the fund at period end. A complete unaudited listing of the fund's holdings as of its most recent quarter end is available upon request. In addition, each Fidelity Central Fund's financial statements are available on the SEC's website or upon request.
(d) Investment made with cash collateral received from securities on loan.
Affiliated Central Funds
Information regarding fiscal year to date income earned by the Fund from investments in Fidelity Central Funds is as follows:
| Fund | Income earned |
| Fidelity Cash Central Fund | $1,149 |
| Fidelity Securities Lending Cash Central Fund | 61,608 |
| Total | $62,757 |
Investment Valuation
The following is a summary of the inputs used, as of August 31, 2015, involving the Fund's assets and liabilities carried at fair value. The inputs or methodology used for valuing securities may not be an indication of the risk associated with investing in those securities. For more information on valuation inputs, and their aggregation into the levels used below, please refer to the Investment Valuation section in the accompanying Notes to Financial Statements.
| Valuation Inputs at Reporting Date: | ||||
| Description | Total | Level 1 | Level 2 | Level 3 |
| Investments in Securities: | ||||
| Common Stocks | $95,123,529 | $90,486,803 | $4,636,726 | $-- |
| Nonconvertible Preferred Stocks | 3,062,291 | 3,062,291 | -- | -- |
| Money Market Funds | 12,680,226 | 12,680,226 | -- | -- |
| Total Investments in Securities: | $110,866,046 | $106,229,320 | $4,636,726 | $-- |
Other Information
Distribution of investments by country or territory of incorporation, as a percentage of Total Net Assets, is as follows (Unaudited):
| United States of America | 59.1% |
| Japan | 19.1% |
| Bailiwick of Jersey | 6.7% |
| Germany | 5.1% |
| Canada | 3.6% |
| India | 3.0% |
| France | 2.4% |
| Netherlands | 1.0% |
| 100.0% |
See accompanying notes which are an integral part of the financial statements.
Automotive Portfolio
Financial Statements
Statement of Assets and Liabilities
| August 31, 2015 (Unaudited) | ||
| Assets | ||
| Investment in securities, at value (including securities loaned of $11,164,678) — See accompanying schedule: Unaffiliated issuers (cost $73,785,254) | $98,185,820 | |
| Fidelity Central Funds (cost $12,680,226) | 12,680,226 | |
| Total Investments (cost $86,465,480) | $110,866,046 | |
| Receivable for investments sold | 893,581 | |
| Receivable for fund shares sold | 35,169 | |
| Dividends receivable | 183,111 | |
| Distributions receivable from Fidelity Central Funds | 7,069 | |
| Prepaid expenses | 804 | |
| Other receivables | 5,927 | |
| Total assets | 111,991,707 | |
| Liabilities | ||
| Payable for fund shares redeemed | $189,757 | |
| Accrued management fee | 48,156 | |
| Other affiliated payables | 23,715 | |
| Other payables and accrued expenses | 19,627 | |
| Collateral on securities loaned, at value | 11,376,500 | |
| Total liabilities | 11,657,755 | |
| Net Assets | $100,333,952 | |
| Net Assets consist of: | ||
| Paid in capital | $63,205,280 | |
| Undistributed net investment income | 784,750 | |
| Accumulated undistributed net realized gain (loss) on investments and foreign currency transactions | 11,944,822 | |
| Net unrealized appreciation (depreciation) on investments and assets and liabilities in foreign currencies | 24,399,100 | |
| Net Assets, for 2,388,502 shares outstanding | $100,333,952 | |
| Net Asset Value, offering price and redemption price per share ($100,333,952 ÷ 2,388,502 shares) | $42.01 |
See accompanying notes which are an integral part of the financial statements.
Statement of Operations
| Six months ended August 31, 2015 (Unaudited) | ||
| Investment Income | ||
| Dividends | $1,327,642 | |
| Income from Fidelity Central Funds | 62,757 | |
| Income before foreign taxes withheld | 1,390,399 | |
| Less foreign taxes withheld | (72,227) | |
| Total income | 1,318,172 | |
| Expenses | ||
| Management fee | $343,320 | |
| Transfer agent fees | 132,294 | |
| Accounting and security lending fees | 25,960 | |
| Custodian fees and expenses | 6,989 | |
| Independent trustees' compensation | 1,113 | |
| Registration fees | 15,943 | |
| Audit | 17,827 | |
| Legal | 863 | |
| Miscellaneous | 1,127 | |
| Total expenses before reductions | 545,436 | |
| Expense reductions | (13,680) | 531,756 |
| Net investment income (loss) | 786,416 | |
| Realized and Unrealized Gain (Loss)
Net realized gain (loss) on: | ||
| Investment securities: | ||
| Unaffiliated issuers | 12,321,436 | |
| Foreign currency transactions | 22,867 | |
| Total net realized gain (loss) | 12,344,303 | |
| Change in net unrealized appreciation (depreciation) on: Investment securities | (24,232,984) | |
| Assets and liabilities in foreign currencies | 1,983 | |
| Total change in net unrealized appreciation (depreciation) | (24,231,001) | |
| Net gain (loss) | (11,886,698) | |
| Net increase (decrease) in net assets resulting from operations | $(11,100,282) |
See accompanying notes which are an integral part of the financial statements.
Statement of Changes in Net Assets
| Six months ended August 31, 2015 (Unaudited) | Year ended February 28, 2015 | |
| Increase (Decrease) in Net Assets | ||
| Operations | ||
| Net investment income (loss) | $786,416 | $1,294,323 |
| Net realized gain (loss) | 12,344,303 | 31,540,853 |
| Change in net unrealized appreciation (depreciation) | (24,231,001) | (24,167,890) |
| Net increase (decrease) in net assets resulting from operations | (11,100,282) | 8,667,286 |
| Distributions to shareholders from net investment income | (178,049) | (1,014,489) |
| Distributions to shareholders from net realized gain | (6,313,886) | (32,500,600) |
| Total distributions | (6,491,935) | (33,515,089) |
| Share transactions | ||
| Proceeds from sales of shares | 14,562,732 | 54,086,634 |
| Reinvestment of distributions | 6,290,534 | 32,352,775 |
| Cost of shares redeemed | (40,806,289) | (137,945,557) |
| Net increase (decrease) in net assets resulting from share transactions | (19,953,023) | (51,506,148) |
| Redemption fees | 1,924 | 3,842 |
| Total increase (decrease) in net assets | (37,543,316) | (76,350,109) |
| Net Assets | ||
| Beginning of period | 137,877,268 | 214,227,377 |
| End of period (including undistributed net investment income of $784,750 and undistributed net investment income of $176,383, respectively) | $100,333,952 | $137,877,268 |
| Other Information
Shares | ||
| Sold | 308,335 | 1,045,483 |
| Issued in reinvestment of distributions | 133,359 | 682,332 |
| Redeemed | (877,425) | (2,665,298) |
| Net increase (decrease) | (435,731) | (937,483) |
See accompanying notes which are an integral part of the financial statements.
Financial Highlights — Automotive Portfolio
| Six months ended (Unaudited) | Years ended February 28, | |||||
| August 31, | 2015 | 2015 | 2014 | 2013 | 2012 A | 2011 |
| Selected Per–Share Data | ||||||
| Net asset value, beginning of period | $48.82 | $56.95 | $40.65 | $38.05 | $46.87 | $31.63 |
| Income from Investment Operations | ||||||
| Net investment income (loss)B | .29 | .42 | .22 | .24 | .03 | (.08) |
| Net realized and unrealized gain (loss) | (4.73) | 3.05 | 16.96 | 2.65 | (6.45) | 15.94 |
| Total from investment operations | (4.44) | 3.47 | 17.18 | 2.89 | (6.42) | 15.86 |
| Distributions from net investment income | (.07) | (.38) | (.15) | (.26) | (.02) | – |
| Distributions from net realized gain | (2.31) | (11.22) | (.73) | (.02) | (2.41) | (.63) |
| Total distributions | (2.37)C | (11.60) | (.88) | (.29)D | (2.42)E | (.63) |
| Redemption fees added to paid in capitalB | –F | –F | –F | –F | .02 | .01 |
| Net asset value, end of period | $42.01 | $48.82 | $56.95 | $40.65 | $38.05 | $46.87 |
| Total ReturnG,H | (9.63)% | 8.04% | 42.33% | 7.64% | (13.06)% | 50.90% |
| Ratios to Average Net AssetsI,J | ||||||
| Expenses before reductions | .87%K | .85% | .84% | .91% | .90% | .91% |
| Expenses net of fee waivers, if any | .86%K | .85% | .84% | .91% | .90% | .91% |
| Expenses net of all reductions | .85%K | .85% | .83% | .89% | .90% | .91% |
| Net investment income (loss) | 1.26%K | .82% | .43% | .66% | .08% | (.19)% |
| Supplemental Data | ||||||
| Net assets, end of period (000 omitted) | $100,334 | $137,877 | $214,227 | $142,959 | $170,016 | $373,632 |
| Portfolio turnover rateL | 95%K | 71% | 148% | 72% | 49% | 91% |
A For the year ended February 29.
B Calculated based on average shares outstanding during the period.
C Total distributions of $2.37 per share is comprised of distributions from net investment income of $.065 and distributions from net realized gain of $2.305 per share.
D Total distributions of $.29 per share is comprised of distributions from net investment income of $.261 and distributions from net realized gain of $.024 per share.
E Total distributions of $2.42 per share is comprised of distributions from net investment income of $.015 and distributions from net realized gain of $2.408 per share.
F Amount represents less than $.005 per share.
G Total returns for periods of less than one year are not annualized.
H Total returns would have been lower if certain expenses had not been reduced during the applicable periods shown.
I Fees and expenses of any underlying Fidelity Central Funds are not included in the Fund's expense ratio. The Fund indirectly bears its proportionate share of the expenses of any underlying Fidelity Central Funds.
J Expense ratios reflect operating expenses of the Fund. Expenses before reductions do not reflect amounts reimbursed by the investment adviser or reductions from brokerage service arrangements or reductions from other expense offset arrangements and do not represent the amount paid by the Fund during periods when reimbursements or reductions occur. Expenses net of fee waivers reflect expenses after reimbursement by the investment adviser but prior to reductions from brokerage service arrangements or other expense offset arrangements. Expenses net of all reductions represent the net expenses paid by the Fund.
K Annualized
L Amount does not include the portfolio activity of any underlying Fidelity Central Funds.
See accompanying notes which are an integral part of the financial statements.
Construction and Housing Portfolio
Investment Summary (Unaudited)
Top Ten Stocks as of August 31, 2015
| % of fund's net assets | % of fund's net assets 6 months ago | |
| Home Depot, Inc. | 24.7 | 23.7 |
| Lowe's Companies, Inc. | 11.8 | 11.2 |
| AvalonBay Communities, Inc. | 6.1 | 2.5 |
| UDR, Inc. | 4.7 | 4.5 |
| Essex Property Trust, Inc. | 4.2 | 3.8 |
| Eagle Materials, Inc. | 3.0 | 2.4 |
| PulteGroup, Inc. | 2.9 | 2.6 |
| A.O. Smith Corp. | 2.8 | 2.7 |
| Forest City Enterprises, Inc. Class A | 2.7 | 2.5 |
| Quanta Services, Inc. | 2.4 | 2.2 |
| 65.3 |
Top Industries (% of fund's net assets)
| As of August 31, 2015 | ||
| Specialty Retail | 36.5% | |
| Real Estate Investment Trusts | 20.6% | |
| Household Durables | 16.1% | |
| Construction & Engineering | 6.0% | |
| Building Products | 5.8% | |
| All Others* | 15.0% | |
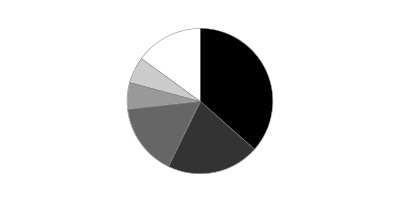
| As of February 28, 2015 | ||
| Specialty Retail | 36.6% | |
| Real Estate Investment Trusts | 18.2% | |
| Household Durables | 16.4% | |
| Construction & Engineering | 8.1% | |
| Building Products | 5.8% | |
| All Others* | 14.9% | |
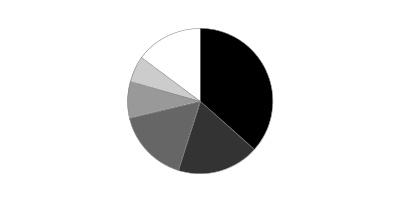
* Includes short-term investments and net other assets (liabilities).
Construction and Housing Portfolio
Investments August 31, 2015 (Unaudited)
Showing Percentage of Net Assets
| Common Stocks - 97.1% | |||
| Shares | Value | ||
| Building Products - 5.8% | |||
| Building Products - 5.8% | |||
| A.O. Smith Corp. | 205,295 | $13,243,580 | |
| Fortune Brands Home & Security, Inc. | 232,900 | 11,144,265 | |
| Owens Corning | 78,800 | 3,490,052 | |
| 27,877,897 | |||
| Construction & Engineering - 6.0% | |||
| Construction & Engineering - 6.0% | |||
| AECOM Technology Corp. (a) | 263,921 | 7,257,822 | |
| Dycom Industries, Inc. (a) | 31,900 | 2,267,771 | |
| Furmanite Corp. (a) | 351,491 | 2,203,849 | |
| Quanta Services, Inc. (a) | 486,600 | 11,795,184 | |
| Tutor Perini Corp. (a) | 309,589 | 5,479,725 | |
| 29,004,351 | |||
| Construction Materials - 3.0% | |||
| Construction Materials - 3.0% | |||
| Eagle Materials, Inc. | 176,676 | 14,457,397 | |
| Electrical Equipment - 1.4% | |||
| Heavy Electrical Equipment - 1.4% | |||
| Babcock & Wilcox Enterprises, Inc. (a) | 65,681 | 1,211,814 | |
| BWX Technologies, Inc. | 205,300 | 5,444,556 | |
| 6,656,370 | |||
| Household Durables - 14.9% | |||
| Home Furnishings - 0.8% | |||
| Mohawk Industries, Inc. (a) | 19,100 | 3,762,127 | |
| Homebuilding - 13.1% | |||
| Cairn Homes PLC (a) | 2,611,100 | 3,208,400 | |
| D.R. Horton, Inc. | 315,900 | 9,593,883 | |
| LGI Homes, Inc. (b)(a) | 74,467 | 1,939,121 | |
| New Home Co. LLC (a) | 237,961 | 3,540,860 | |
| PulteGroup, Inc. | 667,700 | 13,814,713 | |
| Taylor Morrison Home Corp. (a) | 396,765 | 7,915,462 | |
| Toll Brothers, Inc. (a) | 300,550 | 11,111,334 | |
| WCI Communities, Inc. (a) | 119,633 | 2,981,254 | |
| William Lyon Homes, Inc. (a) | 388,121 | 8,794,822 | |
| 62,899,849 | |||
| Household Appliances - 1.0% | |||
| Whirlpool Corp. | 28,570 | 4,802,617 | |
| TOTAL HOUSEHOLD DURABLES | 71,464,593 | ||
| Insurance - 0.8% | |||
| Property & Casualty Insurance - 0.8% | |||
| First American Financial Corp. | 94,154 | 3,658,824 | |
| Paper & Forest Products - 1.4% | |||
| Forest Products - 1.4% | |||
| Boise Cascade Co. (a) | 212,251 | 6,887,545 | |
| Real Estate Investment Trusts - 20.6% | |||
| Residential REITs - 20.6% | |||
| American Homes 4 Rent Class A | 431,623 | 6,897,336 | |
| AvalonBay Communities, Inc. | 177,659 | 29,324,395 | |
| Essex Property Trust, Inc. | 93,801 | 20,131,571 | |
| Mid-America Apartment Communities, Inc. | 143,700 | 11,293,383 | |
| Sun Communities, Inc. | 136,991 | 8,933,183 | |
| UDR, Inc. | 700,900 | 22,639,070 | |
| 99,218,938 | |||
| Real Estate Management & Development - 5.8% | |||
| Diversified Real Estate Activities - 0.9% | |||
| Countrywide PLC | 522,419 | 4,188,631 | |
| Real Estate Operating Companies - 2.7% | |||
| Forest City Enterprises, Inc. Class A (a) | 605,400 | 13,034,262 | |
| Real Estate Services - 2.2% | |||
| Foxtons Group PLC | 587,800 | 2,169,260 | |
| Realogy Holdings Corp. (a) | 207,000 | 8,342,100 | |
| 10,511,360 | |||
| TOTAL REAL ESTATE MANAGEMENT & DEVELOPMENT | 27,734,253 | ||
| Specialty Retail - 36.5% | |||
| Home Improvement Retail - 36.5% | |||
| Home Depot, Inc. | 1,019,170 | 118,692,537 | |
| Lowe's Companies, Inc. | 821,634 | 56,832,424 | |
| 175,524,961 | |||
| Thrifts & Mortgage Finance - 0.9% | |||
| Thrifts & Mortgage Finance - 0.9% | |||
| Essent Group Ltd. (a) | 153,800 | 4,120,302 | |
| TOTAL COMMON STOCKS | |||
| (Cost $360,204,362) | 466,605,431 | ||
| Convertible Preferred Stocks - 1.2% | |||
| Household Durables - 1.2% | |||
| Homebuilding - 1.2% | |||
| Blu Homes, Inc. Series A, 5.00% (c)(a) | |||
| (Cost $4,000,001) | 865,801 | 5,783,551 | |
| Money Market Funds - 1.4% | |||
| Fidelity Cash Central Fund, 0.15% (d) | 5,498,278 | 5,498,278 | |
| Fidelity Securities Lending Cash Central Fund, 0.19% (d)(e) | 1,292,850 | 1,292,850 | |
| TOTAL MONEY MARKET FUNDS | |||
| (Cost $6,791,128) | 6,791,128 | ||
| TOTAL INVESTMENT PORTFOLIO - 99.7% | |||
| (Cost $370,995,491) | 479,180,110 | ||
| NET OTHER ASSETS (LIABILITIES) - 0.3% | 1,336,676 | ||
| NET ASSETS - 100% | $480,516,786 |
Legend
(a) Non-income producing
(b) Security or a portion of the security is on loan at period end.
(c) Restricted securities - Investment in securities not registered under the Securities Act of 1933 (excluding 144A issues). At the end of the period, the value of restricted securities (excluding 144A issues) amounted to $5,783,551 or 1.2% of net assets.
(d) Affiliated fund that is generally available only to investment companies and other accounts managed by Fidelity Investments. The rate quoted is the annualized seven-day yield of the fund at period end. A complete unaudited listing of the fund's holdings as of its most recent quarter end is available upon request. In addition, each Fidelity Central Fund's financial statements are available on the SEC's website or upon request.
(e) Investment made with cash collateral received from securities on loan.
Additional information on each restricted holding is as follows:
| Security | Acquisition Date | Acquisition Cost |
| Blu Homes, Inc. Series A, 5.00% | 6/10/13 | $4,000,001 |
Affiliated Central Funds
Information regarding fiscal year to date income earned by the Fund from investments in Fidelity Central Funds is as follows:
| Fund | Income earned |
| Fidelity Cash Central Fund | $6,108 |
| Fidelity Securities Lending Cash Central Fund | 34,857 |
| Total | $40,965 |
Investment Valuation
The following is a summary of the inputs used, as of August 31, 2015, involving the Fund's assets and liabilities carried at fair value. The inputs or methodology used for valuing securities may not be an indication of the risk associated with investing in those securities. For more information on valuation inputs, and their aggregation into the levels used below, please refer to the Investment Valuation section in the accompanying Notes to Financial Statements.
| Valuation Inputs at Reporting Date: | ||||
| Description | Total | Level 1 | Level 2 | Level 3 |
| Investments in Securities: | ||||
| Common Stocks | $466,605,431 | $466,605,431 | $-- | $-- |
| Convertible Preferred Stocks | 5,783,551 | -- | -- | 5,783,551 |
| Money Market Funds | 6,791,128 | 6,791,128 | -- | -- |
| Total Investments in Securities: | $479,180,110 | $473,396,559 | $-- | $5,783,551 |
The following is a reconciliation of Investments in Securities and Derivative Instruments for which Level 3 inputs were used in determining value:
| Investments in Securities: | |
| Convertible Preferred Stocks | |
| Beginning Balance | $6,961,040 |
| Total Realized Gain (Loss) | -- |
| Total Unrealized Gain (Loss) | (1,177,489) |
| Cost of Purchases | -- |
| Proceeds of Sales | -- |
| Amortization/Accretion | -- |
| Transfers in to Level 3 | -- |
| Transfers out of Level 3 | -- |
| Ending Balance | $5,783,551 |
| The change in unrealized gain (loss) for the period attributable to Level 3 securities held at August 31, 2015 | $(1,177,489) |
The information used in the above reconciliation represents fiscal year to date activity for any Investments in Securities identified as using Level 3 inputs at either the beginning or the end of the current fiscal period. Transfers in or out of Level 3 represent the beginning value of any Security or Instrument where a change in the pricing level occurred from the beginning to the end of the period. The cost of purchases and the proceeds of sales may include securities received or delivered through corporate actions or exchanges.
See accompanying notes which are an integral part of the financial statements.
Construction and Housing Portfolio
Financial Statements
Statement of Assets and Liabilities
| August 31, 2015 (Unaudited) | ||
| Assets | ||
| Investment in securities, at value (including securities loaned of $1,320,228) — See accompanying schedule: Unaffiliated issuers (cost $364,204,363) | $472,388,982 | |
| Fidelity Central Funds (cost $6,791,128) | 6,791,128 | |
| Total Investments (cost $370,995,491) | $479,180,110 | |
| Receivable for investments sold | 5,325,249 | |
| Receivable for fund shares sold | 2,233,659 | |
| Dividends receivable | 69,377 | |
| Distributions receivable from Fidelity Central Funds | 4,022 | |
| Prepaid expenses | 3,596 | |
| Other receivables | 7,728 | |
| Total assets | 486,823,741 | |
| Liabilities | ||
| Payable for investments purchased | $3,743,473 | |
| Payable for fund shares redeemed | 933,821 | |
| Accrued management fee | 221,923 | |
| Other affiliated payables | 89,936 | |
| Other payables and accrued expenses | 24,952 | |
| Collateral on securities loaned, at value | 1,292,850 | |
| Total liabilities | 6,306,955 | |
| Net Assets | $480,516,786 | |
| Net Assets consist of: | ||
| Paid in capital | $364,712,272 | |
| Undistributed net investment income | 1,049,669 | |
| Accumulated undistributed net realized gain (loss) on investments and foreign currency transactions | 6,570,226 | |
| Net unrealized appreciation (depreciation) on investments | 108,184,619 | |
| Net Assets, for 8,368,702 shares outstanding | $480,516,786 | |
| Net Asset Value, offering price and redemption price per share ($480,516,786 ÷ 8,368,702 shares) | $57.42 |
See accompanying notes which are an integral part of the financial statements.
Statement of Operations
| Six months ended August 31, 2015 (Unaudited) | ||
| Investment Income | ||
| Dividends | $2,853,105 | |
| Income from Fidelity Central Funds | 40,965 | |
| Total income | 2,894,070 | |
| Expenses | ||
| Management fee | $1,261,022 | |
| Transfer agent fees | 444,875 | |
| Accounting and security lending fees | 90,900 | |
| Custodian fees and expenses | 9,805 | |
| Independent trustees' compensation | 3,758 | |
| Registration fees | 32,975 | |
| Audit | 17,883 | |
| Legal | 2,590 | |
| Miscellaneous | 2,031 | |
| Total expenses before reductions | 1,865,839 | |
| Expense reductions | (23,814) | 1,842,025 |
| Net investment income (loss) | 1,052,045 | |
| Realized and Unrealized Gain (Loss)
Net realized gain (loss) on: | ||
| Investment securities: | ||
| Unaffiliated issuers | 7,481,165 | |
| Foreign currency transactions | 5,281 | |
| Total net realized gain (loss) | 7,486,446 | |
| Change in net unrealized appreciation (depreciation) on investment securities | (21,051,600) | |
| Net gain (loss) | (13,565,154) | |
| Net increase (decrease) in net assets resulting from operations | $(12,513,109) |
See accompanying notes which are an integral part of the financial statements.
Statement of Changes in Net Assets
| Six months ended August 31, 2015 (Unaudited) | Year ended February 28, 2015 | |
| Increase (Decrease) in Net Assets | ||
| Operations | ||
| Net investment income (loss) | $1,052,045 | $1,779,852 |
| Net realized gain (loss) | 7,486,446 | 36,555,977 |
| Change in net unrealized appreciation (depreciation) | (21,051,600) | 14,605,675 |
| Net increase (decrease) in net assets resulting from operations | (12,513,109) | 52,941,504 |
| Distributions to shareholders from net investment income | (190,199) | (1,765,360) |
| Distributions to shareholders from net realized gain | (7,544,550) | (39,110,787) |
| Total distributions | (7,734,749) | (40,876,147) |
| Share transactions | ||
| Proceeds from sales of shares | 168,580,988 | 126,467,385 |
| Reinvestment of distributions | 7,479,090 | 39,619,226 |
| Cost of shares redeemed | (94,790,257) | (135,431,284) |
| Net increase (decrease) in net assets resulting from share transactions | 81,269,821 | 30,655,327 |
| Redemption fees | 15,813 | 8,087 |
| Total increase (decrease) in net assets | 61,037,776 | 42,728,771 |
| Net Assets | ||
| Beginning of period | 419,479,010 | 376,750,239 |
| End of period (including undistributed net investment income of $1,049,669 and undistributed net investment income of $187,823, respectively) | $480,516,786 | $419,479,010 |
| Other Information
Shares | ||
| Sold | 2,850,402 | 2,209,593 |
| Issued in reinvestment of distributions | 124,985 | 737,432 |
| Redeemed | (1,628,288) | (2,480,004) |
| Net increase (decrease) | 1,347,099 | 467,021 |
See accompanying notes which are an integral part of the financial statements.
Financial Highlights — Construction and Housing Portfolio
| Six months ended (Unaudited) | Years ended February 28, | |||||
| August 31, | 2015 | 2015 | 2014 | 2013 | 2012 A | 2011 |
| Selected Per–Share Data | ||||||
| Net asset value, beginning of period | $59.74 | $57.48 | $52.01 | $40.01 | $37.43 | $29.89 |
| Income from Investment Operations | ||||||
| Net investment income (loss)B | .13 | .29 | .26 | .19 | .21 | .18 |
| Net realized and unrealized gain (loss) | (1.47) | 8.53 | 9.65 | 12.47 | 2.62 | 7.63 |
| Total from investment operations | (1.34) | 8.82 | 9.91 | 12.66 | 2.83 | 7.81 |
| Distributions from net investment income | (.02) | (.29) | (.30) | (.14) | (.25) | (.28) |
| Distributions from net realized gain | (.95) | (6.28) | (4.14) | (.53) | – | – |
| Total distributions | (.98)C | (6.56)D | (4.44) | (.67) | (.25) | (.28) |
| Redemption fees added to paid in capitalB | –E | –E | –E | .01 | –E | .01 |
| Net asset value, end of period | $57.42 | $59.74 | $57.48 | $52.01 | $40.01 | $37.43 |
| Total ReturnF,G | (2.32)% | 16.99% | 19.84% | 31.79% | 7.65% | 26.24% |
| Ratios to Average Net AssetsH,I | ||||||
| Expenses before reductions | .81%J | .82% | .81% | .86% | .96% | .98% |
| Expenses net of fee waivers, if any | .81%J | .82% | .81% | .86% | .96% | .98% |
| Expenses net of all reductions | .80%J | .82% | .81% | .86% | .96% | .98% |
| Net investment income (loss) | .46%J | .52% | .47% | .42% | .59% | .55% |
| Supplemental Data | ||||||
| Net assets, end of period (000 omitted) | $480,517 | $419,479 | $376,750 | $781,007 | $171,514 | $112,200 |
| Portfolio turnover rateK | 68%J | 71% | 53% | 47% | 81% | 101% |
A For the year ended February 29.
B Calculated based on average shares outstanding during the period.
C Total distributions of $0.98 per share is comprised of distributions from net investment income of $.024 and distributions from net realized gain of $.952 per share.
D Total distributions of $6.56 per share is comprised of distributions from net investment income of $.287 and distributions from net realized gain of $6.276 per share.
E Amount represents less than $.005 per share.
F Total returns for periods of less than one year are not annualized.
G Total returns would have been lower if certain expenses had not been reduced during the applicable periods shown.
H Fees and expenses of any underlying Fidelity Central Funds are not included in the Fund's expense ratio. The Fund indirectly bears its proportionate share of the expenses of any underlying Fidelity Central Funds.
I Expense ratios reflect operating expenses of the Fund. Expenses before reductions do not reflect amounts reimbursed by the investment adviser or reductions from brokerage service arrangements or reductions from other expense offset arrangements and do not represent the amount paid by the Fund during periods when reimbursements or reductions occur. Expenses net of fee waivers reflect expenses after reimbursement by the investment adviser but prior to reductions from brokerage service arrangements or other expense offset arrangements. Expenses net of all reductions represent the net expenses paid by the Fund.
J Annualized
K Amount does not include the portfolio activity of any underlying Fidelity Central Funds.
See accompanying notes which are an integral part of the financial statements.
Consumer Discretionary Portfolio
Investment Summary (Unaudited)
Top Ten Stocks as of August 31, 2015
| % of fund's net assets | % of fund's net assets 6 months ago | |
| Amazon.com, Inc. | 7.9 | 1.3 |
| The Walt Disney Co. | 7.4 | 8.5 |
| Home Depot, Inc. | 5.1 | 5.4 |
| NIKE, Inc. Class B | 5.0 | 3.5 |
| Starbucks Corp. | 4.7 | 4.3 |
| L Brands, Inc. | 4.7 | 3.9 |
| Comcast Corp. Class A | 4.5 | 6.3 |
| Hilton Worldwide Holdings, Inc. | 4.5 | 1.6 |
| Las Vegas Sands Corp. | 2.8 | 1.7 |
| Ross Stores, Inc. | 2.6 | 1.7 |
| 49.2 |
Top Industries (% of fund's net assets)
| As of August 31, 2015 | ||
| Hotels, Restaurants & Leisure | 21.8% | |
| Media | 21.2% | |
| Specialty Retail | 19.6% | |
| Internet & Catalog Retail | 9.1% | |
| Textiles, Apparel & Luxury Goods | 6.4% | |
| All Others* | 21.9% | |
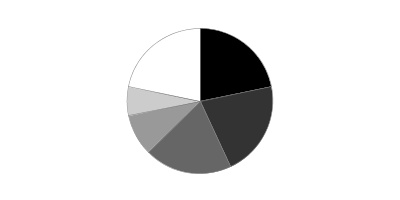
| As of February 28, 2015 | ||
| Media | 24.1% | |
| Hotels, Restaurants & Leisure | 20.9% | |
| Specialty Retail | 18.6% | |
| Textiles, Apparel & Luxury Goods | 11.3% | |
| Internet & Catalog Retail | 5.1% | |
| All Others* | 20.0% | |
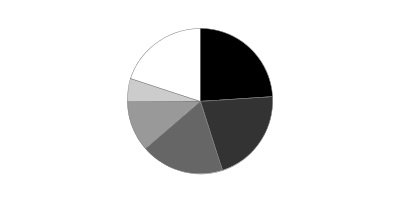
* Includes short-term investments and net other assets (liabilities).
Consumer Discretionary Portfolio
Investments August 31, 2015 (Unaudited)
Showing Percentage of Net Assets
| Common Stocks - 98.9% | |||
| Shares | Value | ||
| Auto Components - 4.2% | |||
| Auto Parts & Equipment - 4.2% | |||
| Delphi Automotive PLC | 334,706 | $25,276,997 | |
| Tenneco, Inc. (a) | 325,612 | 15,320,045 | |
| Visteon Corp. (a) | 108,100 | 10,773,246 | |
| 51,370,288 | |||
| Automobiles - 3.2% | |||
| Automobile Manufacturers - 1.9% | |||
| Tata Motors Ltd. (a) | 605,941 | 3,132,953 | |
| Tesla Motors, Inc. (b)(a) | 79,400 | 19,775,364 | |
| 22,908,317 | |||
| Motorcycle Manufacturers - 1.3% | |||
| Harley-Davidson, Inc. | 292,200 | 16,377,810 | |
| TOTAL AUTOMOBILES | 39,286,127 | ||
| Beverages - 3.3% | |||
| Distillers & Vintners - 2.1% | |||
| Constellation Brands, Inc. Class A (sub. vtg.) | 195,900 | 25,075,200 | |
| Soft Drinks - 1.2% | |||
| Monster Beverage Corp. (a) | 109,400 | 15,147,524 | |
| TOTAL BEVERAGES | 40,222,724 | ||
| Food Products - 0.6% | |||
| Packaged Foods & Meats - 0.6% | |||
| Associated British Foods PLC | 119,500 | 5,871,595 | |
| Keurig Green Mountain, Inc. | 25,300 | 1,431,980 | |
| 7,303,575 | |||
| Hotels, Restaurants & Leisure - 21.8% | |||
| Casinos & Gaming - 3.9% | |||
| Las Vegas Sands Corp. | 733,800 | 33,923,574 | |
| Wynn Resorts Ltd. | 186,864 | 14,024,143 | |
| 47,947,717 | |||
| Hotels, Resorts & Cruise Lines - 7.2% | |||
| Accor SA | 175,299 | 8,316,974 | |
| Hilton Worldwide Holdings, Inc. | 2,221,700 | 55,164,811 | |
| Wyndham Worldwide Corp. | 318,321 | 24,345,190 | |
| 87,826,975 | |||
| Leisure Facilities - 1.4% | |||
| Vail Resorts, Inc. | 155,651 | 16,796,299 | |
| Restaurants - 9.3% | |||
| Dave & Buster's Entertainment, Inc. | 225,264 | 7,758,092 | |
| Domino's Pizza, Inc. | 71,800 | 7,606,492 | |
| Fiesta Restaurant Group, Inc. (a) | 236,600 | 12,218,024 | |
| Jubilant Foodworks Ltd. (a) | 130,461 | 3,278,550 | |
| McDonald's Corp. | 84,500 | 8,029,190 | |
| Ruth's Hospitality Group, Inc. | 1,096,766 | 17,635,997 | |
| Starbucks Corp. | 1,059,800 | 57,981,658 | |
| 114,508,003 | |||
| TOTAL HOTELS, RESTAURANTS & LEISURE | 267,078,994 | ||
| Household Durables - 3.8% | |||
| Homebuilding - 3.0% | |||
| D.R. Horton, Inc. | 373,800 | 11,352,306 | |
| Lennar Corp. Class A | 202,000 | 10,281,800 | |
| PulteGroup, Inc. | 741,000 | 15,331,290 | |
| 36,965,396 | |||
| Household Appliances - 0.0% | |||
| Techtronic Industries Co. Ltd. | 2,000 | 7,239 | |
| Housewares & Specialties - 0.8% | |||
| Jarden Corp. (a) | 174,800 | 8,974,232 | |
| TOTAL HOUSEHOLD DURABLES | 45,946,867 | ||
| Internet & Catalog Retail - 9.1% | |||
| Internet Retail - 9.1% | |||
| Amazon.com, Inc. (a) | 188,600 | 96,731,055 | |
| Ocado Group PLC (a) | 2,728,968 | 14,355,098 | |
| 111,086,153 | |||
| Internet Software & Services - 1.8% | |||
| Internet Software & Services - 1.8% | |||
| Alibaba Group Holding Ltd. sponsored ADR (b) | 196,300 | 12,979,356 | |
| HomeAway, Inc. (a) | 205,800 | 5,904,402 | |
| JUST EAT Ltd. (a) | 517,900 | 3,131,982 | |
| 22,015,740 | |||
| Leisure Products - 0.7% | |||
| Leisure Products - 0.7% | |||
| Polaris Industries, Inc. | 70,600 | 9,168,822 | |
| Media - 21.2% | |||
| Advertising - 0.3% | |||
| MDC Partners, Inc. Class A (sub. vtg.) | 198,631 | 3,901,112 | |
| Broadcasting - 2.4% | |||
| ITV PLC | 7,709,000 | 29,597,310 | |
| Cable & Satellite - 8.8% | |||
| Charter Communications, Inc. Class A (b)(a) | 120,200 | 21,829,522 | |
| Comcast Corp. Class A | 981,100 | 55,265,363 | |
| Naspers Ltd. Class N | 171,800 | 22,271,558 | |
| Starz Series A (a) | 198,900 | 7,480,629 | |
| 106,847,072 | |||
| Movies & Entertainment - 9.7% | |||
| Lions Gate Entertainment Corp. | 257,100 | 9,432,999 | |
| The Walt Disney Co. | 896,247 | 91,309,644 | |
| Time Warner, Inc. | 254,600 | 18,102,060 | |
| 118,844,703 | |||
| TOTAL MEDIA | 259,190,197 | ||
| Multiline Retail - 2.6% | |||
| Department Stores - 2.0% | |||
| Macy's, Inc. | 422,600 | 24,768,586 | |
| General Merchandise Stores - 0.6% | |||
| B&M European Value Retail S.A. | 1,321,994 | 6,562,520 | |
| TOTAL MULTILINE RETAIL | 31,331,106 | ||
| Software - 0.6% | |||
| Application Software - 0.6% | |||
| Mobileye NV (b)(a) | 133,600 | 7,556,416 | |
| Home Entertainment Software - 0.0% | |||
| Playtech Ltd. | 21,062 | 277,141 | |
| TOTAL SOFTWARE | 7,833,557 | ||
| Specialty Retail - 19.6% | |||
| Apparel Retail - 8.8% | |||
| L Brands, Inc. | 686,425 | 57,591,058 | |
| Ross Stores, Inc. | 662,359 | 32,203,895 | |
| TJX Companies, Inc. | 112,695 | 7,924,712 | |
| United Arrows Ltd. | 77,800 | 3,069,130 | |
| Zumiez, Inc. (a) | 312,036 | 7,273,559 | |
| 108,062,354 | |||
| Automotive Retail - 4.1% | |||
| AutoZone, Inc. (a) | 35,700 | 25,560,843 | |
| O'Reilly Automotive, Inc. (a) | 102,086 | 24,507,786 | |
| 50,068,629 | |||
| Home Improvement Retail - 5.1% | |||
| Home Depot, Inc. | 532,400 | 62,003,304 | |
| Specialty Stores - 1.6% | |||
| Staples, Inc. | 1,356,759 | 19,279,545 | |
| TOTAL SPECIALTY RETAIL | 239,413,832 | ||
| Textiles, Apparel & Luxury Goods - 6.4% | |||
| Apparel, Accessories & Luxury Goods - 1.4% | |||
| G-III Apparel Group Ltd. (a) | 241,536 | 16,745,691 | |
| Footwear - 5.0% | |||
| NIKE, Inc. Class B | 551,475 | 61,627,331 | |
| TOTAL TEXTILES, APPAREL & LUXURY GOODS | 78,373,022 | ||
| TOTAL COMMON STOCKS | |||
| (Cost $1,099,934,905) | 1,209,621,004 | ||
| Money Market Funds - 6.8% | |||
| Fidelity Cash Central Fund, 0.15% (c) | 19,569,297 | 19,569,297 | |
| Fidelity Securities Lending Cash Central Fund, 0.19% (c)(d) | 63,986,025 | 63,986,025 | |
| TOTAL MONEY MARKET FUNDS | |||
| (Cost $83,555,322) | 83,555,322 | ||
| TOTAL INVESTMENT PORTFOLIO - 105.7% | |||
| (Cost $1,183,490,227) | 1,293,176,326 | ||
| NET OTHER ASSETS (LIABILITIES) - (5.7)% | (69,426,135) | ||
| NET ASSETS - 100% | $1,223,750,191 |
Legend
(a) Non-income producing
(b) Security or a portion of the security is on loan at period end.
(c) Affiliated fund that is generally available only to investment companies and other accounts managed by Fidelity Investments. The rate quoted is the annualized seven-day yield of the fund at period end. A complete unaudited listing of the fund's holdings as of its most recent quarter end is available upon request. In addition, each Fidelity Central Fund's financial statements are available on the SEC's website or upon request.
(d) Investment made with cash collateral received from securities on loan.
Affiliated Central Funds
Information regarding fiscal year to date income earned by the Fund from investments in Fidelity Central Funds is as follows:
| Fund | Income earned |
| Fidelity Cash Central Fund | $13,292 |
| Fidelity Securities Lending Cash Central Fund | 86,236 |
| Total | $99,528 |
Investment Valuation
The following is a summary of the inputs used, as of August 31, 2015, involving the Fund's assets and liabilities carried at fair value. The inputs or methodology used for valuing securities may not be an indication of the risk associated with investing in those securities. For more information on valuation inputs, and their aggregation into the levels used below, please refer to the Investment Valuation section in the accompanying Notes to Financial Statements.
| Valuation Inputs at Reporting Date: | ||||
| Description | Total | Level 1 | Level 2 | Level 3 |
| Investments in Securities: | ||||
| Common Stocks | $1,209,621,004 | $1,203,418,921 | $6,202,083 | $-- |
| Money Market Funds | 83,555,322 | 83,555,322 | -- | -- |
| Total Investments in Securities: | $1,293,176,326 | $1,286,974,243 | $6,202,083 | $-- |
Other Information
Distribution of investments by country or territory of incorporation, as a percentage of Total Net Assets, is as follows (Unaudited):
| United States of America | 86.7% |
| United Kingdom | 4.9% |
| Bailiwick of Jersey | 2.1% |
| South Africa | 1.9% |
| Canada | 1.1% |
| Cayman Islands | 1.1% |
| Others (Individually Less Than 1%) | 2.2% |
| 100.0% |
See accompanying notes which are an integral part of the financial statements.
Consumer Discretionary Portfolio
Financial Statements
Statement of Assets and Liabilities
| August 31, 2015 (Unaudited) | ||
| Assets | ||
| Investment in securities, at value (including securities loaned of $61,984,399) — See accompanying schedule: Unaffiliated issuers (cost $1,099,934,905) | $1,209,621,004 | |
| Fidelity Central Funds (cost $83,555,322) | 83,555,322 | |
| Total Investments (cost $1,183,490,227) | $1,293,176,326 | |
| Receivable for investments sold | 2,693,353 | |
| Receivable for fund shares sold | 1,880,964 | |
| Dividends receivable | 963,736 | |
| Distributions receivable from Fidelity Central Funds | 29,225 | |
| Prepaid expenses | 9,366 | |
| Other receivables | 19,762 | |
| Total assets | 1,298,772,732 | |
| Liabilities | ||
| Payable for investments purchased | $6,150,909 | |
| Payable for fund shares redeemed | 4,067,744 | |
| Accrued management fee | 572,643 | |
| Other affiliated payables | 201,055 | |
| Other payables and accrued expenses | 44,165 | |
| Collateral on securities loaned, at value | 63,986,025 | |
| Total liabilities | 75,022,541 | |
| Net Assets | $1,223,750,191 | |
| Net Assets consist of: | ||
| Paid in capital | $1,097,581,261 | |
| Undistributed net investment income | 3,572,561 | |
| Accumulated undistributed net realized gain (loss) on investments and foreign currency transactions | 12,914,090 | |
| Net unrealized appreciation (depreciation) on investments and assets and liabilities in foreign currencies | 109,682,279 | |
| Net Assets, for 36,389,104 shares outstanding | $1,223,750,191 | |
| Net Asset Value, offering price and redemption price per share ($1,223,750,191 ÷ 36,389,104 shares) | $33.63 |
See accompanying notes which are an integral part of the financial statements.
Statement of Operations
| Six months ended August 31, 2015 (Unaudited) | ||
| Investment Income | ||
| Dividends | $7,906,398 | |
| Income from Fidelity Central Funds | 99,528 | |
| Total income | 8,005,926 | |
| Expenses | ||
| Management fee | $3,205,647 | |
| Transfer agent fees | 968,689 | |
| Accounting and security lending fees | 190,915 | |
| Custodian fees and expenses | 26,935 | |
| Independent trustees' compensation | 9,519 | |
| Registration fees | 71,314 | |
| Audit | 24,078 | |
| Legal | 6,495 | |
| Miscellaneous | 5,713 | |
| Total expenses before reductions | 4,509,305 | |
| Expense reductions | (82,324) | 4,426,981 |
| Net investment income (loss) | 3,578,945 | |
| Realized and Unrealized Gain (Loss)
Net realized gain (loss) on: | ||
| Investment securities: | ||
| Unaffiliated issuers (net of foreign taxes of $74,206) | 14,157,105 | |
| Foreign currency transactions | (10,186) | |
| Total net realized gain (loss) | 14,146,919 | |
| Change in net unrealized appreciation (depreciation) on: Investment securities (net of decrease in deferred foreign taxes of $355,571) | (51,952,240) | |
| Assets and liabilities in foreign currencies | (757) | |
| Total change in net unrealized appreciation (depreciation) | (51,952,997) | |
| Net gain (loss) | (37,806,078) | |
| Net increase (decrease) in net assets resulting from operations | $(34,227,133) |
See accompanying notes which are an integral part of the financial statements.
Statement of Changes in Net Assets
| Six months ended August 31, 2015 (Unaudited) | Year ended February 28, 2015 | |
| Increase (Decrease) in Net Assets | ||
| Operations | ||
| Net investment income (loss) | $3,578,945 | $3,926,598 |
| Net realized gain (loss) | 14,146,919 | 77,731,562 |
| Change in net unrealized appreciation (depreciation) | (51,952,997) | 50,665,375 |
| Net increase (decrease) in net assets resulting from operations | (34,227,133) | 132,323,535 |
| Distributions to shareholders from net investment income | (900,053) | (2,942,822) |
| Distributions to shareholders from net realized gain | (22,253,041) | (64,572,472) |
| Total distributions | (23,153,094) | (67,515,294) |
| Share transactions | ||
| Proceeds from sales of shares | 261,407,536 | 953,129,672 |
| Reinvestment of distributions | 22,880,138 | 66,769,010 |
| Cost of shares redeemed | (82,157,219) | (563,595,486) |
| Net increase (decrease) in net assets resulting from share transactions | 202,130,455 | 456,303,196 |
| Redemption fees | 11,749 | 8,470 |
| Total increase (decrease) in net assets | 144,761,977 | 521,119,907 |
| Net Assets | ||
| Beginning of period | 1,078,988,214 | 557,868,307 |
| End of period (including undistributed net investment income of $3,572,561 and undistributed net investment income of $893,669, respectively) | $1,223,750,191 | $1,078,988,214 |
| Other Information
Shares | ||
| Sold | 7,490,878 | 29,777,744 |
| Issued in reinvestment of distributions | 650,558 | 2,124,019 |
| Redeemed | (2,382,091) | (18,022,350) |
| Net increase (decrease) | 5,759,345 | 13,879,413 |
See accompanying notes which are an integral part of the financial statements.
Financial Highlights — Consumer Discretionary Portfolio
| Six months ended (Unaudited) | Years ended February 28, | |||||
| August 31, | 2015 | 2015 | 2014 | 2013 | 2012 A | 2011 |
| Selected Per–Share Data | ||||||
| Net asset value, beginning of period | $35.23 | $33.30 | $27.40 | $25.97 | $24.98 | $19.37 |
| Income from Investment Operations | ||||||
| Net investment income (loss)B | .11 | .15 | .04 | .11 | .17 | .05 |
| Net realized and unrealized gain (loss) | (.96) | 4.39 | 8.67 | 3.70 | 1.91 | 5.71 |
| Total from investment operations | (.85) | 4.54 | 8.71 | 3.81 | 2.08 | 5.76 |
| Distributions from net investment income | (.03) | (.11) | (.03) | (.11) | (.12) | (.05) |
| Distributions from net realized gain | (.72) | (2.51) | (2.77) | (2.27) | (.97) | (.10) |
| Total distributions | (.75) | (2.61)C | (2.81)D | (2.38) | (1.09) | (.15) |
| Redemption fees added to paid in capitalB,E | – | – | – | – | – | – |
| Net asset value, end of period | $33.63 | $35.23 | $33.30 | $27.40 | $25.97 | $24.98 |
| Total ReturnF,G | (2.52)% | 14.79% | 32.17% | 15.38% | 8.67% | 29.75% |
| Ratios to Average Net AssetsH,I | ||||||
| Expenses before reductions | .77%J | .79% | .82% | .86% | .89% | .96% |
| Expenses net of fee waivers, if any | .77%J | .79% | .82% | .86% | .89% | .96% |
| Expenses net of all reductions | .76%J | .79% | .81% | .84% | .88% | .95% |
| Net investment income (loss) | .61%J | .46% | .14% | .43% | .72% | .23% |
| Supplemental Data | ||||||
| Net assets, end of period (000 omitted) | $1,223,750 | $1,078,988 | $557,868 | $397,925 | $278,524 | $203,083 |
| Portfolio turnover rateK | 61%J | 109%L | 138% | 170% | 174% | 196% |
A For the year ended February 29.
B Calculated based on average shares outstanding during the period.
C Total distributions of $2.61 per share is comprised of distributions from net investment income of $.105 and distributions from net realized gain of $2.508 per share.
D Total distributions of $2.81 per share is comprised of distributions from net investment income of $.034 and distributions from net realized gain of $2.772 per share.
E Amount represents less than $.005 per share.
F Total returns for periods of less than one year are not annualized.
G Total returns would have been lower if certain expenses had not been reduced during the applicable periods shown.
H Fees and expenses of any underlying Fidelity Central Funds are not included in the Fund's expense ratio. The Fund indirectly bears its proportionate share of the expenses of any underlying Fidelity Central Funds.
I Expense ratios reflect operating expenses of the Fund. Expenses before reductions do not reflect amounts reimbursed by the investment adviser or reductions from brokerage service arrangements or reductions from other expense offset arrangements and do not represent the amount paid by the Fund during periods when reimbursements or reductions occur. Expenses net of fee waivers reflect expenses after reimbursement by the investment adviser but prior to reductions from brokerage service arrangements or other expense offset arrangements. Expenses net of all reductions represent the net expenses paid by the Fund.
J Annualized
K Amount does not include the portfolio activity of any underlying Fidelity Central Funds.
L Portfolio turnover rate excludes securities received or delivered in-kind.
See accompanying notes which are an integral part of the financial statements.
Leisure Portfolio
Investment Summary (Unaudited)
Top Ten Stocks as of August 31, 2015
| % of fund's net assets | % of fund's net assets 6 months ago | |
| Starbucks Corp. | 18.4 | 16.9 |
| Yum! Brands, Inc. | 9.5 | 9.5 |
| McDonald's Corp. | 6.8 | 3.9 |
| Chipotle Mexican Grill, Inc. | 5.9 | 6.0 |
| Las Vegas Sands Corp. | 5.7 | 7.3 |
| Wyndham Worldwide Corp. | 5.0 | 5.7 |
| Marriott International, Inc. Class A | 4.0 | 4.7 |
| Hilton Worldwide Holdings, Inc. | 3.8 | 1.4 |
| Starwood Hotels & Resorts Worldwide, Inc. | 3.4 | 4.7 |
| Jack in the Box, Inc. | 2.8 | 3.0 |
| 65.3 |
Top Industries (% of fund's net assets)
| As of August 31, 2015 | ||
| Hotels, Restaurants & Leisure | 89.1% | |
| Diversified Consumer Services | 3.4% | |
| Internet Software & Services | 1.4% | |
| Commercial Services & Supplies | 0.8% | |
| Specialty Retail | 0.7% | |
| All Others* | 4.6% | |

| As of February 28, 2015 | ||
| Hotels, Restaurants & Leisure | 90.1% | |
| Diversified Consumer Services | 3.5% | |
| Media | 1.6% | |
| Specialty Retail | 0.8% | |
| Commercial Services & Supplies | 0.8% | |
| All Others* | 3.2% | |

* Includes short-term investments and net other assets (liabilities).
Leisure Portfolio
Investments August 31, 2015 (Unaudited)
Showing Percentage of Net Assets
| Common Stocks - 98.7% | |||
| Shares | Value | ||
| Automobiles - 0.2% | |||
| Automobile Manufacturers - 0.2% | |||
| General Motors Co. | 34,000 | $1,000,960 | |
| Commercial Services & Supplies - 0.8% | |||
| Diversified Support Services - 0.8% | |||
| KAR Auction Services, Inc. | 102,200 | 3,785,488 | |
| Diversified Consumer Services - 3.4% | |||
| Education Services - 1.5% | |||
| Houghton Mifflin Harcourt Co. (a) | 331,932 | 7,495,025 | |
| Specialized Consumer Services - 1.9% | |||
| H&R Block, Inc. | 201,600 | 6,858,432 | |
| ServiceMaster Global Holdings, Inc. (a) | 62,012 | 2,181,582 | |
| 9,040,014 | |||
| TOTAL DIVERSIFIED CONSUMER SERVICES | 16,535,039 | ||
| Food Products - 0.5% | |||
| Packaged Foods & Meats - 0.5% | |||
| Amplify Snack Brands, Inc. | 59,700 | 786,846 | |
| Blue Buffalo Pet Products, Inc. (a) | 2,100 | 53,655 | |
| Greencore Group PLC | 329,000 | 1,500,921 | |
| 2,341,422 | |||
| Hotels, Restaurants & Leisure - 89.1% | |||
| Casinos & Gaming - 8.2% | |||
| Las Vegas Sands Corp. | 598,976 | 27,690,660 | |
| Melco Crown Entertainment Ltd. sponsored ADR (b) | 105,335 | 1,856,003 | |
| MGM China Holdings Ltd. | 548,800 | 907,816 | |
| MGM Mirage, Inc. (a) | 225,700 | 4,611,051 | |
| Sands China Ltd. | 44,800 | 155,498 | |
| Scientific Games Corp. Class A (b)(a) | 129,295 | 1,424,831 | |
| Wynn Resorts Ltd. (b) | 40,600 | 3,047,030 | |
| 39,692,889 | |||
| Hotels, Resorts & Cruise Lines - 18.4% | |||
| Accor SA | 12,800 | 607,290 | |
| Extended Stay America, Inc. unit | 534,373 | 10,030,181 | |
| Hilton Worldwide Holdings, Inc. | 749,500 | 18,610,085 | |
| Interval Leisure Group, Inc. | 1,000 | 20,060 | |
| Marriott International, Inc. Class A | 275,396 | 19,459,481 | |
| Starwood Hotels & Resorts Worldwide, Inc. | 228,690 | 16,344,474 | |
| Wyndham Worldwide Corp. | 316,002 | 24,167,833 | |
| 89,239,404 | |||
| Leisure Facilities - 2.5% | |||
| Cedar Fair LP (depositary unit) | 66,688 | 3,679,844 | |
| Vail Resorts, Inc. | 77,089 | 8,318,674 | |
| 11,998,518 | |||
| Restaurants - 60.0% | |||
| Buffalo Wild Wings, Inc. (a) | 29,100 | 5,519,688 | |
| Chipotle Mexican Grill, Inc. (a) | 40,010 | 28,407,500 | |
| Dave & Buster's Entertainment, Inc. | 59,400 | 2,045,736 | |
| Del Frisco's Restaurant Group, Inc. (a) | 87,700 | 1,301,468 | |
| DineEquity, Inc. | 30,849 | 2,946,080 | |
| Domino's Pizza, Inc. | 96,000 | 10,170,240 | |
| Dunkin' Brands Group, Inc. (b) | 210,600 | 10,563,696 | |
| Fiesta Restaurant Group, Inc. (a) | 191,808 | 9,904,965 | |
| Jack in the Box, Inc. | 171,087 | 13,375,582 | |
| McDonald's Corp. | 348,544 | 33,118,651 | |
| Panera Bread Co. Class A (a) | 46,986 | 8,377,604 | |
| Papa John's International, Inc. | 111,576 | 7,503,486 | |
| Red Robin Gourmet Burgers, Inc. (a) | 23,118 | 1,821,467 | |
| Ruth's Hospitality Group, Inc. | 590,140 | 9,489,451 | |
| Sonic Corp. | 313,960 | 8,476,920 | |
| Starbucks Corp. | 1,627,100 | 89,018,640 | |
| Whitbread PLC | 36,285 | 2,670,938 | |
| Wingstop, Inc. | 300 | 8,208 | |
| Yum! Brands, Inc. | 575,836 | 45,934,438 | |
| 290,654,758 | |||
| TOTAL HOTELS, RESTAURANTS & LEISURE | 431,585,569 | ||
| Internet & Catalog Retail - 0.2% | |||
| Internet Retail - 0.2% | |||
| Etsy, Inc. (b) | 82,229 | 1,178,342 | |
| Internet Software & Services - 1.4% | |||
| Internet Software & Services - 1.4% | |||
| Alibaba Group Holding Ltd. sponsored ADR | 8,000 | 528,960 | |
| Facebook, Inc. Class A (a) | 25,800 | 2,307,294 | |
| HomeAway, Inc. (a) | 50,589 | 1,451,398 | |
| JUST EAT Ltd. (a) | 212,400 | 1,284,481 | |
| Yahoo!, Inc. (a) | 36,600 | 1,179,984 | |
| 6,752,117 | |||
| IT Services - 0.2% | |||
| Data Processing & Outsourced Services - 0.2% | |||
| Visa, Inc. Class A | 13,200 | 941,160 | |
| Media - 0.7% | |||
| Movies & Entertainment - 0.7% | |||
| The Walt Disney Co. | 12,200 | 1,242,936 | |
| Twenty-First Century Fox, Inc. Class A | 79,800 | 2,185,722 | |
| 3,428,658 | |||
| Personal Products - 0.6% | |||
| Personal Products - 0.6% | |||
| Nu Skin Enterprises, Inc. Class A (b) | 60,100 | 2,745,368 | |
| Real Estate Investment Trusts - 0.2% | |||
| Specialized REITs - 0.2% | |||
| Gaming & Leisure Properties | 30,995 | 958,985 | |
| Software - 0.4% | |||
| Application Software - 0.4% | |||
| Intuit, Inc. | 20,000 | 1,715,000 | |
| Specialty Retail - 0.7% | |||
| Computer & Electronics Retail - 0.4% | |||
| GameStop Corp. Class A | 52,800 | 2,242,944 | |
| Specialty Stores - 0.3% | |||
| Sally Beauty Holdings, Inc. (a) | 53,000 | 1,385,420 | |
| TOTAL SPECIALTY RETAIL | 3,628,364 | ||
| Textiles, Apparel & Luxury Goods - 0.3% | |||
| Apparel, Accessories & Luxury Goods - 0.3% | |||
| Kate Spade & Co. (a) | 70,100 | 1,329,096 | |
| TOTAL COMMON STOCKS | |||
| (Cost $334,606,237) | 477,925,568 | ||
| Money Market Funds - 4.2% | |||
| Fidelity Cash Central Fund, 0.15% (c) | 5,944,915 | 5,944,915 | |
| Fidelity Securities Lending Cash Central Fund, 0.19% (c)(d) | 14,650,897 | 14,650,897 | |
| TOTAL MONEY MARKET FUNDS | |||
| (Cost $20,595,812) | 20,595,812 | ||
| TOTAL INVESTMENT PORTFOLIO - 102.9% | |||
| (Cost $355,202,049) | 498,521,380 | ||
| NET OTHER ASSETS (LIABILITIES) - (2.9)% | (14,077,723) | ||
| NET ASSETS - 100% | $484,443,657 |
Legend
(a) Non-income producing
(b) Security or a portion of the security is on loan at period end.
(c) Affiliated fund that is generally available only to investment companies and other accounts managed by Fidelity Investments. The rate quoted is the annualized seven-day yield of the fund at period end. A complete unaudited listing of the fund's holdings as of its most recent quarter end is available upon request. In addition, each Fidelity Central Fund's financial statements are available on the SEC's website or upon request.
(d) Investment made with cash collateral received from securities on loan.
Affiliated Central Funds
Information regarding fiscal year to date income earned by the Fund from investments in Fidelity Central Funds is as follows:
| Fund | Income earned |
| Fidelity Cash Central Fund | $2,718 |
| Fidelity Securities Lending Cash Central Fund | 54,261 |
| Total | $56,979 |
Investment Valuation
All investments are categorized as Level 1 under the Fair Value Hierarchy. The inputs or methodology used for valuing securities may not be an indication of the risk associated with investing in those securities. For more information on valuation inputs please refer to the Investment Valuation section in the accompanying Notes to Financial Statements.
See accompanying notes which are an integral part of the financial statements.
Leisure Portfolio
Financial Statements
Statement of Assets and Liabilities
| August 31, 2015 (Unaudited) | ||
| Assets | ||
| Investment in securities, at value (including securities loaned of $13,836,759) — See accompanying schedule: Unaffiliated issuers (cost $334,606,237) | $477,925,568 | |
| Fidelity Central Funds (cost $20,595,812) | 20,595,812 | |
| Total Investments (cost $355,202,049) | $498,521,380 | |
| Receivable for investments sold | 240,455 | |
| Receivable for fund shares sold | 1,518,473 | |
| Dividends receivable | 695,921 | |
| Distributions receivable from Fidelity Central Funds | 19,073 | |
| Prepaid expenses | 3,693 | |
| Other receivables | 2,950 | |
| Total assets | 501,001,945 | |
| Liabilities | ||
| Payable for investments purchased | $1,313,993 | |
| Payable for fund shares redeemed | 254,631 | |
| Accrued management fee | 229,703 | |
| Other affiliated payables | 88,928 | |
| Other payables and accrued expenses | 20,136 | |
| Collateral on securities loaned, at value | 14,650,897 | |
| Total liabilities | 16,558,288 | |
| Net Assets | $484,443,657 | |
| Net Assets consist of: | ||
| Paid in capital | $326,194,067 | |
| Undistributed net investment income | 2,415,521 | |
| Accumulated undistributed net realized gain (loss) on investments and foreign currency transactions | 12,514,753 | |
| Net unrealized appreciation (depreciation) on investments and assets and liabilities in foreign currencies | 143,319,316 | |
| Net Assets, for 3,558,384 shares outstanding | $484,443,657 | |
| Net Asset Value, offering price and redemption price per share ($484,443,657 ÷ 3,558,384 shares) | $136.14 |
See accompanying notes which are an integral part of the financial statements.
Statement of Operations
| Six months ended August 31, 2015 (Unaudited) | ||
| Investment Income | ||
| Dividends | $4,436,817 | |
| Income from Fidelity Central Funds | 56,979 | |
| Total income | 4,493,796 | |
| Expenses | ||
| Management fee | $1,284,154 | |
| Transfer agent fees | 411,867 | |
| Accounting and security lending fees | 92,570 | |
| Custodian fees and expenses | 5,117 | |
| Independent trustees' compensation | 3,899 | |
| Registration fees | 25,034 | |
| Audit | 20,809 | |
| Legal | 2,745 | |
| Interest | 254 | |
| Miscellaneous | 2,792 | |
| Total expenses before reductions | 1,849,241 | |
| Expense reductions | (25,590) | 1,823,651 |
| Net investment income (loss) | 2,670,145 | |
| Realized and Unrealized Gain (Loss)
Net realized gain (loss) on: | ||
| Investment securities: | ||
| Unaffiliated issuers | 15,936,158 | |
| Foreign currency transactions | 95 | |
| Total net realized gain (loss) | 15,936,253 | |
| Change in net unrealized appreciation (depreciation) on: Investment securities | (26,457,587) | |
| Assets and liabilities in foreign currencies | 239 | |
| Total change in net unrealized appreciation (depreciation) | (26,457,348) | |
| Net gain (loss) | (10,521,095) | |
| Net increase (decrease) in net assets resulting from operations | $(7,850,950) |
See accompanying notes which are an integral part of the financial statements.
Statement of Changes in Net Assets
| Six months ended August 31, 2015 (Unaudited) | Year ended February 28, 2015 | |
| Increase (Decrease) in Net Assets | ||
| Operations | ||
| Net investment income (loss) | $2,670,145 | $4,640,549 |
| Net realized gain (loss) | 15,936,253 | 90,218,609 |
| Change in net unrealized appreciation (depreciation) | (26,457,348) | (44,238,899) |
| Net increase (decrease) in net assets resulting from operations | (7,850,950) | 50,620,259 |
| Distributions to shareholders from net investment income | (560,154) | (4,879,767) |
| Distributions to shareholders from net realized gain | (7,275,551) | (33,240,879) |
| Total distributions | (7,835,705) | (38,120,646) |
| Share transactions | ||
| Proceeds from sales of shares | 107,812,812 | 67,372,454 |
| Reinvestment of distributions | 7,456,071 | 36,550,960 |
| Cost of shares redeemed | (60,440,789) | (239,280,764) |
| Net increase (decrease) in net assets resulting from share transactions | 54,828,094 | (135,357,350) |
| Redemption fees | 6,417 | 4,103 |
| Total increase (decrease) in net assets | 39,147,856 | (122,853,634) |
| Net Assets | ||
| Beginning of period | 445,295,801 | 568,149,435 |
| End of period (including undistributed net investment income of $2,415,521 and undistributed net investment income of $305,530, respectively) | $484,443,657 | $445,295,801 |
| Other Information
Shares | ||
| Sold | 760,886 | 512,008 |
| Issued in reinvestment of distributions | 53,182 | 287,167 |
| Redeemed | (433,504) | (1,828,098) |
| Net increase (decrease) | 380,564 | (1,028,923) |
See accompanying notes which are an integral part of the financial statements.
Financial Highlights — Leisure Portfolio
| Six months ended (Unaudited) | Years ended February 28, | |||||
| August 31, | 2015 | 2015 | 2014 | 2013 | 2012 A | 2011 |
| Selected Per–Share Data | ||||||
| Net asset value, beginning of period | $140.13 | $135.06 | $108.30 | $106.53 | $91.26 | $69.99 |
| Income from Investment Operations | ||||||
| Net investment income (loss)B | .80 | 1.31 | 1.40C | 1.40D | .64 | .55 |
| Net realized and unrealized gain (loss) | (2.34) | 14.80 | 35.09 | 6.22 | 14.73 | 21.22 |
| Total from investment operations | (1.54) | 16.11 | 36.49 | 7.62 | 15.37 | 21.77 |
| Distributions from net investment income | (.18) | (1.47) | (1.01) | (1.36) | (.09) | (.52) |
| Distributions from net realized gain | (2.27) | (9.57) | (8.72) | (4.50) | (.01) | – |
| Total distributions | (2.45) | (11.04) | (9.73) | (5.86) | (.10) | (.52) |
| Redemption fees added to paid in capitalB | –E | –E | –E | .01 | –E | .02 |
| Net asset value, end of period | $136.14 | $140.13 | $135.06 | $108.30 | $106.53 | $91.26 |
| Total ReturnF,G | (1.15)% | 12.91% | 34.71% | 7.52% | 16.85% | 31.16% |
| Ratios to Average Net AssetsH,I | ||||||
| Expenses before reductions | .79%J | .80% | .82% | .85% | .86% | .90% |
| Expenses net of fee waivers, if any | .78%J | .80% | .82% | .85% | .86% | .90% |
| Expenses net of all reductions | .78%J | .80% | .81% | .83% | .86% | .89% |
| Net investment income (loss) | 1.14%J | 1.00% | 1.13%C | 1.33%D | .68% | .66% |
| Supplemental Data | ||||||
| Net assets, end of period (000 omitted) | $484,444 | $445,296 | $568,149 | $347,701 | $440,507 | $411,239 |
| Portfolio turnover rateK | 37%J | 32%L | 65% | 90% | 77% | 112% |
A For the year ended February 29.
B Calculated based on average shares outstanding during the period.
C Investment income per share reflects a large, non-recurring dividend which amounted to $.43 per share. Excluding this non-recurring dividend, the ratio of net investment income (loss) to average net assets would have been .79%.
D Investment income per share reflects a large, non-recurring dividend which amounted to $.53 per share. Excluding this non-recurring dividend, the ratio of net investment income (loss) to average net assets would have been .82%.
E Amount represents less than $.005 per share.
F Total returns for periods of less than one year are not annualized.
G Total returns would have been lower if certain expenses had not been reduced during the applicable periods shown.
H Fees and expenses of any underlying Fidelity Central Funds are not included in the Fund's expense ratio. The Fund indirectly bears its proportionate share of the expenses of any underlying Fidelity Central Funds.
I Expense ratios reflect operating expenses of the Fund. Expenses before reductions do not reflect amounts reimbursed by the investment adviser or reductions from brokerage service arrangements or reductions from other expense offset arrangements and do not represent the amount paid by the Fund during periods when reimbursements or reductions occur. Expenses net of fee waivers reflect expenses after reimbursement by the investment adviser but prior to reductions from brokerage service arrangements or other expense offset arrangements. Expenses net of all reductions represent the net expenses paid by the Fund.
J Annualized
K Amount does not include the portfolio activity of any underlying Fidelity Central Funds.
L Portfolio turnover rate excludes securities received or delivered in-kind.
See accompanying notes which are an integral part of the financial statements.
Multimedia Portfolio
Investment Summary (Unaudited)
Top Ten Stocks as of August 31, 2015
| % of fund's net assets | % of fund's net assets 6 months ago | |
| The Walt Disney Co. | 24.8 | 23.0 |
| Comcast Corp. Class A | 18.1 | 18.3 |
| Charter Communications, Inc. Class A | 5.0 | 3.4 |
| Time Warner Cable, Inc. | 5.0 | 4.7 |
| Time Warner, Inc. | 4.9 | 8.9 |
| Liberty Global PLC Class C | 4.6 | 4.0 |
| Lions Gate Entertainment Corp. | 3.5 | 1.8 |
| Facebook, Inc. Class A | 2.8 | 3.0 |
| AMC Networks, Inc. Class A | 2.8 | 0.0 |
| Starz Series A | 2.4 | 0.0 |
| 73.9 |
Top Industries (% of fund's net assets)
| As of August 31, 2015 | ||
| Media | 88.2% | |
| Internet & Catalog Retail | 5.2% | |
| Internet Software & Services | 3.9% | |
| IT Services | 1.5% | |
| All Others* | 1.2% | |

| As of February 28, 2015 | ||
| Media | 92.4% | |
| Internet Software & Services | 5.7% | |
| Communications Equipment | 1.7% | |
| All Others* | 0.2% | |

* Includes short-term investments and net other assets (liabilities).
Percentages shown as 0.0% may reflect amounts less than 0.05%.
Multimedia Portfolio
Investments August 31, 2015 (Unaudited)
Showing Percentage of Net Assets
| Common Stocks - 98.8% | |||
| Shares | Value | ||
| Internet & Catalog Retail - 5.2% | |||
| Internet Retail - 5.2% | |||
| Expedia, Inc. | 100,700 | $11,579,493 | |
| Netflix, Inc. (a) | 125,800 | 14,470,774 | |
| Wayfair LLC Class A (b) | 316,100 | 11,790,530 | |
| 37,840,797 | |||
| Internet Software & Services - 3.9% | |||
| Internet Software & Services - 3.9% | |||
| Facebook, Inc. Class A (a) | 228,800 | 20,461,584 | |
| Google, Inc.: | |||
| Class A (a) | 6,200 | 4,016,484 | |
| Class C | 6,514 | 4,027,281 | |
| 28,505,349 | |||
| IT Services - 1.5% | |||
| Data Processing & Outsourced Services - 1.5% | |||
| PayPal Holdings, Inc. (a) | 313,600 | 10,976,000 | |
| Media - 88.2% | |||
| Advertising - 1.8% | |||
| Interpublic Group of Companies, Inc. | 394,000 | 7,438,720 | |
| Omnicom Group, Inc. | 79,700 | 5,338,306 | |
| 12,777,026 | |||
| Broadcasting - 5.5% | |||
| CBS Corp. Class B | 317,700 | 14,372,748 | |
| Cumulus Media, Inc. Class A (a) | 210 | 300 | |
| Discovery Communications, Inc.: | |||
| Class A (a) | 450 | 11,970 | |
| Class C (non-vtg.) (a) | 92,300 | 2,340,728 | |
| Entercom Communications Corp. Class A (a) | 3,053 | 33,644 | |
| Liberty Media Corp.: | |||
| Class A (a) | 39,893 | 1,486,014 | |
| Class C (a) | 121,286 | 4,392,979 | |
| Media General, Inc. (b)(a) | 726,900 | 8,541,075 | |
| Nexstar Broadcasting Group, Inc. Class A | 195,046 | 9,065,738 | |
| 40,245,196 | |||
| Cable & Satellite - 40.5% | |||
| AMC Networks, Inc. Class A (a) | 282,000 | 20,411,160 | |
| Charter Communications, Inc. Class A (b)(a) | 200,700 | 36,449,127 | |
| Comcast Corp. Class A | 2,347,050 | 132,209,327 | |
| DISH Network Corp. Class A (a) | 164,400 | 9,743,988 | |
| Liberty Broadband Corp.: | |||
| Class A (a) | 35,623 | 1,940,385 | |
| Class C (a) | 93,340 | 4,996,490 | |
| Liberty Global PLC: | |||
| Class A (a) | 43,438 | 2,090,237 | |
| Class C (a) | 747,747 | 33,551,408 | |
| Starz Series A (a) | 461,802 | 17,368,373 | |
| Time Warner Cable, Inc. | 195,369 | 36,342,541 | |
| 295,103,036 | |||
| Movies & Entertainment - 40.4% | |||
| AMC Entertainment Holdings, Inc. Class A | 12,185 | 353,121 | |
| Lions Gate Entertainment Corp. (b) | 695,377 | 25,513,382 | |
| Live Nation Entertainment, Inc. (a) | 673,700 | 16,586,494 | |
| The Madison Square Garden Co. Class A (a) | 195,700 | 13,785,108 | |
| The Walt Disney Co. | 1,772,804 | 180,613,272 | |
| Time Warner, Inc. | 506,082 | 35,982,430 | |
| Twenty-First Century Fox, Inc. Class A | 577,107 | 15,806,961 | |
| Viacom, Inc. Class B (non-vtg.) | 138,900 | 5,662,953 | |
| 294,303,721 | |||
| Publishing - 0.0% | |||
| Gannett Co., Inc. | 6,937 | 90,944 | |
| TOTAL MEDIA | 642,519,923 | ||
| TOTAL COMMON STOCKS | |||
| (Cost $475,143,907) | 719,842,069 | ||
| Money Market Funds - 9.4% | |||
| Fidelity Cash Central Fund, 0.15% (c) | 259,736 | 259,736 | |
| Fidelity Securities Lending Cash Central Fund, 0.19% (c)(d) | 68,221,475 | 68,221,475 | |
| TOTAL MONEY MARKET FUNDS | |||
| (Cost $68,481,211) | 68,481,211 | ||
| TOTAL INVESTMENT PORTFOLIO - 108.2% | |||
| (Cost $543,625,118) | 788,323,280 | ||
| NET OTHER ASSETS (LIABILITIES) - (8.2)% | (59,766,677) | ||
| NET ASSETS - 100% | $728,556,603 |
Legend
(a) Non-income producing
(b) Security or a portion of the security is on loan at period end.
(c) Affiliated fund that is generally available only to investment companies and other accounts managed by Fidelity Investments. The rate quoted is the annualized seven-day yield of the fund at period end. A complete unaudited listing of the fund's holdings as of its most recent quarter end is available upon request. In addition, each Fidelity Central Fund's financial statements are available on the SEC's website or upon request.
(d) Investment made with cash collateral received from securities on loan.
Affiliated Central Funds
Information regarding fiscal year to date income earned by the Fund from investments in Fidelity Central Funds is as follows:
| Fund | Income earned |
| Fidelity Cash Central Fund | $2,711 |
| Fidelity Securities Lending Cash Central Fund | 121,809 |
| Total | $124,520 |
Investment Valuation
All investments are categorized as Level 1 under the Fair Value Hierarchy. The inputs or methodology used for valuing securities may not be an indication of the risk associated with investing in those securities. For more information on valuation inputs please refer to the Investment Valuation section in the accompanying Notes to Financial Statements.
See accompanying notes which are an integral part of the financial statements.
Multimedia Portfolio
Financial Statements
Statement of Assets and Liabilities
| August 31, 2015 (Unaudited) | ||
| Assets | ||
| Investment in securities, at value (including securities loaned of $65,658,129) — See accompanying schedule: Unaffiliated issuers (cost $475,143,907) | $719,842,069 | |
| Fidelity Central Funds (cost $68,481,211) | 68,481,211 | |
| Total Investments (cost $543,625,118) | $788,323,280 | |
| Receivable for investments sold | 32,013,844 | |
| Receivable for fund shares sold | 725,735 | |
| Dividends receivable | 381,928 | |
| Distributions receivable from Fidelity Central Funds | 38,478 | |
| Prepaid expenses | 6,257 | |
| Other receivables | 24,907 | |
| Total assets | 821,514,429 | |
| Liabilities | ||
| Payable for investments purchased | $20,741,925 | |
| Payable for fund shares redeemed | 3,448,402 | |
| Accrued management fee | 359,436 | |
| Other affiliated payables | 166,335 | |
| Other payables and accrued expenses | 20,253 | |
| Collateral on securities loaned, at value | 68,221,475 | |
| Total liabilities | 92,957,826 | |
| Net Assets | $728,556,603 | |
| Net Assets consist of: | ||
| Paid in capital | $449,795,775 | |
| Undistributed net investment income | 1,116,322 | |
| Accumulated undistributed net realized gain (loss) on investments | 32,946,344 | |
| Net unrealized appreciation (depreciation) on investments | 244,698,162 | |
| Net Assets, for 9,577,112 shares outstanding | $728,556,603 | |
| Net Asset Value, offering price and redemption price per share ($728,556,603 ÷ 9,577,112 shares) | $76.07 |
See accompanying notes which are an integral part of the financial statements.
Statement of Operations
| Six months ended August 31, 2015 (Unaudited) | ||
| Investment Income | ||
| Dividends | $4,176,284 | |
| Income from Fidelity Central Funds | 124,520 | |
| Total income | 4,300,804 | |
| Expenses | ||
| Management fee | $2,217,078 | |
| Transfer agent fees | 835,198 | |
| Accounting and security lending fees | 143,230 | |
| Custodian fees and expenses | 4,620 | |
| Independent trustees' compensation | 6,879 | |
| Registration fees | 30,899 | |
| Audit | 19,841 | |
| Legal | 5,143 | |
| Interest | 912 | |
| Miscellaneous | 5,804 | |
| Total expenses before reductions | 3,269,604 | |
| Expense reductions | (86,976) | 3,182,628 |
| Net investment income (loss) | 1,118,176 | |
| Realized and Unrealized Gain (Loss)
Net realized gain (loss) on: | ||
| Investment securities: | ||
| Unaffiliated issuers | 34,597,459 | |
| Total net realized gain (loss) | 34,597,459 | |
| Change in net unrealized appreciation (depreciation) on investment securities | (85,081,033) | |
| Net gain (loss) | (50,483,574) | |
| Net increase (decrease) in net assets resulting from operations | $(49,365,398) |
See accompanying notes which are an integral part of the financial statements.
Statement of Changes in Net Assets
| Six months ended August 31, 2015 (Unaudited) | Year ended February 28, 2015 | |
| Increase (Decrease) in Net Assets | ||
| Operations | ||
| Net investment income (loss) | $1,118,176 | $2,307,365 |
| Net realized gain (loss) | 34,597,459 | 84,462,999 |
| Change in net unrealized appreciation (depreciation) | (85,081,033) | (14,371,615) |
| Net increase (decrease) in net assets resulting from operations | (49,365,398) | 72,398,749 |
| Distributions to shareholders from net investment income | (173,696) | (2,039,294) |
| Distributions to shareholders from net realized gain | (15,043,981) | (70,422,213) |
| Total distributions | (15,217,677) | (72,461,507) |
| Share transactions | ||
| Proceeds from sales of shares | 109,345,373 | 212,392,932 |
| Reinvestment of distributions | 14,683,048 | 69,926,090 |
| Cost of shares redeemed | (133,889,119) | (488,279,180) |
| Net increase (decrease) in net assets resulting from share transactions | (9,860,698) | (205,960,158) |
| Redemption fees | 12,335 | 23,333 |
| Total increase (decrease) in net assets | (74,431,438) | (205,999,583) |
| Net Assets | ||
| Beginning of period | 802,988,041 | 1,008,987,624 |
| End of period (including undistributed net investment income of $1,116,322 and undistributed net investment income of $171,842, respectively) | $728,556,603 | $802,988,041 |
| Other Information
Shares | ||
| Sold | 1,311,693 | 2,629,387 |
| Issued in reinvestment of distributions | 178,387 | 892,056 |
| Redeemed | (1,649,087) | (6,128,688) |
| Net increase (decrease) | (159,007) | (2,607,245) |
See accompanying notes which are an integral part of the financial statements.
Financial Highlights — Multimedia Portfolio
| Six months ended (Unaudited) | Years ended February 28, | |||||
| August 31, | 2015 | 2015 | 2014 | 2013 | 2012 A | 2011 |
| Selected Per–Share Data | ||||||
| Net asset value, beginning of period | $82.48 | $81.74 | $61.55 | $48.48 | $47.80 | $34.39 |
| Income from Investment Operations | ||||||
| Net investment income (loss)B | .11 | .22 | .20 | .53C | .29 | .14 |
| Net realized and unrealized gain (loss) | (4.94) | 7.62 | 22.46 | 12.96 | .96 | 13.39 |
| Total from investment operations | (4.83) | 7.84 | 22.66 | 13.49 | 1.25 | 13.53 |
| Distributions from net investment income | (.02) | (.20) | (.19) | (.43) | (.32) | (.12) |
| Distributions from net realized gain | (1.56) | (6.89) | (2.30) | – | (.25) | – |
| Total distributions | (1.58) | (7.10)D | (2.48)E | (.43) | (.57) | (.12) |
| Redemption fees added to paid in capitalB | –F | –F | .01 | .01 | –F | –F |
| Net asset value, end of period | $76.07 | $82.48 | $81.74 | $61.55 | $48.48 | $47.80 |
| Total ReturnG,H | (6.00)% | 10.16% | 37.01% | 27.91% | 2.73% | 39.37% |
| Ratios to Average Net AssetsI,J | ||||||
| Expenses before reductions | .81%K | .81% | .81% | .88% | .90% | .94% |
| Expenses net of fee waivers, if any | .80%K | .81% | .81% | .88% | .90% | .94% |
| Expenses net of all reductions | .79%K | .81% | .80% | .88% | .90% | .94% |
| Net investment income (loss) | .28%K | .27% | .27% | .97%C | .64% | .37% |
| Supplemental Data | ||||||
| Net assets, end of period (000 omitted) | $728,557 | $802,988 | $1,008,988 | $657,366 | $183,157 | $205,920 |
| Portfolio turnover rateL | 66%K | 55% | 111% | 30% | 85% | 76% |
A For the year ended February 29.
B Calculated based on average shares outstanding during the period.
C Investment income per share reflects a large, non-recurring dividend which amounted to $.12 per share. Excluding this non-recurring dividend, the ratio of net investment income (loss) to average net assets would have been .76%.
D Total distributions of $7.10 per share is comprised of distributions from net investment income of $.204 and distributions from net realized gain of $6.892 per share.
E Total distributions of $2.48 per share is comprised of distributions from net investment income of $.187 and distributions from net realized gain of $2.295 per share.
F Amount represents less than $.005 per share.
G Total returns for periods of less than one year are not annualized.
H Total returns would have been lower if certain expenses had not been reduced during the applicable periods shown.
I Fees and expenses of any underlying Fidelity Central Funds are not included in the Fund's expense ratio. The Fund indirectly bears its proportionate share of the expenses of any underlying Fidelity Central Funds.
J Expense ratios reflect operating expenses of the Fund. Expenses before reductions do not reflect amounts reimbursed by the investment adviser or reductions from brokerage service arrangements or reductions from other expense offset arrangements and do not represent the amount paid by the Fund during periods when reimbursements or reductions occur. Expenses net of fee waivers reflect expenses after reimbursement by the investment adviser but prior to reductions from brokerage service arrangements or other expense offset arrangements. Expenses net of all reductions represent the net expenses paid by the Fund.
K Annualized
L Amount does not include the portfolio activity of any underlying Fidelity Central Funds.
See accompanying notes which are an integral part of the financial statements.
Retailing Portfolio
Investment Summary (Unaudited)
Top Ten Stocks as of August 31, 2015
| % of fund's net assets | % of fund's net assets 6 months ago | |
| Home Depot, Inc. | 16.3 | 17.9 |
| Amazon.com, Inc. | 14.6 | 9.0 |
| Priceline Group, Inc. | 7.1 | 9.8 |
| TJX Companies, Inc. | 5.1 | 6.2 |
| AutoZone, Inc. | 4.6 | 4.8 |
| O'Reilly Automotive, Inc. | 4.6 | 4.6 |
| L Brands, Inc. | 4.6 | 6.2 |
| Netflix, Inc. | 3.7 | 0.0 |
| G-III Apparel Group Ltd. | 3.7 | 4.8 |
| Lowe's Companies, Inc. | 2.7 | 3.3 |
| 67.0 |
Top Industries (% of fund's net assets)
| As of August 31, 2015 | ||
| Specialty Retail | 48.8% | |
| Internet & Catalog Retail | 25.9% | |
| Textiles, Apparel & Luxury Goods | 12.0% | |
| Multiline Retail | 2.6% | |
| Food & Staples Retailing | 2.1% | |
| All Others* | 8.6% | |

| As of February 28, 2015 | ||
| Specialty Retail | 52.6% | |
| Internet & Catalog Retail | 19.4% | |
| Textiles, Apparel & Luxury Goods | 14.8% | |
| Food & Staples Retailing | 2.4% | |
| Hotels, Restaurants & Leisure | 1.8% | |
| All Others* | 9.0% | |

* Includes short-term investments and net other assets (liabilities).
Percentages shown as 0.0% may reflect amounts less than 0.05%.
Retailing Portfolio
Investments August 31, 2015 (Unaudited)
Showing Percentage of Net Assets
| Common Stocks - 97.9% | |||
| Shares | Value | ||
| Food & Staples Retailing - 2.1% | |||
| Drug Retail - 0.7% | |||
| CVS Health Corp. | 70,600 | $7,229,440 | |
| Hypermarkets & Super Centers - 1.4% | |||
| Costco Wholesale Corp. | 113,543 | 15,901,697 | |
| TOTAL FOOD & STAPLES RETAILING | 23,131,137 | ||
| Food Products - 1.2% | |||
| Packaged Foods & Meats - 1.2% | |||
| Associated British Foods PLC | 284,900 | 13,998,473 | |
| Hotels, Restaurants & Leisure - 2.0% | |||
| Restaurants - 2.0% | |||
| Chipotle Mexican Grill, Inc. (a) | 13,500 | 9,585,135 | |
| Ruth's Hospitality Group, Inc. | 153,400 | 2,466,672 | |
| Starbucks Corp. | 195,300 | 10,684,863 | |
| 22,736,670 | |||
| Household Durables - 1.6% | |||
| Home Furnishings - 0.6% | |||
| Tempur Sealy International, Inc. (a) | 88,800 | 6,484,176 | |
| Household Appliances - 1.0% | |||
| Techtronic Industries Co. Ltd. | 3,340,000 | 12,088,567 | |
| TOTAL HOUSEHOLD DURABLES | 18,572,743 | ||
| Internet & Catalog Retail - 25.9% | |||
| Internet Retail - 25.9% | |||
| Amazon.com, Inc. (a) | 321,880 | 165,089,033 | |
| Netflix, Inc. (a) | 364,000 | 41,870,920 | |
| Ocado Group PLC (b)(a) | 1,114,900 | 5,864,671 | |
| Priceline Group, Inc. (a) | 64,520 | 80,562,253 | |
| 293,386,877 | |||
| Internet Software & Services - 1.0% | |||
| Internet Software & Services - 1.0% | |||
| Alibaba Group Holding Ltd. sponsored ADR | 50,000 | 3,306,000 | |
| Facebook, Inc. Class A (a) | 58,900 | 5,267,427 | |
| HomeAway, Inc. (a) | 110,200 | 3,161,638 | |
| 11,735,065 | |||
| Multiline Retail - 2.6% | |||
| Department Stores - 1.9% | |||
| Macy's, Inc. | 362,900 | 21,269,569 | |
| General Merchandise Stores - 0.7% | |||
| B&M European Value Retail S.A. | 1,592,227 | 7,903,986 | |
| TOTAL MULTILINE RETAIL | 29,173,555 | ||
| Specialty Retail - 48.8% | |||
| Apparel Retail - 13.4% | |||
| Inditex SA | 353,310 | 11,790,923 | |
| L Brands, Inc. | 616,683 | 51,739,704 | |
| Ross Stores, Inc. | 578,500 | 28,126,670 | |
| TJX Companies, Inc. | 823,100 | 57,880,392 | |
| Zumiez, Inc. (a) | 116,400 | 2,713,284 | |
| 152,250,973 | |||
| Automotive Retail - 9.2% | |||
| AutoZone, Inc. (a) | 73,263 | 52,455,575 | |
| O'Reilly Automotive, Inc. (a) | 217,586 | 52,235,871 | |
| 104,691,446 | |||
| Home Improvement Retail - 19.0% | |||
| Home Depot, Inc. | 1,587,800 | 184,915,188 | |
| Lowe's Companies, Inc. | 441,000 | 30,503,970 | |
| 215,419,158 | |||
| Homefurnishing Retail - 0.8% | |||
| Restoration Hardware Holdings, Inc. (a) | 93,100 | 8,609,888 | |
| Specialty Stores - 6.4% | |||
| Dufry AG (a) | 31,850 | 4,283,350 | |
| Signet Jewelers Ltd. | 131,800 | 18,188,400 | |
| Staples, Inc. | 806,500 | 11,460,365 | |
| Tiffany & Co., Inc. | 147,300 | 12,115,425 | |
| Tractor Supply Co. | 111,300 | 9,495,003 | |
| Ulta Salon, Cosmetics & Fragrance, Inc. (a) | 104,100 | 16,457,169 | |
| 71,999,712 | |||
| TOTAL SPECIALTY RETAIL | 552,971,177 | ||
| Technology Hardware, Storage & Peripherals - 0.7% | |||
| Technology Hardware, Storage & Peripherals - 0.7% | |||
| Apple, Inc. | 68,100 | 7,678,956 | |
| Textiles, Apparel & Luxury Goods - 12.0% | |||
| Apparel, Accessories & Luxury Goods - 10.2% | |||
| Coach, Inc. | 52,600 | 1,591,150 | |
| Compagnie Financiere Richemont SA Series A | 85,500 | 6,388,339 | |
| G-III Apparel Group Ltd. (a) | 599,634 | 41,572,625 | |
| Kate Spade & Co. (a) | 220,100 | 4,173,096 | |
| lululemon athletica, Inc. (b)(a) | 269,657 | 17,260,745 | |
| Michael Kors Holdings Ltd. (a) | 79,200 | 3,442,032 | |
| PVH Corp. | 126,000 | 14,991,480 | |
| Ralph Lauren Corp. | 24,900 | 2,768,631 | |
| Swatch Group AG (Bearer) (Reg.) | 55,334 | 4,098,603 | |
| Under Armour, Inc. Class A (sub. vtg.) (a) | 91,200 | 8,712,336 | |
| VF Corp. | 145,200 | 10,516,836 | |
| 115,515,873 | |||
| Footwear - 1.8% | |||
| NIKE, Inc. Class B | 184,820 | 20,653,635 | |
| TOTAL TEXTILES, APPAREL & LUXURY GOODS | 136,169,508 | ||
| TOTAL COMMON STOCKS | |||
| (Cost $693,395,181) | 1,109,554,161 | ||
| Principal Amount | Value | ||
| Convertible Bonds - 0.1% | |||
| Software - 0.1% | |||
| Home Entertainment Software - 0.1% | |||
| Take-Two Interactive Software, Inc. 1.75% 12/1/16 (Cost $1,000,000) | 1,000,000 | 1,556,250 | |
| Shares | Value | ||
| Money Market Funds - 4.0% | |||
| Fidelity Cash Central Fund, 0.15% (c) | 31,407,076 | 31,407,076 | |
| Fidelity Securities Lending Cash Central Fund, 0.19% (c)(d) | 14,387,677 | 14,387,677 | |
| TOTAL MONEY MARKET FUNDS | |||
| (Cost $45,794,753) | 45,794,753 | ||
| TOTAL INVESTMENT PORTFOLIO - 102.0% | |||
| (Cost $740,189,934) | 1,156,905,164 | ||
| NET OTHER ASSETS (LIABILITIES) - (2.0)% | (23,029,149) | ||
| NET ASSETS - 100% | $1,133,876,015 |
Legend
(a) Non-income producing
(b) Security or a portion of the security is on loan at period end.
(c) Affiliated fund that is generally available only to investment companies and other accounts managed by Fidelity Investments. The rate quoted is the annualized seven-day yield of the fund at period end. A complete unaudited listing of the fund's holdings as of its most recent quarter end is available upon request. In addition, each Fidelity Central Fund's financial statements are available on the SEC's website or upon request.
(d) Investment made with cash collateral received from securities on loan.
Affiliated Central Funds
Information regarding fiscal year to date income earned by the Fund from investments in Fidelity Central Funds is as follows:
| Fund | Income earned |
| Fidelity Cash Central Fund | $17,734 |
| Fidelity Securities Lending Cash Central Fund | 47,900 |
| Total | $65,634 |
Investment Valuation
The following is a summary of the inputs used, as of August 31, 2015, involving the Fund's assets and liabilities carried at fair value. The inputs or methodology used for valuing securities may not be an indication of the risk associated with investing in those securities. For more information on valuation inputs, and their aggregation into the levels used below, please refer to the Investment Valuation section in the accompanying Notes to Financial Statements.
| Valuation Inputs at Reporting Date: | ||||
| Description | Total | Level 1 | Level 2 | Level 3 |
| Investments in Securities: | ||||
| Common Stocks | $1,109,554,161 | $1,103,165,822 | $6,388,339 | $-- |
| Convertible Bonds | 1,556,250 | -- | 1,556,250 | -- |
| Money Market Funds | 45,794,753 | 45,794,753 | -- | -- |
| Total Investments in Securities: | $1,156,905,164 | $1,148,960,575 | $7,944,589 | $-- |
See accompanying notes which are an integral part of the financial statements.
Retailing Portfolio
Financial Statements
Statement of Assets and Liabilities
| August 31, 2015 (Unaudited) | ||
| Assets | ||
| Investment in securities, at value (including securities loaned of $14,090,631) — See accompanying schedule: Unaffiliated issuers (cost $694,395,181) | $1,111,110,411 | |
| Fidelity Central Funds (cost $45,794,753) | 45,794,753 | |
| Total Investments (cost $740,189,934) | $1,156,905,164 | |
| Receivable for fund shares sold | 7,412,743 | |
| Dividends receivable | 624,269 | |
| Interest receivable | 4,375 | |
| Distributions receivable from Fidelity Central Funds | 7,075 | |
| Prepaid expenses | 7,542 | |
| Other receivables | 3,063 | |
| Total assets | 1,164,964,231 | |
| Liabilities | ||
| Payable for investments purchased | $14,076,401 | |
| Payable for fund shares redeemed | 1,898,665 | |
| Accrued management fee | 504,980 | |
| Other affiliated payables | 193,235 | |
| Other payables and accrued expenses | 27,258 | |
| Collateral on securities loaned, at value | 14,387,677 | |
| Total liabilities | 31,088,216 | |
| Net Assets | $1,133,876,015 | |
| Net Assets consist of: | ||
| Paid in capital | $721,492,124 | |
| Undistributed net investment income | 369,876 | |
| Accumulated undistributed net realized gain (loss) on investments and foreign currency transactions | (4,696,382) | |
| Net unrealized appreciation (depreciation) on investments and assets and liabilities in foreign currencies | 416,710,397 | |
| Net Assets, for 11,473,584 shares outstanding | $1,133,876,015 | |
| Net Asset Value, offering price and redemption price per share ($1,133,876,015 ÷ 11,473,584 shares) | $98.82 |
See accompanying notes which are an integral part of the financial statements.
Statement of Operations
| Six months ended August 31, 2015 (Unaudited) | ||
| Investment Income | ||
| Dividends | $2,679,013 | |
| Special dividends | 1,541,708 | |
| Interest | 8,750 | |
| Income from Fidelity Central Funds | 65,634 | |
| Total income | 4,295,105 | |
| Expenses | ||
| Management fee | $2,723,977 | |
| Transfer agent fees | 962,693 | |
| Accounting and security lending fees | 167,663 | |
| Custodian fees and expenses | 10,039 | |
| Independent trustees' compensation | 8,087 | |
| Registration fees | 46,924 | |
| Audit | 18,729 | |
| Legal | 5,576 | |
| Miscellaneous | 5,458 | |
| Total expenses before reductions | 3,949,146 | |
| Expense reductions | (33,373) | 3,915,773 |
| Net investment income (loss) | 379,332 | |
| Realized and Unrealized Gain (Loss)
Net realized gain (loss) on: | ||
| Investment securities: | ||
| Unaffiliated issuers | (3,585,484) | |
| Foreign currency transactions | 2,682 | |
| Total net realized gain (loss) | (3,582,802) | |
| Change in net unrealized appreciation (depreciation) on: Investment securities | 49,046,735 | |
| Assets and liabilities in foreign currencies | (1,082) | |
| Total change in net unrealized appreciation (depreciation) | 49,045,653 | |
| Net gain (loss) | 45,462,851 | |
| Net increase (decrease) in net assets resulting from operations | $45,842,183 |
See accompanying notes which are an integral part of the financial statements.
Statement of Changes in Net Assets
| Six months ended August 31, 2015 (Unaudited) | Year ended February 28, 2015 | |
| Increase (Decrease) in Net Assets | ||
| Operations | ||
| Net investment income (loss) | $379,332 | $3,039,275 |
| Net realized gain (loss) | (3,582,802) | 51,285,454 |
| Change in net unrealized appreciation (depreciation) | 49,045,653 | 61,709,364 |
| Net increase (decrease) in net assets resulting from operations | 45,842,183 | 116,034,093 |
| Distributions to shareholders from net investment income | (1,021,996) | (1,546,416) |
| Distributions to shareholders from net realized gain | (11,161,013) | (70,497,905) |
| Total distributions | (12,183,009) | (72,044,321) |
| Share transactions | ||
| Proceeds from sales of shares | 312,139,100 | 203,801,729 |
| Reinvestment of distributions | 11,744,441 | 69,797,839 |
| Cost of shares redeemed | (138,893,084) | (466,362,827) |
| Net increase (decrease) in net assets resulting from share transactions | 184,990,457 | (192,763,259) |
| Redemption fees | 49,163 | 30,612 |
| Total increase (decrease) in net assets | 218,698,794 | (148,742,875) |
| Net Assets | ||
| Beginning of period | 915,177,221 | 1,063,920,096 |
| End of period (including undistributed net investment income of $369,876 and undistributed net investment income of $1,012,540, respectively) | $1,133,876,015 | $915,177,221 |
| Other Information
Shares | ||
| Sold | 3,198,812 | 2,328,758 |
| Issued in reinvestment of distributions | 123,081 | 847,929 |
| Redeemed | (1,455,100) | (5,604,901) |
| Net increase (decrease) | 1,866,793 | (2,428,214) |
See accompanying notes which are an integral part of the financial statements.
Financial Highlights — Retailing Portfolio
| Six months ended (Unaudited) | Years ended February 28, | |||||
| August 31, | 2015 | 2015 | 2014 | 2013 | 2012A | 2011 |
| Selected Per–Share Data | ||||||
| Net asset value, beginning of period | $95.26 | $88.40 | $66.59 | $57.54 | $53.68 | $45.11 |
| Income from Investment Operations | ||||||
| Net investment income (loss)B | .04C | .31D | .15E | .52F | .49G | .09 |
| Net realized and unrealized gain (loss) | 4.72 | 13.72 | 23.64 | 10.27 | 7.46 | 9.81 |
| Total from investment operations | 4.76 | 14.03 | 23.79 | 10.79 | 7.95 | 9.90 |
| Distributions from net investment income | (.10) | (.17) | (.12) | (.38) | (.34) | (.01) |
| Distributions from net realized gain | (1.10) | (7.01) | (1.86) | (1.36) | (3.76) | (1.33) |
| Total distributions | (1.20) | (7.17)H | (1.99)I | (1.75)J | (4.10) | (1.34) |
| Redemption fees added to paid in capitalB | –K | –K | .01 | .01 | .01 | .01 |
| Net asset value, end of period | $98.82 | $95.26 | $88.40 | $66.59 | $57.54 | $53.68 |
| Total ReturnL,M | 5.05% | 17.29% | 35.82% | 18.98% | 15.70% | 22.24% |
| Ratios to Average Net AssetsN,O | ||||||
| Expenses before reductions | .80%P | .81% | .83% | .86% | .90% | .93% |
| Expenses net of fee waivers, if any | .79%P | .81% | .83% | .86% | .90% | .93% |
| Expenses net of all reductions | .79%P | .81% | .82% | .84% | .88% | .93% |
| Net investment income (loss) | .08%P,C | .36%D | .18%E | .83%F | .93%G | .18% |
| Supplemental Data | ||||||
| Net assets, end of period (000 omitted) | $1,133,876 | $915,177 | $1,063,920 | $643,082 | $344,743 | $167,094 |
| Portfolio turnover rateQ | 9%P | 31% | 72% | 119% | 217% | 191% |
A For the year ended February 29.
B Calculated based on average shares outstanding during the period.
C Investment income per share reflects a large, non-recurring dividend which amounted to $.15 per share. Excluding this non-recurring dividend, the ratio of net investment income (loss) to average net assets would have been (.23)%.
D Investment income per share reflects a large, non-recurring dividend which amounted to $.13 per share. Excluding this non-recurring dividend, the ratio of net investment income (loss) to average net assets would have been .22%.
E Investment income per share reflects a large, non-recurring dividend which amounted to $.08 per share. Excluding this non-recurring dividend, the ratio of net investment income (loss) to average net assets would have been .08%.
F Investment income per share reflects a large, non-recurring dividend which amounted to $.19 per share. Excluding this non-recurring dividend, the ratio of net investment income (loss) to average net assets would have been .53%.
G Investment income per share reflects a large, non-recurring dividend which amounted to $.28 per share. Excluding this non-recurring dividend, the ratio of net investment income (loss) to average net assets would have been .40%.
H Total distributions of $7.17 per share is comprised of distributions from net investment income of $.166 and distributions from net realized gain of $7.006 per share.
I Total distributions of $1.99 per share is comprised of distributions from net investment income of $.124 and distributions from net realized gain of $1.861 per share.
J Total distributions of $1.75 per share is comprised of distributions from net investment income of $.383 and distributions from net realized gain of $1.364 per share.
K Amount represents less than $.005 per share.
L Total returns for periods of less than one year are not annualized.
M Total returns would have been lower if certain expenses had not been reduced during the applicable periods shown.
N Fees and expenses of any underlying Fidelity Central Funds are not included in the Fund's expense ratio. The Fund indirectly bears its proportionate share of the expenses of any underlying Fidelity Central Funds.
O Expense ratios reflect operating expenses of the Fund. Expenses before reductions do not reflect amounts reimbursed by the investment adviser or reductions from brokerage service arrangements or reductions from other expense offset arrangements and do not represent the amount paid by the Fund during periods when reimbursements or reductions occur. Expenses net of fee waivers reflect expenses after reimbursement by the investment adviser but prior to reductions from brokerage service arrangements or other expense offset arrangements. Expenses net of all reductions represent the net expenses paid by the Fund.
P Annualized
Q Amount does not include the portfolio activity of any underlying Fidelity Central Funds.
See accompanying notes which are an integral part of the financial statements.
Notes to Financial Statements (Unaudited)
For the period ended August 31, 2015
1. Organization.
Automotive Portfolio, Construction and Housing Portfolio, Consumer Discretionary Portfolio, Leisure Portfolio, Multimedia Portfolio, and Retailing Portfolio (the Funds) are non-diversified funds of Fidelity Select Portfolios (the Trust). The Trust is registered under the Investment Company Act of 1940, as amended (the 1940 Act), as an open-end management investment company organized as a Massachusetts business trust. The Funds invest primarily in securities of companies whose principal business activities fall within specific industries. Each Fund is authorized to issue an unlimited number of shares. Share transactions on the Statement of Changes in Net Assets may contain exchanges between funds.
2. Investments in Fidelity Central Funds.
The Funds invest in Fidelity Central Funds, which are open-end investment companies generally available only to other investment companies and accounts managed by the investment adviser and its affiliates. The Funds' Schedules of Investments list each of the Fidelity Central Funds held as of period end, if any, as an investment of each Fund, but do not include the underlying holdings of each Fidelity Central Fund. As an Investing Fund, each Fund indirectly bears its proportionate share of the expenses of the underlying Fidelity Central Funds.
The Money Market Central Funds seek preservation of capital and current income and are managed by Fidelity Investments Money Management, Inc. (FIMM), an affiliate of the investment adviser. Annualized expenses of the Money Market Central Funds as of their most recent shareholder report date are less than .01%.
A complete unaudited list of holdings for each Fidelity Central Fund is available upon request or at the Securities and Exchange Commission (the SEC) website at www.sec.gov. In addition, the financial statements of the Fidelity Central Funds are available on the SEC website or upon request.
3. Significant Accounting Policies.
The financial statements have been prepared in conformity with accounting principles generally accepted in the United States of America (GAAP), which require management to make certain estimates and assumptions at the date of the financial statements. Actual results could differ from those estimates. Subsequent events, if any, through the date that the financial statements were issued have been evaluated in the preparation of the financial statements. The following summarizes the significant accounting policies of the Funds:
Investment Valuation. Investments are valued as of 4:00 p.m. Eastern time on the last calendar day of the period. The Board of Trustees (the Board) has delegated the day to day responsibility for the valuation of each Fund's investments to the Fidelity SelectCo, LLC (SelectCo) Fair Value Committee (the Committee). In accordance with valuation policies and procedures approved by the Board, each Fund attempts to obtain prices from one or more third party pricing vendors or brokers to value its investments. When current market prices, quotations or currency exchange rates are not readily available or reliable, investments will be fair valued in good faith by the Committee, in accordance with procedures adopted by the Board. Factors used in determining fair value vary by investment type and may include market or investment specific events, changes in interest rates and credit quality. The frequency with which these procedures are used cannot be predicted and they may be utilized to a significant extent. The Committee oversees each Fund's valuation policies and procedures and reports to the Board on the Committee's activities and fair value determinations. The Board monitors the appropriateness of the procedures used in valuing each Fund's investments and ratifies the fair value determinations of the Committee.
Each Fund categorizes the inputs to valuation techniques used to value its investments into a disclosure hierarchy consisting of three levels as shown below:
- Level 1 – quoted prices in active markets for identical investments
- Level 2 – other significant observable inputs (including quoted prices for similar investments, interest rates, prepayment speeds, etc.)
- Level 3 – unobservable inputs (including the Fund's own assumptions based on the best information available)
Valuation techniques used to value each Fund's investments by major category are as follows:
Equity securities, including restricted securities, for which market quotations are readily available, are valued at the last reported sale price or official closing price as reported by a third party pricing vendor on the primary market or exchange on which they are traded and are categorized as Level 1 in the hierarchy. In the event there were no sales during the day or closing prices are not available, securities are valued at the last quoted bid price or may be valued using the last available price and are generally categorized as Level 2 in the hierarchy. For foreign equity securities, when market or security specific events arise, comparisons to the valuation of American Depositary Receipts (ADRs), futures contracts, Exchange-Traded Funds (ETFs) and certain indexes as well as quoted prices for similar securities may be used and would be categorized as Level 2 in the hierarchy. Utilizing these techniques may result in transfers between Level 1 and Level 2. For equity securities, including restricted securities, where observable inputs are limited, assumptions about market activity and risk are used and these securities may be categorized as Level 3 in the hierarchy. Equity securities, including restricted securities, for which observable inputs are not available are valued using alternate valuation approaches, including the market approach and the income approach and are categorized as Level 3 in the hierarchy. The market approach generally consists of using comparable market transactions while the income approach generally consists of using the net present value of estimated future cash flows, adjusted as appropriate for liquidity, credit, market and/or other risk factors.
Debt securities, including restricted securities, are valued based on evaluated prices received from third party pricing vendors or from brokers who make markets in such securities. Corporate bonds are valued by pricing vendors who utilize matrix pricing which considers yield or price of bonds of comparable quality, coupon, maturity and type or by broker-supplied prices. When independent prices are unavailable or unreliable, debt securities may be valued utilizing pricing methodologies which consider similar factors that would be used by third party pricing vendors. Debt securities are generally categorized as Level 2 in the hierarchy but may be Level 3 depending on the circumstances.
Investments in open-end mutual funds, including the Fidelity Central Funds, are valued at their closing net asset value (NAV) each business day and are categorized as Level 1 in the hierarchy.
The following provides information on Level 3 securities held by the Construction and Housing Portfolio that were valued at period end based on unobservable inputs. These amounts exclude valuations provided by a broker.
| Asset Type | Fair Value at 08/31/15 | Valuation Technique(s) | Unobservable Input | Amount or Range/Weighted Average | Impact to Valuation from an Increase in Input* |
| Equities | $5,783,551 | Discounted cash flow | Discount rate | 15.0% | Decrease |
| Market comparable | Discount for lack of marketability | 15.0% | Decrease | ||
| P/E multiple | 14.3 | Increase |
* Represents the expected directional change in the fair value of the Level 3 investments that would result from an increase in the corresponding input. A decrease to the unobservable input would have the opposite effect. Significant changes in these inputs could result in significantly higher or lower fair value measurements.
Changes in valuation techniques may result in transfers in or out of an assigned level within the disclosure hierarchy. The aggregate value of investments by input level as of August 31, 2015, as well as a roll forward of Level 3 investments, is included at the end of each applicable Fund's Schedule of Investments.
Foreign Currency. The Funds may use foreign currency contracts to facilitate transactions in foreign-denominated securities. Gains and losses from these transactions may arise from changes in the value of the foreign currency or if the counterparties do not perform under the contracts' terms.
Foreign-denominated assets, including investment securities, and liabilities are translated into U.S. dollars at the exchange rates at period end. Purchases and sales of investment securities, income and dividends received and expenses denominated in foreign currencies are translated into U.S. dollars at the exchange rate in effect on the transaction date.
The effects of exchange rate fluctuations on investments are included with the net realized and unrealized gain (loss) on investment securities. Other foreign currency transactions resulting in realized and unrealized gain (loss) are disclosed separately.
Investment Transactions and Income. For financial reporting purposes, the Funds' investment holdings and NAV include trades executed through the end of the last business day of the period. The NAV per share for processing shareholder transactions is calculated as of the close of business of the New York Stock Exchange (NYSE), normally 4:00 p.m. Eastern time and includes trades executed through the end of the prior business day. Gains and losses on securities sold are determined on the basis of identified cost and may include proceeds received from litigation. Dividend income is recorded on the ex-dividend date, except for certain dividends from foreign securities where the ex-dividend date may have passed, which are recorded as soon as the Funds are informed of the ex-dividend date. Non-cash dividends included in dividend income, if any, are recorded at the fair market value of the securities received. Income and capital gain distributions from Fidelity Central Funds, if any, are recorded on the ex-dividend date. Distributions received on securities that represent a return of capital or capital gain are recorded as a reduction of cost of investments and/or as a realized gain. Subsequent to ex-dividend date the Funds determine the components of these distributions, based upon receipt of tax filings or other correspondence relating to the underlying investment. Large, non-recurring dividends recognized by the Funds are presented separately on the Statement of Operations as "Special Dividends" and the impact of these dividends is presented in the Financial Highlights. Interest income is accrued as earned and includes coupon interest and amortization of premium and accretion of discount on debt securities as applicable. Investment income is recorded net of foreign taxes withheld where recovery of such taxes is uncertain.
Expenses. Expenses directly attributable to a fund are charged to that fund. Expenses attributable to more than one fund are allocated among the respective funds on the basis of relative net assets or other appropriate methods. Expense estimates are accrued in the period to which they relate and adjustments are made when actual amounts are known.
Income Tax Information and Distributions to Shareholders. Each year, each Fund intends to qualify as a regulated investment company under Subchapter M of the Internal Revenue Code, including distributing substantially all of its taxable income and realized gains. As a result, no provision for U.S. Federal income taxes is required. Each Fund files a U.S. federal tax return, in addition to state and local tax returns as required. Each Fund's federal income tax returns are subject to examination by the Internal Revenue Service (IRS) for a period of three fiscal years after they are filed. State and local tax returns may be subject to examination for an additional fiscal year depending on the jurisdiction. Foreign taxes are provided for based on each Fund's understanding of the tax rules and rates that exist in the foreign markets in which it invests. Consumer Discretionary is subject to a tax imposed on capital gains by certain countries in which it invests.
Distributions are declared and recorded on the ex-dividend date. Income and capital gain distributions are determined in accordance with income tax regulations, which may differ from GAAP.
Capital accounts within the financial statements are adjusted for permanent book-tax differences. These adjustments have no impact on net assets or the results of operations. Capital accounts are not adjusted for temporary book-tax differences which will reverse in a subsequent period.
Book-tax differences are primarily due to foreign currency transactions, partnerships, deferred trustees compensation, redemption in-kind, and losses deferred due to wash sales and excise tax regulations.
The federal tax cost of investment securities and unrealized appreciation (depreciation) as of period end were as follows for each Fund:
| Tax cost | Gross unrealized appreciation | Gross unrealized depreciation | Net unrealized appreciation (depreciation) on securities | |
| Automotive Portfolio | $86,892,438 | $29,150,516 | $(5,176,908) | $23,973,608 |
| Construction and Housing Portfolio | 372,219,329 | 116,173,641 | (9,212,860) | 106,960,781 |
| Consumer Discretionary Portfolio | 1,184,463,450 | 173,941,115 | (65,228,239) | 108,712,876 |
| Leisure Portfolio | 358,898,660 | 159,401,625 | (19,778,905) | 139,622,720 |
| Multimedia Portfolio | 545,346,141 | 260,900,283 | (17,923,144) | 242,977,139 |
| Retailing Portfolio | 740,992,909 | 438,577,934 | (22,665,679) | 415,912,255 |
Trading (Redemption) Fees. Shares held by investors in the Funds less than 30 days may be subject to a redemption fee equal to .75% of the NAV of shares redeemed. All redemption fees, which reduce the proceeds of the shareholder redemption, are retained by the Funds and accounted for as an addition to paid in capital.
Restricted Securities. The Funds may invest in securities that are subject to legal or contractual restrictions on resale. These securities generally may be resold in transactions exempt from registration or to the public if the securities are registered. Disposal of these securities may involve time-consuming negotiations and expense, and prompt sale at an acceptable price may be difficult. Information regarding restricted securities is included at the end of each applicable Fund's Schedule of Investments.
4. Purchases and Sales of Investments.
Purchases and sales of securities, other than short-term securities, are noted in the table below.
| Purchases ($) | Sales ($) | |
| Automotive Portfolio | 58,049,517 | 84,911,387 |
| Construction and Housing Portfolio | 228,057,606 | 150,236,686 |
| Consumer Discretionary Portfolio | 528,894,390 | 350,171,944 |
| Leisure Portfolio | 132,721,835 | 85,079,522 |
| Multimedia Portfolio | 262,241,606 | 293,770,018 |
| Retailing Portfolio | 223,458,456 | 45,859,412 |
5. Fees and Other Transactions with Affiliates.
Management Fee. Fidelity SelectCo, LLC (the investment adviser) and its affiliates provide the Funds with investment management related services for which the Funds pay a monthly management fee. The management fee is the sum of an individual fund fee rate and an annualized group fee rate. The individual fund fee rate is applied to each Fund's average net assets. The group fee rate is based upon the average net assets of all the mutual funds advised by Fidelity Management & Research Company (FMR) and the investment adviser. The group fee rate decreases as assets under management increase and increases as assets under management decrease. For the reporting period, each Fund's annualized management fee rate expressed as a percentage of each Fund's average net assets was as follows.
| Individual Rate | Group Rate | Total | |
| Automotive Portfolio | .30% | .25% | .55% |
| Construction and Housing Portfolio | .30% | .25% | .55% |
| Consumer Discretionary Portfolio | .30% | .25% | .55% |
| Leisure Portfolio | .30% | .25% | .55% |
| Multimedia Portfolio | .30% | .25% | .55% |
| Retailing Portfolio | .30% | .25% | .55% |
Transfer Agent Fees. Fidelity Investments Institutional Operations Company, Inc. (FIIOC), an affiliate of the investment adviser, is the Funds' transfer, dividend disbursing and shareholder servicing agent. FIIOC receives account fees and asset-based fees that vary according to account size and type of account. FIIOC pays for typesetting, printing and mailing of shareholder reports, except proxy statements. For the period, transfer agent fees were equivalent to the following annualized rates expressed as a percentage of average net assets:
| Automotive Portfolio | .21% |
| Construction and Housing Portfolio | .19% |
| Consumer Discretionary Portfolio | .17% |
| Leisure Portfolio | .18% |
| Multimedia Portfolio | .21% |
| Retailing Portfolio | .19% |
Accounting and Security Lending Fees. Fidelity Service Company, Inc. (FSC), an affiliate of the investment adviser, maintains each Fund's accounting records. The accounting fee is based on the level of average net assets for each month. Under a separate contract, FSC administers the security lending program. The security lending fee is based on the number and duration of lending transactions.
Brokerage Commissions. Certain Funds placed a portion of their portfolio transactions with brokerage firms which are affiliates of the investment adviser. Brokerage commissions are included in net realized gain (loss) and change in net unrealized appreciation (depreciation) in the Statement of Operations. The commissions paid to these affiliated firms were as follows:
| Amount | |
| Automotive Portfolio | $2,069 |
| Construction and Housing Portfolio | 9,571 |
| Consumer Discretionary Portfolio | 4,657 |
| Leisure Portfolio | 2,212 |
| Multimedia Portfolio | 8,427 |
| Retailing Portfolio | 705 |
Interfund Lending Program. Pursuant to an Exemptive Order issued by the SEC, the Funds, along with other registered investment companies having management contracts with FMR or other affiliated entities of FMR, may participate in an interfund lending program. This program provides an alternative credit facility allowing the funds to borrow from, or lend money to, other participating affiliated funds. At period end, there were no interfund loans outstanding. Each applicable fund's activity in this program during the period for which loans were outstanding was as follows:
| Borrower or Lender | Average Loan Balance | Weighted Average Interest Rate | Interest Expense | |
| Leisure Portfolio | Borrower | $4,128,500 | .37% | $254 |
| Multimedia Portfolio | Borrower | 5,320,615 | .37% | 702 |
6. Committed Line of Credit.
Certain Funds participate with other funds managed by the investment adviser or an affiliate in a $4.25 billion credit facility (the "line of credit") to be utilized for temporary or emergency purposes to fund shareholder redemptions or for other short-term liquidity purposes. The participating funds have agreed to pay commitment fees on their pro-rata portion of the line of credit, which are reflected in Miscellaneous expenses on the Statement of Operations, and are as follows:
| Automotive Portfolio | $101 |
| Construction and Housing Portfolio | 319 |
| Consumer Discretionary Portfolio | 821 |
| Leisure Portfolio | 336 |
| Multimedia Portfolio | 616 |
| Retailing Portfolio | 692 |
During the period, the Funds did not borrow on this line of credit.
7. Security Lending.
Certain Funds lend portfolio securities through a lending agent from time to time in order to earn additional income. On the settlement date of the loan, each applicable Fund receives collateral (in the form of U.S. Treasury obligations, letters of credit and/or cash) against the loaned securities and maintains collateral in an amount not less than 100% of the market value of the loaned securities during the period of the loan. The market value of the loaned securities is determined at the close of business of the Funds and any additional required collateral is delivered to the Funds on the next business day. If the borrower defaults on its obligation to return the securities loaned because of insolvency or other reasons, the Funds may apply collateral received from the borrower against the obligation. The Funds may experience delays and costs in recovering the securities loaned. Any cash collateral received is invested in the Fidelity Securities Lending Cash Central Fund. The value of loaned securities and cash collateral at period end are disclosed on each applicable Fund's Statement of Assets and Liabilities. Security lending income represents the income earned on investing cash collateral, less rebates paid to borrowers and any lending agent fees associated with the loan, plus any premium payments received for lending certain types of securities. Security lending income is presented on each applicable Fund's Statement of Operations as a component of income from Fidelity Central Funds.
| Total Security Lending Income | |
| Automotive Portfolio | $61,608 |
| Construction and Housing Portfolio | 34,857 |
| Consumer Discretionary Portfolio | 86,236 |
| Leisure Portfolio | 54,261 |
| Multimedia Portfolio | 121,809 |
| Retailing Portfolio | 47,900 |
8. Bank Borrowings.
Each Fund is permitted to have bank borrowings for temporary or emergency purposes to fund shareholder redemptions or for other short-term liquidity requirements. Each Fund has established borrowing arrangements with certain banks. The interest rate on the borrowings is the bank's base rate, as revised from time to time. At period end, there were no bank borrowings outstanding. Each applicable Fund's activity in this program during the period for which loans were outstanding was as follows:
| Average Loan Balance | Weighted Average Interest Rate | Interest Expense | |
| Multimedia Portfolio | $5,940,000 | .65% | $210 |
9. Expense Reductions.
Commissions paid to certain brokers with whom the investment adviser, or its affiliates, places trades on behalf of Certain Funds include an amount in addition to trade execution, which may be rebated back to the Funds to offset certain expenses. All of the applicable expense reductions are noted in the table below.
| Brokerage Service reduction | Custody expense reduction |
|
| Automotive Portfolio | $8,642 | $– |
| Construction and Housing Portfolio | 10,965 | 12 |
| Consumer Discretionary Portfolio | 60,905 | 18 |
| Leisure Portfolio | 13,304 | – |
| Multimedia Portfolio | 63,376 | – |
| Retailing Portfolio | 9,372 | 2 |
In addition, during the period the investment adviser reimbursed and/or waived a portion of operating expenses as follows:
| Amount | |
| Automotive Portfolio | $5,038 |
| Construction and Housing Portfolio | 12,837 |
| Consumer Discretionary Portfolio | 21,401 |
| Leisure Portfolio | 12,286 |
| Multimedia Portfolio | 23,600 |
| Retailing Portfolio | 23,999 |
10. Other.
The Funds' organizational documents provide former and current trustees and officers with a limited indemnification against liabilities arising in connection with the performance of their duties to the Funds. In the normal course of business, the Funds may also enter into contracts that provide general indemnifications. The Funds' maximum exposure under these arrangements is unknown as this would be dependent on future claims that may be made against the Funds. The risk of material loss from such claims is considered remote.
At the end of the period, the following mutual funds managed by the investment adviser or its affiliates were the owners of record of 10% or more of the total outstanding shares of the following Funds.
| VIP FundsManager 50% Portfolio | VIP FundsManager 60% Portfolio | Strategic Advisers Core Fund | |
| Automotive Portfolio | 10% | – | – |
| Construction and Housing Portfolio | – | 13% | – |
| Consumer Discretionary Portfolio | 14% | 22% | 29% |
Mutual funds managed by the investment adviser or its affiliates, in aggregate, were the owners of record of more than 20% of the total outstanding shares of the following Funds.
| % of shares held | |
| Construction and Housing Portfolio | 26% |
| Consumer Discretionary Portfolio | 72% |
Shareholder Expense Example
As a shareholder of the Fund, you incur two types of costs: (1) transaction costs, including redemption fees and (2) ongoing costs, including management fees and other Fund expenses. This Example is intended to help you understand your ongoing costs (in dollars) of investing in the Fund and to compare these costs with the ongoing costs of investing in other mutual funds.
The Example is based on an investment of $1,000 invested at the beginning of the period and held for the entire period (March 1, 2015 to August 31, 2015).
Actual Expenses
The first line of the accompanying table for each fund provides information about actual account values and actual expenses. You may use the information in this line, together with the amount you invested, to estimate the expenses that you paid over the period. Simply divide your account value by $1,000.00 (for example, an $8,600 account value divided by $1,000.00 = 8.6), then multiply the result by the number in the first line for a fund under the heading entitled "Expenses Paid During Period" to estimate the expenses you paid on your account during this period. A small balance maintenance fee of $12.00 that is charged once a year may apply for certain accounts with a value of less than $2,000. This fee is not included in the table below. If it was, the estimate of expenses you paid during the period would be higher, and your ending account value lower, by this amount. In addition, each Fund, as a shareholder in the underlying Fidelity Central Funds, will indirectly bear its pro-rata share of the fees and expenses incurred by the underlying Fidelity Central Funds. These fees and expenses are not included in the Fund's annualized expense ratio used to calculate the expense estimate in the table below.
Hypothetical Example for Comparison Purposes
The second line of the accompanying table for each fund provides information about hypothetical account values and hypothetical expenses based on a fund's actual expense ratio and an assumed rate of return of 5% per year before expenses, which is not the Fund's actual return. The hypothetical account values and expenses may not be used to estimate the actual ending account balance or expenses you paid for the period. You may use this information to compare the ongoing costs of investing in the Fund and other funds. To do so, compare this 5% hypothetical example with the 5% hypothetical examples that appear in the shareholder reports of the other funds. A small balance maintenance fee of $12.00 that is charged once a year may apply for certain accounts with a value of less than $2,000. This fee is not included in the table below. If it was, the estimate of expenses you paid during the period would be higher, and your ending account value lower, by this amount. In addition, each Fund, as a shareholder in the underlying Fidelity Central Funds, will indirectly bear its pro-rata share of the fees and expenses incurred by the underlying Fidelity Central Funds. These fees and expenses are not included in the Fund's annualized expense ratio used to calculate the expense estimate in the table below.
Please note that the expenses shown in the table are meant to highlight your ongoing costs only and do not reflect any transaction costs. Therefore, the second line of the table is useful in comparing ongoing costs only, and will not help you determine the relative total costs of owning different funds. In addition, if these transactional costs were included, your costs would have been higher.
| Annualized Expense Ratio-A | Beginning Account Value March 1, 2015 | Ending Account Value August 31, 2015 | Expenses Paid During Period-B March 1, 2015 to August 31, 2015 |
|
| Automotive Portfolio | .86% | |||
| Actual | $1,000.00 | $903.70 | $4.12 | |
| Hypothetical-C | $1,000.00 | $1,020.81 | $4.37 | |
| Construction and Housing Portfolio | .81% | |||
| Actual | $1,000.00 | $976.80 | $4.02 | |
| Hypothetical-C | $1,000.00 | $1,021.06 | $4.12 | |
| Consumer Discretionary Portfolio | .77% | |||
| Actual | $1,000.00 | $974.80 | $3.82 | |
| Hypothetical-C | $1,000.00 | $1,021.27 | $3.91 | |
| Leisure Portfolio | .78% | |||
| Actual | $1,000.00 | $988.50 | $3.90 | |
| Hypothetical-C | $1,000.00 | $1,021.22 | $3.96 | |
| Multimedia Portfolio | .80% | |||
| Actual | $1,000.00 | $940.00 | $3.90 | |
| Hypothetical-C | $1,000.00 | $1,021.11 | $4.06 | |
| Retailing Portfolio | .79% | |||
| Actual | $1,000.00 | $1,050.50 | $4.07 | |
| Hypothetical-C | $1,000.00 | $1,021.17 | $4.01 |
A Annualized expense ratio reflects expenses net of applicable fee waivers.
B Expenses are equal to each Fund's annualized expense ratio, multiplied by the average account value over the period, multiplied by 184/366 (to reflect the one-half year period).
C 5% return per year before expenses
![]()
SELCON-SANN-1015
1.813637.110
Item 2.
Code of Ethics
Not applicable.
Item 3.
Audit Committee Financial Expert
Not applicable.
Item 4.
Principal Accountant Fees and Services
Not applicable.
Item 5.
Audit Committee of Listed Registrants
Not applicable.
Item 6.
Investments
(a)
Not applicable.
(b)
Not applicable
Item 7.
Disclosure of Proxy Voting Policies and Procedures for Closed-End Management Investment Companies
Not applicable.
Item 8.
Portfolio Managers of Closed-End Management Investment Companies
Not applicable.
Item 9.
Purchase of Equity Securities by Closed-End Management Investment Company and Affiliated Purchasers
Not applicable.
Item 10.
Submission of Matters to a Vote of Security Holders
There were no material changes to the procedures by which shareholders may recommend nominees to the Fidelity Select Portfolios’s Board of Trustees.
Item 11.
Controls and Procedures
(a)(i) The President and Treasurer and the Chief Financial Officer have concluded that the Fidelity Select Portfolios’s (the “Trust”) disclosure controls and procedures (as
defined in Rule 30a-3(c) under the Investment Company Act) provide reasonable assurances that material information relating to the Trust is made known to them by the appropriate persons, based on their evaluation of these controls and procedures as of a date within 90 days of the filing date of this report.
(a)(ii) There was no change in the Trust’s internal control over financial reporting (as defined in Rule 30a-3(d) under the Investment Company Act) that occurred during the second fiscal quarter of the period covered by this report that has materially affected, or is reasonably likely to materially affect, the Trust’s internal control over financial reporting.
Item 12.
Exhibits
(a) | (1) | Not applicable. |
(a) | (2) | Certification pursuant to Rule 30a-2(a) under the Investment Company Act of 1940 (17 CFR 270.30a-2(a)) is filed and attached hereto as Exhibit 99.CERT. |
(a) | (3) | Not applicable. |
(b) | Certification pursuant to Rule 30a-2(b) under the Investment Company Act of 1940 (17 CFR 270.30a-2(b)) is furnished and attached hereto as Exhibit 99.906CERT. |
SIGNATURES
Pursuant to the requirements of the Securities Exchange Act of 1934 and the Investment Company Act of 1940, the registrant has duly caused this report to be signed on its behalf by the undersigned, thereunto duly authorized.
Fidelity Select Portfolios
By: | /s/Adrien E. Deberghes |
Adrien E. Deberghes | |
President and Treasurer | |
Date: | October 27, 2015 |
Pursuant to the requirements of the Securities Exchange Act of 1934 and the Investment Company Act of 1940, this report has been signed below by the following persons on behalf of the registrant and in the capacities and on the dates indicated.
By: | /s/Adrien E. Deberghes |
Adrien E. Deberghes | |
President and Treasurer | |
Date: | October 27, 2015 |
By: | /s/Howard J. Galligan III |
Howard J. Galligan III | |
Chief Financial Officer | |
Date: | October 27, 2015 |